
Competitive Intelligence and Sustainable Competitive ... - MDPI
Upload
independentCategory
view
4download
0
Innovation or Imitation? The effect of spillovers and competitive pressure on firms’ R&D strategy choice
Olga Slivko
Bernd Theilen
Document de treball nº -23- 2011
WORKING PAPERS
Col·lecció “DOCUMENTS DE TREBALL DEL DEPARTAMENT D’ECONOMIA - CREIP”
DEPARTAMENT D’ECONOMIA – CREIP Facultat de Ciències Econòmiques i Empresarials
UNIVERSITAT
VROVIRA I IRGILI
DEPARTAMENT D’ECONOMIA
Edita:
Adreçar comentaris al Departament d’Economia / CREIP Dipòsit Legal: T -1561- 2011 ISSN 1988 - 0812
DEPARTAMENT D’ECONOMIA – CREIP
Facultat de Ciències Econòmiques i Empresarials
Departament d’Economia www.fcee.urv.es/departaments/economia/public_html/index.html Universitat Rovira i Virgili Facultat de Ciències Econòmiques i Empresarials Avgda. de la Universitat, 1 43204 Reus Tel.: +34 977 759 811 Fax: +34 977 300 661 Email: [email protected]
CREIP www.urv.cat/creip Universitat Rovira i Virgili Departament d’Economia Avgda. de la Universitat, 1 43204 Reus Tel.: +34 977 558 936 Email: [email protected]
UNIVERSITAT
VROVIRA I IRGILI
DEPARTAMENT D’ECONOMIA
Innovation or Imitation? The e¤ect of spillovers and competitivepressure on �rms�R&D strategy choice
Olga Slivko and Bernd Theilen� y
Departament d�Economia and CREIP, Universitat Rovira i Virgili
September, 2011
Abstract
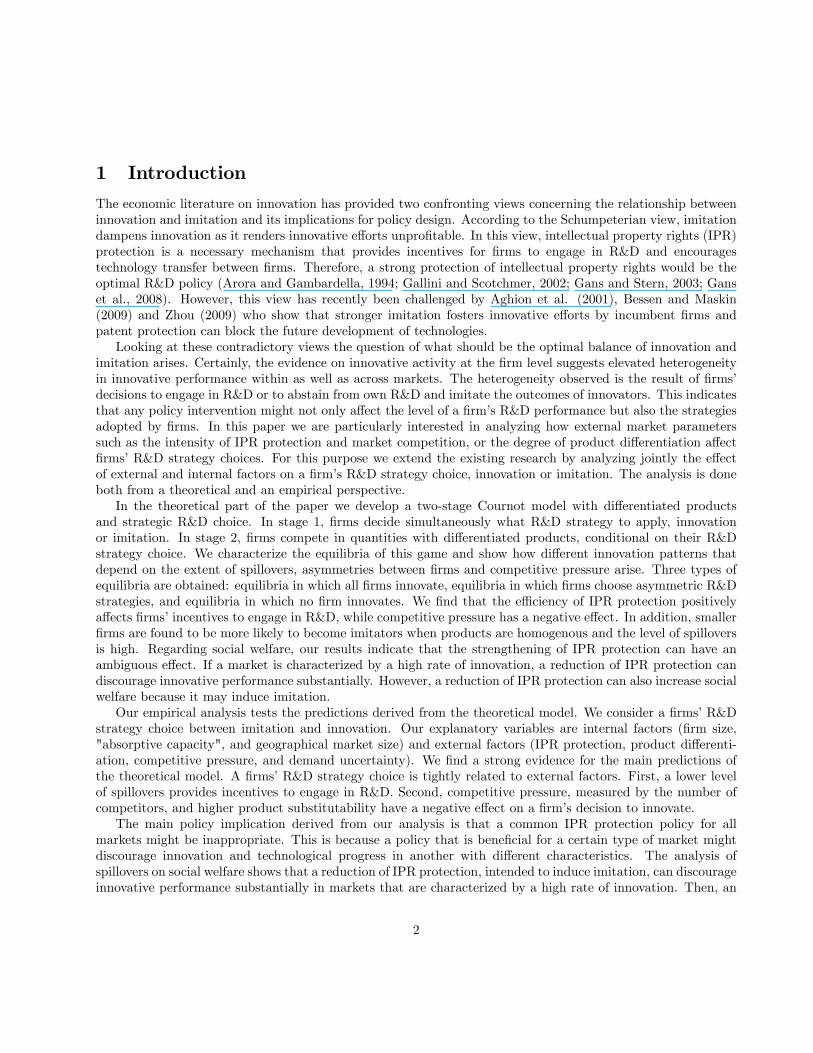
This article provides a theoretical and empirical analysis of a �rm�s optimal R&D strategy choice. In thispaper a �rm�s R&D strategy is assumed to be endogenous and allowed to depend on both internal �rms�characteristics and external factors. Firms choose between two strategies, either they engage in R&D orabstain from own R&D and imitate the outcomes of innovators. In the theoretical model this yields threetypes of equilibria in which either all �rms innovate, some �rms innovate and others imitate, or no �rminnovates. Firms�equilibrium strategies crucially depend on external factors. We �nd that the e¢ ciency ofintellectual property rights protection positively a¤ects �rms�incentives to engage in R&D, while competitivepressure has a negative e¤ect. In addition, smaller �rms are found to be more likely to become imitatorswhen the product is homogeneous and the level of spillovers is high. These results are supported by empiricalevidence for German �rms from manufacturing and services sectors.
Regarding social welfare our results indicate that strengthening intellectual property protection can havean ambiguous e¤ect. In markets characterized by a high rate of innovation a reduction of intellectualproperty rights protection can discourage innovative performance substantially. However, a reduction ofpatent protection can also increase social welfare because it may induce imitation. This indicates that policyissues such as the optimal length and breadth of patent protection cannot be resolved without taking intoaccount speci�c market and �rm characteristics.
Journal of Economic Literature Classi�cation Numbers: C35, D43, L13, L22, O31.
Keywords: Innovation; imitation; spillovers; product di¤erentiation; market competition; intellectual propertyrights protection.
�Correspond to: Departament d�Economia, Universitat Rovira i Virgili, Avinguda de la Universitat 1, E-43204 Reus, Spain,E-mail address: [email protected], [email protected].
yAn earlier version of this paper has been presented at the �European Network on Industrial Policy� workshop in Florence,the XVI edition of �Dynamics, Economic Growth, and International Trade� conference in Saint-Petersburg and the XXVI editionof the �Jornadas de Economía Industrial� in Valencia. We are very grateful to the participants in these meetings and especiallyto Xose-Luís Varela, Matthias Dahm, Ricardo Flores-Fillol, Susana Iranzo, Galina Zudenkova, Bruno Cassiman and ChristianRammer for their comments and suggestions. The authors also acknowledge data support from the Centre for European EconomicResearch in Mannheim and �nancial support from the Spanish �Ministerio de Ciencia e Innovación�under project ECO2010-17113.
1
1 Introduction
The economic literature on innovation has provided two confronting views concerning the relationship betweeninnovation and imitation and its implications for policy design. According to the Schumpeterian view, imitationdampens innovation as it renders innovative e¤orts unpro�table. In this view, intellectual property rights (IPR)protection is a necessary mechanism that provides incentives for �rms to engage in R&D and encouragestechnology transfer between �rms. Therefore, a strong protection of intellectual property rights would be theoptimal R&D policy (Arora and Gambardella, 1994; Gallini and Scotchmer, 2002; Gans and Stern, 2003; Ganset al., 2008). However, this view has recently been challenged by Aghion et al. (2001), Bessen and Maskin(2009) and Zhou (2009) who show that stronger imitation fosters innovative e¤orts by incumbent �rms andpatent protection can block the future development of technologies.Looking at these contradictory views the question of what should be the optimal balance of innovation and
imitation arises. Certainly, the evidence on innovative activity at the �rm level suggests elevated heterogeneityin innovative performance within as well as across markets. The heterogeneity observed is the result of �rms�decisions to engage in R&D or to abstain from own R&D and imitate the outcomes of innovators. This indicatesthat any policy intervention might not only a¤ect the level of a �rm�s R&D performance but also the strategiesadopted by �rms. In this paper we are particularly interested in analyzing how external market parameterssuch as the intensity of IPR protection and market competition, or the degree of product di¤erentiation a¤ect�rms�R&D strategy choices. For this purpose we extend the existing research by analyzing jointly the e¤ectof external and internal factors on a �rm�s R&D strategy choice, innovation or imitation. The analysis is doneboth from a theoretical and an empirical perspective.In the theoretical part of the paper we develop a two-stage Cournot model with di¤erentiated products
and strategic R&D choice. In stage 1, �rms decide simultaneously what R&D strategy to apply, innovationor imitation. In stage 2, �rms compete in quantities with di¤erentiated products, conditional on their R&Dstrategy choice. We characterize the equilibria of this game and show how di¤erent innovation patterns thatdepend on the extent of spillovers, asymmetries between �rms and competitive pressure arise. Three types ofequilibria are obtained: equilibria in which all �rms innovate, equilibria in which �rms choose asymmetric R&Dstrategies, and equilibria in which no �rm innovates. We �nd that the e¢ ciency of IPR protection positivelya¤ects �rms�incentives to engage in R&D, while competitive pressure has a negative e¤ect. In addition, smaller�rms are found to be more likely to become imitators when products are homogenous and the level of spilloversis high. Regarding social welfare, our results indicate that the strengthening of IPR protection can have anambiguous e¤ect. If a market is characterized by a high rate of innovation, a reduction of IPR protection candiscourage innovative performance substantially. However, a reduction of IPR protection can also increase socialwelfare because it may induce imitation.Our empirical analysis tests the predictions derived from the theoretical model. We consider a �rms�R&D
strategy choice between imitation and innovation. Our explanatory variables are internal factors (�rm size,"absorptive capacity", and geographical market size) and external factors (IPR protection, product di¤erenti-ation, competitive pressure, and demand uncertainty). We �nd a strong evidence for the main predictions ofthe theoretical model. A �rms�R&D strategy choice is tightly related to external factors. First, a lower levelof spillovers provides incentives to engage in R&D. Second, competitive pressure, measured by the number ofcompetitors, and higher product substitutability have a negative e¤ect on a �rm�s decision to innovate.The main policy implication derived from our analysis is that a common IPR protection policy for all
markets might be inappropriate. This is because a policy that is bene�cial for a certain type of market mightdiscourage innovation and technological progress in another with di¤erent characteristics. The analysis ofspillovers on social welfare shows that a reduction of IPR protection, intended to induce imitation, can discourageinnovative performance substantially in markets that are characterized by a high rate of innovation. Then, an
2
additional reduction of IPR protection induces more imitation and increases welfare. However, after a certainpoint, the reduction of patent protection completely discourages innovation and therefore reduces social welfare.Moreover, IPR protection policy must be tightly coordinated with the competition policy. This is becauseexternal parameters such as IPR protection and competitive pressure jointly a¤ect the �rms�R&D strategychoice.This paper is related to a large literature on the relationship between market structure and innovation
strategy. Speci�cally, it is related to two strands in the literature. The �rst strand analyzes how �rms�R&Dinvestments are a¤ected by market competition. Pioneer works in this �eld are those of Schumpeter (1934 and1942) who argues that, on the one hand, market pressure may foster �rms�innovation, but, on the other hand,it may decrease �rms�R&D investments because monopoly power of larger �rms acts as a major acceleratorof technological progress. Actually, there is still no accordance on this Schumpeterian debate in theoreticaland empirical studies. For example, some authors argue that more intensive market competition decreases a�rm�s incentives for innovation because when advantages from innovation are temporary, only su¢ cient marketpower guarantees that �rms invest in R&D (Arrow, 1962; Futia, 1980; Gilbert and Newbery, 1982; Reinganum,1983; or Zhou, 2009). This argument is supported by empirical studies that �nd that market concentrationincreases the pace of innovative change. For instance, Henderson and Cockburn (1996) show that large �rmsin the US pharmaceutical industry perform R&D more e¢ ciently, as they can enjoy scale and scope economies.Using patent data of UK manufacturing �rms, Ce�s (2003) �nds that, due to innovative e¤ort, the contributionof large �rms to aggregated industrial performance is above the industry mean. On the other hand, marketconcentration is also argued to have a dampening e¤ect on innovation because more intensive competition actsas an important incentive for �rms to innovate (Dasgupta & Stiglitz, 1980). Again, these theoretical argumentsare supported by empirical evidence (Geroski, 1990; Blundell et al., 1999).These contradictory results led to the hypothesis that the e¤ect of market competition on �rms�innovative
e¤orts is non-monotonic. For example, Boone (2000) �nds that when competition is weak, the incentives ofless e¢ cient �rms to innovate increase. However, when competition becomes more intense, the incentives ofe¢ cient �rms to innovate grow. Aghion et al. (2005) suggest the existence of an inverted-U relationship. Both,a low or high level of competition provide low incentives to innovate while a medium level of competition fostersinnovation of �rms operating on a similar technological level (�neck-and-neck �rms�). On the contrary, Tishlerand Milstein (2009) �nd that R&D investments decrease with competitive pressure. However, at a certain levelof competition �rms engage in "R&D wars" and spend excessively on R&D.The above literature assumes that �rms�innovation behavior is homogeneous, that is, that all �rms innovate.
However, empirical evidence suggests that most markets are characterized by an elevated heterogeneity of R&Dactivities. So, in most markets we �nd a core of �rms that are persistent innovators while other �rms eitherare occasional innovators or imitators (Ce�s and Orsenigo, 2000; Ce�s, 2003). Czarnitzki et al. (2008) �ndthat, depending on a �rm�s role in the market, competitive pressure might have a di¤erent e¤ect on innovativee¤ort. So, while entry pressure decreases the average investment per �rm, it increases innovative e¤ort of marketleaders.The second strand of the literature to which this paper is related are studies that allow for heterogeneity in
�rms�R&D strategies by distinguishing between �rms that innovate and those that imitate innovators. Theo-retical studies have analyzed the e¤ect of the possibility of imitation on innovative incentives in two frameworks,economic growth models (Grossman & Helpman, 1991; Aghion & Howitt, 1992) and oligopolistic competitionmodels (Zhou, 2009). In both cases, the imitation rate is assumed to be exogenously determined. Imitation isshown to foster the innovation activity of technological leaders. This �nding challenges the common view thatpatent protection should be strengthened. In fact, strong IPR protection may slow down the development ofcountries and decrease world welfare and consumer surplus (Helpman, 1993; Bessen & Maskin 2009; Che et al.,2009; Fershtman & Markovich, 2010). Additionally, Braguinsky et al. (2007) �nd that the relationship between
3
innovation and imitation itself depends on other factors such as the maturity of an industry. When the industryis young and small, innovators do not have incentives to prevent imitation. But when the industry expands,innovative e¤ort decreases because of imitation pressure.Most of this literature assumes that innovators and imitators are exogenously given. Exceptions in the
theoretical literature are Segestrom (1991) and Amir and Wooders (2000). Applying an economic growth model,Segestrom (1991) allows �rms to participate in both innovative and imitative R&D races. In the steady-state,�rms�equilibrium R&D strategies depend on the distribution of previous R&D outcomes and the relative price ofimitation. Firms are found to bene�t more from imitation in industries with a single leader, while in industrieswith several leaders innovation is a more pro�table strategy. In a standard oligopoly framework, Amir andWooders (2000) show that, in equilibrium, �rms choose their R&D strategies asymmetrically. This gives rise toan innovator/imitator con�guration in the market. Regarding the empirical literature, the determinants of �rms�R&D strategy choices have been studied by a small number of authors. Using US marketing data, Robinson andMin (2002) �nd that innovators face higher survival risks associated with technological uncertainties. On theother hand, Zhou (2006) �nds that in the presence of demand uncertainty or with more competitive pressure�rms obtain higher bene�ts from being pioneers in innovation. Shankar et al. (1998) analyze data on salesand advertising of 13 brands of ethical drugs in the US. They show that imitators with a slightly di¤erentiatedproduct can grow faster than initial innovators. Therefore, in the presence of rapidly changing technologies, inthe long run, imitators obtain higher bene�ts than innovators because the innovator�s initial pro�ts are rapidlydiscouraged.The rest of the paper is arranged as follows. Section 2 presents a theoretical Cournot duopoly model of
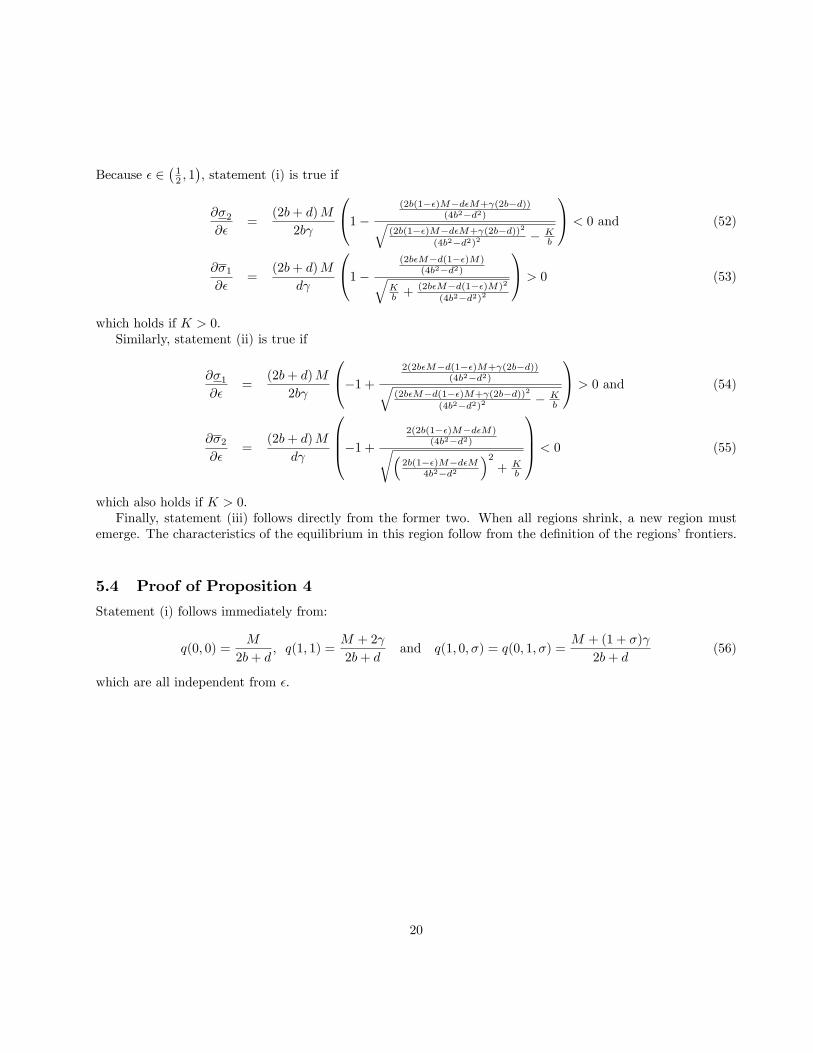
R&D strategy choice and extensions for the cases of asymmetric �rms and more than two-�rm competition.The empirical analysis is performed in Section 3. Section 4 discusses the policy implications of our �ndings.Proofs are in the Appendix.
2 A duopoly model
In this section we develop a two-stage Cournot duopoly model with di¤erentiated products and strategic R&Dchoice. In stage 1, �rms decide simultaneously what R&D strategy to apply, innovation or imitation. In stage 2,�rms compete in quantities with di¤erentiated products, conditional on their R&D strategy choice. We assumethat each �rm produces a single good and that the two goods are substitutes. The inverse demand function ofgood i is:
pi = a� bqi � dqj , i; j = 1; 2; i 6= j, (1)
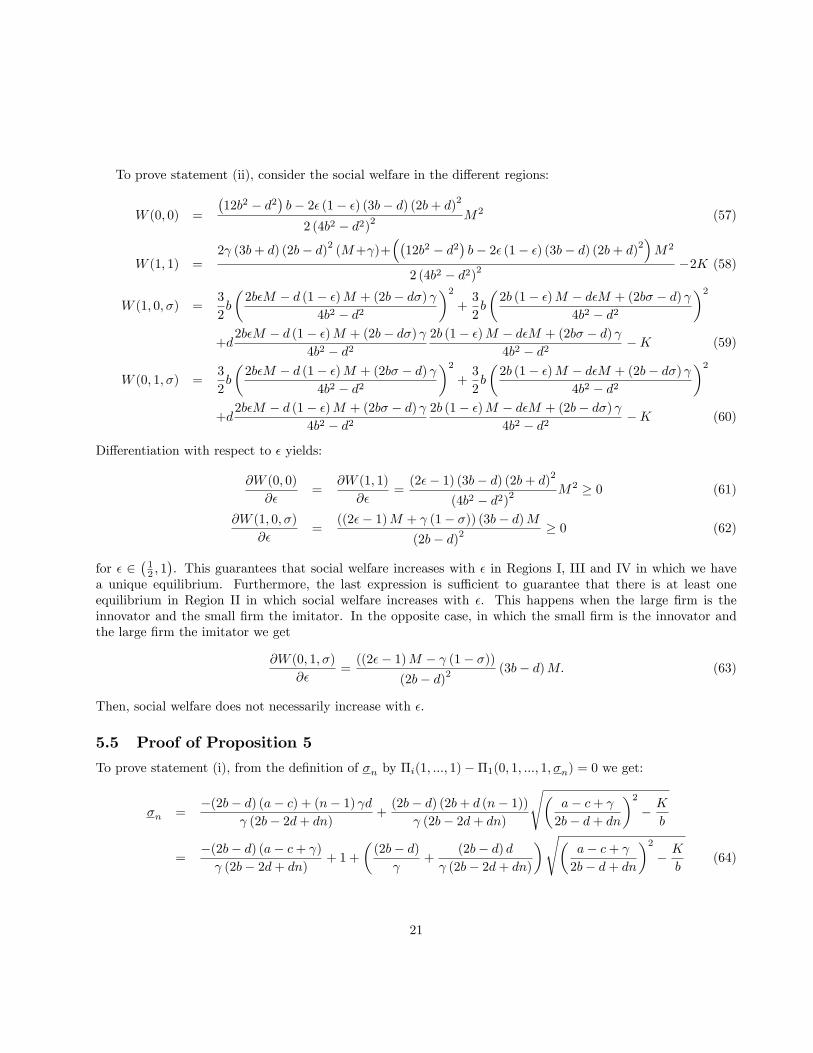
where pi is the price and qi is the quantity of good i. We assume that a > 0, b > 0, d � 0. Furthermore, theabsolute value of the own-price e¤ect on the quantity demanded is assumed to be higher than the correspondinge¤ect of the price of the substitute, thus b� d � 0.The R&D strategy at stage 1 is realized by the choice of a binary variable xi, where xi = 1 stands for the
�rm�s decision to engage in R&D and xi = 0 means that the �rm abstains from innovation. R&D investmentallows a �rm to reduce its unit production cost c by the amount xi at cost Kxi, where 2 [0; 1] and K > 0 areknown constants. However, if a �rm abstains from investing in R&D at stage 1, due to spillovers, it�s productioncost still is reduced by imitating the rival�s R&D outcomes. Concretely, if �rm i innovates and �rm j abstainsfrom innovation but decides to imitate, the unit cost reduction for �rm j is � xi. The parameter � indicatesto what extent a cost reduction of �rm i allows �rm j to reduce its own production costs. We assume that� 2 [0; 1], where � = 0 indicates that there are no spillovers and � = 1 means that �rm j obtains the same cost
4
saving as �rm i without any additional investment.1 Resuming this, the unit production cost of �rm i is givenby:
ci (x1; x2) =
�c� xi
c� (xi + �xj)for x1 = 1 and x2 = 1
else, i; j = 1; 2; i 6= j (2)
where c > . The innovation activity analyzed in this paper is cost-reducing (process innovation). However,the results can be straightforwardly generalized to the case of product innovation.2
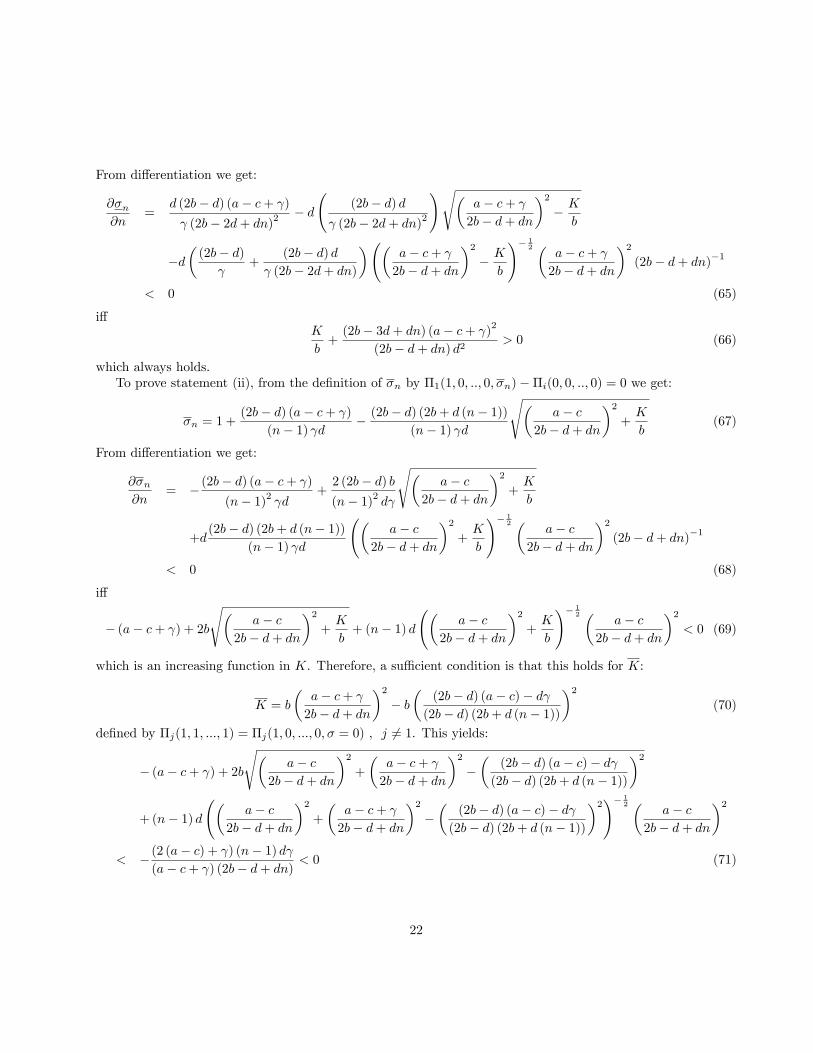
Total production costs are Ci (x1; x2) = ci (x1; x2) qi. The objective of �rm i is to choose the R&D strategythat maximizes pro�ts:
�i (x1; x2) = �i (x1; x2)�Kxi (3)
where �i (x1; x2) denotes operating pro�ts obtained in stage 2.The solution concept is Subgame Perfect Nash Equilibrium (SPNE) and the game is solved by backward
induction. First, for given R&D strategies the optimal equilibrium outputs are solved in the second stage. Then,�rms�pro�t-maximizing R&D strategies in stage 1 are derived.In stage 2, �rm i chooses the output qi in order to maximize its operating pro�t:
�i = (a� bqi � dqj) qi � ciqi; i; j = 1; 2; i 6= j: (4)
From straightforward calculations we �nd that the Nash-Cournot equilibrium output for �rm i is given by:
qi =2b (a� ci)� d (a� cj)
4b2 � d2 , i; j = 1; 2. (5)
Notice, that the output of �rm i is positive as long as (a� ci) > d2b (a� cj). Firm i�s optimal equilibrium
operating pro�t is given by �i = bq2i , i = 1; 2:In stage 1, �rms choose their pro�t-maximizing R&D strategy. When both �rms engage in R&D (i.e.
x1 = x2 = 1), quantities and pro�ts are:
qi(1; 1) =a� c+ 2b+ d
and �i(1; 1) = bqi(1; 1)2 �K. (6)
If none of the �rms engages in R&D (i.e. x1 = x2 = 0), quantities and pro�ts are equal to those of the classicalCournot model with di¤erentiated products:
qi(0; 0) =a� c2b+ d
and �i(0; 0) = bqi(0; 0)2. (7)
Finally, if one �rm engages in R&D, say �rm 1, and �rm 2 decides to imitate, the corresponding quantities andpro�ts are given by:3
q1(1; 0; �) =(2b� d) (a� c) + (2b� d�)
4b2 � d2 and �1(1; 0; �) = bq1(1; 0; �)2 �K (8)
q2(1; 0; �) =(2b� d) (a� c) + (2b� � d)
4b2 � d2 and �2(1; 0; �) = bq2(1; 0; �)2. (9)
1Here we focus on asymmetric spillovers (from the innovator to the imitator), which is justi�ed when �rms perform di¤erentroles in the market (see Bower and Christensen, 1995; De Bondt, 1996; Amir and Wooders, 2000).
2See Tishler and Milstein (2009) for this.3Further on, without loss of generality, we assume that �rm 1 innovates and �rm 2 imitates.
5
The equilibrium R&D strategies are obtained as a result of each �rm�s best strategic response to the pro�t-maximizing strategy of the rival. The most interesting parameters that a¤ect a �rm�s R&D strategy choice arethe extent of spillovers in the industry and the degree of product di¤erentiation, which sometimes is interpretedas a measure for the intensity of competition in the industry (for instance,Tishler and Milstein, 2009).The value of the spillover parameter re�ects the legal and technical framework of the industry, speci�cally,
the level of IPR protection or the ease of knowledge transfer in the market. The polar cases are a blue printdi¤usion in the absence of IPR protection, or the absolute ease of replication (� = 1), and an absence of anyknowledge di¤usion when an invention can be completely protected by a patent, or a high level of knowledgesophistication that makes it impossible to replicate (� = 0). In practice, most markets can be characterizedby some intermediate level of spillovers. The degree of product di¤erentiation varies from completely di¤erentproducts (d = 0) to homogeneous or identical products (d = 1). To exclude trivial cases we make restrictionson R&D costs:
Assumption 1. Let K < K < K where K is de�ned by �i(1; 1) = �i(0; 0), i = 1; 2 and K is de�ned by�2(1; 1) = �2(1; 0; 0).
This assumption guarantees that costs are not too low such that making no R&D is a possible choice andthat costs are not too high such that in the absence of spillovers �rms are interested in investing in R&D. Thus,the focus of the analysis is to characterize the conditions under which engaging in R&D is a Nash equilibrium.Assuming that �rm 1 decides to innovate, from expressions (6) and (9) we see that �rm 2 faces a trade-o¤ whenchoosing between innovation and imitation. On the one hand, if �rm 2 decides to innovate it must pay a costK, which in turn allows to obtain a reduction of unit production costs. On the other hand, if �rm 2 decides toimitate, it saves the payment of the R&D cost K. Then, however, the decrease in unit production costs will belower and depend on the R&D outcome of the innovator and the value of the spillover parameter.To characterize the equilibria of the two-stage game, let � be implicitly de�ned by �i(1; 1)��2(1; 0; �) = 0
and � by �1(1; 0; �)��i(0; 0) = 0. We obtain the following proposition:
Proposition 1 (Existence of equilibria)For given parameter values (d; b; a; c; ) the equilibrium R&D strategies are characterized as follows:
(i) When spillovers are low (� � �) there exists a pure strategy SPNE, in which both �rms engage in R&D(Region I).
(ii) When spillovers are intermediate (� � � � �) there exist multiple pure strategy SPNE, in which one �rmengages in R&D and the other �rm chooses to imitate (Region II).
(iii) When spillovers are high (� � �) there exists a pure strategy SPNE, in which none of the �rms engagesin R&D (Region III).
Furthermore, @�=@K < 0, @�=@K < 0, @�=@ < 0, @�=@ < 0, @�=@ (a� c) > 0 and @�=@ (a� c) > 0:
The three regions are displayed in Figure 1. In Region I there exists a unique SPNE in pure strategiesin which both �rms innovate. This equilibrium is obtained when spillovers and R&D costs are low and whenmarkets are large. Actually, Region I corresponds to the case of a highly innovative competitive industry witheither an elevated level of knowledge protection or knowledge sophistication such that innovations are di¢ cult tocopy. In Region III there exists a unique SPNE in which none of the �rms innovates. This equilibrium emergesin the presence of high spillovers and elevated product homogeneity. Region III is an example of markets wherecompetition together with free knowledge �ows discourages innovation.
6
While �rms�R&D strategies in Regions I and III are symmetric, in Region II both �rms choose opposedstrategies in equilibrium. Furthermore, we have multiple equilibria with one innovating and one imitating�rm.4 This is the case for intermediate spillover levels. An increase in R&D cost K and a decrease in marketsize a � c shifts the curves to the "south-west" so that Region I becomes smaller and innovation in Region IIholds for lower spillover level. Interestingly, Amir and Wooders (2000) also �nd that initially symmetric �rmsapply di¤erent R&D strategies in equilibrium and therefore perform asymmetrically. Their result holds for anysubmodular payo¤ function and Cournot and Bertrand competition. They also model one-way spillovers froman R&D innovator to an R&D imitator. However, they do not consider market factors that may a¤ect �rms�R&D strategy choices and analyze changes in social welfare only in comparison with the case where �rms createa research joint venture.We deal with the multiplicity of equilibria in Region II by assuming that either pure-strategy equilibrium
is played with equal probability. The qualitative nature of the results does not depend on the selection of theequilibrium but re�ects the initial symmetry between �rms and their choices. So, if we allow for mixed strategyequilibria the comparison of payo¤s and social welfare between regions remains the same.
Proposition 2 (The e¤ect of � on aggregated output and social welfare)
(i) Output and welfare are lower in the area of high spillovers (in Region III) than in the area of low spillovers(in Region I);
(ii) Output is increasing in � and welfare is convex in � for intermediate spillovers (in Region II);
(iii) Output decreases when passing from low to intermediate and from intermediate to high spillovers. Welfarecan increase or decrease when passing from low to intermediate spillovers (from Region I to Region II)and welfare decreases when passing from intermediate to high spillovers (from Region II to Region III).
To illustrate the results of Proposition 2, we display the e¤ect of changes in spillovers on aggregate industryoutput and welfare for some parameter values in Figure 2. We obtain two principal results. First, the relationshipbetween the level of spillovers and aggregated industry output is non-monotonic. So, since the industry outputis lower when spillovers are high than when they are low, for intermediate spillover levels an increase of �increases industry output. Second, a similar result holds for the relationship between the level of spillovers andsocial welfare with the di¤erence that the welfare might be even higher for an intermediate spillover level thanfor a low one.These results imply that the answer to the question of whether spillovers favor or discourage innovation
is not straightforward. In our model spillovers have two di¤erent e¤ects on the level of R&D output. A �rste¤ect is that with higher spillovers, in equilibrium, fewer �rms are innovators. This decreases R&D output. Asecond e¤ect is that with higher spillovers imitators obtain greater e¢ ciency gains from the use of innovators�less costly technology. This increases aggregated industry output and social welfare. While the �rst e¤ecttends to dominate if changes in spillover levels are large, the second e¤ect dominates for small variations of �.However, because of discontinuities, small changes in spillovers can also lead to important reductions in R&Doutput, aggregated industry output and social welfare. Therefore, a crucial question is to �nd the right level ofspillovers. This result provides a possible explanation to the long and controversial discussion concerning the
4See also Zhou (2009) who assumes exogenously one innovating �rm and n imitators and analyzes how competitive pressurea¤ects the innovator�s incentives to engage in R&D.
7
duration of patents.5
Regarding the e¤ect of product di¤erentiation on aggregated industry output and social welfare we �ndthat when the product is more homogenous �rms need more IPR protection in order to maintain incentives forinnovation. This �nding is supported by empirical evidence for U.S. drug companies in the 1970s and 1980s.For this data Shankar et al. (1998) show that the capacity to di¤erentiate products acts as an important factorfor the imitators�survival.
2.1 Extension: Asymmetric �rms
The results of Section 2 can be extended for the case of initially asymmetric �rms where the inverse demandfunction of good i is:
pi = ai � bqi � dqj , i; j = 1; 2; i 6= j,b� d � 0; (10)
and the unit production cost of �rm i is given by:
ci (xi; xj) =
�ci � xi
ci � (xi + �xj)for xi = 1 and xj = 1
else, i; j = 1; 2; i 6= j. (11)
Without loss of generality we assume that initially �rm 1 is larger than �rm 2, a1 � c1 > a2 � c2. De�ningM = (a1 � c1) + (a2 � c2), and � = (a1 � c1) =M , this means that � 2
�12 ; 1�. The Nash-Cournot equilibrium
output for �rm i is given by:
qi =2b (ai � ci)� d (aj � cj)
4b2 � d2 , i; j = 1; 2. (12)
Now, four possible situations may occur. When none of the �rms innovates, �rms�outputs are given by:
q1(0; 0) =2b�M � d (1� �)M
4b2 � d2 and q2(0; 0) =2b (1� �)M � d�M
4b2 � d2 . (13)
The corresponding pro�ts are �1(0; 0) = bq1(0; 0)2 and �2(0; 0) = bq2(0; 0)2. When both �rms innovate, the
output of each �rm is:
q1(1; 1) =2b�M � d (1� �)M + (2b� d)
4b2 � d2 and q2(1; 1) =2b (1� �)M � d�M + (2b� d)
4b2 � d2 . (14)
The corresponding pro�ts are �1(1; 1) = bq1(1; 1)2�K and �2(1; 1) = bq2(1; 1)2�K. When only �rm 1 engagesin R&D and �rm 2 decides to imitate, the �rms�outputs are:
q1(1; 0; �) =2b�M � d (1� �)M + (2b� d�)
4b2 � d2 and q2(1; 0; �) =2b (1� �)M � d�M + (2b� � d)
4b2 � d2 : (15)
The �rms�pro�ts are �1(1; 0; �) = bq1(1; 0; �)2 �K and �2(1; 0; �) = bq2(1; 0; �)2. Finally, if �rm 2 engages inR&D and �rm 1 decides to imitate, the �rms�outputs are:
q1(0; 1; �) =2b�M � d (1� �)M + (2b� � d)
4b2 � d2 and q2(0; 1; �) =2b (1� �)M � d�M + (2b� d�)
4b2 � d2 . (16)
5Helpman (1993), Aghion et al. (2001), Bessen and Maskin (2009) and Zhou (2009), for example, argue against patents becauseof their redundant and excessive protection, which discourages �rms�incentives for innovation. Jin et al. (2004), Halmenschlager(2006) and Fershtman and Markovich (2010) also �nd that the presence of patent protection on an intermediate stage would delaythe pace of innovation and that lower spillovers are not the optimal public policy. Finally, Boldrin and Levine (2008) �nd that thegreater the market scale (industry size) the more reduced should be IP protection. On the other hand, Arora and Gambardella(1994), Gans and Stern (2003), Gans et al. (2008) argue that IPR protection is essential for the existence of a market for technology.
8
The �rms�pro�ts are �1(0; 1; �) = bq1(0; 1; �)2 and �2(0; 1; �) = bq2(0; 1; �)2 �K.Let �1 be implicitly de�ned by �1(1; 1) = �1(1; 0; �1), �1 by �1(0; 0) = �1(1; 0; �1), �2 by �2(1; 1) =
�2(1; 0; �2) and �2 by �2(0; 0) = �2(1; 0; �2). Then, we obtain the following result:
Proposition 3 (Existence of equilibria with asymmetric �rms)Compared to the case of symmetric �rms:
(i) The regions, in which both �rms innovate or none of them innovates (Regions I and III) become smallerwhen �rms are asymmetric, as for given values of d we have �2 < � and �1 > �.
(ii) The region with multiple equilibria in which one of the �rms innovates and the other imitates (Region II)becomes smaller, as for given d we have �1 > � and �2 < �.
(iii) A new region with a unique pure strategy SPNE emerges (Region IV). In this region the large �rm is aninnovator and the small �rm an imitator.
The four regions with the resulting equilibria are displayed in Figure 3. A speci�c feature of this extension is thatallowing for initially asymmetric �rms leads to the emergence of an area where the larger �rm is an innovatorand the smaller �rm chooses to imitate. A similar result was found by Cabral and Polak (2004) who show thatan increase in a �rm�s relative dominance raises incentives for that �rm to innovate and decreases those of therival. Empirical evidence widely supports this result. For instance, Henderson and Cockburn (1996) using datafrom individual research programs of pharmaceutical �rms in the United States, suggest the advantage of large�rms in the conduct of basic research.The di¤erence between the situations in Region II and Region IV can be explained in terms of the persistence
of �rms�R&D strategies. In Region II we have equilibria where the optimal strategy of a �rm is opposed tothat of the rival. If the rival innovates the best reply is to imitate, and vice versa. Therefore, in a repeatedcontext of this game �rms will not follow a continuous innovation strategy in Region II. On the contrary, inRegion IV initially asymmetric �rms always choose the same R&D strategy. The larger �rm innovates and thesmaller �rm imitates. So, in Region IV, both �rms continuously choose the same R&D strategy. The results inProposition 3 allow us to obtain testable predictions of how market conditions such as product di¤erentiation,�rm asymmetries and spillovers a¤ect �rm�s R&D strategy choice.
Proposition 4 (The e¤ect of �, �rm asymmetry, on aggregated output and social welfare)
(i) Aggregated industry output is constant in � in all regions.
(ii) In all region there exists at least one equilibrium in which social welfare is increasing in �.
Endogenizing a �rm�s decision to innovate or to abstain from innovation we obtain that asymmetries between�rms, which may lead to a persistent innovator-imitator con�guration in the market, positively a¤ects socialwelfare. A similar result has been obtained by Cabral and Polak (2004) who examine the relation between�rm dominance and spillover levels. They �nd that an increase in market dominance of a �rm increases it�sR&D spending and the �rm�s pro�ts. However, it discourages other �rms to innovate. Which of the two e¤ectsdominates depends on IPR protection. They conclude that dominance is good for innovation when propertyrights are strong but discourages innovation when the IPR protection is weak.
9
2.2 Extension: n �rms
In this section we analyze how the results extend to oligopoly markets with n initially symmetric �rms. In thiscase, the corresponding inverse demand function of good i is given by:
pi = a� bqi � dPj 6=iqj ; i = 1; :::; n, (17)
We assume that spillovers occur when at least one �rm decides to innovate. Thus, unit production cost are:
ci (xi; x�i) =
8<: c� c� �c
if xi = 1if xi = 0 and 9j with xj = 1
else, i = 1; :::; n. (18)
In stage 2, �rm i chooses the output qi to maximize its operating pro�t:
�i =
a� bqi � d
Pj 6=iqj
!qi � ciqi; i; j = 1; 2; i 6= j: (19)
The Nash-Cournot equilibrium output for �rm i is given by:
qi =(2b� d) (a� ci)� d
�nci �
Pnj=1 cj
�(2b� d) (2b+ d (n� 1)) . (20)
In stage 1, �rms choose their pro�t-maximizing R&D strategy. When all �rms engage in R&D (i.e. x1 =::: = xn = 1), outputs and pro�ts are:
qi(1; :::; 1) =a� c+
2b+ d (n� 1) and �i(1; :::; 1) = bqi(1; :::; 1)2 �K. (21)
If none of the �rms engages in R&D (i.e. x1 = ::: = xn = 0), output and pro�ts are equal to those of theclassical Cournot model with di¤erentiated products:
qi(0; :::; 0) =a� c
2b� d+ dn and �i(0; :::; 0) = bqi(0; :::; 0)2. (22)
Furthermore, if all �rms except one, say �rm 1, engage in R&D the corresponding output and pro�t of �rm 1are given by:
q1(0; 1; :::; 1; �) =(2b� d) (a� c+ � )� (n� 1) (1� �) d
(2b� d) (2b+ d (n� 1)) and �1(0; 1; :::; 1; �) = bq1(0; 1; :::; 1; �)2. (23)
Finally, if none of the �rms innovates, except one, say �rm 1, the corresponding output and pro�t of �rm 1 aregiven by:
q1(1; 0; :::0; �) =(2b� d) (a� c+ ) + (n� 1) (1� �) d
(2b� d) (2b+ d (n� 1)) and �1(1; 0; :::0; �) = bq1(1; 0; :::0; �)2 �K. (24)
To analyze how the frontiers of Region I and Region III depend on the number of �rms in the market, weexamine a �rm�s choice between innovation and imitation. First, we assume that all other �rms in the industryinnovate. Second, we assume that all other �rms do not engage in R&D. Let �n be such that �i(1; 1; ::; 1) =�1(0; 1; :::; 1; �n) and �n such that �1(1; 0; ::; 0; �n) = �i(0; 0; ::; 0).
Proposition 5 (The e¤ect of n, competitive pressure, on equilibria)Compared to the duopoly case with two symmetric �rms we have:
10
(i) The region, in which all �rms innovate (Region I) decreases with the number of �rms in the market as forgiven d we have �n < �n�1.
(ii) The region, in which none of the �rms innovates (Region III) increases with the number of �rms in themarket as for given d we have �n < �n�1.
Figure 4 displays how Regions I and III change when the number of �rms in the market increases. RegardingRegion I, we observe that the probability of a particular �rm to engage in R&D decreases as the number ofcompetitors increases. With more competitors initially symmetric �rms will be innovators only when productsare su¢ ciently di¤erentiated and IPR protection is high. This �nding is supported by empirical evidence fromShankar (1998). Though Region I shirks with entry, notice that the overall innovative performance in the marketincreases within Region I as entrants also engage in R&D. With more competitors what was formerly RegionII becomes more complex as further possible equilibria emerge. For example, with three �rms we can havemultiple equilibria with one innovator and two imitators or with two innovators and one imitator. ConcerningRegion III, we �nd that the entry of new �rms means that equilibria with no innovating �rm will occur for lowerspillover values and for more di¤erentiated products. Together, these results imply that the e¤ect of entry ontotal R&D performance and welfare depends on spillovers and product di¤erentiation. Concretely, we get thefollowing result.
Proposition 6 (The e¤ect of n, competitive pressure, on industry R&D output and welfare)
(i) Entry increases total R&D output and welfare when spillovers are low and products are highly di¤erentiated.
(ii) Entry decreases total R&D output and welfare when spillovers are high and products are rather homoge-nous.
This result is similar to that of De Bondt et al (1992) who �nd that more rivals typically lead to reducedinvestments, output and pro�tability, while consumer surplus and welfare increase, or at least do not decrease.On the contrary, Tishler and Milstein (2009) show that social welfare decreases with the number of competitors.However, their model doesn�t account for spillovers of R&D between �rms, and the increase in competitionleads to excessive R&D spending.
3 Empirical analysis
The empirical analysis is intended to examine the consistency of the predictions that can be derived from thetheoretical model. Speci�cally, it contributes to the literature by including �rm internal characteristics as wellas external market parameters (competitive pressure, spillover level, product substitutability) in the analysis ofa �rms�R&D decision. This is important, because the innovation strategy of a �rm must be considered in thecontext of its global market strategy as it serves to maintain and improve the �rm�s market position. Therefore,when managers decide to launch an R&D project, they consider both internal �rm characteristics and externalfactors such as rivals�strategies, competitive pressure, knowledge speci�city, intellectual property protection,availability of funding, public support etc. A variation in one of these external factors might critically a¤ectthe �rm�s resources and capabilities and thereby the �rm�s innovation strategy.Empirical studies during the last decades discussed the determinants of R&D activity mainly based on inter-
nal �rm characteristics such as �rm size, appropriability of the outcomes of innovation, access to international
11
markets, cooperation with customers, suppliers and others (Patel and Pavitt, 1992; Crépon et al., 1998; Loofand Heshmati, 2002; Veugelers and Cassiman, 2005). Less attention has been paid to external factors. Thiscertainly is due to the problems that its measurement rises. For example, the intensity of market competitionhas been proxied with concentration measures, such as concentration ratios or the Hirshman-Her�nadahl in-dex, based on industry data (Geroski, 1990; Blundel et al., 1999; Aghion et al., 2005). The problem with thisapproach is that the market in which �rms compete can hardly be identi�ed by the industrial sector. So, �rmswithin one sector might not compete at all if their products meet di¤erent consumer needs. Another example isthe measurement of spillovers. The average spillover level has been measured with industry data as an averageof �rm R&D expenditures in the industry (Bloom et al., 2007; Czarnitzki and Kraft, 2007). However, �rms canprotect the outcomes of their R&D activity by using legal protection mechanisms as well as by secrecy. So, thisindicator might wrongly re�ect the spillover level in the industry or in the market.The common problem with the measurement of these variables is that market characteristics such as the
�rm�s market position, the level of knowledge protection or demand uncertainty are not directly observable.The Mannheim Innovation Panel (MIP), a survey used in this study, allows to improve the measures of externalfactors. This is because �rms provide information about these factors according to their own perceptions ofmarket characteristics, which de�nitely determine their R&D strategies.
3.1 Data and variables
To investigate the determinants of �rms� R&D strategy choices, we use data from MIP conducted by theCentre for European Economic Research (ZEW). The database has a cross-sectional structure. It covers arepresentative sample of German manufacturing and service sectors during the period 1995-2007. It includesimportant information on the introduction of new products, services and processes within �rms, as well asdetails on innovation activity and the degree of success achieved by �rms through the introduction of newproducts and the improvement of processes. Remarkably, the MIP questionnaire of 2005 asks �rms aboutinternal and external factors that a¤ect their decisions regarding commercialization and innovation during theperiod 2002-2004. Thereby, it provides valuable information for the purposes of our study.Our dependent variable (STR) represents a �rm�s R&D strategy choice. STR is a categorical variable that
indicates if, between 2002 and 2004, a �rm did not introduce any innovation, introduced a product that is newfor the �rm but known in the market or introduced a product that is new for the market. As it is commonin the economic literature, we interpret the introduction of a product that is new for the market as innovationwhile the introduction of a product that is new for the �rm (but not for the market) is interpreted as imitation(Vinding, 2006).That the rate of innovating and imitating �rms varies across industries, can be observed for the representative
sample of German �rms. In Table 1 we display the rate of innovating �rms for manufacturing and services sectorsin the year 2005. The highest rate of non-innovating �rms can be observed in sectors such as mining, textilesand food and tobacco, and many of the services sectors. On the other hand, in sectors such as chemicals,medical instruments and electrical equipment we �nd that most �rms are innovators. Thus, we observe that�rms�R&D strategies vary across industries and markets which also agrees with the results of our theoreticalmodel that suggest that the level of a �rm�s innovative performance can be a¤ected by market characteristics.Consequently, to study �rms�R&D strategy choices, we include two categories of independent variables into ourempirical model: variables that measure internal and external factors. As commonly used in �rm-level studies,our internal factors are: �rm size (SIZE02), absorptive capacity (AC03), �rm�s group membership (GROUP),turnover from exports (EX02), geographical market size to which a �rm accesses (GEO), and, speci�c to our
12
data, �rm location in the territory of former Eastern Germany (OST).6
Most studies on �rm innovation control for �rm size, measured by the number of employees or turnover, aslarger �rms are supposed to be more e¢ cient in the conduct of innovation (Henderson and Cockburn, 1996;Shefer and Frenkel, 2005). In our study SIZE02 is measured by the number of employees. Regarding GROUPand EX02, former studies suggest that �rms, which belong to the group, and �rms, which export abroad, havemore incentives and resources for innovation. GEO is used as a proxy for the �rm´s market size. We distinguishbetween �rms that have access to di¤erent markets: local or regional markets, the German (i.e. nation-wide)market, the market of EU member, EU candidate and EFTA member countries and the world market. Thevariable GEO in the empirical analysis corresponds to (a � c) in the theoretical model. Alternatively, SIZE02is also related to (a � c). According to the theoretical model, we expect a positive e¤ect of GEO and SIZE02on a �rm�s propensity to engage in R&D (see Proposition 1).Apart from the traditional internal factors mentioned above, the literature adopted the term absorptive
capacity, which is a measure of a �rm�s ability to identify, assimilate and apply new knowledge given the �rm�sexperience, human capital skills, and organizational procedures��exibility and relevance (Cohen and Levintal,1989). Firms that have higher absorptive capacity are expected to dispose of more capability for R&D. Thereis a number of ways to measure a �rm�s absorptive capacity (see Schmidt, 2005). Given the cross-sectionalstructure of our data, AC03 is measured as the proportion of all employees with a university degree or otherhigher education quali�cation in 2003. As a �rm�s absorptive capacity depends on that of its employees, thegeneral level of education, experience and training of employees, this seems to be a good proxy for a �rm�sabsorptive capacity. Finally, we use the dummy variable OST to control whether a �rm is located in formerEastern Germany. Historically, �rms belonging to the western and eastern part of Germany were a¤ected bydi¤erent institutional settings. Therefore, the innovative performance might di¤er among �rms in these regions.Regarding the external factors, our variables are: intellectual property rights protection (IPR and av_IPR),
the pace of technological change (TEC), competitive pressure (COM), product di¤erentiation (DIF), and demanduncertainty (DEM). The MIP survey is based on �rms� perceptions regarding their external environment.Because manager�s decisions are based on their subjective perceptions of external factors this allows to assessbetter the determinants of �rms� R&D strategy choices. The external factors IPR, TEC, DIF, DEM arerepresented by categorical variables. In order to get information on them, each �rm was asked to what extent itwas a¤ected by these factors. Firms�answers take values in Likert scale from 0 ("not applicable") to 3 ("appliesstrongly").The level of intellectual property protection is measured by IPR. IPR is an index constructed as the sum
of the scores of the success of legal protection mechanisms for innovations and inventions (patents, registeredand industry design, trademarks and copyright), rescaled from 0 (minimum level) to 1 (maximum level). Todeal with possible endogeneity of IPR, as in Schmidt (2006), we calculate for each �rm the average IPR acrossthe NACE 3-digit industry code excluding this �rm (av_IPR). A higher value of this variable means betterprotection of intellectual property (or more di¢ culty for copying). In the theoretical model this corresponds toa lower value of �. We suggest a positive e¤ect of successful IPR protection in the industry on �rms�incentivesto innovate. Another measure of spillovers is TEC, which is an evaluation of the pace of technological changein the industry provided by �rms. A higher value of TEC corresponds to a lower level of spillovers, as itre�ects higher knowledge complexity. Therefore, according to predictions from the theoretical model we expecta positive e¤ect of TEC on �rms�"innovativeness".The variable COM is measured by the number of main competitors reported by a �rm. Since a �rm has
better vision of its market, this indicator closer measures the intensity of market competition. This is a proxyfor n, the number of �rms, in the theoretical model. According to Proposition 5, we expect a negative impact of
6Numbers in the variable de�nitions indicate the year of measurement.
13
competitive pressure on the propensity of a �rm to engage in R&D. Another indicator for competitive pressureis the degree of product substitutability (DIF) which corresponds to d=b, in the theoretical setup. From thetheoretical results we do not get a clear prediction for the sign of the parameter estimate of this variable, i.e.for its in�uence on �rms�decisions to become innovators. The variable DEM measures demand uncertaintyrelated to changes in consumers tastes. Following some previous studies, we expect that unforeseeable demandnegatively a¤ects the incentives of �rms to innovate. Especially, it might discourage persistent innovation (seeCaballero and Pindyck, 1996; Czarnitzki and Toole, 2008). The asymmetries between �rms are captured by theparameter � in the theoretical model. The e¤ect of � is captured by the variables SIZE02 and GEO. We expectthat a �rm that is larger than its rivals is more likely to engage in R&D, while a �rm that is smaller than itsrivals would be more likely to become an imitator when product substitutability is high. We also control forunobserved heterogeneity in the innovative performance across sectors by, following OECD taxonomy for NACERev.1 codes, including 25 aggregated industry sectors and 5 industry classes (high-tech manufacturing, high-tech services, medium-high- and medium-low-tech manufacturing, and low-tech manufacturing and services)according to R&D intensity.7
A detailed description of the variables, their theoretical counterparts and expected signs are provided inTable 2. Table 3 presents descriptive statistics on the variables used. 28% of the �rms in our sample belong tohigh-tech services sectors, 8% to high-tech manufacturing and 27% to medium-tech manufacturing. Over 27%of �rms introduced product innovations that were new to their market by 2005, while 33% of �rms introducedproducts that were known to their market but new for the �rm. 40% of �rms abstained from innovation. Theaverage �rm in the sample has 575 employees, among them, 20% have higher education. 34% of �rms are groupmembers, and 34% of the �rms are from Eastern Germany. Over 70% of the �rms indicate that intellectualproperty is not well-protected, and only 1.5% recognize a high success of legal protection mechanisms. Fromthe correlation analysis, we �nd that there are no systematic correlations between variables that could a¤ectthe results of our econometric analysis.
3.2 Econometric analysis and results
We test our model using a multinomial logit and an ordinal logit speci�cation. A �rm chooses whether to engagein R&D considering:
y�i = x0i�1 + z
0i�2 + "i
where y�i is the unobserved latent variable which is the utility obtained from continuous innovation activities.The vectors xi and zi contain the proxies for internal and external parameters that a¤ect the �rms�R&D strategychoice. The observed dependent variable yi is a choice between 3 alternatives: to abstain from innovation, toimitate and to engage in R&D. The probability that the ith response falls into the jth category is given by�ij = Pr fyi = jg. The appropriate model to treat these probabilities would be one that considers them asunordered strategic choices, or, as naturally ordered strategy choices representing the degree of innovativenessin the �rm�s activity.First, consider the multinomial response model.8 We are interested in analyzing how ceteris paribus changes
in the elements of the vectors xi and zi of covariates associated with the ith individual a¤ect the response
7Aggregations of manufacturing and services based on NACE Rev 1.1, Eurocomission.8The regressors of the model are alternative-invariant, as the the choice depends on attributes of individuals and not on the
characteristics of the alternatives. Therefore, the choices are not conditioned on the alternatives.
14
probability for category j:
�ij = Pr(yi = jjxi) =exp (x0i�1 + z
0i�2)
1 +PJ
j=1 exp (x0i�1 + z
0i�2)
;
where j = 1; :::; J . The assumption of independence of irrelevant alternatives is tested by the standard Hausmantest (Hausman and McFadden, 1984), which compares coe¢ cients obtained in a multinomial model with thoseobtained by pairwise estimation of alternatives chosen with the same reference in a binary choice model.Second, consider the ordinal logit model, which is obtained directly from a binary model by splitting y� into
J ordinal categories:yi = j if � j�1 < y�i < � j ,
where � j are the estimated cutpoints (thresholds). The probability of observing y = j for given values of x is:
Pr(y = jjx) = Pr (� j�1 < y�i < � j jx) .
For model evaluation we report pseudo-R2. The regression parameters usually are not interpreted directly.Instead, we consider marginal e¤ects of changes in regressors on the outcome probabilities. The marginal e¤ectsof R&D strategies are reported with respect to the reference category, which is a �rm�s decision to abstain frominnovation.Table 4 provides the estimates for multinomial logit speci�cations. Table 5 provides the estimates for ordered
logit speci�cations. Both estimated models show e¤ects of similar direction and magnitude. Hence, the e¤ectsof market parameters on �rm R&D strategies are robust to the model speci�cation. The results suggest thata �rm�s R&D strategy is a¤ected to great extent by both internal and external factors (see Tables 4 and 5).The pseudo-R2 takes values from 0:1607 to 0:1987. As expected, �rm size, absorptive capacity and groupmembership have a signi�cant positive impact on a �rm�s innovativeness, measured as its propensity to engagein innovation. Geographical market size also has a strong positive e¤ect. This fact provides empirical supportfor Propositions 1 and 3 of our theoretical setup. Notably, the location of a �rm in former Eastern Germany isrelated to a lower propensity of the �rm to engage in R&D, although this e¤ect is lowly signi�cant.The estimation results suggest crucial importance of external (market) factors for a �rm�s R&D strategy
choice. The success of legal IPR protection in the industry crucially a¤ects a �rms�choice to engage in imitativeor innovative activity. This might be due to several reasons. First, the reduction of uncertainty about the R&Doutcomes and future pro�ts due to patent protection plays a very important role in the decision of �rms toengage in R&D. This result provides support for the arguments of Arora and Gambardella (1994), Gans andStern (2003), and Gans et al. (2008) that the perception of protection for new ideas provides more incentivesfor �rms to innovate. Second, better IPR protection might enhance open innovation. Acording to the �openinnovation paradigm�, �rms use patents as a channel of knowledge disclosure and dissemination. This bene�tsother �rms in the industry and allows them to be more innovative (Chesbrough, 2003).Competitive pressure measured by the number of main competitors negatively a¤ects �rms�incentives to
innovate, which supports the results in Proposition 5. A similar result has been obtained in a previous studyby Czarnitzki et al. (2008) who use a framework with Stackelberg competition and endogenous market entry.They conclude that entry pressure results in a decrease of �rm�s innovation incentives. Although, when entrypressure is high, market leaders tend to spend more on R&D. Regarding the degree of product substitutability,we �nd a positive e¤ect. This indicates that in markets with highly substitutable products �rms have moreincentive to do R&D. As expected, demand uncertainty negatively a¤ects �rms�decision to innovate. Mostindustry dummies result signi�cant. Concerning industry classes, medium- and high-tech manufacturing andhigh-tech services show signi�cant positive e¤ects with respect to the base category, other manufacturing andservices sectors.
15
4 Concluding remarks
This paper analyzes how the equilibrium R&D strategies of �rms are a¤ected by external factors such asspillovers and competitive pressure. The theoretical and empirical analysis contributes to the understanding ofa �rm�s R&D strategy choice. In this paper, especially, we focus on a �rms�choice to innovate or to imitate.From the theoretical model we obtain that when �rms choose endogenously their optimal R&D strategies
three types of equilibria arise: equilibria in which all �rms innovate, equilibria in which �rms choose asymmetricR&D strategies with one innovating and one imitating �rm, and, �nally, equilibria in which no �rm innovates.We �nd that stronger intellectual property rights protection provides higher incentives for �rms to engage inR&D. Nevertheless, smaller �rms are less likely to be innovators in markets with homogenous product andhigh levels of spillovers. An increase in the number of competitors or more demand uncertainty decrease �rms�incentives to innovate. Regarding social welfare, depending on external factors, stronger intellectual propertyrights protection can provide both higher and lower incentives for �rms to engage in R&D. If a market ischaracterized by a high rate of innovation a reduction of IPR protection can discourage innovative performancesubstantially. However, a reduction of IPR protection can also increase social welfare because it may induceimitation and resulting in higher aggregate industry output.Following the prediction from the theoretical model, in the empirical part of the paper we explicitly consider
that �rms may have di¤erent innovation strategies (imitate or innovate) and analyze which factors a¤ect �rms�R&D strategy choice. Our explanatory variables are internal factors (�rm size category, absorptive capacity, andgeographical market size) and external factors (product di¤erentiation, competitive pressure, IPR protectionperception by �rms and on average in the industry, and demand uncertainty). We �nd strong empirical evidencefor our main predictions from the theoretical model. A �rms�R&D strategy choice is tightly related to externalfactors. First, the e¢ ciency of legal IPR protection provides incentives to engage in R&D as it guaranteesbetter appropriation of the bene�ts of innovation. Second, competitive pressure, measured by the number ofcompetitors, has a negative e¤ect.Some important policy implications are obtained from our results. We �nd that a common IPR protection
policy irrespective speci�c market and �rms characteristics is inappropriate. The analysis of spillover e¤ectson social welfare shows that a reduction of IPR protection can discourage innovative performance but alsoallow for imitation with a positive total welfare e¤ect. Another implication of our �ndings is that the IPRprotection policy must be tightly coordinated with the competition policy because external parameters such asIPR protection and competitive pressure jointly a¤ect the �rms�R&D strategy choice.
5 Appendix.
5.1 Proof of Proposition 1
De�ne � such that �rm i is indi¤erent between engaging and abstaining from R&D when �rm j imitates:
�1(1; 0; �)��i(0; 0) = b�2b (a� c+ )� d (a� c+ � )
4b2 � d2
�2�K � b
�2b (a� c)� d (a� c)
4b2 � d2
�2= 0; (25)
that is:
� =2b (a� c+ )� d (a� c)
d ��4b2 � d2
�d
sK
b+
�a� c2b+ d
�2. (26)
16
De�ne � such that �rm i is indi¤erent between engaging and abstaining from R&D when �rm j engages inR&D:
�i(1; 1)��2(1; 0; �) = b�2b (a� c+ )� d (a� c+ )
4b2 � d2
�2�K�b
�2b (a� c+ � )� d (a� c+ )
4b2 � d2
�2= 0 (27)
that is:
� =�2b (a� c) + d (a� c+ )
2b +
�4b2 � d2
�2b
s�a� c+ 2b+ d
�2� Kb
(28)
First, consider the partial derivatives. From equations (26) and (28) we have: @�=@K < 0, @�=@K < 0,@�=@ = ��= < 0, @�=@ = � �= < 0,
@�=@ (a� c) =2b� dd
241� � a� c2b+ d
� K
b+
�a� c2b+ d
�2!�1=235 > 0, and (29)
@�=@ (a� c) = �2b� d2b
241� �a� c+ 2b+ d
� �a� c+ 2b+ d
�2� Kb
!�1=235 > 0. (30)
To prove existence of the equilibria we make the following claims:Claim 1: � > �.We have:
� � � =�4b2 � d2
� d
0@ (a� c+ )2b
�
sK
b+
�a� c2b+ d
�2� d
2b
s�a� c+ 2b+ d
�2� Kb
1A (31)
This is an increasing function in K under assumption 1, i.e.
@� � �@K
=
�4b2 � d2
�2b d
0@� Kb+
�a� c2b+ d
�2!� 12
+d
2b
�a� c+ 2b+ d
�2� Kb
!� 12
1A > 0 (32)
for K > K. Therefore, a su¢ cient condition for � > � is that the condition holds for K = K:
� � � =
�4b2 � d2
� d
0@ (a� c+ )2b
�
sK
b+
�a� c2b+ d
�2� d
2b
s�a� c+ 2b+ d
�2� Kb
1A=
1
2b(2b� d) > 0. (33)
Claim 2: � < 1.From assumption 1 we have that K > K = b
�a�c+ 2b+d
�2� b
�a�c2b+d
�2. Thus
� <2b (a� c+ )� d (a� c)
d ��4b2 � d2
�d
sK
b+
�a� c2b+ d
�2= 1 (34)
17
Claim 3: � > 0.
From assumption 1 we have K < K = b�a�c+ 2b+d
�2� b
�(2b�d)(a�c)�d
4b2�d2
�2. Thus, � > �2b(a�c)+d(a�c+ )
2b +
(4b2�d2)2b
r�a�c+ 2b+d
�2� K
b = 0.
Together, claims 1-3 prove the existence of the di¤erent equilibria.
5.2 Proof of Proposition 2
First, consider aggregated output. We have:
q(1; 1) =2 (a� c+ )2b+ d
> q(1; 0; �) =2 (a� c) + (1 + �)
2b+ d> q(0; 0) =
2 (a� c)2b+ d
(35)
and @q(1; 0; �)=@� > 0 which proves the statements regarding aggregated output.Next, consider social welfare. When both �rms engage in R&D, (i.e. xi = 1, i = 1; 2) social welfare is:
W (1; 1) = (3b+ d)
�a� c+ 2b+ d
�2� 2K (36)
If none of the �rms engages in R&D, (i.e. xi = 0, i = 1; 2) social welfare is:
W (0; 0) = (3b+ d)
�a� c2b+ d
�2(37)
Finally, if �rm 1 engages in R&D and �rm 2 decides to imitate, social welfare is:
W (1; 0; �) = �1(1; 0; �) + �2(0; 1; �) + dq1(1; 0; �)q2(0; 1; �) +1
2b�q21(1; 0; �) + q
22(0; 1; �)
�=
3
2b
�a� c2b+ d
+(2b� d�) 4b2 � d2
�2+3
2b
�a� c2b+ d
+(2b� � d) 4b2 � d2
�2+d
�a� c2b+ d
+(2b� d�) 4b2 � d2
��a� c2b+ d
+(2b� � d) 4b2 � d2
��K (38)
To prove statement (i), from (36) and (37) we have:
W (1; 1)�W (0; 0) = (2b+ d)�2(2a� 2c+ ) (3b+ d) � 2K
> (2b+ d)�2(2a� 2c+ ) (3b+ d) � 2K
=2 (b� d)
�4b2 � d2
�(a� c) +
�4b3 � bd2 + d3
�
(4b2 � d2)2 > 0 (39)
18
To prove statement (ii), consider the second derivative of (38):
@2W (1; 0; �)
@�2=
�12b2 � d2
�b 2
(4b2 � d2)2> 0: (40)
Finally, to prove statement (iii), we analyze when
W (1; 0; �) < W (1; 1). (41)
By de�nition of � we have �2(0; 1; �) = �2(1; 1). So, (41) is equivalent to
�1(1; 0; �) + dq1(1; 0; �)q2(0; 1; �) +1
2b�q21(1; 0; �) + q
22(0; 1; �)
�< �1(1; 1) + (d+ b) q1(1; 1)q2(1; 1) (42)
or1
2 (� � 1) (2 (b� d) (a� c) + (b� 2d+ b�)) < 0 (43)
or
1
4 (� � 1)
0@(2b� 3d) (a� c+ ) + �4b2 � d2�s�
a� c+ 2b+ d
�2� Kb
1A < 0. (44)
This is true if 2b > 3d or K < 8(b�d)(a�c+ )2bd(4b2�d2)2 . Notice, that in case of homogeneous products the conditions
are not ful�lled such that W (1; 0; �) > W (1; 1).Next, we analyze when
W (1; 0; �) > W (0; 0). (45)
By de�nition of � we have �1(1; 0; �) = �1(0; 0). So (45) is equivalent to
�2(0; 1; �) + dq1(1; 0; �)q2(0; 1; �) +1
2b�q21(1; 0; �) + q
22(0; 1; �)
�> �2(0; 0) + (d+ b) q
21(0; 0) (46)
or�2 (a� c) (b� d+ (3b� d)�) +
�b+ 3b�2 � 2d�
�> 0 (47)
which always holds.
5.3 Proof of Proposition 3
From the de�nition of �1, �1, �2 and �2 we obtain:
�1 = �2b�M � d (1� �)M � d 2b
+4b2 � d22b
s(2b�M � d (1� �)M + (2b� d))2
(4b2 � d2)2� Kb
(48)
�1 =2b (M�+ )�Md (1� �)
d ��4b2 � d2
�d
sK
b+(2b�M � d (1� �)M)2
(4b2 � d2)2(49)
�2 = �2b (1� �)M � d (�M + )
2b +
�4b2 � d2
�2b
s(2b (1� �)M � d�M + (2b� d))2
(4b2 � d2)2� Kb
(50)
�2 =2b (1� �)M � d�M + 2b
d � 4b
2 � d2d
s�2b (1� �)M � d�M
4b2 � d2
�2+K
b(51)
19
Because � 2�12 ; 1�, statement (i) is true if
@�2@�
=(2b+ d)M
2b
0@1� (2b(1��)M�d�M+ (2b�d))(4b2�d2)q
(2b(1��)M�d�M+ (2b�d))2(4b2�d2)2 � K
b
1A < 0 and (52)
@�1@�
=(2b+ d)M
d
0@1� (2b�M�d(1��)M)(4b2�d2)q
Kb +
(2b�M�d(1��)M)2
(4b2�d2)2
1A > 0 (53)
which holds if K > 0.Similarly, statement (ii) is true if
@�1@�
=(2b+ d)M
2b
0@�1 + 2(2b�M�d(1��)M+ (2b�d))(4b2�d2)q
(2b�M�d(1��)M+ (2b�d))2(4b2�d2)2 � K
b
1A > 0 and (54)
@�2@�
=(2b+ d)M
d
0BB@�1 + 2(2b(1��)M�d�M)(4b2�d2)r�
2b(1��)M�d�M4b2�d2
�2+ K
b
1CCA < 0 (55)
which also holds if K > 0.Finally, statement (iii) follows directly from the former two. When all regions shrink, a new region must
emerge. The characteristics of the equilibrium in this region follow from the de�nition of the regions�frontiers.
5.4 Proof of Proposition 4
Statement (i) follows immediately from:
q(0; 0) =M
2b+ d, q(1; 1) =
M + 2
2b+ dand q(1; 0; �) = q(0; 1; �) =
M + (1 + �)
2b+ d(56)
which are all independent from �.
20
To prove statement (ii), consider the social welfare in the di¤erent regions:
W (0; 0) =
�12b2 � d2
�b� 2� (1� �) (3b� d) (2b+ d)2
2 (4b2 � d2)2M2 (57)
W (1; 1) =2 (3b+ d) (2b� d)2 (M+ )+
��12b2 � d2
�b� 2� (1� �) (3b� d) (2b+ d)2
�M2
2 (4b2 � d2)2�2K (58)
W (1; 0; �) =3
2b
�2b�M � d (1� �)M + (2b� d�)
4b2 � d2
�2+3
2b
�2b (1� �)M � d�M + (2b� � d)
4b2 � d2
�2+d2b�M � d (1� �)M + (2b� d�)
4b2 � d22b (1� �)M � d�M + (2b� � d)
4b2 � d2 �K (59)
W (0; 1; �) =3
2b
�2b�M � d (1� �)M + (2b� � d)
4b2 � d2
�2+3
2b
�2b (1� �)M � d�M + (2b� d�)
4b2 � d2
�2+d2b�M � d (1� �)M + (2b� � d)
4b2 � d22b (1� �)M � d�M + (2b� d�)
4b2 � d2 �K (60)
Di¤erentiation with respect to � yields:
@W (0; 0)
@�=
@W (1; 1)
@�=(2�� 1) (3b� d) (2b+ d)2
(4b2 � d2)2M2 � 0 (61)
@W (1; 0; �)
@�=
((2�� 1)M + (1� �)) (3b� d)M(2b� d)2
� 0 (62)
for � 2�12 ; 1�. This guarantees that social welfare increases with � in Regions I, III and IV in which we have
a unique equilibrium. Furthermore, the last expression is su¢ cient to guarantee that there is at least oneequilibrium in Region II in which social welfare increases with �. This happens when the large �rm is theinnovator and the small �rm the imitator. In the opposite case, in which the small �rm is the innovator andthe large �rm the imitator we get
@W (0; 1; �)
@�=((2�� 1)M � (1� �))
(2b� d)2(3b� d)M: (63)
Then, social welfare does not necessarily increase with �.
5.5 Proof of Proposition 5
To prove statement (i), from the de�nition of �n by �i(1; :::; 1)��1(0; 1; :::; 1; �n) = 0 we get:
�n =�(2b� d) (a� c) + (n� 1) d
(2b� 2d+ dn) +(2b� d) (2b+ d (n� 1))
(2b� 2d+ dn)
s�a� c+ 2b� d+ dn
�2� Kb
=�(2b� d) (a� c+ ) (2b� 2d+ dn) + 1 +
�(2b� d)
+(2b� d) d
(2b� 2d+ dn)
�s�a� c+ 2b� d+ dn
�2� Kb
(64)
21
From di¤erentiation we get:
@�n@n
=d (2b� d) (a� c+ ) (2b� 2d+ dn)2
� d
(2b� d) d (2b� 2d+ dn)2
!s�a� c+ 2b� d+ dn
�2� Kb
�d�(2b� d)
+(2b� d) d
(2b� 2d+ dn)
� �a� c+ 2b� d+ dn
�2� Kb
!� 12 �
a� c+ 2b� d+ dn
�2(2b� d+ dn)�1
< 0 (65)
i¤K
b+(2b� 3d+ dn) (a� c+ )2
(2b� d+ dn) d2 > 0 (66)
which always holds.To prove statement (ii), from the de�nition of �n by �1(1; 0; ::; 0; �n)��i(0; 0; ::; 0) = 0 we get:
�n = 1 +(2b� d) (a� c+ )
(n� 1) d � (2b� d) (2b+ d (n� 1))(n� 1) d
s�a� c
2b� d+ dn
�2+K
b(67)
From di¤erentiation we get:
@�n@n
= � (2b� d) (a� c+ )(n� 1)2 d
+2 (2b� d) b(n� 1)2 d
s�a� c
2b� d+ dn
�2+K
b
+d(2b� d) (2b+ d (n� 1))
(n� 1) d
�a� c
2b� d+ dn
�2+K
b
!� 12 �
a� c2b� d+ dn
�2(2b� d+ dn)�1
< 0 (68)
i¤
� (a� c+ ) + 2b
s�a� c
2b� d+ dn
�2+K
b+ (n� 1) d
�a� c
2b� d+ dn
�2+K
b
!� 12 �
a� c2b� d+ dn
�2< 0 (69)
which is an increasing function in K. Therefore, a su¢ cient condition is that this holds for K:
K = b
�a� c+ 2b� d+ dn
�2� b
�(2b� d) (a� c)� d (2b� d) (2b+ d (n� 1))
�2(70)
de�ned by �j(1; 1; :::; 1) = �j(1; 0; :::; 0; � = 0) , j 6= 1. This yields:
� (a� c+ ) + 2b
s�a� c
2b� d+ dn
�2+
�a� c+ 2b� d+ dn
�2��
(2b� d) (a� c)� d (2b� d) (2b+ d (n� 1))
�2
+(n� 1) d �
a� c2b� d+ dn
�2+
�a� c+ 2b� d+ dn
�2��
(2b� d) (a� c)� d (2b� d) (2b+ d (n� 1))
�2!� 12 �
a� c2b� d+ dn
�2< � (2 (a� c) + ) (n� 1) d
(a� c+ ) (2b� d+ dn) < 0 (71)
22
References
[1] Aghion, P., Howitt, P. (1992). "A Model of Growth through Creative Destruction", Econometrica, 60(2),pp.323-51.
[2] Aghion, P., Harris, C., Howitt, P., Vickers, J. (2001). �Competition, Imitation, and Growth with Step-by-Step Innovation�, Review of Economic Studies, 68, pp.467-492.
[3] Aghion, P., Bloom, N., Blundell, R., Gri¢ th, R., Howitt, P. (2005). "Competition and innovation: aninverted-U relationship", Quarterly Journal of Economics, 120, pp.701�728.
[4] Almus, Matthias & Czarnitzki, Dirk (2003). "The E¤ects of Public R&D Subsidies on Firms�InnovationActivities: The Case of Eastern Germany," Journal of Business & Economic Statistics, 21(2), pp. 226-36.
[5] Amir, R., Wooders, J. (2000). "One-Way Spillovers, Endogenous Innovator/Imitator Roles, and ResearchJoint Ventures", Games and Economic Behaviour, 31, pp.1-25.
[6] Arora, A., Gambardella A. (1994). "The Changing Technology of Technological Change: General andAbstract Knowledge and the Division of Innovative Labour", Research Policy, 32, pp. 523-532.
[7] Arrow, K. (1962). "Economic welfare and the allocation of resources for invention", In: Nelson, R. (Ed.),The Rate and Direction of Inventive Activity: Economic and Social Factors. Princeton University Press,Princeton, NJ.
[8] Bessen, J., Maskin, E. (2009). "Sequential Innovation, Patents, and Imitation", RAND Journal of Eco-nomics, 40, pp.611-635.
[9] Bloom, N., Schankerman, M., Van Reenen, J. (2007). "Identifying Technology Spillovers and ProductMarket Rivalry," NBER Working Papers 13060, National Bureau of Economic Research, Inc.
[10] Blundell, R., Gri¢ th, R., Van Reenen, J. (1999). "Market Share, Market Value and Innovation in a Panelof British Manufacturing Firms", Review of Economic Studies, 66, pp.529�554.
[11] Boone, J. (2000). "Competitive pressure: the e¤ects on investments in product and process innovation",RAND Journal of Economics, 31 (3), pp.549�569.
[12] Boone, J. (2001). "Intensity of competition and the incentive to innovate", International Journal of Indus-trial Organization, 19, pp.705�726.
[13] Bower, J. L., Christensen, C.M. (1995). "Disruptive technologies: catching the wave", Harvard BusinessReview, pp. 43-53.
[14] Braguinsky, S., Gabdrakhmanov, S., Ohyama, A. (2007). "A theory of competitive industry dynamics withinnovation and imitation", Review of Economic Dynamics, 10(4), pp.729-760.
[15] Caballero, R., Pindyck, R. (1996). "Uncertainty, Investment, and Industry Evolution," International Eco-nomic Review, 37(3), pp.641-62.
[16] Cabral, L., Polak, B. (2004). "Does Microsoft Sti�e Innovation? Dominant Firms, Imitation and R&DIncentives," CEPR Discussion Papers 4577.
23
[17] Che, J., Qiu, L., Zhou, W. (2009). "Intellectual property rights enforcement in imperfect markets", Levine�sWorking Paper Archive, David K. Levine.
[18] Ce�s, E. (2003). "Is there persistence in innovative activities?," International Journal of Industrial Orga-nization, 21(4), pp.489-515.
[19] Ce�s, E., Orsenigo, L. (2001). "The persistence of innovative activities. A cross-countries and cross-sectorscomparative analysis", Research Policy, 30, pp.1139-1158.
[20] Crepon, B., Duguet, E., Mairesse, J. (1998). "Research, Innovation, and Productivity: An EconometricAnalysis at the Firm Level," NBER Working Papers 6696, National Bureau of Economic Research.
[21] Czarnitzki, D., Etro, F., Kraft, K. (2008). "The E¤ect of Entry on R&D Investment of Leaders: Theoryand Empirical Evidence", ZEW Discussion Paper No. 08-078, Mannheim.
[22] Czarnitzki, D., Kraft, K. (2007). "Spillovers of Innovation Activities and Their Pro�tability", ZEW Dis-cussion Papers 07-073, ZEW - Center for European Economic Research.
[23] Czarnitzki, D., Toole, A. (2008). "The R&D Investment-Uncertainty Relationship: Do Competition andFirm Size Matter?", ZEW Discussion Paper No. 08-013, ZEW - Center for European Economic Research.
[24] Dasgupta , P., Stiglitz, J. (1980). "Industrial Structure and the Nature of Innovative Activity", EconomicJournal, 90, pp.226-293.
[25] De Bondt, R., Slaets, P., Cassiman, B. (1992). "The degree of spillovers and the number of rivals formaximum e¤ective R &D", International Journal of Industrial Organization, 10(1), pp.35-54.
[26] Duguet, E., Monjon, S. (2004). "Is innovation persistent at the �rm Level? An econometric examinationcomparing the propensity score and regression methods", Cahiers de la Maison des Sciences Economiquesv04075, Université Panthéon-Sorbonne (Paris 1).
[27] Fershtman, C., Markovich, S. (2010). "Patents, imitation and licensing in an asymmetric dynamic R&Drace", International Journal of Industrial Organization, 28, pp.113-126.
[28] Futia, C., (1980). �Schumpeterian Competition�, Quarterly Journal of Economics, 94 (4), pp. 675�695.
[29] Gans, J., Hsu, D.H., Stern, S. (2008). "The Impact of Uncertain Intellectual Property Rights on the Marketfor Ideas: Evidence for Patent Grant Delays", Management Science, 54 (5), pp.982-997.
[30] Gans, J., Stern, S. (2003). "The product Market and the Market for Ideas: Commercialization Strategiesfor Technology Entrepreneurs", Research Policy, 32, pp.333-350.
[31] Gallini, N.T., Scotchmer, S. (2002). "Intellectual property: When is it the best incentive system?", in:Ja¤e, A., Lerner, J., Stern, S. (Eds.), Innovation Policy and the Economy, vol.2 MIT Press, Cambridge,MA.
[32] Geroski P. (1990). "Innovation, Technological Opportunity, and Market Structure", Oxford Economic Pa-pers, 42 (3), pp.586-602.
[33] Gilbert, R., Newbery, D. (1982). "Preemptive patenting and the persistence of monopoly", AmericanEconomic Review, 72, pp.514-526.
24
[34] Grossman, G., Helpman, E. (1991a). "Endogenous Product Cycles", The Economic Journal, 101, pp.1214-1229.
[35] Halmenschlager, C. (2006). "Spillovers And Absorptive Capacity In A Patent Race," Manchester School,University of Manchester, 74 (1), pp. 85-102, 01.
[36] Helpman, E. (1993). "Innovation, Imitation, and Intellectual Property Rights," Econometrica, 61(6),pp.1247-80.
[37] Henderson, R., Cockburn, I. (1996). "Scale, Scope, and Spillovers: Determinants of Research Productivityin the Pharmaceutical Industry", RAND Journal of Economics, 27(1), pp.32-59.
[38] Loof H., Heshmati, A. (2002). "Knowledge capital and performance heterogeneity: A �rm-level innovationstudy", International Journal of Production Economics, 76, pp.61-85.
[39] López Mielgo, N., Montes Peón, J. M., Vázquez Ordás, C., Prieto Rodríguez, J. (2004). �Innovación ycompetitividad: Implicaciones para la gestión de la innovación�, Revista MadrI+D, 24, pp. 33-46.
[40] Malerba, F., Orsenigo, L., Peretto, P. (1997). "Persistence of innovative activities, sectoral patterns ofinnovation and international technological specialization", International Journal of Industrial Organization,15, pp.801-826.
[41] Patel, P., Pavitt, K. (1992). "The Innovative Performance of the World�s Largest Firms: Some New Evi-dence", Economics of Innovation and New Technology, 2, pp. 91-102.
[42] Peters, B. (2009). "Persistence of innovation: stylised facts and panel data evidence," The Journal ofTechnology Transfer, 34 (2), pp. 226-243.
[43] Reinganum, J. (1983). "Uncertain innovation and the persistence of monopoly", American Economic Review73 (4), pp.741�748.
[44] Robinson, W.T., Min, S. (2002). "Is the First to Market the First to Fail? Empirical Evidence for IndustrialGoods Bussinesses", Journal of Marketing Research, 39, pp.120-128.
[45] Segestrom, P. (1991). "Innovation, Imitation, and Economic Growth," Journal of Political Economy, 99(4),pp. 807-27.
[46] Shankar, V., Carpenter, G.S., Krishnamurthi, L. (1998). "Late Mover Advantage: How Innovative LateEntrants Outsell Pioneers", Journal of Marketing Research, 35, pp.54-70.
[47] Schmidt, T. (2005). "Absorptive Capacity - One Size Fits All? A Firm-level Analysis of Absorptive Ca-pacity for Di¤erent Kinds of Knowledge", ZEW Discussion Paper No. 05-72, Zentrum für EuropäischeWirtschaftsforschung / Center for European Economic Research.
[48] Schmidt, T. (2006). "An Empirical Analysis of the E¤ects of Patents and Secrecy on Knowledge Spillovers",ZEW Discussion Papers 06-48, Zentrum für Europäische Wirtschaftsforschung / Center for European Eco-nomic Research.
[49] Schumpeter, J. (1934). �The theory of economic development: An inquiry into pro�ts, capital, credit,interest and the business cycle�(transl. Theorie der wirtschaftlichen Entwicklung, 1911).
25
[50] Schumpeter, J. (1942). Capitalism, Socialism, and Democracy. Allen & Unwin, London.
[51] Shefer, D., Frenkel, A. (2005). "R&D, �rm size and innovation: an empirical analysis", Technovation, 25,pp.25-32.
[52] Tishler, A., Milstein, I. (2009). "R&D wars and the e¤ects of innovation on the success and survivabilityof �rms in oligopoly markets", International Journal of Industrial Organization, 27, pp.519-531.
[53] Veugelers, R., Cassiman, B. (2005). "R&D cooperation between �rms and universities. Some empiricalevidence from Belgian manufacturing," International Journal of Industrial Organization, 23(5-6), pp.355-379.
[54] Vinding, A. (2006). "Absorptive capacity and innovative performance: A human capital approach", Eco-nomics of Innovation and New Technology, 15(4-5), pp.507-517.
[55] Zhou, K. Z. (2006). "Innovation, imitation, and new product performance: The case of China", IndustrialMarketing Management, 35, pp.394-402.
[56] Zhou, W. (2009). "Innovation, Imitation and Competition", The B.E. Journal of Economic Analysis andPolicy, 9(1), article 27.
26
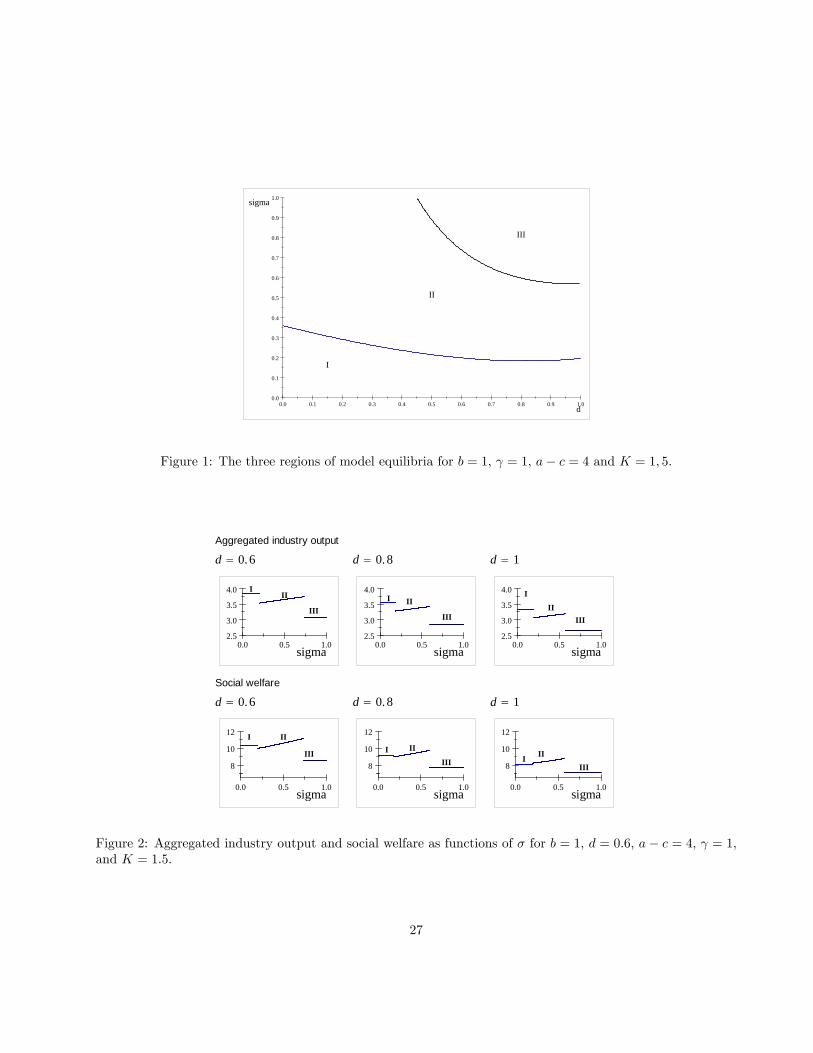
0.0 0.1 0.2 0.3 0.4 0.5 0.6 0.7 0.8 0.9 1.00.0
0.1
0.2
0.3
0.4
0.5
0.6
0.7
0.8
0.9
1.0
d
sigma
I
II
III
Figure 1: The three regions of model equilibria for b = 1, = 1, a� c = 4 and K = 1; 5.
Aggregated industry output
d = 0.6 d = 0.8 d = 1
0.0 0.5 1.02.5
3.0
3.5
4.0
sigma
III
III
0.0 0.5 1.02.5
3.0
3.5
4.0
sigma
I II
III
0.0 0.5 1.02.5
3.0
3.5
4.0
sigma
I
IIIII
Social welfare
d = 0.6 d = 0.8 d = 1
0.0 0.5 1.0
8
10
12
sigma
I II
III
0.0 0.5 1.0
8
10
12
sigma
I II
III
0.0 0.5 1.0
8
10
12
sigma
I IIIII
Figure 2: Aggregated industry output and social welfare as functions of � for b = 1; d = 0:6; a� c = 4; = 1,and K = 1:5.
27
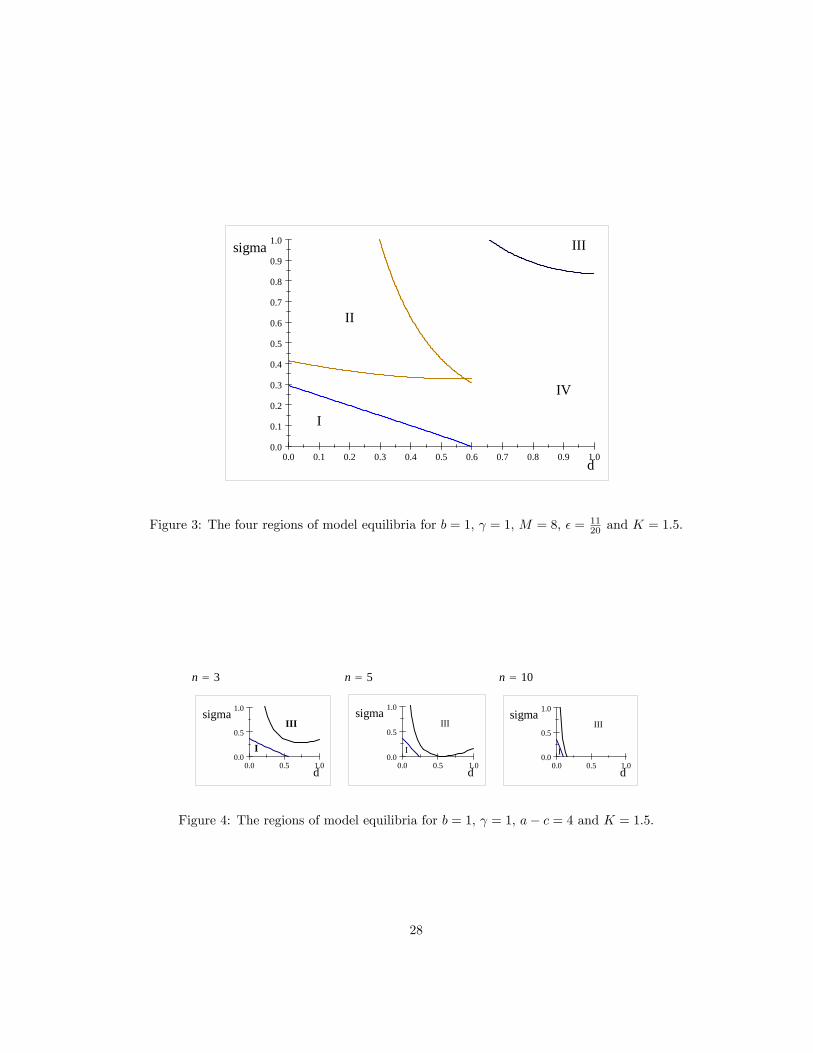
0.0 0.1 0.2 0.3 0.4 0.5 0.6 0.7 0.8 0.9 1.00.0
0.1
0.2
0.3
0.4
0.5
0.6
0.7
0.8
0.9
1.0
d
sigma
I
II
IV
III
Figure 3: The four regions of model equilibria for b = 1, = 1, M = 8, � = 1120 and K = 1:5.
n = 3 n = 5 n = 10
0.0 0.5 1.00.0
0.5
1.0
d
sigma
I
III
0.0 0.5 1.00.0
0.5
1.0
d
sigma
I
III
0.0 0.5 1.00.0
0.5
1.0
d
sigma
I
III
Figure 4: The regions of model equilibria for b = 1, = 1, a� c = 4 and K = 1:5.
28
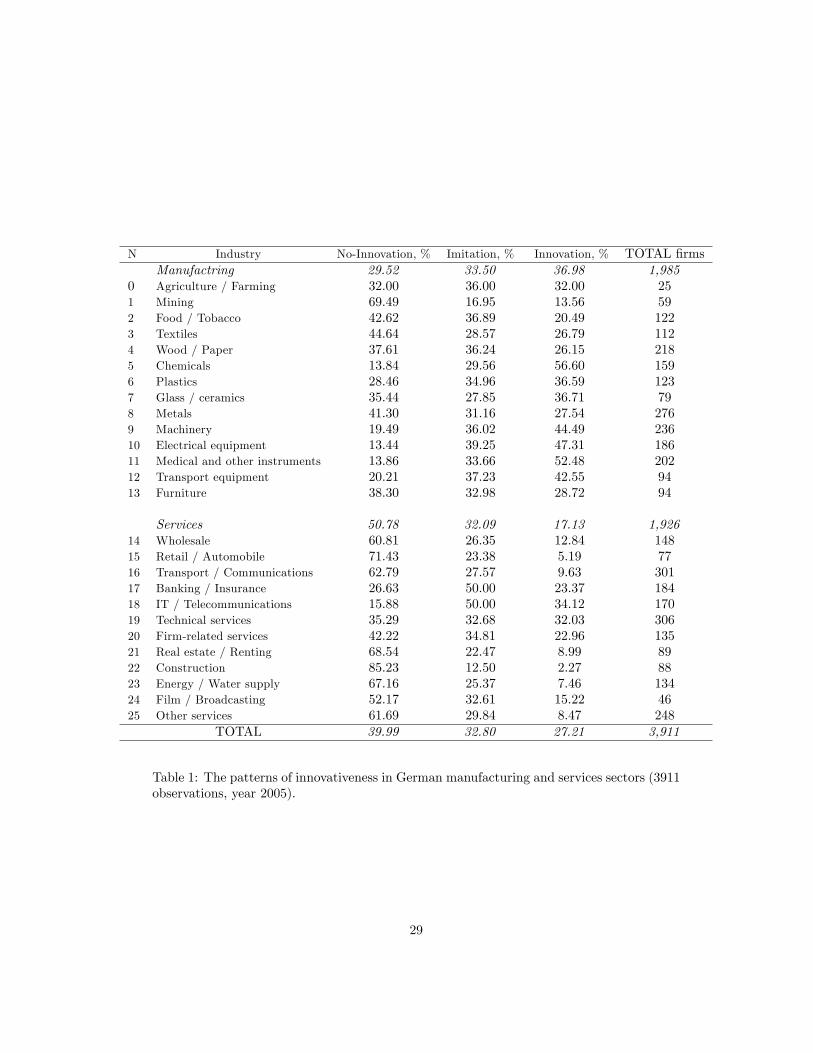
N Industry No-Innovation, % Imitation, % Innovation, % TOTAL �rmsManufactring 29.52 33.50 36.98 1,985
0 Agriculture / Farming 32:00 36:00 32:00 251 Mining 69:49 16:95 13:56 592 Food / Tobacco 42:62 36:89 20:49 1223 Textiles 44:64 28:57 26:79 1124 Wood / Paper 37:61 36:24 26:15 2185 Chemicals 13:84 29:56 56:60 1596 Plastics 28:46 34:96 36:59 1237 Glass / ceramics 35:44 27:85 36:71 798 Metals 41:30 31:16 27:54 2769 Machinery 19:49 36:02 44:49 23610 Electrical equipment 13:44 39:25 47:31 18611 Medical and other instruments 13:86 33:66 52:48 20212 Transport equipment 20:21 37:23 42:55 9413 Furniture 38:30 32:98 28:72 94
Services 50.78 32.09 17.13 1,92614 Wholesale 60:81 26:35 12:84 14815 Retail / Automobile 71:43 23:38 5:19 7716 Transport / Communications 62:79 27:57 9:63 30117 Banking / Insurance 26:63 50:00 23:37 18418 IT / Telecommunications 15:88 50:00 34:12 17019 Technical services 35:29 32:68 32:03 30620 Firm-related services 42:22 34:81 22:96 13521 Real estate / Renting 68:54 22:47 8:99 8922 Construction 85:23 12:50 2:27 8823 Energy / Water supply 67:16 25:37 7:46 13424 Film / Broadcasting 52:17 32:61 15:22 4625 Other services 61:69 29:84 8:47 248
TOTAL 39.99 32.80 27.21 3,911
Table 1: The patterns of innovativeness in German manufacturing and services sectors (3911observations, year 2005).
29
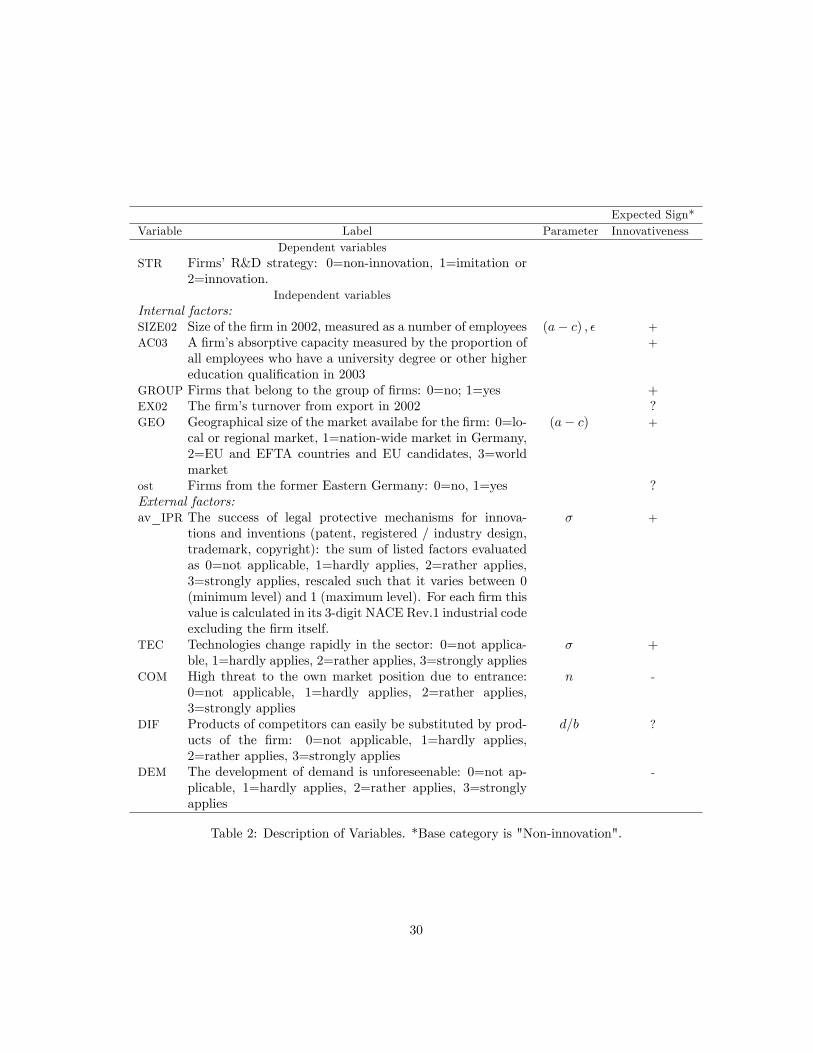
Expected Sign*Variable Label Parameter Innovativeness
Dependent variablesSTR Firms�R&D strategy: 0=non-innovation, 1=imitation or
2=innovation.Independent variables
Internal factors:SIZE02 Size of the �rm in 2002, measured as a number of employees (a� c) ; � +AC03 A �rm�s absorptive capacity measured by the proportion of
all employees who have a university degree or other highereducation quali�cation in 2003
+
GROUP Firms that belong to the group of �rms: 0=no; 1=yes +EX02 The �rm�s turnover from export in 2002 ?GEO Geographical size of the market availabe for the �rm: 0=lo-
cal or regional market, 1=nation-wide market in Germany,2=EU and EFTA countries and EU candidates, 3=worldmarket
(a� c) +
ost Firms from the former Eastern Germany: 0=no, 1=yes ?External factors:av_IPR The success of legal protective mechanisms for innova-
tions and inventions (patent, registered / industry design,trademark, copyright): the sum of listed factors evaluatedas 0=not applicable, 1=hardly applies, 2=rather applies,3=strongly applies, rescaled such that it varies between 0(minimum level) and 1 (maximum level). For each �rm thisvalue is calculated in its 3-digit NACE Rev.1 industrial codeexcluding the �rm itself.
� +
TEC Technologies change rapidly in the sector: 0=not applica-ble, 1=hardly applies, 2=rather applies, 3=strongly applies
� +
COM High threat to the own market position due to entrance:0=not applicable, 1=hardly applies, 2=rather applies,3=strongly applies
n -
DIF Products of competitors can easily be substituted by prod-ucts of the �rm: 0=not applicable, 1=hardly applies,2=rather applies, 3=strongly applies
d=b ?
DEM The development of demand is unforeseenable: 0=not ap-plicable, 1=hardly applies, 2=rather applies, 3=stronglyapplies
-
Table 2: Description of Variables. *Base category is "Non-innovation".
30
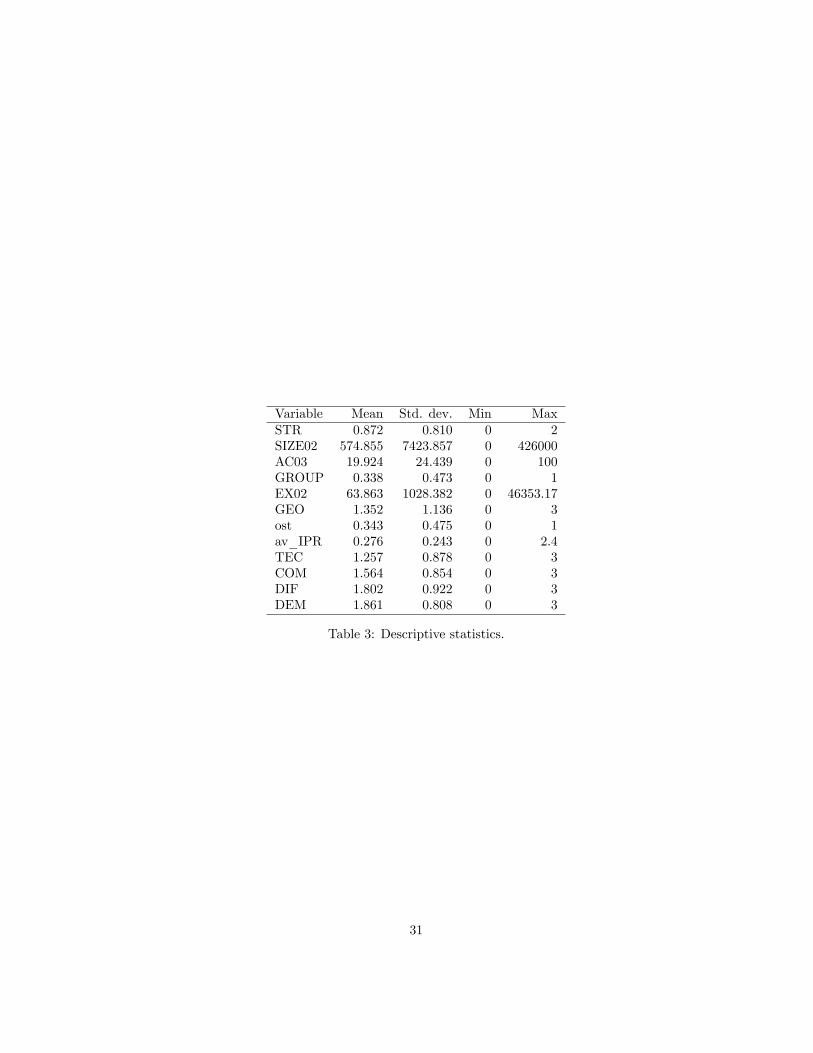
Variable Mean Std. dev. Min MaxSTR 0:872 0:810 0 2SIZE02 574:855 7423:857 0 426000AC03 19:924 24:439 0 100GROUP 0:338 0:473 0 1EX02 63:863 1028:382 0 46353:17GEO 1:352 1:136 0 3ost 0:343 0:475 0 1av_IPR 0:276 0:243 0 2:4TEC 1:257 0:878 0 3COM 1:564 0:854 0 3DIF 1:802 0:922 0 3DEM 1:861 0:808 0 3
Table 3: Descriptive statistics.
31
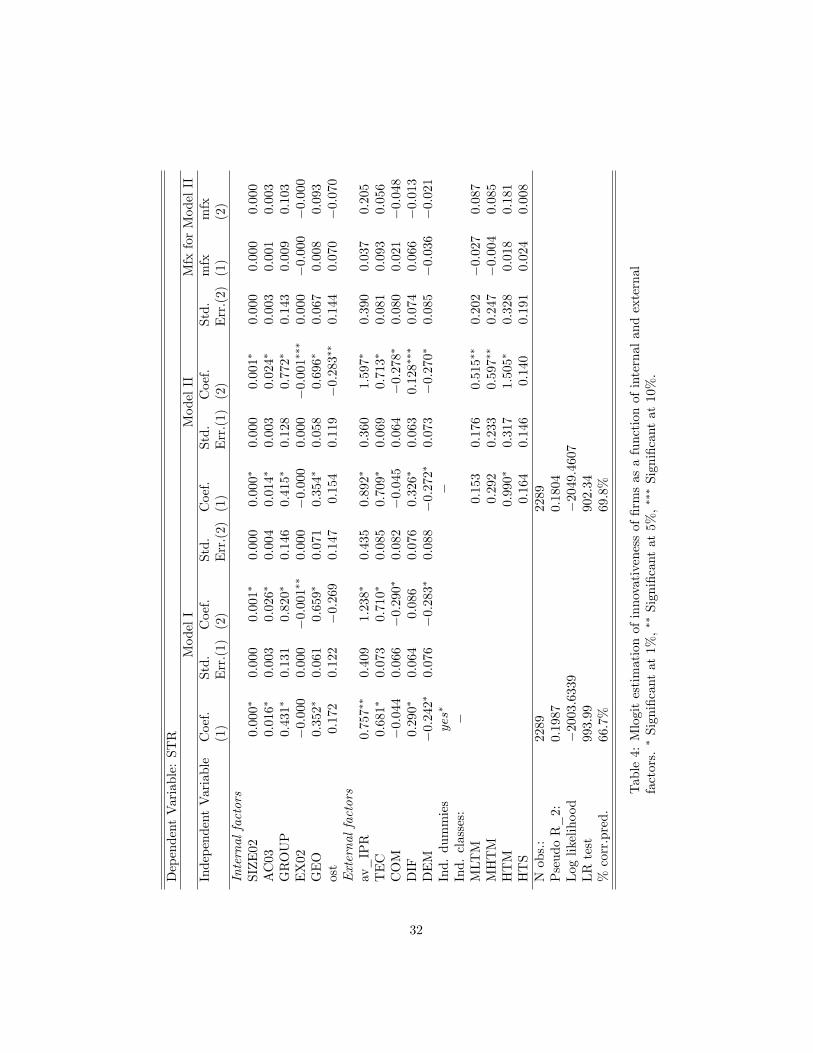
DependentVariable:STR
ModelI
ModelII
MfxforModelII
IndependentVariable
Coef.
(1)
Std.
Err.(1)
Coef.
(2)
Std.
Err.(2)
Coef.
(1)
Std.
Err.(1)
Coef.
(2)
Std.
Err.(2)
mfx
(1)
mfx
(2)
Internalfactors
SIZE02
0:000�
0:000
0:001�
0:000
0:000�
0:000
0:001�
0:000
0:000
0:000
AC03
0:016�
0:003
0:026�
0:004
0:014�
0:003
0:024�
0:003
0:001
0:003
GROUP
0:431�
0:131
0:820�
0:146
0:415�
0:128
0:772�
0:143
0:009
0:103
EX02
�0:000
0:000
�0:001��
0:000
�0:000
0:000
�0:001���
0:000
�0:000
�0:000
GEO
0:352�
0:061
0:659�
0:071
0:354�
0:058
0:696�
0:067
0:008
0:093
ost
0:172
0:122
�0:269
0:147
0:154
0:119
�0:283��
0:144
0:070
�0:070
Externalfactors
av_IPR
0:757��
0:409
1:238�
0:435
0:892�
0:360
1:597�
0:390
0:037
0:205
TEC
0:681�
0:073
0:710�
0:085
0:709�
0:069
0:713�
0:081
0:093
0:056
COM
�0:044
0:066
�0:290�
0:082
�0:045
0:064
�0:278�
0:080
0:021
�0:048
DIF
0:290�
0:064
0:086
0:076
0:326�
0:063
0:128���
0:074
0:066
�0:013
DEM
�0:242�
0:076
�0:283�
0:088
�0:272�
0:073
�0:270�
0:085
�0:036
�0:021
Ind.dummies
yes�
�Ind.classes:
�MLTM
0:153
0:176
0:515��
0:202
�0:027
0:087
MHTM
0:292
0:233
0:597��
0:247
�0:004
0:085
HTM
0:990�
0:317
1:505�
0:328
0:018
0:181
HTS
0:164
0:146
0:140
0:191
0:024
0:008
Nobs.:
2289
2289
PseudoR_2:
0:1987
0:1804
Loglikelihood
�2003:6339
�2049:4607
LRtest
993:99
902:34
%corr.pred.
66:7%
69:8%
Table4:Mlogitestimationofinnovativenessof�rmsasafunctionofinternalandexternal
factors.
�Signi�cantat1%,��Signi�cantat5%,���Signi�cantat10%.
32
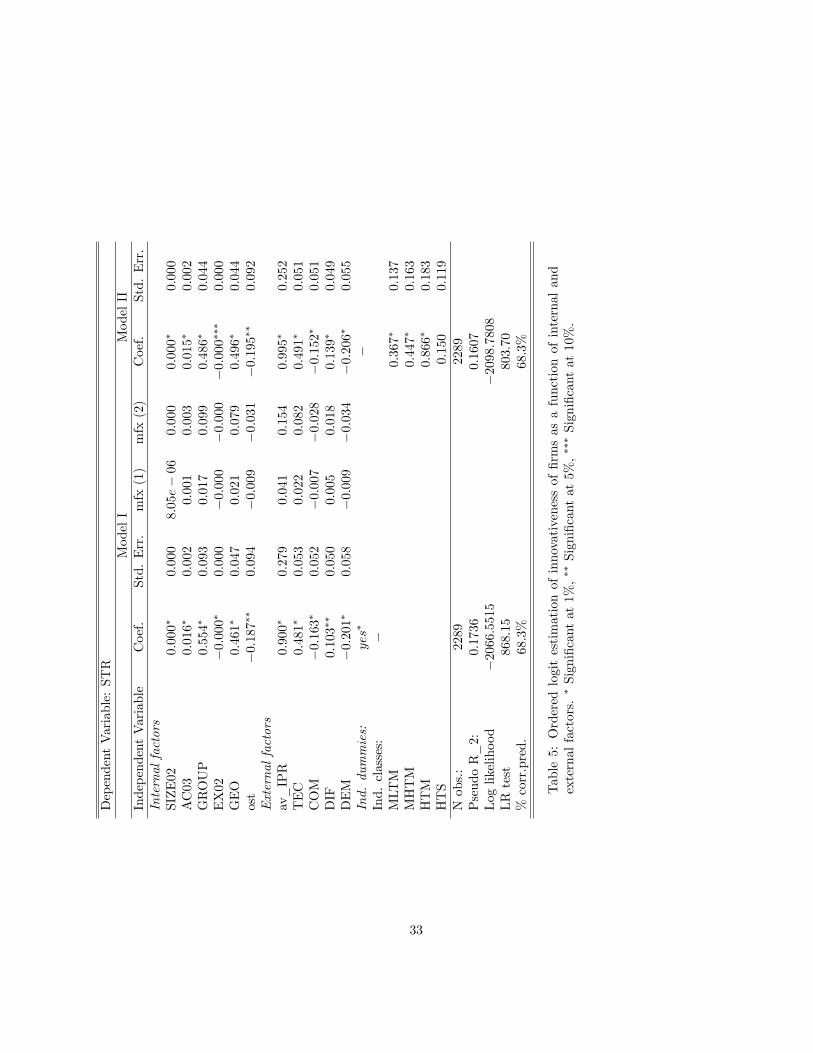
DependentVariable:STR
ModelI
ModelII
IndependentVariable
Coef.
Std.Err.
mfx(1)
mfx(2)
Coef.
Std.Err.
Internalfactors
SIZE02
0:000�
0:000
8:05e�06
0:000
0:000�
0:000
AC03
0:016�
0:002
0:001
0:003
0:015�
0:002
GROUP
0:554�
0:093
0:017
0:099
0:486�
0:044
EX02
�0:000�
0:000
�0:000
�0:000
�0:000���
0:000
GEO
0:461�
0:047
0:021
0:079
0:496�
0:044
ost
�0:187��
0:094
�0:009
�0:031
�0:195��
0:092
Externalfactors
av_IPR
0:900�
0:279
0:041
0:154
0:995�
0:252
TEC
0:481�
0:053
0:022
0:082
0:491�
0:051
COM
�0:163�
0:052
�0:007
�0:028
�0:152�
0:051
DIF
0:103��
0:050
0:005
0:018
0:139�
0:049
DEM
�0:201�
0:058
�0:009
�0:034
�0:206�
0:055
Ind.dummies:
yes�
�Ind.classes:
�MLTM
0:367�
0:137
MHTM
0:447�
0:163
HTM
0:866�
0:183
HTS
0:150
0:119
Nobs.:
2289
2289
PseudoR_2:
0:1736
0:1607
Loglikelihood
�2066:5515
�2098:7808
LRtest
868:15
803:70
%corr.pred.
68:3%
68:3%
Table5:Orderedlogitestimationofinnovativenessof�rmsasafunctionofinternaland
externalfactors.
�Signi�cantat1%,��Signi�cantat5%,���Signi�cantat10%.
33
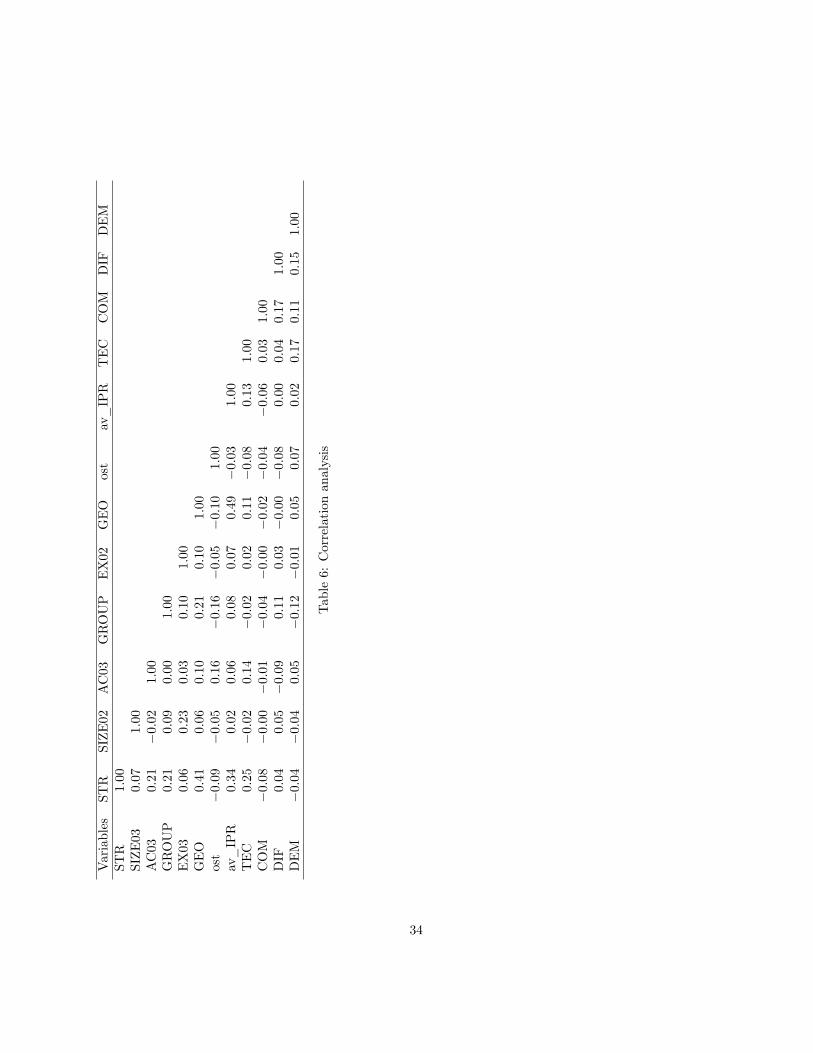
Variables
STR
SIZE02
AC03
GROUP
EX02
GEO
ost
av_IPR
TEC
COM
DIF
DEM
STR
1:00
SIZE03
0:07
1:00
AC03
0:21
�0:02
1:00
GROUP
0:21
0:09
0:00
1:00
EX03
0:06
0:23
0:03
0:10
1:00
GEO
0:41
0:06
0:10
0:21
0:10
1:00
ost
�0:09
�0:05
0:16
�0:16
�0:05
�0:10
1:00
av_IPR
0:34
0:02
0:06
0:08
0:07
0:49
�0:03
1:00
TEC
0:25
�0:02
0:14
�0:02
0:02
0:11
�0:08
0:13
1:00
COM
�0:08
�0:00
�0:01
�0:04
�0:00
�0:02
�0:04
�0:06
0:03
1:00
DIF
0:04
0:05
�0:09
0:11
0:03
�0:00
�0:08
0:00
0:04
0:17
1:00
DEM
�0:04
�0:04
0:05
�0:12
�0:01
0:05
0:07
0:02
0:17
0:11
0:15
1:00
Table6:Correlationanalysis
34
Copyright © 2022 FDOKUMEN