Injury Severity Analysis of Accidents Involving Young Motorcycle Riders in Malaysia
14
Proceedings of the Eastern Asia Society for Transportation Studies, Vol.8, 2011 1 Injury Severity Analysis of Accidents Involving Young Motorcycle Riders in Malaysia Mohd Hafzi MD ISA Research Officer Vehicle Safety and Biomechanics Centre Malaysian Institute of Road Safety Research 43000 Kajang, Selangor Malaysia Fax: +60387368685 E-mail: [email protected] Zulhaidi MOHD JAWI Research Officer Vehicle Safety and Biomechanics Centre Malaysian Institute of Road Safety Research 43000 Kajang, Selangor Malaysia Fax: +60387368685 E-mail: [email protected] Rohayu SARANI Research Officer Road Engineering and Environment Centre Malaysian Institute of Road Safety Research 43000 Kajang, Selangor Malaysia Fax: +60387342160 E-mail: [email protected] Shaw Voon WONG Director Vehicle Safety and Biomechanics Centre Malaysian Institute of Road Safety Research 43000 Kajang, Selangor Malaysia Fax: +60387368685 E-mail: wongsv@miros.gov.my Abstract: Motorcyclists are the highest contributors to road fatality statistics in Malaysia, particularly young riders. This warrants a study to be carried out to understand the overall accident characteristics and investigate the associated risk factors. Secondary data from police records (POL 27) were utilized using three years of accident records (2006 – 2008). Results shown that the following factors led to a higher probability of being killed or severely injured (KSI) for young motorcycle riders; being a male motorcyclist, riding with a learner probationary license or without a license, riding with an improper helmet or without wearing any, being involved in a crash that happens during the wee hours, being involved in a crash that happens during dawn or dusk or in the dark with and without street lighting, being involved in a crash that happens at built-up or rural areas and being involved in a head-on collision. Key Words: young motorcycle riders, logistic regression, injury severity 1. INTRODUCTION Road transportation mishaps are responsible for the death of more than a million of the world’s population each year and also leave other 50 million surviving victims with injuries and incapacities (WHO, 2009). It is also learned that 90% of the said fatalities occur in low- income and middle-income countries. Figure 1 describes the trend of reported deaths by three road user groups – (1) Vulnerable Road Users (VRUs), (2) motorized four-wheeled vehicle occupants and (3) others – according to WHO region and income level classifications which are Low (LIC), Middle (MIC) and High Income Country (HIC). In overall, reported fatalities involving VRUs is more pronounced in low and middle income countries. One of the factors associated with this finding is that the Southeast Asia region has a considerable number of motorcycle users. For instance, registered motorcycles constitute more than 50% of the total registered vehicles (2007) in Malaysia, Indonesia, Vietnam, Thailand and Philippines, with the highest in Vietnam at 95% (WHO, 2009). This fact can be
Transcript of Injury Severity Analysis of Accidents Involving Young Motorcycle Riders in Malaysia

Proceedings of the Eastern Asia Society for Transportation Studies, Vol.8, 2011
1
Injury Severity Analysis of Accidents Involving Young Motorcycle Riders
in Malaysia
Mohd Hafzi MD ISA Research Officer Vehicle Safety and Biomechanics Centre Malaysian Institute of Road Safety Research 43000 Kajang, Selangor Malaysia Fax: +60387368685 E-mail: [email protected]
Zulhaidi MOHD JAWI Research Officer Vehicle Safety and Biomechanics Centre Malaysian Institute of Road Safety Research 43000 Kajang, Selangor Malaysia Fax: +60387368685 E-mail: [email protected]
Rohayu SARANI Research Officer Road Engineering and Environment Centre Malaysian Institute of Road Safety Research 43000 Kajang, Selangor Malaysia Fax: +60387342160 E-mail: [email protected]
Shaw Voon WONG Director Vehicle Safety and Biomechanics Centre Malaysian Institute of Road Safety Research 43000 Kajang, Selangor Malaysia Fax: +60387368685 E-mail: [email protected]
Abstract: Motorcyclists are the highest contributors to road fatality statistics in Malaysia,
particularly young riders. This warrants a study to be carried out to understand the overall
accident characteristics and investigate the associated risk factors. Secondary data from police
records (POL 27) were utilized using three years of accident records (2006 – 2008). Results
shown that the following factors led to a higher probability of being killed or severely injured
(KSI) for young motorcycle riders; being a male motorcyclist, riding with a learner
probationary license or without a license, riding with an improper helmet or without wearing
any, being involved in a crash that happens during the wee hours, being involved in a crash
that happens during dawn or dusk or in the dark with and without street lighting, being
involved in a crash that happens at built-up or rural areas and being involved in a head-on
collision.
Key Words: young motorcycle riders, logistic regression, injury severity
1. INTRODUCTION
Road transportation mishaps are responsible for the death of more than a million of the
world’s population each year and also leave other 50 million surviving victims with injuries
and incapacities (WHO, 2009). It is also learned that 90% of the said fatalities occur in low-
income and middle-income countries. Figure 1 describes the trend of reported deaths by three
road user groups – (1) Vulnerable Road Users (VRUs), (2) motorized four-wheeled vehicle
occupants and (3) others – according to WHO region and income level classifications which
are Low (LIC), Middle (MIC) and High Income Country (HIC).
In overall, reported fatalities involving VRUs is more pronounced in low and middle income
countries. One of the factors associated with this finding is that the Southeast Asia region has
a considerable number of motorcycle users. For instance, registered motorcycles constitute
more than 50% of the total registered vehicles (2007) in Malaysia, Indonesia, Vietnam,
Thailand and Philippines, with the highest in Vietnam at 95% (WHO, 2009). This fact can be

Proceedings of the Eastern Asia Society for Transportation Studies, Vol.8, 2011
2
linked to high accident rate of motorcycles and consequently a significant number of related
casualties (e.g. Wedagama et al., 2009; Iamtrakul et al., 2003; Sigua, 2009). Another notable
finding is that, the situation pertaining VRU fatalities in the Southeast Asia region is way
greater in the MIC group as compared to its LIC counterpart due to differences in socio-
economic situation as compared to the situation in middle income countries (more vehicles,
traffic etc.).
Figure 1 Reported deaths by type of road user (%), by WHO region and income group
(Source: WHO, 2009)
In Malaysia, the population of motorcycle represents about half of the total registered vehicles
in the country (RMP, 2009). Its economical features especially in terms of ownership costs as
well as its ease-of-use are apparently the main attractions a motorcycle has to offer. In the
motorized vehicle segment in Malaysia, a motorcycle is in average priced five-folds lower
than the cheapest car in the market (for a new unit). It is certainly not a fuel guzzler, entitled
for nominal road tax, excluded from being tolled in most highways, easy to maneuver and
enables its user to change lanes and save time during traffic congestions, and many other
advantages that make motorcycles a very convenient and attractive mode of transportation.
In contrast, motorcycle casualties have long been a significant concern in the country, whereby
the motorcycle users represent more than half of the total traffic fatalities each year e.g. 4067
out of 6745 fatalities in 2009 alone (RMP, 2009). Furthermore, from the breakdown of
fatalities by type of road user as compiled by the Malaysian Institute of Road Safety Research
(MIROS), motorcycle users recorded an increase of approximately 4% in fatalities in 2009 as
compared to 2008. It also recorded almost 19% increment as compared to the counts in 2002
(Figure 2).
Being classified as Vulnerable Road Users (VRU) together with pedestrians and cyclists,
motorcyclists often suffer more severe injuries than occupants of bigger vehicles due to
minimal protection to their exposed body. The death profile suggests that the injury outcome
for motorcyclist is rather high, and an in-depth study of 186 fatally injured motorcyclists by
Pang et al. in 2000 had revealed that 71.5% of them were pronounced dead at the scene and a
Proceedings of the Eastern Asia Society for Transportation Studies, Vol.8, 2011
3
further 25.3% died within three hours after the accident.
Road User
% change over
2002 % 2008 % 2009 % Previous
year 2002
Pedestrian 650 11.03% 598 9.16% 589 8.73% -1.51 -9.83
Motorcycle 3429 58.21% 3898 59.72% 4067 60.30% 4.34 18.61
Bicycle 261 4.43% 203 3.11% 224 3.32% 10.34 -14.18
Car 1023 17.37% 1335 20.45% 1405 20.83% 5.24 37.34
Van 156 2.65% 96 1.47% 91 1.35% -5.21 -41.67
Bus 45 0.76% 48 0.75% 31 0.46% -35.42 -31.11
Lorry 197 3.34% 195 2.99% 213 3.16% 9.23 8.12
4Wheel 74 1.26% 106 1.62% 78 1.16% -26.42 5.41
Other 56 0.95% 48 0.74% 47 0.70% -2.08 -16.07
Total 5891 100% 6527 100% 6745 100% 3.34 14.50
Figure 2: Fatalities by mode of transport (source: MIROS)
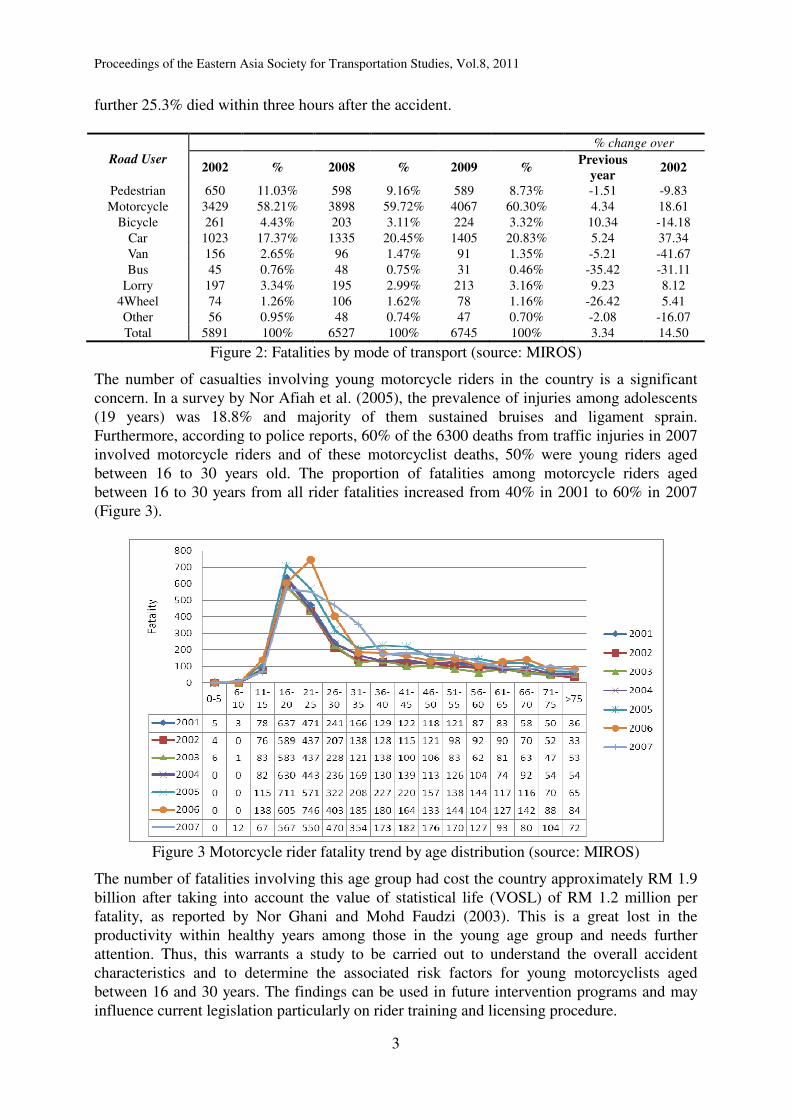
The number of casualties involving young motorcycle riders in the country is a significant
concern. In a survey by Nor Afiah et al. (2005), the prevalence of injuries among adolescents
(19 years) was 18.8% and majority of them sustained bruises and ligament sprain.
Furthermore, according to police reports, 60% of the 6300 deaths from traffic injuries in 2007
involved motorcycle riders and of these motorcyclist deaths, 50% were young riders aged
between 16 to 30 years old. The proportion of fatalities among motorcycle riders aged
between 16 to 30 years from all rider fatalities increased from 40% in 2001 to 60% in 2007
(Figure 3).
Figure 3 Motorcycle rider fatality trend by age distribution (source: MIROS)
The number of fatalities involving this age group had cost the country approximately RM 1.9
billion after taking into account the value of statistical life (VOSL) of RM 1.2 million per
fatality, as reported by Nor Ghani and Mohd Faudzi (2003). This is a great lost in the
productivity within healthy years among those in the young age group and needs further
attention. Thus, this warrants a study to be carried out to understand the overall accident
characteristics and to determine the associated risk factors for young motorcyclists aged
between 16 and 30 years. The findings can be used in future intervention programs and may
influence current legislation particularly on rider training and licensing procedure.

Proceedings of the Eastern Asia Society for Transportation Studies, Vol.8, 2011
4
2. LITERATURE REVIEW
2.1 Previous Studies
It has been highlighted in numerous literatures whereby young motorcyclists face higher risk
of being involved in traffic accidents. In a recent review study on the contribution of age and
experience to young driver crashes (Mccartt et al., 2009), the authors found that young drivers
had higher crash rates than older drivers even after taking account the effects of length of
licensure. Furthermore, it has been well documented that young motorcycle riders are
statistically over-represented in road crash injuries and mortalities in most motorized
countries.
In the US, it has been reported that 346 motorcycle riders aged between 15 to 20 years old
were killed and 8000 were injured in 2008 (NHTSA, 2008). In Australia, it was estimated that
the fatality statistics for riders aged between 17 to 25 years old is 47.0 fatalities per 100
million kilometers ridden in comparison with riders aged between 26 to 39 years (14.5
fatalities per 100 million kilometers ridden) and riders aged 40 years and over (7.7 fatalities
per 100 million kilometers ridden), as reported by the Australian Transport Bureau (ATSB,
2002).
This problem is not only prevalent in the western countries but also in Asian countries. The
number of casualties involving motorcycle riders aged between 16 to 25 years constitutes
about 31% of the overall motorcycle fatalities in Taiwan in 1992 (Lin et al., 2003). In Khon
Kaen, Thailand, riders aged between 16 to 25 years had the tendency to encounter accidents
than other age group of riders (Iamrtrakul et al., 2003). Furthermore, it has been shown that
motorcycle casualty is significantly higher among the younger group in comparison with other
road accident victims in Singapore (Leong et al., 2009). The study also shows that young
motorcycle riders have a higher injury risk than riders who are older.
The high accident risk among young motorcycle riders could be attributed to a number of
factors. Early studies suggest that inexperience may account for the high accident rate among
young motorcycle riders (Mccartt et al., 2009). This lack of riding experience is not the only
explanation for road accidents. According to Pileggi et al. (2006), the major reason for
accidents involving adolescents is their risky and unsafe driving behaviors rather than driving
experience or technical failures. Steg and Brussel (2009) identified that young moped riders
were more likely to speed and had a stronger tendency to travel over the speed limit. Speeding
increases both the risk of being involved in a crash and suffering more severe injuries in the
event of a crash.
Studies on the contribution of risk factors on injury severity among young motorcycle riders
using accident data have been scarcely explored. In a previous study in Sweden (Zambon and
Hasselberg, 2006), accident records of motorcycle riders aged between 16 to 30 years who
sustained at least injuries were extracted from the Swedish National Road Administration
Accident Database. Univariate analysis shows that alcohol consumption, riding in rural areas
and travelling at the speed of over 50 km/h, are all factors positively associated with the
likelihood of being severely injured. Alcohol consumption was the strongest determinant after
taking into consideration of other factors through stepwise logistic regression.

Proceedings of the Eastern Asia Society for Transportation Studies, Vol.8, 2011
5
In another study by Lin et al. (2003), self-administered questionnaires were used to collect
information on crash characteristics. The subjects for the survey were junior students from
two residential areas in Taiwan (Taipei and Hualien) who have been involved in motorcycle
crashes. The results of the study indicate that crashes occurring at rural areas, in the dark,
involving high riding speed, collisions with a moving car or a parked car or a stationary object
increase the severity of injury. This study used logistic regression technique to determine the
risk factors associated with injury severity.
The following subsection summarizes recent literatures and explains in detail the application
of logistic regression analysis used in this paper.
2.2 Logistic Regression
Identifying the underlying cause of road accidents is important. However, determining the
factors associated with the cause of accident is equally imperative. There are many causes of
accidents, and three influential factors are human, vehicle and the environment. However, in
discussing the three, there are specific sub-factors that come under each of these factors. For
example, under the factor of human, several aspects come into question such as which age
group has the highest number of casualties, who are at higher risk, and how their driving
experience affects their capability in vehicle handling and many other unknown factors. The
same goes for the factors of the vehicles and the environment. The need to find out which of
these factors pose the highest risk leads to the use of logistic regression.
Especially in road safety, logistic regression is a handy tool that is essential; to researchers.
There are various variables involved in a traffic collision which illustrates the nature of the
collision and its impact. From the severity of the accident (fatal, serious, slight and damage-
only accident), condition of the victims (killed, seriously injured, slightly injured), location of
the collision (straight road, curved road) or the environmental condition of the location
(weather, lighting condition), the variables recorded are mostly categorical. Due to the nature
of data, normal regression model is almost impossible. Therefore, logistic regression suits
accident data since the dependent variable usually is a categorical data.
Extensive literature search performed showed that logistic regression plays an important role
in analyzing road crashes data; as illustrated in Al-Ghamdi (2002). In his paper, Ali S. Al-
Ghamdi utilised accident data to assess the effects of risk factors to accident severity using
logistic regression. Wong and Sze (2007) make use of logistic regression in evaluating injury
risk of pedestrian casualties using comprehensive historical data in Hong Kong. The objective
is to determine the association between the probability of fatality and severe injury and all its
contributing factors. Among factors being considered is the influence of pedestrian behaviors,
traffic congestion and junction type. Wedagama et al. (2009) also used logistic regression to
determine the influence of accident factors on road fatalities in Bali, Indonesia.
The theoretical background of logistic regression model is explained as follows:
ppjj xxxxxf βββββ ++++++= ........)( 22110 (1)
Whereby xj is the value of the independent variable j, with β1j as the corresponding coefficient,
for j = 1,2,….,p, and p is the number of independent variables.
With this latent variable, the conditional probability of a positive outcome is determined by

Proceedings of the Eastern Asia Society for Transportation Studies, Vol.8, 2011
6
)(
)(
1)(
xf
xf
e
ex
+=Π (2)
The maximum likelihood method is employed to measure the associations by constructing the
likelihood function as follows:
iiii yxyxL −−Π= 1))(1()()( ππβ (3)
Whereby yi denotes the observed outcome of i, with the value of either 0 or 1 only, and i = 1,2
3,. . . , n whereby n is the number of observations. By maximizing the log likelihood
expression as
))}(1ln()1())(ln({)ln()( iiii xyxyLLl ππββ −−+∑== (4)
The best estimate of β could be obtained accordingly. The influence of each level for each
independent variable; on the dependent variable/ outcome could be revealed by the odd ratio
(OR) value whereby .βeOR =
The odds ratio shows the strength of association between a predictor and the response of
interest by comparing the odds of success for one group to another group. An odds ratio that is
greater than 1 indicates that the concerned attribute leads to a higher risk and vice versa.
Based on the analysis of odds ratio, one can then determine which factor has the highest risk
and hence, countermeasure can be proposed to either lower the risk or if possible eliminate it.
3. METHODOLOGY
3.1 Data Source
The source of the road accident data was obtained from the MIROS Road Accident Database
System (M-ROADS) which contains accident data collected by the Royal Malaysian Police
(RMP) Traffic Department. The form used by the police for the data collection is a road
accident form known as POL27. POL27 contains a total of 91 variables which comprise
information on the crash characteristics, the casualties and the vehicles involved.
3.2 Data Selection
Only accident cases which resulted in at least minor injuries to the rider were included.
Damage-only cases were not included due to a high number of such cases going unreported. In
the police accident reporting system, injury severity is divided into three categories; death,
serious injury and minor injury. The type of casualty is defined by the RMP as follows:
i. Death – any person who dies within 30 days of an accident
ii. Serious injury – any person who has injured as a result of an accident as referred to
section 320 of the Penal Code which includes any of the following:
a. Loss of sexual ability;
b. Permanent privation of the sight of either eye;
c. Permanent privation of the hearing of either ear;
d. Privation of any member of joint;
e. Destruction or permanent impairment of the powers of any member of joint;
f. Permanent disfiguration of the head or face;
Proceedings of the Eastern Asia Society for Transportation Studies, Vol.8, 2011
7
g. Fracture or dislocation of a bone;
h. Any hurt which endangers life, or which causes the sufferer to be, during the space
of twenty days, in severe bodily pain, or unable to follow his ordinary pursuits.
iii. Minor injury – any injury that does not fall under death or serious injury.
As there is no valid international definition of ‘young motorcycle rider’, the age from 16 to 30
years, which represented about 60% of all casualties, is chosen for this paper. After applying
the exclusion criteria to the initial data set including the removal of missing and unreliable
data, 7676 accident cases were used for the study.
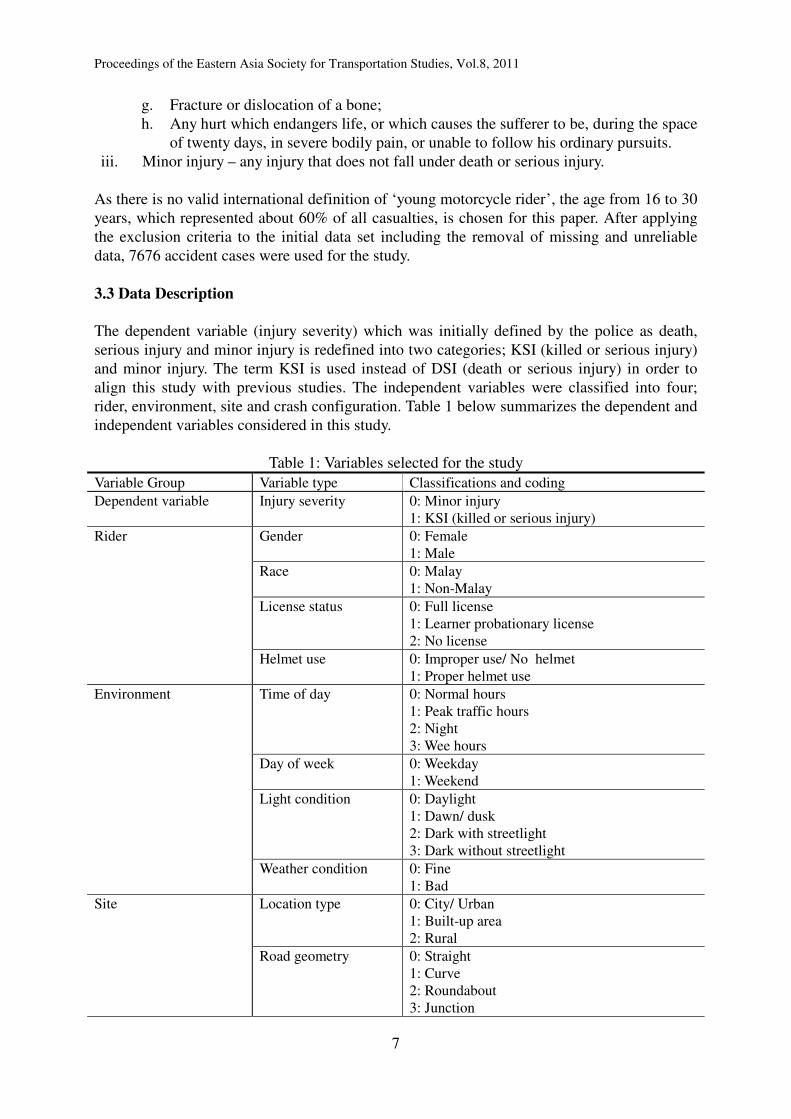
3.3 Data Description
The dependent variable (injury severity) which was initially defined by the police as death,
serious injury and minor injury is redefined into two categories; KSI (killed or serious injury)
and minor injury. The term KSI is used instead of DSI (death or serious injury) in order to
align this study with previous studies. The independent variables were classified into four;
rider, environment, site and crash configuration. Table 1 below summarizes the dependent and
independent variables considered in this study.
Table 1: Variables selected for the study
Variable Group Variable type Classifications and coding
Dependent variable Injury severity 0: Minor injury
1: KSI (killed or serious injury)
Rider Gender 0: Female
1: Male
Race 0: Malay
1: Non-Malay
License status 0: Full license
1: Learner probationary license
2: No license
Helmet use 0: Improper use/ No helmet
1: Proper helmet use
Environment Time of day 0: Normal hours
1: Peak traffic hours
2: Night
3: Wee hours
Day of week 0: Weekday
1: Weekend
Light condition 0: Daylight
1: Dawn/ dusk
2: Dark with streetlight
3: Dark without streetlight
Weather condition 0: Fine
1: Bad
Site Location type 0: City/ Urban
1: Built-up area
2: Rural
Road geometry 0: Straight
1: Curve
2: Roundabout
3: Junction

Proceedings of the Eastern Asia Society for Transportation Studies, Vol.8, 2011
8
Crash configuration Collision type 0: Head-on collision
1: Rear collision
2: Lateral collision
3: Side swipe
4: Hitting objects/ pedestrian/ animal
5: Others
3.4 Data Analysis
Logistic regression analysis was performed in order to deal with the binary nature of the
dependent variables i.e. injury severity. Referring to logistic regression coefficient mentioned
in the literature review earlier (section 2.2), if β is the logistic regression coefficient, then βe is
the odds ratio corresponding to a one unit change in the exponential beta of said variable. In
this study, each level of independent variables has their odds ratio whereby the first level
(coded as 0) is the base of the odds (Table 1). Odds ratio greater than 1 indicates the risk of
getting killed or seriously injured is higher as compared to the base level group and vice versa.
Univariate logistic regression analysis was performed to estimate unadjusted odds ratio (OR)
and 95% confidence interval (CI). Nevertheless, the univariate analysis only gives affects for
each individual variable. Thus, in order to take into consideration the effects of other
variables, a multivariate logistic regression analysis was employed. In short, adjusted odds
ratio estimates the magnitude after controlling for other confounding factors (Hosmer &
Lemeshow, 1989). The statistical analyses were carried out using the SPSS software package
(version 17; SPSS Inc., Chicago, IL, USA).
4. RESULTS
A total record of 7676 motorcycle riders who were involved in traffic accidents was reviewed.
Of this, 3012 (39.2%) of them were either killed or seriously injured and 4664 (60.8%) were
slightly injured. The following subsections explain the independent variables and injury
severity analysis in detail.
4.1 Rider
Table 2 describes the profile of the riders according to their gender, race, license status and
also helmet use. Based on the records, males make up a higher percentage as compared to
females (87.8% male, 12.2% female). According to race classification, Malays as the majority
in the country’s population outnumber the other races by 80%. A majority (71.3%) of the
young riders possess full license (formally known as Competence Driving License – CDL),
and only 3.8% are in the learner probationary license group. However, an alarming figure of
1908 or about 25% of the young motorcycle riders do not possess a license. In overall,
approximately 6.6% of motorcyclists were found to be either wearing a helmet (but
improperly buckled or strapped) or not wearing a helmet at all.
Table 2: Rider characteristics for all casualties
Factor n %
Gender
Female 937 12.2
Male 6739 87.8

Proceedings of the Eastern Asia Society for Transportation Studies, Vol.8, 2011
9
Race
Malay 6168 80.4
Non-Malay 1508 19.6
License status
Full license 5475 71.3
Learner probationary license 293 3.8
No license 1908 24.9
Helmet use
Proper helmet use 7168 93.4
Improper use/ No helmet 508 6.6
4.2 Environment
Table 3 explains the environment profiles pertaining to the accident scene where the young
motorcyclists involved in the studied road accident cases. From a total of 7678 cases, this tally
is evenly distributed in three out of four “Time of Day” classifications; normal hours (25.9%),
peak traffic hours (33.4%) and at night (31.1%). The remaining 736 casualties (9.6%)
occurred during wee hours (between midnight and early morning). In terms of the day of the
week, approximately 70% of the cases occurred on a weekday. Furthermore, only 14.6% of
the cases occurred during adverse weather as most of the studied young motorcycle riders
were involved in accidents in clear weather. For light condition, from both ambient and street
lighting sources, 4856 or 63.3% of the studied samples were involved in accidents in daylight.
In the condition with low ambient light intensity (dawn or dusk) or completely dark (at night),
the situations were rather obvious at night with 28.8%. From the figure, 18.2% occurred with
the presence of streetlight and the remaining 10.6% were without streetlight.
Table 3: Environment factors for all casualties
Factor n %
Time of day
Normal hours 1990 25.9
Peak traffic hours 2562 33.4
Night 2388 31.1
Wee hours 736 9.6
Day of week
Weekday 5328 69.4
Weekend 2348 30.6
Weather
Fine 6555 85.4
Bad 1121 14.6
Light condition
Daylight 4856 63.3
Dawn/ dusk 612 8.0
Dark with streetlight 1395 18.2
Dark without streetlight 813 10.6
4.3 Site
The accident site profiles of the accidents involving the studied samples are further explained
in Table 4. For location type factor, it is further categorized into city or urban setting, built-up
area and rural. It is found out that approximately 62% of the cases occurred in rural areas, as
compared to those that happened in developing areas (20.4%) or developed areas (17.9%).

Proceedings of the Eastern Asia Society for Transportation Studies, Vol.8, 2011
10
Moreover, in term of road geometry, more cases involving young motorcyclists happened on
straight roads and at intersections with the proportion of 54.4% and 34.7%, respectively. The
other road geometry category (curved roads and roundabouts) only account for a total of 825
casualties or 10.7% of all accidents.
Table 4: Site factors for all casualties
Factor n %
Location type
City/ Urban 1375 17.9
Built-up area 1565 20.4
Rural 4736 61.7
Road geometry
Straight 4184 54.5
Curved 792 10.3
Roundabout 33 0.4
Junction 2667 34.7
4.4 Crash configuration
From Table 5, it is learned that 3510 or 45.7% of the casualties resulted from lateral collisions.
The cases in three other arrangements were fairly evenly distributed at 13.0%, 15.4% and
12.9%, respectively in head-on, rear and side swipe collisions. The rest of the cases that were
grouped in “others” account for 8.5% of the total cases.
Table 5: Collision type for all casualties
Factor n %
Collision type
Head-on collision 998 13.0
Rear collision 1179 15.4
Lateral collision 3510 45.7
Side swipe 985 12.8
Hitting objects/pedestrian/animal 355 4.6
Others 649 8.5
4.5 Injury Severity Analysis
Table 6 shows the unadjusted and adjusted ORs (with 95% CI) for each of the eleven
variables considered. For univariate logistic regression, almost all the variables were
significantly associated with the injury severity except for day of week and peak traffic hours.
When controlling for other confounding factors, the adjusted ORs reveal that, males as
compared to females, unlicensed riders together with novice riders (those who hold a learner
probationary license) as compared to those who have a full license are among those who have
a higher risk of being killed or severely injured. Proper helmet use helps immensely since
improper or failure to use helmet doubles the risk of being seriously injured or killed.
On the environment factors, crashes that occur during the wee hours increase the risk of a
young rider being killed or severely injured in comparison with crashes occurring during
normal hours. Light is also a significant factor; whereby analysis showed insufficient light
especially during dusk/ dawn, dark with or without streetlight poses higher risk of KSI
outcome. Compared to city areas, young riders are more prone to face severe injury or be

Proceedings of the Eastern Asia Society for Transportation Studies, Vol.8, 2011
11
killed if a crash happens in a rural or built-up area. Furthermore, the risk of getting killed or
severely injured is much higher if the rider is involved in a head-on collision as compared to
other collision types.
Table 6: Univariate and multivariate logistic regression results with ORs (95% CI)
Factor Unadjusted ORs
(95% CI)
Adjusted ORs
(95% CI)
Gender
Female (reference)
Male 1.422 (1.230, 1.645)* 1.273 (1.093, 1.481)*
Race
Malay (reference)
Non-Malay 0.861 (0.766, 0.968)* 0.885 (0.783, 1.000)
License status
Full license (reference)
Learner probationary license 1.420 (1.121, 1.799)* 1.429 (1.118, 1.826)*
No license 1.470 (1.323, 1.634)* 1.272 (1.137, 1.423)*
Helmet use
Proper helmet use (reference)
Improper use / No helmet 2.989 (2.478, 3.606)* 2.510 (2.062, 3.056)*
Time of day
Normal hours (reference)
Peak traffic hours 0.925 (0.819, 1.045) 0.917 (0.809, 1.040)
Night 1.169 (1.035, 1.321)* 0.914 (0.771, 1.083)
Wee hours 1.561 (1.316, 1.851)* 1.242 (1.009, 1.529)*
Day of week
Weekday (reference)
Weekend 0.991 (0.898, 1.095) 0.948 (0.855, 1.051)
Weather
Fine (reference)
Bad 1.165 (1.024, 1.324)* 1.135 (0.988, 1.304)
Light condition
Daylight (reference)
Dawn/ dusk 1.483 (1.252, 1.756)* 1.244 (1.017, 1.521)*
Dark with streetlight 1.288 (1.141, 1.454)* 1.259 (1.064, 1.489)*
Dark without streetlight 1.466 (1.262, 1.703)* 1.228 (1.009, 1.496)*
Location type
City/ Urban (reference)
Built-up area 1.222 (1.050, 1.424)* 1.172 (1.001, 1.371)*
Rural 1.498 (1.320, 1.700)* 1.283 (1.123, 1.466)*
Road geometry
Straight (reference)
Curved 1.292 (1.109, 1.504)* 1.079 (0.917, 1.269)
Roundabout 0.525 (0.244, 1.133) 0.681 (0.309, 1.500)
Junction 0.690 (0.623, 0.763)* 0.761 (0.680, 0.851)*
Collision type
Head-on collision (reference)
Rear collision 0.483 (0.407, 0.573)* 0.534 (0.447, 0.638)*
Lateral collision 0.408 (0.353, 0.471)* 0.495 (0.426, 0.575)*
Side swipe 0.278 (0.230, 0.335)* 0.310 (0.255, 0.375)*
Hitting object/pedestrian/animal 0.305 (0.235, 0.396)* 0.282 (0.216, 0.370)*
Others 0.830 (0.680, 1.012) 0.800 (0.651, 0.983)*
* Statistically significant at the 0.05 level.

Proceedings of the Eastern Asia Society for Transportation Studies, Vol.8, 2011
12
5. DISCUSSION
Understanding the contributing factors of motorcycle crashes involving young motorcycle
riders is a challenge. The current study was embarked upon to assess what factors play the
most important role in the risk of a young motorcycle rider being severely injured or killed in
a traffic accident. This study applies the logistic regression technique to determine the risk
factors associated with injury outcomes.
In term of license status, the proportion of young illegal riders is still a concern as it
constitutes about 25% of the total number of accidents, as shown in Table 2. Furthermore,
from the multivariate analysis, riding without a valid license increases the odds of being killed
or severely injured in comparison with riding with a full license. The risk is also greater for
riders with a learner probationary license. This highlights the necessity to improve current
licensing system and training program for novice riders.
Our findings also show that without proper helmet use or the failure to use a helmet resulted
in a high risk of being killed or severely injured. It has been widely established that helmets
provide considerable protection and are the major factor in the decrease of severity of injuries
and mortality to motorcycle occupants. In Malaysia, it is mandatory for both riders and
pillion-riders to wear helmets. However, the rate of use is still low, especially in rural areas
(Kulanthayan et al., 2001). Due to the low compliance rate among young motorcyclists in
Greece, school-based helmet promotion programs were developed and tested in high schools,
focusing on second grade students who are eligible to obtain a driving license (Germeni et al.,
2010). This approach highlights the importance of targeting new riders who are in the
transition to driving status (about to obtain a driving license) in promoting helmet use and the
same approach can be explored in Malaysia.
In terms of environmental factors, crashes at rural areas increase the risk of young motorcycle
riders being killed or severely injured. This supports the findings of previous studies (Lin et
al., 2003; Zambon and Hasselberg, 2006). Furthermore, based on the multivariate analysis,
riders who were involved in crashes occurred in the wee hours (between midnight and early
morning) faced a higher risk of being killed or severely injured. This can be partly explained
by the social behavior of young motorcycle riders in Malaysia. The social problem coined by
the locals as ‘Mat Rempit’ refers to young riders who are involved in illegal racing and
performing dangerous stunts, mostly at nights and in the small, which may lead to a greater
risk of being involved in an accident. Besides this, they are also involved in other behaviors
that are frowned upon by the public, e.g. drug use, illicit unprotected sex, fist-fights and many
other negative behaviors (Muhamad Fuad et al., 2009).
Since a substantial proportion of road crashes involving younger motorcyclists cannot be
easily avoided, an increased emphasis on reducing injury severity of a crash is needed. Factors
such as being in rural areas, during night or the wee hours and on roads without streetlight,
indicates the importance of improving road infrastructure e.g. expanding exclusive and non-
exclusive motorcycle lanes into rural areas and providing adequate lighting for roads and
improving enforcement system for reducing injury severity in motorcycle crashes.
The motorcycle lane has been considered the best practice and is highly cost efficient in
reducing motorcycle related accidents (Law and Radin Umar, 2005). However, this lane is
only available on a few roads in the country. Nevertheless, the initiative of gradually
Proceedings of the Eastern Asia Society for Transportation Studies, Vol.8, 2011
13
expanding motorcycle lane to rural areas to separate motorcycle riders from the rest of the
traffic can aid in the reduction of the overall rider injury and mortality statistics in the country.
6. CONCLUSION
The analyses in this study are limited by the variables that are readily available in POL 27.
Thus, there is limited information on more detailed vehicle damage and casualty injury as well
as the cause of injury. To improve the overall analysis, future researches should utilize data
from more in-depth accident investigations. Despite the limitations, these analyses have
provided useful information about motorcycle crashes involving young riders in Malaysia and
the contributing factors that lead to higher injury outcomes. Future interventions should take
into consideration the identified risk factors and focus more on this particular age group as
they represent more than half of the total motorcycle rider casualties in the country.
ACKNOWLEDGEMENT
The authors would like to express their gratitude to those who were involved directly or
indirectly in the course of the study. A special mention to the research assistants and other
research members for their considerable support and commitment.
REFERENCES
Al-Ghamdi, A.S. (2002) Using logistic regression to estimate the influence of accident factors
on accident severity, Accident Analysis and Prevention, Vol. 34, 729-741.
ATSB (2002) Motorcycle rider age and risk of fatal injury. Monograph 12: Motorcycle Safety
2000. Canberra: Australian Transport Safety Bureau.
Germeni, E., Lionis, C., Kalampoki, V., Davou, B., Belechri, M., and Petridou, E. (2010)
Evaluating the impact of a school-based helmet promotion program on eligible adolescent
drivers: different audiences, different needs?, Health Education Research, Vol. 25, No. 5,
865-876.
Hosmer, D.W. & Lemeshow, S., (1989) Applied Logistic Regression, Wiley, New York.
Iamtrakul, P., Tanaboriboon, Y., and Hokao, K., (2003) Analysis of Motorcycle Accidents in
Developing Countries: A Case Study of Khon Kaen, Thailand, Journal of Eastern Asia
Society for Transportation Studies, Vol. 5, 147-162.
Kulanthayan, S., Umar, R.S., Hariza, H.A., and Nasir, M.T. (2001) Modeling of Compliance
of Motorcyclist to Proper Usage of Safety Helmet in Malaysia, Journal of Crash
Prevention and Injury Control, Vol. 2, No. 3, 239-246.
Law, T.H., and Radin Umar, R.S. (2005) Determination of Comfortable Safe Width in an
Exclusive Motorcycle Lane, Journal of Eastern Asia Society for Transportation
Studies, Vol. 6, 3372-3385.
Lin, M.R., Chang, S.H., Huang, W., Hwang, H.F., and Pai L., (2003) Factors Associated with
Severity of Motorcycle Injuries Among Young Adults Riders, Annals of Emergency
Medicine, Vol. 41, No. 6, 783-791.
Leong, Q.M., Tsung Shyen, K.G., Appasamy, V., and Chiu, M.T. (2009) Young Adults and
Riding Position: Factors that Affect Mortality among Inpatient Adult Motorcycle
Casualties: A Major Trauma Center Experience, World J Surg, Vol. 33, No. 4, 870-873.

Proceedings of the Eastern Asia Society for Transportation Studies, Vol.8, 2011
14
Mccart, A. T., Mayheww, D. R., Braitman, K. A., Ferguson, S. A., and Simpson, H. M.
(2009) Effects of Age and Experience on Young Driver Crashes: Review of Recent
Literature, Traffic Injury Prevention, Vol. 10, 209-219.
Menard, S. (2009) Logistic Regression: From Introductory to Advanced Concepts and
Applications. USA: Sage Publications, Inc.
Muhamad Fuad Abdul Karim, Rokiah Ismail, and Mohamad Fauzi Sukimi (2009) Sub-budaya
Mat Rempit dan Perubahan Sosiobudaya, Malaysian Journal of Society and Space, Vol.
3, 26-43 (In Malay).
NHTSA (2008) Traffic Safety Facts 2008. National Highway Traffic Safety Administration,
Washington D.C.
Nor Ghani, M. N., and Mohd Faudzi, M. Y. (2003) Value of Life of Malaysian Motorists:
Estimates from a Nationwide Survey, Journal of Eastern Asia Society for
Transportation Studies, Vol. 5, No. 8, 232-243.
Nur Afiah, M. Z., Hejar, A.R., Kulanthayan, S., and Law, T.H. (2005) Prevalence of
Motorcycle Injuries Among School Students in Selangor, Malaysia, Proceedings of the
Eastern Asia Society for Transportation Studies, Vol. 5, 1857-1866.
Pang, T.Y., Radin Umar, R.S., Azhar, A., Ahmad, M.M., Mohd Nasir, M.T. and Harwant, S.,
(2000) Accident characteristics of injured motorcyclists in Malaysia. Medical Journal of
Malaysia, Vol. 55, 45 – 50.
Pileggi, C., Bianco, A., Nobile, C.G.A., and Angelillo, I.F. (2006) Risky Behaviors among
Motorcycling Adolescents in Italy, The Journal of Pediatrics, Vol. 148, 527–32.
RMP (2009) Statistical Report of Road Accidents Malaysia 2009. Royal Malaysia Police,
Traffic Branch, Bukit Aman, Kuala Lumpur.
Sigua, R.G. (2009) Motorcycle Involvement in Road Crashes in Metro Manila, Journal of
Eastern Asia Society for Transportation Studies, Vol. 7.
Sze N.N and Wong S. C (2007) Diagnostic analysis of the Logistic Model for Pedestrian
Injury Severity in Traffic Crashes, Accident Analysis and Prevention, Vol. 39, 1267-
1278.
Wedagama, D.M.P., and Dissanayake, D. (2009) The Influence of Accident Related Factors
on Road Fatalities Considering Bali Province in Indonesia as a Case Study, Journal of
Eastern Asia Society for Transportation Studies, Vol. 8.
WHO (2009) Global Status Report on Road Safety: Time for Action. World Health
Organization, Geneva.
Zambon, F., and Hasselberg, M. (2006) Factors Affecting the Severity of Injuries Among
Young Motorcyclists – A Swedish Nationwide Cohort Study, Journal Crash Prevention
and Injury Control, Vol. 7, No. 2, 143-149.