Informatique scientifique - ENS Lyon
55
GMT Generalities Cr´ eation de cartes et de figures : GMT 4 Cr´ eation de cartes et de figures : GMT Generalities Sismicity map Histogram Seafloor age Oceanic heat flux Hawaiian ridge M.Ulvrova, L.Pouilloux (ENS LYON) Informatique L3 Automne 2011 123 / 177
-
Upload
khangminh22 -
Category
Documents
-
view
0 -
download
0
Transcript of Informatique scientifique - ENS Lyon
GMT Generalities
Creation de cartes et de figures : GMT
4 Creation de cartes et de figures : GMTGeneralitiesSismicity mapHistogramSeafloor ageOceanic heat fluxHawaiian ridge
M.Ulvrova, L.Pouilloux (ENS LYON) Informatique L3 Automne 2011 123 / 177

GMT Generalities
The Generic Mapping Tools
http://gmt.soest.hawaii.edu/
M.Ulvrova, L.Pouilloux (ENS LYON) Informatique L3 Automne 2011 124 / 177

GMT Generalities
GMT - What is it? Why to use it?
GMT : Generic Mapping Tool
developed by Paul Wessel (UH)and Walter Smith (NOAA) +voluntaries
first version in 1987
open source and platformindependent
data processing and manipulation (base sur UNIX tools awk,grep,sed,etc.)
PostScript visualization
contains more than 60 individual programs
M.Ulvrova, L.Pouilloux (ENS LYON) Informatique L3 Automne 2011 125 / 177

GMT Generalities
GMT users
2005: 10000+ 2011: 15000+
M.Ulvrova, L.Pouilloux (ENS LYON) Informatique L3 Automne 2011 126 / 177

GMT Generalities
Data processing et manipulation
0
2
4
6
0 2 4 6
0 2 4 6
870793
755690 800
800730
728
710780
804
855
830813
762
765 740 765760
790820
855
812 773
812
827 805
840
890
820
873875
873865 841
862 908
855850
882 910
940915
890
880
870
880
960
890
860
830
705
0 2 4 6
0 2 4 6
870793
755
710
697.5
780
800
781
729
760
804
855
830813
783.333
740
788.5
790820
855
820
827 805 835
890
873853
864862.5
915
871
908
960
896
940
890
870
880
890
860
800
850
0
2
4
6
0 2 4 6
750
800
850
900
0 2 4 6
800
850
900
950
1000
0 1 2 3 4 5 6 7 8 9 10
2009 Oct 07 12:21:37 Example 14 in Cookbook
Filtering data
Gridding xyz data
Arbitrary math operations
Cut/paste grids
Data interpolation
Data extrapolation
M.Ulvrova, L.Pouilloux (ENS LYON) Informatique L3 Automne 2011 127 / 177

GMT Generalities
PostScript Plotting
2D: Plots of points, lines etc.
2009 Oct 07 12:21:33 Example 3 in Cookbook
0.00
0.25
0.50
0.75
1.00
Co
he
ren
cy2
100101102103
Wavelength (km)
Coherency2
10-1
100
101
102
103
104
Po
we
r (m
Ga
l2km
)
100101102103
Ship and Satellite Gravity
Input Power
Ship
Satellite
Histograms
2009 Oct 07 12:21:34 Example 6 in Cookbook
SOUTH0.2
EASTWEST
NORTH
0 %
10 %
20 %
30 %
Fre
quency
-6000 -4000 -2000 0
Topography (m)
Two types of histograms
Vector fields and Contour mapswith labels
2009 Oct 07 12:21:36 Example 13 in Cookbook
0 0
0.5
0.5
-2
-1
0
1
2
-2 -1 0 1 2
-0.2
-0.2
-0.2
-0.2
0
0
0.2
0.2
0.20.2
-2
-1
0
1
2
-2 -1 0 1 2
-0.4
-0.3
-0.2
-0.2
-0.1
-0.1
-0.1
0
0.1
0.1
0.1
0.2
0.2
0.3
0.4
-2
-1
0
1
2
-2 -1 0 1 2
-2
-1
0
1
2
-2 -1 0 1 2
z(x,y) = x * exp(-x2-y2)
M.Ulvrova, L.Pouilloux (ENS LYON) Informatique L3 Automne 2011 128 / 177

GMT Generalities
PostScript Plotting
Color images from gridded or rawxyz data
0
1
0 1
0
1
0 1
0.0
0.5
1.0
Te
mp
era
ture
t =.0527
Multiple images
0
1
0 10
1
0 10
1
0 1
0
1
0 10
1
0 1
0.0
0.5
1.0
T
0.00
0.05
∆T
0
2
4
6
8
10
log
10η
(a) (b)
(c) (d) (e)
Text, labels, legend placement
M.Ulvrova, L.Pouilloux (ENS LYON) Informatique L3 Automne 2011 129 / 177

GMT Generalities
PostScript Plotting - Base maps with coastlines, rivers,and borders
M.Ulvrova, L.Pouilloux (ENS LYON) Informatique L3 Automne 2011 130 / 177

GMT Generalities
Is your GMT installed ?
Tape in the terminalpscoast
Path configuration - add to your ∼/.bashrc
#gmt variablesexport NETCDFHOME=/usr/libexport GMTHOME=/usr/lib/gmtexport PATH=$PATH:$GMTHOME/bin
source .bashrc
M.Ulvrova, L.Pouilloux (ENS LYON) Informatique L3 Automne 2011 131 / 177

GMT Generalities
Figure Plotting
18 commands for plotting
psxy, psxyz, psbasemap, pscoast, pstext, · · ·
cmd [options] > myfigure.pstape cmd for help
Layering - calling several commands
cmd1 -K > myfigure.pscmd2 -O -K � myfigure.pscmd3 -O -K � myfigure.pscmd4 -O � myfigure.ps
K: continue (keep)O: overlay
M.Ulvrova, L.Pouilloux (ENS LYON) Informatique L3 Automne 2011 132 / 177

GMT Generalities
GMT cake
M.Ulvrova, L.Pouilloux (ENS LYON) Informatique L3 Automne 2011 133 / 177

GMT Generalities
Plotting - continuation
Usual compulsory parameters
-R Region Rw/e/s/n-J proJection linear/logarithmic, polar, cylindrical, Mollweide, · · ·-B Bound. annot.
pscoast -R-180/180/-89/89 -JW20c -Gblack -P > test.pspscoast -R-180/180/-89/89 -JW20c -Gblack -Bg30/g15 -P > test.ps
Useful trick
R=` minmax -I0.01/0.01 `
M.Ulvrova, L.Pouilloux (ENS LYON) Informatique L3 Automne 2011 134 / 177

GMT Generalities
Configuration files
general: /path/to/gmt/gmtdefaults
personal: ∼/.gmtdefaults
gmtdefaults [-D | -L]
changing a parameter: gmtset (e.g. gmtset PAPER MEDIA A4+)
M.Ulvrova, L.Pouilloux (ENS LYON) Informatique L3 Automne 2011 135 / 177

GMT Generalities
Plotting - finishing
Convert ps file to something more useful
ps2raster myfigure.ps (convertion to jpg)ps2raster -Tf myfigure.ps (convertion to pdf)
M.Ulvrova, L.Pouilloux (ENS LYON) Informatique L3 Automne 2011 136 / 177

GMT Sismicity map
Creation de cartes et de figures : GMT
4 Creation de cartes et de figures : GMTGeneralitiesSismicity mapHistogramSeafloor ageOceanic heat fluxHawaiian ridge
M.Ulvrova, L.Pouilloux (ENS LYON) Informatique L3 Automne 2011 137 / 177

GMT Sismicity map
Seismicity the last 7 days
Get your data - USGSwget http://neic.usgs.gov/neis/gis/bulletin.asc -Oquakes.dat
I look at your data file (e.g. with more)I use minmax
Create your executable scriptI touch make map.shI chmod u+x make map.shI Start editing
M.Ulvrova, L.Pouilloux (ENS LYON) Informatique L3 Automne 2011 138 / 177

GMT Sismicity map
Seismicity the last 7 days
Get ready - definitions
Tell that we are going to use bashI #!/bin/bash
Set GMT parametersI gmtset PAPER MEDIA A4+
Use variablesI input="quakes.dat"I psfile="map seismicity.ps"
M.Ulvrova, L.Pouilloux (ENS LYON) Informatique L3 Automne 2011 139 / 177

GMT Sismicity map
Seismicity the last 7 days
First step - plot world map with continents: use pscoast
Choose your projection: -Jx0.1cdI x stands for linear projectionI 0.1c stands for scaling factor in cmI stands for using geographic coordinates
Choose your range: -R-180/180/-89/89
Choose your frame: -B60g30WSneI 60 stands for anotation each 60 degreeI g30 stands for grid line each 30 degreeI WSne stands for anotation on West/South/north/est
Tell to plot shorelines filled with lightgray: -W -Glightgray
Alltogether
pscoast -R-180/180/-89/89 -Jx0.1cd -B60g30WSne -Dc -Glightgray -W -P -K >
$psfile
M.Ulvrova, L.Pouilloux (ENS LYON) Informatique L3 Automne 2011 140 / 177

GMT Sismicity map
Seismicity the last 7 days
Processing and plotting data with awk and psxy
awk -F, ’IF NR>1 {print $4, $3, $5*0.02}’ $input sed ’s/,/./g’I man awk
psxy -R -J -Gred -Wthin -Sc -O -K � $psfileI tape psxy for help
Redirecting output from awk as input for psxy
awk -F, ’{ print $4, $3, $5*0.02}’ $input psxy -R -J -Sc -Gred -Wthin -O -K �$psfile
M.Ulvrova, L.Pouilloux (ENS LYON) Informatique L3 Automne 2011 141 / 177

GMT Sismicity map
Seismicity the last 7 days
Finally, plot your position - use echo and psxy
echo ”4.825 45.7426” psxy -R -J -Gblue -Wthin -Sa0.9c -O � $psfile
Don’t forget to close your ps file, no -K option!
Convert to pdf
ps2raster -Tf $psfile
Tell the world that your map is finished
echo map $psfile created
You are finished - run your script
./make map.sh
evince map seismicity.pdf
M.Ulvrova, L.Pouilloux (ENS LYON) Informatique L3 Automne 2011 142 / 177

GMT Sismicity map
Seismicity the last 7 days
−180˚ −120˚ −60˚ 0˚ 60˚ 120˚ 180˚
−60˚
0˚
60˚
M.Ulvrova, L.Pouilloux (ENS LYON) Informatique L3 Automne 2011 143 / 177

GMT Histogram
Creation de cartes et de figures : GMT
4 Creation de cartes et de figures : GMTGeneralitiesSismicity mapHistogramSeafloor ageOceanic heat fluxHawaiian ridge
M.Ulvrova, L.Pouilloux (ENS LYON) Informatique L3 Automne 2011 144 / 177

GMT Histogram
Histogram - use pshistogram
0
10
20
30
40
50
60
Nb o
f eart
hquaques
1 2 3 4 5 6 7
Magnitude
M.Ulvrova, L.Pouilloux (ENS LYON) Informatique L3 Automne 2011 145 / 177

GMT Histogram
Histogram
Prepare your data: awk -F, ’IF NR>1 {print $?}’ $inputdata
Examine them: use minmax
Use them as an input for gmt program pshistogram: use pipe
Find parameters for pshistogramI Range -Rxmin/xmax/ymin/ymaxI ProJection -JX20c/10cI Boundary -Ba1g1:"Magnitude":/a10f5:"Nb of
earthquaques":WSneI choose bin-Width -W?I -Ggray -Lthin -P
Alltogether
awk -F, ’IF NR>1 {print $?}’$inputdata pshistogram
-Ba1g1:”Magnitude”:/a10f5:”Nb of earthquaques”:WSne -R?/?/?/? -JX20c/10c
-Ggray -Lthin -W? -P > $psfile
Don’t forget to replace question marks !M.Ulvrova, L.Pouilloux (ENS LYON) Informatique L3 Automne 2011 146 / 177

GMT Seafloor age
Creation de cartes et de figures : GMT
4 Creation de cartes et de figures : GMTGeneralitiesSismicity mapHistogramSeafloor ageOceanic heat fluxHawaiian ridge
M.Ulvrova, L.Pouilloux (ENS LYON) Informatique L3 Automne 2011 147 / 177

GMT Seafloor age
Seafloor age map
0 20 40 60 80 100 120 140 160 180 200 220 240 260
Seafloor Age [my]
M.Ulvrova, L.Pouilloux (ENS LYON) Informatique L3 Automne 2011 148 / 177

GMT Seafloor age
Seafloor age map
Get your data from EarthByteuse wget or click strategy
I http://www.earthbyte.org/Resources/agegrid2008.htmlI download grids - ageI look at README to find out which data to download and download
them (a simple ASCII file - long, lat, age - is desirable).I unzip your file
F bunzip2F bzip2 -d
I examine your dataF the size (ls -l -h | grep age)F the range (minmax)
wget ftp://ftp.earthbyte.org/earthbyte/agegrid/2008/Grids/age.3.6.xyz.bz2
Data file is big - extract each 10th lineI $ awk ’0==NR % 10’ mydatafile.xyz > mydatafile.xyz.coarse
M.Ulvrova, L.Pouilloux (ENS LYON) Informatique L3 Automne 2011 149 / 177
GMT Seafloor age
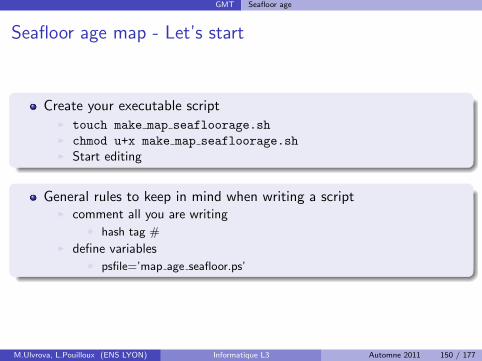
Seafloor age map - Let’s start
Create your executable scriptI touch make map seafloorage.shI chmod u+x make map seafloorage.shI Start editing
General rules to keep in mind when writing a scriptI comment all you are writing
F hash tag #
I define variablesF psfile=’map age seafloor.ps’
M.Ulvrova, L.Pouilloux (ENS LYON) Informatique L3 Automne 2011 150 / 177

GMT Seafloor age
Seafloor age map - Get ready - definitions
Tell that we are going to use bashI #!/bin/bash -eI Note the -e option for handling errors
Set GMT parametersI gmtset PAPER MEDIA A4+
Define input and output variblesI input="myinputfile.xyz.coarse"I psfile="map age seafloor.ps"
M.Ulvrova, L.Pouilloux (ENS LYON) Informatique L3 Automne 2011 151 / 177

GMT Seafloor age
Seafloor age map - Step by step
Converting an ASCII table to grd file formatI xyz2grd
Reading a grdfile and making a color palette fileI grd2cpt
Creating colored image from a 2-D grd fileI grdimage
Plotting land-masses, water-masses, coastlines, borders, and riversI pscoast
Creating colorscale for your mapI psscale
M.Ulvrova, L.Pouilloux (ENS LYON) Informatique L3 Automne 2011 152 / 177

GMT Seafloor age
Seafloor age map
xyz2grd
Mandatory parametersI xyzfile - File holding (x,y,z) valuesI -G - Define name of the binary output grdfileI -I - Define grid spacingI -R - Specify the region of interest
OptionsI -fg - Geographic formating for i/o
xyz2grd $inputdata -R-180/180/-90/90 -I10m/10m -fg -Gage.grd
M.Ulvrova, L.Pouilloux (ENS LYON) Informatique L3 Automne 2011 153 / 177

GMT Seafloor age
Seafloor age map
grd2cpt
Mandatory parametersI grdfile - Grd binary file created with xyz2grd
OptionsI -C - Select the color tableI -I - Inverse the sense of color progressionI -Z - Create a continuous color palette
All must be redirected to cpt file
grd2cpt age.grd -Crainbow -Z -I > age.cpt
M.Ulvrova, L.Pouilloux (ENS LYON) Informatique L3 Automne 2011 154 / 177

GMT Seafloor age
Seafloor age map
grdimage
Mandatory parametersI grdfile - Grd binary file created with xyz2grdI -C - Color palette table created with grd2cptI -J - Select the map projection - Mollweide -JW
OptionsI -P - Select Portrait plotting modeI -K - Keep open the PostScript fileI -Y - Shift origin of plot
All must be redirected to PostScript file
grdimage age.grd -R -JW20c -Cage.cpt -Ya3c -P -K > $psfile
M.Ulvrova, L.Pouilloux (ENS LYON) Informatique L3 Automne 2011 155 / 177

GMT Seafloor age
Seafloor age map
pscoast
Mandatory parametersI -J - Select the map projectionI -R - Specify the region of interest
OptionsI -B - Set map boundary tickmark intervalsI -G - Color filling for continentsI -P - Select Portrait plotting modeI -O - OverlayI -K - Keep open the PostScript file
All must be redirected to PostScript file
pscoast -R -J -Bg30/g15 -Gblack -P -O -K � $psfile
M.Ulvrova, L.Pouilloux (ENS LYON) Informatique L3 Automne 2011 156 / 177

GMT Seafloor age
Seafloor age map
psscale
Mandatory parametersI -D - Define the position of the center/top and the dimensions of the
scale
OptionsI -B - Set anotation, tick and gridline interval for the colorbarI -C - Define cptfile that is used for the color paletteI -O - Overlay
All must be redirected to PostScript file
It’s the last step ⇒ no -K option !
psscale -D10c/-0.5c/20c/0.2ch -B20:”Seafloor Age [my]”: -Cage.cpt -O � $psfile
M.Ulvrova, L.Pouilloux (ENS LYON) Informatique L3 Automne 2011 157 / 177

GMT Seafloor age
Seafloor age map - Finishing
Converting your PostScript file into a pdf file
ps2raster -A -Tf $psfile
Tell the world that your map was created
echo $psfile created
Cleaning
rm -f *.ps
Run your script
./make map seafloorage.sh
M.Ulvrova, L.Pouilloux (ENS LYON) Informatique L3 Automne 2011 158 / 177

GMT Seafloor age
Seafloor age map - coarse data
0 20 40 60 80 100 120 140 160 180 200 220 240 260 280
Seafloor Age [my]
M.Ulvrova, L.Pouilloux (ENS LYON) Informatique L3 Automne 2011 159 / 177

GMT Seafloor age
Seafloor age map - full data cover
0 20 40 60 80 100 120 140 160 180 200 220 240 260
Seafloor Age [my]
M.Ulvrova, L.Pouilloux (ENS LYON) Informatique L3 Automne 2011 160 / 177

GMT Oceanic heat flux
Creation de cartes et de figures : GMT
4 Creation de cartes et de figures : GMTGeneralitiesSismicity mapHistogramSeafloor ageOceanic heat fluxHawaiian ridge
M.Ulvrova, L.Pouilloux (ENS LYON) Informatique L3 Automne 2011 161 / 177

GMT Oceanic heat flux
Oceanic heat flow
Let’s compute and plot the oceanic heat flow
The heat flux q
q =490√
a
I a is the age of the seafloor in Myr for a ≤ 100MyI Comes from the theory of half space coolingI For larger ages q is constant and equal to q = 47 mWm−2
M.Ulvrova, L.Pouilloux (ENS LYON) Informatique L3 Automne 2011 162 / 177

GMT Oceanic heat flux
Oceanic heat flow - Step by step
Compute your data - all operations are performed on your grd fileI grdmath
Use a color palette fileI Will be downloaded
Creating colored image from a 2-D grd fileI grdimage
Plotting land-masses, water-masses, coastlines, borders, and riversI pscoast
Creating colorscale for your mapI psscale
M.Ulvrova, L.Pouilloux (ENS LYON) Informatique L3 Automne 2011 163 / 177

GMT Oceanic heat flux
Let’s start
Create your executable scriptI touch make hf.shI chmod u+x make hf.shI Start editing
Tell that we are going to use bashI #!/bin/bash -e
Set GMT parametersI gmtset PAPER MEDIA A4+
Use variablesI psfile="map heat flux.ps"
M.Ulvrova, L.Pouilloux (ENS LYON) Informatique L3 Automne 2011 164 / 177

GMT Oceanic heat flux
Oceanic heat flow
grdmath
490√a
= 490
(√(1
a
))
DivisionI 1 age.grd DIV
Square rootI SQRT
MultiplicationI 490 MUL
Is equal to your new grd fileI = flux.grd
grdmath 1 age.grd DIV SQRT 490 MUL = flux.grd
M.Ulvrova, L.Pouilloux (ENS LYON) Informatique L3 Automne 2011 165 / 177

GMT Oceanic heat flux
Oceanic heat flow
Download a color palette file - flux.cpt
wget goo.gl/CpvN4
grdimage flux.grd -R-180/180/-90/90 -JW20c -Cflux.cpt -Ya3c -P -K> $psfile
pscoast -R -J -Bg30/g15 -Dc -Gblack -P -O -K � $psfile
psscale -D10c/-0.5c/20c/0.2ch -C -L -B:”Heat flux [mWm@+-2@+]”: -Cflux.cpt -O � $psfile
M.Ulvrova, L.Pouilloux (ENS LYON) Informatique L3 Automne 2011 166 / 177

GMT Oceanic heat flux
Oceanic heat flow - Finishing
Convert to pdf
ps2raster -Tf $psfile
Tell the world that your map was created
echo map $psfile created
Run your script and look at results
./make hf.sh
evince map heat flux.pdf
M.Ulvrova, L.Pouilloux (ENS LYON) Informatique L3 Automne 2011 167 / 177

GMT Oceanic heat flux
Oceanic heat flow
47 60 80 100 120 140 220 320 5000
Heat flux [mW m−2]
M.Ulvrova, L.Pouilloux (ENS LYON) Informatique L3 Automne 2011 168 / 177

GMT Hawaiian ridge
Creation de cartes et de figures : GMT
4 Creation de cartes et de figures : GMTGeneralitiesSismicity mapHistogramSeafloor ageOceanic heat fluxHawaiian ridge
M.Ulvrova, L.Pouilloux (ENS LYON) Informatique L3 Automne 2011 169 / 177

GMT Hawaiian ridge
3D mesh plot of Hawaiian topography - GMT example
Making complicated imageswith GMT - Let’s plot 2 layerperspective plot
I First layer - shows a contourmap of the marine geoid
I Second layer - shows 3D meshplot of the topography
I Also, show the position of theHawaiian islands
I Also, show an arrow pointingnorth
I Finally, add some text
0
0
4
4
4
8
8
12
12
−164˚
−162˚
−160˚
−158˚
−156˚
−154˚
−152˚
−150˚
18˚
20˚
22˚
24˚
N
−4
−2
02
4
Topo (
km
)
Hawaiian Ridge
M.Ulvrova, L.Pouilloux (ENS LYON) Informatique L3 Automne 2011 170 / 177

GMT Hawaiian ridge
Hawaiian ridge - Step by step
Show contours of the geoidI grdcontour
Show Hawaiian isladsI pscoast
Show topography in 3DI grdview
Add title for your figureI pstext
0
0
4
4
4
8
8
12
12
−164˚
−162˚
−160˚
−158˚
−156˚
−154˚
−152˚
−150˚
18˚
20˚
22˚
24˚
N
−4
−2
02
4
Topo (
km
)
Hawaiian Ridge
M.Ulvrova, L.Pouilloux (ENS LYON) Informatique L3 Automne 2011 171 / 177

GMT Hawaiian ridge
Let’s start
Get your data and extract themI wget http://goo.gl/aq1neI tar -xzf nameofyourdatafile.tar.gz
Create your executable scriptI touch make topo.shI chmod u+x make topo.sh
Start editingI #!/bin/bash -eI gmtset PAPER MEDIA A4+I psfile="map topo.ps"
M.Ulvrova, L.Pouilloux (ENS LYON) Informatique L3 Automne 2011 172 / 177
GMT Hawaiian ridge
Hawaiian ridge
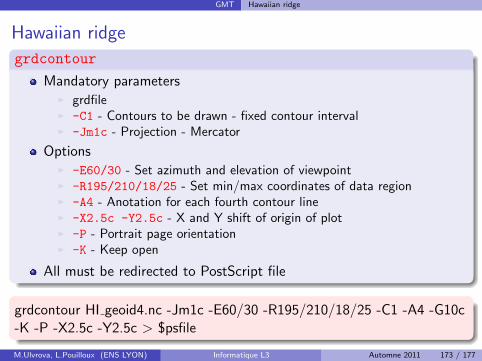
grdcontour
Mandatory parametersI grdfileI -C1 - Contours to be drawn - fixed contour intervalI -Jm1c - Projection - Mercator
OptionsI -E60/30 - Set azimuth and elevation of viewpointI -R195/210/18/25 - Set min/max coordinates of data regionI -A4 - Anotation for each fourth contour lineI -X2.5c -Y2.5c - X and Y shift of origin of plotI -P - Portrait page orientationI -K - Keep open
All must be redirected to PostScript file
grdcontour HI geoid4.nc -Jm1c -E60/30 -R195/210/18/25 -C1 -A4 -G10c-K -P -X2.5c -Y2.5c > $psfile
M.Ulvrova, L.Pouilloux (ENS LYON) Informatique L3 Automne 2011 173 / 177

GMT Hawaiian ridge
Hawaiian ridge
pscoast - Plot Hawaiian islands
You already know . . .
Don’t forget to set your viewpoint
Add a north-pointing map roseI -T-151/19.5/2.5c
pscoast -J -R -E60/30 -B2/2NEsw -Gblack -O -K -T-151/19.5/2.5c � $psfile
M.Ulvrova, L.Pouilloux (ENS LYON) Informatique L3 Automne 2011 174 / 177

GMT Hawaiian ridge
Hawaiian ridge
grdview - Plot topography
Mandatory parametersI topofileI -J - ProjectionI -Jz0.8636c - Set projection in vertical directionI -Czero.cpt - Color palette table
OptionsI -R195/210/18/25/-6/4 - Set min/max coordinates of data region
Palette table - zero.cpt
echo ’-10 255 0 255’ > zero.cptecho ’ 0 100 10 100’ � zero.cpt
grdview HI topo4.nc -J -Jz0.8636c -Czero.cpt -E60/30 -R195/210/18/25/-6/4
-N-6/lightgray -Qsm -O -K -B2/2/2:”Topo (km)”:neswZ -Y5c � $psfile
M.Ulvrova, L.Pouilloux (ENS LYON) Informatique L3 Automne 2011 175 / 177

GMT Hawaiian ridge
Hawaiian ridge - Finishing
pstext - Adding title
echo ’5 8 40 0.0 6 BC Hawaiian Ridge’ pstext -R0/10/0/10 -Jx1.5c -O� $psfile
Convert to pdf
ps2raster -Tf $psfile
Tell the world that your map was created
echo map $psfile created
Run your script and look at results
./make topo.sh
evince map topo.pdf
M.Ulvrova, L.Pouilloux (ENS LYON) Informatique L3 Automne 2011 176 / 177

GMT Hawaiian ridge
00
4
4
4
8
8
1212
−164˚
−162˚
−160˚
−158˚
−156˚
−154˚
−152˚
−150˚
18˚
20˚
22˚
24˚
N
−4
−2
02
4
Topo (
km
)
Hawaiian Ridge
M.Ulvrova, L.Pouilloux (ENS LYON) Informatique L3 Automne 2011 177 / 177