Family Planning for Strangers: An Experiment on the Validity of Reported Contraceptive Use
Upload
khangminh22Category
view
1download
0
INFLUENCES ON CONTRACEPTIVE USE AMONG
COLLEGE WOMEN
A DISSERTATION IN
Nursing
Presented to the Faculty of the University
Of Missouri-Kansas City in partial fulfillment of
the requirements for the degree
DOCTOR OF PHILOSOPHY
By
VALERIE GWEN BADER
BSN, University of Missouri, Columbia, 1984
MN, University of Washington, 1995
Kansas City, Missouri
2015

© 2015
VALERIE GWEN BADER
ALL RIGHTS RESERVED

iii
INFLUENCES ON CONTRACEPTIVE USE AMONG COLLEGE WOMEN
Valerie Gwen Bader, Candidate for the Doctor of Philosophy Degree
University of Missouri-Kansas City, 2015
ABSTRACT
Background: An unintended pregnancy (UIP) occurs before an ideal time or is
completely unwanted. In 2011, the rate of UIP in the United States was 49% of all
pregnancies. Unintended pregnancies are expensive to society and result in poorer health
outcomes for the woman and the infant. Women in the following groups have the highest
rates of UIP: aged 20-24; unmarried and co-habitating; income below the poverty level;
educational level less than a high school diploma; and, Black or Latina women.
Contraceptive use prevents UIP, but many women do not use contraception, especially
the highly effective long-acting reversible forms of contraception. Purposes: This
descriptive, cross-sectional study examined the relationship between background factors,
attitudes, perceived norms, and self-efficacy and the intent to use contraception.
Secondly, this study examined the relationship between background factors, intent to use
contraception, environmental factors, competency, and reported use of contraception.
Finally, this study aimed to establish the validity and reliability of the survey instrument,
Influences on Birth Control Use (IBCU). Methods: Participants were a convenience
sample of 270 women ages 18-24 attending a large public university or community
college in the Midwest. Participants completed a paper survey. The integrated behavioral

iv
model provided a framework for factors associated with intent to use contraception and
reported contraception use. Results: IBCU was found to have reliable sub-scales,
especially for attitude and self-efficacy toward contraceptive use. For each one point
increase in the attitude scale score, the odds that a participant did not intend to use
contraception declined. If a participant reported a rural childhood, they were more likely
to report they did not intend to use contraception. If a participant intended to use
contraception, they were 15 times more likely to report contraceptive use, and if a
participant had health insurance that paid for contraception, they were six times more
likely to report contraceptive use. Conclusions: Understanding social differences in rural
areas allows providers to offer sensitive reproductive health care to women from those
areas. Decreasing the cost of contraception will increase the number of women who use
contraception. Men should be included in research on contraception in future.

v
APPROVAL PAGE
The faculty listed below, appointed by the Dean of the School of Nursing have
examined a dissertation titled “Influences on Contraceptive Use Among College
Women,” presented by Valerie Gwen Bader, candidate for the Doctor of Philosophy
degree, and certify that in their opinion it is worthy of acceptance.
Supervisory Committee
Patricia Kelly, PhD, MPH, RN, FNP, Committee Chair
School of Nursing
An-Ling Cheng, Ph.D.,
School of Nursing
Marjorie Sable, DrPH, MPH, MSW
School of Social Work, University of Missouri
Lori Popejoy, PhD, APRN, GCNS-BC, FAAN
Sinclair School of Nursing, University of Missouri
Patricia A. Murphy, CNM, DrPH, FACNM, FAAN
University of Utah

vi
TABLE OF CONTENTS
ABSTRACT ................................................................................................................. iii
LIST OF ILLUSTRATIONS ...........................................................................................viii
LIST OF TABLES .............................................................................................................ix
ACKNOWLEDGMENTS ..................................................................................................x
Chapter
1. INTRODUCTION .... ....................................................................................................1
Study Purpose and Research Questions ........................................................................3
Definition of Terms . ....................................................................................................4
Assumptions . ................................................................................................................5
Limitations ... ................................................................................................................5
Significance .. ................................................................................................................6
2. A REVIEW OF THE LITERATURE ............................................................................7
Operationalizing Unintended Pregnancy ..... ................................................................7
Impact of Unintended Pregnancy .... ..........................................................................14
Unintended Pregnancy in the US..... ..........................................................................19
A Brief History of Preventing Unintended Pregnancy: Contraception ....... ..............29
The Integrated Behavioral Model .... ..........................................................................32
The Integrated Behavioral Model and Contraceptive Use ... ......................................34
3. METHODOLOGY ................................................................................................... 38
Research Design ...... ..................................................................................................38
Sample and Setting .. ..................................................................................................38
Setting and population. ........................................................................................... 38

vii
Sample size. ............................................................................................................ 39
Measures ...... ..............................................................................................................39
Theoretical model. .................................................................................................. 40
Background questions. ............................................................................................ 42
Dependent variables. ............................................................................................... 43
Independent variables. ............................................................................................ 43
Data Analysis ..............................................................................................................48
Procedures for Data Collection ....... ..........................................................................51
Protection of Human Subjects ......... ..........................................................................51
4. RESULTS ................................................................................................................ 52
Participants’ Characteristics . ......................................................................................52
Research Question One: Do the items on IBCU reliably measure the independent
variables?...... ..............................................................................................................59
Composition of the Scales .... ......................................................................................64
Research Question Two: What is the Relationship between Background Variables,
Independent Variables and Dependent Variables? .....................................................67
Research Question Three: What is the Relationship between Background Factors,
Independent Variables and the Intent to use Contraception?......................................74
Research Question four: What is the Relationship between Background factors,
Independent Variables and Contraceptive Use? .........................................................76
5. DISCUSSION .......................................................................................................... 79
The Sample of Participants .. ......................................................................................79
The Survey Instrument ......... ......................................................................................81
viii
Factors that predict Intent to Use and Reported Use of Contraception ....... ..............83
A Rural Childhood ... ..................................................................................................83
Attitudes toward Contraception ....... ..........................................................................85
Environmental Factors, Self-efficacy, Health Insurance, and Alcohol use . ..............87
Strengths, Limitations, and Future Research ..............................................................89
Recommendations.... ..................................................................................................91
Conclusion .... ..............................................................................................................92
Appendix
A. INFLUENCES ON BIRTH CONTROL USE ...........................................................94
B. INFORMED CONSENT ...... ....................................................................................105
C. POSTER AT RESEARCH TABLE . ........................................................................110
D. MACC APPROVAL LETTER ........ ........................................................................112
E. UMKC IRB APPROVAL LETTER ........................................................................114
F. UNIVERSITY OF MISSOURI HEALTH SCIENCES IRB APPROVAL LETTER116
G. PERMISSIONS TO USE PREVIOUSLY PUBLISHED SURVEYS....................... 118
REFERENCES ........................................................................................................... 120
VITA .......................................................................................................................... 132

ix
LIST OF ILLUSTRATIONS
Figure ....................................................................................................................... Page
1. Integrated Behavioral Model..................................................................................33, 42
2. Scree Plot of Factor Analysis .......................................................................................60

x
TABLES
Table Page
3.1 Constructs and their Measures ...........................................................................45
3.2 Analysis plan for Research Questions ...............................................................49
4.1 Characteristics of Sample ...................................................................................55
4.2 Exploratory Factor Analysis ...............................................................................61
4.3 Scores on Independent and Dependent Variables of Interest ...............................66
4.4 Results: ANOVA test of Background and Independent Variables ......................69
4.5 Results of Chi Square Test of Background and Dependent Variables ................72
4.6 Odds ratio of Predictors of Intent to Use Contraception ....................................75
4.7 Odds ratio of Predictors of Contraceptive Use ..................................................77

xi
ACKNOWLEDGMENTS
I would like to thank Eric Bader for understanding that I needed to pursue
doctoral studies, and for reading rough drafts, too numerous to mention. Eric, you are
ahead of your time.
I would like to thank Roxanne McDaniel Patricia Kelly and Cheryl Bausler for
encouraging me to complete doctoral studies.
I would like to thank my parents for being such good first teachers.
I would like to thank my children for encouraging me to keep going, when I
didn't think I could.
Finally, I would like to thank the Alpha Iota Chapter of Sigma Theta Tau for
awarding me the grant to pay for the iPad mini's for four participants in this research.

1
CHAPTER 1
Introduction
Nearly 50% of pregnancies in the United States are unintended (Finer &
Henshaw, 2006). Because of poor health outcomes for infants and their mothers,
unintended pregnancy is a major public health concern (United States Department of
Health and Human Services, 2010). For example, infants from an unintended
pregnancy are more likely to be born low-birth weight, premature, and experience
failure to thrive during infancy and to have higher rates of child abuse and mortality
than those from planned pregnancies (Gipson, Koenig, & Hendin, 2008). Women
with an unintended pregnancy enter prenatal care later in the pregnancy, have higher
rates of substance abuse during the pregnancy, and experience more postpartum
depression and anxiety following delivery (Cheng, Schwarz, Douglas, & Horon,
2009). Healthy People 2020 reports that rates of UIP are highest in the US among
women ages 18-24, women who are cohabitating; women whose income is below the
poverty line; women with less than a high school diploma; and black or Hispanic
women (United States Department of Health and Human Services, 2012). An
important family planning objective identified in Healthy People 2020 is to increase
the proportion of pregnancies that are intended to 56%.
An unintended pregnancy is defined as one that is unwanted or that
occurs mistimed, sooner than the woman wanted it (Santelli, Lindberg, Orr, Finer, &
Speizer, 2009). Recently, the definition of a mistimed pregnancy has differentiated
between pregnancies that are seriously mistimed (by more than two years) and
pregnancies that are mistimed (by less than two years) (Mosher, Jones, & Abma,

2
2012). Negative consequences of an UIP are more severe if a pregnancy is seriously
mistimed. Approximately half of unintended pregnancies end in abortion (Finer &
Zolna, 2011).
Current research on UIP assumes that people plan their pregnancies
and see themselves as in control of their reproductive abilities. This may not be the
case for all people, however. (Bleil et al., 2011) documented that women who report
serious childhood adversity have higher rates of UIP. Additionally, research has
documented reproductive coercion on the part of male partners contributes to UIP
(Miller et al., 2010). Psychosocial factors such as perceived low risk of pregnancy,
depression, anxiety, smoking, obesity, and not engaging in other health promotion
behaviors, all predicted an increased risk for UIP (Ayoola, Nettleman, & Brewer,
2007); (Xaverius, Tenkku, & Salas, 2009).
Unintended pregnancy can be prevented by using contraception correctly and
consistently; however, the majority of women reporting an unintended pregnancy did
not use contraception, or used it incorrectly, at the time that they became pregnant
(Homco, Peipert, Secura, Lewis, & Allsworth, 2009). According to the integrated
behavioral model, the best predictor of using contraception correctly and consistently
is whether or not one intends to use contraception (Montano & Kasprzyk, 2008, p77-
8). The intention to use contraception is influenced by attitudes toward the behavior
of contraceptive use, social norms toward contraceptive use, and perceived self-
efficacy around contraceptive use. Once a person intends to use contraception, their
intention is supported or hindered by their actual competency at using contraception
and environmental factors. For example, a woman may believe she is capable of

3
using an oral contraceptive pill to prevent pregnancy, but if she misplaces her phone
several times each week, and therefore does not hear the reminder alert, she may not
actually be able to carry out my intention to take a pill at the same time each day.
Because correct and consistent contraceptive use can prevent unintended pregnancy, a
better understanding of how to influence young women to use contraceptives
correctly and consistently is essential.
Study Purpose and Research Questions
Based on the integrated behavioral model, this research will describe the
association between the intention to use contraception and attitudes toward
contraceptive use, perceived norms regarding contraception, and self-efficacy beliefs.
This research will also describe the association between intention to use
contraception, actual competency, environmental factors and reported use of
contraception. The purpose of this study is to improve knowledge about components
of contraceptive decision making so that nurses can develop clinical and educational
interventions that effectively address the high rate of UIP among women ages 18-24.
The specific aim of this study is to explore the contraception use patterns among
young women (ages 18-24) and their relationship to attitudes toward contraceptive
behavior, perceived norms regarding contraception behavior, and self-efficacy
regarding contraception behavior. The research questions guiding this study are: (1)
what is the relationship between attitudes, perceived norms, and self-efficacy and the
intention to use contraception correctly and consistently? And (2) what is the
relationship between intention to use contraception correctly and consistently,
competency, and environmental factors and reported contraception behavior? And (3)

4
do background variables (age, ethnicity, rural vs. urban residence, and socio-
economic status) contribute to intention to use contraception, and reported
contraceptive behavior, over and above the independent variables (attitudes,
perceived norms, self-efficacy, competence, and environmental factors)? Finally, a
factor analysis will be conducted to determine the validity and reliability of the
instrument: Influences on Birth Control Use.
Definition of Terms
Unintended pregnancy: a pregnancy that is sooner than the woman wanted
it (mistimed), or a pregnancy that occurs when a woman did not want a baby, or a
baby of that birth order (unwanted) (Mosher et al., 2012).
Attitudes: A person’s evaluation of how favorable or unfavorable the
outcomes would be after he or she performed a particular behavior (Yzer, 2012, p. 24;
Fishbein, 2008, p. 839).
Perceived social norms: The social pressure one expects to perform, or not
perform the behavior. Perceived social norms includes two aspects: whether or not
significant others expect one to perform the behavior (injunctive norm), and whether
or not they themselves are performing the behavior (descriptive norm) (Yzer, 2012, p.
24).
Self-efficacy: This refers to the extent to which one perceives they can
perform the behavior, despite obstacles (Fishbein, 2008, p. 839).
Intention: A readiness to engage in a particular behavior. Intention to
perform a behavior is predicted by attitudes toward the behavior, perceived social
norms regarding the behavior, and self-efficacy regarding the behavior.

5
Competence: Actual skills and ability (Fishbein, 2008).
Environmental factors: Barriers that prevent people from acting on their
intentions (Fishbein, 2008).
Contraception: Deliberate prevention of pregnancy by using behaviors,
devices or hormones to prevent fertilization of an ovum, or implantation of a
fertilized ovum into the endometrial lining.
Assumptions
Based on the integrated behavioral model, this study will assume the
following:
1. Young women intend to use contraception, depending on their
attitudes toward use of contraception, their perceived social norms about use of
contraception and their self-efficacy beliefs regarding contraceptive use.
2. Young women will use contraception, if they intend to, so long as they
are competent to use contraception and environmental factors do not prevent them
from using contraception.
3. Factor analysis assesses construct validity, and can identify the
relevant items in a survey on contraceptive use.
4. Once the influence (on contraceptive use) of attitudes, social norms,
self-efficacy, competency, and environmental factors are understood, policy and
educational interventions can be developed that will improve contraceptive use.
Limitations
Potential limitations of this study include limitations common to all cross-
sectional studies.

6
1. Cross sectional studies suggest relationships between variables that are
associations, rather than causative (Gordis, 2009, p. 198).
2. Survey research relies on self-report, which may be inaccurate because
the participants want to please the researcher (Polit & Beck, 2010, p. 294).
Additionally, recall bias may occur.
3. Information obtained from cross-sectional surveys can be superficial,
and fail to capture the complexity of the behavior being studied (Polit & Beck, 2010,
p. 295).
4. The convenience sampling method to find participants may limit the
generalizability of the findings of this research.
Significance
The findings from this study will illustrate which personal attitudes, social
norms, self-efficacy beliefs, intention to use contraception, competency, and
environmental factors are associated with consistent contraceptive use, within
different socio-economic reference groups. Knowing more about which attitudes,
perceived norms, and self-efficacy beliefs influence contraceptive behavior helps
nurses provide relevant information to clients in a clinical and community setting.
While evidence suggests some effective pregnancy prevention educational strategies
for teens, the literature lacks research on effective education to increase contraceptive
use and prevent unintended pregnancy among young adults (Kirby, 2009). Second,
findings from this study can be used to design and test intervention strategies directed
at the specific factors that prevent correct and consistent contraceptive use. By
increasing the correct and consistent use of contraception, we can reduce unintended

7
pregnancy, which prevents the negative health consequences for the mother and the
increased morbidity and mortality rates for the child.
CHAPTER 2
A REVIEW OF THE LITERATURE
Operationalizing Unintended Pregnancy
An unintended pregnancy (UIP) either occurs before an ideal time or is
completely unwanted (Santelli et al., 2009). This measure of unintended pregnancy,
also known as the standard measure, has been in use since the 1965 National Fertility
Survey that classified pregnancy into three broad categories: intended; mistimed; and
unwanted (Bumpass & Westhoff, 1970). In the 1965 National Fertility Survey
interviewers asked respondents to think back to the circumstances that existed when
they found out they were pregnant: were they using contraception and did they want
to be pregnant at that time? If they did not want to be pregnant at that time,
respondents were then asked whether they wanted a child at some time in the future.
Intended pregnancies occurred when women wanted to be pregnant at that time.
Mistimed pregnancies occurred when women wanted a child, but not at that time.
Unwanted pregnancies occurred when women did not want to be pregnant, and did
not want a child in the future.
Currently, the National Survey of Family Growth (NSFG) provides the most
comprehensive assessment of the rate of unintended pregnancy in the United States.
Initially, the purpose of the NSFG was to provide reliable national data on marriage,

8
divorce, contraception, infertility, and the health of women and infants. The most
recent survey, concluding in June 2010, included an assessment of attitudes toward
marriage, children, and families, but also information regarding behavior related to
sexually transmitted infection risk and men’s roles in raising and supporting their
children (Centers for Disease Control and Prevention, 2012). Since 1973, NSFG
research assistants have interviewed women aged 15-44, in their homes, every three
to six years. Beginning in 2002, the NSFG began surveying men as well as women.
The results of the NSFG survey that concluded in June 2010, are based on a national
sample of 22,682 men and women, ages 15-44 living in households in the United
States. Survey questions used to measure unintended pregnancy for women are very
detailed and include the following: how many times have you been pregnant; how did
each pregnancy resolve; on a scale of one to ten, how happy were you to find out you
were pregnant; and thinking back to the time you found out you were pregnant, would
you say you wanted a baby at that time or in the future; did you want to be pregnant
at that time; and how much sooner than you wanted did you get pregnant. Women
were also asked to report their perceptions of how happy their partners were about the
pregnancy and the timing of the pregnancy (National Survey of Family Growth,
2006). This current measure of unintended pregnancy, while imperfect, identifies the
conditions in which men and women bear children and seeks to inform policies that
support fertility control (Campbell & Mosher, 2000).
Beginning in 2010, the NSFG began to include data on how “mistimed” a
mistimed pregnancy was (Mosher et al., 2012). Expanding the definition of
unintended pregnancy was necessary because important differences exist between

9
pregnancies mistimed by more than two years (seriously mistimed), and those that are
mistimed by less than two years (moderately mistimed). One notable difference is
that unwanted and seriously mistimed pregnancies occur more frequently among the
following groups of women: teen-agers (77% of pregnancies are unintended, 51% are
seriously mistimed), unmarried women, not co-habitating (76% of pregnancies are
unintended), and women of Hispanic descent (35% of pregnancies are unintended) or
African-American descent (45% of pregnancies are unintended) (Mosher et al.,
2012).
Conceptual problems with the measurement of UIP in the 1965 National
Fertility Survey persist and weaken the results of the current NSFG survey results.
To begin with, both the 1965 and the 2010 surveys assume that couples have an ideal
family size in mind, and then control their fertility to achieve that goal. In this model,
family planning is conceptualized as having a pre-determined goal, resulting in
intentional contraceptive use or non-use, which in turn results in a desired family size.
The family planning process proceeds in a temporal, logical order (Ryder, 1973). In
fact, what one considers to be the ideal family size surely changes as one ages and as
life circumstances change. Yet, this logically ordered model of family planning
persists in current measures of unintended pregnancy.
Another conceptual problem with the standard definition of unintended
pregnancy is that the standard definition links contraceptive behavior with pregnancy
intention, though studies have shown pregnancy intention may or may not predict
contraceptive behavior (Ahluwalia, Whitehead, & Bensyl, 2007; Santelli et al., 2009).
Ambivalence about pregnancy intentions or not having intentions at all regarding

10
pregnancy and childbearing are common. In addition, what motivates people to
engage in sexual activity that can result in pregnancy is likely very different than
what motivates people to bear children (Santelli et al., 2003). Women likely choose to
engage in sexual activity with men they would not necessarily choose to raise
children with. But the standard definition of unintended pregnancy implies that there
will be an ideal time and an ideal partner with whom one would both engage in sexual
activity and become pregnant. The ideal partner and time may not arrive for all
women, or may be different, depending on their immediate goals (Lifflander, Gaydos,
& Hogue, 2007; Santelli, et al., 2009).
The sample populations most of our knowledge on UIP derive from limit our
findings and subsequent knowledge. Surveys on unintended pregnancy sample
women ages 15-45, who agree to participate and who researchers have access to
(Ryder, 1973). This sampling strategy fails to capture young women who are not in
conventional living arrangements and/or not affiliated with large institutions like
colleges, the military, or family planning clinics. Another problem with the sampling
for unintended pregnancy surveys are that men have been historically absent. Both
the 1965 National Fertility Survey, and the NSFG survey data collected before 2002
relied on the woman’s attitude regarding pregnancy, and asked her about her male
partner’s desire for a child. This is problematic because while men have not been
directly included in family planning research, in daily life they certainly play a role
(Melchionne, 2010). This oversight is beginning to change. Since 2002 men have
been included in the NSFG survey, and the survey data from 2006-2010 includes the
responses of more than 10,000 men (Centers for Disease Control and Prevention,

11
2012). Questions used to ask men about UIP include: birth control used with all sex
partners; birth control used by female partners; number of biological children;
possibility of having fathered children unknowingly; desire for children prior to
learning partner was pregnant; and, did partner’s pregnancies occur at the right time,
or too soon? Unlike the survey for women, men are not asked to report how happy
about or wanted the pregnancy was by their female partners.
Another criticism of the standard definition of unintended pregnancy is that
most data on pregnancy timing and intention is collected retrospectively.
Retrospective data collection is problematic because descriptions of pregnancy intent
have been shown to change during the pregnancy (Joyce, Kaestner, & Korenman,
2000). Further, some women may not have considered whether they wanted to be
pregnant prior to finding out that they were in fact pregnant (Ryder, 1973). In a
retrospective survey, women report their current state of mind regarding their
previous intentions, with full knowledge of how things turned out. As Joyce,
Kaestner, and Korenman note, a smiling baby may result in a more positive
recollection of past intentions (2000). Therefore questions about pregnancy intention
may reflect the final outcome, not the process of arriving at that outcome. Stated
another way, retrospective reports of early pregnancy intentions may only reflect
whether a woman eventually adjusted to a pregnancy. For example, in survey data
collected at the time a pregnancy test was taken, before pregnancy was confirmed, an
inconsistent relationship existed between pregnancy intentions and happiness about
the pregnancy (Sable & Libbus, 2000). Currently however, an analysis of NSFG data
cannot determine how correlated pre-pregnancy intentions are to subsequent

12
pregnancy adjustment. To address this issue, the most recent NSFG survey questions
women and men about how happy they were to learn of the pregnancy, in addition to
whether they wanted the pregnancy. But to fully understand pregnancy intention
prior to a pregnancy, more information is needed. Because prospective questions
about the desire for future children are not good predictors of retrospective intention
status, Schwartz, et al (2010) encourage researchers to question not just whether
pregnancy is wanted in the future, but when in the future.
Finally, the NSFG, the primary measure of UIP in the US, does not address
the perceived level of reproductive control women or men have. Perceived
reproductive control is emerging as an important factor in predicting unintended
pregnancy. (Belsky, Steinberg, Houts, & Halpern-Fisher, 2010) showed an
association between early maternal harshness and risky behavior at age 15 in a
prospective, longitudinal survey of 526 mother-daughter pairs. Maternal harshness
was defined as mothers who spanked their children; expected unquestioning
obedience; expected the child to be quiet and respectful around adults; and regarded
respect for authority as the most important thing for a child to learn. Maternal
harshness was associated with early menarche (Χ2=-0.23, p<0.0001), increased sexual
risk taking (Χ2=0.11, p<0.05) and an increase in other risk taking behaviors (Χ
2=0.19,
p<0.0001). The authors interpret these findings as support for the evolutionary theory
of socialization. This theory posits that individuals raised in an environment of risk
and uncertainty mature more quickly, bear more offspring, and limit their parental
investment. Maturing more quickly and breeding promiscuously, while not investing
heavily in parenting is perceived as ensuring more future progeny by women with

13
harsher mothers. These women learned in early childhood that the future was
precarious, others could not be trusted, and intimate relationships were not enduring
(Belsky et al., 2010).
Bleil et al., (2011) also found support for the theory that childhood adversity
predicts low perceived control of reproduction in adolescence and adulthood. These
authors interviewed 259 reproductive aged women and compared their abortion
history with the experience of childhood stressors of abuse (physical and sexual),
family disruption (parental death, divorce, addiction, mental illness, and witnessing
violence) and threats to personal safety (having a serious illness, injury, or accident,
or witnessing a robbery, violence, or being physically assaulted). Among the 89
women reporting having had an abortion, 48.3% had two or more abortions. Women
who had one abortion (compared to women with no abortions) had increased odds of
having experienced family disruption (OR 1.34, CI 1.00-1.79). Women who had two
or more abortions (compared to women who had no abortions) had increased odds of
having experienced abuse (OR 5.83, CI 1.71-19.89), family disruption (OR= 1.75,
CI= 1.14-2.69), and threats to personal safety (OR= 2.74, CI= 1.29-5.82). Finally,
compared to women who had one abortion, women with two or more abortions had
increased childhood experiences of abuse, especially sexual abuse (OR 9.21, CI 1.70-
48.97, p=0.010) and threats to their personal safety (OR =2.23, CI 1.03-4.81,
p=0.042).
The studies cited above by Belsky, et al., and Bleil, et al., point to causative
factors that predict unintended pregnancy, and suggest that the causes of future UIP
have their origins in early childhood. Currently, the most recent NSFG data collected
14
information about the marital status of biological parents, and the participant’s
relationship with their childhood maternal and paternal figure. What the parental
figure’s level of education and age were when first giving birth are also asked. These
questions do not provide detailed information regarding childhood adversity or
maternal harshness, but they are a step in the right direction.
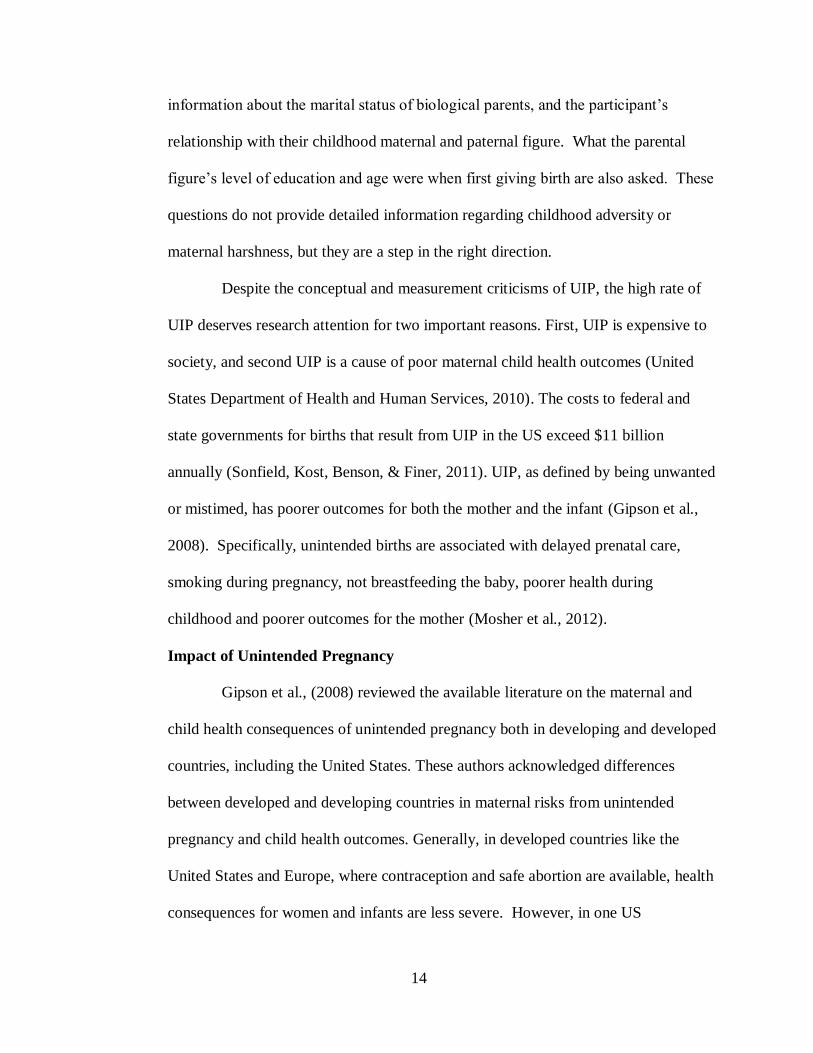
Despite the conceptual and measurement criticisms of UIP, the high rate of
UIP deserves research attention for two important reasons. First, UIP is expensive to
society, and second UIP is a cause of poor maternal child health outcomes (United
States Department of Health and Human Services, 2010). The costs to federal and
state governments for births that result from UIP in the US exceed $11 billion
annually (Sonfield, Kost, Benson, & Finer, 2011). UIP, as defined by being unwanted
or mistimed, has poorer outcomes for both the mother and the infant (Gipson et al.,
2008). Specifically, unintended births are associated with delayed prenatal care,
smoking during pregnancy, not breastfeeding the baby, poorer health during
childhood and poorer outcomes for the mother (Mosher et al., 2012).
Impact of Unintended Pregnancy
Gipson et al., (2008) reviewed the available literature on the maternal and
child health consequences of unintended pregnancy both in developing and developed
countries, including the United States. These authors acknowledged differences
between developed and developing countries in maternal risks from unintended
pregnancy and child health outcomes. Generally, in developed countries like the
United States and Europe, where contraception and safe abortion are available, health
consequences for women and infants are less severe. However, in one US

15
prospective cohort sample of married women with health insurance, who presented
for prenatal care between 1959 and 1966 (n=8823), having an unintended pregnancy
was associated with a significantly higher risk of neonatal mortality (Shah et al.,
2011). Unintended pregnancy was defined as having one or more of the following
attitudes toward the pregnancy: being unhappy, resentful, upset, not wanting the
pregnancy, or having a mistimed pregnancy. Women were asked what their
husband’s attitudes toward the pregnancy was also, and only women whose husband
also viewed the pregnancy as unintended were labeled as having an unintended
pregnancy (n=1274, or 14.4% of the sample). Women reporting the pregnancy as
unintended in the first trimester of pregnancy were 2.4 times more likely to deliver
infants who died in the neonatal period (95% CI= 1.5-4.0). It is important to note that
this data was collected between June 1959 and September, 1966, prior to the
availability of legal abortion and mostly before legal birth control was available in the
US.
Currently, in the United States and other wealthy countries an association
exists between unintended pregnancy and an increased risk of low birth weight (odds
ratio= 1.36, 95% confidence interval =1.25-1.48, p<0.001), preterm birth (odds
ratio=1.33, 95% confidence interval= 0.80-2.21, p<0.01), and being born small for
gestational age (odds ratio= 1.31, 95% confidence interval = 1.09-1.58, p<0.01)
(Shah, et al., 2011). These findings derive from a meta-analysis of 15 studies, 10 of
which were conducted in the US, all of which defined unintended pregnancy as
mistimed or unwanted. Another strength of this study was the large overall sample

16
size (n>109,934), though the entire sample was not used to address each outcome
variable.
Children born from an unintended pregnancy also face an increased risk of
subsequent child abuse (Gipson et al., 2008, p. 27). In a population based cohort
study conducted in the United Kingdom (n=14,256), researchers compared the
pregnancy intention of the mother at 12 weeks gestation, to the child’s subsequent
risk of being registered with the child protection agency at the age of six. Children
under protective supervision were nearly three times more likely to have a mother
who reported her pregnancy as unintended at 12 weeks gestation (OR= 2.92; 95%
CI= 1.83-4.64). The results of this study suggest an association between UIP and
subsequent child abuse, but a limited number of studies have been done to test this
association.
Among women in wealthy countries, unintended pregnancy is associated
with higher rates of depression and abuse. Cheng et al., (2009) examined Pregnancy
Risk Assessment Monitoring System (PRAMS) data from a random sample of
women who delivered in Maryland between 2001 and 2006. These authors found a
nearly two-fold increase in depression among women with unwanted pregnancies,
compared to women with intended pregnancies (Odds ratio=1.98, 95% CI=1.48-
2.64). Maxson and Miranda (2011) surveyed 1321 women when they were between
18 and 28 weeks gestation and compared demographic and psychosocial
characteristics of women with intended, mistimed, and unwanted pregnancies.
Women with unwanted pregnancies tended to be older and have other children.
These women also had significantly higher levels of depression, perceived stress and

17
partners described as critical, controlling, and abusive (p<0.05 for all groups).
Finally, in a study designed to assess the relationship between unintended pregnancy
and postpartum depression at three and 12 months, the authors found the lowest rates
of depression among women with intended births (5% at three months) compared to
unintended births (11% at three months, p<0.001) (Mercier, Garrett, Thorp, & Siega-
Riz, 2013). At 12 months, women with intended pregnancies had a postpartum
depression rate of 3%, compared to 12% of women with unintended pregnancies
(p<0.001). Women with unwanted pregnancies had the highest rates of postpartum
depression at three months (15%) and 12 months (20%), and differed significantly
from women with mistimed or intended pregnancies. Unfortunately, this report did
not compare baseline depression data among women with intended, mistimed, and
unwanted pregnancies.
Miller et al., (2010) documented the association between intimate partner
violence, reproductive control and unintended pregnancy. Reproductive control was
defined as pregnancy coercion (male threatened consequences to the woman if she
didn’t get pregnant), and birth control sabotage (refused to use an intact condom, or
took birth control pills away). In this sample of 1,278 women recruited from family
planning clinics in California, over half of the sample reported having experienced
physical or sexual violence from an intimate partner. Pregnancy coercion was
reported by nearly 20% of the sample, and birth control sabotage was reported by
15%. Of the women who reported partner violence, 35% also reported pregnancy
coercion or birth control sabotage.

18
Women in poorer countries face far more dangerous health consequences
from unintended pregnancy. In low and middle-income countries, preventing
unintended pregnancy unequivocally improves the health and survival of women and
children (Cleland, Conde-Agudelo, Peterson, Ross, & Tsui, 2012). Ross and Blanc
(2012) assert that maternal deaths have declined by 44% in sub-Saharan Africa and
Southeast Asia over the previous 20 years because contraception reduced the number
of unintended pregnancies, particularly in women of high parity. Maternal morbidity
has also declined because contraception increases the interval between pregnancies,
as demonstrated by an analysis of 450,000 births in Latin America between 1985 and
1997 (Cleland et al., 2012). Finally, contraception prevents abortion, and in
developing countries, where 97% of unsafe abortions occur, women are more likely
to die from abortion. Inter-pregnancy spacing of less than 18 months or greater than
60 months leads to poorer infant and child health, as well, more so in developing
countries (Cleland et al., 2012, p. 152). Infants have an increased risk of preterm
birth (OR=2.3; 95% CI= 2.2-2.4), low birth weight (OR=2.1; 95% CI 2.0-2.3) when
born following a short inter-pregnancy interval (<6 mos.). The increased mortality
risk does not go away after infancy however. Children born within two years of an
elder sibling have 60% increased risk of infant mortality and 40% increased risk of
mortality between ages 1-4 (Cleland et al., 2012, pgs. 152-3).
Many of the benefits to women and children of both contraception and safe,
legal abortion were realized many years ago in the United States (Cleland, et al.,
2012, p. 154). An understanding of the relationship of contraception, legal abortion,
unintended pregnancy and pregnancy outcomes is illusive, however, and support for

19
family planning is waning in the current U.S. political climate. Despite the
availability of contraception and safe abortion in the US, rates of unintended
pregnancy and abortion remain high compared with other developed countries (Finer
& Zolna, 2011).
Unintended Pregnancy in the US
In the United States, the rate of unintended pregnancy is estimated to be 49%
of all pregnancies, based on data from the NSFG (Finer & Zolna, 2011). Mosher, et
al., evaluated trends in rates of unintended pregnancy among women who gave birth
between 1982 and 2010, also using NSFG data from 12,279 women (2012). These
authors identified demographic factors associated with higher rates of unintended
pregnancy: unmarried; African American descent; less education; or, less income. In
2010, as in 1982, approximately 37% of births were from unintended pregnancies.
Two changes were noted between the two time-points, however. First, the percentage
of births that were intended increased among ever-married, non-Hispanic white
women. However, this gain was offset by the dramatic increase in births to
unmarried women, which rose from 18% in 1982 to 41% in 2009. Because the
proportion of births to unmarried women rose (most of whom have unintended
pregnancies) the overall percentage of births that were intended, declined.
Striking disparities in rates of unintended pregnancy exist among different
groups of women in the US (Finer & Henshaw, 2006). Women in the following
groups had the highest unintended pregnancy rates: women aged 20-24; unmarried
women who are co-habitating; women whose income is below the poverty line;
women with less than a high school diploma; and black or Hispanic women. Women
20
who were married at the time of the NSFG survey data collection or were college
graduates, reported their pregnancies as intended 72% and 74% of the time,
respectively (Finer & Zolna, 2011). By contrast, never married women (who were not
cohabitating) reported their intended pregnancy rate as 1%; and formerly married
women (who were also not cohabitating) had an intended pregnancy rate of 2.5%
(Finer & Zolna, 2011, table 1). The statistical evidence showing disparities in rates of
unintended pregnancy suggest that the more socially and financially vulnerable a
woman is, the higher her risk for UIP.
Contraceptive use prevents many unintended pregnancies, though certainly
not all. Therefore understanding why women do not use contraception and protect
themselves from UIP is very important. In a widely cited paper, researchers
documented that nearly half of the women who responded to their survey (n=10,683)
while waiting for an abortion procedure had not used contraception in the month they
became pregnant (Jones, Darroch, & Henshaw, 2002). Women in this sample cited
perceived low risk of pregnancy (33% of non-users), and concerns about
contraception (32% of non-users) as important reasons why they did not use
contraception. Specifically concerns about contraception included problems with
contraception in the past and fear of side effects. Twenty-seven percent of non-users
of contraception identified unexpected sexual encounters as a reason for non-use of
contraception. Finally, these authors also documented that women with incomes
lower than 300% of poverty cited financial barriers to obtaining contraception as a
reason for non-use.

21
Following the legalization of contraceptive pills for unmarried women in
1972, many assumed that abortion would become uncommon because women would
opt to prevent unwanted pregnancies. Luker noted that the abortion rate in the US had
not declined with the legalization of contraceptive pills and she sought to understand
why women were not preventing unintended pregnancies (Luker, 1977). Luker’s
findings from a sample of 500 women presenting for an abortion at clinics in the San
Francisco Bay area (1971-73) remain relevant today. Women weighed the costs and
benefits of using contraception (in the present), as well as the costs and benefits of
pregnancy (in the future) (Luker, 1977, p. 193). Contraception had (and still has)
social costs that family planning clinicians fail to consider. For example, using
contraception means a woman is sexually active, and intends to engage in sexual
behavior, which is culturally taboo for many young women. Similarly, pregnancy has
social benefits that are acquired without formal training or a special selection process.
Pregnancy increases a woman’s femininity, her independence and proves that she
really is fertile. Pregnancy also tests a partner’s commitment. Finally, as women’s
lives change, women continually re-evaluate the costs and benefits of both
contraception and pregnancy. In addition to personal costs and benefits, large scale
social forces, such as poverty and gender issues, also determine the costs and benefits
associated with contraception and pregnancy.
In contrast to the high abortion rates in the US that have persisted to
the present day, abortion rates in the Netherlands have declined dramatically over the
past three decades and abortion is now a rare event (Levels, Need, Niewenhuis,
Sluiter, & Ultee, 2012). In fact, abortion in the Netherlands is rare, despite the fact

22
that abortion is safe, legal, and freely available to women. Similar to Luker, Levels, et
al. posit that women engage in cost-benefit analysis regarding abortion, contraception
and pregnancy. Contraceptive cost-benefit analyses includes the ease with which
women can obtain very effective forms of contraception: in the Netherlands all forms
of contraception are paid for by national insurance, and both pills and long acting
reversible contraceptives are readily available. Inexpensive access to a variety of
contraceptive methods has reduced the rate of unintended pregnancy and subsequent
abortion.
Ayoola, Nettleman, and Brewer (2007) summarized in a literature review
reasons why adult women in the US do not use birth control and therefore put
themselves at high risk for an unintended pregnancy. These authors reviewed 16
studies that described reasons for non-use of contraception at the individual,
intrapersonal, and societal level. At the individual level, women identified several
barriers to contraceptive use: fear of side effects of contraception; perceived low risk
of pregnancy; the attitude that contraception was unnatural; and embarrassment over
purchasing contraception. At the interpersonal level, male partners who disapproved
of contraception influenced contraception use. At the societal level, important
reasons women did not use contraception were difficulty getting an appointment for
contraception and difficulty paying for contraception (Ayoola et al., 2007).
Lifflander, Gaydos, and Hogue (2007) conducted a phenomenological
investigation among low-income adult women in Atlanta, Georgia, who had a 24%
intended pregnancy rate. One purpose of this study was to explore the meaning and
circumstances of planned and unplanned pregnancy. Participants identified positive

23
and negative situations in which planned pregnancies occur. Planned pregnancies can
occur when a couple’s relationship is proceeding well; they are financially secure;
they have family and community support; and the couple and their other children are
the right age. Planned pregnancies also occur because women are seeking
unconditional love from a child, or want to ensure a male partner stays connected.
This strategy for securing a relationship was identified as ineffective by participants.
Unplanned pregnancies also occurred in differing circumstances, and the
circumstances affected whether the woman was happy about the pregnancy and
continued the pregnancy. Interestingly, the findings of this study suggest that
unintended pregnancies that occur under positive circumstances may be at lower risk
than intended pregnancies that occur in less than optimal circumstances (Lifflander et
al., 2007, p. 88).
Different use and non-use of contraception among women of differing ethnic
and income groups can account for some differences in rates of UIP. (Dehlendorf,
Rodriguez, Levy, Borrero, & Steinauer, 2010), summarized the research on
disparities in family planning outcomes and etiologies, in order to suggest pathways
to reducing unintended pregnancy. These authors assert that Black and Hispanic
women use less effective methods of contraception overall, and poorer black or
Hispanic women are even less likely to use any contraception (Dehlendorf, et al.,
2010, p. 3). Perhaps this is because safety concerns about contraception are more
prevalent among Black and Latina women, no doubt a result of historical events, in
which minority women were the unknowing subjects of contraceptive research
(Thorburn & Bogart, 2005; Grossman, et al., 2010). Knowledge differences also

24
exist based on ethnicity and income and may result from lower levels of education,
culturally based myths, and attitudes toward contraception in families. Obtaining
contraception from health care providers may not be as acceptable to Black or Latina
women, who trust peers and family more than health care providers. Finally, Black
and Hispanic women report more ambivalence toward pregnancy than White women,
and ambivalence toward pregnancy is associated with less use of contraception
(Schwartz, Peacock, McRae, Seymour, & Gilliam, 2010; Higgins, Popkin, & Santelli,
2012). But, research has documented that poor and minority women also experience
higher rates of method failure and discontinuation, even when using more reliable
methods (Jones et al., 2002).
Contraceptive methods vary in their effectiveness and side effect profile,
which in turn may cause women to use contraceptives effectively, ineffectively, or
quit using them, altogether. For example, long acting reversible contraceptive
methods (LARC’s) are considered very effective, and the low rate of use of these in
the United States, compared to other countries, is thought to be one factor behind
higher rates of UIP in the US (ACOG Committee Opinion, 2009). LARC’s include
contraceptive implants (Implanon) and intrauterine devices (IUD’s). LARC’s have
the lowest levels of failure rates and the highest continuation rates of all reversible
forms of birth control: the failure rate is less than one pregnancy per 100 women in
one year (ACOG Committee Opinion, 2009).
The use of LARC’s has been increasing in the United States in the past
decade (Kavanaugh, Jerman, Hubacher, Kost, & Finer, 2011). In 2002, less than 1%
of women reported using an implant or an IUD for birth control. Between 2006 and

25
2010, 7.7% of US women report having used an IUD. Kavanaugh et al., report that
most of the increase in IUD use has occurred among the youngest and the oldest
women of childbearing age, and among women who have given birth (2011).
Effective forms of contraception include Depo-Provera (DMPA) injections,
oral contraceptive pills, and combined hormonal patches and rings. In a recent,
prospective, large cohort study on the effectiveness of these methods of
contraception, Depo-Provera, oral contraceptive pills and combined hormonal patches
and rings were found to be substantially less effective than long acting reversible
contraceptives, like IUD’s and implants (Winner et al., 2012). If women continue
DMPA, and receive repeat injections on time, the failure rate is very low: 0.22 per
100 participants per year. However, only about 60% of women continue DMPA past
one year of use. The failure rate of oral contraceptive pills, and combined hormonal
patches and rings is approximately 4.55 pregnancies, per 100 participants, per year
(Winner et al., 2012).
Contraceptive counseling is widely assumed to be an effective intervention
that influences contraceptive use, but in fact there is no evidence to support that
assumption. Both a Cochrane Review and the US Preventive Services Task Force
have found no evidence supporting the idea that contraceptive counseling improves
contraceptive use (Langston, Rosario, & Westhoff, 2010). Additionally, a systematic
review and meta-analysis revealed no evidence supporting the hypothesis that
components of contraceptive counseling increased contraceptive use following an
abortion (Ferreira, Lemos, Figueiroa, & deSouza, 2009).
26
Whether improved contraceptive knowledge leads to consistent and correct
contraceptive use has yet to be determined (Hall, Castaño, Stone, & Westhoff, 2010;
Ip, Sin, & Chan, 2009). One recent, large, nationally representative survey of young
adults in the US documented the high prevalence of inaccurate knowledge about
contraception (Kaye, Suellentrop, & Beck, 2009). Other studies have documented
factors besides knowledge that influence contraceptive use, including: belief that one
cannot get pregnant; unwanted side effects of contraception; fear of contraception’s
health effects; partners or family members who discouraged contraceptive use; and
barriers to access because of cost and inconvenience (Ayoola et al., 2007; Grossman,
Fernandez, Hopkins, Amastae, & Potter, 2010; Homco et al., 2009).
While evidence does not support a relationship between counseling
interventions and increased use of contraception, evidence does show that women
who use contraception correctly and consistently are likely to have more education.
In 2001 demographic data indicated that women over age 20 with only a high school
diploma had UIP rates three times that of college graduates (Finer & Henshaw, 2006,
p. 94). More specifically, higher scores on a test about contraceptive methods was
associated with an increased likelihood of using hormonal or long acting
contraception among young men and young women (Frost, Lindberg, & Finer, 2012).
While more education is associated with more effective contraceptive use, no specific
educational intervention has been shown to improve contraceptive use. Possibly, a
third factor that influences women to have more education in general, and specifically
more education about contraception, also influences educated women to use
contraception correctly and consistently.

27
Finally, some authors have studied whether other risky health-related
behaviors are associated with unintended pregnancy. Among college women, risk
drinking (more than eight drinks per week and binge drinking) was associated with
less effective contraceptive use (Ingersoll, Ceperich, Nettleman, & Johnson, 2008) .
However, in a large sample (n=16,113) of women of childbearing age, women at high
risk for unintended pregnancy were less likely to use alcohol and binge drink
(Xaverius, Tenkku, & Salas, 2009). Xaverius, et al., also explored whether women at
risk for UIP would have fewer other health promotion behaviors, such as: exercise;
health screenings, like Pap smear testing and STI counseling; and being obese (2009).
Women at high risk for UIP, were 1.23 times more likely to be obese, 1.2 times more
likely to smoke, 27% less likely to exercise, 62% less likely to receive a Pap test, and
44% less likely to have received STI counseling.
Other psychosocial characteristics that have been studied in relation to UIP
include depression, self-efficacy, perceived stress, social support and coping styles.
Maxson and Miranda (2011) found that women with unintended pregnancies have the
highest depression scores, highest perceived stress scores, and highest negative
paternal support scores, compared to women with mistimed and wanted pregnancies.
Women with unwanted pregnancies from Maxson and Miranda’s sample were also
more likely to report a previous preterm birth, more likely to report a previous
elective abortion, and were less likely to be having their first child. Maxson and
Miranda’s findings support Messer, Dole, Kaufman, and Savitz's, (2005) findings that
unintended pregnancies are associated with increased perceived stress, increased rates
of depression, and less effective coping strategies. Messer, et al., analyzed the results

28
of a self-administered mail-back survey, which 1908 pregnant women completed
between 24 and 29 weeks gestation. In addition to measuring perceived stress and
depression with acceptable scales, these authors assessed maternal coping style with
The Ways of Coping Questionnaire. Coping methods included: accept responsibility;
confrontative; distancing; escape avoidance; planful problem solving; positive
reappraisal; seek social support; and, self-control of behavior. Unintended
pregnancies were associated with medium and high levels of depression. Coping
styles used by women with UIP included: medium and high levels of accepting
responsibility; medium and high levels of escape avoidance; and high levels of
positive reappraisal, confrontative, distancing, and self-control coping styles.
Interestingly, positive reappraisal indicates an effort to create positive meaning from
life events and focus on personal growth. Positive reappraisal is associated with
religiosity (Messer et al., 2005).
As mentioned previously, one personal characteristic strongly associated
with UIP is age. Young women, specifically women ages 18-24 have the highest rates
of UIP (Finer & Zolna, 2011). The ages of 18-24 corresponds directly to the
developmental stage newly identified by Arnett as “emerging adulthood” (2000).
During emerging adulthood people explore a variety of life directions in love, work,
and world-views. Notably, risky behavior of all types peaks during emerging
adulthood from a desire for novel and intense experiences (Arnett, 2000, p. 473).
People between the years of 18 and 25 no longer see themselves as adolescents, nor
do they see themselves entirely as adults. Achieving two criteria mark the transition
to full adulthood: accepting responsibility for one’s self; and, making independent

29
decisions. Parenthood, while not an essential component of adulthood, is a sufficient
marker of adult status (Arnett, 2000, p. 473).
Another personal characteristic that may influence risk for UIP is libido, or
level of interest in sex. Willoughby (2012) applied the theory of emerging adulthood
to his study of emerging adults’ sexual behaviors and attitudes toward sexual activity.
Willoughby found four sexual experience groups: confident abstainers; technical
abstainers; average engagers; and, high-frequency engagers. Confident abstainers
(21.8% of the total sample) disapproved of premarital sex, casual sex and
pornography use. Technical abstainers (17% of the total sample) had very low levels
of intercourse behavior, but high levels of pornography use and high levels of non-
intercourse sexual activity. The average engagers (36.9% of the total sample) were
the largest group, and had on average 2.39 lifetime partners. The final group, high
frequency engagers (24.3% of the total) had the highest degree of approval for
premarital sex, casual sex, and pornography use. This group also engaged in the most
sexual activity, and indicated the youngest age at first sex. People in the high engager
group experienced sexual activity at rates two to three times higher than the average
engagers, and likely also placed themselves at higher risk for STI’s and UIP.
Currently, level of interest in sexual activity has not been compared to risk for UIP in
the research literature.
A Brief History of Preventing Unintended Pregnancy: Contraception
People have engaged in sexual behavior without the intention of conceiving a
child since antiquity. In order to prevent pregnancy, people have also practiced
contraception. Some ancient contraceptive practices were ineffective or dangerous:

30
such as drinking lead or mercury, or wearing a weasel testicle around one’s neck.
Other ancient contraceptive methods were somewhat or very effective, and are still
practiced today. People have known since antiquity that abstinence, outer-course, and
exclusive breastfeeding are all reasonably effective forms of contraception. The
practice of coitus interuptus is described and condemned in Genesis (Knowles, 2002).
African and Native American women of the seventeenth century monitored the
quality of their cervical mucus to predict fertility and plan their families (p.4). The
oldest known illustration of a condom is 12,000-15,000 years old, and was found
painted on a cave wall in France. Similarly, illustrations of condoms occur in 3,000
year old Egyptian artifacts. Archeologists uncovered the oldest surviving condoms in
the foundations of Dudley Castle in England; these date to 1640.
Riddle (1997) documented the extensive and effective use of herbal
preparations for contraception from ancient times to the present. Greek mythology
teaches that Persephone ate only pomegranate seeds while she was kidnapped in the
underworld each winter; pomegranate is now known as having contraceptive effects,
along with pennyroyal, juniper, and vitex (or chaste-tree). Additionally, pomegranate
rind has been used as a diaphragm (Riddle, 1997). The practice of using plants to
prevent pregnancy continues in parts of the world to this day. Women in tropical
India and Sri Lanka eat a papaya each day to prevent pregnancy. In 1993, an English
research team discovered that an enzyme in papayas (papain) interacts with
progesterone to prevent pregnancy. The chewed seeds from Queen Anne’s lace has
been documented as an effective contraceptive since first recorded by Hippocrates in
the fifth century BCE (Riddle, 1992), and this practice continues in rural parts of the

31
US (Riddle, 1997). Finally, had it not been for Central American women who ate
Barbasco root to prevent pregnancy, Russell Marker may not have discovered the
inexpensive source of progesterone that Gregory Pincus developed into the first birth
control pill (Knowles, 2002). Evidence for the effectiveness of herbal preparations
comes from demographic data showing smaller than expected families in many parts
of the ancient and medieval world, even after accounting for infant mortality. Further
evidence of the effectiveness of herbs also comes from the writings of past scholars
who were confident their herbal recipes would prevent pregnancy or cause an early
abortion. Finally, current scientific study confirms the antifertility actions of many of
the herbs used in ancient and medieval times (Riddle, 1997, p. 67).
Gordon asserts that despite evidence for the use of herbs to prevent
pregnancy, the most effective form of contraception from antiquity to the modern age
were pessaries, especially those containing oil and rock salt (Gordon, 2002, p. 19).
Oil retards sperm motility and rock salt is an effective spermicide. Oil in the vagina
has been a recommended form of contraception since the first century BCE, until the
early twentieth century, and oils have the additional benefit of providing some
protection from sexually transmitted infections. Pessaries were made from a variety
of substances, depending on the local resources: herbs; wool; cotton; crocodile dung.
The most effective pessaries were sponges, which were only easily available to those
who lived by the sea.
Whether contraception was practiced by herbal therapies, pessaries, or some
other method, the need to prevent unintended pregnancies and terminate high risk
pregnancies has long been recognized in medical texts (Riddle, 1997, pgs. 103-104).

32
Avicenna, an Islamic writer from 1000 AD, noted that physicians may need to advise
contraception and abortion when pregnancy would be too risky because of a woman’s
other health problems. William of Saliceto, writing in the thirteenth century, added to
Avicenna’s justification for contraception that very young girls who conceived,
would likely die during delivery. In the late thirteenth century, one author
recommended contraceptive herbs to protect single women’s suitability for later
marriage. This is the earliest writer to acknowledge that women’s ability to control
their childbearing was linked to their future social status. Later, Malthus, in
nineteenth century Britain, wrote extensively on the connection between
overpopulation and poverty, leading some social reformers to recommend
contraception for the poor to reduce their poverty (Gordon, 2002, p. 40). In the early
twentieth century, feminists like Emma Goldman and Margaret Sanger further
justified the use of birth control to include the idea that each woman had the right to
control her own destiny, which was largely determined by when and how many
children a woman delivered (Gordon, 2002, p. 152). This empowered view of women
continued through the twentieth century as an additional motivator for finding safe
and effective forms of contraception, especially after the Great Depression exposed
the economic system as the main cause of poverty, instead of the childbearing habits
of the poor as Malthus had insisted (Gordon, 2002, p. 229).
The Integrated Behavioral Model
The integrated behavioral model (IBM) grew out of social cognitive theory,
the health belief model, and the theory of reasoned action (Montano & Kasprzyk,

33
2008). Constructs and proposed relationships contained in IBM are shown in Figure
1 below.
Figure 1. The Integrated Behavioral Model
Basically, IBM posits that a small number of variables can explain a
substantial proportion of the variance in any behavior in any population (Fishbein,
2008, Yzer, 2012). Additionally, behavior follows from specific attitudes people hold
about the behavior. Attitudes about the specific behavior are reasonable, but not
always rational or even accurate. The best predictor of behavior is a person’s
intention to perform that behavior. If someone intends to perform a behavior, IBM
predicts they will do so, provided they have the necessary skills and abilities, and
Attitude: expected consequences
from the performing the behavior;
knowledge about performing the
behavior; and beliefs about the
behavior.
Perceived norms regarding the
behavior: what important others
expect me to do regarding this
behavior; and whether important
others perform this behavior.
Self-efficacy: belief in ability to
perform the behavior and overcome
obstacles to performing the
behavior.
Intention to perform
the behavior.
Behavior
Environmental
Factors
Competence:
skills and
abilities

34
provided environmental factors do not interrupt their performance of the behavior. A
person’s intention to perform the behavior is determined by their attitudes toward the
behavior, perceived norms regarding the behavior, and self-efficacy regarding the
behavior. In IBM, attitude refers to how favorable or unfavorable a person believes
his or her performing the behavior would be. Perceived norm refers to the social
pressure one feels to perform the behavior. Social pressure regarding the behavior
refers to whether important people value the behavior and whether peers are actually
performing the behavior, as well. Finally, self-efficacy consists of an individual’s
beliefs about whether they are able to perform the behavior, regardless of their actual
competence. Background factors, such as socio-economic status, relationship factors,
and education predict attitudes, perceived norms, and self-efficacy.
The Integrated Behavioral Model and Contraceptive Use
The first step in applying IBM to behavioral research, like contraceptive use,
is to clearly define the behavior (Fishbein, 2008). The behavior that is the focus of
the IBM in this paper is on correct and consistent contraceptive behavior, as a means
to prevent UIP. A clear definition of contraceptive behavior is difficult because of
the variety of contraceptives available, and the variety of contexts in which sexual
behavior occurs. Fishbein (2008) recommends the following: identify the action (use),
identify the target (contraception), identify the context (during vaginal intercourse),
identify the time (every time). This is the first study to use the integrated behavioral
model to explore contraceptive behavior that includes all forms of contraception
(Wohlwend et al., 2014).

35
Attitudes toward contraceptive behavior include the beliefs, knowledge and
expected consequences regarding that behavior (Pratte, Whitesell, McFarlane, & Bull,
2010). Research reveals the existence of conflicting attitudes about contraceptive use
(Pratte et al., 2010; Ayoola et al., 2007). Attitudes that influence the intention to use
contraception include the following: concerns about side effects, concerns about
weight gain, and perceived health risks from using contraception (Homco et al., 2009;
Ayoola et al., 2007). Many women do not use contraception because they believe
they have a low risk of pregnancy, which in some cases means women believe they
are infertile (Mosher et al., 2012; Homco, et al., 2009; Jones et al., 2002). Whether or
not one deems the health care system that prescribes and dispenses contraception as
trustworthy is an attitude that may profoundly influence the intention to use
contraception (Yang, Matthews, & Hillemeier, 2011). Many studies have documented
inaccurate knowledge about (a) how to use contraception and (b) how contraception
works (Kaye et al., 2009; Homco, et al., 2009). Finally, mental health problems are
associated with inadequate contraceptive behavior (Homco, et al., 2009; Maxson &
Miranda, 2011). While many different attitudes determine one’s intention to use
contraceptives, a thorough understanding of which personal benefits and expected
consequences affect contraceptive use decisions of women of different ages and
socioeconomic strata is not well understood.
Perceived norms consist of the social pressures that one feels to engage in or
avoid certain behaviors (Montano & Kasprzyk, 2008, p. 78). Perceived norms are in
flux for “emerging adults” defined by Arnett (2000) as a new developmental stage for
the years between adolescence and adulthood. Only 13% of young adults perceive

36
contraception as immoral (Kaye et al., 2009). Additionally, many other ethical
questions exist regarding which forms of contraception are unethical and in which
circumstances. Perceived norms also prescribe an appropriate power balance between
partners in intimate relationships. Men who are abusive frequently control their
partner’s contraceptive use (Miller et al., 2010). Identifying perceived norms that
influence young adults’ contraceptive behavior will enable nurses to develop
messages that can be tailored to more effectively influence this aspect of
contraceptive behavior.
Perceived norms vary depending on socio-economic and community
circumstances, also. Higher income women, with more education, are more likely to
use contraception consistently and have fewer unintended pregnancies (Finer &
Zolna, 2011). Women of color are more likely to experience unintended pregnancy,
and the rate of UIP increases among all women of lower socio-economic status.
Whether or not perceived norms regarding contraception differ in rural areas
compared to urban areas is unknown. Finally, perceived norms vary with age, and
women ages 18-24 have the highest rate of unintended pregnancy overall (United
States Department of Health and Human Services, 2012). The social norms that
predict unintended pregnancy among adult women are not well understood.
The third factor that contributes to the intent to use contraception is self-
efficacy. Self-efficacy refers to one’s belief that they can acquire the skills needed to
use contraception, and to use contraception in a variety of challenging conditions (Ip
et al., 2009). Perceived control over performing a behavior is a component of self-
efficacy. Perceived control is influenced by how much one believes they can

37
influence the environment to allow the behavior (Montano & Kasprzyk, 2008).
Studies that evaluate self-efficacy and contraceptive use in Western populations are
20-30 years old (Ip et al., 2009). A recent study on the association between self-
efficacy and contraceptive knowledge among women in Hong Kong showed no
association (Ip et al., 2009). These authors did not evaluate whether self-efficacy was
associated with contraceptive intention or use.
Finally, if one intends to use contraception, there are two additional
categories of hurdles that may thwart their intentions: environmental constraints and
actual competence (Yzer, 2012). Environmental constraints that deter contraceptive
use include lack of access to health care clinics, and a lack of money to pay for highly
effective forms of birth control. An example of a lack of skills necessary to use
contraception may include an inability to adhere to daily pill use, or an inability to
manage side effects that are uncomfortable.
In conclusion, more information is needed about the circumstances in which
so many American women experience unintended pregnancy. IBM provides a
theoretical basis for this investigation that incorporates a comprehensive assessment
of factors that influence birth control behavior. Once factors that influence birth
control behaviors are better understood, researchers can then develop interventions
that are more likely to reduce the rate of unintended pregnancy.

38
CHAPTER 3
METHODOLOGY
Research Design
This descriptive, cross-sectional study applied the integrated behavioral model to
examine the relationship between the behavior of contraceptive use and: (a) attitudes
toward contraceptive use; (b) perceived norms regarding contraceptive use; and (c) self-
efficacy regarding contraceptive use.
Sample and Setting
This research used a convenience sample of female college students, ages 18-24,
a group at high risk for unintended pregnancy.
Setting and population. One community college (College 1) and one public
university in central Missouri (College 2) will make up the population. Over 5000
students enroll annually at College 1. Sixty-five percent of College 1 students come from
rural areas in central and northeastern Missouri, as of fall 2011, according to the most
recent published data (Moberly Area Community College, 2013). Eighty-six percent of
the student body is white; 10% are African American; two percent are Hispanic; and two
percent identify as another ethnic group. The average age of students at college 1 is 24.
Nearly 80% of College 1 students report financial need and 65% report working while
they attend school. The average ACT score in fall 2011 of incoming students at College
1 was 19.7, compared to a national average of 21.1.
Over 26,000 undergraduate students enrolled at College 2 for fall semester 2013,
according to the most recent published data (University of Missouri, 2013). Over 28% of
College 2 students come from other states, while 6.4% come from other countries.

39
Minority students comprise 15% of the student body at College 2. Twenty-one percent of
students receive Pell Grants, identifying them as low-income, and approximately 60%
receive other forms of financial aid. The average ACT score of incoming freshman for
Fall 2013 was 25.7.
Sample size. An overall sample size of 270 was calculated through logistic
regression with the following parameters: a power of 0.8, with odds ratio equal to 1.5,
and an alpha level equal to 0.05. A minimum of 163 subjects is needed (Faul, et al.,
2009). If 163 subjects cannot be obtained, there should be a minimum of 20 cases per
predictor variable for logistic regression. For three predictors, at least 60 subjects should
be obtained (Leech, Barrett, & Morgan, 2008). Because there are three predictor variables
for each dependent variable, at least 120 participants should be included in this research.
However, because a factor analysis of the survey will be completed as part of this
research, and at least 10 participants are needed per item, the desired sample size is 270
women (Pett, Lackey, & Sullivan, 2003).
Measures
Survey questions for Influences on Birth Control Use (IBCU) were derived
primarily from two sources: a survey on condom use based on IBM (Pratte et al., 2010)
and questions used in The Fog Zone (Kaye et al., 2009). The authors of both of these
surveys granted permission to use their content with attribution. Please see Appendix G.
Pratte, et al., developed a 37 item instrument designed to measure attitudes
(positive outcomes and negative outcomes), norms, and self-efficacy regarding condom
use (2010). The authors found survey items from previous literature that were used across
multiple studies, and then determined whether those items contained elements of

40
attitudes, social norms, and self-efficacy. The final instrument was self-administered,
took about 20 minutes to complete, and was scored based on a five point Likert Scale.
The factor analysis of this scale was based on 3,989 people ages 18-24. Twenty-two
items were retained in the final analysis, and the subscales showed a Cronbach’s alpha
between 0.76 and 0.89. Survey items for the survey (IBCU) in the proposed study were
based on these final items, but modified to reflect birth control methods, not just condom
use.
In contrast, The Fog Zone Survey was based on survey questions used by the
National Survey of Family Growth (Kaye et al., 2009). No factor analysis of the NSFG
instrument has been conducted. The Fog Zone survey questions used a theoretical model
more similar to the Theory of Planned Behavior, and not the integrated behavioral model.
Some questions in the survey assessed knowledge with a true/false response format,
while others used a Likert scale format.
To validate the survey questions derived from the survey on condom use and the
Fog Zone Survey, and to ensure readability, a first draft of the survey was presented to
four content experts and ten young women. This procedure for instrument development
using IBM is recommended by Montano and Krasprzyk (2008). Feedback from pilot
study participants and content experts was used to edit the survey to reflect relevant
suggestions and address concerns. Participants were able to complete the survey in
approximately 20 minutes.
Theoretical model. This research is based on the integrated behavioral model
(IBM). Basically, IBM posits that a small number of variables can explain a substantial
proportion of the variance in any behavior in any population (Fishbein, 2008; Yzer,

41
2012). Additionally, behavior follows from specific attitudes people hold about the
behavior. Attitudes about the specific behavior are reasonable, but not always rational or
even accurate. The best predictor of behavior is a person’s intention to perform that
behavior. If someone intends to perform a behavior, IBM predicts they will do so,
provided they have the necessary skills and abilities, and provided environmental factors
do not interrupt their performance of the behavior. A person’s intention to perform the
behavior is determined by their attitudes toward the behavior, perceived norms regarding
the behavior, and self-efficacy regarding the behavior. In IBM, attitude refers to how
favorable or unfavorable a person believes his or her performing the behavior would be.
Perceived norm refers to the social pressure one feels to perform the behavior. Social
pressure regarding the behavior refers to whether important people value the behavior
and whether peers are actually performing the behavior, as well. Finally, self-efficacy
consists of an individual’s beliefs about whether they are able to perform the behavior,
regardless of their actual competence. Background factors, such as socio-economic
status, relationship factors, and education predict attitudes, perceived norms, and self-
efficacy. Please see the theoretical model in Figure 1.

42
Figure 1. The Integrated Behavioral Model
Background questions. To determine whether a participant is eligible for
this study, a series of background questions will be asked: gender; age; and, is the
participant planning a pregnancy. Eligible participants will be women between the ages
of 18-24, who are not planning a pregnancy. Additional background questions pertain to
reproductive and sexual history: is the participant sexually active with men; pregnancy
ambivalence; level of engagement in sexual activity; and any previous unintended
pregnancies. Participants may choose more than one racial/ethnic identity from the
following: American Indian or Alaskan native; Asian; Black or African American; Native
Hawaiian or Other Pacific Islander; White; Hispanic or Latino. Rural residence was
determined based on where the participant spent their childhood, based on the US Census
Bureau definition of rural and urban (United States Census Bureau, 2013). Socio-
Attitude: expected consequences
from the performing the behavior;
knowledge about performing the
behavior; and beliefs about the
behavior.
Perceived norms regarding the
behavior: what important others
expect me to do regarding this
behavior; and whether important
others perform this behavior.
Self-efficacy: belief in ability to
perform the behavior and overcome
obstacles to performing the
behavior.
Intention to perform
the behavior.
Behavior
Environmental
Factors
Competence:
skills and
abilities

43
economic status will be determined by asking participants (who are students) whether
they work to help pay for college, are a full time student, have health insurance that pays
for birth control, and whether their parents help pay for their college.
Dependent variables. There are two dependent variables: current contraceptive
use, and intended contraceptive use. Current contraceptive use will be measured with
two questions: “Last time you had sex (penis in vagina) did you use birth control?” and
“When you have sex, do you keep the man’s penis away from your vagina to prevent
pregnancy?” Intent to use contraception will be measured with the question “Do you
intend to be protected from pregnancy the next time you have sex?” These questions are
unique to this survey. Participants will respond to these questions by answering yes/no.
Independent variables. There are three independent variables for each of the
two dependent variables: intended contraceptive use and reported contraceptive use.
Attitudes, perceived norms, and self-efficacy predict intended contraceptive use.
Attitudes toward the behavior of contraceptive use will be measured by eight
items: three items are taken from Pratte, et al., (2010); one item is taken from Kaye, et al.
(2009); and four items are unique to this survey. Responses to all eight items are in a
Likert scale format, with higher scores indicating more agreement with the statement.
Face validity on these items was determined by expert review and review by 10 women
in the 18-25 age group. Please see Table 3.1: Constructs and their Measures.
Perceived norms will be measured by 13 items: six items are taken from Pratte,
et al., (2010); and, seven items are taken from Kaye, et al. (2009). Responses to all 13
items are in a Likert scale format, with higher scores indicating more agreement with the

44
statement. Face validity on these items was determined by expert review, and review by
10 women in the 18-25 age group.
Self-efficacy will be measured with six items: four items are taken from Pratte, et
al., (2010); and two items are unique to this survey. Responses to all six items are in a
Likert scale format, with higher scores indicating more agreement with the statement.
Face validity on these items was determined by expert review, and review by 10 women
in the 18-25 age group.
Competence, environmental factors, and intention predict reported contraceptive
use. Please see Figure 1. Competence and environmental factors are measured with
statements answered by a five point Likert scale, requiring the participant to choose how
much the statement represents their views and experiences. Higher scores on each item
indicates more agreement with the statement. Competence is measured with two items:
one taken from Kaye, et al. (2009); and one that is unique to this survey. Environmental
factors are measured with three items: two are taken from Kaye, et al. (2009); and one is
unique to this survey. Table 3.1: Constructs and their Measures, identifies instrument
items that measure all dependent and independent variables, and the source of those
items.
The survey, Influences on Birth Control Use, is attached in Appendix A.

45
Table 3.1
Constructs and their Measures
Construct Type of
variable
Measure
Background
variables
1. If yes to have you ever been pregnant, how
many pregnancies were a surprise? 3
2. Thinking about the last four weeks, how
many times have you had sexual intercourse
with a male in the past four weeks?4
3. How many males have you had sexual
intercourse with in the past 12 months? 4
4. Thinking about your life right now, how
important is it to avoid becoming pregnant?2
Attitude
toward
Contraceptive
Use
Independent 1. How likely is it that you would enjoy sex
more if you were using birth control?3
2. How likely is it that you would be protected
from pregnancy if you were using birth
control?1
3. How likely is it that using birth control
would be safe for you?1
4. How likely is it that you would feel good if
you used birth control? 3
5. How likely is it that birth control is healthy
for you? 3
6. How likely is it that using birth control
would ruin the sexual mood? 1
7. How likely is it that using birth control is
harmful to you? 3
8. Preventing pregnancy with birth control is
morally wrong.2
1Pratte, et al., 2010;
2 Kaye, Suellentrop, & Sloup, 2009;
3Unique to this survey;
4
National Survey of Family Growth, Section E, 2008

46
Table 3.1 Continues.
Construct Type of
variable
Measure
Perceived
Norms
Independent 1. How likely is it that your partner would be
happier knowing birth control was used in your
relationship? 1
2. How likely is it that your partner would be
angry if you told him you were using birth
control? 1
3. How likely is it that your partner would think
you were having sex with another person if you
were using birth control? 1
4. How likely is it that your partner would leave
you if you said you had to use birth control? 1
5. How likely is it your partner would refuse to
have sex if you said you wanted to use birth
control? 1
6. In a sexual relationship, the woman decides
whether or not to use birth control. 2
7. In a sexual relationship, the man decides
whether or not the woman uses birth control.2
8. In a sexual relationship, the man and woman
decide together whether or not to use birth
control. 2
9. How important is it that your peers use
condoms in one-night flings/stands?1
10. How important is it that people like you use
birth control to prevent pregnancy? 2
11. How important is it that people like you
always have birth control available during the
next month? 2
12. How important is it that people like you plan
a pregnancy with a committed partner? 2
13. My parents believe I should use birth control
to prevent pregnancy. 2
1Pratte, et al., 2010;
2 Kaye, Suellentrop, & Sloup, 2009;
3Unique to this survey;
4
National Survey of Family Growth, Section E, 2008

47
Table 3.1 Continues.
Construct Type of
variable
Measure
Self-efficacy Independent
Variable
1. How likely are you to have problems with
birth control? 3
2. How confident are you that you could
discuss using birth control with your partner? 1
3. How confident are you that you could
suggest using birth control to prevent pregnancy?1
4. How confident are you that you could use
birth control without having it break the sexual
mood?1
5. How confident are you that you could use
birth control correctly?1
6. How confident are you that you could
handle any problems with your birth control? 3
Competency Independent
variable
1. How likely is it that using birth control
would be easy for you? 3
2. I have used birth control correctly in the
past. 2
3. I can handle side effects from birth control. 3
Environmental
factors
Independent
variable
1. Do you use alcohol or other substances
before you have sex? 3
2. Birth control is affordable for me. 2
3. Birth control is affordable for my peers. 2
4. I can get birth control when I want to. 3
Intent to use
contraception
Independent
and
Dependent
1. Do you intend to be protected from
pregnancy the next time you have sex? 2
Reported use
of
contraception
Dependent
variable
1. Last time you had sex (penis in vagina) did
you use birth control? 3
2. When you have sex, do you keep the
man’s penis away from your vagina to prevent
pregnancy? 3
1Pratte, et al., 2010;
2 Kaye, Suellentrop, & Sloup, 2009;
3Unique to this survey;
4
National Survey of Family Growth, Section E, 2008

48
Data Analysis
Participants completed a paper and pencil survey, then data was entered into
Qualtrics Survey Software, and exported to IBM SPSS GradPack v.20 for data analysis.
Descriptive statistics were calculated to describe the background variables of participants
overall and separately for College 1 and College 2 participants. Factor analysis of the
questionnaire was conducted to determine whether items from Influences on Birth
Control Use reliably measured the independent variables in this research.
To address the first research question (what is the relationship between
attitudes, perceived norms, and self-efficacy and the intention to use contraception
correctly and consistently?), a hierarchical logistic regression analysis was conducted to
estimate and examine the relationship between independent variables and dependent
variables, while accounting for any possible significant covariates in the model. To
address the second research question (what is the relationship between intention to use
contraception correctly and consistently, competence, and environmental factors and
reported contraception behavior?) a hierarchical logistic regression analysis was
conducted to estimate and examine the relationship between independent and dependent
variables, while accounting for any significant covariates in the model.
ANOVA analyses was conducted to address the third research question (Do
background variables (age, engagement in sexual activity, previous UIP, pregnancy
ambivalence, ethnicity, rural vs. urban, and socio-economic status) contribute to intention
to use contraception and reported contraception use over and above the independent
variables (attitudes, perceived norms, self-efficacy, competence, and environmental
factors). Chi-square tests were used to study the association between background

49
variables and intention to use contraception and reported contraceptive behavior. Mean
responses to the questionnaire were calculated and statistically significant differences in
responses were determined based on background data, including: socio-economic status,
ethnicity, rural vs. urban residence, pregnancy ambivalence, engagement in sexual
activity, previous UIP, campus location, and reported age. Please see the summary of
statistical tests and research questions presented in Table 3.2: Analysis Plan for Research
Questions.
Table 3.2
Analysis Plan for Research Questions
Research
Question
Independent
Variables
Dependent
Variable
Analysis
Plan
Do the items on
IBCU reliably
measure the
independent
variables? Which
factors contribute
to the most
variance in
intention to use
contraception and
reported
contraception
use?
Exploratory
factor
analysis and
Cronbach’s
alpha
What is the
relationship
between attitudes,
perceived norms,
and self-efficacy
and the intention
to use
contraception
correctly and
consistently?
Attitudes
Perceived
norms
Self-efficacy
Intention to use
contraception.
Logistic
regression

50
Table 3.2 Continues.
Research
Question
Independent
Variables
Dependent
Variable
Analysis
Plan
What is the
relationship
between intention
to use
contraception,
competence, and
environmental
factors and
reported
contraception
behavior?
Intent to use
contraception
Competence
Environmental factors
Reported
contraception
behavior.
Logistic
regression
What is the
relationship
between
background
variables (age,
ethnicity, rural
vs. urban,
engagement in
sexual activity,
previous UIP,
pregnancy
ambivalence and
socio-economic
status)
and
the independent
variables
(attitudes,
perceived norms,
self-efficacy,
competence,
environmental
factors)
and
Intent to use
contraception and
reported
contraceptive
behavior?
Background variables
1. age,
2. ethnicity,
3. rural vs. urban
childhood,
4. engagement in
sexual activity,
5. pregnancy
ambivalence,
6. previous UIP and
7. Socio-economic
status.
Attitude
Perceived norms
Self-efficacy
Competence
Environmental
factors
Intention to use
contraception
Reported
contraceptive
behavior
ANOVA
analysis and
Chi-square
test

51
Procedures for Data Collection
To recruit participants at both colleges, the researcher set up a table in a common
area. Participants were offered a chance to win one of four iPad Mini’s. Women
interested in participating completed the survey on paper. Recruited participants wrote
their e-mail address on a ticket stub, and took home the matching ticket stub. The ticket
stub number did not reflect any link to the survey the participant completed. Winning
participants were contacted by e-mail.
Protection of Human Subjects
Institutional Review Board approval from University of Missouri-Kansas City,
Social Sciences and University of Missouri, Columbia, Health Sciences Review Board
was obtained prior to beginning data collection. Please see Appendices E and F. The
Vice Provost at College 1 approved participation in this research, once IRB approval at
University of Missouri, Kansas City (UMKC) was secured. Please see Appendix D.
To protect human subjects, participants read an information page that contained
all the elements of informed consent, as the first page of the survey. Please see Appendix
B. No identifying information was collected with the survey. After reading the
information page, if the woman chose to complete the survey, her consent was implied.
Responses by participants were entered into Qualtrics, an encrypted secure site. Paper
copies of the surveys were stored in a locked file cabinet and will be shredded once this
dissertation is completed.

52
CHAPTER 4
RESULTS
This chapter details the results of the statistical analysis of the participants’
responses to the survey Influences on Birth Control Use. The demographic
characteristics of the sample will be presented, and the variables of interest will be
described. Finally, the results of the statistical analysis of each of the four research
questions will be described.
Participants’ Characteristics
Describing the participants’ background characteristics at the two colleges shows
that the sampling strategy of using the two colleges broadened the population of college
women that was studied. Important differences in background characteristics of
participants were identified by using a chi square test to compare the background and
demographic characteristics based on the college a participant attended. However, which
college a participant attended was not included as a background variable when the
research question statistics were calculated.
Of the 270 participants, 268 were between the ages of 18 and 22; one participant
was 23, and another was 24 years old. College 1 students had a mean age of 19 (95%
CI=18.82-19.18, SD=1.079); 46 (35.9%) were freshmen and 65 (50.8%) participants
were sophomores. In comparison, College 2 students had a mean age of 19.9 years
(95%CI=19.73-20.09, SD=1.068). Seventy-seven (57.0%) College 2 participants were
sophomores, while 20 (14.8%) were juniors. These numbers were statistically different
(p<0.001). Overall, 198 (73.3%) women identified their ethnicity as “Caucasian”, while

53
41 (15.2%) were African American, 6 (2.2%) were Asian, 6 (2.2%) identified as Latino
or Hispanic. Sixteen participants (5.9%) identified with more than one ethnic group. At
College 1, 102 (75.6%) women identified as Caucasian; 16 (11.9%) participants
identified as African American; four (3.0%) identified as Asian; and four (3.0%)
identified as Hispanic or Latina. Seven participants at College 1 identified as more than
one ethnicity. At College 2, 96 (71.1%) identified as Caucasian; 25 (18.5%) identified as
African American; two (1.5%) identified as Asian; and two (1.5%) identified as Hispanic
or Latina. Nine (6.7%) participants at College 2 identified as more than one ethnicity.
There were no significant differences in ethnicity when compared with a chi square test
(p=0.345). There was a significant difference in the hometown locations of participants
from the two colleges (p<0.001). At College 1, 42 (31.6%) participants were from a rural
area, while at College 2, only 13 (9.7%) were from a rural area.
For the variable “having expenses paid by parents”, a proxy for economic
support, 62 (47.3%) participants at College 1 reported that their parents paid none of their
college expenses, while 32 (24.4%) reported their parents paid less than one-third.
Among College 2 participants, 22 (26.2%) reported their parents paid none of their
college expenses and 26 (19.3%) reported less than one-third of their college expenses
were paid. These differences were statistically significant (p<0.001). A second indicator
of economic support was that the majority (94/70.7%) of College 1 participants reported
working while in school; fewer College 2 participants reported working while in school,
(69/53.9%). These differences too were statistically significant (p=0.004). A final source
of economic support, health insurance that paid for birth control, was reported by 80
(66.1%) of College 1 participants and by 113 (85.6%) of College 2 participants. This
54
difference was statistically significant (p<0.001). Please see Table 4.1: Characteristics of
Sample.
There were statistically significant differences in sexual activity and pregnancy
prevention reports between College 1 and College 2. Among College 1 participants, 70
(52.6%) reported they were currently sexually active with men, and 91 (67.4%) College 2
participants reported they were currently sexually active with men. These numbers were
statistically different (p=0.009). Ninety-one (67.9%) participants from College 1 reported
contraceptive use, while 105 (77.8%) participants from College 2 reported contraceptive
use. These numbers were statistically different (p=0.046).
Many characteristics were not statistically significantly different between the
participants at the two colleges. At College 1, 120 participants (44.9%) intended to use
contraception the next time they had sex; and at College 2, 129 (48.3%) intended use.
There was no statistically significant difference in these numbers (p=0.102). Of the 18
women who did not intend to be protected from pregnancy, some wrote comments on the
survey indicating they were not sexually active, so there was no need to be protected
from pregnancy.
There was no difference between the two colleges in the number of male partners
reported in the previous 12 months. Overall, 92 (34.2%) women reported no male
partner; 107 (39.8%) women reported one male partner; 47 (17.5%) reported two or three
male partners; and 23 (8.5%) reported four or more male partners. There was no
difference in the number of participants that reported they were in a committed
relationship with a man (N=112, 41.5%). Finally, 93.3% of participants agreed that
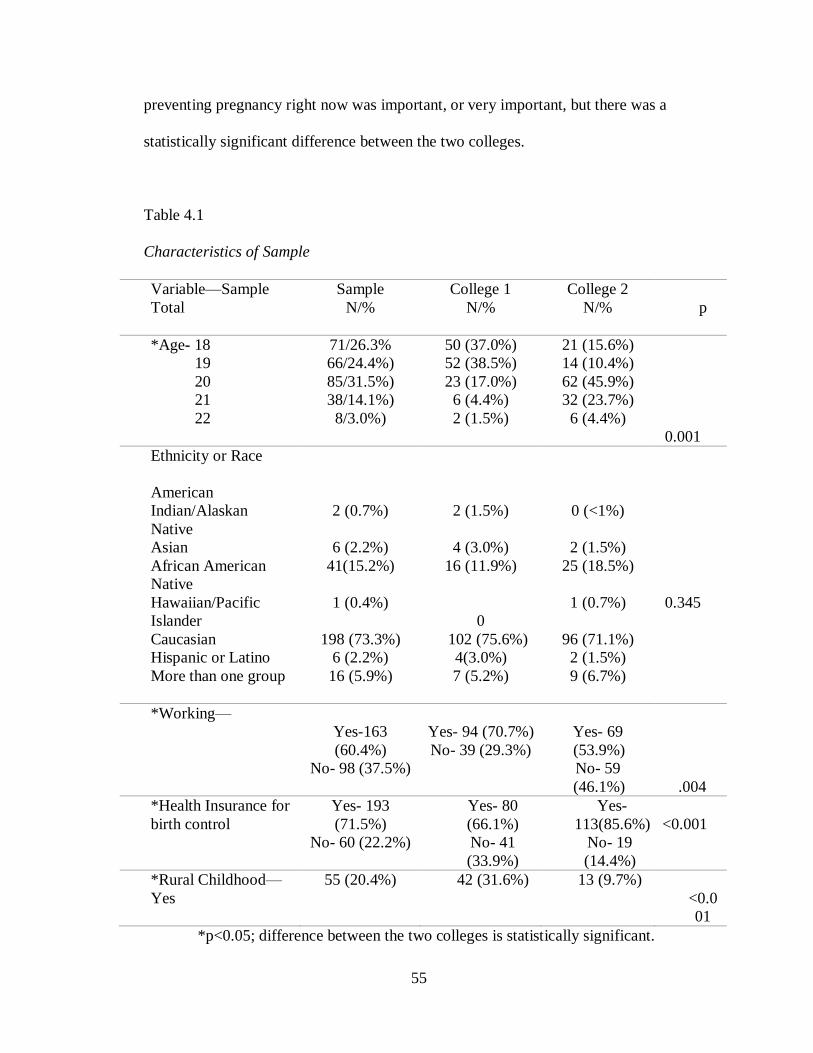
55
preventing pregnancy right now was important, or very important, but there was a
statistically significant difference between the two colleges.
Table 4.1
Characteristics of Sample
Variable—Sample
Total
Sample
N/%
College 1
N/%
College 2
N/%
p
p
*Age- 18
19
20
21
22
71/26.3%
66/24.4%)
85/31.5%)
38/14.1%)
8/3.0%)
50 (37.0%)
52 (38.5%)
23 (17.0%)
6 (4.4%)
2 (1.5%)
21 (15.6%)
14 (10.4%)
62 (45.9%)
32 (23.7%)
6 (4.4%)
<
0.001
Ethnicity or Race
American
Indian/Alaskan
Native
Asian
African American
Native
Hawaiian/Pacific
Islander
Caucasian
Hispanic or Latino
More than one group
2 (0.7%)
6 (2.2%)
41(15.2%)
1 (0.4%)
198 (73.3%)
6 (2.2%)
16 (5.9%)
2 (1.5%)
4 (3.0%)
16 (11.9%)
0
102 (75.6%)
4(3.0%)
7 (5.2%)
0 (<1%)
2 (1.5%)
25 (18.5%)
1 (0.7%)
96 (71.1%)
2 (1.5%)
9 (6.7%)
=
0.345
*Working—
Yes-163
(60.4%)
No- 98 (37.5%)
Yes- 94 (70.7%)
No- 39 (29.3%)
Yes- 69
(53.9%)
No- 59
(46.1%)
0
.004
*Health Insurance for
birth control
Yes- 193
(71.5%)
No- 60 (22.2%)
Yes- 80
(66.1%)
No- 41
(33.9%)
Yes-
113(85.6%)
No- 19
(14.4%)
<0.001
*Rural Childhood—
Yes
55 (20.4%) 42 (31.6%) 13 (9.7%) P
<0.0
01
*p<0.05; difference between the two colleges is statistically significant.

56
Table 4.1 Continues.
Variable—Sample Total
Sample
N/%
College 1
N/%
College 2
N/%
p
Committed
Relationship with a
man
Time in Relationship:
<4mos……18 (16.4%)
<1year …..29 (26.4%)
≥1year …..63 (57.3%)
Yes=112
(41.5%)
No=155
(58.1%)
Yes- 56
(41.8%)
No-78
(58.2%)
Yes- 56
(42.1%)
No- 77
(57.9%)
P=0.529
*Currently Sexually
Active
Yes- 161
(59.6%)
No-107 (39.6%)
Yes- 70
(52.6%)
No- 63
(47.4%)
Yes- 91
(67.4%)
No- 44
(32.6%)
P=0.009
Number of male
partners past 12 mos.
None
One
Two or Three
Four or more
92(34.2%)
107(39.8%)
47 (17.5%)
23 (8.5%)
52 (19.3%)
55 (20.4%)
19 (7.0%)
8 (3.0%)
40 (14.9%)
52 (19.3%)
28 (10.4%)
15 (5.6%)
P=0.066
*Sexual Intercourse
previous 4 weeks
0
3 or more
136 50.9%)
91 (34.1%)
79 (59.4%)
37 (27.8%)
57 (42.5%)
54 (40.3%)
P=0.039
*p<0.05; difference between the two colleges is statistically significant.

57
Table 4.1 Continues
Variable—Sample Total
Sample
N/%
College 1
N/%
College 2
N/%
p
Intends to use
(BC)
Yes…
No….
249 (92.2%)
18 (6.7%)
120(44.9%)
12(4.5%)
129 (48.3%)
6 (2.2%)
0
.102
*Uses BC Yes-
196(72.6%)
No-
73(27.0%)
Yes- 91 (67.9%)
No- 43 (32.1%)
Yes-
105(77.8%)
No- 30
(22.2%)
P
=0.0
46
BC Use is Immoral
Definitely
false- 194
(71.9%)
Probably false-
31 (11.5%)
Not sure-
15 (5.6%)
Probably true-
16 (5.9%)
Definitely true-
11 (4.1%)
90 (33.7%)
16 (6.0%)
10 (3.7%)
9 (3/4%)
8 (3.0%)
104 (39.0%)
15 (5.6%)
5 (5.6%)
7 (2.6%)
3 (1.1%)
P
=0.2
65
*p<0.05; difference between the two colleges is statistically significant.

58
Table 4.1 Continues.
Variable—Sample Total
Sample
N/%
College 1
N/%
College 2
N/%
p
*Avoiding pregnancy
(ambivalence)
Not at all
important-
4 (1.5%)
Not too
important-
4 (1.5%)
Not Sure-
13 (4.8%)
Very
Important-
20 (7.4%)
Extremely
Important-
229 (84.8 %)
3 (1.1%)
3 (1.1%)
11 (4.1%)
13 (4.8%)
105 (38.9%)
1(0.4%)
1 (0.4%)
2 (0.7%)
7 (2.6%)
124 (45.9%)
0
.021
Number of Pregnancies
None-
256 (94.8%)
One
10 (3.7%)
Two or more
1 (0.4%)
123 (46.1%)
8 (6.1%)
1 (0.4%)
133 (49.8%)
2 (0.7%)
0
P
0.084
*p<0.05; difference between the two colleges is statistically significant.

59
Research Question One: Do the items on IBCU reliably measure the independent
variables?
Principal factor analysis with oblique rotation was conducted to assess the
underlying structure of the variables in the Influences on Birth Control Use Scale. The
assumption of independent sampling was met. The Kaiser-Meyer Olkin measure of
sampling adequacy was 0.862, indicating sufficient items for each factor. The Bartlett’s
test of sphericity was significant (<0.001), indicating the correlations between the items
were high enough to warrant a factor analysis. Five factors were requested to reflect the
five theoretical factors:
Attitudes toward contraceptive use,
Social norms about contraceptive use,
Perceived control over contraceptive use,
Competency around contraceptive use, and
Environmental factors regarding birth control use.
The initial factor analysis with oblique rotation showed eight factors with
eigenvalues above 1.0. Therefore, the scree plot was examined, which showed a
flattening of the line at four factors. Please see Figure 2. Because five factors were in the
theoretical model (integrated behavioral model) the fourth and fifth factors were included
in the data reduction process, whereas the sixth through eighth factors were not.

60
Figure 2. Scree Plot of Factor Analysis

61
Table 4.2
Exploratory Factor Analysis of IBCU
Item Attitude Self-efficacy Perceived Norms Competency Environ-
mental
factors
Attitude
Partner
happier
knowing
contraception
used.1
0.976
Enjoy sex
more3
0.817
Important that
others use
contraception2
0.717
Feel good
using
contraception3
0.682
Easy to use
contraception3
0.612
Safe to use
contraception1
0.551
Important to
have
contraception
available.2
0.520
Contraception
prevents
pregnancy1
0.517
Source of questions:
1Pratte, et al, 2010;
2Kaye, Suellentrop, & Sloup, 2009;
3Unique to this survey;
4National Survey of Family Growth, Section E, 2008

62
Table 4.2 Continues.
Item Attitude Self-
efficacy
Perceived
Norms
Competency Environmental
factors
Self-Efficacy
Contraception
preserves sexual
mood1
0.954
Can use
contraception
correctly1
0.924
Can suggest
condom use?1
0.799
Can discuss
contraception1
0.671
Can handle
problems with
contraception3
0.651
Can suggest
contraception1
0.512
Perceived norms
Partner leave1
0.845
Partner think
cheating1
0.756
Contraception ruins
sexual mood1
0.738
Partner refuse sex1
0.718
Partner angry1
0.706
Source of questions:
1Pratte, et al, 2010;
2Kaye, Suellentrop, & Sloup, 2009;
3Unique to this survey;
4National Survey of Family Growth, Section E, 2008

63
Table 4.2 Continues.
Item Attitude Self-
efficacy
Perceived
Norms
Competency Environ
-mental
factors
Competency
Contraception
problems likely3
-0.897
Contraception likely
harmful3
-0.831
Contraception likely
healthy3
0.526
Environmental
Factors
Contraception
affordable for me2
0.809
Contraception
affordable peers2
0.735
Source of questions:
1Pratte, et al, 2010;
2Kaye, Suellentrop, & Sloup, 2009;
3Unique to this survey;
4National Survey of Family Growth, Section E, 2008
The first factor, attitude, measured positive outcomes from contraceptive use,
and had strong loadings on the first eight items. The second factor measured self-
efficacy, and had strong loadings on the next six items in Table 4.2. The third factor
measured perceived norms, and had strong loadings on the next five items. The fourth
factor, measured competency with contraception, and had strong loadings on the next
three items. The fifth factor, environmental factors, which measured cost for self and
others, had strong loadings on the last two items.
64
Composition of the Scales
Participants chose the score to each item on IBCU by selecting an answer that
corresponded to between one and five on a Likert scale. Scores were then added on all
items within each scale. While this data represents an ordinal level of measurement, it is
common practice in social sciences to treat Likert scale measurement as interval data.
The rationale for this practice comes from the observation that attribute-type independent
variables exist on a continuum, rather than in discrete categories, therefore researchers
can analyze attribute measurements from Likert scales using parametric statistics
(Nunnally & Bernstein, 1994).
To assess whether adding together the eight items of the first factor, attitude,
formed a reliable scale with the current sample, Cronbach’s alpha was computed. The
alpha for the eight items was 0.867, indicating a scale with good internal consistency and
reliability. The range of total possible scores (from adding all eight items together) on
this scale was 8-40 points; a higher score indicated a more positive attitude toward
contraception. The mean score on the attitude scale was 34.7, which is negatively
skewed. The median score for the attitude scale is 37, and the mode is 40. Complete data
was obtained from 258 participants on the attitude scale.
The perceived norms scale consisted of five items. The Cronbach’s alpha for
these five items was 0.829, indicating a scale with good internal consistency and
reliability. The range of possible scores on this scale was 6-30 points; a lower score
indicated perceived norms that are more favorable toward contraception. The mean score
on the perceived norms scale was 6.5, the median was 5.0, and the mode was 5.0. The

65
results on this scale are positively skewed. Complete data was obtained from 264
participants on the perceived norms scale.
The self-efficacy scale consisted of six items. The Cronbach’s alpha for these six
items was 0.835 indicating a scale with good internal consistency and reliability. The
range of possible scores on this scale was 6-30 points; a higher score indicates more self-
efficacy regarding contraception. The mean of the self-efficacy scale was 27.3, while the
median was 29 and the mode was 30. These results are negatively skewed. Complete
data was obtained from 264 participants on the self-efficacy scale.
The competency scale had only three items. The Cronbach’s alpha for these three
items was 0.809, indicating a scale with good internal consistency and reliability. The
range of possible scores on this scale was 5-15 points; a higher score indicated more
competency with contraception. The mean score on the competency scale was 12.2, the
median was 13, and the mode was 15. The results are negatively skewed. Only 179
participants completed the data for the competency scale.
The environmental factors scale had only two items: birth control is affordable
for me; and birth control is affordable for my peers. The range of possible scores on this
scale was 2-10 points; a higher score indicates an environment that is more supportive of
contraceptive use. The mean score for environmental factors was 8.1, the median was
eight, and the mode was eight. Complete data was obtained on the environmental factors
from 268 participants.
The dependent variable, “use contraception” was scored as a yes, if a participant
answered any of the following three questions affirmatively: Last time you had sex did
you use birth control; when you have sex do you keep the man’s penis away from your

66
vagina to prevent pregnancy; and, last time you had sex, did you use a condom? Many
participants used more than one form of contraception. Birth control was used by 152
participants (67.3%); ejaculation outside of the vagina was used by 57 (25.3%)
participants; and, condoms were used by 116 (53.5%) participants. Please see Table 4.3:
Scores on Dependent and Independent Variables of Interest.
Table 4.3
Scores on Dependent and Independent Variables of Interest
Variable Scale Entire
Sample
College 1
Mean
College 2
Mean
Significance
Independent Attitude Scale
Eight items
Mean: 34.7
Median: 37
Mode: 40
Std. Dev.:
6.1 Range: 29
Mean: 33.3 Mean: 36.6
P=0.003*
Perceived Norms
Five items
Mean: 6.5
Median: 5.0
Mode: 5.0
Std. Dev.:
2.9
Range:
20
Mean: 7.4
Mean:5.7
P=0.000*
Self-Efficacy
Mean: 27.3
Median: 29
Mode: 30
Std. Dev.:
27.3
Range: 21
Mean: 26.8
Mean: 27.7
P=0.909
Environmental Factors
Mean: 8.1 Median: 8
Mode: 8
Std. Dev.:
1.8
Range: 8
Mean: 8.0
Mean: 8.2
P=0.906
*Significant difference between the two colleges.

67
Table 4.3 Continues.
Variable Scale Entire
Sample
College 1
Mean
College 2
Mean
Significance
Independent
Competency Mean: 12.2
Median: 13
Mode: 15
Std. Dev.: 3.1
Range: 12
Mean: 12.1
Mean: 12.4
P=0.859
Dependent Intention to use
BC
Yes- 249
(93.3%)
No- 18 (6.7%)
Yes- 120
(44.9%)
No- 12 (4.5%)
Yes- 129
(48.3%)
No- 6 (2.2%)
P=0.102
Use BC Yes- 196
(72.9%)
No- 73
(27.1%)
Yes- 91
(33.8%)
No- 43 (16.0%)
Yes- 105
(39.0%)
No- 30 (11.2%)
P=0.046*
*Significant difference between the two colleges.
Research Question Two: What is the Relationship between Background Variables,
Independent Variables and Dependent Variables?
Research question two asks whether the background variables of:
Age,
Ethnicity
Rural childhood,
Currently sexually active,
Number of male partners,
Intercourse (amount in past four weeks),
Pregnancy prevention,
Work,
Health insurance for contraception,

68
And, expenses for college paid,
Were associated with the independent variables of:
Attitudes
Norms
Self-efficacy
Competency
And, environmental factors.
And, were the background factors described above associated with the dependent
variables:
Intention to use contraception,
And use of contraception.
ANOVA was conducted to determine whether attitudes, perceived norms, self-
efficacy, competency and environmental factors changed significantly based on the
background variables. The background variables were: age; ethnicity; rural childhood;
currently sexually active; previous pregnancy; number of male partners; intercourse in
past four weeks; work; health insurance; and expenses for college paid. Which college
the participant attended was not included as a background variable because different
colleges were chosen in order to increase the diversity of background factors among
participants. Findings are listed in Table 4.4.

69
Table 4.4
Results: ANOVA test of Background and Independent Variables (Mean and p value).
Background
Variable
Attitude toward
contraceptive use
Self-efficacy
regarding
contraceptive
use
Perceived
norms
toward
contraceptive
use
Competency
with contraceptive
use
Environmental
factors support
contraceptive
use
Age
18
19
20
21
22
23
24
34.4
34.3
35.8
34.3
29.6
0
32.0
p=0.116
26.4
27.6
27.8
27.5
25.0
30.0
30.0
p=0.097
6.9
6.7
6.0
6.0
8.8
5.0
7.0
p=0.098
12.3
13.1
11.9
12.0
10.6
7.0
4.0
p=0.014*
8.2
8.1
8.0
8.1
7.4
0
0
p=0.651
Ethnicity
American
Indian/
Alaskan
Native
Asian
African
American
Hawaiian/ Pacific
Islander
White
Latina
More than
one
31.5
37.2
34.9
37.0
34.4
36.5
36.1
(p=0.753)
25.0
25.8
28.2
30.0
27.1
27.2
28.0
(p=0.398)
7.0
7.2
6.5
5.0
6.4
7.2
7.1
(p=0.930)
4.0
14.3
11.9
12.2
12.2
13.5
13.2
(p=0.057)
6.0
7.7
8.8
8.0
8.0
8.2
7.8
(p=0.109)
*p<0.05, a significant association.

70
Table 4.4 Continues.
Background
Variable
Attitude toward
contraceptive
use
Self-efficacy
regarding
contraceptive
use
Perceived
norms
toward
contraceptive
use
Competency
with
contraceptive
use
Environ
mental
factors
support
contracep
tive use
Health
Insurance
yes—35.7
no—33.3
p=0.004*
yes—27.6
no—26.8 p=0.080
yes—6.4
no—6.3 p=0.719
yes—12.5
no—11.7 p=0.151
yes—8.4
no—7.2
p<0.001*
Current Sex
Act.
yes—35.9
no—32.6
p<0.001
yes—28.1
no—25.8
p<0.001
yes—6.0
no—7.1
p=0.001
yes—12.3
no—12.1
p=0.667
yes—8.2
no—7.8
p=0.074
Ever pregnant none-34.7
once-35.8
twice or >-37.0
p=0.811
none-27.2
once-28.0
twice or >-30.0
p=0.607
none-6.5
once-6.9
twice or >-9.0
p=0.598
none-12.3
once-8.5
twice or >-0
p=0.003*
none-8.1
once-7.6
twice or
>-8.0
p=0.678
Episodes of sex in the past four
weeks
0—33.3 1—34.1
2—37.0
3+--36.2
p=0.001*
0—26.6 1—27.1
2—27.4
3+--28.3
p=0.005*
0—6.8 1—6.4
2—5.8
3+--6.2
p=0.215
0—3.3 1—2.5
2—3.6
3+--2.8
p=0.980
0—8.0 1—8.1
2—8.1
3+--8.2
p=0.760
Number of
partners in the
past 12 months
0—32.4
1—35.8
2—34.5
3—37.6
4—33.8
5+--35.2
p=0.001*
0—25.9
1—28.2
2—27.9
3—28.1
4—25.9
5+--27.4
p<0.001*
0—7.0
1—6.2
2—5.7
3—5.7
4—7.1
5+--8.3
p=0.031*
0—12.1
1—12.2
2—11.8
3—13.4
4—11.8
5+--12.3
p=0.734
0—7.7
1—8.1
2—8.1
3—9.0
4—8.3
5+--8.4
p=0.044*
*p<0.05, a significant association
Participants who were 18 and 19 years old reported higher scores on the
competency scale than older participants. Higher scores represent increased competency.
Participants with health insurance reported more favorable attitudes toward birth control
use, than those without health insurance (p=0.004). Participants who were currently
sexually active reported more favorable attitudes toward birth control use (p<0.001),

71
improved self-efficacy regarding birth control use (p<0.001), and more favorable
perceived norms regarding birth control use (p=0.001) than participants who were not
sexually active currently. Participants who reported at least one pregnancy reported
lower scores on the competency scale with birth control use than women who reported
no pregnancies (p=0.003).
The amount of sexual activity a respondent engaged in was associated with
significant changes in attitudes, perceived norms, self-efficacy, competency, and
environmental factors. Participants who reported no sexual intercourse in the past four
weeks had less favorable attitudes toward birth control use than women who reported one
episode of sexual intercourse; in turn, women with one episode of sexual intercourse
reported less favorable attitudes toward birth control use than women who reported two
episodes of sexual intercourse. Participants who reported two or more episodes of sexual
intercourse had the most favorable attitudes toward birth control use (p=0.001) and
reported more favorable environmental factors (decreased cost) (p=0.002). Finally,
women with one or more sexual partners in the past twelve months had more favorable
perceived norms (p=0.021), and fewer environmental impediments to contraceptive use
(p=0.003).
Chi square tests were calculated to determine the relationship between
background variables and the dependent variables: intent to use contraception and
reported contraceptive use. Findings are listed in Table 4.5. The more college expense
parents paid for, the more likely participants were to report they intended to use
contraception (p=0.008). Participants from a rural area were less likely to report they
intended to use contraception than participants from an urban area (p=0.006). As age

72
increased, the number of participants who reported contraceptive use increased
(p=0.049). Similarly, health insurance that paid for contraception (p<0.001) and being
sexually active (p<0.001) were both associated with higher rates of reported
contraceptive use. Participants who reported alcohol use with sexual activity were more
likely to also report contraceptive use (p=0.030). Finally, participants in a committed
relationship (p<0.001), participants reporting more sexual activity in the past four weeks
(p<0.001), and participants reporting one or more male partners (p<0.001) were all more
likely to report contraceptive use.
Table 4.5
Results: Chi Square test of Background and Dependent Variables (p value)
Background Intends Contraception Use Contraception
Age
18
19
20 21
22 or older
67 (25.1%)
60 (24.1%)
79 (31.7%) 35 (14.1%)
8 (3.2%)
p=0.95
45(24.5%)
48 (24.5%)
72 (36.7%) 25 (12.8%)
6 (3.0%)
P=0.049*
Ethnicity
American
Indian/Alaskan
Native
Asian
African American
Hawaiian/Pacific
Islander
White
Latina
More than one
2 (0.8%)
6 (2.4%)
38 (15.3%)
1 (0.4%)
182 (73.1%)
5 (2.0%)
15 (6.0%)
P=0.951
1 (0.5%)
3 (1.5%)
30 (15.3%)
1 (0.5%)
144 (73.5%)
4 (2.0%)
13 (6.6%)
P=0.786
*Significant association between background variable and dependent variable.
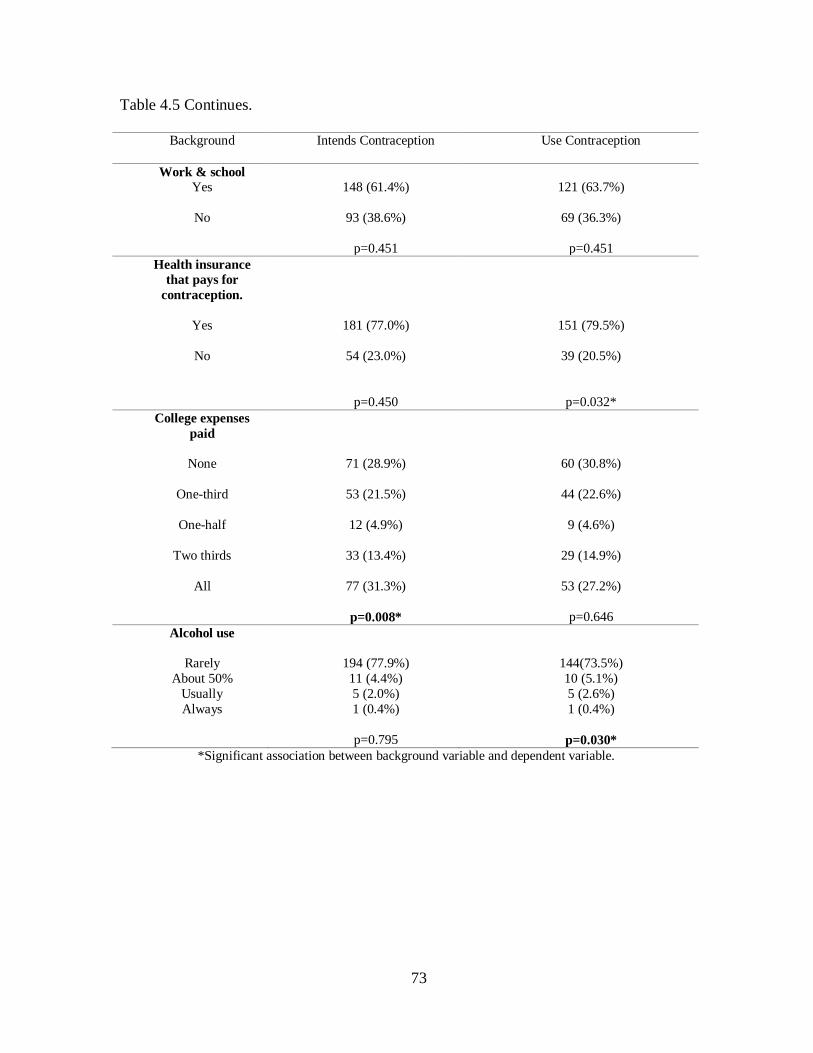
73
Table 4.5 Continues.
Background Intends Contraception Use Contraception
Work & school
Yes
No
148 (61.4%)
93 (38.6%)
p=0.451
121 (63.7%)
69 (36.3%)
p=0.451
Health insurance
that pays for
contraception.
Yes
No
181 (77.0%)
54 (23.0%)
p=0.450
151 (79.5%)
39 (20.5%)
p=0.032*
College expenses
paid
None
One-third
One-half
Two thirds
All
71 (28.9%)
53 (21.5%)
12 (4.9%)
33 (13.4%)
77 (31.3%)
p=0.008*
60 (30.8%)
44 (22.6%)
9 (4.6%)
29 (14.9%)
53 (27.2%)
p=0.646
Alcohol use
Rarely
About 50%
Usually
Always
194 (77.9%)
11 (4.4%)
5 (2.0%)
1 (0.4%)
p=0.795
144(73.5%)
10 (5.1%)
5 (2.6%)
1 (0.4%)
p=0.030*
*Significant association between background variable and dependent variable.

74
Table 4.5 Continues.
Background Intends Contraception Use Contraception
Rural childhood
Yes
No
47 (19.0%)
200 (81%)
p=0.006*
35 (18%)
159 (82.0%)
p=0.081
Episodes of sex in 4
wks.
0
1
2
3 or more
125 (50.8%)
16 (6.5%)
20 (8.1%)
85 (34.6%)
p=0.918
75 (38.9%)
16 (8.3%)
20 (10.4%)
82 (42.5%)
p<0.001*
*Significant association between background variable and dependent variable.
Research Question Three: What is the Relationship between Background Factors,
Independent Variables and the Intent to use Contraception?
To answer research question three (What is the relationship between attitudes,
perceived norms, and self-efficacy and the intent to use contraception correctly and
consistently?), logistic regression was conducted. The assumptions of observations that
were independent and independent variables that were linearly related to the logit score
were checked and met. Because the background variables rural childhood and expenses
for college paid were significantly associated with intent to use contraception, they were
entered in Step 1. The model was significant, chi-square = 17.042, df 2, and p<0.001,
N=243. Between six and 18.3% of the variance in intent to use contraception was

75
explained by this model. The Hosmer and Lemeshow test was not significant, indicating
the data fit the model.
With significant background variables controlled, the three independent variables
(attitude, perceived norms, and self-efficacy) were entered in Step 2. The model
significantly predicted whether or not a participant intended to use contraception, chi-
square = 29.47, df=5, n=261, p<0.001. The Hosmer and Lemeshow test was not
significant, indicating the data fit the model. Between 11.4% and 30.8% of the variance
was explained by this model. In the final model, attitude (p=0.001) and rural childhood
(p=0.020) were significant predictors of intention to use contraception. For each one
point increase in the total attitude score, the odds that a participant would not intend to
use contraception declined. If a respondent reported they had a rural childhood, the odds
that a participant did not intend to use contraception were lower. Please see Table 4.6.
Table 4.6
Odds ratio of Predictors of Intention to Use Contraception
Factor
Odds
Ratio
95% Confidence
Interval
Significance
Attitudes*
0.85 0.77 - 0.94 0.001*
Perceived Norms
0.961 0.79 – 1.18 0.704
Self-Efficacy
1.08 0.90 - 1.29 0.413
Rural childhood*
0.46 0.24 – 0.89 0.020*
Expenses for college paid
2.03 0.62-6.72 0.244
*P<0.05

76
Research Question four: What is the Relationship between Background factors,
Independent Variables and Contraceptive Use?
To answer research question four (What is the relationship between intention to
use contraception, competence, and environmental factors and contraceptive use?),
logistic regression was conducted, using data from 111 participants who reported one or
more sexual partners in the previous year. The assumption of observation independence
and linear relationship to the logit were checked and met. The following background
variables were entered in Step 1: age, health insurance, alcohol use with sex, and
intercourse amount in four weeks. The background variables do not predict whether a
participant reported contraceptive use: chi square= 7.08, df=4, p=0.131.
Next, with background variables controlled, three independent variables were
entered in Step 2: competency, environmental factors, and intent to use contraception.
This model significantly predicted whether or not a participant reported contraceptive
use, chi-square=14.81*, df=7, N=111, p=0.038. The Hosmer and Lemeshow Test was
not significant, indicating the data fit the model. This model predicted between 12.5%
and 26.2% of the variance in reported contraceptive use. Two variables significantly
predicted contraceptive use: intent to use contraception (p=0.011) and having health
insurance that paid for contraception (0.022). When participants reported they intended
to use contraception, they were 15 times more likely to report contraceptive use. When
participants reported they had health insurance that paid for contraceptive use, they were
six times more likely to report contraceptive use. Please see Table 4.7.
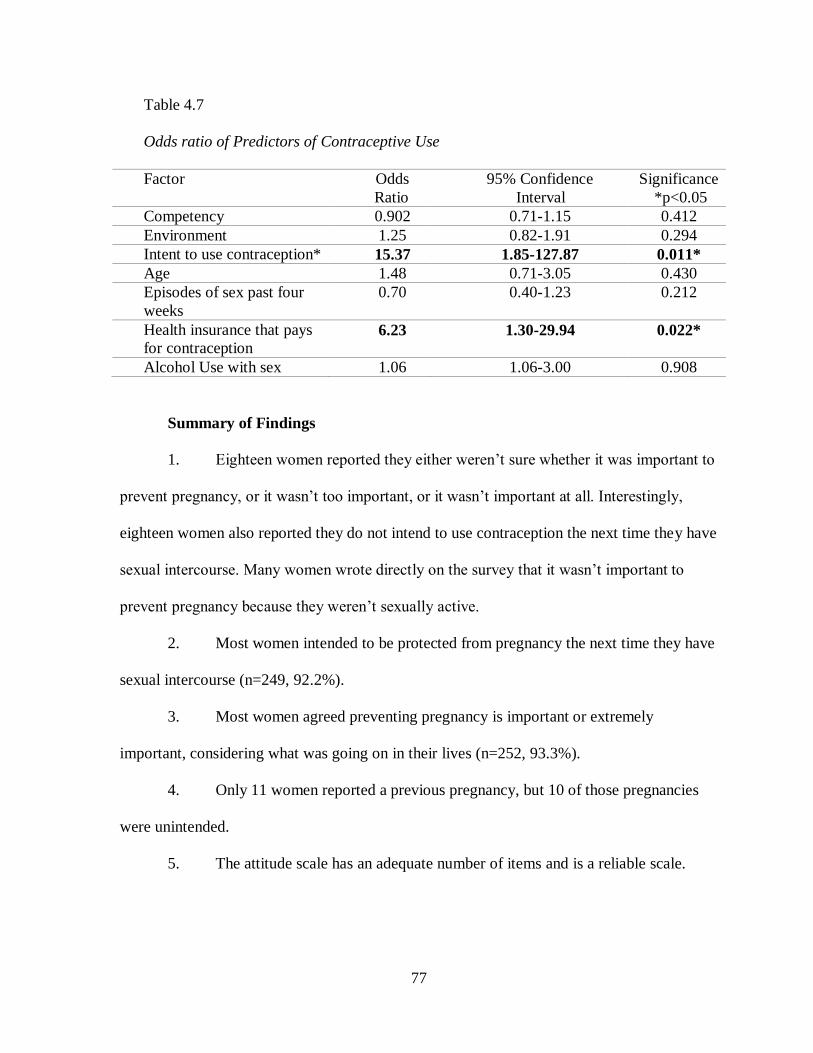
77
Table 4.7
Odds ratio of Predictors of Contraceptive Use
Factor Odds
Ratio
95% Confidence
Interval
Significance
*p<0.05
Competency 0.902 0.71-1.15 0.412
Environment 1.25 0.82-1.91 0.294
Intent to use contraception* 15.37 1.85-127.87 0.011*
Age 1.48 0.71-3.05 0.430
Episodes of sex past four
weeks
0.70 0.40-1.23 0.212
Health insurance that pays
for contraception 6.23 1.30-29.94 0.022*
Alcohol Use with sex 1.06 1.06-3.00 0.908
Summary of Findings
1. Eighteen women reported they either weren’t sure whether it was important to
prevent pregnancy, or it wasn’t too important, or it wasn’t important at all. Interestingly,
eighteen women also reported they do not intend to use contraception the next time they have
sexual intercourse. Many women wrote directly on the survey that it wasn’t important to
prevent pregnancy because they weren’t sexually active.
2. Most women intended to be protected from pregnancy the next time they have
sexual intercourse (n=249, 92.2%).
3. Most women agreed preventing pregnancy is important or extremely
important, considering what was going on in their lives (n=252, 93.3%).
4. Only 11 women reported a previous pregnancy, but 10 of those pregnancies
were unintended.
5. The attitude scale has an adequate number of items and is a reliable scale.

78
6. Sexual activity is associated with: (a) more favorable attitudes toward
contractive use; (b) a more supportive environment for contraceptive use; (c) and, less
negative perceived norms.
7. When parents paid a higher percentage of college expenses, a participant was
significantly more likely to intend to use contraception.
8. When a participant grew up in a rural area, they were significantly less likely
to intend to use contraception.
9. As age increased, participants were significantly more likely to report
contraceptive use.
10. Participants who reported alcohol use with sex were significantly more likely
to report contraceptive use.
11. Sexual activity was measured three ways: Are you currently sexually active?
How many times have you had sex in the past four weeks? And, how many male sex partners
have you had in the past year? Participants who were sexually active using any one of these
measures were significantly more likely to report contraceptive use.
12. For each one point decrease in a participant’s attitude scale score, participants
were more likely to report they did not intend to use contraception. The odds ratio was 0.15.
13. If a participant had a rural childhood, they were also more likely to not intend
to use contraception. The odds ratio was 0.54.
14. If a participant intended to use contraception, they were 15 times more likely
to report contraceptive use.
15. If a participant had health insurance that paid for contraception, they were six
times more likely to report contraceptive use.

79
CHAPTER 5
DISCUSSION
The Sample of Participants
Most young women from this sample intended to protect themselves from
pregnancy the next time they engaged in sexual activity (92.2%). This is a higher
number of women who intend to be protected from pregnancy than has been found by
other researchers (Frost, Finer, and Lindbergh, 2012). It is possible that even though
young women answered surveys in private, and had no identifying data on their surveys,
that this question was answered in order to appear socially acceptable to the researcher,
who was seated nearby. In other words, the Hawthorne effect could be responsible for
the high number of women participating in this survey who intend to prevent pregnancy.
But, it is also possible that this statistic is an honest reflection of the attitude of young
women who are enrolled in college. The sample of women who participated in this
research may actually be very highly motivated to avoid pregnancy in order to finish their
college studies. Other researchers have found a relationship between motivation to avoid
pregnancy and contraceptive use (Curtis, Evens, & Sambisa, 2012).
Sexual activity was associated with differences in attitudes, perceived norms,
self-efficacy, and environmental factors regarding birth control, in this survey. Attitudes
toward contraceptive use were more positive when respondents reported sexual activity.
Likewise, perceived norms regarding contraceptive use were more supportive when
respondents reported sexual activity. Negative impacts on attitudes and perceived norms
regarding contraceptive use occurred more frequently when respondents were younger,

80
reported less sexual activity, and were from a rural area. Experience with contraception
and sexual activity are factors that alter perceptions of contraceptive use among young
adults. These observed differences in attitudes, and perceived norms before and after
sexual activity reinforce how important sexuality education is prior to engaging in sex.
The most unfortunate consequence of inadequate education during the teen years is that
there is even less opportunity to receive contraceptive education as young adult women
(Kirby, 2009).
Young women in this sample reported sexual behavior that is remarkably similar
to sexual behavior reported by Willoughby in research that defined four sexual
experience categories of young adults (2012). Willoughby found that 21.8% of young
adults were confident abstainers from sexual activity who disapproved of pornography
and premarital sex. Seventeen percent of young adults were technical abstainers who
approved of pornography and pre-marital sex, but had very low rates of sexual behavior.
Young adults who abstained from sexual behavior were more likely to be younger than
those who engaged in sexual activity. In the current sample of young women, 34.2% of
young women reported no sexual activity in the past year. Like Willoughby’s sample,
these women tended to be younger. Young adults who were sexually active were
clustered into two categories by Willoughby: average engagers and high frequency
engagers. Average engagers were the largest group (36.9%), and usually had one partner
(1.18) in the past year. In this sample, average engagers were also the largest group, with
39.8% reporting one sexual partner in the past year. Willoughby’s high frequency
engagers (24.6% of his sample) reported the most sexual activity on all measures and had
an average of 2.32 partners in the past year. In this sample, women reporting two or more

81
sexual partners in the past year comprised 26% of the sample. In Willoughby’s research,
participants were assigned to a sexual experience group and then their attitudes toward
marriage were analyzed, based on that sexual experience group. Participants with the
most sexual experience indicated the highest levels of readiness for marriage. Participants
in this sample were not asked whether they were married.
The Survey Instrument
The factor analysis indicated that questions designed to measure different
independent variables, were in fact measuring different concepts. The scale used to
determine attitude toward birth control use could be pared down to eight questions, that
also had a high Cronbach’s alpha (0.867). Therefore, one can cautiously conclude the
measure used for attitude in this research was valid and reliable. Reservations about this
conclusion are described below.
Other scales were not as strong as the attitude scale. For example, the final
perceived norms scale only consisted of five items, indicating that important aspects of
perceived norms were not captured in this survey. Lacking an adequate measure of
perceived norms may explain why subsequent statistical analysis failed to show an effect
of perceived norms on intent to use contraception, and contraceptive use. Similarly, the
competency scale had only three items used in subsequent analyses, and the
environmental factors had only two. It is possible that significant background factors,
such as current sexual activity and rural childhood, may load as items on one of the
independent variable scales, if the questions had been designed so that they could be
included in the factor analysis. While other researchers have asked about sexual activity
on surveys, this is the first study to show that reported sexual activity is strongly

82
associated with contraceptive use among college women (Brunner Huber & Ersek, 2011).
Additionally, this is the first research study to show that having had a rural childhood
predicts one does not intend to use contraception, among college enrolled women.
While Nunally and Bernstein (1994) and Munro (2005) accept analyzing Likert
scale data as interval data, both authors also state that the data should have a normal
distribution. Scores on the subscales of the IBCU had very skewed distributions.
Therefore, it is imperative that the factor analysis on this survey be repeated, with a
broader sample of women before the survey or any of the scales are considered truly
valid.
Another important finding from this study is that parents did not influence
contraceptive use among young adult women. Campo, Askelson, Spies, and Losch,
(2010) found that focus group participants identified parents’ possible knowledge that
respondents were using contraception as a barrier to obtaining contraception. Frost,
Lindberg, and Finer (2012) noted that the most important social reference in their study
of young adult women and men was what friends thought about birth control.
Unfortunately, IBCU did not include a question about what friends thought about
contraception.
Bader, Kelly, Cheng, and Witt, (2014) found that perceiving birth control use as
moral behavior was associated with having visited a clinic to obtain contraception. In the
current sample of women, 83% responded that the idea that birth control is immoral is
definitely or probably false. However the question regarding the morality of birth control
did not load on any of the final factors that influenced contraceptive intent or use.

83
Factors that predict Intent to Use and Reported Use of Contraception
Consistent with the integrated model of behavior theory, this study suggests that
two factors are the strongest predictors of whether one intends to use contraception: rural
childhood, a background factor, and attitudes toward contraceptive use, an independent
variable. Also in support of the theoretical model this research is based on, the strongest
predictor of actual contraceptive use was intent to use contraception (OR= 15.37) and
whether or not one had health insurance that paid for contraception (OR=6.23). These
two predictors of contraceptive use were significant in spite of the fact that the sample
size for that analysis had only 111 participants. Had the sample size been adequate
(n=164), other background factors or independent variables (competency and
environmental factors) may have predicted contraceptive use also.
A Rural Childhood
Because having a rural childhood emerged as a background factor that predicted
participants did not intend to use contraception, it is important to understand how rural
environments differ from urban landscapes. In this sample of 270 women, 20% reported
having had a rural childhood, and three out of four of those rural participants were
attending a community college (College 1). Thirty-seven percent of Missourians (2.2
million people) live in rural counties, which is defined as “not urban” by the US Census
Bureau (Missouri Department of Health and Senior Services, n.d.). Socio-economic
differences exist between rural and urban counties in Missouri: the rural poverty rate is
higher; unemployment is higher; and rural residents are less likely to have health
insurance. There are fewer health care providers in rural areas, and the death rate overall
is higher in rural areas especially from accidental death and suicide.
84
The American Congress of Obstetrics and Gynecology states that women’s
reproductive health care services in rural areas are lacking, leaving many women without
access to contraception (ACOG Committee Opinion, 2014). Additionally, social norms
regarding contraception are different in rural areas, where women have higher rates of
sterilization for birth control. Finally, there are 98 Title X funded clinics in Missouri, that
served over 60,000 women in 2013, but the number of women who need access to
contraceptive care is in excess of 300,000 women (Frost, Zolna, & Frohwirth, 2013).
While all women in this survey’s sample were currently living in an urban area of
Missouri, having limited access to contraception during adolescence may have also
limited these women’s personal and vicarious experiences with contraception, and
consequently their intent to use contraception.
Researchers also have limited access to people who live in rural areas, unless
potential participants have joined an institution such as the military or a college.
Therefore, very little is known about the experience of learning about, accessing and
maintaining contraception in a rural area. It is possible that women in rural areas have
less privacy when buying contraception products, since they may know, or even be
related to people who serve them at the pharmacy. Less privacy may inhibit younger
women especially from buying contraception. One qualitative study explored the social
norms in rural Oregon regarding talking with one’s daughter about sexuality and
contraception (Noone & Young, 2010). The participants identified rural lifestyle
elements that influenced discussions about sexuality between mothers and daughters,
including: isolation; less privacy; stigma associated with teen sexuality; the opportunity

85
to witness animals having sex; and long car-rides that provided the opportunity for in-
depth conversations regarding sexuality.
Understanding the unique needs of women from rural areas is important in
planning health services both in rural communities and in settings where formerly rural
residents are likely to live. Future research should explore attitudes, social norms, and
self-efficacy regarding contraception among women who have relocated to an urban
setting as a young adult. Additionally, health policies at community colleges and
vocational schools should address unique needs these young women face since both of
these settings will attract young women from rural environments.
Attitudes toward Contraception
Other researchers have investigated the association between attitudes and
contraceptive use, but the findings have not been consistent. However, inconsistent
findings may be the result of using attitude questions that have not been validated with
factor analysis. The items that loaded on the attitude scale from this survey were either
unique to this survey, or derived from work by Pratte, et al., (2010) or work by Kaye, et
al. (2009). The attitude scale items unique to this survey were: I enjoy sex more using
contraception; I feel good using contraception; I can handle any problems with
contraception; and, it is easy to use contraception. The items derived from work by
Pratte, et al., have previously been found to load on an attitude scale that was part of a
survey about condom use. These items were: my partner is happier knowing
contraception is used; contraception is safe; I can suggest condom use; and, contraception
prevents pregnancy. Finally, one item loaded on the attitude scale that derived from work
by Kaye, et al.: it is important for people like me to have contraception available.

86
Lee and Jezewski (2007) systematically reviewed attitudes toward oral
contraceptives. These authors defined attitudes as having affective, cognitive, and
behavioral dimensions. The affective dimension, in turn, consists of feelings and
emotional reactions. The cognitive dimension of attitudes consists of perceptions, beliefs,
and expectations, and the behavioral dimension of attitudes corresponds to overt action,
or intended behavior. The nine items on the IBCU that comprised the attitude scale fit
the affective and cognitive dimensions of attitudes, as described by Lee and Jezewski.
The affective attitude items were: partner happier knowing contraception was used; feel
good using contraception; enjoy sex more. The cognitive attitude items were: important
that others use contraception; easy to use contraception; safe to use contraception;
important to have contraception available; and, contraception prevents pregnancy. All of
these items reflect an attitude of positive expectations related to contraceptive use.
Frost, Lindbergh, and Finer (2012) studied contraceptive knowledge, norms, and
attitudes and how those independent variables were associated with contraceptive use.
Their findings indicated that objective knowledge explained 10-13% of the variance in
contraceptive use, and attitudes explained 3% of the variance. Objective knowledge was
measured by how many correct answers participants scored on a quiz. The two attitude
questions were answered on a five point Likert scale and addressed whether respondents
viewed contraception fatalistically. Attitudes explained more variance when explaining
inconsistent contraceptive use (11%), expect to have unprotected sex (9%), and no use of
contraception (8%). Approximately half of the respondents had attended college, and
both men and women were surveyed. Unlike Frost, Lindbergh, and Finer, this research
using the IBCU showed that attitudes and rural childhood explained between 11 and

87
30.8% of the variance in intent to use contraception. None of the attitude questions in
IBCU measured fatalism. Additionally, the IBCU survey did not assess how correct a
participant’s factual knowledge was on contraception. Finally, in the present study,
intent to use contraception, and having health insurance that paid for contraception
accounted for 12.5% to 26.2% of the variance in contraceptive use, and neither of these
factors were studied by Frost, Finer, and Lindbergh (2012).
Environmental Factors, Self-efficacy, Health Insurance, and Alcohol use
If participants had health insurance that paid for contraception, they tended to
believe that birth control was affordable for their peers. However, one out of five
participants did not have health insurance, and therefore did pay more than their peers for
birth control. Another interesting finding is that if respondents worked, they reported
more competency with birth control. Additionally, women who had not been pregnant
reported more competence with birth control, than women who had been pregnant. It
seems that competency (and previous failure) in other areas of life carry over into
perceived competency around birth control.
Having health insurance that paid for contraception emerged as an important
independent factor that predicted contraceptive use. In fact, even with a smaller than
desirable sample size, the odds of reporting contraceptive use were six times higher if one
had health insurance that paid for it. Decades of research on contraceptive uptake in the
United States has documented the inverse relationship between cost and access to
contraception (Hubacher, Spector, Monteith, Chen, & Hart, 2015). Currently, women
without health insurance use shorter acting, less expensive forms of contraception, like
combined hormonal contraceptive pills. Directives from the Affordable Care Act have

88
made longer acting, more reliable forms of contraception, like intrauterine devices, more
affordable for women with health insurance. Socially disadvantaged women, who are
more likely to have an unintended pregnancy, deserve access to the same, highly
effective, long acting forms of contraception as their more advantaged counterparts.
One surprising finding was that women whose parents’ paid for their college
were more likely to report intent to use contraception in the bivariate analysis. However,
in the final logistic regression model, having parents pay college expenses did not predict
actual contraceptive intent. Perhaps young women enrolled in college are motivated to
take care of themselves regardless of the financial level of parental support. Or perhaps
having the opportunity to enroll in college implies that a person has achieved the
necessary financial support to also afford contraception. Alternatively, parental financial
support could be an environmental factor that is significant, a relationship that could be
more evident had the question been designed to fit into the cluster of environmental
questions. Finally, had the sample size of the second logistic regression been larger,
parental support may have emerged as a factor that predicts contraceptive use.
In other studies of contraceptive use among college age women, alcohol use was
associated with reduced use of contraception, especially since alcohol use was associated
with unplanned casual sexual encounters (Campo, Askelson, Spies & Losch, 2010;
Higgins, Trussell, Moore, & Davidson, 2010). Once again, had the sample size been
larger for the second logistic regression, alcohol use may have emerged as a significant
predictor of contraceptive use. Future surveys should include a Likert scale question
about alcohol use to test the significance of this item.
89
Strengths, Limitations, and Future Research
The findings from this study are based on an adequate number of surveys to
conduct a factor analysis on the instrument, and show construct validity. Few other
studies of contraception are based on surveys that show constructs validated by factor
analysis, and then are shown to be reliable by Cronbach’s alpha. A validated survey is
important because it allows researchers to measure differences in important factors that
guide behavior, but differ in sub-populations of interest. Additionally, a validated survey
can allow researchers to accurately measure the effect of educational interventions
designed to influence contraceptive behavior. In future research, researchers should use
the survey questions from the IBCU that were valid, and add questions that are further
tested. Doing so will improve the construct validity of scales measuring especially self-
efficacy, competence, and environmental factors.
An improved survey tool should be tested on a wider sample of young women
and on a sample of men. Doing so will improve the distribution of responses on the
scales, and make the survey more generalizable. Validating the survey tool with men will
allow researchers to achieve many of the same goals that a validated survey has when
used with women. Differences in sub-populations of men can be measured. And, the
effect of an educational intervention designed for men can be measured. Finally, once the
survey is validated with male participants, researchers can begin to study the differences
between men’s and women’s attitudes toward contraception. Understanding more about
men’s role in contraception will also allow researchers to design interventions for
couples, which is the context in which most contraception is used.

90
This study has several limitations. First, this is a cross-sectional descriptive
survey, based on a theoretical model. Therefore, the relationships between the variables
are associations, and cohort studies should be completed to show causation between the
independent variables and dependent variables. Secondly, this sample consists of a
convenience sample of young women, who were present in a college campus commons
area. Therefore, this research is not generalizable to all college women, nor can it be
generalized to young women not in college. Additionally, self-report data can be subject
to reporting biases, including recall bias and wanting to please the researcher. Finally,
only the attitude scale had a sufficient number of final items, in addition to high
reliability. Attitude is the only construct that was accurately measured with the IBCU.
Future research should be directed to two areas: improving the survey that
measures contraceptive use; and developing an educational intervention to address
contraceptive knowledge deficits. Many questions were not included in this survey that
may predict contraceptive intent and use. Many studies suggest that the experience of
intimate partner violence negatively impacts self-care regarding contraception. In fact,
sabotage of contraception efforts can be a control strategy some men employ (Miller et
al., 2010; Pallito, Campbell, & O’Campo, 2005). Secondly, the literature on failure to use
contraception clearly implicates the belief that one cannot get pregnant as an influence on
contraceptive use (Biggs, Karasek, & Foster, 2012; Frost et al., 2012). An assessment of
the belief that one cannot get pregnant was not included in this survey. As noted
previously, in future surveys close friends’ attitudes toward contraception should be
measured as a component of social norms. Finally, whether or not participants have
correct knowledge regarding how to use contraception and manage side effects was not

91
studied, yet accurate knowledge predicts contraceptive use in other research (Frost et al.,
2012).
Lastly, researchers should consider how male partners influence contraceptive
use in relationships because very little is known about this, and intuitively the male
sexual partner seems like an important influence. Bruner Huber, and Ersek (2011) asked
college women who should be responsible for birth control in a relationship, and who
actually is responsible. Eighty-nine percent of women in their sample felt contraceptive
responsibility should be shared, but only 58% reported that contraceptive responsibility
actually was shared. Wildsmith, Manlove, and Steward-Streng, (2015) studied the
associations between relationship characteristics and contraceptive use, among co-
habitating and dating young adult couples. These authors estimate that 35% of young
adults aged 18-25 are in dating relationships; 20% are co-habitating; and 21% are
married. Their findings show that as young adults experience dating and co-habitating
with more or less intimacy, their use of specific types of contraception varies (condoms
vs. hormonal contraception). Specifically, as couples were older and co-habitating they
were less likely to use both condoms and hormonal contraception.
Recommendations
An educational program for young women and men on contraception and normal
human sexuality should be offered on all college campuses. While larger campuses have
the resources for such a program, smaller community colleges can also offer smaller scale
educational programs to their young adult students. Other venues where young adults can
be reached for sexuality and contraception education includes community centers,
libraries, churches, and adult education courses. But accessing young adults who remain

92
in rural settings will be difficult if material is presented in person. Virtual program
delivery may be an alternative for people in rural areas with internet access.
One way all nurses can advocate for young women, and prevent unintended
pregnancy, is to promote inexpensive access to long acting reversible forms of
contraception. In Missouri, we have the opportunity to expand Medicaid and implement
the Affordable Care Act. Doing so would improve access to contraception for young
women, especially in rural areas, similar to the way the CHOICE project impacted poorer
women in St. Louis. When the Contraceptive CHOICE project provided long acting
reversible contraceptives at no cost to poorer women, those women enrolled to receive
this form of contraception and succeeded in preventing unintended pregnancy
(McNichols, Madden, Secura, & Peipert, 2014). Medicaid expansion can make
contraception more accessible in rural areas where young women are more likely to face
numerous barriers to obtaining and using contraception.
Conclusion
This research has identified important survey questions to use when assessing
attitudes toward contraceptive use. Additionally, this research provides support for the
integrated theory of behavioral modification. Finally this research identifies important
factors that predict contraceptive use: attitude toward contraceptive use, rural childhood,
intent to use contraception and health insurance that pays for contraception. New
knowledge about contraceptive use is important because contraception is the only reliable
way to prevent unintended pregnancy, a condition that threatens the health of the next
generation and their mothers. Men and women can gain control over their own destiny
and the health of their children through family planning. Therefore finding ways to

93
empower young people to take full advantage of contraception and have families when
they want them deserves our full attention.

94
Appendix A
Influences on Birth Control Use

95
Influences on Birth Control Use
1. Do you plan to become pregnant in the next 6 months? (yes/no)
2. Gender (male/female)
3. Age
4. What race/ethnicity do you identify yourself as? (Mark all that apply).
i. American Indian or Alaska Native
ii. Asian
iii. Black or African American
iv. Native Hawaiian or Other Pacific Islander
v. White
vi. Hispanic or Latino
5. Currently completed how many years of school (12 yrs., 1yr college; 2 yrs
college; 3 yrs college; 4 or more yrs of college)
6. Currently working? (yes/no)
i. Do you have to work to help pay for college? (yes/no)
ii. Are you a full-time student? (yes/no)
iii. Do you have health insurance that covers birth control? (yes/no)
iv. What percent of your college expenses is paid for by your parents?
1. None; 2. 1/3 or less ; 3. ½ or less; 4. 2/3 or less; 5. All.
7. Are you currently sexually active with men? (yes/no)
8. Last time you had sex (penis in vagina), did you use birth control? (yes/no)
9. When you have sex, do you keep the man’s penis away from your vagina to
prevent pregnancy? (yes/no)

96
10. Last time you had sex, did you use a condom? (yes/no)
11. How many times have you been pregnant in your life time?
a. If more than “0”, how many pregnancies were a surprise?
12. Do you intend to be protected from pregnancy the next time you have
sex? (yes/no)
13. Do you use alcohol or other substances before you have sex
a. Rarely b. <25% of the time c. about half of the time
d. usually e. always
14. While growing up did you live in a town that had more than 2,500
people? (yes/no)
a. If yes, for how many years before age 18 did you live in a town with more
than 2500 people?
15. Do you currently use birth control? (yes/no)
a. If yes, do you use birth control to prevent pregnancy? (yes/no)
b. If no, have you used birth control to prevent pregnancy in the past? (yes/no)
16. Are you currently in a committed relationship with a man? (yes/no)
a. If yes, for how long?
i. <4 mos., ii. < 1 year; iii. >1 year
17. Thinking about the last four weeks, how many times have you had
sexual intercourse with a male (in the past four weeks)?
18. How many males have you had sexual intercourse with in the past 12
months?

97
19. Thinking about your life right now, how important is it to avoid
becoming pregnant?
1.Very important somewhat important 3.not sure not too important 5.not important
Your views on birth control…
1. How likely is it that your partner would be happier knowing birth control was
used in your relationship?
1 2 3 4 5
Not at all likely Very Likely
2. How likely is it that you would enjoy sex more if you were using birth
control?
1 2 3 4 5
Not at all likely Very Likely
3. How likely is it that you would be protected from pregnancy if you were using
birth control?
1 2 3 4 5
Not at all likely Very Likely
4. How likely is it that using birth control would be easy for you?
1 2 3 4 5
Not at all likely Very Likely

98
5. How likely is it that using birth control would be safe for you?
1 2 3 4 5
Not at all likely Very Likely
6. How likely is it that you would feel good if you used birth control?
1 2 3 4 5
Not at all likely Very Likely
7. How likely is it that birth control is healthy for you?
1 2 3 4 5
Not at all likely Very Likely
8. How likely is it that your partner would be angry if you told him you were
using birth control?
1 2 3 4 5
Not at all likely Very Likely
9. How likely is it that using birth control would ruin the sexual mood?
1 2 3 4 5
Not at all likely Very Likely

99
10. How likely is it that your partner would think you were having sex
with another person if you were using birth control?
1 2 3 4 5
Not at all likely Very Likely
11. How likely is it that your partner would leave you if you said you had
to use birth control?
1 2 3 4 5
Not at all likely Very Likely
12. How likely is it that your partner would refuse to have sex if you said
you wanted to use birth control?
1 2 3 4 5
Not at all likely Very Likely
13. How likely is it that birth control is harmful to you?
1 2 3 4 5
Not at all likely Very Likely
14. How likely are you to have problems with birth control?
1 2 3 4 5
Not at all likely Very Likely

100
15. In a sexual relationship, the woman decides whether or not to use birth
control.
1 2 3 4 5
Not at all true Very True
16. In a sexual relationship, the man decides whether or not the woman
uses birth control.
1 2 3 4 5
Not at all true Very True
17. In a sexual relationship, the man and woman decide together whether
or not to use birth control.
1 2 3 4 5
Not at all true Very True
18. Preventing pregnancy with birth control is morally wrong.
1 2 3 4 5
Not at all true Very True

101
19. How important is it that your peers use condoms in one-night
stands/flings?
1 2 3 4 5
Not at all important Very Important
20. How important is it that people like you use birth control to prevent
pregnancy?
1 2 3 4 5
Not at all important Very Important
21. How important is it that people like you always have birth control
available during the next month?
1 2 3 4 5
Not at all important Very Important
22. How important is it that people like you plan a pregnancy with a
committed partner?
1 2 3 4 5
Not at all important Very Important
23. Thinking about your life right now, how important is it to avoid
becoming pregnant?
1 2 3 4
5
Not at all A little important I don’t know. Somewhat important Very important

102
24. How confident are you that you could discuss using birth control with your
partner?
1 2 3 4
5
Not at all confident Very confident
25. How confident are you that you could suggest using birth control to
prevent pregnancy?
1 2 3 4 5
Not at all confident Very confident
26. How confident are you that you could suggest using a condom to
prevent sexually transmitted infections?
1 2 3 4 5
Not at all confident Very confident
27. How confident are you that you could use birth control without having
it break the sexual mood?
1 2 3 4 5
Not at all confident Very confident

103
28. How confident are you that you could use birth control correctly?
1 2 3 4 5
Not at all confident Very confident
29. How confident are you that you could handle any problems with your
birth control?
1 2 3 4 5
Not at all confident Very confident
30. I have used birth control correctly in the past.
1 2 3 4 5
Not at all like me Very much like me
31. My parents believe I should use birth control to prevent pregnancy.
1 2 3 4 5
Not at all like me Very much like me
32. Birth control is affordable for me.
1 2 3 4 5
Not at all like me Very much like me

104
33. Birth control is affordable for my peers.
1 2 3 4 5
Not at all like me Very much like me

105
Appendix B: Informed Consent

106
CONSENT FORM FOR PARTICIPATION IN A RESEARCH STUDY
Influences on Birth Control Use
Introduction
You are being asked to volunteer for a research study. This study is being
conducted at University of Missouri, Columbia, and Moberly Area Community College.
The researcher in charge of this study is Valerie Bader. Ms. Bader’s dissertation
chair person is Dr. Patricia Kelly.
The study team is asking you to take part in this research study because you are a
woman between the ages of 18 and 24, who does not plan to become pregnant in the next
six months. Research studies only include people who choose to take part. Please read
this consent form carefully and take your time making your decision. This consent form
explains what to expect: the risks, discomforts, and benefits, if any, if you consent to be
in the study.
Background
An unintended pregnancy is one that occurs at the wrong time, or is not
wanted. Women with an unintended pregnancy who give birth get sick more often, and
their babies get sick more often. Birth control can prevent unintended pregnancy.

107
Purpose
The purpose of this research study is to learn more about feelings and
knowledge about birth control use. This study will tell researchers how to help women
use birth control, and prevent unintended pregnancy.
You will be one of about 270 subjects who participate in this study.
Study Procedures and Treatments
If you agree to volunteer, you will be given a paper survey and a pencil. Please
answer the questions on the survey by circling the response that is true for you, or
writing in the information. Completing this survey will take about 20 minutes.
If you agree to take part in this study, you will be involved in this study for the
20 minutes we estimate it will take you to complete the survey. We will only contact you
after you complete the survey if you enter and win the drawing for an iPad mini.
Possible Risks or Side Effects of Taking Part in this Study
The risks to you from participating in this study are expected to be minimal.
You may become psychologically uncomfortable answering some of the questions in
the study. We believe there is no way anyone could link your answers to questions back
to you.

108
Possible Benefits for Taking Part in this Study
There are no benefits to you for taking part in this study.
Other people may benefit in the future from the information about birth control
that comes from this study.
Payment for Taking Part in this Study
To compensate you for your time you may put your e-mail address on a raffle
ticket, which will be entered into a drawing for one of four iPad mini’s. We will e-mail
you if you win the drawing.
Contacts for Questions about the Study
You should contact the IRB Administrator of UMKC’s Adult Health Sciences
Institutional Review Board at 816-235-5927 if you have any questions, concerns or
complaints about your rights as a research subject. You may call the researcher Valerie
Bader at (573) 673-2219 if you have any questions about this study. You may also call
her if any problems come up.
Voluntary Participation

109
Taking part in this research study is voluntary. If you choose to be in the study,
you are free to stop participating at any time and for any reason.
You have read this Consent Form or it has been read to you. You have been told
why this research is being done and what will happen if you take part in the study,
including the risks and benefits. You have had the chance to ask questions, and you may
ask questions at any time in the future by calling Valerie Bader at (573)673-2219. By
completing the survey, you volunteer and consent to take part in this research study.
Study staff will give you a copy of this consent form, at your request.

110
Appendix C: Poster at Research Table

111
COMPLETE A
SURVEY---
AND ENTER A
RAFFLE TO WIN AN
IPAD MINI
Are you a woman
between 18 and 24?
Who is not trying to
become pregnant…
Will you take a survey?
The survey takes 20
minutes to complete.
Share your thoughts
and feelings about birth
control.
University of
Missouri, Kansas city
School of Nursing
Pat Kelly, PhD,
RN
And
Valerie Bader,

112
Appendix D: MACC Approval Letter

113
RKearch Propos;!1 Application
r .... _ .... ~_: "" _1:1II""'01 .... I~_ Dom .... l llodol ""c.:...-.".. • .-uo_ rcr,xo.t: It .. cIe,,.i:t\~ ot..<.'\' ...... _:tIO ",10'';'-_ _ .,., <OI't<~ bet_"",
"'~(Q) "--"'''''''''''~''' (>I~ ~tOoy~":l "''' _ _ . .. .:.1 (_: ~ "",. ~i~ '-'-" .. ,.",.... ..... _

114
Appendix E: UMKC IRB Approval Letter

115
UMKC
~---.... _ , """ ~"'- """ h _....,VO .. ' .. __ , ~"" '-<"' , ... ..... _, .. _ ...... ,,.., • ............. ,--,~
"-" ......
Ho n CE Of' EXEM'" DE TE" '''' noN
,- , " ... " ........
. M~e .. " ,,,~;
'" "' ,,,...,,, r "" .. , ",.,6O.l
,~ .. ~ , . ,,-"'- .~ ........ ... , .... ~ .... ~ .... -.... , .,, ~ •. -"." ,--'" .,-_ .... ~ ... ",..,...,-." .. . ", " ,"' ,,",
no .. ", . _ """","' . ... 0.0""'=-0 ,-, ..0-,',_ . ...... - -= >=>: ""-" " ,0- "" _ . ,""".,",,-
, .. __ . ........ . -'-' _ --"_ ....,. ... . --. .. .. _. " 0_ ' . ........ ... _<m _ . '- , __ • .., ' . .. . _ .,_ N __ ; . __ .... _ .. _ ._ . "..,
...... _._ ""_ 0,,_"_ 0 •. _, ) ... ,_ ..... _ -" .... _. ~ .. p,i-~''' ~_ .... . ,~ _ _ ~ ... ,-.re._. , ..... , ... w. , ''--,~ , .

116
Appendix F: University of Missouri Health Sciences IRB Approval Letter

117
Health Sciences IRB u,;.",>~y ul M;,."" .... C~b.ob:..
l'J() Q~~ J-L>1:; =1= W , " .. " ,,,.
( a .. ,o.. , ~'(l r{'11! I'IW ~, (>7!) ><f~-J""
1'."" (ffi ) SM4tJl
"l1ti< ~ ....... ' ''': b."t>J on.! .~ b)' 11>< Lhl;.,.iIy 01 ~~ _ ect.>m'>' .. t_ Sd«."" n.t:Ub"~1 "'-~ L"" _ ru 11!SOOl! .>.>;LOci" , Iv 01", Urn> ",oJ ",>d,"", J",,-..v..d ~
.......... Nw'..."
......... ; ]',~
~. r,. .• .,">; .....
1'm"'Y Un""-, Aj,"" -'" n.,,, ~, .... " " , I~, ...
API""'-" c.~::<y , .... ~ .-.I ""''"',
"'."AA) Inoh.-."" '" _ UnbJI s..J",. ,"dL.->:C~-rn
;'..J ",. 'iL"---.: C~-rn
~' '\: 12, lil t<
~''\: 12, 1iI 1~
E<eny.;j'i UH -0>.101[ " '2'
' '''''''PO
>'co ''''~~F''-u..J ... '-"O!''y ,,~, h "-'l~'" ",on..! .. tho MU HSWJl ~~ ill I' l':i ,,,,.,-,,rl, C) i;<" " i" J I "";"'1'''''''' I" oJ. flo ~ ; ", • • i", .-,-.-.' "& nr "'""~'-;-'< ...-! f"',H , ,,",, oW"'" "& ' ''''' '" ", ..... =ffi I" " ."" "~ '" <Ji>.T>
lJutog"'"' "'" <a".~,"-; 01 "", . IUd)", ... <b.lhg """"'" F"""" '"' """",It "'l"'" ..-.11> ... , "' ... . ...... d""'" r.-.m. .... 1, . -h OJ" ~ ... "PI""""I ":-,.h,> H<IIW I'W< ., 0" j-,(,' '''''''' "" .... ,", .-t....-v<- (l;., "V" " I f.-. ""'" .--. .-.I ... ,.1 r bhl"$ n_ .o.u.., "'1""~.L """'''''& .-. ,,1..,,01 ft'8 ., I".-.-.., I h ~ f"'i«' ''':'.'J>< n::R "''' '''' ''"'t ..... ,_ M ~ .t., f"':<' ... ri"''''r"·''''''' d.'" ~, y'-"' """" """,-, <11"" "" E,"-" r' .\r."",ll'Pd= 1[.'11.1 " ~'" O"'·~"""'.vOloJm~-.j I'.r.n If),,,, l-_,,< qu"' ...... or ""i'"'" >oJ ~rlono' .. Jocn.o om. rho< "'-"'_lO<t ',,", ., (~;:;) OOl":; Il l ", iIM'n-;'" oi;;:d, '

118
Appendix G: Permission to use previously published surveys.

119
s ign out I Bader, Valerie G . •
a. 18 II Find Someone Options · O·
Condom attitudes, norms and self efficacy scale
~ Bader, Valerie ... Thank you! I will keep you posted. Valerie Badel", MN, CNM Clinical Instructor of Nursing S424 Sinclair School of Nursing Un ... 3/6/2012
, Bull, Sheana [Sheana.Bull @ucdenver.edu]
Hello Ms. Bader, by all means, please use the scale, I'm g lad that you can adopt it. I'd love to learn about the results.
Thanks
Sheana Bull
, Bader, Valerie G. To: [email protected]
Cc Enriquez. Ma;the: Kelly. Patricia J.
Dr. Bull:
Tuesday. Mardl06. 2012 11:19AM
Actions .... .. Tuesday. Mardl06. 2012 lD:56AM
Currently I am completing m y PhD work at University of Missouri in Kansas Gty, School of N Ursing. I have been searching the literature for a scale that measures contraception use based on an integrated theory of behavior (self-efficacy, theory of reasoned action,. and health belief model) as described by the Institute of Medicine. In looking for a scale I came across your article entitled "Factor Analyses of Condom Attitudes, Norms, and Self-efficacy Measures in Diverse Samples".
I would like your permission to use the 21-item scale described in your article, modified for contraception use. I will also add an item regarding intention to use contraception.
Thank you for considering this. I look forward to hearing from you.
Valerie Bader, MN, CNM: Oinical Instructor of Nursing 5424 Sinclair School of Nursing University of Missouri Columbia, Missouri 65211
573.673.2219
permission to use survey questions from The Fog Zone
, Kel leen Kaye [[email protected] ] To: Bader. Vale r;e G.
Dellr M,. Ollde r,
s ign out I Bader, Valerie G . •
a. tJ Iii Find Someone Options · o ·
Actions .... .. Thursday. MardlOl. 2012 2:!>4 PM
Thank you for your e-mai l and for your interest in our sur"\ .. ey. We welcome the opportunity to see the Fog lone questions replicated in other surveys, so
ple",e feel free to include your que,ti"n, of intere,t. We only requ",t " Uribution in your work to the extent th"t would be "'ppropri"te.
Good luck w ith your research,
Kelleen
KelleenKaye
Senior Director of Research
The National Carrpaign
to Prevent Teen and Unplamed Pregnancy
202-478-8512
Ucheck out our blo!:l'~
htlp"l!bloo TheNai"onalCamoaign om ... ~
v.ww. TheNationalCamoaign ora
www sliwteen om
) Bader, Valerie ... Dear Ms. Kaye: I am writing to request permission to use survey questions from The Fog Zone in a survey I intend to conduct f... 3/1/2012
v

120
REFERENCES
ACOG Committee Opinion. (2009). Increasing use of contraceptive implants and
intrauterine devices to reduce unintended pregnancy. Obstetrics and Gynecology,
114(6114), 1434–1438. http://doi.org/10.1097/AOG.0b013e3181c6f965
Ahluwalia, I., Whitehead, N., & Bensyl, D. (2007). Pregnancy intention and
contraceptive use among adult women. Maternal & Child Health Journal, 11(4), 347–
351. http://doi.org/10.1007/s10995-007-0180-9
Arnett, J. (2000). Emerging adulthood: A theory of development from the late
teens through the twenties. American Psychologist, 55(5), 469–480.
http://doi.org/10.1037//0003-066X.55.5.469
Ayoola, A., Nettleman, M., & Brewer, J. (2007). Reasons for unprotected
intercourse in adult women. Journal of Women’s Health, 16(3), 302–10.
http://doi.org/10.1089/jwh.2007.0210
Bader, V., Kelly, P., Cheng, A., & Witt, J. (2014). The role of previous
contraception education and moral judgment in contraceptive use. Journal of Midwifery
& Women’s Health.
Belsky, J., Steinberg, L., Houts, R., & Halpern-Fisher, B. (2010). The
development of reproductive strategy in females: Early maternal harshness, earlier
menarche, increased sexual risk-taking. Developmental Psychology, 46(1), 120–128.
http://doi.org/10.1037/a0015549
121
Biggs, M., Karasek, D., & Foster, D. (2012). Unprotected intercourse among
women wanting to avoid pregnancy: Attitudes, behaviors, and beliefs. Women’s Health
Issues, 22(3), e311–e318. http://doi.org/10.1016/j.whi.2012.03.003
Bleil, M., Adler, N., Pasch, L., Sternfeld, B., Reijo-Pera, R., & Cedars, M.
(2011). Adverse childhood experiences and repeat induced abortion. American Journal of
Obstetrics and Gynecology, 204(122), e1–6.
Brunner Huber, L. R., & Ersek, J. L. (2011). Perceptions of Contraceptive
Responsibility Among Female College Students: An Exploratory Study. Annals of
Epidemiology, 21(3), 197–203. http://doi.org/10.1016/j.annepidem.2010.11.006
Bumpass, L., & Westhoff, C. (1970). The “perfect contraceptive” population.
Science, 169(3951), 1177–82.
Campbell, A., & Mosher, W. (2000). A history of the measurement of
unintended pregnancies and births. Maternal Child Health Journal, 4(3), 163–169.
Campo, S., Askelson, N., Spies, E., & Losch, M. (2010). Preventing unintended
pregnancies and improving contraceptive use among young adult women in a rural,
Midwestern state: health promotion implications. Women & Health, 50(3), 279–96.
Centers for Disease Control and Prevention. (2012, June). About the National
Survey of Family Growth. Retrieved from http://www.cdc.gov/nchs/nsfg/about_nsfg.htm
Cheng, D., Schwarz, E., Douglas, E., & Horon, I. (2009). Unintended pregnancy
and associated maternal preconception, prenatal and postpartum behaviors.
Contraception, 79, 194–198. http://doi.org/10.1016/j.contraception.2008.09.009

122
Cleland, J., Conde-Agudelo, A., Peterson, H., Ross, J., & Tsui, A. (2012).
Family planning 2: Contraception and health. Lancet, 380, 149–156.
http://doi.org/10.1016/s0140-6736(12)60609-6
Curtis, S., Evens, E., & Sambisa, W. (2012). Contraceptive discontinuation and
unintended pregnancy: An Imperfect Relationship. International Perspectives on Sexual
and Reproductive Health, 37(2), 58–66. http://doi.org/10.1363/3705811
Dehlendorf, C., Rodriguez, M. I., Levy, K., Borrero, S., & Steinauer, J. (2010).
Disparities in family planning. American Journal of Obstetrics and Gynecology, 202(3),
214–220. http://doi.org/10.1016/j.ajog.2009.08.022
Ferreira, A., Lemos, A., Figueiroa, J., & deSouza, A. (2009). Effectiveness of
contraceptive counselling of women following an abortion: A systematic review and
meta-analysis. The European Journal of Contraception and Reproductive Health Care,
14(1), 1–9. http://doi.org/10.1080/13625180802549970
Finer, L., & Henshaw, S. (2006). Disparities in rates of unintended pregnancy in
the United States, 1994 and 2001 [electronic copy]. Perspectives on Sexual and
Reproductive Health, 38, 90–96.
Finer, L., & Zolna, M. (2011). Unintended pregnancy rates in the United States:
Incidence and Disparities, 2006. Contraception, 84(5), 478–85.
http://doi.org/10.1016/j.contraception.2011.07.013
Fishbein, M. (2008). A reasoned action approach to health promotion. Medical
Decision Making, 28(6), 834–44. http://doi.org/10.1177/0272989X08326092
Frost, J., Lindberg, L., & Finer, L. (2012). Young adults’ contraceptive
knowledge, norms and attitudes: Associations with risk of unintended pregnancy.

123
Perspectives on Sexual and Reproductive Health, 44(2), 107–116.
http://doi.org/10.1363/4410712
Frost, J., Zolna, M., & Frohwirth, L. (2013). Contraceptive Needs and Services.
Guttmacher Institute. Retrieved from http://www.guttmacher.org/pubs/win/contraceptive-
needs-2010.pdf
Gipson, J., Koenig, M., & Hendin, M. (2008). The effects of unintended
pregnancy on infant, child, and parental health: A review of the literature. Studies in
Family Planning, 39(1), 18–38.
Gordis, L. (2009). Epidemiology. Philadelphia: Saunders Elsevier.
Gordon, L. (2002). The Moral Property of Women (3rd ed.). Champaign, Illinois:
University of Illinois Press.
Grossman, D., Fernandez, L., Hopkins, K., Amastae, J., & Potter, J. (2010).
Perceptions of the safety of oral contraceptives among a predominantly Latina population
in Texas. Contraception, 81(3), 254–260.
http://doi.org/10.1016/j.contraception.2009.09.009
Hall, K. S., Castaño, P. M., Stone, P. W., & Westhoff, C. (2010). Measuring oral
contraceptive knowledge: A review of research findings and limitations. Patient
Education and Counseling, 81(3), 388–394. http://doi.org/10.1016/j.pec.2010.10.016
Higgins, J., Popkin, R., & Santelli, J. (2012). Pregnancy ambivalence and
contraceptive use among young adults in the United States. Perspectives on Sexual and
Reproductive Health, 44(2), 236–244. http://doi.org/10.1363/4423612
Higgins, J., Trussell, J., Moore, N., & Davidson, J. (2010). Virginity lost,
satisfaction gained? Physiological and psychological sexual satisfaction at heterosexual

124
debut. Journal of Sex Research, 47(4), 384–394.
http://doi.org/10.1080/00224491003774792
Homco, J., Peipert, J., Secura, G., Lewis, V., & Allsworth, J. (2009). Reasons for
ineffective pre-pregnancy contraceptive use in patients seeking an abortion.
Contraception, 80(6), 569–574. http://doi.org/10.1016/j.contraception.2009.05.127
Hubacher, D., Spector, H., Monteith, C., Chen, P., & Hart, C. (2015). Rationale
and enrollment results for a partially randomized patient preference trial to compare
continuation rates of short-acting and long-acting reversible contraception.
Contraception, 91(3), 185–192.
http://doi.org/http://dx.doi.org/10.1016/j.contraception.2014.11.006
Ingersoll, K., Ceperich, S., Nettleman, M., & Johnson, B. (2008). Risk drinking
and contraception effectiveness among college women. Psychology and Health, 23(8),
965–981. http://doi.org/10.1080/08870440701596569
Ip, W., Sin, L., & Chan, D. (2009). Contraceptive self-efficacy and contraceptive
knowledge of Hong Kong Chinese women with unplanned pregnancy. Journal of
Clinical Nursing, 18(17), 2416–2425. http://doi.org/10.1111/j.1365-2702.2009.02829.x
Jones, R., Darroch, J., & Henshaw, S. (2002). Contraceptive use among US
women having abortions in 2000-2001. Perspectives on Sexual and Reproductive Health,
34(6), 294–303.
Joyce, T., Kaestner, R., & Korenman, S. (2000). The stability of pregnancy
intentions and pregnancy-related maternal behaviors. Maternal & Child Health Journal,
4(3), 171–178.

125
Kavanaugh, M., Jerman, J., Hubacher, D., Kost, K., & Finer, L. (2011).
Characteristics of women in the United States who use long-acting reversible
contraceptive methods. Obstetrics and Gynecology, 117(6), 1349–1357.
http://doi.org/10.1097/AOG.0b013e31821c47c9
Kaye, K., Suellentrop, K., & Beck, C. (2009). The Fog Zone: How
Misperceptions, Magical Thinking, and Ambivalence Put Young Adults at Risk for
Unplanned Pregnancy. Washington DC: The National Campaign to Prevent Teen and
Unplanned Pregnancy. Retrieved from http://www.thenationalcampaign.org/fogzone/
Kirby, D. (2009). The impact of programs to increase contraceptive use among
adult women: A review of experimental and quasi-experimental studies. Perspectives on
Sexual and Reproductive Health, 40(1), 34–41. http://doi.org/10.1363/4003408
Knowles, J. (2002). A History of Birth Control Methods. New York: Planned
Parenthood Federation of America, Inc. Retrieved from www.plannedparenthood.org
Langston, A., Rosario, L., & Westhoff, C. (2010). Structured contraceptive
counseling—A randomized controlled trial. Patient Education and Counseling, 81, 362–
367. http://doi.org/10.1016/j.pec.2010.08.006
Lee, J., & Jezewski, M. (2007). Attitudes toward oral contraceptive use among
women of reproductive age: A systematic review. Advances in Nursing Science, 30(1),
e85–e103.
Levels, M., Need, A., Niewenhuis, R., Sluiter, R., & Ultee, W. (2012).
Unintended pregnancy and induced abortion in the Netherlands 1954-2002. European
Sociological Review, 28(3), 301–318. http://doi.org/10.1093/esr/jcq065

126
Lifflander, A., Gaydos, L., & Hogue, C. (2007). Circumstances of pregnancy:
Low income women in Georgia describe the difference between planned and unplanned
pregnancies. Maternal & Child Health Journal, 11(1), 81–89.
http://doi.org/10.1007/s10995-006-0138-3
Luker, K. (1977). Contraceptive risk taking and abortion: Results and
implications of a San Francisco Bay area study. Studies in Family Planning, 8(8), 190–
196.
Maxson, P., & Miranda, M. (2011). Pregnancy intention, demographic
differences, and psychosocial health. Journal of Women’s Health, 20(8), 1215–1223.
http://doi.org/10.1089/jwh.2010.2379
McNichols, C., Madden, T., Secura, G., & Peipert, J. (2014). The contraceptive
CHOICE project round up: what we did and what we learned. Clinical Obstetrics and
Gynecology, 57(4), 635–43.
Melchionne, K. (2010). Eight indicators of unilateral pregnancy. American
Journal of Men’s Health, 4(4), 323–33. http://doi.org/10.1177/1557988309350492
Mercier, R., Garrett, J., Thorp, J., & Siega-Riz, A. (2013). Pregnancy intention
and postpartum depression: Secondary data analysis from a prospective cohort. British
Journal of Obstetrics and Gynecology, 120, 1116–1122. http://doi.org/10.1111/1471-
0528.12255
Messer, L., Dole, N., Kaufman, J., & Savitz, D. (2005). Pregnancy intendedness,
maternal psychosocial factors and preterm birth. Maternal & Child Health Journal, 9(4),
403–412.
127
Miller, E., Decker, M., McCauley, H., Tancredi, D., Levenson, R., Waldman, J.,
… Silverman, J. (2010). Pregnancy coercion, intimate partner violence, and unintended
pregnancy. Contraception, 81, 316–22.
http://doi.org/10.1016/j.contraception.2009.12.004
Missouri Department of Health and Senior Services. (n.d.). Community Data
Profiles. Retrieved June 14, 2015, from
http://health.mo.gov/data/CommunityDataProfiles/
Moberly Area Community College. (2013). Institutional data and statistics.
Retrieved from http:/www.macc.edu/index.php/institutional-data-stats
Montano, D., & Kasprzyk, D. (2008). Chapter 4: Theory of reasoned action,
theory of planned behavior, and the integrated behavioral model. In K. Glanz, B. Rimer,
& K. Viswanath (Eds.), Health Behavior and Health Education: Theory, Research, and
Practice (4th ed.). San Francisco: Jossey-Bass.
Mosher, W., Jones, J., & Abma, J. (2012). Intended and unintended births in the
United States: 1982-2010. (No. 55). Washington DC: National Center for Health
Statistics.
National Survey of Family Growth. (2006, June). National Survey of Family
Growth Female Questionnaire, Year 1, CAPI-Lite Version OMB No. 0920-0314. Centers
for Disease Control and Prevention. Retrieved from
http://www.cdc.gov/nchs/data/nsfg/NSFG_2006-2010_Y1_FemaleCapiLite.pdf
Noone, J., & Young, H. (2010). Rural mothers’ experiences and perceptions of
their role in pregnancy prevention for their adolescent daughters. Journal of Obstetric,

128
Gynecologic, and Neonatal Nursing, 39(1), 27–36. http://doi.org/10.1111/j.1552-
6909.2009.01082.x
Nunnally, J., & Bernstein, I. (1994). Pyschometric Theory (3rd ed.). New York:
McGraw Hill.
Pallito, C., Campbell, C., & O’Campo, P. (2005). Is intimate partner violence
associated with unintended pregnancy? A review of the literature. Trauma, Violence, &
Abuse, 6(3), 217–235. http://doi.org/10.1177/1524838005277441
Polit, D., & Beck, C. (2010). Essentials of Nursing Research: Appraising
Evidence for Practice (7th ed.). Philadelphia: Wolters Kluwer/Lippencott Williams, and
Wilkins.
Pratte, K., Whitesell, N., McFarlane, M., & Bull, S. (2010). Factor analyses of
condom attitudes, norms, and self-efficacy measures in diverse samples. Journal of
Nursing Measurement, 18(3), 153–175. http://doi.org/10.1891/1061-3749.18.3.153
Riddle, J. (1992). Contraception and Abortion from the Ancient World to the
Renaissance. Cambridge, Massachusetts: Harvard University Press.
Riddle, J. (1997). Eve’s Herbs: A History of Contraception and Abortion in the
West. Cambridge, Massachusetts: Harvard University Press.
Ryder, N. (1973). A Critique of the National Fertility Study. Demography, 10(4),
495–506.
Sable, M., & Libbus, K. (2000). Pregnancy intention and pregnancy happiness:
Are they different? Maternal & Child Health Journal, 4(3), 191–198.
Santelli, J., Lindberg, L., Orr, M., Finer, L., & Speizer, I. (2009). Toward a
multidimensional measure of pregnancy intentions: Evidence from the United States.

129
Studies in Family Planning, 40(2), 87–100. http://doi.org/10.1111/j.1728-
4465.2009.00192.x
Santelli, J., Rochat, R., Hatfield-Timajchy, K., Gilbert, B., Curtis, K., Cabral, R.,
& ...Schieve, L. (2003). The measurement and meaning of unintended pregnancy.
Perspectives on Sexual and Reproductive Health, 35(2), 94–102.
Schwartz, A., Peacock, N., McRae, K., Seymour, R., & Gilliam, M. (2010).
Defining new categories of pregnancy intention in African-American women. Women’s
Health Issues, 20(6), 371–379. http://doi.org/10.1016/j.whi.2010.06.005
Shah, P., Balkhair, T., Ohlsson, A., Beyene, J., Scott, F., & Frick, C. (2011).
Intention to become pregnant and low birth weight and preterm birth: A systematic
review. Maternal & Child Health Journal, 15, 205–216. http://doi.org/10.1007/s10995-
009-0546-2
Sonfield, A., Kost, K., Benson, R., & Finer, L. (2011). The public costs of births
resulting from unintended pregnancies: National and state level estimates. Perspectives
on Sexual and Reproductive Health, 43(2), 94–102. http://doi.org/10.1363/4309411
Thorburn, S., & Bogart, L. (2005). Conspiracy beliefs about birth control:
Barriers to pregnancy prevention among African Americans of reproductive age. Health,
Education, and Behavior, 32(4), 474–487. http://doi.org/10.1177/1090198105276220
United States Census Bureau. (2013). Geography: Urban and rural
classification. Retrieved from http://www.census.gov/geo/reference/urban-rural.html
United States Department of Health and Human Services. (2010). Unintended
Pregnancy. Retrieved from
http://www.cdc.gov/reproductivehealth/UnintendedPregnancy/

130
United States Department of Health and Human Services. (2012, February).
Family Planning. Retrieved from
http://healthypeople.gov/2020/topicsobjectives2020/overview.aspx?topicid=13
University of Missouri. (2013). MU Facts. Retrieved from
http://missouri.edu/about/facts.php
Wildsmith, E., Manlove, J., & Steward-Streng, N. (2015). Relationship
characteristics and contraceptive use among dating and cohabiting young adult couples.
Perspectives on Sexual and Reproductive Health, 47(1), 27–36.
http://doi.org/10.1363/47e2515
Willoughby, B. (2012). Associations between sexual behavior, sexual attitudes,
and marital horizons during emerging adulthood. Journal of Adult Development, 19, 100–
110. http://doi.org/10.1007/s10804-011-9138-7
Winner, B., Peipert, J., Zhao, Q., Buckel, C., Madden, T., Allsworth, J., &
Secura, G. (2012). Effectiveness of long-acting reversible contraception. New England
Journal of Medicine, 366(221), 1998–2007. http://doi.org/10.1056/NEJMoa1110855
Wohlwend, J., Glassman, T., Dake, J., Jordan, T., Khuder, S., & Kimmel, S.
(2014). An examination of emergency contraception use by undergraduate college
students in the Midwest using the integrated behavioral model. Sex Education.
http://doi.org/10.1080/14681811.2013.869205
Xaverius, P., Tenkku, L., & Salas, J. (2009). Differences between women at
higher and lower risk for an unintended pregnancy. Women’s Health Issues, 19(5), 306–
312. http://doi.org/10.1016/j.whi.2009.06.002

131
Yang, T., Matthews, S., & Hillemeier, M. (2011). Effect of health care system
distrust on breast and cervical cancer screening in Philadelphia, Pennsylvania. American
Journal of Public Health, 101(7), 1297–1305. http://doi.org/10.2105/AJPH.2010.300061
Yzer, M. (2012). The integrative model of behavioral prediction as a tool for
designing health messages. In H. Cho (Ed.), Heath Communication Message Design:
Theory and Practice. (pp. 21–40). Thousand Oaks: Sage.

132
Vita
Valerie Gwen Bader was born in Bremerhaven, Germany and began
kindergarten in 1966 in Rota, Spain. She attended nine different schools before
graduating from high school in 1979, the same year she enrolled in the University of
Missouri. She was awarded a BSN in 1984. Ms. Bader worked as a staff nurse in a
Level 2 nursery and a labor and delivery unit before enrolling at the University of
Washington. She graduated with a Master of Nursing in 1995 and successfully passed the
American College of Nurse Midwives Certification exam the same year. She has worked
as a staff nurse or a nurse-midwife for over 30 years. Ms. Bader has provided primary
care to women, including contraception, and attended home and hospital birth.
Ms. Bader loves health and nursing education. She has taught childbirth
education classes, staff development courses, and nursing classes at the undergraduate
and graduate level. Ms. Bader has taken undergraduate nursing students on study abroad
trips for their community health course to Cape Coast, Ghana, and Monte Verde, Costa
Rica.
Ms. Bader was inspired to study unintended pregnancy from her clinical practice
where she met numerous women who were pregnant and did not want to be. She intends
to continue teaching nursing for the foreseeable future. Ms. Bader lives with her husband
of 30 years, Eric, and their dog, Bandit. Ms. Bader enjoys traveling, knitting, gardening,
and reading, and she has no plans to move ever again.
Copyright © 2022 FDOKUMEN