Prodnik, Jernej A. - 3C: Commodifying Communication in Capitalism

Please cite this article in press as: D.M. Minic, et al., J. Alloys Compd. (2011), doi:10.1016/j.jallcom.2011.03.011
ARTICLE IN PRESSG Model
JALCOM 24395 1–6
Journal of Alloys and Compounds xxx (2011) xxx–xxx
1
Contents lists available at ScienceDirect
Journal of Alloys and Compounds
journa l homepage: www.e lsev ier .com/ locate / ja l l com
Influence of thermally induced structural transformations on hardness in
Fe89.8Ni1.5Si5.2B3C0.5 amorphous alloy
1
2
D.M. Minic a,∗, V. Blagojevic a, D.G. Minic b, A. Gavrilovic c, L. Rafailovic c3
a Faculty of Physical Chemistry, University of Belgrade, Belgrade, Serbia4b Kontrola LLC, Austin, TX, USA5c CEST, Centre of Electrochemical Surface Technology, Wiener Neustadt, Austria6
7
a r t i c l e i n f o8
9
Article history:10
Received 13 November 201011
Received in revised form 2 March 201112
Accepted 3 March 201113
Available online xxx
14
Keywords:15
Metallic glasses16
Nanostructured materials17
Composite materials18
X-ray diffraction19
Microhardness20
a b s t r a c t
Effect of heat treatment on mechanical behavior of Fe89.8Ni1.5Si5.2B3C0.5 amorphous alloy was investigated
by measuring microhardness. It was shown that the as-prepared amorphous alloy has an unexpectedly
high microhardness. This can be attributed not only to boron dispersed in the alloy, but also to the struc-
ture which exhibits aspects of a nanocomposite of nanoparticles dispersed in an amorphous matrix. As
the alloy crystallizes at temperatures above 540 ◦C, microhardness decreases continuously as a func-
tion of heating temperature. This is attributed to separation of boron out of the amorphous matrix into
nanocrystals of Fe2B phase. Further decrease in microhardness is attributed to crystallite growth with the
accompanying change in the dominant nature of the interfaces from amorphous/crystal to crystal/crystal,
and creation of a porous structure. When the crystallization is complete, the alloy exhibits microhardness
close to that of a hypothetical mixture of �-Fe and Fe2B phases of the same composition.
© 2011 Published by Elsevier B.V.
1. Introduction21
Iron-based amorphous alloys have been a subject of con-22
siderable scientific interest, because of their soft ferromagnetic23
properties (saturation magnetization, high permeability, low coer-24
civity and loss), high corrosion resistance and good mechanical25
properties [1,2]. This makes them suitable for use in a variety of26
applications [3–6], but their application as structural materials27
has been limited by high cooling rates required to avoid crys-28
tallization and their tendency to oxidize. Magnetic properties of29
amorphous Fe-based alloys could deteriorate after crystallization,30
or, if nanocrystalline phases are formed, they may be improved31
[7–10], producing functional materials with targeted properties.32
Commercial soft magnetic nanocrystalline materials, exhibiting33
superior soft magnetic and mechanical properties, have recently34
been successfully obtained by crystallization of amorphous pre-35
cursors. These materials are characterized by a microstructure36
of nanocrystals dispersed in an amorphous matrix. Recent theo-37
retical studies of iron-based binary systems predict existence of38
short-range ordering in iron-based amorphous alloys. Theoretical39
investigation of nanoscale phase separation in small Fe80B20 and40
Fe83B17 clusters [11] predicts formation of Fe-pure regions, Fe-rich41
regions (which contain around 9% B) and B-rich regions. Addition-42
∗ Corresponding author. Tel.: +381 11 3336 689; fax: +381 11 187 133.Q1E-mail addresses: [email protected], [email protected] (D.M. Minic).
ally, Lass et al. [12] predicted presence of short-range chemical 43
ordering in Fe-based binary systems and found that predicted coor- 44
dination numbers for Fe–P and Fe–B alloys were in good agreement 45
with experimental results. 46
Thermal stability of these alloys and its correlation with elec- 47
trical and magnetic properties have been a focus of some interest 48
[13–16], but there has not been much discussion of the correlation 49
of thermal stability with mechanical properties. Mechanical prop- 50
erties of iron-based amorphous alloys [17,18] have been studied in 51
some detail lately, but there have been very few studies that discuss 52
the correlation of microstructure or phase composition of these 53
alloys with their mechanical properties. Recent study of rapidly 54
quenched iron alloy with 6.5% Si [19] found that rapid quenching 55
resulted in smaller grain size in the alloy samples than conventional 56
casting and decreased microhardness. The authors attributed this 57
to suppression of first-order phase transformation in crystalline 58
iron. Recent studies of hardness of iron-based alloy powders [20] 59
revealed that, when going from crystalline towards amorphous 60
sample, hardness reaches a maximum when the sample is com- 61
posed of a mix of crystalline nanoparticles and amorphous phase, 62
and then begins to decrease as the amorphous content of the sam- 63
ple is further increased. The authors attribute this effect to dense 64
packing of crystalline nanoparticles, which have substantial hard- 65
ness, because of relative lack of defects, in an amorphous matrix. 66
Amorphous/crystal interface has lower interfacial energy than 67
crystal/crystal interface [21] and this structure suppresses prop- 68
agation of shear bands and cracks along these interfaces. Finally, 69
0925-8388/$ – see front matter © 2011 Published by Elsevier B.V.doi:10.1016/j.jallcom.2011.03.011
Please cite this article in press as: D.M. Minic, et al., J. Alloys Compd. (2011), doi:10.1016/j.jallcom.2011.03.011
ARTICLE IN PRESSG Model
JALCOM 24395 1–6
2 D.M. Minic et al. / Journal of Alloys and Compounds xxx (2011) xxx–xxx
the dispersion of the nanoparticles probably suppresses the defor-70
mation of the amorphous phase through shear sliding. Because71
of these mechanisms, the nanocomposites of crystalline nanopar-72
ticles and amorphous phase should have higher microhardness73
than either pure crystalline or pure amorphous phase. A recent74
study investigated the relationship between thermophysical and75
mechanical properties of amorphous alloys [22] in order to develop76
a generalized picture of shear band propagation. Investigation of77
microhardness in boronizing layers of Fe-powder compacts [23]78
showed that, when iron particles are doped with boron through sin-79
tering of iron powders at temperatures above 1000 ◦C, the surface80
structure of the particles exhibits three distinct areas, going from81
the surface down into the layer: surface boride zone is followed by82
a transition zone of diminishing boron content and then, finally,83
the iron matrix without any boron. Microhardness of the surface84
boride layer is 1487–2066 HV, depending on its thickness—as the85
thickness of the layer increases, so does microhardness. Average86
microhardness of the transition layer is 855 HV.87
Our previous study of different aspects of structural transforma-88
tions of Fe89.8Ni1.5Si5.2B3C0.5 amorphous alloy focused on thermal89
stability [24] and the correlation of structural transformations90
with electrical and magnetic properties [25,26]. The focus of this91
research has been the relationship between structural transforma-92
tions of the alloy and its mechanical properties, in particular the93
microhardness. In particular, we discussed in detail the influence94
of changes in microstructure, as well as phase composition of the95
alloy, over 25–850 ◦C temperature range.96
2. Experimental97
Fe89.8Ni1.5Si5.2B3C0.5 amorphous alloy samples were prepared in form of ribbon,98
2 cm wide and 35 �m thick, using the standard procedure of rapid quenching of a99
melt on a rotating disc (melt spinning method). The ribbon samples were thermally100
treated, under vacuum in quartz ampoules, at different temperatures (up to 850 ◦C)101
for 1 h and then left to cool down to room temperature, before investigating their102
properties.103
X-ray diffraction spectra were acquired on X-Pert powder diffractometer (PAN-104
alytical, Netherlands) using CuK� radiation in Bragg-Bentano geometry at 40 kV105
and 30 mA. This instrument is equipped with a secondary graphite monochroma-106
tor, automatic divergence slits and a scintillation counter. The collection of data was107
performed with 0.05◦ step in diffraction angle and the collection time of 30 s per108
step. Analysis of XRD spectra was performed using Rietveld refinement method and109
single peak refinement approach, with TOPAS v.3.0 general profile and structure110
analysis software [27]. Dislocation density was obtained from the Rietveld analysis,111
while microstrain was calculated using Williamson-Hall method [28], using the XRD112
data.113
Vickers microhardness tests were performed using MHT-10 (Anton Paar,114
Austria) microhardness tester, with loads of 0.4 N and loading time of 10 s. Up to115
seven measurements were performed on each individual sample and used to deter-116
mine the average value of microhardness for each sample. Surface-to-volume ratio117
of the crystallites was estimated using the average crystal size of individual crystal118
phases, by approximating that all the crystallites were spherical in shape. The cal-119
culated surface-to-volume ratio represents an estimate of total surface-to-volume120
ratio for crystalline phases in alloy samples.121
SEM images were obtained using XL 30 ESEM-FEG (Environmental Scanning122
Microscope with Field Emission Gun, by FEI, Netherlands), with 20 kV acceleration123
voltage, at magnifications of 3500× and 20,000×.124
3. Results125
X-ray diffraction (XRD) spectra (Fig. 1) of Fe89.8Ni1.5Si5.2B3C0.5126
alloy at room temperature showed a relatively strong broad peak127
around 44◦ and another, much smaller and also broad peak around128
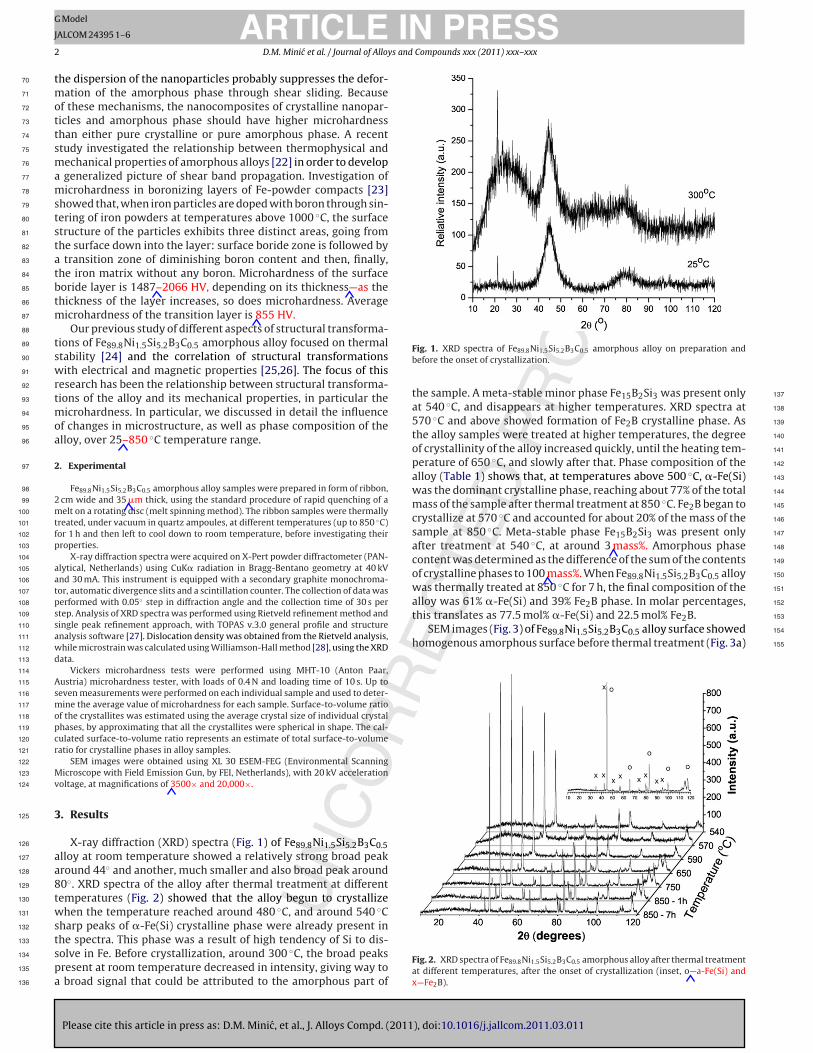
80◦. XRD spectra of the alloy after thermal treatment at different129
temperatures (Fig. 2) showed that the alloy begun to crystallize130
when the temperature reached around 480 ◦C, and around 540 ◦C131
sharp peaks of �-Fe(Si) crystalline phase were already present in132
the spectra. This phase was a result of high tendency of Si to dis-133
solve in Fe. Before crystallization, around 300 ◦C, the broad peaks134
present at room temperature decreased in intensity, giving way to135
a broad signal that could be attributed to the amorphous part of136
Fig. 1. XRD spectra of Fe89.8Ni1.5Si5.2B3C0.5 amorphous alloy on preparation and
before the onset of crystallization.
the sample. A meta-stable minor phase Fe15B2Si3 was present only 137
at 540 ◦C, and disappears at higher temperatures. XRD spectra at 138
570 ◦C and above showed formation of Fe2B crystalline phase. As 139
the alloy samples were treated at higher temperatures, the degree 140
of crystallinity of the alloy increased quickly, until the heating tem- 141
perature of 650 ◦C, and slowly after that. Phase composition of the 142
alloy (Table 1) shows that, at temperatures above 500 ◦C, �-Fe(Si) 143
was the dominant crystalline phase, reaching about 77% of the total 144
mass of the sample after thermal treatment at 850 ◦C. Fe2B began to 145
crystallize at 570 ◦C and accounted for about 20% of the mass of the 146
sample at 850 ◦C. Meta-stable phase Fe15B2Si3 was present only 147
after treatment at 540 ◦C, at around 3 mass%. Amorphous phase 148
content was determined as the difference of the sum of the contents 149
of crystalline phases to 100 mass%. When Fe89.8Ni1.5Si5.2B3C0.5 alloy 150
was thermally treated at 850 ◦C for 7 h, the final composition of the 151
alloy was 61% �-Fe(Si) and 39% Fe2B phase. In molar percentages, 152
this translates as 77.5 mol% �-Fe(Si) and 22.5 mol% Fe2B. 153
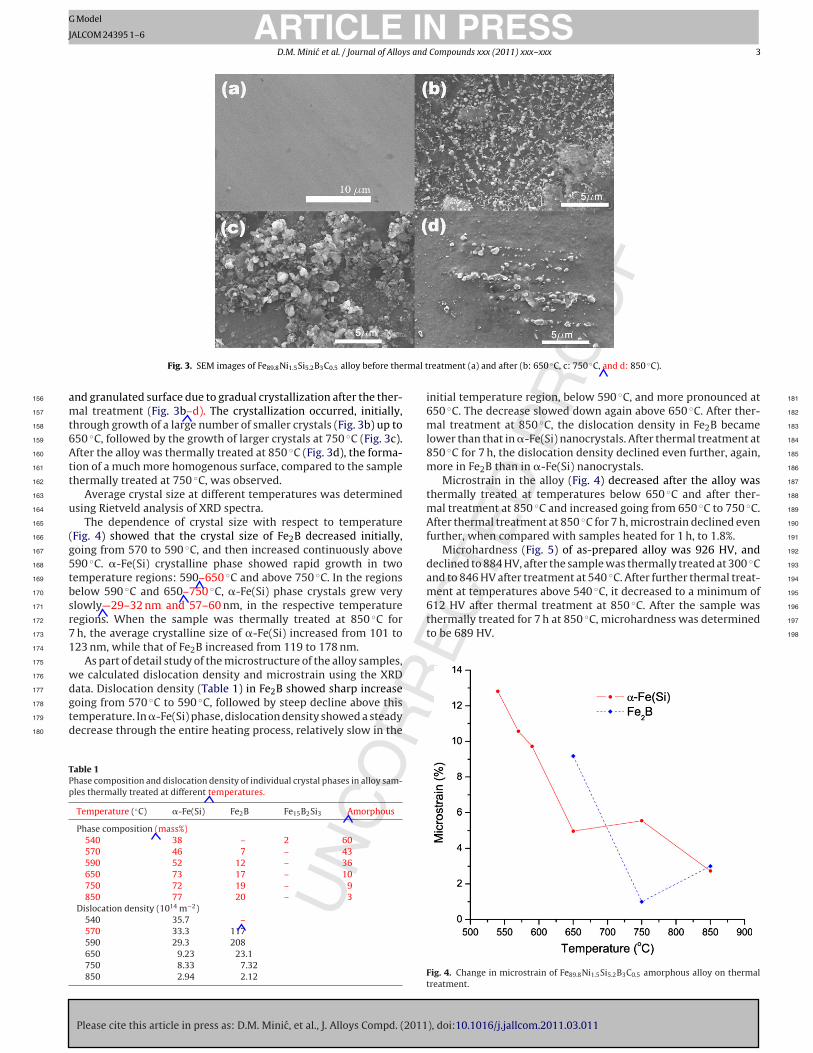
SEM images (Fig. 3) of Fe89.8Ni1.5Si5.2B3C0.5 alloy surface showed 154
homogenous amorphous surface before thermal treatment (Fig. 3a) 155
Fig. 2. XRD spectra of Fe89.8Ni1.5Si5.2B3C0.5 amorphous alloy after thermal treatment
at different temperatures, after the onset of crystallization (inset, o—a-Fe(Si) and
x—Fe2B).
Please cite this article in press as: D.M. Minic, et al., J. Alloys Compd. (2011), doi:10.1016/j.jallcom.2011.03.011
ARTICLE IN PRESSG Model
JALCOM 24395 1–6
D.M. Minic et al. / Journal of Alloys and Compounds xxx (2011) xxx–xxx 3
Fig. 3. SEM images of Fe89.8Ni1.5Si5.2B3C0.5 alloy before thermal treatment (a) and after (b: 650 ◦C, c: 750 ◦C, and d: 850 ◦C).
and granulated surface due to gradual crystallization after the ther-156
mal treatment (Fig. 3b–d). The crystallization occurred, initially,157
through growth of a large number of smaller crystals (Fig. 3b) up to158
650 ◦C, followed by the growth of larger crystals at 750 ◦C (Fig. 3c).159
After the alloy was thermally treated at 850 ◦C (Fig. 3d), the forma-160
tion of a much more homogenous surface, compared to the sample161
thermally treated at 750 ◦C, was observed.162
Average crystal size at different temperatures was determined163
using Rietveld analysis of XRD spectra.164
The dependence of crystal size with respect to temperature165
(Fig. 4) showed that the crystal size of Fe2B decreased initially,166
going from 570 to 590 ◦C, and then increased continuously above167
590 ◦C. �-Fe(Si) crystalline phase showed rapid growth in two168
temperature regions: 590–650 ◦C and above 750 ◦C. In the regions169
below 590 ◦C and 650–750 ◦C, �-Fe(Si) phase crystals grew very170
slowly—29–32 nm and 57–60 nm, in the respective temperature171
regions. When the sample was thermally treated at 850 ◦C for172
7 h, the average crystalline size of �-Fe(Si) increased from 101 to173
123 nm, while that of Fe2B increased from 119 to 178 nm.174
As part of detail study of the microstructure of the alloy samples,175
we calculated dislocation density and microstrain using the XRD176
data. Dislocation density (Table 1) in Fe2B showed sharp increase177
going from 570 ◦C to 590 ◦C, followed by steep decline above this178
temperature. In �-Fe(Si) phase, dislocation density showed a steady179
decrease through the entire heating process, relatively slow in the180
Table 1Phase composition and dislocation density of individual crystal phases in alloy sam-
ples thermally treated at different temperatures.
Temperature (◦C) �-Fe(Si) Fe2B Fe15B2Si3 Amorphous
Phase composition (mass%)
540 38 – 2 60
570 46 7 – 43
590 52 12 – 36
650 73 17 – 10
750 72 19 – 9
850 77 20 – 3
Dislocation density (1014 m−2)
540 35.7 –
570 33.3 117
590 29.3 208
650 9.23 23.1
750 8.33 7.32
850 2.94 2.12
initial temperature region, below 590 ◦C, and more pronounced at 181
650 ◦C. The decrease slowed down again above 650 ◦C. After ther- 182
mal treatment at 850 ◦C, the dislocation density in Fe2B became 183
lower than that in �-Fe(Si) nanocrystals. After thermal treatment at 184
850 ◦C for 7 h, the dislocation density declined even further, again, 185
more in Fe2B than in �-Fe(Si) nanocrystals. 186
Microstrain in the alloy (Fig. 4) decreased after the alloy was 187
thermally treated at temperatures below 650 ◦C and after ther- 188
mal treatment at 850 ◦C and increased going from 650 ◦C to 750 ◦C. 189
After thermal treatment at 850 ◦C for 7 h, microstrain declined even 190
further, when compared with samples heated for 1 h, to 1.8%. 191
Microhardness (Fig. 5) of as-prepared alloy was 926 HV, and 192
declined to 884 HV, after the sample was thermally treated at 300 ◦C 193
and to 846 HV after treatment at 540 ◦C. After further thermal treat- 194
ment at temperatures above 540 ◦C, it decreased to a minimum of 195
612 HV after thermal treatment at 850 ◦C. After the sample was 196
thermally treated for 7 h at 850 ◦C, microhardness was determined 197
to be 689 HV. 198
Fig. 4. Change in microstrain of Fe89.8Ni1.5Si5.2B3C0.5 amorphous alloy on thermal
treatment.

Please cite this article in press as: D.M. Minic, et al., J. Alloys Compd. (2011), doi:10.1016/j.jallcom.2011.03.011
ARTICLE IN PRESSG Model
JALCOM 24395 1–6
4 D.M. Minic et al. / Journal of Alloys and Compounds xxx (2011) xxx–xxx
Fig. 5. Change in microhardness of Fe89.8Ni1.5Si5.2B3C0.5 amorphous alloy on thermal
treatment with (a) surface-to-volume ratio and (b) average crystal size.
4. Discussion199
4.1. Thermally induced structural transformations200
X-ray diffraction spectrum (Fig. 1) of the alloy at room tem-201
perature showed two broad peaks: around 44◦ and around 80◦.202
These positions correspond to the positions of most intense peaks203
of the two crystalline phases: �-Fe(Si) and Fe2B, respectively [ICDD204
PDF 00-036-4899 and 00-036-1332]. This indicates that the as-205
prepared alloy was not completely amorphous and had some206
crystalline character, probably in form of short-range crystalline207
ordering, with characteristics of the two crystalline phases that208
appear after the samples are heated. This is in agreement with209
theoretical investigations of iron–boron systems [11], which pre-210
dicts formation of Fe-pure regions in parallel with Fe-rich regions211
(which contain around 9% B, compared to 8.88% B in Fe2B) and212
B-rich regions. Since our alloy contained much smaller Fe-to-B213
ratio than these clusters (around 30:1, compared to 4:1 and 5:1,214
respectively), it is possible that the two peaks belonging to �-215
Fe(Si) and Fe2B correspond to Fe-pure regions and Fe-rich regions216
described above. The overall alloy structure at room temperature217
could be described as a very fine nanocomposite of small nan-218
oclusters dispersed in the amorphous matrix. After the alloy was219
thermally treated to 300 ◦C, another broad peak appeared, cen- 220
tered around 25◦, which could be attributed to the amorphous 221
content of the sample. Its absence at room temperature indicates 222
that it appears as a result of disordering of the as-prepared alloy 223
structure due to thermal treatment. It also gives us an indication 224
that the as-prepared alloy structure seems to be much more orga- 225
nized than one would expect from a completely amorphous sample. 226
The XRD spectra of the samples thermally treated at 540 ◦C and 227
above showed crystallization of two stable crystalline phases (�- 228
Fe(Si) and Fe2B) and a meta-stable Fe15B2Si3 phase, which only 229
appeared at 540 ◦C, suggesting that the meta-stable phase was an 230
intermediate phase in the initial stage of crystallization of Fe2B. 231
Phase composition (Table 1) showed that most of the crystalliza- 232
tion occurred below 650 ◦C as the percentage of amorphous content 233
dropped from 60 mass% to 10 mass%, going from 540 to 650 ◦C, with 234
�-Fe(Si) being the dominant crystalline phase. After that �-Fe(Si) 235
phase content decreased slightly at 750 ◦C and increased again 236
at 850 ◦C. This behavior between 650 ◦C and 850 ◦C was reflected 237
in the amorphous content of the sample, which, after the sharp 238
decline, dropped from 10% to 9% going from 650 ◦C to 750 ◦C and 239
then to 3% going to 850 ◦C. When the sample was thermally treated 240
for 7 h at 850 ◦C, the phase mass content was 61% �-Fe(Si) and 39% 241
Fe2B, indicating that the crystallization was complete at this point, 242
since amorphous phase was completely gone and mass percent- 243
age of Fe2B corresponded to the boron content of the as-prepared 244
alloy. 245
SEM images (Fig. 3) showed smooth surface in amorphous sam- 246
ple at room temperature and then the presence of smaller and 247
lager crystals after thermal treatment at 650 ◦C and 750 ◦C, respec- 248
tively. After thermal treatment at 850 ◦C the sample showed much 249
smoother surface than at 750 ◦C, indicating that the surface had 250
reformed and the individual crystals had probably reoriented and 251
merged together. 252
4.2. Evolution of microstructure 253
In order to conduct a more detailed analysis of the microstruc- 254
ture, we determined average crystal size, dislocation density and 255
microstrain for each crystal phase. These parameters could offer 256
further insight into causes of structural transformations and their 257
influence on the mechanical properties of alloy samples. The depen- 258
dence of average crystal size (Fig. 5b) of the dominant phase 259
on the heating temperature showed two major increases—below 260
650 ◦C and above 750 ◦C, mirroring the phase composition change 261
(Table 1). Nucleation was the dominant process below 600 ◦C, 262
as indicated by relatively stable crystal size and high disloca- 263
tion density (Table 1). After treatment at 650 ◦C, crystal growth 264
was accelerated—the crystal size increased rapidly and dislocation 265
density and microstrain decreased, indicating that larger crys- 266
tals were formed. After that, the crystalline size remained almost 267
stable, mass percentage of �-Fe(Si) crystalline phase declined, 268
dislocation density showed a slight decrease and microstrain 269
increased. These indicate that a nanocomposite of nanocrys- 270
tals in an amorphous matrix had been formed, with amorphous 271
matrix occupying the space between nanocrystals. The nanocrys- 272
tals grew until the system reached a point where the difference 273
in interfacial energy of existing amorphous/crystal interface and 274
crystal/crystal interface forced the crystalline phase to reorga- 275
nize through recrystallization in order to accommodate further 276
growth. 277
The in-depth analysis of the XRD spectra supported this, indi- 278
cating that significant change in aspect ratio of �-Fe(Si) crystallites 279
occurred in this temperature region, manifesting itself as a change 280
in the ratio of full-widths at half-maxima of peaks corresponding 281
to (1 0 0) and (2 1 1) crystalline planes. Judging by this, the crys- 282
tallites formed at 650 ◦C exhibited more symmetrical shape than 283
Please cite this article in press as: D.M. Minic, et al., J. Alloys Compd. (2011), doi:10.1016/j.jallcom.2011.03.011
ARTICLE IN PRESSG Model
JALCOM 24395 1–6
D.M. Minic et al. / Journal of Alloys and Compounds xxx (2011) xxx–xxx 5
those formed at 750 ◦C. The asymmetrical shape of the larger crys-284
tallites was a result of rapid growth. The average crystal size almost285
doubled going from 750 ◦C to 850 ◦C, as the crystal shape changed286
to a more symmetrical one and the sample surface becomes much287
smoother. Dislocation density and microstrain declined, indicat-288
ing that �-Fe(Si) crystals had formed with better defined crystal289
facets, which were accommodated by the increased size of the290
crystals. Mass percentage of �-Fe(Si) in the sample increased from291
72% to 77%, while amorphous phase content declined from 9% to292
3%.293
Fe2B started to crystallize around 570 ◦C, with average crys-294
tal size of 16 nm, when it accounted for around 7% of the total295
mass. When the sample was heated at 590 ◦C, the mass percent-296
age of Fe2B increased to 12%, while average crystal size decreased297
to 12 nm. Dislocation density in Fe2B increased (Table 1), going298
from 570 to 590 ◦C, which reflected the decrease in average crys-299
tal size (Fig. 5b). Fe2B crystals could be initially formed as one300
of the products of decomposition of the meta-stable Fe15Si3B2301
phase. The initial nucleation was followed by very rapid crys-302
tal growth above 590 ◦C, as the average crystal size increased303
from 12 to 36 nm, going from 590 ◦C to 650 ◦C. The phase con-304
tent percentage increased from 12% to 17%, and dislocation density305
declined rapidly. SEM image of sample heated at 650 ◦C (Fig. 3b)306
showed a large number of small nanoparticles on the surface307
of the alloy, indicating that Fe2B phase probably separated as308
individual crystals from the alloy at this point. The crystal size309
continued to increase (64 nm at 750 ◦C and 119 nm at 850 ◦C),310
while the mass percentage of the Fe2B phase remained rela-311
tively stable (19% at 750 ◦C and 20% at 850 ◦C). This indicated312
that the rapid growth of Fe2B, up to this point, was mostly at313
the expense of the amorphous phase, while the growth above314
650 ◦C probably happened through merging of smaller crystals315
or their dissolution and incorporation into larger crystals. This is316
supported by continued sharp decline in dislocation density. SEM317
images of samples heated at 750 ◦C and 850 ◦C (Fig. 3c and d)318
show a contrasting image: at 750 ◦C the surface had a large num-319
ber of nanoparticles on the surface, consistent with the growth320
of nanocrystals going from 650 ◦C to 750 ◦C; at 850 ◦C the sur-321
face was much smoother and the nanoparticles visible seemed322
to be merged with the surface of the alloy. This indicates that,323
as the heating temperature was increased and Fe2B phase sep-324
arated out from the alloy, the structure of the alloy changed325
to accommodate for the incorporation of these crystals back326
into the alloy. This is supported by the changes in the micros-327
train of the alloy ribbon (Fig. 4), which showed a decrease at328
850 ◦C, after an increase at 750 ◦C. After the sample was thermally329
treated for 7 h at 850 ◦C, boron completely separated into Fe2B330
phase.331
4.3. Influence of structural changes on mechanical properties332
The influence of microstructural changes studied here on333
mechanical properties of the alloy was investigated by measuring334
microhardness of alloy samples, thermally treated at different tem-335
peratures. Microhardness (Fig. 5) of the as-prepared alloy at room336
temperature was 924 HV, which is unexpectedly high. After the337
alloy was thermally treated at 300 ◦C for an hour, it exhibited a338
lower degree of ordering and this was accompanied by a decrease339
in microhardness, to 884 HV. At the early stage of crystallization340
of the alloy, at 540 ◦C, the microhardness declined further, to 846341
HV. This value corresponds well to microhardness of intermedi-342
ate layer found in crystalline boron doped iron powders [23]. The343
increased microhardness of as-prepared alloy can be attributed to344
the fact that the alloy exhibits some degree of ordering, similar345
to nanocomposites of nanoparticles dispersed in an amorphous346
matrix. Nanocomposites of nanocrystals dispersed in an amor-347
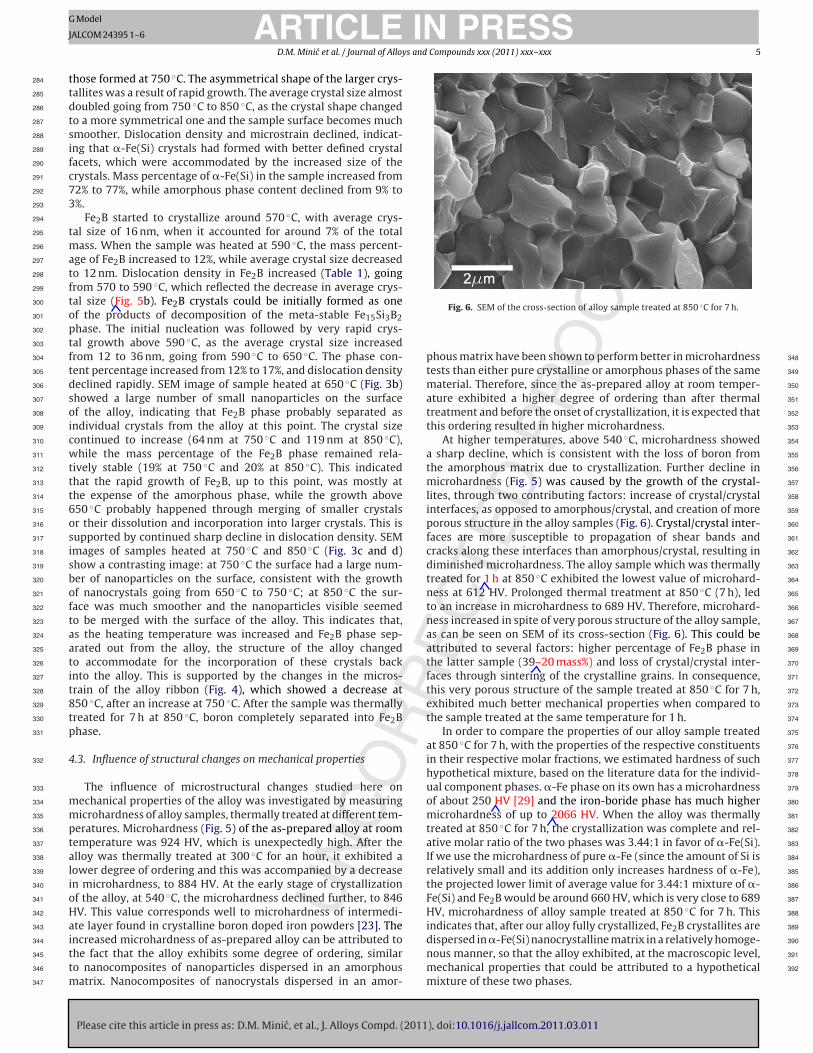
Fig. 6. SEM of the cross-section of alloy sample treated at 850 ◦C for 7 h.
phous matrix have been shown to perform better in microhardness 348
tests than either pure crystalline or amorphous phases of the same 349
material. Therefore, since the as-prepared alloy at room temper- 350
ature exhibited a higher degree of ordering than after thermal 351
treatment and before the onset of crystallization, it is expected that 352
this ordering resulted in higher microhardness. 353
At higher temperatures, above 540 ◦C, microhardness showed 354
a sharp decline, which is consistent with the loss of boron from 355
the amorphous matrix due to crystallization. Further decline in 356
microhardness (Fig. 5) was caused by the growth of the crystal- 357
lites, through two contributing factors: increase of crystal/crystal 358
interfaces, as opposed to amorphous/crystal, and creation of more 359
porous structure in the alloy samples (Fig. 6). Crystal/crystal inter- 360
faces are more susceptible to propagation of shear bands and 361
cracks along these interfaces than amorphous/crystal, resulting in 362
diminished microhardness. The alloy sample which was thermally 363
treated for 1 h at 850 ◦C exhibited the lowest value of microhard- 364
ness at 612 HV. Prolonged thermal treatment at 850 ◦C (7 h), led 365
to an increase in microhardness to 689 HV. Therefore, microhard- 366
ness increased in spite of very porous structure of the alloy sample, 367
as can be seen on SEM of its cross-section (Fig. 6). This could be 368
attributed to several factors: higher percentage of Fe2B phase in 369
the latter sample (39–20 mass%) and loss of crystal/crystal inter- 370
faces through sintering of the crystalline grains. In consequence, 371
this very porous structure of the sample treated at 850 ◦C for 7 h, 372
exhibited much better mechanical properties when compared to 373
the sample treated at the same temperature for 1 h. 374
In order to compare the properties of our alloy sample treated 375
at 850 ◦C for 7 h, with the properties of the respective constituents 376
in their respective molar fractions, we estimated hardness of such 377
hypothetical mixture, based on the literature data for the individ- 378
ual component phases. �-Fe phase on its own has a microhardness 379
of about 250 HV [29] and the iron-boride phase has much higher 380
microhardness of up to 2066 HV. When the alloy was thermally 381
treated at 850 ◦C for 7 h, the crystallization was complete and rel- 382
ative molar ratio of the two phases was 3.44:1 in favor of �-Fe(Si). 383
If we use the microhardness of pure �-Fe (since the amount of Si is 384
relatively small and its addition only increases hardness of �-Fe), 385
the projected lower limit of average value for 3.44:1 mixture of �- 386
Fe(Si) and Fe2B would be around 660 HV, which is very close to 689 387
HV, microhardness of alloy sample treated at 850 ◦C for 7 h. This 388
indicates that, after our alloy fully crystallized, Fe2B crystallites are 389
dispersed in �-Fe(Si) nanocrystalline matrix in a relatively homoge- 390
nous manner, so that the alloy exhibited, at the macroscopic level, 391
mechanical properties that could be attributed to a hypothetical 392
mixture of these two phases.

Please cite this article in press as: D.M. Minic, et al., J. Alloys Compd. (2011), doi:10.1016/j.jallcom.2011.03.011
ARTICLE IN PRESSG Model
JALCOM 24395 1–6
6 D.M. Minic et al. / Journal of Alloys and Compounds xxx (2011) xxx–xxx
5. Conclusions393
Here we present the examination of structural transformations394
of Fe89.8Ni1.5Si5.2B3C0.5 amorphous alloy induced by thermal treat-395
ment and the effect of these transformations on its mechanical396
properties (microhardness in particular). Microhardness of as-397
prepared amorphous alloy was unexpectedly high, 924 HV, because398
the alloy exhibited a degree of ordering which could correspond to a399
structure involving nanoclusters dispersed in an amorphous matrix400
containing boron, which increased microhardness of the alloy. The401
crystallization process was characterized by gradual separation402
of two crystalline phases: �-Fe(Si) and Fe2B, and was completed403
when the sample is thermally treated at 850 ◦C for 7 h, with dis-404
tribution of mass being 61% of �-Fe(Si) and 39% of Fe2B. During405
the crystallization process, we observed a continuous decline in406
the microhardness, starting from 570 ◦C, corresponding to gradual407
separation of boron out of the amorphous alloy into the separate408
Fe2B crystalline phase and formation of nanocrystalline granulated409
structure. This led us to conclude that the presence of boron was410
the major contributor to the microhardness of the amorphous alloy.411
Further growth of Fe2B nanocrystals at higher temperatures led to412
additional decline in microhardness, because the dominant type413
of interface changed from amorphous/crystal to crystal/crystal.414
Microhardness of fully crystallized mixture of �-Fe(Si) and Fe2B415
was close to a calculated average value of microhardness for the416
mixture of the same molar ratios of �-Fe and Fe2B phases.417
Acknowledgements418
The investigation was partially supported by the Ministry of419
Science and Environmental Protection of Serbia, under the follow-420
ing Project and 172015. The work at CEST was supported within421
the COMET program by the Austrian Research Promotion Agency422
(Österreichische Forschungförderungsgesellschaft, FFG) and the423
government of Lower Austria.
References 424
[1] K. Biswas, S. Ram, L. Schultz, J. Eckert, J. Alloys Compd. 397 (2005) 104. 425
[2] A.L. Greer, Curr. Opin. Solid State Mater. 2 (1997) 412. 426
[3] J. Long, M. McHenry, D.P. Urciuoli, V. Keylin, J. Huth, T.E. Salem, J. Appl. Phys. 427
103 (2008) 07E705. 428
[4] L.K. Varga, J. Magn. Magn. Mater. 316 (2007) 442. 429
[5] L.J. Wang, J.Q. Li, S.H. Li, G.Q. Zhang, S.L. Huang, J. Appl. Mech. Mater. 48–49 430
(2011) 246. 431
[6] N. Nishiyama, K. Takenaka, N. Togashi, N. Miura, N. Saidoh, A. Inoue, Inter- 432
metallics 18 (2010) 1983. 433
[7] D.M. Minic, A.M. Maricic, R.Z. Dimitrijevic, M.M. Ristic, J. Alloys Compd. 430 434
(2007) 241. 435
[8] H.F. Li, R.V. Ramanujan, Mater. Sci. Eng. A 375 (377) (2004) 1087–1091. 436
[9] J. Bednarick, R. Nicula, M. Stir, E. Bukel, J. Magn. Magn. Mater. 316 (2007) 437
e823. 438
[10] M.E. McHenry, M.A. Willard, D.E. Laughlin, Prog. Mater. Sci. 44 (1999) 291. 439
[11] M. Aykol, A.O. Mekhrabov, M.V. Akdeniz, Acta Mater. 57 (2009) 171. 440
[12] E.A. Lass, A. Zhu, G.J. Shiflet, S.J. Poon, Acta Mater. 58 (2010) 5460. 441
[13] E. Thirumal, D. Prabhu, K. Chattopadhyay, V. Ravichandran, Phys. Status Solidi 442
A 207 (2010) 2505. 443
[14] S. Bhattacharya, E.A. Lass, S.J. Poon, G.J. Shiflet, J. Alloys Compd. 488 (2009) 79. 444
[15] X.F. Miao, Y.G. Wang, M. Guo, J. Alloys Compd. 509 (2011) 2789. 445
[16] T. Saito, J. Alloys Compd. 505 (2010) 23. 446
[17] H. Jian, W. Luo, S. Tao, M. Yan, J. Alloys Compd. 505 (2010) 315. 447
[18] J.J. Lewandowski, X.J. Gu, A.S. Nouri, S.J. Poon, G.J. Shiflet, Appl. Phys. Lett. 92 448
(2008) 091918. 449
[19] Y.F. Liang, J.P. Lin, F. Ye, Y.J. Li, Y.L. Wang, G.L. Chen, J. Alloys Compd. 504S (2010) 450
S476. 451
[20] E. Salahinejad, R. Amini, E. Askari Bajestani, M.J. Hadianfard, J. Alloys Compd. 452
497 (2010) 369. 453
[21] S. Stankov, M. Miglierini, A.I. Chumakov, I. Sergueev, Y.Z. Yue, B. Sepiol, P. Svec, 454
L. Hu, R. Ruffer, Phys. Rev. B 82 (2010) 144301. 455
[22] L. Battezzati, A. Habib, D. Baldissin, P. Rizzi, J. Alloys Compd. 504S (2010) S48. 456
[23] X. Dong, J. Hu, Z. Huang, H. Wang, R. Gao, Z. Guo, Sci. Sintering 41 (2009) 199. 457
[24] D.M. Minic, A. Gavrilovic, P. Angerer, D.G. Minic, A. Maricic, J. Alloys Compd. 458
482 (2009) 502. 459
[25] A. Kalezic-Glisovic, L. Novakovic, A. Maricic, D. Minic, N. Mitrovic, Mater. Sci. 460
Eng. B 131 (2006) 45. 461
[26] A. Maricic, M.M. Ristic, Sci. Sintering 35 (2003) 31. 462
[27] A.X.S. Bruker, TOPAS V3: General Profile and Structure Analysis Software for 463
Powder Diffraction Data, Karlsruhe, 2005. 464
[28] G.K. Williamson, W. Hall, Acta Metall. 1 (1953) 22. 465
[29] D. Ritter, G. Ravichandran, 15th Technical Meeting DYMAT, Metz, 1–2 June, 466
2006. 467
Copyright © 2022 FDOKUMEN


![2W ^fde_¶e SV cVXZ`_R] eYcVRe+ 3C:4D - Daily Pioneer](https://static.fdokumen.com/doc/165x107/631aa8d85d5809cabd0f7e42/2w-fdee-sv-cvxzr-eycvre-3c4d-daily-pioneer.jpg)