Influence of Impurities on Acid-base Data for Oxide Minerals–Analysis of» Observable «Surface...
11
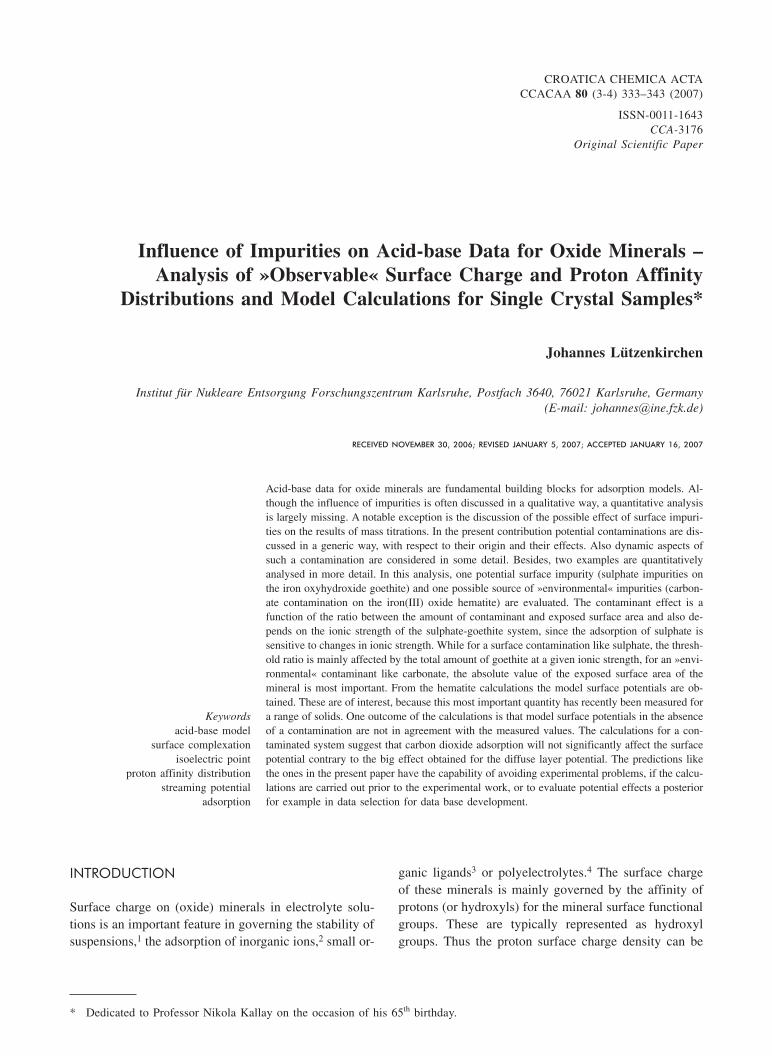
Influence of Impurities on Acid-base Data for Oxide Minerals – Analysis of »Observable« Surface Charge and Proton Affinity Distributions and Model Calculations for Single Crystal Samples* Johannes Lützenkirchen Institut für Nukleare Entsorgung Forschungszentrum Karlsruhe, Postfach 3640, 76021 Karlsruhe, Germany (E-mail: johannes@ine.fzk.de) RECEIVED NOVEMBER 30, 2006; REVISED JANUARY 5, 2007; ACCEPTED JANUARY 16, 2007 Acid-base data for oxide minerals are fundamental building blocks for adsorption models. Al- though the influence of impurities is often discussed in a qualitative way, a quantitative analysis is largely missing. A notable exception is the discussion of the possible effect of surface impuri- ties on the results of mass titrations. In the present contribution potential contaminations are dis- cussed in a generic way, with respect to their origin and their effects. Also dynamic aspects of such a contamination are considered in some detail. Besides, two examples are quantitatively analysed in more detail. In this analysis, one potential surface impurity (sulphate impurities on the iron oxyhydroxide goethite) and one possible source of »environmental« impurities (carbon- ate contamination on the iron(III) oxide hematite) are evaluated. The contaminant effect is a function of the ratio between the amount of contaminant and exposed surface area and also de- pends on the ionic strength of the sulphate-goethite system, since the adsorption of sulphate is sensitive to changes in ionic strength. While for a surface contamination like sulphate, the thresh- old ratio is mainly affected by the total amount of goethite at a given ionic strength, for an »envi- ronmental« contaminant like carbonate, the absolute value of the exposed surface area of the mineral is most important. From the hematite calculations the model surface potentials are ob- tained. These are of interest, because this most important quantity has recently been measured for a range of solids. One outcome of the calculations is that model surface potentials in the absence of a contamination are not in agreement with the measured values. The calculations for a con- taminated system suggest that carbon dioxide adsorption will not significantly affect the surface potential contrary to the big effect obtained for the diffuse layer potential. The predictions like the ones in the present paper have the capability of avoiding experimental problems, if the calcu- lations are carried out prior to the experimental work, or to evaluate potential effects a posterior for example in data selection for data base development. Keywords acid-base model surface complexation isoelectric point proton affinity distribution streaming potential adsorption CROATICA CHEMICA ACTA CCACAA 80 (3-4) 333¿343 (2007) ISSN-0011-1643 CCA-3176 Original Scientific Paper INTRODUCTION Surface charge on (oxide) minerals in electrolyte solu- tions is an important feature in governing the stability of suspensions, 1 the adsorption of inorganic ions, 2 small or- ganic ligands 3 or polyelectrolytes. 4 The surface charge of these minerals is mainly governed by the affinity of protons (or hydroxyls) for the mineral surface functional groups. These are typically represented as hydroxyl groups. Thus the proton surface charge density can be * Dedicated to Professor Nikola Kallay on the occasion of his 65 th birthday.
Transcript of Influence of Impurities on Acid-base Data for Oxide Minerals–Analysis of» Observable «Surface...
Influence of Impurities on Acid-base Data for Oxide Minerals –Analysis of »Observable« Surface Charge and Proton Affinity
Distributions and Model Calculations for Single Crystal Samples*
Johannes Lützenkirchen
Institut für Nukleare Entsorgung Forschungszentrum Karlsruhe, Postfach 3640, 76021 Karlsruhe, Germany
(E-mail: [email protected])
RECEIVED NOVEMBER 30, 2006; REVISED JANUARY 5, 2007; ACCEPTED JANUARY 16, 2007
Acid-base data for oxide minerals are fundamental building blocks for adsorption models. Al-though the influence of impurities is often discussed in a qualitative way, a quantitative analysisis largely missing. A notable exception is the discussion of the possible effect of surface impuri-ties on the results of mass titrations. In the present contribution potential contaminations are dis-cussed in a generic way, with respect to their origin and their effects. Also dynamic aspects ofsuch a contamination are considered in some detail. Besides, two examples are quantitativelyanalysed in more detail. In this analysis, one potential surface impurity (sulphate impurities onthe iron oxyhydroxide goethite) and one possible source of »environmental« impurities (carbon-ate contamination on the iron(III) oxide hematite) are evaluated. The contaminant effect is afunction of the ratio between the amount of contaminant and exposed surface area and also de-pends on the ionic strength of the sulphate-goethite system, since the adsorption of sulphate issensitive to changes in ionic strength. While for a surface contamination like sulphate, the thresh-old ratio is mainly affected by the total amount of goethite at a given ionic strength, for an »envi-ronmental« contaminant like carbonate, the absolute value of the exposed surface area of themineral is most important. From the hematite calculations the model surface potentials are ob-tained. These are of interest, because this most important quantity has recently been measured fora range of solids. One outcome of the calculations is that model surface potentials in the absenceof a contamination are not in agreement with the measured values. The calculations for a con-taminated system suggest that carbon dioxide adsorption will not significantly affect the surfacepotential contrary to the big effect obtained for the diffuse layer potential. The predictions likethe ones in the present paper have the capability of avoiding experimental problems, if the calcu-lations are carried out prior to the experimental work, or to evaluate potential effects a posteriorfor example in data selection for data base development.
Keywords
acid-base modelsurface complexation
isoelectric pointproton affinity distribution
streaming potentialadsorption
CROATICA CHEMICA ACTACCACAA 80 (3-4) 333¿343 (2007)
ISSN-0011-1643CCA-3176
Original Scientific Paper
INTRODUCTION
Surface charge on (oxide) minerals in electrolyte solu-tions is an important feature in governing the stability ofsuspensions,1 the adsorption of inorganic ions,2 small or-
ganic ligands3 or polyelectrolytes.4 The surface chargeof these minerals is mainly governed by the affinity ofprotons (or hydroxyls) for the mineral surface functionalgroups. These are typically represented as hydroxylgroups. Thus the proton surface charge density can be
* Dedicated to Professor Nikola Kallay on the occasion of his 65th birthday.
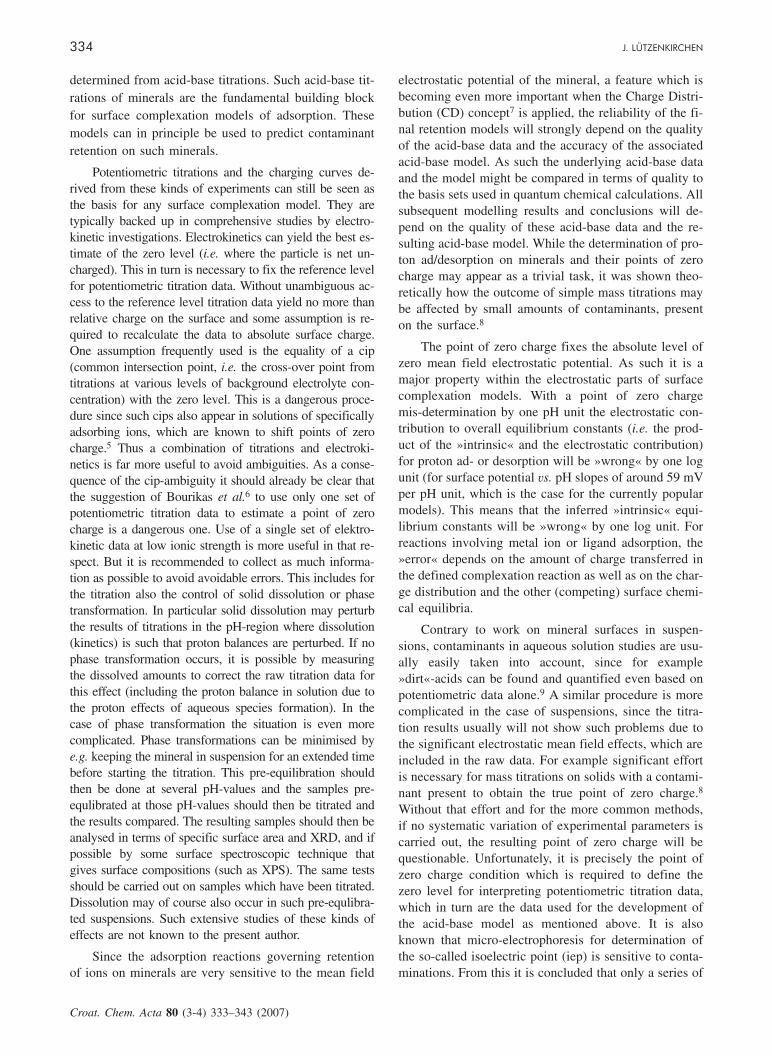
determined from acid-base titrations. Such acid-base tit-rations of minerals are the fundamental building blockfor surface complexation models of adsorption. Thesemodels can in principle be used to predict contaminantretention on such minerals.
Potentiometric titrations and the charging curves de-rived from these kinds of experiments can still be seen asthe basis for any surface complexation model. They aretypically backed up in comprehensive studies by electro-kinetic investigations. Electrokinetics can yield the best es-timate of the zero level (i.e. where the particle is net un-charged). This in turn is necessary to fix the reference levelfor potentiometric titration data. Without unambiguous ac-cess to the reference level titration data yield no more thanrelative charge on the surface and some assumption is re-quired to recalculate the data to absolute surface charge.One assumption frequently used is the equality of a cip(common intersection point, i.e. the cross-over point fromtitrations at various levels of background electrolyte con-centration) with the zero level. This is a dangerous proce-dure since such cips also appear in solutions of specificallyadsorbing ions, which are known to shift points of zerocharge.5 Thus a combination of titrations and electroki-netics is far more useful to avoid ambiguities. As a conse-quence of the cip-ambiguity it should already be clear thatthe suggestion of Bourikas et al.6 to use only one set ofpotentiometric titration data to estimate a point of zerocharge is a dangerous one. Use of a single set of elektro-kinetic data at low ionic strength is more useful in that re-spect. But it is recommended to collect as much informa-tion as possible to avoid avoidable errors. This includes forthe titration also the control of solid dissolution or phasetransformation. In particular solid dissolution may perturbthe results of titrations in the pH-region where dissolution(kinetics) is such that proton balances are perturbed. If nophase transformation occurs, it is possible by measuringthe dissolved amounts to correct the raw titration data forthis effect (including the proton balance in solution due tothe proton effects of aqueous species formation). In thecase of phase transformation the situation is even morecomplicated. Phase transformations can be minimised bye.g. keeping the mineral in suspension for an extended timebefore starting the titration. This pre-equilibration shouldthen be done at several pH-values and the samples pre-equlibrated at those pH-values should then be titrated andthe results compared. The resulting samples should then beanalysed in terms of specific surface area and XRD, and ifpossible by some surface spectroscopic technique thatgives surface compositions (such as XPS). The same testsshould be carried out on samples which have been titrated.Dissolution may of course also occur in such pre-equlibra-ted suspensions. Such extensive studies of these kinds ofeffects are not known to the present author.
Since the adsorption reactions governing retentionof ions on minerals are very sensitive to the mean field
electrostatic potential of the mineral, a feature which isbecoming even more important when the Charge Distri-bution (CD) concept7 is applied, the reliability of the fi-nal retention models will strongly depend on the qualityof the acid-base data and the accuracy of the associatedacid-base model. As such the underlying acid-base dataand the model might be compared in terms of quality tothe basis sets used in quantum chemical calculations. Allsubsequent modelling results and conclusions will de-pend on the quality of these acid-base data and the re-sulting acid-base model. While the determination of pro-ton ad/desorption on minerals and their points of zerocharge may appear as a trivial task, it was shown theo-retically how the outcome of simple mass titrations maybe affected by small amounts of contaminants, presenton the surface.8
The point of zero charge fixes the absolute level ofzero mean field electrostatic potential. As such it is amajor property within the electrostatic parts of surfacecomplexation models. With a point of zero chargemis-determination by one pH unit the electrostatic con-tribution to overall equilibrium constants (i.e. the prod-uct of the »intrinsic« and the electrostatic contribution)for proton ad- or desorption will be »wrong« by one logunit (for surface potential vs. pH slopes of around 59 mVper pH unit, which is the case for the currently popularmodels). This means that the inferred »intrinsic« equi-librium constants will be »wrong« by one log unit. Forreactions involving metal ion or ligand adsorption, the»error« depends on the amount of charge transferred inthe defined complexation reaction as well as on the char-ge distribution and the other (competing) surface chemi-cal equilibria.
Contrary to work on mineral surfaces in suspen-sions, contaminants in aqueous solution studies are usu-ally easily taken into account, since for example»dirt«-acids can be found and quantified even based onpotentiometric data alone.9 A similar procedure is morecomplicated in the case of suspensions, since the titra-tion results usually will not show such problems due tothe significant electrostatic mean field effects, which areincluded in the raw data. For example significant effortis necessary for mass titrations on solids with a contami-nant present to obtain the true point of zero charge.8
Without that effort and for the more common methods,if no systematic variation of experimental parameters iscarried out, the resulting point of zero charge will bequestionable. Unfortunately, it is precisely the point ofzero charge condition which is required to define thezero level for interpreting potentiometric titration data,which in turn are the data used for the development ofthe acid-base model as mentioned above. It is alsoknown that micro-electrophoresis for determination ofthe so-called isoelectric point (iep) is sensitive to conta-minations. From this it is concluded that only a series of
334 J. LÜTZENKIRCHEN
Croat. Chem. Acta 80 (3-4) 333¿343 (2007)
experiments and preferably from different set-ups hasthe potential to reveal problems or alternatively allowthe development of a model that has to describe thosedata sets.
To conclude this introduction it is important to statethat it requires some effort to obtain a contaminant freemineral (or rather a mineral free of significant contami-nations) as will be detailed in the next section. One aimof the present contribution is to exemplify potentialsources of contaminations. This is done in a generic waywithout attempting to quantify effects but rather pointingto the existing problems. The generic examples, whichwill be discussed, may yield an indication how difficulta critical evaluation of published acid-base data may be,in particular when only limited information has beenpublished on procedures.
The other purpose of this paper is to use some wellaccepted state of the art models to study the effect ofimpurities on (i) potentiometric titration curves and thederivatives of charging curves of the iron(III) oxyhydrox-ide goethite and (ii) on experimental work on small surfacearea samples (single crystals) of hematite.
POTENTIAL SOURCES OF IMPURITIES
There are several groups of potential impurities whichmay affect potentiometric titrations. The following list isnot meant to be complete. Overall three sources will bedistinguished here for the sake of illustration. Note thatcontaminants like carbonate may originate from severalsources.
Impurities due to Mineral Production Procedures. –
Within this group of contaminations, various impuritiesmay occur. When a mineral is produced in the laboratorythe chemicals used may include impurities, which maythen be incorporated into the solid. They may also beclose to surface of that solid and create some kind of de-fect structure, which may in turn affect surface properties.They may also be enriched at the interface itself. It is of-ten observed that residual amounts of ions involved inthe preparation procedure are difficult to remove. Some-times, history-dependency or some kind of »memory-ef-fect«10,11 have been invoked to discuss a preferential in-teraction between the solid and such ions. Due to this,such impurities are not only difficult to remove, they mayalso interact with the surfaces in a surprisingly strong wayafter having been removed (e.g. when being used as partof the »inert« background electrolyte). Another group ofimpurities would be »adventitious« chemicals, which in-trude during the preparation from the environment (suchas carbon dioxide), from reaction vessels (such as silicaor organics from glass or plastic containers, respectively)from dialysis tubes etc.
Impurities due to Chemicals Added in the Course of a
Potentiometric Titration. – Such impurities may be in-cluded in the background electrolyte itself. Generally thechemicals used to fix the »inert« background electrolyteconcentration for a titration may include anionic or ca-tionic impurities, which may be involved in aqueousacid-base reactions or adsorbed. Both effects will lead toerrors in the »ideal« (i.e. the expected or assumed) pro-ton balance, which will be applied to the raw potentio-metric data to obtain surface charge data (the analysis ofthe raw data relies on the assumptions that there are noimpurities). This can to some extent be avoided via blankcorrections, but in case the impurity adsorbs and affectsproton balances, the blank correction is incorrect. Simi-lar problems are introduced via titrant solutions in casethey have been adjusted to the same electrolyte concen-tration as the background electrolyte in the titration vesselto minimise changes in aqueous species activity coeffi-cients (constant ionic medium). Furthermore, a potentialsource of carbon dioxide can be seen in base solutionsused as titrants or as reagents to fix a basic starting pointof the titration. Here, the introduced error in the data istwofold. Not only will carbonate typically adsorb to themineral surface, but the OH concentration in the base so-lution will also be affected and the expected proton ba-lance will not be valid. The overall effect will depend onthe relative amount of the impurities, i.e. if the amountof impurities is sufficiently low the effect may be ne-glected, or if the impurity does not adsorb, the blankcorrection will allow a correct result.
Impurities due to Adventitious (»Environmental«) Intru-
sions During the Tirations. – Here, the contaminantsmay come from components of reaction vessels (titrationvessels themselves, e.g. glass), material intruding into thesuspension (such as electrodes) or from air or »inert« gas.In this class of contaminations, silica would be a poten-tial problem, but the most important issue is typicallycarbon dioxide, since even the »inert« gas used to avoidcarbon dioxide may include traces of it. Since the gas isusually continuously bubbled through or flowed over thesuspension, it would provide a source of carbon dioxideand the titration vessel would then correspond to a sys-tem open to carbon dioxide. When the titration vesselitself is not entirely closed to the atmosphere, carbondioxide may leak into the vessel and affect the results. Inthese intrusion reactions, kinetic aspects may interfere,i.e. it is usually not justified to assume equilibrium con-centrations for example with respect to carbon dioxideconcentrations or glass/silica dissolution.
The consequences of the various impurities are dif-ferent. Their effects will depend on their relative abun-dance but also on the boundary conditions and the dy-namics of the contaminant intrusion into the system. Inthe following some of these issues will be discussed.
IMPURITIES AND ACID-BASE DATA FOR OXIDE MINERALS 335
Croat. Chem. Acta 80 (3-4) 333¿343 (2007)
Abundance of Impurities
This is a rather obvious issue, since the overall effect ofan impurity will be related to its relative abundance withrespect to other relevant reactants. In titration experi-ments the exposed surface area (the amount of reactivesurface functional groups), the concentrations of titrantsolutions and the concentrations of protons (hydroxyls)in solution are the crucial reactants. Of course the rela-tive reactivities of all the components must also be con-sidered.
Boundary Conditions
Boundary conditions can be discussed in terms of a car-bonate contamination. If carbonate is present only due toan initially adsorbed or dissolved amount, which is thennot removed from the system by purging with inert gas,carbonate should be treated as a component for whichthe total concentration is known. This is the case for aclosed system such as streaming potential set-ups, wheresolutions are pumped back and forth. If on the otherhand carbon dioxide intrudes only from a pollution ofthe titrant, the total concentration will change as a func-tion of titrant addition. Finally, if the source of carbondioxide is the gas phase, the free concentration of dis-solved carbon dioxide would be constant (given the par-tial pressure of carbon dioxide remains constant) andthis would result in variable overall contaminant concen-trations as a function of pH. These effects may occur si-multaneously in the case of carbonate. However, for thesimulations presented later, either a constant total con-centration of inorganic carbon or a constant partial pres-sure of CO2 will be assumed. These are idealised bound-ary conditions, since the closed system with a total con-centration of carbonate is not realistic for any titrationset-up, since titrant solutions are added in the course of atitration.
Another potential contamination, which is not atconstant concentration but where the concentration va-ries with the added volume of titrant in particular basetitrant, might be silica which may be leached from aglass burette (e.g. assuming a glass burette is used).
Dynamics of Contaminant Intrusion
This issue is related to the kinetics of a process whichmay lead to the intrusion of a contaminant into a system.It has been shortly addressed above with respect to car-bonate and the choice of boundary conditions. It is con-venient to discuss silica as an example in this context.One possible source for silica contamination would be aglass vessel used as a titration reactor. A glass burette(either intruding the solution in the solution in a titrationvessel or in contact with acidic and basic solution, whichis added to the titration vessel) or the glass electrode it-self would be other examples. Considering that the equi-
librium solubility of quartz is 0.1 mmol dm–3 there is atleast the danger that silica may dissolve from glass ma-terial in substantial amounts (although there is no men-tion of that in the literature with respect to titrations, butit is not clear whether someone has attempted to evalu-ate this experimentally). It is known that the kinetics ofquartz dissolution at constant ionic strength depends onpH. However, dissolution rates are not very high, so thatthe extent of potential/possible silica in solution in sucha system will be affected by the concomitant effect ofthe overall duration of the titration, exposure to extremepH values and the ionic strength. Furthermore, the inter-action of silica with the titrated mineral will be of im-portance, since silica adsorption will keep the gradientfor glass dissolution high. Even silica adsorption is afunction of pH, such that a very complex system is cre-ated. It would be highly interesting to study such a com-plex system systematically both from a modelling andan experimental point of view. The main question ofcourse is whether dissolution of silica bearing materialreally occurs and if that will result in significant amounts(i.e. amounts that will affect proton balances).
Another »dynamic« aspect might be an impuritywhich is present at the mineral surface due to the synthe-sis and which was not or could not be removed in wash-ing/cleaning procedures. As indicated above the »mem-ory« effect may cause slow equilibration e.g. with re-spect to desorption of an ion. As an example to bediscussed in more detail below, certain commercialgoethites made from sulphate containing solutions in-clude a sulphate impurity. Although based on equilib-rium studies sulphate will desorb at high pH it may bedifficult to remove such a sulphate impurity fromgoethite. This may explain the low points of zero charge,which are often reported for commercial samples. Withrespect to titrations the extent to which desorption fromsuch samples (desorption at equilibrium is a function ofpH and ionic strength) may interfere with proton bal-ances may depend on the equilibration times chosen forthe titration (steps), in particular if desorption is slow.Kinetic effects may also explain observed hysteresis intitration curves, which often are reported to disappear af-ter some runs on the same sample, i.e. after repeated ex-posure to the extreme pH-values in such a titration. In-herited contaminations (in terms of excess ions) fromthe sample preparation are a puzzling issue. Theo-retically, it is impossible to remove counter-ions quanti-tatively from a mineral except for the case where themineral has a pristine point of zero charge of 7. In allother cases, there will be more or less significant resid-ual charge on minerals when washing with distilled wa-ter is pursued. Although at the expected low ionic strengththe charging curve around the point of zero charge (pzc)will become diffuse layer controlled and will have a verylow slope, some residual counter-ions must be there to
336 J. LÜTZENKIRCHEN
Croat. Chem. Acta 80 (3-4) 333¿343 (2007)
counter-balance that charge. Consequently, washing cannotremove this residual counter-charge. A most illustrativeexperiment would be washing of such a mineral in acolumn. At equilibrium the pH of the outlet solutionmust be that of the inlet solution (i.e. pH = 7). The mi-neral with say a pzc of 10 would be exposed to a pH = 7solution in the column and therefore have some (residual)charge. Consequently, the counter-ions that assure theelectro-neutrality of the system cannot be removed.
SYSTEMS CHOSEN FOR DETAILEDQUANTITATIVE ANALYSIS
Based on the discussion of the above potential impuri-ties, two examples have been chosen for more detaileddiscussion. One is an assumed surface impurity. As indi-cated above sulphate may be found on commercial goe-thite samples. Thus the sulphate-goethite-system mayserve as a realistic example. The other case to be discus-sed is an adventitious contamination, namely carbon di-oxide. Here the interaction of dissolved inorganic carbonwith hematite is considered to be of interest. Over thelast decade experiments with single crystals have gainedimportance. Single crystals are taken as the ideal sub-strates for studying mechanisms of adsorption, sincethey are expected to be best characterised in terms ofsurface structure. This is assumed based on known crys-tal structures, but in reality the presence of water maychange the ideal surface structure. A variety of differenttechniques has been applied in studies on reactions atsingle crystal-electrolyte interfaces, ranging from X-rayabsorption spectroscopy, over X-ray standing waves tosum frequency generation/second harmonic methods.Measurements of interaction forces between such singlecrystals or between a colloidal probe and a single crystalare another class of experiments. Streaming potentialmeasurements12 are capable of yielding classical electro-kinetic data on such substrates.
Compared to streaming potential measurementswith particles, where larger surface areas are involved, apotential problem with all the single crystal work is thata small surface area is exposed to the aqueous phase.The volume of the solution is usually not specified byauthors of the relevant experimental work. Furthermore,the presence of carbonate is typically not discussed. Inthis context, it is worthwhile to mention a paper by Ganand Franks.13 These authors studied charging of gibbsitebasal planes with an AFM colloidal probe technique(force distance curves). As in streaming potential meas-urements these kinds of experiments involve very smallsurface areas. The solution volume in contact with theprobes (the basal planes and the colloidal particle graft-ed to the AFM tip) is not given in the experimental partof the paper. However, Gan and Franks13 explicitly dis-cuss carbon dioxide contamination. They state that their
solutions were not degassed, thus carbon dioxide wasmost probably present. As one potential consequence ofthis intrusion they mention small drifts of pH. They fur-thermore claim that since bicarbonate cannot »contributea positive charge to the gibbsite surface«, the effect ofcarbon dioxide in the solution may be safely excluded.However, they do not discuss the possibility that the ad-sorption of carbonate species may contribute negativecharge to the gibbsite and thus be able to shift isoelectricpoints, an issue which is documented for a number ofsystems.14 This will obviously affect the elelctrostaticsof the interfaces and consequently the results of forcedistance measurements.
For many experiments, which are sensitive to min-eral surface charge, it is difficult to consequently exclu-de carbonate because the setup has simply not been de-signed for that purpose. Therefore, it is useful to applysome model calculations to evaluate the threshold ofcarbonate interference compared to a carbonate free en-vironment. Boundary conditions have been discussedabove and will be applied accordingly.
Sulfate on Goethite
As indicated above, sulphate is a potential impurity oncommercial goethite. Sulphate adsorption on goethite hasbeen studied on a sulphate-free goethite sample (synthe-sized from ferric chloride solutions) and a mechanisticmodel has been obtained15 for the adsorption and pro-ton-co-adsorption data. The model is not in conflict witha set of spectroscopic data available for that system.This model by Rietra15 is used here to calculate titrationcurves in the absence and presence of sulphate. The pur-pose of the model calculations is to obtain an idea abouttypical threshold concentrations, at which the impuritywill significantly affect measurement results, when com-pared to impurity-free conditions.
Carbonate on Hematite
As mentioned above carbonate may originate from allkinds of sources. It may already pollute the solid duringits synthesis, e.g. when hydrous ferric oxide is precipi-tated it may be present in the base solution. This maylead to residual carbonate content in the solid. To whatextent such contamination can be removed by washingand/or bubbling with pure gas is an open issue. Boily et
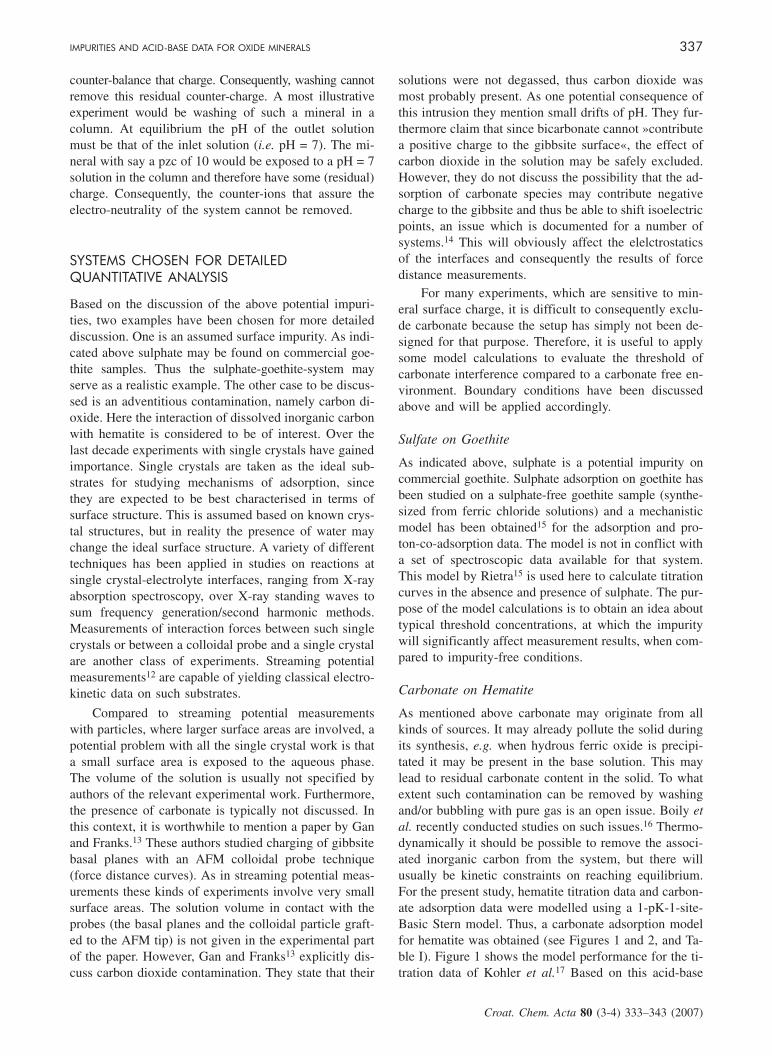
al. recently conducted studies on such issues.16 Thermo-dynamically it should be possible to remove the associ-ated inorganic carbon from the system, but there willusually be kinetic constraints on reaching equilibrium.For the present study, hematite titration data and carbon-ate adsorption data were modelled using a 1-pK-1-site-Basic Stern model. Thus, a carbonate adsorption modelfor hematite was obtained (see Figures 1 and 2, and Ta-ble I). Figure 1 shows the model performance for the ti-tration data of Kohler et al.17 Based on this acid-base
IMPURITIES AND ACID-BASE DATA FOR OXIDE MINERALS 337
Croat. Chem. Acta 80 (3-4) 333¿343 (2007)
model the carbonate adsorption data of Kohler et al.17
were evaluated and the performance of the carbonate ad-sorption model is shown in Figure 2. The model wasused subsequently to calculate potentials at the head-endof the diffuse layer to obtain the »would-be-observed«isoelectric points of hematite as a function of total car-bonate concentration or carbon dioxide partial pressure.Also the sensitivity of surface potential measurements onhematite to carbon dioxide contamination may be eva-luated in this way.
METHODS
Calculations were carried out using either a modifiedversion of FITEQL2.118 or ECOSAT.19 The former wasused for inverse modelling of the hematite systems (i.e.
parameter optimisation) and for forward modelling ofhematite systems under conditions relevant to streamingpotential measurements. ECOSAT was applied to thegoethite system to first calculate »observable« surfacecharge density vs. pH curves. To this end, actually pro-ton consuming or producing species were used. Then theresults were used to compute proton affinity spectra byspline fitting the »observable« or »measurable« surfacecharge vs. pH curves and obtaining the first derivativecurve of these. The terms »observable« and »measur-able« indicate that the surface charge density in the out-put of ECOSAT calculations cannot be used directlysince they also include surface charge contributed by theadsorbed sulphate ions. Instead proper proton balanceshave to be applied to surface and solution equilibria asindicated above.
RESULTS AND DISCUSSIONS
Sulphate on Goethite
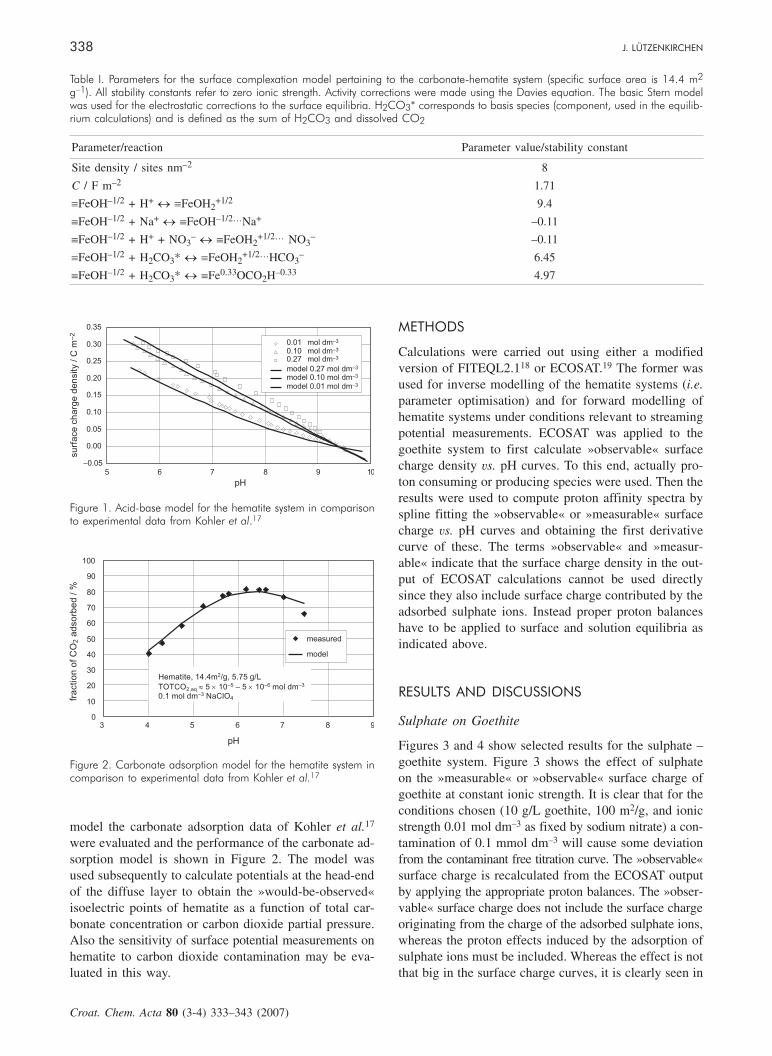
Figures 3 and 4 show selected results for the sulphate –goethite system. Figure 3 shows the effect of sulphateon the »measurable« or »observable« surface charge ofgoethite at constant ionic strength. It is clear that for theconditions chosen (10 g/L goethite, 100 m2/g, and ionicstrength 0.01 mol dm–3 as fixed by sodium nitrate) a con-tamination of 0.1 mmol dm–3 will cause some deviationfrom the contaminant free titration curve. The »observable«surface charge is recalculated from the ECOSAT outputby applying the appropriate proton balances. The »obser-vable« surface charge does not include the surface chargeoriginating from the charge of the adsorbed sulphate ions,whereas the proton effects induced by the adsorption ofsulphate ions must be included. Whereas the effect is notthat big in the surface charge curves, it is clearly seen in
338 J. LÜTZENKIRCHEN
Croat. Chem. Acta 80 (3-4) 333¿343 (2007)
–0.05
0.00
0.05
0.10
0.15
0.20
0.25
0.30
0.35
5 6 7 8 9 10
pH
su
rfa
ce
ch
arg
ed
en
sity
/C
m–
2
0.01 mol dm–3
0.10 mol dm–3
0.27 mol dm–3
model 0.27 mol dm–3
model 0.10 mol dm–3
model 0.01 mol dm–3
Figure 1. Acid-base model for the hematite system in comparisonto experimental data from Kohler et al.17
0
10
20
30
40
50
60
70
80
90
100
3 4 5 6 7 8 9
pH
fra
ctio
no
fC
Oa
dso
rbe
d/
%2 measured
model
Hematite, 14.4m /g, 5.75 g/L
TOTCO 5 10 – 5 10 mol dm0.1 mol dm NaClO
2
2,aq–5 –6 –3
–34
» ´ ´
Figure 2. Carbonate adsorption model for the hematite system incomparison to experimental data from Kohler et al.17
Table I. Parameters for the surface complexation model pertaining to the carbonate-hematite system (specific surface area is 14.4 m2
g–1). All stability constants refer to zero ionic strength. Activity corrections were made using the Davies equation. The basic Stern modelwas used for the electrostatic corrections to the surface equilibria. H2CO3* corresponds to basis species (component, used in the equilib-rium calculations) and is defined as the sum of H2CO3 and dissolved CO2
Parameter/reaction Parameter value/stability constant
Site density / sites nm–2 8
C / F m–2 1.71
ºFeOH–1/2 + H+« ºFeOH2
+1/2 9.4
ºFeOH–1/2 + Na+« ºFeOH–1/2…Na+ –0.11
ºFeOH–1/2 + H+ + NO3–
« ºFeOH2+1/2… NO3
– –0.11
ºFeOH–1/2 + H2CO3* « ºFeOH2+1/2…HCO3
– 6.45
ºFeOH–1/2 + H2CO3* « ºFe0.33OCO2H–0.33 4.97
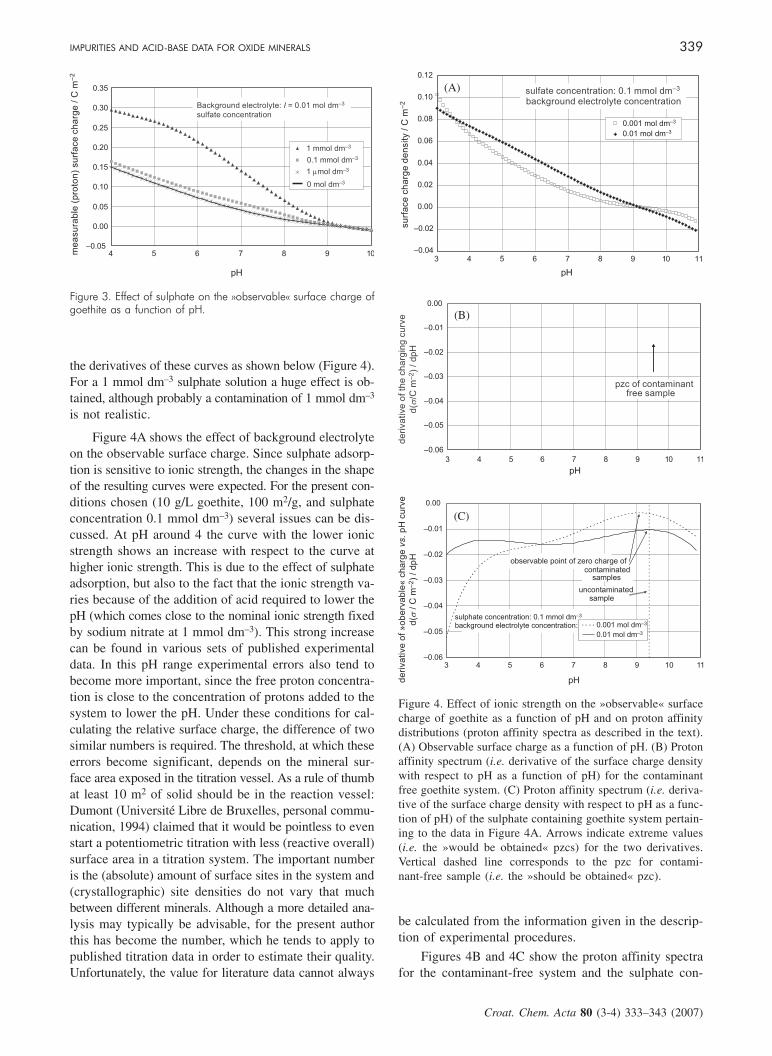
the derivatives of these curves as shown below (Figure 4).For a 1 mmol dm–3 sulphate solution a huge effect is ob-tained, although probably a contamination of 1 mmol dm–3
is not realistic.
Figure 4A shows the effect of background electrolyteon the observable surface charge. Since sulphate adsorp-tion is sensitive to ionic strength, the changes in the shapeof the resulting curves were expected. For the present con-ditions chosen (10 g/L goethite, 100 m2/g, and sulphateconcentration 0.1 mmol dm–3) several issues can be dis-cussed. At pH around 4 the curve with the lower ionicstrength shows an increase with respect to the curve athigher ionic strength. This is due to the effect of sulphateadsorption, but also to the fact that the ionic strength va-ries because of the addition of acid required to lower thepH (which comes close to the nominal ionic strength fixedby sodium nitrate at 1 mmol dm–3). This strong increasecan be found in various sets of published experimentaldata. In this pH range experimental errors also tend tobecome more important, since the free proton concentra-tion is close to the concentration of protons added to thesystem to lower the pH. Under these conditions for cal-culating the relative surface charge, the difference of twosimilar numbers is required. The threshold, at which theseerrors become significant, depends on the mineral sur-face area exposed in the titration vessel. As a rule of thumbat least 10 m2 of solid should be in the reaction vessel:Dumont (Université Libre de Bruxelles, personal commu-nication, 1994) claimed that it would be pointless to evenstart a potentiometric titration with less (reactive overall)surface area in a titration system. The important numberis the (absolute) amount of surface sites in the system and(crystallographic) site densities do not vary that muchbetween different minerals. Although a more detailed ana-lysis may typically be advisable, for the present authorthis has become the number, which he tends to apply topublished titration data in order to estimate their quality.Unfortunately, the value for literature data cannot always
be calculated from the information given in the descrip-tion of experimental procedures.
Figures 4B and 4C show the proton affinity spectrafor the contaminant-free system and the sulphate con-
IMPURITIES AND ACID-BASE DATA FOR OXIDE MINERALS 339
Croat. Chem. Acta 80 (3-4) 333¿343 (2007)
–0.05
0.00
0.05
0.10
0.15
0.20
0.25
0.30
0.35
4 5 6 7 8 9 10
pH
me
asu
rab
le(p
roto
n)
su
rfa
ce
ch
arg
e/
Cm
–2
1 mmol dm–3
0.1 mmol dm–3
1 mol dmm –3
0 mol dm–3
Background electrolyte: = 0.01 mol dmI –3
sulfate concentration
Figure 3. Effect of sulphate on the »observable« surface charge ofgoethite as a function of pH.
–0.04
–0.02
0.00
0.02
0.04
0.06
0.08
0.10
0.12
3 4 5 6 7 8 9 10 11
pH
su
rfa
ce
ch
arg
ed
en
sity
/C
m–
2
0.001 mol dm–3
sulfate concentration: 0.1 mmol dm–3
background electrolyte concentration
0.01 mol dm–3
(A)
–0.06
–0.05
–0.04
–0.03
–0.02
–0.01
0.00
3 4 5 6 7 8 9 10 11
pH
pzc of contaminantfree sample
de
riva
tive
ofth
ech
arg
ing
cu
rve
d(
/Cm
)/
dp
Hs
–2
(B)
pH
–0.06
–0.05
–0.04
–0.03
–0.02
–0.01
0.00
3 4 5 6 7 8 9 10 11
de
riva
tive
of
»o
be
rva
ble
«ch
arg
ep
Hcu
rve
d(
/C
m)
/dp
H
vs.
s–
2
0.001 mol dm–3
0.01 mol dm–3
sulphate concentration: 0.1 mmol dm–3
background electrolyte concentration:
observable point of zero charge of
uncontaminatedsample
contaminatedsamples
pH
(C)
Figure 4. Effect of ionic strength on the »observable« surfacecharge of goethite as a function of pH and on proton affinitydistributions (proton affinity spectra as described in the text).(A) Observable surface charge as a function of pH. (B) Protonaffinity spectrum (i.e. derivative of the surface charge densitywith respect to pH as a function of pH) for the contaminantfree goethite system. (C) Proton affinity spectrum (i.e. deriva-tive of the surface charge density with respect to pH as a func-tion of pH) of the sulphate containing goethite system pertain-ing to the data in Figure 4A. Arrows indicate extreme values(i.e. the »would be obtained« pzcs) for the two derivatives.Vertical dashed line corresponds to the pzc for contami-nant-free sample (i.e. the »should be obtained« pzc).
taining systems, respectively. The derivative for the con-taminant free system yields the pzc in agreement withthe suggestion of Bourikas et al.6 However, the protonaffinity spectra in the presence of the contamination(Figure 4C) show significant deviations from the mastercurve in Figure 4B. Therefore, the derivative may yieldsome indication on the quality of the titration data. Theshift of the extremum close to the pristine point of zerocharge of the sample is relatively small for the higherionic strength. It is questionable whether this differencecould be obtained experimentally. For the lower ionicstrength a stronger shift is obtained and this shift makesit apparent that the measurement of just one titrationcurve is not enough to safely determine a point of zerocharge no matter which method is used. If the presenceof a contaminant is not known the derivative method asproposed by Bourikas et al.6 may yield the wrong pzc(as would other methods if only one data set is collect-ed) and if only one such curve is available there is no in-formation that might help raise suspicion (except theshape of the derivative curve). It is noteworthy that theshapes of the curves in Figure 4C are quite similar tothose of an experimental affinity spectrum published byPrélot et al.20 on a commercial goethite. Compared tothe sulphate-goethite-system chosen for illustration, theeffect of a contaminant on the pzc would be muchstronger if adsorption of the contaminant at the pzc weremore important.
As a conclusion of the presented results, it is obvi-ous that surface impurities may strongly affect experi-mental results. The present model calculations are instriking agreement with published experimental resultson a commercial goethite sample. It is furthermore con-cluded, that such impurities are difficult to identify if aminimised approach to pzc determination is chosen. Asdiscussed in the introduction a wrong pzc will have se-vere repercussions on a surface complexation model.Furthermore, the impurity will also interfere in other ex-periments such as metal ion adsorption experiments.Therefore, an extended acid-base study is recommendedto (i) identify potential impurities and (ii) make sure aproper acid-base model can be developed.
Carbonate on Hematite
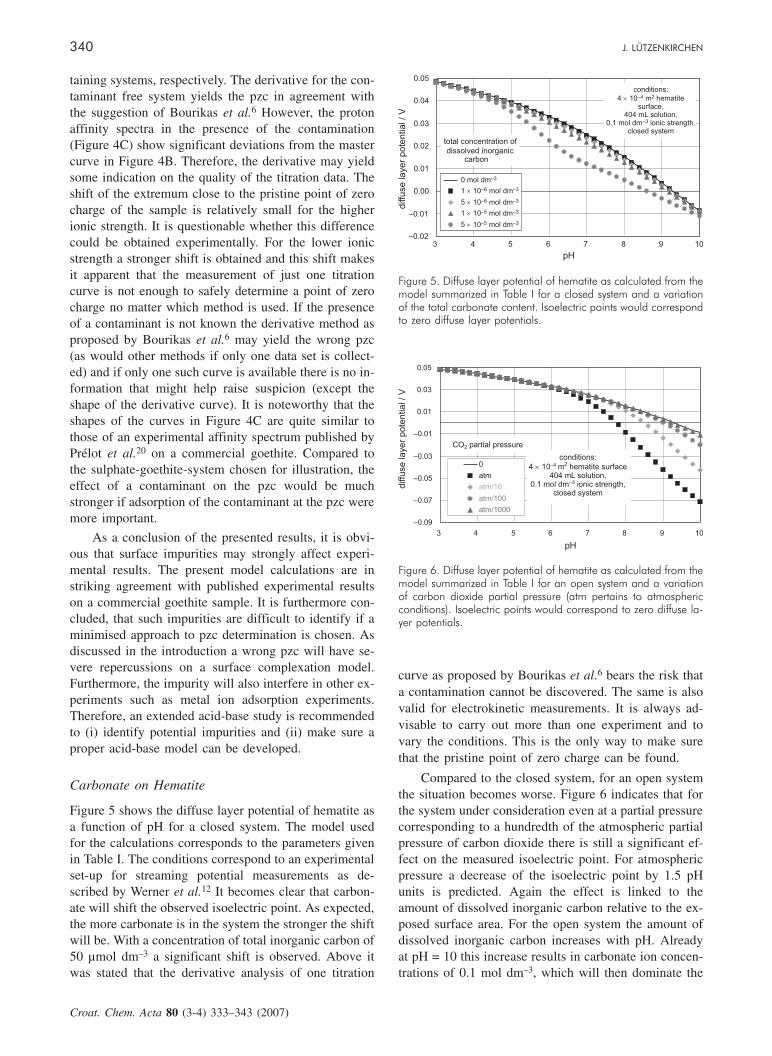
Figure 5 shows the diffuse layer potential of hematite asa function of pH for a closed system. The model usedfor the calculations corresponds to the parameters givenin Table I. The conditions correspond to an experimentalset-up for streaming potential measurements as de-scribed by Werner et al.12 It becomes clear that carbon-ate will shift the observed isoelectric point. As expected,the more carbonate is in the system the stronger the shiftwill be. With a concentration of total inorganic carbon of50 µmol dm–3 a significant shift is observed. Above itwas stated that the derivative analysis of one titration
curve as proposed by Bourikas et al.6 bears the risk thata contamination cannot be discovered. The same is alsovalid for electrokinetic measurements. It is always ad-visable to carry out more than one experiment and tovary the conditions. This is the only way to make surethat the pristine point of zero charge can be found.
Compared to the closed system, for an open systemthe situation becomes worse. Figure 6 indicates that forthe system under consideration even at a partial pressurecorresponding to a hundredth of the atmospheric partialpressure of carbon dioxide there is still a significant ef-fect on the measured isoelectric point. For atmosphericpressure a decrease of the isoelectric point by 1.5 pHunits is predicted. Again the effect is linked to theamount of dissolved inorganic carbon relative to the ex-posed surface area. For the open system the amount ofdissolved inorganic carbon increases with pH. Alreadyat pH = 10 this increase results in carbonate ion concen-trations of 0.1 mol dm–3, which will then dominate the
340 J. LÜTZENKIRCHEN
Croat. Chem. Acta 80 (3-4) 333¿343 (2007)
–0.02
–0.01
0.00
0.01
0.02
0.03
0.04
0.05
3 4 5 6 7 8 9 10
pH
diffu
se
laye
rp
ote
ntia
l/
V
0 mol dm–3
1 10 mol dm´ –6 –3
5 10 mol dm´ –6 –3
1 10 mol dm´ –5 –3
5 10 mol dm´ –5 –3
conditions:
4 10 m hematitesurface,
404 mL solution,0.1 mol dm ionic strength,
closed system
´ –4 2
–3
total concentration of
dissolved inorganiccarbon
Figure 5. Diffuse layer potential of hematite as calculated from themodel summarized in Table I for a closed system and a variationof the total carbonate content. Isoelectric points would correspondto zero diffuse layer potentials.
–0.09
–0.07
–0.05
–0.03
–0.01
0.01
0.03
0.05
3 4 5 6 7 8 9 10
pH
diffu
se
laye
rp
ote
ntia
l/
V
0
atm
atm/10
atm/100
atm/1000
conditions:
4 10 m hematite surface404 mL solution,
0.1 mol dm ionic strength,closed system
´ –4 2
–3
·
CO partial pressure2
Figure 6. Diffuse layer potential of hematite as calculated from themodel summarized in Table I for an open system and a variationof carbon dioxide partial pressure (atm pertains to atmosphericconditions). Isoelectric points would correspond to zero diffuse la-yer potentials.
ionic strength and additionally affect the zeta potential.The (additional) amount of hydroxide required to obtainsuch high pH values may accentuate the effect. FromFigure 6 it can be seen that with increasing partial pres-sure the zeta potential pH relationships become steeper.
Recently a new approach to measuring surface po-tentials has been published and applied to hematite.21,22
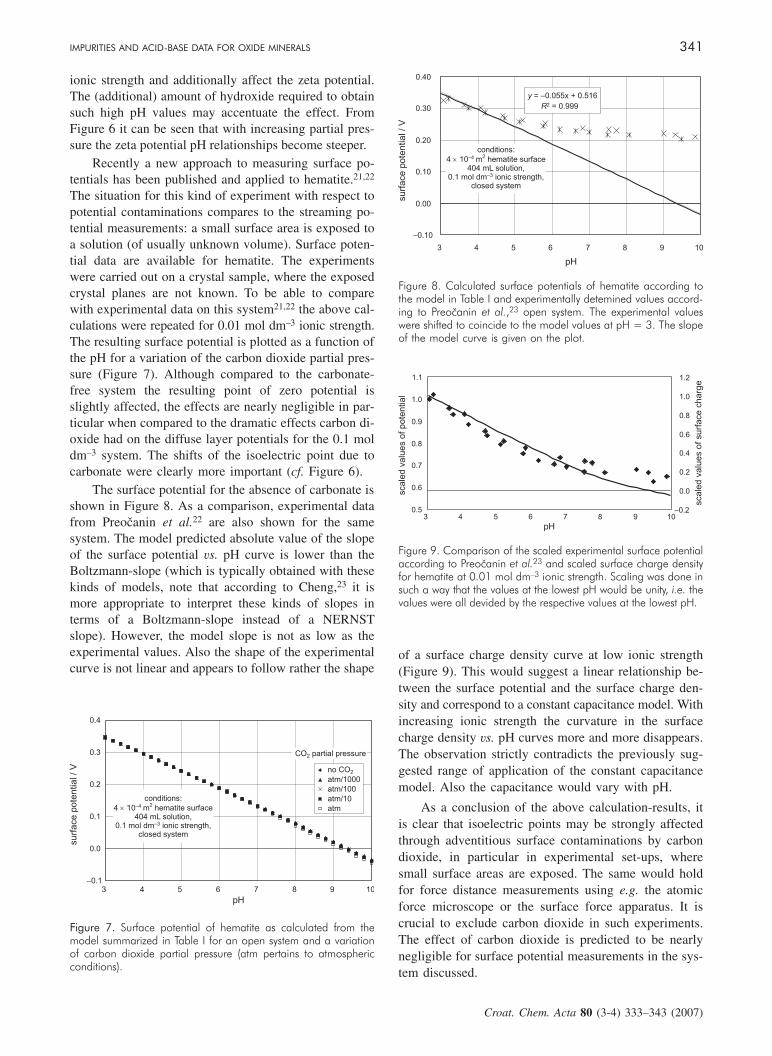
The situation for this kind of experiment with respect topotential contaminations compares to the streaming po-tential measurements: a small surface area is exposed toa solution (of usually unknown volume). Surface poten-tial data are available for hematite. The experimentswere carried out on a crystal sample, where the exposedcrystal planes are not known. To be able to comparewith experimental data on this system21,22 the above cal-culations were repeated for 0.01 mol dm–3 ionic strength.The resulting surface potential is plotted as a function ofthe pH for a variation of the carbon dioxide partial pres-sure (Figure 7). Although compared to the carbonate-free system the resulting point of zero potential isslightly affected, the effects are nearly negligible in par-ticular when compared to the dramatic effects carbon di-oxide had on the diffuse layer potentials for the 0.1 moldm–3 system. The shifts of the isoelectric point due tocarbonate were clearly more important (cf. Figure 6).
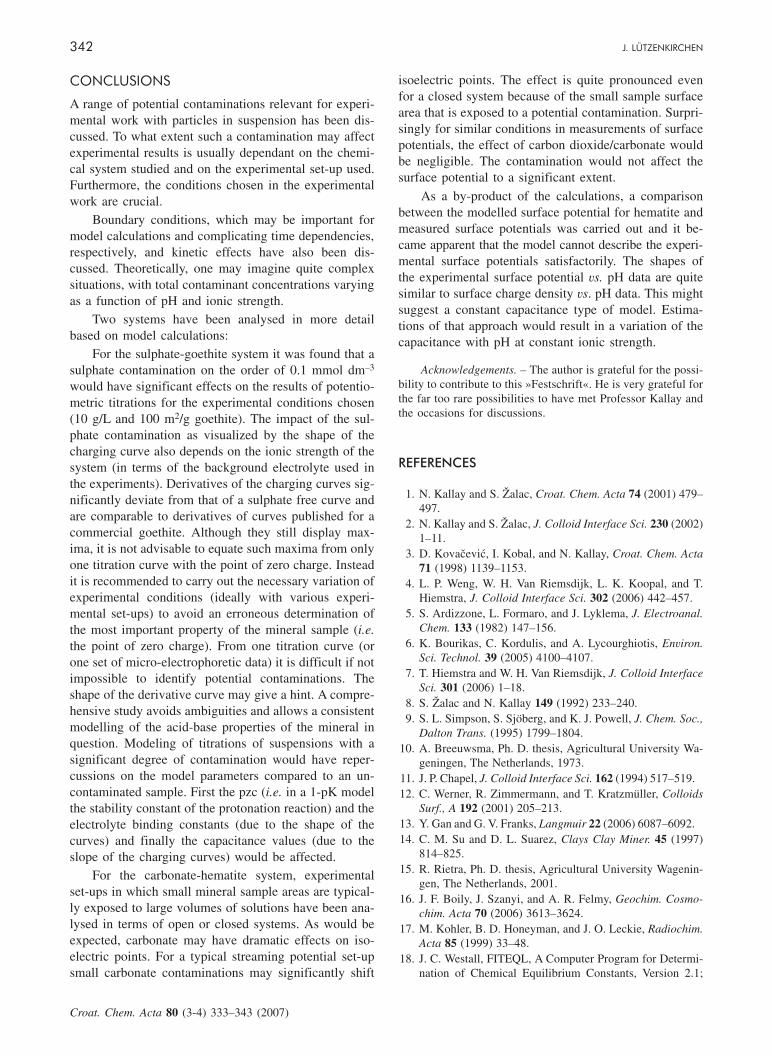
The surface potential for the absence of carbonate isshown in Figure 8. As a comparison, experimental datafrom Preo~anin et al.22 are also shown for the samesystem. The model predicted absolute value of the slopeof the surface potential vs. pH curve is lower than theBoltzmann-slope (which is typically obtained with thesekinds of models, note that according to Cheng,23 it ismore appropriate to interpret these kinds of slopes interms of a Boltzmann-slope instead of a NERNSTslope). However, the model slope is not as low as theexperimental values. Also the shape of the experimentalcurve is not linear and appears to follow rather the shape
of a surface charge density curve at low ionic strength(Figure 9). This would suggest a linear relationship be-tween the surface potential and the surface charge den-sity and correspond to a constant capacitance model. Withincreasing ionic strength the curvature in the surfacecharge density vs. pH curves more and more disappears.The observation strictly contradicts the previously sug-gested range of application of the constant capacitancemodel. Also the capacitance would vary with pH.
As a conclusion of the above calculation-results, itis clear that isoelectric points may be strongly affectedthrough adventitious surface contaminations by carbondioxide, in particular in experimental set-ups, wheresmall surface areas are exposed. The same would holdfor force distance measurements using e.g. the atomicforce microscope or the surface force apparatus. It iscrucial to exclude carbon dioxide in such experiments.The effect of carbon dioxide is predicted to be nearlynegligible for surface potential measurements in the sys-tem discussed.
IMPURITIES AND ACID-BASE DATA FOR OXIDE MINERALS 341
Croat. Chem. Acta 80 (3-4) 333¿343 (2007)
–0.1
0.0
0.1
0.2
0.3
0.4
3 4 5 6 7 8 9 10
pH
su
rfa
ce
po
ten
tia
l/
V no CO2
atm/1000
atm/100
atm/10
atm·conditions:
4 10 m hematite surface404 mL solution,
0.1 mol dm ionic strength,closed system
´ –4 2
–3
CO partial pressure2
Figure 7. Surface potential of hematite as calculated from themodel summarized in Table I for an open system and a variationof carbon dioxide partial pressure (atm pertains to atmosphericconditions).
y = –0.055x + 0.516
R2 = 0.999
–0.10
0.00
0.10
0.20
0.30
0.40
3 4 5 6 7 8 9 10
pH
su
rfa
ce
po
ten
tia
l/
V
conditions:
4 10 m hematite surface404 mL solution,
0.1 mol dm ionic strength,closed system
´ –4 2
–3
Figure 8. Calculated surface potentials of hematite according tothe model in Table I and experimentally detemined values accord-ing to Preo~anin et al.,23 open system. The experimental valueswere shifted to coincide to the model values at pH = 3. The slopeof the model curve is given on the plot.
0.5
0.6
0.7
0.8
0.9
1.0
1.1
3 4 5 6 7 8 9 10
pH
scale
dva
lue
so
fp
ote
ntia
l
–0.2
0.0
0.2
0.4
0.6
0.8
1.0
1.2
scale
dva
lue
so
fsu
rfa
ce
ch
ar g
e
Figure 9. Comparison of the scaled experimental surface potentialaccording to Preo~anin et al.23 and scaled surface charge densityfor hematite at 0.01 mol dm–3 ionic strength. Scaling was done insuch a way that the values at the lowest pH would be unity, i.e. thevalues were all devided by the respective values at the lowest pH.
CONCLUSIONS
A range of potential contaminations relevant for experi-mental work with particles in suspension has been dis-cussed. To what extent such a contamination may affectexperimental results is usually dependant on the chemi-cal system studied and on the experimental set-up used.Furthermore, the conditions chosen in the experimentalwork are crucial.
Boundary conditions, which may be important formodel calculations and complicating time dependencies,respectively, and kinetic effects have also been dis-cussed. Theoretically, one may imagine quite complexsituations, with total contaminant concentrations varyingas a function of pH and ionic strength.
Two systems have been analysed in more detailbased on model calculations:
For the sulphate-goethite system it was found that asulphate contamination on the order of 0.1 mmol dm–3
would have significant effects on the results of potentio-metric titrations for the experimental conditions chosen(10 g/L and 100 m2/g goethite). The impact of the sul-phate contamination as visualized by the shape of thecharging curve also depends on the ionic strength of thesystem (in terms of the background electrolyte used inthe experiments). Derivatives of the charging curves sig-nificantly deviate from that of a sulphate free curve andare comparable to derivatives of curves published for acommercial goethite. Although they still display max-ima, it is not advisable to equate such maxima from onlyone titration curve with the point of zero charge. Insteadit is recommended to carry out the necessary variation ofexperimental conditions (ideally with various experi-mental set-ups) to avoid an erroneous determination ofthe most important property of the mineral sample (i.e.
the point of zero charge). From one titration curve (orone set of micro-electrophoretic data) it is difficult if notimpossible to identify potential contaminations. Theshape of the derivative curve may give a hint. A compre-hensive study avoids ambiguities and allows a consistentmodelling of the acid-base properties of the mineral inquestion. Modeling of titrations of suspensions with asignificant degree of contamination would have reper-cussions on the model parameters compared to an un-contaminated sample. First the pzc (i.e. in a 1-pK modelthe stability constant of the protonation reaction) and theelectrolyte binding constants (due to the shape of thecurves) and finally the capacitance values (due to theslope of the charging curves) would be affected.
For the carbonate-hematite system, experimentalset-ups in which small mineral sample areas are typical-ly exposed to large volumes of solutions have been ana-lysed in terms of open or closed systems. As would beexpected, carbonate may have dramatic effects on iso-electric points. For a typical streaming potential set-upsmall carbonate contaminations may significantly shift
isoelectric points. The effect is quite pronounced evenfor a closed system because of the small sample surfacearea that is exposed to a potential contamination. Surpri-singly for similar conditions in measurements of surfacepotentials, the effect of carbon dioxide/carbonate wouldbe negligible. The contamination would not affect thesurface potential to a significant extent.
As a by-product of the calculations, a comparisonbetween the modelled surface potential for hematite andmeasured surface potentials was carried out and it be-came apparent that the model cannot describe the experi-mental surface potentials satisfactorily. The shapes ofthe experimental surface potential vs. pH data are quitesimilar to surface charge density vs. pH data. This mightsuggest a constant capacitance type of model. Estima-tions of that approach would result in a variation of thecapacitance with pH at constant ionic strength.
Acknowledgements. – The author is grateful for the possi-bility to contribute to this »Festschrift«. He is very grateful forthe far too rare possibilities to have met Professor Kallay andthe occasions for discussions.
REFERENCES
1. N. Kallay and S. �alac, Croat. Chem. Acta 74 (2001) 479–497.
2. N. Kallay and S. �alac, J. Colloid Interface Sci. 230 (2002)1–11.
3. D. Kova~evi}, I. Kobal, and N. Kallay, Croat. Chem. Acta
71 (1998) 1139–1153.4. L. P. Weng, W. H. Van Riemsdijk, L. K. Koopal, and T.
Hiemstra, J. Colloid Interface Sci. 302 (2006) 442–457.5. S. Ardizzone, L. Formaro, and J. Lyklema, J. Electroanal.
Chem. 133 (1982) 147–156.6. K. Bourikas, C. Kordulis, and A. Lycourghiotis, Environ.
Sci. Technol. 39 (2005) 4100–4107.7. T. Hiemstra and W. H. Van Riemsdijk, J. Colloid Interface
Sci. 301 (2006) 1–18.8. S. �alac and N. Kallay 149 (1992) 233–240.9. S. L. Simpson, S. Sjöberg, and K. J. Powell, J. Chem. Soc.,
Dalton Trans. (1995) 1799–1804.10. A. Breeuwsma, Ph. D. thesis, Agricultural University Wa-
geningen, The Netherlands, 1973.11. J. P. Chapel, J. Colloid Interface Sci. 162 (1994) 517–519.12. C. Werner, R. Zimmermann, and T. Kratzmüller, Colloids
Surf., A 192 (2001) 205–213.13. Y. Gan and G. V. Franks, Langmuir 22 (2006) 6087–6092.14. C. M. Su and D. L. Suarez, Clays Clay Miner. 45 (1997)
814–825.15. R. Rietra, Ph. D. thesis, Agricultural University Wagenin-
gen, The Netherlands, 2001.16. J. F. Boily, J. Szanyi, and A. R. Felmy, Geochim. Cosmo-
chim. Acta 70 (2006) 3613–3624.17. M. Kohler, B. D. Honeyman, and J. O. Leckie, Radiochim.
Acta 85 (1999) 33–48.18. J. C. Westall, FITEQL, A Computer Program for Determi-
nation of Chemical Equilibrium Constants, Version 2.1;
342 J. LÜTZENKIRCHEN
Croat. Chem. Acta 80 (3-4) 333¿343 (2007)
Report 82–02; Department of Chemistry, Oregon StateUniversity, Corvallis, OR, 1982.
19. M. G. Keizer, ECOSAT, Technical report, Agricultural Uni-versity Wageningen, The Netherlands, 1998.
20. B. Prelot, R. Charmans, P. Zarzycki, F. Thomas, F. Vil-lieras, W. Piasecki, and W. Rudzinski, J. Phys. Chem. B 106(2002) 13280–13286.
21. N. Kallay, Z. Dojnovi}, and A. ^op, J. Colloid Interface
Sci. 286 (2005) 610–614.22. T. Preo~anin, A. ^op, and N. Kallay, J. Colloid Interface
Sci. 299 (2006) 772–776.23. K. L. Cheng, Microchem. J. 59 (1998) 457–461.
SA@ETAK
Utjecaj ne~isto}a na kiselo-bazna svojstva mineralnih oksida – analiza »izmjerenog« povr{inskognaboja i distribucije afiniteta vezivanja protona te modelni ra~uni za monokristalne uzorke
Johannes Lützenkirchen
Kiselo-bazna svojstva mineralnih oksida od temeljne su va`nosti pri razradi modela povr{inskih reakcija.Utjecaj ne~isto}a na adsorpciju ~esto je razmatran samo kvalitativno, dok kvantitativna analiza uglavnom izo-staje, osim u slu~aju utjecaja ne~isto}a na masenu titraciju. U ovom je radu utjecaj ne~isto}a razmatran op-}enito, s posebnim osvrtom na njihov izvor i dinami~ke aspekte. Detaljno su i kvantitativno obra|ena dva spe-cifi~na slu~aja: povr{insko zaga|enje (adsorpcija sulfata na getit) te zaga|enje iz okoline (adsorpcija karbonatana hematit). Stupanj zaga|enja je funkcija omjera koli~ine zaga|enja i izlo`ene povr{ine, a ovisi, kao i ad-sorpcija, o ionskoj jakosti. U slu~aju adsorpcije sulfata, najzna~ajniji utjecaj ima ukupna koli~ina getita pri ne-koj ionskoj jakosti, dok na adsorpciju karbonata utje~e apsolutna vrijednost izlo`ene povr{ine. Izra~unat jepovr{inski potencijal hematita u slu~aju adsorpcije karbonata iz otopine i uspore|en s literaturnim eksperimen-talnim vrijednostima. Izra~unate vrijednosti povr{inskog potencijala u odsutnosti zaga|enja karbonatom nisu uslaganju s izmjerenim vrijednostima. Rezultati ra~una za sustav zasi}en otopljenim ugljikovim dioksidom su-geriraju, da adsorpcija ugljikova dioksida na povr{inu hematita ne utje~e znatno na povr{inski potencijal, dok jeutjecaj na potencijal difuznog sloja znatan. Prikazana razmatranja omogu}uju izbjegavanje eksperimentalnihte{ko}a. Potrebno je provesti prora~une prije samog eksperimenta ili mogu}e efekte uzeti u obzir prilikom se-lekcije mjerenih podataka.
IMPURITIES AND ACID-BASE DATA FOR OXIDE MINERALS 343
Croat. Chem. Acta 80 (3-4) 333¿343 (2007)