Influence of fluorophore and linker composition on the pharmacology of fluorescent adenosine A 1...
15
THEMED SECTION: IMAGING IN PHARMACOLOGY RESEARCH PAPER Influence of fluorophore and linker composition on the pharmacology of fluorescent adenosine A 1 receptor ligandsJillian G Baker 1 , Richard Middleton 2 *, Luke Adams 2 *, Lauren T May 1 , Stephen J Briddon 1 , Barrie Kellam 2 and Stephen J Hill 1 1 Institute of Cell Signalling, School of Biomedical Sciences, Medical School and 2 School of Pharmacy, Centre for Biomolecular Sciences, University of Nottingham, Queen’s Medical Centre, Nottingham, UK Background and purpose: The introduction of fluorescence-based techniques, and in particular the development of fluores- cent ligands, has allowed the study of G protein-coupled receptor pharmacology at the single cell and single molecule level. This study evaluated how the physicochemical nature of the linker and the fluorophore affected the pharmacological properties of fluorescent agonists and antagonists. Experimental approach: Chinese hamster ovary cells stably expressing the human adenosine A1 receptor and a cyclic 3′,5′ adenosine monophosphate response element-secreted placental alkaline phosphatase (CRE-SPAP) reporter gene, together with whole cell [ 3 H]-8-cyclopentyl-1,3-dipropylxanthine (DPCPX) radioligand binding, were used to evaluate the pharmacological properties of a range of fluorescent ligands based on the antagonist xanthine amine congener (XAC) and the agonist 5′ (N-ethylcarboxamido) adenosine (NECA). Key results: Derivatives of NECA and XAC with different fluorophores, but equivalent linker length, showed significant differences in their binding properties to the adenosine A1 receptor. The BODIPY 630/650 derivatives had the highest affinity. Linker length also affected the pharmacological properties, depending on the fluorophore used. Particularly in fluorescent agonists, higher agonist potency could be achieved with large or small linkers for dansyl and BODIPY 630/650 derivatives, respectively. Conclusions and implications: The pharmacology of a fluorescent ligand was critically influenced by both the fluorophore and the associated linker. Furthermore, our data strongly suggest that the physicochemical properties of the fluorophore/linker pairing determine where in the environment of the target receptor the fluorophore is placed, and this, together with the environmental sensitivity of the resulting fluorescence, may finally decide its utility as a fluorescent probe. British Journal of Pharmacology (2010) 159, 772–786; doi:10.1111/j.1476-5381.2009.00488.x; published online 26 January 2010 This article is part of a themed section on Imaging in Pharmacology. To view the editorial for this themed section visit http://dx.doi.org/10.1111/j.1476-5381.2010.00685.x Keywords: GPCRs; fluorescent ligands; molecular pharmacology; reporter genes; ligand binding; adenosine Abbreviations: ABEA, N 6 -(4-aminobutyl)-5′-ethylamino-5′-oxo-5′-deoxyadenosine; ADOEA, N 6 -(8-amino-3,6-dioxaoctyl)-5′- ethylamino-5′-oxo-5′-deoxyadenosine; AEAO, 8-(2-aminoethylamino)-8-oxooctanoyl; AHH, 6-(6-aminohex- anamido)hexanoyl; AO, 8-aminooctanoyl; AOEA, N 6 -(8-aminooctyl)-5′-ethylamino-5′-oxo-5′-deoxyadenosine; APEA, N 6 -(5-aminopentyl)-5′-ethylamino-5′-oxo-5′-deoxyadenosine; APrEA, N 6 -(3-aminopropyl)-5′-ethy- lamino-5′-oxo-5′-deoxyadenosine; AUEA, N 6 -(11-aminoundecyl)-5′-ethylamino-5′-oxo-5′-deoxyadenosine; cAMP, cyclic AMP; CGS 15943, 5-amino-9-chloro-2-(2-furyl)1,2,4-trizolo[1,5-c]quinazoline; CHO, Chinese hamster ovary; CRE, cyclic AMP response element; DMEM/F12, Dulbecco’s modified Eagle’s medium/nutrient mix F12; DPCPX, 8-cyclopentyl-1,3-dipropylxanthine; FCS, fluorescence correlation spectroscopy; GPCR, G protein coupled receptor; HBS, HEPES-buffered salt solution; HEPES, N-2-Hydroxyethylpiperazine-N′-2- ethanesulfonic acid; NECA, 5′ (N-ethylcarboxamido)adenosine; pNPP, 4-nitrophenyl phosphate; PTX, Pertussis toxin; SPAP, secreted placental alkaline phosphatase; X, 6-aminohexanoyl; XAC, xanthine amine congener British Journal of Pharmacology (2010), 159, 772–786 © 2010 The Authors Journal compilation © 2010 The British Pharmacological Society All rights reserved 0007-1188/10 www.brjpharmacol.org
-
Upload
independent -
Category
Documents
-
view
0 -
download
0
Transcript of Influence of fluorophore and linker composition on the pharmacology of fluorescent adenosine A 1...

THEMED SECTION: IMAGING IN PHARMACOLOGY
RESEARCH PAPER
Influence of fluorophore and linker composition onthe pharmacology of fluorescent adenosine A1
receptor ligandsbph_488 772..786
Jillian G Baker1, Richard Middleton2*, Luke Adams2*, Lauren T May1, Stephen J Briddon1,Barrie Kellam2 and Stephen J Hill1
1Institute of Cell Signalling, School of Biomedical Sciences, Medical School and 2School of Pharmacy, Centre for BiomolecularSciences, University of Nottingham, Queen’s Medical Centre, Nottingham, UK
Background and purpose: The introduction of fluorescence-based techniques, and in particular the development of fluores-cent ligands, has allowed the study of G protein-coupled receptor pharmacology at the single cell and single molecule level.This study evaluated how the physicochemical nature of the linker and the fluorophore affected the pharmacological propertiesof fluorescent agonists and antagonists.Experimental approach: Chinese hamster ovary cells stably expressing the human adenosine A1 receptor and a cyclic 3′,5′adenosine monophosphate response element-secreted placental alkaline phosphatase (CRE-SPAP) reporter gene, together withwhole cell [3H]-8-cyclopentyl-1,3-dipropylxanthine (DPCPX) radioligand binding, were used to evaluate the pharmacologicalproperties of a range of fluorescent ligands based on the antagonist xanthine amine congener (XAC) and the agonist 5′(N-ethylcarboxamido) adenosine (NECA).Key results: Derivatives of NECA and XAC with different fluorophores, but equivalent linker length, showed significantdifferences in their binding properties to the adenosine A1 receptor. The BODIPY 630/650 derivatives had the highest affinity.Linker length also affected the pharmacological properties, depending on the fluorophore used. Particularly in fluorescentagonists, higher agonist potency could be achieved with large or small linkers for dansyl and BODIPY 630/650 derivatives,respectively.Conclusions and implications: The pharmacology of a fluorescent ligand was critically influenced by both the fluorophoreand the associated linker. Furthermore, our data strongly suggest that the physicochemical properties of the fluorophore/linkerpairing determine where in the environment of the target receptor the fluorophore is placed, and this, together with theenvironmental sensitivity of the resulting fluorescence, may finally decide its utility as a fluorescent probe.British Journal of Pharmacology (2010) 159, 772–786; doi:10.1111/j.1476-5381.2009.00488.x; published online 26January 2010
This article is part of a themed section on Imaging in Pharmacology. To view the editorial for this themed sectionvisit http://dx.doi.org/10.1111/j.1476-5381.2010.00685.x
Keywords: GPCRs; fluorescent ligands; molecular pharmacology; reporter genes; ligand binding; adenosine
Abbreviations: ABEA, N6-(4-aminobutyl)-5′-ethylamino-5′-oxo-5′-deoxyadenosine; ADOEA, N6-(8-amino-3,6-dioxaoctyl)-5′-ethylamino-5′-oxo-5′-deoxyadenosine; AEAO, 8-(2-aminoethylamino)-8-oxooctanoyl; AHH, 6-(6-aminohex-anamido)hexanoyl; AO, 8-aminooctanoyl; AOEA, N6-(8-aminooctyl)-5′-ethylamino-5′-oxo-5′-deoxyadenosine;APEA, N6-(5-aminopentyl)-5′-ethylamino-5′-oxo-5′-deoxyadenosine; APrEA, N6-(3-aminopropyl)-5′-ethy-lamino-5′-oxo-5′-deoxyadenosine; AUEA, N6-(11-aminoundecyl)-5′-ethylamino-5′-oxo-5′-deoxyadenosine;cAMP, cyclic AMP; CGS 15943, 5-amino-9-chloro-2-(2-furyl)1,2,4-trizolo[1,5-c]quinazoline; CHO, Chinesehamster ovary; CRE, cyclic AMP response element; DMEM/F12, Dulbecco’s modified Eagle’s medium/nutrientmix F12; DPCPX, 8-cyclopentyl-1,3-dipropylxanthine; FCS, fluorescence correlation spectroscopy; GPCR, Gprotein coupled receptor; HBS, HEPES-buffered salt solution; HEPES, N-2-Hydroxyethylpiperazine-N′-2-ethanesulfonic acid; NECA, 5′ (N-ethylcarboxamido)adenosine; pNPP, 4-nitrophenyl phosphate; PTX, Pertussistoxin; SPAP, secreted placental alkaline phosphatase; X, 6-aminohexanoyl; XAC, xanthine amine congener
British Journal of Pharmacology (2010), 159, 772–786© 2010 The AuthorsJournal compilation © 2010 The British Pharmacological Society All rights reserved 0007-1188/10www.brjpharmacol.org
Introduction
Adenosine A1 receptors are G protein-coupled receptors(GPCRs) that signal via Gi/o proteins to inhibit adenylyl cyclaseactivity and reduce the cellular levels of the second messenger,cyclic 3′,5′ adenosine monophosphate (cyclic AMP; Libertet al., 1992; Olah and Styles, 1995; Fredholm et al., 2001). Ourcurrent understanding of the molecular pharmacology of theadenosine A1-receptor has been deduced primarily from theuse of radioligand binding techniques for studying ligand-receptor interactions and the measurement of intracellularsecond messenger generation. These experiments require largenumbers of cells, and the pharmacological parameters that arededuced from them therefore represent the average for the cellpopulation. However, it is now evident that adenosine A1
receptors are not uniformly distributed in the plasma mem-brane of individual cells but instead are located within mem-brane compartments and microdomains (Gines et al., 2001;Zajchowshi and Robbins, 2002; Helmreich, 2003). The intro-duction of fluorescence-based techniques, and in particular thedevelopment of fluorescent ligands, has now advanced thestudy of GPCR pharmacology to the single-cell and singlemolecule level (Emmerson et al., 1997; Harikumar et al., 2002;Baker et al., 2003; Briddon et al., 2004; Cordeaux et al., 2008;Daly and McGrath, 2003). For example, the application oftechniques such as fluorescence correlation spectroscopy (FCS)has provided the means by which the diffusion of receptorspecies within defined membrane microdomains can by moni-tored in real time (Briddon and Hill, 2007), and we have usedboth fluorescent agonists and antagonists to study the adenos-ine A1 receptor using this technique (Briddon et al., 2004;Middleton et al., 2007).
The general approach to the design of a fluorescent ligandhas been to take a parent molecule with known pharmaco-logical properties and to add a fluorophore to it. Given thesize of most fluorophores in relation to the active parentmolecule, it would not be surprising to observe that thisprocess may result in alterations to the pharmacology of theparent molecule (Baker et al., 2003; Middleton and Kellam,2005; Middleton et al., 2007). An ideal fluorescent moleculewould retain the properties of the parent ligand. For anantagonist, this would mean retaining high affinity and selec-tivity for the receptor under study, as well as the neutralantagonist or inverse agonist properties of the parent ligand.For an agonist, the fluorescent molecule must retain the effi-cacy of the parent ligand, and enough potency still to bepharmacologically useful. However, the addition of a fluoro-phore to a known ligand clearly alters its structure, and thepharmacology of the subsequent molecule needs to be care-fully studied in order to determine its usefulness (Briddon
et al., 2004; Middleton and Kellam, 2005; Cordeaux et al.,2008).
We have designed and synthesized a number of fluorescentagonist and antagonist probes of the human adenosine A1
receptor, which vary in both their fluorescent label and alsoin the composition and length of the linker that attachesthe fluorophore to the parent molecule. Our aim was toinvestigate the effect of these variations on the pharmacol-ogy of these probes, and also their usefulness as A1 receptorprobes in live cell imaging. Here, we show that the nature ofboth the linker and the fluorophore can exert major effectson the pharmacological properties of both agonists andantagonists.
Methods
Cell cultureChinese hamster ovary (CHO) cells stably expressing both thehuman A1-adenosine receptor and a cyclic AMP responseelement-secreted placental alkaline phosphatase (CRE-SPAP)reporter gene were used throughout this study (CHO-A1;Baker and Hill, 2007). Cells were grown in Dulbecco’s modi-fied Eagle’s medium/nutrient mix F12 (DMEM/F12) contain-ing 10% fetal calf serum and 2 mM L-glutamine in ahumidified 5% CO2: 95% air atmosphere at 37°C.
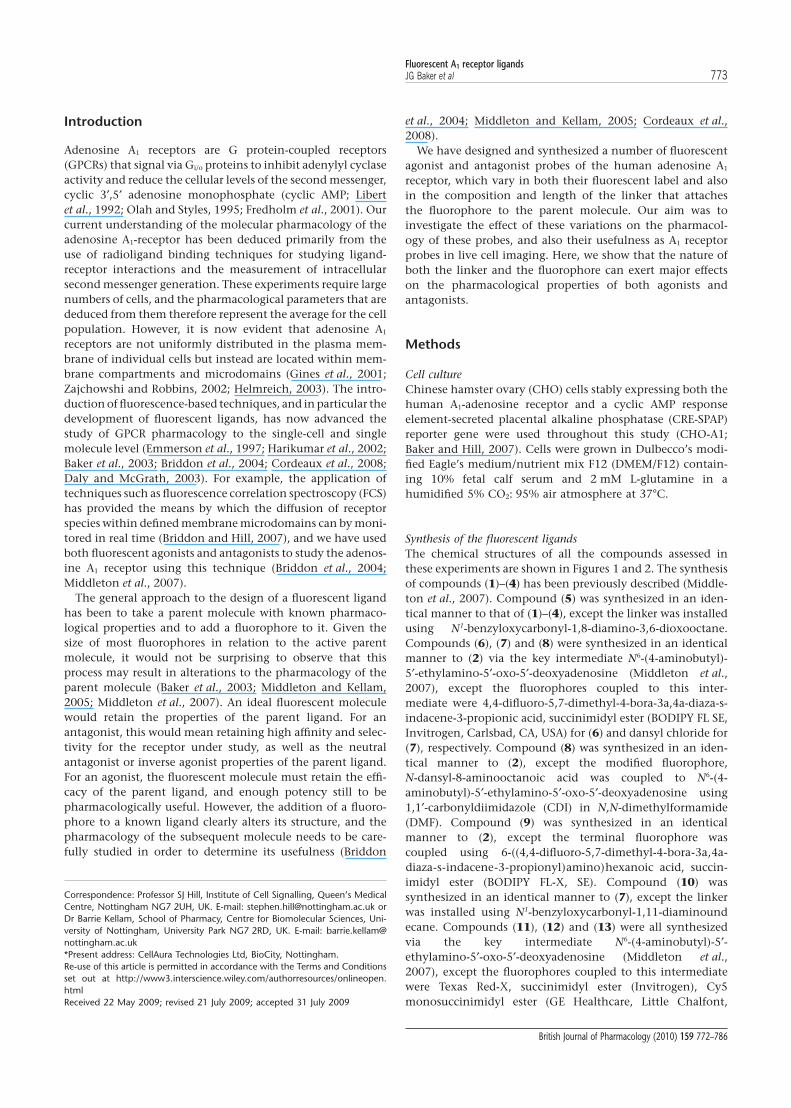
Synthesis of the fluorescent ligandsThe chemical structures of all the compounds assessed inthese experiments are shown in Figures 1 and 2. The synthesisof compounds (1)–(4) has been previously described (Middle-ton et al., 2007). Compound (5) was synthesized in an iden-tical manner to that of (1)–(4), except the linker was installedusing N1-benzyloxycarbonyl-1,8-diamino-3,6-dioxooctane.Compounds (6), (7) and (8) were synthesized in an identicalmanner to (2) via the key intermediate N6-(4-aminobutyl)-5′-ethylamino-5′-oxo-5′-deoxyadenosine (Middleton et al.,2007), except the fluorophores coupled to this inter-mediate were 4,4-difluoro-5,7-dimethyl-4-bora-3a,4a-diaza-s-indacene-3-propionic acid, succinimidyl ester (BODIPY FL SE,Invitrogen, Carlsbad, CA, USA) for (6) and dansyl chloride for(7), respectively. Compound (8) was synthesized in an iden-tical manner to (2), except the modified fluorophore,N-dansyl-8-aminooctanoic acid was coupled to N6-(4-aminobutyl)-5′-ethylamino-5′-oxo-5′-deoxyadenosine using1,1′-carbonyldiimidazole (CDI) in N,N-dimethylformamide(DMF). Compound (9) was synthesized in an identicalmanner to (2), except the terminal fluorophore wascoupled using 6-((4,4-difluoro-5,7-dimethyl-4-bora-3a,4a-diaza-s-indacene-3-propionyl)amino)hexanoic acid, succin-imidyl ester (BODIPY FL-X, SE). Compound (10) wassynthesized in an identical manner to (7), except the linkerwas installed using N1-benzyloxycarbonyl-1,11-diaminoundecane. Compounds (11), (12) and (13) were all synthesizedvia the key intermediate N6-(4-aminobutyl)-5′-ethylamino-5′-oxo-5′-deoxyadenosine (Middleton et al.,2007), except the fluorophores coupled to this intermediatewere Texas Red-X, succinimidyl ester (Invitrogen), Cy5monosuccinimidyl ester (GE Healthcare, Little Chalfont,
Correspondence: Professor SJ Hill, Institute of Cell Signalling, Queen’s MedicalCentre, Nottingham NG7 2UH, UK. E-mail: [email protected] orDr Barrie Kellam, School of Pharmacy, Centre for Biomolecular Sciences, Uni-versity of Nottingham, University Park NG7 2RD, UK. E-mail: [email protected]*Present address: CellAura Technologies Ltd, BioCity, Nottingham.Re-use of this article is permitted in accordance with the Terms and Conditionsset out at http://www3.interscience.wiley.com/authorresources/onlineopen.htmlReceived 22 May 2009; revised 21 July 2009; accepted 31 July 2009
Fluorescent A1 receptor ligandsJG Baker et al 773
British Journal of Pharmacology (2010) 159 772–786
R1
Fluorescent NECA derivatives
ONH
HO OH
N
N
N
N
HN
O
n = 3 (APrEA-X-BY630) (1)n = 4 (ABEA-X-BY630) (2)
ADOEA-X-BY630 (5)ABEA-BYFL (6)
NHn
R1
ONH
HO OH
N
N
N
N
HN
O
OO
HN
R1
ONH
HO OH
N
N
N
N
HN
O
HNR2
HN H HN Hn = 5 (APEA-X-BY630) (3)n = 8 (AOEA-X-BY630) (4)
O N
N
N
N
HN
O
ONH
HO OH
N
N
N
N
HN
O
HN
R3
ABEA-dansyl (7)ABEA-AO-dansyl (8)H
N
ONH5
R2
ONH
HO OH
N
N
N
N
HN
O
HN
ONH7
R3
N N
HN NH
11R3
NH
HO OHABEA-X-BYFL (9)
AUEA-dansyl (10)
ONH
HO OH
N
N
N
N
HN
O
HN
HNS
SO
O
O O
ABEA-X-Texas Red (11)
ONH
HO OH
N
N
N
N
HN
O HN O
ONH
HO OH
N N
NO
N N
HN
O NN
SO3N
N
O3S
ABEA-Cy5 (12)
HO OH
NO
ON
NO3S
ABEA-EVOBlue 30 (13)
ONH
HO OH
N N
NO HN
O3S
3
N NB
FFR2 =
SO
OR3 =
N NB
SFFR1 =
O NMe2ONH
O
O
Figure 1 Chemical structures of fluorescent NECA derivatives. ABEA, N6-(4-aminobutyl)-5′-ethylamino-5′-oxo-5′-deoxyadenosine; ADOEA,N6-(8-amino-3,6-dioxaoctyl)-5′-ethylamino-5′-oxo-5′-deoxyadenosine; AO, 8-aminooctanoyl; AOEA, N6-(8-aminooctyl)-5′-ethylamino-5′-oxo-5′-deoxyadenosine; APEA, N6-(5-aminopentyl)- 5′-ethylamino-5′-oxo-5′-deoxyadenosine; APrEA, N6-(3-aminopropyl)-5′-ethylamino-5′-oxo-5′-deoxyadenosine; AUEA, N6-(11-aminoundecyl)-5′-ethylamino-5′-oxo-5′-deoxyadenosine; X, 6-aminohexanoyl.
Fluorescent A1 receptor ligands774 JG Baker et al
British Journal of Pharmacology (2010) 159 772–786

Buckinghamshire, UK) and EVOBlue 30 succinimidyl ester(Novabiochem, Nottingham, UK), respectively. Compound(14) has been previously described (Briddon et al., 2004).Compounds (15), (16), (18) and (19) were synthesized in anidentical manner to (14), except the fluorophores coupled toxanthine amine congener (XAC) were Texas Red-X succinim-idyl ester (Invitrogen), Cy5 monosuccinimidyl ester (GEHealthcare), EVOBlue 30 succinimidyl ester (Novabiochem)and dansyl chloride, respectively. Compound (17) was pre-pared by reacting XAC and suberic acid monomethyl ester inDMF in the presence of CDI. The crude 7-carboxyheptanoyl-XAC methyl ester product was saponified and reacted with4,4-difluoro-5,7-dimethyl-4-bora-3a,4a-diaza-s-indacene-3-propionyl ethylenediamine, hydrochloride (BODIPY FL EDA,Invitrogen) using CDI as the coupling reagent in DMF.Compound (20) was synthesized by coupling XAC with N-dansyl-8-aminooctanoic acid using 1,1′-carbonyldiimidazolein DMF. Compound (21) was synthesized by reactingN-tbutyloxycarbonylaminocaproic acid with XAC using dicy-clohexylcarbodiimide (DCC) as the coupling reagent in DMF.Following acidolytic removal of the tbutyloxycarbonylprotecting group, aminocaproyl-XAC was coupled withN-dansyl-6-aminohexanoic acid using diisopropylcarbodiim-ide as the coupling reagent in DMF. All compounds werepurified using preparative thin-layer chromatography (pTLC),as previously described (Briddon et al., 2004; Middleton et al.,2007). Single peak purity of all compounds was confirmed byanalytical reversed-phase high-performance liquid chroma-tography (recorded on a Waters Millennium 995 LC system,Milford, MA, USA) and the structures confirmed using high-resolution mass spectrometry (recorded on a Waters 2795Separation Module/Micromass LCT platform).
[3H]-8-cyclopentyl-1,3-dipropylxanthine (DPCPX)whole cell bindingCHO-A1 cells were grown to confluence over 24 h in white-sided 96 well view plates. The following day, the media wasremoved and replaced with 100 mL serum-free media (i.e.DMEM/F12 containing 2 mM L-glutamine only) containingthe competing ligand. This was immediately followed by theaddition of 100 mL serum-free media containing 3H-DPCPX(to give a final concentration of 3H-DPCPX of 0.99–1.77 nM).Total and non-specific binding (as defined by 10 mM XAC)were measured in each experiment. Cells were then incu-bated for 2 h at 37°C in a humidified 5% CO2: 95% room airatmosphere. After 2 h, the media and drugs were removed,and the cells washed twice by the addition and removal ofphosphate-buffered saline at 4°C (2 ¥ 200 mL per well). Awhite base was then added to the plate, followed by 100 mLMicroscint 20 (Perkin Elmer, Shelton, CT, USA) per well anda sealant film placed over the wells. The plates were thencounted the following day on a Topcount (Perkin Elmer) for2 min per well.
CRE-SPAP gene transcriptionCells were grown to confluence in 96-well plates in 100 mLDMEM/F12 containing 10% fetal calf serum and 2 mML-glutamine. Once confluent, the media was removed and
replaced with 100 mL serum-free media (DMEM/F12 contain-ing 2 mM L-glutamine), and the cells incubated for a further24 h. Where used, Pertussis toxin (PTX, 100 ng·mL–1) wasadded for this 24 h period. On the day of experimentation,the serum-free media was removed and replaced with 100 mLserum-free media � antagonist at the final required concen-tration, and the cells incubated for 1 h at 37°C (5% CO2).Agonists (10 mL, diluted in serum free media) were thenadded to each well, and the plate incubated at 37°C for10 min. Forskolin (10 mL) was then added to all but the basalwells, and the cells incubated for a further 5 h at 37°C (5%CO2). After 5 h, the media and drugs were removed, 40 mLserum-free media was added to each well, and the cells incu-bated for a further 1 h at 37°C. The plates were then incu-bated at 65°C for 30 min to destroy any endogenousphosphatases before the plates were then cooled to 37°C.4-nitrophenyl phosphate (pNPP; 100 mL of 5 mM) in dietha-nolamine buffer was added to each well, and the plates incu-bated at 37°C until the yellow colour developed. The plateswere then read on a Dynex MRX plate reader (Chelmsford,MA, USA) at 405 nm.
Confocal microscopyCells were grown to 100% confluency in Labtek 8-wellchambered-coverglasses (Nalgene Nunc International, Scien-tific Laboratory Supplies, Nottingham, UK) in 400 mL DMEM-F12 media containing 10% FCS and 2 mM glutamine. Themedia was replaced with 400 mL N-2-Hydroxyethylpiperazine-N′-2-ethanesulfonic acid (HEPES)-buffered saline (HBS,Briddon et al., 2004) at room temperature. Confocal micros-copy was performed using a Zeiss LSM510 laser-scanningmicroscope using either a Zeiss 40 ¥ 1.3NA oil-immersion lens(Zeiss, Jena, Germany) or (for experiments using 364 nm exci-tation) a C-Apochromat 60 ¥ 1.2NA water-immersion lens.Images of ligands were captured using the following opticalconfigurations: BODIPY 630/650, Cy5 and EVOBlue 30 con-jugates, 633 nm excitation, with emission captured through a650LP filter; Texas Red conjugates, 543 nm excitation and560LP emission filter; BODIPY-FL conjugates, 488 nm excita-tion and LP505 emission and dansyl conjugates 364 nm exci-tation and 475-525BP emission. In each case, a pinholediameter of 1 Airy unit was used.
Initial images were captured in the absence of ligand todetermine the level of auto-fluorescence under each excita-tion wavelength, and settings adjusted to minimize this.Single equatorial images were subsequently captured follow-ing a 5 min incubation of the indicated concentration offluorescent ligands (in HBS). If membrane fluorescence wasseen, the media and fluorescent drug were removed from thewell and the cells washed by the addition and removal of400 mL HBS. A further 400 mL HBS was added, and a furtherimage captured. This was to ensure that any apparentmembrane-localized fluorescence was indeed bound to themembrane and not just due to fluorescent ligand present inthe media between cells. For any given experimental condi-tion, a minimum of three different cell preparations on threedifferent days with different drug dilutions were used. In thetext, ‘n’ refers to the number of different complete experi-ments performed.
Fluorescent A1 receptor ligandsJG Baker et al 775
British Journal of Pharmacology (2010) 159 772–786
Excitation and emission spectra for fluorescent ligandsLigand solutions were prepared in methanol or HBS (1 mM forXAC-X-BY630 and XAC-X-TR; 50 mM for XAC-dansyl). Exci-tation and emission spectra (2 nm intervals) were collectedusing a Flexstation 96-well fluorescence plate reader (Molecu-lar Devices Corporation, Sunnyvale, CA, USA) using 100 mL ofligand dispensed in to UV-transparent flat-bottomed 96-wellplates (Costar, Fisher Scientific, Loughborough, UK). Dataanalysis was performed in Softmax Pro 4.2 (Molecular DevicesCorporation) and GraphPad Prism 4.0 (GraphPad, San Diego,CA, USA).
Data analysis3H-DPCPX whole cell binding. Curves for inhibition of specificbinding of 3H-DPCPX by a range of concentrations of 5′(N-ethylcarboxamido)adenosine (NECA), XAC and the fluo-rescent adenosine A1 receptor ligands were fitted to thefollowing equation:
% of specific bindingA
A IC= − × [ ]
[ ] +100
100
50
where [A] is the concentration of competing ligand, and IC50
is the concentration that inhibits specific binding by 50%.Antagonist dissociation constants (KB) were then determinedfrom the following expression:
KIC KK L
BD
D
=×+ [ ]
50
where [L] and KD are the concentration and dissociation con-stant of 3H-DPCPX, respectively. The KD value of 3H-DPCPXwas previously determined in this cell line to be 3.61 nM(Baker and Hill, 2007).
Functional experimentsOne-site concentration responses curves. Sigmoidal agonistconcentration-response curves were fitted to the data usingthe following equation through computer-assisted non-linearregression using the programme GraphPad Prism 2:
ResponseE AEC A
=× [ ]+ [ ]
MAX
50
where EMAX is the maximal response, [A] is the agonist con-centration and EC50 (or IC50) is the concentration of agonistthat produces 50% of the maximal response.
Antagonist KD values were then calculated from the shift ofthe agonist concentration responses in the presence of a fixedconcentration of antagonist using the following equation:
DRB
K= +
[ ]1
D
where DR (dose ratio) is the ratio of the agonist concentrationrequired to stimulate an identical response in the presenceand absence of a fixed concentration of antagonist [B].
Two-site agonist curves. As many concentration responsecurves clearly contained two components, two-site analysis
was required for most ligands. This was performed using thefollowing equation:
Response Basal FK BasalA
A IC
SA
A
= + −( ) −[ ]
[ ] +( )⎡⎣⎢
⎤⎦⎥
+[ ]
[ ] +
150
MAXEEC50( )
⎡⎣⎢
⎤⎦⎥
where basal is the response in the absence of agonist, FK is theresponse to a fixed concentration of forskolin, [A] is the con-centration of A1-receptor agonist, IC50 is the concentration ofagonist that inhibits 50% of the response to forskolin, SMAX isthe maximum stimulation of the Gs-component of theresponse to the agonist and EC50 is the concentration ofagonist that stimulates a half maximal Gs-response.
A maximal forskolin concentration (3 mM) was included ineach CRE-gene transcription plate for each separate experi-ment. All data are presented as mean � SEM of triplicatedeterminations, and n in the text refers to the number ofseparate experiments.
MaterialsCGS 15943, DPCPX and NECA were from Tocris Cookson(Avonmouth, Bristol, UK). 3H-DPCPX was obtained fromAmersham International (Buckinghamshire, UK). Fetal calfserum was from PAA laboratories (Teddington, Middlesex,UK). XAC was from Sigma Chemicals (Poole, Dorset, UK),who also supplied all other reagents. Pertussis toxin was fromCalbiochem, Nottingham, UK. The receptor nomenclatureused in this manuscript follows Alexander et al. (2008).
Results
In order to systematically test the effect of fluorophore, linkerlength and composition on ligand pharmacology, we synthe-sized a number of fluorescent derivatives of the archetypaladenosine A1-receptor agonist, NECA and the correspondingantagonist, XAC (Figures 1 and 2, Table 1; compounds 1–21).We have previously demonstrated the use of the red-excitedfluorophore BODIPY 630/650 to generate functional fluores-cent A1-receptor agonists and antagonists (Briddon et al.,2004; Middleton et al., 2007). We have extended the range ofred-emitting fluorophores tested to include the cyanine dye,Cy5 and also EVOBlue30. In addition, we have used dyesspread over the full UV-visible excitation wavelength rangeusing dansyl (excitation maximum = 320 nm), BODIPY FL(BYFL, 488 nm) and Texas Red (TXR, 590 nm). Furthermore,we have varied the length of the linker between the activepharmacophore and fluorophore. Initially, these compoundswere assessed for A1-receptor affinity using whole-cell radioli-gand binding (3H-DPCPX) and also for functional potencyand efficacy using a CRE-based reporter gene assay.
Fluorescent XAC derivativesWhole-cell binding in CHO-A1 cells using 3H-DPCPX con-firmed that the affinity of XAC itself was similar to thatpreviously shown (Table 2; Figure 3). In line with our previous
Fluorescent A1 receptor ligands776 JG Baker et al
British Journal of Pharmacology (2010) 159 772–786
NHN
HNNH
O
O
NH NHN
HNNH
O
O
NHN
N NO O
OO
O
N
NB
SF
F
N
N NO O
OO2S
O
N
N
SO3
XAC-X-Texas Red (15)
XAC-X-BY630 (14)
N
N NH
N
O
OO
HN
O
NH
O
NHO
NH
O
6N
N N
HN
O
HN
O
NHO
O
O
NSO3
XAC-Cy5 (16)H O
N
NB
FF
XAC-AEAO-BYFL (17)
NO
N
SO3
ON
NH
NO
OHN
ONH
N
O
O
N
NO3S
SO O
N
N
N N
HN
O
HN
O
NHO
O
XAC-dansyl (19)
XAC-EVOBlue 30 (18)
O
N
N N
HN
O
HN
ONH
O
OO
N
N N
HN
O
HN
ONH
O
O
XAC-AO-dansyl (20)
SOO
Me2N HN
NO
XAC-AHH-dansyl (21)
HNO
NHS
Me2N
OO
Fluorescent XAC derivatives
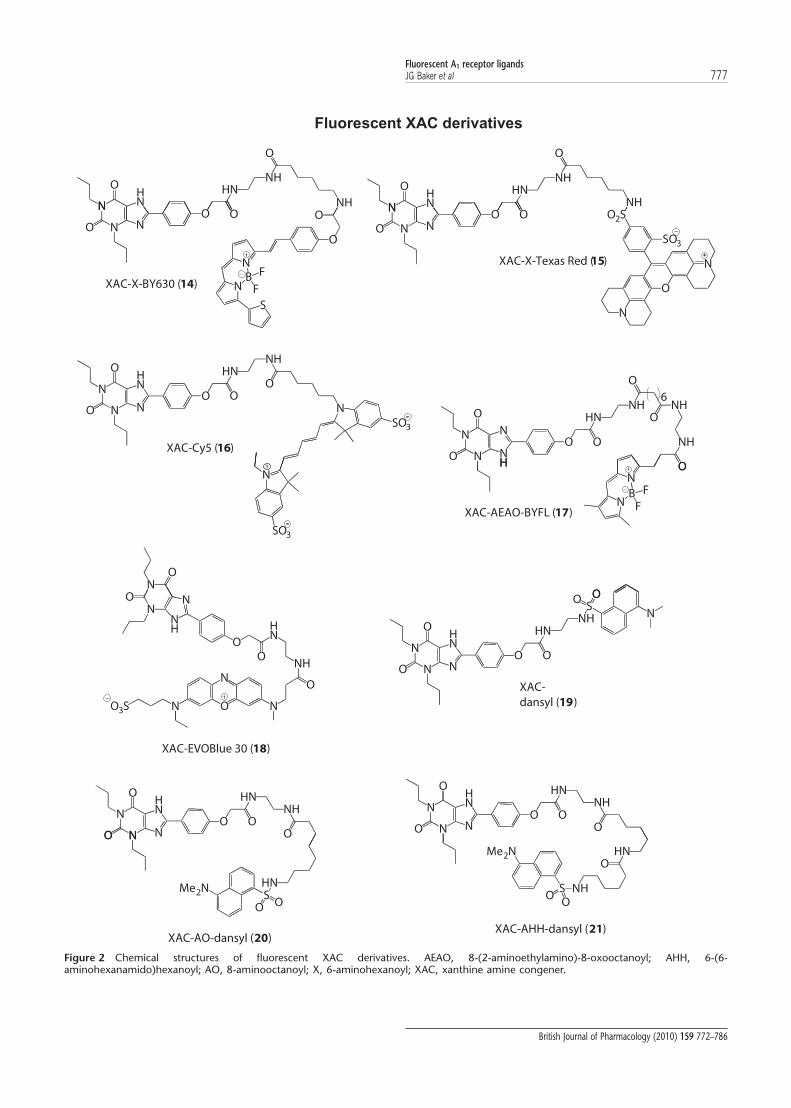
Figure 2 Chemical structures of fluorescent XAC derivatives. AEAO, 8-(2-aminoethylamino)-8-oxooctanoyl; AHH, 6-(6-aminohexanamido)hexanoyl; AO, 8-aminooctanoyl; X, 6-aminohexanoyl; XAC, xanthine amine congener.
Fluorescent A1 receptor ligandsJG Baker et al 777
British Journal of Pharmacology (2010) 159 772–786
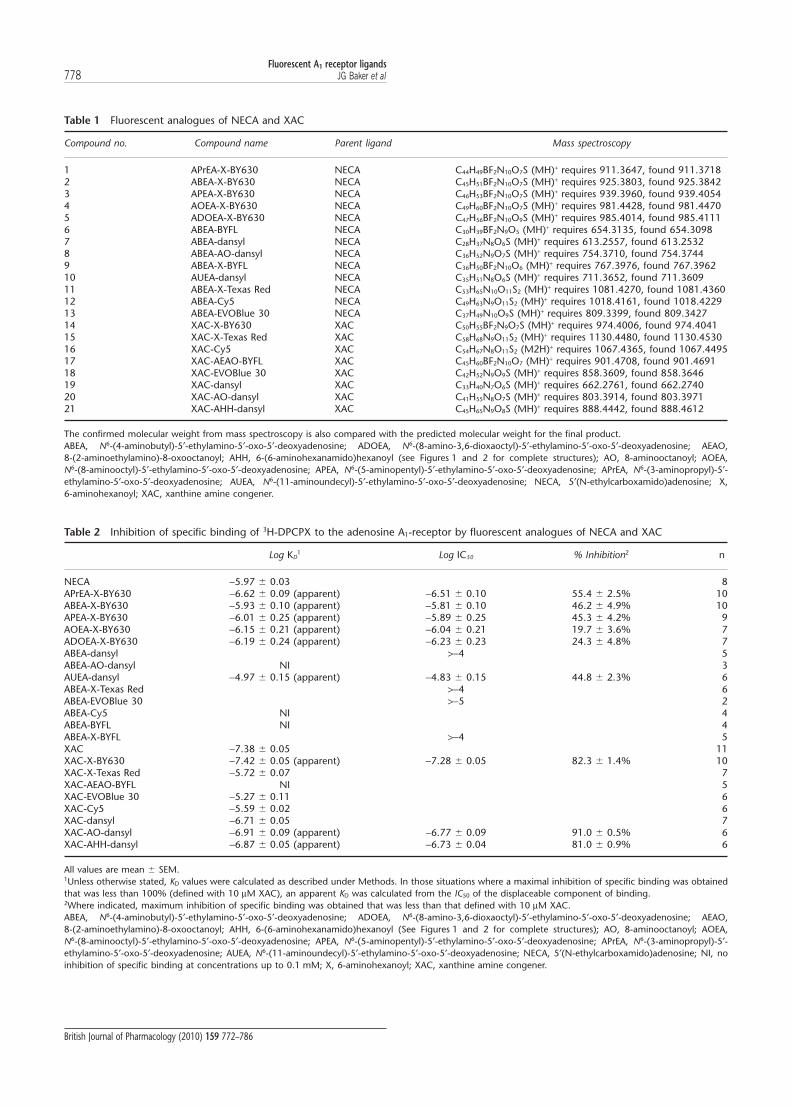
Table 1 Fluorescent analogues of NECA and XAC
Compound no. Compound name Parent ligand Mass spectroscopy
1 APrEA-X-BY630 NECA C44H49BF2N10O7S (MH)+ requires 911.3647, found 911.37182 ABEA-X-BY630 NECA C45H51BF2N10O7S (MH)+ requires 925.3803, found 925.38423 APEA-X-BY630 NECA C46H53BF2N10O7S (MH)+ requires 939.3960, found 939.40544 AOEA-X-BY630 NECA C49H60BF2N10O7S (MH)+ requires 981.4428, found 981.44705 ADOEA-X-BY630 NECA C47H56BF2N10O9S (MH)+ requires 985.4014, found 985.41116 ABEA-BYFL NECA C30H39BF2N9O5 (MH)+ requires 654.3135, found 654.30987 ABEA-dansyl NECA C28H37N8O6S (MH)+ requires 613.2557, found 613.25328 ABEA-AO-dansyl NECA C36H52N9O7S (MH)+ requires 754.3710, found 754.37449 ABEA-X-BYFL NECA C36H50BF2N10O6 (MH)+ requires 767.3976, found 767.396210 AUEA-dansyl NECA C35H51N8O6S (MH)+ requires 711.3652, found 711.360911 ABEA-X-Texas Red NECA C53H65N10O11S2 (MH)+ requires 1081.4270, found 1081.436012 ABEA-Cy5 NECA C49H63N9O11S2 (MH)+ requires 1018.4161, found 1018.422913 ABEA-EVOBlue 30 NECA C37H49N10O9S (MH)+ requires 809.3399, found 809.342714 XAC-X-BY630 XAC C50H55BF2N9O7S (MH)+ requires 974.4006, found 974.404115 XAC-X-Texas Red XAC C58H68N9O11S2 (MH)+ requires 1130.4480, found 1130.453016 XAC-Cy5 XAC C54H67N8O11S2 (M2H)+ requires 1067.4365, found 1067.449517 XAC-AEAO-BYFL XAC C45H60BF2N10O7 (MH)+ requires 901.4708, found 901.469118 XAC-EVOBlue 30 XAC C42H52N9O9S (MH)+ requires 858.3609, found 858.364619 XAC-dansyl XAC C33H40N7O6S (MH)+ requires 662.2761, found 662.274020 XAC-AO-dansyl XAC C41H55N8O7S (MH)+ requires 803.3914, found 803.397121 XAC-AHH-dansyl XAC C45H65N9O8S (MH)+ requires 888.4442, found 888.4612
The confirmed molecular weight from mass spectroscopy is also compared with the predicted molecular weight for the final product.ABEA, N6-(4-aminobutyl)-5′-ethylamino-5′-oxo-5′-deoxyadenosine; ADOEA, N6-(8-amino-3,6-dioxaoctyl)-5′-ethylamino-5′-oxo-5′-deoxyadenosine; AEAO,8-(2-aminoethylamino)-8-oxooctanoyl; AHH, 6-(6-aminohexanamido)hexanoyl (see Figures 1 and 2 for complete structures); AO, 8-aminooctanoyl; AOEA,N6-(8-aminooctyl)-5′-ethylamino-5′-oxo-5′-deoxyadenosine; APEA, N6-(5-aminopentyl)-5′-ethylamino-5′-oxo-5′-deoxyadenosine; APrEA, N6-(3-aminopropyl)-5′-ethylamino-5′-oxo-5′-deoxyadenosine; AUEA, N6-(11-aminoundecyl)-5′-ethylamino-5′-oxo-5′-deoxyadenosine; NECA, 5′(N-ethylcarboxamido)adenosine; X,6-aminohexanoyl; XAC, xanthine amine congener.
Table 2 Inhibition of specific binding of 3H-DPCPX to the adenosine A1-receptor by fluorescent analogues of NECA and XAC
Log KD1 Log IC50 % Inhibition2 n
NECA -5.97 � 0.03 8APrEA-X-BY630 -6.62 � 0.09 (apparent) -6.51 � 0.10 55.4 � 2.5% 10ABEA-X-BY630 -5.93 � 0.10 (apparent) -5.81 � 0.10 46.2 � 4.9% 10APEA-X-BY630 -6.01 � 0.25 (apparent) -5.89 � 0.25 45.3 � 4.2% 9AOEA-X-BY630 -6.15 � 0.21 (apparent) -6.04 � 0.21 19.7 � 3.6% 7ADOEA-X-BY630 -6.19 � 0.24 (apparent) -6.23 � 0.23 24.3 � 4.8% 7ABEA-dansyl >-4 5ABEA-AO-dansyl NI 3AUEA-dansyl -4.97 � 0.15 (apparent) -4.83 � 0.15 44.8 � 2.3% 6ABEA-X-Texas Red >-4 6ABEA-EVOBlue 30 >-5 2ABEA-Cy5 NI 4ABEA-BYFL NI 4ABEA-X-BYFL >-4 5XAC -7.38 � 0.05 11XAC-X-BY630 -7.42 � 0.05 (apparent) -7.28 � 0.05 82.3 � 1.4% 10XAC-X-Texas Red -5.72 � 0.07 7XAC-AEAO-BYFL NI 5XAC-EVOBlue 30 -5.27 � 0.11 6XAC-Cy5 -5.59 � 0.02 6XAC-dansyl -6.71 � 0.05 7XAC-AO-dansyl -6.91 � 0.09 (apparent) -6.77 � 0.09 91.0 � 0.5% 6XAC-AHH-dansyl -6.87 � 0.05 (apparent) -6.73 � 0.04 81.0 � 0.9% 6
All values are mean � SEM.1Unless otherwise stated, KD values were calculated as described under Methods. In those situations where a maximal inhibition of specific binding was obtainedthat was less than 100% (defined with 10 mM XAC), an apparent KD was calculated from the IC50 of the displaceable component of binding.2Where indicated, maximum inhibition of specific binding was obtained that was less than that defined with 10 mM XAC.ABEA, N6-(4-aminobutyl)-5′-ethylamino-5′-oxo-5′-deoxyadenosine; ADOEA, N6-(8-amino-3,6-dioxaoctyl)-5′-ethylamino-5′-oxo-5′-deoxyadenosine; AEAO,8-(2-aminoethylamino)-8-oxooctanoyl; AHH, 6-(6-aminohexanamido)hexanoyl (See Figures 1 and 2 for complete structures); AO, 8-aminooctanoyl; AOEA,N6-(8-aminooctyl)-5′-ethylamino-5′-oxo-5′-deoxyadenosine; APEA, N6-(5-aminopentyl)-5′-ethylamino-5′-oxo-5′-deoxyadenosine; APrEA, N6-(3-aminopropyl)-5′-ethylamino-5′-oxo-5′-deoxyadenosine; AUEA, N6-(11-aminoundecyl)-5′-ethylamino-5′-oxo-5′-deoxyadenosine; NECA, 5′(N-ethylcarboxamido)adenosine; NI, noinhibition of specific binding at concentrations up to 0.1 mM; X, 6-aminohexanoyl; XAC, xanthine amine congener.
Fluorescent A1 receptor ligands778 JG Baker et al
British Journal of Pharmacology (2010) 159 772–786

studies, XAC-X-BY630 (14) showed a comparable affinity forthe adenosine A1 receptor (Table 2), and inhibited over 80% ofspecific binding (Figure 3). Derivatives in which the fluoro-phore was changed, but which had an equivalent linkerlength, showed significant differences in their binding prop-erties (Table 2). XAC-AO-dansyl (20) showed a reducedbut reasonable affinity. In contrast, XAC-Cy5 (16), XAC-EVOBlue30 (18) and XAC-X-TXR (15) were at least 10-foldless potent than the BODIPY630/650 derivative. TheBODIPY-FL derivative of XAC (XAC-AEAO-BYFL; 17) showedno displacement of specific binding at concentrations up to10 mM (Figure 3).
The effect of linker length was investigated using threedansyl derivatives (XAC-dansyl (19), XAC-AO-dansyl (20)and XAC-AHH-dansyl (21)), with relative chain lengths of 0,9 and 14 atoms, respectively. Interestingly, increasing thechain length had no significant effect on the binding affinityof the ligand, but did seem to decrease slightly the maximumdisplacement of 3H-DPCPX (Table 2).
The adenosine A1 receptor is primarily a Gi-coupled recep-tor, and, as such, agonist responses result in a decrease incAMP and CRE-mediated gene transcription responses (Bakerand Hill, 2007). In order to make these inhibitory responses
easier to see, forskolin was added to the experiments in orderto raise the basal adenylyl cyclase activity, and thus cAMP andCRE-gene transcription levels. In the presence of forskolin,the agonist response to NECA is comprised of both an inhibi-tory Gi-mediated inhibition of gene transcription and, athigher agonist concentrations, a Gs-mediated enhancementof the response to forskolin (Figure 4). We have previouslyshown that both the Gi and Gs responses to NECA in this cellline are mediated via the adenosine A1 receptor (Baker andHill, 2007). Inverse agonists, however, result in an increase inadenylyl cyclase activity and an increase in CRE-mediatedgene transcription (Figure 4; Baker and Hill, 2007). Log KD
values obtained from antagonism of the Gs and Gi phases ofthe NECA response for each fluorescent antagonist were verysimilar (Table 3). The Gs phase of the NECA response could beisolated by pretreatment with PTX, and the KD values forfluorescent antagonists were again similar (Table 3).
All of the fluorescent derivatives of XAC that were able toantagonize NECA-stimulated Gi-mediated responses, alsoacted as inverse agonists (Table 4; Figure 4). Table 4 shows themean log EC50 values for an increase in CRE-mediated genetranscription that are in good agreement with the antagonistKD values obtained from antagonism of NECA-stimulatedresponses (Table 3). Interestingly, similar KD values wereobtained for XAC-X-BY630 (14), XAC-X-TXR (15) and Dansylderivatives of XAC (19, 20, 21) from inhibition of DPCPXbinding (Table 2).
Fluorescent NECA derivativesIn whole cell radioligand binding assays, the parentA1-receptor agonist, NECA, fully inhibited specific bindingwith a log KD value of -5.97 (see Table 2; Figure 3). The pre-viously characterized A1 receptor agonist ABEA-X-BY630 (2)had a similar apparent log KD value to NECA (Table 2:Figure 3), but displaced only 50% of the specific binding aspreviously reported (Middleton et al., 2007). Maintaining asimilar linker length, but altering the fluorophore to TexasRed (ABEA-X-TR, 11), Cy5 (ABEA-Cy5, 12), EVOBlue30(ABEA-EVOBlue30, 13) or BODIPY FL (ABEA-X-BYFL, 9) effec-tively abolished any measurable affinity of the agonists for theA1 receptor. The dansyl equivalent of ABEA-X-BY630, AUEA-dansyl (10), did show measurable affinity for the A1 receptor,but was significantly less potent (Table 2).
For the BODIPY 630/650-labelled NECA derivatives, varyingthe linker length from three to eight carbon atoms (APrEA-,ABEA-, APEA- and AOEA-X-BY630, 1,2,3 and 4, respectively)did not significantly change their affinity for the adenosine A1
receptor or their inability to displace all of the specificbinding. The exception to this was for the longest chainlength, AOEA-X-BY630 (4), which displaced only 20% of thespecific binding. This lack of displacement was unlikely to bea solubility issue, as a compound with a diethylene glycollinker of equivalent length (ADOEA-X-BY630, 5) showedsimilar properties. In the case of the dansyl derivativesvarying the carbon chain from 4 carbon atoms in ABEA-dansyl (7) to 7 carbon atoms in ABEA-AO-dansyl (8), or 11carbon atoms in AUEA-dansyl (10), indicated that the longercarbon chain length was required for measurable bindingaffinity (Table 2).
A
50
100 XAC
XAC-dansyl
XAC-AO-dansyl
XAC-X-BY630
XAC-AEAO-BYFL
bit
ion
of
sp
ecif
ic
PC
PX
bin
din
g
–12 –11 –10 –9 –8 –7 –6 –5 –4
0
log [XAC or derivative] M
% I
nh
ib3H
-DP
B
50
100 NECA
AprEA-X-BY630
APEA-X-BY630
AOEA-X-BY630
on
of
sp
ec
ific
PX
bin
din
g
–9 –8 –7 –6 –5 –40
50
log [NECA or derivative] M
% I
nh
ibit
i3H
-DP
C
g [ ]
Figure 3 Inhibition of the specific binding of 3H-DPCPX by fluores-cent (A) antagonists and (B) agonists in CHO-A1 cells expressing thehuman adenosine A1 receptor. Non-specific binding was defined with10 mM XAC. 3H-DPCPX was used at (A) 1.30 nM or (B) 1.11 nM.Values represent mean � SEM from triplicate determinations in asingle experiment. These separate experiments are representativeof (A) five and (B) seven separate experiments. AEAO, 8-(2-aminoethylamino)-8-oxooctanoyl; AO, 8-aminooctanoyl; AOEA,N6-(8-aminooctyl)-5′-ethylamino-5′-oxo-5′-deoxyadenosine; APEA, N6-(5-aminopentyl)-5′-ethylamino-5′-oxo-5′-deoxyadenosine; APrEA,N6-(3-aminopropyl)-5′-ethylamino-5′-oxo-5′-deoxyadenosine; X, 6-aminohexanoyl; CHO, Chinese hamster ovary; DPCPX,8-cyclopentyl-1,3-dipropylxanthine; NECA, 5′ (N-ethylcarboxamido)adenosine; X, 6-aminohexanoyl; XAC, xanthine amine congener.
Fluorescent A1 receptor ligandsJG Baker et al 779
British Journal of Pharmacology (2010) 159 772–786
Several of the fluorescent NECA derivatives were also able tostimulate agonist responses via the adenosine A1 receptor(Table 5). In each case, the Gi-coupled agonist response wasabolished following pretreatment of the cells with PTX(Table 5), and could be competitively antagonized by thenon-fluorescent A1 receptor antagonists DPCPX, XAC andCGS 15943 (Table 6). BODIPY 630/650 derivatives of NECAwere able to stimulate both Gi- and Gs- mediated responses(Figure 5). However, the increased length of the linkerresulted in lower potency and reduced Gs responses (Figure 5).The dansyl derivatives of NECA elicited Gi-mediatedresponses, but no significant activation of Gs-mediatedresponses was observed over the concentration range studied(Table 5; Figure 6). This was probably a consequence of their
lower potency and the inability to reach concentrations atwhich a Gs response would be visible.
It was notable that while BODIPY 630/650 derivatives ofNECA became less potent as the carbon chain lengthincreased, the opposite was true for the dansyl derivatives,with the most potent compound being AUEA-dansyl (10),with an 11 carbon linker (Table 5; Figures 5 and 6). This wasin keeping with AUEA-dansyl providing the only measurablebinding affinity in whole cell ligand-binding studies. It wasnotable that IC50 values for the Gi-mediated function genetranscription responses were generally much lower than theKD values obtained in binding experiments for all agonists.This reflects the fact that this is a well-coupled system andexplains why weak agonist responses were obtained for
Basal
Forskolin 3 μM
1.0
1.5
AP
pro
duct
ion
OD
units)
XAC-X-BY630 1μM
NECA
NECA + XAC-X-BY630 1μM
A
0.0
0.5
–11 –10 –9 –8 –7 –6 –5
log[NECA](M)
SP
A (
B l
0.4
0.6
0.8
1.0
AP
pro
duction
OD
units)
asa
Forskolin 3 μM
XAC-X-BY630
D
0.0
0.2
0.4
–11 –10 –9 –8 –7 –6 –5
log[XAC-X-BY630](M)
SP
A (0 4
0.6
0.8
1.0
P p
roduct
ion
OD
units)
Basal
Forskolin 3 μM
XAC-X-TXR
E
0.0
0.2
0.4
–11 –10 –9 –8 –7 –6 –5
log[XAC-X-TXR](M)
SP
A (O
0.50
0.75
1.00
P p
roduction
OD
units)
Basal
Forskolin 3 μM
XAC-X-TXR 1μM
NECA
NECA + XAC-X-TXR 1μM
B
0.00
0.25
–11 –10 –9 –8 –7 –6 –5
log[NECA](M)
SP
AP (O
0.75
1.00
oduction
nits)
Basal
Forskolin 3 μM
XAC-AEAO-BYFL 1μM
NECA
NECA + XAC-AEAO-BYFL 1μM
C
0.00
0.25
0.50
–11 –10 –9 –8 –7 –6 –5
log[NECA](M)
SP
AP
pr
(OD
u
0.8
1.0
1.2
oduction
units)
Basal
Forskolin 3 μM
XAC-AEAO-BYFL
F
0.0
0.2
0.4
0.6
–11 –10 –9 –8 –7 –6 –5
log[XAC-AEAO-BYFL](M)
SP
AP
pro
(OD
u
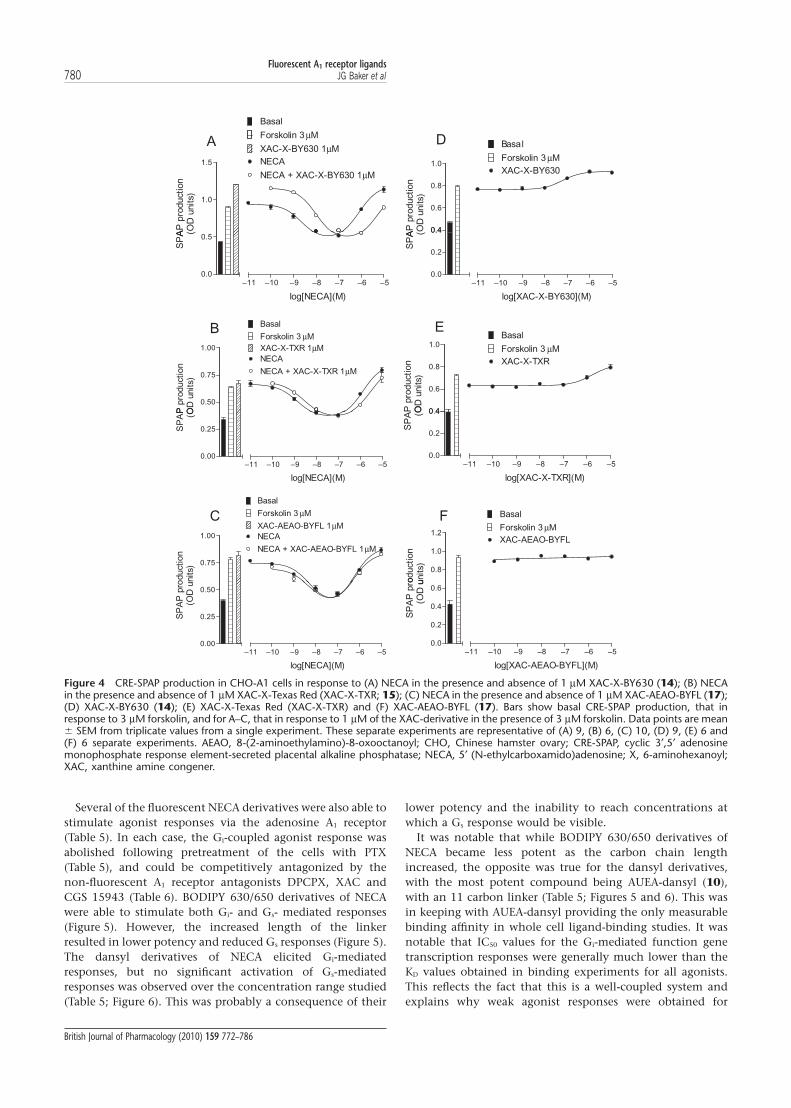
Figure 4 CRE-SPAP production in CHO-A1 cells in response to (A) NECA in the presence and absence of 1 mM XAC-X-BY630 (14); (B) NECAin the presence and absence of 1 mM XAC-X-Texas Red (XAC-X-TXR; 15); (C) NECA in the presence and absence of 1 mM XAC-AEAO-BYFL (17);(D) XAC-X-BY630 (14); (E) XAC-X-Texas Red (XAC-X-TXR) and (F) XAC-AEAO-BYFL (17). Bars show basal CRE-SPAP production, that inresponse to 3 mM forskolin, and for A–C, that in response to 1 mM of the XAC-derivative in the presence of 3 mM forskolin. Data points are mean� SEM from triplicate values from a single experiment. These separate experiments are representative of (A) 9, (B) 6, (C) 10, (D) 9, (E) 6 and(F) 6 separate experiments. AEAO, 8-(2-aminoethylamino)-8-oxooctanoyl; CHO, Chinese hamster ovary; CRE-SPAP, cyclic 3′,5′ adenosinemonophosphate response element-secreted placental alkaline phosphatase; NECA, 5′ (N-ethylcarboxamido)adenosine; X, 6-aminohexanoyl;XAC, xanthine amine congener.
Fluorescent A1 receptor ligands780 JG Baker et al
British Journal of Pharmacology (2010) 159 772–786
several compounds when no displacement of 3H-DPCPXbinding was detectable. This was particularly true of theBODIPY FL derivatives ABEA-BYFL (6) and ABEA-X-BYFL (9).
Visualizing ligand binding to live cellsAll of the fluorescent ligands were examined under the con-focal microscope for their ability to bind to CHO-A1 cells(Figure 7). When XAC-X-TXR (15) was monitored at thesingle-cell level, no specific binding was seen at concentra-tions up to 30 nM. At 30 nM, bright fluorescence was seenbetween cells (Figure 7E), suggesting that enough of thefluorescent molecules were present to be detected by confocalmicroscopy, but this fluorescence was lost immediately onwashout of the label (Figure 7F). In the case of the dansylderivatives (both agonist and antagonist), no increase in fluo-rescence was seen above the level of autofluoresence from thecells (Figure 7G,H). Furthermore, unlike the situation withXAC-X-TXR (15), no dansyl fluorescence was detected in solu-tion. When XAC-X-BY630 (14) and the BODIPY 630/650derivatives of NECA (1–4) were visualized, clear membranebinding was observed even in the continued presence of fluo-rescent ligand (Figure 7A–D). This latter result suggests that theBODIPY 630/650 fluorophore is heavily quenched in aqueoussolution. This suggestion was reinforced when excitation andemission spectra for XAC-dansyl (19), XAC-X-TR (15) andXAC-X-BY630 (14) were determined in HBS and methanol(Figure 8). The ratio of peak emission intensities in HBS com-
pared with methanol was 0.89 for XAC-X-TR (15), 0.26 forXAC-dansyl (19) and 0.07 for XAC-X-BY630 (14). It was alsonotable that clear membrane binding could be detected withXAC-X-BY630 when confocal imaging was undertaken inthe presence of Brilliant Black BN (50 mM), which heavilyquenches the extracellular aqueous fluorescence (Figure 9).
Discussion
XAC and its antagonist fluorescent derivativesXAC is a well-known antagonist of the human adenosine A1
receptor. It bound with high affinity to the human adenosineA1 receptor in this transfected cell system (log KD -7.38). Inkeeping with previous findings, the inverse agonist nature ofthis ligand was also evident (Baker and Hill, 2007). The addi-tion of EVOBlue30, Cy5 and BODIPY-FL fluorophores to XACresulted in a large loss in affinity of the resultant molecules,with only very weak binding being detected for XAC-Cy5 (16)and XAC-EVOBlue30 (18). None of these XAC derivativeswere able to inhibit any of the NECA agonist responses (at aconcentration up to 1 mM for the fluorescent XAC ligand).The addition of the EVOBlue, Cy5 and BODIPY-FL fluoro-phores to XAC therefore resulted in a loss of pharmacologicalactivity of the XAC molecule that was due to a large reductionin affinity for the adenosine A1 receptor.
When the XAC-X-Texas Red (15) molecule was examined,the affinity as measured by 3H-DPCPX binding was about30-fold lower than that seen with the parent XAC. XAC-X-Texas Red (15) was also able to inhibit the NECA agonistresponses, and this included both those occurring via theGi-and Gs-coupled states of the receptor (Table 3). However,when XAC-X-Texas Red (15) was monitored at the single-celllevel, no specific binding was seen at concentrations up to30 nM. At 30 nM, bright fluorescence was seen between cells,suggesting that enough fluorescent molecules were present tobe detected by confocal microscopy, but this fluorescence waslost immediately on washout of the label. This suggests thatthe affinity of XAC-X-Texas Red (15) for the adenosine A1
receptor is too low for successful imaging studies.The addition of the smaller dansyl fluorophore to XAC
resulted in a molecule that maintained high affinity at the A1
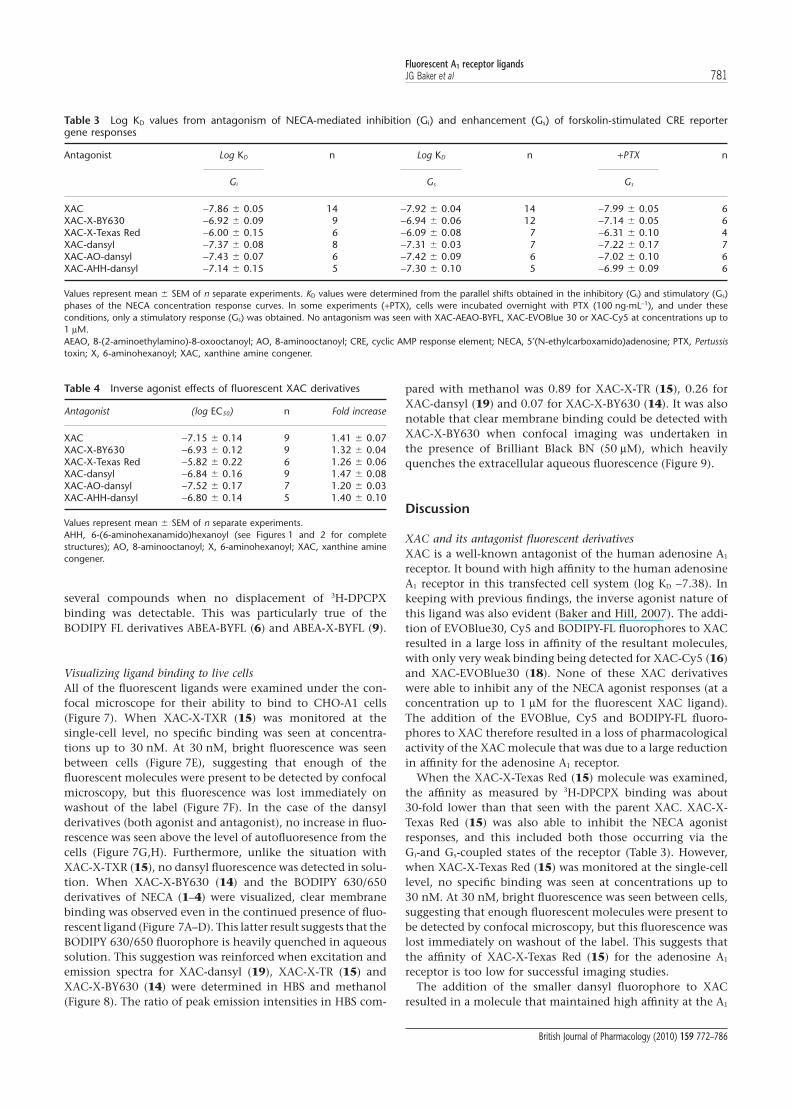
Table 3 Log KD values from antagonism of NECA-mediated inhibition (Gi) and enhancement (Gs) of forskolin-stimulated CRE reportergene responses
Antagonist Log KD n Log KD n +PTX n
Gi Gs Gs
XAC -7.86 � 0.05 14 -7.92 � 0.04 14 -7.99 � 0.05 6XAC-X-BY630 -6.92 � 0.09 9 -6.94 � 0.06 12 -7.14 � 0.05 6XAC-X-Texas Red -6.00 � 0.15 6 -6.09 � 0.08 7 -6.31 � 0.10 4XAC-dansyl -7.37 � 0.08 8 -7.31 � 0.03 7 -7.22 � 0.17 7XAC-AO-dansyl -7.43 � 0.07 6 -7.42 � 0.09 6 -7.02 � 0.10 6XAC-AHH-dansyl -7.14 � 0.15 5 -7.30 � 0.10 5 -6.99 � 0.09 6
Values represent mean � SEM of n separate experiments. KD values were determined from the parallel shifts obtained in the inhibitory (Gi) and stimulatory (Gs)phases of the NECA concentration response curves. In some experiments (+PTX), cells were incubated overnight with PTX (100 ng·mL–1), and under theseconditions, only a stimulatory response (Gs) was obtained. No antagonism was seen with XAC-AEAO-BYFL, XAC-EVOBlue 30 or XAC-Cy5 at concentrations up to1 mM.AEAO, 8-(2-aminoethylamino)-8-oxooctanoyl; AO, 8-aminooctanoyl; CRE, cyclic AMP response element; NECA, 5′(N-ethylcarboxamido)adenosine; PTX, Pertussistoxin; X, 6-aminohexanoyl; XAC, xanthine amine congener.
Table 4 Inverse agonist effects of fluorescent XAC derivatives
Antagonist (log EC50) n Fold increase
XAC -7.15 � 0.14 9 1.41 � 0.07XAC-X-BY630 -6.93 � 0.12 9 1.32 � 0.04XAC-X-Texas Red -5.82 � 0.22 6 1.26 � 0.06XAC-dansyl -6.84 � 0.16 9 1.47 � 0.08XAC-AO-dansyl -7.52 � 0.17 7 1.20 � 0.03XAC-AHH-dansyl -6.80 � 0.14 5 1.40 � 0.10
Values represent mean � SEM of n separate experiments.AHH, 6-(6-aminohexanamido)hexanoyl (see Figures 1 and 2 for completestructures); AO, 8-aminooctanoyl; X, 6-aminohexanoyl; XAC, xanthine aminecongener.
Fluorescent A1 receptor ligandsJG Baker et al 781
British Journal of Pharmacology (2010) 159 772–786
receptor, comparable with that of the parent XAC molecule.This was true whether the affinity was deduced from inhibi-tion of specific 3H-DPCPX binding or from inhibition of theNECA-stimulated reporter gene responses (Tables 2 and 3).The addition of the dansyl fluorophore therefore had littleeffect on the pharmacological properties of XAC. However,when the ligands were visualized, no binding was seen at all.In fact, no increase in fluorescence was seen above the level ofcellular autofluoresence (Figure 7). Furthermore, unlike thesituation with XAC-X-Texas Red (15), no dansyl fluorescencewas detected in solution. This is consistent with the relativelyweak fluorescence intensity normally observed with dansylfluorophores in aqueous solution (Hayashida et al., 2007).This fluorophore has been observed previously to demon-strate sensitivity to the microenvironment polarity such thatits fluorescence intensity increases in lower polarity environ-
ments along with a blue shift in emission wavelength(Hayashida et al., 2007). The increase in fluorescence intensityin environments of lower polarity (methanol) was also dem-onstrated directly in the present study (Figure 8), althoughthe emission wavelength increased slightly. These datasuggest that when the dansyl derivatives are bound to theadenosine A1 receptor, the fluorophore is likely to be locatedwithin an aqueous and/or highly quenched environment.
The addition of BODIPY 630/650 fluorophore to the XACmolecule made no difference to the affinity of the moleculesas determined from 3H-DPCPX whole cell binding. Theinverse agonist activity of the molecule was maintained, aswas the affinity when measured at both the Gi- andGs-coupled states of the receptor. Furthermore, when XAC-X-BY630 (14) was visualized using the confocal microscope,clear membrane binding was observed, which remained even
Table 5 Agonist responses to fluorescent NECA analogues at the adenosine A1 receptor
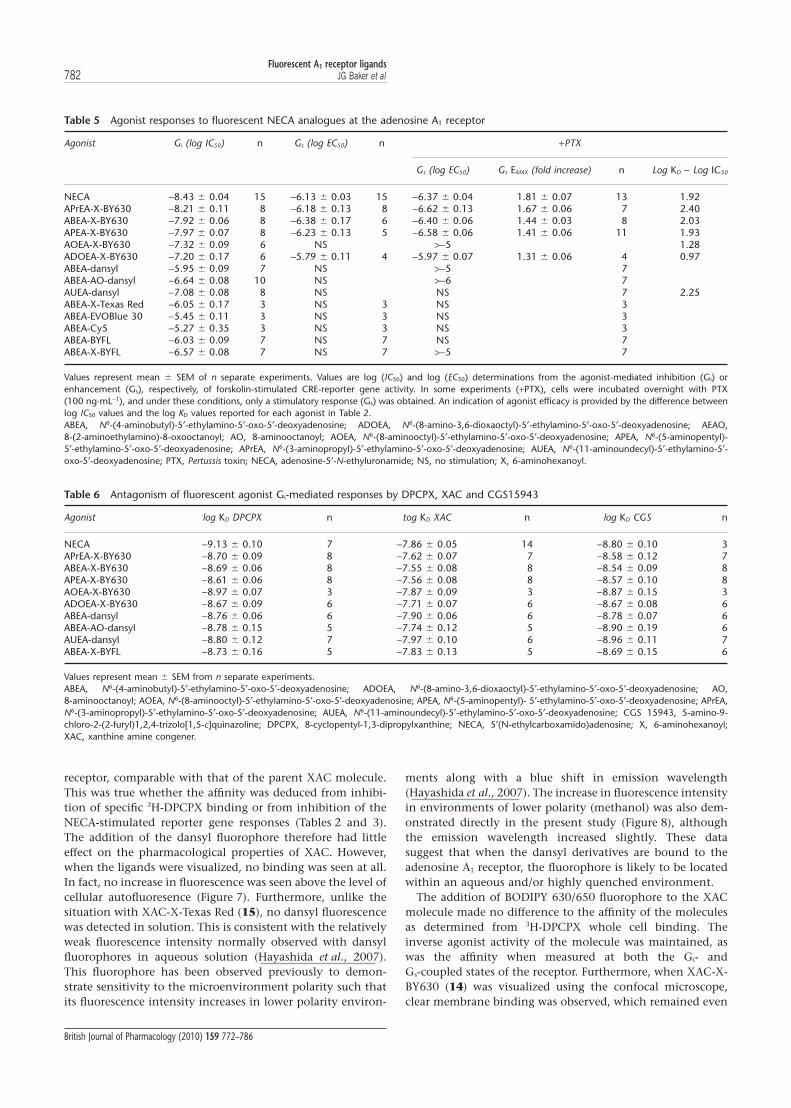
Agonist Gi (log IC50) n Gs (log EC50) n +PTX
Gs (log EC50) Gs EMAX (fold increase) n Log KD - Log IC50
NECA -8.43 � 0.04 15 -6.13 � 0.03 15 -6.37 � 0.04 1.81 � 0.07 13 1.92APrEA-X-BY630 -8.21 � 0.11 8 -6.18 � 0.13 8 -6.62 � 0.13 1.67 � 0.06 7 2.40ABEA-X-BY630 -7.92 � 0.06 8 -6.38 � 0.17 6 -6.40 � 0.06 1.44 � 0.03 8 2.03APEA-X-BY630 -7.97 � 0.07 8 -6.23 � 0.13 5 -6.58 � 0.06 1.41 � 0.06 11 1.93AOEA-X-BY630 -7.32 � 0.09 6 NS >-5 1.28ADOEA-X-BY630 -7.20 � 0.17 6 -5.79 � 0.11 4 -5.97 � 0.07 1.31 � 0.06 4 0.97ABEA-dansyl -5.95 � 0.09 7 NS >-5 7ABEA-AO-dansyl -6.64 � 0.08 10 NS >-6 7AUEA-dansyl -7.08 � 0.08 8 NS NS 7 2.25ABEA-X-Texas Red -6.05 � 0.17 3 NS 3 NS 3ABEA-EVOBlue 30 -5.45 � 0.11 3 NS 3 NS 3ABEA-Cy5 -5.27 � 0.35 3 NS 3 NS 3ABEA-BYFL -6.03 � 0.09 7 NS 7 NS 7ABEA-X-BYFL -6.57 � 0.08 7 NS 7 >-5 7
Values represent mean � SEM of n separate experiments. Values are log (IC50) and log (EC50) determinations from the agonist-mediated inhibition (Gi) orenhancement (Gs), respectively, of forskolin-stimulated CRE-reporter gene activity. In some experiments (+PTX), cells were incubated overnight with PTX(100 ng·mL-1), and under these conditions, only a stimulatory response (Gs) was obtained. An indication of agonist efficacy is provided by the difference betweenlog IC50 values and the log KD values reported for each agonist in Table 2.ABEA, N6-(4-aminobutyl)-5′-ethylamino-5′-oxo-5′-deoxyadenosine; ADOEA, N6-(8-amino-3,6-dioxaoctyl)-5′-ethylamino-5′-oxo-5′-deoxyadenosine; AEAO,8-(2-aminoethylamino)-8-oxooctanoyl; AO, 8-aminooctanoyl; AOEA, N6-(8-aminooctyl)-5′-ethylamino-5′-oxo-5′-deoxyadenosine; APEA, N6-(5-aminopentyl)-5′-ethylamino-5′-oxo-5′-deoxyadenosine; APrEA, N6-(3-aminopropyl)-5′-ethylamino-5′-oxo-5′-deoxyadenosine; AUEA, N6-(11-aminoundecyl)-5′-ethylamino-5′-oxo-5′-deoxyadenosine; PTX, Pertussis toxin; NECA, adenosine-5′-N-ethyluronamide; NS, no stimulation; X, 6-aminohexanoyl.
Table 6 Antagonism of fluorescent agonist Gi-mediated responses by DPCPX, XAC and CGS15943
Agonist log KD DPCPX n tog KD XAC n log KD CGS n
NECA -9.13 � 0.10 7 -7.86 � 0.05 14 -8.80 � 0.10 3APrEA-X-BY630 -8.70 � 0.09 8 -7.62 � 0.07 7 -8.58 � 0.12 7ABEA-X-BY630 -8.69 � 0.06 8 -7.55 � 0.08 8 -8.54 � 0.09 8APEA-X-BY630 -8.61 � 0.06 8 -7.56 � 0.08 8 -8.57 � 0.10 8AOEA-X-BY630 -8.97 � 0.07 3 -7.87 � 0.09 3 -8.87 � 0.15 3ADOEA-X-BY630 -8.67 � 0.09 6 -7.71 � 0.07 6 -8.67 � 0.08 6ABEA-dansyl -8.76 � 0.06 6 -7.90 � 0.06 6 -8.78 � 0.07 6ABEA-AO-dansyl -8.78 � 0.15 5 -7.74 � 0.12 5 -8.90 � 0.19 6AUEA-dansyl -8.80 � 0.12 7 -7.97 � 0.10 6 -8.96 � 0.11 7ABEA-X-BYFL -8.73 � 0.16 5 -7.83 � 0.13 5 -8.69 � 0.15 6
Values represent mean � SEM from n separate experiments.ABEA, N6-(4-aminobutyl)-5′-ethylamino-5′-oxo-5′-deoxyadenosine; ADOEA, N6-(8-amino-3,6-dioxaoctyl)-5′-ethylamino-5′-oxo-5′-deoxyadenosine; AO,8-aminooctanoyl; AOEA, N6-(8-aminooctyl)-5′-ethylamino-5′-oxo-5′-deoxyadenosine; APEA, N6-(5-aminopentyl)- 5′-ethylamino-5′-oxo-5′-deoxyadenosine; APrEA,N6-(3-aminopropyl)-5′-ethylamino-5′-oxo-5′-deoxyadenosine; AUEA, N6-(11-aminoundecyl)-5′-ethylamino-5′-oxo-5′-deoxyadenosine; CGS 15943, 5-amino-9-chloro-2-(2-furyl)1,2,4-trizolo[1,5-c]quinazoline; DPCPX, 8-cyclopentyl-1,3-dipropylxanthine; NECA, 5′(N-ethylcarboxamido)adenosine; X, 6-aminohexanoyl;XAC, xanthine amine congener.
Fluorescent A1 receptor ligands782 JG Baker et al
British Journal of Pharmacology (2010) 159 772–786

when the extracellular fluorescent ligands were washed away.Thus, the addition of BODIPY 630/650 to XAC had very littleeffect on the pharmacology of the molecule, with all thepharmacological properties being preserved in addition togood fluorescent properties. A striking property of theBODIPY 630/650 ligands was that membrane binding to cellsexpressing the adenosine A1 receptor could be determined inthe continued presence of the fluorescent ligand. These datasuggest that the fluorescence intensity of the BODIPY 630/650fluorophore increases on binding to the receptor. Thus, unlikethe dansyl congeners, the BODIPY 630/650 fluorophore islikely to be located within a non-polar environment whenbound to the A1 receptor.
NECA and its fluorescent derivativesNECA had a binding affinity as measured by 3H-DPCPXwhole-cell binding of 1 mM. The IC50 for activation of theadenosine A1 receptor was, however, 38 nM. This is becauseNECA is a highly efficacious agonist and needs to occupy onlya few receptors to stimulate a full agonist response. Thishighly efficacious nature of NECA makes it an ideal choice forthe starting molecule from which to make fluorescent deriva-tives. Adenosine A1 receptors have also been shown to coupleto Gs-coupled receptors in CHO cells (Cordeaux et al., 2000;2004; Baker and Hill, 2007), and the EC50 for stimulation byNECA of the Gs-coupled state of the receptor (794 nM) showsthat this coupling is much less efficient.
A
Basal
Forskolin 3 μM
DPCPX 30 nM
0.4
0.6
0.8
1.0
1.2
PA
P p
rod
uctio
n(O
D u
nits)
APrEA-X-BY630
APrEA-X-BY630 + DPCPX 30 nM
0.0
0.2
–11 –10 –9 –8 –7 –6 –5
log[APrEA-X-BY630](M)
SP
D
Basal
Forskolin 3μM
DPCPX 10 nM
+ PTX1.0
1.5
2.0
2.5
PA
P p
roduction
(OD
units)
APrEA-X-BY630
APrEA-X-BY630 + DPCPX 10 nM
+ PTX
0.0
0.5
–11 –10 –9 –8 –7 –6 –5
log[APrEA-X-BY630](M)
SP
Basal
Forskolin 3 μMB
0.6
0.8
1.0
1.2
P p
roduction
OD
units)
DPCPX 30 nM
APEA-X-BY630
APEA-X-BY630 + DPCPX 30 nM
0.0
0.2
0.4
–11 –10 –9 –8 –7 –6 –5
log[APEA-X-BY630](M)
SP
AP (O
Basal
Forskolin 3 μM
DPCPX 10 nME
1.0
1.5
2.0
P p
roduction
OD
units)
APEA-X-BY630
APEA-X-BY630 + DPCPX 10 nM
+ PTX
0.0
0.5
–11 –10 –9 –8 –7 –6 –5
log[APEA-X-BY630](M)
SP
AP (O
Basal
F
1 0
1.5
2.0
pro
duction
units)
Basal
Forskolin 3 μM
DPCPX 10 nM
ADOEA-X-BY630
ADOEA-X-BY630 + DPCPX 10 nM
+ PTX
0.0
0.5
1.0
–11 –10 –9 –8 –7 –6 –5
log[ADOEA-X-BY630](M)
SP
AP
p(O
D
Basal
C
0 6
0.8
1.0
1.2
roduct
ion
units)
Forskolin 3 μM
DPCPX 30 nM
ADOEA-X-BY630
ADOEA-X-BY630 + DPCPX 30 nM
0.0
0.2
0.4
0.6
–11 –10 –9 –8 –7 –6 –5
log[ADOEA-X-BY630](M)
SP
AP
p(O
D
Figure 5 CRE-SPAP production in CHO-A1 cells in response to APrEA-X-BY630 (A and D), APEA-X-BY630 (B and E), ADOEA-X-BY630 (C andF) in the presence and absence of 30 nM DPCPX (A, B and C) and 10 nM DPCPX (D, E and F). The cells in D, E and F were incubated withPTX (100 ng·mL-1) for 24 h before experimentation. Bars show basal CRE-SPAP production, that in response to 3 mM forskolin and that inresponse to either 30 nM or 10 nM DPCPX in the presence of 3 mM forskolin. Data points are mean � SEM from triplicate values from a singleexperiment. These separate experiments are representative of (A) 8, (B) 8, (C) 6, (D) 6, (E) 6 and (F) 6 separate experiments. ADOEA,N6-(8-amino-3,6-dioxaoctyl)-5′-ethylamino-5′-oxo-5′-deoxyadenosine; APEA, N6-(5-aminopentyl)-5′-ethylamino-5′-oxo-5′-deoxyadenosine;APrEA, N6-(3-aminopropyl)-5′-ethylamino-5′-oxo-5′-deoxyadenosine; CHO, Chinese hamster ovary; CRE-SPAP, cyclic AMP response element-secreted placental alkaline phosphatase; DPCPX, 8-cyclopentyl-1,3-dipropylxanthine; NECA, 5′ (N-ethylcarboxamido)adenosine; PTX, Pertussistoxin; X, 6-aminohexanoyl.
Fluorescent A1 receptor ligandsJG Baker et al 783
British Journal of Pharmacology (2010) 159 772–786

The NECA agonist response was inhibited by non-fluorescent adenosine A1 receptor antagonists to give valuessimilar to those previously published (Baker and Hill, 2007).The affinity of non-fluorescent antagonists was the same forboth the NECA–Gi-induced state of the receptor, and theNECA-induced Gs state of the receptor. The Gs-coupled statecould be isolated by pre-incubating the cells with PTX. Thisresulted in a complete abolition of the inhibitory Gi-response(i.e. the reduction in CRE-gene transcription), leaving onlythe Gs-stimulatory response intact. The affinity of the non-fluorescent antagonists measured under these conditions wasalso identical.
The addition of the EVOBlue30, Texas Red and Cy5 fluoro-phores to the parent NECA molecule completely abolished allmeasurable pharmacological activity. The addition of theBODIPY-FL fluorophore resulted in molecules with muchreduced potency, which was probably due to a reduction inaffinity, as no binding was detectable. The agonist response tothese molecules was mediated by the adenosine A1 receptor, asit could be inhibited by non-fluorescent A1 receptor antago-nists to give the same affinity (log KD values) as for the parentNECA. Furthermore, the response was abolished followingPTX pretreatment confirming that it was occurring via theGi-coupled state of the receptor. However, when these NECAderivatives were examined using confocal microscopy, no spe-cific binding was seen with any of the ligands. Thus, althoughABEA-X-BYFL (9) had marginal functional activity, none ofthe Texas Red, EVOblue30, Cy5 or BODIPY-FL derivativeshave useful functional or fluorescent use.
The addition of the dansyl derivatives to the parent NECAmolecule did result in functionally active molecules. Thesemolecules had reduced affinity for the adenosine A1 receptor(Table 2); however agonist Gi-coupled inhibitory functionalresponses were still seen. Although none of the dansyl deriva-tives of NECA were sufficiently efficacious to induce theGs-coupled state of the A1 receptor, it is interesting to notethat lengthening the carbon chain in the linker between theNECA moiety and fluorophore from C4 to C11 (AUEA-dansyl,10) resulted in an increase in agonist potency of 10-fold, and
that this was most likely due to an increase in affinity(Table 2). However, the combination of lower affinity for theadenosine A1 receptor, together with the problems high-lighted above for dansyl XAC derivatives regarding the lowfluorescence intensity of the dansyl fluorophore in polaraqueous environments, is the most likely explanation of thelack of success with these ligands in confocal microscopystudies.
The addition of a BODIPY 630/650 fluorophore resulted ina series of functionally active molecules. It was only possibleto determine the apparent affinity (log KD values) of thefluorescent NECA BODIPY 630/650 derivatives from the
0.75
1.00Basal
Forskolin 3 μM
AUEA-dansylts)
0.00
0.25
0.50ABEA-AO-dansyl
ABEA-dansyl
SP
AP
pro
du
ctio
n(O
D u
ni
–12 –11 –10 –9 –8 –7 –6 –5
log[NECA-dansyl-derivative](M)
Figure 6 CRE-SPAP production in CHO-A1 cells in response toNECA-dansyl derivatives (AUEA-dansyl, ABEA-AO-dansyl and ABEA-dansyl). Bars show basal CRE-SPAP production, that in response to3 mM forskolin. Data points are mean � SEM from triplicate valuesfrom a single experiment and this is representative of seven separateexperiments. ABEA, N6-(4-aminobutyl)-5′-ethylamino-5′-oxo-5′-deoxyadenosine; AUEA, N6-(11-aminoundecyl)-5′-ethylamino-5′-oxo-5′-deoxyadenosine; CHO, Chinese hamster ovary; CRE-SPAP,cyclic AMP response element-secreted placental alkaline phos-phatase; NECA, 5′ (N-ethylcarboxamido)adenosine.
A B
C D
E F
G H
Figure 7 Confocal images of CHO-A1 cells incubated (5 min) with:(A) APrEA-X-BY630 (10 nM), (B) ADOEA-X-BY630 (10 nM), (C, D)XAC-X-BY630 (30 nM), (E, F) XAC-X-Texas Red (30 nM) and (G)XAC-dansyl (10 nM). In D and F, images were collected immediatelyafter the fluorescent ligand had been removed from the cells. Hshows a representative image of autofluorescence collected underidentical conditions to image (G), but without the addition ofXAC-dansyl. ADOEA, N6-(8-amino-3,6-dioxaoctyl)-5′-ethylamino-5′-oxo-5′-deoxyadenosine; APrEA, N6-(3-aminopropyl)-5′-ethylamino-5′-oxo-5′-deoxyadenosine; CHO, Chinese hamster ovary; X,6-aminohexanoyl; XAC, xanthine amine congener.
Fluorescent A1 receptor ligands784 JG Baker et al
British Journal of Pharmacology (2010) 159 772–786

3H-DPCPX whole cell-binding studies (Table 2) because thefluorescent analogues did not inhibit all of the specificbinding. We have observed this previously for the ABEA-X-BY630 (2) derivative (Middleton et al., 2007), and shown that
this may be partly due to differential penetration of the fluo-rescent ligand and 3H-DPCPX into the intracellular environ-ment of intact cells. Thus, permeabilization of cells didincrease the percentage of specific binding inhibited by thisfluorescent agonist by allowing access to intracellularreceptors (Middleton et al., 2007). An alternative interpreta-tion is that these fluorescent analogues are acting allosteri-cally to inhibit binding of 3H-DPCPX (Christopolous andKenakin, 2002; Kenakin, 2004; May et al., 2007).
It is interesting, however, to note that the log IC50 values ofthe BODIPY 630/650 derivatives in the functional Gi protein-coupled CRE response increased as the linker lengthened. Thisdid not appear to be due to a decrease in binding affinity(Table 2), but rather reflected a decrease in agonist efficacy. Ifone takes the difference between log IC50 and apparent log KD
values as a measure of efficacy, then there was a clear decreasein efficacy as the chain length increased (Table 5). All butAOEA-X-BY630 (4) were able to stimulate an increase in CRE-gene transcription by inducing a Gs-coupled state of theadenosine A1 receptor at higher concentrations. Interestingly,the ADOEA-X-BY630 (5) analogue was equally potent withAOEA-X-BY630 (which has an identical linker length) atinhibiting CRE-gene transcription, but retained someGs-stimulating activity (Table 5). These data suggest that thelatter compound has a reduced affinity and/or efficacy for theGs-coupled conformation of the adenosine A1 receptor com-pared with the other fluorescent agonists.
In the case of the dansyl NECA derivatives, there is a hintthat affinity and/or efficacy increases as the chain lengthincreases. This is opposite to the finding with the BODIPY630/650 derivatives, and this observation may provide aclue to the orientation of the fluorophore within the
1.0
MeOH
HBS
B XAC-X-TR
0.2
0.4
0.6
0.8MeOH
Em
issio
n
(fra
cti
on
MeO
H m
ax)
500 550 600 650 700 7500.0
l (nm)
C XAC-X-BY630
A XAC-dansyl
0.4
0.6
0.8
1.0MeOH
HBS
Em
issio
n
acti
on
M
eO
H m
ax)
300 400 500 6000.0
0.2
l (nm)
(fra
0 4
0.6
0.8
1.0 HBS
MeOH
Em
issio
n
on
MeO
H m
ax)
500 550 600 650 700 7500.0
0.2
0.4
l (nm)
E
(fr
acti
Figure 8 Normalized excitation and emission spectra obtained inHBS or methanol for (A) XAC-dansyl (50 mM), (B) XAC-X-Texas Red(1 mM) and (C) XAC-X-BY630 (1 mM). Data have been normalized tothe maximum excitation or emission obtained with each ligand inmethanol. Excitation maxima were: (A) 320, 315 nm; (B) 590,585 nm and (C) 628, 634 nm in HBS and methanol respectively.Corresponding emission maxima were: (A) 500, 525 nm; (B) 605,600 nm and (C) 645, 640 nm. The relative maximal emission inten-sities (HBS; methanol) were: (A) 0.26; (B) 0.89 and (C) 0.07. HBS,N-2-Hydroxyethylpiperazine-N′-2-ethanesulfonic acid-buffered sal-ine; X, 6-aminohexanoyl; XAC, xanthine amine congener.
Control Brilliant Black (50mM)
A B
XAC-X-BY630
(10 nM, 2 min)
C D
Phase
Figure 9 The effect of Brilliant Black on the fluorescence of XAC-X-BY630 bound to CHO-A1 cells. CHO-A1 cells were incubated withXAC-X-BY630 (10 nM, 37°C) for 2 min, and a single confocal (A) andsimultaneous phase image (C) were acquired. Immediately followingthe addition of the fluorescence quencher, Brilliant Black (50 mM),similar confocal (B) and phase contrast (D) images were taken, withthe darkening of the phase image indicating a successful addition ofthe Brilliant Black. CHO, Chinese hamster ovary; X, 6-aminohexanoyl;XAC, xanthine amine congener.
Fluorescent A1 receptor ligandsJG Baker et al 785
British Journal of Pharmacology (2010) 159 772–786

receptor-binding pocket. A comparison of the affinity of XAC-X-BY630 with all three XAC dansyl derivatives suggests thatbinding affinity is retained with both fluorophores. However,the marked differences in fluorescence intensity of ligandbinding at the single-cell level with these fluorescent ligandssuggest that the dansyl fluorophore is located within anaqueous environment, whereas the BODIPY 630/650 fluoro-phore is within a less polar membrane environment. Thissuggestion is supported by the data obtained with XAC-dansyl(19) and XAC-X-BY630 (14) in aqueous buffer or methanol(Figure 7), which shows a marked quenching of both agents inaqueous environments. The clear imaging of membrane bind-ing of XAC-X-BY630 (Figure 9) in CHO-A1 cells in the presenceof Brilliant Black is also consistent with this conclusion.
The opposite influence of chain length on agonist activityof the dansyl and BODIPY 630/650 NECA derivatives isentirely consistent with this interpretation. That is, theBODIPY 630/650 fluorophore could potentially be placedwithin the transmembrane lipid environment of the A1 recep-tor binding site without interfering with agonist action evenwith short linker lengths, whereas the dansyl fluorophoremay alternatively need to exit the binding pocket into theextracellular aqueous medium on a long linker to avoidunfavourable interactions with either the surrounding lipidenvironment or the receptor itself.
In summary, the present study adds further weight to theargument that design of a fluorescent ligand needs to takeinto account the influence of both the fluorophore and theassociated linker on the pharmacology of the final product.Furthermore, our data strongly suggest that the physico-chemical properties of the fluorophore/linker pairing ulti-mately determine where in the environment of the targetreceptor the fluorophore is located, and this, together withthe environmental sensitivity of the resulting fluorescence,may ultimately decide its utility as a fluorescent probe.
Acknowledgments
JGB is a Wellcome Trust Clinician Scientist Fellow. LTM holdsan NHMRC Fellowship. We thank Tim Self, Richard Proud-man and Marleen Groenen for technical assistance. We thankWellcome Trust, BBSRC and MRC for financial support.
Conflicts of interest
SJH and BK are founding directors of the University of Not-tingham spin-out company CellAura Technologies Ltd. RMand LA are currently employed by CellAura Technologies Ltd.
References
Alexander SPH, Mathie A, Peters JA (2008). Guide to Receptors andChannels (GRAC), 3rd edition (2008 revision). Br J Pharmacol 153(Suppl. 2): S1–S209.
Baker JG, Hill SJ (2007). A comparison of the antagonist affinities forthe Gi and Gs-coupled states of the human adenosine A1 receptor.J Pharmacol Exp Ther 320: 218–228.
Baker JG, Hall IP, Hill SJ (2003). Pharmacology and direct visualisation
of BODIPY-TMR-CGP: a long acting fluorescent b2-adrenoceptoragonist. Br J Pharmacol 139: 232–242.
Briddon SJ, Hill SJ (2007). Pharmacology under the microscope: The useof fluorescence correlation spectroscopy to determine the propertiesof ligand-receptor complexes. Trends Pharmacol Sci 28: 637–645.
Briddon SJ, Middleton RJ, Cordeaux Y, Flavin FM, Weinstein JA,George MW et al. (2004). Quantitative analysis of the formationand diffusion of A1-adenosine receptor-antagonist complexes inliving cells. Proc Natl Acad Sci USA 101: 4673–4678.
Christopolous A, Kenakin T (2002). G protein-coupled receptor allos-terism and complexing. Pharmacol Rev 54: 323–374.
Cordeaux Y, Briddon SJ, Megson AE, McDonnell J, Dickenson J, Hill SJ(2000). Influence of receptor number on functional responses elic-ited by agonists acting at the human adenosine A1 receptor: evi-dence for signalling pathway-dependent changes in agonist potencyand relative intrinsic activity. Mol Pharmacol 58: 1075–1084.
Cordeaux Y, IJzerman AP, Hill SJ (2004). Coupling of the human A1receptor to different heterotrimeric G proteins: evidence foragonist-specific G protein activation. Br J Pharmacol 143: 705–714.
Cordeaux Y, Briddon SJ, Alexander SPH, Kellam B, Hill SJ (2008).Agonist occupied A3 adenosine receptors exist within heteroge-neous complexes in membrane microdomains of individual livingcells. FASEB J 22: 850–860.
Daly CJ, McGrath JC (2003). Fluorescent ligands, antibodies, andproteins for the study of receptors. Pharmacol Ther 100: 101–118.
Emmerson PJ, Archer S, El-Harmouly W, Mansour A, Akil H, Medzi-hradsky F (1997). Synthesis and characterization of 4-difluoro-4-bora 3a,4a-diazo-s-indacene (BODIPY)-labeled fluorescent ligandsfor the mu opioid receptor. Biochem Pharmacol 54: 1315–1322.
Fredholm BB, Ijzerman AP, Jacobson KA, Klotz KN, Linden J (2001).International Union of Pharmacology XXV: nomenclature and clas-sification of adenosine receptors. Pharmacol Rev 53: 527–552.
Gines S, Ciruela F, Burgueno J, Casado V, Canela EI, Mallol J et al.(2001). Involvement of caveolin in ligand-induced recruitment andinternalization of A1 adenosine receptor and adenosine deaminasein an epithelial cell line. Molec Pharmacol 59: 1314–1323.
Harikumar KG, Pinon DI, Wessels WS, Prendergast FG, Miller LJ(2002). Environment and mobility of a series of fluorescent report-ers at the amino terminus of structurally related peptide agonistsand antagonists bound to the cholecystokinin receptor. J Biol Chem277: 18552–18560.
Hayashida O, Ogawa N, Uchiyama M (2007). Surface recognition andfluorescence sensing of histone by dansyl-appended cyclophanebased resorcinarene trimer. J Am Chem Soc 129: 13698–13705.
Helmreich EJM (2003). Environmental influences on signal transduc-tion through membranes: A retrospective mini-review. BiophysChem 100: 519–534.
Kenakin T (2004). Allosteric modulators: the new generation of recep-tor antagonist. Mol Interv 4: 222–229.
Libert F, Van Senade J, Lefort A, Czernilofsky A, Dumont JE, Vassart Get al. (1992). Cloning and functional characterization of a humanA1 adenosine receptor. Biochem Biophys Res Commun 187: 919–926.
May LT, Leach K, Sexton PM, Christopolous A (2007). Allostericmodulation of G protein-coupled receptors. Annu Rev PharmacolToxicol 47: 1–51.
Middleton RJ, Kellam B (2005). Fluorophore-tagged GPCR ligands.Curr Opin Chem Biol 9: 517–525.
Middleton RJ, Briddon SJ, Cordeaux Y, Yates AS, Dale CL, George MWet al. (2007). New fluorescent adenosine A1-receptor agonists whichallow quantification of ligand-receptor interactions in micro-domains of single living cells. J Med Chem 50: 782–793.
Olah ME, Styles GL (1995). Adenosine receptor subtypes: character-ization and therapeutic regulation. Annu Rev Pharmacol Toxicol 35:581–606.
Zajchowshi LD, Robbins SM (2002). Lipid rafts and little caves –compartmentalized signalling in membrane microdomains. Eur JBiochem 269: 737–752.
Fluorescent A1 receptor ligands786 JG Baker et al
British Journal of Pharmacology (2010) 159 772–786