Relationship between students' perceptions of the adequacy ...
Upload
indonesiabankingschoolCategory
view
0download
0
Proceedings of Annual Shanghai Business, Economics and Finance Conference
3 - 4 November 2014, Shanghai University of International Business and Economics, Shanghai, China
ISBN: 978-1-922069-63-4
1
Influence of Effeciency and Capital Adequacy on Financial Performance’s Regional Development Banks (BPD) in
Indonesia
Sparta1
This research study analyzes the efficiency in Indonesian BPD bank and to what extent the efficiency, capital adequacy, bank size and macro economic indicators influence on financial performance in Indonesian BPD bank for the period 2008-2012. This study uses the variables ROA, CAR, LNSIZE, GDP, GCRED and INF. The models are estimated using Ordinary Least Square and panel data obtained from Indonesian BPD bank. There are 26 Indonesian BPD banks contain 130 observations. The average BOPO in Indonesian BPD bank for the period of five years is 72.45%. BPD bank Aceh is the most inefficient bank which has BOPO 92.98% and South Sulawesi BPD is the most efficient bank wich has BOPO 54.03%. The most inefficient BPD for each year 2008, 2009, 2010, 2011 and 2012 respectively are BDKI, BSTR, BACH, BSUA and BSSN. The most efficient BPD bank for 2008, 2009, 2010, 2011, and 2012 respectively are BSST, BSTA, BKTM, BSTA and BSTA. None of Indonesian BPD bank in Java could be awarded the most efficient bank although they have total assets greater than BPD bank in outside Java . BOPO, CAR, and LNSIZE have negatively significant influence on Indonesian BPD bank financial performance. Regional economic indicators, GCREDR has negatively significant influences on financial performance BPD bank but INFR has positively significant influences on financial performance and GPDRBT regional economic indicator does not appear to have significant influence on financial performance in Indonesian BPD bank.
Keywords: BOPO and CAR
1. Introduction In the post-crisis period (after 2002), bank condition began to recover gradually. It can be seen from current performance of national banks began to improve compared with before the crisis period (Bank Indonesia, 2008). Better performance of national banks indicate that banks can recover from crisis performance. Improving financial performance can be done from two sides. One side, it can be done by operating income and other side by operating costs of bank. Efficiency indicator of bank operating expenses is ratio of operating expenses divided by operating income or shortened by BOPO (Endri, 2008). Statistical data on bank performance which is issued by Bank Indonesia in 2011 shows that ROA national banks increase from 2001 to 2011. Although ROA performance has increased, but BOPO performance is not optimal. Indonesian banking efficiency level is lower than banks in other countries. BOPO ratio in Indonesia is always above 84% except for 2004. BOPO ratio in Malaysia, Singapore, and Thailand are under 70% (Bank Indonesia, 2011), BOPO figure in Indonesia is still relatively high.
1 Lecturer of Accounting Departemen Sekolah Tinggi Ilmu Ekonomi (STIE) Indonesia Banking School, Jl. Kemang
Raya No.35, Kemang, Kebayoran Baru, Jakarta Selatan, Indonesia. Candidat Doctor from Doctoral Program of Economic Faculty of Padjajaran University, Email: [email protected] dan [email protected]

Proceedings of Annual Shanghai Business, Economics and Finance Conference
3 - 4 November 2014, Shanghai University of International Business and Economics, Shanghai, China
ISBN: 978-1-922069-63-4
2
Research banking and financial performance which use efficiency frontier method is investigated by Bonin et.all (2003). He measures bank performance by ROA and ROE and bank efficiency by SFA. He find that banks wich have high ROA have positively significant relationship with the level of efficiency. Nigmonov’s (2010) measures bank performance by ratio revenue to the bank assets. Micco, Panizea and Yaless (2005), and Malgahaes (2010) use ROA as a performance of bank
variable. Fiorentino, Karman and Kotter (2006) also use ROA as a standard measurement of bank
performance and relate it with the performance of bank efficiency using DEA and SFA. Mirnawati (2007)
uses financial ratios ROA associated with bank performance using DEA. Alfarizi (2010) measures bank
financial performance by ROE. Most of these studies show significant relationship between bank
efficiency and bank performance.
How to measure the efficiency of bank performance uses traditional efficiency measurement? The study
Sudiatno and Suroso (2010) uses BOPO traditional efficiency measures. BOPO is linked to ROA as an
indicator of bank financial performance. They find that BOPO has negatively significant effect on bank
financial performance. Research Sudiatno and Setyowati (2012), Rusdiana (2012), Sari (2011), and
Amalia (2010) with a different year find the same results.
Bank Indonesia Regulation No. 10/15/PBI/2008 at 24 September 2008 about Liability Provision of Capital
Adequacy of Commercial Banks in article 2, paragraph 1 states "Banks are required to provide a minimum
capital of 8% (eight percent) of risk adjusted-weighted assets ". (http://www.bi.go.id). That provision has
motivate the bank owner to add bank capital with the result that bank can expand the operation and
increase the confidence of depositors.
Sufficient bank capital which could cover asset risk can probably improve bank performance (Rose,
2002). It can increase level of confidence of depositors to entrust their funds even though the interest rate
is lower at third party funds (TPF). In terms of assets, high levels of capital adequacy will provide asset
diversification and expantion opportunities that will improve the ability of bank to make profit or to
increase bank financial performance. (Rose, 2002). Bank capital adequacy can affect the performance of
the bank (Mester, 1996; Pastor et.al, 1997; Carbo et.al, 1999; and Girardone, Molyenux and Gardener,
2003). Capital adequacy research (CAR), also has positive influence on bank performance in Indonesia
(Sudiyatno and Soroso (2010) and Sari (2011)). But Sudiyatno and Setyowati (2012), Amalia (2010) and
Rusdini (2012) find that CAR does not significantly affect bank performance.
Chen (2001) examines the efficiency performance of banks in the United States. He uses macroeconomic
variables GDP as an independent variable to investigate to what extent its influence on bank performance
in that country. He find that macroeconomic conditions affect the performance of small banks, but not in
large banks, because large banks have more diversified portfolios than small banks.
Regional Development Bank (BPD) is a bank which majority owner is local government. Currently a lot
of BPD has been operating in other provinces. For examples West Sumatera BPD, Java BPD, North
Sumatera BPD, West Java and Banten etc. Certainly, expansion of the BPD operational area give impact
to capital adequacy, efficiency and performance of BPD itself. This study,is going to investigate to what
extent the efficiency and capital adequacy influence bank financial performance for periode from 2008
until 2012.
Efficiency is measured by BOPO. Capital adequacy is measured by CAR and financial performance is
measured by ROA. Macro variables such as Gross Domestic Product, inflation regional, regional credit
growth use as control variables. Other control variable is the size of LN of bank total assets.

Proceedings of Annual Shanghai Business, Economics and Finance Conference
3 - 4 November 2014, Shanghai University of International Business and Economics, Shanghai, China
ISBN: 978-1-922069-63-4
3
Basic issues in this study are 1). How is the efficiency level in the Indonesian BPD Bank for the period
2008-2012? 2). To what extent efficiency and capital adequacy influence on financial performance in
Indonesian BPD bank for the period 2008 – 2012? 3). To what extent macroeconomic indicators of
previous year GDP growth, credit growth and inflation influence on financial performance in Indonesian
BPD bank for the period 2008-2012?. 4). To what extent size influences on financial performance in
Indonesian BPD bank for the period 2008-2012?.
The purpose of this study are 1). To investigate the efficiency level in the Indonesian BPD bank for the
period 2008 - 2012 2). To determine to what extent efficiency, adequacy of capital influence on financial
performance in Indonesian BPD bank for the period 2008-2012 3). To determine to what extent
macroeconomic indicators influence on financial performance in Indonesian BPD bank for the period
2008-2012 . And 4). To determine to what extent size influences on financial performance in Indonesian
BPD bank for the period 2008-2012.
The results of this study are expected to be useful: 1). For academics, the results of this study as the one of
empirical evidence that can be used in developing specialized knowledge about efficiency, capital
adequacy, bank size, macro indicators GDP, credit growth and inflation and its influence on financial
performance in Indonesian BPD bank. 2). For the Financial Services Authority (OJK), the results can be
used as a basis for evaluation and making policies about efficiency and capital adequacy requirements and
operational control in Indonesian BPD bank. 3). For existing practitioners in the BPD, it can be used as a
basis for estimating bank financial performance.
2. Literatur Review
Banking Performance
Performance of financial institutions must be evaluated by separating each unit of production and use
better standard perform (Berger and Humphrey, 1997). This is done by applying a non-parametric frontier
analysis or parametric frontier analysis in the financial industry.
Banking performance assessment indicators in Indonesia based on the ratios of Capital Adequacy Ratio,
Gross Non-Performing Loans, Return on Assets, Net Interest Margin, ROA, and Loan Deposit Ratio
(Bank Indonesia Annual Report, 2011).
Bank financial performance in this study uses return on assets (ROA) variable. ROA describes yield that
can be given to the corporate funders (Subramanyan, 2010). Another ratio is Return On Equity (ROE).
ROE is not used in this study. ROE describes yield from the shareholder perspective.
This study investigates the relationship between bank efficiency and bank financial performance. The
results of previous studies show the strong relationship between financial performance and efficiency
ratio (Mirnawati, 2007).
Banking efficiency
Bank efficiency is measured by the difference between costs incurred and minimum cost that should be
issued by bank to produce the same output (Mardanugraha, 2005). Assessment of bank efficiency is also
measured by the cost incurred at bank compared with the cost incurred based on bank best practice. Bank
efficiency means the ratio between the cost of the minimum produce a specific output and the actual costs
incurred bank (Hartono, 2009). Minimum cost is obtained from the estimated minimum cost of banking

Proceedings of Annual Shanghai Business, Economics and Finance Conference
3 - 4 November 2014, Shanghai University of International Business and Economics, Shanghai, China
ISBN: 978-1-922069-63-4
4
functions. Bank efficiency can be divided into two (Farel, 1957 in Fiorentino, Karman and Kotter, 2006),
namely technical efficiency and allocative efficiency.
There are two approaches to measure bank efficiency (Hartono, 2009): 1). Traditional Approach, using the
Ratio Index Number or BOPO. 2). Frontier Approach, based optimal company behavior in order to
maximize output or minimize costs, as a way to achieve economic unit’s goal.
Frontier approach provides two approaches: 1). Deterministic Approach: often classified as a Non-
Parametric Approach, this approach uses Technical Mathematic Programming, or popular known as Data
Envelopment Analysis (DEA). 2). Stochastic Approach: This approach is classified as a parametric
approach, using Econometric Frontier. This study uses traditional approach to measure efficiency.
Efficiency is measured by BOPO.
Bank Efficiency and Financial Performance
The relationship of financial performance and efficiency can be explained from the formulation ROA
(Subramanyam, 2010; White, Sondhi and Fried, 2003; Robinson, Munter & Grant, 2004 and Fraser &
Ormiston, 2007):
………………….... (1)
Formulation ROA can be decomposed as follows:
………………….. (2)
The more efficient company operation and higher utilization of the company asset, the higher company
ability to provide returns to the funder. Thus there is relationship between operating efficiency and asset
utilization (using financial ratios NPM and Turn Over Assets) with ROA and ROE (Subramanyam, 2010).
The variables ROA, ROE, NPM and turn over assets are financial ratios that are used to measure
corporate financial performance.
ROA formula (2) further elaborate to illustrate the performance of bank entity, it can be decomposed as
follows:
…………...… (3)
…… (4)
Where ROA is bank return on assets, NII is bank net interest income, PO is operating income, BO is
operating expense and PNO is non-operating income. BOH is bank overhead expense and tax is a tax.
Formula 4 is inserted into equation 3, then can be as follows:
…………....(5)
Suppose the impact of changes in the level of bank efficiency (EFF) on and are symbolized by
and , then
; and

Proceedings of Annual Shanghai Business, Economics and Finance Conference
3 - 4 November 2014, Shanghai University of International Business and Economics, Shanghai, China
ISBN: 978-1-922069-63-4
5
Assume that , mean that an increase in the level of bank efficiency will increase bank operating income
and bank non-operating income. The more efficient bank, the more operating income because bank is able to
reduce operating costs with the result that operating income increase. It’s because the bank can sell fund is lower
than the other bank. Thus, the value of PO after a change in the level of bank efficiency is ( ), and the value
of PNO after a change in the level of bank efficiency is ( ).
The impact of a change in the level of bank efficiency (EFF) of the BO, BNO, BOH and Tax can be expressed as
follows:
;
;
; and
Assumed value mean an increase in the bank efficiency will make bank charges decrease.
Thus, the value of BO, BNO, BOH and Tax after change in efficiency are equal to ( ), ( ), ( )
and ( ).
Increasing efficiency impacts on increasing bank revenue, decreasing expense and will impact on
increasing the value of bank assets. Thus, bank efficiency impacts on increasing bank asset positively.
The impact of change in bank efficiency level on total assets can be expressed as follows:
The value of bank assets after change of bank efficiency will form equal to (1 + ). This means that the higher
the level of efficiency of the bank changes, the higher total value of its assets.
The impact of change efficiency on ROA can be expressed by including the impact of change in the efficiency of
each component to the equation 5, with result that it becomes as follows:
………………..…… (6)
Suppose assume , then the impact on ROA efficiency can be obtained
as follows
(( ) ( ) ) (( ) ( ) ) ( ) ( )
( )
( )
…....….……… (7)
then,
(( ) ( ) )
….…. (8)
so:
[
( )
]
…………… (9)
When EFF level increase cause , then increase the EFF will cause ROA decrease. However,
when increase in EFF cause , then EFF will causes ROA increase. Thus the efficiency impact on
ROA could be positive and negative, it depends on the extent of the impact of efficiency change to
Proceedings of Annual Shanghai Business, Economics and Finance Conference
3 - 4 November 2014, Shanghai University of International Business and Economics, Shanghai, China
ISBN: 978-1-922069-63-4
6
change in revenue and expense components. When the impact of this change is under one, then increases
efficiency causes ROA decrease, but when this change above one, then increases in EFF will causes ROA
increase. It is assumed that that every 1% increase in efficiency levels cause rising income and
expense components fell more than 1%. Thus, the efficiency level of relationship with ROA is positive.
Bank financial performance research that use financial ratios and efficiency by frontier method is
investigated by Bonin, Hasa, and Wachtel (2003). Bonin et.all use bank performance ratio by ROA and
ROE and relate it to the bank efficiency using SFA. The results are banks with high ROA have positively
significant relationship with the efficiency level using SFA. Nigmonov research (2010) uses performance
indicator ratio revenue to the bank assets. Micco, Panizea and Valess (2001) and Malgahaes et.all (2010)
use ROA as a bank performance variable. Mirnawati (2007) uses ROA ratio associate with bank
performance using DEA. Alfarizi (2010) use the bank financial performance by ROE to see the
connection with the bank efficiency in Indonesia. Sudiatno and Suroso (2010), Sudiatno and Setyowati
(2012), Rusdini (2012) and Amalia (2010) use ROA variable as an indicator of the bank financial
performance associate with traditional efficiency BOPO. The results are BOPO have negatively
significant influence on the bank financial performance (ROA ). Research Fiorentino, Karman and Kotter
(2006) also use a variable ROA as a standard measurement of bank performance and link it with the
performance of bank efficiency using DEA and SFA. According to these studies indicate that there is
relationship between ROA and efficiency which use either the traditional method or the frontier, but few
studies indicate no connection between ROA and efficiency.
Capital Adequacy and Bank Financial Performance
Bank capital requirements in the Basel Accord 1 in 1988, have increased bank capital in Europe
(Fiordelisi et al, 2010). Capital requirement issued by the Bank of International Setlement (BIS) is also
adopt by Bank Indonesia in regulating bank capital in Indonesia. The amount of bank capital required at
least 8% of total risk adjusted weighted assets.
Bank Indonesia Regulation No. 10/15 / PBI / 2008 at 24 September 2008 on Liability Provision of Capital
Adequacy of Commercial Banks, states that "Banks are required to provide a minimum capital of 8%
(eight percent) of risk-weighted assets (RWA)". Further, the Bank is required to provide a core capital of
at least 5% (five percent) of the RWA, both individually and on a consolidated basis with its subsidiaries
"(http://www.bi.go.id).
Increasing bank capital adequacy will improve bank performance. This is due to increasing in the level of
confidence of depositors to entrust their funds even though the interest rate is lower in third party funds. In
terms of assets, high levels of capital adequacy will provide an opportunity for bank to diversify its asset
and to do expantion in order to improve the ability of bank profitability (Rose, 2002).
Bownmen Berger (2009) investigate the level of bank capital for small, medium and large banks. He finds
that small banks can survive in the current market crisis and the banking crisis that occurred in the world
especially in the United States. The level of capital in medium and large banks can only survive when the
banking crisis occurs. It indicate that there is relationship between bank capital and bank performance.
The results of the research in Indonesia by Sudiyatno and Soroso (2010) show that the capital adequacy
has a positively significant relationship to the bank performance. While the opposite results are conducted
by Sudiyatno and Setyowati (2012), Rusdini (2012) and Amalia (2010) show that CAR do not
significantly affect the bank performance.

Proceedings of Annual Shanghai Business, Economics and Finance Conference
3 - 4 November 2014, Shanghai University of International Business and Economics, Shanghai, China
ISBN: 978-1-922069-63-4
7
Size and Financial Performance Bank
In this study the size of the bank is measured by the bank total assets. In equation
has shown that total assets negatively relate to ROA or the company
performance. It’s assume that NIAT and sales unchanged when asset increase (Subramanyan, 2010). But
in reality increasing in the value of assets is often followed by increasing NIAT and sales and thus
increasing the total asset can increase ROA.
Macro Economic Indicators and Financial Performance Bank
Chen (2001) investigate the relationship between bank performance and macroeconomic in the United
States. Macro variables that he use are changes in GDP, changes in unemployment rates, changes in key
economic indicators (M2 money supply) and the difference between the interest rate treasury bonds with a
term of 10 years and the interest rate the central bank. Findings show the majority of economic indicators
have influence on the bank performance.
Study conduct by Beck and Hesse (2006) about the bank performance in Uganda in 1999-2005 uses
independent variables of macroeconomic as GDP growth, real T-Bill rate, inflation and exchange rate.
Bank performance uses indicators of changes in spreads and bank margins. Changes in macroeconomic
conditions have a low explanatory power in explaining the changes in spreads and margins and not
significant.
Macroeconomic indicators of GDP may affect bank performance. Ianotta et.all (2006) find that GDP
significantly positive affects the bank performance in 15 European countries. Banking performance is
influenced by GDP, bank profits and bank earnings. The higher the GDP of a country, the higher the
performance of banks in that country. According to Ross (2005), Current year GDP impact on bank
performance in the following year.
Inflation affects interest rates. In the nominal interest rate on bank loans include inflation (Rose, 2002).
The higher inflation rate the lower bank financial performance, this is caused by the increase in operating
expenses and the cost of funds of banks. However, when increasing inflation can increase credit income is
greater than the increase in interest expense and bank operations, the impact of increasing inflation is
positive on bank performance. Theory Philiips (Mankiw et.all, 2013) describes the increase in inflation
within certain limits can reduce unployment, so that economic growth will increase and than performance
of the company will increase too. Both the theory presented by Rose and Philip contradictory because a
different perspective.
Credit growth will improve bank performance (Ross, 2002). Bank credit growth will increase bank
interest income when the loan growth is not accompanied by a significant increase in bad debts. Thus the
impact of credit growth on bank performance can be positive or negative.
Based on the study of theory, hypothesis propose in this research problems are 1). Ha1: Bank efficiency
is estimated influence BPD bank financial performance. 2). Ha2: Capital adequacy is estimated influence
BPD bank financial performance. 3). Ha3: Size is estimated influence BPD bank financial performance.
4) Ha4: The growth of regional domestic product in one year is estimated influence BPD bank financial
performance in the following year. 5). HA5: Regional Banking Loan Growth is estimated influence BPD
bank financial performance. 6). HA6: Regional Inflation is estimated influence BPD bank financial
performance
Proceedings of Annual Shanghai Business, Economics and Finance Conference
3 - 4 November 2014, Shanghai University of International Business and Economics, Shanghai, China
ISBN: 978-1-922069-63-4
8
3. Research Metodology
This study is conducted to obtain data and information about bank efficiency, capital adequacy, bank size
and PSDRB macroeconomic variables, inflation, and the growth of credit on financial performance in
Indonesian Regional Development (BPD) Bank. Data collection technique uses secondary data and
financial statements Indonesian BPD Bank reports. In this study, Dependent variable is bank performance
(ROA) and independent variables are bank efficiency (BOPO) and capital adequacy ratio (CAR). Control
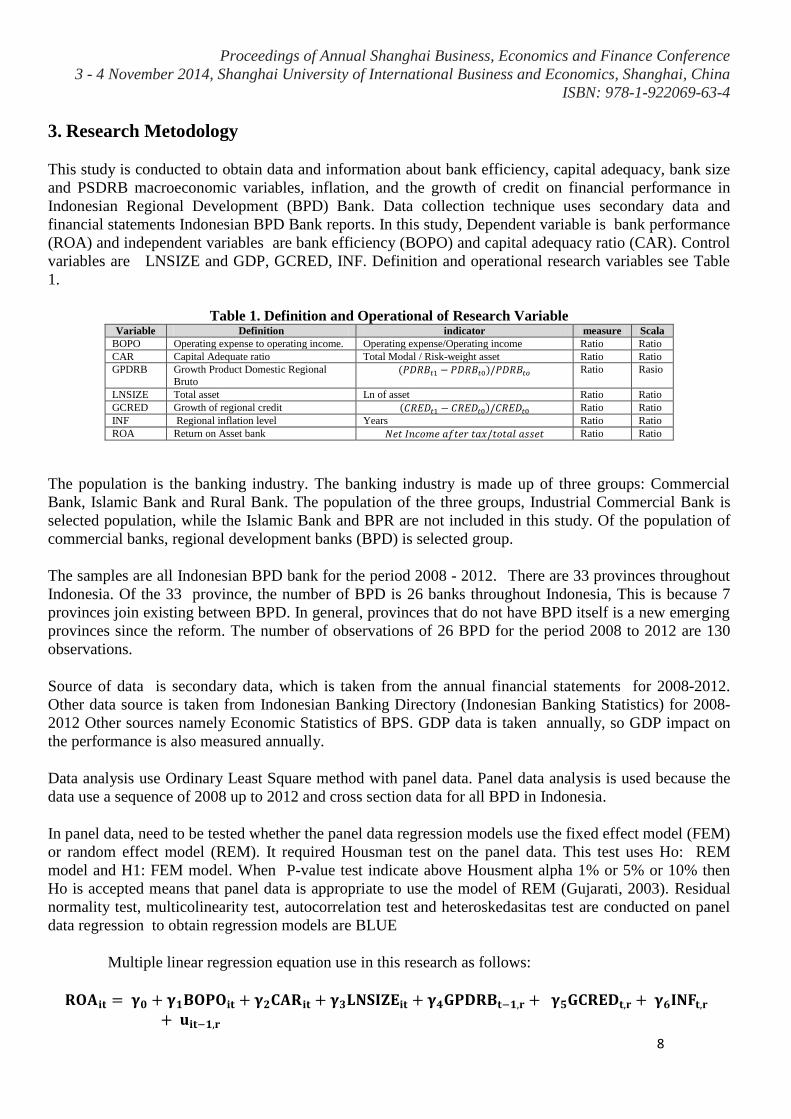
variables are LNSIZE and GDP, GCRED, INF. Definition and operational research variables see Table
1.
Table 1. Definition and Operational of Research Variable Variable Definition indicator measure Scala
BOPO Operating expense to operating income. Operating expense/Operating income Ratio Ratio
CAR Capital Adequate ratio Total Modal / Risk-weight asset Ratio Ratio
GPDRB Growth Product Domestic Regional
Bruto Ratio Rasio
LNSIZE Total asset Ln of asset Ratio Ratio
GCRED Growth of regional credit Ratio Ratio
INF Regional inflation level Years Ratio Ratio
ROA Return on Asset bank Ratio Ratio
The population is the banking industry. The banking industry is made up of three groups: Commercial
Bank, Islamic Bank and Rural Bank. The population of the three groups, Industrial Commercial Bank is
selected population, while the Islamic Bank and BPR are not included in this study. Of the population of
commercial banks, regional development banks (BPD) is selected group.
The samples are all Indonesian BPD bank for the period 2008 - 2012. There are 33 provinces throughout
Indonesia. Of the 33 province, the number of BPD is 26 banks throughout Indonesia, This is because 7
provinces join existing between BPD. In general, provinces that do not have BPD itself is a new emerging
provinces since the reform. The number of observations of 26 BPD for the period 2008 to 2012 are 130
observations.
Source of data is secondary data, which is taken from the annual financial statements for 2008-2012.
Other data source is taken from Indonesian Banking Directory (Indonesian Banking Statistics) for 2008-
2012 Other sources namely Economic Statistics of BPS. GDP data is taken annually, so GDP impact on
the performance is also measured annually.
Data analysis use Ordinary Least Square method with panel data. Panel data analysis is used because the
data use a sequence of 2008 up to 2012 and cross section data for all BPD in Indonesia.
In panel data, need to be tested whether the panel data regression models use the fixed effect model (FEM)
or random effect model (REM). It required Housman test on the panel data. This test uses Ho: REM
model and H1: FEM model. When P-value test indicate above Housment alpha 1% or 5% or 10% then
Ho is accepted means that panel data is appropriate to use the model of REM (Gujarati, 2003). Residual
normality test, multicolinearity test, autocorrelation test and heteroskedasitas test are conducted on panel
data regression to obtain regression models are BLUE
Multiple linear regression equation use in this research as follows:
Proceedings of Annual Shanghai Business, Economics and Finance Conference
3 - 4 November 2014, Shanghai University of International Business and Economics, Shanghai, China
ISBN: 978-1-922069-63-4
9
4. Empirical Results
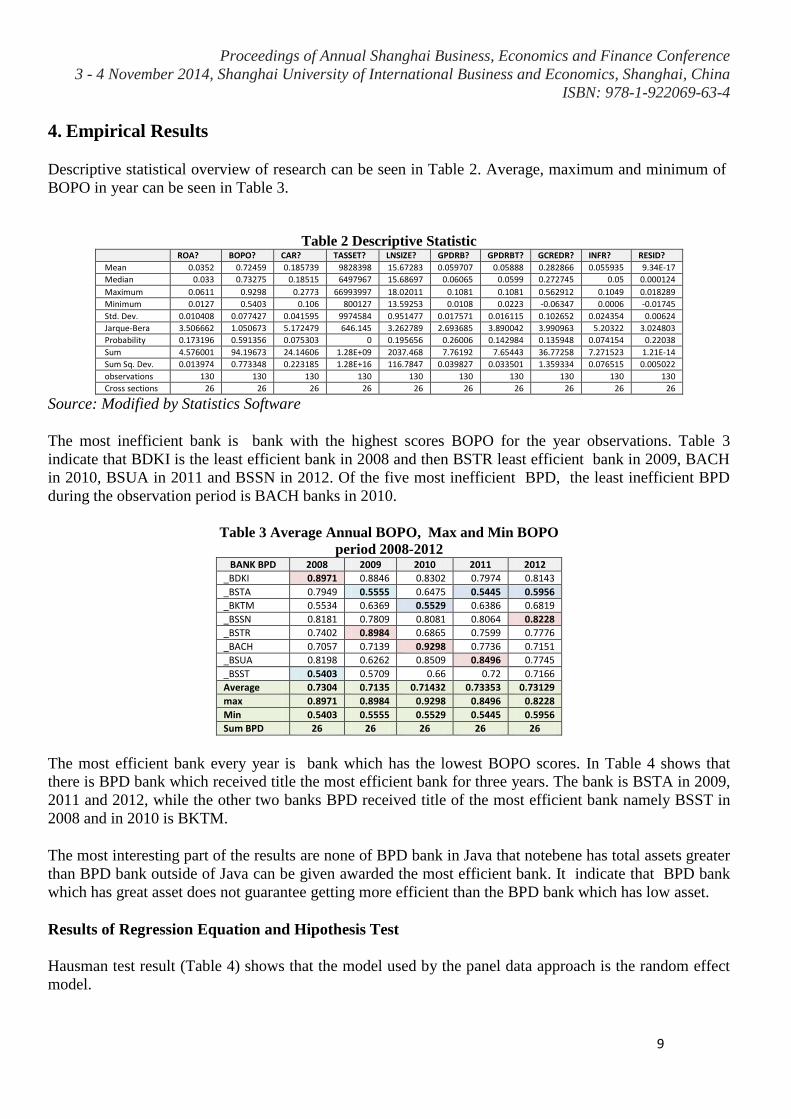
Descriptive statistical overview of research can be seen in Table 2. Average, maximum and minimum of
BOPO in year can be seen in Table 3.
Table 2 Descriptive Statistic
ROA? BOPO? CAR? TASSET? LNSIZE? GPDRB? GPDRBT? GCREDR? INFR? RESID?
Mean 0.0352 0.72459 0.185739 9828398 15.67283 0.059707 0.05888 0.282866 0.055935 9.34E-17
Median 0.033 0.73275 0.18515 6497967 15.68697 0.06065 0.0599 0.272745 0.05 0.000124
Maximum 0.0611 0.9298 0.2773 66993997 18.02011 0.1081 0.1081 0.562912 0.1049 0.018289
Minimum 0.0127 0.5403 0.106 800127 13.59253 0.0108 0.0223 -0.06347 0.0006 -0.01745
Std. Dev. 0.010408 0.077427 0.041595 9974584 0.951477 0.017571 0.016115 0.102652 0.024354 0.00624
Jarque-Bera 3.506662 1.050673 5.172479 646.145 3.262789 2.693685 3.890042 3.990963 5.20322 3.024803
Probability 0.173196 0.591356 0.075303 0 0.195656 0.26006 0.142984 0.135948 0.074154 0.22038
Sum 4.576001 94.19673 24.14606 1.28E+09 2037.468 7.76192 7.65443 36.77258 7.271523 1.21E-14
Sum Sq. Dev. 0.013974 0.773348 0.223185 1.28E+16 116.7847 0.039827 0.033501 1.359334 0.076515 0.005022
observations 130 130 130 130 130 130 130 130 130 130
Cross sections 26 26 26 26 26 26 26 26 26 26
Source: Modified by Statistics Software
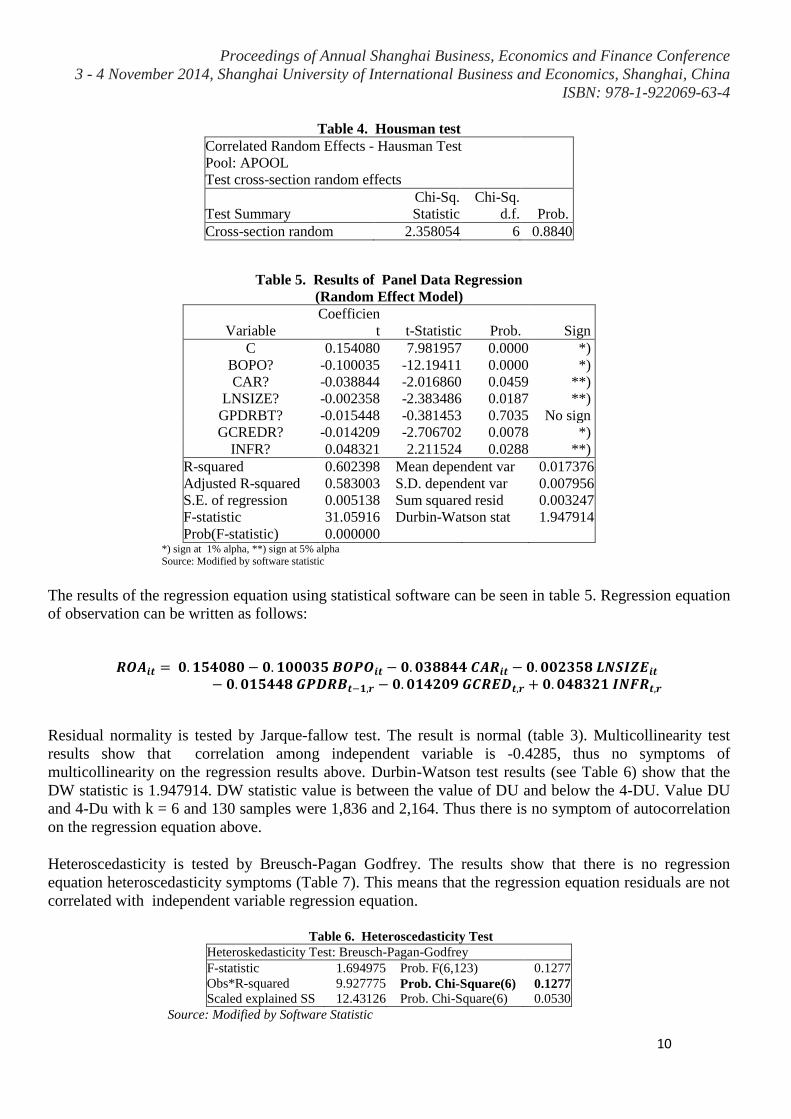
The most inefficient bank is bank with the highest scores BOPO for the year observations. Table 3
indicate that BDKI is the least efficient bank in 2008 and then BSTR least efficient bank in 2009, BACH
in 2010, BSUA in 2011 and BSSN in 2012. Of the five most inefficient BPD, the least inefficient BPD
during the observation period is BACH banks in 2010.
Table 3 Average Annual BOPO, Max and Min BOPO
period 2008-2012 BANK BPD 2008 2009 2010 2011 2012
_BDKI 0.8971 0.8846 0.8302 0.7974 0.8143
_BSTA 0.7949 0.5555 0.6475 0.5445 0.5956
_BKTM 0.5534 0.6369 0.5529 0.6386 0.6819
_BSSN 0.8181 0.7809 0.8081 0.8064 0.8228
_BSTR 0.7402 0.8984 0.6865 0.7599 0.7776
_BACH 0.7057 0.7139 0.9298 0.7736 0.7151
_BSUA 0.8198 0.6262 0.8509 0.8496 0.7745
_BSST 0.5403 0.5709 0.66 0.72 0.7166
Average 0.7304 0.7135 0.71432 0.73353 0.73129
max 0.8971 0.8984 0.9298 0.8496 0.8228
Min 0.5403 0.5555 0.5529 0.5445 0.5956
Sum BPD 26 26 26 26 26
The most efficient bank every year is bank which has the lowest BOPO scores. In Table 4 shows that
there is BPD bank which received title the most efficient bank for three years. The bank is BSTA in 2009,
2011 and 2012, while the other two banks BPD received title of the most efficient bank namely BSST in
2008 and in 2010 is BKTM.
The most interesting part of the results are none of BPD bank in Java that notebene has total assets greater
than BPD bank outside of Java can be given awarded the most efficient bank. It indicate that BPD bank
which has great asset does not guarantee getting more efficient than the BPD bank which has low asset.
Results of Regression Equation and Hipothesis Test
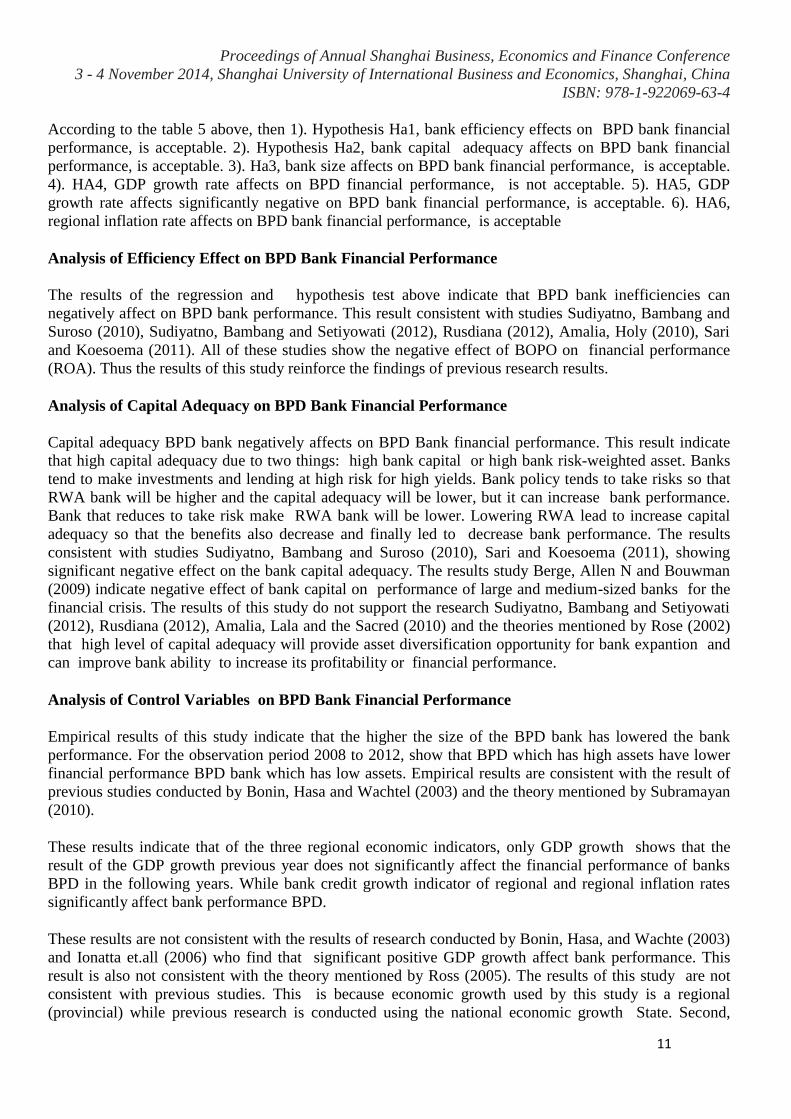
Hausman test result (Table 4) shows that the model used by the panel data approach is the random effect
model.
Proceedings of Annual Shanghai Business, Economics and Finance Conference
3 - 4 November 2014, Shanghai University of International Business and Economics, Shanghai, China
ISBN: 978-1-922069-63-4
10
Table 4. Housman test
Correlated Random Effects - Hausman Test
Pool: APOOL
Test cross-section random effects
Test Summary
Chi-Sq.
Statistic
Chi-Sq.
d.f. Prob.
Cross-section random 2.358054 6 0.8840
Table 5. Results of Panel Data Regression
(Random Effect Model)
Variable
Coefficien
t t-Statistic Prob. Sign
C 0.154080 7.981957 0.0000 *)
BOPO? -0.100035 -12.19411 0.0000 *)
CAR? -0.038844 -2.016860 0.0459 **)
LNSIZE? -0.002358 -2.383486 0.0187 **)
GPDRBT? -0.015448 -0.381453 0.7035 No sign
GCREDR? -0.014209 -2.706702 0.0078 *)
INFR? 0.048321 2.211524 0.0288 **)
R-squared 0.602398 Mean dependent var 0.017376
Adjusted R-squared 0.583003 S.D. dependent var 0.007956
S.E. of regression 0.005138 Sum squared resid 0.003247
F-statistic 31.05916 Durbin-Watson stat 1.947914
Prob(F-statistic) 0.000000 *) sign at 1% alpha, **) sign at 5% alpha
Source: Modified by software statistic
The results of the regression equation using statistical software can be seen in table 5. Regression equation
of observation can be written as follows:
Residual normality is tested by Jarque-fallow test. The result is normal (table 3). Multicollinearity test
results show that correlation among independent variable is -0.4285, thus no symptoms of
multicollinearity on the regression results above. Durbin-Watson test results (see Table 6) show that the
DW statistic is 1.947914. DW statistic value is between the value of DU and below the 4-DU. Value DU
and 4-Du with k = 6 and 130 samples were 1,836 and 2,164. Thus there is no symptom of autocorrelation
on the regression equation above.
Heteroscedasticity is tested by Breusch-Pagan Godfrey. The results show that there is no regression
equation heteroscedasticity symptoms (Table 7). This means that the regression equation residuals are not
correlated with independent variable regression equation.
Table 6. Heteroscedasticity Test
Heteroskedasticity Test: Breusch-Pagan-Godfrey
F-statistic 1.694975 Prob. F(6,123) 0.1277
Obs*R-squared 9.927775 Prob. Chi-Square(6) 0.1277
Scaled explained SS 12.43126 Prob. Chi-Square(6) 0.0530
Source: Modified by Software Statistic
Proceedings of Annual Shanghai Business, Economics and Finance Conference
3 - 4 November 2014, Shanghai University of International Business and Economics, Shanghai, China
ISBN: 978-1-922069-63-4
11
According to the table 5 above, then 1). Hypothesis Ha1, bank efficiency effects on BPD bank financial
performance, is acceptable. 2). Hypothesis Ha2, bank capital adequacy affects on BPD bank financial
performance, is acceptable. 3). Ha3, bank size affects on BPD bank financial performance, is acceptable.
4). HA4, GDP growth rate affects on BPD financial performance, is not acceptable. 5). HA5, GDP
growth rate affects significantly negative on BPD bank financial performance, is acceptable. 6). HA6,
regional inflation rate affects on BPD bank financial performance, is acceptable
Analysis of Efficiency Effect on BPD Bank Financial Performance
The results of the regression and hypothesis test above indicate that BPD bank inefficiencies can
negatively affect on BPD bank performance. This result consistent with studies Sudiyatno, Bambang and
Suroso (2010), Sudiyatno, Bambang and Setiyowati (2012), Rusdiana (2012), Amalia, Holy (2010), Sari
and Koesoema (2011). All of these studies show the negative effect of BOPO on financial performance
(ROA). Thus the results of this study reinforce the findings of previous research results.
Analysis of Capital Adequacy on BPD Bank Financial Performance
Capital adequacy BPD bank negatively affects on BPD Bank financial performance. This result indicate
that high capital adequacy due to two things: high bank capital or high bank risk-weighted asset. Banks
tend to make investments and lending at high risk for high yields. Bank policy tends to take risks so that
RWA bank will be higher and the capital adequacy will be lower, but it can increase bank performance.
Bank that reduces to take risk make RWA bank will be lower. Lowering RWA lead to increase capital
adequacy so that the benefits also decrease and finally led to decrease bank performance. The results
consistent with studies Sudiyatno, Bambang and Suroso (2010), Sari and Koesoema (2011), showing
significant negative effect on the bank capital adequacy. The results study Berge, Allen N and Bouwman
(2009) indicate negative effect of bank capital on performance of large and medium-sized banks for the
financial crisis. The results of this study do not support the research Sudiyatno, Bambang and Setiyowati
(2012), Rusdiana (2012), Amalia, Lala and the Sacred (2010) and the theories mentioned by Rose (2002)
that high level of capital adequacy will provide asset diversification opportunity for bank expantion and
can improve bank ability to increase its profitability or financial performance.
Analysis of Control Variables on BPD Bank Financial Performance
Empirical results of this study indicate that the higher the size of the BPD bank has lowered the bank
performance. For the observation period 2008 to 2012, show that BPD which has high assets have lower
financial performance BPD bank which has low assets. Empirical results are consistent with the result of
previous studies conducted by Bonin, Hasa and Wachtel (2003) and the theory mentioned by Subramayan
(2010).
These results indicate that of the three regional economic indicators, only GDP growth shows that the
result of the GDP growth previous year does not significantly affect the financial performance of banks
BPD in the following years. While bank credit growth indicator of regional and regional inflation rates
significantly affect bank performance BPD.
These results are not consistent with the results of research conducted by Bonin, Hasa, and Wachte (2003)
and Ionatta et.all (2006) who find that significant positive GDP growth affect bank performance. This
result is also not consistent with the theory mentioned by Ross (2005). The results of this study are not
consistent with previous studies. This is because economic growth used by this study is a regional
(provincial) while previous research is conducted using the national economic growth State. Second,

Proceedings of Annual Shanghai Business, Economics and Finance Conference
3 - 4 November 2014, Shanghai University of International Business and Economics, Shanghai, China
ISBN: 978-1-922069-63-4
12
BPD in their regional lending and absorption of public funds are still inferior compare with national banks
that have higher assets and wider branch network. Third, the quality of human resources BPD bank is
expected lower than quality of human resources of national banks. Fourth, The level of efficiency of
national banks which have branches in every province alleg higher than the BPD. With this condition, the
increase in economic growth in the province can not affect the BPD Bank performance because they are
not able to compete with national banks. BPD rely more on lending to local corporations mainly owned by
the local government. The source of funds BPD bank depend on pocket-project PAD and local
government projects.
Regional credit growth (all banks in the local area) significantly negative affects on BPD Bank financial
performance. These result is not congruence with the theory expressed by Rose (2005) who states that the
increase in credit growth can improve the company financial performance.
From the observational data shows that the average growth rate of the 2008 regional credit tends to
increase up to 2012. The increase in credit growth can not improve BPD bank performance. This is
because, first, the market share of the credit in the province allegedly has not been controlled by local
banks but it is controlled by large national banks that have branches in that area. Second, BPD allegedly
can not use the moment to improve the performance associate with an increase in credit growth. Third,
Increasing in BPD bank credit growth each year for the observation period allegedly unsupported by
infrastructure and human resource readiness.
These results indicate that the rate of inflation can significantly improve BPD bank performance. These
results are consistent with the theory mentioned by Rose (2005) that the nominal interest rate on bank
loans already includes inflation. The higher the inflation, the higher the interest rate. Increasing interest
rates can increase operating income assuming bank can increase its efficiency levels. The higher the
inflation rate, the bank financial performance will be lower or higher. The increase in the inflation rate can
be negative or positive impact on the bank financial performance.
Managerial Implications of Research Results
The level of inefficiency BPD, capital adequacy, bank size, and negatively affect the credit growth
significantly on BPD bank performance. These results have implications to BPD bank manager in
making the program to improve the bank financial performance. First, bank managers must make
efficiency improvements in order to increase the bank performance. Second, bank managers must make
arrangements at least 5% of capital adequacy in accordance with the provisions of the banking authorities.
Total capital adequacy well above provisions will give implications for declining in BPD bank financial
performance. Third, Increasing BPD bank size must be accompanied by increasing in the bank
operational efficiency and increasing bank volume operations. Thus increasing in BPD bank size does not
cause decreasing in bank performance. Fourth, bank managers must make improving the quality of its
human resources in the management of credit so that the moment of growth of bank credit in the province
can be utilized to increase BPD bank credit. Implications relating to management of credit growth are
necessary to make the increasing BPD bank credit management efficiency program, and increasing
lending to the public and private companies to promote economic growth and BPD bank performance.
Managerial implications in connection with the positive effect of inflation on the BPD bank performance
are in the event of rising inflation in that region, BPD bank should increase its credit expantion programs.

Proceedings of Annual Shanghai Business, Economics and Finance Conference
3 - 4 November 2014, Shanghai University of International Business and Economics, Shanghai, China
ISBN: 978-1-922069-63-4
13
5. Conclusions
Average inefficiency Indonesian BPD bank for five-year observation period is 72.45%. BACH is the least
efficient bank and BSST is the most of efficient bank. The most inefficient BPD bank for the years 2008,
2009, 2010, 2011 and 2012 respectively are BDKI, BSTR, BACH, BSUA and BSSN. While the most
efficient BPD bank for 2008, 2009, 2010, 2011, and 2012 respectively are BSST, BSTA, BKTM, BSTA
and BSTA.
The level of inefficiency BPD bank, bank capital adequacy, bank size and regional credit growth have a
negative effect on BPD bank financial performance. GDP growth has no significant effect on financial
performance BPD bank. Regional inflation rate has positive influence on Indonesian BPD bank financial
performance.
Limitations of this study are 1). Not examine the influential factors that explain why the growth of
regional GDP and credit growth do not influence Indonesian BPD bank performance 2). Use traditional
approach to measure efficiency BPD bank.
Suggestions this study are 1). To improve BPD bank performance, BPD bank managers have to make the
program for strenghtening financial performance through increasing bank efficiency, managing capital
adequacy, increasing bank assets must be accompanied by increasing in operational efficiency, increasing
operational volume, improving the quality of human resources in managing bank credit. 2). For
subsequent researchers need to consider using frontier approach. Using this approach, the level of bank
efficiency can be compared with the best practice bank, so the bank can be assessed with good efficiency
rating. 3). For subsequent researchers need to examine factors trigger the negative impact of credit growth
on BPD bank financial performance. The factors are quality of human resources, credit monitoring
system, diversification of credit and other factors that trigger a strong relationship between credit growth
and good financial performance. 4). For subsequent studies suggested to conduct research about trigger
factors that causal GDP growth does not significantly affect on bank performance in Indonesian BPD
bank. The factors are the quality of human resources, diversification of credit, the ability to compete with
other banks, and another potential factors. 5). For institutions banking authorities, it is advisable to do a
strengthening efficiency BPD bank in order to improve BPD bank financial performance that contribute
to the banking financial system. Provide reinforcement requirements to bank officials competencies
particularly to officers lenders and credit monitoring.
References
Alfarisi, Ade Salman, 2008, “Analysis terhdapap Laba, Profit efficiency, dan Agency Cost Hypothesis
pada bank Syariah dan Bank Umum di Indonesia”, Dissertation S3 Doctoral Program in Economics
with a specialization in Business Management, Graduate University of Padjadjaran, Bandung.
Amalia, laila Suci (2010), “Pengaruh CAR, NPL, NIM, BOPO, LDR dan PPAP terhadap Kinerja
Rentabilitas Bank (Studi Kasus pada Bank Devisa dan Bank Non devisa tahun 2004-2008)”,,
Bachelor's Thesis, Faculty of Economics, University of Diponegoro.
Bank Indonesia, 2008, Data Perbankan Indonesia Tahun 2008, Januari 2008, Jakarta: Bank Indonesia - Data Bank Indonesia Year 2008, January 2008, Jakarta: Bank
Indonesia - Directorate of Licensing and Banking Information.
Proceedings of Annual Shanghai Business, Economics and Finance Conference
3 - 4 November 2014, Shanghai University of International Business and Economics, Shanghai, China
ISBN: 978-1-922069-63-4
14
------------------- ,2011, “Statistik Perbankan Indonesia - Bulanan”, Vol.10 No.54, April 2011, Jakarta:
Bank Indonesia.
-------------------,2008, Peraturan Bank Indonesia No.10/15/PBI/2008 tanggal 24 September 2008 tentang
Kewajiban Penyedian Modal Minimum Bank Umum, http://www.bi.go.id/NR/rdonlyres/529755C4-F8CE-425A-8A31-11C234C18C6E/14792/pbi_101508revs.pdf
Beck, Thorsten and Heiko Hesse, 2006, “Bank Efficiency, Ownership and Market Structure-why are
interest spreads so high in Uganda”, World bank policy research working paper 4027, Oktober 2006.
http://econ.worldbank.org
Berger, Allen N. and Christa H.S. Bouwman, (2009), “Bank Capital, Survival, and Performance around
Financial Crises” Wharton Financial Institutions Center, and Case Western Reserve University,
University of South Carolina, Wharton Financial Institutions Center, and CentER – Tilburg
University MIT Sloan School of Management (visiting),
Berger, Allan N and David B. Humphrey, 1997, “Efficiency of Financial Institutions: International Survey
and Directions for Future Research” Forthcoming in European Journal of Operational Research,
Januari 1997. The Warthon School, University of Pennsylvania.
Bonin, Jhon P., Iftekhar and Paul Wachtel, 2003, “Bank Performance, Efficiency, and ownership in
transition countries”, paper presented in The Ninth Dubrovnik Economic Confrence The 9 DEC
"Banking and The financial Sector in transition and Emerging Market Economic" , organized by The
Croatian Natioanal Bank, in Dubrovnik, 26-28 Juni 2003.
Carbo, S., E.P.M, gardener and J Wiiliam (1999), “Efficiency and Technical Change in the Eroupean
Association of University Teacher of Banking and Finance”, Lisbon, 2-3 September 1999.
Chen, Yi-Kai., 2001, “Three Essay on Bank Efficiency”, A Thesis Submitted as Doctor of Philosophy to
the Faculty Of Drexel University
Endri, 2008, “Efisiensi Teknis Perbankan Syariah di Indonesia”, Finance and Banking Journal, Vol.10
No.2 Desember 2008, hal.123-140.
Fiordelisi , Franco,, David Marques-Ibanez and Phil Molyneux, 2010, “Efficiency and risk in European
Banking”, Working Paper Series No. 1211 / JUNE 2010. European Central Bank.
Fraser, Lyn M., and Aileen Ormiston, 2007, Understanding Financial Statements, Eight Edition, New
Jersey: Pearson-Prentice Hall.
Fiorentino, Elizabets, Alexander Karmann, and Micahel Koetter, 2006, “The cost efficiency of German
Banks: a Comparison of SFA and DEA”, Deutsche Bundesbank Euro System- Discussion paper Serie
2: banking and Financial Studies No.10/2006..
Girardone, Molyenux and gardener 2003???
Gujarati, Damodar N. , 2003, Basic econometric, Fourth Edition, New York: McGraw-Hill.
Proceedings of Annual Shanghai Business, Economics and Finance Conference
3 - 4 November 2014, Shanghai University of International Business and Economics, Shanghai, China
ISBN: 978-1-922069-63-4
15
Hartono, Edy, 2009, “Analisis Efisiensi Biaya Industri Perbankan Indonesia dengan menggunakan Metode
Parametrik Stochastik Frontier Analysisi- Studi pada Perbankan yang terdaftar di Bursa Efek
Indonesia” Tesis S-2 Magister Manajemen Pascasarjana, Fakultas Ekonomi Universitas Airlangga.
Ianotta, Giuliano, Giacomo Nocera and Andrea Sironi, 2006, “Ownership Structure, Risk and
Performance in the European Banking Industry” working paper has presented at a Bacconi University
seminar.
Keown, Arthur J, John D. Martin, J. William Petty, and David F. Scott, JR, 2005, Financial Management,
Tenth Edition, New Jersey: Pearson-Prentice Hall.
Magalhaes, Romulo, Maria Gulerrez Urtiaga, Josep A. Tribo, 2010, “Bank’s Ownership Structure, risk
and Performance”, This Paper from Electronic copy available at: http://ssrn.com/abstract=1102390
Mardanugraha, Eugenia, 2005, “Efisiensi Perbankan di Indonesia Dipelajari Melalui Pendekatan Fungsi
Biaya Parametrik”, Disertasi S3 program Studi Ilmu Ekonomi, Program Pasca Sarjana Fakultas
Ekonomi Universitas Indonesia.
Mester, Loretta J. , 1993, ”Efficiency of Banks in the Third Federal reserve District” Financial Institution
Center, Pennsylvania: The Wartton School University of Pennsylvania.
Micco, Alejandro, Ugo Panizza and Monica Yañez, 2005, ”Bank Ownership and performance -does
politics matters?” Working paper, Central Bank of Chile,
http://www.bcentral.cl/eng/stdpub/studies/workingpaper.
Mirnawati, Fadliah, 2007, “Analisis efisiensi perbankan sebelum dan sesudah menjadi Bank Listed
dengan menggunakan Analisis Non Parametric”, Tesis S-2 Program Studi Ilmu Manajemen
Pascasarjana Fakultas Ekonomi Universitas Indonesia, Depok: Perpustakaan Pusat of Indonesia
University.
Nigmonov, Asror, 2010, ”Bank Performance and Efficiency in Uzbekistan”, Eurasian Journal of Business
and Economics , 3 (5), 1-25.
Pastor, JM., F. Perez and J. Quesada (1997),”efficiency Analysisi in Banking Firms:An International
Comparision”, European Journal of Operational research 98, pp395-407.
Robinson, Thomas R., Paul Munter and Julia Grant (2004), Financial Statement Analysisis-A Globa
Perspektif, International edition, New Jersey: Pearson-Prentice Hall.
Rose, Peter S., 2002, Commercial Bank Management, New York: McGraw-Hill/Irwin-International
Edition.
Rose, Peter S. and Sylvia C. Hudgins, 2005, Bank Management & Financial Service, Sixth Edition,
Singapore: McGra-Hill/International Edition.
Rusdiana, Nana (2012), “Analisis Pengaruh CAR, LDR, NIM, NPL, BOPO, dan DPK terhadap Kinerja
Keuangan Perbankan – Studi Kasus pada Bank Umum Yang Terdaptar pada Bursa Efek Indonesia
periode 2008-2011)”, Skripsi Program Sarjana S-1, Fakultas Ekonomi Universitas Diponegoro.
Proceedings of Annual Shanghai Business, Economics and Finance Conference
3 - 4 November 2014, Shanghai University of International Business and Economics, Shanghai, China
ISBN: 978-1-922069-63-4
16
Sari, Enggar Koesoema (2011),” Analisis Pengaruh CAR, NPL, BOPO, NIM, LDR, dan Pemenuhan
PPAP terhadap Kinerja Perbankan (Studi kasus pada Bank Umum di Indonesia)”, Skripsi Sarjana S-1,
Economic Faculty of Dipenogoro University.
Subramanyam, KR., and John J. Wild., 2009, Financial statement Analysis, Tenth Edition, Singapore:
McGraw-Hill.
Sudiyatno, Bambang and Jati Suroso, 2010, ”Analisis Pengaruh Dana Pihak Ketika, BOPO, CAR, dan
LDR terhadap Kinerja Keuangan pada Sektor Perbankan yang Go Publik di Bursa efek Indonesia
(BEI) (Periode 2005-2008)”, Dinamika Keuangan dan Perbankan, Vol. 2, No.2 ISSN :1979-4878,
Mei 2010, Hal: 125 – 137.
Sudiyatno, Bambang and Rini Setiyowati (2012), “Pengaruh BOPO, NPL, NIM dan CAR terhadap
Kinerja Keuangan Bank (studi pada Bank-bank yang Listed di Bursa Efek Indonesia)”, Dinamika
Akuntansi, Keuangan dan Perbankan, Mei 2012, Vol. 1, No. 1 ISSN :1979-4878, Hal: 57 - 73
White, Gerald I., Ashwinpaul C. Sondhi amd Dov Fried (2003), The Analysis and Use of Financial
Statements, Third Edtion, USA: Willey.
Copyright © 2022 FDOKUMEN