Improvement in Aqueous Solubility of Cilnidipine by Amorphous
Influence of chemical weathering and aging of iron oxideson the potential iron solubility of Saharan dust duringsimulated atmospheric processing
Zongbo Shi,1 Michael D. Krom,1 Steeve Bonneville,1 Alex R. Baker,2 Charlie Bristow,3
Nick Drake,4 Graham Mann,5 Ken Carslaw,5 James B. McQuaid,5 Tim Jickells,2
and Liane G. Benning1
Received 1 April 2010; revised 14 September 2010; accepted 15 February 2011; published 21 May 2011.
[1] The flux of bioavailable Fe from mineral dust to the surface ocean is controlled not onlyby the processes in the atmosphere but also by the nature and source of the dust. In thisstudy, we investigated how the nature of Fe minerals in the dust affects its potential Fesolubility (Fepsol) employing traditional and modern geochemical, mineralogical, andmicroscopic techniques. The chemical and mineralogical compositions, particularly Femineralogy, in soil samples as dust precursors collected from North African dust sourceregions were determined. The Fepsol was measured after 3 days of contact with sulfuric acidat pH 2 to simulate acid processes in the atmosphere. Fepsol of the soil dust samples werecompared with calculated predictions of Fepsol based on the amount of individual Fe‐bearingminerals present in the samples and Fe solubilities of corresponding standard minerals.The calculated Fepsol deviated significantly from themeasured Fepsol of the soil dust samples.We attributed this to the variability in properties of Fe minerals (e.g., size of Fe oxidesand heterogeneity of chemical compositions of clay minerals) in soil dusts in comparisonto the standard minerals. There were, however, clear relationships between the degree ofchemical weathering of North African soils and Fepsol. The Parker index and ratio ofascorbate plus dithionite Fe to total Fe ((FeA+FeD)/FeT) are positively and negativelycorrelated with Fepsol, respectively. In addition, the ratio of FeA/(FeA+FeD), whichdecreases with aging of the Fe oxides, was found to be positively correlated with Fepsol in thesoil dusts. Overall, our results indicate that there is a significant regional variability in thechemical and Fe mineralogical compositions of dusts across North African sources, as aresult of the differences in chemical weathering and aging of Fe oxides. Furthermore,the indices for these weathering processes can provide an estimate of the fraction of Fewhich can be solubilized if acid processed in the atmosphere.
Citation: Shi, Z., et al. (2011), Influence of chemical weathering and aging of iron oxides on the potential iron solubility ofSaharan dust during simulated atmospheric processing, Global Biogeochem. Cycles, 25, GB2010, doi:10.1029/2010GB003837.
1. Introduction
[2] Iron (Fe) is an important micronutrient which can limitphytoplankton growth in the ocean [Boyd et al., 2007]. WhileFe supplied by dust is globally a rather small fraction of thetotal Fe inputs to the oceans, it is disproportionately important
in open ocean waters [Jickells et al., 2005]. Bioavailable Fesupply can regulate and at times limit the primary produc-tivity in large areas of the open oceans. Even in regions wherephytoplankton growth is not Fe limited, such as the sub-tropical North Atlantic, dust input may affect primary pro-ductivity by stimulating nitrogen fixation [Mills et al., 2004;Moore et al., 2009]. As a result, the supply of bioavailableFe from mineral dust can influence the CO2 uptake from theatmosphere and affect Earth’s climate [Jickells et al., 2005].The effect of aerosol Fe supply to the ocean on primaryproductivity and climate depends on the flux of bioavailableFe, which is in turn partly controlled by the Fe solubilityin the dust. Fe solubility in the dust however is one of themost uncertain parameters in current biogeochemical andearth system models.[3] Available data indicate that apparent Fe solubility is
higher in dust collected over the remote marine atmosphere
1Earth and Biosphere Institute, School of Earth and Environment,University of Leeds, Leeds, UK.
2School of Environmental Sciences, University of East Anglia,Norwich, UK.
3Department of Earth and Planetary Sciences, Birkbeck College,University of London, London, UK.
4Department of Geography, King’s College London, London, UK.5Institute of Climate and Atmospheric Sciences, School of Earth and
Environment, University of Leeds, Leeds, UK.
Copyright 2011 by the American Geophysical Union.0886‐6236/11/2010GB003837
GLOBAL BIOGEOCHEMICAL CYCLES, VOL. 25, GB2010, doi:10.1029/2010GB003837, 2011
GB2010 1 of 14
than in dust collected close to source areas [Hand et al., 2004;Baker et al., 2006]. This suggests that atmospheric process-ing can increase the solubility of Fe during dust transport[Mahowald et al., 2005; Baker and Croot, 2010]. One of thepotentially important processes is the mobilization of Fe inacidic aerosol water which can reach pH values below 1–2[Zhu et al., 1992; Keene et al., 2002;Meskhidze et al., 2003].The dissolution and solubility of Fe in natural soil samplesas dust precursors is strongly pH‐dependent, with acidic pHtriggering faster dissolution and increasing the fraction oftotal Fe that is dissolved [e.g., Cornell and Schwertmann,2003; Desboeufs et al., 2005].[4] The flux of bioavailable Fe to the surface ocean is
controlled not only by the processes in the atmosphere whichchange its chemical and physical nature [e.g., Shi et al., 2009]but also by the nature of the mineral dust suspended in thesource area. Mineral dust typically contains a mixture ofseveral Fe‐bearing minerals including: ferrihydrite andpoorly crystalline Fe [Shi et al., 2009], hematite (Fe2O3) andgoethite (FeOOH) [Arimoto et al., 2002; Lafon et al., 2004,2006; Shen et al., 2006; Formenti et al., 2008; Shi et al.,2009], magnetite [Lazaro et al., 2008], and clay mineralssuch as illite, kaolinite, mixed layer illite/smectite, andsmectite [Avila et al., 1997; Shi et al., 2005]. Journet et al.[2008] measured the apparent Fe solubility of commonFe‐bearing minerals including hematite, goethite, and clayminerals (e.g., illite and smectite) at atmospheric relevant pHconditions. They showed that the apparent Fe solubility ofclay minerals is higher than that of Fe oxides (hematite andgoethite). As a result they argued that it is the clay mineralsalone that control the apparent Fe solubility in the dust.Schroth et al. [2009] showed that Fe solubility in Saharandust was far lower than that measured in other sources of Fe
to the ocean. They suggested, based on X‐ray absorptionspectroscopy (XAS), that the presence of Fe as oxides, wasresponsible for the low Fe solubility in a Saharan dust.However, they identified these Fe oxides as mainly ferrihy-drite which is generally considered to be highly soluble at thelow pH [Schwertmann, 1991]. Shi et al. [2009] showed thatFe oxides (goethite and hematite) can be converted to labileFe‐rich nanoparticles by atmospheric processing. In theirstudy, Fe nanoparticles were also shown to be present bothin soils which had been through laboratory simulations ofatmospheric processing and in natural dust samples fromthe western Mediterranean which had been cloud processed.Mackie et al. [2005] found that Fe was significantly mobi-lized below a threshold of pH 3.6, and between this thresholdand pH 7.1, dissolved Fe falls to a minimum. Cwiertny et al.[2008a] found that the apparent Fe solubility is not correlatedto the total Fe (FeT) or the surface area of the dust sourcematerials. Fu et al. [2010] suggested that the apparent Fesolubility is dependent on pH, light, O2, type of acids (e.g.,HCl, H2SO4, HNO3). Thus the complexity of the Fe solubilityin mineral dust is only starting to be investigated and nopatterns which can predict its general behavior have yet beenfound.[5] In order to simulate the flux of bioavailable Fe to the
ocean, a few models have been developed to understandhow atmospheric processing may increase the apparent Fesolubility in the dust [e.g.,Hand et al., 2004;Meskhidze et al.,2005; Luo et al., 2005; Fan et al., 2006; Solmon et al., 2009;Ito and Feng, 2010]. These models are able to capture theobserved increase in apparent Fe solubility with distance fromdust source regions. However, these models have not tried toinclude how processes in the source region might affect theability of Fe in the mineral dust to be solubilized by atmo-spheric processes. In addition, these modeling studies haveassumed hematite to be the only Fe‐bearing mineral presentin the dust. This simplifying assumption is questionable as itoverlooks the wide range of potentially reactive Fe‐bearingmineral which are known to be present in desert dusts.[6] The aim of this study is to understand better how
weathering processes in the source area can modify the Femineralogy of Saharan dust and hence affect the solubility ofFe when that dust is subjected to acidic atmospheric proces-sing. Initially, the chemistry and mineralogy of soil samplesused as surrogates for dust aerosol, collected from a seriesof known dust source regions in Africa was characterized.Laboratory experiments that simulated atmospheric proces-sing on these samples and on reference minerals were carriedout and Fe solubilities in these samples were determined. Themeasured Fe solubilities were then compared with calculatedsolubilities predicted from the contents of individual mineralsand the solubilities of corresponding reference minerals andthe results are discussed. Finally, we tried to link the chemicalweathering processes in the dust source region with thepotential of Fe to be dissolved in mineral dust during simu-lated atmospheric processing by acids.
2. Materials and Methodology
2.1. Samples
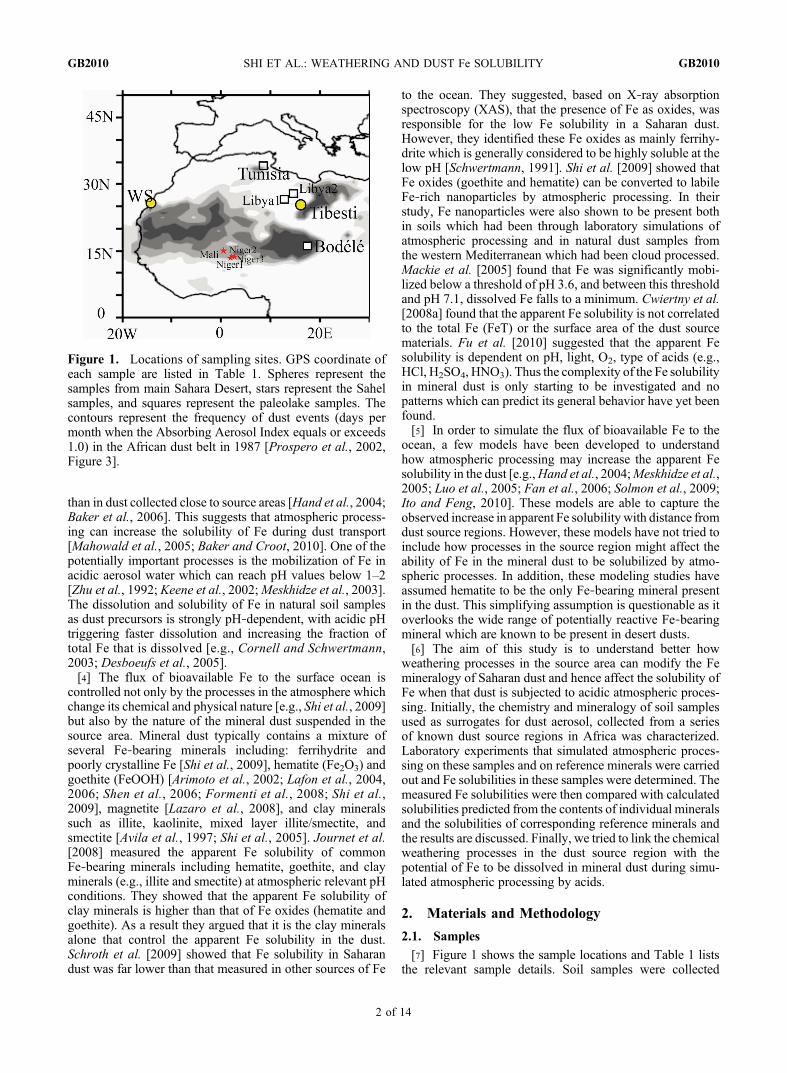
[7] Figure 1 shows the sample locations and Table 1 liststhe relevant sample details. Soil samples were collected
Figure 1. Locations of sampling sites. GPS coordinate ofeach sample are listed in Table 1. Spheres represent thesamples from main Sahara Desert, stars represent the Sahelsamples, and squares represent the paleolake samples. Thecontours represent the frequency of dust events (days permonth when the Absorbing Aerosol Index equals or exceeds1.0) in the African dust belt in 1987 [Prospero et al., 2002,Figure 3].
SHI ET AL.: WEATHERING AND DUST Fe SOLUBILITY GB2010GB2010
2 of 14
from major sources of present‐day Saharan dust (Tibesti,western Sahara (WS), Bodélé and Tunisia), past major dustsources (Libya 1 and 2) and potential dust sources (Mali andNiger 1–3) [Brooks and Legrand, 2000; Prospero et al.,2002; Drake et al., 2008; Washington et al., 2009; Bristowet al., 2009]. As dried‐up water courses, ephemeral driedlakes and paleolakes are known to be the major sourcesof atmospheric dusts [Tegen et al., 2002; Prospero et al.,2002], we targeted those areas for sampling. Further detailsabout the samples used are given in the supplementarymaterial (Text S1).1
[8] All soil samples were dry sieved to <63 mm and thenwet‐sieved to less than 20 mm, freeze‐dried and then dis-aggregated by gentle crushing. Minimum amounts of MQwater was used for sieving and that water was included in thefreeze drying process. The dissolution of Fe from large par-ticles should be minimal because the contact time of waterwith 20–63 mm soils was less than 5 min and we sieved thesoils with MQ water. These <20 mm soil samples were usedas surrogates for mineral dust as had been done previously[Lafon et al., 2006]. In order to carry out the various geo-chemical andmineralogical analyses in this study, a relativelylarge quantity of sample was required. Lafon et al. [2006]showed that Fe speciation in Saharan soils was dependanton grain size but found that the geochemical properties of the<20 mm samples was similar to PM10 (particulate matter lessthan 10 mm) samples obtained from a wind tunnel.[9] In addition, we purchased standard clay minerals includ-
ing illite, illite/smectite mixed layer (I/S), smectite and kao-linite (Table S1 in Text S1) from the clay mineral depository(http://www.clays.org/SOURCE%20CLAYS/SCavailable.html).[10] Microgoethite and microhematite were synthesized
in the laboratory according to Cornell and Schwertmann[2003]. Nanohematite was purchased from Scholz and Co.Ltd. and nanogoethite was made according to Cwiertny et al.[2008b]. Most particles in the nanogoethite sample werenanorod goethite (generally less than 100 nm) although a few∼100 nm hematite were also identified. However, the minorcontamination of goethite by hematite did not affect ourresults because the purpose of that part of the study was tocompare the solubilities of crystalline Fe oxides (not goethiteor hematite individually) against size (see sections 4.1 and4.2). Details of standard Fe oxides were shown in Table S1in Text S1.
[11] Finally, a sample of ultrafine Arizona Test Dust (ATD,Power Technology Inc.) was used as an internal standardmaterial to determine the precision of the sequential Feextraction method (see below).
2.2. Simulated Atmospheric Processing
[12] About 15 mg of sieved soil dust sample or clay stan-dard, or 2 mg of synthetic goethite or hematite were added to500 mL Milli‐Q water (∼pH 5.3). Multiple cycling (3 times)between acidic (pH 2, 24 h) and circumneutral pH (pH 5–6,24 h) were performed on the suspensions according to theprocedure of Shi et al. [2009], Spokes et al. [1994] andMackie et al. [2005]. H2SO4 was used instead of HNO3 toavoid the oxidation of dissolved Fe(II) by NO3
− [Cwiertnyet al., 2008a]. These pH cycles were intended to simulatethe cycling of dust between atmospheric aerosols and clouds,which may happen during the transport of dust [Spokes et al.,1994; Pruppacher and Jaenicke, 1995; Meskhidze et al.,2003]. In the last low pH cycle, a 5 mL suspension samplewas retrieved and filtered through a 0.2 mm pore sizepolycarbonate filter just before the pH was again raised to5–6. Dissolved Fe concentration in the filtrate solution wasmeasured using the ferrozine method after reduction byhydroxylamine hydrochloride solution [Viollier et al., 2000].Fes (mg dissolved Fe g−1 sample) was defined as the dis-solved Fe solubilized after 2 cycles between acid and cir-cumneutral conditions plus a further 24 h at pH 2. The totaltime for the dust to be in contact with acid was 3 days. Weused the term potentially Fe solubility (Fepsol) defined asFes /FeT × 100% to characterize and compare the solubilitiesof different samples of soils and minerals as a result of sim-ulated atmospheric processing.
2.3. X‐Ray Fluorescence Analysis
[13] Major elements were determined by X‐Ray Fluores-cence Analysis (XRF) on fused glass beads prepared fromignited powder with a sample to flux ratio of 1:5, 80% Limetaborate: 20% Li tetraborate flux. Results were quoted ascomponent oxide weight percent, recalculated to include losson ignition (Table 2). Samples were analyzed at the Univer-sity of Leicester, Department of Geology on a PANalyticalAxios Advanced XRF spectrometer calibrated using inter-national and internal standards to ensure accurate data andincluded a lake sediment standard (LKSD‐1) which yields atotal elemental recovery of 98% and accuracy for all elementsof better than 10% except for P2O5 which was 16% comparedto quoted reference values (Table 2 and Table S2 in Text S1).
1Auxiliary materials are available in the HTML. doi:10.1029/2010GB003837.
Table 1. Locations and Properties of Soil Samples
Origin Class BET Surface area (m2 g−1)
Tibesti Tibesti Mountains, Libya, N25°35′, E16°31′ Saharan, dried water course 11.83WS Western Saharan Saharan, open desert 11.37Niger1 Banizoumbou, Niger, N13°52′, E2°62′ Sahel, open desert 14.25Niger2 Gourou Goussou, Niger, N13°50 E2°23′ Sahel, open desert 33.78Niger3 Giraffe Reserve, Koure, Niger N13°18′, E2°34′ Sahel, open desert 11.2Mali Agoufou, Hombori, Mali, N15°22′ W1°28′ Sahel, ephemeral lake 28.34Bodele Bodele Depression, Chad, N16°41′ E17°47′ Paleolake 8.66Tunisia Chott el Djerid, Tunisia Paleolake 11.35Libya1 Wadi al Hyatt, Libya Paleolake 4.75Libya2 Wadi Ash Shatti, Libya Paleolake 31.5
SHI ET AL.: WEATHERING AND DUST Fe SOLUBILITY GB2010GB2010
3 of 14
2.4. Chemical Weathering Indices
[14] Two weathering indices were calculated based onbulk chemical compositions of the samples. The Parker index[Parker, 1970] is calculated by
Parker index ¼ Nað Þa0:35
� �þ Mgð Þa
0:9
� �þ Kð Þa
0:25
� �
þ Cað Þa0:7
� �� 100 ð1Þ
where (X)a indicates the atomic proportion of a given ele-ment, defined as atomic percentage divided by atomic weight.This index is based on the proportions of alkali and alkalineearth metals (Na, K, Mg and Ca) present and on their bondstrength with oxygen (0.35, 0.9, 0.25, and 0.7, respectively)to determine the weathering of a given soil. Here, we did notcorrect the halite and carbonate/gypsum‐related Ca for cal-culating the Parker index. This, however, should have mini-mum effect on the calculation of the Parker indices for theSaharan and Sahelian samples (see Table 2).[15] Chemical Index of Alteration (CIA) [Nesbitt and
Young, 1982] is calculated by
CIA ¼ Al2O3
Al2O3 þ CaO* þ Na2O* þ K2O� 100 ð2Þ
where Al2O3, CaO*, Na2O* and K2O are in molar fractions.CaO* represents the amount of CaO in the silicate fractionof the sample, and Al2O3 and K2O were both determined byXRF (Table 2). The calculation of Na2O* from the silicatefraction was made by subtracting the Na associated withhalite (measured after a 12 h extraction with 1 M acetic acidusing ion chromatography) from the total Na2O measured byXRF. We followed the procedure developed by McLennan[1993] assuming CaO* to be equivalent to Na2O*.
2.5. X‐Ray Diffraction Analysis
[16] A D/MAX‐250 (Rigaku, Japan) XRD scanning withCu Ka radiation at 40 kV, 125 mA was used for mineral-ogical analysis. The scanning speed was −3° (2�) min−1 andthe step size was 0.01° (2�). The specimen was placed ona small cuboid trough made of aluminum for X‐Ray Dif-fraction (XRD) analysis. Mineral phases were identifiedby means of ICDD PDF2 (International Centre for Diffrac-tion Data Powder Diffraction Files) database based on the
d‐spacing values and diffraction peak intensity. Weightpercentages of different phases in the samples were semi-quantified based on the Petroleum Industry Standard Meth-ods of China (FY‐T5263‐1995).
2.6. Scanning and Transmission Electron Microscopy
[17] Powder or filter samples were suspended in ethanol,dispersed by ultrasonication, and deposited on Al‐stubsfor Scanning Electron Microscopy (SEM) analysis or onCu‐grids covered by standard holey carbon films for Trans-mission Electron Microscopy (TEM) analysis. Samples wereimaged using a Jeol JXA 8100 Superprobe SEM after coatingwith 3 nm Au or C. The SEM was operated at an accelerat-ing voltage of 20 kV with a beam current 40–100 nA. AFEI CM200 FEG‐TEM equipped with an Oxford Instru-ment Ultrathin window ISIS Energy Dispersive X‐ray (EDX)spectrometer was used for high‐resolution imaging and toanalyze the chemical composition of individual particles.The FEG‐TEM was operated at 200 kV. Finally, usingTEM, selected area electron diffraction (SAED) patterns wereacquired of representative particles.
2.7. Sequential Fe Extraction
[18] pH 7.5 buffered ascorbate extractions were performedover a period of 24 h to leach the chemically highly reactiveamorphous and nanoparticulate Fe (hereafter referred toas FeA) [Hyacinthe et al., 2006; Raiswell et al., 2008]. Theascorbate extractant consisted of a deoxygenated solutionof 50 g L−1 sodium citrate and 50 g L−1 sodium bicarbonateto which 10 g L−1 of ascorbic acid was added. About 15 mgof sample was mixed with 10 mL of the ascorbate solution,shaken for 24 h at room temperature and then filtered througha 0.2 mm pore size polycarbonate filter. After the ascorbateextraction, the particles collected on the filters were sub-sequently extracted for 2 h with citrate‐buffered dithioniteto dissolve crystalline Fe(III) oxides, mainly goethite andhematite (hereafter referred to as FeD). This extraction con-sisted of a solution of 50 g L−1 sodium dithionite in 0.35 Macetic acid and 0.2 M sodium citrate, buffered at pH 4.8. Inaddition, sodium acetate extractions were performed over aperiod of 2 h to selectively leach the carbonate‐associatedFe in the paleolake samples (Bodèlè, Tunisia, Libya1 andLibya2) at a dust/liquid ratio of ∼30 mg/10 mL. The sodiumacetate solution was made of 1 M sodium acetate, bufferedat pH 4.5 [Poulton and Canfield, 2005].
Table 2. Chemical Composition, Chemical Index of Alternation, Parker Index, and Potential Fe Solubility (Fepsol) of Soil Samples(<20 mm)a
Sample SiO2 TiO2 Al2O3 Fe2O3 MnO MgO CaO Na2O K2O P2O5 SO3 LOI Total Si/Al Fe/Al Ca/Al CIA Parker Fepsol, %
Tibesti 48.74 0.94 17.66 6.88 0.10 3.70 5.91 0.69 2.21 0.21 0.29 11.70 99.02 2.43 0.58 0.51 80 117 5.6WS 49.65 0.87 16.25 6.66 0.09 3.94 7.23 0.67 2.70 0.19 0.02 11.64 99.93 2.69 0.61 0.68 76 133 5.1Niger1 51.69 2.01 19.11 8.29 0.13 0.64 0.67 0.05 1.13 0.14 0.04 14.77 98.64 2.38 0.65 0.05 93 34 1.0Niger2 45.81 1.69 25.99 12.12 0.04 0.15 0.10 0.01 0.33 0.11 0.03 12.59 98.98 1.55 0.70 0.01 98 9 0.7Niger3 72.32 2.04 12.69 3.86 0.05 0.39 0.30 0.09 1.04 0.08 0.03 6.72 99.62 5.02 0.46 0.04 90 32 2.4Mali 55.10 0.99 21.95 6.07 0.04 1.57 0.37 0.14 2.57 0.13 <0.005 9.76 98.70 2.21 0.41 0.03 87 70 10.1Bodele 18.01 0.19 3.05 1.39 0.12 5.57 35.20 0.94 0.38 0.15 0.35 35.59 100.93 5.21 0.68 17.67 49 294 16.9Tunisia 23.26 0.30 4.98 2.22 0.04 9.71 14.13 8.19 1.74 0.12 3.73 25.94 94.36 4.12 0.67 4.35 22 521 17.3Libya1 5.01 0.14 1.90 0.80 0.02 2.94 45.41 2.04 0.21 0.07 0.34 42.53 101.42 2.32 0.63 36.54 17 416 10.1Libya2 56.12 0.60 14.12 4.90 0.02 3.09 0.78 3.70 2.46 0.14 0.84 11.16 97.94 3.50 0.52 0.08 54 209 6.6LKSD‐1 40.1 0.5 7.8 4.1 0.1 3.7 10.8 2.0 1.1 0.2 ‐ 29.9 96.6
aNote: LOI is loss on ignition. LKSD‐1 is a lake sediment reference sample. See Table S2 in Text S1 for reference concentration of elements.
SHI ET AL.: WEATHERING AND DUST Fe SOLUBILITY GB2010GB2010
4 of 14
[19] Dissolved Fe concentrations in the filtrates passingthrough 0.2 mm pore size membrane filters were determinedusing the ferrozine method [Viollier et al., 2000]. The pre-cision of the pH‐buffered ascorbate and dithionite extractionswere tested on nine ATD replicates and showed a relativestandard error of 7.5% for FeA and 9.7% for FeD. The pre-cision of the pH‐buffered sodium acetate extraction testedon 6 reference samples demonstrated a relative standard errorof 4.4%.[20] FeT (total Fe) in all soil samples and the ATD was
measured by XRF. FeT in standard clay minerals was pro-vided by the supplier.[21] We defined free Fe ratio [e.g., Lafon et al., 2004] as
Free Fe ratio ¼ FeAþ FeD
FeTð3Þ
3. Results
3.1. Properties of Soil Dust Samples and TheirPotential Fe Solubility
3.1.1. Chemical Composition[22] Table 2 shows the chemical compositions of different
soil samples. Tibesti and WS had chemical compositionscharacteristic of a quartz/feldspar/clay dominated soil. Bycontrast, the paleolake samples (Tunisia, Libya1, and Bodélé)
had CaO as amain component while Libya2mainly consistedof SiO2 probably due to opaline silica (diatoms). The Sahelsamples (Niger1–3, Mali) had low CaO and relatively highFe2O3.3.1.2. Mineralogical Composition[23] Table 3 shows the semiquantitative mineral composi-
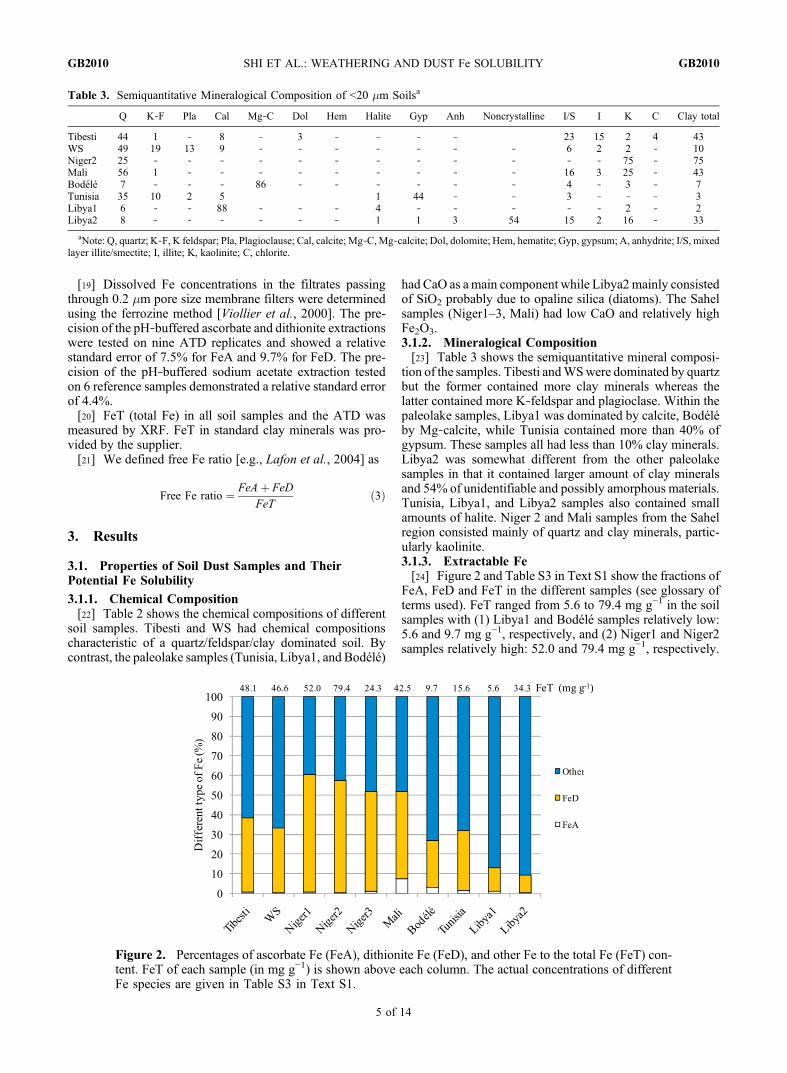
tion of the samples. Tibesti andWSwere dominated by quartzbut the former contained more clay minerals whereas thelatter contained more K‐feldspar and plagioclase. Within thepaleolake samples, Libya1 was dominated by calcite, Bodéléby Mg‐calcite, while Tunisia contained more than 40% ofgypsum. These samples all had less than 10% clay minerals.Libya2 was somewhat different from the other paleolakesamples in that it contained larger amount of clay mineralsand 54% of unidentifiable and possibly amorphous materials.Tunisia, Libya1, and Libya2 samples also contained smallamounts of halite. Niger 2 and Mali samples from the Sahelregion consisted mainly of quartz and clay minerals, partic-ularly kaolinite.3.1.3. Extractable Fe[24] Figure 2 and Table S3 in Text S1 show the fractions of
FeA, FeD and FeT in the different samples (see glossary ofterms used). FeT ranged from 5.6 to 79.4 mg g−1 in the soilsamples with (1) Libya1 and Bodélé samples relatively low:5.6 and 9.7 mg g−1, respectively, and (2) Niger1 and Niger2samples relatively high: 52.0 and 79.4 mg g−1, respectively.
Table 3. Semiquantitative Mineralogical Composition of <20 mm Soilsa
Q K‐F Pla Cal Mg‐C Dol Hem Halite Gyp Anh Noncrystalline I/S I K C Clay total
Tibesti 44 1 ‐ 8 ‐ 3 ‐ ‐ ‐ ‐ 23 15 2 4 43WS 49 19 13 9 ‐ ‐ ‐ ‐ ‐ ‐ ‐ 6 2 2 ‐ 10Niger2 25 ‐ ‐ ‐ ‐ ‐ ‐ ‐ ‐ ‐ ‐ ‐ ‐ 75 ‐ 75Mali 56 1 ‐ ‐ ‐ ‐ ‐ ‐ ‐ ‐ ‐ 16 3 25 ‐ 43Bodélé 7 ‐ ‐ ‐ 86 ‐ ‐ ‐ ‐ ‐ ‐ 4 ‐ 3 ‐ 7Tunisia 35 10 2 5 1 44 ‐ ‐ 3 ‐ ‐ ‐ 3Libya1 6 ‐ ‐ 88 ‐ ‐ ‐ 4 ‐ ‐ ‐ ‐ ‐ 2 ‐ 2Libya2 8 ‐ ‐ ‐ ‐ ‐ ‐ 1 1 3 54 15 2 16 ‐ 33
aNote: Q, quartz; K‐F, K feldspar; Pla, Plagioclause; Cal, calcite; Mg‐C,Mg‐calcite; Dol, dolomite; Hem, hematite; Gyp, gypsum; A, anhydrite; I/S, mixedlayer illite/smectite; I, illite; K, kaolinite; C, chlorite.
Figure 2. Percentages of ascorbate Fe (FeA), dithionite Fe (FeD), and other Fe to the total Fe (FeT) con-tent. FeT of each sample (in mg g−1) is shown above each column. The actual concentrations of differentFe species are given in Table S3 in Text S1.
SHI ET AL.: WEATHERING AND DUST Fe SOLUBILITY GB2010GB2010
5 of 14
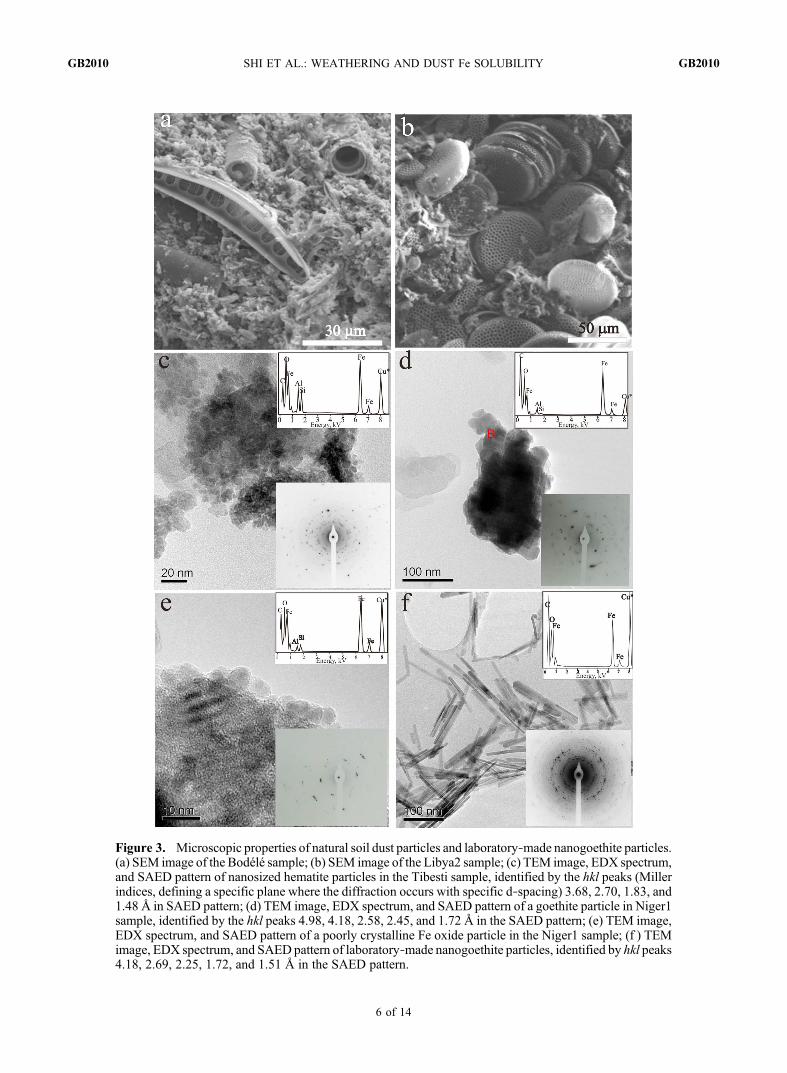
Figure 3. Microscopic properties of natural soil dust particles and laboratory‐made nanogoethite particles.(a) SEM image of the Bodélé sample; (b) SEM image of the Libya2 sample; (c) TEM image, EDX spectrum,and SAED pattern of nanosized hematite particles in the Tibesti sample, identified by the hkl peaks (Millerindices, defining a specific plane where the diffraction occurs with specific d‐spacing) 3.68, 2.70, 1.83, and1.48 Å in SAED pattern; (d) TEM image, EDX spectrum, and SAED pattern of a goethite particle in Niger1sample, identified by the hkl peaks 4.98, 4.18, 2.58, 2.45, and 1.72 Å in the SAED pattern; (e) TEM image,EDX spectrum, and SAED pattern of a poorly crystalline Fe oxide particle in the Niger1 sample; (f ) TEMimage, EDX spectrum, and SAEDpattern of laboratory‐made nanogoethite particles, identified by hkl peaks4.18, 2.69, 2.25, 1.72, and 1.51 Å in the SAED pattern.
SHI ET AL.: WEATHERING AND DUST Fe SOLUBILITY GB2010GB2010
6 of 14
Generally, samples from the Bodélé and other paleolakeshad lower FeT contents per mass of sample because of the“dilution effect” by authigenic minerals (calcite, gypsumand/or opaline silica).[25] FeA varied from 0.08 (Libya1) to 3.10 mg g−1 (Mali)
(Table S3 in Text S1). In the Tibesti, WS, Niger1, Niger2, andNiger3 samples, FeA/FeT was typically less than 1.0%. Inthe paleolake samples (Bodélé, Tunisia, Libya1), FeA/FeTwas generally higher than 1.0% although FeA/FeT in Libya2was unusually low with only 0.4%. In the Mali sample, alocation seasonally submerged under water, FeA/FeT reacheda maximum at 7.3%.[26] FeD ranged from 1.7 to 45.4 mg g−1 and FeD/FeT
varied from 9.0% to 59.6% in different soil samples (Table S3in Text S1). FeD/FeT was particularly high in the Niger1,Niger2, and Niger3 samples (Figure 2). FeA+FeD representedthe total Fe oxides, which accounted for 9.3 to 60.3% of theFeT in these samples (Figure 2 and Table S3 in Text S1).[27] The remaining Fe represented the Fe in the alumino-
silicate lattice and is often termed structural Fe [e.g., Lafonet al., 2006]. Its content ranged from 39.7 to 90.7% in thesoil samples (Figure 2).[28] In addition, carbonate‐associated Fe was measured
in the paleolake samples, which accounted for 5.0%, 0.7%,3.1%, and 0.1% of the FeT in the Bodèlè, Tunisia, Libya1 andLibya2 samples, respectively.3.1.4. Microscopic Properties of Fe‐Rich Particles[29] Figures 3a and 3b show the SEM images of two
diatomite‐containing paleolake samples (Bodélé and Libya2).The Bodélé sample contained diatoms that were cemented byauthigenic carbonates (Figure 3a) which precipitated fromthe lake waters. The Libya2 sample was mainly composedof diatoms (Figure 3b) and their opaline silica compositionagrees well with the XRD analysis showing the presence oflarge amounts of amorphousmaterials (Table 3), and the XRFdata showing the large SiO2 content (56%, Table 2).[30] Figures 3c–3f show TEM images, EDX spectra, and
SAED patterns of individual Fe‐rich particles in Saharansoils, and an Fe oxide standard (nanogoethite). The EDXspectra shown in Figures 3c and 3d of Fe oxide particlesexhibit some contributions of adjacent particles rich in Siand Al, however, typical d‐spacings (see Figure 3 captionfor details) allowed the identification of nanosized hematite(Figure 3c) and goethite (Figure 3d). In addition, some poorlycrystalline Fe oxides were also identified (e.g., Figure 3e).In contrast, the synthetic Fe oxides showed characteristicwell‐crystalline morphologies and SAED pattern as exem-plified by Figure 3f.3.1.5. Potential Fe Solubility of the Soil Dust Samples[31] Fepsol of the soil samples ranged from 0.7% in Niger2
to 17.3% in Tunisia (Table 2). The two Niger samples (Niger1–2), which had the highest FeT contents among all samples,showed the lowest Fepsol. The highest Fepsol were observedin the paleolake and lake samples (Bodélé, Tunisia, Libya1,and Mali), all of which were higher than 10%.
3.2. Properties of Standard Minerals and TheirPotential Fe Solubility
3.2.1. Properties of Standard Minerals[32] Major elemental compositions and extractable Fe for
the standard clay minerals are presented in Tables S2 and S3,
respectively, in Text S1. FeT content ranged from 0.8 mg g−1
in kaolinite to 55.5 mg g−1 in illite. In addition to structural Fe(bound to silicate), XRD analysis detected the presence of Feoxides in the I/S sample (further identified as goethite (FeG)by Direct Reflectance Spectrometry (DRS), see I/S samplein Table S3 in Text S1) and illite. However, the contributionof Fe oxide represented a small fraction of the FeT presentin the standard clay minerals (Table S3 in Text S1). FeA, inthe standard clay minerals (illite, I/S and smectite) were 0.9,3.8, and 1.2% of FeT. Furthermore, FeA+FeD was less than10% of FeT in the illite and smectite samples. As a com-parison, in the microhematite, FeA was only 0.21 ± 0.01%while 99 ± 9% of the sample was measured as FeD (Table S3in Text S1).3.2.2. Potential Fe Solubility of Mineral Standards[33] The soluble Fe (Fes) in the illite, I/S, smectite and
kaolinite was 1.5, 0.3, 1.3 and 0.9 mg g−1, respectively, whilein the standard Fe oxides (Microhematite, nanohematite,microgoethite and nanogoethite), the Fes was greater at 2.7,3.6, 6.7, 2.7 mg g−1 (Figure S1 in Text S1). However, whenexpressed as Fepsol, the values for standard clayminerals wereconsiderably larger (2.7, 3.7, 5.2 and 13.4% in illite, I/S,smectite and kaolinite, respectively) than in the Fe oxideswhich ranged from 0.4% to 1.1% because the former con-tained far lower FeT. The Fepsol in the nanosized hematite andgoethite was higher than those in corresponding microsizedminerals.
4. Discussion
[34] In this paper, we examined the factors controlling thesolubility of Fe in North African soil dusts during simulatedatmospheric processing. In the atmosphere, mineral aerosolsage by taking up sulfate and/or nitrate [Sullivan et al., 2007;Shi et al., 2008]. The acid gases can be adsorbed onto mineralaerosol particles or scavenged by cloud droplets where the pHis usually above 3.0 [Hegg et al. 2002; Straub et al., 2007]. Asthe cloud droplets evaporate, most of the water is lost, leadingto an increase in the relative concentration of these dissolvedacids and therefore the pH drops; these pH values can reach 1or even lower [Zhu et al., 1992;Meskhidze et al., 2003]. SinceFe‐rich dust particles tend to be smaller in size [i.e., Cwiertnyet al., 2008a] and externally mixed with carbonate [i.e.,Sullivan et al., 2007; Ito and Feng, 2010], they are morelikely to experience low pH conditions after long‐rangetransport. Furthermore, since clouds commonly form andevaporate, this causes systematic fluctuations in mineral‐aerosol water pH. Dust particles can be transported in theatmosphere for more than 2 weeks, therefore, they mayencounter several cloud cycles during their lifetime[Pruppacher and Jaenicke, 1995; Uno et al., 2009]. Thiscomplex atmospheric processing of Fe in the dust was illus-trated by Mackie et al. [2005]. In order to simulate the pHfluctuations in the aerosol and cloud water, in this study weexposed soil samples to three acidic and two intermediate pHperiods of 24 h each. We used the potential Fe solubility asa measure of the relative ability of simulated acidic processesto dissolve Fe in our samples. In the following sections,we attempt to predict Fepsol of soil samples from the contentsof different Fe‐bearing minerals and solubilities of (Fes)of corresponding standard minerals, and then explain why
SHI ET AL.: WEATHERING AND DUST Fe SOLUBILITY GB2010GB2010
7 of 14
this procedure does not seem able to predict Fe solubilitieswith acceptable accuracy. On this basis, we developed a newunderstanding of the critical factors that control the potentialof Fe to be dissolved in the dust.
4.1. Predicting Potential Fe Solubility in Dust Samples
[35] Knowing the mineralogical contents of all our samplesand the solubilities (Fes) of the corresponding standard Fe‐bearing minerals (poorly crystalline Fe oxides, clay minerals,crystalline Fe oxides, calcite/dolomite/gypsum), we calcu-lated the Fepsol by summing soluble Fe from each Fe‐bearingmineral.
PredictedFepsol ¼Pi
Massi � Fes�ið ÞFeT
� 100 ð4Þ
whereMassi is the mass of Fe‐bearing phase i (e.g., illite) (ing mineral g−1 sample); Fes‐i is the Fes of the Fe‐bearing phasei (mg g−1); FeT is the total Fe content in a sample (mg g−1).We applied four scenarios:[36] Scenario 1. We assumed that total dissolved Fe came
from crystalline Fe oxides and clay minerals only. For sim-plicity, Fe oxides and clay minerals were assumed to bepresent only as nanogoethite and illite in our sample. Notethat the two selected phases exhibited the highest Fes amongour set of standards (Figure S1 in Text S1). This scenario wassimilar to the methodology of Journet et al. [2008] to cal-culate the contribution of Fe oxides to total dissolved Fe poolin a model composite dust.
[37] Scenario 2. We assumed that Fe in calcite/dolomite(as Fe carbonate) was totally soluble during simulatedatmospheric processing and that Fe in a gypsum standardwas totally soluble (Fe content in the sample is ∼0.1% [Varjoet al., 2003]) as well. We only considered the paleolakesamples because Fe carbonate (i.e., FeCO3) can only beformed under anoxic conditions and the other samples do notcontain gypsum. We calculated Fepsol in the same manner asin scenario 1 but added the measured carbonate and gypsum‐associated Fe for each paleolake sample (see section 2.7).[38] Scenario 3. We made the same assumptions as in
scenario 2 except that, in addition, we assumed that all thepoorly crystalline or nanoparticulate Fe (FeA) was com-pletely dissolved during the simulated atmospheric proces-sing. Thus we calculated Fepsol in the same manner as inscenario 2 but added the measured FeA for each sample. Thisscenario addressed the fact that ferrihydrite and amorphousFe are very soluble at low pH [Schwertmann, 1991; Shi et al.,2009].[39] Scenario 4. We assumed that clay minerals were not
contributing to Fe dissolution, that Fe oxides existed only ashematite (nanosized), and the Fes was 10 times bigger thanthe actuallymeasured Fes (Table S3 in Text S1). This scenariowas similar to that used by Meskhidze et al. [2005] andSolmon et al. [2009] in their atmospheric models.[40] The results of these four calculation scenarios are
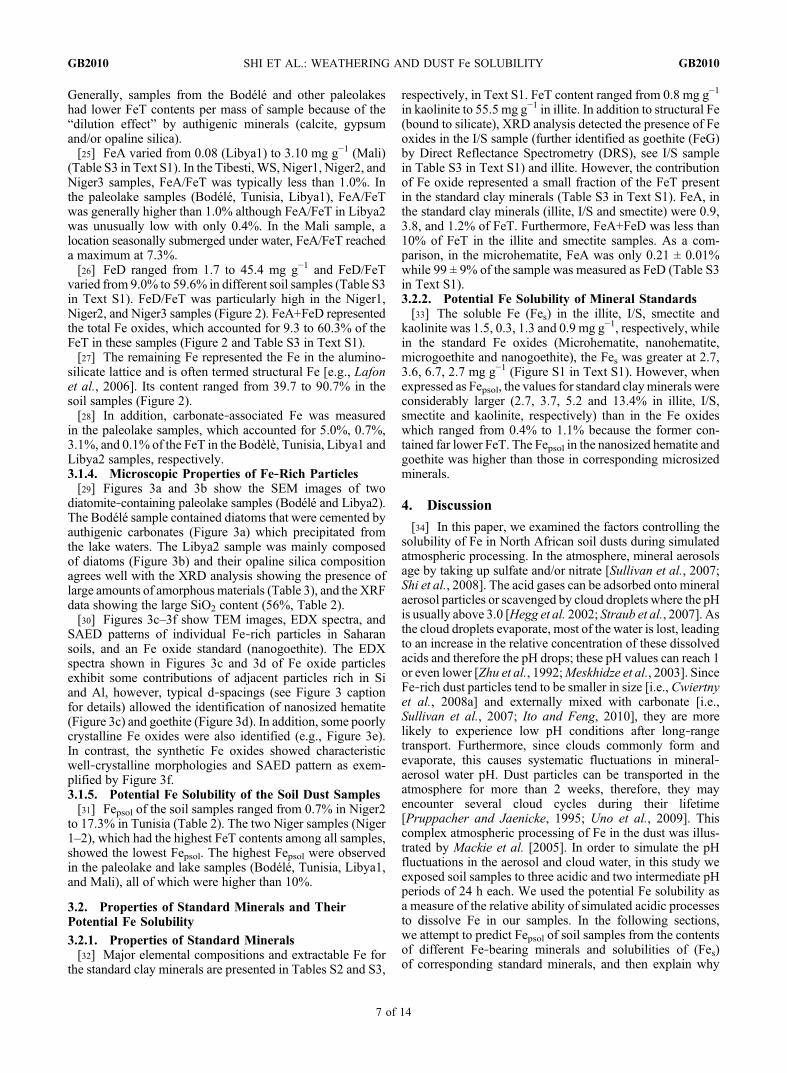
plotted against our experimental data of Fepsol in Figure 4.Overall, none of these above scenarios adequately predictedthe variability of Fepsol in dust precursors and, except forNiger1 and Niger2, these calculations significantly under-estimated the measured Fepsol. Indeed, the Root Mean Squares(RMS) of the four scenarios were very high (2.7, 2.2 1.7and 2.2 respectively), where RMS of an ideal fit is 0. Theseresults suggest that the methodology of predicting Fepsol frommineralogical compositions in a natural sample and Fes ofstandard mineral may not be applicable to real dust.[41] In addition to the above calculations, we used a similar
mineralogical distribution of Fe‐bearing minerals in a com-posite dust as in the work of Journet et al. [2008], but our ownFepsol measurements for the standard phases (determined after3 d at pH 2) to predict the contribution of Fe oxides to the totalsoluble Fe. Assuming microhematite or microgoethite to bethe only Fe oxide phase, the contribution of Fe oxides to totaldissolved Fe was as high as 10% and this value increasedto 21% if we assumed a smaller size for the Fe oxides (i.e.,nanogoethite). The above mentioned discrepancies lead us toquestion the basic assumptions underlying our calculations,i.e., that standard Fe‐bearing minerals are representative ofthe corresponding phases in natural dust samples.
4.2. Potential Fe Solubility of Clay Minerals and FeOxides in Natural Dusts
[42] The standard clay minerals used in this study (andother similar studies) were derived from natural sources(Table S1 in Text S1). Among them, the chemical andphysical properties including their Fe contents vary dramat-ically (e.g., Table S2 in Text S1), even when the same typeof clay mineral standard is concerned. For example, the illitesample used in the present study contained 22% and 66%more Fe than the two illite standards used by Journet et al.[2008]. This chemical heterogeneity is partly due to the dif-ferences in chemical weathering regimes and also the parent/
Figure 4. Measured versus predicted potential Fe solubility(Fepsol) in North African soil dust samples. Predicted Fepsolwas calculated from contents of individual Fe mineralsand measured Fepsol of corresponding standard minerals.For a detailed explanation of scenario 1, 2, 3, and 4, seesection 4.1. Scenario 4 created a straight line with predictedFe solubility of about 3.5%. Because the amount of samplesin Niger1 and Niger 3 was not enough for semiquantitativemineralogical analysis, we assumed total clay contents inthese samples to be 30%. A 10% variation in the clay contentsin these two samples leads to less than 30% changes in esti-mated Fepsol. The sample numbers used are “a” Tibesti; “b”WS; “c” Niger1; “d” Niger2; “e” Niger3; “f” Mali; “g”Bodélé; “h” Tunisia; “i” Libya1; “j” Libya2.
SHI ET AL.: WEATHERING AND DUST Fe SOLUBILITY GB2010GB2010
8 of 14
primary mineral from which the illite and generally other clayminerals originated [Meunier and Velde, 2004]. As a resultof these heterogeneities, apparent Fe solubilities of the sametype of standard clay mineral from different sources is likelyto be different. For example, the two illite samples of Journetet al. [2008] exhibited apparent Fe solubility of 0.95% and1.35%.[43] In addition, once formed, clay minerals will undergo
weathering processes, which affect the fate of the Fe speciesin them. It is well established that Fe can be solubilized fromclay minerals to form Fe oxides in soils [McFadden andHendricks, 1985], often as nanometer sized particles. XRDand DRS revealed the presence of Fe oxides (data not shown)in our standard illite and I/S samples. Therefore, assessing theFepsol of clay mineral standard is problematic as they oftenalso contain Fe oxides that can dissolve with the clay mineralunder acidic conditions.[44] Furthermore, the choice of a single phase of pure Fe
oxide synthesized in the laboratory to assess the Fepsol ofnaturally occurring Fe oxides in mineral dust is also prob-lematic. The differences in the formation conditions betweenthe natural and laboratory settings in term of temperature,ionic strength, pH and chemical composition affect themineralogy of Fe oxides formed as well as their physical andchemical properties. For instance, we found in our soil samplessome Fe oxides that were poor in crystal order or even amor-phous, often in the 5–10 nm size range (i.e., Figures 3c–3e)and therefore have a very large specific surface area. Bycontrast, our synthetic Fe oxides were well crystallized withcharacteristic morphologies and larger sizes (e.g., Figure 3f).These differences between natural and synthetic Fe oxideshave been widely reported [Kampf and Schwertmann, 1983;Schwertmann and Latham, 1986; Anand and Gilkes, 1987;Fontes et al., 1992; Costantini et al., 2006]. Since the solu-bilities of Fe oxides and clay minerals are primarily controlledby specific surface area, grain size, purity and crystal orderwhich are themselves highly sensitive to chemical and envi-ronmental conditions, it is not surprising that synthetic pureFe oxides [Cornell and Schwertmann, 2003] and standardclay minerals [Meunier and Velde, 2004] do not reflectaccurately the Fe solubility of the spectrum of Fe‐bearingminerals potentially present in real mineral dust. Therefore the
assumption underlying our calculations that the standard Fe‐bearing minerals are representative of the correspondingphases in all natural soil samples is unlikely to be valid. Wesuggest that this is the reason why we failed to predict theFepsol of our natural dust samples from the Fes of the standardFe‐bearing phases in them (scenario 1–3).[45] For a similar reason, when using the characteristics
of standard minerals to interpret and quantify the phasesin complex natural samples, one should be cautious. Forexample, although we agree with Schroth et al. [2009] thatFe speciation of natural samples may control their apparentFe solubility, these authors’ interpretation that the dominantphase of Fe oxyhydroxides in Saharan dust is ferrihydrite(∼70% of FeT) based on XAS identification is not in agree-ment with our data.We determined only 0.3–7.4% of our dustprecursor samples to be ferrihydrite or amorphous Fe asextracted by ascorbate [Kostka and Luther, 1994; Hyacintheet al., 2006; Raiswell et al., 2008] (Table S3 in Text S1). Thishas critical implications since ferrihydrite is orders of mag-nitude more soluble under simulated atmospheric processingthan goethite and hematite [Schwertmann, 1991; Shi et al.,2009]. None of our samples showed Fepsol close to valuesof 70% which would be expected if 70% of the FeT wasferrihydrite. We consider it much more likely that crystallineFe oxides (FeD) will dominate over ferrihydrite or poorlycrystalline Fe in Sahara and Sahel soils (FeA; Figure 2)because ferrihydrite is only likely to be stable under mostdesert conditions for a relatively short time [Cornell andSchwertmann, 2003].
4.3. Dependence of Fepsol on Degree of ChemicalWeathering and Aging of Fe Oxides
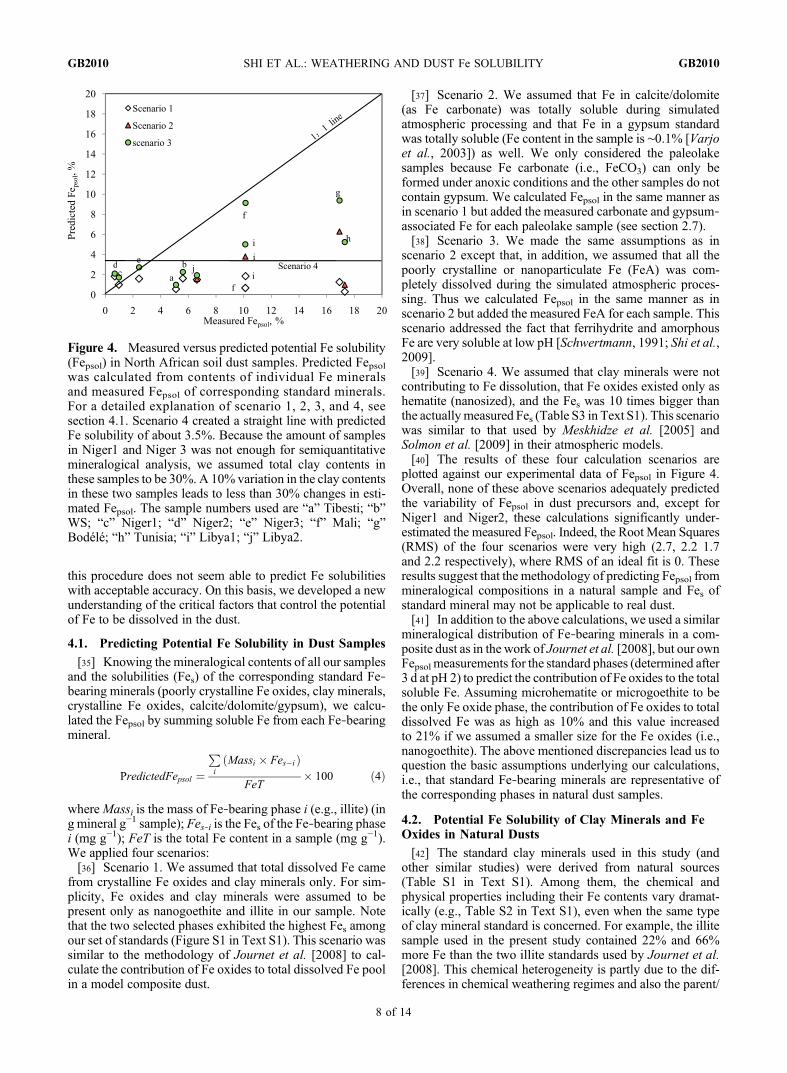
[46] Since it was not possible to predict Fepsol from thecomponent minerals, we set out to determine if an under-standing of the weathering processes in the source area mightbe used to develop a more accurate proxy for predictingthe potential of Fe to dissolve during simulated atmosphericprocessing.[47] In order to assess the degree of weathering of our
dust source samples, we calculated three potentially relevantparameters: The Parker weathering index, the CIA, and thefree Fe ratio ((FeA+FeD)/FeT; see equation (3)). The Parkerweathering index is considered the most appropriate forapplication to weathering of heterogeneous parent rocks[Price and Velbel, 2003]. Unlike Price and Velbel [2003], wefound that CIA was also a good index to represent the degreeof weathering in our samples since it was highly correlatedwith the Parker index (Figure S2 in Text S1). The free Feratio has also been used as an indicator of soil maturity anddegree of chemical weathering [e.g., Torrent et al., 1980;Arduino et al., 1984; Egli et al., 2001]. The good correlationsbetween the free Fe ratio, the CIA and, and the Parker index(Figure 5 and Figure S3 in Text S1) support our argument thatthe former is a good weathering index. This is consistent withour understanding of the sequence of chemical weathering ofFe‐containing minerals particularly under desert conditions.As the parent rock weathers and soil develops, the originalFe‐bearing minerals (including clay minerals) chemicallyweather releasing Fe which is subsequently converted intopoorly crystalline Fe oxides (FeA). In turn, these labile Feoxides are then aged and transformed into crystalline Feoxides [McFadden and Hendricks, 1985; Leigh, 1996;Cornell
Figure 5. Plot of Parker weathering index against(FeA+FeD)/FeT (free Fe ratio) for soil dusts.
SHI ET AL.: WEATHERING AND DUST Fe SOLUBILITY GB2010GB2010
9 of 14
and Schwertmann, 2003; Torrent et al., 2007]. Initially,the minerals that are easiest to break down weather, and arelatively large amount of FeA forms. This FeA is convertedover time to more refractory goethite and hematite (togethermeasured as FeD). With time, the relative amount of FeAproduced decreases and FeD increases. In the extreme case,which did not happen in our samples all the Fe in the rock/soil(FeT) is converted into FeD.[48] In this study, the soils can be divided into 3 groups.
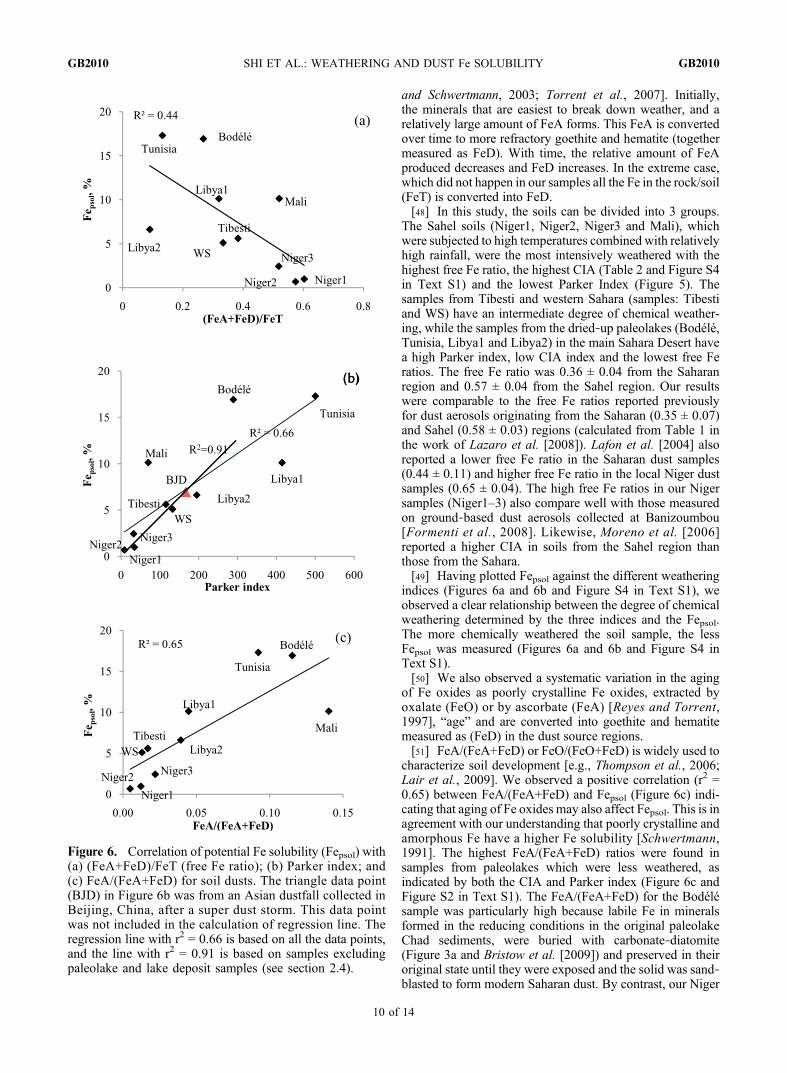
The Sahel soils (Niger1, Niger2, Niger3 and Mali), whichwere subjected to high temperatures combined with relativelyhigh rainfall, were the most intensively weathered with thehighest free Fe ratio, the highest CIA (Table 2 and Figure S4in Text S1) and the lowest Parker Index (Figure 5). Thesamples from Tibesti and western Sahara (samples: Tibestiand WS) have an intermediate degree of chemical weather-ing, while the samples from the dried‐up paleolakes (Bodélé,Tunisia, Libya1 and Libya2) in the main Sahara Desert havea high Parker index, low CIA index and the lowest free Feratios. The free Fe ratio was 0.36 ± 0.04 from the Saharanregion and 0.57 ± 0.04 from the Sahel region. Our resultswere comparable to the free Fe ratios reported previouslyfor dust aerosols originating from the Saharan (0.35 ± 0.07)and Sahel (0.58 ± 0.03) regions (calculated from Table 1 inthe work of Lazaro et al. [2008]). Lafon et al. [2004] alsoreported a lower free Fe ratio in the Saharan dust samples(0.44 ± 0.11) and higher free Fe ratio in the local Niger dustsamples (0.65 ± 0.04). The high free Fe ratios in our Nigersamples (Niger1–3) also compare well with those measuredon ground‐based dust aerosols collected at Banizoumbou[Formenti et al., 2008]. Likewise, Moreno et al. [2006]reported a higher CIA in soils from the Sahel region thanthose from the Sahara.[49] Having plotted Fepsol against the different weathering
indices (Figures 6a and 6b and Figure S4 in Text S1), weobserved a clear relationship between the degree of chemicalweathering determined by the three indices and the Fepsol.The more chemically weathered the soil sample, the lessFepsol was measured (Figures 6a and 6b and Figure S4 inText S1).[50] We also observed a systematic variation in the aging
of Fe oxides as poorly crystalline Fe oxides, extracted byoxalate (FeO) or by ascorbate (FeA) [Reyes and Torrent,1997], “age” and are converted into goethite and hematitemeasured as (FeD) in the dust source regions.[51] FeA/(FeA+FeD) or FeO/(FeO+FeD) is widely used to
characterize soil development [e.g., Thompson et al., 2006;Lair et al., 2009]. We observed a positive correlation (r2 =0.65) between FeA/(FeA+FeD) and Fepsol (Figure 6c) indi-cating that aging of Fe oxides may also affect Fepsol. This is inagreement with our understanding that poorly crystalline andamorphous Fe have a higher Fe solubility [Schwertmann,1991]. The highest FeA/(FeA+FeD) ratios were found insamples from paleolakes which were less weathered, asindicated by both the CIA and Parker index (Figure 6c andFigure S2 in Text S1). The FeA/(FeA+FeD) for the Bodélésample was particularly high because labile Fe in mineralsformed in the reducing conditions in the original paleolakeChad sediments, were buried with carbonate‐diatomite(Figure 3a and Bristow et al. [2009]) and preserved in theiroriginal state until they were exposed and the solid was sand‐blasted to form modern Saharan dust. By contrast, our Niger
Figure 6. Correlation of potential Fe solubility (Fepsol) with(a) (FeA+FeD)/FeT (free Fe ratio); (b) Parker index; and(c) FeA/(FeA+FeD) for soil dusts. The triangle data point(BJD) in Figure 6b was from an Asian dustfall collected inBeijing, China, after a super dust storm. This data pointwas not included in the calculation of regression line. Theregression line with r2 = 0.66 is based on all the data points,and the line with r2 = 0.91 is based on samples excludingpaleolake and lake deposit samples (see section 2.4).
SHI ET AL.: WEATHERING AND DUST Fe SOLUBILITY GB2010GB2010
10 of 14
(Sahel) samples have been subjected to relatively strongchemical weathering; the FeA content was the lowest amongall our samples. We also found that the plot of the ratio ofhematite to goethite Fe against Fepsol shows an inverse cor-relation. This is consistent with the known conversion ofgoethite into more refractory hematite (Figure S5 in Text S1)as chemicalweathering progresses [Cornell and Schwertmann,2003].[52] Thus our study shows a clear systematic pattern
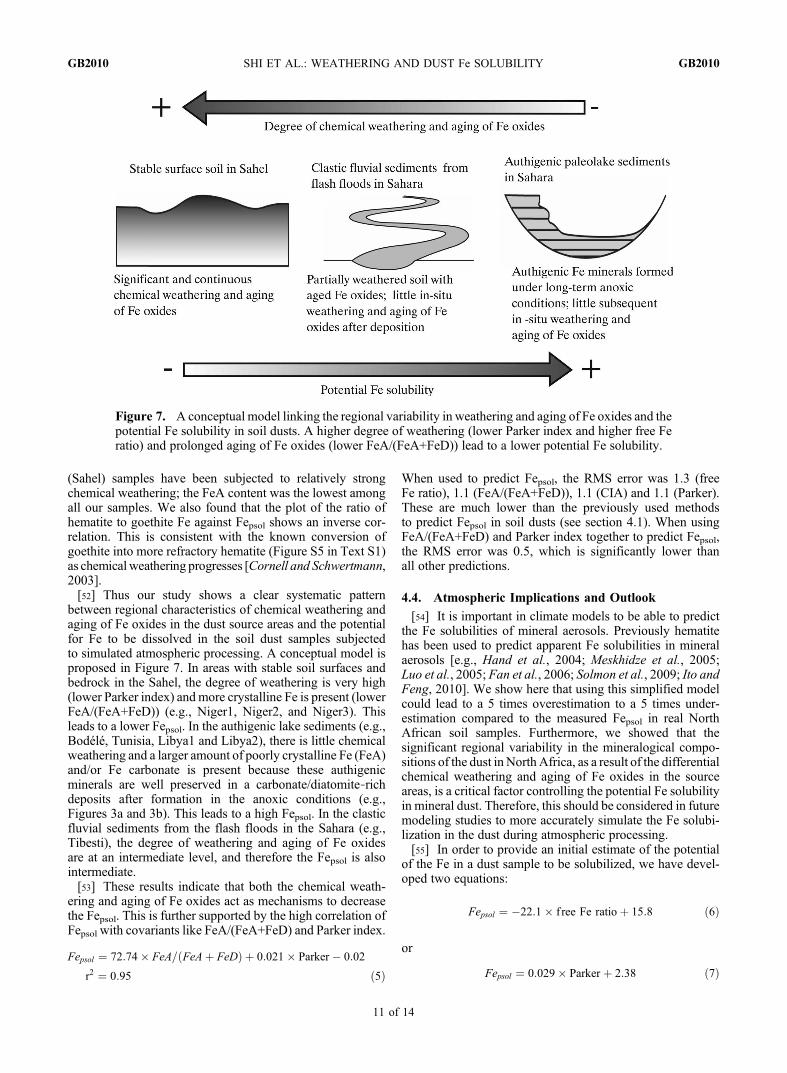
between regional characteristics of chemical weathering andaging of Fe oxides in the dust source areas and the potentialfor Fe to be dissolved in the soil dust samples subjectedto simulated atmospheric processing. A conceptual model isproposed in Figure 7. In areas with stable soil surfaces andbedrock in the Sahel, the degree of weathering is very high(lower Parker index) andmore crystalline Fe is present (lowerFeA/(FeA+FeD)) (e.g., Niger1, Niger2, and Niger3). Thisleads to a lower Fepsol. In the authigenic lake sediments (e.g.,Bodélé, Tunisia, Libya1 and Libya2), there is little chemicalweathering and a larger amount of poorly crystalline Fe (FeA)and/or Fe carbonate is present because these authigenicminerals are well preserved in a carbonate/diatomite‐richdeposits after formation in the anoxic conditions (e.g.,Figures 3a and 3b). This leads to a high Fepsol. In the clasticfluvial sediments from the flash floods in the Sahara (e.g.,Tibesti), the degree of weathering and aging of Fe oxidesare at an intermediate level, and therefore the Fepsol is alsointermediate.[53] These results indicate that both the chemical weath-
ering and aging of Fe oxides act as mechanisms to decreasethe Fepsol. This is further supported by the high correlation ofFepsol with covariants like FeA/(FeA+FeD) and Parker index.
Fepsol ¼ 72:74� FeA= FeAþ FeDð Þ þ 0:021� Parker � 0:02
r2 ¼ 0:95 ð5Þ
When used to predict Fepsol, the RMS error was 1.3 (freeFe ratio), 1.1 (FeA/(FeA+FeD)), 1.1 (CIA) and 1.1 (Parker).These are much lower than the previously used methodsto predict Fepsol in soil dusts (see section 4.1). When usingFeA/(FeA+FeD) and Parker index together to predict Fepsol,the RMS error was 0.5, which is significantly lower thanall other predictions.
4.4. Atmospheric Implications and Outlook
[54] It is important in climate models to be able to predictthe Fe solubilities of mineral aerosols. Previously hematitehas been used to predict apparent Fe solubilities in mineralaerosols [e.g., Hand et al., 2004; Meskhidze et al., 2005;Luo et al., 2005; Fan et al., 2006; Solmon et al., 2009; Ito andFeng, 2010]. We show here that using this simplified modelcould lead to a 5 times overestimation to a 5 times under-estimation compared to the measured Fepsol in real NorthAfrican soil samples. Furthermore, we showed that thesignificant regional variability in the mineralogical compo-sitions of the dust in NorthAfrica, as a result of the differentialchemical weathering and aging of Fe oxides in the sourceareas, is a critical factor controlling the potential Fe solubilityin mineral dust. Therefore, this should be considered in futuremodeling studies to more accurately simulate the Fe solubi-lization in the dust during atmospheric processing.[55] In order to provide an initial estimate of the potential
of the Fe in a dust sample to be solubilized, we have devel-oped two equations:
Fepsol ¼ �22:1� f ree Fe ratioþ 15:8 ð6Þ
or
Fepsol ¼ 0:029� Parker þ 2:38 ð7Þ
Figure 7. A conceptual model linking the regional variability in weathering and aging of Fe oxides and thepotential Fe solubility in soil dusts. A higher degree of weathering (lower Parker index and higher free Feratio) and prolonged aging of Fe oxides (lower FeA/(FeA+FeD)) lead to a lower potential Fe solubility.
SHI ET AL.: WEATHERING AND DUST Fe SOLUBILITY GB2010GB2010
11 of 14
In these equations, we assumed that the dust sample hasundergone acid processing at pH 2 for 3 days. The free Feratio is a parameter that has commonly been measured onmineral aerosols [Lafon et al., 2004, 2006; Lazaro et al.,2008; Formenti et al., 2008], while the Parker Index can becalculated from bulk chemical composition of the samplesusing equation (1). As an independent test of our relationship,we plotted both Fepsol and Parker index of an Asian dustfallsample collected after a major dust storm in Beijing [Shaoet al., 2008] on Figure 6b. The data point (triangle, BJD)fitted very closely on our regression line.[56] We noted that our simulated atmospheric processing
experiments are idealistic and do not take into account thecomplexity of Fe dissolution in the dust under actual atmo-spheric conditions or upon mixing with seawater [Baker andCroot, 2010]. Indeed, in addition to the nature of Fe in thedust proposed in this paper, several other parameters have tobe predicted or measured before a model can accuratelysimulate the solubilization of Fe in dust during actual atmo-spheric processing. These include the pH (and buffer capac-ity) of the aerosol and the acid exposure time [i.e., Mackieet al., 2005], or the heterogeneity of Fe‐containing andCa‐containing dust particles and their affinity to differentacidic gases [i.e., Sullivan et al., 2007; Shi et al., 2008]. Suchmodels also need to take account of the presence and con-centration of organic ligands, possible photoreduction[Siefert et al., 1994; Cornell and Schwertmann, 2003; Fuet al., 2010], and the kinetics of Fe dissolution at differentatmospheric conditions.[57] In summary, we have established in this paper that it is
inappropriate to estimate the Fe solubility in a dust sampleaccording to its content of Fe oxides and clayminerals and thesolubilities of standard minerals; we showed that chemicalweathering and Fe oxides aging processes in the dust sourceregions led to a significant regional variability in the chemicaland mineralogical compositions of the dust samples in NorthAfrica, which controlled the potential of Fe to be solubilizedduring simulated atmospheric processing.
Notation
FeA poorly crystalline or nanoparticulate Fe, extractableby ascorbate solution (mg Fe g−1 sample).
FeD oxide Fe, mainly goethite and hematite, extractableby citrate‐buffered dithionite solution (mg Fe g−1
sample).FeT total Fe, determined byX‐ray Fluorescence (mg Fe g−1
sample).Fes soluble Fe after simulated atmospheric processing
(mg Fe g−1 sample).Fepsol potential Fe solubility, equals to Fes /FeT*100.
[58] Acknowledgments. This work was supported by NERC(NE/E011470/1, PI: M. D. Krom). S. Bonneville and L. G. Benning thankNERC for financial support (NE/C004566/1; PI: L. G. Benning). C. Bristowthanks the Royal Geographical Society and the Gilchrist Educational Trustfor supporting BoDEx and sample collection within the Bodélé Depression,Chad. Two anonymous reviewers are greatly thanked for their constructiveand detailed review comments. Jose Torrent at Departamento de Cienciasy Recursos Agrícolas y Forestales Universidad de Córdoba, Spain, wasacknowledged for his help in DRS analysis. N. Hanan from Colorado StateUniversity provided soil samples from Mali. J. Ratnam and B. Brooks fromUniversity of Leeds (UoL) helped to collect the Mali and Sahel samples.R. Mortimer, S. Shaw, H. P. Vu, A. Xylouri, L. Brinza, J. D. RodriguezBlanco, and R. Raiswell at School of Earth and Environment and M. Ward,
R. Walshaw, and J. Harrington at LEMSC of UoL are acknowledged fortheir comments or technical help. L. Shao and W. Li at China Universityof Mining and Technology collected the Beijing dust sample. A. Nenesand P. Kumar from Georgia Institute of Technology are acknowledged forproviding the kaolinite standard.
ReferencesAnand, R. R., and R. J. Gilkes (1987), Variations in the properties of ironoxides within individual specimens of lateritic duricrust, Aust. J. SoilRes., 25, 287–302, doi:10.1071/SR9870287.
Arduino, E., E. Barberis, F. Carraro, and M. G. Forno (1984), Estimatingrelative ages from iron‐oxide/total‐iron ratios of soils in the western PoValley, Italy, Geoderma, 33, 39–52, doi:10.1016/0016-7061(84)90088-0.
Arimoto, R., W. Balsam, and C. Schloesslin (2002), Visible spectroscopyof aerosol particles collected on filters: Iron‐oxide minerals, Atmos.Environ., 36, 89–96, doi:10.1016/S1352-2310(01)00465-4.
Avila, A., I. Queralt‐Mitjans, and A. Alrcona (1997), Mineralogical com-position of African dust delivered by red rains over northeastern Spain,J. Geophys. Res., 102(D18), 21,977–21,996, doi:10.1029/97JD00485.
Baker, A. R., and P. L. Croot (2010), Atmospheric and marine controls onaerosol iron solubility in seawater,Mar. Chem., 120, 4–13, doi:10.1016/j.marchem.2008.09.003.
Baker, A. R., T. D. Jickells, M. Witt, and K. L. Linge (2006), Trends inthe solubility of iron, aluminium, manganese and phosphorus in aerosolcollected over the Atlantic Ocean, Mar. Chem., 98, 43–58, doi:10.1016/j.marchem.2005.06.004.
Boyd, P. W., et al. (2007), Mesoscale iron enrichment experiments1993–2005: Synthesis and future directions, Science, 315, 612–617,doi:10.1126/science.1131669.
Bristow, C., N. A. Drake, and S. Armitage (2009), Deflation in the dustiestplace on Earth: The Bodélé Depression, Chad, Geomorphology, 105,50–58, doi:10.1016/j.geomorph.2007.12.014.
Brooks, N., and M. Legrand (2000), Dust variability over northern Africaand rainfall in the Sahel, in Linking Climate Change to Land SurfaceChange, edited by S. McLaren, pp. 1–26, D. Kniveton Kluwer Acad.,Dordrecht.
Cornell, R. M., and U. Schwertmann (2003), The Iron Oxides: Structure,Properties, Reactions, Occurrence and Uses, Wiley‐VCH, New York.
Costantini, E. A. C., S. Lessovaia, and Y. Vodyanitskii (2006), Using theanalysis of iron and iron oxides in paleosols (TEM, geochemistry andiron forms) for the assessment of present and past pedogenesis, Quat.Int., 156–157, 200–211, doi:10.1016/j.quaint.2006.05.008.
Cwiertny, D. M., J. Baltrusaitis, G. J. Hunter, A. Laskin, M. M. Scherer,and V. H. Grassian (2008a), Characterization and acid‐mobilizationstudy of iron‐containing mineral dust source materials, J. Geophys.Res., 113, D05202, doi:10.1029/2007JD009332.
Cwiertny, D. M., R. M. Handler, M. V. Schaefer, V. H. Grassian, andM. M. Scherer (2008b), Interpreting nanoscale size‐effects in aggregatedFe‐oxide suspensions: Reaction of Fe(II) with Goethite, Geochim.Cosmochim. Acta, 72, 1365–1380, doi:10.1016/j.gca.2007.12.018.
Desboeufs, K. V., A. Sofikitis, R. Losno, J. L. Colin, and P. Ausset (2005),Dissolution and solubility of trace metals from natural and anthropogenicaerosol particulate matter, Chemosphere, 58, 195–203, doi:10.1016/j.chemosphere.2004.02.025.
Drake, N. A., A. S. El‐Hawat, P. Turner, S. J. Armitage, M. J. Salem, K. H.White, and S. McLaren (2008), Palaeohydrology of the Fazzan Basin andsurrounding regions: The last 7 million years, Palaeogeogr. Palaeo-climatol. Palaeoecol., 263, 131–145, doi:10.1016/j.palaeo.2008.02.005.
Egli, M., P. Fitze, and A. Mirabella (2001), Weathering and evolution ofsoils formed on granitic, glacial deposits: Results from chronosequencesof Swiss alpine environments, Catena, 45, 19–47, doi:10.1016/S0341-8162(01)00138-2.
Fan, S.‐M., W. J. Moxim, and H. Levy II (2006), Aeolian input of bioavail-able iron to the ocean, Geophys. Res. Lett., 33, L07602, doi:10.1029/2005GL024852.
Fontes, M. R., S. B. Weed, and L. H. Bowen (1992), Association of micro-crystalline goethite and humic acid in some oxisols fromBrazil, Soil Sci. Soc.Am. J., 56, 982–990, doi:10.2136/sssaj1992.03615995005600030050x.
Formenti, P., et al. (2008), Regional variability of the composition of min-eral dust from western Africa: Results from the AMMA SOP0/DABEXand DODO field campaigns, J. Geophys. Res., 113 , D00C13,doi:10.1029/2008JD009903.
Fu, H., D. M. Cwiertny, G. R. Carmichael, M. M. Scherer, and V. H.Grassian (2010), Photoreductive dissolution of Fe‐containing mineraldust particles in acidic media, J. Geophys. Res., 115, D11304,doi:10.1029/2009JD012702.
SHI ET AL.: WEATHERING AND DUST Fe SOLUBILITY GB2010GB2010
12 of 14
Hand, J. L., N. M. Mahowald, Y. Chen, R. L. Siefert, C. Luo,A. Subramaniam, and I. Fung (2004), Estimates of atmospheric‐processed soluble iron from observations and a global mineral aerosolmodel: Biogeochemical implications, J. Geophys. Res., 109, D17205,doi:10.1029/2004JD004574.
Hegg, D. A., S. Gao, and H. Jonsson (2002), Measurements of selecteddicarboxylic acids in marine cloud water, Atmos. Res., 62, 1–10,doi:10.1016/S0169-8095(02)00023-6.
Hyacinthe, C., S. Bonneville, and P. Van Cappellen (2006), ReactiveIron (III) in sediments: Chemical versus microbial extractions, Geochim.Cosmochim. Acta, 70, 4166–4180, doi:10.1016/j.gca.2006.05.018.
Ito, A., and Y. Feng (2010), Role of dust alkalinity in acid mobilizationof iron, Atmos. Chem. Phys. Discuss., 10, 10,399–10,428, doi:10.5194/acpd-10-10399-2010.
Jickells, T. D., et al. (2005), Global iron connections between desert dust,ocean biogeochemistry, and Climate, Science, 308, 67–71, doi:10.1126/science.1105959.
Journet, E., K. V. Desboeufs, S. Caquineau, and J.‐L. Colin (2008),Mineralogy as a critical factor of dust iron solubility, Geophys. Res. Lett.,35, L07805, doi:10.1029/2007GL031589.
Kampf, N., and U. Schwertmann (1983), Goethite and hematite in a climo-sequence in southern Brazil and their application in classification ofkaolinitic soils, Geoderma, 29, 27–39, doi:10.1016/0016-7061(83)90028-9.
Keene, W. C., A. A. P. Pszenny, J. R. Maben, and R. Sander (2002), Var-iation of marine aerosol acidity with particle size, Geophys. Res. Lett.,29(7), 1101, doi:10.1029/2001GL013881.
Kostka, J. E., and G. W. Luther III (1994), Partitioning and speciation ofsolid phase iron in saltmarsh sediments, Geochim. Cosmochim. Acta,58, 1701–1710, doi:10.1016/0016-7037(94)90531-2.
Lafon, S., J. L. Rajot, S. C. Alfaro, and A. Gaudichet (2004), Quantificationof iron oxides in desert aerosol, Atmos. Environ., 38, 1211–1218,doi:10.1016/j.atmosenv.2003.11.006.
Lafon, S., I. N. Sokolik, J. L. Rajot, S. Caquineau, and A. Gaudichet(2006), Characterization of iron oxides in mineral dust aerosols: Implica-tions for light absorption, J. Geophys. Res., 111, D21207, doi:10.1029/2005JD007016.
Lair, G. J., F. Zehetner, M. Hrachowitz, N. Franz, F. J. Maringer, and M. H.Gerzabek (2009), Dating of soil layers in a young floodplain using ironoxide crystallinity, Quat. Geochronol., 4, 260–266, doi:10.1016/j.quageo.2008.11.003.
Lazaro, F. J., L. Gutierrez, V. Barron, and M. D. Gelado (2008), The spe-ciation of iron in desert dust collected in Gran Canaria (Canary Islands):Combined chemical, magnetic and optical analysis, Atmos. Environ., 42,8987–8996, doi:10.1016/j.atmosenv.2008.09.035.
Leigh, D. S. (1996), Soil chronosequence of Brasstown Creek, Blued RidgeMountains, USA, Catena, 26, 99–114, doi:10.1016/0341-8162(95)00040-2.
Luo, C., N. M. Mahowald, N. Meskhidze, Y. Chen, R. L. Siefert, A. R.Baker, and A. M. Johansen (2005), Estimation of iron solubility fromobservations and a global aerosol model, J. Geophys. Res., 110,D23307, doi:10.1029/2005JD006059.
Mackie, D. S., P. W. Boyd, K. A. Hunter, and G. H. McTainsh (2005),Simulating the cloud processing of iron in Australian dust: PH and dustconcentration, Geophys. Res. Lett., 32 , L06809, doi:10.1029/2004GL022122.
Mahowald, N. M., A. R. Baker, G. Bergametti, N. Brooks, R. A. Duce,T. D. Jickells, N. Kubilay, J. M. Prospero, and I. Tegen (2005), Atmo-spheric global dust cycle and iron inputs to the ocean, Global Biogeo-chem. Cycles, 19, GB4025, doi:10.1029/2004GB002402.
McFadden, I. D., and D. M. Hendricks (1985), Changes in the content andcomposition of pedogenic iron oxyhydroxides in a chronosequence ofsoils in southern California, Quat. Res., 23, 189–204, doi:10.1016/0033-5894(85)90028-6.
McLennan, S. M. (1993), Weathering and global denudation, J. Geol., 101,295–303, doi:10.1086/648222.
Meskhidze, N., W. L. Chameides, A. Nenes, and G. Chen (2003), Ironmobilization in mineral dust: Can anthropogenic SO2 emissions affectocean productivity?, Geophys. Res. Lett., 30(21), 2085, doi:10.1029/2003GL018035.
Meskhidze, N., W. L. Chameides, and A. Nenes (2005), Dust and pollu-tion: A recipe for enhanced ocean fertilization?, J. Geophys. Res., 110,D03301, doi:10.1029/2004JD005082.
Meunier, A., and B. Velde (2004), Illite: Origins, Evolution, and Metamor-phism, Springer, Berlin.
Mills, M. M., C. Ridame, M. Davey, J. La Roche, and R. J. Geider (2004),Iron and phosphorus co‐limit nitrogen fixation in the eastern tropicalNorth Atlantic, Nature, 429, 292–294, doi:10.1038/nature02550.
Moore, C. M., et al. (2009), Large‐scale distribution of Atlantic nitrogenfixation controlled by iron availability, Nat. Geosci., 2, 867–871,doi:10.1038/ngeo667.
Moreno, T., et al. (2006), Geochemical variations in Aeolian mineral par-ticles from the Sahara‐Sahel dust corridor, Chemosphere, 65, 261–270,doi:10.1016/j.chemosphere.2006.02.052.
Nesbitt, H. W., and G. M. Young (1982), Early Proterozoic climates andplate motions inferred from major element chemistry of lutites, Nature,299, 715–717, doi:10.1038/299715a0.
Parker, A. (1970), An index of weathering for silicate rocks, Geol. Mag.,107, 501–504, doi:10.1017/S0016756800058581.
Poulton, S. W., and D. E. Canfield (2005), Development of a sequentialextraction procedure for iron: Implications for iron partitioning in conti-nentally derived particulates, Chem. Geol., 214, 209–221, doi:10.1016/j.chemgeo.2004.09.003.
Price, J. R., and M. A. Velbel (2003), Chemical weathering indices appliedto weathering profiles developed on heterogeneous felsic metamorphicparent rocks, Chem. Geol., 202, 397–416, doi:10.1016/j.chemgeo.2002.11.001.
Prospero, J. M., P. Ginoux, O. Torres, S. E. Nicholson, and T. E. Gill(2002), Environmental characterization of global sources of atmosphericsoil dust dandified with the NIMBUS 7 Total Ozone Mapping Spectrom-eter (TOMS) absorbing aerosol product, Rev. Geophys., 40(1), 1002,doi:10.1029/2000RG000095.
Pruppacher, H. R., and R. Jaenicke (1995), The processing of water vaporand aerosols by atmospheric clouds, a global estimate, Atmos. Res., 38,283–295, doi:10.1016/0169-8095(94)00098-X.
Raiswell, R., L. G. Benning, M. Tranter, and S. Tulaczyk (2008), Bioavail-able iron in the Southern Ocean: The significance of the iceberg conveyorbelt, Geochem. Trans., 9, 7, 9 pp., doi:10.1.1186/1467-4866-9-7.
Reyes, I., and J. Torrent (1997), Citrate‐ascorbate as a highly selectiveextractant for poorly crystalline iron oxides, Soil Sci. Soc. Am. J., 61,1647–1654, doi:10.2136/sssaj1997.03615995006100060015x.
Schroth, A. W., J. Crusius, E. R. Sholkovitz, and B. C. Bostick (2009), Ironsolubility driven by speciation in dust sources to the ocean, Nat. Geosci.,2, 337–340, doi:10.1038/ngeo501.
Schwertmann, U. (1991), Solubility and dissolution of iron oxides, PlantSoil, 130, 1–25, doi:10.1007/BF00011851.
Schwertmann, U., and M. Latham (1986), Properties of iron oxides in someNew Caledonien soils, Geoderma, 39, 105–123, doi:10.1016/0016-7061(86)90070-4.
Shao, L., W. Li, Z. Xiao, and Z. Sun (2008), The mineralogy and possiblesources of spring dust particles over Beijing, Adv. Atmos. Sci., 25,395–403, doi:10.1007/s00376-008-0395-8.
Shen, Z. X., J. J. Cao, X. Y. Zhang, R. Arimoto, J. F. Ji, W. L. Balsam,Y. Q. Wang, R. J. Zhang, and X. X. Li (2006), Spectroscopic analysisof iron‐oxide minerals in aerosol particles from northern China, Sci.Total Environ., 367, 899–907, doi:10.1016/j.scitotenv.2006.01.003.
Shi, Z., L. Shao, T. P. Jones, and S. Lu (2005), Microscopy and mineralogyof airborne particles collected during severe dust storm episodes inBeijing, China, J. Geophys. Res., 110, D01303, doi:10.1029/2004JD005073.
Shi, Z., D. Zhang, M. Hayashi, H. Ogata, H. Ji, and W. Fujiie (2008),Influences of sulfate and nitrate on the hygroscopic behaviors of coarsedust particles, Atmos. Environ., 42, 822–827, doi:10.1016/j.atmosenv.2007.10.037.
Shi, Z., M. D. Krom, S. Bonneville, A. R. Baker, T. D. Jickells, and L. G.Benning (2009), Formation of iron nanoparticles and increase in ironreactivity in the mineral dust during simulated cloud processing, Environ.Sci. Technol., 43, 6592–6596, doi:10.1021/es901294g.
Siefert, R. L., S. O. Pehkonen, Y. Erel, and M. R. Hoffmann (1994),Iron photochemistry of aqueous suspensions of ambient aerosol withadded organic‐acids, Geochim. Cosmochim. Acta, 58(15), 3271–3279,doi:10.1016/0016-7037(94)90055-8.
Solmon, F., P. Y. Chuang, N. Meskhidze, and Y. Chen (2009), Acidicprocessing of mineral dust iron by anthropogenic compounds over theNorth Pacific Ocean, J. Geophys. Res., 114, D02305, doi:10.1029/2008JD010417.
Spokes, J. L., T. D. Jickells, and B. Lim (1994), Solubilisation of aerosoltrace metals by cloud processing: A laboratory study, Geochim. Cosmo-chim. Acta, 58, 3281–3287, doi:10.1016/0016-7037(94)90056-6.
Straub, D. J., T. Lee, and J. L. Collett Jr. (2007), Chemical composition ofmarine stratocumulus clouds over the eastern Pacific Ocean, J. Geophys.Res., 112, D04307, doi:10.1029/2006JD007439.
Sullivan, R. C., S. A. Guazzotti, D. A. Sodeman, and K. A. Prather (2007),Direct observations of the atmospheric processing of Asian mineral dust,Atmos. Chem. Phys., 7, 1213–1236, doi:10.5194/acp-7-1213-2007.
Tegen, I., S. P. Harrison, K. Kohfeld, I. C. Prentice, M. Coe, andM. Heimann (2002), Impact of vegetation and preferential source areas
SHI ET AL.: WEATHERING AND DUST Fe SOLUBILITY GB2010GB2010
13 of 14
on global dust aerosol: Results from a model study, J. Geophys. Res.,107(D21), 4576, doi:10.1029/2001JD000963.
Thompson, A., O. A. Chadwich, G. G. Rancourt, and J. Chorover (2006),Iron‐oxide crystallinity increases during soil redox oscillations, Geochim.Cosmochim. Acta, 70, 1710–1727, doi:10.1016/j.gca.2005.12.005.
Torrent, J., U. Schwertmann, and D. G. Schulze (1980), Iron oxide miner-alogy of some soils of two river terrace sequences in Spain, Geoderma,23, 191–208, doi:10.1016/0016-7061(80)90002-6.
Torrent, J., Q. Liu, J. Bloemendal, and V. Barron (2007), Magneticenhancement and iron oxides in the upper Luochuan loess‐paleosolsequence, Chinese Loess plateau, Soil Sci. Soc. Am. J., 71, 1570–1578,doi:10.2136/sssaj2006.0328.
Uno, I., et al. (2009), Asian dust transported one full circuit around theglobe, Nat. Geosci., 2, 557–560, doi:10.1038/ngeo583.
Varjo, E., A. Liikanen, V.‐P. Salonen, and P. J. Martikainen (2003), A newgypsum‐based technique to reduce methane and phophorus release fromsediments of eutrophied lakes: (Gypsum treatment to reduce internalloading), Water Res., 37, 1–10, doi:10.1016/S0043-1354(02)00264-6.
Viollier, E., P. W. Inglett, K. Hunter, A. N. Roychoudhury, and P. VanCappellen (2000), The ferrozine method revisited: Fe(II)/Fe(III) determi-nation in natural waters, Appl. Geochem., 15, 785–790, doi:10.1016/S0883-2927(99)00097-9.
Washington, R., C. Bouet, G. Cautenet, E. Mackenzie, I. Ashpole,S. Engelstaedter, G. Lizcano, G. M. Henerson, K. Schepanski, and
I. Tegen (2009), Dust as a tipping element: The Bodèlè Depression,Chad, Proc. Natl. Acad. Sci., 106(49), 20,564–20,571, doi:10.1073/pnas.0711850106.
Zhu, X., J. M. Prospero, F. J. Millero, D. L. Savoie, and G. W. Brass(1992), The solubility of ferric ion in marine mineral aerosol solutionsat ambient relative humidities, Mar. Chem., 38, 91–107, doi:10.1016/0304-4203(92)90069-M.
A. R. Baker and T. Jickells, School of Environmental Sciences,University of East Anglia, Norwich NR4 7TJ, UK.L. G. Benning, S. Bonneville, M. D. Krom, and Z. Shi, Earth and
Biosphere Institute, School of Earth and Environment, University ofLeeds, Woodhouse Lane, Leeds LS2 9JT, UK. ([email protected])C. Bristow, Department of Earth and Planetary Sciences, Birkbeck
College, University of London, Malet Street, Bloomsbury, LondonWC1E 7HX, UK.K. Carslaw, G. Mann, and J. B. McQuaid, Institute of Climate and
Atmospheric Sciences, School of Earth and Environment, University ofLeeds, Maths/Earth and Environment Building, Leeds LS2 9JT, UK.N. Drake, Department of Geography, King’s College London, Fourth
Floor, Strand Campus, London WC2R 2LS, UK.
SHI ET AL.: WEATHERING AND DUST Fe SOLUBILITY GB2010GB2010
14 of 14
Copyright © 2022 FDOKUMEN