Muscle-Derived Collagen XIII Regulates Maturation of the Skeletal Neuromuscular Junction
Upload
khangminh22Category
view
2download
0
The effects of mechanical stretch on the immunological and anti-
inflammatory properties of skeletal muscle cells: An in vitro study of
potential mechanisms that affect response to exercise therapy
Thesis submitted for the degree of
Doctor of Philosophy
at the University of Leicester
by
Ziyad Mohammed Aldosari
Department of Infection, Immunity and Inflammation
College of Life Sciences
School of Medicine
University of Leicester
2020

i
The effects of mechanical stretch on the immunological and anti-inflammatory
properties of skeletal muscle cells: An in vitro study of potential mechanisms that affect
response to exercise therapy
Ziyad Mohammed Aldosari
Abstract
The contraction of skeletal muscle during exercise that occurs in the absence of muscle damage
has been demonstrated to yield a significant increase in the release of potentially anti-
inflammatory myokine interleukin-6 (IL-6). Increased generation of IL-6 may be valuable in
managing inflammatory states, such as chronic kidney disease (CKD). However, the IL-6
output of CKD patients during muscular exercise may be unusually weak, due to factors such
as metabolic acidosis.
In CKD, physical exertion has been reported to lower levels of amino acids in muscles in vivo.
This effect may be attributable to uraemic metabolic acidosis and exercise-induced acidosis
impairing mitogen-activated protein kinases (MAPKs) such as p38, which normally activate
the amino acid transporter SNAT2. The SNAT2 transporter protein is also known to be directly
and rapidly inhibited by low pH. The resulting intracellular amino acid depletion could, in turn,
result in inhibited protein synthesis, and hence reduced production of IL-6.
This study sought to test the following hypotheses: (1) higher levels of IL-6 expression occur
in mechanically stressed skeletal muscle cells following in vitro mechanical stretch, arising
from the activation of MAPKs, followed by activation of SNAT2; and (2) low pH blocks this
process.
Experiments on L6 rat skeletal muscle cells showed that drug inhibition of MAPKs inhibited
SNAT2 transport activity, confirming that MAPKs play a role in the regulation of SNAT2 and,
by extension, in the availability of amino acids for protein synthesis.
Interestingly, while P-p38 and P-JNK activation significantly increased after cyclic stretching
of 1-10 minutes duration, SNAT2 activity significantly increased only transiently i.e. after
periods of stretching lasting 1 minute, suggesting that this transporter may paradoxically be
inhibited by prolonged stretching. In addition, mRNA of IL-6 was increased after 30 minutes
of intermittent stretching and, (as previously reported elsewhere) by 6 hours of Ca2+ loading of
the cells with ionomycin which activates p38.
The siRNA silencing of SNAT2 in L6 myoblasts decreased gene expression of the mRNA of
IL-6, suggesting that SNAT2 can influence IL-6 expression. As SNAT2 and MAPKs,
particularly p38 and JNK, are inhibited at low pH, it would be predicted that low pH (pH 7.1)
would decrease IL-6 expression. However, both with and without ionomycin, low pH failed to
decrease IL-6 mRNA; indeed with ionomycin low pH strongly activated IL-6 expression.

ii
It is concluded that even though the acidosis-sensing amino acid transporter SNAT2 may play
some role in regulating IL-6 expression (as previously hypothesised), a distinct and novel
stimulatory effect of low pH over-rides this and maybe a more important regulator of IL-6
expression in L6 skeletal muscle cells.

iii
Acknowledgments
I would like to express my profound appreciation to my supervisors, Dr Alan Bevington and
Dr Emma Watson, for their help and support throughout the entirety of my PhD. My sincere
thanks to Dr Bevington for his encouragement and constant support. It was a pleasure and an
honour to be mentored by such a remarkable scientist. Dr Watson has always been available to
provide support and useful insights, for which I am eternally grateful. I would also like to
express my gratitude to the members of my progress review panel, Professor Jonathan Barratt
and Professor James Burton, for their invaluable advice and guidance in our annual meetings.
I would like extend my gratitude and heartfelt appreciation to Mr Jeremy Brown for his
assistance during my PhD. When I started my PhD, he trained me in the techniques that I used
in early experiments and he was very cooperative and extremely helpful. My sincere thanks to
Dr Nima Abbasian and Dr Ravinder Chana for assistance with the mycoplasma screening
testing of L6 cells. I would like to thank Professor Gary Willars and Mr Heider Qassam for
their support, their assistance with the calcium experiments, and for graciously allowing access
to their lab equipment. My thanks to Dr Jonathon Willets for his help and for giving access to
his Flexercell Strain Unit (FX-4000) machine for the purpose of stretching L6 cells. My
profound thanks also to Dr Alan Bevington for his help with the experiments presented in
Figures 3.6, 3.1B and 3.2B. My sincere gratitude to BSc project student Mr Toramaru
Sugawara who performed (under my supervision) the 5 minute stretching experiments that
contributed to the data displayed in Figures 4.3A, 4.5A and 4.6.
Very special thanks to the people in the renal lab for all of their help and support, and for
helping to create a positive, healthy environment inside the lab: Safia Balbas, Violeta Diez
Beltran, Abdullah Alruwaili, Douglas Gould, Tom O'Sullivan, Patricia Higgins, Katherine
Robinson, Soteris Xenophontos, and Luke Baker.
I would like to thank Shaqra University for supporting my studies in the UK.
I would like to take this opportunity to thank all my family members and friends for their
support. I would like to thank my mother and father for their unceasing help and for providing
enormous and invaluable emotional support.
I would like to express my deepest gratitude towards my children, Rawan, Mohammed and
Deena, for their emotional support, for making me happy and for being my sanctuary every
time I returned home from the lab.
Finally, I wish to express my deepest thanks to my wife, Rana, for her encouragement and
unending support along every step of the way. I could not have completed this PhD without
her.

iv
Table of contents
Abstract .................................................................................................................................................... i
Acknowledgments .................................................................................................................................. iii
Table of contents ................................................................................................................................... iv
List of figures ........................................................................................................................................ viii
List of tables ............................................................................................................................................ x
List of abbreviations ............................................................................................................................... xi
Chapter 1 General introduction .............................................................................................................. 1
1.1 Overview ................................................................................................................................. 1
1.2 Protein energy wasting ................................................................................................................. 2
1.3 Physical exercise and chronic inflammation ................................................................................. 3
1.4 Effect of exercise training on chronic inflammation ..................................................................... 6
1.5 Direct evidence for anti-inflammatory effects of physical exercise ............................................. 6
1.6 Skeletal muscle as an endocrine organ ......................................................................................... 7
1.7 The biosynthesis of IL-6................................................................................................................. 9
1.7.1 Transcriptional regulation of IL-6 ........................................................................................... 9
1.7.2 Protein synthesis .................................................................................................................. 10
1.8 Mammalian target of rapamycin (mTOR) ................................................................................... 12
1.9 The SNAT2 amino acid transporter ............................................................................................. 14
1.10 Mechanotransduction ............................................................................................................... 17
1.11 The effect of mechanical stress on MAP kinases and System A / SNAT2 ................................. 22
1.12 Mitogen-activated protein kinases (MAPKs) ............................................................................ 22
1.12.1 ERKs .................................................................................................................................... 23
1.12.2 JNKs .................................................................................................................................... 23
1.12.3 p38 isoforms ...................................................................................................................... 24
1.13 In vitro cell stretching ................................................................................................................ 25
1.14 The choice of the in vitro model of skeletal muscle used in this project .................................. 28
1.15 Hypothesis ................................................................................................................................. 29
Chapter 2: Materials and Methods ....................................................................................................... 32
2.1 General materials and reagents .................................................................................................. 32
2.2 Cell culture models ..................................................................................................................... 32
2.2.1 L6 cells .................................................................................................................................. 32
2.2.2 Screening cultures for mycoplasma contamination ............................................................ 32
2.2.3 L6-cells, maintenance and passaging ................................................................................... 33

v
2.2.4 Preparing L6 myoblasts for experiments ............................................................................. 34
2.2.5 L6-myotube formation ......................................................................................................... 34
2.3 Passive continuous stretch technique ........................................................................................ 35
2.4 Cyclic stretch by vacuum suction – the “pull” technique ........................................................... 36
2.5 Cyclic stretch by motor-driven pistons – the “push” technique ................................................. 38
2.6 Medium for experimental incubations ....................................................................................... 40
2.7 Protein assays ............................................................................................................................. 41
2.7.1 Lowry Protein Assay ............................................................................................................. 41
2.7.2 Bio-Rad detergent-compatible (DC) protein assay .............................................................. 41
2.8 Enzyme-linked Immunosorbent assay (ELISA) for IL-6 ................................................................ 42
2.9 Creatine phosphokinase activity ................................................................................................. 42
2.10 Transport activity assay (14C MeAIB uptake measurement) ..................................................... 43
2.10.1 Preparation of cell lysates for counting the radio-activity ................................................ 44
2.11 Measuring 14C-urea as an intracellular water space marker .................................................... 44
2.12 Sodium Dodecyl Sulphate Polyacrylamide Gel Electrophoresis (SDS-PAGE) ............................ 45
2.12.1 Preparing the samples for SDS-PAGE ................................................................................. 45
2.12.2 Running the gel .................................................................................................................. 45
2.12.3 Immunoblotting ................................................................................................................. 45
2.12.4 Quantification and data analysis ........................................................................................ 46
2.13 RNA techniques ......................................................................................................................... 48
2.13.1 RNA extraction ................................................................................................................... 48
2.13.2 Reverse transcription ......................................................................................................... 48
2.13.3 Real time qPCR for detailed studies of IL6 and SNAT2 mRNA expression using Taqman
assays ............................................................................................................................................ 50
2.13.4 SNAT2 silencing in L6 myoblasts with small interfering RNAs (siRNAs)............................. 51
2.14 Measurement of intracellular Ca2+ using Fluo-4 fluorescence ................................................ 52
2.15 Statistical analysis ..................................................................................................................... 53
Chapter 3 Regulation of MAPK activation in L6 cells ............................................................................ 54
3.1 Introduction ................................................................................................................................ 54
3.2 Results ......................................................................................................................................... 55
3.2.1 Dependence of System A / SNAT2 transporter activity in L6-G8C5 cells on MAP kinase
activity ........................................................................................................................................... 55
3.2.2 The effect of low pH on MAPKs in L6 Myotubes ................................................................. 58
3.2.3 The role of JNK in the inhibition of System A by low pH ..................................................... 61
3.2.4 The role of cell swelling ........................................................................................................ 62

vi
3.2.5 The acute effect of cyclic stretching on the phosphorylation of MAPKs in L6-G8C5
myotubes ...................................................................................................................................... 64
3.3 Discussion .................................................................................................................................... 68
3.3.1 Inhibition of MAP kinases inhibits System A / SNAT2 activity in L6-G8C5 myotubes .......... 68
3.3.2 pH sensitivity of MAP kinases .............................................................................................. 68
3.3.3 Sensing of pH by MAP kinases ............................................................................................. 69
3.4 Conclusion ................................................................................................................................... 70
Chapter 4 Characterisation of experimental systems for studying mechanical stretch effects on
System A in L6 cells ............................................................................................................................... 72
4.1 Introduction ................................................................................................................................ 72
4.2 Results ......................................................................................................................................... 73
4.2.1 Positive control for MAPK response in stretched cells ........................................................ 73
4.2.2 Monitoring of pH drift .......................................................................................................... 75
4.2.3 Effect of continuous stretching of L6-G8C5 myotubes on System A (SNAT2) amino acid
transport activity ........................................................................................................................... 75
4.2.4 The effect of cyclic stretch on the activity of System A (SNAT2) on L6-G8C5 myotubes .... 76
4.2.5 The effect of cyclic stretch on the activity of System A (SNAT2) in L6 myoblasts ............... 78
4.3 Discussion .................................................................................................................................... 81
4.3.1. The effect of stretch on System A (SNAT2) transporters .................................................... 81
4.3.2. Technical artifacts ............................................................................................................... 81
4.3.4. Rapid inactivation of the effect of stretch on System A (SNAT2) transport ....................... 82
4.3.5. Implications of this negative result ..................................................................................... 83
Chapter 5 Regulation of expression of Interleukin-6 (IL-6) in L6 cells .................................................. 84
5.1 Introduction ................................................................................................................................ 84
5.2 Results ......................................................................................................................................... 85
5.2.1 The effect of stimulation with ionomycin and p38 MAP kinase inhibition on IL-6 gene
expression in L6-G8C5 myotubes .................................................................................................. 85
5.2.2 The effect of low pH on IL-6 mRNA and protein expression in L6-G8C5 myotubes ............ 86
5.2.3 The effect of p38 inhibitor, JNK inhibitor and MeAIB on the stimulatory effect of
ionomycin on IL-6 gene expression in L6-G8C5 myotubes ........................................................... 88
5.2.4 The effect of low pH with JNK inhibitor and MeAIB on the stimulation by ionomycin of IL-6
gene expression in L6-G8C5 myotubes ......................................................................................... 90
5.2.5 Measurement of intracellular Ca2+ ..................................................................................... 91
5.2.6 The effect of siRNA silencing of SNAT2 on the stimulation of IL-6 gene expression in L6-
G8C5 myoblasts ............................................................................................................................ 93
5.2.7 A revised model for regulation of IL-6 expression ............................................................... 95
5.2.8 The effect of short periods of cyclic stretching on IL-6 mRNA expression in L6-G8C5
myotubes ...................................................................................................................................... 96

vii
5.2.9 The effect of blockade of Focal Adhesion Kinase (FAK) with selective inhibitor (PF-573228)
and p38 inhibitor (SB202190) on the effect of mechanical stretch on IL-6 expression in L6-G8C5
myotubes ...................................................................................................................................... 99
5.3 Discussion .................................................................................................................................. 102
5.3.1 Ionomycin or cyclic stretch increase expression of IL-6 mRNA but not IL-6 protein ......... 102
5.3.2 Low pH exerts an unexpected stimulatory effect on ionomycin-induced IL-6 mRNA
expression ................................................................................................................................... 102
5.3.3 Coupling between System A/SNAT2 and IL-6 expression .................................................. 103
5.3.4 A revised model for regulation of IL-6 expression in L6G8-C5 myotubes ......................... 104
5.3.5 Conclusion from the experimental work ........................................................................... 105
Chapter 6 General Discussion and Future Work ................................................................................. 106
6.1 General discussion .................................................................................................................... 106
6.1.1 The physiological significance of the findings in this thesis ............................................... 106
6.1.2 The complex relationships between MAPKs, SNAT2, IL-6 and pH ..................................... 108
6.1.3 The physiological significance of System A/SNAT2 during exercise .................................. 109
6.1.4 The role of ionomycin in IL-6 expression in vitro ............................................................... 109
6.2 Future work ............................................................................................................................... 110
6.2 Conclusion ................................................................................................................................. 112
Appendixes .......................................................................................................................................... 113
References .......................................................................................................................................... 123

viii
List of figures
Figure 1.1. The effect of IL-6 from contracting muscle in different organs. ........................................... 4
Figure 1.2. Schematic comparison of sepsis-induced verses exercise-induced increases in circulating
cytokines in plasma. ................................................................................................................................ 5
Figure 1.3. Schematic representation of the promoter region of the human interleukin-6 (IL-6) gene
showing possible cis-regulatory elements. ............................................................................................. 9
Figure 1.5. Relationship between mTORC1 activation and muscle hypertrophy. ................................ 14
Figure 1.7. Schematic diagram showing how SNAT2, mechanical stretch and MAPK activation may be
linked, and impaired by low pH, in L6-G8C5 cells. ................................................................................ 31
Figure 2.1. PCR gel electrophoresis to screen for mycoplasma contamination in cultures of L6-G8C5
cells. ...................................................................................................................................................... 33
Figure 2.2. Photographs of L6-G8C5 cells. ............................................................................................ 34
Figure 2.3. The in vitro model of continuous mechanical stretch comprising. .................................... 35
Figure 2.5. An illustration of the FX-4000 cell stretching system. ........................................................ 37
Figure 3.1. The effect of pre-incubation with MAPK inhibitors on the activity of System A
transporters in L6-G8C5 myotubes. ...................................................................................................... 56
Figure 3.2. The acute effect of MAPK inhibitors on the activity of System A transporters in L6-G8C5
myotubes. ............................................................................................................................................. 57
Figure 3.3. The effect of different pH media on p-JNK in L6-G8C5 myotubes. ..................................... 59
Figure 3.4. The effect of different pH media on p-p38 in L6-G8C5 myotubes. .................................... 60
Figure 3.5. The effect of different pH media on p-ERK-1 in L6-G8C5 myotubes. ................................. 61
Figure 3.7. Effect of 1 min or 5 min or 10 min of cyclic stretch on P-p38 activity. ............................... 65
Figure 3.8. Effect of 10 min of cyclic stretch on P-JNK activity. ............................................................ 66
Figure 3.9. Effect of 10 min of cyclic stretch on p-ERK-1/2 activity. ..................................................... 67
Figure 4.1. Effect of 5 minutes of cyclic stretch on p-p38 activity. ....................................................... 74
Figure 4.2. Images showing stable phenol red colour following 5 minutes of cyclic stretching in the
culture incubator. ................................................................................................................................. 75
Figure 4.3. Time course of the effect of passive continuous stretch on System A (SNAT2) transporter
activity in L6-G8C5 myotubes. .............................................................................................................. 76
Figure 4.4. Time course of the effect of vacuum-induced cyclic stretch on System A (SNAT2) transport
activity in L6-G8C5 myotubes. .............................................................................................................. 77
Figure 4.5. Time course of the effect of cyclic stretch induced by mechanical pushing on System A
(SNAT2) transport activity in L6-G8C5 myotubes. ................................................................................ 78
Figure 4.6. Time course of the effect of vacuum-induced cyclic stretch on System A (SNAT2) transport
activity in L6-G8C5 myoblasts. .............................................................................................................. 79
Figure 4.7. Effect of 1 hour of cyclic vacuum-induced stretch and 1 hour of post-stretch incubation
on System A (SNAT2) transport activity in L6-G8C5 myoblasts. ........................................................... 80
Figure 5.1. The effect of ionomycin and p38 MAP kinase inhibition on IL-6 gene expression in L6-
G8C5 myotubes and myoblasts. ........................................................................................................... 86
Figure 5.2. The effect of low pH on the stimulation by ionomycin of IL-6 gene expression in L6-G8C5
myotubes. ............................................................................................................................................. 87
Figure 5.3. The effect of low pH and of ionomycin on IL-6 protein secretion in L6-G8C5 myotubes. . 88
Figure 5.4. The effect of JNK inhibition and MeAIB on the stimulation by ionomycin of IL-6 gene
expression in L6-G8C5 myotubes. ......................................................................................................... 89
Figure 5.5. The effect of JNK inhibition and MeAIB on the stimulatory effect of low pH and ionomycin
on IL-6 gene expression in L6-G8C5 myotubes. .................................................................................... 90
ix
Figure 5.6. The effect of pH and MeAIB with or without ionomycin on intracellular calcium levels of
L6 myoblasts. ........................................................................................................................................ 92
Figure 5.7. Testing the effect of anti-SNAT2 siRNA reagent on SNAT2 mRNA expression. .................. 94
Figure 5.8. Effect SNAT2 silencing on the expression of IL-6 mRNA in absence of ionomycin. ............ 95
Figure 5.9. Effect of 30 minutes of cyclic stretch on the expression of IL-6 mRNA. ............................. 97
Figure 5.10. Effect of 30 minutes of cyclic stretch on the secretion of IL-6 protein. ............................ 98
Figure 5.11. The effect of 30 minutes of cyclic stretch on creatine phosphokinase (CPK) released into
the medium from L6-G8C5 myotubes. ................................................................................................. 99
Figure 5.12. Testing the effectiveness of FAK inhibitor (PF-573228) on phosphorylation of phospho-
FAK (Tyr576/577) in L6-G8C5 myotubes. ............................................................................................ 100
Figure 5.13. The effect of blockade of Focal Adhesion Kinase (FAK) with selective inhibitor (PF-
573228) and p38 inhibitor (SB202190) on the effect of mechanical stretch on IL-6 Expression in L6-
G8C5 myotubes. .................................................................................................................................. 101
Figure 5.14. Schematic diagram showing pathways investigated in this chapter that may contribute
to increased IL-6 mRNA expression in L6-G8C5 cells. ......................................................................... 104
Figure 6.1 The 2002 model proposed for the transcriptional regulation of IL-6 in skeletal muscle in
Febbraio, MA and Pedersen, BK (Febbraio and Pedersen, 2002). ...................................................... 106

x
List of tables
Table 2.1 Details of antibodies .............................................................................................................. 47
Table 2.2 RT- Reaction .......................................................................................................................... 49
Table 2.3 Real time qPCR thermal cycle ............................................................................................... 50
Table 2.4. siRNA transfection mixture for L6 transfection. .................................................................. 52

xi
List of abbreviations
IL-6 Interleukin-6
CKD Chronic Kidney Disease
MAPKs Mitogen-activated protein kinases
SNAT2 Sodium-coupled neutral amino acid transporter
PEW Protein Energy Wasting
ESRD End-Stage Renal Disease
GFR Glomerular filtration rate
ATP Adenosine triphosphate
PI3K Phosphoinositide 3-kinase
IGF1 Insulin-like Growth Factor-1
ERK Extracellular Signal-Regulated Kinase
JNK c-Jun NH2-terminal kinase
IRS-1 Insulin receptor substrate-1
AKT Protein kinase B (PKB)
WHO World Health Organization
CRP C-reactive protein
IL-1 Interleukin-1
TNF-α Tumor necrosis factor alpha
IL-1ra IL-1 receptor antagonist
IL-10 Interleukin-10
CRF Cardiorespiratory fitness
COPD Chronic obstructive pulmonary disease
CVD Cardiovascular disease
AMPK AMP-activated protein kinase
4E-BP1 Eukaryotic translation initiation factor 4E binding protein 1
mTOR Mechanistic or mammalian target of rapamycin
DFBS Dialysed foetal bovine serum
DMEM Dulbecco's Modified Eagle’s Medium
DMSO Dimethyl sulfoxide
HBS Hepes Buffered Saline

xii
HBSS Hanks’ Balanced Salt Solution
HIA-FBS Heat inactivated foetal bovine serum
MeAIB Methylaminoisobutyric acid
MEM Minimum Essential Medium
PIP2 Phosphatidylinositol 4,5-Biphosphate
TSC Tuberous sclerosis complex proteins
FAK Focal adhesion kinase
EIMD Exercise-induced muscle damage
ELISA Enzyme-linked Immunosorbent assay
CPK Creatine phosphokinase
PSS Physiological Salt Solution

1
Chapter 1 General introduction
1.1 Overview
Chronic kidney disease (CKD) patients suffer from complications resulting from the defect in
their kidney functions, one of which is metabolic acidosis, which arises as a result of the
accumulation of acid in blood and tissue interstitial fluid, resulting in a low pH (Raphael, 2018).
CKD, acidosis and their accompanying metabolic defects lead to a range of problems, including
protein energy wasting (PEW) and cachexia (Wing et al., 2015), and chronic inflammation
(Viana et al., 2014). This can lead to a very complicated condition in which different aspects
of the immune response might be activated. CKD also results in a continuous state of chronic
inflammation, resulting in increased risk of cardiovascular disease (CVD) (Descamps-Latscha
et al., 2002) and protein energy wasting (PEW) (Wing et al., 2014, Deger et al., 2017). These
disorders eventually increase the chance of morbidity and mortality among CKD patients
(Block et al., 2004). There is a strong association in CKD with increased levels of C-reactive
protein (CRP) and pro-inflammatory cytokines, mostly IL-6 whose level is dependent on the
stimulation of TNF-α and IL-1, which reflect a pro-inflammatory state in CKD patients
(Cheung et al., 2010). Most inflammatory conditions are characterised by increased levels of
TNF-α, IL-6 and IL-1 (Scheller et al., 2011). Therefore, numerous investigations (Hauser et
al., 2008, Kato et al., 2008, Yeo et al., 2010) have examined immunity dysfunction and the
associated chronic inflammatory complications and PEW among CKD patients.
Multiple studies (Viana et al., 2014, Steensberg et al., 2002, Starkie et al., 2003) have shown
that moderate exercise can exert beneficial effects on PEW/cachexia and on the immune system
by producing anti-inflammatory cytokines that assist in the reduction of inflammation. IL-6
can be produced by muscle fibers through a TNF-independent pathway during exercise
(Petersen and Pedersen, 2005b).It was seen that the levels of anti-inflammatory cytokines such
as IL-10 and IL-1ra were increased following the acute increases in levels of IL-6 after
prolonged running exercise (Ostrowski et al., 1998b). However, TNF-α production can be
inhibited by strenuous exercise and IL-6 infusion in healthy individuals (Starkie et al., 2003).
Therefore, IL-6 can play anti-inflammatory roles in the context of exercise, or inflammatory
roles along with CRP, TNF-α and IL-1 in chronic inflammatory states such as CKD.

2
This thesis investigates, using a cultured skeletal muscle cell model in vitro, the regulation of
the expression of a key cytokine expressed in muscle (interleukin 6 (IL-6)) which may play a
central role in the anti-inflammatory and metabolic effects of exercise.
1.2 Protein energy wasting
The term ‘protein energy wasting’ (PEW) describes a dysfunctional metabolic state that is
common in inflammatory conditions. PEW is characterised by profound depletion of energy
reserves and the loss of protein mass in the body leading to cachexia (Wing et al., 2014, Deger
et al., 2017). PEW typically has a profound impact on the quality of life of patients, resulting
in limited mobility, increased frailty, and even psychological side effects. Unlike malnutrition,
which occurs as a result of insufficient nutrient intake, PEW is a maladaptive metabolic state
that cannot be treated effectively through nutritional supplementation. PEW occurs in patients
with chronic kidney disease (CKD) and end-stage renal disease (ESRD), as well as in 20-70%
of adults treated by dialysis. The prevalence of both inflammatory markers and PEW increases
in response to falls in the glomerular filtration rate (GFR) (Wing et al., 2014).
PEW is associated with numerous factors, including inflammation (Gupta et al., 2012), insulin
resistance (Bailey et al., 2006), and metabolic acidosis (Mitch, 1998). Metabolic acidosis is a
particularly important factor in PEW, as it contributes to muscle wasting by accelerating
protein catabolism (Wing et al., 2014). Even moderate levels of acidosis (20 mmol/L
bicarbonate) result in the breakdown of proteins, through activation of the adenosine
triphosphate (ATP)-dependent pathway involving ubiquitin and proteasomes (Chiu et al., 2009,
Mitch et al., 1994). This has been demonstrated clearly in classical studies, where the muscle
protein was shown to preferentially waste in rats with metabolic acidosis and renal failure (May
et al., 1987). Metabolic acidosis may also contribute to muscle degradation through multiple
defects associated with the condition, including: insulin resistance (Mak, 2008); inflammation
and abnormal muscle signalling especially dysregulation of IGF-1 signalling (Abramowitz et
al., 2013); and the reduction in serum levels of essential branched-chain amino acids, with the
corresponding impact on muscle development and operation (Carrero et al., 2013); and through
accelerated proteolysis arising from impairment of the IRS/PI3K/Akt pathway (Bailey et al.,
2006). The importance of insulin and IGF-1 signalling in muscle protein studies has been
demonstrated through the correction of metabolic acidosis in rats, which yielded a
corresponding rise in IRS-associated PI3K activity, in turn led to the reduction in the levels of
muscle catabolism (Bailey et al., 2006).

3
The issue of protein degradation has been investigated through a variety of experimental
approaches. For example, using sodium bicarbonate as a pre-dialysis treatment for CKD
patients has been shown to lessen protein catabolism (Papadoyannakis et al., 1984, Reaich et
al., 1993). Furthermore, this approach also decreased amino acid oxidation and the levels of
plasma urea (Papadoyannakis et al., 1984, Reaich et al., 1993). However, comparatively few
studies of CKD have examined the viability of exercise in improving the health outcomes in
terms of PEW, despite evidence suggesting that patients with CKD benefit from resistance
training in terms of muscle repair and development (Balakrishnan et al., 2010, Johansen and
Painter, 2012). Kosmadakis et al. studied forty CKD patients (stage 4 and 5) on a 6-month
walking programme. At 1 month, they found short-term improvement of body composition,
with the reduction of fat mass by 0.71 ± 0.62 kg (P = 0.001) and corresponding marginally
significant increase in lean mass by 0.56 ± 0.98 kg (P = 0.060) (Kosmadakis et al., 2012).
Balakrishnan et al. conducted a 12-week trial on CKD patients (stage 3 and 4) to test the
efficacy of high intensity resistance training. In addition to changes in types I and II muscle
fibres, the mitochondrial DNA copy numbers of patients increased, indicating increased muscle
mass. It was suggested that resistance training is effective in the treatment of metabolic
catabolism and the treatment of muscle wasting in CKD (Castaneda et al., 2004, Balakrishnan
et al., 2010). The present study further expands upon these outcomes, investigating the effect
of low pH in stretched skeletal muscle (L6 cells) (in vitro), in an attempt to mimic some aspects
of what happens in exercised skeletal muscle (eccentric muscle contractions) in CKD patients.
1.3 Physical exercise and chronic inflammation
The WHO Global Burden of Disease study has shown that chronic non-communicable diseases
(such as cardiovascular disease, cancer, chronic lung disease, CKD and type 2 diabetes
mellitus) are now the major cause of death worldwide, accounting for 72% of deaths in 2016
(World Health Organization, 2014, Lancet, 2017).These diseases affect not just developed but
also developing countries (de-Graft Aikins, 2007). Mounting evidence over the past 20 years
has shown that regular physical exercise is a promising tool for the preventive therapy of
complications arising from a number of different types of chronic diseases, such as type 2
diabetes, colon cancer, breast cancer, and atherosclerosis (Blair et al., 2001, Taylor et al., 2004,
Boulé et al., 2001, Fiuza-Luces et al., 2018, Winzer et al., 2018, Fletcher et al., 2018). Physical
exercise has also demonstrated the ability to be an effective treatment for complications arising
from other diseases that include heart failure (Swedberg et al., 2005), ischemic heart disease

4
(Pedersen and Saltin, 2015a) and chronic obstructive pulmonary disease (Lacasse et al., 2001)
and, more recently, CKD (Watson et al., 2013b, Viana et al., 2014).
Two key factors linking many of these diseases are obesity (Lancet, 2017) and chronic
inflammation, for example in the insulin resistance of type 2 diabetes patients (Dandona et al.,
2004) and in atherosclerosis, which is characterised by an accumulation of fibrotic tissue and
lipids in large arteries (Petersen and Pedersen, 2005b). Numerous studies (Pedersen and Saltin,
2015a, Lacasse et al., 2001, Mallat et al., 1999, Hansson et al., 2002) have suggested that
inflammation plays an important role in the pathogenesis of atherosclerosis in CKD. Low-
grade chronic inflammation can be detected by measuring C-reactive protein (CRP) and other
acute phase proteins, and some pro-inflammatory cytokines, such as TNF-α and IL-1. There
may be a link between chronic inflammation, ageing and obesity, arising at least partly from
release of pro-inflammatory adipokines from adipose tissue (Fantuzzi, 2005). However, many
studies have noted that chronic physical exercise can also lead to a reduction in inflammation
by enhancing the ability of the immune system and of skeletal muscle cells to produce anti-
inflammatory cytokines like IL-10 (Figure 1.1) (Petersen and Pedersen, 2005a).
Figure 1.1. The effect of IL-6 from contracting muscle in different organs.
IL-6 enhances the systemic levels of IL-1 receptor antagonist (IL-1ra), soluble TNF receptor (TNF-R), and IL-10. Taken from (Petersen and Pedersen, 2005a).

5
Interestingly, it has been demonstrated in predialysis CKD that systemic anti-inflammatory
status can be developed after acute aerobic physical exercise, due to the increased level of
plasma IL-10 just one hour post-exercise (Viana et al., 2014). Paradoxically this may be linked
to the increased level of plasma IL-6 just after exercise (Steensberg et al., 2001a, Viana et al.,
2014). It has been shown that the level of IL-6 mRNA derived directly from the contracting
skeletal muscle (Section 1.6) significantly increases during resistance exercise without muscle
damage (Steensberg et al., 2002). However, this was not observed with regard to the level of
TNF-α mRNA, which showed no significant increases in skeletal muscle (Steensberg et al.,
2002).
The plasma levels of TNF-α were shown to increase following infection and followed by
increases in IL-6 production as an indication of inflammatory status (Pedersen and Febbraio,
2008b). However, the levels of IL-6 in exercise are significantly higher compared to TNF-α
and are followed by an increase of anti-inflammatory cytokines such as IL-10, which results in
an anti-inflammatory state under exercise conditions in general. An exception however is
highly strenuous, prolonged exercise such as marathon running which can result in a small
detectable increase in the plasma concentration of TNF- α (Figure 1.2) (Pedersen and Febbraio,
2008b).
Figure 1.2. Schematic comparison of sepsis-induced versus exercise-induced increases in circulating cytokines in plasma.
The level of circulating tumor necrosis factor (TNF-α) increases rapidly during sepsis and is followed by a marked increase in muscle-derived interleukin-6 (IL-6). However, while IL-6 levels increase during exercise, there is no preceding increase in TNF-α. Taken from (Pedersen and Febbraio, 2008b).

6
1.4 Effect of exercise training on chronic inflammation
Data from cohort studies suggest the existence of a link between physical exercise and
inflammation (Beavers et al., 2010, Pedersen and Saltin, 2015a). People who partake in regular
exercise activity tend to show lower inflammatory biomarkers (Pedersen and Saltin, 2006).
Physical exercise also seems to have a regulatory effect on the immune response in a way that
encourages the production of anti-inflammatory cytokines and even eventually reduces the
onset of inflammation (Astrom et al., 2010). This suggested that physical exercise could help
in the treatment of some chronic diseases (Pedersen and Saltin, 2015a). This conclusion was
supported by a Danish study that showed that physical exercise improved cardiorespiratory
fitness (CRF) in patients with chronic obstructive pulmonary disease (COPD) (Pedersen and
Saltin, 2015a). As patients with COPD produce a high level of TNF-α, this can affect myocyte
differentiation and induce cachexia, thereby leading to reduced muscle strength (Pedersen and
Saltin, 2015a). Chronic exercise may exert an indirect beneficial effect on muscle by reducing
the production of pro-inflammatory cytokines including TNF-α (Pedersen and Saltin, 2015a).
Exercise may increase muscle strength among COPD patients and could eventually lead to
improved quality of life compared with patients with a more sedentary lifestyle (Pedersen and
Saltin, 2015b).
1.5 Direct evidence for anti-inflammatory effects of physical exercise
To investigate further the observation that physical exercise could reduce systemic low-grade
inflammation (Petersen and Pedersen, 2005b), a model of “low-grade inflammation” was
developed to see if acute exercise can reduce inflammation under defined laboratory conditions
(Starkie et al., 2003). In this laboratory experiment, the level of TNF-α was increased among
healthy volunteers by injecting them with a low dose of Escherichia coli endotoxin. The level
of TNF-α was subsequently found to be decreased when the volunteers performed endurance
physical exercise (riding a bicycle for 3 hours). However, the levels of the TNF-α remained
higher in control subjects who had received endotoxin but did not perform exercise, suggesting
that physical exercise could play an important role in the regulation of the immune response.
Interestingly, it has also been shown that a remarkable increase in IL-6 production occurs
among people who partake in regular moderate exercise without any inflammatory damage to
their muscles, suggesting that IL-6 is a myokine that is secreted from exercising muscles
(Section 1.6) (Petersen and Pedersen, 2005b). IL-6 is normally regarded as a pro-inflammatory

7
cytokine, but the release of IL-6 that occurs during exercise exerts an overall anti-inflammatory
effect (Munoz-Canoves et al., 2013). It was seen in functional studies that were done in rodents
that IL-6 can play an important role in terms of regeneration of skeletal muscles after injury
and that IL-6 has a stimulatory effect on satellite cell proliferation (Munoz-Canoves et al.,
2013). Ablation of IL-6 expression with specific siRNA inhibited myoblast differentiation and
fusion in cultured myoblasts (Munoz-Canoves et al., 2013). Acute increase of IL-6 after
exercise has a role in the activation of satellite cells; however, prolonged activation of systemic
IL-6 has a harmful role in terms of catabolic effects and muscle wasting (Munoz-Canoves et
al., 2013).
1.6 Skeletal muscle as an endocrine organ
As the largest organ in the human body, skeletal muscle is an endocrine organ that serves a
number of key roles. The contraction of skeletal muscle stimulates the production, expression
and release cytokines or peptides called ‘myokines’, which have a paracrine or endocrine effect
(Pedersen et al., 2007). These myokines can then, in turn, affect organ and tissue metabolism
in other parts of the body (Pedersen and Febbraio, 2008a). The ability to increase cytokine
production in response to exercise suggests evidence for the long-sought link between immune
changes and muscle contraction, opening up the possibility of inducing beneficial metabolic
responses in organs like the liver.
The homeostatic state of the human body involves the contribution of the nervous, endocrine,
and immune systems, which have a degree of inter-dependence for their normal function and
development (Pedersen and Febbraio, 2008a). IL-6 is part of the IL-6 family of cytokines,
which includes IL-11, oncostatin M, leukaemia inhibitory factor, ciliary neurotrophic factor,
cardiotrophin-1, and cardiotrophin-like cytokine. The common targets of the IL-6 family of
cytokines are the gp130 (IL-6Rβ/CD130) and the gp80 (IL-6Rα/ CD126) receptors, which are
type I cytokine receptors (Kamimura et al., 2003). Levels of IL-6 in plasma increase after
protracted periods of exercise, rising exponentially during activity and declining rapidly once
exercise terminates (Febbraio and Pedersen, 2002, Suzuki et al., 2002), irrespective of levels
of muscle damage involved (Pedersen et al., 2007). Increases in circulating IL-6 are affected
by the duration and intensity of the exercise, and the mass and endurance capacity of the muscle
involved. IL-6 mRNA is upregulated in skeletal muscle as it contracts (Ostrowski et al., 1998b,
Steensberg et al., 2001a), with the transcriptional rate of the IL-6 gene being enhanced by
exercise, particularly at low muscle glycogen levels (Keller et al., 2001). IL-6 is released from

8
skeletal muscle during exercise (Steensberg et al., 2002, Steensberg et al., 2000) and is
expressed in muscle fibres in the post-exercise phase (Hiscock et al., 2004), with increased IL-
6 receptor production occurring in skeletal muscle in response to physical activity, suggesting
the presence of a co-ordinated biological mechanism (Keller et al., 2005).
Although commonly perceived as a pro-inflammatory cytokine, there is some evidence to
suggest that IL-6 also may have context-sensitive anti-inflammatory properties (Petersen and
Pedersen, 2005b). When circulating levels of IL-6 increase, there is a corresponding rise in
levels of anti-inflammatory cytokines like IL-10 and IL-1ra (Ostrowski et al., 2000, Ostrowski
et al., 1999). Blood infusion of IL-6 to healthy donors has the same effect on these cytokines
as exercise, as well as increasing levels of cortisol in the body (Steensberg et al., 2003). In
addition, studies have shown that TNF-α production can be suppressed by exercise and IL-6
infusion (Starkie et al., 2003). A link might also exist between IL-6 and AMP-activated protein
kinase (AMPK), which plays an important role in modulating glucose uptake and the
stimulation of fatty acid oxidation (Kahn et al., 2005). IL-6 enhances adipose and muscular
AMPK activity (Kelly et al., 2004), and its positive effects on glucose uptake and fatty acid
oxidation are halted by the presence of dominant-negative AMPK constructs (Carey et al.,
2006). In some senses, muscle-derived IL-6 is a myokine with endocrine effects and can be
thought of as an ‘exercise factor’ (Pedersen et al., 2007), as it is quickly activated in response
to muscle contractions and has a faster transcription rate than other muscle genes. Additionally,
the availability of carbohydrates in skeletal muscles strongly influences IL-6 production,
suggesting that it is produced in response to variation in energy levels.
In summary, the contraction of human skeletal muscle causes the expression and release of IL-
6, which has numerous metabolic effects, such as the activation of AMPK, which influences
fatty acid oxidation and insulin-stimulated glucose disposal in vivo. IL-6 may have beneficial
effects in serious inflammatory states especially when secreted without other pro-inflammatory
cytokines, such as TNF-α. Even though acutely secretion of IL-6 has ‘anti-inflammatory’
properties, chronic elevated levels promote atrophy via protein degradation, shown both in-
vitro and in-vivo, and IL-6 is chronically elevated in muscle of elderly individuals with
sarcopenia and the increase is associated with earlier morbidity and mortality (Munoz-Canoves
et al., 2013).

9
1.7 The biosynthesis of IL-6
For an understanding of the IL-6 myokine response in exercising skeletal muscle, it is necessary
to consider the steps involved in IL-6 biosynthesis: i.e. transcription of the IL-6 gene (Luo and
Zheng, 2016), translation of the IL-6 mRNA, and subsequent post-translational modification
to generate a mature biologically active IL-6 protein.
1.7.1 Transcriptional regulation of IL-6
In muscle biopsies from exercising human volunteers an increase in IL-6 mRNA expression
was found to correlate with increased phosphorylation of a nuclear pool of the MAP kinases
JNK and p38 (Chan et al., 2004b) which may be activated in response to muscle contraction
(see Section 1.11 and 1.12 below). A similar p38 response was observed in vitro in cultured
L6 rat myotubes when the intracellular Ca2+ concentration was elevated by incubation with the
ionophore ionomycin (Chan et al., 2004b). The transcription factors involved in the increased
expression of IL-6 in muscle following exercise are still not fully understood, but the promoter
region of the human IL-6 gene (Figure 1.3) is known to contain an AP-1 response element,
which (as explained in Section 1.12) can be activated through JNK. The mechanism through
which p38 activates IL-6 transcription in muscle is less clear: indeed more recent evidence
from macrophages (Nyati et al., 2017) suggests that prolonged stimulation of p38 may decrease
the abundance of IL-6 mRNA by stimulating degradation of the mRNA stabilising protein
Arid5a.
Figure 1.3. Schematic representation of the promoter region of the human interleukin-6 (IL-6)
gene showing possible cis-regulatory elements.
GR: glucocorticoid receptor. AP-1: Activator protein 1. CRE: The cAMP response element. NF-IL6: nuclear factor–interleukin-6. NF-kB: Nuclear Factor Kappa Beta. TATA: three TATA like sequences (TATA boxes). CREB: CRE-binding protein. C-fos: cellular oncogene. Taken from (Luo and Zheng, 2016).

10
1.7.2 Protein synthesis
Protein synthesis by translation of mRNA requires numerous components, including: the
mRNA to be translated; amino acids (see Section 1.9); amino acid specific aminoacyl-transfer
RNAs (aminoacyl-tRNAs); functional ribosomes; regulatory protein factors; energy sources;
and enzymes (Gingras et al., 1999). The translation process is separated into the following
steps: initiation, elongation, and termination and these are described briefly below.
1.7.2.1 Initiation
Before peptide bond formation occurs, several components are required for the assembly of the
translation system: the mRNA template; the two ribosomal subunits (40S and 60S); the
aminoacyl-tRNA; and ATP, which serves as a source of energy (Proud, 2006). In order to
facilitate the initiation complex, a series of regulatory proteins, the eukaryote initiation factors
(eIFs) are required (Mitchell and Lorsch, 2008).
During this process, the ribosome recognizes the start codon (AUG), which then initiates
translation (Proud, 2006). The scanning process involves the 40S ribosomal subunit binding at
the mRNA 5’-end, where it scans through until it meets the AUG codon. This process consumes
ATP. This process is facilitated by eukaryotic Initiation Factor 2 / Guanosine-5'-triphosphate
complex (elF-2-GTP) and additional elFs. On the small ribosomal subunit, the tRNA initiator
carrying methionine enters the P position, with the complex becoming functional when it binds
to the large (60S) ribosomal subunit.
1.7.2.2 Elongation
The elongation step of the protein synthesis involves the addition of amino acid residues to the
growing polypeptide chain (Proud, 2006). As the mRNA is translated, the ribosome moves
from the 5’➝3’ end of the mRNA molecule. During elongation, EF-1α−GTP and EF-1βγ
elongation factors facilitate the delivery of the next aminoacyl-t-RNA that is encoded by the
codon which appears next in the ribosomal A position (Rodwell et al., 2015). The peptide bond
is then formed between the amino acids at the P and A positions under the catalysis of the
peptidyltransferase enzyme (Proud, 2006). By the process of translocation, the ribosome then
advances three nucleotides towards the mRNA 3’-end, which requires EF-2-GTP and GTP
hydrolysis. Consequently, uncharged tRNA at the P position moves to the E position before
release and the amino acyl t-RNA at the A position on the ribosome is moved to the P position.
This process is repeated leading to elongation of the growing polypeptide chain until a stop
codon is reached.

11
1.7.2.3 Termination
Termination occurs when a stop codon (UAA, UGA, or UAG) moves into the A position
(Merrick, 1992, Proud, 2006). All three-stop codons are recognized by a single release factor,
eRF. Once the eRF is bound, the completed polypeptide chain is released from the ribosome
(Proud, 2006).
1.7.2.4 Post-translational Modifications of Human Interleukin-6
It has been reported that TNF- α and IL-6 induce IL-6 secretion from human fibroblasts (May
et al., 1988a, 1988b; Santhanam et al., 1989). This IL-6 consisted of six or more differentially
modified phosphoglycoproteins of molecular mass 23-30 kDa. These masses included three
with mass from 23 to 25 kDa and three with mass from 28 to 30 kDa (May et al., 1988a, May
et al., 1988b, Santhanam et al., 1989).
Using metabolic labelling, glycosidase digestion, and lectin chromatography experiments
demonstrated that the mass of 23-25 kDa species are O-glycosylated and that the 28- to 30-
kDa species are both O- and N-glycosylated (Santhanam et al., 1989).
Pulse-chase experiments were used to study newly synthesised IL-6 polypeptides, which were
shown to quickly enter two separate protein modification pathways. One of these pathways led
to O-glycosylation and the other led to both N- and O-glycosylation. Prior to the production of
these polypeptides, further modifications (phosphorylation) occurred in the two pathways
(Santhanam et al., 1989).
The treatment of human fibroblasts with the glycosylation inhibitor tunicamycin has been
shown to lead to IL-6 production in the O-glycosylated form only (Santhanam et al., 1989).
However, when human fibroblasts were treated with the translation inhibitor cycloheximide,
IL-6 was produced in both forms of N- and O-glycosylation pathways. Interestingly, treating
fibroblasts with the ionophore monensin (which is used to block the intracellular transport of
cytokines, resulting in their accumulation in the Golgi region and endoplasmic reticulum (Jung
et al., 1993) resulted in glycosylation inhibition, but did not inhibit IL-6 polypeptide production
(Santhanam et al., 1989).
Other IL-6 species was revealed using immunoprecipitation, immunoblotting, and
immunoaffinity chromatography techniques. These IL-6 species were found (from their
mobility in dodecyl sulfate-polyacrylamide gel electrophoresis under reducing conditions to
have apparent molecular masses of 17-19 kDa and 45 kDa, thereby indicating that IL-6 has

12
additional modifications (Santhanam et al., 1989). These studies of IL-6 illustrate the
complexity of this cytokine. Interestingly, it has been suggested that the more
immunosuppressive isoforms of the protein are those, which are less glycosylated forms
(Bennett and Schmid, 1980; Santhanam et al., 1989).
1.8 Mammalian target of rapamycin (mTOR)
An important regulator of the process of translation (especially at the initiation step) is
mammalian target of rapamycin (also known the mechanistic target of rapamycin). This is a
serine/threonine kinase, which can play an important role in cells, including regulation of
growth, proliferation, and survival, as well as protein synthesis (Lieberthal and Levine, 2009a).
It biological activity is selectively inhibited by rapamycin (also known as sirolimus), which
was first identified in Streptomyces hygroscopicus in 1975 (Sehgal, 2003). Rapamycin can
inhibit mTOR via the creation of a complex along with an intracellular protein called FK506-
binding protein 12 (FKBP-12) (Lieberthal and Levine, 2009a). In cells there are two
functionally active protein complexes containing mTOR, namely mTOR complex 1
(mTORC1) and mTOR complex 2 (mTORC2), each of which utilises a characteristic
scaffolding protein. The scaffolding protein is called raptor for mTORC1 and rictor for
mTORC2. The mTORC1 can be activated by growth factors and amino acids, allowing it to
increase cell size and proliferation (Lieberthal and Levine, 2009a), and it is thought to play an
important role in myocyte hypertrophy in skeletal muscle (Lieberthal and Levine, 2009b).
The activation of mTORC1 results in activation of phosphatidyl inositol 3-kinase (PI3K - a
lipid kinase), which phosphorylates the plasma membrane phospholipid phosphatidylinositol
4,5-biphosphate (PIP2) to yield PIP3 (Lieberthal and Levine, 2009a). This then phosphorylates
and activates the regulatory protein kinase Akt through 3-phosphoinositide-dependent kinase-
1 (PDK1). PI3K activity is negatively regulated by PTEN, a phosphatase that dephosphorylates
PIP3 back to PIP2. In addition, Akt phosphorylates and inhibits the tuberous sclerosis complex
proteins (TSC), which inhibits the cytoplasmic GTPase, Rheb, a key activator of mTORC1.
This process negatively regulates mTORC1 (Lieberthal and Levine, 2009a). If the ATP stores
of the cell are reduced by stress (or by prolonged exercise in muscle), the AMP-ATP ratio
increases, which activates AMPK. AMPK inhibits mTOR by phosphorylating and activating
TSC2. After mTORC1 has been activated, it phosphorylates the protein kinase p70S6K and
initiation factor 4E binding proteins 4EBPs. This promotes the translation of mRNAs
(especially at the initiation step) resulting in an increase in global protein synthesis and cellular

13
hypertrophy, and the corresponding synthesis of proteins necessary for cell growth and cell-
cycle progression. (Lieberthal and Levine, 2009a) (Figure 1.4).
Figure 1.4. mTOR is a component of two major intracellular signalling complexes: mTORC1
and mTORC2.
These complexes fulfil different functional roles: stimulating cell growth and proliferation in the case of mTORC1 and the regulation of cell polarity and the cytoskeleton in the case of mTORC2. They are connected to different targets downstream by their individual scaffolding proteins, termed raptor (mTORC1) and rictor (mTORC2). Taken from (Lieberthal and Levine, 2009a).
A large fraction of total body protein in humans occurs in skeletal muscle and mTORC1 has
been shown to be a major regulator of protein synthesis and total protein mass in the skeletal
muscle (Watson and Baar, 2014b) (Figure 1.5).

14
Figure 1.5. Relationship between mTORC1 activation and muscle hypertrophy.
In this graph, the growth in muscle mass resulting from 6 weeks of resistance training in rats is plotted against the post exercise (6 hours) phosphorylation of S6K1. A significant association is evident between increased muscle mass and mTORC1 activity. Taken from (Baar and Esser, 1999, Watson and Baar, 2014a)
Resistance exercise training can lead to hypertrophy of muscle, potentially because of the
increased synthesis of protein due to the high activity of S6 protein kinase (p70S6k) through
mTORC1 (Baar and Esser, 1999, Watson and Baar, 2014b).
An important influence on the activity of mTORC1 is the availability of free amino acids (Baar
and Esser, 1999, Watson and Baar, 2014a) inside the cell which is partly dependent on the
activity of plasma membrane amino acid transporters. Of particular importance is the SNAT2
transporter, which is described below.
1.9 The SNAT2 amino acid transporter
In order to build proteins (including IL-6), small neutral (zwitterionic) amino acids, including
L-alanine, L-glutamine and L-serine, need to be transported into the cells (Pinilla et al., 2011)
by active amino acid transporters of which the most important are sodium-coupled neutral
amino acid transporters (SNATs) (Broer, 2014) (Figure 1.5). SNATs are encoded by genes of
the SLC38 gene family. They perform secondary active transport (AT) i.e. pumping amino

15
acids into the cell against their electrochemical gradient) by coupling the transport to the
electrochemical gradient of Na+ across the plasma membrane which is maintained by the
primary active transporter Na+,K+-ATPase (the sodium pump) (Figure 1.6). In this mechanism,
each amino acid is transported by an electrogenic mechanism involving co-transport with one
Na+. This is called a symport mechanism (Broer, 2014).
So-called tertiary active transport of other amino acids such as L-leucine (Leu) can then be
performed indirectly by coupling of (for example) the L-glutamine (Gln) gradient that is
generated by the SNATs to transport of Leu through a System L amino acid exchanger (Figure
1.6). In this way SNAT transporters such as SNAT2 (SLC38A2) can indirectly control the
intracellular Leu concentration which is an important regulator of mTORC1 (Evans et al.,
2007b).
Figure 1.6. Integration of primary (I), secondary (II), and tertiary (III) active transport (AT)
mechanisms may affect transmembrane distribution of particular amino acids (AAs).
The net movement of AAs to the intracellular pool from the extracellular pool is generated through the actions of secondary active transporters (e.g. System A/SNAT2 – also known as SLC38A2). Taken from (Hundal and Taylor, 2009).
There are 11 members of the solute carrier 38 (SLC38) family in the human genome, and this
is true in other mammalian genomes. The best characterised transporters of this family are
SNAT1 to SNAT5 inclusive (SLC38A1 to SLC38A5). Three of these (SNAT1, 2 and 4) are
classed as so-called “System A” transporters i.e. Na+-linked transporters which efficiently
transport L-alanine and are inhibited by low pH. The most prominent of these is SNAT2, in
terms of its high level of expression in most human tissues including skeletal muscle (Pinilla
et al., 2011). In the rat L6-G8C5 skeletal muscle cells that are used as a culture model in this
thesis (Section 1.15) SNAT2 is the dominant isoform of System A transporter expressed in the
cells and therefore accounts for nearly all of the System A transport activity in the cells (Evans

16
et al., 2007b). For this reason, in the remainder of this thesis, the terms System A and SNAT2
are used interchangeably and the transporter is referred to as System A / SNAT2.
The System A transporters are also characterised by their inhibition by the non-metabolisable
competitive amino acid analogue 2-methylamino-isobutyric acid (MeAIB), which is a substrate
for these transporters and its rate of transport into cells is used as an indicator of System A
activity (Christensen et al., 1965, Franchi-Gazzola et al., 2006). One of the main physiological
characteristics of these System A transporters is their sensitivity to pH i.e. the fact that their
functionality is inhibited at physiologically attainable low extracellular pH (Mackenzie and
Erickson, 2004, Broer, 2014).
In humans System A transporters can be found on chromosome 12: the number of amino acids
is 486 for SNAT1 and 505 for SNAT2 (Pochini et al., 2014), and the N-terminal His residue is
thought to confer most of the pH sensitivity on the SNAT2 transporter (Baird et al., 2006) . In
L6-G8C5 rat skeletal muscle cells SNAT2 can play an important role in the regulation of
protein synthesis through mammalian target of rapamycin and ribosomal protein S6 kinase,
and 4E-BP1 because it can control the intracellular free amino acid concentration which
activates mTORC1 (Evans et al., 2007a). In addition to its effects on mTORC1 through
transport of neutral amino acids into the cell, there is also evidence that SNAT2 can exert
effects independent of its transport activity by acting as a so-called “transceptor” i.e. a
transporter protein, which senses extracellular amino acids, pH and other extracellular stimuli
and then sends a transport-independent signal into the cell. For example SNAT2 is thought to
regulate its own gene expression and translation in the face of extracellular amino acid
starvation by such a transceptor mechanism (Hyde et al., 2007). The transceptor signal is not
fully understood but there is evidence that it occurs through the MAP kinase JNK (Hyde et al.,
2007) and through cyclin dependent kinase 7 (CDK7) (Stretton et al., 2019). In L6-G8C5 cells,
a pH-sensing transceptor signal is thought to be involved in the regulation of PI3K and Akt,
thus explaining the stimulation of global protein degradation that occurs at low pH in these
cells (Evans et al., 2008a). This is potentially important in the case of CKD patients with
uraemic metabolic acidosis , who have a resistance to insulin signalling through PI3K and Akt,
eventually leading to loss of protein synthesis and increased protein catabolism in their skeletal
muscles and hence to muscle wasting.

17
1.10 Mechanotransduction
In view of the evidence (reviewed in Sections 1.3 to 1.6 above) that IL-6 secreted as a myokine
during exercise exerts potent metabolic and anti-inflammatory effects on target cells, it is
important to understand the biochemical mechanisms that link exercise (including muscle
contraction and mechanical stress) to increased IL-6 expression in myocytes and its secretion
into extracellular fluid. It is also important to understand how these mechanisms may change
in response to the biochemical abnormalities that occur in CKD (such as uraemic metabolic
acidosis - see Section 1.15 below). It is therefore important to understand the mechanisms
involved in mechanotransduction by which mechanical stress on skeletal muscle is transduced
into intracellular signals, which lead to muscle hypertrophy in response to resistance exercise,
and which may play a role in the accompanying increase in biosynthesis and secretion of IL-6.
One of the key mechanisms driving skeletal muscle hypertrophy as an adaptation to resistance
exercise is increased synthesis of muscle protein mediated by mammalian target of rapamycin
complex 1 (mTORC1). However, the various factors involved in the hypertrophy cascade are
imperfectly understood, including the initiating factors, the stimuli induced by exercise and the
specific stimuli causing hypertrophy. A signal that is initiated, induced by exercise and which
stimulates hypertrophy is known as a "hypertrophy stimulus", which is detected by a
"hypertrophy sensor" (Wackerhage et al., 2018).
Resistance exercise triggering the synthesis of muscle protein and corresponding muscle
hypertrophy is strongly dependent on a downstream hypertrophy signalling “hub” involving
Akt and mTORC1 (Bodine et al., 2001, Marcotte et al., 2015, Pereira et al., 2017). Extensive
research shows that muscle protein synthesis and post resistance exercise muscle growth can
be reduced, or prevented entirely, by mTORC1 blockade with rapamycin in rodents (Kubica et
al., 2004) and humans (Drummond et al., 2009). Overloading muscle through the synergist
ablation model of muscle hypertrophy has been shown to have similar hypertrophic effects
(Bodine et al., 2001, Goodman et al., 2011). Muscle size is also regulated by other signalling
pathways and genes, but their contribution to muscle hypertrophy from resistance exercise is
not fully understood (Verbrugge et al., 2018).
Even though the molecular mechanisms regulating muscle mass have been extensively
studied, the initiating hypertrophy stimuli and the ultimate sensors of mechanical stress are
still poorly understood (Wackerhage et al., 2018). The term “hypertrophy stimulus” denotes an
initiating stimulus of sufficient magnitude and duration to trigger a skeletal muscle

18
hypertrophic response to resistance exercise. This stimulus is then detected by a “hypertrophy
sensor” (Rindom et al., 2019). According to these definitions, hypertrophy regulators like IGF-
1 or its MGF splice variant are not initiating hypertrophy stimuli, because there are not
signalling events (i.e. hypertrophy stimuli) that change their expression after resistance exercise
(Hameed et al., 2003). It has been suggested that true hypertrophy stimuli would involve a
sophisticated signalling system that produces hypertrophy in response to resistance exercise,
regardless of variations in load or sets (Wackerhage et al., 2018).
The most intuitive hypertrophy stimuli are mechanical signals (Wackerhage et al., 2018), as is
shown by the atrophy of muscles that occurs in response to reduced mechanical load (Psatha
et al., 2012, Appell, 1990). This suggests that maintaining baseline muscle mass requires a
certain level of mechanical loading. Further evidence of the importance of mechanical signals
is that hypertrophy of skeletal muscle can be achieved by mechanical overload, tested on rat
muscles using cast-induced stretch or the ablation of plantar flexor synergists (Goldberg et al.,
1975) (MacKenzie et al., 2009). However, it should be noted that these studies suffered from
numerous cofounding variables, such as damage or metabolic variation. The third line of
indirect evidence is that exercise at low load (endurance) induces minimal hypertrophy,
whereas exercise at high mechanical load (resistance) triggers significant growth of skeletal
muscle (Wackerhage et al., 2018). However, near maximal muscle hypertrophy can occur in
response to mechanical loads as low as ≈30% of the 1RM (Medicine, 2009).
In skeletal muscle force transduction systems, there are several potential candidates for
hypertrophy-triggering mechanosensors. Research into mechanical stimuli started in the 1950s,
when researchers discovered the ability of cancer cells to grow on agar without being anchored,
and continued in the 1970s with the discovery that cells anchor using focal adhesion complexes,
which include proteins like vinculin, talin and integrins, and kinases, including focal adhesion
kinase (FAK) or integrin-linked kinase (Ilk) (Iskratsch et al., 2014). In addition to anchoring
cells on a substrate, focal adhesions can also mechanically connect the exterior to the
cytoskeleton, as well as sense and trigger adaptations to mechanical stimuli (Iskratsch et al.,
2014, Sun et al., 2016). In skeletal muscle, the equivalent of focal adhesions are costameres,
which are Z-disc associated structures of muscle fibres that link the cytoskeleton to the
extracellular matrix and transmit force laterally from the sarcomere to the extracellular matrix.
The two costamere complexes are the vinculin-talin-integrin complex and the dystrophin-
glycoprotein complex (Iskratsch et al., 2014). Costameres are essential for normal muscle

19
function, as shown by the fact that the mutation of costamere genes typically results in severe
muscle diseases. For example, mutation of the dystrophin-encoding (DMD) gene causes
Duchenne muscular dystrophy (Jaka et al., 2015).
In skeletal muscle, the focal adhesion kinase (FAK) (encoded by the gene PTK2) is a
nonreceptor tyrosine kinase that moves to focal adhesions when the cell adheres to a substrate
(Graham et al., 2015). In cultured C2C12 myotubes, IGF-1 can increase FAK Tyr397
autophosphorylation and FAK is required for IGF-1-induced hypertrophy and Tsc2, mTOR
and S6K1 signalling (Crossland et al., 2013) and signals to other key downstream kinases
including the MAPKs (see Sections 1.11 and 1.12) . However, it is not clear whether a
mechanical hypertrophy sensor can activate FAK and whether FAK is activated itself by
mechanical load during resistance exercise. It seems unlikely that FAK is directly activated by
mechanical load during resistance exercise, because it does not seem to have a mechano-
activated protein domain, unlike filamin-C or titin (Glover et al., 2008). Laboratory testing
showed that activity-related FAK Tyr576/577 phosphorylation was not affected by intense
resistance exercise (4 sets of 10 repetitions) for both fed and fasted participants (Glover et al.,
2008). However, 60-90 min post eccentric exercise, phosphorylated FAK Tyr397 was elevated
(in comparison to what was observed following a concentric bout of exercise) exclusively at
the distal site of the vastus lateralis muscle (Franchi et al., 2018). Therefore, while evidence
suggests that FAK may have a role in the regulation of muscle size, it does not seem to be
linked to a mechanosensor that directly senses mechanical load as a hypertrophy stimulus
during resistance exercise (Wackerhage et al., 2018).
Focal adhesions are closely associated with phosphatidic acid-generating enzymes, such as
phospholipases. Recent research has shown that mechanical stimuli, specifically the attachment
to a soft or stiff substrate, promote the conversion of phosphatidylinositol 4,5-bisphosphate
(PIP2) to phosphatidic acid. This synthesis was catalysed by phospholipase Cγ1 (PLCγ1) and
activated the Hippo pathway effectors Yap (Yes-associated protein 1, gene Yap1) and its
paralogue Taz (gene Wwtr1) (Meng et al., 2018). Yap and Taz are mechanosensitive
transcriptional co-factors that seem to regulate gene expression by co-activating Tead1-4
transcription factors (Dupont et al., 2011). In this way, they regulate muscle differentiation,
satellite cell function (Wackerhage et al., 2014), and are affected by many exercise-associated
stimuli (Gabriel et al., 2016) with increased Yap activity in muscle fibres causing hypertrophy
(Goodman et al., 2015, Watt et al., 2018). No clear link has been suggested between Yap and

20
Taz and mTORC1, with studies even demonstrating that Yap with rapamycin treatment can
cause hypertrophy (Goodman et al., 2015). However, some links are known to exist between
Yap and mTORC1 (Wackerhage et al., 2018). For example, Yap suppresses the mTORC1
inhibitor PTEN (Tumaneng et al., 2012) and induces the expression of SLC7A5 and SLC3A2
that encode the LAT1 amino acid transporter (Hansen et al., 2015). (This is the L-leucine
transporter shown in Figure 1.6, which increases the L-leucine supply to activate mTORC1).
In contrast, even though PTEN expression did not decrease in the vastus lateralis 2.5 h and 5
h after human resistance exercise (Vissing and Schjerling, 2014) and in synergist-ablated,
hypertrophying plantaris muscle (Chaillou et al., 2013), the expression of the LAT1-encoding
genes SLC7A5 and SLC3A2, as well asother Yap targets such as Ankrd1, did increase in both
situations. These data suggest that an unknown sensor may be triggered by mechanical load to
increase phosphatidic acid and thereby activate Yap and Taz, which then increase LAT1 levels
and sensitize the muscle under load to leucine stimulation of mTORC1 (Wackerhage et al.,
2018). However, it is important to note that phosphatidic acid not only modulates Hippo
signalling but can also activate mTORC1, the primary muscle protein synthesis regulator
(Hornberger et al., 2006a). Hypertrophy-inducing eccentric contractions were found to elevate
levels of phosphatidic acid in tibialis anterior muscles for up to 1 hour. Furthermore, use of
butanol to inhibit phosphatidic acid synthesis has been shown to prevent the phosphorylation
of mTORC1 activity markers, suggesting that phosphatidic acid mediates eccentric exercise-
induced hypertrophic signalling (O’Neil et al., 2009). Although Z-disc-linked phospholipase
D (Pld) was first identified as a phosphatidic acid-synthesizing enzyme and therefore not
exclusively located in focal adhesions, it is now recognised that another source of phosphatidic
acid in mechanically loaded muscle occurs in a reaction catalysed by diacylglycerol kinase-ζ
(DGKζ) (You et al., 2014). Together, these studies suggest that mechanical stimuli can activate
phospholipases to synthesize phosphatidic acid, which in turn can activate mTORC1 and the
Hippo effectors Yap and Taz (Wackerhage et al., 2014, Goodman et al., 2015). However, it is
important to note that research has not identified the actual phosphatidic acid synthesis-
stimulating mechanosensor governing hypertrophy, despite locating important signalling
mechanisms in-between the mechanical stimulus and hypertrophy-mediating pathways.
As noted above, another important protein group that are part of costameres are integrins, with
the α7β1-integrin isoform (partly encoded by the gene Itga7) having been linked to muscle size
(α7β1-integrin overexpressing mice develop larger muscle fibres in response to exercise
training than wild-type mice) (Wackerhage et al., 2018). In addition, it is possible that α7β1-
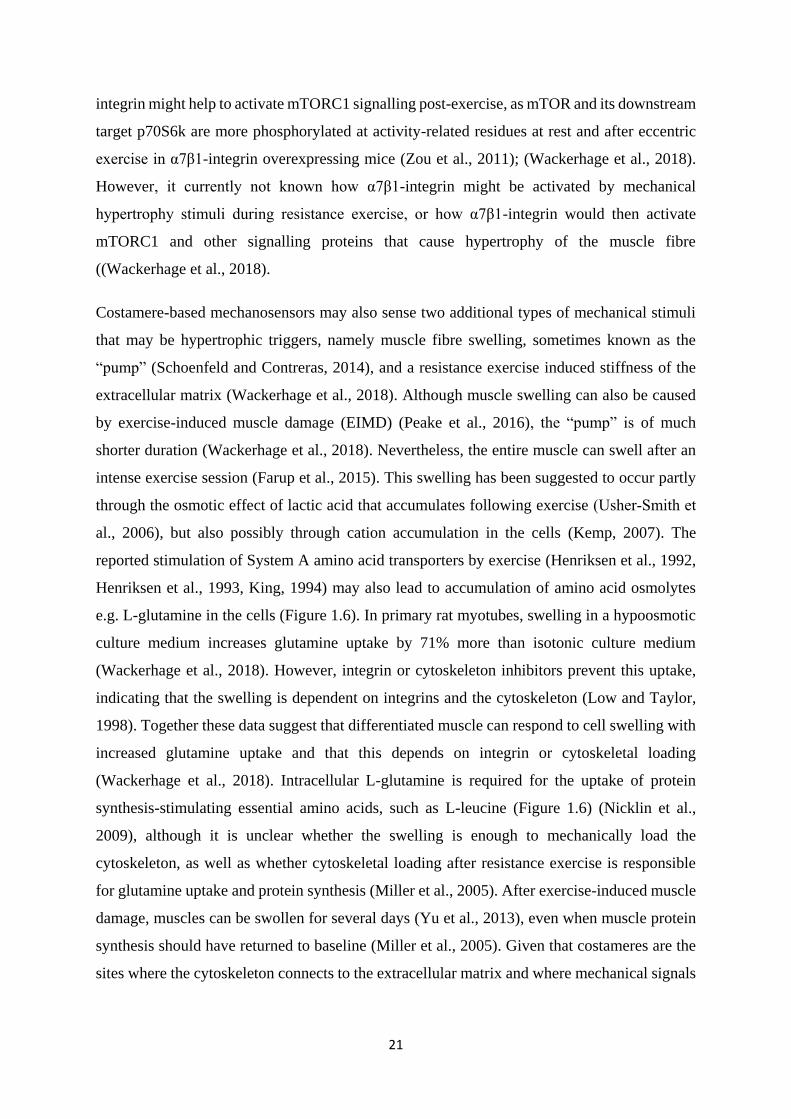
21
integrin might help to activate mTORC1 signalling post-exercise, as mTOR and its downstream
target p70S6k are more phosphorylated at activity-related residues at rest and after eccentric
exercise in α7β1-integrin overexpressing mice (Zou et al., 2011); (Wackerhage et al., 2018).
However, it currently not known how α7β1-integrin might be activated by mechanical
hypertrophy stimuli during resistance exercise, or how α7β1-integrin would then activate
mTORC1 and other signalling proteins that cause hypertrophy of the muscle fibre
((Wackerhage et al., 2018).
Costamere-based mechanosensors may also sense two additional types of mechanical stimuli
that may be hypertrophic triggers, namely muscle fibre swelling, sometimes known as the
“pump” (Schoenfeld and Contreras, 2014), and a resistance exercise induced stiffness of the
extracellular matrix (Wackerhage et al., 2018). Although muscle swelling can also be caused
by exercise-induced muscle damage (EIMD) (Peake et al., 2016), the “pump” is of much
shorter duration (Wackerhage et al., 2018). Nevertheless, the entire muscle can swell after an
intense exercise session (Farup et al., 2015). This swelling has been suggested to occur partly
through the osmotic effect of lactic acid that accumulates following exercise (Usher‐Smith et
al., 2006), but also possibly through cation accumulation in the cells (Kemp, 2007). The
reported stimulation of System A amino acid transporters by exercise (Henriksen et al., 1992,
Henriksen et al., 1993, King, 1994) may also lead to accumulation of amino acid osmolytes
e.g. L-glutamine in the cells (Figure 1.6). In primary rat myotubes, swelling in a hypoosmotic
culture medium increases glutamine uptake by 71% more than isotonic culture medium
(Wackerhage et al., 2018). However, integrin or cytoskeleton inhibitors prevent this uptake,
indicating that the swelling is dependent on integrins and the cytoskeleton (Low and Taylor,
1998). Together these data suggest that differentiated muscle can respond to cell swelling with
increased glutamine uptake and that this depends on integrin or cytoskeletal loading
(Wackerhage et al., 2018). Intracellular L-glutamine is required for the uptake of protein
synthesis-stimulating essential amino acids, such as L-leucine (Figure 1.6) (Nicklin et al.,
2009), although it is unclear whether the swelling is enough to mechanically load the
cytoskeleton, as well as whether cytoskeletal loading after resistance exercise is responsible
for glutamine uptake and protein synthesis (Miller et al., 2005). After exercise-induced muscle
damage, muscles can be swollen for several days (Yu et al., 2013), even when muscle protein
synthesis should have returned to baseline (Miller et al., 2005). Given that costameres are the
sites where the cytoskeleton connects to the extracellular matrix and where mechanical signals

22
can be sensed, it is probable that fibre swelling will strain costameres, thereby triggering a
hypertrophic response (Wackerhage et al., 2018).
1.11 The effect of mechanical stress on MAP kinases and System A / SNAT2
Downstream from FAK in the signalling pathways described above there is activation of the
mitogen-activated protein kinases (MAPKs) in muscle (Aronson et al., 1997). Mechanical
loading, including mechanical stretch, can activate MAPK pathways, including p38 mitogen-
activated protein kinase (Chambers et al., 2009a). A consequence of this may be activation of
the anabolic System A sodium-coupled neutral amino acid transporter SNAT2 (slc38a2) which
has been shown to be activated in mammalian cells by a range of different stimuli, mediated
by MAPKs such as p38 (Aye et al., 2015, Bevington et al., 1998b, Lang, 2007). The activation
of System A/SNAT2 also occurs in ex vivo preparations of skeletal muscle following muscular
exertion in vivo (King, 1994, Henriksen et al., 1992, Henriksen et al., 1993). MAPK activation
may therefore be a significant intermediate step between mechanotransduction/FAK/Yap
activation and System A/SNAT2, mTORC1 activation and IL-6 protein synthesis (see Section
1.15 and Figure 1.7).
1.12 Mitogen-activated protein kinases (MAPKs)
The mammalian MAPKs consist of serine/threonine kinases which can respond to extracellular
signals, including hormones, osmotic stress, mechanical stress (Section 1.10) and pro-
inflammatory cytokines (Widmann et al., 1999). They can transfer these signals at an
intracellular level, sending them into the nucleus and regulating different cell functions, such
as proliferation, differentiation and gene expression (Cargnello and Roux, 2011a). There are
several groups of MAPKs that can be expressed in mammals, for example extracellular signal-
related kinases 1/2 (ERK 1/2), c- Jun amino (N)-terminal kinases 1/2/3 (JNK1/2/3), p38
isoforms α/β/γ/δ (p38 α/β/γ/δ), and ERK5 (Cargnello and Roux, 2011a, Chang and Karin,
2001). There are also atypical MAPK groups, which comprise ERK 3/4, ERK 7 and Nemo-
like kinase (NLK) (Cargnello and Roux, 2011a). Among MAPK groups, particular focus has
been given to the study of ERK 1/2, JNKs and p38 isoforms. The signaling pathways for
MAPKs consist of at least three steps: a MAP kinase kinase kinase (MAP3K), a MAP kinase
kinase (MAP2K), and a MAPK (Roskoski, 2012). MAPK activation results in phosphorylation
of certain transcription factors and proteins, which lie downstream and facilitate the cellular
functions of these kinases. Of particular relevance here is the activation of IL-6 transcription
by nuclear p38 and possibly JNK during Ca2+ - dependent muscle contraction ((Chan et al.,

23
2004b)and Section 1.7.1). In addition to the kinases themselves, there are a number of
scaffolding proteins that interact with one another and with the kinases to transduce signals and
promote the different cell functions (Roskoski, 2012). For example, the scaffolds involved in
the signalling pathway for ERK 1/2 are kinase suppressors of Ras (KSR) and MP1, while the
JNK-interacting protein group (JIP) are the scaffolds for the JNK pathway.
1.12.1 ERKs
The primary structure of ERK 1 and 2 proteins shows approximately 83% amino acid sequence
homology, as well as sharing almost the same biochemical function (Roskoski, 2012). They
are expressed in many tissues, such as skeletal muscle, the brain, and the heart (Cargnello and
Roux, 2011a). ERK can be activated by several stimuli, including growth factors like platelet-
derived growth factor (PDGF), epidermal growth factor (EGF), and insulin. While human ERK
1 is composed of 379 amino acids, rat and mouse ERK 1 enzyme is composed of 380 amino
acid residues. ERK 2 consists of 360 amino acid residues in humans and 358 residues in rats
and mice. The activation of ERK MAP kinase starts when an extracellular signal such as EGF
activates a transmembrane receptor tyrosine kinase (RTK). This leads to the recruitment of
growth factor receptor-bound protein 2 (Grb2), which will eventually be combined to the
guanine nucleotide exchange factor son of sevenless (SOS) (Ramos, 2008). During the next
stage, SOS binds to RAS which will then be converted to an active form by the removal of the
guanosine diphosphate (GDP) from RAS, which is replaced by guanosine-5'-triphosphate
(GTP). Downstream phosphorylation signals then lead to the activation of RAF, MEK and
ERK (Ramos, 2008). Following this activation by phosphorylation, ERK is released from MEK
and regulates a number of important functions in the nucleus, including transcriptional
regulation of gene expression. ERK activation has been shown to occur in skeletal muscle
following physical exercise. For instance, a study performed in humans found that ERK 1/2
was highly phosphorylated in the skeletal muscle of people who performed resistance exercise
in comparison to those who did not (Williamson et al., 2003).
1.12.2 JNKs
JNK has been described as a prime example of a stress-activated protein kinase (SAPK) and is
considered as a member of the cycloheximide actvated-MAP-2 kinase family, which can be
affinity purified by using c-Jun protein bound to beads (Hibi et al., 1993, Kyriakis and Avruch,
1990). Stress stimuli enhance the phosphorylation of JNK through Threonine and Tyrosine
residues, as has also been found in ERKs (Kyriakis et al., 1991, Kyriakis and Avruch, 1996).

24
There are three isoforms of JNKs, JNK1, JNK2 and JNK3, which can also be called SAPKγ,
SAPKα and SAPKβ respectively (Cargnello and Roux, 2011a). There is more than 85%
sequence similarity between the JNK isoforms, which are encoded by three genes encoding
proteins with molecular weight that ranges from 46 to 55 kilo Dalton. JNK1 and JNK2 can be
found in many tissues in the body, but JNK3 is limited to a small number of isolated locations,
including neuronal tissue and cardiac myocytes (Cargnello and Roux, 2011a). Different stimuli
can lead to the activation of JNKs such as cytokines, heat shock and UV irradiation. JNKs play
an important role in the regulation of gene expression through phosphorylation of c-Jun due
the fact that it is part of the activated protein 1 (AP-1) complex, which is responsible for
controlling cytokine gene expression (Johnson and Lapadat, 2002) including the IL-6 gene in
which AP-1 is one of the cis-acting factors which binds to a key 1.2kb fragment within the 5’-
flanking region of the IL-6 gene (Figure 1.3). AP-1 is a heterodimer protein, which consists of
proteins belong to Jun, Fos, Maf and ATF families (Johnson and Nakamura, 2007). AP-1 can
be stimulated in response to a variety of different environmental stimuli, many of which are
the same as those that lead to the activation of JNKs. The activation process of the JNK pathway
begins when stimuli, such as cytokines, interact with their receptor in the cell surface. This is
followed by MAP3K activation (Weston and Davis, 2007). After that MKK4 and MKK7,
which are isoforms of MAP2K, are activated, followed by the activation and phosphorylation
of JNK. Eccentric contraction in human skeletal muscle has also been demonstrated to lead to
higher activity of JNK phosphorylation than occurs with concentric contraction (Boppart et al.,
1999).
1.12.3 p38 isoforms
There are four isoforms of p38; p38α, p38β, p38γ and p38δ, the best known of which is p38α,
because of its existence in many cell types (Johnson and Lapadat, 2002). Many stimuli have
been found to lead to the activation of p38, including osmotic shock, heat shock, mechanical
stress and inflammatory cytokines (Johnson and Lapadat, 2002, Boppart et al., 2001). The
activation of p38 begins when a stimulus such as IL-1 leads to the recruitment of TNF
Receptor-Associated Factor-6 (TRAF6), which in turn causes the activation of MAPK kinase
kinases (MAP3K) and the phosphorylation of Transforming growth factor beta-activated
kinase 1 (TAK1) and then finally the activation and phosphorylation of p38 through MKK3
and MKK6 activation (Cuenda and Rousseau, 2007). In mouse myoblast cell line C2C12, p38
was found to be an important MAPK that can lead to the differentiation of myoblasts to
myotubes (Cuenda and Cohen, 1999). Blocking p38 with a pharmacological inhibitor has been

25
shown to prevent myoblasts from transforming to myotubes. Inhibition of p38 has been
suggested as a therapeutic target in RA, which is characterised by a dysregulation of pro-
inflammatory cytokines such as TNF-α, IL-1 and IL-8 (Thalhamer et al., 2008). There was a
detectable phospho-activation of p38 in rat skeletal muscle in response to resistance exercise,
and in humans in response to cycling exercise (Chan et al., 2004b) suggesting that p38 is
activated in response to the mechanical stress of muscle contraction (Boppart et al., 2001).
1.13 In vitro cell stretching
In their review of in vitro models of skeletal muscle stretching, Passey et al. (2011) state that
“skeletal muscle tissue possesses a high degree of plasticity in that it has the ability to adapt
specifically to the functional demands placed upon it or alterations in its environment”. It does
this by reacting to variation in numerous factors, including the availability of specific amino
acids, neuronal stimulation, the levels of cytokines or growth factors, or mechanical loading.
This last variable represents the type of stress that can occur during resistance training or
moderate exercise (Passey et al., 2011). In response to these stimuli, the muscle increases
protein synthesis, which facilitates improved metabolism and muscle contraction capacity,
which in turn results in eventual muscle hypertrophy. As it is widely believed that in vitro
models (and some commonly used in vivo models) may be unable to accurately represent the
normal physiological responses to exercise training, studies have tended to utilise human
subjects and animal models to examine the molecular mechanisms that enable this kind of
adaptive process (Spangenburg, 2009, Passey et al., 2011). However, in pursuit of experimental
environments that allow for accurate control of study variables, it is desirable to develop in
vitro model systems that are able to effectively model in vivo conditions (Passey et al., 2011).
The most successful of these model systems have important similarities with muscle in vivo,
as outlined below.
The most important tissue in glucose uptake and homeostasis in vivo is skeletal muscle (Abdul-
Ghani and DeFronzo, 2010, Passey et al., 2011). Observations of muscle performance
conducted in vitro and in vivo have noted that during exercise there is an increase in glucose
uptake (Rose and Richter, 2005) and lactate efflux, and this has reproduced in vitro through
application of the Vandenburgh system of stretch-relaxation protocols to muscle cultures. This
was originally described in embryonic chicken myotube cultures mounted on a stretchable
elastic membrane (Hatfaludy et al., 1989). In vitro stretch also enabled a calcium-dependent
mechanism for glucose uptake to be demonstrated in skeletal muscle cells (Iwata et al., 2007),

26
which has been supported by in vivo studies of post-exercise calcium mediated glucose uptake
(Santos et al., 2008).
In vitro and in vivo stretching of skeletal muscle can lead to the activation of many growth
factors that eventually lead to the enhancement of protein synthesis and cell growth (Rauch
and Loughna, 2005a). Stretching mouse C2C12 myocytes using passive static stretch tools
(static Loughna cell stretching assemblies (Rauch and Loughna, 2005b, Rauch and Loughna,
2008b)) shows that p38 phosphorylation is increased in stretched cells when compared to the
levels in non-stretched cells (Rauch and Loughna, 2005a). The previous findings of Boppart et
al. (2001) in a study of rat skeletal muscle in vivo after resistance exercise showed that p38 also
undergoes increased phosphorylation in vivo (Boppart et al., 2001) and this has also been
observed following cycling exercise in humans (Chan et al., 2004b).
The development of skeletal muscle cells in vitro has many of the same patterns as in vivo,
including increased levels of organizing muscle-specific proteins and the conversion of satellite
cells to mature working multinucleated contractile myotubes (Stockdale and Miller, 1987,
Vandenburgh et al., 1989). A study of skeletal muscle in vitro can be used in terms of measuring
protein turnover regulation and cell proliferation (Vandenburgh et al., 1989). Mechanical
stimulation through repetitive intermittent stretch-relaxing computerised tools was used in vitro
in avian tissue culture, showing elevated protein synthesis and reduced protein degradation,
which supports in vivo studies that show mechanical activity can increase protein synthesis
(Vandenburgh et al., 1989, Hornberger et al., 2006b). The response of passive stretching on
skeletal muscle in vitro has been shown to have the same response patterns as in vivo and organ-
cultured skeletal muscle (Vandenburgh et al., 1989).
C2C12 skeletal myotube cultures have also been stretched using a commercial vacuum-driven
Flexercell (FX-3000) device to investigate the way that glucose uptake is affected by the 5′
adenosine monophosphate-activated protein kinase (AMPK), which is considered as a
metabolic sensor in skeletal muscle (Chambers et al., 2009a). In this way, stretching was shown
to stimulate glucose uptake depending on p38 activity: when p38 was blocked with the
inhibitors SB203580 and A304000 the glucose uptake was reduced; whereas the glucose
uptake was not affected when AMPK-α and PI3-K/Akt were inhibited.
Mechanical activity can lead to variation in protein synthesis, as there is a reduction during
heavy muscular activity followed by an increase that depends on the availability of amino acids
(Atherton et al., 2009b). In order to understand the mechanism behind this, Atherton et al.

27
(2009) used cyclic stretching to mimic eccentric contraction utilising myotubes that were
differentiated from L6 skeletal myoblasts and plated in type I collagen coated Bio-flex six-well
Flexcell plates (Atherton et al., 2009b). A computerised vacuum system then performed cyclic
stretching using a Flexercell FX4000T (Flexcell International). Time was shown to play an
important role in increasing protein synthesis in accordance with increases in mTOR, P70S6K,
and 4E-BP1 post-exercise (Atherton et al., 2009a). Hornberger and Chien (2006) performed a
study on skeletal muscles (ex vivo), which were stimulated by intermittent mechanical
stretching, leading to increased protein synthesis in accordance with high activity of the
phosphorylation of P70S6K. Since the bulk of this project will test different conditions using
in vitro stretching, it should be noted that previous papers found that in vivo and in vitro
stretching outcomes match in many parameters. For instance, Dreyer et al. (2006) observed
that the level of protein synthesis was lower during resistance exercises in human subjects and
was elevated post exercise (Dreyer et al., 2006). The same finding was also observed using in
vitro stretching using cyclic cell stretching, as discussed above (Atherton et al., 2009b).
Resistance exercise was also shown to increase mTOR activity (Dreyer et al., 2010), which
supported the observation that passive stretching of skeletal muscle ex vivo can increase mTOR
activity (Hornberger et al., 2004). Furthermore, there was an increase of glucose metabolism
within human subjects who performed as mentioned earlier (Rose and Richter, 2005, Passey et
al., 2011), which supported the observation by (Hatfaludy et al., 1989), which used an in vitro
cell stretching model.
The commonly available commercial Flexercell system (see Chapter 2) for cell stretching uses
a partial vacuum applied under a stretchable culture plate to stretch cell monolayers. An
advantage of this system is that it is convenient, using commercially available multi-well plates
rather than relatively fragile stretchable elastic membranes mounted in stretching frames
(Hatfaludy et al., 1989) or myotubes stretched in a 3-dimensional collagen gel matrix (Powell
et al., 2002, Cheema et al., 2003, Passey et al., 2011). While the latter provide an excellent
physiological environment of extracellular matrix, they are difficult to use for experiments
which require rapid physical access to the cells, for example in amino acid transport studies
using radio-labelled amino acid and rapid rinsing of the cells.
A potential limitation of the Flexercell vacuum system however is that (by definition) applying
a partial vacuum in a cell culture incubator reduces the oxygen and carbon dioxide
concentration under the stretched cell monolayer, thus possibly affecting oxygenation and pH
buffering; and vacuum could in principle also lead to vacuum cooling (Annaratone et al., 2013).

28
For this reason, the work described in this thesis compares three systems for stretching cells
on Flexcell silicone plates (Chapter 2) i.e. (1) an in vitro model of continuous mechanical
stretch in L6 skeletal muscle cells (using static Loughna cell stretching assemblies) (Rauch and
Loughna, 2008b); (2) a vacuum-driven “Pull” system, generating a partial vacuum under the
culture wells using a Flexercell system ( FX-4000) and (3) using a purpose-built mechanical
“Push” system which did not involve the potential confounding factor of a vacuum during
stretching.
1.14 The choice of the in vitro model of skeletal muscle used in this project
For in vitro studies, a common approach is to utilise ex vivo muscle preparations, using refined
myograph systems (e.g. Kent Scientific, Torrington, CT, U.S.A.) to mechanically stimulate
isolated rodent skeletal muscle (Hornberger et al., 2004). A key issue with such in vitro
preparations is that they lack a physiological blood supply and may therefore suffer from
hypoxia, unless small bundles of isolated muscle fibres are used. However, the isolated fibre
bundle preparation method requires micro-dissection, which is extremely time- and labour-
intensive (Wendowski et al., 2017).
Human myotubes are also an excellent cell culture model for skeletal muscle studies and have
been widely used in the literature, although variation between donors potentially increases the
degree of variation in the system. These myotubes can be isolated from dormant satellite cells
in adult skeletal muscles using either enzymatic digestion or cell migration from intact tissue
(Aas et al., 2013), after which they can be differentiated in vitro into multinucleated myotubes.
The capacity of human myotubes to grow, differentiate and undergo passaging is also more
inconsistent, limited, and variable than in immortalised cell lines (Aas et al., 2013). These
issues are exacerbated over time, with increasing passage numbers seeing a corresponding
decline in their morphology, metabolic capacity and the ability to fuse to form myotubes (Aas
et al., 2013). Previous studies have found that human skeletal muscle myotubes require
stimulation by neuronal contacts in order to achieve spontaneous contraction(Aas et al., 2013).
Similar observations have almost been made regarding the inability of rodent cell cultures to
achieve spontaneous contraction (Guo et al., 2014).
Due to the aforementioned limitations, studies extensively rely upon myotubes grown from
immortalised myoblast cell lines e.g. the L6 rat myoblast line and C2C12, a mouse myoblast
line, (Philp et al., 2010, Philp et al., 2011). However, C2C12 myotubes are only of limited use
in studies of acidosis-induced protein degradation, because they cause rapid acidification of the

29
culture medium. Lower acidification rates were found with the L6 sub-clone L6-G8C5
(Bevington et al., 1998a). It is possible to obtain highly differentiated L6-G8C5 myotubes by
pre-treatment using retinoic acid and IGF-1 (Elsner et al., 1998). However, the present study
did not utilise this approach as previous work from this laboratory (Pickering et al., 2003)
suggested that they give a limited response to some catabolic stimuli for example
glucocorticoid and acidosis (low pH). Pilot experiments in this laboratory (Dr E Watson –
personal communication) indicate that cultured human myotubes may fail to show the protein
catabolic response to acidosis that is observed in humans in vivo (Reaich et al., 1993). For this
reason, the present study used spontaneously fused L6-G8C5 myotubes, which this laboratory
has previously demonstrated shows a marked protein catabolic response and impaired protein
synthesis in response to low pH, and expresses SNAT2 pH sensitive amino acid transporters
as the predominant isoform of System A amino acid transporter (Evans, 2009, Blbas, 2018,
Evans et al., 2007b, Evans et al., 2008b).
1.15 Hypothesis
The hypothesis to be tested in this project (using L6-G8C5 rat skeletal muscle cells as a pH-
responsive in vitro model) is that the expression and biosynthesis of IL-6 in skeletal muscle
cells is:
a) stimulated by FAK and MAP kinases (p38 and JNK) and dependent on the System
A/SNAT2 amino acid transporter, and
b) inhibited by low extracellular pH acting through an inhibitory effect on MAP kinase
activation and on System A/SNAT2 transporters
This hypothesis is summarised in the pictorial scheme shown in Figure 1.7.
This is of potential clinical and physiological importance because it provides a possible
molecular explanation for the reported suppression of the release of IL-6 from exercising
skeletal muscle following lactic acid accumulation that has been reported in patients who are
prone to lactic acidosis owing to mitochondrial myopathy (Steensberg et al., 2001b). Whether
the lactate anion itself contributes to this effect is unknown, but a possible explanation is that
lactic acidosis (and its associated fall in muscle pH) may play a role. If this is true, an impaired
IL-6 response to exercise may also occur in other acidotic patients (for example those with
CKD) or in individuals who show marked lactic acidosis in response to exercise.

30
The model in Figure 1.7 is based on the following principal experimental observations that
were reviewed above:
The inverse correlation between the plasma concentrations of IL-6 and lactate following
exercise in patients with mitochondrial myopathy (Steensberg et al., 2001b)
The observation that p38 MAPK activation in L6 myotubes is a potent stimulator of IL-
6 mRNA expression (Chan et al., 2004a).
Studies of patients with CKD which showed depletion of free amino acids present in
muscles in vivo following walking exercise, and the prevention of this effect by
administering bicarbonate supplements to minimise acidosis (Watson et al., 2013).
Evidence that inhibition of System A/SNAT2 transporters in L6-G8C5 cells by low
extracellular pH depletes free amino acid pools in the cells, impairs mTORC1 signalling
and global protein synthesis, and is mimicked by pharmacological inhibition or siRNA
silencing of System A/SNAT2 (Evans et al., 2007b).
Evidence that exercise in vivo activates p38 (Boppart et al., 2001).and JNK (Boppart
et al., 1999) and System A transport activity(Henriksen et al., 1992, Henriksen et al.,
1993, King, 1994).
The model in Figure1.7 was also supported by the following pilot data that was available in
this laboratory at the start of this project:
A preliminary observation of impaired phospho-activation of JNK in cultured L6-G8C5
myotubes following incubation at low extracellular pH (Evans K.F. - unpublished
observations)
An unpublished observation of inhibition of System A/SNAT2 transport activity in L6-
G8C5 myotubes following pharmacological inhibition of JNK or p38 MAP kinase
(Blbas, 2018).
The observation using L6-G8C5 myoblasts, that siRNA silencing of SNAT2 can impair
phosphoactivation of the MAP kinase JNK (Blbas, 2018).
A trial of the effect of prolonged (17 or 48h)mechanical stretching of L6-G8C5
myotubes which showed an apparent stimulation of System A/SNAT2 transport activity
(Clapp, 2010).

31
Figure 1.7. Schematic diagram showing how SNAT2, mechanical stretch and MAPK activation may be linked, and impaired by low pH, in L6-G8C5 cells.
The experimental aims of this study were to test the model in Figure 1.7 in L6-G8C5
cells in 3 phases as follows:
1) Chapter 3 to assess the effect of pharmacological inhibition of MAPKs on System A
SNAT2) amino acid transport activity in L6 skeletal muscle cells, to determine the
effect of mechanical loading on MAPKs, and to observe the effect of low pH on these
MAPKs.
2) Chapter 4 to set up 3 in vitro models of mechanical stretch and use these to reproduce
and characterise further the apparent System A/SNAT2 activation by in vitro cell
stretch that had been reported in pilot experiments (Clapp, 2010).
3) Chapter 5 to reproduce the previously reported p38 MAP kinase-dependent
stimulation of IL-6 mRNA expression in L6 myotubes in response to ionomycin (Chan
et al., 2004b), and to use this experimental system to investigate the effects of low pH
predicted in Figure 1.7.

32
Chapter 2: Materials and Methods
2.1 General materials and reagents
All chemicals and reagents, including those of molecular grade, were purchased from Sigma
unless explicitly stated otherwise. The following sources were utilised in the acquisition of
sterile consumables for tissue culture: Petri dishes and 35 mm diameter 6-wells (Thermo
Scientific); 96 well plates (Sarstedt); 22mm diameter 12-well plates (non-pyrogenic sterile
polystyrene) (Corning Costar); and type I collagen coated Bio-flex 6-well plates (ref. BF-
3001C, Flexcell International Corporation, NC, USA).
2.2 Cell culture models
2.2.1 L6 cells
L6-G8C5 is a sub-clone of the rat skeletal muscle cell line L6 (Yaffe, 1968). The justification
of this choice of culture model is described in detail in Section 1.8, Chapter 1. When cultured
in a low serum medium, L6-G8C5 fuses to form myotubes (Elsner et al., 1998). This skeletal
muscle cell model has been used in the investigation of experimental manipulations, such as
acidosis and their effects on global protein metabolism in muscle (Bevington et al., 1998b,
Bevington et al., 2001, Bevington et al., 2002, Pickering et al., 2003, Evans et al., 2008a, Evans
et al., 2007a, Clapp, 2010, Atherton et al., 2009a, Blbas, 2018), making it highly suitable for
the current study. In addition, it is simple to culture L6-G8C5, and SNAT2 is strongly
expressed in these cells (Evans, 2009). Stocks were acquired from ECACC (European
Collection of Animal Cell Cultures) (ref. 9212111) and were used at passage number (10-20).
2.2.2 Screening cultures for mycoplasma contamination
Stock cultures were screened for mycoplasma contamination using the EZ-PCR Mycoplasma
Test Kit (GENEFLOW; 20-700-10). The assay was done as described in the manufacturer’s
instructions. The assay relies on PCR amplification of a mycoplasma-specific region in the 16S
rRNA gene, followed by agarose gel electrophoresis to detect amplified DNA fragments. The
assay detects 96 mycoplasma species as well as acholeplasma and spiroplasma species
according to the manufacturer’s stated assay specificities.

33
Figure 2.1. PCR gel electrophoresis to screen for mycoplasma contamination in cultures of L6-G8C5 cells.
(Lane 1) molecular ladder; (Lane 2) positive control provided in the kit; (Lane 3) negative control (water).; (Lane 4) sample derived from growing stock L6-G8C5 culture (35 PCR amplification cycles were applied). The prominent 270bp band in Lane 2 is a mycoplasma DNA amplicon, The 357bp band is an internal control to guard against false negative results arising from inhibition of the PCR reaction by mycoplasma. The faint ~ 100bp band is an artefact arising from self-annealing of the primers.
2.2.3 L6-cells, maintenance and passaging
The cells were plated in 9cm Petri dishes at 10×104 cells per Petri in Growth Medium (GM),
comprising Dulbecco's Modified Eagle Medium (DMEM-Life Technologies 11880-028)
(Appendix A.1), which contains 5mM D-glucose and added pyruvate, supplemented with
10mg Phenol Red/l (Sigma-P5530), 100U/ml Penicillin G, 100µg/ml Streptomycin, 2mM L-
glutamine and 10% v/v batch-tested foetal bovine serum (FBS) that had been heat inactivated
at 56oC for 30 minutes before use. The plated cells were then grown in a culture incubator
under humidified air at 37°C, 5% CO2 until they reached ~80% confluence, after which they
were passaged. (Care was taken to ensure that propagating stocks were not allowed to become
confluent as this leads to formation of non-proliferating fused myotubes, thus eliminating the
most myogenic cells from the population). For passaging, the GM was aspirated and each Petri
dish was rinsed with 5ml of (1x) Hank’s Balanced Salt Solution (HBSS, Life Technologies-
1754651) (Appendix A.3), then incubated with 2ml of (1x) Trypsin-EDTA (T/E) (Invitrogen
25300) for 10 min at 37°C in the culture incubator to detach the cells from the Petri. The cells
were re-suspended in 10ml of the GM described above and centrifuged at 500g for 5 minutes.
After this, the supernatant was discarded, the cell pellet was re-suspended in 10ml of GM, and
the suspension counted using a haemocytometer and re-plated at 10x104 cells/9cm Petri dish
in 15ml of GM for the maintenance of stock cells.

34
2.2.4 Preparing L6 myoblasts for experiments
Certain experiments utilised unfused L6 myoblasts (i.e. those that had not formed myotubes
from prior fusion of the cells) by seeding at a plating density of 43×104 per well on Bio-flex
6-well plates of the required size containing the GM (see Section 2.2.3). Cells were left in GM
for three days before performed experiments.
2.2.5 L6-myotube formation
To obtain differentiated myotubes for experiments, the requisite L6 myoblasts were cultured
in GM at the plating density noted above (see Section 2.2.4) (Figure 2.2A), then the serum
content of the medium was reduced to 2% after 72 hours. The GM was aspirated and the ~70-
80% confluent cultures were incubated in Minimum Essential Medium (MEM) (Invitrogen
21090-022), supplemented with 100U/ml Penicillin G, 100µg/ml Streptomycin, 2mM L-
glutamine and 2% v/v heat inactivated foetal bovine serum (FBS) to induce fusion and
formation of myotubes. The cultures were provided every two days with fresh medium (2%
FBS in MEM, as described above), until day 8, when the myotubes were ready for experimental
incubations (Figure 2.2.B).
Figure 2.2. Photographs of L6-G8C5 cells.
(A) Sub-confluent L6-G8C5 myoblasts following 3 days of incubation in Growth Medium with 10% v/v foetal bovine serum (FBS). (B) L6-G8C5 myotubes after 3 additional days of incubating L6-myoblasts with 2% FBS in MEM, 100X magnification.
A B

35
2.3 Passive continuous stretch technique
The process utilised in the current study was adapted from the approach described by Rauch
and Loughna (Rauch and Loughna, 2008a) (Figure 2.3). This involved the seeding of L6-G8C5
cells on 35mm type I collagen coated Bio-flex 6-well plates (Flexcell International
Corporation, NC, USA, BF-3001C). After they had fused to form myotubes, a series of 15mm
diameter glass marbles embedded in a block of Perspex (one marble per well) was placed
underneath each of the wells (as shown in Fig 2.3A). Then, a 3kg weight was placed on top of
the culture plate, creating an approximately 18% linear stretch of the culture surface. The linear
stretch was calculated as described in (Rauch and Loughna, 2008a) by measuring the vertical
movement of the culture plate (using a mm rule) and the known radius of the culture well (and
then applying Pythagoras’ Theorem). The relationship between vertical movement, % stretch
and the weight applied in Kg is shown in Fig 2.4B (Clapp, 2010).
Figure 2.3. The in vitro model of continuous mechanical stretch comprising.
A) Marbles embedded in a block of Perspex, B) A 35mm type I collagen coated Bio-flex well plate,. C) a 3kg weight. D) the complete assembly with all components in place.
A B
C D

36
Figure 2.4. Estimation of linear stretch of the cultures in the previous figure. (A) the proportional relationship between the measured vertical movement of the highest point on the culture surface and the loads applied to the top of the culture plate. (B) the estimated linear stretch of the L6-G8C5 myotubes. (Redrawn from (Clapp, 2010).
2.4 Cyclic stretch by vacuum suction – the “pull” technique
L6-G8C5 cells were seeded on type I collagen coated Bio-flex 6-well Flexcell plates and
stretched using a computer-controlled vacuum suction Flexercell Strain Unit FX-4000
(Flexcell International Corporation, NC, USA) (Figure 2.5). Cells were cyclically stretched
using the protocol originally described in (Goto et al., 2003) comprising a 2 second sine wave
stretch with a 4 second release that resulting in an 18% maximum stretch as shown in Figure
2.6. In each experiment, a second Flexcell plate of cells was simultaneously incubated on the
same vacuum manifold under exactly the same conditions, but the orifice in the manifold
through which the vacuum was drawn was blocked (as shown in Figure 2.5D) thus preventing
stretching, in order to act as a negative control. This was done to control for any non-specific
effects arising from mounting the Flexcell plate in the vacuum manifold e.g. local variation in
temperature, humidity or pCO2.

37
Figure 2.5. An illustration of the FX-4000 cell stretching system.
A) Overview of the system from the manufacturer’s website (www.flexcellint.com); B) The strain control units coupled to a PC; C) The vacuum airflow regulators mounted between the vacuum pump and the vacuum manifold; D) The vacuum manifold mounted in the culture incubator, showing one of the red rubber seals in which the stretchable culture plate is mounted, and the adjacent mountings in which the vacuum orifice has been blocked with masking tape.
ww.flexcellint.com
A B
C D

38
Figure 2.6. This figure shows the time course of the stretch applied to L6-G8C5 myotubes during cyclic stretch, comprising a 2 second sine wave stretch with a 4 second release resulting in a maximum 18% linear stretch (Goto et al., 2003).
2.5 Cyclic stretch by motor-driven pistons – the “push” technique
To allow mechanical stretch to be applied to Flexcell plates without the need for a vacuum-
driven computer-controlled stretching system, a motor-driven system of pistons was designed
to apply force to the stretchable culture surface by pushing from below. This was designed and
manufactured in collaboration with Mr Praful Chauhan (Biomedical Joint Workshops
Manager, Core Biotechnology Services, University of Leicester). Rather than pulling the cells
attached to the membrane using negative pressure, as in the FX-4000, it instead pushes them
upwards intermittently. This was done by mounting the Flexcell plate in a stationary black steel
frame (Figure 2.7). Stretching was achieved (as in the static Rauch and Loughna method –
Section 2.3) by vertical motion of pistons (capped with silver-coloured steel hemispheres)
(Figure 2.7) and mounted on a cradle which was driven up and down by a direct-current (DC)
motor. The amount of vertical travel of the steel hemispheres was adjusted to give the same
amount of vertical displacement of the floor of the culture well as on the Rauch and Loughna
assembly (Figure 2.4A). This vertical travel was adjustable by means of a screw thread under
each steel hemisphere. The “up-delay” or “down-delay” in the motion of the cradle at its limits
of travel was also adjustable by means of controls on the front of the instrument (Figure 2.7).

39
This allowed the time course of the stretch pattern to be adjusted to approximate to that of the
vacuum system shown in Figure 2.6.
A

40
Figure 2.7. Images showing the push-based system for cell stretching driven by a direct-current (DC) motor .A) the push system mounted in the culture incubator with the culture plate removed to show the silver-coloured steel hemispheres on top of the pistons. The pistons are lowered in this image. The control unit which controls time and stretch regimens can be seen in the top half of the image. B) Showing the white Bio-flex culture plate mounted in its black steel frame, with the pistons partly raised underneath it.
2.6 Medium for experimental incubations
The basal medium utilised in creating the experimental test media was Minimum Essential
Medium (MEM) (Invitrogen 21090-022) (Appendix A.2), which was supplemented with
100U/ml Penicillin G, 100µg/ml Streptomycin, and 2mM L-glutamine. When the test media
required serum, the selected source was 2% v/v heat-inactivated Dialysed Foetal Bovine Serum
(DFBS, Invitrogen ref 26400).
As MEM has an approximate pH of 7.33 in a 5% CO2 atmosphere, and is further acidified to
7.26 when cultured for 24 hours with confluent L6-G8C5 myotubes (Table 1 in (Bevington et
al., 1998b) ) all experimental incubations at the physiological pH of 7.4 were conducted
through the addition of an additional 8mM NaHCO3 to the medium. To achieve pH values of
7.1 or 7.7, the pH was adjusted by addition of HCl or further NaHCO3 respectively. As adding
NaHCO3 involves adding a Na+ load, the Na+ concentration was kept constant in such pH
B

41
variation experiments by addition of the required amount of NaCl. Other variations in the
experimental test media are specifically noted in the figure legends in the results chapters.
2.7 Protein assays
Measurement of the total protein concentration of the cell cultures was carried out through
the use of a Folin (Lowry) protein assay (Lowry et al., 1951). Protein in lysates intended for
Western blotting was analysed using the BioRad Detergent Compatible (DC) assay (BioRad,
UK, 500-0116).
2.7.1 Lowry Protein Assay
The total protein content of cell lysates in transport activity experiments was measured using
the Lowry protein assay (Folin assay) (Lowry et al., 1951). The protein content in the samples
was calibrated using BSA protein standards (Appendix B.4) made up at 0 to 500μg / ml in
0.5M NaOH. Each assay was conducted as follows: fresh Reagent C was prepared by
combining Reagent A and Reagent B (see Appendix B.2 and B.3 respectively) in a ratio of
50:1 (A:B v/v); and Ciocalteu’s Folin phenol reagent (Sigma F-9252) was 3-fold diluted with
ultra-pure water in a ratio of 1:2 v/v. Then 600µl of Reagent C was added to 50µl of BSA
standards or cell protein samples in 0.5M NaOH, and immediately vortexed. After exactly 10
min, 60µl of the diluted Ciocalteu reagent was added and vortexed again. Finally, the mixture
was incubated at room temperature for 30 min. The OD was read at 650nm using a Titertek
Multiskan Plus MKII spectrophotometer and the protein concentration of the samples was
calculated by linear interpolation using the optical density of the protein standards.
2.7.2 Bio-Rad detergent-compatible (DC) protein assay
The Lysis Buffer (Appendix B.5.1) utilised in the preparation of cells for Western blotting
(Section 2.9) contained detergent. As this interferes with the Lowry protein assay, a Bio-Rad
detergent-compatible (DC) protein assay kit (Bio-Rad 500-0113) was utilised in measuring the
protein content of the cell lysates for Western blotting. In this kit, Reagent A comprises an
alkaline copper tartrate solution (with 20μl of supplementary reagent S added to each ml of
reagent) and Reagent B, which is a diluted Folin-like reagent. The following process was used
for the assay: 5µl of cell lysate or standards (0-2000µg/ml BSA in 1% IGEPAL detergent) was
added to 96 well plates in triplicate, then 25µl of kit Reagent A and 200 µl of Reagent B was
added to each well, and incubated at room temperature for 15 min. The absorbance was read at
750nm and the protein concentration in the samples was calculated using the optical density of
the protein standards.

42
2.8 Enzyme-linked Immunosorbent assay (ELISA) for IL-6
Enzyme-linked Immunosorbent assay (ELISA) was performed for supernatants collected from
L6 cell supernatants. An ELISA kit from R&D (R&D, R6000B) was used to measure IL-6
secretions under different experimental conditions. Standards were set up at 8 concentrations
from 0 to 4000 pg/ml to to create a calibration curve. Standards, samples and a recombinant
IL-6 positive control were added to wells of 96-well plates which had been pre-coated with
capture antibody (provided with kit R6000B), and incubated for two hours at room temperature.
The solutions were then discarded and an ELISA washing buffer which was provided with the
kit was used to wash the plates five times, following which a 100μl aliquot of an HRP
conjugated anti-Rat IL6 antibody was added to each well and then incubated again for two
hours at room temperature. The solutions were then discarded and the ELISA washing buffer
was used to wash the plates another five times. After this 100μl of Substrate Solution was added
to each well and then incubated for 30 min at room temperature and was protected from light.
Finally, plates were read on a 96 well microplate reader (Varioskan Flash, ThermoFisher) at
an assay wavelength of 450 nm and at a control wavelengthof 540 nm to correct for turbidity
in the wells. This 540nm turbidity measurement was subtracted from all of the 450nm values.
The quantity of IL-6 produced in each well was calculated by interpolation from the standard
curve. All samples were assayed in duplicate.
2.9 Creatine phosphokinase activity
A creatine phosphokinase (CPK) assay kit (abcam, ab155901) was utilised to investigate
whether any of the tested conditions might lead to cell injury in L6 cells. This kinase can
convert creatine to phosphocreatine and ADP. The assay is based on an NADH-linked enzyme
reaction coupled to the rate of formation of ADP with generation of an intermediate which, in
the presence of a developer, can then create a colour that is detectable at an OD of 450 nm. The
stages of this reaction are as follows:

43
CPK
Creatine + ATP Phosphocreatine + ADP
NADH Developer
ADP Intermediate Colour detection
(OD 450nm)
This assay was performed as follows. The supernatant was collected from each well. Standard
solutions of NADH were set up using a 10mM NADH stock solution, to create a six point
calibration curve. Standards, samples or a CPK positive control were added to each well of a
96-well microplate. Then, the reaction mix (CK assay buffer, CK Enzyme Mix, CK Developer,
ATP and CK Substrate) was added and mixed in each well of the microplate. The wells were
then incubated at 37°C for 40 min and read at an OD of 450 nm.
2.10 Transport activity assay (14C MeAIB uptake measurement)
In order to assess the activity of System A amino acid transporters in intact cells, measurements
were taken of the quantity of selective System A substrate α-[1-14C]-methylaminoisobutyric
acid (14C MeAIB) (NEN-Du Pont NEC 671) absorbed by the cells at room temperature in 5
min. After incubating the cells in 22mm culture wells using experimental test media modified
for the purpose of each experiment, the cells were rinsed twice using 1ml of Hepes-buffered
saline (HBS) (Appendix A.4), after which 500µl of HBS was added to each well. The transport
experiment was started by the addition of an aliquot of 14C MeAIB, sufficient to create a final
concentration of 10µM 14C MeAIB (21 kBq/ml) in the culture well. In some culture wells,
10mM unlabelled MeAIB (Sigma M-2383) was also present in the medium as a negative
control to assess non-specific binding of 14C MeAIB in the well. In order to mix the 14C MeAIB
with the medium, the plate was swirled immediately after the addition of the aliquot of 14C
MeAIB and incubated at room temperature (25℃) for exactly 5 min. Then the transport was
immediately halted by placing the plate on a tray of ice. The medium was aspirated and the
wells washed three times with 1ml of ice-cold 0.9% w/v NaCl. The cells were then rapidly
checked under a phase contrast microscope to ensure that they were still attached to the wells,
after which the plates were stored at -20°C until processed as described below.

44
2.10.1 Preparation of cell lysates for counting the radio-activity
After the transport activity incubation, cell lysates were prepared by scraping each well in 200µl
0.05M NaOH. The scrapings were then transferred into 1.5ml microcentrifuge tubes and
incubated in a water bath at 70°C for 30 min to digest the cells. From the digested cells, 110µl
was added to 4ml of Ecoscint A scintillant (National diagnostics LS-273), then incubated at
room temperature for 2 hours in the dark to allow chemiluminescence to decay. Samples were
counted with quench correction to determine the number of disintegrations per min (dpm) on
an LKB 1219 liquid scintillation counter. The 14C-MeAIB dpm count in the non-specific
binding control cultures was subtracted from the count in the other cultures to determine level
of net 14C-MeAIB transport into the cells. The number of pmol transported was calculated from
the 14C-MeAIB specific radio-activity of 50pCi/pmol or 110dpm/pmol as was indicated by the
manufacturer.
2.11 Measuring 14C-urea as an intracellular water space marker
14C-urea has previously been validated as a method for estimating cell water space in adherent
cultures of mammalian cells (Burns and Rozengurt, 1983). To correct for trapped extracellular
water in the rinsed monolayer cultures, more recent authors have also included a radio-labelled
extracellular water space marker such as inulin in the assay (Chien et al., 2016). However,
some cell lines yield negative apparent cellular water space if corrected with this extracellular
marker, possibly indicating that it binds to extracellular matrix (A Bevington unpublished
observations).
Cells were plated at 43 x 104 cells per well on 35mm diameter 6-well culture plates, in 2ml of
Growth Medium (DMEM, Life Technologies 11880-028, which contains 5mM glucose and
added pyruvate, supplemented with 10mg Phenol Red/L, 100 U/ml Penicillin G, 100ug/ml
Streptomycin, 2mM glutamine and 10% v/v heat inactivated foetal bovine serum (HIA-FBS)).
Cells were cultured for 3 days before commencing fusion to form myotubes.
Following the incubation of the cells in 35 mm culture wells in the required experimental test
media the volume experiment was started by the direct addition of a aliquot of 14C-urea (as for
14C MeAIB in Section 2.10). In order to mix the 14C-urea with the medium, the plate was
swirled immediately after the addition of the aliquot of 14C -urea and incubated at room
temperature (25℃) for exactly 5 min. Then the transport was immediately halted by placing
the plate on a tray of ice. The medium was aspirated and the wells washed three times with 1ml
of ice-cold 0.9% w/v NaCl. The cells were then rapidly checked under a phase contrast

45
microscope to ensure that they were still attached to the wells, after which the plates were
stored at -20°C until processed as described in 2.10.1.
2.12 Sodium Dodecyl Sulphate Polyacrylamide Gel Electrophoresis (SDS-PAGE)
2.12.1 Preparing the samples for SDS-PAGE
After completion of the required experimental incubation (described in the data Figure
legends), the culture plates were immediately put on ice. Each 35mm well was then scraped in
200µl of pre-chilled Lysis buffer (Appendix B.5.1), then each lysate was transferred to a 1.5ml
micro centrifuge tube on ice and centrifuged on a refrigerated micro centrifuge at 13,000 rpm
for 10 min at 4°C to remove insoluble debris. This stage was followed by a Bio-Rad DC protein
assay (Section 2.6.2) which sought to determine the quantity of cell lysate required to deliver
30µg of protein. The calculated amount of lysate was mixed with the same volume of SDS-
reducing sample buffer (Appendix B.5.2), then the mixture was placed on a heating block
(Grant QBT2) at 100°C for 5 min to denature the proteins and remove disulphide bridges.
2.12.2 Running the gel
Discontinuous Laemmli gels (Laemmli, 1970) (1.5mm thick with 12% polyacrylamide in the
resolving gel) were arranged in an electrophoresis tank with a running buffer (Appendix B.5.5).
The samples (Section 2.10.1) were loaded into the sample wells in the stacking gel, with
molecular weight standards (Full-Range Rainbow MW Markers 10-250kDa, Fisher Ref
11580684) in one lane. The electrophoresis was then run on a Bio-Rad Mini-Protean® system
at 200 volts until the bromophenol blue dye front neared the end of the gel.
2.12.3 Immunoblotting
After separation by SDS-PAGE, the proteins were blotted onto 0.45µm nitrocellulose
membranes (Fisher Ref 10773485) in a wet transfer cell in a transfer buffer (Appendix B.5.4)
at 80 volts for 2 hours. This was carried out in the presence of an ice block, with continuous
stirring to ensure that the transfer remained cool throughout. The membranes were washed
three times with x1 Tris-buffered Saline with 0.5% Tween 20 (TTBS) (Appendix B.5.6) and
blocked with 5% w/v milk powder in x1 TTBS for one hour, after which they were washed
three more times with x1 TTBS and incubated overnight at 4°C on a rocker with one of the
primary antibodies shown in Table 2.1. After incubation with the primary antibody, three
further washes were conducted using x1 TTBS. The membranes were then incubated with the
relevant secondary antibody presented in Table 2.1 for a further two hours at room temperature

46
in order to label the bound primary antibody. The membranes were then washed three times
with x1 TTBS, for a period of 10 min per wash, and chemiluminescence was generated on the
membranes using an ECL kit (Thermo Scientific-34080). Detection of the chemiluminescence
was carried out using Kodak BioMax Light film or a ChemiDoc™ Touch Imaging System.
The positions of the bands were compared against the molecular weight standards in order to
confirm the size of the detected proteins.
2.12.4 Quantification and data analysis
The bands were quantified by using digital images of the membrane taken, as described above.
Densitometry was conducted using Image LabTM software.

47
Table 2.1 Details of antibodies
R: HRP conjugated Goat anti Rabbit IgG (1:1000) (Dako P0448) M: HRP conjugated Goat anti Mouse IgG (1:1000) (Dako P0260)
Antibody
Against:
Source Ref
No.
Dilution Diluted
in
Blocking
agent
Seconda
ry
Antibody
PThr202-ERK1/
PTyr204-ERK2
Cell
Signaling
9101 1:1000 5% w/v
BSA in
TTBS
5% Milk
powder
R
Total-ERK2 Cell
Signaling
9108 1:2000 5% w/v
Milk
powder
in TTBS
5% Milk
powder
R
P Thr183/Tyr185 JNK Promega V7931/7 1:4000 5% w/v
BSA in
TTBS
5% BSA R
Total JNK2 Cell
Signaling
9258
1:4000 5% w/v
Milk
powder
in TTBS
5% Milk
powder
R
PThr180/Tyr182p38 Promega V121A/7 1:1000 5% w/v
BSA in
TTBS
5% BSA R
Total p38 Cell
Signaling
9217S 1:1000 5% w/v
Milk
powder
in TTBS
5% Milk
powder
M
P Tyr576/577 FAK Cell
Signaling
3281S 1:1000 5% w/v
BSA in
TTBS
5% BSA M
Total FAK Cell
Signaling
3285S 1:1000 5% w/v
BSA in
TTBS
5% BSA M

48
2.13 RNA techniques
2.13.1 RNA extraction
The TRIzol technique (based on guanidinium thiocyanate-phenol-chloroform extraction) was
used to extract the RNA from L6-G8C5 cells (Chomczynski and Sacchi, 1987).
After the experimental incubation period, the test medium was aspirated and 0.6ml TRIzol per
35mm well was then added and the cells were incubated in Trizol at room temperature for 5
min and the resulting cell digest was transferred into autoclaved screw capped 2ml
polypropylene tubes, then frozen at -80˚C until ready for RNA extraction. After thawing, the
tubes were microcentrifuged at 13,000rpm for 15 min at 4°C in order to remove any insoluble
material. The TRIzol solution was then transferred to a fresh tube, to which chloroform
(200µl/ml of TRIzol) was added. The tubes were thoroughly vortexed and incubated for a
further 10 min at room temperature, after which they were microcentrifuged at 13,000rpm for
15 min at 4˚C. This process resulted in the formation of three phases. The RNA was contained
in the aqueous phase, so this was removed and transferred to a new tube. The addition of
isopropanol (500μl/ml of original TRIzol extract) enabled the RNA to be precipitated, and then
the tubes were vortexed and incubated at room temperature for 10-15 min. They were then
microcentrifuged at 13,000rpm for 15 min at 4°C to create an RNA pellet, which was washed
in 75% ethanol, then dissolved in RNAase-free diethyl pyrocarbonate-treated DEPC water
(20µl). The RNA concentration was quantified from the optical density at 260nm using a
Nanodrop (ND 1000) Spectrophotometer (Thermo Scientific, Northumberland, UK) and an
example of how RNA concertation was quantified is presented in Appendix D.1. Finally, the
RNA extracts were stored at -80°C.
2.13.2 Reverse transcription
RNA was reverse transcribed to cDNA using the Promega Reverse Transcription System
(Promega, Hampshire, UK A3500). RNA samples (0.5μg/µl of DEPC water) were heated to
remove any secondary structure (at 70˚C for 10 min) and a 1µl aliquot was taken for reverse
transcription. The composition of the reaction buffer is provided in Table 2.2. The tubes were
placed on a PCR thermal cycler (Techne Genius, TC-3000X) at 42˚C for 1 hour, then raised to
95˚C for 5 min, and then lowered to 4˚C for 5 min. The resulting cDNA was stored at -20˚C.

49
Table 2.2 RT- Reaction
For a single 20µl reaction Volume
(µl)
MgCl2 4
10X Reverse Transcription Buffer 2
10mM dNTP Mix 2
Rnasin Ribonuclease Inhibitor 0.5
AMV Reverse Transcriptase 15 Units
Primers1
RNA
Water
1μl
1μl
to 20µl
1A mixture comprising a 1:1 ratio of random and oligo dT primers was used. Preliminary experiments demonstrated that this approach produced higher yield than using each primer

50
2.13.3 Real time qPCR for detailed studies of IL6 and SNAT2 mRNA expression using
Taqman assays
The results presented in Chapter 5 for the expression of rat IL-6 and SNAT2 mRNA were
obtained through real-time qPCR utilising an Applied Biosystems Fast 7500 Real-Time PCR
system and software package, with optimised gene specific amplification primers and probes
(TaqMan gene expression assays, Applied Biosystems, Warrington, UK) as follows:
Rat IL-6 - assay ID number Rn01410330_m1
Rat SNAT2 - assay ID number Rn00710421_m1
Rat TBP (TATA-box binding protein) (assay ID number Rn01455646_m1) was used as a
house-keeping gene (Kelleher et al., 2014) and the coefficient of variation between experiments
was 4.29 %.
PCR reactions were set up in 20μl volumes that comprised the following: 10μl TaqMan Gene
Expression Master Mix (Applied Biosystems, Warrington, UK,), 1μl TaqMan gene expression
assay (including primers and probes), and 8μl nuclease-free water. This created 19μl of master
mix, which was applied to the plate and then supplemented with 1μl of cDNA. For negative
controls, the 19μl of master mix was instead supplemented with 1μl of DEPC water. PCR was
performed for all genes using the 7500 Fast Real-Time PCR System profile shown in Table
2.3. The samples were analysed in pairs on the same plate (both the target and housekeeping
genes) to enable direct comparisons, with contamination being monitored using ‘blank’
reactions.
Table 2.3 Real time qPCR thermal cycle
Thermal cycle
Stage 1 Stage 2 Stage 3 Stage 4
Repeats 1 Repeats1 Repeats 40 Repeats 1
50°C 95°C 95°C 60°C 95°C 60°C 95°C
2 min 10 min 15 sec 1 min 15 sec 1 min 15 sec
The expression of IL-6 and SNAT2 related to TBP expression was calculated using the 2-ΔΔCт
method (Pfaffl, 2001).

51
2.13.4 SNAT2 silencing in L6 myoblasts with small interfering RNAs (siRNAs)
A SNAT2 silencing procedure was conducted using a validated siRNA with custom-
synthesised siRNA oligonucleotides supplied by Eurogentec, as previously outlined (Evans et
al., 2007a, Evans et al., 2008a). The oligonucleotides were supplied in solution as ds siRNA in
50mM TRIS-HCl, 100mM NaCl, and pH 7.6 at a concentration of 100μM. The SNAT2
silencing siRNA (SIL) had a forward sequence of 5’-CUGACAUUCUCCUCCUCGUdTdT
which was directed against base position 1095 onward in the SNAT2 gene sequence (Evans et
al., 2007a, Evans et al., 2008a). In order to control for possible non-specific functional effects
of siRNA transfection, the procedure utilised in parallel transfections a previously validated
scrambled siRNA control (Scr) (forward sequence 5’-CGCUCAACUCUACUUGUCCdTdT)
that shared the same overall base composition as SNAT2 SIL (Evans et al., 2007a, Evans et
al., 2008a).
L6 myoblasts were plated in DMEM Growth Medium at 10×104 per 35 mm well. After
overnight incubation, the DMEM Growth Medium was discarded and 1ml of fresh GM was
added to the wells and the cells were transfected with SNAT2 siRNA using a Profection
Promega Calcium Phosphate Transfection Kit (Promega Cat. #E1200). The precise
composition of the transfection mixture is presented below (Table 2.6). Prior to use, the stock
of pre-annealed siRNA oligonucleotide supplied by the manufacturer was diluted to 20µM by
the addition of nuclease-free water. The contents of Tube 1 and Tube 2 (Table 2.4) were then
mixed by pipetting and 150µl was added drop-wise to the culture well. The culture plate was
then gently agitated to ensure that the transfection mixture was distributed evenly over the cells.
The final concentration of siRNA in the culture medium was 30nM: the cells were incubated
in a culture incubator at 37°C for 16 hours, after which the medium was changed, doubling the
standard volume of Growth Medium (4 ml to each well) for a further 24 hours. The medium
was aspirated on day 4, after which experimental incubations and measurements were
performed.

52
Table 2.4. siRNA transfection mixture for L6 transfection.
*Hepes-buffered saline (Promega-E110A).
2.14 Measurement of intracellular Ca2+ using Fluo-4 fluorescence
Free intracellular Ca2+ in L6 myoblasts was assayed fluorometrically by binding of Ca2+ to the
calcium chelator dye Fluo-4 (Heding et al., 2002). The change of Ca2+ dependent fluorescence
was measured on a NOVOstar fluorescence plate-reader (BMG LABTECH, Offenburg,
Germany). Cells were plated on Poly-D-lysine hydrobromide treated plastic 6mm wells on
ELISA strips or 96-well plates at 5 x 10⁴ cells per well in 60 µl per well of the Growth Medium
(GM) described in Section 2.2.3. Cells were cultured for 18 hours before commencing dye-
loading experiments. After that, the Growth Medium was gently aspirated from each well
which was then rinsed with 200µl of Physiological Salt Solution (PSS) (Appendix A.5). Then,
the cells were loaded with fluo-4-AM ester (Fisher-11504786) for 45 min at 37°C under a 5%
CO2 atmosphere. The concentration of fluo-4-AM was 2μM and the loading buffer was PSS
supplemented with BSA (0.1% w/v) (PSS-BSA) (Liu et al., 2010). After that, the wells were
rinsed three times with 200µl of PSS-BSA, and then 200µl of fresh PSS- BSA was added to
each well and cells were incubated again in a humidified incubator at 37oC to allow time for
the Fluo-4 AM to be de-esterified by the cells to generate the free Fluo-4 dye. Then the
fluorescence intensity was read on the NOVOstar plate-reader at an excitation wavelength of
488nm, and detecting at >500nm at 37oC. The calibration of the fluo-4 signal was performed
by adding a final concentration of 0.5nM ionomycin Ca2+ ionophore in the presence of a total
concentration of 4mM CaCl2 to the PSS-BSA medium, in order to equilibrate the concentration
of intracellular and extracellular Ca2+. The fluorescence signal was allowed to stabilise for 10
min and this signal was called Fmax. Then, (in the presence of ionomycin as above) the cells
were rinsed with PSS-BSA + 2mM EGTA to chelate Ca2+ and again the fluorescence signal
was allowed to stabilise for 10 min and this signal was called Fmin.
The intracellular Ca2+ concentration was calculated using the formula:
Tube 1
Tube 2
Transfection Mixture Label
2×HBS* (µl)
20µM Scr. SNAT2 siRNA (µl)
20µM SIL SNAT2
siRNA (µl)
Nuclease-Free Water
(µl)
2M CaCl2 (µl)
Scr 310 7 ---- 264 39
SIL 310 ---- 7 264 39

53
[Ca2+]i = Kd*(F-Fmin)/(Fmax-F),
where the dissociation constant Kd of the fluo-4-AM - Ca2+ complex was taken to be 350nM
(Yamasaki-Mann et al., 2009).
2.15 Statistical analysis
The data presented have been derived from a minimum of three independent experiments,
unless stated otherwise, and were analysed with GraphPad Prism 7.0. Normally distributed data
are presented as the mean ± SEM, and were analysed using Student’s t-test or (for data sets
involving multiple comparisons) repeated measures ANOVA followed by post hoc testing with
Tukey’s multiple comparisons test. Non-normally distributed data are presented as linked data
curves for the individual experiments. These were analysed using Friedman’s nonparametric
repeated measures ANOVA, followed by post hoc testing with Dunn’s multiple comparisons
test.

54
Chapter 3 Regulation of MAPK activation in L6 cells
3.1 Introduction
It has been known for more than 20 years that the MAP kinase signal transduction pathways
play an important role in exercise signalling (Sakamoto and Goodyear, 2002, Cargnello and
Roux, 2011b, Tsuzuki et al., 2018). The MAP kinase family of intracellular signalling cascades
is expressed in all eukaryotic cells and includes the extracellular signal regulated kinase 1 and
2 (ERK1/2), the c-Jun NH2- terminal kinase (JNK), p38, and the extracellular signal- regulated
kinase 5 (ERK5 or big MAP kinase, BMK1) (Cargnello and Roux, 2011b, Wang et al., 2019).
These pathways are stimulated by a wide variety of environmental stressors and growth factors
(Tsuzuki et al., 2018, Nakayama et al., 2019) and have been implicated in a large number of
physiological processes, including cell proliferation, differentiation, hypertrophy,
inflammation, apoptosis, carbohydrate metabolism, and gene transcription (Shrestha, 2017, Di
Meo et al., 2019). Thus MAP kinase proteins exert a profound effect on cellular function
(Cargnello and Roux, 2011b).
Preliminary experiments from this laboratory (Blbas, 2018) suggested that System A (SNAT2)
transporter activity in L6-G8C5 myotubes is significantly dependent on MAP kinase signalling
through the JNK and p38 pathways.
As outlined in the hypothesis in Section 1.15, the importance of these pathways is that they
may be involved in the activation of System A / SNAT2 in response to cell stress, which might
occur through actions that include mechanical stretch or the application of a change in
osmolarity.
This aim of the chapter was to extend the preliminary observations (Blbas, 2018) , to examine
the effect of mechanical loading on MAPKs, and to observe the effect of low pH on these
MAPKs.
In (Figures 3.1 and 3.2), myotubes were treated with MAPK inhibitors and then SNAT2
activity was measured as described in Section 2.10.
In (Figures 3.3-3.5), myotubes were incubated under different pH conditions and then
the phosphorylation of MAPKs was measured as described in Section 2.12.
In (Figures 3.7-3.9) myotubes were cyclically stretched by an FX-4000 cell stretcher as
described in section 2.4 and then phosphorylation of MAPKs was measured as
described in Section 2.12.

55
3.2 Results
3.2.1 Dependence of System A / SNAT2 transporter activity in L6-G8C5 cells on MAP
kinase activity
As described in Section 1.8, it is possible to assay the activity of System A amino acid
transporters (including SNAT2 which is the most strongly expressed System A transporter in
L6-G8C5 cells (Evans et al., 2007a)), through the measurement of the uptake of the 14C-
labelled amino acid analogue MeAIB into intact cells.
It was shown that incubation with pharmacological inhibitors of JNK or p38 significantly
inhibited System A / SNAT2 transporter activity in L6-G8C5 cells, even in the resting
unstressed state, but that inhibition of signalling through the MEK/ERK pathways had no
significant effect under these conditions even when employing a high concentration of MEK
inhibitor PD98059 (50µM) (Figure 3.1). The effect required 4h of pre-incubation with the
MAPK pathway inhibitors (presumably to allow them time to enter the cells) and the effect
persisted even though the inhibitors were not present during the subsequent transport assay. In
3 further experiments, incubation with these inhibitors only during the 14C-MeAIB transport
assay (i.e. without pre-incubation) had no detectable effect (Figure 3.2) suggesting that the
inhibitors were acting on the intended intracellular kinases rather than exerting an off-target
direct inhibitory effect on the transporters on the cell surface.
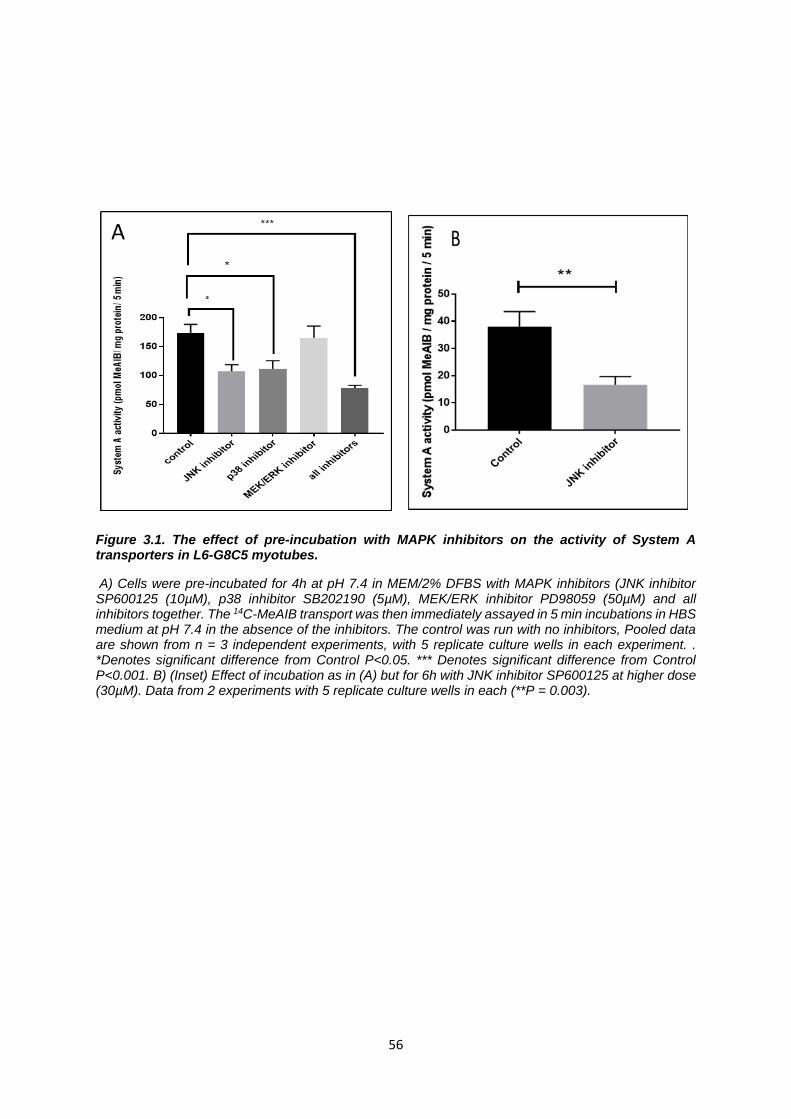
56
Figure 3.1. The effect of pre-incubation with MAPK inhibitors on the activity of System A transporters in L6-G8C5 myotubes.
A) Cells were pre-incubated for 4h at pH 7.4 in MEM/2% DFBS with MAPK inhibitors (JNK inhibitor SP600125 (10µM), p38 inhibitor SB202190 (5µM), MEK/ERK inhibitor PD98059 (50µM) and all inhibitors together. The 14C-MeAIB transport was then immediately assayed in 5 min incubations in HBS medium at pH 7.4 in the absence of the inhibitors. The control was run with no inhibitors, Pooled data are shown from n = 3 independent experiments, with 5 replicate culture wells in each experiment. . *Denotes significant difference from Control P<0.05. *** Denotes significant difference from Control P<0.001. B) (Inset) Effect of incubation as in (A) but for 6h with JNK inhibitor SP600125 at higher dose (30µM). Data from 2 experiments with 5 replicate culture wells in each (**P = 0.003).
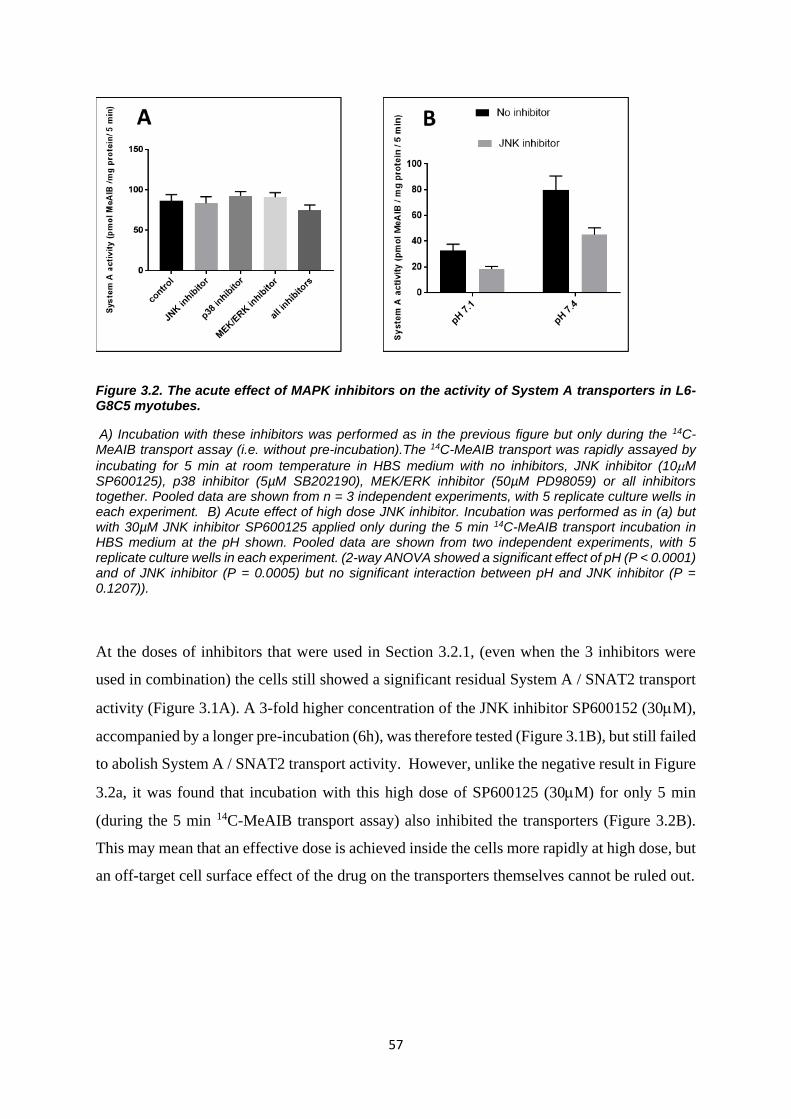
57
Figure 3.2. The acute effect of MAPK inhibitors on the activity of System A transporters in L6-G8C5 myotubes.
A) Incubation with these inhibitors was performed as in the previous figure but only during the 14C-MeAIB transport assay (i.e. without pre-incubation).The 14C-MeAIB transport was rapidly assayed by
incubating for 5 min at room temperature in HBS medium with no inhibitors, JNK inhibitor (10M SP600125), p38 inhibitor (5µM SB202190), MEK/ERK inhibitor (50µM PD98059) or all inhibitors together. Pooled data are shown from n = 3 independent experiments, with 5 replicate culture wells in each experiment. B) Acute effect of high dose JNK inhibitor. Incubation was performed as in (a) but with 30µM JNK inhibitor SP600125 applied only during the 5 min 14C-MeAIB transport incubation in HBS medium at the pH shown. Pooled data are shown from two independent experiments, with 5 replicate culture wells in each experiment. (2-way ANOVA showed a significant effect of pH (P < 0.0001) and of JNK inhibitor (P = 0.0005) but no significant interaction between pH and JNK inhibitor (P = 0.1207)).
At the doses of inhibitors that were used in Section 3.2.1, (even when the 3 inhibitors were
used in combination) the cells still showed a significant residual System A / SNAT2 transport
activity (Figure 3.1A). A 3-fold higher concentration of the JNK inhibitor SP600152 (30M),
accompanied by a longer pre-incubation (6h), was therefore tested (Figure 3.1B), but still failed
to abolish System A / SNAT2 transport activity. However, unlike the negative result in Figure
3.2a, it was found that incubation with this high dose of SP600125 (30M) for only 5 min
(during the 5 min 14C-MeAIB transport assay) also inhibited the transporters (Figure 3.2B).
This may mean that an effective dose is achieved inside the cells more rapidly at high dose, but
an off-target cell surface effect of the drug on the transporters themselves cannot be ruled out.

58
3.2.2 The effect of low pH on MAPKs in L6 Myotubes
In view of the well-documented pH sensitivity of System A amino acid transporters and the
possible mutual interaction between System A and MAPKs (outlined in the schematic diagram
in Section 1.15 Figure 1.7) it is important to assess the effect of the pH of extracellular fluid
on MAPK activation. Here, JNK, p38, and ERK1/2 activation were assessed by
immunoblotting for the phospho-activated forms of the proteins after 1-hour of incubation of
the cells in test media at different pH values. Compared to the control (pH=7.4) (Figure 3.3),
treatment of cells with acidic medium (pH 7.1) resulted in a decrease in p-JNK, implying
inhibition of the kinase. This study also found that p-p38 was similarly decreased at pH 7.1
(Figure 3.4), again indicating pH sensitivity. Interestingly, like p-JNK; p-p38 was upregulated
in the alkaline condition of pH 7.7 (see Figures 3.3 and 3.4) although this effect was more
variable and did not achieve statistical significance. However, this was not the case with p-
ERK1/2 (Figure 3.5), which showed no changes in response to different pH environments.

59
Figure 3.3. The effect of different pH media on p-JNK in L6-G8C5 myotubes.
Cells were incubated in MEM adjusted to give the required pH under a 5% CO2 atmosphere, at different pH (pH=7.1, pH=7.4, pH=7.7, and with 200mM sucrose as a hyper-osmotic positive control) in MEM/2% DFBS for one hour in the incubator. After 1 hour incubation in the test media, the plates were immediately placed on a tray of crushed ice. The media were then rapidly aspirated and each well
immediately scraped in 200l of Lysis Buffer. Immunoblots of proteins were prepared; probing with anti-p-JNK1/2 antibody and the bands (46/54 kDa) were quantified by densitometry using the ChemiDoc Touch Imaging System. Pooled data are shown from n=3 independent experiments, with 4 replicate culture wells in each experiment. * Denotes significant difference from Control (pH= 7.4) (P <0.05).

60
Figure 3.4. The effect of different pH media on p-p38 in L6-G8C5 myotubes.
Cells were pre-incubated at different pH (pH=7.1, pH=7.4, pH=7.7, and with 200mM sucrose as a hyper-osmotic positive control) in MEM/2% DFBS for one hour in the incubator. After 1 hour incubation in the test media, the plates were immediately placed on a tray of crushed ice. The media were then rapidly
aspirated and each well immediately scraped in 200l of Lysis Buffer. Immunoblots of proteins were separated by SDS-PAGE; probing with anti-p-p38 MAPK antibody and the bands (43 kDa) were quantified by densitometry using the ChemiDoc Touch Imaging System. Pooled data are shown from n=3 independent experiments, with at least 4 replicate culture wells in each experiment. * Denotes significant difference from Control (pH= 7.4) (P<0.05).

61
Figure 3.5. The effect of different pH media on p-ERK-1 in L6-G8C5 myotubes.
Cells were pre-incubated at different pH (pH=7.1, pH=7.4, pH=7.7 and with 200mM sucrose as a hyper-osmotic stress) in MEM/2% DFBS for one hour in the incubator. After 1 hour incubation in the test media, the plates were immediately placed on a tray of crushed ice. The media were then rapidly
aspirated and each well immediately scraped in 200l of Lysis Buffer. Immunoblots of proteins were separated by SDS-PAGE; probing with anti- Phospho-p44/42 MAPK (ERK1/2) and the bands (44/42 kDa) were quantified by densitometry using the ChemiDoc Touch Imaging System. Pooled data are shown from n=4 independent experiments, with at least 4 replicate culture wells in each experiment.
3.2.3 The role of JNK in the inhibition of System A by low pH
As with all System A transporters, acutely lowering the extracellular pH from 7.4 to 7.1 during
the 5 min System A transport assay acutely inhibits the System A transporter activity in L6-
G8C5 cells (Evans et al., 2007a). This rapid effect of low pH is thought to arise from direct
protonation of the extracellular C-terminal histidine residue of the SNAT2 transporter (Baird

62
et al., 2006). However, the observation that inhibiting JNK or p38 partly inhibits System A
activity (Figure 3.1A), and that pH 7.1 inhibits phospho-activation of JNK (Figure 3.3) and p38
(Figure 3.4) suggests an alternative explanation i.e. that the effect of low pH on System A is
mediated by the pH effect on JNK or p38. This was tested by measuring the acute effect of
high dose JNK inhibitor applied acutely during the transport assay (Figure 3.2B). Even at this
high dose, the percentage decline in System A/ SNAT2 activity by applying pH 7.1 versus pH
7.4 was unaltered, and 2-way analysis of variance (2-way ANOVA) detected no significant
interaction between JNK inhibitor and pH. There is therefore no detectable role for JNK in the
pH sensitivity of System A / SNAT2 transport activity in these cells.
3.2.4 The role of cell swelling
Cell shrinkage by hyper-osmotic stress (sucrose loading) is a potent stimulator of phospho-
activation of JNK and of p38 in L6-G8C5 myotubes (as seen in the sucrose positive controls
in Figures 3.4 and 3.5). It has also been known for many years that activation of sodium-
hydrogen exchange (NHE) transporters in the plasma membrane (for example NHE1 (Lang,
2007)) can lead to cell swelling and this plays a significant role in physiological cell volume
regulation (Lang, 2007). In L6-G8C5 cells the cytosolic pH is tightly regulated and shows no
detectable fall when extracellular pH is lowered to 7.1 (Table 5 in (Bevington et al., 1998a).
The apparent decrease in JNK and p38 activation observed at pH 7.1 (Figures 3.3 and 3.4)
might therefore occur because of cell swelling caused by the NHE activation that is necessary
to regulate cytosolic pH. To test this explanation, changes in cell volume were screened by
equilibration of 14C-urea (Burns and Rozengurt, 1983) between extracellular and intracellular
water spaces (Figure 3.6). As a positive control, cells were incubated in medium that had been
made hypo-osmotic (approximately 240 mOsM) by omitting NaCl. Even though this positive
control showed an apparent increase in cell volume after 2h of incubation, the cell swelling
expected because of Na+/H+ exchange at low pH (7.1) was not observed at any time point. On
the contrary, after 7 hours a slight decrease in volume may have occurred with declining pH
(Figure 3.6), especially when the transport of amino acid osmolytes into cells through System
A . SNAT2 transporters was inhibited by adding synthetic System A substrate MeAIB as a
competitive inhibitor (Evans et al., 2007a). This apparent shrinkage is probably an under-
estimate because it has also been shown that a significant concentration of MeAIB can be
accumulated by these cells within 7 hours (Bevington et al., 2002) which could potentially lead
to osmotic swelling.

63
As cell shrinkage with sucrose-loaded medium strongly activates JNK and p38 in these cells
(Figures 3.3 and 3.4), it is therefore very unlikely that stress arising from the small apparent
cell shrinkage observed at pH 7.1 in Figure 3.6 could cause the decrease in P-JNK and P-p38
observed in Figures 3.3 and 3.4.
Figure 3.6. Screening for cell volume changes assessed by equilibration of L6-G8C5 myotubes with 14C-urea in MEM/2% DFBS which had been modified as shown on the x-axis. Pooled data are shown from 2 independent experiments with 3 replicate culture wells in each. (* P < 0.05; + borderline significant, P = 0.0539). Cell water per culture well was calculated by dividing the total 14C measured in
each well by the concentration of 14C per l in the culture medium.

64
3.2.5 The acute effect of cyclic stretching on the phosphorylation of MAPKs in L6-G8C5
myotubes
As MAP kinase activation is thought to play a role in mechanotransduction signalling in
skeletal muscle (as reviewed in Section 1.14) the effect of cyclic stretching on phospho-
activation of MAP kinases was assessed in L6-G8C5 myotubes. Even a short period (1, 5 or
10 min) of stretching significantly increased P-p38 phospho-activation (Figure 3.7). Moreover,
the phospho-activation of P-JNK was also increased significantly after a similar duration of
stretching compared to the control (as in Figure 3.8). However, stretching the cells had no
detectable effect on the phosphorylation of p-ERK1/2 (Figure 3.9).
As rising pH was associated with increased phospho-activation of JNK and p38 in Figures 3.3
and 3.4, care was taken in these stretching experiments to minimise disturbance to the pH. As
placing the culture plates on the stretching equipment requires opening the culture incubator
door, the resulting loss of atmospheric CO2 could in principle raise the pH of bicarbonate-
buffered medium. This effect was minimised by working as rapidly as possible. In some initial
experiments an additional 20mM supplementary Hepes buffer (Gibco Ref 15630) was added
to the medium, but this was found to be unnecessary. Negligible change was observed in the
colour of the Phenol Red pH indicator (see Figure 4.2 in the next chapter) and, to assess the
effect of any small changes not detected by Phenol Red, a parallel stretchable Flexcell culture
plate of cells was run alongside the stretched plate in the incubator. A blot from such a parallel
unstretched control plate is shown in Figure 3.7B and shows no significant increase in phospho-
activation signal at the time points at which stretched plates showed a response.

65
Figure 3.7. Effect of 1 min or 5 min or 10 min of cyclic stretch on P-p38 activity.
A) L6-G8C5 myotubes were cultured on collagen-coated Flexcell silicone-based culture wells. The medium used was based on MEM at pH 7.4 and contained 2mM L-Gln with 2% dialysed foetal bovine serum. Myotubes were stretched using a Flexcell FX-4000 system as described in Section 2.4 (Goto et al., 2003). After stretching, the media were then rapidly aspirated and each well immediately scraped
in 200l of Lysis Buffer. Immunoblots of proteins were separated by SDS-PAGE; probing with anti-Phospho-p38 MAPK and the bands (43 kDa) were quantified by densitometry using the ChemiDoc Touch Imaging System. 2-Way ANOVA. Data compiled from 3 experiments are presented. B) An example of a control blot that was run in parallel with (A) on an unstretched plate. **** Denotes significant difference from Pre-stretch Control (P< 0.0001). *** Denotes significant difference from Pre-stretch Control (P<0.001). *Denotes significant difference from Pre-stretch Control (p<0.05).
B
A

66
Figure 3.8. Effect of 10 min of cyclic stretch on P-JNK activity.
L6-G8C5 myotubes were cultured on collagen-coated Flexcell silicone-based culture wells. The medium used was based on MEM at pH 7.4 and contained 2mM L-Gln with 2% dialysed foetal bovine serum. Myotubes were stretched using a Flexcell FX-4000 system as described in Section 2.4 (Goto et al., 2003). After stretching, the media were then rapidly aspirated and each well immediately scraped
in 200l of Lysis Buffer. Immunoblots of proteins were separated by SDS-PAGE; probing with anti-Phospho-JNK MAPK and the bands (46/54 kDa) were quantified by densitometry using the ChemiDoc Touch Imaging System. Pooled data are shown from n=4 independent experiments. ** Denotes significant difference from Pre-stretch Control (P= <0.01).

67
Figure 3.9. Effect of 10 min of cyclic stretch on p-ERK-1/2 activity.
L6-G8C5 myotubes were cultured on collagen-coated Flexcell silicone-based culture wells. The medium used was based on MEM at pH 7.4 and contained 2mM L-Gln with 2% dialysed foetal bovine serum. Myotubes were stretched using a Flexcell FX-4000 system as described in Section 2.4 (Goto et al., 2003). After stretching, the media were then rapidly aspirated and each well immediately scraped
in 20ul of Lysis Buffer. Immunoblots of proteins were separated by SDS-PAGE; probing with anti-Phospho-p44/42 MAPK (ERK1/2) and the bands (44/42 kDa) were quantified by densitometry using the ChemiDoc Touch Imaging System. Pooled data are shown from n=3 independent experiments.

68
3.3 Discussion
3.3.1 Inhibition of MAP kinases inhibits System A / SNAT2 activity in L6-G8C5 myotubes
It was hypothesized in this chapter that MAP kinases affect the System A / SNAT2 transporter,
which has implications for the control of SNAT2 and hence protein synthesis. Using doses of
JNK inhibitor SP600125 (Nieminen et al., 2006), p38 inhibitor SB202190 (Cheng et al., 2006)
and MEK inhibitor PD98059 (Hotokezaka et al., 2002) that are regarded as selective for these
kinases, the data presented in this chapter suggest that the System A / SNAT2 transport activity
in L6-G8C5 myotubes shows a detectable dependence on JNK and p38, even in unstressed
cells. The inhibitory effect of these selective doses of the inhibitors was seen when the cells
were pre-incubated with the inhibitors for 4 hours followed by rapid removal of the inhibitors
and assay of transport in medium without these drugs (Figure 3.1) suggesting that transport
into the cells to gain access to the intended kinases was required. In contrast, acute exposure
of cells to the inhibitors only during the 5 min transport assay (Figure 3.2) failed to inhibit the
transporters, suggesting that the inhibitory effect was not a direct cell surface action on the
transporters themselves.
The observed apparent insensitivity of System A / SNAT2 transport to MEK inhibition with
PD98059 should not be taken as evidence that the Ras-Raf-MEK-ERK pathway has no role in
System A / SNAT2 regulation in these cells. Other experiments in this laboratory have shown
that, at the dose used here, PD98059 fails to block phospho-ERK activation in these cells
(Nicole Simms, Department of Infection, Immunity & Inflammation, unpublished
observation). The reason for the failure of this widely used inhibitor is unknown, but it is
possible that L6-G8C5 myotubes show a pathway of MEK-independent ERK activation similar
to that which has been reported in human neutrophils (Simard et al., 2015).
3.3.2 pH sensitivity of MAP kinases
In view of this apparent coupling of the acid-inhibitable transporter System A / SNAT2 to JNK
and p38, the effect of physiological pH changes on the phosphoactivation of these kinases was
determined. Interestingly, at low pH 7.1; p38 and JNK phospho-activation were significantly
inhibited, indicating that they follow a similar pattern to SNAT2 in terms of sensitivity to low
pH (Evans et al., 2007b, Evans et al., 2008b, Blbas, 2018). This was accompanied by an
apparent (but variable) phospho-activation on raising the pH to 7.7 (Figures 3.3 and 3.4). The
reason for the variability in the pH 7.7 result is unknown, but might be linked to possible
damaging effects of pH 7.7 on cell viability that are noted later (in Figure 5.11, in Chapter 5).

69
Inhibition of JNK by low pH, leading to an impaired JNK signal to System A / SNAT2 is
potentially a mechanism by which low pH could inhibit these transporters, but no evidence for
blunting of the pH sensitivity of System A transporters by the JNK inhibitor SP600125 was
found in this chapter (Figure 3.2B). However, in view of the possible role of MAP kinases in
mechanotransduction in skeletal muscle (Section 1.14) and the significant generation of lactic
acid through glycolysis during exercise (Cairns, 2006) this acid-dependence of JNK and p38
may be of physiological significance following exercise, potentially blocking some of the
mechanotransduction signals.
It is also interesting to note that the strong pH dependence of JNK observed here is not a
universal feature of all muscle cell types. In contrast to L6-G8C5, activation of JNK has been
reported in the smooth muscle-derived BC3H1 cell line by incubation at pH 7.1 (Price and
Mitch, 1995).
3.3.3 Sensing of pH by MAP kinases
The effect of extracellular pH on the intracellular protein kinases JNK and p38 observed here
cannot be a direct effect of pH on the kinase proteins themselves, because the extracellular pH
range used here has no effect on cytosolic pH in L6-G8C5 myotubes (Table 5 in (Bevington et
al., 1998a). In a number of cell types osmotic stress, resulting in changes in cell volume, is a
potent activator of MAP kinases. Whereas JNK and p38 are strongly activated in L6-G8C5
cells by osmotic shrinkage (Figures 3.3 and 3.4), hypo-osmotic cell swelling activates p38 in
other cells (Tilly et al., 1996). Cell swelling in myocytes has been suggested to be functionally
important in skeletal muscle during contraction (possibly leading to muscle fatigue) (Usher‐
Smith et al., 2006). This swelling has been suggested to occur partly because of the osmotic
effect of lactic acid generated by glycolysis and accumulating in the cells (Usher‐Smith et al.,
2006), but also possibly as a result of transport of cations such a Na+ across the sarcolemma
(Kemp, 2007) for example during extrusion of H+ from the cells by Na+/H+ exchangers.
Therefore a possible explanation for the inhibitory effect of low pH on JNK and p38 phospho-
activation (Figures 3.3 and 3.4) is that the regulation of cytosolic pH in these cells by Na+/H+
antiport exchangers is driving osmotically active Na+ ions into the cells leading to cell swelling
which might inhibit p38 and JNK activation. At least with the 14C-urea-based method for
assessing cell volume that was used here, no acid-induced cell swelling was detected in these
cells (Figure 3.6). On the contrary, a small cell shrinkage may have occurred under acidic
conditions (Figure 3.6). This may have occurred because acid-inhibited System A amino acid

70
transporters, especially SNAT2, are an important controller of the intracellular concentration
of amino acid osmolytes such as L-glutamine (Evans et al., 2007a) and therefore potentially
affect cell volume. In contrast, low pH (7.0) has been reported elsewhere to induce swelling of
L6 cells in about 30 min (Sen et al., 1995). The reason for the discrepancy between this and
the present study is unknown.
The mechanism of pH sensing by JNK and p38 remains unclear. However, as it has previously
been shown in this laboratory, using L6-G8C5 myoblasts, that siRNA silencing of SNAT2 can
impair phosphoactivation of JNK (Blbas, 2018), it is possible that the pH sensing mechanism
of SNAT2 (Evans et al., 2007b, Evans et al., 2008b, Blbas, 2018) may be partly responsible
for the pH sensitivity of JNK.
As the total protein content of the cultures in Figure 3.6 was approximately 0.5mg per 35mm
well, the cell water space detected by this 14C-urea distribution assay was about 2µl per mg
protein, similar to the value reported in other adherent monolayer cultures using an alternative
water space marker 3-O-methyl-D-glucose (Kletzien et al., 1975). Ideally the experiments here
should be confirmed using flow cytometry forward angle light scatter (Tzur et al., 2011) which
is the current method of choice for detecting changes in cell volume. However this requires
cell detachment and is therefore unsuitable for myotubes, especially as this would break
integrin-extracellular matrix interactions which may be an important influence on System A
transporters and on Focal Adhesion Kinase (Figure 1.7, Section 1.15) (McCormick and
Johnstone, 1995).
3.4 Conclusion
The data presented in this chapter suggest that, as in the hypothesis outlined in Chapter 1
(Section 1.15), JNK and p38 kinase activation is coupled to System A (SNAT2) amino acid
transporters, and that JNK and p38 (like System A / SNAT2) are inhibited by low pH (Evans
et al., 2007b, Evans et al., 2008b, Blbas, 2018).
Previous studies have established that the activation of MAP kinases (JNK and p38) is possible
in skeletal muscle through the use of static stretch, and is accompanied by a smaller effect on
ERK (Boppart et al., 2001). The observation in this chapter that mechanical stretch activates
JNK and p38 in L6-G8C5 cells seems consistent with this, although no effect was detected on
ERK. This and the data in Section 3.2.1 suggest that stretch should also activate System A /
SNAT2 and (from the data on the effect of low pH on MAPKs above) this effect of stretch

71
should be blunted by low pH. Testing these predicted effects of stretch on System A / SNAT2
is the subject of the next chapter.

72
Chapter 4 Characterisation of experimental systems for studying
mechanical stretch effects on System A in L6 cells
4.1 Introduction
The hypothesis to be tested in this chapter is that the anabolic System A sodium-coupled neutral
amino acid transporter (SNAT2) (slc38a2) can be activated in L6-G8C5 rat skeletal muscle
cells by mechanical stretch in vitro. At the start of these experiments, it seemed likely that this
effect would be observed for the following reasons:
Data from the previous chapter had shown that the activity of these transporters is
dependent on the MAP kinases JNK and p38, and that mechanical stretch leads to
phospho-activation of these kinases
In skeletal muscle there is evidence that these transporters are activated by muscular
exertion (King, 1994, Henriksen et al., 1992, Henriksen et al., 1993). For example an
ex vivo study showed that System A can be activated in muscle of rats that had been
running on a treadmill for a duration of up to 1 hour (King, 1994).
Such an effect on System A (SNAT2) transport activity seems plausible in view of an
earlier report (Chambers et al., 2009b) that 15% stretch applied to mouse C2C12
myotubes or to mouse extensor digitorum longus muscle activates glucose transport by
a p38-dependent mechanism. Electrical stimulation of L6 myotube contraction has also
been reported to stimulate glucose transport (Yano et al., 2011).
An earlier small series of pilot experiments which were done in this laboratory had
suggested that mechanical loading by in vitro cell stretch can lead to an apparent
System A (SNAT2) activation (Clapp, 2010) either by 48 hours of continuous passive
stretch or by 17 hours or 48 hours of cyclic intermittent stretch (ibid).
Therefore, the aims of experiments in this chapter were to reproduce the apparent effect of
SNAT2 activation by in vitro cell stretch that had been reported in pilot experiments (Clapp
2010), and to optimise the effect by comparing it in different models of mechanical stretch in
L6-G8C5 skeletal muscle cells using:
Continuous stretch of L6 myotubes as in (Figure 4.3) with static Loughna cell
stretching assemblies (Rauch and Loughna, 2008b) as described in (Section 2.3).
Two models of cyclic stretch:

73
1. A vacuum-driven “Pull” system, generating a partial vacuum under the culture
wells as described in (Section 2.4). L6 myotubes were stretched by this machine
(FX-4000) as in (Figures 4.1 and 4.5) and myoblasts were used as in (Figures
4.7 and 4.8).
2. A purpose-built mechanical “Push” system, which did not involve the potential
confounding factor of a vacuum, as described in (Section 2.5). L6 myotubes
were stretched by this machine as in (Figure 4.6).
4.2 Results
4.2.1 Positive control for MAPK response in stretched cells
To confirm that MAP kinases in the cells were retaining their responsiveness to mechanical
stretch that was observed in Chapter 3, replicates of the immunoblotting experiments to detect
phospho-activation of p38 were run alongside the series of stretch experiments described in
this chapter. p38 activation was chosen as the positive control in view of the earlier report of
stretch-induced activation of glucose transport by this kinase (Chambers et al., 2009b). A clear
p38 response to stretch was observed (Figure 4.1).

74
Figure 4.1. Effect of 5 minutes of cyclic stretch on p-p38 activity.
A) L6-G8C5 myotubes were cultured on collagen-coated Flexcell silicone-based culture wells. The medium used was based on MEM at pH 7.4 and contained 2mM L-Gln with 2% dialysed foetal bovine serum. Myotubes were stretched using a Flexcell FX-4000 system as described in section 2.4 (Goto et al., 2003). After stretching, the media were then rapidly aspirated and each well immediately scraped in 200µl of Lysis Buffer. Immunoblots of proteins were separated by SDS-PAGE; probing with anti- Phospho-p38 MAPK and the bands (43 kDa) were quantified by densitometry using the ChemiDoc Touch Imaging System. Pooled data are shown from n=3 independent experiments. B) An example of control blot that was run in parallel with (a) on an unstretched plate. **** Denotes significant difference from Pre-stretch Control (P= <0.0001).
A
B

75
4.2.2 Monitoring of pH drift
As disturbance to the 5% CO2 atmosphere in a culture incubator can be a problem during cell stretching
experiments, potentially leading to inadequate gassing of the culture medium and pH drift (especially
in short incubations), the colour of the phenol red in the stretched and control plates was
monitored and shown to remain stable (Figure 4.2).
Figure 4.2. Images showing stable phenol red colour following 5 minutes of cyclic stretching in the culture incubator.
A) (Left) cultures which had been subjected to 5 minutes of stretching on a Flexcell FX-4000 system. (Right) control cultures which had been incubated on the same system without applying vacuum stretching. B) Visual calibration of the phenol red colour showing MEM with 2mM L-Gln with 2% dialysed foetal bovine serum adjusted to pH 7.4 (top), pH 7.1 (middle) and pH 7.7 (bottom) after equilibration in a 5% CO2 culture incubator.
4.2.3 Effect of continuous stretching of L6-G8C5 myotubes on System A (SNAT2) amino
acid transport activity
As previous pilot experiments (Clapp, 2010) had detected an apparent stimulation of transport
activity and a possible (but statistically insignificant) increase in SNAT2 mRNA expression
after 48 hours of continuous stretch, initial experiments in this project sought to reproduce these
effects (Figure 4.3). Analysis of the whole time course by 2-way ANOVA detected no
significant stimulatory effect of stretch on System A (SNAT2) activity. Indeed, when the 48
hours data alone were analysed, a marginally significant decrease in activity in response to
stretch was detected (Figure 4.3).
5 minutes stretching 5 minutes control A B

76
Figure 4.3. Time course of the effect of passive continuous stretch on System A (SNAT2) transporter activity in L6-G8C5 myotubes.
L6-G8C5 myotubes cultured on collagen-coated Flexcell silicone-based culture wells were placed on
glass spheres and stretched for the times indicated by applying a 3kg weight on the top of the culture
plate, as described in Section 2.3 (Rauch and Loughna, 2008b). The medium used was MEM at pH 7.4
with 2mM L-Gln and 2% dialysed foetal bovine serum. A) Analysis of the whole data set by 2-way
ANOVA, taking stretch and time as the experimental variables, detected no significant effect of stretch
(P = 0.3334), but a significant effect of time (P<0.0001). B) Analysis of the 48h data in isolation by
unpaired t-test detected a marginally significant inhibitory effect of stretch (*P = 0.0213)- Data compiled
from 5 independent experiments are presented, with 4 replicate culture wells in each experiment.
4.2.4 The effect of cyclic stretch on the activity of System A (SNAT2) on L6-G8C5
myotubes
In view of the negative results above, the effect of stretch was also examined by cyclic stretch,
which may be a more physiologically relevant model for effects of exercise on skeletal muscle.
However, as prolonged cyclic stretch has been reported to induce apoptosis is L6 myoblasts
(Liu et al., 2009), further experiments were restricted to shorter duration than in Section 4.2.3.
As can be seen in Figure 4.4A, when L6-G8C5 myotubes were stretched by a vacuum-driven
FX-4000 system for up to 1 hour using cyclic intermittent stretch, no obvious effect on System
A (SNAT2) transport was observed, with the possible exception of a transient increase in
transport rate after only 1 minute of stretch (Figure 4.4B). Moreover, to assess whether the
method of stretching was affecting the outcome of the experiment, stretching was also

77
performed without applying a vacuum by using a mechanical device (the “Push” system
described in Section 2.5) for myotube stretching over a similar time course. This again showed
no significant effect of stretch on System A activity (Figure 4.5).
Figure 4.4. Time course of the effect of vacuum-induced cyclic stretch on System A (SNAT2) transport activity in L6-G8C5 myotubes.
L6-G8C5 myotubes cultured on collagen-coated Flexcell silicone-based culture wells were subjected to cyclic stretching using a Flexcell FX-4000 system as described in Section 2.4 (Goto et al., 2003) and stretched for the times indicated.. The medium used was MEM at pH 7.4 and contained 2mM L-Gln with 2% dialysed foetal bovine serum. A) Analysis of the whole data set by 2-way ANOVA, taking stretch and time as the experimental variables detected no significant effect of stretch (P =, 0.5022), but a significant effect of time (P = 0.0008). B) Analysis of the 1 minute data in isolation by paired t-test detected a marginally significant stimulatory effect of stretch (*P = 0.0248 )- Data compiled from 3 experiments are presented, with 6 replicate culture wells in each experiment.

78
Figure 4.5. Time course of the effect of cyclic stretch induced by mechanical pushing on System A (SNAT2) transport activity in L6-G8C5 myotubes.
L6-G8C5 myotubes cultured on collagen-coated Flexcell silicone-based culture wells were subjected to cyclic stretching using a Push system as described in Section 2.5 and stretched for the times indicated. The medium used was MEM with 2mM L-Gln and 2% dialysed foetal bovine serum. Analysis of the whole data set by 2-way ANOVA, taking stretch and time as the experimental variables detected no significant effect of stretch (P = 0.2397), but a significant effect of time (P <0.0001). Data compiled from 3 experiments are presented, with 6 replicate culture wells in each experiment.
4.2.5 The effect of cyclic stretch on the activity of System A (SNAT2) in L6 myoblasts
It has previously been observed that the physiological catabolic response of L6-G8C5 cultures
to low pH is unexpectedly lost when very highly fused myotube cultures are used (Pickering
et al., 2003). For that reason, the effect of stretch was also studied here using unfused
myoblasts, to determine whether the cultures were becoming refractory to stress in the fused
state. However, again no significant effect was recorded on System A (SNAT2) transport after
in vitro stretch of these myoblasts (Figures 4.6 and 4.7).
It has also been proposed that cultures of L6 myotubes may show a delayed response to cyclic
stretch. (Atherton et al., 2009a) found that there was an increase of the phosphorylation of
5 m
in
60 m
in
0
1 0 0
2 0 0
3 0 0
4 0 0
D u ra tio n o f s tre tc h
Sy
ste
m
A a
cti
vit
y (
pm
ol
Me
AIB
/ m
g p
ro
tein
/ 5
min
)
U n s tre tc h e d
S tre tc h e d

79
mTOR at Ser2448 when a delay was imposed after a bout of L6 myotube cyclic stretching.
However, there was not an effect on mTOR during stretching (ibid). In the transport
experiments that are shown in (Figures 4.4, 4.5 and 4.6) the 5 minutes 14C-MeAIB transport
assay was performed by working as rapidly as possible after stretching had stopped. In practice,
this meant that the transport measurement started approximately 1 minute to 2 minutes after
the end of stretch. In Figures 4.4 to 4.6, this led to detection of an apparent (but statistically
insignificant) increase in transport of about 20% after 1 hour of stretching. Therefore, L6
myoblasts were subjected here to cyclic stretch for 1 hour and System A (SNAT2) transport
activity was measured immediately post-stretch (as in Figure 4.6) and also post-stretch after
leaving the stretched cultures in the incubator for a further 1 hour to see if there was an effect
of further delay on transport. As shown in Figure 4.7, there was no effect of stretch at all in the
cultures that had been subjected to the extra 1 hour delay.
Figure 4.6. Time course of the effect of vacuum-induced cyclic stretch on System A (SNAT2) transport activity in L6-G8C5 myoblasts.
L6-G8C5 myoblasts cultured on collagen-coated Flexcell silicone-based culture wells were subjected to cyclic stretching using a Flexcell FX-4000 system as described in Section 2.4 (Goto et al., 2003) and stretched for the times indicated.. The medium used was MEM at pH 7.4 and contained 2mM L-Gln with 2% dialysed foetal bovine serum. Analysis of the whole data set by 2-way ANOVA, taking stretch and time as the experimental variables detected no significant effect of stretch (P = 0.4359), Data compiled from 3 experiments are presented, with 6 replicate culture wells in each experiment.
1 5 min
3 0 min
6 0 min
1 2 0 min
0
1 0 0
2 0 0
3 0 0
4 0 0
Sys
tem
A a
ctiv
ity
(pm
ol M
eAIB
/ m
g p
rote
in /
5 m
in)
U n s tre tc h e d
S tre tc h e d

80
Figure 4.7. Effect of 1 hour of cyclic vacuum-induced stretch and 1 hour of post-stretch incubation on System A (SNAT2) transport activity in L6-G8C5 myoblasts.
L6-G8C5 myoblasts cultured on collagen-coated Flexcell silicone-based culture wells were subjected to 1 hour of cyclic stretching using a Flexcell FX-4000 system as described in Section 2.4 (Goto et al., 2003), followed by a 1 hour post-stretch incubation. The medium used was MEM at pH 7.4 and contained 2mM L-Gln with 2% dialysed foetal bovine serum. Analysis of the whole data set by 2-way ANOVA, taking stretch and post-stretch incubation as the experimental variables detected no significant effect of stretch (P = 0.9642), Data compiled from 4 experiments are presented, with 6 replicate culture wells in each experiment.
imm
e dia
tely
po
s t s tr
e tch
1 h p
os t
s tre tc
h
0
2 0 0
4 0 0
6 0 0
8 0 0
1 0 0 0
Sy
ste
m
A a
cti
vit
y (
pm
ol
Me
AIB
/ m
g p
rote
in /
5 m
in)
U n s tre tc h e d
S tre tc h e d

81
4.3 Discussion
4.3.1. The effect of stretch on System A (SNAT2) transporters
In testing the hypothesis that System A (SNAT2) transporters can be activated in stretched L6-
G8C5 cells in vitro, this chapter sought to investigate the effect of mechanical loading on these
cells and to optimise the stretch methods to examine the effect on the transporters. It was hoped
that this optimisation would also provide insights into the role of different proteins involved in
the hypothesis being tested in this project, especially MAPKs. In practice, no significant effect
was observed.
There is abundant evidence, from the data in Chapter 3 of this thesis, from previous work in
this laboratory (Blbas, 2018), and from a range of cell types stressed with hypertonic medium
or by amino acid deprivation (López-Fontanals et al., 2003, Franchi‐Gazzola et al., 2006,
Hyde et al., 2007), that MAP kinases exert a major activating influence on SNAT2 transporters.
There is also strong evidence, both from the data in Chapter 3 and from other laboratories
(Hornberger and Chien, 2006, Kook et al., 2008, Chambers et al., 2009b, Fu et al., 2018) that
mechanical stretch, both in stretched myotubes and in passively stretched skeletal muscle,
acutely activates MAP kinases. Furthermore, in rat skeletal muscle studied ex vivo System A
transport is activated by exercise (King, 1994, Henriksen et al., 1992, Henriksen et al., 1993).
It is therefore surprising that when L6-G8C5 myoblasts and myotubes were stretched for
different periods, using the range of techniques applied here, no significant stimulation of
transport was observed, with the possible exception of a transient increase following very short
duration stretching of L6-G8C5 myotubes (1 minute, in Figure 4.4B). Indeed continuous stretch
for 48h showed a tendency to decrease transport (Figure 4.3B).
4.3.2. Technical artifacts
Very prolonged in vitro cell stretching may lead to cell death, as demonstrated by Liu et al.
(2009), who used a Flexcell 4000 system to conduct cyclic stretching of rat myoblasts (L6) for
up to 24 hours and found that apoptosis occurred through caspase activation as a result (Liu et
al., 2009). For this reason, such prolonged cyclic stretching was not applied in the present
experiments. The cyclic stretching protocol that was applied here is derived from the work of
Goto et al (Goto et al., 2003). Applying an 18% linear stretch in this way has been criticised
on the grounds that it is too severe and may lead to rupture of myotubes (Schultz and

82
McCormick, 1994, Zhan et al., 2007, Kook et al., 2008). For this reason, the cultures in the
present project were routinely checked for signs of myotube rupture or detachment in three
ways: by phase contrast microscopy, by monitoring the total protein content of the cultures at
the end of the experiment, and by assay of the myotube lysis marker CPK in the medium (see
Chapter 5). Spontaneous rapid fusion of L6-G8C5 myotubes leading to fragile highly fused
cultures may occasionally make them vulnerable to spontaneous detachment, especially when
they are then subjected to stretch. This was only observed in one short series of experiments in
this project (Appendix C.1). This did not suppress System A transport activity. On the contrary,
this caused a marked artifactual increase in transport activity in the remaining adherent cells,
especially in the stretched cultures (Appendix C.1).
A significant time-dependent increase in System A transport activity is routinely observed
during short incubations with the L6-G8C5 cell line (Figures 4.2, 4.4, 4.5), possibly caused
by rapid conditioning of the medium with autocrine insulin-like factors which are produced by
myotubes (Perrone et al., 1995). Insulin potently stimulates System A activity in L6 myotubes
(Hyde et al., 2002). For this reason, the apparent transient stretch-induced rise in transport
observed here in 1 minute stretching experiments should be treated with caution: because
relatively small errors in timing the experiment could lead to a large error in the System A
activity measured.
Cyclic vacuum-induced “pull” stretch and continuous or cyclic “push” stretch all yielded
similar negative results in these experiments, suggesting that the failure to observe stretch-
induced transport activation was not simply a technical artefact arising from vacuum or
temperature effects on the cell monolayer.
4.3.4. Rapid inactivation of the effect of stretch on System A (SNAT2) transport
Even though the responsiveness of p38 activation to stretch was shown to be retained in the
cultures used here (Figure 4.1), it is possible that the transport activity was not assayed
sufficiently rapidly at the end of the stretching experiments to detect the stimulation of transport
by the JNK and p38 kinases predicted from the effects of stretch in Chapter 3. The failure to
observe the predicted effect might arise because phosphorylation events activated by stretch
are rapidly inactivated by phospho-protein phosphatases (PPases) when stretching ceases.
PPase up-regulation by prolonged stretch might also explain the apparent decrease in transport
activity after 48 hours of stretching (Figure 4.3B).

83
In contrast clear activation of System A transporters by exercise has been detected in ex vivo
preparations of rat muscle in spite of prolonged post mortem processing of the tissue (King,
1994, Henriksen et al., 1992, Henriksen et al., 1993) suggesting that rapid inactivation was not
a problem there. However, in exercising muscle the lifetime of phosphorylation events may be
radically different from that in stretched myotubes. Myosin ATPase and CPK activity in
exercising muscle generates high intracellular concentrations of inorganic phosphate (Pi) by
degradation of phosphocreatine (Arnold et al., 1985) and Pi is known to be a potent inhibitor
of PPases in intact cells (Abbasian et al., 2015). Such effects would be absent in the present
study.
4.3.5. Implications of this negative result
The failure here to observe the predicted rise in System A (SNAT2) transport activity following
mechanical stretch suggests that an important part of the hypothesis outlined in Section 1.15 is
not supported by the experimental evidence. The hypothesis predicted that such a MAPK-
mediated stretch effect on System A transport, and its inhibition by the action of low pH on
MAPK activation and on the System A transporters themselves, would lead to a downstream
decline in IL-6 gene expression (via p38) and a decline in synthesis of the IL-6 protein (via
SNAT2 activity and mTORC1). Testing these downstream predictions is the subject of the next
chapter.

84
Chapter 5 Regulation of expression of Interleukin-6 (IL-6) in L6 cells
5.1 Introduction
The contraction of human skeletal muscle causes the expression and release of IL-6, which
then has numerous metabolic effects, such as the activation of AMPK, which influences fatty
acid oxidation and insulin-stimulated glucose disposal in vivo (Section 1.12). IL-6 may exert
beneficial effects in serious inflammatory states, like chronic kidney disease (Stockdale and
Miller), especially when secreted without other pro-inflammatory cytokines, such as TNF-α.
However, the presence of acidosis resulting in System A/SNAT2 inhibition in CKD patients
could theoretically result in expression of IL-6 being particularly weak, for the reasons
explained in the hypothesis section of this thesis (Section 1.15). The resulting depletion of
important amino acids is in principle problematic because the protein kinase complex
mTORC1, which plays a crucial role in protein synthesis (including possibly synthesis of the
IL-6 protein itself), is sensitive to amino acids. In addition exercise-induced lactic acidosis
could in principle worsen this problem when CKD patients exercise (Watson et al., 2013a),
which might have further adverse effects on mTORC1 and the production of IL-6 and, and
result in a corresponding drop in global protein synthesis.
The experiments described in this chapter aim to test these possibilities to better understand the
effect of low pH in stretched skeletal muscle cells (L6 cells) (in vitro), in an attempt to mimic
some aspects of what happens in exercising skeletal muscle in CKD patients. This model (using
the FX-4000 system as described in 2.4) involving lengthening of the cells could mimic
eccentric contraction of skeletal muscles, but cannot mimic concentric muscle contraction.
This study proposes to test the following hypothesis:
1) In mechanically stressed skeletal muscle cells, in vitro mechanical stretching can lead to
MAPK activation, resulting in increased expression of Il-6 mRNA and (at least in vivo (King,
1994, Henriksen et al., 1992, Henriksen et al., 1993)) to System A/SNAT2 up-regulation,
followed by mTORC1 activation and ultimately the up-regulation of translation and global
protein synthesis and synthesis of the IL-6 protein.
2) The above pathway is inhibited (and IL-6 myokine expression and output lessened) as a
result of the associated inhibition by acidosis of MAP kinases and SNAT2 (Evans et al., 2007b,
Evans et al., 2008b, Blbas, 2018).

85
3) Similar effects should be obtained by experimental MAPK inhibition or SNAT2 gene
silencing by siRNA.
However, before this hypothesis can be tested, it is important to note that a key feature of
muscle contraction which cannot be simulated in vitro by mechanical stretch alone is the rise
in intracellular Ca2+ concentration (Iwata et al., 2007) which has been shown previously to be
an important factor regulating IL-6 gene expression in L6 myotubes (Chan et al., 2004b). In
earlier studies with those cells this requirement was satisfied by treating the cells with the Ca2+
ionophore ionomycin (Chan et al., 2004b) and, for this reason, ionomycin was also used in the
experiments described in this chapter.
In (Figures 5.1A, 5.2, 5.4 and 5.5) myotubes were incubated with ionomycin for 6 hours and
IL-6 expression was measured as described in Section 2.13.3. However, myoblasts were used
in (Figure 5.1B).
In (Figures 5.7 and 5.8) SNAT2 was silenced in myoblasts as described in Section 3.13.5 and
IL-6 expression was measured as described in Section 2.13.3.
In (Figure 5.9) myotubes were cyclically stretched as described in Section 2.4, under different
pH conditions and then IL-6 expression was measured as described in Section 2.13.3.
5.2 Results
5.2.1 The effect of stimulation with ionomycin and p38 MAP kinase inhibition on IL-6
gene expression in L6-G8C5 myotubes
In L6 myotubes, it has been shown previously that ionomycin induces p38 MAPK activation
in the nucleus, which increases the expression of IL-6 mRNA (Chan et al., 2004b) and a p38
inhibitor drug (SB203580) blocked the effect on IL6 expression (Chan et al., 2004b). The
previous results in Chapter 3 (Figure 3.7) demonstrate p38 activation by mechanical stretch
(and inhibition of p38 by low pH as in Figure 3.4). It is therefore possible that mechanical
stretch or low pH will also affect IL-6 expression. The initial aim of this investigation was to
reproduce the effect of ionomycin on IL-6 mRNA expression reported by Chan et al.(Chan et
al., 2004b), and to attempt to block this expression using a different p38 inhibitor SB202190.
This inhibitor differs from the one used by Chan et al. but showed significant effects on System
A/SNAT2 activity in L6-G8C5 cells (see Figure 3.1A). In agreement with Chan et al. a very
marked 50-fold increase in IL-6 mRNA was observed in response to ionomycin and

86
interestingly, this expression of IL-6 mRNA was significantly inhibited by pharmacological
p38 inhibition, despite the use of a different p38 inhibitor (Figure 5.1A).
Figure 5.1. The effect of ionomycin and p38 MAP kinase inhibition on IL-6 gene expression in L6-G8C5 myotubes and myoblasts.
A) In L6-G8C5 myotubes IL-6 mRNA was measured by RT-qPCR using a Rat IL-6 Taqman gene expression assay and TBP as a house-keeping gene. The expression of IL-6 was related to TBP expression as secribed in 2.12.3 (Pfaffl, 2001). The myotubes were cultured in a medium based on MEM at pH 7.4, containing 2mML- glutamine with 2% dialysed foetal bovine serum. Then the myotubes were incubated for 6 hours with 0. 5 µM ionomycin and 5µM SB202190 (p38 inhibitor), and either no drugs as a baseline control, or 0.5µM ionomycin as a positive control. Pooled data are shown from n=3 independent experiments. ** Denotes a significant difference from the positive control (P<0.01). B) shows a similar experiment performed n L6-G8C5 myoblasts. Culture conditions were as described below in (Figure 5.7).* Denotes a significant difference from the control (P<0.05).
5.2.2 The effect of low pH on IL-6 mRNA and protein expression in L6-G8C5 myotubes
It was hypothesised (in Section 1.15) that IL-6 expression (especially IL-6 protein expression)
might be impaired at low pH. This also seems likely in view of the strong p38 dependence of
IL-6 expression that was seen in(Figure 5.1, and the observation that basal p38 activation was
inhibited by low pH in Figure 3.4. The effect of low extracellular pH on the expression both of
IL-6 mRNA (Figure 5.2) and of IL-6 protein (Figure 5.3) was therefore tested. The predicted
decrease of IL-6 mRNA expression was not observed (Figure 5.2) on the contrary when cells
were stimulated at low pH in the presence of ionomycin, a surprising significant increase was
observed in the IL-6 mRNA expression (Figure 5.2) and a similar fractional increase with low
pH was also observed in the absence of ionomycin but fell short of statistical significance.
A B

87
However, in contrast there was no significant effect of ionomycin or pH on IL-6 protein
secretion into the culture medium measured by ELISA (Figure 5.3) even though the IL-6
positive control provided with the assay was clearly detected.
Figure 5.2. The effect of low pH on the stimulation by ionomycin of IL-6 gene expression in L6-G8C5 myotubes.
IL-6 mRNA was measured by RT-qPCR using Rat IL-6 Taqman gene expression assay and TBP as a house-keeping gene. The expression of IL-6 was related to TBP expression (Pfaffl, 2001). The myotubes were cultured in a medium that was based on MEM at a control pH of 7.4, or pH 7.1 which contained 2mM L-glutamine with 2% dialysed foetal bovine serum. The myotubes were then incubated for 6 hours either with no drug as a baseline control or with 0.5 µM ionomycin at pH 7.4 or pH 7.1. Pooled data are shown from n=3 independent experiments. **** Denotes significant difference between two conditions (P=<0.0001).
Control
Ionom
ycin
pH 7.1
Ionom
ycin in
pH 7
.10
10
20
30
Rel
ativ
e IL
-6 m
RN
Aex
pres
sion
****
****

88
Figure 5.3. The effect of low pH and of ionomycin on IL-6 protein secretion in L6-G8C5 myotubes.
Myotubes were cultured in a medium that was based on MEM at pH 7.4 or pH 7.1 with 2mM L-glutamine with 2% dialysed foetal bovine serum. The myotubes were then incubated for 6 hours either with no drug as a baseline control or with 0.5 µM ionomycin at pH 7.4 or pH 7.1 or pH 7.7 and supernatants was taken for assay as described in Section 2.7. Data pooled from 3 independent experiments.
5.2.3 The effect of p38 inhibitor, JNK inhibitor and MeAIB on the stimulatory effect of
ionomycin on IL-6 gene expression in L6-G8C5 myotubes
It was hypothesised (in Section 1.15) that inhibition of System A/SNAT2 might lead to
inhibition of IL-6 expression. In view of Chan et al.’s (Chan et al., 2004b) observation
(confirmed in Figure 5.1A) of p38 inhibition suppressing IL-6 mRNA expression; and in view
of the observation (in Figure 3.1A) that p38 inhibition inhibited System A / SNAT2 activity, it
is also possible that p38 inhibition may be inhibiting IL-6 mRNA expression at least partly
through inhibiting System A / SNAT2. In Figure 3.1A, it was observed that inhibition of JNK
also inhibited System A/SNAT2 activity. JNK has also been reported in a number of cell types
to be activated by Ca2+ (Sun et al., 2017, Brnjic et al., 2010, Kim and Sharma, 2004, Saxena et
al., 2011, Arthur et al., 2000, Dhanasekaran and Reddy, 2017, Huang et al., 2014), suggesting
that it might play a role in the stimulatory effect of ionomycin that was observed in Figure
5.1A. Therefore, the aim of this experiment was to see the effect of a JNK inhibitor, and direct
competitive inhibition of System A / SNAT2 amino acid transport activity with a saturating
Post
ive
contr
ol
Contr
ol pH 7
.4
Ionom
ycin
in p
H 7
.4
Ionom
ycin
in p
H7.
1
Ionom
ycin
in p
H7.
7
0
100
200
300
400
IL-6
(p
g/m
l)

89
dose (10mM) of MeAIB, on IL-6 expression. In spite of the predicted roles of JNK and System
A / SNAT2, it was found that only p38 inhibitor inhibited ionomycin-induced IL-6 expression
(Figure 5.4), indeed MeAIB may have further increased expression, although this fell short of
statistical significance (P =0.0754 ), and JNK inhibitor may also have had a weak stimulatory
effect.
Figure 5.4. The effect of JNK inhibition and MeAIB on the stimulation by ionomycin of IL-6 gene expression in L6-G8C5 myotubes.
IL-6 mRNA was measured by RT-qPCR using Rat IL-6 Taqman gene expression assay and TBP as a house-keeping gene. The expression of IL-6 was related to TBP expression (Pfaffl, 2001). The myotubes were cultured in a medium that was based on MEM at pH 7.4, and which contained 2mM L-glutamine with 2% dialysed foetal bovine serum. The myotubes were then incubated for 6 hours either with no drugs as a baseline control or with 0.5µM ionomycin with and without drugs at pH 7.4. These drugs include 10µM JNK inhibitor (SP600125) and 10mM MeAIB. Pooled data are shown from n=3 independent experiments. *** Denotes significant difference between two conditions (P<0.001), **** (P=<0.0001).

90
5.2.4 The effect of low pH with JNK inhibitor and MeAIB on the stimulation by
ionomycin of IL-6 gene expression in L6-G8C5 myotubes
Even though JNK inhibitor and MeAIB failed to inhibit ionomycin-induced IL-6 expression at
pH 7.4 (Figure 5.4), the acid-induced stimulation of IL-6 mRNA expression that was observed
in Figure 5.2 showed a completely different response to these agents (Figure 5.5). The data
show that IL-6 expression at pH 7.1 with ionomycin was significantly inhibited by JNK
inhibitor and a marginally significant inhibition (P=0.052) was also observed with MeAIB.
This observation of a marked JNK dependence at pH 7.1 but not at pH 7.4 was unexpected in
view of the significant inhibition of basal JNK activation by low pH that had previously been
observed in Chapter 3 (Figure 3.3) – see Discussion Section 5.3.
Figure 5.5. The effect of JNK inhibition and MeAIB on the stimulatory effect of low pH and ionomycin on IL-6 gene expression in L6-G8C5 myotubes.
IL-6 mRNA was measured by RT-qPCR using Rat IL-6 Taqman gene expression assay and TBP as a house-keeping gene. The expression of IL-6 was related to TBP expression (Pfaffl, 2001). The myotubes were cultured in a medium that was based on MEM at pH 7.4 or pH 7.1 which contained 2mML- glutamine with 2% dialysed foetal bovine serum. The myotubes were then incubated for 6 hours either with no drugs as a baseline control or with 0.5 µM ionomycin with and without drugs either at pH
7.4 or pH 7.1. These drugs included 10M JNK inhibitor (SP600125) and 10 mM MeAIB. Pooled data are shown from n=3 independent experiments. * Denotes significant difference between two conditions (P<0.05), **** (P=<0.0001).

91
5.2.5 Measurement of intracellular Ca2+
A possible explanation for the unexpected stimulation of IL-6 mRNA expression by low pH in
Figures 5.2 and 5.5, and for the suppression of this effect by a JNK inhibitor at low pH (Figure
5.5) but not at pH 7.4 (Figures 5.4 and 5.5) is that low pH is increasing intracellular Ca2+ which
could further enhance the effect shown in Figure 5.1 and also activate JNK (Sun et al., 2017,
Brnjic et al., 2010, Kim and Sharma, 2004, Saxena et al., 2011, Arthur et al., 2000,
Dhanasekaran and Reddy, 2017, Huang et al., 2014). As low pH had only a relatively small
stimulatory effect on IL-6 expression in the absence of ionomycin (Figure 5.2) this might arise
because low pH increases the ability of ionomycin to carry Ca2+ into the cell. However, direct
measurements of the pH dependence of ionomycin’s effect as an ionophore have shown that
this does not occur: in fact ionomycin is reported to become more active as pH rises (Stiles et
al., 1991). Furthermore direct measurement of intracellular Ca2+ in L6-G8C5 myoblasts using
the fluorescent indicator Fluo-4 (Figure 5.6) failed to detect any significant change in response
to low pH or to inhibition of System A / SNAT2 transporter flux with a saturating dose of
MeAIB. Even though the Fluo-4 AM ester had entered the cells and undergone de-esterification
to the fluorescent dye (Figure 5.6) and even though this fluorescence was clearly responsive to
Ca2+ depletion with EGTA and to Ca2+ loading with high dose ionomycin during calibration
(Figure 5.6), all other stimuli had no apparent effect on the Ca2+ concentration (Figure 5.6).

92
Figure 5.6. The effect of pH and MeAIB with or without ionomycin on intracellular calcium levels of L6 myoblasts.
A) Negative control image of cells without FLuo-4 showing auto-fluorescence. B) An image of the Fluo-4 loaded cells showing their enhanced fluorescence. C) Typical calibration data showing the effect on the fluorescence signal of adding high dose ionomycin and EGTA. D) L6 myoblasts were cultured in DMEM Growth Medium for 18h as described in Section 2.13. Then, the Growth Medium was gently aspirated from each well, which was then rinsed with 200µl of PSS. Then, the cells were loaded with fluo-4-AM ester (Fisher-11504786) for 45 minutes at 37°C under a 5% CO2 atmosphere. After that, the wells were rinsed three times with 200µl of PSS-BSA, and then 200µl of fresh PSS-BSA was added to each well and cells were incubated again in a humidified incubator at 37oC to allow time for the Fluo-4 AM to be de-esterified by the cells to generate the free Fluo-4 dye. Then the fluorescence intensity was read on a NOVOstar plate-reader at an excitation wavelength of 488nm, and detecting at >500nm at 37oC. Pooled data are shown from n = 3 independent experiments. The ionomycin concentrations that was used in the experiment was 0.5µM and the higher concentration of ionomycin that was used in the calibration was 1µM.
A B
C D

93
5.2.6 The effect of siRNA silencing of SNAT2 on the stimulation of IL-6 gene expression
in L6-G8C5 myoblasts
The aforementioned results (Figure 5.5) suggest that the stimulation of IL-6 mRNA expression
by iononmycin in L6-G8C5 myotubes is more effective at pH 7.1 than at pH 7.4. This is not
what would be expected if, as originally postulated (Section 1.15), System A / SNAT2
promotes IL-6 expression and is inhibited by low pH. However, a saturating dose of the System
A substrate MeAIB did seem to suppress IL-6 expression in Figure 5.5. Therefore, to clarify
further the role of System A / SNAT2 in regulation of IL-6 expression, silencing of the
expression of SNAT2 with anti-SNAT2 siRNA was performed, to see whether it mimicked the
enhancing effect of low pH on ionomycin-induced IL6 expression in L6-G8C5 cells, or (in
contrast) mimicked the inhibitory effect of MeAIB. In this experiment, it was necessary to use myoblasts rather than myotubes, because myoblasts
allow more efficient siRNA transfection and hence more efficient siRNA silencing of SNAT2
(Evans et al., 2007a, Evans et al., 2008a). Silencing of SNAT2 with siRNA is measurable in
myotubes (Evans et al., 2008b) but is less marked than in myoblasts. However, myotubes
(Figure 5.1A) and myoblasts (Figure 5.1B) both show a strong increase in IL-6 mRNA
expression in response to ionomycin, thus allowing the effect of SNAT2 silencing on IL-6
expression to be studied in myoblasts.
The experiment aimed to test whether the level of SNAT2 expression can influence IL-6
expression. In myoblasts SNAT2 was silenced successfully using the silencing siRNA (Figure
5.7). However, in studying cytokine expression, it is important to control for non-specific
effects of siRNAs on cells, because of evidence that uncapped RNA is sensed by mammalian
cells as a sign of viral infection, and can induce some aspects of an inflammatory response
(Kanasty et al., 2012). In studying IL-6 expression, it is important therefore to compare the
effect of SNAT2 silencing siRNA with an irrelevant scrambled control sequence rather than
with transfection reagent alone. Compared with transfection reagent alone, scrambled siRNA
led to an apparent increase in IL-6 expression both without (Figure 5.8A) and with (Figure
5.8B) ionomycin, and this reached statistical significance when no ionomycin was present.
However, relative to this elevated baseline, the same concentration of SNAT2 silencing siRNA
gave an apparent decrease in IL-6 mRNA. In the presence of ionomycin (Figure 5.8B), this
reached statistical significance – apparently consistent with the marginal inhibition of IL-6
mRNA expression induced by MeAIB at low pH in Figure 5.4.

94
Contr
ol,non-t
ransf
ecte
d
Transf
ectio
n rea
gent o
nly
SNAT2
Scr
SNAT2
SIL
0.0
0.5
1.0
1.5
Rela
tive S
NA
T2 m
RN
Aexp
ressio
n
P= 0.0190
Figure 5.7. Testing the effect of anti-SNAT2 siRNA reagent on SNAT2 mRNA expression.
L6 myoblasts were cultured in DMEM growth medium for 24h then the medium was aspirated and replaced with half of the usual volume of growth medium and treated with 30nM scrambled control siRNA (Scr) (Evans et al., 2007b), silencing anti-SNAT2 siRNA (SIL). The cells were left with the transfection mix for 16h then the medium with the transfection mix was aspirated and replaced with double the normal volume of the usual growth medium for another 24h before commencing the experiment. The myoblasts were then incubated for 6 hours in the test media. The medium that was used was based on MEM at pH 7.4 and contained 2mM L-Gln with 2% dialysed foetal bovine serum. The non-transfected cells were used as an additional negative control in the experiment. SNAT2 mRNA was measured by RT-qPCR using rat SNAT2 Taqman gene expression assay and TBP as a house-keeping gene. The expression of SNAT2 was related to TBP expression (Pfaffl, 2001). Pooled data are shown from n=4 independent experiments. (Friedman’s ANOVA with Dunn’s multiple comparison post hoc test).

95
Figure 5.8. Effect SNAT2 silencing on the expression of IL-6 mRNA in absence of ionomycin.
L6 myoblasts were cultured in DMEM growth medium for 24h then the medium was aspirated and replaced with half of the usual volume of growth medium and treated with 30nM scrambled control siRNA (Scr) (Evans et al., 2007b), or silencing anti-SNAT2 siRNA (SIL). The cells were left with the transfection mix for 16h then the medium with the transfection mix was aspirated and replaced with double the normal volume of the usual growth medium for another 24h before commencing the experiment. The myoblasts were then incubated for 6 hours in the test media A) in absence of
ionomycin, B) with 0.5M ionomycin. The medium that was used was based on MEM at pH 7.4 and contained 2mM L-Gln with 2% dialysed foetal bovine serum. IL-6 mRNA was measured by RT-qPCR using a rat IL-6 Taqman gene expression assay and TBP as a house-keeping gene. The expression of IL-6 was related to TBP (Pfaffl, 2001). Pooled data are shown from n=4 independent experiments. (Friedman’s ANOVA with Dunn’s multiple comparison post hoc test).
5.2.7 A revised model for regulation of IL-6 expression
The results presented above do not support the hypothesis in Section 1.15 that a low
extracellular pH would decrease IL-6 expression by inhibiting the amino acid transport rate
through System A/SNAT2 transporters and by inhibiting MAPK (p38) activation. However,
even though there was no clear evidence that the System A amino acid transporter activity of
SNAT2 affected IL-6 expression, it is possible that indirect effects of the SNAT2 protein occur
through the proposed “transceptor” function of SNAT2 in sensing extracellular signals (Hyde
et al., 2007). Additionally, System A transporters like SNAT2 may associate with integrins in
the plasma membrane (McCormick and Johnstone, 1995). Integrins and their associated
tyrosine kinases (for example Focal Adhesion Kinase, FAK) are thought to play an important
role in the mechanotransduction signals by which mechanical stretch can activate MAPKs

96
(Hanke et al., 2010). It has also been shown using L6-G8C5 myoblasts that siRNA silencing
of SNAT2 can impair phospho-activation of JNK (Blbas, 2018). A revised model that may
explain the links observed between mechanical stretching, SNAT2 and JNK activation is
illustrated below in Figure 5.14 (see Discussion Section 5.3).
If the proposed link between System A / SNAT2, integrins (McCormick and Johnstone,
1995) and possibly FAK occurs in L6G8C5 myotubes, it would be predicted that:
1. Mechanotransduction through this complex by stretching the cells should increase
IL-6 mRNA.
2. As the proposed effect in (1) is not directly Ca2+ - dependent, it should occur without
ionomycin.
3. As pH sensitive System A transport is not involved, the effect in (1) may not be
strongly pH sensitive.
4. The effect in (1) may be inhibited by a selective inhibitor of FAK
5.2.8 The effect of short periods of cyclic stretching on IL-6 mRNA expression in L6-
G8C5 myotubes
The only previously reported study of the effect of stretch on IL-6 expression in myotubes
stretched the cells up to 1 hour (Juffer et al., 2014). Therefore, this study sought to evaluate the
effect of short duration (30 minutes) stretching on the expression of mRNA of IL-6 in L6-
G8C5 myotubes, using a vacuum FX-4000 mechanical stretcher exactly as described in
Chapter 4. A significant increase was found in the expression of IL-6 mRNA after the L6
myotubes were stretched. This was observed in the absence of ionomycin and in all pH
conditions studied – from pH 7.1 to pH 7.7 (Figure 5.9). Unlike the myotubes treated with
ionomycin (Figures 5.2 and 5.5), no statistically significant pH dependence of the IL-6 mRNA
expression was seen, either in stretched or unstretched cells (Figure 5.9).
However, in the same experiments there was no corresponding effect on IL-6 protein secretion
when the same conditions were applied (Figure 5.10). This could be due a defective step in
post-translation modification of the IL-6 protein (see Discussion) or a decline in cell viability
owing to myotubes rupture induced by stretch. However, L6 myotubes that were stretched for
30 minutes showed no sign of cell damage judged from release of the intracellular marker
enzyme CPK into the medium, except at pH 7.7. This condition had slightly higher CPK levels,

97
as can be seen in Figure 5.11. For this reason, the apparent (but statistically insignificant)
increase in IL-6 mRNA observed at pH 7.7 in Figure 5.9 should be treated with caution, as it
may be a consequence of cell damage.
Pre-stretch well + - - - + - - -
pH 7.4 7.4 7.1 7.7 7.4 7.4 7.1 7.7
Stretched well - + + + - - - -
Unstretched + - - - + - - -
Incubation conditions
Figure 5.9. Effect of 30 minutes of cyclic stretch on the expression of IL-6 mRNA.
L6-G8C5 myotubes were cultured on collagen-coated Flexcell silicone-based culture wells. The medium used was based on MEM at pH 7.4 and contained 2mM L-Gln with 2% dialysed foetal bovine serum. Myotubes were stretched using an FX-4000 system as described in Section 2.4 (Goto et al., 2003). IL-6 mRNA was measured by RT-qPCR using a rat IL-6 Taqman gene expression assay and TBP (TATA-box binding protein) as a house-keeping gene. The expression of IL-6 was related to TBP expression (Pfaffl, 2001). Pooled data are shown from n=3 independent experiments. * Denotes significant difference from Pre-stretch Control (P<0.05), ** (P<0.01), *** (P<0.001).

98
Positive control + - - - - - - - -
Pre-stretch well - + - - - + - - -
pH 7.4 7.4 7.4 7.1 7.7 7.4 7.4 7.1 7.7
Stretched well - - + + + - - - -
unstretched + + - - - + - - -
Incubation conditions
Figure 5.10. Effect of 30 minutes of cyclic stretch on the secretion of IL-6 protein.
L6-G8C5 myotubes were cultured on collagen-coated Flexcell silicone-based culture wells. Myotubes were stretched for 30 minutes using a FX-4000 system as described in Section 2.4 (Goto et al., 2003) under the different conditions shown on the figure and supernatants were taken and assayed for rat IL-6 by ELISA as described in Section 2.8. Data pooled from 3 independent experiments are shown.

99
Positive control + - - - - - - - -
Pre-stretch well - + - - - + - - -
pH 7.4 7.4 7.4 7.1 7.7 7.4 7.4 7.1 7.7
Stretched well - - + + + - - - -
unstretched + + - - - + - - -
Incubation conditions
Figure 5.11. The effect of 30 minutes of cyclic stretch on creatine phosphokinase (CPK) released into the medium from L6-G8C5 myotubes.
L6-G8C5 myotubes were cultured on collagen-coated Flexcell silicone-based culture wells. Myotubes were stretched for 30 minutes using the FX-4000 system as described in Section 2.4 (Goto et al., 2003) under the conditions shown on the figure and supernatants were taken and assayed for CPK as described in Section 2.9. Data pooled from 3 independent experiments are shown.
5.2.9 The effect of blockade of Focal Adhesion Kinase (FAK) with selective inhibitor (PF-
573228) and p38 inhibitor (SB202190) on the effect of mechanical stretch on IL-6
expression in L6-G8C5 myotubes
The model shown in Section 5.3, Figure 5.14 suggests that integrins and FAK may play a role
in regulation of MAPKs (and hence IL-6 gene expression). Therefore, the aim of this
experiment was to measure the effect of a selective FAK Inhibitor (PF-573228) (Slack-Davis
et al., 2007) and of a p38 inhibitor (SB202190) on the apparent stimulation of IL-6 mRNA
expression that was induced in L6 myotubes by mechanical stretching as described in Figure
5.9. First, FAK inhibitor (PF-573228) was tested to confirm its efficacy by pre-incubating it

100
with L6-G8C5 myotubes for 4 hours and measuring the FAK-phosphorylation using an anti-
phospho-FAK (Tyr576/577) antibody. To ensure optimum selectivity of this FAK inhibitor,
the minimum dose was used that gave a clearly measurable inhibition of the phosphorylation
of FAK (Figure 5.12). Then, L6 myotubes were stretched for 30 minutes with FAK and p38
inhibitors and IL-6 expression were measured. Interestingly, both inhibitors detectably
inhibited the increased IL-6 expression that was induced by stretching (Figure 5.13).
Figure 5.12. Testing the effectiveness of FAK inhibitor (PF-573228) on phosphorylation of phospho-FAK (Tyr576/577) in L6-G8C5 myotubes.
Cells were pre-incubated at pH 7.4 in MEM/2% DFBS with FAK inhibitor (1µM PF573228) for 4 hours. After 4 hours incubation in the test media, the plates were immediately placed on a tray of crushed ice. The media were then rapidly aspirated and each well immediately scraped in 200ul of Lysis Buffer. Immunoblots of proteins were separated by SDS-PAGE; probing with anti-p-FAK antibody and the bands (125 kDa) were quantified by densitometry using the ChemiDoc Touch Imaging System. Pooled data are shown from n=3 independent experiments, with at least 2 replicate culture wells in each experiment. * Denotes significant difference from Control (P<0.05).

101
Figure 5.13. The effect of blockade of Focal Adhesion Kinase (FAK) with selective inhibitor (PF-573228) and p38 inhibitor (SB202190) on the effect of mechanical stretch on IL-6 Expression in L6-G8C5 myotubes.
L6-G8C5 myotubes were cultured on collagen-coated Flexcell silicone-based culture wells. The medium used was based on MEM at pH 7.4 and contained 2mM L-Gln with 2% dialysed foetal bovine serum. Myotubes were stretched using an FX-4000 system as described in Section 2.4 (Goto, Okuyama et al. 2003). IL-6 mRNA was measured by RT-qPCR using a rat IL-6 Taqman gene expression assay and TBP as a house-keeping gene. The expression of IL-6 was related to TBP expression (Pfaffl 2001). Pooled data are shown from n=3 independent experiments. * Denotes significant difference between stretched control cells and stretched cells with FAK inhibitor (1µM PF573228) (P<0.05). *** Denotes significant difference between stretched control cells and stretched cells with p38 inhibitor (5µM SB202190) (P<0.001).

102
5.3 Discussion
5.3.1 Ionomycin or cyclic stretch increase expression of IL-6 mRNA but not IL-6 protein
The reason for the failure of the stimulatory effects of ionomycin and low pH on IL-6 mRNA
to be translated into similar effects on the secreted IL-6 protein is unknown. In principle an
effect may have been missed here because of a possible time lag between the rise in IL-6
mRNA and secretion of a mature IL-6 protein for which rate-limiting processing steps such as
glycosylation (Santhanam et al., 1989) may be required. Sampling the culture medium at later
time points might therefore have detected stimulation of release of IL-6 protein. However it
should be noted that such stimulation of IL-6 protein expression in vitro has also not been
reported elsewhere (for example in (Chan et al., 2004b)), possibly indicating some form of
defect in post-translational processing of the IL-6 protein or a defect in its secretion from L6-
G8C5 cells. As the protein was assayed here only in the medium and not in the cell layer, the
present experiments give no information on the efficiency of IL-6 secretion from the cells, and
this would be worth investigating in future experiments.
5.3.2 Low pH exerts an unexpected stimulatory effect on ionomycin-induced IL-6 mRNA
expression
An important paradox that was observed in these experiments was that the acid-induced rise in
IL-6 mRNA (at pH 7.1 with ionomycin) was partly blocked by JNK inhibitor even though JNK
inhibitor had no effect on IL-6 mRNA at pH 7.4 (Figure 5.5). This effect of JNK inhibitor at
low pH was unexpected, because directly measured phospho-activation of JNK was lower at
pH 7.1 than at pH 7.4 (Figure 3.3). However, an important difference between the Chapter 3
data and the data in Figure 5.5 is that Figure 3.3 shows the effect of pH on JNK activation
under basal conditions, whereas Figure 5.5 shows the effect of pH in Ca2+ - loaded cells. As
Ca2+ has been reported to activate JNK (Sun et al., 2017, Brnjic et al., 2010, Kim and Sharma,
2004, Saxena et al., 2011, Arthur et al., 2000, Dhanasekaran and Reddy, 2017, Huang et al.,
2014), it is possible that the overall pH dependence of JNK activation is significantly different
in Ca2+ loaded cells. In the presence of Ca2+ it seems that a JNK-dependent pathway has been
activated by low pH, possibly indicating that the decline in JNK phospho-activation that was
observed in Figure 3.3 is reversed in Ca2+ loaded cells, resulting in a rise in JNK activation at
low pH. This could be tested by direct measurement of the pH dependence of JNK activation
in ionomycin-treated cells.

103
The acid-induced rise in IL-6 mRNA at pH 7.1 with ionomycin could not be explained by an
effect on low pH on System A transporters. The molecule(s) that sense this pH change and
signal to IL-6 gene expression (possibly via JNK) are still unknown. The findings of the current
study might be attributable to an effect of low pH on intracellular calcium signalling to the
induction of IL-6 expression. However, direct measurement of cytosolic Ca2+ under different
conditions (including pH 7.4, and pH 7.1 with and without ionomycin) did not detect a
significant change of cytosolic Ca2+ in Figure 5.6. This does not completely rule out a role for
intracellular calcium levels in L6 myoblasts however, because it is possible that low pH is
acting on the cells through some other intracellular calcium pool – for example in the nucleus
where a nuclear p38 pool is thought be acting on IL-6 gene expression (Chan et al., 2004b).The
occurrence of such large non-cytosolic calcium pools in L6-G8C5 cells, buffering the cytosolic
pool, might explain why the measured cytosolic Ca2+ pool was so resistant to ionomycin in
Figure 5.6.
5.3.3 Coupling between System A/SNAT2 and IL-6 expression
Even though attempted inhibition of System A transporters with a saturating dose of MEAIB
(Figure 5.5) or silencing of SNAT2 gene expression with siRNA (Figures 5.7 and 5.8) may
have had some partial blunting effect on the stimulation of IL-6 mRNA expression by
ionomycin with or without low pH, no evidence was found in this chapter for a tight or
obligatory coupling between System A / SNAT2 transporters and the amount of IL-6 mRNA.
MeAIB had no detectable effect on IL-6 mRNA with ionomycin at the control pH of 7.4 (Figure
5.4); and mechanical stretching clearly stimulated IL-6 mRNA expression, even though stretch
had no effect on System A / SNAT2 activity in Chapter 4 under the same conditions.
Even though the scrambled siRNA control that was used here in Figures 5.7 and 5.8 has
previously been validated in L6 myoblasts (Evans 2007, 2008), in future work on IL-6
expression in these cells it would be useful to examine other scrambled control sequences to
confirm that these give similar results and that the scrambled sequence used here is not exerting
an indirect off-target stimulatory effect on SNAT2 or IL-6 expression.

104
5.3.4 A revised model for regulation of IL-6 expression in L6G8-C5 myotubes
Figure 5.14. Schematic diagram showing pathways investigated in this chapter that may contribute to increased IL-6 mRNA expression in L6-G8C5 cells.
A number of observations in this study seem consistent with the revised model that is shown
in schematic form in Figure 5.14 and as outlined in Section 5.2.7. Stretching L6 myotubes for
short periods significantly increased levels of IL-6 mRNA gene expression, even at low pH.
This outcome would not be expected if the amino acid transport rate through System A /
SNAT2 was a dominant factor controlling IL-6 expression as was originally postulated in
Section 1.15.However, this does not exclude a possible involvement of the SNAT2 protein as
a “transceptor” – sensing extracellular signals or, through its reported complex with alpha 3 ,
beta 1 integrins (McCormick and Johnstone, 1995), possibly sending stretch signals to FAK.
At least a partial involvement of FAK was detected here in the inhibitor experiment in Figure
5.14.
In addition to competitively blocking amino acid influx into cells through System A / SNAT2
transporters, a saturating dose of MeAIB has also been reported to down-regulate SNAT2
protein expression in L6 myotubes, apparently through sensing extracellular MeAIB and
signalling as a transceptor in these cells (Hyde et al., 2007). This may explain the apparent
blunting effect of MeAIB on IL-6 mRNA that was observed in (Figure 5.5). Such transceptor
signals from SNAT2 have also been reported to be blocked by a JNK inhibitor (Hyde et al.,

105
2007) which might contribute to the inhibitory effect of JNK inhibition on the rise in IL-6
mRNA in response to ionomycin and low pH in Figure 5.5.
In contrast to the marked effect of pH on ionomycin-induced IL-6 expression in Figure 5.5, no
significant pH dependence of the effect of mechanical stretch on IL-6 mRNA expression was
observed. This seems consistent with the idea that pH sensitive System A amino acid transport
is not directly involved in this process. A transport-independent System A/integrin/FAK
complex might have a role (Figure 5.14) and might be insensitive to pH. FAK itself has been
reported to respond to pH (Ilic et al., 2007, Choi et al., 2013, Paradise et al., 2011), but it is not
yet known whether FAK in L6-G8C5 myotubes is able to respond to the relatively narrow
range of pH values that were applied in this study.
5.3.5 Conclusion from the experimental work
In spite of the importance of System A / SNAT2 amino acid transporters in the supply of neutral
amino acids and regulation of mTORC1 and global protein synthesis in L6-G8C5 cells (Evans
et al., 2007b, Evans et al., 2008b), and in spite of the inhibition of System A / SNAT2 and of
basal MAPK activation (including p38) by low pH; applying a low pH to these cells was found
to enhance significantly the p38-dependent stimulation of IL-6 mRNA expression that was
induced by ionomycin. Discussion of the possible physiological relevance of this result in the
response of muscle to exercise and in the response of muscle to acidosis is the subject of the
next chapter.

106
Chapter 6 General Discussion and Future Work
6.1 General discussion
6.1.1 The physiological significance of the findings in this thesis
Previously in Section 1.15 and Figure 1.7 of this thesis, the hypothesis to be tested was stated
to be that in L6-G8C5 rat skeletal muscle cells the expression and biosynthesis of IL-6 would
be:
c) Stimulated by FAK and MAP kinases (p38 and JNK) and dependent on the System
A/SNAT2 amino acid transporter, and
d) Inhibited by low extracellular pH acting through an inhibitory effect on MAP kinase
activation and on System A/SNAT2 transporters (Evans et al., 2007b, Evans et al.,
2008b, Blbas, 2018).
The data presented in Chapters 3, 4 and 5 of this thesis do not support part (b) of this hypothesis.
In particular, in Chapter 5 the effect of low extracellular pH on the expression of IL-6 at mRNA
level (in the presence of Ca2+ loading with ionomycin) was found to be the opposite of what
was predicted. A significant enhancement of IL-6 expression was observed at low pH. Even
though the model in Figure 1.7 cannot fully explain the data, neither can the previously
accepted model of IL-6 transcriptional regulation in muscle proposed by Febbraio and
Pedersen in 2002 (Febbraio and Pedersen, 2002) (Figure 6.1) explain this significant pH
sensitivity.
Figure 6.1 The 2002 model proposed for the transcriptional regulation of IL-6 in skeletal muscle in Febbraio, MA and Pedersen, BK (Febbraio and Pedersen, 2002).

107
The idea that low pH and lactic acidosis might play a part in the IL-6 myokine response to
exercise is not new however. It was suggested 20 years ago that lactate or lactic acid generated
by exercise might have an important role in mediating the increased expression and secretion
of IL-6 in muscle (Ostrowski et al., 1998a), because the circulating IL-6 response to exercise
was found to correlate tightly with the peak lactate response. However this idea was abandoned
when it was found that in mitochondrial myopathy patients the opposite response was observed
(Steensberg et al., 2001b). IL-6 production was measured in exercising patients who had
mitochondrial myopathy and consequently high levels of plasma lactate (Steensberg et al.,
2001b). The patients who exercised and received treatment with dichloroacetate to suppress
their lactic acidosis produced more IL-6 than the patients who did not have treatment
(Steensberg et al., 2001b) which may indicate that lactate or low pH could inhibit IL-6
production. This observation was in part the basis of part (b) of the hypothesis underlying the
present project (Section 1.15).
The principal finding in the present study (that low pH enhances ionomycin–induced IL-6
mRNA expression) seems more consistent with the original observation by Ostrokowski et al
(Ostrowski et al., 1998a). A possible flaw with the study that implied suppression of the IL-6
response by lactate (Steensberg et al., 2001b) was that mitochondrial myopathy, or the
dichloroacetate drug that was used in that study, might have had confounding effect(s) on the
lactate or acidosis dependence of IL-6 expression.
The possible role of lactic acidosis has recently been investigated again, but without such
confounding factors (Hojman et al., 2019). This again showed a tight positive correlation
between the circulating concentration of the IL-6 protein and the serum concentration of
lactate; following interval-based cycling exercise in healthy men. Such a correlation was also
shown in electrically stimulated human myotubes, and in non-exercising mice in which lactic
acid was directly injected into their muscles (Hojman et al., 2019). However, unlike the effect
of low pH described in this thesis, the lactic acid effect was attributed to a post-translational
mechanism in which proteolysis caused by activation of matrix metalloproteases 2 and 9
stimulated release of a vesicular pool of IL-6 protein stored within myocytes. It is interesting
to note however that, in the same study (Hojman et al., 2019), injecting lactic acid into the
skeletal muscle of non-exercising mice in vivo led to a 5.4-fold increase in IL-6 mRNA –
apparently resembling the response to low pH in Chapter 5 of this thesis. A role for acidosis

108
was also implied in the Hojman et al study by the observation that the IL-6 myokine response
to exercise in mice was abolished by pre-treating the animals with bicarbonate (- although that
part of the study did not reach statistical significance (Hojman et al., 2019)).
It therefore seems both from (Hojman et al., 2019) and from the data in Chapter 5, that low pH
may enhance the IL-6 response to exercise, and the data in the present study are the first direct
demonstration of this effect in vitro without the presence of lactate, suggesting that this is a
direct effect of pH rather than lactic acid itself. However, in neither study was it possible to
identify the pH sensing mechanism, and no convincing evidence was found in this thesis that
the rise in IL-6 mRNA expression at low pH was linked to the pH sensitive System A / SNAT2
transporter. A possible missing factor, which was not considered in either study, is extracellular
ATP which is released from stimulated skeletal muscle cells through pannexin-1 hemichannels
and has been suggested as a mediator of the increase in IL-6 expression in electrically
stimulated myotubes (Bustamante et al., 2014). Such hemichannels are reported to be pH
sensitive but, as low pH closes rather than opens such channels (Trexler et al., 1999), it is
unlikely that this explains the enhancement of IL-6 expression by low pH.
It was also observed in the present study that stretching L6-G8C5 myotubes for up to 30
minutes led to an increase in IL-6 mRNA (Figure 5.9). A further unsolved question about pH-
sensing in these cells is why does this response to stretch show no significant pH sensitivity?
Surprisingly, stretched L6 myotubes showed a significant increase in the expression of mRNA
of IL-6 in all pH conditions tested, including pH 7.1 (Figure 5.9).
6.1.2 The complex relationships between MAPKs, SNAT2, IL-6 and pH
Part (a) of the hypothesis that was stated in Section 1.15 (and again at the start of Section 6.1
above) suggests that MAP kinases (p38 and JNK) and the System A/SNAT2 amino acid
transporter may be important factors in the expression and biosynthesis of IL-6. Low pH can
inhibit System A / SNAT2 transport activity (Christensen et al., 1965, Evans et al., 2007b) and
inhibition of this transporter can inhibit global protein synthesis through inhibition of mTORC1
(Evans et al., 2008a). It was also demonstrated here that both JNK and p38 were inhibited at
low pH (Figures 3.3 and 3.4). MAPKs especially p38 and JNK were demonstrated to have
some ability to control the activity of System A / SNAT2 transporters (Figure 3.1a). On the
basis of these observations it might be expected that p38, JNK and System A /SNAT2 would
promote IL-6 expression and biosynthesis in L6-G8C5 myotubes, and this pathway was
hypothesised to be blunted in the acidic condition at pH 7.1. It is therefore interesting that, in

109
spite of the properties of p38, JNK and SNAT2 that were clearly demonstrated above, low pH
in vitro (Chapter 5) and lactic acidosis in vivo (Hojman et al., 2019) significantly promoted
(rather than suppressed) the expression and secretion of IL-6.
6.1.3 The physiological significance of System A/SNAT2 during exercise
Chapter 4 of this study investigated whether mechanical loading can increase System A /
SNAT2 transporter activity. Even though stretching of L6-G8C5 myotubes led to a clear
increase in the phospho-activition of p38 and JNK, stretching for up to 17 or even 48 hours did
not lead to reproducible activation of System A / SNAT2, although a possible increase of
SNAT2 activity was transiently observed as a result of short periods of stretching (1 minute)
(Figure 4.4B). This contrasts with the ex vivo experiments on muscle obtained from exercising
rats (King, 1994, Henriksen et al., 1992, Henriksen et al., 1993) which showed that System A
can be activated and that this effect persists in the isolated muscle. Possible technical reasons
for this discrepancy between stretched L6-G8C5 myotubes and ex vivo muscle preparations
were discussed at the end of Chapter 4. This may merit further investigation because
understanding up-regulation of an important amino acid transporter during exercise may be of
value in promoting the effect of nutrient supplementation in parallel with exercise (Nelson et
al., 2019). The factors controlling success or failure of such feeding are poorly understood
(Nelson et al., 2019), but success could potentially increase muscle protein mass and
biosynthesis of IL-6.
6.1.4 The role of ionomycin in IL-6 expression in vitro
The original in vitro modelling of the effect of ionomycin on IL-6 gene expression in L6
myotubes (Chan et al., 2004b) was made on the assumption that cytosolic Ca2+ was a key
regulator of IL-6 expression (Febbraio and Pedersen, 2002). However, cytosolic Ca2+ was not
measured directly in that study. Measurement of this parameter in the present study using the
fluorescent Ca2+ indicator Fluo-4 suggested that the pH dependence of expression of IL-6
mRNA under pH 7.1 to pH 7.7 conditions could not be explained by variation in this Ca2+ pool
(Figure 5.6). This pool showed clear changes in response to the high dose of ionomycin that
was used to calibrate the assay (Figure 5.6). However, the cytosolic Ca2+ pool detected in this
way did not show any significant changes in response to the lower dose of ionomycin that
clearly gave a p38 dependent activation of IL-6 mRNA expression (Figures 5.1 and 5.6). The
reason for this is unknown, but possibly arises because ionomycin is acting through some other
(non-cytosolic) Ca2+ pool, for example in the nucleus where p38 is thought to be acting (Chan

110
et al., 2004b). Alternatively, the effect of ionomycin could be off-target and might be altering
some parameter(s) other than the size of Ca2+ pools. For example it has been suggested that
ionomycin may also be able to induce intracellular alkalinisation (Anwer, 1993), although there
is no evidence at present that such a rise in pH could promote p38-dependent IL-6 expression.
6.2 Future work
In view of the questions raised above, it would be of interest to perform the following future
work to extend the findings in this thesis:
To extend the work from Chapter 3, other ways of inhibiting MAPKs would be of interest,
for example:
Using alternative small molecule inhibitors, such as the p38 inhibitor used in
the original study reported in (Chan et al., 2004b).
Transfecting with cDNA constructs encoding mutant “dominant negative”
MAP kinases (as described for example for p38 inhibition (López-Fontanals et
al., 2003)).
Silencing of MAPKs by transfection with siRNAs.
A problem with the latter two transfection-based approaches is that they require transfection of
L6 myotubes, which is difficult to achieve. An alternative approach would be to perform stable
transfection of myoblasts with short-hairpin (sh) RNAs which would give stable MAPK
silencing in myoblasts which could then be fused to form myotubes. However, this could be
problematic because long-term silencing of these functionally important MAP kinases could in
principle impair cell proliferation, survival or differentiation.
In Chapter 4, it was observed that a possible transient stimulation of System A activity was
observed after only 1 minute of cyclic stretch. However, it was also observed that basal System
A transport activity was strongly dependent on the time elapsed since the addition of fresh
culture medium (Figure 4.8). In future investigations of this apparent transient effect of stretch,
careful timing of the incubations would therefore be needed to eliminate such artifactual basal
effects. (Alternatively changing of the medium about an hour before attempting stretching
might yield a more stable baseline). It would then also be of interest to search for transient
stretch effects in related experimental systems. For example:
In cyclically stretched mouse C2C12 or human myotubes.

111
In cyclically stretched bundles of isolated mouse skeletal muscle fibres (Wendowski et
al., 2017).
In passively stretched muscles (e.g. EDL (Chambers et al., 2009b)).
In electrically stimulated skeletal muscle or myotubes (Yano et al., 2011, Hojman et
al., 2019).
To test the idea (from the discussion section of Chapter 4) that a key protein phosphorylation
signal (e.g. from MAPKs – Chapter 3) or from FAK (Chapter 5) is being turned off by a
phosphoprotein phosphatase during stretch, the effect of pharmacological inhibition of
phosphoprotein phosphatases (Abbasian et al., 2015) or loading of myotubes with the
physiological inhibitor Pi (Abbasian et al., 2015) could be tested. Loading of the culture
medium with physiologically attainable Pi concentrations may be sufficient to give
functionally important effects, because effects on global protein metabolism have been
observed in these cells in such Pi-loaded medium (Zhang et al., 2018).
In Chapter 5, SNAT2 silencing in L6-G8C5 cells seemed capable of inhibiting the expression
of IL-6 mRNA (Figure 5.8) and this may indicate the potential influence of this transporter on
IL-6. It was observed that siRNA silencing of SNAT2 inhibited IL-6 mRNA expression,
whereas competitive inhibition of all System A transport with MeAIB gave a more complex
result: no effect was observed at control pH (Figure 5.4) but a borderline significant inhibition
was seen at low pH (Figure 5.5). Therefore, to extend the work of Chapter 5, other ways of
manipulating SNAT2 expression or activity could be tested. For example:
Testing of alternative scrambled siRNA sequences as controls for non-specific effects
of siRNA transfection on IL-6 expression
Stable transfection of myoblasts with short-hairpin (sh) RNAs to give stable SNAT2
silencing followed by fusion to form myotubes.
Transfection with SNAT2 cDNA constructs (Blbas, 2018) to determine the effect of
over-expression of functionally active SNAT2 transporters on IL-6 expression.
Transfection with SNAT2 cDNA constructs following site-directed mutagenesis (Chen
et al., 2016, Zhang and Grewer, 2007, Zhang et al., 2008) to determine the effect on IL-
6 expression of mutated SNAT2 e.g. SNAT2 mutated to suppress its ability to transport
amino acids (Zhang et al., 2008). Such mutation would be of interest to determine
whether the apparent effect of siRNA silencing in (Figure 5.8) arises from a transport

112
effect of SNAT2 or a transport-independent “transceptor” signalling (Hyde et al., 2007)
effect of the SNAT2 protein.
As no significant effects on IL-6 protein expression or secretion were detected in Chapter 5,
the work could also be extended by increasing the duration of the experiments to determine
whether effects reflecting those on mRNA could also be obtained for IL-6 protein at later time
points. This seems feasible because effects of ROS and NF-kappa-B signalling have been
reported on IL-6 protein release from C2C12 myotubes in 24h incubations (Kosmidou et al.,
2002). It would also be of interest to extend the measurements to other inflammatory (TNF-
alpha) or anti-inflammatory (IL-10) cytokines.
Finally, as it was observed in Chapter 5 that the acid-induced increment in IL-6 mRNA
expression was sensitive to inhibition by JNK, it would be of interest in future exercise studies
in experimental animals, or in human muscle biopsies from exercising volunteers or acidotic
CKD patients, to test for the predicted JNK-dependent stimulation of IL-6 expression by
acidosis. It would be predicted that IL-6 expression (both at mRNA level and at protein level)
and phospho-activation of JNK and c-Jun would be strongly observed following exercise, but
suppressed in individuals who had received oral bicarbonate supplementation as in (Watson et
al., 2013a).
6.2 Conclusion
Exercise-induced IL-6 production is regarded as physiologically important as an anti-
inflammatory stimulus (Petersen and Pedersen, 2005a), as a measure to promote muscle
growth and suppress cachexia (Munoz-Canoves et al., 2013) and, from recent systems biology
analysis (Morettini et al., 2017), as a regulator of glucose homeostasis and insulin sensitivity
via the action of IL-6 on Glucagon-like Peptide-1 (GLP-1) (Morettini et al., 2017). The key
observation from this thesis of direct pH dependence of ionomycin-induced IL-6 mRNA
expression in L6-G8C6 myotubes seems likely to be of physiological value in optimising the
effect of exercise on IL-6 release – strongly supported by recent studies on the effect of lactic
acid on IL-6 expression and secretion in vitro and in vivo (Hojman et al., 2019).

113
Appendixes
Appendix A: Culture medium and Test medium
A.1 DMEM (Invitrogen 11880-028)
Components Molecular Weight
Concentration (mg/L)
mM
Amino Acids
Glycine 75.0 30.0 0.4
L-Arginine hydrochloride 211.0 84.0 0.39810428
L-Cystine 2HCl 313.0 63.0 0.20127796
L-Histidine hydrochloride-H2O 210.0 42.0 0.2
L-Isoleucine 131.0 105.0 0.8015267
L-Leucine 131.0 105.0 0.8015267
L-Lysine hydrochloride 183.0 146.0 0.7978142
L-Methionine 149.0 30.0 0.20134228
L-Phenylalanine 165.0 66.0 0.4
L-Serine 105.0 42.0 0.4
L-Threonine 119.0 95.0 0.79831934
L-Tryptophan 204.0 16.0 0.078431375
L-Tyrosine 181.0 72.0 0.39779004
L-Valine 117.0 94.0 0.8034188
Vitamins
140.0 4.0 0.028571429
D-Calcium pantothenate 477.0 4.0 0.008385744
Folic Acid 441.0 4.0 0.009070295
Niacinamide 122.0 4.0 0.032786883
Pyridoxine hydrochloride 206.0 4.0 0.019417476
Riboflavin 376.0 0.4 0.0010638298
Thiamine hydrochloride 337.0 4.0 0.011869436
i-Inositol 180.0 7.2 0.04
Inorganic Salts
Calcium Chloride (CaCl2-2H2O) 147.0 264.0 1.7959183
Ferric Nitrate (Fe(NO3)3"9H2O) 404.0 0.1 2.4752476E-4
Magnesium Sulfate (MgSO4-7H2O) 246.0 200.0 0.8130081
Potassium Chloride (KCl) 75.0 400.0 5.3333335
Sodium Bicarbonate (NaHCO3) 84.0 3700.0 44.04762
Sodium Chloride (NaCl) 58.0 6400.0 110.344826
Sodium Phosphate monobasic (NaH2PO4-2H2O)
154.0 141.0 0.91558444
Other Components
D-Glucose (Dextrose) 180.0 1000.0 5.5555553
Sodium Pyruvate 110.0 110.0 1.0
https://www.thermofisher.com/order/catalog/product/11880028?SID=srch-hj-11880-028#/11880028?SID=srch-hj-11880-028

114
A.2 MEM (Invitrogen 21090-022)
Components Molecular
Weight
Concentration
(mg/L)
mM
Amino Acids
L-Arginine hydrochloride 211.0 126.0 0.5971564
L-Cystine 240.0 24.0 0.1
L-Histidine hydrochloride-H2O 210.0 42.0 0.2
L-Isoleucine 131.0 52.0 0.39694658
L-Leucine 131.0 52.0 0.39694658
L-Lysine hydrochloride 183.0 73.0 0.3989071
L-Methionine 149.0 15.0 0.10067114
L-Phenylalanine 165.0 32.0 0.19393939
L-Threonine 119.0 48.0 0.40336135
L-Tryptophan 204.0 10.0 0.04901961
L-Tyrosine 181.0 36.0 0.19889502
L-Valine 117.0 46.0 0.3931624
Vitamins
Choline chloride 140.0 1.0 0.007142857
D-Calcium pantothenate 477.0 1.0 0.002096436
Folic Acid 441.0 1.0 0.0022675737
Niacinamide 122.0 1.0 0.008196721
Pyridoxal hydrochloride 204.0 1.0 0.004901961
Riboflavin 376.0 0.1 2.6595744E-4
Thiamine hydrochloride 337.0 1.0 0.002967359
i-Inositol 180.0 2.0 0.011111111
Inorganic Salts
Calcium Chloride (CaCl2-2H2O) 147.0 264.0 1.7959183
Magnesium Sulfate (MgSO4-7H2O) 246.0 200.0 0.8130081
Potassium Chloride (KCl) 75.0 400.0 5.3333335
Sodium Bicarbonate (NaHCO3) 84.0 2200.0 26.190475
Sodium Chloride (NaCl) 58.0 6800.0 117.24138
Sodium Phosphate monobasic
(NaH2PO4-2H2O)
156.0 158.0 1.0128205
Other Components
D-Glucose (Dextrose) 180.0 1000.0 5.5555553
Phenol Red 376.4 10.0 0.026567481
https://www.thermofisher.com/uk/en/home/technical-resources/media-formulation.197.html

115
A.3 HBSS (Invitrogen 24020-133/500ml)
Components Molecular
Weight
Concentration
(mg/L)
mM
Inorganic Salts
Calcium Chloride (CaCl2) (anhyd.) 111.0 140.0 1.2612612
Magnesium Chloride (MgCl2-6H2O) 203.0 100.0 0.49261084
Magnesium Sulfate (MgSO4-7H2O) 246.0 100.0 0.40650406
Potassium Chloride (KCl) 75.0 400.0 5.3333335
Potassium Phosphate monobasic
(KH2PO4)
136.0 60.0 0.44117647
Sodium Bicarbonate (NaHCO3) 84.0 350.0 4.1666665
Sodium Chloride (NaCl) 58.0 8000.0 137.93103
Sodium Phosphate dibasic (Na2HPO4)
anhydrous
142.0 48.0 0.33802816
Other Components
D-Glucose (Dextrose) 180.0 1000.0 5.5555553
Phenol Red 376.4 10.0 0.026567481
https://www.thermofisher.com/uk/en/home/technical-resources/media-formulation.152.html
A.4 Hepes Buffered Saline (HBS) (1Litre)
Component
Formula Weight
Weight (g)
Concentration (mM/L)
NaCl 58.44 8.1816 140
Hepes Acid 238.3 4.7660 20
MgSO4.7H2O 246.5 0.6163 2.5
KCl 74.55 0.3728 5.0
CaCl2.2H2O 147.02 0.1470 1.0
Phenol Red ---------- 0.010g 10mg/L
The above components were dissolved in about 750ml of freshly drawn ultra-pure water by
stirring to dissolve with a magnetic stirrer bar. The pH was adjusted to 7.4 at room temperature
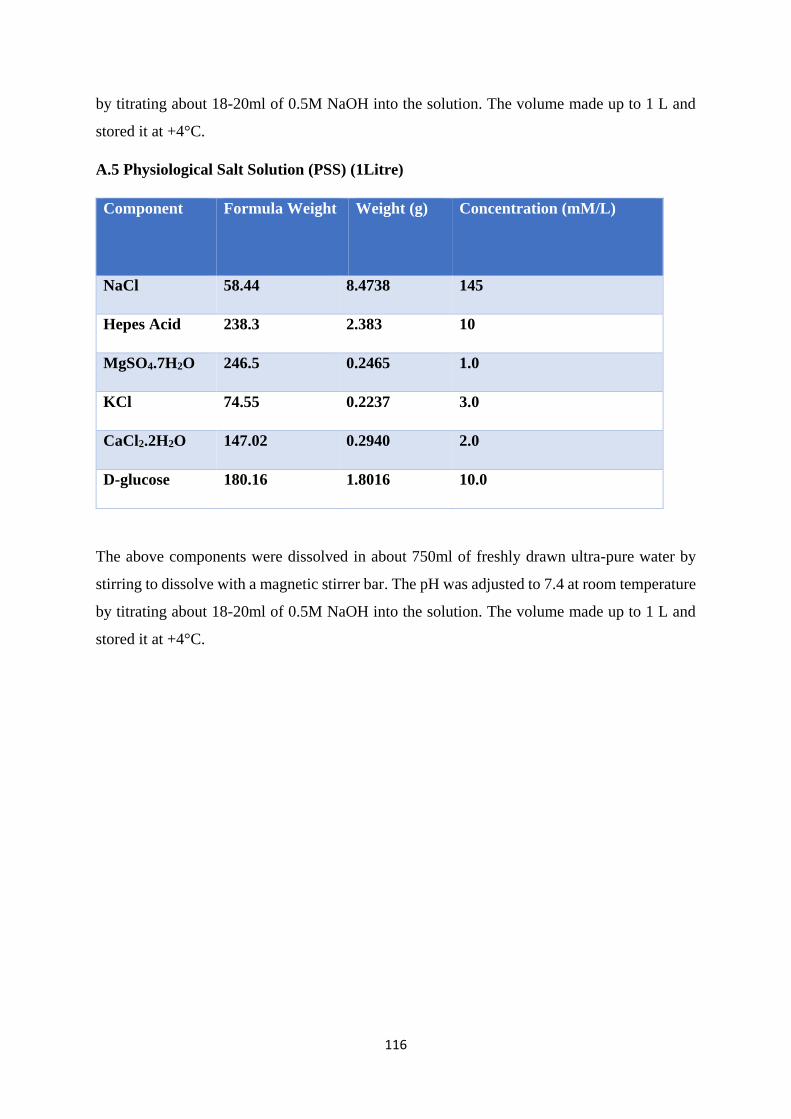
116
by titrating about 18-20ml of 0.5M NaOH into the solution. The volume made up to 1 L and
stored it at +4°C.
A.5 Physiological Salt Solution (PSS) (1Litre)
Component
Formula Weight
Weight (g)
Concentration (mM/L)
NaCl 58.44 8.4738 145
Hepes Acid 238.3 2.383 10
MgSO4.7H2O 246.5 0.2465 1.0
KCl 74.55 0.2237 3.0
CaCl2.2H2O 147.02 0.2940 2.0
D-glucose 180.16 1.8016 10.0
The above components were dissolved in about 750ml of freshly drawn ultra-pure water by
stirring to dissolve with a magnetic stirrer bar. The pH was adjusted to 7.4 at room temperature
by titrating about 18-20ml of 0.5M NaOH into the solution. The volume made up to 1 L and
stored it at +4°C.

117
Appendix B (Buffers and Reagents)
B.1 0.5 M Sodium Hydroxide (NaOH)
To prepare 500 ml of 0.5M NaOH, dissolve 10g of pellets (Sigma S-8045 FW: 40.00) in nearly
250 ml of ultra-pure water then bring up the volume to 500 ml by using volumetric flask and
store in room temperature.
B.2 Lowry (Folin) Reagent A (L)
Dissolve the following composition in 500 ml ultra-pure water:
• 20.00 g Sodium Carbonate “Anhydrous” (Sigma S-2127 FW 106.0)
• 4.00 g Sodium hydroxide (Sigma S-8045 FW: 40.00)
• 0.2 g Potassium Sodium (+)-tartrate.4H2O (BDH AR 10219 FW: 282.22)
Then make up to 1L in a volumetric flask and store in 4°C.
B.3 Lowry (Folin) Reagent B (L)
Dissolve 5g of Cupric Sulphate (BDH AR 10091 FW: 249.68) in 500 ml ultra-pure water and
make up the volume to 1L in a volumetric flask then store 4°C.
B.4 Lowry (Folin) standards
Make up a stock solution (S) first, weigh out 0.05 g of Bovine Serum Albumin (BSA: Sigma
A-7638) and add 20 ml of 0.5M NaOH. Dissolve it with magnetic stirrer then make the
standards as follows:
Final BSA(µg/ml) 0 50 100 150 200 300 400 500
Volume of Stock (S) (µl) 0 50 100 150 200 300 400 500
Volume of 0.5M NaOH
(ml)
2.5 2.45 2.4 2.35 2.3 2.2 2.1 2.0

118
B.5 Immunoblotting buffers
B.5.1 Reducing Lysis buffer
Stock Solutions For 10ml Final concentration
1M pH 7.4 beta
glycerophosphate
100ul 10mM
0.5M pH 8 EDTA 20ul 1mM
40mM EGTA 250ul 1mM
1M pH 7.5 Tris-HCl 500ul 50mM
100mM Na Orthovanadate 100ul 1mM
1M Benzamidine 10ul 1mM
100mM PMSF 20ul 0.2mM
5mg/ml Pepstatin A 10ul
5mg/ml Leupeptin 10ul
Beta-Mercaptoethanol 10ul 0.1%
10% Triton X-100 1ml 1%
500mM Na Fluoride 1ml 50mM
Nano-pure water 6.97ml

119
B.5.2 Sample Buffer
Component Volume (ml)
Water 4.00
0.5m TRIS HCl pH6.8 1.00
Glycerol 0.80
10% (w/v) SDS 1.60
2--mercaptoethanol 0.40
0.05% (w/v) bromophenol blue 0.20
B.5.3 Resolving and Stacking Gel for Immunoblotting (×1 gel)
Stock solutions
12% Resolving gel
10% Resolving gel
12% Stacking gel
Water (Nano-pure) 3.35 ml 3.1 ml 3.03 ml
Acrylamide1 (30
w/v)
4 ml 2.5 ml 0.65 ml
1.5M Tris HCl
(pH:8.8)
2.5 ml 1.875 ---
0.5M Tris
HCl(pH:6.8)
--- --- 1.25 ml
SDS(10% w/v) 100 µl 75 µl 50 µl
APS2 50 µl 37.5 µl 25 µl
TEMED3 5 µl 10 µl 5 µl
1 Acrylamide: Sigma A3699-100ml
2 APS: Ammonium persulphate
3 N,N,N’,N’- Tetramethylene diamine (Sigma T9281-25ml)

120
B.5.4 Immunoblotting Transfer buffer (1litre)
3.03g Tris-base
14.4g Glycine
200ml Methanol
B.5.5 SDS-PAGE Running buffer (1litre)
3.03g Tris-base
14.4g glycine
50ml 20% w/v SDS
B.5.6 Tris-buffered saline 10 X (TBS) (1 litre)
6.055g Trizma Base
8.766g NaCl
Adjust to pH 7.6 with HCl
B.5.7 TBS-Tween 1 X (1 litre)
100ml 10X TBS
900ml De-ionised H2O
1ml Tween 20

121
Appendix C
C.1. Artifactual effect of 5 minutes of vacuum-induced cyclic stretch on System A
(SNAT2) transporter activity accompanied by cell detachment in L6-G8C5 myotubes.
L6-G8C5 myotubes cultured on collagen-coated Flexcell silicone-based culture wells were subjected to cyclic stretching using a Flexcell FX-4000 system as described in Section 2.4 (Goto et al., 2003) and stretched for 5 minutes. The medium used was MEM at pH 7.4 and contained 2mM L-Gln with 2% dialysed foetal bovine serum. Data compiled from 3 independent experiments are presented, with 4 replicate culture wells in each experiment.

122
Appendix D
D.1. An example of how RNA concentration was quantified
RNA extraction calculations
No. Sample Name
OD 1 (ng/µl)
OD 2 (ng/µl)
Mean 260/280 260/280 Mean
1 1.0 1432.9 1421.8 1427.4 2.0 2.0 2.0
2 2.0 1854.6 1808.3 1831.5 1.9 1.9 1.9
3 3.0 1352.9 1363.7 1358.3 1.9 1.9 1.9
4 4.0 1422.2 1388.1 1405.2 1.9 1.9 1.9
5 5.0 1315.6 1290.2 1302.9 2.0 1.9 1.9
6 6.0 1156.7 1146.9 1151.8 1.9 1.9 1.9
No. Sample Name
RNA ng/µl
Reading
RNA µg/µl
µl of DEPC
H2O to 1µl of
RNA (to make it
0.5 µg/µl)
amount of water for 5ul RNA
1 1.0 1427.4 1.42735 1.8547 9.2735
2 2.0 1831.5 1.83145 2.6629 13.3145
3 3.0 1358.3 1.3583 1.7166 8.583
4 4.0 1405.2 1.40515 1.8103 9.0515
5 5.0 1302.9 1.3029 1.6058 8.029
6 6.0 1151.8 1.1518 1.3036 6.518

123
References
AAS, V., BAKKE, S. S., FENG, Y. Z., KASE, E. T., JENSEN, J., BAJPEYI, S., THORESEN, G. H. & RUSTAN, A. C. 2013. Are cultured human myotubes far from home? Cell and tissue research, 354, 671-682.
ABBASIAN, N., BURTON, J. O., HERBERT, K. E., TREGUNNA, B.-E., BROWN, J. R., GHADERI-NAJAFABADI, M., BRUNSKILL, N. J., GOODALL, A. H. & BEVINGTON, A. 2015. Hyperphosphatemia, phosphoprotein phosphatases, and microparticle release in vascular endothelial cells. Journal of the American Society of Nephrology, 26, 2152-2162.
ABDUL-GHANI, M. A. & DEFRONZO, R. A. 2010. Pathogenesis of insulin resistance in skeletal muscle. BioMed Research International, 2010.
ABRAMOWITZ, M. K., MELAMED, M. L., BAUER, C., RAFF, A. C. & HOSTETTER, T. H. 2013. Effects of oral sodium bicarbonate in patients with CKD. Clinical Journal of the American Society of Nephrology, CJN. 08340812.
ANNARATONE, L., MARCHIÒ, C., RUSSO, R., CIARDO, L., RONDON-LAGOS, S. M., GOIA, M., SCALZO, M. S., BOLLA, S., CASTELLANO, I. & DI CANTOGNO, L. V. 2013. A collection of primary tissue cultures of tumors from vacuum packed and cooled surgical specimens: a feasibility study. PLoS One, 8, e75193.
ANWER, M. S. 1993. Mechanism of ionomycin‐induced intracellular alkalinization of rat hepatocytes. Hepatology, 18, 433-439.
APPELL, H.-J. 1990. Muscular atrophy following immobilisation. Sports Medicine, 10, 42-58. ARNOLD, D., TAYLOR, D. & RADDA, G. 1985. Investigation of human mitochondrial myopathies by
phosphorus magnetic resonance spectroscopy. Annals of Neurology: Official Journal of the American Neurological Association and the Child Neurology Society, 18, 189-196.
ARONSON, D., VIOLAN, M. A., DUFRESNE, S. D., ZANGEN, D., FIELDING, R. A. & GOODYEAR, L. J. 1997. Exercise stimulates the mitogen-activated protein kinase pathway in human skeletal muscle. Journal of Clinical Investigation, 99, 1251.
ARTHUR, J. M., LAWRENCE, M. S., PAYNE, C. R., RANE, M. J. & MCLEISH, K. R. 2000. The calcium-sensing receptor stimulates JNK in MDCK cells. Biochemical and biophysical research communications, 275, 538-541.
ASTROM, M.-B., FEIGH, M. & PEDERSEN, B. K. 2010. Persistent low-grade inflammation and regular exercise. Front Biosci, 2, 96-105.
ATHERTON, P., SZEWCZYK, N., SELBY, A., RANKIN, D., HILLIER, K., SMITH, K., RENNIE, M. & LOUGHNA, P. 2009a. Cyclic stretch reduces myofibrillar protein synthesis despite increases in FAK and anabolic signalling in L6 cells. The Journal of physiology, 587, 3719-3727.
ATHERTON, P. J., SZEWCZYK, N. J., SELBY, A., RANKIN, D., HILLIER, K., SMITH, K., RENNIE, M. J. & LOUGHNA, P. T. 2009b. Cyclic stretch reduces myofibrillar protein synthesis despite increases in FAK and anabolic signalling in L6 cells. J Physiol, 587, 3719-27.
AYE, I. L., JANSSON, T. & POWELL, T. L. 2015. TNF-alpha stimulates System A amino acid transport in primary human trophoblast cells mediated by p38 MAPK signaling. Physiol Rep, 3.
BAAR, K. & ESSER, K. 1999. Phosphorylation of p70S6kcorrelates with increased skeletal muscle mass following resistance exercise. American Journal of Physiology-Cell Physiology, 276, C120-C127.
BAILEY, J. L., ZHENG, B., HU, Z., PRICE, S. R. & MITCH, W. E. 2006. Chronic kidney disease causes defects in signaling through the insulin receptor substrate/phosphatidylinositol 3-kinase/Akt pathway: implications for muscle atrophy. Journal of the American Society of Nephrology, 17, 1388-1394.
BAIRD, F. E., PINILLA-TENAS, J. J., OGILVIE, W. L., GANAPATHY, V., HUNDAL, H. S. & TAYLOR, P. M. 2006. Evidence for allosteric regulation of pH-sensitive System A (SNAT2) and System N

124
(SNAT5) amino acid transporter activity involving a conserved histidine residue. Biochemical Journal, 397, 369-375.
BALAKRISHNAN, V. S., RAO, M., MENON, V., GORDON, P. L., PILICHOWSKA, M., CASTANEDA, F. & CASTANEDA-SCEPPA, C. 2010. Resistance training increases muscle mitochondrial biogenesis in patients with chronic kidney disease. Clinical Journal of the American Society of Nephrology, 5, 996-1002.
BEAVERS, K. M., BRINKLEY, T. E. & NICKLAS, B. J. 2010. Effect of exercise training on chronic inflammation. Clin Chim Acta, 411, 785-93.
BEVINGTON, A., BROWN, J., BUTLER, H., GOVINDJI, S., SHERIDAN, K. & WALLS, J. 2002. Impaired system A amino acid transport mimics the catabolic effects of acid in L6 cells. European journal of clinical investigation, 32, 590-602.
BEVINGTON, A., BROWN, J., PRATT, A., MESSER, J. & WALLS, J. 1998a. Impaired glycolysis and protein catabolism induced by acid in L6 rat muscle cells. European journal of clinical investigation, 28, 908-917.
BEVINGTON, A., BROWN, J. & WALLS, J. 2001. Leucine suppresses acid‐induced protein wasting in L6 rat muscle cells. European journal of clinical investigation, 31, 497-503.
BEVINGTON, A., POULTER, C., BROWN, J. & WALLS, J. 1998b. Inhibition of protein synthesis by acid in L6 skeletal muscle cells: analogies with the acute starvation response. Mineral and electrolyte metabolism, 24, 261-266.
BLAIR, S. N., CHENG, Y. & HOLDER, J. S. 2001. Is physical activity or physical fitness more important in defining health benefits? Medicine and science in sports and exercise, 33, S379-S399.
BLBAS, S. S. I. 2018. The role of acidosis sensing in the regulation of chronic inflammation by skeletal muscle. PhD thesis, University of Leicester.
BLOCK, G. A., KLASSEN, P. S., LAZARUS, J. M., OFSTHUN, N., LOWRIE, E. G. & CHERTOW, G. M. 2004. Mineral metabolism, mortality, and morbidity in maintenance hemodialysis. Journal of the American Society of Nephrology, 15, 2208-2218.
BODINE, S. C., STITT, T. N., GONZALEZ, M., KLINE, W. O., STOVER, G. L., BAUERLEIN, R., ZLOTCHENKO, E., SCRIMGEOUR, A., LAWRENCE, J. C. & GLASS, D. J. 2001. Akt/mTOR pathway is a crucial regulator of skeletal muscle hypertrophy and can prevent muscle atrophy in vivo. Nature cell biology, 3, 1014.
BOPPART, M. D., ARONSON, D., GIBSON, L., ROUBENOFF, R., ABAD, L. W., BEAN, J., GOODYEAR, L. J. & FIELDING, R. A. 1999. Eccentric exercise markedly increases c-Jun NH2-terminal kinase activity in human skeletal muscle. Journal of applied physiology, 87, 1668-1673.
BOPPART, M. D., HIRSHMAN, M. F., SAKAMOTO, K., FIELDING, R. A. & GOODYEAR, L. J. 2001. Static stretch increases c-Jun NH2-terminal kinase activity and p38 phosphorylation in rat skeletal muscle. American Journal of Physiology-Cell Physiology, 280, C352-C358.
BOULÉ, N. G., HADDAD, E., KENNY, G. P., WELLS, G. A. & SIGAL, R. J. 2001. Effects of exercise on glycemic control and body mass in type 2 diabetes mellitus: a meta-analysis of controlled clinical trials. Jama, 286, 1218-1227.
BRNJIC, S., OLOFSSON, M. H., HAVELKA, A. M. & LINDER, S. 2010. Chemical biology suggests a role for calcium signaling in mediating sustained JNK activation during apoptosis. Molecular BioSystems, 6, 767-774.
BROER, S. 2014. The SLC38 family of sodium-amino acid co-transporters. Pflugers Arch, 466, 155-72. BURNS, C. P. & ROZENGURT, E. 1983. Serum, platelet-derived growth factor, vasopressin and
phorbol esters increase intracellular pH in Swiss 3T3 cells. Biochemical and biophysical research communications, 116, 931-938.
BUSTAMANTE, M., FERNÁNDEZ-VERDEJO, R., JAIMOVICH, E. & BUVINIC, S. 2014. Electrical stimulation induces IL-6 in skeletal muscle through extracellular ATP by activating Ca2+ signals and an IL-6 autocrine loop. American Journal of Physiology-Endocrinology and Metabolism, 306, E869-E882.
CAIRNS, S. P. 2006. Lactic acid and exercise performance. Sports medicine, 36, 279-291.

125
CAREY, A. L., STEINBERG, G. R., MACAULAY, S. L., THOMAS, W. G., HOLMES, A. G., RAMM, G., PRELOVSEK, O., HOHNEN-BEHRENS, C., WATT, M. J., JAMES, D. E., KEMP, B. E., PEDERSEN, B. K. & FEBBRAIO, M. A. 2006. Interleukin-6 increases insulin-stimulated glucose disposal in humans and glucose uptake and fatty acid oxidation in vitro via AMP-activated protein kinase. Diabetes, 55, 2688-97.
CARGNELLO, M. & ROUX, P. P. 2011a. Activation and function of the MAPKs and their substrates, the MAPK-activated protein kinases. Microbiol Mol Biol Rev, 75, 50-83.
CARGNELLO, M. & ROUX, P. P. 2011b. Activation and function of the MAPKs and their substrates, the MAPK-activated protein kinases. Microbiol. Mol. Biol. Rev., 75, 50-83.
CARRERO, J. J., STENVINKEL, P., CUPPARI, L., IKIZLER, T. A., KALANTAR-ZADEH, K., KAYSEN, G., MITCH, W. E., PRICE, S. R., WANNER, C. & WANG, A. Y. 2013. Etiology of the protein-energy wasting syndrome in chronic kidney disease: a consensus statement from the International Society of Renal Nutrition and Metabolism (ISRNM). Journal of Renal Nutrition, 23, 77-90.
CASTANEDA, C., GORDON, P. L., PARKER, R. C., UHLIN, K. L., ROUBENOFF, R. & LEVEY, A. S. 2004. Resistance training to reduce the malnutrition-inflammation complex syndrome of chronic kidney disease. American Journal of Kidney Diseases, 43, 607-616.
CHAILLOU, T., LEE, J. D., ENGLAND, J. H., ESSER, K. A. & MCCARTHY, J. J. 2013. Time course of gene expression during mouse skeletal muscle hypertrophy. Journal of applied physiology, 115, 1065-1074.
CHAMBERS, M. A., MOYLAN, J. S., SMITH, J. D., GOODYEAR, L. J. & REID, M. B. 2009a. Stretch-stimulated glucose uptake in skeletal muscle is mediated by reactive oxygen species and p38 MAP-kinase. J Physiol, 587, 3363-73.
CHAMBERS, M. A., MOYLAN, J. S., SMITH, J. D., GOODYEAR, L. J. & REID, M. B. 2009b. Stretch‐stimulated glucose uptake in skeletal muscle is mediated by reactive oxygen species and p38 MAP‐kinase. The Journal of physiology, 587, 3363-3373.
CHAN, M. H., MCGEE, S. L., WATT, M. J., HARGREAVES, M. & FEBBRAIO, M. A. 2004a. Altering dietary nutrient intake that reduces glycogen content leads to phosphorylation of nuclear p38 MAP kinase in human skeletal muscle: association with IL-6 gene transcription during contraction. Faseb J, 18, 1785-7.
CHAN, M. S., MCGEE, S. L., WATT, M. J., HARGREAVES, M. & FEBBRAIO, M. A. 2004b. Altering dietary nutrient intake that reduces glycogen content leads to phosphorylation of nuclear p38 MAP kinase in human skeletal muscle: association with IL-6 gene transcription during contraction. The FASEB journal, 18, 1785-1787.
CHANG, L. & KARIN, M. 2001. Mammalian MAP kinase signalling cascades. Nature, 410, 37-40. CHEEMA, U., YANG, S. Y., MUDERA, V., GOLDSPINK, G. & BROWN, R. 2003. 3‐D in vitro model of early
skeletal muscle development. Cell motility and the cytoskeleton, 54, 226-236. CHEN, C., WANG, J., CAI, R., YUAN, Y., GUO, Z., GREWER, C. & ZHANG, Z. 2016. Identification of a
Disulfide Bridge in Sodium-Coupled Neutral Amino Acid Transporter 2 (SNAT2) by Chemical Modification. PloS one, 11, e0158319.
CHENG, Z., PANG, T., GU, M., GAO, A.-H., XIE, C.-M., LI, J.-Y., NAN, F.-J. & LI, J. 2006. Berberine-stimulated glucose uptake in L6 myotubes involves both AMPK and p38 MAPK. Biochimica et Biophysica Acta (BBA)-General Subjects, 1760, 1682-1689.
CHEUNG, W. W., PAIK, K. H. & MAK, R. H. 2010. Inflammation and cachexia in chronic kidney disease. Pediatric nephrology, 25, 711-724.
CHIEN, H.-C., ZUR, A. A., MAURER, T. S., YEE, S. W., TOLSMA, J., JASPER, P., SCOTT, D. O. & GIACOMINI, K. M. 2016. Rapid Method To Determine Intracellular Drug Concentrations in Cellular Uptake Assays: Application to Metformin in Organic Cation Transporter 1–Transfected Human Embryonic Kidney 293 Cells. Drug Metabolism and Disposition, 44, 356-364.
CHIU, Y.-W., KOPPLE, J. D. & MEHROTRA, R. Correction of metabolic acidosis to ameliorate wasting in chronic kidney disease: goals and strategies. Seminars in nephrology, 2009. Elsevier, 67-74.

126
CHOI, C. H., WEBB, B. A., CHIMENTI, M. S., JACOBSON, M. P. & BARBER, D. L. 2013. pH sensing by FAK-His58 regulates focal adhesion remodeling. J Cell Biol, 202, 849-59.
CHOMCZYNSKI, P. & SACCHI, N. 1987. Single-step method of RNA isolation by acid guanidinium thiocyanate-phenol-chloroform extraction. Analytical biochemistry, 162, 156-159.
CHRISTENSEN, H. N., OXENDER, D. L., LIANG, M. & VATZ, K. A. 1965. The use of N-methylation to direct the route of mediated transport of amino acids. Journal of Biological Chemistry, 240, 3609-3616.
CLAPP, E. L. 2010. The effect of therapeutic exercise and metabolic acidosis on skeletal muscle metabolism in chronic kidney disease. PhD thesis, Loughborough University.
CROSSLAND, H., KAZI, A. A., LANG, C. H., TIMMONS, J. A., PIERRE, P., WILKINSON, D. J., SMITH, K., SZEWCZYK, N. J. & ATHERTON, P. J. 2013. Focal adhesion kinase is required for IGF-I-mediated growth of skeletal muscle cells via a TSC2/mTOR/S6K1-associated pathway. American Journal of Physiology-Endocrinology and Metabolism, 305, E183-E193.
CUENDA, A. & COHEN, P. 1999. Stress-activated protein kinase-2/p38 and a rapamycin-sensitive pathway are required for C2C12 myogenesis. Journal of Biological Chemistry, 274, 4341-4346.
CUENDA, A. & ROUSSEAU, S. 2007. p38 MAP-kinases pathway regulation, function and role in human diseases. Biochim Biophys Acta, 1773, 1358-75.
DANDONA, P., ALJADA, A. & BANDYOPADHYAY, A. 2004. Inflammation: the link between insulin resistance, obesity and diabetes. Trends in immunology, 25, 4-7.
DE-GRAFT AIKINS, A. 2007. Ghana's neglected chronic disease epidemic: a developmental challenge. Ghana Med J, 41, 154-9.
DEGER, S. M., HUNG, A. M., GAMBOA, J. L., SIEW, E. D., ELLIS, C. D., BOOKER, C., SHA, F., LI, H., BIAN, A. & STEWART, T. G. 2017. Systemic inflammation is associated with exaggerated skeletal muscle protein catabolism in maintenance hemodialysis patients. JCI insight, 2.
DESCAMPS-LATSCHA, B., ATRICE, E., JUNGERS, P., WITKO-SARSAT, V. & RONIQUE, E. 2002. Immune system dysregulation in uremia: role of oxidative stress. Blood purification, 20, 481-484.
DHANASEKARAN, D. N. & REDDY, E. P. 2017. JNK-signaling: a multiplexing hub in programmed cell death. Genes & cancer, 8, 682.
DI MEO, S., NAPOLITANO, G. & VENDITTI, P. 2019. Mediators of Physical Activity Protection against ROS-Linked Skeletal Muscle Damage. International journal of molecular sciences, 20, 3024.
DREYER, H. C., FUJITA, S., CADENAS, J. G., CHINKES, D. L., VOLPI, E. & RASMUSSEN, B. B. 2006. Resistance exercise increases AMPK activity and reduces 4E‐BP1 phosphorylation and protein synthesis in human skeletal muscle. The Journal of physiology, 576, 613-624.
DREYER, H. C., FUJITA, S., GLYNN, E. L., DRUMMOND, M. J., VOLPI, E. & RASMUSSEN, B. B. 2010. Resistance exercise increases leg muscle protein synthesis and mTOR signalling independent of sex. Acta Physiol (Oxf), 199, 71-81.
DRUMMOND, M. J., FRY, C. S., GLYNN, E. L., DREYER, H. C., DHANANI, S., TIMMERMAN, K. L., VOLPI, E. & RASMUSSEN, B. B. 2009. Rapamycin administration in humans blocks the contraction-induced increase in skeletal muscle protein synthesis. J Physiol, 587, 1535-46.
DUPONT, S., MORSUT, L., ARAGONA, M., ENZO, E., GIULITTI, S., CORDENONSI, M., ZANCONATO, F., LE DIGABEL, J., FORCATO, M. & BICCIATO, S. 2011. Role of YAP/TAZ in mechanotransduction. Nature, 474, 179.
ELSNER, P., QUISTORFF, B., HERMANN, T. S., DICH, J. & GRUNNET, N. 1998. Regulation of glycogen accumulation in L6 myotubes cultured under optimized differentiation conditions. American Journal of Physiology-Endocrinology and Metabolism, 275, E925-E933.
EVANS, K., NASIM, Z., BROWN, J., BUTLER, H., KAUSER, S., VAROQUI, H., ERICKSON, J. D., HERBERT, T. P. & BEVINGTON, A. 2007a. Acidosis-sensing glutamine pump SNAT2 determines amino acid levels and mammalian target of rapamycin signalling to protein synthesis in L6 muscle cells. J Am Soc Nephrol, 18, 1426-36.

127
EVANS, K., NASIM, Z., BROWN, J., BUTLER, H., KAUSER, S., VAROQUI, H., ERICKSON, J. D., HERBERT, T. P. & BEVINGTON, A. 2007b. Acidosis-sensing glutamine pump SNAT2 determines amino acid levels and mammalian target of rapamycin signalling to protein synthesis in L6 muscle cells. Journal of the American Society of Nephrology, 18, 1426-1436.
EVANS, K., NASIM, Z., BROWN, J., CLAPP, E., AMIN, A., YANG, B., HERBERT, T. P. & BEVINGTON, A. 2008a. Inhibition of SNAT2 by metabolic acidosis enhances proteolysis in skeletal muscle. J Am Soc Nephrol, 19, 2119-29.
EVANS, K., NASIM, Z., BROWN, J., CLAPP, E., AMIN, A., YANG, B., HERBERT, T. P. & BEVINGTON, A. 2008b. Inhibition of SNAT2 by metabolic acidosis enhances proteolysis in skeletal muscle. Journal of the American Society of Nephrology, 19, 2119-2129.
EVANS, K. F. 2009. The effects of acidosis, glutamine starvation and inhibition of the pH sensitive SNAT 2 amino acid transporter on protein metabolism in L6 muscle cells. PhD thesis, University of Leicester.
FANTUZZI, G. 2005. Adipose tissue, adipokines, and inflammation. J Allergy Clin Immunol, 115, 911-9; quiz 920.
FARUP, J., DE PAOLI, F., BJERG, K., RIIS, S., RINGGARD, S. & VISSING, K. 2015. Blood flow restricted and traditional resistance training performed to fatigue produce equal muscle hypertrophy. Scandinavian journal of medicine & science in sports, 25, 754-763.
FEBBRAIO, M. A. & PEDERSEN, B. K. 2002. Muscle-derived interleukin-6: mechanisms for activation and possible biological roles. The FASEB Journal, 16, 1335-1347.
FIUZA-LUCES, C., SANTOS-LOZANO, A., JOYNER, M., CARRERA-BASTOS, P., PICAZO, O., ZUGAZA, J. L., IZQUIERDO, M., RUILOPE, L. M. & LUCIA, A. 2018. Exercise benefits in cardiovascular disease: beyond attenuation of traditional risk factors. Nature Reviews Cardiology, 15, 731-743.
FLETCHER, G. F., LANDOLFO, C., NIEBAUER, J., OZEMEK, C., ARENA, R. & LAVIE, C. J. 2018. Promoting physical activity and exercise: JACC health promotion series. Journal of the American College of Cardiology, 72, 1622-1639.
FRANCHI-GAZZOLA, R., DALL'ASTA, V., SALA, R., VISIGALLI, R., BEVILACQUA, E., GACCIOLI, F., GAZZOLA, G. C. & BUSSOLATI, O. 2006. The role of the neutral amino acid transporter SNAT2 in cell volume regulation. Acta Physiol (Oxf), 187, 273-83.
FRANCHI‐GAZZOLA, R., DALL'ASTA, V., SALA, R., VISIGALLI, R., BEVILACQUA, E., GACCIOLI, F., GAZZOLA, G. & BUSSOLATI, O. 2006. The role of the neutral amino acid transporter SNAT2 in cell volume regulation. Acta physiologica, 187, 273-283.
FRANCHI, M., RUOSS, S., VALDIVIESO, P., MITCHELL, K., SMITH, K., ATHERTON, P., NARICI, M. & FLÜCK, M. 2018. Regional regulation of focal adhesion kinase after concentric and eccentric loading is related to remodelling of human skeletal muscle. Acta Physiologica, 223, e13056.
FU, S., YIN, L., LIN, X., LU, J. & WANG, X. 2018. Effects of Cyclic Mechanical Stretch on the Proliferation of L6 Myoblasts and Its Mechanisms: PI3K/Akt and MAPK Signal Pathways Regulated by IGF-1 Receptor. Int J Mol Sci, 19.
GABRIEL, B. M., HAMILTON, D. L., TREMBLAY, A. M. & WACKERHAGE, H. 2016. The Hippo signal transduction network for exercise physiologists. Journal of Applied Physiology, 120, 1105-1117.
GINGRAS, A.-C., RAUGHT, B. & SONENBERG, N. 1999. eIF4 initiation factors: effectors of mRNA recruitment to ribosomes and regulators of translation. Annual review of biochemistry, 68, 913-963.
GLOVER, E. I., OATES, B. R., TANG, J. E., MOORE, D. R., TARNOPOLSKY, M. A. & PHILLIPS, S. M. 2008. Resistance exercise decreases eIF2Bε phosphorylation and potentiates the feeding-induced stimulation of p70S6K1 and rpS6 in young men. American Journal of Physiology-Regulatory, Integrative and Comparative Physiology, 295, R604-R610.
GOLDBERG, A. L., ETLINGER, J. D., GOLDSPINK, D. F. & JABLECKI, C. 1975. Mechanism of work-induced hypertrophy of skeletal muscle. Medicine and science in sports, 7, 185-198.

128
GOODMAN, C. A., DIETZ, J. M., JACOBS, B. L., MCNALLY, R. M., YOU, J.-S. & HORNBERGER, T. A. 2015. Yes-Associated Protein is up-regulated by mechanical overload and is sufficient to induce skeletal muscle hypertrophy. FEBS letters, 589, 1491-1497.
GOODMAN, C. A., FREY, J. W., MABREY, D. M., JACOBS, B. L., LINCOLN, H. C., YOU, J. S. & HORNBERGER, T. A. 2011. The role of skeletal muscle mTOR in the regulation of mechanical load-induced growth. J Physiol, 589, 5485-501.
GOTO, K., OKUYAMA, R., SUGIYAMA, H., HONDA, M., KOBAYASHI, T., UEHARA, K., AKEMA, T., SUGIURA, T., YAMADA, S. & OHIRA, Y. 2003. Effects of heat stress and mechanical stretch on protein expression in cultured skeletal muscle cells. Pflügers Archiv, 447, 247-253.
GRAHAM, Z. A., GALLAGHER, P. M. & CARDOZO, C. P. 2015. Focal adhesion kinase and its role in skeletal muscle. Journal of muscle research and cell motility, 36, 305-315.
GUO, X., GREENE, K., AKANDA, N., SMITH, A. S., STANCESCU, M., LAMBERT, S., VANDENBURGH, H. & HICKMAN, J. J. 2014. In vitro differentiation of functional human skeletal myotubes in a defined system. Biomaterials science, 2, 131-138.
GUPTA, J., MITRA, N., KANETSKY, P. A., DEVANEY, J., WING, M. R., REILLY, M., SHAH, V. O., BALAKRISHNAN, V. S., GUZMAN, N. J. & GIRNDT, M. 2012. Association between albuminuria, kidney function, and inflammatory biomarker profile in CKD in CRIC. Clinical journal of the American Society of Nephrology, 7, 1938-1946.
HAMEED, M., ORRELL, R., COBBOLD, M., GOLDSPINK, G. & HARRIDGE, S. 2003. Expression of IGF‐I splice variants in young and old human skeletal muscle after high resistance exercise. The Journal of physiology, 547, 247-254.
HANKE, N., KUBIS, H. P., SCHEIBE, R. J., BERTHOLD-LOSLEBEN, M., HUSING, O., MEISSNER, J. D. & GROS, G. 2010. Passive mechanical forces upregulate the fast myosin heavy chain IId/x via integrin and p38 MAP kinase activation in a primary muscle cell culture. Am J Physiol Cell Physiol, 298, C910-20.
HANSEN, C. G., NG, Y. L. D., LAM, W.-L. M., PLOUFFE, S. W. & GUAN, K.-L. 2015. The Hippo pathway effectors YAP and TAZ promote cell growth by modulating amino acid signaling to mTORC1. Cell research, 25, 1299.
HANSSON, G. K., LIBBY, P., SCHÖNBECK, U. & YAN, Z.-Q. 2002. Innate and adaptive immunity in the pathogenesis of atherosclerosis. Circulation research, 91, 281-291.
HATFALUDY, S., SHANSKY, J. & VANDENBURGH, H. H. 1989. Metabolic alterations induced in cultured skeletal muscle by stretch-relaxation activity. American Journal of Physiology-Cell Physiology, 256, C175-C181.
HAUSER, A. B., STINGHEN, A. E., KATO, S., BUCHARLES, S., AITA, C., YUZAWA, Y. & PECOITS-FILHO, R. 2008. Characteristics and causes of immune dysfunction related to uremia and dialysis. Peritoneal Dialysis International, 28, S183-S187.
HEDING, A., ELLING, C. & SCHWARTZ, T. 2002. Novel method for the study of receptor Ca2+ signalling exemplified by the NK1 receptor. Journal of Receptors and Signal Transduction, 22, 241-252.
HENRIKSEN, E. J., LOUTERS, L. L., STUMP, C. S. & TIPTON, C. M. 1992. Effects of prior exercise on the action of insulin-like growth factor I in skeletal muscle. American Journal of Physiology-Endocrinology And Metabolism, 263, E340-E344.
HENRIKSEN, E. J., SCHNEIDER, M. C. & RITTER, L. S. 1993. Regulation of contraction-stimulated system A amino acid uptake in skeletal muscle: role of vicinal sulfhydryls. Metabolism, 42, 440-445.
HIBI, M., LIN, A., SMEAL, T., MINDEN, A. & KARIN, M. 1993. Identification of an oncoprotein-and UV-responsive protein kinase that binds and potentiates the c-Jun activation domain. Genes & development, 7, 2135-2148.
HISCOCK, N., CHAN, M. S., BISUCCI, T., DARBY, I. A. & FEBBRAIO, M. A. 2004. Skeletal myocytes are a source of interleukin-6 mRNA expression and protein release during contraction: evidence of fiber type specificity. The FASEB journal, 18, 992-994.

129
HOJMAN, P., BROLIN, C., NØRGAARD-CHRISTENSEN, N., DETHLEFSEN, C., LAUENBORG, B., OLSEN, C. K., ÅBOM, M. M., KRAG, T., GEHL, J. & PEDERSEN, B. K. 2019. IL-6 release from muscles during exercise is stimulated by lactate-dependent protease activity. American Journal of Physiology-Endocrinology and Metabolism, 316, E940-E947.
HORNBERGER, T., CHU, W., MAK, Y., HSIUNG, J., HUANG, S. & CHIEN, S. 2006a. The role of phospholipase D and phosphatidic acid in the mechanical activation of mTOR signaling in skeletal muscle. Proceedings of the National Academy of Sciences, 103, 4741-4746.
HORNBERGER, T. A. & CHIEN, S. 2006. Mechanical stimuli and nutrients regulate rapamycin-sensitive signaling through distinct mechanisms in skeletal muscle. J Cell Biochem, 97, 1207-16.
HORNBERGER, T. A., STUPPARD, R., CONLEY, K. E., FEDELE, M. J., FIOROTTO, M. L. & ESSER, K. A. 2004. Mechanical stimuli regulate rapamycin-sensitive signalling by a phosphoinositide 3-kinase-, protein kinase B-and growth factor-independent mechanism. Biochemical Journal, 380, 795-804.
HORNBERGER, T. A., SUKHIJA, K. B. & CHIEN, S. 2006b. Regulation of mTOR by mechanically induced signaling events in skeletal muscle. Cell cycle, 5, 1391-1396.
HOTOKEZAKA, H., SAKAI, E., KANAOKA, K., SAITO, K., MATSUO, K.-I., KITAURA, H., YOSHIDA, N. & NAKAYAMA, K. 2002. U0126 and PD98059, specific inhibitors of MEK, accelerate differentiation of RAW264. 7 cells into osteoclast-like cells. Journal of Biological Chemistry, 277, 47366-47372.
HUANG, Y., LI, X., WANG, Y., WANG, H., HUANG, C. & LI, J. 2014. Endoplasmic reticulum stress-induced hepatic stellate cell apoptosis through calcium-mediated JNK/P38 MAPK and Calpain/Caspase-12 pathways. Molecular and cellular biochemistry, 394, 1-12.
HUNDAL, H. S. & TAYLOR, P. M. 2009. Amino acid transceptors: gate keepers of nutrient exchange and regulators of nutrient signaling. Am J Physiol Endocrinol Metab, 296, E603-13.
HYDE, R., CWIKLINSKI, E. L., MACAULAY, K., TAYLOR, P. M. & HUNDAL, H. S. 2007. Distinct sensor pathways in the hierarchical control of SNAT2, a putative amino acid transceptor, by amino acid availability. J Biol Chem, 282, 19788-98.
HYDE, R., PEYROLLIER, K. & HUNDAL, H. S. 2002. Insulin promotes the cell surface recruitment of the SAT2/ATA2 system A amino acid transporter from an endosomal compartment in skeletal muscle cells. Journal of Biological Chemistry, 277, 13628-13634.
ILIC, D., MAO-QIANG, M., CRUMRINE, D., DOLGANOV, G., LAROCQUE, N., XU, P., DEMERJIAN, M., BROWN, B. E., LIM, S.-T. & OSSOVSKAYA, V. 2007. Focal adhesion kinase controls pH-dependent epidermal barrier homeostasis by regulating actin-directed Na+/H+ exchanger 1 plasma membrane localization. The American journal of pathology, 170, 2055-2067.
ISKRATSCH, T., WOLFENSON, H. & SHEETZ, M. P. 2014. Appreciating force and shape—the rise of mechanotransduction in cell biology. Nature Reviews Molecular Cell Biology, 15, 825.
IWATA, M., HAYAKAWA, K., MURAKAMI, T., NARUSE, K., KAWAKAMI, K., INOUE-MIYAZU, M., YUGE, L. & SUZUKI, S. 2007. Uniaxial cyclic stretch-stimulated glucose transport is mediated by a Ca2+-dependent mechanism in cultured skeletal muscle cells. Pathobiology, 74, 159-168.
JAKA, O., CASAS-FRAILE, L., DE MUNAIN, A. L. & SÁENZ, A. 2015. Costamere proteins and their involvement in myopathic processes. Expert reviews in molecular medicine, 17.
JOHANSEN, K. L. & PAINTER, P. 2012. Exercise in individuals with CKD. American Journal of Kidney Diseases, 59, 126-134.
JOHNSON, G. L. & LAPADAT, R. 2002. Mitogen-activated protein kinase pathways mediated by ERK, JNK, and p38 protein kinases. Science, 298, 1911-1912.
JOHNSON, G. L. & NAKAMURA, K. 2007. The c-jun kinase/stress-activated pathway: regulation, function and role in human disease. Biochim Biophys Acta, 1773, 1341-8.
JUFFER, P., BAKKER, A. D., KLEIN-NULEND, J. & JASPERS, R. T. 2014. Mechanical loading by fluid shear stress of myotube glycocalyx stimulates growth factor expression and nitric oxide production. Cell biochemistry and biophysics, 69, 411-419.

130
JUNG, T., SCHAUER, U., HEUSSER, C., NEUMANN, C. & RIEGER, C. 1993. Detection of intracellular cytokines by flow cytometry. Journal of immunological methods, 159, 197-207.
KAHN, B. B., ALQUIER, T., CARLING, D. & HARDIE, D. G. 2005. AMP-activated protein kinase: ancient energy gauge provides clues to modern understanding of metabolism. Cell metabolism, 1, 15-25.
KAMIMURA, D., ISHIHARA, K. & HIRANO, T. 2003. IL-6 signal transduction and its physiological roles: the signal orchestration model. Reviews of physiology, biochemistry and pharmacology. Springer.
KANASTY, R. L., WHITEHEAD, K. A., VEGAS, A. J. & ANDERSON, D. G. 2012. Action and reaction: the biological response to siRNA and its delivery vehicles. Molecular Therapy, 20, 513-524.
KATO, S., CHMIELEWSKI, M., HONDA, H., PECOITS-FILHO, R., MATSUO, S., YUZAWA, Y., TRANAEUS, A., STENVINKEL, P. & LINDHOLM, B. 2008. Aspects of immune dysfunction in end-stage renal disease. Clinical Journal of the American Society of Nephrology, 3, 1526-1533.
KELLEHER, A. R., GORDON, B. S., KIMBALL, S. R. & JEFFERSON, L. S. 2014. Changes in REDD1, REDD2, and atrogene mRNA expression are prevented in skeletal muscle fixed in a stretched position during hindlimb immobilization. Physiological reports, 2, e00246.
KELLER, C., STEENSBERG, A., PILEGAARD, H., OSADA, T., SALTIN, B., PEDERSEN, B. K. & NEUFER, P. D. 2001. Transcriptional activation of the IL-6 gene in human contracting skeletal muscle: influence of muscle glycogen content. The FASEB Journal, 15, 2748-2750.
KELLER, P., PENKOWA, M., KELLER, C., STEENSBERG, A., FISCHER, C. P., GIRALT, M., HIDALGO, J. & PEDERSEN, B. K. 2005. Interleukin-6 receptor expression in contracting human skeletal muscle: regulating role of IL-6. The FASEB Journal, 19, 1181-1183.
KELLY, M., KELLER, C., AVILUCEA, P. R., KELLER, P., LUO, Z., XIANG, X., GIRALT, M., HIDALGO, J., SAHA, A. K. & PEDERSEN, B. K. 2004. AMPK activity is diminished in tissues of IL-6 knockout mice: the effect of exercise. Biochemical and biophysical research communications, 320, 449-454.
KEMP, G. 2007. Muscle cell volume and pH changes due to glycolytic ATP synthesis. The Journal of physiology, 582, 461.
KIM, J. & SHARMA, R. P. 2004. Calcium-mediated activation of c-Jun NH2-terminal kinase (JNK) and apoptosis in response to cadmium in murine macrophages. Toxicological sciences, 81, 518-527.
KING, P. A. 1994. Effects of insulin and exercise on amino acid transport in rat skeletal muscle. American Journal of Physiology-Cell Physiology, 266, C524-C530.
KLETZIEN, R. F., PARIZA, M. W., BECKER, J. E. & POTTER, V. R. 1975. A method using 3-O-methyl-D-glucose and phloretin for the determination of intracellular water space of cells in monolayer culture. Analytical biochemistry, 68, 537-544.
KOOK, S.-H., LEE, H.-J., CHUNG, W.-T., HWANG, I.-H., LEE, S.-A., KIM, B.-S. & LEE, J.-C. 2008. Cyclic mechanical stretch stimulates the proliferation of C2C12 myoblasts and inhibits their differentiation via prolonged activation of p38 MAPK. Molecules and cells, 25, 479-486.
KOSMADAKIS, G. C., JOHN, S. G., CLAPP, E. L., VIANA, J. L., SMITH, A. C., BISHOP, N. C., BEVINGTON, A., OWEN, P. J., MCINTYRE, C. W. & FEEHALLY, J. 2012. Benefits of regular walking exercise in advanced pre-dialysis chronic kidney disease. Nephrol Dial Transplant, 27, 997-1004.
KOSMIDOU, I., VASSILAKOPOULOS, T., XAGORARI, A., ZAKYNTHINOS, S., PAPAPETROPOULOS, A. & ROUSSOS, C. 2002. Production of interleukin-6 by skeletal myotubes: role of reactive oxygen species. American journal of respiratory cell and molecular biology, 26, 587-593.
KUBICA, N., KIMBALL, S. R., JEFFERSON, L. S. & FARRELL, P. A. 2004. Alterations in the expression of mRNAs and proteins that code for species relevant to eIF2B activity after an acute bout of resistance exercise. Journal of applied physiology, 96, 679-687.
KYRIAKIS, J., BRAUTIGAN, D., INGEBRITSEN, T. & AVRUCH, J. 1991. pp54 microtubule-associated protein-2 kinase requires both tyrosine and serine/threonine phosphorylation for activity. Journal of Biological Chemistry, 266, 10043-10046.

131
KYRIAKIS, J. M. & AVRUCH, J. 1990. pp54 microtubule-associated protein 2 kinase. A novel serine/threonine protein kinase regulated by phosphorylation and stimulated by poly-L-lysine. Journal of Biological Chemistry, 265, 17355-17363.
KYRIAKIS, J. M. & AVRUCH, J. 1996. Sounding the alarm: protein kinase cascades activated by stress and inflammation. Journal of Biological Chemistry, 271, 24313-24316.
LACASSE, Y., BROSSEAU, L., MILNE, S., MARTIN, S., WONG, E., GUYATT, G., GOLDSTEIN, R. & WHITE, J. 2001. Pulmonary rehabilitation for chronic obstructive pulmonary disease. The Cochrane Library.
LAEMMLI, U. K. 1970. Cleavage of structural proteins during the assembly of the head of bacteriophage T4. nature, 227, 680.
LANCET, T. 2017. Worldwide trends in body-mass index, underweight, overweight, and obesity from 1975 to 2016: a pooled analysis of 2416 population-based measurement studies in 128.9 million children, adolescents, and adults. Lancet, 390, 2627-2642.
LANG, F. 2007. Mechanisms and significance of cell volume regulation. Journal of the American college of nutrition, 26, 613S-623S.
LIEBERTHAL, W. & LEVINE, J. S. 2009a. The role of the mammalian target of rapamycin (mTOR) in renal disease. J Am Soc Nephrol, 20, 2493-502.
LIEBERTHAL, W. & LEVINE, J. S. 2009b. The role of the mammalian target of rapamycin (mTOR) in renal disease. Journal of the American Society of Nephrology, ASN. 2008111186.
LIU, A., YANG, J., GONZALEZ, F. J., CHENG, G. Q. & DAI, R. 2010. Biphasic regulation of intracellular calcium by gemfibrozil contributes to inhibiting L6 myoblast differentiation: implications for clinical myotoxicity. Chemical research in toxicology, 24, 229-237.
LIU, J., LIU, J., MAO, J., YUAN, X., LIN, Z. & LI, Y. 2009. Caspase‐3‐mediated cyclic stretch‐induced myoblast apoptosis via a Fas/FasL‐independent signaling pathway during myogenesis. Journal of cellular biochemistry, 107, 834-844.
LÓPEZ-FONTANALS, M., RODRÍGUEZ-MULERO, S., CASADO, F. J., DÉRIJARD, B. & PASTOR-ANGLADA, M. 2003. The osmoregulatory and the amino acid-regulated responses of system A are mediated by different signal transduction pathways. The Journal of general physiology, 122, 5-16.
LOW, S. Y. & TAYLOR, P. M. 1998. Integrin and cytoskeletal involvement in signalling cell volume changes to glutamine transport in rat skeletal muscle. The Journal of physiology, 512, 481.
LOWRY, O. H., ROSEBROUGH, N. J., FARR, A. L. & RANDALL, R. J. 1951. Protein measurement with the Folin phenol reagent. J biol Chem, 193, 265-275.
LUO, Y. & ZHENG, S. G. 2016. Hall of fame among pro-inflammatory cytokines: interleukin-6 gene and its transcriptional regulation mechanisms. Frontiers in immunology, 7, 604.
MACKENZIE, B. & ERICKSON, J. D. 2004. Sodium-coupled neutral amino acid (System N/A) transporters of the SLC38 gene family. Pflugers Arch, 447, 784-95.
MACKENZIE, M. G., HAMILTON, D. L., MURRAY, J. T., TAYLOR, P. M. & BAAR, K. 2009. mVps34 is activated following high‐resistance contractions. The Journal of physiology, 587, 253-260.
MAK, R. H. 2008. Insulin and its role in chronic kidney disease. Pediatric Nephrology, 23, 355-362. MALLAT, Z., BESNARD, S., DURIEZ, M., DELEUZE, V., EMMANUEL, F., BUREAU, M. F., SOUBRIER, F.,
ESPOSITO, B., DUEZ, H. & FIEVET, C. 1999. Protective role of interleukin-10 in atherosclerosis. Circulation research, 85, e17-e24.
MARCOTTE, G. R., WEST, D. W. & BAAR, K. 2015. The molecular basis for load-induced skeletal muscle hypertrophy. Calcified tissue international, 96, 196-210.
MAY, L. T., GHRAYEB, J., SANTHANAM, U., TATTER, S., STHOEGER, Z., HELFGOTT, D., CHIORAZZI, N., GRIENINGER, G. & SEHGAL, P. 1988a. Synthesis and secretion of multiple forms of beta 2-interferon/B-cell differentiation factor 2/hepatocyte-stimulating factor by human fibroblasts and monocytes. Journal of Biological Chemistry, 263, 7760-7766.

132
MAY, L. T., SANTHANAM, U., TATTER, S. B., BHARDWAJ, N., GHRAYEB, J. & SEHGAL, P. B. 1988b. Phosphorylation of secreted forms of human β2-interferon/hepatocyte stimulating factor/interleukin-6. Biochemical and biophysical research communications, 152, 1144-1150.
MAY, R., KELLY, R. & MITCH, W. 1987. Mechanisms for defects in muscle protein metabolism in rats with chronic uremia. Influence of metabolic acidosis. Journal of Clinical Investigation, 79, 1099.
MCCORMICK, J. & JOHNSTONE, R. 1995. Identification of the integrin α3 β1 as a component of a partially purified A-system amino acid transporter from Ehrlich cell plasma membranes. Biochemical Journal, 311, 743-751.
MEDICINE, A. C. O. S. 2009. American College of Sports Medicine position stand. Progression models in resistance training for healthy adults. Medicine and science in sports and exercise, 41, 687.
MENG, Z., QIU, Y., LIN, K. C., KUMAR, A., PLACONE, J. K., FANG, C., WANG, K.-C., LU, S., PAN, M. & HONG, A. W. 2018. RAP2 mediates mechanoresponses of the Hippo pathway. Nature, 560, 655.
MERRICK, W. C. 1992. Mechanism and regulation of eukaryotic protein synthesis. Microbiological reviews, 56, 291-315.
MILLER, B. F., OLESEN, J. L., HANSEN, M., DØSSING, S., CRAMERI, R. M., WELLING, R. J., LANGBERG, H., FLYVBJERG, A., KJAER, M. & BABRAJ, J. A. 2005. Coordinated collagen and muscle protein synthesis in human patella tendon and quadriceps muscle after exercise. The Journal of physiology, 567, 1021-1033.
MITCH, W. E. 1998. Robert H Herman Memorial Award in Clinical Nutrition Lecture, 1997. Mechanisms causing loss of lean body mass in kidney disease. The American journal of clinical nutrition, 67, 359-366.
MITCH, W. E., MEDINA, R., GRIEBER, S., MAY, R. C., ENGLAND, B. K., PRICE, S. R., BAILEY, J. L. & GOLDBERG, A. L. 1994. Metabolic acidosis stimulates muscle protein degradation by activating the adenosine triphosphate-dependent pathway involving ubiquitin and proteasomes. Journal of Clinical Investigation, 93, 2127.
MITCHELL, S. F. & LORSCH, J. R. 2008. Should I stay or should I go? Eukaryotic translation initiation factors 1 and 1A control start codon recognition. Journal of Biological Chemistry, 283, 27345-27349.
MORETTINI, M., PALUMBO, M. C., SACCHETTI, M., CASTIGLIONE, F. & MAZZÀ, C. 2017. A system model of the effects of exercise on plasma Interleukin-6 dynamics in healthy individuals: Role of skeletal muscle and adipose tissue. PloS one, 12, e0181224.
MUNOZ-CANOVES, P., SCHEELE, C., PEDERSEN, B. K. & SERRANO, A. L. 2013. Interleukin-6 myokine signaling in skeletal muscle: a double-edged sword? FEBS J, 280, 4131-48.
NAKAYAMA, A., AOI, W., TAKAMI, M., HIRANO, N., OGAYA, Y., WADA, S. & HIGASHI, A. 2019. Effect of downhill walking on next-day muscle damage and glucose metabolism in healthy young subjects. The Journal of Physiological Sciences, 69, 31-38.
NELSON, A., CAMIC, C. L., FOSTER, C., ZAJAC, B., HOECHERL, K., ERICKSON, J. & JAGIM, A. R. 2019. Supplementation with a Multi-ingredient Pre-workout Supplement does not Augment Resistance Training Adaptations in Females. International journal of exercise science, 12, 187.
NICKLIN, P., BERGMAN, P., ZHANG, B., TRIANTAFELLOW, E., WANG, H., NYFELER, B., YANG, H., HILD, M., KUNG, C. & WILSON, C. 2009. Bidirectional transport of amino acids regulates mTOR and autophagy. Cell, 136, 521-534.
NIEMINEN, R., LAHTI, A., JALONEN, U., KANKAANRANTA, H. & MOILANEN, E. 2006. JNK inhibitor SP600125 reduces COX-2 expression by attenuating mRNA in activated murine J774 macrophages. International immunopharmacology, 6, 987-996.
NYATI, K. K., MASUDA, K., ZAMAN, M. M.-U., DUBEY, P. K., MILLRINE, D., CHALISE, J. P., HIGA, M., LI, S., STANDLEY, D. M. & SAITO, K. 2017. TLR4-induced NF-κB and MAPK signaling regulate the IL-6 mRNA stabilizing protein Arid5a. Nucleic acids research, 45, 2687-2703.

133
O’NEIL, T. K., DUFFY, L., FREY, J. & HORNBERGER, T. 2009. The role of phosphoinositide 3‐kinase and phosphatidic acid in the regulation of mammalian target of rapamycin following eccentric contractions. The Journal of physiology, 587, 3691-3701.
OSTROWSKI, K., HERMANN, C., BANGASH, A., SCHJERLING, P., NIELSEN, J. N. & PEDERSEN, B. K. 1998a. A trauma‐like elevation of plasma cytokines in humans in response to treadmill running. The Journal of physiology, 513, 889-894.
OSTROWSKI, K., ROHDE, T., ASP, S., SCHJERLING, P. & PEDERSEN, B. K. 1999. Pro‐and anti‐inflammatory cytokine balance in strenuous exercise in humans. The Journal of physiology, 515, 287-291.
OSTROWSKI, K., ROHDE, T., ZACHO, M., ASP, S. & PEDERSEN, B. 1998b. Evidence that interleukin‐6 is produced in human skeletal muscle during prolonged running. The Journal of physiology, 508, 949-953.
OSTROWSKI, K., SCHJERLING, P. & PEDERSEN, B. K. 2000. Physical activity and plasma interleukin-6 in humans–effect of intensity of exercise. European journal of applied physiology, 83, 512-515.
PAPADOYANNAKIS, N., STEFANIDIS, C. & MCGEOWN, M. 1984. The effect of the correction of metabolic acidosis on nitrogen and potassium balance of patients with chronic renal failure. The American journal of clinical nutrition, 40, 623-627.
PARADISE, R. K., LAUFFENBURGER, D. A. & VAN VLIET, K. J. 2011. Acidic extracellular pH promotes activation of integrin αvβ3. PloS one, 6, e15746.
PASSEY, S., MARTIN, N., PLAYER, D. & LEWIS, M. 2011. Stretching skeletal muscle in vitro: does it replicate in vivo physiology? Biotechnology letters, 33, 1513-1521.
PEAKE, J. M., NEUBAUER, O., DELLA GATTA, P. A. & NOSAKA, K. 2016. Muscle damage and inflammation during recovery from exercise. Journal of applied physiology, 122, 559-570.
PEDERSEN, B. & SALTIN, B. 2015a. Exercise as medicine–evidence for prescribing exercise as therapy in 26 different chronic diseases. Scandinavian journal of medicine & science in sports, 25, 1-72.
PEDERSEN, B. K., AKERSTROM, T. C., NIELSEN, A. R. & FISCHER, C. P. 2007. Role of myokines in exercise and metabolism. Journal of applied physiology, 103, 1093-1098.
PEDERSEN, B. K. & FEBBRAIO, M. A. 2008a. Muscle as an endocrine organ: focus on muscle-derived interleukin-6. Physiol Rev, 88, 1379-406.
PEDERSEN, B. K. & FEBBRAIO, M. A. 2008b. Muscle as an endocrine organ: focus on muscle-derived interleukin-6. Physiological reviews, 88, 1379-1406.
PEDERSEN, B. K. & SALTIN, B. 2006. Evidence for prescribing exercise as therapy in chronic disease. Scandinavian journal of medicine & science in sports, 16, 3-63.
PEDERSEN, B. K. & SALTIN, B. 2015b. Exercise as medicine - evidence for prescribing exercise as therapy in 26 different chronic diseases. Scand J Med Sci Sports, 25 Suppl 3, 1-72.
PEREIRA, M. G., DYAR, K. A., NOGARA, L., SOLAGNA, F., MARABITA, M., BARALDO, M., CHEMELLO, F., GERMINARIO, E., ROMANELLO, V. & NOLTE, H. 2017. Comparative analysis of muscle hypertrophy models reveals divergent gene transcription profiles and points to translational regulation of muscle growth through increased mTOR signaling. Frontiers in physiology, 8, 968.
PERRONE, C. E., FENWICK-SMITH, D. & VANDENBURGH, H. H. 1995. Collagen and stretch modulate autocrine secretion of insulin-like growth factor-1 and insulin-like growth factor binding proteins from differentiated skeletal muscle cells. Journal of Biological Chemistry, 270, 2099-2106.
PETERSEN, A. M. & PEDERSEN, B. K. 2005a. The anti-inflammatory effect of exercise. J Appl Physiol (1985), 98, 1154-62.
PETERSEN, A. M. W. & PEDERSEN, B. K. 2005b. The anti-inflammatory effect of exercise. Journal of applied physiology, 98, 1154-1162.
PFAFFL, M. W. 2001. A new mathematical model for relative quantification in real-time RT–PCR. Nucleic acids research, 29, e45-e45.

134
PHILP, A., BELEW, M. Y., EVANS, A., PHAM, D., SIVIA, I., CHEN, A., SCHENK, S. & BAAR, K. 2011. The PGC-1α-related coactivator promotes mitochondrial and myogenic adaptations in C2C12 myotubes. American Journal of Physiology-Regulatory, Integrative and Comparative Physiology, 301, R864-R872.
PHILP, A., PEREZ-SCHINDLER, J., GREEN, C., HAMILTON, D. L. & BAAR, K. 2010. Pyruvate suppresses PGC1α expression and substrate utilization despite increased respiratory chain content in C2C12 myotubes. American Journal of Physiology-Cell Physiology, 299, C240-C250.
PICKERING, W., CHENG, M.-K., BROWN, J., BUTLER, H., WALLS, J. & BEVINGTON, A. 2003. Stimulation of protein degradation by low pH in L6G8C5 skeletal muscle cells is independent of apoptosis but dependent on differentiation state. Nephrology Dialysis Transplantation, 18, 1466-1474.
PINILLA, J., ALEDO, J. C., CWIKLINSKI, E., HYDE, R., TAYLOR, P. M. & HUNDAL, H. S. 2011. SNAT2 transceptor signalling via mTOR: a role in cell growth and proliferation. Front Biosci (Elite Ed), 3, 1289-1299.
POCHINI, L., SCALISE, M., GALLUCCIO, M. & INDIVERI, C. 2014. Membrane transporters for the special amino acid glutamine: structure/function relationships and relevance to human health. Front Chem, 2, 61.
POWELL, C. A., SMILEY, B. L., MILLS, J. & VANDENBURGH, H. H. 2002. Mechanical stimulation improves tissue-engineered human skeletal muscle. American Journal of Physiology-Cell Physiology, 283, C1557-C1565.
PRICE, S. & MITCH, W. AcidIfication-Induced Metabolic Responses Muscle-Cells-Stimulation of Stress-Activated Protein-Kinase Activity. JOURNAL OF THE AMERICAN SOCIETY OF NEPHROLOGY, 1995. WILLIAMS & WILKINS 351 WEST CAMDEN ST, BALTIMORE, MD 21201-2436, 1028-1028.
PROUD, C. 2006. Regulation of protein synthesis by insulin. Biochemical Society Transactions, 34, 213-216.
PSATHA, M., WU, Z., GAMMIE, F. M., RATKEVICIUS, A., WACKERHAGE, H., LEE, J. H., REDPATH, T. W., GILBERT, F. J., ASHCROFT, G. P. & MEAKIN, J. R. 2012. A longitudinal MRI study of muscle atrophy during lower leg immobilization following ankle fracture. Journal of Magnetic Resonance Imaging, 35, 686-695.
RAMOS, J. W. 2008. The regulation of extracellular signal-regulated kinase (ERK) in mammalian cells. Int J Biochem Cell Biol, 40, 2707-19.
RAPHAEL, K. L. 2018. Metabolic acidosis and subclinical metabolic acidosis in CKD. Journal of the American Society of Nephrology, 29, 376-382.
RAUCH, C. & LOUGHNA, P. T. 2005a. Static stretch promotes MEF2A nuclear translocation and expression of neonatal myosin heavy chain in C2C12 myocytes in a calcineurin- and p38-dependent manner. Am J Physiol Cell Physiol, 288, C593-605.
RAUCH, C. & LOUGHNA, P. T. 2005b. Static stretch promotes MEF2A nuclear translocation and expression of neonatal myosin heavy chain in C2C12 myocytes in a calcineurin-and p38-dependent manner. American Journal of Physiology-Cell Physiology, 288, C593-C605.
RAUCH, C. & LOUGHNA, P. T. 2008a. Stretch-induced activation of ERK in myocytes is p38 and calcineurin-dependent. Cell Biochem Funct, 26, 866-9.
RAUCH, C. & LOUGHNA, P. T. 2008b. Stretch‐induced activation of ERK in myocytes is p38 and calcineurin‐dependent. Cell Biochemistry and Function: Cellular biochemistry and its modulation by active agents or disease, 26, 866-869.
REAICH, D., CHANNON, S., SCRIMGEOUR, C., DALEY, S., WILKINSON, R. & GOODSHIP, T. 1993. Correction of acidosis in humans with CRF decreases protein degradation and amino acid oxidation. American Journal of Physiology-Endocrinology And Metabolism, 265, E230-E235.
RINDOM, E., KRISTENSEN, A. M., OVERGAARD, K., VISSING, K. & DE PAOLI, F. V. 2019. Activation of mTORC 1 signaling in rat skeletal muscle is independent of the EC‐coupling sequence but dependent on tension per se in a dose‐response relationship. Acta Physiologica, e13336.

135
RODWELL, V., BENDER, D., BOTHAM, K. M., KENNELLY, P. J. & WEIL, P. A. 2015. Harpers Illustrated Biochemistry 30th Edition, McGraw-Hill Education.
ROSE, A. J. & RICHTER, E. A. 2005. Skeletal muscle glucose uptake during exercise: how is it regulated? Physiology, 20, 260-270.
ROSKOSKI, R., JR. 2012. ERK1/2 MAP kinases: structure, function, and regulation. Pharmacol Res, 66, 105-43.
SAKAMOTO, K. & GOODYEAR, L. J. 2002. Invited review: intracellular signaling in contracting skeletal muscle. Journal of applied physiology, 93, 369-383.
SANTHANAM, U., GHRAYEB, J., SEHGAL, P. B. & MAY, L. T. 1989. Post-translational modifications of human interleukin-6. Archives of biochemistry and biophysics, 274, 161-170.
SANTOS, J., RIBEIRO, S., GAYA, A., APPELL, H. & DUARTE, J. 2008. Skeletal muscle pathways of contraction-enhanced glucose uptake. International journal of sports medicine, 29, 785-794.
SAXENA, M., PANDEY, S., KRYWORUCHKO, M. & KUMAR, A. 2011. CpG Protects Human Monocytic Cells against HIV-Vpr–Induced Apoptosis by Cellular Inhibitor of Apoptosis-2 through the Calcium-Activated JNK Pathway in a TLR9-Independent Manner. The Journal of Immunology, 187, 5865-5878.
SCHELLER, J., CHALARIS, A., SCHMIDT-ARRAS, D. & ROSE-JOHN, S. 2011. The pro-and anti-inflammatory properties of the cytokine interleukin-6. Biochimica et Biophysica Acta (BBA)-Molecular Cell Research, 1813, 878-888.
SCHOENFELD, B. J. & CONTRERAS, B. 2014. The muscle pump: potential mechanisms and applications for enhancing hypertrophic adaptations. Strength & Conditioning Journal, 36, 21-25.
SCHULTZ, E. & MCCORMICK, K. M. 1994. Skeletal muscle satellite cells. Reviews of Physiology, Biochemistry and Pharmacology, Volume 123. Springer.
SEHGAL, S. Sirolimus: its discovery, biological properties, and mechanism of action. Transplantation proceedings, 2003. Elsevier, S7-S14.
SEN, C. K., HANNINEN, O. & ORLOV, S. N. 1995. Unidirectional sodium and potassium flux in myogenic L6 cells: mechanisms and volume-dependent regulation. Journal of Applied Physiology, 78, 272-281.
SHRESTHA, M. M. 2017. Phosphorylation of tropomodulin3 by AMPK regulates GLUT4 translocation and glucose uptake in L6 myoblasts. National University of Singapore (Singapore).
SIMARD, F. A., CLOUTIER, A., EAR, T., VARDHAN, H. & MCDONALD, P. P. 2015. MEK‐independent ERK activation in human neutrophils and its impact on functional responses. Journal of leukocyte biology, 98, 565-573.
SLACK-DAVIS, J. K., MARTIN, K. H., TILGHMAN, R. W., IWANICKI, M., UNG, E. J., AUTRY, C., LUZZIO, M. J., COOPER, B., KATH, J. C. & ROBERTS, W. G. 2007. Cellular characterization of a novel focal adhesion kinase inhibitor. Journal of Biological Chemistry, 282, 14845-14852.
SPANGENBURG, E. E. 2009. Changes in muscle mass with mechanical load: possible cellular mechanisms This paper is one of a selection of papers published in this Special Issue, entitled 14th International Biochemistry of Exercise Conference-Muscles as Molecular and Metabolic Machines, and has undergone the Journal's usual peer review process. Applied Physiology, Nutrition, and Metabolism, 34, 328-335.
STARKIE, R., OSTROWSKI, S. R., JAUFFRED, S., FEBBRAIO, M. & PEDERSEN, B. K. 2003. Exercise and IL-6 infusion inhibit endotoxin-induced TNF-α production in humans. The FASEB Journal, 17, 884-886.
STEENSBERG, A., FEBBRAIO, M. A., OSADA, T., SCHJERLING, P., HALL, G., SALTIN, B. & PEDERSEN, B. K. 2001a. Interleukin‐6 production in contracting human skeletal muscle is influenced by pre‐exercise muscle glycogen content. The Journal of Physiology, 537, 633-639.
STEENSBERG, A., FISCHER, C. P., KELLER, C., MØLLER, K. & PEDERSEN, B. K. 2003. IL-6 enhances plasma IL-1ra, IL-10, and cortisol in humans. American Journal of Physiology-Endocrinology And Metabolism, 285, E433-E437.

136
STEENSBERG, A., KELLER, C., STARKIE, R. L., OSADA, T., FEBBRAIO, M. A. & PEDERSEN, B. K. 2002. IL-6 and TNF-α expression in, and release from, contracting human skeletal muscle. American Journal of Physiology-Endocrinology and Metabolism, 283, E1272-E1278.
STEENSBERG, A., VAN HALL, G., OSADA, T., SACCHETTI, M., SALTIN, B. & PEDERSEN, B. K. 2000. Production of interleukin‐6 in contracting human skeletal muscles can account for the exercise‐induced increase in plasma interleukin‐6. The Journal of physiology, 529, 237-242.
STEENSBERG, A., VISSING, J. & PEDERSEN, B. K. 2001b. Lack of IL-6 production during exercise in patients with mitochondrial myopathy. European journal of applied physiology, 84, 155-157.
STILES, M. K., CRAIG, M. E., GUNNELL, S., PFEIFFER, D. & TAYLOR, R. 1991. The formation constants of ionomycin with divalent cations in 80% methanol/water. Journal of Biological Chemistry, 266, 8336-8342.
STOCKDALE, F. E. & MILLER, J. B. 1987. The cellular basis of myosin heavy chain isoform expression during development of avian skeletal muscles. Developmental biology, 123, 1-9.
STRETTON, C., LIPINA, C., HYDE, R., CWIKLINSKI, E., HOFFMANN, T. M., TAYLOR, P. M. & HUNDAL, H. S. 2019. CDK7 is a component of the integrated stress response regulating SNAT2 (SLC38A2)/System A adaptation in response to cellular amino acid deprivation. Biochimica et Biophysica Acta (BBA)-Molecular Cell Research, 1866, 978-991.
SUN, W., WU, X., GAO, H., YU, J., ZHAO, W., LU, J.-J., WANG, J., DU, G. & CHEN, X. 2017. Cytosolic calcium mediates RIP1/RIP3 complex-dependent necroptosis through JNK activation and mitochondrial ROS production in human colon cancer cells. Free Radical Biology and Medicine, 108, 433-444.
SUN, Z., GUO, S. S. & FÄSSLER, R. 2016. Integrin-mediated mechanotransduction. J Cell Biol, 215, 445-456.
SUZUKI, K., NAKAJI, S., YAMADA, M., TOTSUKA, M., SATO, K. & SUGAWARA, K. 2002. Systemic inflammatory response to exhaustive exercise. Cytokine kinetics. Exercise immunology review, 8, 6-48.
SWEDBERG, K., CLELAND, J., DARGIE, H., DREXLER, H., FOLLATH, F., KOMAJDA, M., TAVAZZI, L., SMISETH, O. A., GAVAZZI, A. & HAVERICH, A. 2005. Guidelines for the diagnosis and treatment of chronic heart failure: executive summary (update 2005). European heart journal, 26, 1115-1140.
TAYLOR, R. S., BROWN, A., EBRAHIM, S., JOLLIFFE, J., NOORANI, H., REES, K., SKIDMORE, B., STONE, J. A., THOMPSON, D. R. & OLDRIDGE, N. 2004. Exercise-based rehabilitation for patients with coronary heart disease: systematic review and meta-analysis of randomized controlled trials. The American journal of medicine, 116, 682-692.
THALHAMER, T., MCGRATH, M. A. & HARNETT, M. M. 2008. MAPKs and their relevance to arthritis and inflammation. Rheumatology (Oxford), 47, 409-14.
TILLY, B. C., GAESTEL, M., ENGEL, K., EDIXHOVEN, M. J. & DE JONGE, H. R. 1996. Hypo‐osmotic cell swelling activates the p38 MAP kinase signalling cascade. Febs Letters, 395, 133-136.
TREXLER, E. B., BUKAUSKAS, F. F., BENNETT, M. V., BARGIELLO, T. A. & VERSELIS, V. K. 1999. Rapid and direct effects of pH on connexins revealed by the connexin46 hemichannel preparation. The Journal of general physiology, 113, 721-742.
TSUZUKI, T., YOSHIHARA, T., ICHINOSEKI-SEKINE, N., KAKIGI, R., TAKAMINE, Y., KOBAYASHI, H. & NAITO, H. 2018. Body temperature elevation during exercise is essential for activating the Akt signaling pathway in the skeletal muscle of type 2 diabetic rats. PloS one, 13, e0205456.
TUMANENG, K., SCHLEGELMILCH, K., RUSSELL, R. C., YIMLAMAI, D., BASNET, H., MAHADEVAN, N., FITAMANT, J., BARDEESY, N., CAMARGO, F. D. & GUAN, K.-L. 2012. YAP mediates crosstalk between the Hippo and PI (3) K–TOR pathways by suppressing PTEN via miR-29. Nature cell biology, 14, 1322.
TZUR, A., MOORE, J. K., JORGENSEN, P., SHAPIRO, H. M. & KIRSCHNER, M. W. 2011. Optimizing optical flow cytometry for cell volume-based sorting and analysis. PloS one, 6, e16053.

137
USHER‐SMITH, J. A., FRASER, J. A., BAILEY, P. S., GRIFFIN, J. L. & HUANG, C. L. H. 2006. The influence of intracellular lactate and H+ on cell volume in amphibian skeletal muscle. The Journal of physiology, 573, 799-818.
VANDENBURGH, H. H., HATFALUDY, S., KARLISCH, P. & SHANSKY, J. 1989. Skeletal muscle growth is stimulated by intermittent stretch-relaxation in tissue culture. American Journal of Physiology-Cell Physiology, 256, C674-C682.
VERBRUGGE, S. A. J., WACKERHAGE, H., SCHÖNFELDER, M., NEZHAD, F. Y., BECKER, L. & HRABE DE ANGELIS, M. 2018. Genes whose gain or loss-of-function increases skeletal muscle mass in mice: a systematic literature review. Frontiers in physiology, 9, 553.
VIANA, J. L., KOSMADAKIS, G. C., WATSON, E. L., BEVINGTON, A., FEEHALLY, J., BISHOP, N. C. & SMITH, A. C. 2014. Evidence for anti-inflammatory effects of exercise in CKD. J Am Soc Nephrol, 25, 2121-30.
VISSING, K. & SCHJERLING, P. 2014. Simplified data access on human skeletal muscle transcriptome responses to differentiated exercise. Scientific data, 1, 140041.
WACKERHAGE, H., DEL RE, D. P., JUDSON, R. N., SUDOL, M. & SADOSHIMA, J. 2014. The Hippo signal transduction network in skeletal and cardiac muscle. Sci. Signal., 7, re4-re4.
WACKERHAGE, H., SCHOENFELD, B. J., HAMILTON, D. L., LEHTI, M. & HULMI, J. J. 2018. Stimuli and sensors that initiate skeletal muscle hypertrophy following resistance exercise. Journal of Applied Physiology, 126, 30-43.
WANG, Y. L., ZHANG, Y. Y., LU, C., ZHANG, W., DENG, H., WU, J. W., WANG, J. & WANG, Z. X. 2019. Kinetic and mechanistic studies of p38α MAP kinase phosphorylation by MKK 6. The FEBS journal, 286, 1030-1052.
WATSON, E. L., KOSMADAKIS, G. C., SMITH, A. C., VIANA, J. L., BROWN, J. R., MOLYNEUX, K., PAWLUCZYK, I. Z., MULHERAN, M., BISHOP, N. C. & SHIRREFFS, S. 2013a. Combined walking exercise and alkali therapy in patients with CKD4–5 regulates intramuscular free amino acid pools and ubiquitin E3 ligase expression. European journal of applied physiology, 113, 2111-2124.
WATSON, E. L., KOSMADAKIS, G. C., SMITH, A. C., VIANA, J. L., BROWN, J. R., MOLYNEUX, K., PAWLUCZYK, I. Z., MULHERAN, M., BISHOP, N. C., SHIRREFFS, S., MAUGHAN, R. J., OWEN, P. J., JOHN, S. G., MCINTYRE, C. W., FEEHALLY, J. & BEVINGTON, A. 2013b. Combined walking exercise and alkali therapy in patients with CKD4-5 regulates intramuscular free amino acid pools and ubiquitin E3 ligase expression. Eur J Appl Physiol, 113, 2111-24.
WATSON, K. & BAAR, K. mTOR and the health benefits of exercise. Seminars in cell & developmental biology, 2014a. Elsevier, 130-139.
WATSON, K. & BAAR, K. 2014b. mTOR and the health benefits of exercise. Semin Cell Dev Biol, 36, 130-9.
WATT, K. I., GOODMAN, C. A., HORNBERGER, T. A. & GREGOREVIC, P. 2018. The Hippo Signaling Pathway in the Regulation of Skeletal Muscle Mass and Function. Exerc Sport Sci Rev, 46, 92-96.
WENDOWSKI, O., REDSHAW, Z. & MUTUNGI, G. 2017. Dihydrotestosterone treatment rescues the decline in protein synthesis as a result of sarcopenia in isolated mouse skeletal muscle fibres. J Cachexia Sarcopenia Muscle, 8, 48-56.
WESTON, C. R. & DAVIS, R. J. 2007. The JNK signal transduction pathway. Curr Opin Cell Biol, 19, 142-9.
WIDMANN, C., GIBSON, S., JARPE, M. B. & JOHNSON, G. L. 1999. Mitogen-activated protein kinase: conservation of a three-kinase module from yeast to human. Physiological reviews, 79, 143-180.
WILLIAMSON, D., GALLAGHER, P., HARBER, M., HOLLON, C. & TRAPPE, S. 2003. Mitogen-activated protein kinase (MAPK) pathway activation: effects of age and acute exercise on human skeletal muscle. J Physiol, 547, 977-87.
138
WING, M. R., RAJ, D. S. & VELASQUEZ, M. T. 2014. Protein Energy Metabolism in Chronic Kidney Disease. Chronic Renal Disease.
WING, M. R., RAJ, D. S. & VELASQUEZ, M. T. 2015. Protein Energy Metabolism in Chronic Kidney Disease. Chronic Renal Disease. Elsevier.
WINZER, E. B., WOITEK, F. & LINKE, A. 2018. Physical activity in the prevention and treatment of coronary artery disease. Journal of the American Heart Association, 7, e007725.
WORLD HEALTH ORGANIZATION 2014. Global Burden of Disease YAFFE, D. 1968. Retention of differentiation potentialities during prolonged cultivation of myogenic
cells. Proceedings of the National Academy of Sciences, 61, 477-483. YAMASAKI-MANN, M., DEMURO, A. & PARKER, I. 2009. cADPR stimulates SERCA activity in Xenopus
oocytes. Cell calcium, 45, 293-299. YANO, S., MORINO-KOGA, S., KONDO, T., SUICO, M. A., KOGA, T., SHIMAUCHI, Y., MATSUYAMA, S.,
SHUTO, T., SATO, T. & ARAKI, E. 2011. Glucose uptake in rat skeletal muscle L6 cells is increased by low-intensity electrical current through the activation of the phosphatidylinositol-3-OH kinase (PI-3K)/Akt pathway. Journal of pharmacological sciences, 115, 94-98.
YEO, E.-S., HWANG, J.-Y., PARK, J. E., CHOI, Y. J., HUH, K. B. & KIM, W. Y. 2010. Tumor necrosis factor (TNF-α) and C-reactive protein (CRP) are positively associated with the risk of chronic kidney disease in patients with type 2 diabetes. Yonsei medical journal, 51, 519-525.
YOU, J.-S., LINCOLN, H. C., KIM, C.-R., FREY, J. W., GOODMAN, C. A., ZHONG, X.-P. & HORNBERGER, T. A. 2014. The role of diacylglycerol kinase ζ and phosphatidic acid in the mechanical activation of mammalian target of rapamycin (mTOR) signaling and skeletal muscle hypertrophy. Journal of Biological Chemistry, 289, 1551-1563.
YU, J.-G., LIU, J.-X., CARLSSON, L., THORNELL, L.-E. & STÅL, P. S. 2013. Re-evaluation of sarcolemma injury and muscle swelling in human skeletal muscles after eccentric exercise. PloS one, 8, e62056.
ZHAN, M., JIN, B., CHEN, S. E., REECY, J. M. & LI, Y. P. 2007. TACE release of TNF-alpha mediates mechanotransduction-induced activation of p38 MAPK and myogenesis. J Cell Sci, 120, 692-701.
ZHANG, Y. Y., YANG, M., BAO, J. F., GU, L. J., YU, H. L. & YUAN, W. J. 2018. Phosphate stimulates myotube atrophy through autophagy activation: evidence of hyperphosphatemia contributing to skeletal muscle wasting in chronic kidney disease. BMC Nephrol, 19, 45.
ZHANG, Z., GAMEIRO, A. & GREWER, C. 2008. Highly conserved asparagine 82 controls the interaction of Na+ with the sodium-coupled neutral amino acid transporter SNAT2. Journal of Biological Chemistry, 283, 12284-12292.
ZHANG, Z. & GREWER, C. 2007. The sodium-coupled neutral amino acid transporter SNAT2 mediates an anion leak conductance that is differentially inhibited by transported substrates. Biophysical journal, 92, 2621-2632.
ZOU, K., MEADOR, B. M., JOHNSON, B., HUNTSMAN, H. D., MAHMASSANI, Z., VALERO, M. C., HUEY, K. A. & BOPPART, M. D. 2011. The α7β1-integrin increases muscle hypertrophy following multiple bouts of eccentric exercise. Journal of Applied Physiology, 111, 1134-1141.
Copyright © 2022 FDOKUMEN