Inference of evolutionary forces acting on human biological pathways
13
Inference of Evolutionary Forces Acting on Human Biological Pathways Josephine T. Daub 1,2,4, *, Isabelle Dupanloup 1,2 , Marc Robinson-Rechavi 2,3 , and Laurent Excoffier 1,2, * 1 CMPG, Institute of Ecology and Evolution, University of Berne, Switzerland 2 Swiss Institute of Bioinformatics SIB, Lausanne, Switzerland 3 Department of Ecology and Evolution, University of Lausanne, Switzerland 4 Present address: Institute of Evolutionary Biology (UPF-CSIC), Barcelona, Spain *Corresponding author: E-mail: [email protected]; laurent.excoffi[email protected]. Accepted: May 9, 2015 Abstract Because natural selection is likely to act on multiple genes underlying a given phenotypic trait, we study here the potential effect of ongoing and past selection on the genetic diversity of human biological pathways. We first show that genes included in gene sets are generally under stronger selective constraints than other genes and that their evolutionary response is correlated. We then introduce a new procedure to detect selection at the pathway level based on a decomposition of the classical McDonald–Kreitman test extended to multiple genes. This new test, called 2DNS, detects outlier gene sets and takes into account past demographic effects and evolutionary constraints specific to gene sets. Selective forces acting on gene sets can be easily identified by a mere visual inspection of the position of the gene sets relative to their two-dimensional null distribution. We thus find several outlier gene sets that show signals of positive, balancing, or purifying selection but also others showing an ancient relaxation of selective constraints. The principle of the 2DNS test can also be applied to other genomic contrasts. For instance, the comparison of patterns of polymorphisms private to African and non-African populations reveals that most pathways show a higher proportion of nonsynonymous mutations in non-Africans than in Africans, potentially due to different demographic histories and selective pressures. Key words: human evolution, pathway analysis, polygenic selection, McDonald–Kreitman test. Introduction In the search for genomic signals of natural selection (e.g., reviewed in Nielsen 2005), there has been a recent shift from single gene to gene set approaches, where the focus moved to gene networks, pathways, and interacting genes (Daub et al. 2013; Fraser 2013; Zhang et al. 2013; Berg and Coop 2014). Studying groups of functionally related genes makes biological sense for several reasons. First, as selection is acting on phenotypic traits usually controlled by many genes (Stranger et al. 2011), we would expect it to affect multiple genes or a whole pathway rather than a single gene. A bio- logical pathway or a gene network is therefore a more natural unit for selection tests. Second, mutations in one gene can induce the modification of functionally connected genes to adapt to or compensate for the initial change (Pazos and Valencia 2008), and such co-evolution can lead to a cascade of evolutionary changes within a gene network. Third, many small effect mutations can together have a large effect on polygenic traits. It has been suggested that selection on such traits, termed polygenic selection, usually acts on stand- ing variation at several loci at the same time. In the long run, this would lead to an increase in the frequency of a suitable combination of alleles that control the favored phenotype (Pritchard et al. 2010). For example, using levels of population differentiation be- tween human groups, we have recently found several path- ways involved in immune response to have been under positive selection in recent human history (Daub et al. 2013). In this article, we investigate whether and what type of polygenic selection could have acted at different stages of human evolution, by comparing patterns of diversity between humans and chimpanzees. The rationale is that since selective pressures could have changed over time for some biological pathways, recent or old episodes of selection cannot be de- tected by only looking at current human diversity. Our method contrasts patterns of fixed and polymorphic mutations in GBE ß The Author(s) 2015. Published by Oxford University Press on behalf of the Society for Molecular Biology and Evolution. This is an Open Access article distributed under the terms of the Creative Commons Attribution License ( http://creativecommons.org/licenses/by/4.0/), which permits unrestricted reuse, distribution, and reproduction in any medium, provided the original work is properly cited. 1546 Genome Biol. Evol. 7(6):1546–1558. doi:10.1093/gbe/evv083 Advance Access publication May 13, 2015 at Biblioteca de la Universitat Pompeu Fabra on June 15, 2015 http://gbe.oxfordjournals.org/ Downloaded from
-
Upload
independent -
Category
Documents
-
view
0 -
download
0
Transcript of Inference of evolutionary forces acting on human biological pathways
Inference of Evolutionary Forces Acting on Human
Biological Pathways
Josephine T. Daub1,2,4,*, Isabelle Dupanloup1,2, Marc Robinson-Rechavi2,3, and Laurent Excoffier1,2,*1CMPG, Institute of Ecology and Evolution, University of Berne, Switzerland2Swiss Institute of Bioinformatics SIB, Lausanne, Switzerland3Department of Ecology and Evolution, University of Lausanne, Switzerland4 Present address: Institute of Evolutionary Biology (UPF-CSIC), Barcelona, Spain
*Corresponding author: E-mail: [email protected]; [email protected].
Accepted: May 9, 2015
Abstract
Because natural selection is likely to act on multiple genes underlying a given phenotypic trait, we study here the potential effect of
ongoing and past selection on the genetic diversity of human biological pathways. We first show that genes included in gene sets are
generallyunder stronger selectiveconstraints thanothergenesandthat their evolutionary response is correlated.Wethen introducea
new procedure to detect selection at the pathway level based on a decomposition of the classical McDonald–Kreitman test extended
to multiple genes. This new test, called 2DNS, detects outlier gene sets and takes into account past demographic effects and
evolutionary constraints specific to gene sets. Selective forces acting on gene sets can be easily identified by a mere visual inspection
of the position of the gene sets relative to their two-dimensional null distribution. We thus find several outlier gene sets that show
signalsofpositive,balancing,orpurifyingselectionbutalsoothers showinganancient relaxationof selectiveconstraints. Theprinciple
of the2DNS test canalsobeapplied toothergenomiccontrasts. For instance, thecomparisonofpatternsofpolymorphismsprivate to
African and non-African populations reveals that most pathways show a higher proportion of nonsynonymous mutations in
non-Africans than in Africans, potentially due to different demographic histories and selective pressures.
Key words: human evolution, pathway analysis, polygenic selection, McDonald–Kreitman test.
Introduction
In the search for genomic signals of natural selection (e.g.,
reviewed in Nielsen 2005), there has been a recent shift
from single gene to gene set approaches, where the focus
moved to gene networks, pathways, and interacting genes
(Daub et al. 2013; Fraser 2013; Zhang et al. 2013; Berg and
Coop 2014). Studying groups of functionally related genes
makes biological sense for several reasons. First, as selection
is acting on phenotypic traits usually controlled by many genes
(Stranger et al. 2011), we would expect it to affect multiple
genes or a whole pathway rather than a single gene. A bio-
logical pathway or a gene network is therefore a more natural
unit for selection tests. Second, mutations in one gene can
induce the modification of functionally connected genes to
adapt to or compensate for the initial change (Pazos and
Valencia 2008), and such co-evolution can lead to a cascade
of evolutionary changes within a gene network. Third, many
small effect mutations can together have a large effect on
polygenic traits. It has been suggested that selection on
such traits, termed polygenic selection, usually acts on stand-
ing variation at several loci at the same time. In the long run,
this would lead to an increase in the frequency of a suitable
combination of alleles that control the favored phenotype
(Pritchard et al. 2010).
For example, using levels of population differentiation be-
tween human groups, we have recently found several path-
ways involved in immune response to have been under
positive selection in recent human history (Daub et al.
2013). In this article, we investigate whether and what type
of polygenic selection could have acted at different stages of
human evolution, by comparing patterns of diversity between
humans and chimpanzees. The rationale is that since selective
pressures could have changed over time for some biological
pathways, recent or old episodes of selection cannot be de-
tected by only looking at current human diversity. Our method
contrasts patterns of fixed and polymorphic mutations in
GBE
� The Author(s) 2015. Published by Oxford University Press on behalf of the Society for Molecular Biology and Evolution.
This is an Open Access article distributed under the terms of the Creative Commons Attribution License (http://creativecommons.org/licenses/by/4.0/), which permits unrestricted reuse,
distribution, and reproduction in any medium, provided the original work is properly cited.
1546 Genome Biol. Evol. 7(6):1546–1558. doi:10.1093/gbe/evv083 Advance Access publication May 13, 2015
at Biblioteca de la U
niversitat Pompeu Fabra on June 15, 2015
http://gbe.oxfordjournals.org/D
ownloaded from

humans, allowing us to detect various selective pressures
having affected our species at different periods of its
evolution.
Our approach is based on statistics previously used in the
classical McDonald–Kreitman (MDK) test for positive selection
(McDonald and Kreitman 1991), a test that compares the ratio
of the number of nonsynonymous substitutions to synony-
mous substitutions between species (DN/DS) to the same
ratio within species (PN/PS). Assuming that synonymous mu-
tations are neutral, a higher DN/DS than PN/PS ratio is ex-
pected in case of ancient adaptive selection, because
positively selected mutations rising to fixation in a population
would contribute more to divergence than to polymorphism.
The related statistic a ¼ 1� ðDS� PNÞ=ðDN� PSÞ has been
used to estimate the proportion (a) of adaptive
nonsynonymous substitutions in a genome (Smith and Eyre-
Walker 2002). A limitation is that the same a value can be
obtained for different combinations of PN/PS and DN/DS
ratios. To account for this problem, we introduce here a
testing procedure, based on a two-dimensional (2D) decom-
position of a, which identifies gene sets departing from a
genome-wide null distribution and leads to a better interpre-
tation of the results by a visual inspection of bivariate
distributions.
Materials and Methods
Data Handling and Collection
Ensembl Gene Data
We downloaded the exon coordinates of protein coding
human genes from Ensembl (Ensembl version 64,
September 2011, Flicek et al. 2014). We then only considered
those genes (and their corresponding coding exons) that have
a chimp ortholog with a “known” status as defined in
Ensembl version 64, and genes having a chimp ortholog with-
out known status but with a known mouse ortholog. The
second group represents genes that most probably have a
real ortholog in chimp but are not annotated as such (yet)
due to the lower quality of the chimp sequence. This left us
with 18,078 genes and we will refer to this set as GEnsembl. We
computed the total exon length of each gene by summing the
length of all its coding exons but only counted a site once if it
was part of two overlapping exons. We thus used the longest
coding exon definition for each gene.
Human Single-Nucleotide Polymorphisms
Human single-nucleotide polymorphisms (SNPs) were inferred
from the comparison of the whole genomes of 42 unrelated
individuals sequenced by Complete Genomics (CG) at a depth
of 51–89X coverage per genome (Drmanac et al. 2010). The
42 individuals were sampled in 3 African populations (four
Luhya from Webuye, Kenya; four Maasai from Kinyawa,
Kenya; and nine Yoruba from Ibadan, Nigeria), and 5
non-African populations (nine Utah residents with Northern
and Western European ancestry from the CEPH collection;
four Han Chinese from Beijing; four Gujarati Indians from
Houston, TX; four Japanese from Tokyo; and four Toscans
from Italy). The SNPs were divided into three categories:
Sites which are polymorphic in Africans only (African SNPs),
sites polymorphic in non-Africans only (non-African SNPs),
and sites polymorphic in both Africans and non-Africans
(shared SNPs). The shared SNPs presumably arose before
the migration of modern humans out of Africa and are
therefore depleted from recent deleterious mutations that
otherwise could distort selective signals. This group of SNPs
was used in the 2DNS test (fig. 1 and supplementary fig. S1,
Supplementary Material online). The African and non-African
SNPs were used in a further analysis to compare demographic
patterns between the two regions (fig. 2).
To investigate the effect of larger sample sizes on our
results, polymorphism data were also obtained from the
1000 Genomes project phase 3 (Abecasis et al. 2012,
hereafter called the 1000G set), including 288,003 SNPs
from 1,594 individuals sampled from 16 nonadmixed
populations (five from Africa, seven from Asia, and four
from Europe, see supplementary table S1, Supplementary
Material online). Note that the 1000G SNP set consists of
polymorphisms called from a combination of both low and
high coverage data (between 8X and 30X) and that it only
targets about 40% of the exome, whereas CG covers the
whole exome at higher coverage (51–89X). For these rea-
sons, the CG set was used in the main analyses. In the
analyses where the CG and 1000G datasets where com-
pared, we only considered SNPs that were in exonic
regions both targeted by the 1000G project and fully
sequenced in all 42 CG samples.
Human Chimp Substitutions
Substitutions between human and chimp were inferred from
the comparison between the reference genomes of the two
species, using the syntenic net alignments between hg19 and
panTro2 available on the University of California–Santa Cruz
(UCSC) platform (Karolchik et al. 2012). The inferred muta-
tions were then placed on the human-specific or chimp-
specific branches of the tree by comparing the nucleotides
observed in human and chimp to the orthologous base in
the ancestral sequence derived from Ensembl Compara
release 59 and used by the 1000 Genomes consortium
(Abecasis et al. 2012); only mutations which could be
placed unambiguously on the human or chimp branch were
used.
Mapping and Annotation of Mutations
We mapped the mutations to the coding exons of the human
genes in the GEnsembl set. Our polymorphism and divergence
data cover a largely overlapping part of the exome: 89.2% of
Evolutionary Forces Acting on Human Pathways GBE
Genome Biol. Evol. 7(6):1546–1558. doi:10.1093/gbe/evv083 Advance Access publication May 13, 2015 1547
at Biblioteca de la U
niversitat Pompeu Fabra on June 15, 2015
http://gbe.oxfordjournals.org/D
ownloaded from

the exome is fully sequenced in all 42 CG samples, whereas
the human–chimp alignment covers 96.3% of the exome,
resulting in 86.8% of the exome covered by both datasets.
We classified the mutations as either synonymous or
nonsynonymous using ANNOVAR (Wang et al. 2010). As a
measure of evolutionary constraint, the sites were assigned
GERP scores (Cooper et al. 2005) collected from the UCSC
platform (Karolchik et al. 2012), which are estimated with the
GERP++ method (Davydov et al. 2010).
Ensembl to Entrez Gene ID Conversion
As genes in Biosystems gene sets are annotated with Entrez
gene IDs, we mapped the Ensembl gene IDs in GEnsembl to
Entrez IDs by constructing a one-to-one Ensembl–Entrez con-
version table. To do this, we first downloaded from the
National Center for Biotechnology Information (NCBI) Entrez
Gene website (Maglott et al. 2011) a gene list (GEntrez) with
19,759 “current” protein coding human genes (http://www.
ncbi.nlm.nih.gov/gene, accessed on February 7, 2013). Next,
we collected conversion tables (containing one-to-many or
many-many mappings) from three sources: Ensembl (version
64, September 2011), NCBI (ftp://ftp.ncbi.nih.gov/gene/DATA,
accessed on February 7, 2013), and HGNC (http://www.gene-
names.org/biomart/, accessed on September 3, 2012). From
these tables, we only kept rows with genes in GEnsembl and
GEntrez. We then pooled the three tables and counted the
occurrences of each unique Ensembl ID–Entrez ID combina-
tion. For each Ensembl ID, we kept the Ensembl–Entrez match
with the highest count (in case of multiple options, we took
the first one) and repeated this for each Entrez ID. The resulting
table contained 17,474 one-to-one Ensembl to Entrez gene ID
conversions and we used the genes from this table (gene list G)
for our further analyses.
Gene Sets
We downloaded 2,402 human gene sets from the NCBI
Biosystems database (Geer et al. 2010) (http://www.ncbi.
nlm.nih.gov/biosystems, accessed on February 2, 2013). The
Biosystems database is a repository of gene sets collected from
other pathway databases, such as BioCyc (Caspi et al. 2014),
KEGG (Kanehisa and Goto 2000; Kanehisa et al. 2014), The
National Cancer Institute Pathway Interaction Database
(Schaefer et al. 2009), Reactome (Croft et al. 2014), and
Wikipathways (Kelder et al. 2012). A gene set represents a
group of genes involved in biochemical interactions that
underlie a biological process. Examples of gene sets include
metabolic pathways, gene regulatory networks, or signal
transduction pathways.
We excluded genes that could not be mapped to the gene
list G and removed gene sets with less than ten genes.
Furthermore, we identified 95 groups of (nearly) identical
gene sets, namely sets sharing at least 95% of their genes,
and replaced each group by a union gene set (in the text their
name is followed by “*”) consisting of all genes in that group.
The remaining collection of 1,366 gene sets (S) was used for
our analyses. Note that, for ease of reading, we use both the
terms pathway and gene set interchangeably throughout the
main text; strictly only a small proportion (<2%) of the sets in
S are labeled as “complex” rather than “pathway” in the
Biosystems database.
Data Analysis
Test of Evolutionary Similarities between Genesof a Given Gene Set
To assess whether genes in sets tend to share the same evolu-
tionary properties, we tested for significant differences in
gene-level DN/DS (or PN/PS) ratios between gene sets. First,
we estimated the variance component due to differences
among gene sets (s2A) for all 1,366 sets using an analysis of
variance (ANOVA) framework (See supplementary text S1,
Supplementary Material online). We constructed the expected
null distribution of s2A under the hypothesis that there are no
differences between groups, by repeatedly (n = 10,000) recal-
culating s2A after permuting DN/DS and PN/PS ratios among
genes. Next, to assess that the significance was not due to one
or a few outlier gene sets, we repeatedly (N = 10,000)
sampled randomly 100 sets from the list of 1,366 gene sets
and computed s2A on these 100 gene sets only. We built the
expected null distribution by performing the same sample
procedure but permuting DN/DS and PN/PS ratios among
genes for each drawing of 100 genes sets. (See also supple-
mentary fig. S2, Supplementary Material online.) Note that the
fact that genes can occur in multiple gene sets has no impact
on the results, as we keep the gene set definitions fixed when
creating the null distribution. Therefore, the amount of over-
lap between gene sets is the same in both null and observed
distributions.
Note that we excluded 4,446 (2,963) genes that had zero
DS (PS), leading to undefined N/S ratios, when comparing DN/
DS (or PN/PS) ratios between genes (as shown in supplemen-
tary fig. S3, Supplementary Material online, and in the ANOVA
test described above). In the other analyses, we could use all
17,474 genes of our gene list G to compute DN/DS (or PN/PS)
ratios at the gene set level.
Gene and Gene Set Level DN/DS and PN/PS Ratios
To calculate the DN/DS ratio for a gene set, we summed up
separately the nonsynonymous and synonymous fixed muta-
tions found in all genes belonging to a given gene set (sup-
plementary fig. S1, Supplementary Material online) and took
their ratio as
DN
DS
� �set
¼DNset
DSset¼
Xg2 set
DNg
Xg2 set
DSg
ð1Þ
Daub et al. GBE
1548 Genome Biol. Evol. 7(6):1546–1558. doi:10.1093/gbe/evv083 Advance Access publication May 13, 2015
at Biblioteca de la U
niversitat Pompeu Fabra on June 15, 2015
http://gbe.oxfordjournals.org/D
ownloaded from
The PN/PS ratio was calculated in a similar way. In a few cases
where the same mutation occurred in more than one gene of
the same gene set (due to gene overlap or exon sharing,
around 0.1% of the mutations), it was counted only once.
Null Distributions
Gene Set Properties Taken into Account When BuildingEmpirical Null Distributions
We constructed empirical null distributions of DN/DS and PN/
PS ratios (in short “N/S ratios”) by creating a series of random
gene sets and recomputing new statistics on these gene sets.
As genes in gene sets might have specific evolutionary proper-
ties, randomly sampling genes from the gene list G would not
create a representative null distribution. Instead, we took into
account the negative correlation found between the number
of gene sets a given gene belongs to and the gene N/S ratio.
We also took into account the fact that genes belonging to
the same pathway tend to share the same evolutionary regime
(supplementary fig. S2, Supplementary Material online). To
preserve the evolutionary properties of gene sets, we applied
a bootstrap sampling method, where we sampled genes from
unions of gene sets that share a given proportion of their
genes (see next section).
In addition, we also considered the fact that gene sets with
a large “set length” (defined as the total exon length of its
genes) accumulate on average more mutations and for this
reason show a lower variance in N/S rates. We therefore cre-
ated null distributions for different set length categories and
tested each pathway against the appropriate null distribution.
Construction of Empirical Bootstrap Null Distributions
In short, we first created random gene sets of different sizes
(number of genes), where we sampled the size according to
the real size distribution and next computed the set length of
the random sets and assigned them to different set length
bins.
We created a random gene set as follows (supplementary
fig. S4, Supplementary Material online). First, we sampled a
gene set S0 from the collection S of all gene sets. For each
sampled gene set S0, we collected all genes that are the union
of genes in S0 and genes in any set S00 that overlaps with S0, in
the sense that their Jaccard similarity coefficient (defined as
[S0 \ S00]/[S0S
S00]) is larger than 0.25. Next, we drew a gene
set size k from the geometric distribution that approximated
the real gene set size distribution. If the union contained less
than min(250, k) genes, it was discarded, otherwise we ran-
domly sampled k genes (without replacement if k< 250,
otherwise with replacement) from this union to form a
random gene set. We repeated this procedure 75�n
(n = 400,000) times. For each observed and random gene
set, we calculated its set length and distributed the sets
according to their set length over 75 equally sized bins,
explaining the factor 75 in the previous sentence. Note that
we drew k from a geometric distribution that approximated
the real size distribution but allowed for sampling gene sets
smaller than ten (the minimum gene set size) to obtain suffi-
cient sets to fill the smallest set length bins
X~Geomðp ¼ 1=ðmeanðset sizeÞ � 10ÞÞ þ 5 ð2Þ
In very few occasions, the N/S ratio of a (random) gene set
was not defined, because S was zero. In those cases, we
removed the gene set from the null distribution or from the
group of sets that were tested. To still have bins of size n, we
therefore actually created 75�n�1.1 gene sets, removed
the sets that did not have a defined N/S ratio, and took the
first n remaining gene sets for each bin.
Changing the values for parameters such as the similarity
coefficient or the number of bins gives similar test results. See
supplementary text S2 and table S2, Supplementary Material
online, for a detailed description of the parameters used and
the effect of changing their values.
Alternative Null Distributions without Gene Set Properties
To investigate the effect of not taking into account some
or all the properties of gene sets when creating a null dis-
tribution, we used several alternative sampling schemes con-
sisting of 1) randomly sampling from the whole gene list G;
2) sampling from all genes that are part of at least one gene
set; and 3) sampling genes with a probability proportional to
the number of gene set a gene belongs to. Similar to the
empirical bootstrap null distribution described above, we
corrected in all cases for gene set length, by creating null
distributions for specific set lengths and testing a pathway
against the corresponding null distribution. Results based on
these alternative null distributions are shown in supplemen-
tary figure S5, Supplementary Material online.
Tests of Selection
A New Test of Polygenic Selection (2DNS Test)
We developed a new test for polygenic selection (named
2DNS), which can be regarded as a decomposition of the
constitutive elements of a MDK test, DN/DS, and PN/PS. Our
2DNS test aims at detecting gene sets that are outliers in the
two dimensional DN/DS� PN/PS plane relative to an empirical
null distribution of joint DN/DS and PN/PS ratios. The P value of
a gene set is estimated from the joint N/S density on a two
dimensional grid. We first used the R function kde2d (taking
bandwidth = 0.15, maximum grid size = 10�10 and grid
point distance = 0.05) to estimate the probability density of
each of the grid points. We then bilinearly interpolated the
N/S coordinates of the observed gene set on the grid of the
null distribution and the corresponding density with the R
function interp.surface. The P value of the gene set is finally
Evolutionary Forces Acting on Human Pathways GBE
Genome Biol. Evol. 7(6):1546–1558. doi:10.1093/gbe/evv083 Advance Access publication May 13, 2015 1549
at Biblioteca de la U
niversitat Pompeu Fabra on June 15, 2015
http://gbe.oxfordjournals.org/D
ownloaded from
calculated by integrating over the densities of grid points that
have the same or lower density as the density of the observed
gene set (supplementary fig. S6, Supplementary Material
online). Note that because we use a kernel density estimation,
P values much smaller than the inverse of number of elements
in the null distribution can be obtained. See also supplemen-
tary text S2 and table S2, Supplementary Material online, for a
description of parameters used in the kde2d function and how
they affect the results when their value is changed.
Correction for Multiple Tests
We corrected the P values for multiple testing by calculating
the q value of each gene set using the function qvalue from
the R package qvalue with default settings. The q value of a
test measures the minimum proportion of false positives (the
false discovery rate, FDR) when that test is called significant
(Storey and Tibshirani 2003). We retained those gene sets
with a q value below 0.2, meaning that we expect 20% of
our final candidates to be false positives.
Jackknife Approach to Detect Pathways with OutlierGenes
We used a jackknife approach to examine the effect of indi-
vidual genes of a given gene set on our results. For each
significant pathway, we repeatedly removed one gene and
recalculated the DN/DS and PN/PS values. These jackknife
scores are depicted in figures 1B–H and 2B–E. Pathways
where one of the jackknife scores resulted in a much higher
P value were probably scoring significant because one gene
has extreme values and such pathways were not considered as
candidate gene sets for polygenic selection.
Classical MDK Test at Gene Set Level
The classical MDK test for positive selection tests at the gene
level whether the DN/DS ratio is significantly larger than the
PN/PS ratio. We extended this procedure to the gene set level
by creating for each gene set a 2�2 contingency table con-
taining its DNset, DSset, PNset, and PSset counts as defined in
equation (1) and testing whether the odds ratio of the table
(OR = (DS� PN)/(DN� PS) is significantly deviating from
(smaller than) one with a two-sided (one-sided) Fisher’s
exact test, using the R function fisher.test.
Comparing Gene Set Level Alpha Values with anEmpirical Null Distribution
We calculated a gene set analog of a for each set, here
defined as
a ¼ 1�
Xg2 set
DSg �X
g2 set
PNg
Xg2 set
PSg �X
g2 set
DNg
ð3Þ
and compared it to the a values of an empirical null distribu-
tion with corresponding set length.
Results
Genes in Biological Pathways Are Conserved and ShareEvolutionary Properties
We first investigated whether genes in pathways have differ-
ent evolutionary properties than genes that are not part of a
pathway. We downloaded a collection of 1,366 pathways
from the Biosystems database (Geer et al. 2010) and con-
trasted the genetic diversity of genes that occur in one or
more gene sets with genes that are not part of any gene
set. We used SNPs inferred from the Complete Genomics
(CG) collection of 42 human individuals from three African
and five non-African populations (Drmanac et al. 2010), as
well as the fixed differences between humans and chimpan-
zees that were assigned to the human branch. Interestingly,
we find that the nonsynonymous to synonymous ratios are
lower for genes in gene sets than for genes that are not part of
a gene set, both for mutations within human populations (PN/
PS) and for fixed mutations on the human lineage (DN/DS).
This suggests that genes belonging to gene sets are globally
under more severe evolutionary constraints (table 1).
In addition, we find that genes that are part of many path-
ways (ten or more) are even more constrained than genes
occurring in a single or a few pathways, as they show signifi-
cantly lower DN/DS and PN/PS ratios (P< 1e-6, Mann–
Whitney test, supplementary fig. S3, Supplementary
Material online). Overall, there is a small but significant nega-
tive correlation between the DN/DS ratio of a gene and the
number of pathways it belongs to (Pearson’s r = �0.09,
P<2.2e-16). These results make sense, since genes that are
part of many pathways often have an essential role or have
several functions, suggesting a potential pleiotropic effect of
mutations in these genes, and thus a higher chance for them
to be deleterious. These findings are also consistent with ear-
lier reports showing that highly connected proteins are usually
more essential (Jeong et al. 2001; Wuchty 2004) or evolving at
a slower rate (Fraser et al. 2002; Saeed and Deane 2006).
These results further imply that tests of selection bearing on
single genes should be performed separately for genes not
part of gene sets or that their lower levels of evolutionary
constraints be taken into account in future testing procedures
to minimize false positives.
Interestingly, we observe that gene-specific DN/DS and PN/
PS ratios are more similar within than between gene sets and
that the variance in N/S ratios due to differences between
gene sets represents around 5% (supplementary fig. S2,
Supplementary Material online) of the total variance in N/S
ratios (nonparametric ANOVA test, P value< 1e-4; see
Materials and Methods and supplementary text S1,
Supplementary Material online). This variance component
Daub et al. GBE
1550 Genome Biol. Evol. 7(6):1546–1558. doi:10.1093/gbe/evv083 Advance Access publication May 13, 2015
at Biblioteca de la U
niversitat Pompeu Fabra on June 15, 2015
http://gbe.oxfordjournals.org/D
ownloaded from
also represents the average correlation between N/S ratios of
two genes belonging to the same gene set relative to two
genes from different gene sets. This positive correlation of
about 5% suggests that genes in a pathway share evolution-
ary properties and have a correlated evolutionary response
(i.e., most are rather conserved or most are under weak selec-
tion). These results are in keeping with the observation of
Fraser et al. (2002) that interacting proteins have similar
evolutionary rates, which the authors explained by the occur-
rence of compensatory changes in interacting proteins.
Measuring and Testing Selective Constraints at thePathway Level
We are interested here in finding a way to determine the
extent and the type of selection acting in gene sets.
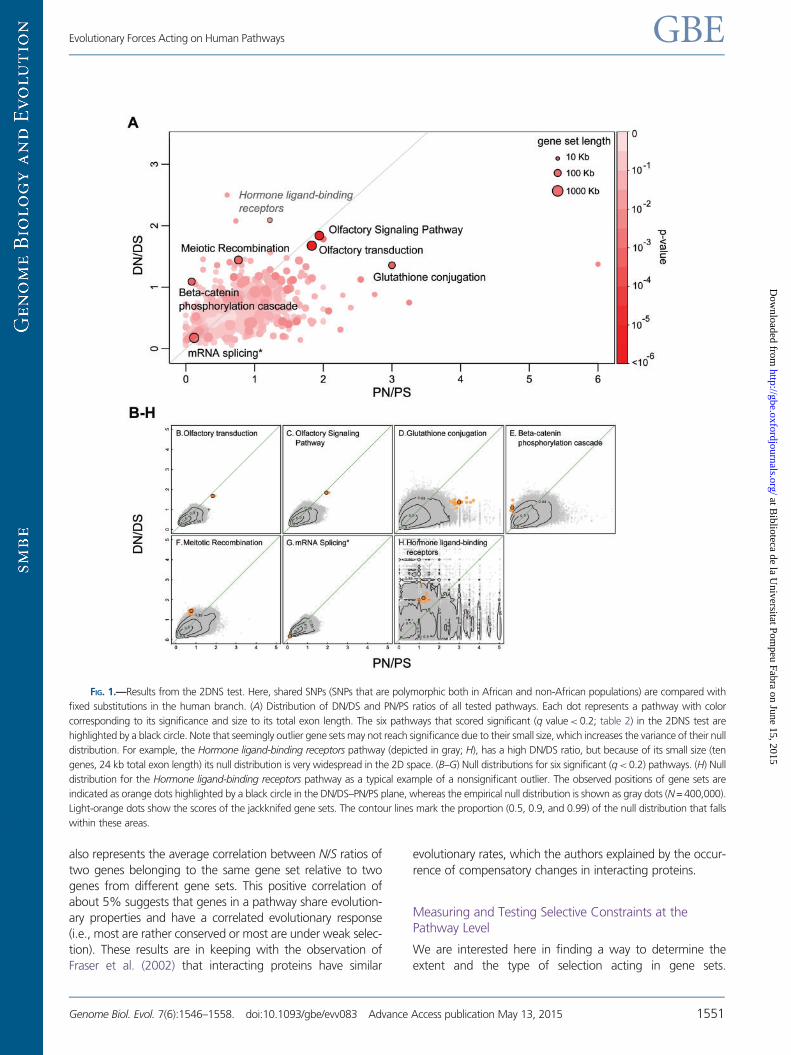
FIG. 1.—Results from the 2DNS test. Here, shared SNPs (SNPs that are polymorphic both in African and non-African populations) are compared with
fixed substitutions in the human branch. (A) Distribution of DN/DS and PN/PS ratios of all tested pathways. Each dot represents a pathway with color
corresponding to its significance and size to its total exon length. The six pathways that scored significant (q value< 0.2; table 2) in the 2DNS test are
highlighted by a black circle. Note that seemingly outlier gene sets may not reach significance due to their small size, which increases the variance of their null
distribution. For example, the Hormone ligand-binding receptors pathway (depicted in gray; H), has a high DN/DS ratio, but because of its small size (ten
genes, 24 kb total exon length) its null distribution is very widespread in the 2D space. (B–G) Null distributions for six significant (q<0.2) pathways. (H) Null
distribution for the Hormone ligand-binding receptors pathway as a typical example of a nonsignificant outlier. The observed positions of gene sets are
indicated as orange dots highlighted by a black circle in the DN/DS–PN/PS plane, whereas the empirical null distribution is shown as gray dots (N = 400,000).
Light-orange dots show the scores of the jackknifed gene sets. The contour lines mark the proportion (0.5, 0.9, and 0.99) of the null distribution that falls
within these areas.
Evolutionary Forces Acting on Human Pathways GBE
Genome Biol. Evol. 7(6):1546–1558. doi:10.1093/gbe/evv083 Advance Access publication May 13, 2015 1551
at Biblioteca de la U
niversitat Pompeu Fabra on June 15, 2015
http://gbe.oxfordjournals.org/D
ownloaded from

Conventional MDK tests such as those based on the a statistic
are usually used to detect only positive selection (but note that
a negative a is an indicator of purifying selection or of slightly
deleterious mutations segregating in a population).
Furthermore, a is based on a ratio of ratios, and a given
high a value, taken to be indicative of positive selection, can
be obtained with a high DN/DS or a low PN/PS, which can be
due to different selective forces, such as recent strong purify-
ing selection. To address these issues, we propose here a new
test of polygenic selection that is more informative about the
respective importance of DN/DS and PN/PS ratios and that
detects outlier pathways for different types of selection. Our
aim with this test, referred to hereafter as the 2DNS test, is to
find gene sets that have evolved differently than other gene
sets, in that they have unusual DN/DS or PN/PS combinations
compared with other sets. First, we sum up the PN, PS, DN,
and DS counts over all genes in a gene set to obtain gene set
level DN/DS and PN/PS ratios (as shown in eq. [1]). Second, we
create genome-wide empirical null distributions of random
gene sets that take into account gene set size, as well as
potentially shared evolutionary properties of gene sets. Note
that the use of these null distributions also allows us to control
for the past demographic history shared among all gene sets
and for the overall selective constraint acting on coding
regions. Third, the joint probability density distribution of
DN/DS versus PN/PS ratios is estimated on a 2D grid directly
from the empirical null distribution. The P value for each gene
set is finally obtained by integrating the joint density of all grid
points that have a similar or lower density than the gene set of
interest defined by its “N/S coordinates” (see supplementary
fig. S6, Supplementary Material online).
We compared the distribution of gene set P values with a
uniform distribution on a QQ plot to confirm that our testing
procedure was well behaved (supplementary fig. S5D,
Supplementary Material online). The fact that the observed
P values are close to the expected uniform distribution sug-
gests that our null distribution correctly represents the proper-
ties of the gene sets. Note that naively constructed null
distributions that ignored some or all of the evolutionary
properties of gene sets led to strongly underestimated
P values, which would have translated in a large number of
false-positive gene sets (see supplementary S5A–C,
Supplementary Material online).
We applied the 2DNS test to the comparison between fixed
mutations on the human branch and polymorphisms that are
found both in African and non-African populations. These
“shared” polymorphisms come from relatively ancient muta-
tions that predated the migration out of Africa, and we thus
expect that slightly deleterious mutations, which can distort
selective signals (Eyre-Walker 2002; Fay et al. 2002; Parsch
et al. 2009), have been purged from this group. Indeed, the
distributions of the GERP score, a measure of evolutionary
constraint (Cooper et al. 2005), for fixed mutations and
shared polymorphisms are very similar, confirming that the
latter are not enriched with deleterious mutations (supple-
mentary fig. S7, Supplementary Material online).
The 2DNS test identifies six gene sets with a q value< 0.2
(fig. 1 and table 2). These gene sets are located well outside
the bulk of the 2D null distributions in different directions
(fig. 1B–G), suggesting that they are subject to different
forms of selection than the majority of sets that are under
slightly purifying selection. For each of the significant
Table 1
Counts and Ratios of Nonsynonymous (N) and Synonymous (S) Fixed Mutations and Polymorphisms in the Human
Lineage
Mutation Group N S N/S
Divergence (D)
All genic substitutions 32,332 41,596 0.78
Substitutions in genes belonging to a gene set 13,802 20,811 0.66
Substitutions in genes not belonging to a gene set 18,530 20,785 0.89
Polymorphism (P)
All genic SNPs 63,812 57,672 1.11
Private African SNPs 27,413 24,953 1.10
Private non-African SNPs 19,965 13,990 1.43
Shared SNPs 16,434 18,729 0.88
SNPs in genes belonging to a gene set 28,876 28,704 1.01
Private African SNPs 12,309 12,377 0.99
Private non-African SNPs 9,263 6,911 1.34
Shared SNPs 7,304 9,416 0.78
SNPs in genes not belonging to a gene set 34,936 28,968 1.21
Private African SNPs 15,104 12,576 1.20
Private non-African SNPs 10,702 7,079 1.51
Shared SNPs 9,130 9,313 0.98
Daub et al. GBE
1552 Genome Biol. Evol. 7(6):1546–1558. doi:10.1093/gbe/evv083 Advance Access publication May 13, 2015
at Biblioteca de la U
niversitat Pompeu Fabra on June 15, 2015
http://gbe.oxfordjournals.org/D
ownloaded from
pathways, we repeatedly recalculated the DN/DS and PN/PS
values leaving one gene out in turn (“jackknifing”) to examine
to which extent the score depends on single genes (fig. 1B–H).
Significant Pathways Have Been Influenced by DifferentTypes of Selection
The two highest scoring sets, Olfactory transduction and
Olfactory Signaling Pathway, have both high DN/DS and
high PN/PS ratios (fig. 1B and C), in line with their known
relaxed constraints in primates, in particular in humans
(Gilad et al. 2005; Somel et al. 2013; Hughes et al. 2014).
This relaxation is often explained by the fact that vision has
become more important than smell in primates (Gilad et al.
2004). Note that having both DN/DS and PN/PS ratios around
two suggest that nonsynonymous mutations are neutral in
these genes, since most mutations on the first two codon
bases result in nonsynonymous changes. This result is consis-
tent with the observation that many olfactory genes have
become pseudogenes (Go and Niimura 2008).
The third high scoring gene set is Glutathione conjugation.
This pathway contains many glutathione S-transferases
(GSTs), which are involved in the protection of cells against
oxidative stress and toxic foreign compounds (Hayes and
Strange 2000). The jackknife scores of this pathway show
that PN/PS ratios are typically high for all genes in this set,
with some variation, whereas their DN/DS ratios is very
stable and maintained at a moderately high level (fig. 1D).
The fact that this pathway has an unusually high PN/PS ratio
for shared SNPs could be due to some form of balancing
selection. It suggests that the high diversity in GSTs is bene-
ficial, possibly serving as a population wide protection against
a large range of toxic factors in the environment. Indeed, GST
polymorphisms have been related to drug sensitivity and are
associated with disease susceptibility (Hayes and Strange
2000).
The next highest scoring pathway is the Beta-catenin phos-
phorylation cascade pathway. Beta-catenin is involved in both
cell adhesion and Wnt signaling (signal transduction). It also
plays an important role during development and it can act as
oncogene (Bienz 2005). This pathway is a good example of
having an unusual combination of N/S coordinates, with PN/
PS being much lower than DN/DS, while the separate ratios
are not extreme outliers by themselves. This pattern is compa-
tible with a recent strong purifying selection in humans result-
ing in very low PN/PS values (fig. 1E), possibly after an initial
adaptive event. Indeed, this is confirmed by the jackknife
scores that show a constantly low PN/PS score across all
genes. Two genes appear as outliers in opposite directions:
The APC gene (a gene involved in tumor suppression and in
synapse assembly, Rosenberg et al. 2008) plays a large role in
the high DN/DS ratio of this gene set, whereas the AXIN gene
has the opposite effect. When one or the other is removed,
the DN/DS ratio changes strongly, but when both are
removed, the DN/DS ratio (1.2) is close to the original value
(1.25). We therefore posit that the signal shown by this path-
way is indeed polygenic and not driven by the effect of a single
gene.
The Meiotic Recombination pathway is another candidate
for being affected by positive selection, with a relatively high
DN/DS ratio and a moderate PN/PS ratio (fig. 1F). Many genes
in this pathway code for histones, but the high DN/DS ratio is
caused by other genes, such as BRCA1, MSH4, TOP3A, and
PRDM9 (supplementary table S3, Supplementary Material
online), some of which were recently reported to be under
positive selection (Lou et al. 2014; Schwartz et al. 2014).
Although meiotic recombination is an essential and therefore
conserved process in mammals, some of the underlying
genetic factors (gene variants, recombination rate, and hot-
spots) vary among species (Baudat et al. 2013). The fact that
PRDM9, one of the key players meiotic recombination, has
been related with interspecific intercompatibilities (Oliver
et al. 2009) suggests that positive selection in the Meiotic
Recombination pathway could have been involved in the
emergence of barriers to reproduction with related species.
The mRNA Splicing pathway is a good candidate for being
under extremely strong purifying selection as it shows parti-
cularly low values both for DN/DS and for PN/PS (fig. 1G). This
pathway is an extreme example of a “housekeeping” path-
way, with genes expressed in all tissues. Earlier studies have
indeed reported that housekeeping genes evolve more slowly
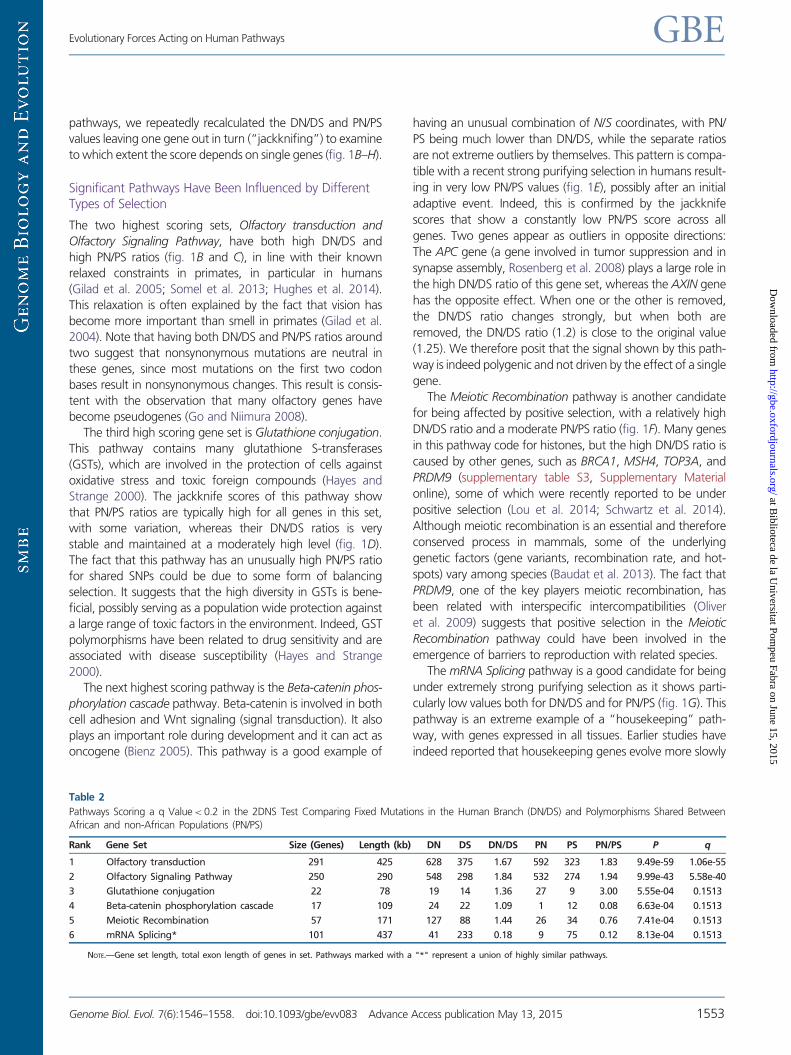
Table 2
Pathways Scoring a q Value< 0.2 in the 2DNS Test Comparing Fixed Mutations in the Human Branch (DN/DS) and Polymorphisms Shared Between
African and non-African Populations (PN/PS)
Rank Gene Set Size (Genes) Length (kb) DN DS DN/DS PN PS PN/PS P q
1 Olfactory transduction 291 425 628 375 1.67 592 323 1.83 9.49e-59 1.06e-55
2 Olfactory Signaling Pathway 250 290 548 298 1.84 532 274 1.94 9.99e-43 5.58e-40
3 Glutathione conjugation 22 78 19 14 1.36 27 9 3.00 5.55e-04 0.1513
4 Beta-catenin phosphorylation cascade 17 109 24 22 1.09 1 12 0.08 6.63e-04 0.1513
5 Meiotic Recombination 57 171 127 88 1.44 26 34 0.76 7.41e-04 0.1513
6 mRNA Splicing* 101 437 41 233 0.18 9 75 0.12 8.13e-04 0.1513
NOTE.—Gene set length, total exon length of genes in set. Pathways marked with a "*" represent a union of highly similar pathways.
Evolutionary Forces Acting on Human Pathways GBE
Genome Biol. Evol. 7(6):1546–1558. doi:10.1093/gbe/evv083 Advance Access publication May 13, 2015 1553
at Biblioteca de la U
niversitat Pompeu Fabra on June 15, 2015
http://gbe.oxfordjournals.org/D
ownloaded from
than tissue specific genes and that they are under stronger
selective constraints (e.g., Zhang and Li 2004).
Impact of Differential Demography in African andNon-African Populations
Previous studies have shown that populations outside Africa
have a higher proportion of deleterious mutations than those
in Africa (Lohmueller et al. 2008; Subramanian 2012), com-
patible with the buildup of a mutation load since the expan-
sion of modern humans out-of Africa (Peischl et al. 2013). We
examined PN/PS ratios for SNPs that were either shared
between Africans and non-Africans or private to Africans or
private to non-Africans. In line with previous results
(Lohmueller et al. 2008; Peischl et al. 2013), we find that
the PN/PS ratio is larger for non-African-specific SNPs than
for SNPs private to Africans. In addition, shared SNPs show
the lowest PN/PS ratio and this for genes belonging or not to
gene sets (table 1). These results are consistent with the view
that bottlenecks and range expansions of non-African popu-
lations have increased their PN/PS ratio relative to Africans
(Peischl et al. 2013) and that purifying selection had more
time to act on shared SNPs than on population specific
SNPs, thus contributing to the elimination of a proportionally
larger number of deleterious nonsynonymous mutations (see
also supplementary fig. S7, Supplementary Material online).
To study the effect of potentially different demographic
histories in Africans and non-Africans at the gene set level,
we used our 2DNS test to compare the PN/PS ratios of private
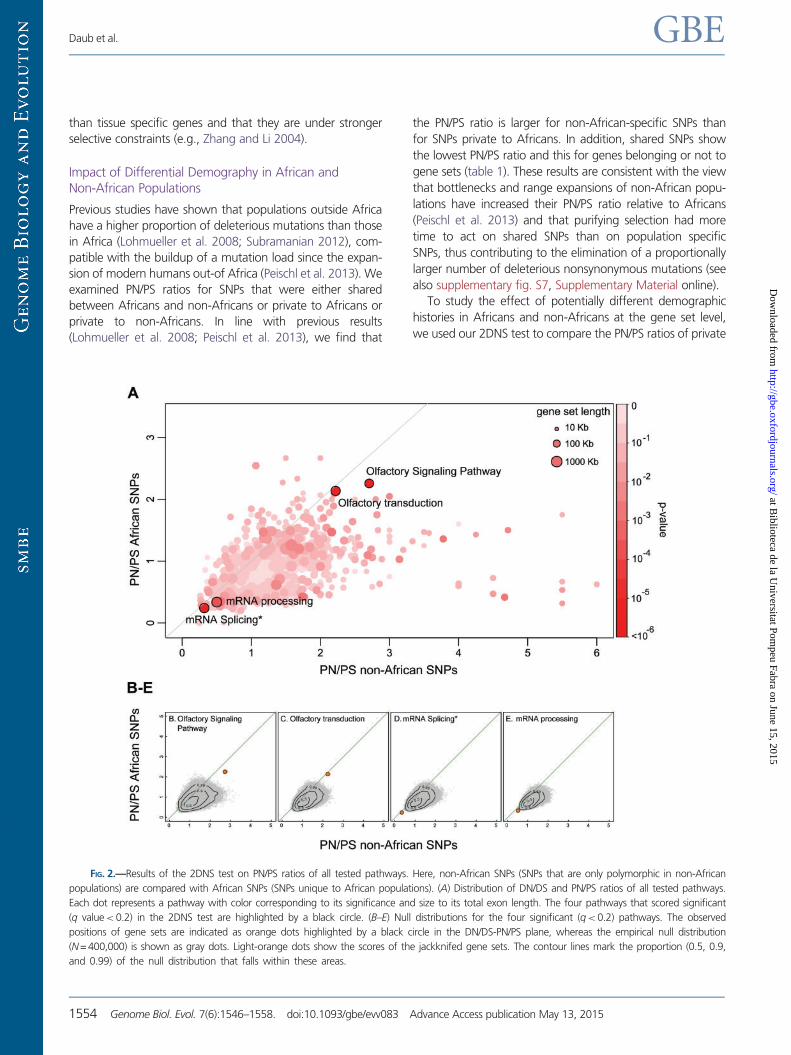
FIG. 2.—Results of the 2DNS test on PN/PS ratios of all tested pathways. Here, non-African SNPs (SNPs that are only polymorphic in non-African
populations) are compared with African SNPs (SNPs unique to African populations). (A) Distribution of DN/DS and PN/PS ratios of all tested pathways.
Each dot represents a pathway with color corresponding to its significance and size to its total exon length. The four pathways that scored significant
(q value< 0.2) in the 2DNS test are highlighted by a black circle. (B–E) Null distributions for the four significant (q<0.2) pathways. The observed
positions of gene sets are indicated as orange dots highlighted by a black circle in the DN/DS-PN/PS plane, whereas the empirical null distribution
(N = 400,000) is shown as gray dots. Light-orange dots show the scores of the jackknifed gene sets. The contour lines mark the proportion (0.5, 0.9,
and 0.99) of the null distribution that falls within these areas.
Daub et al. GBE
1554 Genome Biol. Evol. 7(6):1546–1558. doi:10.1093/gbe/evv083 Advance Access publication May 13, 2015
at Biblioteca de la U
niversitat Pompeu Fabra on June 15, 2015
http://gbe.oxfordjournals.org/D
ownloaded from
non-African SNPs and private African SNPs. As expected, PN/
PS ratios are overall clearly larger for non-African SNPs than for
African SNPs at the gene sets level (fig. 2, sign test: P<2.2e-
16). In addition to showing the effect of past demography on
the whole genome, our procedure reveals four significant out-
lier pathways (supplementary table S4, Supplementary
Material online), which all have unusual N/S combinations
given the genomic background. These pathways are related
to olfactory signaling and mRNA processing and they are
examples of relaxation and purifying selection, as found in
the previous test where we contrasted fixed mutations against
shared SNPs.
Effect of Increasing Sample Size: 2DNS Applied on the1000 Genomes Dataset
Increasing the number of sampled individuals will not only
lead to a higher number of detected SNPs but also to an
enrichment in low frequency variants that are potentially
under stronger purifying selection. To study this effect, we
repeated our testing procedure on another dataset, namely
SNPs from the 1000 Genomes project phase 3 (1000G set),
using data collected from 1,594 individuals. To properly com-
pare the results, we restricted our analyses to the part of the
exome that is covered by both the Complete Genomics and
the 1000 Genomes projects. First, we applied the 2DNS test
on both SNP sets to compare N/S ratios between fixed muta-
tions in the human lineage and SNPs shared between African
and non-African populations. Although there were twice as
many shared SNPs in the 1000G set as in the CG set (supple-
mentary table S5, Supplementary Material online), the top
scoring gene sets are very similar (supplementary table S6,
Supplementary Material online). Indeed, the four significant
gene sets in the CG dataset are the top four of five significant
gene sets in the 1000G results. Next, we applied the test on
both datasets to compare N/S ratios between SNPs private to
African and non-African populations. Although three out of
the four significant sets in the CG results are also significant in
the 1000G test, the latter test produces twice as many sig-
nificant sets in total (supplementary table S7 and fig. S8,
Supplementary Material online). This larger number of signifi-
cant sets seems both due to the much larger number of SNPs
in the 1000G set (five times more African SNPs and ten times
more non-African SNPs, supplementary table S5,
Supplementary Material online) and to the enrichment of
slightly deleterious nonsynonymous mutations among rare
variants that can inflate the PN/PS ratio. Two high scoring
pathways are particularly interesting, because the PN/PS
ratio of their African SNPs is larger than the PN/PS ratio of
their non-African SNPs. The Signaling by constitutively active
EGFR pathway has a moderate African PN/PS ratio and lower
non-African PN/PS ratio, suggesting recent adaptation in
Africa or purifying selection outside Africa. The Linoleic acid
metabolism pathway has a high PN/PS ratio in both African
and non-African SNPs which rather points to a recent relaxa-
tion of purifying selection in African populations.
Comparison between 2DNS and Classical MDK Tests
To illustrate the difference between our new approach and
classical MDK tests, we performed an MDK test at the gene
set level. In other words, we tested whether some gene sets
presented a DN/DS ratio larger than their PN/PS ratio. We
inferred the significance of the results in two ways: With a
conventional Fisher’s exact test on the 2� 2 contingency table
of gene set level DN, DS, PN and PS counts and by comparing
the gene set a value computed according to equation (3) (see
Materials and Methods) to an empirical null distribution built
along the same principles as for the 2DNS test.
With a two-sided Fisher’s exact test (testing for deviation
from DN/DS = PN/PS) we find 68 pathways scoring significant
(q value< 20%). Most of them have a PN/PS>DN/DS, which
would point toward purifying or balancing selection rather
than to positive selection (supplementary table S8,
Supplementary Material online). Interestingly, nine out of
the ten highest scoring significant sets are directly related to
immunity or response to pathogens. There are only four sig-
nificant pathways with DN/DS> PN/PS, indicative of positive
selection, namely IL-2 Signaling Pathway, IL2-mediated signal-
ing events, Beta-catenin phosphorylation cascade, and
Pentose phosphate pathway (Pentose phosphate cycle), all
ranked in the lower half of the list. However, applying a
one-sided Fisher’s exact test, where we explicitly try to
detect cases where DN/DS> PN/PS, produces no significant
pathways at FDR level 20% (supplementary table S9,
Supplementary Material online). We note, however, that a
QQ plot analysis of the P values of both Fisher’s exact tests
shows clear systematic departures from expectations. Indeed,
the P values are under- and overestimated for the two sided
and for the one-sided Fisher exact test, respectively (supple-
mentary fig. S9, Supplementary Material online), implying that
the two-sided test is too liberal, and the one-sided test is too
conservative.
The comparison of gene set a values to an empirical null
distribution results in several high scoring pathways, but none
of them are significant after correcting for multiple tests (sup-
plementary table S10, Supplementary Material online), sug-
gesting that a test based on a values is less powerful than our
2DNS test. Moreover, we notice that most of the top-ranking
pathways (shown as dark red points on supplementary fig.
S10, Supplementary Material online) have a high a value asso-
ciated with a low DN/DS and an even lower PN/PS. This sug-
gests that positive selection is more easily detected in (or is
more likely to act on) slowly evolving genes.
Discussion
Our 2DNS test has several advantages over classical methods
such as the MDK test. First, we focus on the detection of
Evolutionary Forces Acting on Human Pathways GBE
Genome Biol. Evol. 7(6):1546–1558. doi:10.1093/gbe/evv083 Advance Access publication May 13, 2015 1555
at Biblioteca de la U
niversitat Pompeu Fabra on June 15, 2015
http://gbe.oxfordjournals.org/D
ownloaded from
selection in functional groups of genes instead of single genes.
Not only is a biological pathway or gene network a more
natural unit to test for selection, but by pooling genes belong-
ing to the same gene set, we avoid the exclusion of many
genes that have undefined N/S ratios. Second, our test allows
one to detect different selective regimes, whereas classical
tests are often designed to evidence only one type of selec-
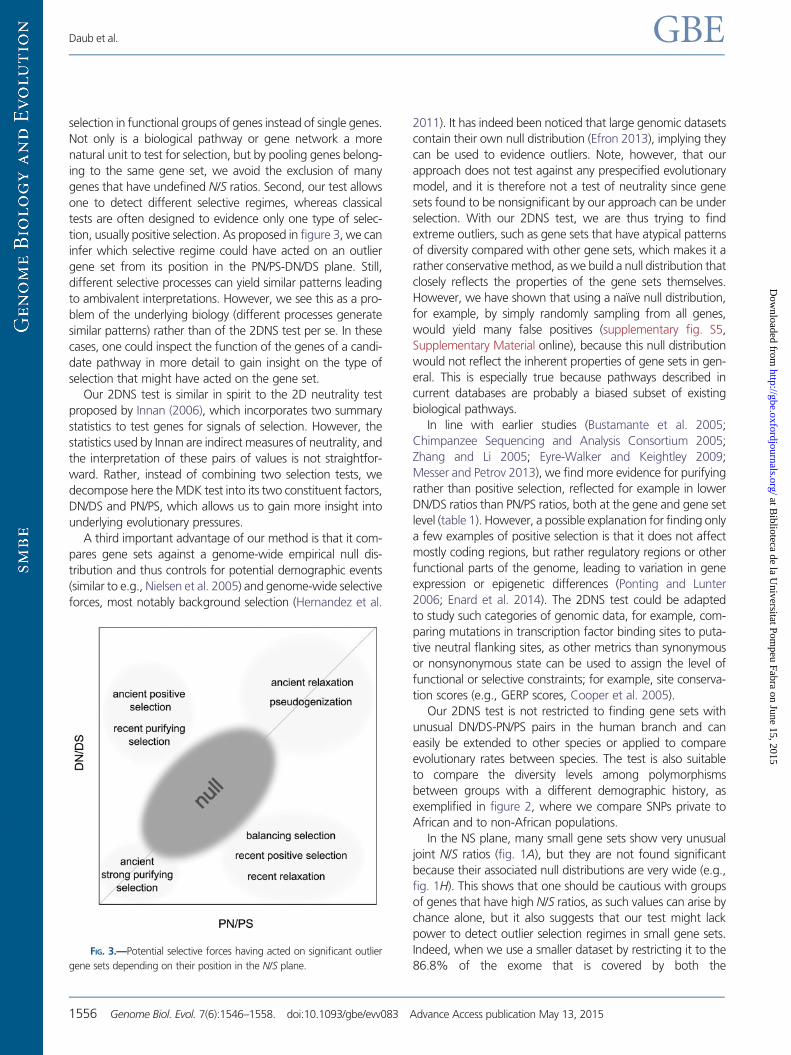
tion, usually positive selection. As proposed in figure 3, we can
infer which selective regime could have acted on an outlier
gene set from its position in the PN/PS-DN/DS plane. Still,
different selective processes can yield similar patterns leading
to ambivalent interpretations. However, we see this as a pro-
blem of the underlying biology (different processes generate
similar patterns) rather than of the 2DNS test per se. In these
cases, one could inspect the function of the genes of a candi-
date pathway in more detail to gain insight on the type of
selection that might have acted on the gene set.
Our 2DNS test is similar in spirit to the 2D neutrality test
proposed by Innan (2006), which incorporates two summary
statistics to test genes for signals of selection. However, the
statistics used by Innan are indirect measures of neutrality, and
the interpretation of these pairs of values is not straightfor-
ward. Rather, instead of combining two selection tests, we
decompose here the MDK test into its two constituent factors,
DN/DS and PN/PS, which allows us to gain more insight into
underlying evolutionary pressures.
A third important advantage of our method is that it com-
pares gene sets against a genome-wide empirical null dis-
tribution and thus controls for potential demographic events
(similar to e.g., Nielsen et al. 2005) and genome-wide selective
forces, most notably background selection (Hernandez et al.
2011). It has indeed been noticed that large genomic datasets
contain their own null distribution (Efron 2013), implying they
can be used to evidence outliers. Note, however, that our
approach does not test against any prespecified evolutionary
model, and it is therefore not a test of neutrality since gene
sets found to be nonsignificant by our approach can be under
selection. With our 2DNS test, we are thus trying to find
extreme outliers, such as gene sets that have atypical patterns
of diversity compared with other gene sets, which makes it a
rather conservative method, as we build a null distribution that
closely reflects the properties of the gene sets themselves.
However, we have shown that using a naı̈ve null distribution,
for example, by simply randomly sampling from all genes,
would yield many false positives (supplementary fig. S5,
Supplementary Material online), because this null distribution
would not reflect the inherent properties of gene sets in gen-
eral. This is especially true because pathways described in
current databases are probably a biased subset of existing
biological pathways.
In line with earlier studies (Bustamante et al. 2005;
Chimpanzee Sequencing and Analysis Consortium 2005;
Zhang and Li 2005; Eyre-Walker and Keightley 2009;
Messer and Petrov 2013), we find more evidence for purifying
rather than positive selection, reflected for example in lower
DN/DS ratios than PN/PS ratios, both at the gene and gene set
level (table 1). However, a possible explanation for finding only
a few examples of positive selection is that it does not affect
mostly coding regions, but rather regulatory regions or other
functional parts of the genome, leading to variation in gene
expression or epigenetic differences (Ponting and Lunter
2006; Enard et al. 2014). The 2DNS test could be adapted
to study such categories of genomic data, for example, com-
paring mutations in transcription factor binding sites to puta-
tive neutral flanking sites, as other metrics than synonymous
or nonsynonymous state can be used to assign the level of
functional or selective constraints; for example, site conserva-
tion scores (e.g., GERP scores, Cooper et al. 2005).
Our 2DNS test is not restricted to finding gene sets with
unusual DN/DS-PN/PS pairs in the human branch and can
easily be extended to other species or applied to compare
evolutionary rates between species. The test is also suitable
to compare the diversity levels among polymorphisms
between groups with a different demographic history, as
exemplified in figure 2, where we compare SNPs private to
African and to non-African populations.
In the NS plane, many small gene sets show very unusual
joint N/S ratios (fig. 1A), but they are not found significant
because their associated null distributions are very wide (e.g.,
fig. 1H). This shows that one should be cautious with groups
of genes that have high N/S ratios, as such values can arise by
chance alone, but it also suggests that our test might lack
power to detect outlier selection regimes in small gene sets.
Indeed, when we use a smaller dataset by restricting it to the
86.8% of the exome that is covered by both theFIG. 3.—Potential selective forces having acted on significant outlier
gene sets depending on their position in the N/S plane.
Daub et al. GBE
1556 Genome Biol. Evol. 7(6):1546–1558. doi:10.1093/gbe/evv083 Advance Access publication May 13, 2015
at Biblioteca de la U
niversitat Pompeu Fabra on June 15, 2015
http://gbe.oxfordjournals.org/D
ownloaded from
polymorphism and divergence datasets (see also Mapping and
annotation of mutations in the Materials and Methods sec-
tion), we get similar top scoring gene sets (supplementary
table S11, Supplementary Material online), but they have a
lower significance, probably due to the loss of data (20% less
SNPs and 10% less fixed mutations).
In addition, it is likely that selection has not affected whole
pathways but only some subsets and that this limited signal
might be difficult to detect at the whole pathway level.
Alternatively, different selective forces might also act on dis-
tinct subsets of genes, and their signal could cancel each
other’s out when examining whole pathways, leading to a
reduced power of our approach. Note that this problem
also occurs when testing single genes, since different exons,
introns, or regulatory regions can be affected by different
selective forces. It would thus be useful to extend our test to
detect selection in pathway submodules, which should be the
object of future work.
Our previous attempt at detecting selection at the gene set
level within human populations revealed several pathways
involved in immune response to be potentially under positive
selection (Daub et al. 2013). Interestingly, our present study
does not show strong signals of positive selection but rather of
overall purifying selection. These differences can be due to
several reasons. First, our previous study used a statistic (hier-
archical FST) detecting differences between continental groups
that should have emerged recently, whereas our 2DNS statis-
tics are more sensitive to older events. We contrast old muta-
tions that have occurred on the human lineage to
polymorphisms shared between Africans and non-Africans
(fig. 1) and which should thus have occurred in the ancestral
human populations prior to the exit out of Africa. Second, our
current testing procedure is more stringent than that used
previously. We are indeed looking for outliers in a null distri-
bution that takes into account selective constraints acting on
pathways and past demographic effects, whereas we pre-
viously based our test on a null model of human evolution
only taking into account global levels of differentiation
between human populations. Third, we focused here strictly
on coding regions, whereas we also considered neighboring
regions in our previous study, thus including regulatory and
enhancer regions that have been recently shown to bear the
strongest signals of positive selection in humans (Enard et al.
2014). These differences in methodology and in the investi-
gated time scales could thus explain the apparent discrepan-
cies found between these two studies. This also indicates that
different forces have acted on pathways at different periods of
human evolution.
Supplementary Material
Supplementary text S1 and S2, tables S1–S11, and figures
S1–S10 are available at Genome Biology and Evolution
online (http://www.gbe.oxfordjournals.org/).
Acknowledgments
The authors thank Adam Eyre-Walker and three anonymous
reviewers for their critical comments on previous versions of
the manuscript. This work was supported by a Swiss National
Science Foundation grant (No. PDFMP3-130309) to L.E. and
M.R.R.
Literature CitedAbecasis GR, et al. 2012. An integrated map of genetic variation from
1,092 human genomes. Nature 491:56–65.
Baudat F, Imai Y, de Massy B. 2013. Meiotic recombination in mammals:
localization and regulation. Nat Rev Genet. 14:794–806.
Berg JJ, Coop G. 2014. A population genetic signal of polygenic adapta-
tion. PLoS Genet. 10:e1004412.
Bienz M. 2005. beta-catenin: a pivot between cell adhesion and Wnt
signalling. Curr Biol. 15:R64–R67.
Bustamante CD, et al. 2005. Natural selection on protein-coding genes in
the human genome. Nature 437:1153–1157.
Caspi R, et al. 2014. The MetaCyc database of metabolic pathways and
enzymes and the BioCyc collection of Pathway/Genome Databases.
Nucleic Acids Res. 42:D459–D471.
Chimpanzee Sequencing and Analysis Consortium. 2005. Initial sequence
of the chimpanzee genome and comparison with the human genome.
Nature 437:69–87.
Cooper GM, et al. 2005. Distribution and intensity of constraint in mam-
malian genomic sequence. Genome Res. 15:901–913.
Croft D, et al. 2014. The Reactome pathway knowledgebase. Nucleic
Acids Res. 42:D472–D477.
Daub JT, et al. 2013. Evidence for polygenic adaptation to pathogens in
the human genome. Mol Biol Evol. 30:1544–1558.
Davydov EV, et al. 2010. Identifying a high fraction of the human genome
to be under selective constraint using GERP++. PLoS Comput Biol.
6:e1001025.
Drmanac R, et al. 2010. Human genome sequencing using unchained
base reads on self-assembling DNA nanoarrays. Science 327:78–81.
Efron B. 2013. Mathematics. Bayes’ theorem in the 21st century. Science
340:1177–1178.
Enard D, Messer PW, Petrov DA. 2014. Genome-wide signals of positive
selection in human evolution. Genome Res. 24:885–895.
Eyre-Walker A. 2002. Changing effective population size and the
McDonald-Kreitman test. Genetics 162:2017–2024.
Eyre-Walker A, Keightley PD. 2009. Estimating the rate of adaptive mo-
lecular evolution in the presence of slightly deleterious mutations and
population size change. Mol Biol Evol. 26:2097–2108.
Fay JC, Wyckoff GJ, Wu CI. 2002. Testing the neutral theory of
molecular evolution with genomic data from Drosophila. Nature
415:1024–1026.
Flicek P, et al. 2014. Ensembl 2014. Nucleic Acids Res. 42:D749–D755.
Fraser HB. 2013. Gene expression drives local adaptation in humans.
Genome Res. 23:1089–1096.
Fraser HB, Hirsh AE, Steinmetz LM, Scharfe C, Feldman MW. 2002.
Evolutionary rate in the protein interaction network. Science
296:750–752.
Geer LY, et al. 2010. The NCBI BioSystems database. Nucleic Acids Res.
38:D492–D496.
Gilad Y, Man O, Glusman G. 2005. A comparison of the human and
chimpanzee olfactory receptor gene repertoires. Genome Res.
15:224–230.
Gilad Y, Przeworski M, Lancet D. 2004. Loss of olfactory receptor genes
coincides with the acquisition of full trichromatic vision in primates.
PLoS Biol. 2:E5.
Evolutionary Forces Acting on Human Pathways GBE
Genome Biol. Evol. 7(6):1546–1558. doi:10.1093/gbe/evv083 Advance Access publication May 13, 2015 1557
at Biblioteca de la U
niversitat Pompeu Fabra on June 15, 2015
http://gbe.oxfordjournals.org/D
ownloaded from
Go Y, Niimura Y. 2008. Similar numbers but different repertoires of olfac-
tory receptor genes in humans and chimpanzees. Mol Biol Evol.
25:1897–1907.
Hayes JD, Strange RC. 2000. Glutathione S-transferase polymorphisms
and their biological consequences. Pharmacology 61:154–166.
Hernandez RD, et al. 2011. Classic selective sweeps were rare in recent
human evolution. Science 331:920–924.
Hughes GM, Teeling EC, Higgins DG. 2014. Loss of olfactory receptor
function in hominin evolution. PLoS One 9:e84714.
Innan H. 2006. Modified Hudson-Kreitman-Aguade test and two-dimen-
sional evaluation of neutrality tests. Genetics 173:1725–1733.
Jeong H, Mason SP, Barabasi AL, Oltvai ZN. 2001. Lethality and centrality in
protein networks. Nature 411:41–42.
Kanehisa M, Goto S. 2000. KEGG: Kyoto encyclopedia of genes and ge-
nomes. Nucleic Acids Res. 28:27–30.
Kanehisa M, et al. 2014. Data, information, knowledge and principle: back
to metabolism in KEGG. Nucleic Acids Res. 42:D199–D205.
Karolchik D, Hinrichs AS, Kent WJ. 2012. The UCSC Genome Browser.
Curr Protoc Bioinform. Chapter 1:Unit 1.4.
Kelder T, et al. 2012. WikiPathways: building research communities on
biological pathways. Nucleic Acids Res. 40:D1301–D1307.
Lohmueller KE, et al. 2008. Proportionally more deleterious
genetic variation in European than in African populations. Nature
451:994–997.
Lou DI, et al. 2014. Rapid evolution of BRCA1 and BRCA2 in humans and
other primates. BMC Evol Biol. 14:155.
Maglott D, Ostell J, Pruitt KD, Tatusova T. 2011. Entrez Gene: gene-
centered information at NCBI. Nucleic Acids Res. 39:D52–D57.
McDonald JH, Kreitman M. 1991. Adaptive protein evolution at the Adh
locus in Drosophila. Nature 351:652–654.
Messer PW, Petrov DA. 2013. Frequent adaptation and the McDonald-
Kreitman test. Proc Natl Acad Sci U S A. 110:8615–8620.
Nielsen R. 2005. Molecular signatures of natural selection. Annu Rev
Genet. 39:197–218.
Nielsen R, et al. 2005. Genomic scans for selective sweeps using SNP data.
Genome Res. 15:1566–1575.
Oliver PL, et al. 2009. Accelerated evolution of the Prdm9 speciation gene
across diverse metazoan taxa. PLoS Genet. 5:e1000753.
Parsch J, Zhang Z, Baines JF. 2009. The influence of demography and weak
selection on the McDonald-Kreitman test: an empirical study in
Drosophila. Mol Biol Evol. 26:691–698.
Pazos F, Valencia A. 2008. Protein co-evolution, co-adaptation and inter-
actions. EMBO J. 27:2648–2655.
Peischl S, Dupanloup I, Kirkpatrick M, Excoffier L. 2013. On the accumu-
lation of deleterious mutations during range expansions. Mol Ecol.
22:5972–5982.
Ponting CP, Lunter G. 2006. Signatures of adaptive evolution within
human non-coding sequence. Hum Mol Genet. 15:R170–R175.
Pritchard JK, Pickrell JK, Coop G. 2010. The genetics of human adaptation:
hard sweeps, soft sweeps, and polygenic adaptation. Curr Biol.
20:R208–R215.
Rosenberg MM, et al. 2008. Adenomatous polyposis coli plays a key role,
in vivo, in coordinating assembly of the neuronal nicotinic postsynaptic
complex. Mol Cell Neurosci. 38:138–152.
Saeed R, Deane CM. 2006. Protein protein interactions, evolutionary rate,
abundance and age. BMC Bioinformatics 7:128.
Schaefer CF, et al. 2009. PID: the pathway interaction database. Nucleic
Acids Res. 37:D674–D679.
Schwartz JJ, Roach DJ, Thomas JH, Shendure J. 2014. Primate evolution of
the recombination regulator PRDM9. Nat Commun. 5:4370.
Smith NG, Eyre-Walker A. 2002. Adaptive protein evolution in Drosophila.
Nature 415:1022–1024.
Somel M, et al. 2013. A scan for human-specific relaxation of negative
selection reveals unexpected polymorphism in proteasome genes. Mol
Biol Evol. 30:1808–1815.
Storey JD, Tibshirani R. 2003. Statistical significance for genomewide stud-
ies. Proc Natl Acad Sci U S A. 100:9440–9445.
Stranger BE, Stahl EA, Raj T. 2011. Progress and promise of genome-wide
association studies for human complex trait genetics. Genetics
187:367–383.
Subramanian S. 2012. The abundance of deleterious polymorphisms in
humans. Genetics 190:1579–1583.
Wang K, Li M, Hakonarson H. 2010. ANNOVAR: functional annotation of
genetic variants from high-throughput sequencing data. Nucleic Acids
Res. 38:e164.
Wuchty S. 2004. Evolution and topology in the yeast protein interaction
network. Genome Res. 14:1310–1314.
Zhang G, Muglia LJ, Chakraborty R, Akey JM, Williams SM. 2013.
Signatures of natural selection on genetic variants affecting complex
human traits. Appl Transl Genomics. 2:77–93.
Zhang L, Li WH. 2004. Mammalian housekeeping genes evolve more
slowly than tissue-specific genes. Mol Biol Evol. 21:236–239.
Zhang L, Li WH. 2005. Human SNPs reveal no evidence of frequent pos-
itive selection. Mol Biol Evol. 22:2504–2507.
Associate editor: Laurence Hurst
Daub et al. GBE
1558 Genome Biol. Evol. 7(6):1546–1558. doi:10.1093/gbe/evv083 Advance Access publication May 13, 2015
at Biblioteca de la U
niversitat Pompeu Fabra on June 15, 2015
http://gbe.oxfordjournals.org/D
ownloaded from