Infectious disease and group size: more than just a numbers game
11
rstb.royalsocietypublishing.org Research Cite this article: Nunn CL, Jorda ´n F, McCabe CM, Verdolin JL, Fewell JH. 2015 Infectious disease and group size: more than just a numbers game. Phil. Trans. R. Soc. B 370: 20140111. http://dx.doi.org/10.1098/rstb.2014.0111 Accepted: 3 January 2015 One contribution of 14 to a theme issue ‘The sociality – health – fitness nexus in animal societies’. Subject Areas: behaviour, ecology Keywords: sociality, infectious disease, social structure, social network, meta-analysis, comparative analysis Author for correspondence: Charles L. Nunn e-mail: [email protected] Electronic supplementary material is available at http://dx.doi.org/10.1098/rstb.2014.0111 or via http://rstb.royalsocietypublishing.org. Infectious disease and group size: more than just a numbers game Charles L. Nunn 1,2 , Ferenc Jorda ´n 3,4 , Collin M. McCabe 5 , Jennifer L. Verdolin 6 and Jennifer H. Fewell 7 1 Department of Evolutionary Anthropology, Duke University, Box 90383, Durham, NC 27708, USA 2 Duke Global Health Institute, Duke University, 310 Trent Drive, Durham, NC 27710, USA 3 The Microsoft Research-University of Trento COSBI, Piazza Manifattura 1, 38068 Rovereto, Italy 4 Balaton Limnological Institute, Centre for Ecological Research HAS, Klebelsberg K. u. 3, 8237 Tihany, Hungary 5 Department of Human Evolutionary Biology, Harvard University, Cambridge, MA 01238, USA 6 National Evolutionary Synthesis Center, Duke University, Durham, NC 27705, USA 7 School of Life Sciences, Arizona State University, Tempe, AZ 85287, USA Increased risk of infectious disease is assumed to be a major cost of group living, yet empirical evidence for this effect is mixed. We studied whether larger social groups are more subdivided structurally. If so, the social subdivi- sions that form in larger groups may act as barriers to the spread of infection, weakening the association between group size and infectious disease. To investigate this ‘social bottleneck’ hypothesis, we examined the association between group size and four network structure metrics in 43 vertebrate and invertebrate species. We focused on metrics involving modularity, clustering, distance and centralization. In a meta-analysis of intraspecific variation in social networks, modularity showed positive associations with network size, with a weaker but still positive effect in cross-species analyses. Network distance also showed a positive association with group size when using intra- specific variation. We then used a theoretical model to explore the effects of subgrouping relative to other effects that influence disease spread in socially structured populations. Outbreaks reached higher prevalence when groups were larger, but subgrouping reduced prevalence. Subgrouping also acted as a ‘brake’ on disease spread between groups. We suggest research directions to understand the conditions under which larger groups become more subdi- vided, and to devise new metrics that account for subgrouping when investigating the links between sociality and infectious disease risk. 1. Introduction The social transmission of infectious agents is widely expected to increase with group size in animal societies [1–4]. Some empirical evidence supports this prediction. For example, Whiteman & Parker [5] found higher louse abundance in larger aggregations of Galapagos hawks (Buteo galapagoensis), while Ezenwa [6] discovered a positive association between prevalence of intestinal parasites and group size in African artiodactyls. Across primates, malaria prevalence increases with group size in comparative tests [7,8], and a recent study found evidence for positive selection on genes related to immunity in species living in larger groups [9]. Despite the intuitive appeal of the ‘group size–infectious disease effect’, some studies have failed to discover the expected positive associ- ation. For example, Arnold & Lichtenstein [10] did not find significantly higher levels of ectoparasite infection in an intraspecific study of alpine marmots (Marmota marmota) living in larger groups, and in comparative studies of pri- mates, group size showed no significant associations with immune system parameters that are expected to proxy disease risk [11–13]. Similarly, complex relationships exist between disease risk, group size and social organization in insect societies [14], whose evolution also has been strongly influenced by infectious disease [15– 17]. For example, pathogen infec- tion rates in bumblebee colonies increase with interindividual contact rates [18], which should increase with colony network density and size. However, in an & 2015 The Author(s) Published by the Royal Society. All rights reserved. on April 13, 2015 http://rstb.royalsocietypublishing.org/ Downloaded from
Transcript of Infectious disease and group size: more than just a numbers game

on April 13, 2015http://rstb.royalsocietypublishing.org/Downloaded from
rstb.royalsocietypublishing.org
ResearchCite this article: Nunn CL, Jordan F, McCabe
CM, Verdolin JL, Fewell JH. 2015 Infectious
disease and group size: more than just a
numbers game. Phil. Trans. R. Soc. B 370:
20140111.
http://dx.doi.org/10.1098/rstb.2014.0111
Accepted: 3 January 2015
One contribution of 14 to a theme issue
‘The sociality – health – fitness nexus in animal
societies’.
Subject Areas:behaviour, ecology
Keywords:sociality, infectious disease, social structure,
social network, meta-analysis,
comparative analysis
Author for correspondence:Charles L. Nunn
e-mail: [email protected]
& 2015 The Author(s) Published by the Royal Society. All rights reserved.
Electronic supplementary material is available
at http://dx.doi.org/10.1098/rstb.2014.0111 or
via http://rstb.royalsocietypublishing.org.
Infectious disease and group size: morethan just a numbers game
Charles L. Nunn1,2, Ferenc Jordan3,4, Collin M. McCabe5, Jennifer L. Verdolin6
and Jennifer H. Fewell7
1Department of Evolutionary Anthropology, Duke University, Box 90383, Durham, NC 27708, USA2Duke Global Health Institute, Duke University, 310 Trent Drive, Durham, NC 27710, USA3The Microsoft Research-University of Trento COSBI, Piazza Manifattura 1, 38068 Rovereto, Italy4Balaton Limnological Institute, Centre for Ecological Research HAS, Klebelsberg K. u. 3, 8237 Tihany, Hungary5Department of Human Evolutionary Biology, Harvard University, Cambridge, MA 01238, USA6National Evolutionary Synthesis Center, Duke University, Durham, NC 27705, USA7School of Life Sciences, Arizona State University, Tempe, AZ 85287, USA
Increased risk of infectious disease is assumed to be a major cost of group
living, yet empirical evidence for this effect is mixed. We studied whether
larger social groups are more subdivided structurally. If so, the social subdivi-
sions that form in larger groups may act as barriers to the spread of infection,
weakening the association between group size and infectious disease. To
investigate this ‘social bottleneck’ hypothesis, we examined the association
between group size and four network structure metrics in 43 vertebrate and
invertebrate species. We focused on metrics involving modularity, clustering,
distance and centralization. In a meta-analysis of intraspecific variation in
social networks, modularity showed positive associations with network
size, with a weaker but still positive effect in cross-species analyses. Network
distance also showed a positive association with group size when using intra-
specific variation. We then used a theoretical model to explore the effects of
subgrouping relative to other effects that influence disease spread in socially
structured populations. Outbreaks reached higher prevalence when groups
were larger, but subgrouping reduced prevalence. Subgrouping also acted
as a ‘brake’ on disease spread between groups. We suggest research directions
to understand the conditions under which larger groups become more subdi-
vided, and to devise new metrics that account for subgrouping when
investigating the links between sociality and infectious disease risk.
1. IntroductionThe social transmission of infectious agents is widely expected to increase with
group size in animal societies [1–4]. Some empirical evidence supports this
prediction. For example, Whiteman & Parker [5] found higher louse abundance
in larger aggregations of Galapagos hawks (Buteo galapagoensis), while Ezenwa
[6] discovered a positive association between prevalence of intestinal parasites
and group size in African artiodactyls. Across primates, malaria prevalence
increases with group size in comparative tests [7,8], and a recent study found
evidence for positive selection on genes related to immunity in species living
in larger groups [9]. Despite the intuitive appeal of the ‘group size–infectious
disease effect’, some studies have failed to discover the expected positive associ-
ation. For example, Arnold & Lichtenstein [10] did not find significantly higher
levels of ectoparasite infection in an intraspecific study of alpine marmots
(Marmota marmota) living in larger groups, and in comparative studies of pri-
mates, group size showed no significant associations with immune system
parameters that are expected to proxy disease risk [11–13].
Similarly, complex relationships exist between disease risk, group size and
social organization in insect societies [14], whose evolution also has been
strongly influenced by infectious disease [15–17]. For example, pathogen infec-
tion rates in bumblebee colonies increase with interindividual contact rates [18],
which should increase with colony network density and size. However, in an

rstb.royalsocietypublishing.orgPhil.Trans.R.Soc.B
370:20140111
2
on April 13, 2015http://rstb.royalsocietypublishing.org/Downloaded from
infection study, termite nymphs had higher fungal infection
rates when reared in smaller groups or alone, versus in
groups of moderate size [19]. Increased susceptibility to
socially transmitted infectious agents has been reported in
smaller and larger honeybee colonies relative to those of
moderate size [20,21].
In some cases, a negative association between group size
and infectious disease makes sense. For example, an individual
living in a larger group may obtain relief from vectors that
actively search for their hosts, such as biting flies and the infec-
tious diseases that they transmit (e.g. yellow fever virus and
filarial nematodes). This may arise through the encounter-
dilution effect, where detection of a group by a searching
parasite increases more slowly than group size and the prob-
ability that an individual is attacked decreases with group size
[22,23]. Overall, these effects can result in a lower per capitabiting rate, and thus a negative association between group
size and infection risk. Evidence for the encounter-dilution
effect has been proposed for several systems, including biting
flies on horses [24] and ectoparasites on rodents [25].
To make sense of these diverse patterns and potential effects,
researchers have turned to meta-analyses to assess the linkage
between group size and infectious disease risk across taxa
[23,26,27]. In one recent meta-analysis, Rifkin et al. [26] found
that 19 of 69 studies showed a negative association between
group size and infectious disease (not all significant). Across
all parasite and pathogen types, the average effect size was
only r ¼ 0.141, which is considered a ‘weak’ effect [28]. Counter
to predictions of the encounter-dilution effect, the authors found
that vector-borne infectious diseases and parasitoids showed the
highest (positive) effect sizes among five subsets of parasites. In
another recent meta-analysis, Patterson & Ruckstuhl [27] found
larger effect sizes for some subsets of parasite and pathogen
types, and a negative association between group size and para-
sitism for mobile parasites, but weak (non-significant) effect
sizes involving parasite richness.
In this paper, we investigate the hypothesis that social net-
work structure modulates the association between group size
and infectious disease risk: larger groups may be more subdi-
vided structurally, resulting in social subgroups that act as
transmission bottlenecks within the group [29]. If so, these
social barriers would offset the increased potential for an infec-
tious agent to spread in larger groups, and thus reduce the
overall association between group size and infectious disease
risk (although it need not eliminate the association completely).
Several studies have investigated aspects of this ‘social bottle-
neck hypothesis’ [30–32]. In a study that directly investigated
network structure in non-human primates, Griffin & Nunn
[29] found a positive association between group size and
social network subdivision (community modularity), and
negative associations between modularity and parasite rich-
ness (including micro- and macroparasites). However, several
issues with this study suggest that further research is needed:
sample sizes were small, the metric of community modularity
used may show a mathematical relationship with network size,
and data on parasite richness and network structure for each
species were obtained from different social groups (owing to
lack of information on the same social groups).
To investigate the social bottleneck hypothesis, we com-
bined empirical and theoretical approaches to examine the
links between group size, group subdivision and disease
spread. Empirically, we expanded the taxonomic scope of the
analysis to include a broader array of organisms (including
social insects), and included additional measures of network
structure. We used meta-analysis and phylogenetic compara-
tive methods [33,34] to investigate whether group size
covaries with these network metrics within and across species.
We also developed a theoretical model that simulates the spread
of a socially transmitted infection in social groups varying in
size and degree of subdivision. We compare disease prevalence
and spread in relation to subgrouping and other variables rel-
evant to social disease transmission, predicting that greater
subgrouping will limit outbreak size, because infections will
tend to be more contained within subgroups. Importantly,
our model enabled us to assess how the effect of substructure
within groups compares with other epidemiologically impor-
tant drivers of outbreak size, such as mortality rates and per
contact probability of transmission.
2. Material and methods(a) Social networks and network structureWe obtained data on social networks from 102 social groups in
43 species of animals. Network data were gathered by surveying
the literature for published association matrices and by contact-
ing authors for permission to use data for matrices not directly
published, but for which network analyses had been performed.
To generate networks [35], we generally preferred social
behaviours involving affiliative associations, although some
agonistic interactions were also used. For 11 species, data were
available for more than one social group, meaning that we had
intraspecific variation recorded in the database; for seven of
these species, we obtained four or more networks, allowing us
to examine the association between group size and network
characteristics within species (and to combine these intraspecific
analyses in a meta-analysis of different species). Network sizes
ranged from 3 to 143, with a mean of 23.9; 36 of the 102 networks
had fewer than 10 nodes. Details are provided in the electronic
supplementary material, including information on sources of
data, type of interaction used and whether the animals were
from wild or captive populations.
We generated weighted social networks, with symmetric ties
(assuming no difference between ij and ji interactions) in undir-
ected networks to allow for the greatest inclusion of networks;
when provided, ij and ji weights were summed, and then all
ties were normalized, so that the average tie strength was equal
to 1. We chose network metrics that we expected to be mathemat-
ically independent of, but empirically associated with, network
(group) size, and that capture different aspects of network
structure: modularity, clustering, distance and centrality.
The first metric is Newman’s [36] leading-eigenvector measure
of community modularity, hereafter called Newman’s modularity.
This is one of multiple measures of modularity that gauge how
divided a given graph is into subgroups, with higher values indicat-
ing greater subdivision into distinct subgroups. Newman’s
algorithm was designed to be mathematically independent of net-
work (group) size. As such, it has been used to investigate
associations between network size and modularity in metabolic
networks [37], although we acknowledge that constraints exist on
the number of modules at extremely small group sizes. As a
measure of network substructure, Newman’s modularity offers
the best test of the social bottleneck hypothesis; in this context, we
predicted that modularity shows a positive association with
group size. Newman’s modularity was calculated using the R
[38] package ‘igraph’ [39].
As a second metric, we calculated the clustering coefficient,which quantifies how densely direct neighbours are connected
to one other (i.e. the number of links between neighbours

rstb.royalsocietypublishing.orgPhil.Trans.R.Soc.B
370:20140111
3
on April 13, 2015http://rstb.royalsocietypublishing.org/Downloaded from
divided by the maximum number of links that could exist
between them). Clustering measures variation in connectivity
among nodes at a more local level than does modularity. It
evaluates the prevalence of those cases in which a node is con-
nected to two other nodes, and those are also connected to
each other (forming a triangle), in essence capturing the redun-
dancy of ties. This binary measure uses presences or absences
of ties, rather than their weights, to provide a more readily intel-
ligible metric. Predictions are less clear-cut for the clustering
coefficient than for Newman’s modularity and will depend on
the specifics of the network and the initially infected individual.
While we generally expect that disease transmission will typi-
cally increase in networks with higher clustering owing to
increased redundancy of ties, and therefore greater opportunity
for transmission [40,41], these patterns are likely to be weaker
and may be more complex than for Newman’s modularity.
Clustering coefficients were calculated using UCINET 6 [42].
For a third metric, we calculated a weight-normalized distancebetween nodes, using Opsahl’s [43] updated algorithm for
Dijkstra’s [44] cost-corrected shortest distances from one node to
another. In this measure, distances are represented as the number
of ‘normalized’ ties (a tie of the average weight of all ties in the net-
work) that compose the shortest path between two nodes. We used
the mean of all shortest paths within a network to represent the
average shortest distance between nodes in the network, with
larger distances representing a less traversable network. Weight-
normalized distances were calculated using the R package ‘tnet’
[45]. We checked for the effect of weighting by comparing the
same network measures for the binary (a more common measure
of shortest distances) and weighted versions of all networks, and
the difference was negligible. Increased internodal distance may
increase with group size, and could delay the rate of disease trans-
mission across the entire network. However, in social networks,
distance can be shortened by modularity in network structure [40].
A fourth measure, eigenvector centralization, captured variation
in connectedness across nodes in the graph. Eigenvector centrality,
the nodal metric that corresponds to and composes the network-
level metric of centralization, is the measure of the influence of a
node in a network [46,47]. Euclidean-normalized eigenvector cen-
tralities of all nodes are used in calculating a single eigenvector
index for the entire network, called eigenvector centralization.
All centralities are compared with that of the most central node,
such that lower eigenvector centralization values denote a less cen-
tralized network in general, where ties are more egalitarian in their
distribution. Higher eigenvector centralization values denote a
more centralized network, where one or a few nodes efficiently
connect the highest-degree nodes of the network. Eigenvector cen-
tralization was calculated using the R package ‘igraph’ [39]. While
the social bottleneck hypothesis does not explicitly predict the
relationship between eigenvector centralization and group size,
this measure quantifies the evenness of the relative importance
of individuals in the group. From the viewpoint of disease
spread within groups, one might expect that an infectious agent
would move more rapidly across a more centralized network.
However, because removal of highly central nodes can fragment
a centralized network, this effect would depend, in part, on patho-
gen attributes such as disease latency, case fatality rates and the
degree of immunity after clearing infection.
In summary, we provide analyses using four measures of
network structure, some of which are weighted and some of
which are not. Newman’s modularity provides the clearest pre-
diction of the social bottleneck hypothesis, and thus is the one
we focus on for testing that hypothesis.
(b) Statistical analysis of comparative dataFor species with four or more networks available, we calcula-
ted correlation coefficients between network structure and
network size for each of the measures of network structure sep-
arately, and then conducted a meta-analysis in the software
COMPREHENSIVE META-ANALYSIS, v. 2 [48]. We also conducted a
phylogenetic meta-analysis of the resulting effect sizes using
the methods described by Lajeunesse [49], as implemented in
PHYLOMETA [50].
We also ran phylogenetic comparative analyses involving
phylogenetic generalized least-squares (PGLS) in R using the
package caper [51], with a statistical model of ‘network
structure � group size’. For species with more than one network,
we avoided taking an average of the network metric, and instead
used only a single network for each species, with data on net-
work size and the network metrics thus obtained from the
same network. To deal with this intraspecific variation, we ran-
domly chose one network for each species (if more than one
was available), and then ran a standard PGLS on the resulting
dataset, including estimation of the branch scaling coefficient l,
which is a measure of phylogenetic signal [52,53]. This was
repeated 1000 times for each analysis, and mean and distri-
butions of resulting statistical output were compiled. We
assessed significance as having a mean p-value less than 0.05.
For both the meta-analysis and the comparative analysis, we
compiled a phylogeny for the mammalian species in the final
dataset by pruning the published, revised mammalian supertree
from Bininda-Emonds et al. [54], and by manually grafting
additional branches as needed, using node estimates from
TIME-TREE for splits among vertebrates, between vertebrates and
arthropods, and between wasps and bees [55]. Additional
branches were added for the split between the ant genera Pogono-myrmex and Camponotus (at 104.7 Ma) from Brady et al. [56], and
for the recent split between the two wasp species of Ropalidia,
arbitrarily estimated at 1 Ma, based on their status as congeneric
species (no genetic estimates were available for these species).
The tree is provided in the electronic supplementary material.
To isolate the effects of deep branches in the trees (i.e. between
invertebrates and vertebrates), we ran comparative analyses
with both the full phylogeny and with a phylogeny composed
only of the mammals.
(c) Theoretical model of disease spreadOur theoretical model was constructed as a modification of a
meta-population model used previously to study the spread of
socially transmitted infections [57] and cultural traits [58]. The
model was implemented in MATLAB version R2013b. Simu-
lations took place on a 10 � 10 square lattice, where each cell
represented a distinct social group that was formed based on
user-specified values for group size (g) by drawing a random
number from a Poisson distribution (with mean of g for
number of females, which was doubled to give the total group
of males and females). Individuals were characterized by infec-
tion status, including number of days in an incubation period
(c, i.e. exposed but not yet infectious) and, following host incu-
bation, number of days in a host infectious period ( f ). All
individuals in the population were initially uninfected.
Individuals were randomly assigned to one of s subgroups
within each social group; setting s equal to 1 resulted in no sub-
group structure. We assumed that disease spread was higher
among individuals within the same subgroup than among indi-
viduals in different subgroups, with subgroup affiliation
representing the only source of heterogeneity in the edges of
the network (although an actual network was not generated).
By assuming only two kinds of ties—those within subgroups
(modules) and those between subgroups—our model deals
with important types of nodal heterogeneity in real-world sys-
tems that may affect disease spread (e.g. super-spreaders),
which may obscure the effect we were most interested in
(subgrouping).
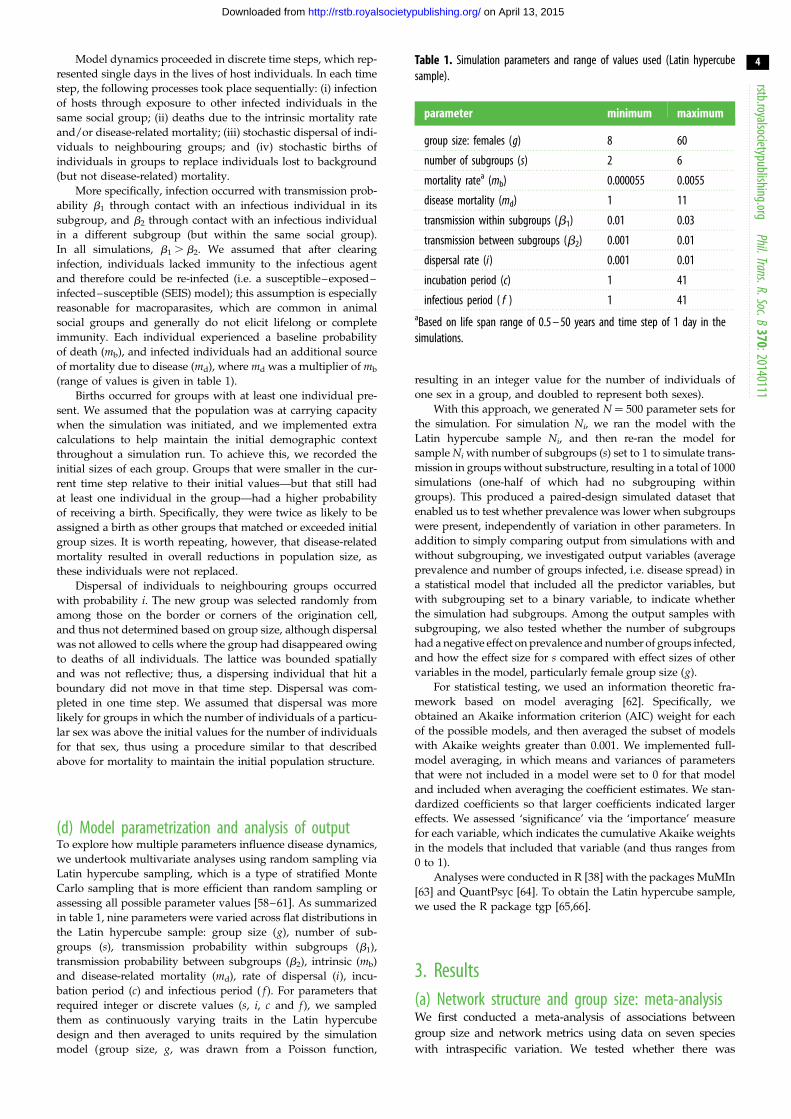
Table 1. Simulation parameters and range of values used (Latin hypercubesample).
parameter minimum maximum
group size: females (g) 8 60
number of subgroups (s) 2 6
mortality ratea (mb) 0.000055 0.0055
disease mortality (md) 1 11
transmission within subgroups (b1) 0.01 0.03
transmission between subgroups (b2) 0.001 0.01
dispersal rate (i) 0.001 0.01
incubation period (c) 1 41
infectious period ( f ) 1 41aBased on life span range of 0.5 – 50 years and time step of 1 day in thesimulations.
rstb.royalsocietypublishing.orgPhil.Trans.R.Soc.B
370:20140111
4
on April 13, 2015http://rstb.royalsocietypublishing.org/Downloaded from
Model dynamics proceeded in discrete time steps, which rep-
resented single days in the lives of host individuals. In each time
step, the following processes took place sequentially: (i) infection
of hosts through exposure to other infected individuals in the
same social group; (ii) deaths due to the intrinsic mortality rate
and/or disease-related mortality; (iii) stochastic dispersal of indi-
viduals to neighbouring groups; and (iv) stochastic births of
individuals in groups to replace individuals lost to background
(but not disease-related) mortality.
More specifically, infection occurred with transmission prob-
ability b1 through contact with an infectious individual in its
subgroup, and b2 through contact with an infectious individual
in a different subgroup (but within the same social group).
In all simulations, b1 . b2. We assumed that after clearing
infection, individuals lacked immunity to the infectious agent
and therefore could be re-infected (i.e. a susceptible–exposed–
infected–susceptible (SEIS) model); this assumption is especially
reasonable for macroparasites, which are common in animal
social groups and generally do not elicit lifelong or complete
immunity. Each individual experienced a baseline probability
of death (mb), and infected individuals had an additional source
of mortality due to disease (md), where md was a multiplier of mb
(range of values is given in table 1).
Births occurred for groups with at least one individual pre-
sent. We assumed that the population was at carrying capacity
when the simulation was initiated, and we implemented extra
calculations to help maintain the initial demographic context
throughout a simulation run. To achieve this, we recorded the
initial sizes of each group. Groups that were smaller in the cur-
rent time step relative to their initial values—but that still had
at least one individual in the group—had a higher probability
of receiving a birth. Specifically, they were twice as likely to be
assigned a birth as other groups that matched or exceeded initial
group sizes. It is worth repeating, however, that disease-related
mortality resulted in overall reductions in population size, as
these individuals were not replaced.
Dispersal of individuals to neighbouring groups occurred
with probability i. The new group was selected randomly from
among those on the border or corners of the origination cell,
and thus not determined based on group size, although dispersal
was not allowed to cells where the group had disappeared owing
to deaths of all individuals. The lattice was bounded spatially
and was not reflective; thus, a dispersing individual that hit a
boundary did not move in that time step. Dispersal was com-
pleted in one time step. We assumed that dispersal was more
likely for groups in which the number of individuals of a particu-
lar sex was above the initial values for the number of individuals
for that sex, thus using a procedure similar to that described
above for mortality to maintain the initial population structure.
(d) Model parametrization and analysis of outputTo explore how multiple parameters influence disease dynamics,
we undertook multivariate analyses using random sampling via
Latin hypercube sampling, which is a type of stratified Monte
Carlo sampling that is more efficient than random sampling or
assessing all possible parameter values [58–61]. As summarized
in table 1, nine parameters were varied across flat distributions in
the Latin hypercube sample: group size (g), number of sub-
groups (s), transmission probability within subgroups (b1),
transmission probability between subgroups (b2), intrinsic (mb)
and disease-related mortality (md), rate of dispersal (i), incu-
bation period (c) and infectious period ( f ). For parameters that
required integer or discrete values (s, i, c and f ), we sampled
them as continuously varying traits in the Latin hypercube
design and then averaged to units required by the simulation
model (group size, g, was drawn from a Poisson function,
resulting in an integer value for the number of individuals of
one sex in a group, and doubled to represent both sexes).
With this approach, we generated N ¼ 500 parameter sets for
the simulation. For simulation Ni, we ran the model with the
Latin hypercube sample Ni, and then re-ran the model for
sample Ni with number of subgroups (s) set to 1 to simulate trans-
mission in groups without substructure, resulting in a total of 1000
simulations (one-half of which had no subgrouping within
groups). This produced a paired-design simulated dataset that
enabled us to test whether prevalence was lower when subgroups
were present, independently of variation in other parameters. In
addition to simply comparing output from simulations with and
without subgrouping, we investigated output variables (average
prevalence and number of groups infected, i.e. disease spread) in
a statistical model that included all the predictor variables, but
with subgrouping set to a binary variable, to indicate whether
the simulation had subgroups. Among the output samples with
subgrouping, we also tested whether the number of subgroups
had a negative effect on prevalence and number of groups infected,
and how the effect size for s compared with effect sizes of other
variables in the model, particularly female group size (g).
For statistical testing, we used an information theoretic fra-
mework based on model averaging [62]. Specifically, we
obtained an Akaike information criterion (AIC) weight for each
of the possible models, and then averaged the subset of models
with Akaike weights greater than 0.001. We implemented full-
model averaging, in which means and variances of parameters
that were not included in a model were set to 0 for that model
and included when averaging the coefficient estimates. We stan-
dardized coefficients so that larger coefficients indicated larger
effects. We assessed ‘significance’ via the ‘importance’ measure
for each variable, which indicates the cumulative Akaike weights
in the models that included that variable (and thus ranges from
0 to 1).
Analyses were conducted in R [38] with the packages MuMIn
[63] and QuantPsyc [64]. To obtain the Latin hypercube sample,
we used the R package tgp [65,66].
3. Results(a) Network structure and group size: meta-analysisWe first conducted a meta-analysis of associations between
group size and network metrics using data on seven species
with intraspecific variation. We tested whether there was
1.00
Pogonomyrmex californicus
Pogonomyrmex californicus
Camponotus fellah
Camponotus fellah
Papio hamadryas
Papio hamadryas
Cyanomys gunnisoni
Cynomis gunnisoni
Marmota flaviventris
Marmota flaviventris
Ropalidia marginata
Ropalidia marginata
Ropalidia cyathiformis
Ropalidia cyathiformis
–1.00
(a) (b)
(c) (d )
1.00–1.00 1.00–1.00
1.00
Pogonomyrmex californicus
Pogonomyrmex californicus
Camponotus fellah
Camponotus fellah
Papio hamadryas
Papio hamadryas
Cynomys gunnisoni
Cynomys gunnisoni
Mamota flaviventris
Mamota flaviventris
Ropalidia cyathiformis
Ropalidia cyathiformisRopalidia marginata
Ropalidia cyanthiformis
–1.00
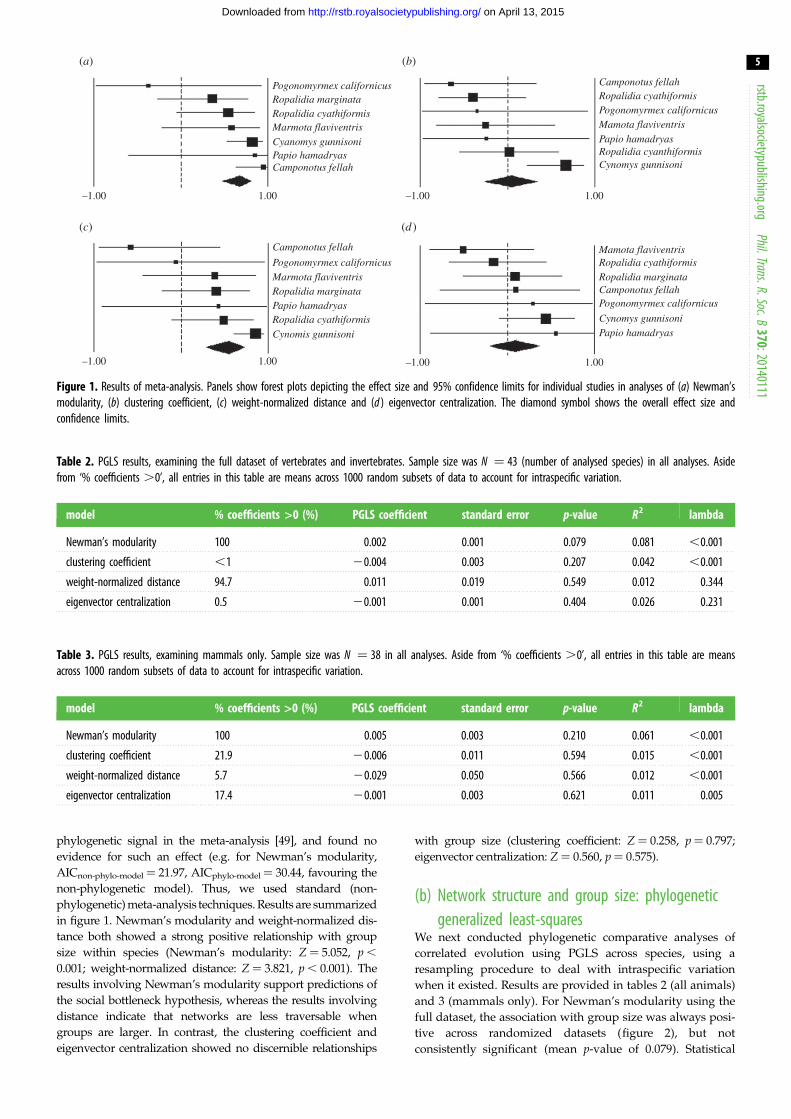
Figure 1. Results of meta-analysis. Panels show forest plots depicting the effect size and 95% confidence limits for individual studies in analyses of (a) Newman’smodularity, (b) clustering coefficient, (c) weight-normalized distance and (d ) eigenvector centralization. The diamond symbol shows the overall effect size andconfidence limits.
Table 2. PGLS results, examining the full dataset of vertebrates and invertebrates. Sample size was N ¼ 43 (number of analysed species) in all analyses. Asidefrom ‘% coefficients .0’, all entries in this table are means across 1000 random subsets of data to account for intraspecific variation.
model % coefficients >0 (%) PGLS coefficient standard error p-value R2 lambda
Newman’s modularity 100 0.002 0.001 0.079 0.081 ,0.001
clustering coefficient ,1 20.004 0.003 0.207 0.042 ,0.001
weight-normalized distance 94.7 0.011 0.019 0.549 0.012 0.344
eigenvector centralization 0.5 20.001 0.001 0.404 0.026 0.231
Table 3. PGLS results, examining mammals only. Sample size was N ¼ 38 in all analyses. Aside from ‘% coefficients .0’, all entries in this table are meansacross 1000 random subsets of data to account for intraspecific variation.
model % coefficients >0 (%) PGLS coefficient standard error p-value R2 lambda
Newman’s modularity 100 0.005 0.003 0.210 0.061 ,0.001
clustering coefficient 21.9 20.006 0.011 0.594 0.015 ,0.001
weight-normalized distance 5.7 20.029 0.050 0.566 0.012 ,0.001
eigenvector centralization 17.4 20.001 0.003 0.621 0.011 0.005
rstb.royalsocietypublishing.orgPhil.Trans.R.Soc.B
370:20140111
5
on April 13, 2015http://rstb.royalsocietypublishing.org/Downloaded from
phylogenetic signal in the meta-analysis [49], and found no
evidence for such an effect (e.g. for Newman’s modularity,
AICnon-phylo-model ¼ 21.97, AICphylo-model¼ 30.44, favouring the
non-phylogenetic model). Thus, we used standard (non-
phylogenetic) meta-analysis techniques. Results are summarized
in figure 1. Newman’s modularity and weight-normalized dis-
tance both showed a strong positive relationship with group
size within species (Newman’s modularity: Z ¼ 5.052, p ,
0.001; weight-normalized distance: Z ¼ 3.821, p , 0.001). The
results involving Newman’s modularity support predictions of
the social bottleneck hypothesis, whereas the results involving
distance indicate that networks are less traversable when
groups are larger. In contrast, the clustering coefficient and
eigenvector centralization showed no discernible relationships
with group size (clustering coefficient: Z ¼ 0.258, p ¼ 0.797;
eigenvector centralization: Z ¼ 0.560, p¼ 0.575).
(b) Network structure and group size: phylogeneticgeneralized least-squares
We next conducted phylogenetic comparative analyses of
correlated evolution using PGLS across species, using a
resampling procedure to deal with intraspecific variation
when it existed. Results are provided in tables 2 (all animals)
and 3 (mammals only). For Newman’s modularity using the
full dataset, the association with group size was always posi-
tive across randomized datasets (figure 2), but not
consistently significant (mean p-value of 0.079). Statistical

PGLS coefficient
freq
uenc
y
−0.0005 0 0.0005 0.0010 0.0015 0.0020 0.0025 0.0030
0
50
100
150
Figure 2. Distribution of regression coefficients for the association between group size and modularity in comparative analyses. The distribution is based on randomselection of a single value per species in the comparative analysis to account for intraspecific variation. Darker bars indicate proportions of statistical results that weresignificant at p , 0.05.
rstb.royalsocietypublishing.orgPhil.Trans.R.Soc.B
370:20140111
6
on April 13, 2015http://rstb.royalsocietypublishing.org/Downloaded from
significance was on average weaker when only mammals
were analysed, although all estimated regression coefficients
remained positive (table 3). The positive trend across species
is weaker than in meta-analysis of within-species associations
of network structure and group size (figure 1). We used
matched data on network metrics and size from the same
social groups rather than averaging intraspecific data for a
‘species-specific’ network. Thus, weaker results in the
cross-species analyses are likely to arise because additional
interspecies differences account for network modularity
independently of group size.
The clustering coefficient tended to show a negative associ-
ation with group size based on the regression coefficient, but
again, the mean p-value was above our significance threshold
when all species were examined (table 2) and when focus-
ing on mammals (table 3). Similarly, weight-normalized
distance and eigenvector centralization showed no significant
associations with group size. Based on the signs of the esti-
mated regression coefficients, weight-normalized distance
tended to show consistent positive associations with group
size across all species, and eigenvector centralization showed
consistent negative associations with group size, yet this con-
sistency disappeared when investigating only mammals
(tables 2 and 3). The consistency in the sign of the regres-
sion coefficients was not matched with compelling levels of
statistical significance.
(c) Theoretical model of disease spreadAcross 1000 simulations, maximum prevalence showed a
bimodal distribution, reflecting that the simulation failed to
take off in many simulation runs (figure 3a); maximum
prevalence was less than 5% in 253 of the simulations. In
most simulations, the disease went extinct (figure 3b), as
expected given that disease-induced mortality was greater
than background mortality and individuals that died from
the disease were not replaced. However, in 45 of the simu-
lations, a peak was reached and the prevalence was still
declining when the simulation ended (figure 3c). To control
for variation in disease dynamics of different simulation
runs, we based our analyses on results involving maximum
prevalence, rather than final or average prevalence.
We also examined the number of groups infected in a
simulation run. In 183 of the 1000 simulations, the disease
never left the starting group (i.e. only one group was
infected), whereas in 595 cases, all 100 groups were infected
at least once during the simulation run. The mean number
of groups infected (out of 100 on the lattice) was 73.1, reflect-
ing that the disease was very effective in spreading across the
lattice in most simulations. Overall, initial indications are that
the simulation parameters used in the Latin hypercube
sample captured substantial variation in outbreak success.
We found that maximum prevalence was substantially
higher in the 500 simulations without subgrouping (median
of 73.4%, standard deviation ¼ 0.353) than in the 500 simu-
lations with subgrouping (median of 39.1%, standard
deviation ¼ 0.355). As shown in figure 4, the patterns were
consistent in the vast majority of simulations, with subgroup-
ing resulting in lower peak prevalence in all but 45
simulations (given the very low prevalence for ‘no sub-
groups’ in most of these cases, they typically represent
stochastic early extinctions). A similar pattern was found
when examining the number of groups infected, with
higher numbers of social groups infected on the 100-group
lattice without subgrouping (mean ¼ 81.1 groups), when
compared with cases when individuals within social groups
showed structured interactions (mean ¼ 65.0). In only 41
paired comparisons (out of 500) did the number of groups
infected come out higher in simulations with subgroups pre-
sent than with subgroups absent (and most of these again

0 0.2 0.4 0.6 0.8 1.0
0
0.2
0.4
0.6
0.8
1.0
prevalence with no subgroups
prev
alen
ce w
hen
subg
roup
s ar
e pr
esen
t
Figure 4. Prevalence of infection in paired simulations with and without socialstructure. Points below the line of equality indicate cases where prevalence washigher in simulations without subgrouping, when compared with simulationsunder identical conditions with subgrouping. In total, 500 such paired compari-sons were conducted. The vast majority of these comparisons exhibited greatermaximum prevalence in simulation runs without subgrouping.
maximum prevalence
(a)
(b)
(c)
freq
uenc
y
0 0.2 0.4 0.6 0.8 1.0
0
50
150
250
0 200 400 600 800 1000 1200
0
0.3
0.6
time step
prop
ortio
n in
fect
ed
0 2000 4000 6000 8000 10 000
0
0.4
time step
prop
ortio
n in
fect
ed
Figure 3. Example simulation output. (a) The distribution of maximum preva-lence at the end of the full 1000 simulations, combining results of simulationswith and without social substructure. (b) Example of prevalence over time for arun in which the simulated infectious disease went extinct. (c) Example of preva-lence over time for a run in which the simulated infectious agent was headingtoward extinction, but had not yet reached that point. On the basis of the pat-terns in b and c, we focused on maximum prevalence over the course of asimulation as one of our two outcome measures from the simulation (withnumber of groups infected as the other outcome measure).
rstb.royalsocietypublishing.orgPhil.Trans.R.Soc.B
370:20140111
7
on April 13, 2015http://rstb.royalsocietypublishing.org/Downloaded from
probably represent stochastic extinctions). Thus, we find
clear evidence that subgrouping resulted in fewer groups
becoming infected.
We also used the simulations to assess the effects of sub-
grouping relative to other epidemiologically important
variables, such as mortality resulting from infection. First,
we examined predictors of maximum prevalence across all
simulations, with predictors involving the variables shown
in table 1 and subgrouping coded as a binary factor (0 indi-
cated no subgrouping, whereas 1 indicated subgrouping
was present). These analyses revealed clear positive effects
of group size on maximum prevalence, and clear negative
effects of subgrouping on maximum prevalence (table 4).
Thus, individuals in larger groups had more risk, but an
independent negative effect existed owing to subgrouping.
These effects are comparable in size to other key variables,
such as mortality rates and infectious period, and somewhat
larger than the effects of transmission probability. Similar
results were obtained when using the number of subgroups
as a predictor (rather than using the binary codes), and
when examining patterns only within the subset of
simulations that involved subgrouping (2 , s , 6).
We also investigated a linear model predicting the
number of groups infected. We again found strong positive
effects of group size, with g having the largest effect size in
the model (table 5). Subgrouping—coded as a binary
factor—showed a negative effect, and was present in all
models retained, with importance of 1.0. Only infectious
period and group size had a larger standardized regression
coefficient (in absolute magnitude) than subgrouping in
this statistical model. We also found that probability of trans-
mission within subgroups (b1) was more important than
transmission of infection across subgroups (b2) in accounting
for the number of groups infected.
4. DiscussionOne of the intrinsic costs of social life is increased risk of
acquiring socially transmitted infectious agents. Disease
transmission is theoretically expected to increase with
group size. However, the individuals in social groups are
not randomly connected; a benefit of this social structure
may be the mitigation of disease impact as group size
becomes larger. We call this the social bottleneck hypothesis.
We used empirical comparative and meta-analyses to
determine whether measures of social network structure
covary with group size, and we coupled these tests with
a simulation model of disease spread in relation to group
structure and other variables. Our empirical analyses focu-
sed on potential links between network structure and
size, expanding on a previous analysis of primates [29]. The
data indicate that network substructure, as measured by
Newman’s modularity, increases in larger social groups,
supporting the social bottleneck hypothesis. In a meta-
analysis of variation in group size and modularity in seven
species, we found consistently positive associations between
these variables. Although weaker in comparative analyses,
indications of a positive effect of network size on modularity
remained. Differences between within-species and cross-
species analyses do not reflect issues with treating group
size and network properties as characteristic of a species in
the comparative tests, because our comparative analyses actu-
ally use paired data on network characteristics and network

Table 4. Effect of group subdivision and other simulation parameters on ‘maximum prevalence’.
variable estimate lower CI upper CI importance
intercept 0.000 20.038 0.038 n.a.
female group size (g) 0.461 0.423 0.499 1.00
presence of subgroups (binary factor) 20.259 20.297 20.222 1.00
transmission within subgroups (b1) 0.124 0.086 0.162 1.00
transmission between subgroups (b2) 0.060 0.021 0.098 0.98
dispersal rate (i) 0.085 0.047 0.123 1.00
mortality rate (mb) 20.313 20.351 20.275 1.00
disease mortality (md) 20.256 20.294 20.218 1.00
infectious period ( f ) 0.333 0.295 0.371 1.00
incubation period (c) 0.009 20.029 0.046 0.28
Table 5: Effects of group subdivision and other simulation parameters on ‘number of groups infected’.
variable estimate lower CI upper CI importance
intercept 0.000 20.050 0.050 n.a.
group size (g) 0.366 0.315 0.416 1.00
presence of subgroups (binary factor) 20.192 20.242 20.142 1.00
transmission within subgroups (b1) 0.087 0.037 0.138 0.99
transmission between subgroups (b2) 0.036 20.015 0.087 0.49
dispersal rate (i) 0.038 20.013 0.088 0.51
mortality rate (mb) 20.178 20.229 20.128 1.00
disease mortality (md) 20.092 20.143 20.042 1.00
infectious period ( f ) 0.329 0.279 0.379 1.00
incubation period (c) 20.037 20.088 0.013 0.51
rstb.royalsocietypublishing.orgPhil.Trans.R.Soc.B
370:20140111
8
on April 13, 2015http://rstb.royalsocietypublishing.org/Downloaded from
size rather than averaging to the species level. Instead, weaker
results in comparative tests suggest that biological differences
across the wide range of species in our comparative analysis
affect the network measures. Other network parameters
also covaried with group size, especially weight-normalized
distance in the meta-analyses.
Our theoretical model investigated the effects of
subgrouping on disease spread. As expected, greater sub-
grouping slowed the spread of disease and reduced
maximum prevalence in the simulation model. The statistical
analyses revealed that the effect of subgrouping was as
important as some other key epidemiological parameters in
accounting for the spread of disease. Of course, these con-
clusions are only valid in the context of the simulation
design and range of parameters used here. While it is
plausible that similarly strong effects of subgrouping exist
in real-world systems, we presently lack the data to assess
this possibility directly.
We focused on how subgrouping may covary with group
size and potentially mitigate the spread of a socially trans-
mitted disease, partly as an explanation for the weakness of
the group size–infectious disease effect in one recent meta-
analysis [26]. Several other explanations for a weak group
size–infectious disease effect should also be considered.
First, it could be that the relevant level of analysis is the
meta-population, and that living in groups—regardless of
how big—acts to ‘quarantine’ infectious agents at the popu-
lation level. Indeed, it is useful to consider subgrouping at
multiple levels: individuals within groups, groups within
populations and even different populations. Rates of contact
between these subdivisions are likely to play important roles
in disease dynamics.
Second, animals in larger groups may invest more in
immune defences, as suggested in a recent study of primate
molecular evolution [67]. However, other studies of primates
have failed to find support for this possibility in comparative
analyses of leucocytes [11–13] or spleen size [68]. These
mixed findings suggest—at least in primates—that individual
immune responses are unlikely to be a major response to
increased disease risk in larger groups, although more
research is clearly needed to rule out such effects. A negative
relationship between sociality and individual immunity may
actually be found in some taxonomic groups where group
level defences occur [16]. Honeybees, for example, have
reduced numbers of immunity and detoxification genes
[69,70], suggesting that highly social systems may shift from
individual physiological immunity to effects at the social
group level [15,71]. This ‘social immunity’ can be enhanced
by behavioural strategies, such as social grooming [17]
and/or isolation or removal of infected individuals. These
behaviours, in turn, can be influenced by group size. In
ants, for example, allogrooming rates [15] and the relative

rstb.royalsocietypublishing.orgPhil.Trans.R.Soc.B
370:20140111
9
on April 13, 2015http://rstb.royalsocietypublishing.org/Downloaded from
performance of maintenance behaviours, such as waste
removal [72], have been shown to increase with group size.
A third possibility is that only a minority of the infectious
agents in wild populations spread from host to host through
social contact; instead, parasites and pathogens of wildlife
may show a proportionally greater occurrence of routes invol-
ving faecal–oral transmission and vector transmission, and
the strength of these transmission pathways may correlate
more weakly with group size. However, theoretical models
indicate that group size covaries with the spread of faecally
transmitted pathogens [73], and a recent meta-analysis
found the strongest effect sizes among vector-transmitted
parasites and pathogens [26]. Hence, this explanation also
appears to fall short, although more research is needed in a
wider array of biological systems.
Finally, social structuring may provide other mechanisms
to generate heterogeneity beyond the measures of network
structure examined here. Genetic variation can theoretically
provide a barrier to disease spread if a subset of related indi-
viduals express immunity, leading to the suggestion that
parasitism may have favoured the evolution of multiple
mating by queens in highly eusocial ant and bee colonies
[15]. In mammalian societies, relatedness could provide sub-
structure if individuals within family groups are more likely
to contact each other, or if dominance rank affects social
interactions. Substructuring may similarly be generated by
differences in behavioural roles and spatial separation
[14,41]. Groups could also substructure by age, as found in
the network structure of honeybee colonies. Older bees,
which are more likely to forage and thus to be exposed to
pathogens in the environment, are more likely to contact
one another than younger bees, and this provides a buffer
against pathogen exposure for younger bees in the hive [41].
Our findings also suggest that research is needed to
identify alternative metrics of group size that account for
network structure. In essence, we need a measure of
effective group size, from the standpoint of disease trans-
mission in a group. Just as effective population size can be
estimated as the harmonic mean of population size over
time, effective group size could be the harmonic mean of
module sizes in a group. Or, simulation approaches could
be used to estimate mean and variance of outbreak size for
groups with different substructuring characteristics. This
was essentially the approach taken by Griffin & Nunn [29],
and it could be extended to parametrize for a specific
infectious agent, including for agents that elicit lasting immu-
nity. Indeed, a single measure of effective group size may be
impossible to obtain, given that different infectious agents
will perceive a group and population differently based on
incubation period, transmissibility, dispersal, immunity and
transmission mode.
A related issue involves development of additional net-
work structure metrics of modularity, and ideally metrics
that are independent of group size. We focused on a
measure—Newman’s modularity—that is proposed to be
independent of group size [36]. However, group size itself
is an important aspect of subgrouping because, for example,
many more possibilities for forming subgroups exist among
30 individuals than among four. Larger groups can also
have more subgroups than smaller groups.
In conclusion, our combined empirical and theoretical
analysis reveals real and potential links between group size,
substructuring and socially transmitted infectious diseases.
Of the network measures we investigated, modularity—
i.e. subgrouping—is one that covaries with group size. It
could be that increased subgrouping is a counterstrategy to
infectious disease risk in larger groups that is shaped by natural
selection, or greater subgrouping could be a simple by-product
of limited amounts of time for interaction in larger groups.
Understanding the mechanisms that generate this pattern is
important for many aspects of sociality, and for understanding
disease dynamics in wildlife populations.
Data accessibility. Data used for the comparative and meta-analyses areprovided in the electronic supplementary material.
Acknowledgements. We thank Daniel Blumstein and RaghavendraGadagkar for providing data, Alexander Vining for help with format-ting the figures, two anonymous referees and Peter Kappeler forcomments on the manuscript.
Funding statement. This research was initiated through a working groupsupported by the National Evolutionary Synthesis Center (NESCent),NSF no. EF-0423641. Training in phylogenetic comparative methodswas provided by the AnthroTree Workshop, which was supported bythe NSF (BCS-0923791) and NESCent. C.M.M. was supportedby Harvard University and the NSF Graduate Research FellowshipProgramme (DGE-1144152).
Authors’ contributions. C.L.N. initiated and guided the research andcrafted the initial manuscript. Network analyses were led by F.J.and C.M.M., with data compilation by C.M.M., F.J., J.L.V. andJ.H.F. Comparative and meta-analyses were led by C.M.M. Epide-miological simulations were led by C.L.N. All authors contributedto the writing of the manuscript and approved its submission.
Conflict of interests. We have no competing interests.
References
1. Freeland WJ. 1979 Primate social groups asbiological islands. Ecology 60, 719 – 728. (doi:10.2307/1936609)
2. Møller AP, Dufva R, Allander K. 1993 Parasites andthe evolution of host social behavior. Adv. Stud.Behav. 22, 65 – 102. (doi:10.1016/S0065-3454(08)60405-2)
3. Loehle C. 1995 Social barriers to pathogentransmission in wild animal populations. Ecology76, 326 – 335. (doi:10.2307/1941192)
4. Altizer S et al. 2003 Social organization andparasite risk in mammals: integrating theory andempirical studies. Annu. Rev. Ecol. Evol. Syst. 34,
517 – 547. (doi:10.1146/annurev.ecolsys.34.030102.151725)
5. Whiteman NK, Parker PG. 2004 Effects of hostsociality on ectoparasite population biology.J. Parasitol. 90, 939 – 947. (doi:10.1645/GE-310R)
6. Ezenwa VO. 2004 Host social behavior and parasiticinfection: a multifactorial approach. Behav. Ecol. 15,446 – 454. (doi:10.1093/beheco/arh028)
7. Davies CR, Ayres JM, Dye C, Deane LM. 1991 Malariainfection rate of Amazonian primates increaseswith body weight and group size. Funct. Ecol. 5,655 – 662. (doi:10.2307/2389485)
8. Nunn CL, Heymann EW. 2005 Malaria infection andhost behaviour: a comparative study of Neotropicalprimates. Behav. Ecol. Sociobiol. 59, 30 – 37. (doi:10.1007/s00265-005-0005-z)
9. Wlasiuk G, Khan S, Switzer W, Nachman M. 2010A history of recurrent positive selection at the toll-like receptor 5 in primates. Mol. Biol. Evol. 26,937 – 949. (doi:10.1093/molbev/msp018)
10. Arnold W, Lichtenstein AV. 1993 Ectoparasiteloads decrease the fitness of alpine marmots(Marmota marmota) but are not a cost ofsociality. Behav. Ecol. 4, 36 – 39. (doi:10.1093/beheco/4.1.36)

rstb.royalsocietypublishing.orgPhil.Trans.R.Soc.B
370:20140111
10
on April 13, 2015http://rstb.royalsocietypublishing.org/Downloaded from
11. Nunn CL, Gittleman JL, Antonovics J. 2000Promiscuity and the primate immune system.Science 290, 1168 – 1170. (doi:10.1126/science.290.5494.1168)
12. Nunn CL. 2002 A comparative study of leukocytecounts and disease risk in primates. Evolution56, 177 – 190. (doi:10.1111/j.0014-3820.2002.tb00859.x)
13. Semple S, Cowlishaw G, Bennett PM. 2002 Immunesystem evolution among anthropoid primates:parasites, injuries and predators. Proc. R. Soc. Lond.B 269, 1031 – 1037. (doi:10.1098/rspb.2001.1950)
14. Naug D, Camazine S. 2002 The role of colonyorganization on pathogen transmission in socialinsects. J. Theor. Biol. 215, 427 – 439. (doi:10.1006/jtbi.2001.2524)
15. Schmid-Hempel P. 1998 Parasites in social insects.Princeton, NJ: Princeton University Press.
16. Meunier J. 2015 Social immunity and the evolutionof group living in insects. Phil. Trans. R. Soc. B 370,20140102. (doi:10.1098/rstb.2014.0102)
17. Theis FJ, Ugelvig LV, Marr C, Cremer S. 2015Opposing effects of allogrooming on diseasetransmission in ant societies. Phil. Trans. R. Soc. B370, 20140108. (doi:10.1098/rstb.2014.0108)
18. Otterstatter MC, Thomson JD. 2007 Contactnetworks and transmission of an intestinalpathogen in bumble bee (Bombus impatiens)colonies. Oecologia 154, 411 – 421. (doi:10.1007/s00442-007-0834-8)
19. Rosengaus RB, Maxmen AB, Coates LE, Traniello JF.1998 Disease resistance: a benefit of sociality in thedampwood termite Zootermopsis angusticollis(Isoptera: Termopsidae). Behav. Ecol. Sociobiol. 44,125 – 134. (doi:10.1007/s002650050523)
20. Eischen FA. 1987 Overwintering performance ofhoney bee colonies heavily infested with Acarapiswoodi (Rennie). Apidologie 18, 293 – 304. (doi:10.1051/apido:19870401)
21. Jeffree E, Allen D. 1956 The influence of colony sizeand of nosema disease on the rate of populationloss in honey bee colonies in winter 1. J. Econ.Entomol. 49, 831 – 834. (doi:10.1093/jee/49.6.831)
22. Mooring MS, Hart BL. 1992 Animal grouping forprotection from parasites: selfish herd andencounter-dilution effects. Behaviour 123,173 – 193. (doi:10.1163/156853992X00011)
23. Cote IM, Poulin R. 1995 Parasitism and group size insocial animals: a meta-analysis. Behav. Ecol. 6,159 – 165. (doi:10.1093/beheco/6.2.159)
24. Rubenstein DI, Hohmann ME. 1989 Parasites andsocial behavior of island feral horses. Oikos 55,312 – 320. (doi:10.2307/3565589)
25. Bordes F, Blumstein DT, Morand S. 2007 Rodentsociality and parasite diversity. Biol. Lett. 3,692 – 694. (doi:10.1098/rsbl.2007.0393)
26. Rifkin J, Nunn CL, Garamszegi LZ. 2012 Do animalsliving in larger groups experience greaterparasitism? A meta-analysis. Am. Nat. 180, 70 – 82.(doi:10.1086/666081)
27. Patterson JEH, Ruckstuhl KE. 2013 Parasite infectionand host group size: a meta-analytical review.
Parasitology 140, 803 – 813. (doi:10.1017/S0031182012002259)
28. Cohen J. 1988 Statistical power analysis for thebehavioral sciences, 2nd edn. Hillsdale, NJ: ErlbaumAssociates.
29. Griffin R, Nunn CL. 2011 Community structure andthe spread of infectious disease in primate socialnetworks. Evol. Ecol. 26, 779 – 800. (doi:10.1007/s10682-011-9526-2)
30. Salathe M, Jones JH. 2010 Dynamics and control ofdiseases in networks with community structure.PLoS Comput. Biol. 6, e1000736. (doi:10.1371/journal.pcbi.1000736)
31. Rushmore J, Caillaud D, Hall RJ, Stumpf RM, MeyersLA, Altizer S. 2014 Network-based vaccinationimproves prospects for disease control in wildchimpanzees. J. R. Soc. Interface 11, 20140349.(doi:10.1098/rsif.2014.0349)
32. Carne C, Semple S, Morrogh-Bernard H, ZuberbuhlerK, Lehmann J. 2014 the risk of disease to greatapes: simulating disease spread in orang-utan(Pongo pygmaeus wurmbii) and chimpanzee (Pantroglodytes schweinfurthii) association networks.PLoS ONE 9, e95039. (doi:10.1371/journal.pone.0095039)
33. Nunn CL. 2011 The comparative approach inevolutionary anthropology and biology. Chicago, IL:University of Chicago Press.
34. Garamszegi LZ. 2014 Modern phylogeneticcomparative methods and their application inevolutionary biology. Berlin, Germany: Springer.
35. Craft ME. 2015 Infectious disease transmission andcontact networks in wildlife and livestock. Phil.Trans. R. Soc. B 370, 20140107. (doi:10.1098/rstb.2014.0107)
36. Newman ME. 2006 Modularity and communitystructure in networks. Proc. Natl Acad. Sci. USA 103,8577 – 8582. (doi:10.1073/pnas.0601602103)
37. Kreimer A, Borenstein E, Gophna U, Ruppin E. 2008The evolution of modularity in bacterial metabolicnetworks. Proc. Natl Acad. Sci. USA 105, 6976 –6981. (doi:10.1073/pnas.0712149105)
38. R Development Core Team. 2014 R: A language andenvironment for statistical computing. Vienna,Austria: R Foundation for Statistical Computing.
39. Csardi G, Nepusz T. 2006 The igraph softwarepackage for complex network research.InterJournal Complex Syst. 1695.
40. Newman ME, Watts DJ. 1999 Scaling and percolationin the small-world network model. Phys. Rev. E 60,7332. (doi:10.1103/PhysRevE.60.7332)
41. Naug D. 2008 Structure of the social network andits influence on transmission dynamics in ahoneybee colony. Behav. Ecol. Sociobiol. 62,1719 – 1725. (doi:10.1007/s00265-008-0600-x)
42. Borgatti SP, Everett MG, Freeman LC. 2002 UCINETfor WINDOWS: software for social network analysis.Lexington, KY: Analytic Technologies.
43. Opsahl T, Agneessens F, Skvoretz J. 2010 Nodecentrality in weighted networks: Generalizingdegree and shortest paths. Soc. Netw. 32,245 – 251. (doi:10.1016/j.socnet.2010.03.006)
44. Dijkstra EW. 1959 A note on two problems inconnexion with graphs. Numer. Math. 1, 269 – 271.(doi:10.1007/BF01386390)
45. Opsahl T. 2009 Structure and evolution of weightednetworks. London, UK: Queen Mary University of London.
46. Bonabeau E, Dagorn L, Freon P. 1999 Scaling inanimal group-size distributions. Proc. Natl Acad. Sci.USA 96, 4472 – 4477. (doi:10.1073/pnas.96.8.4472)
47. Kasper C, Voelkl B. 2009 A social network analysisof primate groups. Primates 50, 343 – 356. (doi:10.1007/s10329-009-0153-2)
48. Borenstein M, Hedges L, Higgins J, Rothstein H.2005 Comprehensive meta-analysis, 2nd edn.Englewood, NJ: Biostat.
49. Lajeunesse M. 2009 Meta Analysis and theComparative Phylogenetic Method. Am. Nat. 174,369 – 381. (doi:10.1086/603628)
50. Lajeunesse MJ. 2011 phyloMeta: a program forphylogenetic comparative analyses with meta-analysis. Bioinformatics 27, 2603 – 2604. (doi:10.1093/bioinformatics/btr438)
51. Orme D, Freckleton R, Thomas G, Petzoldt T, Fritz S,Isaac N. 2011 caper: comparative analyses ofphylogenetics and evolution in R. See http://R-Forge.R-project.org/projects/caper/.
52. Pagel M. 1999 Inferring the historical patterns ofbiological evolution. Nature 401, 877 – 884. (doi:10.1038/44766)
53. Freckleton RP, Harvey PH, Pagel M. 2002Phylogenetic analysis and comparative data: a testand review of evidence. Am. Nat. 160, 712 – 726.(doi:10.1086/343873)
54. Bininda-Emonds ORP et al. 2007 The delayed rise ofpresent-day mammals. Nature 446, 507 – 512.(doi:10.1038/nature05634)
55. Hedges SB, Dudley J, Kumar S. 2006 TimeTree: apublic knowledge-base of divergence times amongorganisms. Bioinformatics 22, 2971 – 2972. (doi:10.1093/bioinformatics/btl505)
56. Brady SG, Schultz TR, Fisher BL, Ward PS. 2006Evaluating alternative hypotheses for the earlyevolution and diversification of ants. Proc. NatlAcad. Sci. USA 103, 18 172 – 18 177. (doi:10.1073/pnas.0605858103)
57. Nunn CL, Thrall PH, Stewart K, Harcourt AH. 2008Emerging infectious diseases and animal socialsystems. Evol. Ecol. 22, 519 – 543. (doi:10.1007/s10682-007-9180-x)
58. Nunn CL, Thrall PH, Bartz K, Dasgupta T, Boesch C.2009 Do transmission mechanisms or social systemsdrive cultural dynamics in socially structuredpopulations? Anim. Behav. 77, 1515 – 1524. (doi:10.1016/j.anbehav.2009.02.023)
59. Seaholm SK, Ackerman E, Wu SC. 1988 Latinhypercube sampling and the sensitivity analysis of aMonte-Carlo epidemic model. Int. J. Bio-Med.Comput. 23, 97 – 112. (doi:10.1016/0020-7101(88)90067-0)
60. Blower SM, Dowlatabadi H. 1994 Sensitivity anduncertainty analysis of complex-models of diseasetransmission—an HIV model, as an example. Int.Stat. Rev. 62, 229 – 243. (doi:10.2307/1403510)

rstb.royalsocietypublishing.orgPhil.Trans.R.Soc
11
on April 13, 2015http://rstb.royalsocietypublishing.org/Downloaded from
61. Rushton SP, Lurz PWW, Gurnell J, Fuller R. 2000Modelling the spatial dynamics of parapoxvirus diseasein red and grey squirrels: a possible cause of the declinein the red squirrel in the UK? J. Appl. Ecol. 37, 997 –1012. (doi:10.1046/j.1365-2664.2000.00553.x)
62. Burnham KP, Anderson DR. 2002 Model selectionand multimodel inference: a practical information-theoretic approach. Berlin, Germany: Springer
63. Barton K. 2011 MuMIn: Multi-model inference. Rpackage version 1.6.5. Vienna, Austria: R Foundationfor Statistical Computing.
64. Fletcher TD. 2012 QuantPsyc: quantitativepsychology tools. R package version 1.5. Vienna,Austria: R Foundation for Statistical Computing.
65. Gramacy RB. 2007 tgp: an R package for Bayesiannonstationary, semiparametric nonlinear regression
and design by treed Gaussian process models.J. Stat. Soft. 19, 6.
66. Gramacy RB, Taddy M. 2012 Categorical inputs,sensitivity analysis, optimization and importancetempering with tgp version 2, an R package for treedGaussian process models. J. Stat. Soft. 33, 1 – 48.
67. Wlasiuk G, Nachman M. 2010 Promiscuity and therate of molecular evolution at primate immunitygenes. Evolution 64, 2204 – 2220. (doi:10.1111/j.1558-5646.2010.00989.x)
68. Nunn CL. 2002 Spleen size, disease risk and sexualselection: a comparative study in primates. Evol.Ecol. Res. 4, 91 – 107.
69. Weinstock GM et al. 2006 Insights into social insectsfrom the genome of the honeybee Apis mellifera.Nature 443, 931 – 949. (doi:10.1038/nature05260)
70. Evans J et al. 2006 Immune pathways and defencemechanisms in honey bees Apis mellifera. InsectMol. Biol. 15, 645 – 656. (doi:10.1111/j.1365-2583.2006.00682.x)
71. Cremer S, Armitage SA, Schmid-Hempel P. 2007Social immunity. Curr. Biol. 17, R693 – R702.(doi:10.1016/j.cub.2007.06.008)
72. Holbrook C, Eriksson T, Overson R, Gadau J,Fewell J. 2013 Colony-size effects on taskorganization in the harvester ant Pogonomyrmexcalifornicus. Insect. Soc. 60, 191 – 201. (doi:10.1007/s00040-013-0282-x)
73. Nunn CL, Thrall PH, Leendertz FH, Boesch C. 2011The spread of fecally transmitted parasites insocially-structured populations. PLoS ONE 6, e21677.(doi:10.1371/journal.pone.0021677)
.
B3 70:20140111