Inequality in access, progress and completion in higher education in Serbia: Definitions,...
16
Inequality in access, progress and completion in higher education in Serbia: Definitions, measurements, inferences INTRODUCTION Inequality in education is primarily analysed in relationship with inequality in society as such, i.e. inequality in socio-economic background, class or status, as well as inequality in ethnic or racial background. The two main streams of research of this relationship can be identified: one focusing on the effects of the socio-economic background (SEB) on education careers and attainment, and the other focusing on the impact of education on social mobility, i.e. increasing one’s social status or class. Given specificities of the Serbian context, especially in the period under study which relates to fast economic and political transition that could lead to short and mid-term shifts in the labour market and the related status of professions, the often used approach that uses professional status of parents as indication of student’s SEB was abandoned. Instead, following a number of studies that focused on similar issues (Archer et al, 2003; Marks, 2005; Morrow and Torres, 1994; Peck, 2001) the study adopted a multi-dimensional perspective on SEB consisting of a number of elements: gender, age, race/ethnicity 1 , education of parents, employment and professional status of parents, citizenship, participation in cultural events, possession or access to high culture at home, participation of both student and parents in social networks, etc. In that respect, they tend to advocate an analysis of the direct effects various student characteristics have on their (higher) education career as well as an analysis of possible interaction between these characteristics and their joint influence on the career in (higher) education. This implies that it would be essential to approach the issue of stratification in more complex terms than just professional status or educational attainment of parents, i.e. to include other student characteristics in defining disadvantaged social groups. However, this is possible only if data on such elements is collected in a systematic manner, which is not the case in Serbia. The current classification of occupations originates from the socialist times and is not really useful for analysing occupational status. Other data, e.g. access to high culture, is not collected and some data (e.g. employment of students) is not reliable due to a significant grey economy. These are the reasons why the study presented here used only the education of parents as a reliable element of SEB. It should be noted that the multi-dimensional perspective does not necessarily preclude ranking in terms of SEB, since individual elements of SEB can be ranked in categories, and, depending on the complexity of the specific context, the combination of these elements can also be ranked in a similar way. This approach would also allow for analysis of the relative impact different elements of SEB can have on access, progress and completion of higher education. Research on the effects of SEB on education careers and attainment is mostly motivated by the understanding that not all social groups or social classes are equal in this respect, i.e. that there is stratification in education which is, more or less, and for a variety of reasons, reflecting the stratification in society. Such studies may be, in broad terms, based on quantitative analysis of large samples and include statistical modelling, sometimes for comparative purposes (for example Müller and Karle, 1993; HEFCE, 2005; Wong, 1998); or be in the form of
Transcript of Inequality in access, progress and completion in higher education in Serbia: Definitions,...
Inequality in access, progress and completion in higher
education in Serbia: Definitions, measurements, inferences
INTRODUCTION
Inequality in education is primarily analysed in relationship with inequality in society as such, i.e. inequality in
socio-economic background, class or status, as well as inequality in ethnic or racial background. The two main
streams of research of this relationship can be identified: one focusing on the effects of the socio-economic
background (SEB) on education careers and attainment, and the other focusing on the impact of education on
social mobility, i.e. increasing one’s social status or class.
Given specificities of the Serbian context, especially in the period under study which relates to fast economic
and political transition that could lead to short and mid-term shifts in the labour market and the related status of
professions, the often used approach that uses professional status of parents as indication of student’s SEB was
abandoned. Instead, following a number of studies that focused on similar issues (Archer et al, 2003; Marks,
2005; Morrow and Torres, 1994; Peck, 2001) the study adopted a multi-dimensional perspective on SEB
consisting of a number of elements: gender, age, race/ethnicity1, education of parents, employment and
professional status of parents, citizenship, participation in cultural events, possession or access to high culture at
home, participation of both student and parents in social networks, etc. In that respect, they tend to advocate an
analysis of the direct effects various student characteristics have on their (higher) education career as well as an
analysis of possible interaction between these characteristics and their joint influence on the career in (higher)
education.
This implies that it would be essential to approach the issue of stratification in more complex terms than just
professional status or educational attainment of parents, i.e. to include other student characteristics in defining
disadvantaged social groups. However, this is possible only if data on such elements is collected in a systematic
manner, which is not the case in Serbia. The current classification of occupations originates from the socialist
times and is not really useful for analysing occupational status. Other data, e.g. access to high culture, is not
collected and some data (e.g. employment of students) is not reliable due to a significant grey economy. These
are the reasons why the study presented here used only the education of parents as a reliable element of SEB.
It should be noted that the multi-dimensional perspective does not necessarily preclude ranking in terms of
SEB, since individual elements of SEB can be ranked in categories, and, depending on the complexity of the
specific context, the combination of these elements can also be ranked in a similar way. This approach would
also allow for analysis of the relative impact different elements of SEB can have on access, progress and
completion of higher education.
Research on the effects of SEB on education careers and attainment is mostly motivated by the understanding
that not all social groups or social classes are equal in this respect, i.e. that there is stratification in education
which is, more or less, and for a variety of reasons, reflecting the stratification in society. Such studies may be, in
broad terms, based on quantitative analysis of large samples and include statistical modelling, sometimes for
comparative purposes (for example Müller and Karle, 1993; HEFCE, 2005; Wong, 1998); or be in the form of
2
qualitative studies using interviews or surveys, therefore more psychological or ethnographical in nature (for
example Ball, 2002; Bowl, 2003; Fuller et al., 2004). In addition to elements of the SEB, other independent
variables may include various operationalisations of personal motivations and expectations, as well as
characteristics of the higher education system: tracking, criteria and procedures for enrolment into the next stage
of education, etc.
The links between stratification in society and educational stratification has been discussed in a large number
of research studies (Lucas, 2001; Müller and Karle, 1993; Raftery and Hout, 1993; Wong, 1998). In line with
Bourdieu and Passeron (1990), one could argue that, since the education system is formed and organised by the
(social) group that is in the possession of power, it also seeks to reproduce the same distribution of power in the
society and hence, reproduce social inequality2. In terms of instruments that the group in the possession of power
has at its disposal, Bourdieu (1986) defines various forms of capital: social capital, cultural capital and economic
capital. While the economic capital is relatively easy to operationalise through wealth or earnings, the other two
forms of capital are more difficult to quantify. Furthermore, the exchange of social and cultural capital for
economic capital, and vice versa, is less visible. Such problems with tangibility of social and cultural capital
make it more difficult to develop an education system that is not characterised by educational stratification.
The nature and scope of inequality in education in a particular system and context is not of relevance only for
higher education research as such, but also for policy debates in light of ongoing higher education reforms. In
this respect, it is of interest that one of the key arguments in favour of Serbia joining the Bologna process (on the
side of decision-makers as well as parts of the academic community), is the understanding that the reforms of the
degree structure and the focus on learning outcomes and student workload would increase the efficiency and
effectiveness of higher education in Serbia. Higher education in Serbia, at least until the adoption of the new law
on higher education in 20053, was marked by high dropout rates (estimated to be around 45%), long expected
duration of studies (4-6 years for the first degree) and prolonged time until actual completion (6.76 years for 4-
year studies and 7.62 for 6-year studies). In addition to this, since tuition is free of charge for a portion of
students in public institutions and due to almost nonexistent studies in the field of economics of higher
education, the system is considered to be rather fair and equitable by many stakeholders. Neither the higher
education institutions nor the system level authorities monitor for possible effects of the SEB on access, progress
and completion of higher education, despite the fact that some data related to this has been continuously
collected by the Statistical Office of Serbia. Therefore, in light of the lack of studies on this issue, and the largely
ungrounded assumptions about the higher education system which guide the policy making and reforms, it is of
significant importance to analyse the nature and scope of inequality in higher education in Serbia, to discuss
available data and offer suggestions for improvement of data collection and analysis.
The data used in the study consist of official statistics regarding enrolment and completion of higher
education undergraduate programmes (a standardised form completed by each student when enrolling into a year
of study or completing first degrees); as well as statistical data related to general demography or education as a
whole. The period chosen for the study is limited to 2000-2005, since this period is marked by relative stability
in terms of external conditions: no significant strikes, no disruptions of the academic year, student or wider
3
political protests took place in this period, unlike for the period prior to 2000. As the new Law on higher
education was adopted in August 2005, data after 2005 would not be comparable to the 2000-2005 period due to
different study structures.
The paper begins with a discussion on the definition of inequality, and the corresponding terms of
disadvantage, exclusion and under-representation. It continues to discuss what, when and how to measure, if the
goal is to analyse inequality within a given higher education system. The conclusion briefly discusses inferences
from such measures.
DEFINING INEQUALITY
Inequality as a lack of equality of opportunity
Inequality can be understood as the absence of equality, primarily in terms of equality of opportunities. Equality
of opportunity first and foremost relates to access, in this case, to higher education, i.e. whether all students
interested in enrolling in higher education can do so. This equality is primarily restricted by limited capacities of
higher education institutions. In the case of Serbia, in order to be eligible to apply for a place in a higher
education institution, a person must have completed 4-year secondary education (comprehensive or vocational).
Furthermore, s/he needs to pass an entrance exam and, given the existence of numeri clausi, needs to be ranked
within the total quota to be admitted into an undergraduate programme in a particular institution. Having in mind
that the GER4 for 4-year secondary education is around 77%
5, dropout from secondary education is around
2.3%6 and that the GER for higher education is 37.8%
7, it is obvious that all who complete 4-year secondary
education cannot enrol into higher education institutions within Serbia. Some secondary school graduates may
have the intention to go directly to the labour market so they would not even consider applying for a position in
higher education. However, the labour market data identifying those who enter the labour market immediately
after completing secondary education are not readily available. Furthermore, the organisation of competition for
positions in specific institutions is not centralised (each higher education institution organises a call and entrance
exam for their own programmes separately), and thus it is not possible to have common data on how many
students compete for a particular place in a given institution8. Nevertheless, even without such data it is possible
to identify several elements of the process of enrolment into higher education that pose obstacles to equality:
First, entrance exams are organised by individual faculties in their own headquarters. Students living outside of
such university centres have additional costs of travel and possibly accommodation in order to sit for the
entrance exams. Second, faculties charge fees for administering entrance exams. This may be a significant
expense for students of modest economic means. Third, faculties often organise preparatory courses for their
entrance exams for which they charge fees9. Similar to the two previous examples, these courses may be an
obstacle for students living outside university centres or students without sufficient economic means. Underlying
all these elements is the question to what extent criteria for enrolment based on merit from previous stages of
education is associated with elements of socio-economic background (SEB).
4
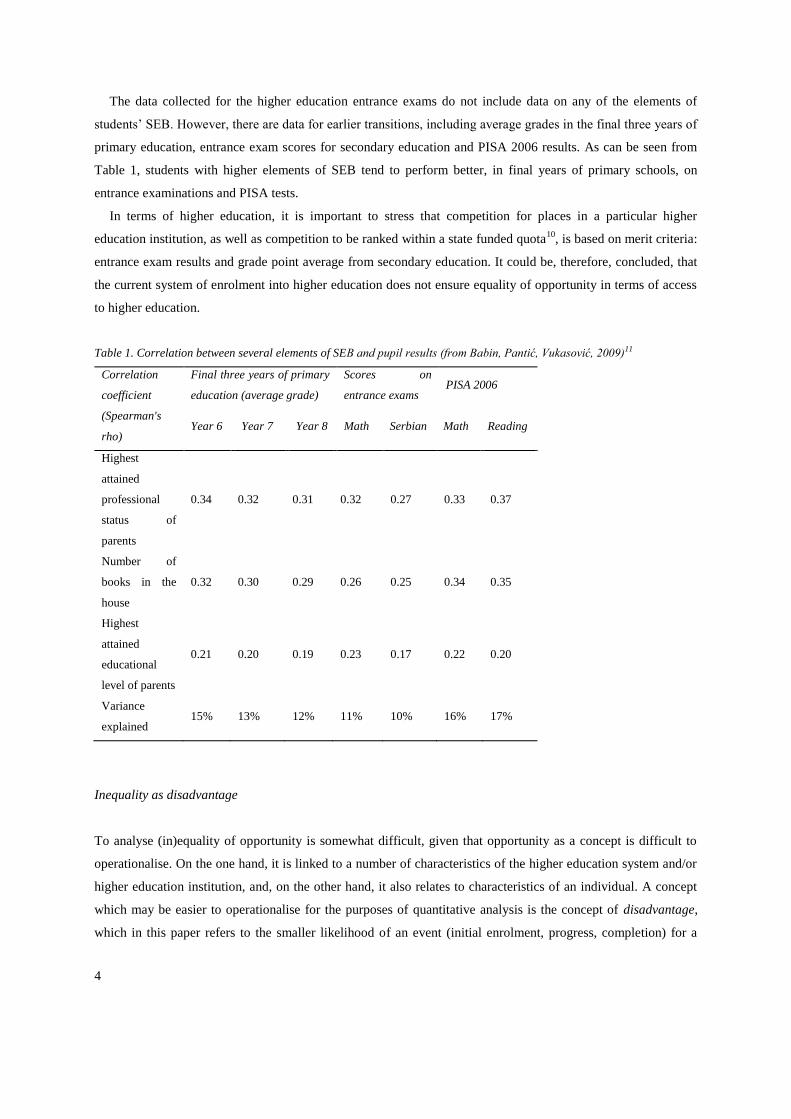
The data collected for the higher education entrance exams do not include data on any of the elements of
students’ SEB. However, there are data for earlier transitions, including average grades in the final three years of
primary education, entrance exam scores for secondary education and PISA 2006 results. As can be seen from
Table 1, students with higher elements of SEB tend to perform better, in final years of primary schools, on
entrance examinations and PISA tests.
In terms of higher education, it is important to stress that competition for places in a particular higher
education institution, as well as competition to be ranked within a state funded quota10
, is based on merit criteria:
entrance exam results and grade point average from secondary education. It could be, therefore, concluded, that
the current system of enrolment into higher education does not ensure equality of opportunity in terms of access
to higher education.
Table 1. Correlation between several elements of SEB and pupil results (from Babin, Pantić, Vukasović, 2009)11
Correlation
coefficient
(Spearman's
rho)
Final three years of primary
education (average grade)
Scores on
entrance exams PISA 2006
Year 6 Year 7 Year 8 Math Serbian Math Reading
Highest
attained
professional
status of
parents
0.34 0.32 0.31 0.32 0.27 0.33 0.37
Number of
books in the
house
0.32 0.30 0.29 0.26 0.25 0.34 0.35
Highest
attained
educational
level of parents
0.21 0.20 0.19 0.23 0.17 0.22 0.20
Variance
explained 15% 13% 12% 11% 10% 16% 17%
Inequality as disadvantage
To analyse (in)equality of opportunity is somewhat difficult, given that opportunity as a concept is difficult to
operationalise. On the one hand, it is linked to a number of characteristics of the higher education system and/or
higher education institution, and, on the other hand, it also relates to characteristics of an individual. A concept
which may be easier to operationalise for the purposes of quantitative analysis is the concept of disadvantage,
which in this paper refers to the smaller likelihood of an event (initial enrolment, progress, completion) for a
5
student with certain characteristics. For example, a student A is considered to be disadvantaged in terms of
enrolment into higher education compared to student B, if data show that A is less likely to enrol than B, given
the analysis of the actual student population (as will be presented within this paper).
The consequence of such disadvantage is exclusion. Exclusion can be seen as absolute and relative. Absolute
exclusion would refer to the situation in which a certain social group is not at all represented in higher education,
even though such a social group can easily be identified in society. For example, the Roma population in Serbia
is almost absolutely excluded (not just) from higher education: although official statistics report that Roma
constitute 1.44% of the population, their participation in higher education is less than 0.1% (Vukasović,
2007:71)12
.
Exclusion can also take the form of under-representation and thus can be labelled as “relative exclusion”. This
situation occurs if the proportion of the social group in higher education with respect to the total number of
students is less than the proportion of that social group with respect to the overall population. An example from
Serbia would be the Hungarians, who constitute 4% of the total population of Serbia, but only 2% of student
enrolments. Another example are students whose parents have primary education as their highest level of
education attained: while there are approx. 21% of such individuals in the active population over 35 years of age,
there are only 7% of students whose parents have primary school as their highest education qualification in the
total student population (Vukasović, 2007:71)13
.
The presented understanding of exclusion is primarily quantitative, i.e. it considers only the quantity of the
members of a certain social group in higher education in general. Such understanding of exclusion resonates with
the hypothesis of maximally maintained inequality (MMI):
“… transition rates and odds ratios between social origin and educational transitions remain the same from
cohort to cohort unless they are forced to change by increasing enrolments” (Raftery and Hout, 1993:56)
As presented in Wong (1998), once the earlier stages of education become accessible to all regardless of their
social status or background, as is the case in industrialised countries (although to a lesser extent in Serbia, see
Babin, Pantić, Vukasović, 2009), the selection shifts to the stage of higher education, in terms of limiting access
to students from poorer socio-economic backgrounds. The MMI hypothesis therefore implies that those of a less
privileged SEB will be under-represented or even not at all represented in higher education, i.e. they will be
externally excluded until the demand for higher education of more privileged SEB is satisfied.
In addition to this, the quality of learning outcomes may also vary from institution to institution. Furthermore,
there may be differences between different fields of study: (a) implicit, e.g. in terms of assigned prestige or (b)
explicit, e.g. in terms of expected earnings upon graduation. Therefore, equality of opportunities in terms of
access, and the related (dis)advantage and exclusion does not relate only to the dichotomy “in” or “not in” higher
education, but also to the type of institution and the study field. In this respect, the MMI hypothesis is not
sufficient to analyse such qualitative differences, and one may find the hypothesis of effectively maintained
inequality (EMI) (Lucas, 2001) better suited to account for what can be labelled as internal exclusion.
Internal exclusion refers to the situation in which a particular social group in question may be adequately
represented in higher education in general (with respect to the population as a whole), but under-represented in
6
more prestigious types of higher education or different fields. This means that the EMI hypothesis is useful to
analyse tracking in education systems:
– explicit tracking, in which the completion of a specific type of secondary education is a rigid explicit
requirement for access to a specific type of higher education, and
– implicit tracking, in which these requirements may not be explicitly stated but the transition from one stage to
the next, due to conditions of transition, results in tracking.
The EMI hypothesis points strongly to earlier stages in education, and underscores the importance of
analysing the inequalities in higher education as a (partial) consequence of inequality accumulated in previous
education. It is worth stressing that, in this respect, the Life Course Perspective (LCP) postulated that the effect
of SEB of individuals will be stronger for earlier education transitions. This is predominantly explained through
waning influence of parents over their children as they grow older.
In terms of (lack of) equality of outcomes, or equality of success, it should be stressed that most of the
analysis on inequality in education focuses on input, or entrance points. This may be due to difficulties in
choosing an appropriate operationalisation of outcome (which will be discussed in section 3). Another reason
could lie in the problems with reliability and validity of data on progress and completion of higher education,
particularly in Serbia. Nevertheless, all such measures focus on visible (and measurable) events on the education
pathway, while inequality in quality of outcomes, i.e. added value in terms of attained knowledge, competences
and skills, personal development, motivation etc. is less visible, difficult to operationalise and, hence, measure.
MEASURING INEQUALITY
In order to assess the nature and scope of inequality in higher education, the following questions arise: How to
operationalise inequality, i.e. what to measure? When to measure, i.e. what events/occurrences reveal
inequalities the most? How to measure, i.e. which data collection mechanisms are implemented?
What to measure?
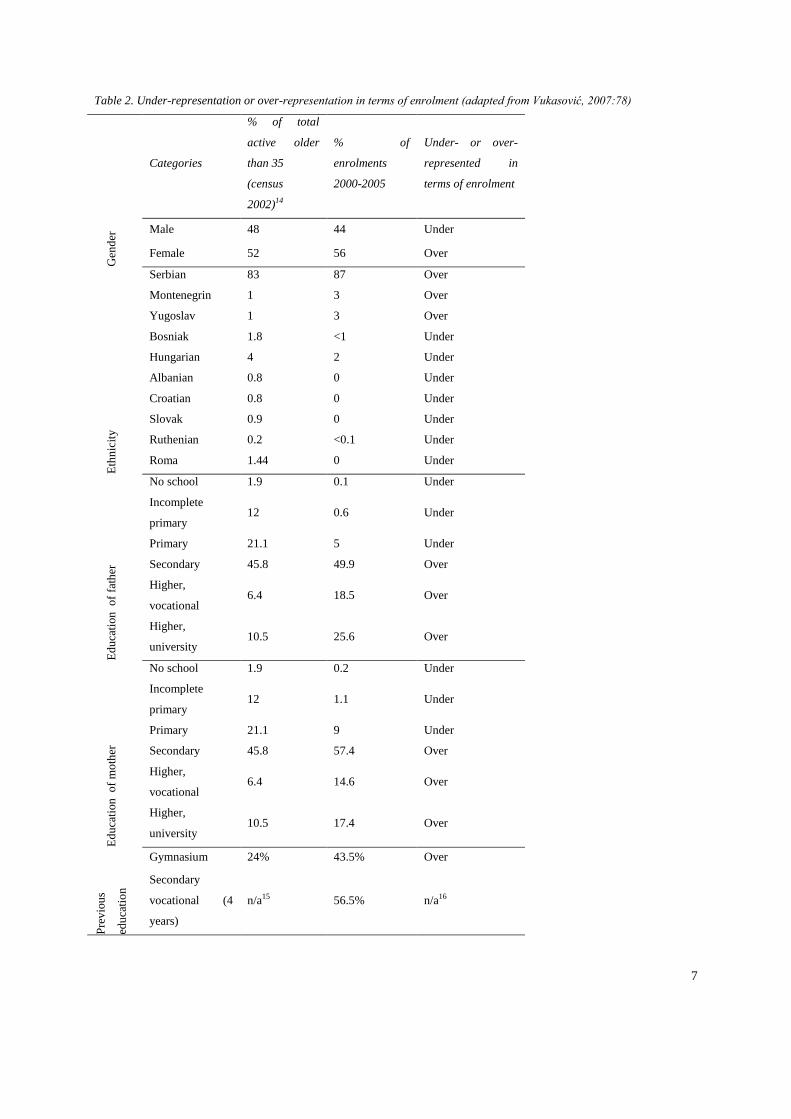
Enrolment into higher education. This question relates to the previous discussion on the aspects of inequality,
disadvantage and under-representation. Many studies focus on participation rates in higher education, to
illustrate problems for equality of opportunity. In the case of Serbia, this is illustrated in Table 2, based on data
for 2000-2005 period.
7
Table 2. Under-representation or over-representation in terms of enrolment (adapted from Vukasović, 2007:78)
Categories
% of total
active older
than 35
(census
2002)14
% of
enrolments
2000-2005
Under- or over-
represented in
terms of enrolment
Gen
der
Male 48 44 Under
Female 52 56 Over
Eth
nic
ity
Serbian 83 87 Over
Montenegrin 1 3 Over
Yugoslav 1 3 Over
Bosniak 1.8 <1 Under
Hungarian 4 2 Under
Albanian 0.8 0 Under
Croatian 0.8 0 Under
Slovak 0.9 0 Under
Ruthenian 0.2 <0.1 Under
Roma 1.44 0 Under
Ed
uca
tion
o
f fa
ther
No school 1.9 0.1 Under
Incomplete
primary 12 0.6 Under
Primary 21.1 5 Under
Secondary 45.8 49.9 Over
Higher,
vocational 6.4 18.5 Over
Higher,
university 10.5 25.6 Over
Ed
uca
tion
o
f m
oth
er
No school 1.9 0.2 Under
Incomplete
primary 12 1.1 Under
Primary 21.1 9 Under
Secondary 45.8 57.4 Over
Higher,
vocational 6.4 14.6 Over
Higher,
university 10.5 17.4 Over
Pre
vio
us
edu
cati
on
Gymnasium 24% 43.5% Over
Secondary
vocational (4
years)
n/a15 56.5% n/a16
8
It shows that groups that are under-represented in higher education, with respect to their proportion in the
overall population, are: men, a number of ethnic minorities (predominantly those ethnic groups with non-
Christian Orthodox denomination), students whose fathers and mothers have less than secondary level education
certificates and students who completed secondary vocational education.
As was discussed earlier, the different categories often interact with each other. For example, studies (Babin,
Pantić, Vukasović, 2009) have shown that students whose parents have lower educational attainment are under-
represented in gymnasiums as well, so the under-representation we can observe in higher education is, in fact, a
result of their under-representation in earlier stages of education, coupled with further selection between
secondary and higher education. Unfortunately, due to the lack of longitudinal studies, it is not possible to
adequately analyse the differences in extent of under-representation from one educational transition to the other.
In terms of ethnic background, the interpretation of results presented in Table 2 needs to take into account
additional factors. For example, the Hungarians seem to be under-represented in higher education in Serbia.
However, this does not necessarily mean that some Hungarians living in Serbia do not go into higher education,
since they can (and do) enrol into higher education institutions in the neighbouring Hungary, to study in their
mother tongue17
, often with some financial aid. A different story is with the Roma population18
, who, due to their
living conditions, are under-represented in all stages of education and are affected by significant lack of support
and thus dropout rather early and in great numbers19
. Contrary to the Hungarians, Roma have no “motherland” or
other option in the neighbouring countries when it comes to access to (higher) education and therefore are
severely disadvantaged in terms of access to any (higher) education provision.
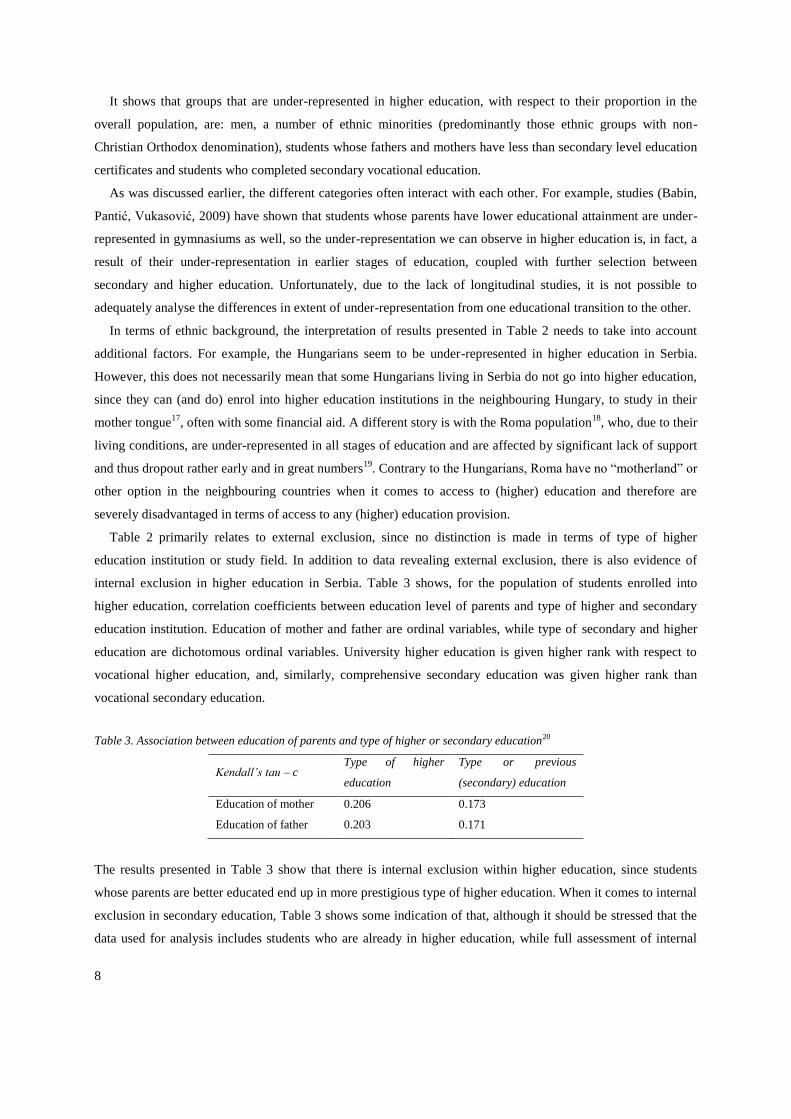
Table 2 primarily relates to external exclusion, since no distinction is made in terms of type of higher
education institution or study field. In addition to data revealing external exclusion, there is also evidence of
internal exclusion in higher education in Serbia. Table 3 shows, for the population of students enrolled into
higher education, correlation coefficients between education level of parents and type of higher and secondary
education institution. Education of mother and father are ordinal variables, while type of secondary and higher
education are dichotomous ordinal variables. University higher education is given higher rank with respect to
vocational higher education, and, similarly, comprehensive secondary education was given higher rank than
vocational secondary education.
Table 3. Association between education of parents and type of higher or secondary education20
Kendall’s tau – c Type of higher
education
Type or previous
(secondary) education
Education of mother 0.206 0.173
Education of father 0.203 0.171
The results presented in Table 3 show that there is internal exclusion within higher education, since students
whose parents are better educated end up in more prestigious type of higher education. When it comes to internal
exclusion in secondary education, Table 3 shows some indication of that, although it should be stressed that the
data used for analysis includes students who are already in higher education, while full assessment of internal
9
exclusion within secondary education can be made only on the basis of analysis of complete data for secondary
school population.
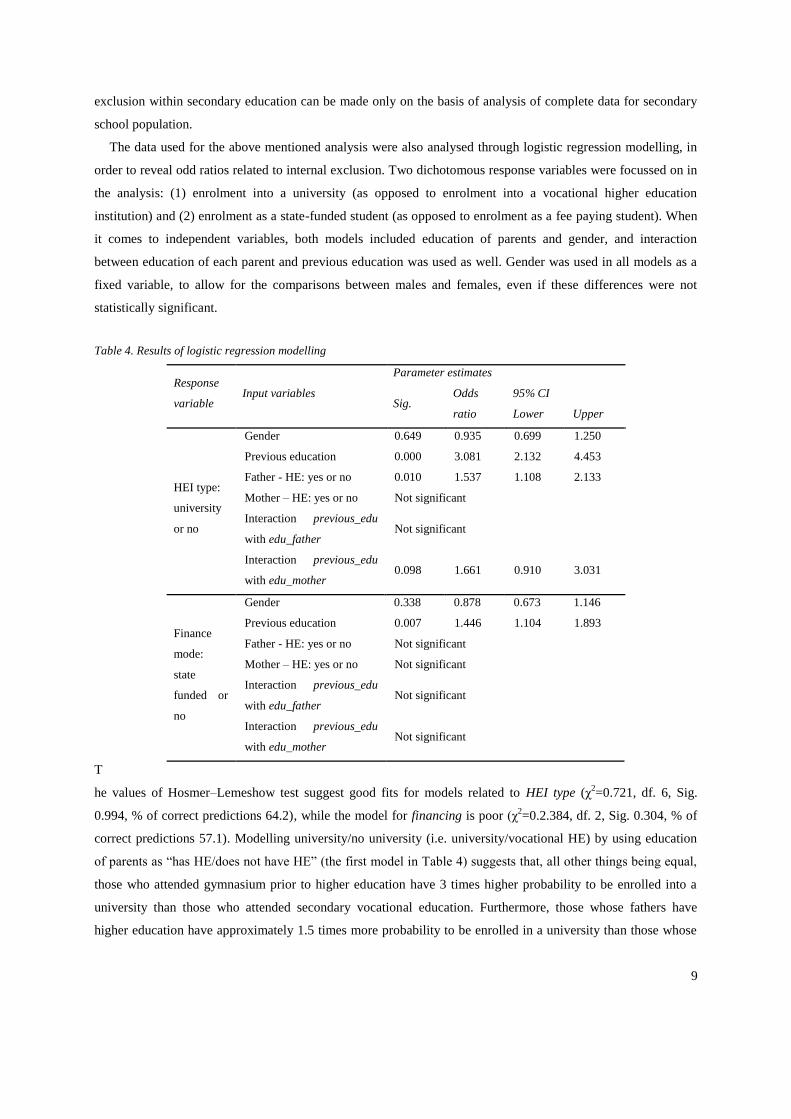
The data used for the above mentioned analysis were also analysed through logistic regression modelling, in
order to reveal odd ratios related to internal exclusion. Two dichotomous response variables were focussed on in
the analysis: (1) enrolment into a university (as opposed to enrolment into a vocational higher education
institution) and (2) enrolment as a state-funded student (as opposed to enrolment as a fee paying student). When
it comes to independent variables, both models included education of parents and gender, and interaction
between education of each parent and previous education was used as well. Gender was used in all models as a
fixed variable, to allow for the comparisons between males and females, even if these differences were not
statistically significant.
Table 4. Results of logistic regression modelling
Response
variable Input variables
Parameter estimates
Sig. Odds
ratio
95% CI
Lower Upper
HEI type:
university
or no
Gender 0.649 0.935 0.699 1.250
Previous education 0.000 3.081 2.132 4.453
Father - HE: yes or no 0.010 1.537 1.108 2.133
Mother – HE: yes or no Not significant
Interaction previous_edu
with edu_father Not significant
Interaction previous_edu
with edu_mother 0.098 1.661 0.910 3.031
Finance
mode:
state
funded or
no
Gender 0.338 0.878 0.673 1.146
Previous education 0.007 1.446 1.104 1.893
Father - HE: yes or no Not significant
Mother – HE: yes or no Not significant
Interaction previous_edu
with edu_father Not significant
Interaction previous_edu
with edu_mother Not significant
T
he values of Hosmer–Lemeshow test suggest good fits for models related to HEI type (χ2=0.721, df. 6, Sig.
0.994, % of correct predictions 64.2), while the model for financing is poor (χ2=0.2.384, df. 2, Sig. 0.304, % of
correct predictions 57.1). Modelling university/no university (i.e. university/vocational HE) by using education
of parents as “has HE/does not have HE” (the first model in Table 4) suggests that, all other things being equal,
those who attended gymnasium prior to higher education have 3 times higher probability to be enrolled into a
university than those who attended secondary vocational education. Furthermore, those whose fathers have
higher education have approximately 1.5 times more probability to be enrolled in a university than those whose
10
fathers do not have higher education. Both of these odds ratios are significant at 0.01 level of significance. The
interaction between mothers having higher education and attending gymnasium is a significant influence (0.1
level of significance) and suggests that, all other things being equal, those whose mothers have higher education
and who attended gymnasium have approximately 1.7 times higher probability of being enrolled into a university
than those who do not have highly educated mothers and did not attended a gymnasium. This model correctly
predicted 64.2% observations.
Progress and completion in higher education. As was stated earlier, participation rates relate to inequality in
opportunity and focus primarily on access or enrolment21
. Yet, the question remains what happens to the
structure of the student population during higher education. Depending on the system of studying, there are
several types of data that may be of use:
– rates of passing/failing exams,
– grades on exams or grade average,
– rates of progression into the next year of study (in cases in which studying is organised around academic
years, and not on accumulation of credits, within an ECTS, or ECTS-like, system).
Rates of passing/failing exams, while providing a possibility for micro analysis of progress through higher
education, require an elaborate information system, which is not (yet) in place in Serbia. When it comes to
grades on exams or grade average, the key question is how good a proxy they are for the quality of learning
outcomes. In line with the human capital theory vs. signalling hypothesis explanations of wage differences
(Weiss, 1995), one could also either see grades as mere signals, which are used primarily for selection purposes
(Gipps, 1999) or see them as useful operationalisations for measuring the quality of learning outcomes.
Naturally, this depends on both the method and process of assessment, as well as to the impact grades have on
further education.
In the case of Serbia, due to the study system structure in place in the 2000-2005 period, as well as the data
available, it was interesting to see whether there are any correlations between rates of repetition of a particular
study year (as an opposing concept to rate of progression). The analysis shows that female students are repeating
less: 45% of those who repeat the year of study are women. Having in mind that women are more numerous than
men in general in higher education, the fact that men are the majority of those who repeat gives further evidence
to the position that females are outperforming men in terms of progress. Further analysis shows that repetition of
a year is not statistically independent from education of parents. Chi-square test for independence between
education of father and repetition of a year in public universities yields chi-square value of 71.5 (df=6) at less
than 0.01 level of significance, while chi-square for education of mother and new enrolment or repetition is
156.105 (df=6), again at less than 0.01 level of significance. Coefficients of correlations (treating both categories
as nominal – e.g. Phi, or ordinal – e.g. Kendall’s tau or Spearman's rho) are significant, and stronger in the case
of education of mother than education of father. Results reflect the situation in which students with better
educated parents repeat less.
11
Finally, in terms of what happens with students during higher education, the final measure is the rate of
completion. As was already stated, the completion rate is estimated to be around 55% for the period under study.
The exact calculation of the completion (and hence, dropout) rate was not possible due to inappropriate data sets
(records on enrolment are not connected to records on completion), as well as prolongation of studies (beyond
expected duration) and the continuously increasing number of students enrolling into higher education.
The data on completion available for this study does not include information on education of parents;
therefore, it was not possible to asses to what extent the composition of the student population changed during
higher education, in terms of SEB of students. However, some indications about the SEB of those who dropout
may be visible from comparing the population of students in terms of SEB at the beginning of their higher
education paths, and at their final year of studying. Naturally, some of the students who have managed to enrol
into the final year of study may dropout during that final year, so the proposed comparison should be considered
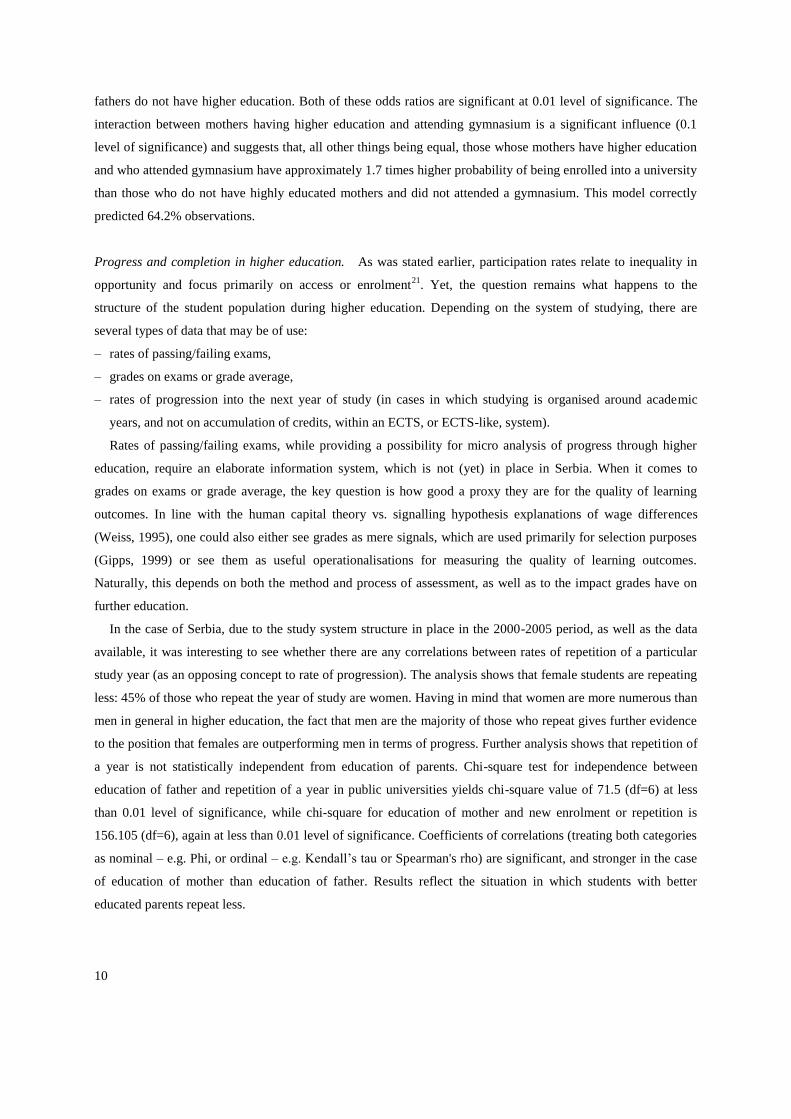
as a proxy. Figure 1 shows the ratio between number of students at initial enrolment and in the final year of
study, depending on the education of their parents. The average line, which corresponds to the ratio between the
number of students in the first year of study and the number of students in the final year of study, was introduced
for comparative purposes, to account for the high dropout rate. Values lower than average thus indicate over-
representation of students of specific education of parents in the final year of study with respect to initial
enrolment and vice versa, values higher than average indicate under-representation of students of specific
education of parents in the final year of study with respect to initial enrolment. The data presented on Figure 1
suggest that those who dropout between the first and the final year of study are those students whose parents
have less education.
Figure 1. Ratio between number of students at initial enrolment and in the final year of study depending on the parent’s level
of education
When and how to measure?
The problems with using existing data within the system of higher education described above bring forward the
question when to measure and how to measure inequality in higher education. As discussed above, the inequality
12
is most visible during the so-called education transitions: transition from one year of schooling to the next (e.g.
second to third year of studies), or from one stage in education to the following (e.g. from secondary to higher
education, or from first degree to postgraduate studies). These transitions are events in which a variety of data is
collected already, in order to enable the transition and to establish some agreed criteria for selection (if selection,
due to limited capacities, is necessary). However, as was stated earlier, within a certain transition inequalities
arise not only due to procedures, criteria or the nature of that very transition, but also due to inequalities
accumulated in earlier transitions. In that respect, one could argue that students go through a series of inequality
cycles, and that during each cycle there is some accumulation of inequality, the scope of which depends of,
amongst other, the structure of the education system (time and strength of tracking, criteria for enrolment,
quotas, entrance exams, etc).
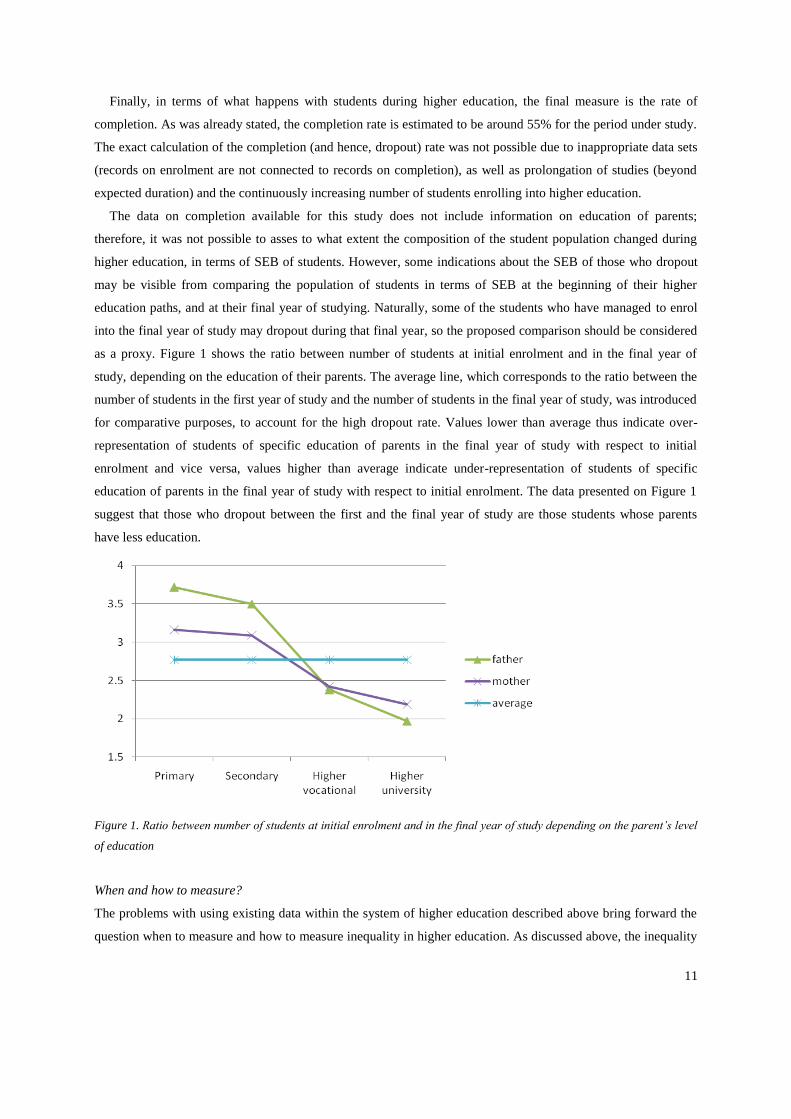
Inequality cycle. The inequality cycle essentially implies that a person´s initial socio-economic inequality
(which could be seen through the possession, or lack of Bourdieu´s three types of capital) contributes to the
emergence of educational inequality (in terms of enrolment or progress in a specific stage of education or quality
of learning outcomes, quality and prestige of institution, track destination, socialisation in the school
environment or academia, etc.). Thus, accumulated educational inequality contributes to further socio-economic
inequality, affecting enrolment into the following stage of education or contributing to inequality in terms of the
labour market outcomes, primarily in the attained (occupational) status.
Figure 2. The inequality cycle
Therefore, going through the education system consisting of three stages (primary, secondary and higher
education), a person would “go through” the inequality cycle three times as presented in Figure 2, and would
maintain his/her disadvantage, compared to the peers of more privileged socio-economic background. This
disadvantage (or the increase thereof) would be easiest to identify in quantitative terms in transfer points, i.e. in
13
points where differentiation and selection takes place (such as moving from primary to secondary education, or
secondary to higher education, or higher education to the labour market). To assess the extent of disadvantage,
one would need data for at least two connected “passages” through the inequality cycle.
Operationalising SEB. Having in mind that the analysis focuses on students in higher education, i.e. people
older than 18, the next question is whether one can continue using characteristics of parents as indications of
SEB of students. In most cases which belong to the quantitative approach, students´ background is analysed
through their parents´ occupation and education. In that way, it is understood that the parents´ social class is
equal to the social class of the student. While this may be considered completely correct in the analysis of
enrolment, progress and completion of earlier stages in the education system (primary and secondary), it is more
complicated in the case of higher education. The issue is not a simple question of legal age of maturity since
family influence may remain strong well beyond age of 18 or 21, thus bearing significant cultural as well as
political and economic implications and complicating research. The fact that, in legislative terms, a young person
of a certain age is considered as an independent adult does not mean that his/her attitudes, aspirations,
expectations, abilities, etc. are no longer affected by his/her family. Most of the studies focusing on students of
traditional age do not make any considerations about this question and treat social class of all students being
equal to the social class of their parents. Archer et al. (2003), however, provide an interesting example from the
UK on the use of parents´ occupation in defining students´ social class until the age of 21. After 21, students´
reported occupation is used. This approach reflects the aforementioned life course perspective (LCP).
In addition to this, some studies claim that the nature of the influence depends on the socio-economic
background as such (Green et al., 2003), i.e. that the students´ SEB does affect their educational experience, but
in different ways for different SEB. For example, the effects are not of the same nature in the case of students
from working families and from the middle-class families. Along these lines, Power (2000) advocates the
division of the middle class, which is often understood as one homogenous group, into several middle classes to
allow for more sensitive analysis. Similarly, students from the same ethnic background but of different gender
may have completely different higher education careers (e.g. in some cases racial minority boys are more
disadvantaged than racial minority girls; HEFCE, 2005). All this seems to further strengthen the
recommendation that research into the topic, even the one adopting a quantitative modernist approach, should
avoid using crude social class definitions and should fine tune the classification of social groups based on
analysis of data, with due attention paid to elements of the student socio-economic background other then
parents´ education or parents´ (or students´) occupation.
INFERENCE FROM INEQUALITY MEASURES
The data presented here are evidence of under-representation of several groups in the society with respect to
higher education, both in terms of external and internal under-representation. Furthermore, data suggest that
14
there is accumulation of disadvantage during higher education, i.e. that those who are of lower elements of
socio-economic background are more likely to repeat study years or dropout entirely.
However, given the discussion on definitions and measurement of inequality, the question is what can be
inferred from data on inequality, or what kind of data is necessary for what kind of inferences.
In this respect it is of significant importance to ensure reliability and comparability of data for each of the
education transitions or to conduct longitudinal studies, following a cohort throughout the education system. The
latter would also provide data for analysing the destinations of those who have left the education system at one
of the transitions and also would allow focus on the socio-economic characteristics of students at “destination”,
i.e. after completion of certain years of schooling. Ideally, the data should be collected for the entire system,
allowing for assessment of differences between higher education institutions and different fields of study. This is
of relevance in order to distinguish between system level effects (e.g. enrolment rules) and the institutional level
or field effects (e.g. entrance exam for a particular institution in the particular field). Unfortunately, neither is the
case at present in Serbia, which means that the fuller assessment of nature and scope of reproduction of
inequality in (higher) education system is not possible at this stage.
On this point, it should also be stressed that such longitudinal studies should include a fine measurement of
various elements of SEB, reflecting the ethnic, linguistic, educational, cultural and economic diversity found
within Serbia. This could provide sufficient data for identification and analysis of causes and effects of under-
representation of specific groups, which could also be used to inform future policy decisions, on both system and
institutional level.
Finally, in order to distinguish between effects of elements of SEB and the personal characteristics such as
motivations, expectations, perceptions and attitudes towards (higher) education, a more qualitative approach
(surveys, interviews, focus groups) would be necessary. This would also enable analysis of possible clashes
between the individual and the institutional habitus. However, it should also be borne in mind that variance in
such personal characteristics may also be related to specific elements of SEB, and that therefore it would be
necessary to control for such effects.
NOTES
1 In the Serbian context, due to the composition of the population, racial diversity is not significant, while ethnic diversity is significant,
especially in certain regions, e.g. north province of Vojvodina or south-west region of Sandzak. 2 Some authors, such as Morrow and Torres (1994), use stronger concepts than “inequality” – they claim that the education system is
reproducing various forms of domination and subjection. 3 The Law on Higher Education adopted in August 2005 introduced some of the Bologna related reforms (bachelor and master degree
structure, ECTS, quality assurance and accreditation). In addition, through the Law on higher education and the process of accreditation,
former post-secondary vocational institutions (offering 2-3 year degrees) became academies of applied sciences, offering bachelors in
applied sciences. Prior to 2005, the higher education system was university dominated. 4 GER – gross enrolment ratio.
5 For 2002, from the data base of the Centre for Education Policy.
6 Statistical Yearbook, Statistical Office of Serbia.
7 For 2002, from Vukasović (2007).
8 However, there is limited anecdotal evidence that the interest for natural sciences and mathematics is decreasing.
9 It could be argued that this borders with academic malpractice (Ivošević and Miklavič, 2009).
10 In public higher education institutions, within the total quota to be admitted, a proportion of students are partially funded by the state (i.e.
they do not pay the tuition fee, although they do have other costs related to studying), while the rest pays for tuition. The proportions are
determined by the state each year, while the level of tuition fee is, essentially, determined by the faculties.
15
11 All correlations significant at p<.01. 12
With respect to Roma population, statistics from census or similar official sources can not be considered as reliable since large numbers of
Roma population live unregistered, i.e. do not possess basic identification documents. International organizations, such as UNICEF or
Save the Children, estimate the number of Roma to be around 5% of the total population of Serbia. 13 Active population older than 35 is used as a proxy for the population that is of age to be parents of students. 14 Active population older than 35 is used as a proxy for the population that is of age to be parents of students. 15 The data on number of pupils in secondary education other than gymnasium does not distinguish between 3-year and 4-year secondary
education. 16 The data on number of pupils in secondary education other than gymnasium does not distinguish between 3-year and 4-year secondary
education. 17 Instruction in Hungarian language is not available in most disciplines in Serbia. 18 Sometimes referred to as Gypsies/travellers. 19 Estimates of a number of (international) NGOs working in Serbia or the region state that only a small proportion of school-aged Roma
children are enrolled into primary schools; 25% dropout in the first grade, further 50% till the 5th grade, while only 25% of those Roma
who started primary education complete it. 20 All correlations significant at p<.01. 21
Due to the nature of data and for the reasons of better operationalisation, analysis focuses on enrolment instead of access. While access
relates to the opportunity of being a student (and this is theoretically possible for any person who has completed 4-year secondary
education), enrolment relates to obtaining the status of student, i.e. becoming registered as a student in a specific higher education
institution.
REFERENCES/BIBLIOGRAPHY
Agresti, A. and Finlay, B. (1986) Statistical Methods for the Social Sciences. San Francisco: Dellen.
Archer, L., Hutchings, M. and Ross, A. (2003) Higher Education and Social Class: Issues of exclusion and inclusion. London: Routledge
and Falmer.
Babin, M., Pantić, N. and Vukasović, M. (2009) Reprodukcija socijalnih nejednakosti kroz obrazovne tranzicije. In Analiza karakteristika
siromaštva u Srbiji. Beograd: Tim potpredsednika Vlade za implementaciju Strategije za smanjenje siromaštva.
Ball, S.J. (2002) “Classification” and “Judgement”: social class and the “cognitive structures” of choice in higher education. In British
Journal of Sociology of Education, 21(1), 51-72.
Bourdieu P. (1986) The Forms of Capital. In Lauder H., Brown, P., Dillabough, J-A. and Halsey, A.H. (Eds) (2006) Education,
Globalization and Social Change. Oxford: Oxford University Press.
Bourdieu, P. and Passeron, J.C. (1990) Reproduction in Education, Society and Culture, 2nd edition. London: SAGE.
Bowl, M. (2003) Non-traditional entrants to higher education: “They talk about people like me”. Stoke on Trent: Trentham Books.
Fuller, M., Healey, M., Bradley, A. and Hall, T. (2004) Barriers to learning: a systematic study of the experience of disabled students in one
university. In Studies in Higher Education, 29(3), 303 – 318.
Gipps, C. (1999) Socio-Cultural Aspects of Assessment. In Review of Research in Education, 24(1), 355-392
Green, A., Preston, J. and Sabates, R. (2003) Education, Equality and Social Cohesion: a distributional approach. In Compare, 33(4), 453-
470.
HEFCE (2005) Young Participation in Higher Education. Place: HEFCE.
Ivošević, V. and Miklavič, K. (2009) Financing higher education: comparative analysis. In Vukasović, M. (Ed.) Financing Higher Education
in South Eastern Europe: Albania, Croatia, Montenegro, Serbia and Slovenia. Belgrade: Centre for Education Policy
Lucas, S.R. (2001) Effectively Maintained Inequality: Education transitions, Track Mobility and Social Background Effects. In American
Journal of Sociology, 106(6), 1642-1690.
Marks, G. N. (2005) Cross-National Differences and Accounting for Social Class Inequalities in Education. In International Sociology,
20(4), 483-505.
Morrow, R.A. and Torres, C.A. (1994) Education and the Reproduction of Class, Gender and Race: Responding to the Postmodern
Challenge. In Educational Theory, 44(1), 43-61.
Müller, W. and Karle, W. (1993) Social Selection in Educational Systems in Europe. In European Sociological Review, 9(1), 1-23.
Peck, B. (2001) The poor stay poor and the rich get rich. In Issues in Educational Research, 11(2), 45-64.
Power, S. (2000) Educational Pathways in the Middle Class(es). In British Journal of Sociology of Education, 21(2), 133-145.

16
Raftery, A.E. and Hout, M. (1993) Maximally Maintained Inequality: Expansion, Reform and Opportunity in Irish Education, 1921-75. In
Sociology of Education, 66(1), 41-62.
Vukasović, M. (2007) Higher Education and Social Stratification in Serbia 1990-2005. Aveiro: University of Aveiro. Master thesis.
Weiss, A. (1995) Human Capital vs. Signalling Explanations of Wages. In Journal of Economic Perspectives, 9(4), 133-154.
Wong, R.S.K. (1998) Multidimensional Influences of Family Environment in Education: The Case of Socialist Czechoslovakia. In Sociology
of Education, 71(1), 1-22.