Inequality and Stability in Democratic and Decentralized Indonesia
34
Mohammad Zulfan Tadjoeddin University of Western Sydney, Australia Athia Yumna Sarah E. Gultom M. Fajar Rakhmadi M. Firman Hidayat Asep Suryahadi The SMERU Research Institute Inequality and Stability in Democratic and Decentralized Indonesia WORKING PAPER *This document has been approved for online preview but has not been through the copyediting and proofreading process which may lead to differences between this version and the final version. Please cite this document as "draft".
-
Upload
westernsydney -
Category
Documents
-
view
1 -
download
0
Transcript of Inequality and Stability in Democratic and Decentralized Indonesia
Mohammad Zulfan Tadjoeddin
University of Western Sydney, Australia
Athia Yumna
Sarah E. Gultom
M. Fajar Rakhmadi
M. Firman Hidayat
Asep Suryahadi
The SMERU Research Institute
Inequality and Stability in Democratic and Decentralized Indonesia
WORKING PAPER
*This document has been approved for online preview but has not been through the copyediting and proofreading process which may lead to differences between this version and the final version. Please cite this document as "draft".
WORKING PAPER
Inequality and Stability in Democratic and Decentralized Indonesia
Mohammad Zulfan Tadjoeddin University of Western Sydney, Australia
Athia Yumna
Sarah E. Gultom M. Fajar Rakhmadi M. Firman Hidayat Asep Suryahadi
The SMERU Research Institute
The SMERU Research Institute
Jakarta
August 2014
The findings, views, and interpretations published in this report are those of the authors and should not be attributed to any of the agencies providing financial support to The SMERU Research Institute. For further information on SMERU’s publications, phone 62-21-31936336; fax 62-21-31930850; e-mail [email protected]; or visit www.smeru.or.id.
The SMERU Research Institute i
ACKNOWLEDGEMENTS We would like to thank Neil McCulloch, David Gottlieb, and Sudarno Sumarto for comments on an earlier draft. However, they bear no responsibility for remaining errors and weaknesses.
The SMERU Research Institute ii
ABSTRACT
Inequality and Stability in Democratic and Decentralized Indonesia
Mohammad Zulfan Tadjoeddin (University of Western Sydney, Australia), Athia Yumna, Sarah E. Gultom, M. Fajar Rakhmadi, M. Firman Hidayat, Asep Suryahadi
(The SMERU Research Institute) Economic inequality in Indonesia has been on the rise and recently reached a record high level of 0.41 measured in the Gini index of household consumption expenditure. Not only economically, the issue of rising inequality is also socially and politically important as it may harm societal stability, especially in large, diverse and young democracy plagued by widespread poverty and vulnerability amid rising expectations. This study finds empirical supports for the violence increasing effects of higher inequality across districts in provinces previously considered as ‘high conflict’ regions. The result is robust after controlling for province and time effects, ethnic and religious fractionalizations and series of usual determinants of violence, as well as across different measures of violence. This new evidence implies that it is important to include tackling inequality as an explicit focus in development agenda. Key words: inequality and stability, inequality and violence, district panel, Indonesia crime.

The SMERU Research Institute iii
TABLE OF CONTENTS
ACKNOWLEDGEMENTS .................................................................................................................... i
ABSTRACT ......................................................................................................................................... ii
TABLE OF CONTENTS ..................................................................................................................... iii
LIST OF TABLES ............................................................................................................................... iv
LIST OF FIGURES ............................................................................................................................. iv
I. INTRODUCTION ......................................................................................................................... 1
II. WHY STABILITY AND WHAT DO WE MEAN BY IT .................................................................. 3
III. INEQUALITY IN DEVELOPMENT .............................................................................................. 8
IV. INEQUALITY AND CONFLICT .................................................................................................... 9
V. EMPIRICAL ESTIMATION STRATEGY .................................................................................... 11
VI. RESULTS .................................................................................................................................. 14 6.1 Routine Violence ................................................................................................................ 14 6.2 Ethnic Violence .................................................................................................................. 16 6.3 Violent Crime ...................................................................................................................... 18 6.4 Robustness Checks ........................................................................................................... 19
VII. CONCLUSION ........................................................................................................................... 21
LIST OF REFERENCES ................................................................................................................... 22
The SMERU Research Institute iv
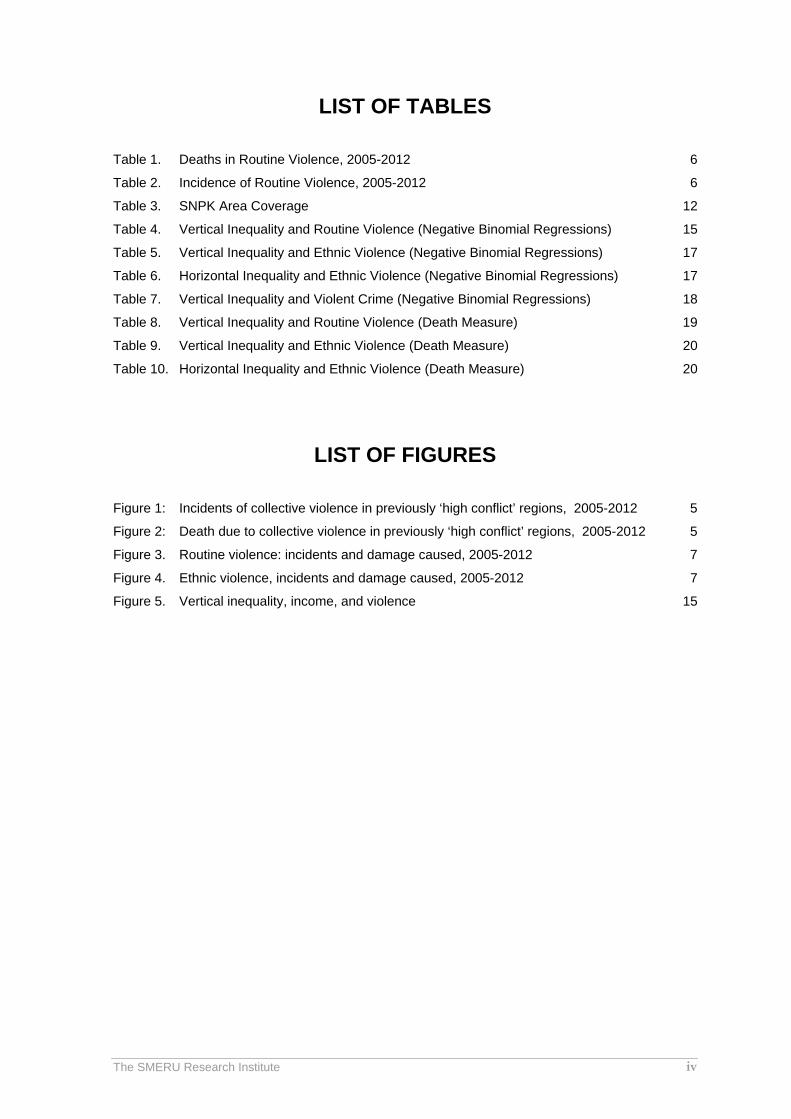
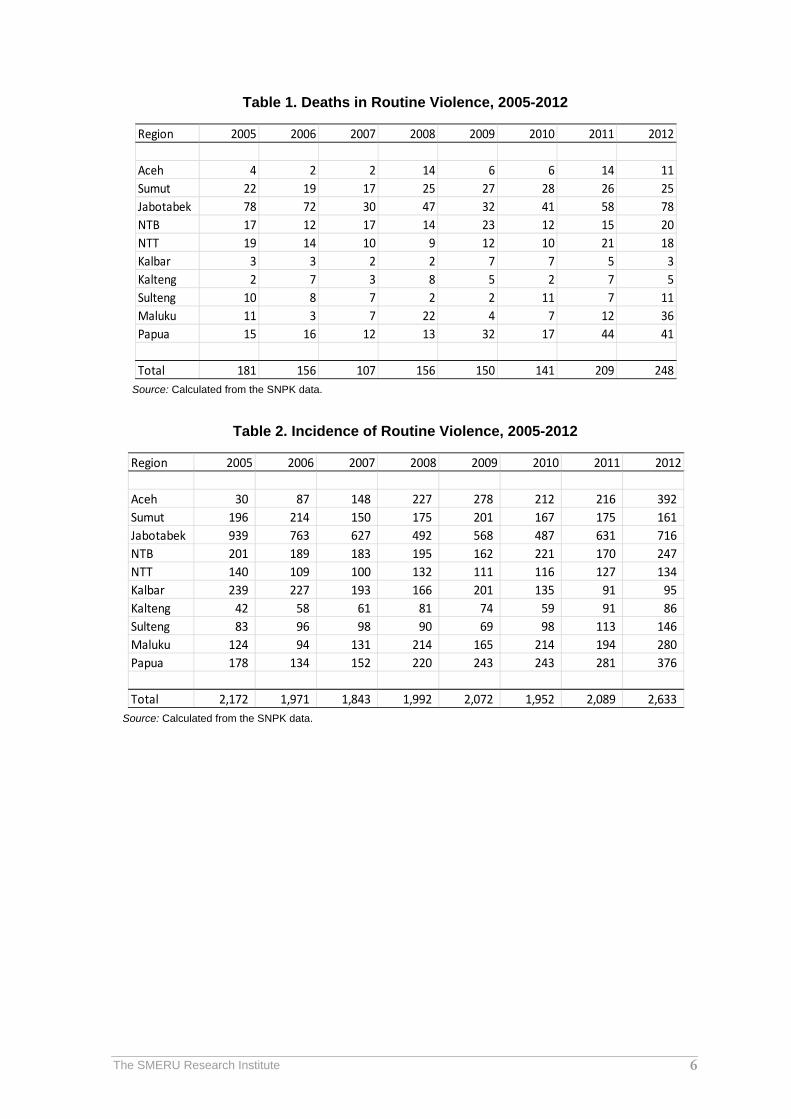
LIST OF TABLES Table 1. Deaths in Routine Violence, 2005-2012 6
Table 2. Incidence of Routine Violence, 2005-2012 6
Table 3. SNPK Area Coverage 12
Table 4. Vertical Inequality and Routine Violence (Negative Binomial Regressions) 15
Table 5. Vertical Inequality and Ethnic Violence (Negative Binomial Regressions) 17
Table 6. Horizontal Inequality and Ethnic Violence (Negative Binomial Regressions) 17
Table 7. Vertical Inequality and Violent Crime (Negative Binomial Regressions) 18
Table 8. Vertical Inequality and Routine Violence (Death Measure) 19
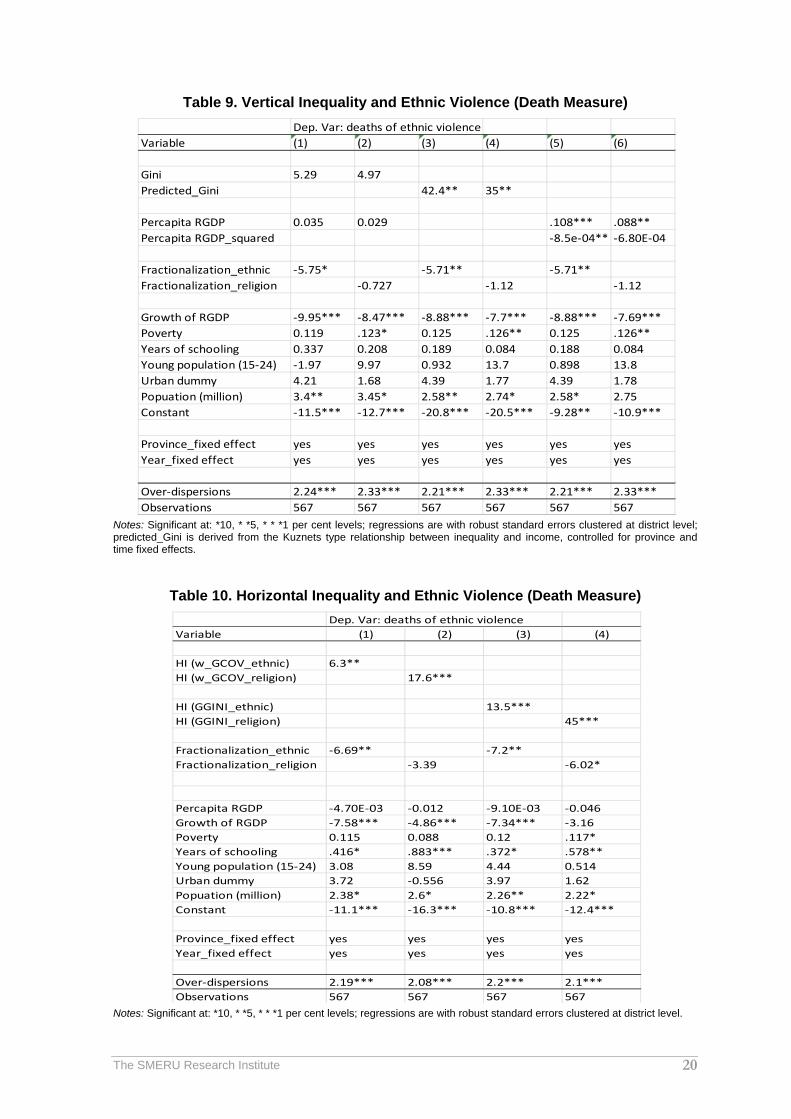
Table 9. Vertical Inequality and Ethnic Violence (Death Measure) 20
Table 10. Horizontal Inequality and Ethnic Violence (Death Measure) 20
LIST OF FIGURES Figure 1: Incidents of collective violence in previously ‘high conflict’ regions, 2005-2012 5
Figure 2: Death due to collective violence in previously ‘high conflict’ regions, 2005-2012 5
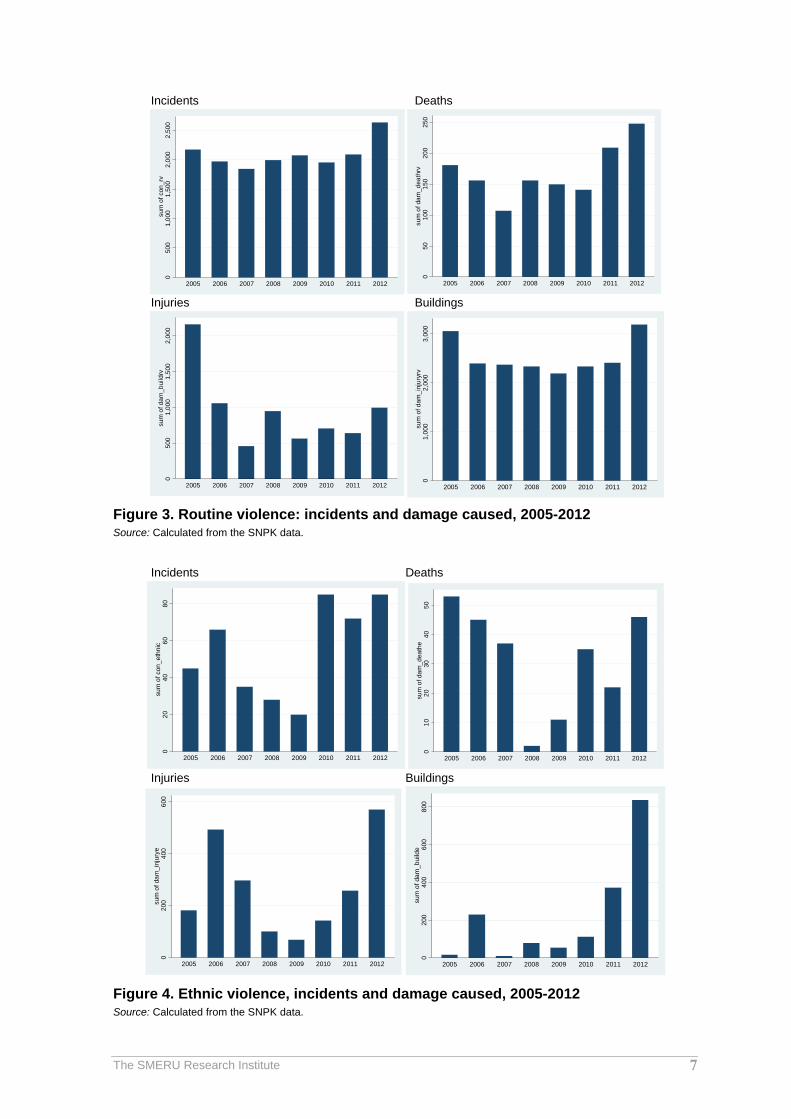
Figure 3. Routine violence: incidents and damage caused, 2005-2012 7
Figure 4. Ethnic violence, incidents and damage caused, 2005-2012 7
Figure 5. Vertical inequality, income, and violence 15
The SMERU Research Institute 1
I. INTRODUCTION
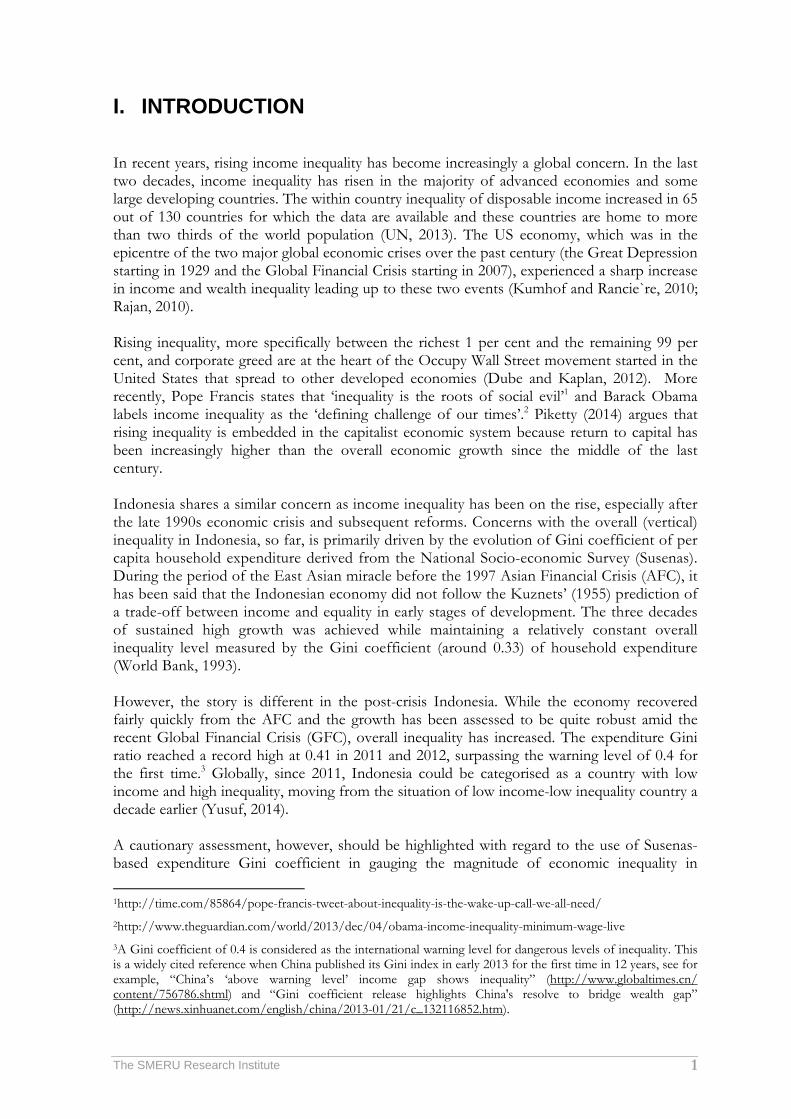
In recent years, rising income inequality has become increasingly a global concern. In the last two decades, income inequality has risen in the majority of advanced economies and some large developing countries. The within country inequality of disposable income increased in 65 out of 130 countries for which the data are available and these countries are home to more than two thirds of the world population (UN, 2013). The US economy, which was in the epicentre of the two major global economic crises over the past century (the Great Depression starting in 1929 and the Global Financial Crisis starting in 2007), experienced a sharp increase in income and wealth inequality leading up to these two events (Kumhof and Rancie`re, 2010; Rajan, 2010). Rising inequality, more specifically between the richest 1 per cent and the remaining 99 per cent, and corporate greed are at the heart of the Occupy Wall Street movement started in the United States that spread to other developed economies (Dube and Kaplan, 2012). More recently, Pope Francis states that ‘inequality is the roots of social evil’1 and Barack Obama labels income inequality as the ‘defining challenge of our times’.2 Piketty (2014) argues that rising inequality is embedded in the capitalist economic system because return to capital has been increasingly higher than the overall economic growth since the middle of the last century. Indonesia shares a similar concern as income inequality has been on the rise, especially after the late 1990s economic crisis and subsequent reforms. Concerns with the overall (vertical) inequality in Indonesia, so far, is primarily driven by the evolution of Gini coefficient of per capita household expenditure derived from the National Socio-economic Survey (Susenas). During the period of the East Asian miracle before the 1997 Asian Financial Crisis (AFC), it has been said that the Indonesian economy did not follow the Kuznets’ (1955) prediction of a trade-off between income and equality in early stages of development. The three decades of sustained high growth was achieved while maintaining a relatively constant overall inequality level measured by the Gini coefficient (around 0.33) of household expenditure (World Bank, 1993). However, the story is different in the post-crisis Indonesia. While the economy recovered fairly quickly from the AFC and the growth has been assessed to be quite robust amid the recent Global Financial Crisis (GFC), overall inequality has increased. The expenditure Gini ratio reached a record high at 0.41 in 2011 and 2012, surpassing the warning level of 0.4 for the first time.3 Globally, since 2011, Indonesia could be categorised as a country with low income and high inequality, moving from the situation of low income-low inequality country a decade earlier (Yusuf, 2014). A cautionary assessment, however, should be highlighted with regard to the use of Susenas-based expenditure Gini coefficient in gauging the magnitude of economic inequality in 1http://time.com/85864/pope-francis-tweet-about-inequality-is-the-wake-up-call-we-all-need/ 2http://www.theguardian.com/world/2013/dec/04/obama-income-inequality-minimum-wage-live 3A Gini coefficient of 0.4 is considered as the international warning level for dangerous levels of inequality. This is a widely cited reference when China published its Gini index in early 2013 for the first time in 12 years, see for example, “China’s ‘above warning level’ income gap shows inequality” (http://www.globaltimes.cn/ content/756786.shtml) and “Gini coefficient release highlights China's resolve to bridge wealth gap” (http://news.xinhuanet.com/english/china/2013-01/21/c_132116852.htm).
The SMERU Research Institute 2
Indonesia both during the ‘miracle’ New Order economy as well as during the recent period of rising inequality. It has been argued that the Susenas expenditure Gini tends to seriously underestimate the true level of economic inequality. Two main reasons are in order; conceptual and technical.
On the conceptual level, it is the Gini index of consumption expenditure and we know that consumption is clearly different from income, let alone wealth or asset. Consumption expenditure is only part of income earned in a typical household; it has a smoothing effect through saving and withdrawal. In a longer term, income will be accumulated in the form of wealth or asset that will grow through capital gains or investment returns. Therefore, by definition, expenditure inequality would be lower than income inequality; and income inequality should be less than wealth inequality.4 Economic inequality could refer to any of these inequalities, whether consumption, income or wealth. On the technical ground, the sampling nature of the Susenas tends to fail in capturing the consumptions of the very high and very low income groups as these groups are largely untouchable for different reasons (Yusuf, 2006). Therefore, if Indonesia is concerned with the recent rise in expenditure Gini surpassing a warning level, one can imagine the true magnitude of economic inequality based on income or wealth measures. There are at least two potential effects of inequality well-known in the literature. First is about its effect on the economic performance or prosperity; and second is how it affects societal stability. Both effects are important and they also influence one another. On the one hand, equitable and sustainable rise in prosperity is needed for societal stability; and on the other hand, stability could be seen a prerequisite for that kind of prosperity. This paper is aimed at examining possible effect of inequality on societal stability based on recent socio-economic data in democratic and decentralized Indonesia, which refers to the period after the rather chaotic transition of late 1990s and early 2000s. The rest of the paper is organised as follows. Section 2 discusses the notion of societal stability as our main concern. Section 3 traces earlier literature to locate inequality in the process of development and probes its potential link with societal stability. Section 4 offers a brief overview of inequality and conflict. Our empirical estimation strategy is detailed in section 5, while results are presented in section 6. Brief conclusion is offered in the last section.
4The following bears testimony to the presence of tiny, but very wealthy elite in Indonesia. In 1996 top ten super-rich Indonesian families controlled 57.7 per cent of stock market capitalization in the country; this is the highest proportion in East Asia (Claessens, Djankov and Lang, 1999). In 2011, although Indonesia’s richest 43,000 citizens represented less than one hundredth of 1 per cent of the population, their total wealth accounted for 25 per cent of the country’s GDP; the average wealth of 40 richest Indonesians is the highest in the region and their combined wealth equal to 10.2 per cent of the country’s GDP (Winters, 2013). Furthermore, the fragility of the Indonesian economy in the wake of the Asian financial crisis and its subsequent democratic transition indicate that the level of economic inequality in Indonesia has not been low and stable as it was commonly perceived (Thee, 2002; UNSFIR, 2003; Dhanani et al., 2009; Frankema and Mark, 2009). The long-term data (1971-2008) indicate that only a minority share of income (less than 30 per cent) accruing to labour, while the majority belongs to capital; and the proportions have not changed much during the period (Tadjoeddin, 2013b).
The SMERU Research Institute 3
II. WHY STABILITY AND WHAT DO WE MEAN BY IT
The importance of societal stability for the ethnically diverse Indonesia inhabited by 250 million people cannot be overlooked. The country is a young democracy and the third largest in the world. After upgraded by the World Bank into the level of lower-middle income country, more recently Indonesia just got upgraded to the 10th largest economy in the world by virtue of the new PPP numbers.5 The country’s transition to democracy took place amid a serious economic decline in the wake of the late 1990s AFC. The transition is, however, regarded as by some as a risky exercise as some authors argue that there is a minimum threshold of income at which democracy can be a successful endeavour (Przeworksi et al., 2000; Zakaria, 2003). Although democracy is seen as a non-violent mechanism for conflict resolution, the practice of democracy in low and lower middle income countries is often complicated by violence, even civil war. The risks of violent conflict during democratic transition in lower income countries have been strongly argued and empirically supported (Hegre et al., 2001; Snyder, 2000). Based on anecdotal evidence, several influential commentators have also suggested that democratization in developing countries produces poor economic outcomes, political instability and ethnic conflict (Kaplan, 2000; Chua, 2002; and Zakaria, 2003). To a large extent, the Indonesian experience very much concurs with the above assessment as the country’s moved toward democracy was accompanied with a significant eruption of violent conflict. In fact, the surge in various kinds of violence during the initial phase of transition led some observers to portray Indonesia as a potential Balkan of Southeast Asia, referring to the risk of disintegration that the country faced (Booth, 1999; Cribb, 1999). Violent conflict, or group/collective violence in contemporary Indonesia could be broadly categorized into episodic and routine (Tadjoeddin and Murshed, 2007; Tadjoeddin 2014). The former consists of separatist and ethnic violence, and the latter centres on group brawls and vigilante violence. While the episodic violence is typically associated with a high number of deaths and a relatively low number of incidents, the routine variety is characterized by the converse. Between 1990–2003, ethno-communal violence accounted for 89 percent (or 9,612 casualties) of total deaths in (non-separatist) collective violence, but it contribute only 17 percent of incidents, while the rest, routine violence, accounted for 11 percent of deaths but 83 percent of total incidents (Varshney, Tadjoeddin and Panggabean, 2008). Separatist violence was confined to Aceh and Papua, and also East Timor before its official departure from Indonesia. Episodic violence has had a major economic impact and internally displaced many people,6 while routine violence tends to cause minor damage and is less likely to displace inhabitants. Interestingly, during the peak of the transition, while routine violence occurs in almost all areas of Java, episodic violence is concentrated in a few regions in the outer islands. A surge in separatist and ethnic violence marked the Indonesian transition to democracy. Soon after the fall of Suharto, the new generation Free Aceh Movement (Gerakan Aceh Merdeka, GAM) rebels energized by Libyan-trained new recruits launched a fresh challenge to the 5The Jakarta Post, 5 May 2014. 6In 2001, the Ministry of Social Affairs released the figure of 1.3 million internally displaced persons (IDPs) spread across 19 provinces due to violence in the country (The Jakarta Post, 24 August).
The SMERU Research Institute 4
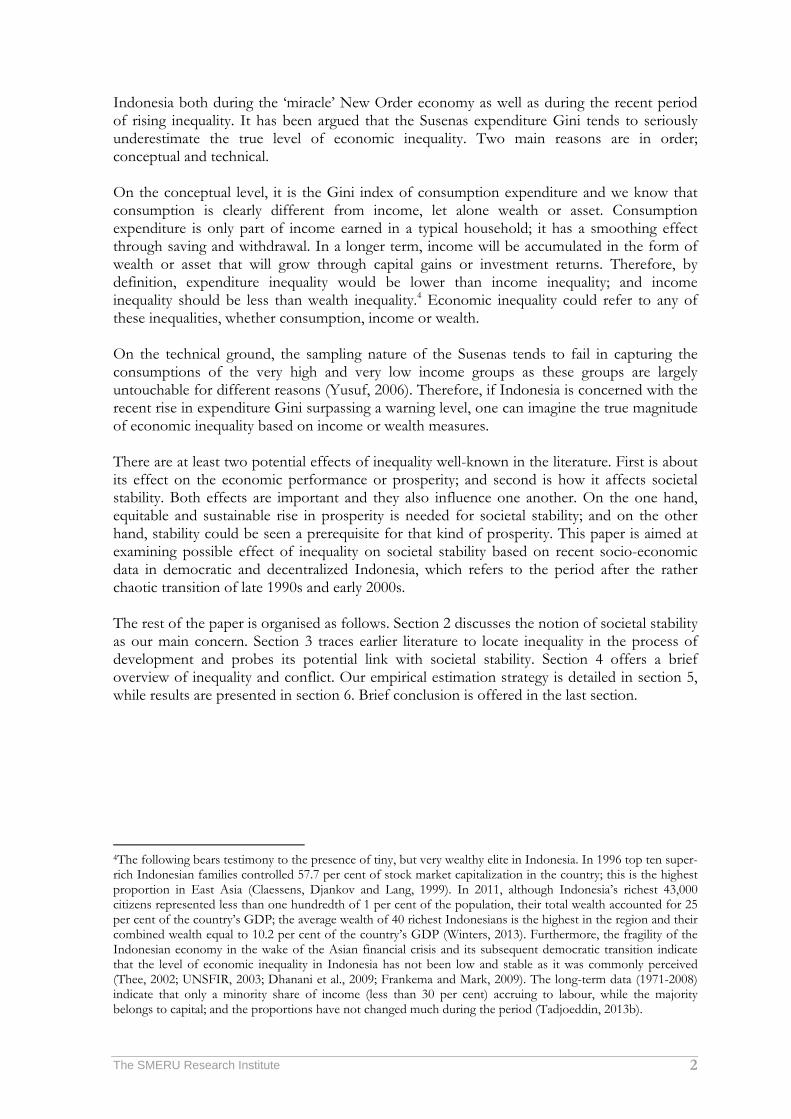
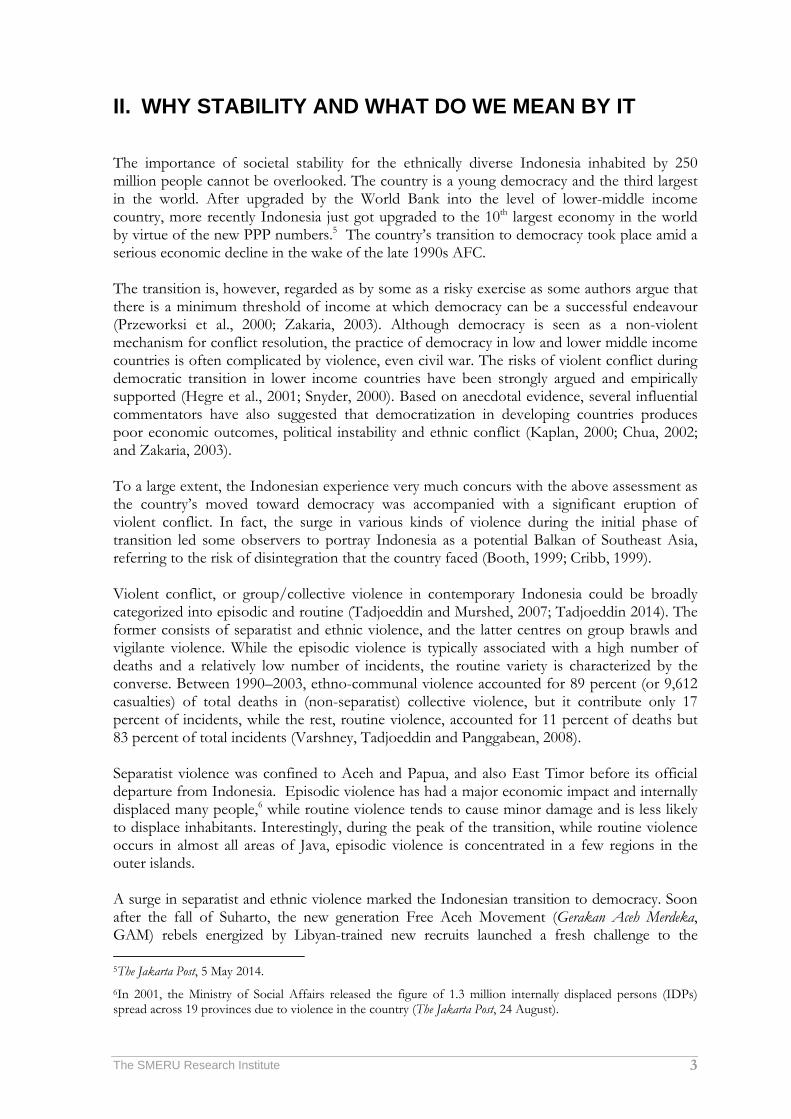
Indonesian grip on the Aceh province. A similar story of a significantly renewed secessionist challenge launched by the Free Papua Organization (Organizasi Papua Merdeka, OPM) also occurred in Papua in the eastern-end of the country. The renewed secessionist challenges were not only articulated on military ground (GAM in Aceh and OPM in Papua), they were also complemented with political moves of civil society organisations, as represented by the Information Center for Referendum in Aceh (Sentra Informasi Referendum Aceh, SIRA) in Aceh and the Presidium of Papua Council (Presidium Dewan Papua, PDP) in Papua. Although political secessionist movements complemented with organised rebel wings were clearly presence in Aceh and Papua, they are categorised as having high and medium levels of separatist violence respectively. The secessionist civil war in Aceh was ended by the Helsinki peace agreement signed August 2005 offering self-governance for the region, while the separatist violence in Papua has been significantly declined since the granting of a special autonomy status to the region in 2001. The GAM rebel military organization in Aceh has been transformed into several local political parties participating in local democratic process. In fact, the provincial government has been run by the former rebels since 2007. In Papua, elements of separatist movement have also been largely absorbed into local political and economic process under the cloak of decentralization and local democracy. Inter-ethnic violence rampaged Maluku, Poso, Sambas, Sampit and several other places with a clear pattern of regional concentration and mainly occurred in late 1990s and early 2000s during the peak of democratic and decentralization reforms. Ethnic violence occurs among communal groups clearly divided along ethnic lines. Following Horowitz (1985), ‘ethnic’ is broadly defined as ascriptive (birth based) group identities: race, language, religion, tribe, or caste can be called ethnic. The construction of systematic data on collective violence in Indonesia was pioneered by the UNDP sponsored UN Support Facility for Indonesian Recovery (UNSFIR), see Tadjoeddin (2002) and Varshney, Tadjoeddin and Panggaben (2008). Later on, the World Bank expanded and deepened the UNSFIR collective violence database through the ViCIS project (Barron et al. 2009). The World Bank collective violence database has been adopted into the Indonesian National Violence Monitoring System (Sistem Nasional Pemantauan Kekerasan, SNPK; see www.snpk-indonesia.com). The SNPK is officially housed at the Coordinating Ministry for People’s Welfare with technical supports from the Habibie Centre and the World Bank. The SNPK collects data on incidents of collective violence/violent conflict as well as violent crime. Looking at the data, there is a clear shifting pattern of collective violence in contemporary Indonesia from the dominance of separatist and ethnic violence during the peak of democratic transition in late 1990s and early 2000s to the dominance of routine violence in the post democratic transition. Figures 1 and 2 present the aggregate trends of collective violence during 2005-2012, this is the period after major episodes of separatist and ethnic violence during the peak of the transition had been largely ended.7 The data is for regions previously considered as ‘high conflict’ during the peak of the transition rampaged by separatist and ethnic violence. The regions include Aceh, Lampung, Jakarta and some districts/municipalities in West Java (Bogor, Depok, Tangerang and Bekasi), West Nusa Tenggara, East Nusa Tenggara, West Kalimantan, Central Kalimantan, Central Sulawesi, Maluku (including North Maluku) and Papua (including West Papua). From both accounts, death and incident, routine violence has been by far the most dominance form of collective violence since 2005.
7See Varshney, Tadjoeddin and Panggabean (2008) for pattern of collective violence during democratic transition in Indonesia.
The S
Figu2005Source
Figu2005Source The n2. Inof repeak and routi3 andit haviole
SMERU Resea
ure 1: Incide5-2012 e: Calculated fro
ure 2: Death5-2012 e: Calculated fro
non-episodicidents and
egional concof the transdamaged cane and ethnd 4. The incs to be notnce, a comp
arch Institute
ents of col
om the SNPK d
h due to co
om the SNPK d
ic nature of deaths of ro
centration, wsition. Furthaused (deathnic violence creasing trented that, theparison depi
lective vio
ata.
ollective vio
ata.
routine violoutine violewhich is in hermore, a chs, injuries in recent ye
nd of ethnice magnitudected earlier i
lence in pr
olence in p
lence duringnce are sprecontrast to
closer look aand damag
ears especialc violence is e of ethnic in Figures 1
reviously ‘h
previously ‘
g 2005-2012ead over theo separatist at the aggregged buildinglly during 20clearer, whviolence is and 2.
high conflic
‘high confl
2 can be seene years withoand ethnic
gate time sergs) shows i009-2012, asich is quite far lower t
ct’ regions
lict’ region
n from Tablout any cleaviolence du
ries data of iincreasing trs depicted inworrying. H
than that of
5
s,
s,
les 1 and r pattern
uring the incidents rends of n Figures However, f routine
The SMERU Research Institute 6
Table 1. Deaths in Routine Violence, 2005-2012
Source: Calculated from the SNPK data.
Table 2. Incidence of Routine Violence, 2005-2012
Source: Calculated from the SNPK data.
Region 2005 2006 2007 2008 2009 2010 2011 2012
Aceh 4 2 2 14 6 6 14 11Sumut 22 19 17 25 27 28 26 25Jabotabek 78 72 30 47 32 41 58 78NTB 17 12 17 14 23 12 15 20NTT 19 14 10 9 12 10 21 18Kalbar 3 3 2 2 7 7 5 3Kalteng 2 7 3 8 5 2 7 5Sulteng 10 8 7 2 2 11 7 11Maluku 11 3 7 22 4 7 12 36Papua 15 16 12 13 32 17 44 41
Total 181 156 107 156 150 141 209 248
Region 2005 2006 2007 2008 2009 2010 2011 2012
Aceh 30 87 148 227 278 212 216 392 Sumut 196 214 150 175 201 167 175 161 Jabotabek 939 763 627 492 568 487 631 716 NTB 201 189 183 195 162 221 170 247 NTT 140 109 100 132 111 116 127 134 Kalbar 239 227 193 166 201 135 91 95 Kalteng 42 58 61 81 74 59 91 86 Sulteng 83 96 98 90 69 98 113 146 Maluku 124 94 131 214 165 214 194 280 Papua 178 134 152 220 243 243 281 376
Total 2,172 1,971 1,843 1,992 2,072 1,952 2,089 2,633
The SMERU Research Institute 7
Incidents Deaths
Injuries Buildings
Figure 3. Routine violence: incidents and damage caused, 2005-2012 Source: Calculated from the SNPK data.
Incidents Deaths
Injuries Buildings
Figure 4. Ethnic violence, incidents and damage caused, 2005-2012 Source: Calculated from the SNPK data.
050
01,
000
1,50
02,
000
2,50
0su
m o
f con
_rv
2005 2006 2007 2008 2009 2010 2011 2012
050
100
150
200
250
sum
of d
am_d
eath
rv
2005 2006 2007 2008 2009 2010 2011 2012
050
01,
000
1,50
02,
000
sum
of d
am_b
uild
rv
2005 2006 2007 2008 2009 2010 2011 2012
01,
000
2,00
03,
000
sum
of d
am_i
njur
yrv
2005 2006 2007 2008 2009 2010 2011 2012
020
4060
80su
m o
f con
_eth
nic
2005 2006 2007 2008 2009 2010 2011 2012
010
2030
4050
sum
of d
am_d
eath
e
2005 2006 2007 2008 2009 2010 2011 2012
020
040
060
0su
m o
f dam
_inj
urye
2005 2006 2007 2008 2009 2010 2011 2012
020
040
060
080
0su
m o
f dam
_bui
lde
2005 2006 2007 2008 2009 2010 2011 2012
The SMERU Research Institute 8
Societal stability could be understood as a desired harmony in the societal life. However this is an abstract desirable outcome that cannot be easily represented by a single indicator, let alone to directly measure it. For a practical reason, it will be easier to focus on variables that may harm societal stability. In this regard, two variables are important: violent conflict and violent crime. For violent conflict, this study concentrates on the routine violence during 2005-2012 in regions previously considered as ‘high conflict’ provinces for the reason of the changing pattern of collective violence in Indonesia explained earlier. III. INEQUALITY IN DEVELOPMENT
Economic inequality within a society is essentially by product of the development process. Therefore, the presence of inequality has long been regarded as a natural phenomenon. Therefore, supressing the level of inequality to zero is a utopia and has been proved to be a failed experiment as evident in the economically communist China and the former Soviet Union. The challenge is more on keeping an eye on the level of inequality and maintaining it not exceeding a tolerable level. There is a long list of literature on inequality in development. However, Albert Hirschman, Arthur Lewis and Simon Kuznets are among the pioneers putting their hypothesis on this (Hirschman, 1973; Lewis, 1976; Kuznets, 1955). Lewis (1976) stressed the natural presence of inequality in the development process and famously contended that development must be inegalitarian because ‘it does not start in every part of the economy at the same time’ (p.26). Much earlier than that, Kuznets (1955) argued for an inevitable trade-off between income and inequality in the early stage of development before an economy eventually achieves higher level of income with declining inequality. Kuznets’ analysis on the evolution of inequality–taking the shape of an inverted-U with regard to income level—is based on the transition of workers from (traditional) agricultural to (modern) industrial sectors. This process implies that: (i) the surge in inequality is temporary as it will eventually decline as income progresses; (ii) the higher inequality in the middle part of the inverted-U curve referring to the transitional period from agriculture to industry is driven by income differences between agricultural and industry sectors; (iii) the level of inequality within both traditional/agricultural and modern/industrial sectors are lower than the overall inequality when the two sectors are combined. The conception of tolerance for economic inequality, introduced by Hirschman (1973), expands the discussion on inequality in development to include societal stability. If the tolerance is passed, hope will transform into grievance. Hirschman (1973) explained the notion of tolerance for economic inequality through the workability of a ‘tunnel effect’. The tunnel illustration is originated from Hirschman’s explanatory analogy with traffic in a two-lane tunnel traffic jam. The traffic jam is legally confined to one lane but initially stirred into hope by movement in the second lane; eventually some drivers will illegally cross into that lane, if it seems that the traffic jam appears to be clearing there. In this illustration, the ‘tolerance’ limit is the maximum duration of how long drivers in the first lane are patient before they start to illegally cross lanes. Hirschman argued for the existence of a social mechanism that could contain relative deprivation or envy due to the rise in inequality. As development proceeded, some people’s
The SMERU Research Institute 9
fortunes improved and others were left behind, and thus inequality typically increased. But the expectations of those left behind might be raised, rather than plagued by anger. Greater inequality gave information about social and economic change that could be interpreted as a signal of hope even for those not immediately benefiting from development. However, the hope will be replaced by grievance if the tolerance is passed and grievance may endanger societal stability. Inequality relates to other socio-economic, political and social issues. Rising inequalities have challenged the notion of trickle-down effect of economic growth advocated by mainstream economics. High level of inequality can be a serious obstacle to future economic growth and a potential cause of underdevelopment (Berg, Ostry, and Zettelmeyer, 2012; Easterly, 2007). Poverty reduction will be undermined by rising inequality (Ravallion, 2011). Inequality is also found to positively correlate with current account deficits and household debts (Goda, 2013; Kumhof and Rancière, 2010; UNCTAD, 2012), both are sources of macroeconomic instability. Rising inequality undermines democracy (Stiglitz, 2012) and is a main source of many social ills (Wilkinson and Pickett, 2009). More importantly and related to the focus of this study, rising inequality has also been associated with violent conflict, this is the issue, in turn, discussed below.
IV. INEQUALITY AND CONFLICT
An important dimension in the analysis of violent conflict is the perceived and actual equitability of distribution of fruits of economic progress among the population. In short, income inequality does matter. There are two types of inequality: (a) vertical and (b) horizontal. Vertical inequality refers to inequality in a population and is commonly measured by the Gini coefficient.8 Horizontal inequality refers to inequality between different ethno-social groups or regions. It can be measured simply by the ratio of mean or average incomes of two groups (or regions). It can also be measured by the relative size of different groups’ (or regions’) income shares in the total – Gross National Income (GNI), group Gini coefficients or by a metric akin to the coefficient of variation. Horizontal inequality, thus, shows the relative welfare of different socio-economic or ethno-religious groups or regions. Horizontal inequality generates a sense of relative group deprivation, while vertical inequality causes a general sense of personal deprivation among the poor and lower middle income people. The link between inequality and conflict is an age old concern. Many theorists have suggested that the former breeds the latter, for example Gurr (1970), Huntington (1968) and Russet (1964).9 Cramer (2005: 1) argues, ‘it is almost a universal assumption that an inequitable distribution of resources and wealth will provoke violent rebellion’. Kanbur (2007:5) states that ‘it seems to be generally accepted that poverty and inequality breed conflict’. In general,
8Another widely used measure is the decile dispersion ratio, which presents the ratio of the average consumption or income of the richest 10 per cent of the population divided by the average income of the bottom 10 per cent. It indicates how the bottom decile of the population (in terms of income) fairs in comparison with the top decile. 9Since Aristotle, social philosophers have speculated that economic inequality is a fundamental cause of political violence and revolution. De Tocqueville ([1835] 1961:302) stated the classical hypothesis succinctly: ‘Almost all of the revolutions which have changed the aspect of nations have been made to consolidate or to destroy social inequality. Remove the secondary causes which have produced the great convulsions of the world, and you will almost always find the principle of inequality at the bottom’.
The SMERU Research Institute 10
inequality creates a sense of injustice that is central to the grievance motive for any kind of violent conflict. Nafziger and Auvinen (2002) find that large income inequality exacerbates the vulnerability of populations to humanitarian emergencies. Muller (1997: 137) argued that ‘a high level of income inequality radicalizes the working class, enhances class polarization, and reduces the tolerance of the bourgeoisie for political participation by the lower classes’. In a cross-country study, he showed a positive correlation between income inequality and binary variable of stability and instability of democracy between 1960 and 1980. These studies are in support of Alesina and Perotti (1996) who found that income inequality was associated with social discontent and political instability which in turn are correlated with lower investment. However, the two most widely cited cross-country empirical studies on civil war by Fearon and Laitin (2003) and Collier and Hoeffler (2004) have largely dismissed the role of inequality in conflict. From a political science perspective, Fearon and Laitin imply inequality does not matter because of state capacity referring to the suppressive power of the state. The Collier and Hoeffler view is more akin to banditry or warlordism. For them, the root cause of conflict is not social pathology (e.g. inequality), but individual pathology (e.g. greed). They also ignore the collective action problem as discussed in Olson (1965), because political scientists are blinded by power and neo-classical economists only see selfish greedy motivation. Since these studies (Fearon and Laitin, 2003; Collier and Hoeffler, 2004) use the Gini index of vertical income inequality that measures inequality between individuals for the entire country, its differentiation with the horizontal inequality that focuses on inequality between groups within country becomes critical. In this regard, Stewart (2000, 2008) argues that it is the latter (horizontal inequality) that matters for conflict. Groups’ horizontal inequalities help in building in-group solidarity and, in turn, solve collective action problem. Stewart presents several case studies in support of her argument. Later on, the horizontal inequality argument has also received empirical supports in a recent cross-country study of civil war (Cederman, Gleditsch and Buhaug, 2013; Østby, 2008), as well as in ethnic conflict across districts in Indonesia (Mancini, 2008). Horizontal inequality between different regions and ethnic groups played a significant role in separatist and ethnic conflicts in Indonesia (Tadjoeddin 2011, 2013a). In contrast to Stewart (2000, 2008), these studies argue that it is not the widening of horizontal inequalities that matters, but convergences of socio-economic progresses both across regions and between ethnic groups achieved under the Suharto’s New Order authoritarian setting that have led to a sense of relative deprivation among the previously richer and more influential groups. Inter-ethnic conflict arising from narrowing of horizontal inequality or converging gap between two competing ethnic groups is not unique to Indonesia. It is also the case in India, where Hindu is the traditionally privileged group and Muslim is a relatively disadvantaged group. Mitra and Ray (2013) find that an increase in Muslim well-being, proxied by Muslim per-capita expenditures, leads to a large and significant increase in future Hindu-Muslim violence, while an increase in Hindu well-being has no significant effect on future conflict. They interpret this as Hindus act as the aggressor against the downgraded group (Muslims) who are trying to make a catching up progress. In the case of convergence, we may see that the traditionally-privileged groups may act as the aggressor. On the other hand, in the case of divergence, the marginalized group becomes the aggressor, as in the case of 1969 race riot in Malaysia when the marginalized and poorer Malay
The SMERU Research Institute 11
attacked the wealthier Chinese. The marginalized may also become aggressor in the case of vertical inequality. Another strand of study relates the role of vertical inequality in conflict to the democratization movement. For example, Acemoglu and Robinson (2006) believe that the demand for democracy is partly driven by aspirations for redistribution. In most cases, the democratization movement in its early phase has involved violent actions against authoritarian regimes. The violence involves not only the citizens and the security apparatus, but also the beneficiaries of the system (the elites and their private armies) and the general public. Therefore, it would be unwise to totally discount the role of vertical inequality in conflict and solely focus on the horizontal inequality, as the latest developments in the area of research seem to suggest, see for example Stewart (2008) and Østby et al. (2011). Both types of inequality create a sense of frustration highly essential in fuelling grievances among the general population and socio-economic/ethno-religious groups. It is argued that the opposing findings may be due to different types of conflict one is studying. While the studies that do not find much support for vertical inequality at the high profile violent conflicts such as civil war and ethnic conflict, a recent study by Tadjoeddin et al. (2012) finds a violence increasing effect of vertical inequality in the case of low profile routine violence in densely populated and ethnically rather homogenous Java.10 In the case of routine violence, the general sense of deprivation among the population due to high inequality of income and assets may play a significant role. Routine violence in some sense is a manifestation of frustration and can be seen as a competition among the lower strata of the socio-economic class in the absence of a class war. Therefore, recent studies on collective violence in contemporary Indonesia have helped to clarify the different role of the two types of inequality (horizontal and vertical) on the two broad classifications of collective violence, episodic and routine. Based on the changing nature of collective violence in Indonesia explained earlier, our empirical examination will focus on routine violence as the most dominant type of collective violence. In addition, we also examine ethnic violence as it shows an increasing trend although its magnitude is much smaller than that of routine violence.
V. EMPIRICAL ESTIMATION STRATEGY This study is about empirical examination of the link between inequality and societal stability. The stability is proxied by two variables, collective violence and violent crime. Collective violence data is taken from the SNPK, the best data of this kind available in Indonesia. In addition to collective violence, the SNPK also collects violent crime incidents. As explained earlier, the SNPK has its origin in the World Bank’s efforts in deepening and expanding of the previous UNSFIR collective violence database. In constructing the database, the SNPK gathers information from local newspapers complemented with NGO reports and other reputable sources. Each entry of violent incidents provides information on date, location, and
10The western part of Java is predominantly ethnic Sundanese, while the central and eastern parts are dominated by ethnic Javanese. The two ethnic groups account for around 85 percent of Java’s population. Higher levels of ethnic homogeneity are found at district levels, too; for example, ethnic Javanese accounts for more than 95 per cent in more than two-third of districts in the provinces of Central and East Java.
The SMERU Research Institute 12
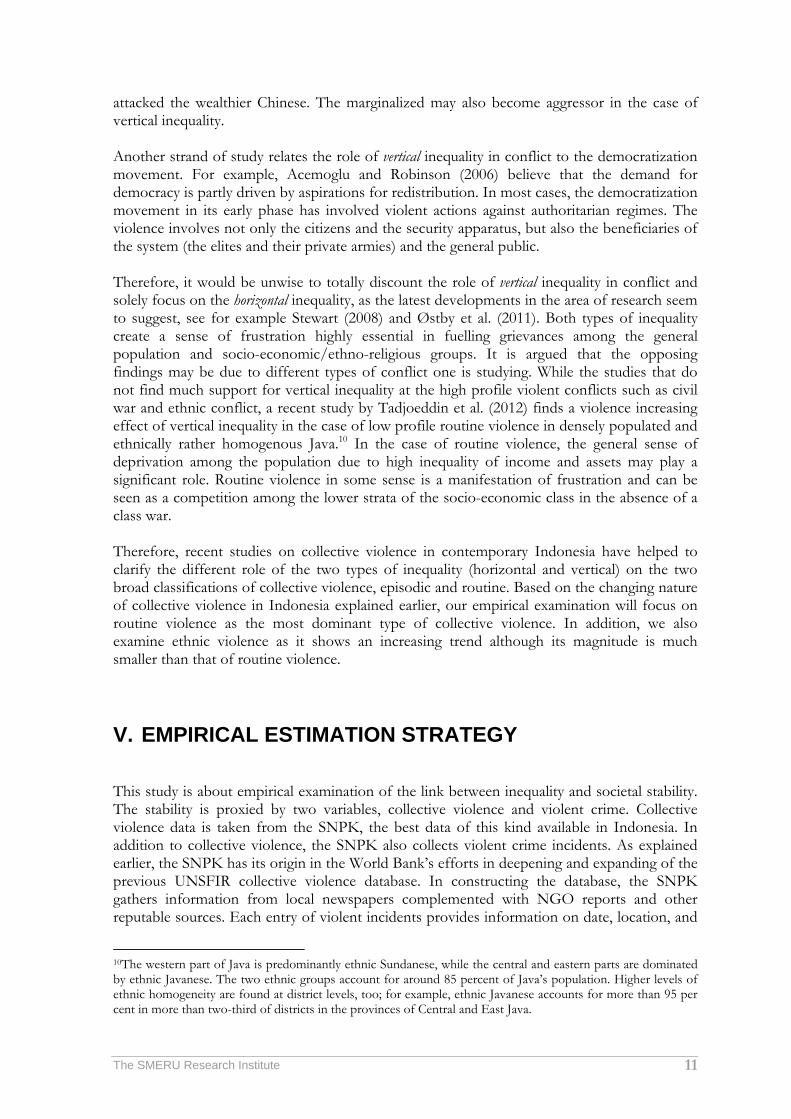
impact of the event; classifications of type, form and trigger of violence; actor affiliation and intervention. The SNPK is an ongoing effort. The SNPK data are available since 1997, but the area coverage varies (see Table 3).
Table 3. SNPK Area Coverage
Regions Year
1997-2004 2005-11 2012-13
Aceh v v v
Lampung - v v
Jabodetabek - v v
West Nusa Tenggara - v v
East Nusa Tenggara v v v
West Kalimantan v v v
Central Kalimantan v v v
East Kalimantan - - v
Central Sulawesi v v v
Maluku v v v
North Maluku v v v
Papua v v v
West Papua v v v
Source: SNPK
Given the SNPK area coverage, for consistency, this study focuses on the period 2005-2012 for the following regions: (1) Aceh, (2) Lampung, (3) Jabodetabek, (4) West Nusa Tenggara, (5) East Nusa Tenggara (6) West Kalimantan, (7) Central Kalimantan, (8) Central Sulawesi, (9) Maluku, (10) North Maluku, (11) Papua, and (12) West Papua. We use district level data following the situation back in 2000 before the start of the decentralization, meaning that we merge all new districts with their parent districts in 2000. Therefore we have panel data observation in the form of district-year. The period of 2005-2012 is chosen to have a consistent coverage of the SNPK data and represents a period when the racket of episodic violence during the peak of democratic transition had been more or less settled. By 2005 the macro picture of Indonesian decentralization had reached a fairly stable shape. The decentralization laws initially introduced in 1999 (to take effect in 2001) was revised in 2004. The revision includes the adoption of direct elections for heads of local governments. Special autonomy arrangements in previously restive regions of Aceh and Papua were confirmed. Ethnic violence in several regions in the outer islands such as Maluku, Sambas, Sampit and Poso during the peak of the decentralization reform has been labelled as communal war by Klinken (2007), while the much lower scale of more sporadic incidents ethnic violence occur after 2005 are rather different. The former is more about uncertainties during democratic and decentralization reforms, while the latter (post 2005 ethnic violence) is more on problems related to the remaining illiberal characteristics of Indonesia’s democracy due to incompleteness of the reform (Wilson, forthcoming).

The SMERU Research Institute 13
Our main variables of interest are collective violence or violent crime as the inverse measures of societal stability treated as dependent variables; and inequality as our main independent variable. The relationship is written as below:
itnitnitit XINEQVIO εααα +++= 10
VIO represents an inverse measure of societal stability that includes routine violence, ethnic violence and violent crime. For routine and ethnic violence, incident and death measures are considered; while for violent crime, we only consider incident measure. INEQ is the inequality variable. We consider both types of inequality, vertical and horizontal; the former is relevant for routine violence and violent crime, and the latter is more suitable to explain ethnic violence. Gini index of consumption expenditure based on the Susenas is used as vertical inequality measure, while group Gini (GGINI) and weighted group coefficient of variation (wGCOV) of years of schooling (education) across ethnic and religious groups based on the decadal population census are used as horizontal inequality measures.11 For the independent variables, in addition INEQ variable as our main interest, we include X vector representing a series of potential determinants of violence as controls. They include economic growth, income (per capita Regional Gross Domestic Product – RGDP), poverty rate (percentage of population live below the poverty line), education (years of schooling), young (proportion of young population aged 15-24), urban dummy (urban-rural categorization), ethnic/religious fractionalization and population size. The inclusion of most of the independent variables is based on the opportunity/feasibility hypothesis for violence (Collier, Hoeffler and Rohner, 2009). Economic growth indicates recent/current economic situation reflecting hope for continuous increase in the level of income in the long run; therefore it should be negatively associated with violence (Tadjoeddin and Murshed 2007). Level of income reflects the overall level of development. Both, lower growth and income indicate lower opportunity costs to engage in violence for its participants. There is a consensus that per capita GDP is the most robust predictor of civil war risk, and it is almost always included in any cross country conflict regression (Hegre and Sambanis, 2006; Ross, 2004). Fearon and Laitin (2003) use per capita GDP as a proxy for state strength, arguing that state weakness, such as limited policing capacity and poor infrastructure, provides the opportunity for rebels to sustain insurgency. The logic of poverty as determinant of violence is also closely linked to the opportunity hypothesis. However, different from having lower average income, poverty measure concerns with the relative size population located below a certain income threshold. Poverty is found be positively correlated with routine violence across districts in Java during 1993-2003 (Tadjoeddin and Murshed, 2007) and local electoral violence across districts in Indonesia during 2005-2007 (Tadjoedin, 2011). Education is another variable to gauge level of development, where lower level of education is associated with lower opportunity cost to engage in violence (Østby and Urdal, 2010). We also consider several demographic variables. Proportion of young people aged between 15 and 24, popularly termed as youth bulge, in a society is another control variable since the majority participants of violence are youths (Urdal, 2006, 2008). Then, we include urban dummy variable to differentiate the predominantly urban district (kota) from the predominantly rural district (kabupaten) as higher population density of urban setting represent 11See Mancini, Stewart and Brown (2008) for detail formula of GGINI and wGCOV.

The SMERU Research Institute 14
a population pressure making violence is more likely (Ostby et al., 2011; Urdal, 2012). Ethnic and religious fractionalizations are next control variables to account for grievance based on identity frames (Esteban, Mayoral and Ray, 2012). The last variable is population size that purely serves as a control variable. We do not convert the dependent variable, either incident or death measure, into incident or death per population to keep the original nature of our dependent variable as count data. This enables us to consistently use count data regression, negative binomial, to estimate the model.12 Data of vertical inequality (Gini index of consumption expenditure), years of schooling and proportion of young people are calculated from the Susenas (National Socioeconomic Survey). Growth and per capita RGDP (Regional Gross Domestic Product) are derived from the Regional Income Account. Data of horizontal inequalities and fractionalization are calculated from the population census. All of this data is collected by Statistics Indonesia (Badan Pusat Statistik, BPS).
VI. RESULTS This section details our results, presented in the order of our dependent variables (routine violence, ethnic violence and violent crime). A robustness check is offered in the last part of this section. 6.1 Routine Violence
We begin with routine violence, the most dominant type of collective violence since 2005. Vertical inequality is found to be positively correlated with incidents of routine violence (Table 4, columns 3 and 4). The statistically significant and sizable magnitude of the Gini variable is obtained after treating inequality as endogenous to the level of income following the bell-shaped curve Kuznets relationship between inequality and income (Kuznets, 1955). A Kuznets-type relationship between inequality and income in Indonesia has also been confirmed by a recent cross district panel study (Tadjoeddin, 2013c). The positive and highly significant coefficients of income in columns (1) and (2) are against our initial expectation as studies show that that level of income is the most robust predictor of conflict (Hegre and Sambanis, 2006). We check a quadratic (bell-shaped curve) relationship between violence and income and found that the quadratic relationship is highly significant. This is to reconcile the contrasting views about the linear and non-linear relationships between violence and income, as detailed in Tadjoeddin and Murshed (2007). An increase in prosperity may encourage predatory behaviour in the form of private violence (akin to our concept of routine violence) by grievance of the less fortunate or greed of the more fortunate. Once growth progresses further, violence has to decline to sustain the security of investment, and the state has to perform regulatory functions. If everyone is lifted up to a certain level they would be less envious and less prone to routine violence.
12Basic model for estimating count data is the Poisson regression model for rare events. However, the Poisson model is usually suffered from the problem of over-dispersion. In this case, a popular alternative is the negative binomial regression. See Cameron & Trivedi (1998) for more details on count data regressions that are common in certain types of empirical research, such as criminology.
The SMERU Research Institute 15
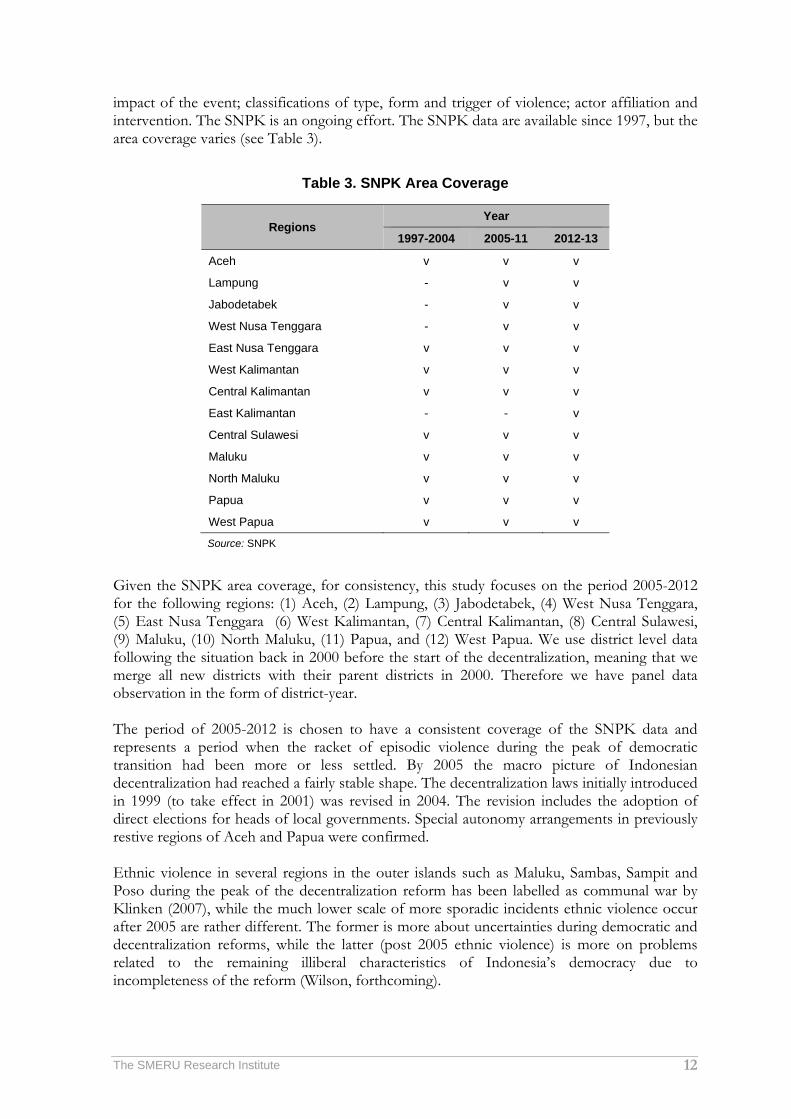
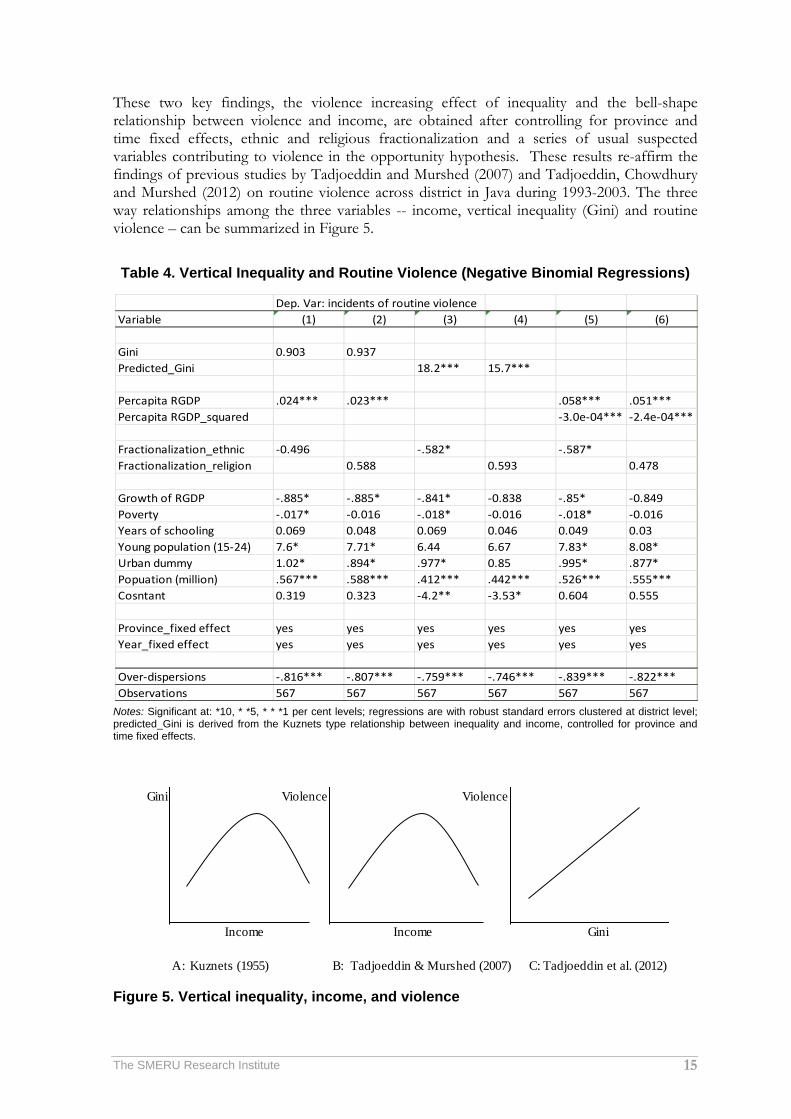
These two key findings, the violence increasing effect of inequality and the bell-shape relationship between violence and income, are obtained after controlling for province and time fixed effects, ethnic and religious fractionalization and a series of usual suspected variables contributing to violence in the opportunity hypothesis. These results re-affirm the findings of previous studies by Tadjoeddin and Murshed (2007) and Tadjoeddin, Chowdhury and Murshed (2012) on routine violence across district in Java during 1993-2003. The three way relationships among the three variables -- income, vertical inequality (Gini) and routine violence – can be summarized in Figure 5.
Table 4. Vertical Inequality and Routine Violence (Negative Binomial Regressions)
Notes: Significant at: *10, * *5, * * *1 per cent levels; regressions are with robust standard errors clustered at district level; predicted_Gini is derived from the Kuznets type relationship between inequality and income, controlled for province and time fixed effects.
Figure 5. Vertical inequality, income, and violence
Dep. Var: incidents of routine violenceVariable (1) (2) (3) (4) (5) (6)
Gini 0.903 0.937 Predicted_Gini 18.2*** 15.7***
Percapita RGDP .024*** .023*** .058*** .051*** Percapita RGDP_squared ‐3.0e‐04*** ‐2.4e‐04***
Fractionalization_ethnic ‐0.496 ‐.582* ‐.587* Fractionalization_religion 0.588 0.593 0.478
Growth of RGDP ‐.885* ‐.885* ‐.841* ‐0.838 ‐.85* ‐0.849Poverty ‐.017* ‐0.016 ‐.018* ‐0.016 ‐.018* ‐0.016Years of schooling 0.069 0.048 0.069 0.046 0.049 0.03Young population (15‐24) 7.6* 7.71* 6.44 6.67 7.83* 8.08* Urban dummy 1.02* .894* .977* 0.85 .995* .877* Popuation (million) .567*** .588*** .412*** .442*** .526*** .555*** Cosntant 0.319 0.323 ‐4.2** ‐3.53* 0.604 0.555
Province_fixed effect yes yes yes yes yes yesYear_fixed effect yes yes yes yes yes yes
Over‐dispersions ‐.816*** ‐.807*** ‐.759*** ‐.746*** ‐.839*** ‐.822*** Observations 567 567 567 567 567 567
Gini Violence Violence
Income Income Gini
A: Kuznets (1955) B: Tadjoeddin & Murshed (2007) C: Tadjoeddin et al. (2012)
The SMERU Research Institute 16
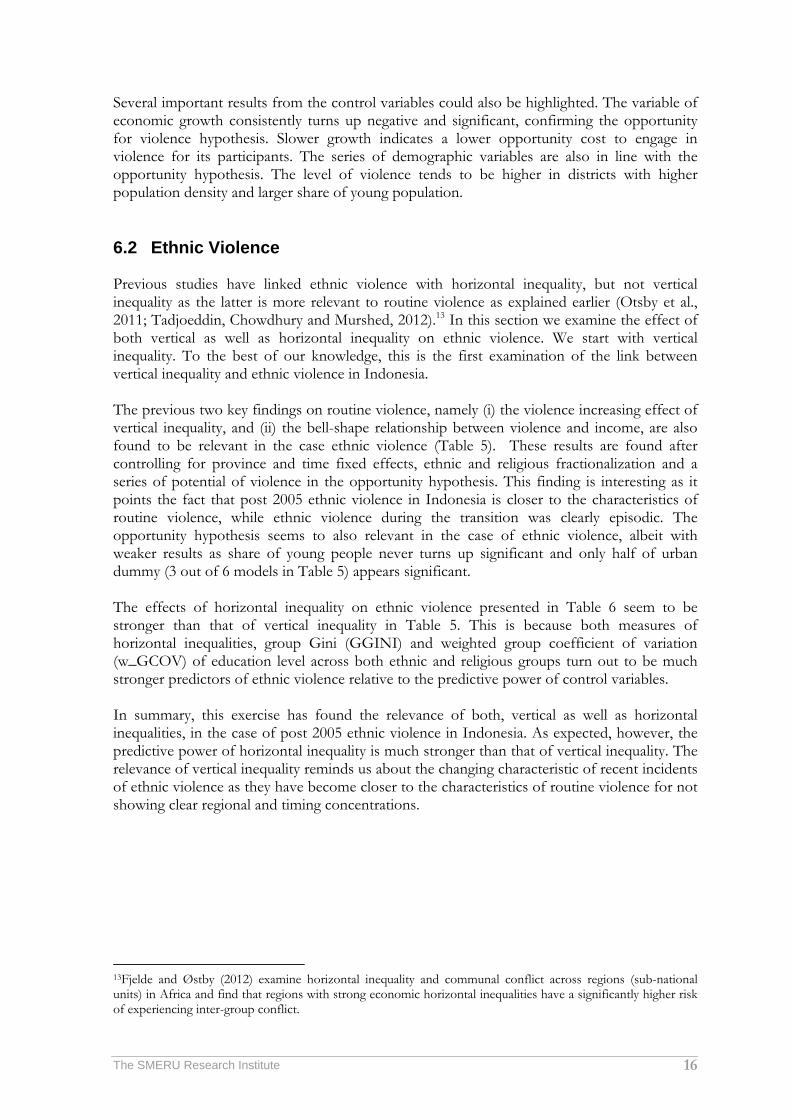
Several important results from the control variables could also be highlighted. The variable of economic growth consistently turns up negative and significant, confirming the opportunity for violence hypothesis. Slower growth indicates a lower opportunity cost to engage in violence for its participants. The series of demographic variables are also in line with the opportunity hypothesis. The level of violence tends to be higher in districts with higher population density and larger share of young population. 6.2 Ethnic Violence Previous studies have linked ethnic violence with horizontal inequality, but not vertical inequality as the latter is more relevant to routine violence as explained earlier (Otsby et al., 2011; Tadjoeddin, Chowdhury and Murshed, 2012).13 In this section we examine the effect of both vertical as well as horizontal inequality on ethnic violence. We start with vertical inequality. To the best of our knowledge, this is the first examination of the link between vertical inequality and ethnic violence in Indonesia. The previous two key findings on routine violence, namely (i) the violence increasing effect of vertical inequality, and (ii) the bell-shape relationship between violence and income, are also found to be relevant in the case ethnic violence (Table 5). These results are found after controlling for province and time fixed effects, ethnic and religious fractionalization and a series of potential of violence in the opportunity hypothesis. This finding is interesting as it points the fact that post 2005 ethnic violence in Indonesia is closer to the characteristics of routine violence, while ethnic violence during the transition was clearly episodic. The opportunity hypothesis seems to also relevant in the case of ethnic violence, albeit with weaker results as share of young people never turns up significant and only half of urban dummy (3 out of 6 models in Table 5) appears significant. The effects of horizontal inequality on ethnic violence presented in Table 6 seem to be stronger than that of vertical inequality in Table 5. This is because both measures of horizontal inequalities, group Gini (GGINI) and weighted group coefficient of variation (w_GCOV) of education level across both ethnic and religious groups turn out to be much stronger predictors of ethnic violence relative to the predictive power of control variables. In summary, this exercise has found the relevance of both, vertical as well as horizontal inequalities, in the case of post 2005 ethnic violence in Indonesia. As expected, however, the predictive power of horizontal inequality is much stronger than that of vertical inequality. The relevance of vertical inequality reminds us about the changing characteristic of recent incidents of ethnic violence as they have become closer to the characteristics of routine violence for not showing clear regional and timing concentrations.
13Fjelde and Østby (2012) examine horizontal inequality and communal conflict across regions (sub-national units) in Africa and find that regions with strong economic horizontal inequalities have a significantly higher risk of experiencing inter-group conflict.
The SMERU Research Institute 17
Table 5. Vertical Inequality and Ethnic Violence (Negative Binomial Regressions)
Notes: Significant at: *10, * *5, * * *1 per cent levels; regressions are with robust standard errors clustered at district level; predicted_Gini is derived from the Kuznets type relationship between inequality and income, controlled for province and time fixed effects.
Table 6. Horizontal Inequality and Ethnic Violence (Negative Binomial Regressions)
Notes: Significant at: *10, * *5, * * *1 per cent levels; regressions are with robust standard errors clustered at district level.
Dep. Var: incidents of ethnic violenceVariable (1) (2) (3) (4) (5) (6)
Gini 0.723 0.832 Predicted_Gini 41.2*** 33.4***
Percapita RGDP .039*** .037*** .105*** .086*** Percapita RGDP_squared ‐6.0e‐04*** ‐4.5e‐04**
Fractionalization_ethnic ‐2.07** ‐2.29** ‐2.26** Fractionalization_religion 2.89** 2.89** 2.77*
Growth of RGDP ‐2.75** ‐2.48** ‐2.17* ‐2.08* ‐2.11 ‐2.01Poverty 0.017 0.018 9.00E‐03 0.011 0.013 0.015Years of schooling 0.055 ‐0.031 ‐0.012 ‐0.091 ‐8.90E‐03 ‐0.083Young population (15‐24) 0.478 1.41 ‐0.693 0.286 0.833 1.83Urban dummy 1.69** 1.06 1.54** 0.941 1.56** 0.957Popuation (million) 1.07*** 1.21*** .709*** .868*** .914*** 1.1*** Constant ‐2.84 ‐2.65 ‐13*** ‐10.7*** ‐2.27 ‐2.16
Province_fixed effect yes yes yes yes yes yesYear_fixed effect yes yes yes yes yes yes
Over‐dispersions .735*** .751*** .705*** .744*** .678*** .715*** Observations 567 567 567 567 567 567
Dep. Var: incidents of ethnic violenceVariable (1) (2) (3) (4)
HI (w_GCOV_ethnic) 4.24***HI (w_GCOV_religion) 6.09***
HI (GGINI_ethnic) 7.22***HI (GGINI_religion) 15***
Fractionalization_ethnic ‐2.56*** ‐2.73***Fractionalization_religion 2.49* 1.6
Percapita RGDP .022*** .025*** .024*** .021***Growth of RGDP ‐1.5 ‐1.39 ‐1.58 ‐0.912Poverty 3.40E‐03 ‐1.30E‐03 7.10E‐03 3.40E‐03Years of schooling 0.174 0.173 0.117 0.085Young population (15‐24) ‐1.46 ‐0.479 ‐0.33 ‐0.887Urban dummy 1.13 0.245 1.37* 0.663Popuation (million) .854*** 1.12*** .89*** 1.06***Constant ‐3.02 ‐3.48* ‐2.67 ‐2.6
Province_fixed effect yes yes yes yesYear_fixed effect yes yes yes yes
Over‐dispersions .612** .607*** .644*** .589***Observations 567 567 567 567
The SMERU Research Institute 18
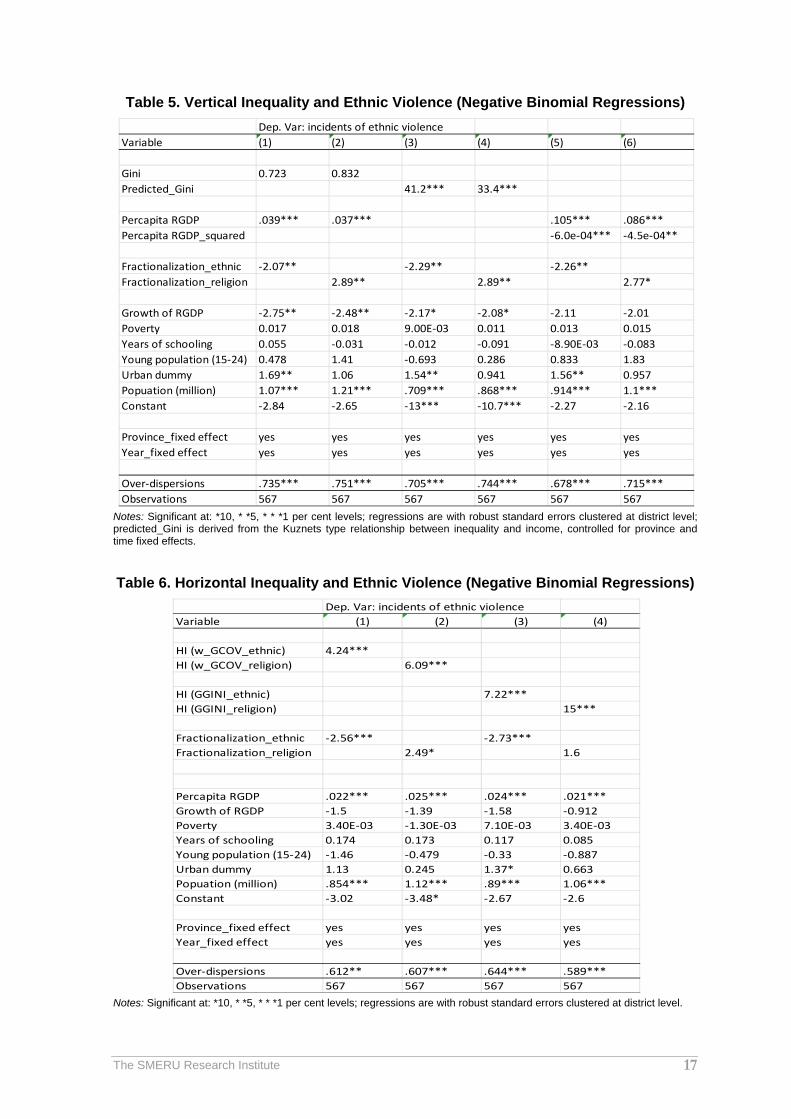
6.3 Violent Crime Now, let us consider violence crime whose data is made available by the SNPK. Our hypothesis on the relationship between inequality and violent crime is similar to that of routine violence as the two have close resemblance. Although routine violence must contain criminal dimension, it cannot simply be labelled as crime since its collective nature points to deeper social context. In essence, violent crime is more confined to rather individualistic criminal behaviour and its social context is less that of routine violence. In accordance with routine violence, we find statistically significant crime increasing effect of higher vertical inequality and a bell-shape relationship between crime and income (Table 7). The results of other control variables are strongly supportive to the opportunity hypothesis. Higher incidents of violent crime are more likely to be experienced by districts with slower economic growth, higher poverty rate and larger share of young population. The significant and positive effect of education on violent crime should be understood with caution. We suspect the relationship is in the form of bell-shape curve as in the case of income. Therefore, as in the case of income, in the long run, achieving higher level of education should correlate with lower frequency of violent crime.14
Table 7. Vertical Inequality and Violent Crime (Negative Binomial Regressions)
Notes: Significant at: *10, * *5, * * *1 per cent levels; regressions are with robust standard errors clustered at district level; predicted_Gini is derived from the Kuznets type relationship between inequality and income, controlled for province and time fixed effects.
14This is an interesting further examination, but beyond the scope of the current study.
Dep. Var: incidents of violent crimeVariable (1) (2) (3) (4) (5) (6)
Gini 0.692 0.675 Predicted_Gini 24*** 21.8***
Percapita RGDP .025*** .023*** .073*** .066*** Percapita RGDP_squared ‐4.3e‐04*** ‐3.8e‐04***
Fractionalization_ethnic ‐0.198 ‐0.339 ‐0.36 Fractionalization_religion 0.971 0.913 0.814
Growth of RGDP ‐1.35*** ‐1.36*** ‐1.37*** ‐1.37*** ‐1.41*** ‐1.41*** Poverty ‐.021** ‐.021** ‐.023** ‐.022** ‐.023** ‐.022** Years of schooling .178*** .165*** .176*** .158*** .156*** .141** Young population (15‐24) 10.7*** 10.5*** 9.86** 9.89** 11.1*** 11.1*** Urban dummy 0.509 0.381 0.401 0.269 0.417 0.293Popuation (million) .692*** .704*** .537*** .557*** .624*** .643*** Constant ‐0.305 ‐0.184 ‐6.53*** ‐5.86*** ‐0.097 ‐0.07
Province_fixed effect yes yes yes yes yes yesYear_fixed effect yes yes yes yes yes yes
Over‐dispersions ‐.766*** ‐.779*** ‐.761*** ‐.769*** ‐.81*** ‐.815*** Observations 567 567 567 567 567 567
The SMERU Research Institute 19
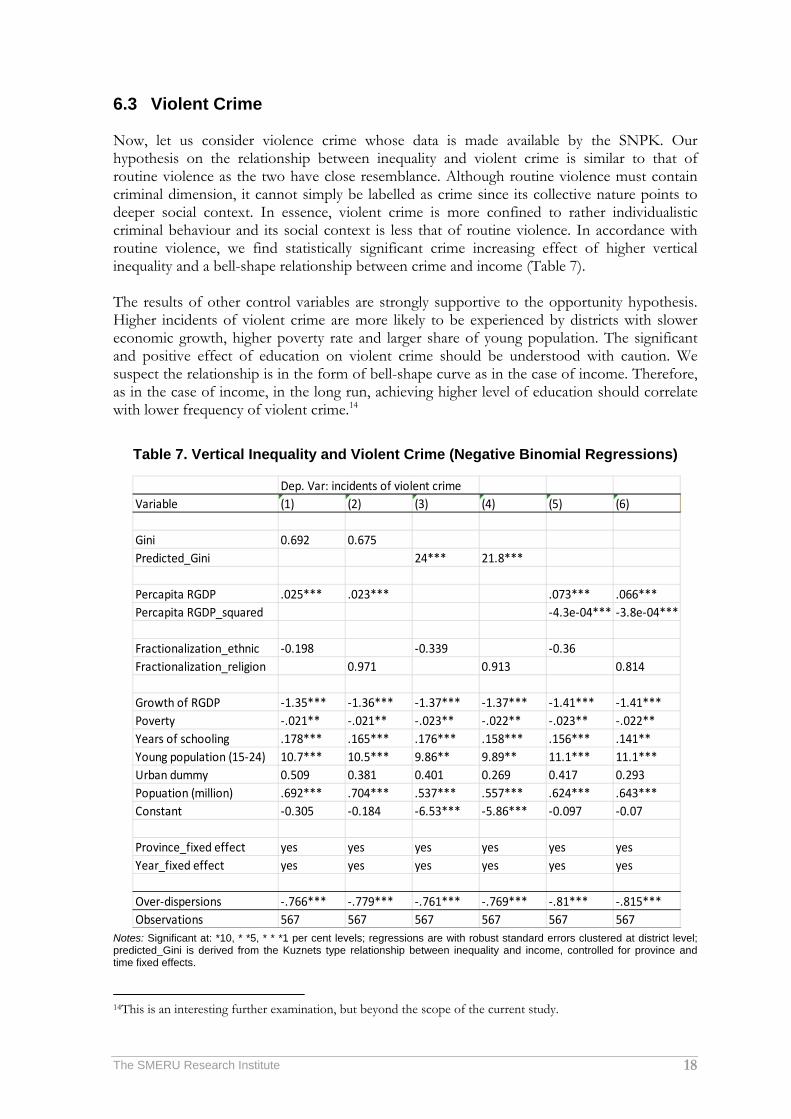
6.4 Robustness Checks As explained earlier, our findings on the violence increasing effect of higher inequality hold after controlling for both province and year fixed effects. The inclusion of province effects means that the regression has controlled for province-specific time invariant unobserved characteristics. Year effects control for time variant unobserved characteristics not unique to any particular region, such as national election year and external shock due to the Global Financial Crisis (GFC). The model has also included several other variables usually suspected to have link with violence based on the opportunity hypothesis. While we rely on the incident measure of violence, we check the stability of our key findings by employing death measure of routine and ethnic violence, see Tables 8, 9 and 10. Our key findings hold after controlling for province and year fixed effects, ethnic and religious fractionalization and series of other potential determinants of violence.
Table 8. Vertical Inequality and Routine Violence (Death Measure)
Notes: Significant at: *10, * *5, * * *1 per cent levels; regressions are with robust standard errors clustered at district level; predicted_Gini is derived from the Kuznets type relationship between inequality and income, controlled for province and time fixed effects.
Dep. Var: deaths of routine violenceVariable (1) (2) (3) (4) (5) (6)
Gini 0.626 0.497 Predicted_Gini 16.3** 14.9**
Percapita RGDP .012** .012** .043*** .039** Percapita RGDP_squared ‐2.7e‐04** ‐2.4e‐04**
Fractionalization_ethnic ‐0.13 ‐0.213 ‐0.2 Fractionalization_religion 0.568 0.495 0.449
Growth of RGDP ‐1.03* ‐.998* ‐.924* ‐.904* ‐.952* ‐.934* Poverty 4.60E‐03 3.60E‐03 2.90E‐03 2.70E‐03 3.60E‐03 3.40E‐03Years of schooling ‐0.045 ‐0.055 ‐0.059 ‐0.068 ‐0.064 ‐0.073Young population (15‐24) ‐0.027 ‐0.453 ‐0.63 ‐0.973 0.16 ‐0.178Urban dummy 0.034 ‐0.02 ‐0.023 ‐0.077 ‐0.017 ‐0.067Popuation (million) .62*** .627*** .551*** .563*** .596*** .607*** Cosntant ‐0.445 ‐0.253 ‐4.53** ‐4.05** ‐0.222 ‐0.124
Province_fixed effect yes yes yes yes yes yesYear_fixed effect yes yes yes yes yes yes
Over‐dispersions ‐.341* ‐.35* ‐.353* ‐.36* ‐.362* ‐.368** Observations 567 567 567 567 567 567
The SMERU Research Institute 20
Table 9. Vertical Inequality and Ethnic Violence (Death Measure)
Notes: Significant at: *10, * *5, * * *1 per cent levels; regressions are with robust standard errors clustered at district level; predicted_Gini is derived from the Kuznets type relationship between inequality and income, controlled for province and time fixed effects.
Table 10. Horizontal Inequality and Ethnic Violence (Death Measure)
Notes: Significant at: *10, * *5, * * *1 per cent levels; regressions are with robust standard errors clustered at district level.
Dep. Var: deaths of ethnic violenceVariable (1) (2) (3) (4) (5) (6)
Gini 5.29 4.97Predicted_Gini 42.4** 35**
Percapita RGDP 0.035 0.029 .108*** .088**Percapita RGDP_squared ‐8.5e‐04** ‐6.80E‐04
Fractionalization_ethnic ‐5.75* ‐5.71** ‐5.71**Fractionalization_religion ‐0.727 ‐1.12 ‐1.12
Growth of RGDP ‐9.95*** ‐8.47*** ‐8.88*** ‐7.7*** ‐8.88*** ‐7.69***Poverty 0.119 .123* 0.125 .126** 0.125 .126**Years of schooling 0.337 0.208 0.189 0.084 0.188 0.084Young population (15‐24) ‐1.97 9.97 0.932 13.7 0.898 13.8Urban dummy 4.21 1.68 4.39 1.77 4.39 1.78Popuation (million) 3.4** 3.45* 2.58** 2.74* 2.58* 2.75Constant ‐11.5*** ‐12.7*** ‐20.8*** ‐20.5*** ‐9.28** ‐10.9***
Province_fixed effect yes yes yes yes yes yesYear_fixed effect yes yes yes yes yes yes
Over‐dispersions 2.24*** 2.33*** 2.21*** 2.33*** 2.21*** 2.33*** Observations 567 567 567 567 567 567
Dep. Var: deaths of ethnic violenceVariable (1) (2) (3) (4)
HI (w_GCOV_ethnic) 6.3**HI (w_GCOV_religion) 17.6***
HI (GGINI_ethnic) 13.5***HI (GGINI_religion) 45***
Fractionalization_ethnic ‐6.69** ‐7.2**Fractionalization_religion ‐3.39 ‐6.02*
Percapita RGDP ‐4.70E‐03 ‐0.012 ‐9.10E‐03 ‐0.046Growth of RGDP ‐7.58*** ‐4.86*** ‐7.34*** ‐3.16Poverty 0.115 0.088 0.12 .117*Years of schooling .416* .883*** .372* .578**Young population (15‐24) 3.08 8.59 4.44 0.514Urban dummy 3.72 ‐0.556 3.97 1.62Popuation (million) 2.38* 2.6* 2.26** 2.22*Constant ‐11.1*** ‐16.3*** ‐10.8*** ‐12.4***
Province_fixed effect yes yes yes yesYear_fixed effect yes yes yes yes
Over‐dispersions 2.19*** 2.08*** 2.2*** 2.1***Observations 567 567 567 567
The SMERU Research Institute 21
VII. CONCLUSION This study has located the problem of economic inequality in development process and hypothesized for the violence increasing effects of inequality that may harm societal stability. Societal stability is something that cannot be overlooked in a large and diverse country like Indonesia with its young democracy. It has also been established that different types of inequality may differently affect different types of collective violence, therefore unpacking inequality and violence into several categorisation becomes critical. The empirical results have provided strong supports for the hypothesis contending that rising inequality is harmful for the societal stability in the case of routine violence, ethnic violence and violent crime based on data from several Indonesia’s provinces previously categorised as ‘high conflict’ regions. These findings are based on empirical analysis of data for the period 2005-2012. This period represents a comparatively much more stable progress related to democratization and decentralization in Indonesia, if one compares the situation with Indonesia in late 1990s and early 2000s.
As the country continuously aspires to grow, move to higher level of development, play more significantly as a regional player and, more importantly, to consolidate its democracy further, something must be done to tackle the rising inequality. With this new evidence, it implies that continuously increasing inequality is indeed something to be worried about. Therefore, at first we have to ensure that tackling inequality is included as an explicit focus in development agenda.
The SMERU Research Institute 22
LIST OF REFERENCES Acemoglu, Daron, and James A. Robinson. 2006. Economic Origins of Dictatorship and Democracy.
New York: Cambridge University Press. Alesina, Alberto, and Roberto Perotti. 1996. "Income Distribution, Political Instability, and
Investment." European Economic Review 40 (6):1203-28. Barron, Patrick, Ashutosh Varsney, Blair Palmer and Sana Jaffrey. 2009. “Understanding
Violent Conflict in Indonesia: A Mix Method Approach”. Social Development Papers 117. Washington, DC: World Bank.
Berg, Andrew, Jonathan D. Ostry and Jeromin Zettelmeyer. 2012. “What makes growth
sustained?” Journal of Development Economics 98(2): 149-66. Booth, Anne. 1999. "Will Indonesia Break up?" Inside Indonesia 59 (July-September). Brown, Graham. 2008. “Horizontal Inequalities and Separatism in Southeast Asia: A
Comparative Perspective”. In F. Stewart (ed.), Horizontal Inequalities and Conflict: Understanding Group Violence in Multiethnic Societies. Basingstoke, UK: Palgrave Macmillan.
Cameron, A. C. & P. K. Trivedi, P. K. 1998. Regression Analysis of Count Data. Cambridge:
Cambridge University Press. Cederman, L. E., K.S. Gleditsch, H. Buhaug. 2013. Inequality, Grievances, and Civil War.
Cambridge, UK: Cambridge University Press. Chua, Amy. 2002. World on Fire: How Exporting Free Market Democracy Breeds Ethnic Hatred and
Global Instability. New York: Doubleday. Claessens, S., S. Djankov and L.H.P. Lang. 1999. “Who controls East Asian corporations?”.
Policy Research Working Paper No. 2054. Washington, DC: World Bank. Collier, Paul, and Anke Hoeffler. 2004. "Greed and grievance in civil war." Oxford Economic
Papers 56 (4):563-95. Collier, Paul, Anke Hoeffler and Dominic Rohner. 2009. “Beyond greed and grievance:
feasibility and civil war”. Oxford Economic Papers 61(1): 1-27. Cramer, Christopher 2005. "Inequality and Conflict: A Review of an Age-Old Concern."
Identities, Conflict and Cohesion Programme Paper 11. Geneva: UNRISD. Cribb, Robert. 1999. "Not the Next Yugoslavia: Prospect for Disintegration of Indonesia."
Australian Journal of International Affairs 53 (2):169-78. de Soysa, Indra. 2002. "Ecoviolence: Shrinking Pie or Honey Pot?" Global Environmental Politics
2(4): 1 – 36.
The SMERU Research Institute 23
Dhanani, S., I. Islam and A. Chowdhury. 2009. The Indonesia Labour Market: Challenge and Changes. London: Routledge.
Dube, Arindrajit and Ethan Kaplan. 2012. “Political Economy of Occupy Wall Street”. The
Economists’ Voice 9 (3): Article 3. Easterly, William. 2007. "Inequality Does Cause Underdevelopment: Insights from a New
Instrument". Journal of Development Economics 84(2): 755-76. Esteban, Joan, Laura Mayoral and Debraj Ray. 2012. “Ethnicity and Conflict: An Empirical
Study”. American Economic Review 102(4): 1310–1342 Fearon, James D., and David D. Laitin. 2003. "Ethnicity, Insurgency, and Civil War." American
Political Science Review 97 (1):75-90. Fjelde, Hanne and Gudrun Østby. 2012. “Economic Inequality and Inter – group Conflicts in
Africa”. Paper prepared for presentation at the Democracy as Idea and Practice conference, Oslo, January 12-13.
Frankema, E. and D. Mark. 2009. “Was it really growth with equity under Soeharto? A Theil
analysis of income distribution in Indonesia, 1960-2001”. Economics and Finance in Indonesia 57 (1): 47-76.
Goda, Thomas. 2013. “The Role of Income Inequality in Crisis Theories and in the Subprime
Crisis”. Post Keynesian Economics Study Group Working Paper 1305. Gurr, Ted R. 1970. Why Men Rebel. Princeton, N.J.: Princeton University Press. Hegre, Håvard, and Nicholas Sambanis. 2006. "Sensitivity Analysis of Empirical Results on
Civil War Onset." Journal of Conflict Resolution 50 (4):508-35. Hegre, Håvard, Tanja Ellingsen, Scott Gates, and Nils Petter Gleditsch. 2001. "Towards a
Democratic Civil Peace? Democracy, Civil Change, and Civil War 1816-1992." American Political Science Review 95 (1):17-33.
Hirschman, Albert O. 1973. "The Changing Tolerance for Income Inequality in the Course of
Economic Development." World Development 1 (12):29-36. Hirschman, Albert O. 1973. "The Changing Tolerance for Income Inequality in the Course of
Economic Development." World Development 1 (12):29-36. Horowitz, Donald. 1985. Ethnic Groups in Conflict. Berkeley: University of California Press. Huntington, Samuel P. 1968. Political Order in Changing Societies. New Haven and London: Yale
University Press. Kanbur, Ravi. 2007. "Poverty, Inequality and Conflict." AEM Working Paper 2007-01. Ithaca,
N.Y.: Cornell University. Kaplan, Robert D. 2000. The coming Anarchy: Shattering the Dreams of the Post Cold War. New
York: Random House.
The SMERU Research Institute 24
Kumhof, Michael and Romain Rancière. 2010. “Inequality, Leverage and Crises”. IMF
Working Paper 10/268. Washington, D.C: International Monetary Fund. Kuznets, Simon. 1955. "Economic Growth and Income Inequality." American Economic Review
45 (1):1-28. Lewis, W. Arthur. 1976. “Development and distribution”. In Employment, Income Distribution and
Development Strategy, eds. A. Cairncross, M . Puri, pp . 26-42. London: Macmillan. Mancini, Luca, Frances Stewart and Graham Brown. 2008. “Approaches to the Measurement
of Horizontal Inequalities”. In F. Stewart (ed.), Horizontal Inequalities and Conflict: Understanding Group Violence in Multiethnic Societies. Basingstoke, UK: Palgrave Macmillan.
Milanovic, Branco. 2011. The Haves and the Have-Nots: A Brief and Idiosyncratic History of Global
Inequality. New York: Basic Books. Mitra, Anirban and Debraj Ray 2013. “Implications of an Economic Theory of Conflict:
Hindu-Muslim Violence in India”. NBER Working Paper No. 19090 Muller, Edward N. 1997. "Economic Determinants of Democracy." In Inequality, Democracy and
Economic Development., ed. M. I. Midlarsky. Cambridge, U.K.: Cambridge University Press.
Nafziger, E. Wayne, and Juha Auvinen. 2002. "Economic Development, Inequality, War and
State Violence." World Development 30 (2):153-63. Olson, Mancur. 1965. The Logic of Collective Action. Cambridge, M.A.: Harvard University Press. Østby, Gudrun and Henrik Urdal 2010. “Education and Civil Conflict: A Review of the
Quantitative, Empirical Literature”. Background paper prepared for the Education for All Global Monitoring Report 2011, The hidden crisis: Armed conflict and education.
Østby, Gudrun, Henrik Urdal, Mohammad Zulfan Tadjoeddin, Syed Mansoob Murshed, and
Havard Strand. 2011. "Population Pressure, Horizontal Inequality and Political Violence: A Disaggregated Study of Indonesian Provinces, 1990–2003." Journal of Development Studies 47(3): 377-98.
Østby, Gudrun. 2008b. "Polarization, Horizontal Inequalities and Violent Civil Conflict."
Journal of Peace Research 45 (2):143-62. Przeworski, Adam, Michael Alvarez, José A. Cheibub, and Fernando Limongi. 2000. Democracy
and Development: Political Institutions and Material Well-being in the World, 1950-1990. New York: Cambridge University Press.
Rajan, R. 2010. Fault Lines: How Hidden Fractures Still Threaten the World Economy. Princeton, NJ:
Princeton University Press. Ravallion, Martin. 2011. “A Comparative Perspective on Poverty Reduction in Brazil, China,
and India”. The World Bank Research Observer 26(1): 71-104.

The SMERU Research Institute 25
Ross, Michael L. 2004. "What Do We Know about Natural Resources and Civil War?" Journal
of Peace Research 41 (3):337-56. Russett, Bruce M. 1964. "Inequality and Insurgency: The Relation of Land Tenure to Politics."
World Politics 16:442-54. Snyder, Jack. 2000. From Voting to Violence: Democratization and Nationalist Conflict. New York,
London: W.W. Norton & Company. Stewart, Frances (ed.). 2008. Horizontal Inequalities and Conflict: Understanding Group Violence in
Multiethnic Societies. Basingstoke, UK: Palgrave Macmillan. Stewart, Frances. 2000. "Crisis Prevention: Tackling Horizontal Inequalities." Oxford
Development Studies 28 (3):245 - 62. Stiglitz, Joseph E. 2012. The Price of Inequality. New York: W.W. Norton. Tadjoeddin, Mohammad Zulfan, and Syed Mansoob Murshed. 2007. "Socio-Economic
Determinants of Everyday Violence in Indonesia: An Empirical Investigation of Javanese Districts, 1994-2003." Journal of Peace Research 44 (6):689-709.
Tadjoeddin, Mohammad Zulfan, Anis Chowdhury and S. Mansoob Murshed. 2012. “Routine
Violence in the Island of Java, Indonesia: Neo-Malthusian and Social Justice Perspectives”. In Jürgen Scheffran et al. (eds.). Climate Change, Human Security and Violent Conflict, Hexagon Series, Vol. VIII, Berlin: Springer.
Tadjoeddin, Mohammad Zulfan. 2002. "Anatomy of Social Violence in the Context of
Transition: The Case of Indonesia 1990-2001." UNSFIR Working Paper 02/01. Jakarta: UNSFIR.
Tadjoeddin, Mohammad Zulfan. 2011. “The Economic Origins of Indonesia's Secessionist
Conflicts”. Civil Wars 13(3): 312-32. Tadjoeddin, Mohammad Zulfan. 2013a. “Educated but poor: Localized ethnic violence during
Indonesia’s democratic transition.” International Area Studies Review 16 (1): 24-49. Tadjoeddin, Mohammad Zulfan. 2013b. “Earnings, productivity and inequality in Indonesia”.
Report for the ILO Jakarta. Tadjoeddin, Mohammad Zulfan. 2013c. “Miracle that never was: Disaggregated level of
inequality in Indonesia”. International Journal of Development Issues 12(1): 22-35. Tadjoeddin, Mohammad Zulfan. 2014. Explaining Collective Violence in Contemporary Indonesia:
From Conflict to Cooperation. Basingstoke, UK: Palgrave Macmillan. Thee, Kian Wie, ed. 2002. Recollections: The Indonesian Economy, 1950s-1990s. Singapore: Institute
of Southeast Asian Studies. UN 2013. Inequality Matters: Report of the World Social Situation 2013. New York: UN Department
of Economic and Social Affair (UNDESA).
The SMERU Research Institute 26
UNCTAD. 2012. “Breaking the Cycle of Exclusion and Crisis”. Policy Brief No. 05, June. UNSFIR. 2003. “Revisiting inequality and growth in Indonesia”, paper presented at the XV
Congress of the Indonesian Economist Association (ISEI), Batu, Malang, 14 July. Urdal, Henrik, 2006: “A Clash of Generations? Youth Bulges and Political Violence”,
International Studies Quarterly, 50(3): 607 – 29. Urdal, Henrik, 2008: “Population, Resources and Political Violence: A Sub-national Study of
India 1956 – 2002”. Journal of Conflict Resolution 52(4): 590 – 617. Urdal, Henrik. 2005. “People vs. Malthus: Population Pressure, Environmental Degradation,
and Armed Conflict Revisited”. Journal of Peace Research 42(4): 417 – 34. Urdal, Henrik. 2012. “Demography and Armed Conflict: Assessing the Role of Population”.
In Graham Brown and Arnim Langer, eds, Elgar Companion to Civil War and Fragile States. Cheltenham, UK: Edward Elgar.
Varshney, Ashutosh, Mohammad Zulfan Tadjoeddin, and Rizal Panggabean. 2008. "Creating
Datasets in Information-Poor Environments: Patterns of Collective Violence in Indonesia (1990-2003)." Journal of East Asian Studies 8 (3):361–94.
Varshney, Ashutosh, Rizal Panggabean and Mohammad Zulfan Tadjoeddin. 2004. "Patterns
of Collective Violence in Indonesia (1990-2003)." UNSFIR Working Paper 04/03. Jakarta: UNSFIR.
Wilkinson, Richard G. and Kate Pickett. 2009. The Spirit Level: Why More Equal Societies Almost
Always Do Better. London: Allen Lane. Wilson, Chris. "Illiberal Democracy and Violent Conflict in Contemporary Indonesia".
Democratization (forthcoming). Winters, J. 2013. “Oligarchy and Democracy in Indonesia”. Indonesia 96 (October): 11-34. World Bank. 1993. The East Asian Miracle: Economic Growth and Public Policy. Oxford: Oxford
University Press. Yusuf, Arief Anshory. 2006. “On the re-assessment of inequality in Indonesia: Household
survey or national account?” Working Paper in Economics and Development Studies No. 200605. Pajajaran University, Bandung.
Yusuf, Arief Anshory. 2014. “Trend of Inequality in Indonesia”, Keynote address delivered in
a workshop on “Mapping the impact of inequality in Indonesia”, SMERU Research Institute, 17 June, Jakarta.
Zakaria, Fareed. 2003. The Future of Freedom: Illiberal Democracy at Home and Abroad. New York:
WW. Norton.
The SMERU Research Institute Telephone : +62 21 3193 6336 Fax : +62 21 3193 0850 E-mail : [email protected] Website : www. smeru.or.id