Industrial Waste Treatment Handbook - ELSEVIER – 2006
582
-
Upload
khangminh22 -
Category
Documents
-
view
1 -
download
0
Transcript of Industrial Waste Treatment Handbook - ELSEVIER – 2006


Industrial Waste Treatment Handbook
Second Edition
Woodard & Curran, Inc.
AMSTERDAM • BOSTON • HEIDELBERG • LONDONNEW YORK • OXFORD • PARIS • SAN DIEGO
SAN FRANCISCO • SINGAPORE • SYDNEY • TOKYOBUTTERWORTH-HEINEMANN IS AK IMPRINT OF ELSEVIER
ELSEVIER

Butterworth-Heinemann is an imprint of Elsevier30 Corporate Drive, Suite 400, Burlington, MA 01803, USALinacre House, Jordan Hill, Oxford OX2 8DP, UK
Copyright © 2006, Elsevier Inc. All rights reserved.
No part of this publication may be reproduced, stored in a retrieval system, ortransmitted in any form or by any means, electronic, mechanical, photocopying,recording, or otherwise, without the prior written permission of the publisher.
Permissions may be sought directly from Elsevier's Science & Technology RightsDepartment in Oxford, UK: phone: (+44) 1865 843830, fax: (+44) 1865 853333,e-mail: [email protected]. You may also complete your request on-linevia the Elsevier homepage (http://elsevier.com), by selecting "Support & Contact"then "Copyright and Permission" and then "Obtaining Permissions."
Recognizing the importance of preserving what has been written, Elsevier prints itsbooks on acid-free paper whenever possible.
Library of Congress Cataloging-in-Publication Data
Application submitted
British Library Cataloguing-in-Publication Data
A catalogue record for this book is available from the British Library.
ISBN 13: 978-0-7506-7963-3ISBN 10: 0-7506-7963-8
For information on all Elsevier Butterworth-Heinemann publications,visit our Web site at www.books.elsevier.com
Printed in the United States of America
05 06 07 08 09 10 9 8 7 6 5 4 3 2 1
Working together to growlibraries in developing countries
www.elsevier.com www.bookaid.org www.sabre.org

Dedication
To Franklin E. Woodard, Ph.D. Without Frank's tireless dedi-cation to the first edition, this second edition would not bepossible. His boundless enthusiasm and expertise in wastetreatment practices are an inspiration to all. He is an engineer,a mentor, an educator, a peer, and a friend. Thank you, Frank.

P r e f a c e
to First Edition
This book has been developed with the intention of providing an updated primary referencefor environmental managers working in industry, environmental engineering consultants,graduate students in environmental engineering, and government agency employees con-cerned with wastes from industries. It presents an explanation of the fundamental mechanismsby which pollutants become dissolved or suspended in water or air, then builds on this knowl-edge to explain how different treatment processes work, how they can be optimized and howone would go about efficiently selecting candidate treatment processes.
Examples from the recent work history of Woodard 8c Curran, as well as other environmen-tal engineering and science consultants, are presented to illustrate both the approach used insolving various environmental quality problems and the step by step design of facilities toimplement the solutions. Where permission was granted, the industry involved in each of theseexamples is identified by name. Otherwise, no name was given to the industry, and the indus-try has been identified only as to type of industry and size. In all cases, the actual numbers andall pertinent information have been reproduced as they occurred, with the intent of providingaccurate illustrations of how environmental quality problems have been solved by one of theleading consultants in the field of industrial wastes management.
This book is intended to fulfill the need for an updated source of information on the charac-teristics of wastes from numerous types of industries, how the different types of wastes aremost efficiently treated, the mechanisms involved in treatment, and the design process itself. Inmany cases, "tricks" that enable lower cost treatment are presented. These "tricks" have beendeveloped through many years of experience and have not been generally available except byword of mouth.
The chapter on Laws, and Regulations is presented as a summary as of the date stated in thechapter itself and/or the addendum that is issued periodically by the publisher. For informationon the most recent addendum, please call the publisher or the Woodard & Curran office inPortland, Maine ((207) 774-2112).

P r e f a c e
to Second Edition
As the change in author's name implies, this book has been turned over, in a manner of speak-ing, to the firm (Woodard 8c Curran) who will perpetuate it in continually updated editions,for many years to come. In growing from 12 employees in 1979 to over 460 in 2005, our knowl-edge of industries and their wastes has increased in breadth and depth. We have brought this tobear on the updating of this, the second edition, and are confident that the reader will benefitgreatly.
As was stated in the preface to the first edition, the readership that the authors had in mindincluded environmental managers working in industry, environmental engineering consult-ants, graduate students in environmental engineering, and federal, state, or regional employeesof government agencies, who are concerned with wastes from industries.
The book maintains its approach of identifying the fundamental chemical and physicalcharacteristics of each target pollutant, then identifying the mechanism by which that targetpollutant is held in solution or suspension by the waste stream (liquid, gaseous, or solid). Themost efficient method by which each target pollutant can be removed from the waste streamcan then be determined.
The chapter on laws and regulations has been expanded significantly, especially in the areaof air pollution control. Again, this chapter is up to date as of the end of 2005. The reader isinvited to call Woodard & Curran's office in Portland, Maine at (207) 774-2112 for informationon new laws or regulations.

Acknowledgments
This second edition was a collaborative effort involving a number of individuals. Being a sec-ond edition, however, we would be remiss if we did not acknowledge the individuals, corpora-tions and business organizations that contributed to the first edition. No distinction has beenmade between first and second edition contributors. We have attempted to cite all contribu-tors. If we have neglected to cite someone, it is unintentional and we extend our sincerest apol-ogies. Thus, heartfelt gratitude and acknowledgements are extended to:
Adam H. Steinman, Esq.; Aeration Technologies, Inc.; R. Gary Gilbert; Albert M. Pregraves;Andy Miller; Claire P. Betze; Connie Bogard; Connie Gipson; Dennis Merrill; Dr. Steven E.Woodard; Geoffrey D. Pellechia; George Abide; George W. Bloom; Henri J. Vincent; Dr.Hugh J. Campbell; J. Alastair Lough; Janet Robinson; Dr. James E. Etzel; James D. Ekedahl;Karen L. Townsend; Katahdin Analytical Services; Keith A. Weisenberger; Kurt R. Marston;Michael Harlos; Michael J. Curato; Patricia A. Proux-Lough; Paul Bishop; Randy E. Tome;Eric P. King; Raymond G. Pepin; Robert W. Severance; Steven N. Whipple; Steven Smock;Susan G. Stevens; Terry Rinehart; Cambridge Water Technology, Inc.; Katherine K. Hender-son; Mohsen Moussavi; Lee M. Cormier; Nimrata K. (Tina) Hunt; Peter J. Martin; Dixon P.Pike, Esq.; Bruce S. Nicholson, Esq.; Charlotte Perry; Thomas R. Eschner; Ethan Brush;Kimberly A. Pontau; James H. Fitch, Jr.; Paul M. Rodriguez; Kyle M. Coolidge; Gillian J.Wood; Sarah Hedrick; Chigako Wilson; Jonathan A. Doucette; Ralph Greco, Jr.; Todd A.Schwingle; Christian Roedlich, Ph.D.; and Sharon E. Ross.
Many of these individuals contributed text or verbal information from which Frank freelydrew in the production of the first edition. While the second edition contains some new infor-mation, it is in large part a repeat of the first edition, and it took effort from dozens of people torecreate what Frank originally produced.

vii This page has been reformatted by Knovel to provide easier navigation.
Contents
Preface to First Edition ........................................................................... ix
Preface to Second Edition ...................................................................... xi
Acknowledgments .................................................................................. xiii
1. Evaluating and Selecting Industrial Waste Treatment Systems .......................................................................................... 1 1.1 Treatment Evaluation Process: Industrial Wastewater ....................... 2
1.1.1 Step 1: Analysis of Manufacturing Processes .................... 3 1.1.2 Step 2: Wastes Minimization and Wastes
Characterization Study ....................................................... 3 1.1.3 Step 3: Determine Treatment Objectives ........................... 4 1.1.4 Step 4: Select Candidate Technologies ............................. 5 1.1.5 Step 5: Bench-scale Investigations .................................... 5 1.1.6 Step 6: Pilot-scale Investigations ....................................... 5 1.1.7 Step 7: Prepare Preliminary Designs ................................. 9 1.1.8 Step 8: Conduct Economic Comparisons .......................... 9
1.1.8.1 Capital Costs .................................................... 10 1.1.8.2 O&M Costs ....................................................... 10 1.1.8.3 Annualized Costs ............................................. 16
1.1.9 Step 9: Final Design ........................................................... 16 1.1.10 Step 10: Solicitation of Competitive Bids for
Construction ....................................................................... 17 1.2 Treatment Evaluation Process: Air Emissions .................................... 18
1.2.1 Analysis of Manufacturing Process .................................... 19 1.2.2 Wastes Minimization and Characterization Study .............. 24
viii Contents
This page has been reformatted by Knovel to provide easier navigation.
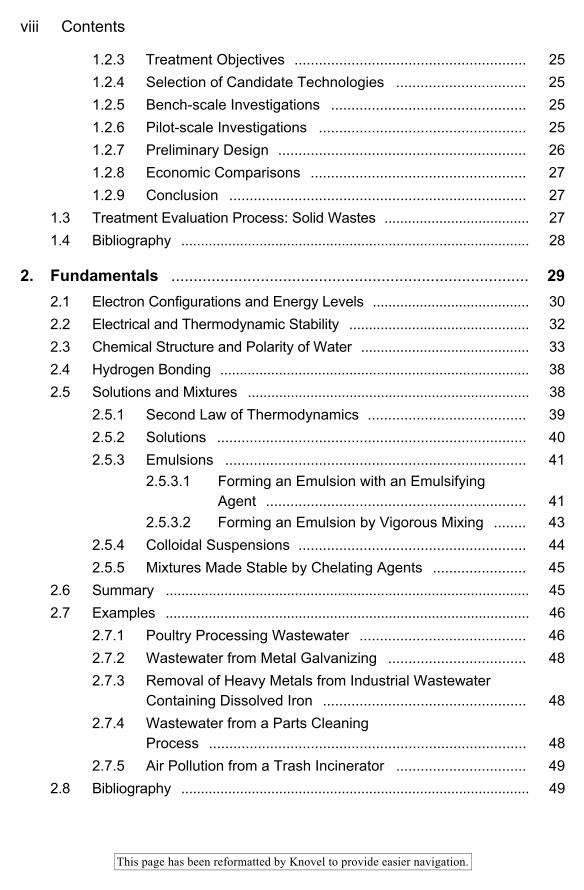
1.2.3 Treatment Objectives ......................................................... 25 1.2.4 Selection of Candidate Technologies ................................ 25 1.2.5 Bench-scale Investigations ................................................ 25 1.2.6 Pilot-scale Investigations ................................................... 25 1.2.7 Preliminary Design ............................................................. 26 1.2.8 Economic Comparisons ..................................................... 27 1.2.9 Conclusion ......................................................................... 27
1.3 Treatment Evaluation Process: Solid Wastes ..................................... 27 1.4 Bibliography ......................................................................................... 28
2. Fundamentals ................................................................................ 29 2.1 Electron Configurations and Energy Levels ........................................ 30 2.2 Electrical and Thermodynamic Stability .............................................. 32 2.3 Chemical Structure and Polarity of Water ........................................... 33 2.4 Hydrogen Bonding ............................................................................... 38 2.5 Solutions and Mixtures ........................................................................ 38
2.5.1 Second Law of Thermodynamics ....................................... 39 2.5.2 Solutions ............................................................................ 40 2.5.3 Emulsions .......................................................................... 41
2.5.3.1 Forming an Emulsion with an Emulsifying Agent ................................................................ 41
2.5.3.2 Forming an Emulsion by Vigorous Mixing ........ 43 2.5.4 Colloidal Suspensions ........................................................ 44 2.5.5 Mixtures Made Stable by Chelating Agents ....................... 45
2.6 Summary ............................................................................................. 45 2.7 Examples ............................................................................................. 46
2.7.1 Poultry Processing Wastewater ......................................... 46 2.7.2 Wastewater from Metal Galvanizing .................................. 48 2.7.3 Removal of Heavy Metals from Industrial Wastewater
Containing Dissolved Iron .................................................. 48 2.7.4 Wastewater from a Parts Cleaning
Process .............................................................................. 48 2.7.5 Air Pollution from a Trash Incinerator ................................ 49
2.8 Bibliography ......................................................................................... 49

Contents ix
This page has been reformatted by Knovel to provide easier navigation.
3. Laws and Regulations ................................................................... 51 3.1 Introduction .......................................................................................... 51 3.2 History of Permitting and Reporting Requirements ............................ 51 3.3 Water Pollution Control Laws .............................................................. 53 3.4 Groundwater Pollution Control Laws .................................................. 55 3.5 Air Pollution Control Laws ................................................................... 58
3.5.1 General .............................................................................. 58 3.5.2 Air Pollution Control Law, as of the Year 2005 .................. 60
3.5.2.1 Title I, Attainment and Maintenance of National Ambient Air Quality Standards (NAAQS) .......................................................... 61
3.5.2.2 Title III, Air Toxics Control ................................ 61 3.5.2.3 Title IV, Acid Rain Control ................................ 62 3.5.2.4 Title V, Permits and Reporting ......................... 62 3.5.2.5 Title VI, Stratospheric Ozone Protection .......... 64 3.5.2.6 Title VII, Enforcement ....................................... 64
3.6 Bibliography ......................................................................................... 64
4. Pollution Prevention ...................................................................... 67 4.1 Pollution Prevention Pays ................................................................... 67
4.1.1 National Pollution Prevention Policy .................................. 67 4.1.1.1 Considerations of Cost ..................................... 68 4.1.1.2 Regulatory Drivers ............................................ 69 4.1.1.3 Pollution Prevention Leads to
Environmental Sustainability ............................ 69 4.1.1.4 Benefits of Pollution Prevention ....................... 69
4.2 General Approach ............................................................................... 70 4.2.1 Secure Unequivocal Support from Management ............... 70 4.2.2 Clearly Establish Objectives and Targets .......................... 71 4.2.3 Establish a Baseline and Ways to Measure
Progress ............................................................................. 72 4.2.4 Accurate Cost Accounting System ..................................... 72 4.2.5 Companywide Philosophy of Waste Minimization ............. 73 4.2.6 Implement Environmental Policy ........................................ 73 4.2.7 Continual Improvement and Education .............................. 74 4.2.8 Pollution Prevention Assessment ...................................... 74
x Contents
This page has been reformatted by Knovel to provide easier navigation.
4.3 Hierarchy of Potential Implementation Strategies ............................... 76 4.3.1 Potential Implementation Strategies .................................. 76
4.3.1.1 Prevention ........................................................ 76 4.3.1.2 Reduce ............................................................. 77 4.3.1.3 Reuse ............................................................... 78 4.3.1.4 Recycle ............................................................ 80 4.3.1.5 Treat ................................................................. 81 4.3.1.6 Dispose ............................................................ 81
4.4 Bibliography ......................................................................................... 82
5. Waste Characterization ................................................................. 83 5.1 Waste Characterization Study ............................................................. 83
5.1.1 Choice of Sampling Location ............................................. 83 5.1.2 Sampling Equipment .......................................................... 85 5.1.3 Sample Preservation .......................................................... 85 5.1.4 Sampling for Oil and Grease .............................................. 86 5.1.5 Sampling for Volatile Substances ...................................... 86
5.2 Waste Audit ......................................................................................... 86 5.2.1 Identify Purchased Hazardous Substances ....................... 87 5.2.2 Identify Hazardous Substances Leaving the Facility ......... 87 5.2.3 Determine the Source of Hazardous Substances .............. 88 5.2.4 Prioritize Reduction of the Waste Streams ........................ 88 5.2.5 Analyze the Feasibility of Toxic Load Reduction ............... 88 5.2.6 Evaluate the Economics of Pollution Prevention ............... 89
5.3 Environmental Audit ............................................................................ 90 5.3.1 Characteristics of Industrial Waste .................................... 97
5.4 Characteristics of Industrial Wastewater ............................................. 97 5.4.1 Priority Pollutants ............................................................... 97
5.4.1.1 BOD ................................................................. 97 5.4.1.2 COD ................................................................. 101 5.4.1.3 Ultimate BOD ................................................... 102 5.4.1.4 pH, Acidity, and Alkalinity ................................. 102 5.4.1.5 D.O. .................................................................. 103 5.4.1.6 Metals ............................................................... 103 5.4.1.7 Color ................................................................. 103

Contents xi
This page has been reformatted by Knovel to provide easier navigation.
5.4.1.8 Turbidity ........................................................... 105 5.4.1.9 Compounds Containing Phosphorus ................ 106 5.4.1.10 Compounds Containing Nitrogen ..................... 106 5.4.1.11 Total Solids ...................................................... 107 5.4.1.12 Suspended Solids ............................................ 107 5.4.1.13 Settleable Solids .............................................. 107 5.4.1.14 Total Volatile Suspended Solids (TVSS) .......... 107 5.4.1.15 Oil and Grease ................................................. 109
5.4.2 "Other Characteristics" (Pollutants) ................................... 110 5.4.2.1 Chlorine Demand and Chlorine
Residual ........................................................... 110 5.4.2.2 Chlorides .......................................................... 110 5.4.2.3 Hardness .......................................................... 110 5.4.2.4 Iron and Manganese ........................................ 111
5.5 Characteristics of Discharges to the Air .............................................. 111 5.5.1 Stack Sampling .................................................................. 111 5.5.2 Sample Collection .............................................................. 112
5.5.2.1 Vacuum Pumps ................................................ 112 5.5.2.2 Vacuum Release of an Evacuated
Collection Container ......................................... 112 5.5.2.3 Tedlar Bags ...................................................... 112 5.5.2.4 Adsorption on a Solid ....................................... 112 5.5.2.5 Condensation (Freeze-out) in a Trap ............... 112 5.5.2.6 Filtration ........................................................... 113 5.5.2.7 Electrostatic Impingement ................................ 113 5.5.2.8 Centrifugal Force .............................................. 113 5.5.2.9 Dry Impingement .............................................. 113 5.5.2.10 Wet Impingement ............................................. 113 5.5.2.11 Impaction .......................................................... 113
5.5.3 Sample Analysis ................................................................ 115 5.5.4 Ambient Air Sampling ........................................................ 115 5.5.5 Air Pollutants ...................................................................... 117
5.6 Characteristics of Solid Waste Streams from Industries .................... 119 5.6.1 Hazardous Wastes ............................................................. 119
5.6.1.1 Ignitable ............................................................ 120 5.6.1.2 Corrosive .......................................................... 120

xii Contents
This page has been reformatted by Knovel to provide easier navigation.
5.6.1.3 Reactive ........................................................... 120 5.6.1.4 Toxic ................................................................. 121
5.7 Bibliography ......................................................................................... 124
6. Industrial Stormwater Management ............................................. 127 6.1 General ................................................................................................ 127 6.2 Federal Stormwater Program .............................................................. 127 6.3 State Stormwater Permitting Programs .............................................. 128
6.3.1 Types of Stormwater Permits ............................................. 129 6.3.1.1 Multi-sector General Permit .............................. 129 6.3.1.2 Individual Permit ............................................... 129
6.3.2 Construction-related Permits ............................................. 130 6.3.3 Stormwater Pollution Prevention Plan (SWPPP) ............... 130
6.4 Prevention of Groundwater Contamination ......................................... 131 6.5 Stormwater Management Concepts ................................................... 131 6.6 Stormwater Treatment System Design Considerations ...................... 132
6.6.1 Quantity and Quality .......................................................... 132 6.6.2 Basic Hydrology ................................................................. 132 6.6.3 Precipitation ....................................................................... 132 6.6.4 Runoff ................................................................................ 133 6.6.5 Selecting a Design Storm .................................................. 133 6.6.6 Collection System Design .................................................. 133 6.6.7 Stormwater Retention/Detention ........................................ 134 6.6.8 System Failure Protection .................................................. 134 6.6.9 Technologies to Achieve Treatment Goals ........................ 134
6.7 Stormwater as a Source of Process Water Makeup ........................... 135 6.7.1 Dissolved Solids (TDS) ...................................................... 136 6.7.2 Biological Oxygen Demand (BOD) .................................... 136 6.7.3 Heat ................................................................................... 137 6.7.4 Case Study: Metals Forging Manufacturing Facility ........... 137
6.7.4.1 Forge Shop Area Stormwater Project .............. 137 6.7.4.2 Preliminary Engineering Studies ...................... 137 6.7.4.3 Initial Design of RMF ........................................ 139 6.7.4.4 Revised Design of RMF ................................... 140 6.7.4.5 Water Balance .................................................. 140

Contents xiii
This page has been reformatted by Knovel to provide easier navigation.
6.7.4.6 Mass Balance ................................................... 143 6.7.4.7 Stormwater Collection and
Retention .......................................................... 143 6.7.4.8 Treatment and Recycle Storage ....................... 143 6.7.4.9 Summary .......................................................... 147
6.8 Bibliography ......................................................................................... 147
7. Methods for Treating Wastewaters from Industry ...................... 149 7.1 General ................................................................................................ 149 7.2 Principle and Nonprinciple Treatment Mechanisms ........................... 150 7.3 Waste Equalization .............................................................................. 153
7.3.1 Flow Equalization ............................................................... 154 7.3.2 Constituent Equalization .................................................... 156
7.4 pH Control ............................................................................................ 157 7.5 Chemical Methods of Wastewater Treatment ..................................... 160
7.5.1 Reaction to Produce an Insoluble Solid ............................. 160 7.5.1.1 The Use of Carbamates ................................... 165 7.5.1.2 Disadvantages of Treatment by
Production of an Insoluble Compound ............. 165 7.5.1.3 Suggested Approach for Treatment of
Industrial Wastewater by Formation of an Insoluble Substance ......................................... 167
7.5.2 Reactions to Produce an Insoluble Gas ............................. 167 7.5.2.1 Breakpoint Chlorination to Remove
Ammonia .......................................................... 168 7.5.3 Reduction of Surface Charge to Produce Coagulation
of a Colloidal Suspension .................................................. 168 7.5.3.1 Lyophobic Sols ................................................. 169 7.5.3.2 Lyophilic Sols ................................................... 170 7.5.3.3 Electrokinetics of Lyophobic Sols ..................... 171 7.5.3.4 Electrokinetics of Lyophilic Sols ....................... 172 7.5.3.5 Coagulation of Colloidal Waste
Systems ........................................................... 173 7.5.3.6 Coagulants ....................................................... 175
7.5.4 Reaction to Produce a Biologically Degradable Substance from a Nonbiodegradable Substance .............. 175

xiv Contents
This page has been reformatted by Knovel to provide easier navigation.
7.5.5 Reaction to Destroy or Otherwise Deactivate a Chelating Agent ................................................................. 176 7.5.5.1 Organic Chelating Agents ................................ 176 7.5.5.2 Inorganic Chelating Agents .............................. 177
7.5.6 Coprecipitation ................................................................... 177 7.5.7 Oxidation or Reduction to Produce a
Nonobjectionable Substance ............................................. 178 7.5.7.1 Alkaline Chlorination of Cyanide ...................... 178 7.5.7.2 Oxidation of (Soluble) Ferric Ions to
(Insoluble) Ferrous Ions by Oxygen ................. 180 7.5.7.3 Oxidative Destruction of Organics by Free
Radicals ........................................................... 180 7.5.7.4 Thermal Oxidation ............................................ 184 7.5.7.5 Catalytic Oxidation ........................................... 184 7.5.7.6 Solvent Extraction ............................................ 184
7.6 Biological Methods of Wastewater Treatment .................................... 185 7.6.1 Organic Matter ................................................................... 185 7.6.2 Microorganisms .................................................................. 186 7.6.3 Oxygen ............................................................................... 186 7.6.4 Nutrients ............................................................................. 186 7.6.5 More Microorganisms ........................................................ 186 7.6.6 CO2 .................................................................................... 186 7.6.7 H2O .................................................................................... 186
7.7 Development of Design Equations for Biological Treatment of Industrial Wastes ................................................................................. 187 7.7.1 Development of Biological Treatment Kinetics in the
Laboratory .......................................................................... 189 7.7.2 The Role of Oxygen in Wastewater Treatment .................. 191 7.7.3 Biological Treatment Technologies .................................... 193
7.8 Treatment of Industrial Wastewaters Using Aerobic Technologies ....................................................................................... 195 7.8.1 Suspended Growth Systems: Activated Sludge ................ 195
7.8.1.1 Selectors .......................................................... 199 7.8.1.2 Variations of the Activated Sludge
Process ............................................................ 201

Contents xv
This page has been reformatted by Knovel to provide easier navigation.
7.8.1.3 Design and Operational Characteristics of Activated Sludge Systems ................................ 216
7.8.1.4 Aeration Systems for Activated Sludge ............ 217 7.8.1.5 Basics of Oxygen Transfer ............................... 224 7.8.1.6 Aerated Lagoons .............................................. 230 7.8.1.7 Nonaerated Facultative Lagoons ..................... 231 7.8.1.8 Oxidation Ponds ............................................... 231 7.8.1.9 Design of Lagoon Systems .............................. 232 7.8.1.10 Attached Growth Systems ................................ 234
7.8.2 Treatment of Industrial Wastewaters Using Anaerobic Technologies ...................................................................... 245 7.8.2.1 Development of Anaerobic Technologies ......... 247 7.8.2.2 Mechanisms of Anaerobic Metabolism ............. 247 7.8.2.3 Variations of Anaerobic Treatment
Systems ........................................................... 251 7.9 Physical Methods of Wastewater Treatment ...................................... 257
7.9.1 Separation Using Physical Barriers ................................... 257 7.9.1.1 Racks and Screens .......................................... 258 7.9.1.2 Plate and Frame Filters .................................... 263 7.9.1.3 Membrane Separation ...................................... 264
7.9.2 Filtration Using Granular Media ......................................... 268 7.9.2.1 Deep Bed Granular Filters ................................ 268
7.9.3 Pressure and Vacuum Filtration ......................................... 274 7.9.3.1 Precoat ............................................................. 274 7.9.3.2 Body Feed ........................................................ 275 7.9.3.3 Swimming Pool Filters ...................................... 277 7.9.3.4 Packaged Water Treatment Systems ............... 277
7.9.4 Slow Sand Filter ................................................................. 279 7.9.5 Plain Sedimentation ........................................................... 279 7.9.6 Discrete Settling ................................................................. 280 7.9.7 Flocculent Settling .............................................................. 281 7.9.8 Sludge Thickening ............................................................. 281
7.9.8.1 Design Procedure ............................................ 283 7.9.8.2 Design Calculations .......................................... 290
7.9.9 Plate, Lamella, and Tube Settlers ...................................... 298 7.9.10 Centrifugation ..................................................................... 300

xvi Contents
This page has been reformatted by Knovel to provide easier navigation.
7.9.11 Flotation ............................................................................. 302 7.9.11.1 Gravity Flotation ............................................... 302 7.9.11.2 Dissolved Air Flotation ...................................... 304
7.9.12 Adsorption .......................................................................... 311 7.9.12.1 The Adsorbent .................................................. 311 7.9.12.2 Adsorption Equilibria ........................................ 312
7.9.13 Ion Exchange ..................................................................... 318 7.9.13.1 Mechanisms of Ion Exchange .......................... 320 7.9.13.2 Kinetics of Ion Exchange .................................. 321 7.9.13.3 Ion Selectivity ................................................... 322 7.9.13.4 Application of Ion Exchange to Industrial
Wastewater Treatment ..................................... 322 7.9.13.5 Design Criteria ................................................. 325 7.9.13.6 Removal of Specific Organic Substances ........ 325
7.9.14 Stripping ............................................................................. 325 7.9.15 Scrubbing ........................................................................... 326 7.9.16 Magnetically Enhanced Solids Separation (CoMag
Process) ............................................................................. 328 7.9.17 Other Wastewater Treatment Methods .............................. 328
7.9.17.1 Land Application ............................................... 328 7.9.17.2 Spray Irrigation ................................................. 330 7.9.17.3 Wastewater Application Rate ........................... 330 7.9.17.4 Wetlands Treatment ......................................... 330
7.10 Bibliography ......................................................................................... 331
8. Treatment of Air Discharges from Industry ................................. 335 8.1 Air Discharges ..................................................................................... 335 8.2 Air Pollution Control Laws ................................................................... 335 8.3 Air Pollution Control ............................................................................. 336
8.3.1 Waste Minimization and Reduction at the Source ............. 336 8.3.2 Containment ....................................................................... 337
8.3.2.1 Hoods and Isolation Chambers ........................ 337 8.3.2.2 Fans and Ductwork .......................................... 337 8.3.2.3 Stabilization ...................................................... 337
8.3.3 Characterization of Discharges to the Air .......................... 338 8.3.3.1 Stack Sampling ................................................ 338

Contents xvii
This page has been reformatted by Knovel to provide easier navigation.
8.3.3.2 Sample Collection ............................................ 338 8.3.3.3 Sample Analysis ............................................... 339 8.3.3.4 Ambient Air Sampling ....................................... 339
8.3.4 Treatment ........................................................................... 339 8.3.4.1 Treatment Systems for Control of
Particulates ...................................................... 339 8.4 Treatment Objectives .......................................................................... 345
8.4.1 Treatment Systems for Control of Gaseous Pollutants ........................................................................... 346 8.4.1.1 Adsorption ........................................................ 347 8.4.1.2 Absorption ........................................................ 350 8.4.1.3 Condensation ................................................... 352 8.4.1.4 Incineration ....................................................... 352 8.4.1.5 Biofiltration ....................................................... 354
8.5 Bibliography ......................................................................................... 357
9. Solid Waste Treatment and Disposal ........................................... 363 9.1 Background .......................................................................................... 364 9.2 Categories of Wastes .......................................................................... 365
9.2.1 Hazardous Wastes ............................................................. 365 9.2.2 Nonhazardous Industrial or Special Wastes ...................... 367 9.2.3 Nonhazardous Solid Waste ............................................... 367
9.3 Characterization of Solid Wastes ........................................................ 369 9.3.1 Opportunities for Waste Reduction .................................... 369 9.3.2 Volume Rate of Waste Generation .................................... 369 9.3.3 Suitability of the Waste for Landfilling ................................ 370
9.3.3.1 Physical Properties ........................................... 370 9.3.3.2 Chemical Properties ......................................... 370
9.3.4 Suitability of the Waste for Incineration .............................. 370 9.3.5 Suitability of the Waste for Composting ............................. 371 9.3.6 Solidification and Stabilization of Industrial Solid
Wastes ............................................................................... 371 9.3.7 S/S Process Systems ........................................................ 372 9.3.8 Binders Used for S/S Technologies ................................... 372
9.3.8.1 Organic Binding Agents .................................... 372 9.3.8.2 Inorganic Binding Agents ................................. 374

xviii Contents
This page has been reformatted by Knovel to provide easier navigation.
9.3.8.3 Mechanisms Involved in S/S Treatment Procedures ....................................................... 376
9.4 The Solid Waste Landfill ...................................................................... 377 9.4.1 The Conventional Landfill .................................................. 377 9.4.2 Landfill Liner System .......................................................... 378
9.5 Landfill Cover and Cap Systems ......................................................... 380 9.5.1 Daily and Intermediate Cover ............................................ 380 9.5.2 Final Cover and/or Cap ...................................................... 381 9.5.3 Gas Venting ....................................................................... 382 9.5.4 Stormwater Management ................................................... 384 9.5.5 Discharges from Landfills ................................................... 384 9.5.6 Alternative Landfills ............................................................ 386
9.6 Solid Waste Incineration ...................................................................... 386 9.6.1 Fluidized Bed Technology .................................................. 387
9.6.1.1 Advantages ...................................................... 389 9.6.1.2 Disadvantages .................................................. 389
9.6.2 Rotary Kiln Technology ...................................................... 389 9.6.2.1 Advantages ...................................................... 390 9.6.2.2 Disadvantages .................................................. 392
9.6.3 Hearth Incinerator Technologies ........................................ 393 9.6.3.1 Advantages ...................................................... 394 9.6.3.2 Disadvantages .................................................. 394
9.6.4 Modular Systems ............................................................... 394 9.6.5 Starved Air Technologies ................................................... 395
9.6.5.1 Advantages ...................................................... 396 9.6.5.2 Disadvantages .................................................. 396 9.6.5.3 Design Considerations ..................................... 396
9.7 The Process of Composting Industrial Wastes ................................... 398 9.7.1 Windrow Composting Technology ..................................... 401 9.7.2 Static Pile Technology ....................................................... 402 9.7.3 Mechanical Composting Technology ................................. 402 9.7.4 Additional Considerations .................................................. 403
9.7.4.1 Nutrients ........................................................... 403 9.7.4.2 Odors ............................................................... 404
9.8 Bibliography ......................................................................................... 405

Contents xix
This page has been reformatted by Knovel to provide easier navigation.
10. Wastes from Industries (Case Studies) ....................................... 409 10.1 General ................................................................................................ 409
10.1.1 Chemical Descaling ........................................................... 410 10.1.2 Degreasing ......................................................................... 410 10.1.3 Rinsing ............................................................................... 412
10.2 Electroplating of Tin ............................................................................. 413 10.2.1 Production Processes ........................................................ 414
10.2.1.1 Preplating ......................................................... 414 10.2.1.2 Plating Baths .................................................... 416 10.2.1.3 Rinse ................................................................ 416
10.2.2 Sources and Characteristics of Wastes ............................. 418 10.2.2.1 Solid Wastes .................................................... 418 10.2.2.2 Airborne Wastes ............................................... 418 10.2.2.3 Waterborne Wastes .......................................... 419
10.2.3 Waste Minimization ............................................................ 420 10.2.4 Wastewater Treatment ....................................................... 421
10.3 The Copper Forming Industry ............................................................. 422 10.3.1 The Copper Forming Process ............................................ 423
10.3.1.1 Hot Rolling ........................................................ 423 10.3.1.2 Cold Rolling ...................................................... 423 10.3.1.3 Extension ......................................................... 423 10.3.1.4 Forging ............................................................. 423 10.3.1.5 Annealing ......................................................... 423 10.3.1.6 Pickling ............................................................. 424 10.3.1.7 Alkaline Cleaning .............................................. 424 10.3.1.8 Solution Heat Treatment .................................. 424 10.3.1.9 Rolling and Drawing Process ........................... 424 10.3.1.10 Solution Heat Treating and Annealing
Quenches ......................................................... 424 10.3.1.11 Alkaline Cleaning Rinse and Baths .................. 424 10.3.1.12 Pickling Baths, Rinses, and Fume
Scrubbers ......................................................... 424 10.3.2 Generation of Wastes ........................................................ 425
10.3.2.1 Solid Waste ...................................................... 425 10.3.2.2 Airborne Wastes ............................................... 425

xx Contents
This page has been reformatted by Knovel to provide easier navigation.
10.3.2.3 Waterborne Wastes, Wastes Minimization, and Wastewater Treatment ........ 425
10.3.2.4 Oil and Grease ................................................. 425 10.3.2.5 Toxic Organics and Metals ............................... 426 10.3.2.6 Suspended Solids ............................................ 426
10.4 Prepared Frozen Foods ...................................................................... 426 10.4.1 Wastes Generation ............................................................ 427
10.4.1.1 Solid Wastes .................................................... 427 10.4.2 Airborne Wastes ................................................................ 427 10.4.3 Waterborne Wastes ........................................................... 427 10.4.4 Prepared Dinners ............................................................... 427 10.4.5 Frozen Bakery Products .................................................... 429 10.4.6 Italian Specialties ............................................................... 429 10.4.7 Chinese Foods and Mexican Foods .................................. 430 10.4.8 Breaded Frozen Products .................................................. 431 10.4.9 Wastes Minimization .......................................................... 432 10.4.10 Treatment and Disposal of Wastes .................................... 433
10.4.10.1 Solid Wastes .................................................... 433 10.4.10.2 Waterborne Wastes .......................................... 433
10.5 Wastepaper De-inking ......................................................................... 434 10.5.1 The De-inking Process – Wastes Generation .................... 435
10.5.1.1 Pulping ............................................................. 436 10.5.1.2 Prewashing ...................................................... 436 10.5.1.3 Screening ......................................................... 436 10.5.1.4 Through-flow Cleaning ..................................... 436 10.5.1.5 Forward Cleaning ............................................. 436 10.5.1.6 Washing ........................................................... 436 10.5.1.7 Flotation ........................................................... 436 10.5.1.8 Dispersion ........................................................ 436 10.5.1.9 Bleaching ......................................................... 436 10.5.1.10 Water Recirculation and Makeup ..................... 437
10.5.2 Wastes Generation and Wastes Minimization ................... 437 10.5.3 Wastewater Characteristics ............................................... 437
10.5.3.1 Toxic Pollutants ................................................ 437

Contents xxi
This page has been reformatted by Knovel to provide easier navigation.
10.5.4 Wastes Minimization .......................................................... 437 10.5.5 Wastewater Treatment ....................................................... 440
10.5.5.1 Aerated Lagoons .............................................. 440 10.5.5.2 Oxidation Basins .............................................. 440 10.5.5.3 Activated Sludge .............................................. 440 10.5.5.4 Anaerobic Contact Filter ................................... 441
10.6 Die Casting: Aluminum, Zinc, and Magnesium ................................... 441 10.6.1 Aluminum Die Casting ....................................................... 441 10.6.2 Zinc Die Casting ................................................................. 443 10.6.3 Magnesium Die Casting ..................................................... 443 10.6.4 Waste Streams and Waste Management .......................... 443
10.6.4.1 Heating Furnace ............................................... 443 10.6.4.2 Scrubbers ......................................................... 443 10.6.4.3 Quench ............................................................. 446 10.6.4.4 Die Casting ....................................................... 446 10.6.4.5 Finishing ........................................................... 446
10.6.5 Additional Waste Management Considerations ................. 446 10.6.5.1 Solids ............................................................... 446 10.6.5.2 Dissolved Organics .......................................... 447 10.6.5.3 Dissolved Inorganics ........................................ 447 10.6.5.4 Oil and Grease ................................................. 447 10.6.5.5 Destruction of Phenolics ................................... 447
10.7 Anodizing and Alodizing ...................................................................... 447 10.7.1 Anodizing ........................................................................... 448 10.7.2 Alodizing ............................................................................ 448 10.7.3 Processing Steps and Wastes Generation ........................ 449
10.7.3.1 Cleaning ........................................................... 449 10.7.3.2 Rinsing ............................................................. 449 10.7.3.3 Deoxidizing and Etching ................................... 449 10.7.3.4 Anodizing or Alodizing ...................................... 449 10.7.3.5 Coloring ............................................................ 449
10.7.4 Wastes Minimization .......................................................... 449 10.7.5 Waste Treatment and Disposal .......................................... 451
10.8 Production and Processing of Coke .................................................... 451 10.8.1 The Coking Process ........................................................... 451

xxii Contents
This page has been reformatted by Knovel to provide easier navigation.
10.8.2 Sources of Wastes ............................................................. 452 10.8.2.1 Solid Wastes .................................................... 452 10.8.2.2 Airborne Wastes ............................................... 452 10.8.2.3 Waterborne Wastes .......................................... 452 10.8.2.4 Wastes Minimization ........................................ 454
10.8.3 Air Pollution Control ........................................................... 454 10.8.4 Wastewater Treatment ....................................................... 454
10.9 The Wine Making Industry ................................................................... 455 10.9.1 The Wine Production Process ........................................... 456 10.9.2 Winemaking Wastes .......................................................... 457 10.9.3 Wastes Minimization .......................................................... 457 10.9.4 Treatment of Winery Wastes ............................................. 457
10.10 The Synthetic Rubber Industry ............................................................ 459 10.10.1 Production of Synthetic Rubber ......................................... 460
10.10.1.1 Emulsion Crumb Production ............................. 460 10.10.1.2 Solution Crumb Production .............................. 462 10.10.1.3 Specialty Products ............................................ 464
10.10.2 Wastes Generation ............................................................ 464 10.10.2.1 Solid Wastes .................................................... 464 10.10.2.2 Airborne Wastes ............................................... 464 10.10.2.3 Waterborne Wastes .......................................... 464
10.10.3 Wastes Minimization .......................................................... 466 10.10.4 Wastewater Treatment ....................................................... 467
10.11 The Soft Drink Bottling Industry ........................................................... 468 10.11.1 Production of Bottled Soft Drinks ....................................... 468 10.11.2 Wastes Generation ............................................................ 471 10.11.3 Solid Wastes ...................................................................... 471
10.11.3.1 Waterborne Wastes .......................................... 471 10.11.3.2 Wastes Minimization ........................................ 471
10.11.4 Wastewater Treatment ....................................................... 472 10.12 Production and Processing of Beef, Pork, and Other Sources
of Red Meat ......................................................................................... 472 10.12.1 The Production and Processing of Beef ............................ 473 10.12.2 The Production and Processing of Pork ............................ 475 10.12.3 Production Processes ........................................................ 475

Contents xxiii
This page has been reformatted by Knovel to provide easier navigation.
10.12.4 Wastes Generation ............................................................ 475 10.12.4.1 Solid Wastes .................................................... 476 10.12.4.2 Airborne Wastes ............................................... 476 10.12.4.3 Waterborne Wastes .......................................... 476
10.12.5 Wastes Minimization .......................................................... 477 10.12.6 Treatment and Disposal ..................................................... 477
10.12.6.1 Solid Wastes .................................................... 477 10.12.6.2 Airborne Wastes ............................................... 477 10.12.6.3 Waterborne Wastes .......................................... 477
10.13 Rendering of By-products from the Processing of Meat, Poultry, and Fish .................................................................................. 479 10.13.1 The Rendering Process ..................................................... 479 10.13.2 Wastes Generation ............................................................ 481
10.13.2.1 Solid Wastes .................................................... 481 10.13.2.2 Airborne Wastes ............................................... 482 10.13.2.3 Waterborne Wastes .......................................... 482
10.13.3 Wastes Minimization .......................................................... 482 10.13.4 Treatment and Disposal ..................................................... 483
10.13.4.1 Solid Wastes .................................................... 483 10.13.4.2 Airborne Wastes ............................................... 483 10.13.4.3 Waterborne Wastes ......................................... 484
10.14 The Manufacture of Lead Acid Batteries ............................................. 486 10.14.1 Lead Battery Manufacture .................................................. 486
10.14.1.1 Leady Oxide Production ................................... 487 10.14.1.2 Grid Manufacturing ........................................... 487 10.14.1.3 Paste Preparation and Pasting ......................... 487 10.14.1.4 Curing ............................................................... 487 10.14.1.5 Stacking and Welding ....................................... 487 10.14.1.6 Assembly .......................................................... 487 10.14.1.7 Electrolyte Preparation and Addition
(Acid Fill) .......................................................... 489 10.14.1.8 Formation ......................................................... 489 10.14.1.9 Battery Washdown ........................................... 489 10.14.1.10 Battery Testing and Repair ............................... 489
10.14.2 Wastes Generation ............................................................ 489 10.14.2.1 Solid Wastes .................................................... 490

xxiv Contents
This page has been reformatted by Knovel to provide easier navigation.
10.14.2.2 Airborne Wastes ............................................... 490 10.14.2.3 Waterborne Wastes .......................................... 490
10.14.3 Wastes Minimization .......................................................... 491 10.14.4 Wastewater Treatment ....................................................... 491
10.15 Bibliography ......................................................................................... 492
Glossary & Acronyms .......................................................................... 497 Acronyms ........................................................................................................ 498
Index ...................................................................................................... 501

1 Evaluating and SelectingIndustrial Waste Treatment Systems
The approach used to develop systems totreat and dispose of industrial wastes is dis-tinctly different from the approach used formunicipal wastes. There is a lot of similarityin the characteristics of wastes from onemunicipality, or one region, to another.Because of this, the best approach to design-ing a treatment system for municipal wastesis to analyze the performance characteristicsof many existing municipal systems anddeduce an optimal set of design parametersfor the system under consideration. Empha-sis is placed on the analysis of other systems,rather than on the waste stream under con-sideration. In the case of industrial waste,however, few industrial plants have a highdegree of similarity between products pro-duced and wastes generated. Therefore,emphasis is placed on analysis of the wastesunder consideration, rather than on what istaking place at other industrial locations.This is not to say that there is little value inanalyzing the performance of treatment sys-tems at other more or less similar industriallocations. Quite the opposite is true. It issimply a matter of emphasis.
Wastes from industries are customarilyproduced as liquid wastes (such as processwastes, which go to an on-site or off-sitewastewater treatment system), solid wastes(including hazardous wastes, which includesome liquids), or air pollutants; often, thethree are managed by different people ordepartments. These wastes are managed andregulated differently, depending on the char-acteristics of the wastes and the process pro-ducing them. They are regulated by separateand distinct bodies of laws and regulations,and, historically, public and governmental
focus has shifted from one category (e.g.,wastewater) to another (e.g., hazardouswastes) as the times change. However, thefact is that the three categories of wastes areclosely interrelated, both as they impact theenvironment and as they are generated andmanaged by individual industrial facilities.For example, solid wastes disposed of in theground can influence the quality of ground-water and surface waters by way of leachateentering the groundwater and traveling withit through the ground, then entering a sur-face water body with groundwater recharge.Volatile organics in that recharge water cancontaminate the air. Air pollutants can fallout to become surface water or groundwaterpollutants, and water pollutants can infiltratethe ground or volatilize into the air.
Additionally, waste treatment processescan transfer substances from one of the threewaste categories to one or both of the others.Air pollutants can be removed from an airdischarge by means of a water solutionscrubber. The waste scrubber solution mustthen be managed in such a way that it can bediscarded in compliance with applicable reg-ulations. Airborne particulates can beremoved from an air discharge using a baghouse, thus creating solid waste to be man-aged. On still a third level, waste treatment ordisposal systems themselves can directlyimpact the quality of the air, water, orground. Activated sludge aeration tanks arevery effective in causing volatilization of sub-stances from wastewater. Failed landfills canbe potent polluters of both groundwater andsurface water. The goal of the manager orengineer is thus to design treatment proc-esses that minimize the volume and toxicity

of both process waste and the final treatmentresidue, since final disposal can incur signifi-cant cost and liability.
Industrial waste treatment thus encom-passes a wide array of environmental, techni-cal, and regulatory considerations. Regard-less of the industry, the evaluation and selec-tion of waste treatment technologies typi-cally follows a logical series of steps that helpto meet the goal of minimizing waste toxicityand volume. These steps start with a bird's-eye description and evaluation of the waste-producing processes and then move througha program of increasingly detailed evalua-tions that seek the optimal balance of effi-ciency and cost, where cost includes bothtreatment and disposal. The following sec-tions present an illustration of this process,as applied to two very different wastestreams: industrial wastewater and air emis-sions. The sections show, through specificexamples, the basic engineering approach toevaluating and selecting waste treatmenttechnologies. This approach is implicit in themore detailed descriptions provided in sub-sequent chapters.
Treatment Evaluation Process:Industrial Wastewater
Figure 1-1 illustrates the approach for devel-oping a well-operating, cost-effective treat-ment system for industrial wastewater. Thefirst step is to gain familiarity with the manu-facturing processes themselves. This usuallystarts with a tour of the facility and thenprogresses through a review of the literatureand interviews with knowledgeable people.The objective is to gain an understanding ofhow wastewater is produced. There are tworeasons for understanding the origin of thewater: the first is to enable an informed andtherefore effective waste reduction, or mini-mization (pollution prevention), program;the second is to enable proper choice of can-didate treatment technologies.
Subsequent steps shown in Figure 1-1examine, in increasing detail, the technical
Figure 1-1 Approach for developing an industrial waste-water treatment system.
PollutionPreventionProgram
Second-leveli/Vastes Minimization
Program
TreatmentObjectives
Determination
Selection ofCandidate
Technologies
Bench ScaleInvestigations
Pilot ScaleInvestigations
PreliminaryDesigns
EconomicComparisons
Final Design
WastewaterCharacterization
Study
Analysis ofManufacturing
Processes

and economic merits of available technolo-gies, thereby narrowing the field of candi-dates as the level of scrutiny increases.Understanding and correctly applying eachof these steps are critical to successful identi-fication of the best treatment approach.These steps are described in detail in the fol-lowing text.
Step 1: Analysis of ManufacturingProcessesOne of the first steps in the analysis of manu-facturing processes is to develop a block dia-gram that shows how each manufacturingprocess contributes wastewater to the treat-ment facility. A block diagram for a typicalindustrial process, which in this case involvesproducing finished woven fabric from anintermediate product of the textile industry,is provided in Figure 1-2. Each block of thefigure represents a step in the manufacturingprocess. The supply of water to each point ofuse is represented on the left side of the blockdiagram. Wastewater that flows away fromeach point of wastewater generation is shownon the right side.
In this example, the "raw material"(woven greige goods) for the process is firstsubjected to a process called "desizing,"where the substances used to providestrength and water resistance to the raw fab-ric, referred to as "size," are removed. Theprocess uses sulfuric acid; therefore, the liq-uid waste from this process would beexpected to have a low pH, as well as contain-ing the substances that were used as sizing.For instance, if starch were the substanceused to size the fabric, the liquid waste fromthe desizing process would be expected toexhibit a high biochemical oxygen demand(BOD), since starch is readily biodegradable.
As a greater understanding of the processis gained, either from the industry's records(if possible) or from measurements taken aspart of a wastewater characterization study,process parameters would be indicated onthe block diagram. These process parametersmay include any number of the following:
flow rates, total quantities for a typical proc-essing day, upper and lower limits, and char-acteristics such as BOD, chemical oxygendemand (COD), total suspended solids(TSS), total dissolved solids (TDS), and anyspecific chemicals being used. Each individ-ual step in the overall industrial processwould be developed and shown on the blockdiagram, as illustrated in Figure 1-2.
Step 2: Wastes Minimization andWastes Characterization StudyAfter becoming sufficiently familiar with themanufacturing processes as they relate towastewater generation, the design teamshould institute a wastes minimization pro-gram (actually part of a pollution preventionprogram), as described in Chapter 4. Then,after the wastes reduction program hasbecome fully implemented, a wastewatercharacterization study should be carried out,as described in Chapter 5.
The ultimate purpose of the wastewatercharacterization study is to provide thedesign team with accurate and completeinformation on which to base the design ofthe treatment system. Both quantitative andqualitative data are needed to properly sizethe facility and to select the most appropriatetreatment technologies.
Often, enough new information aboutmaterial usage, water use efficiency, andwastes generation is learned during thewastewater characterization study to war-rant a second level of wastes minimizationeffort. This second part of the wastes mini-mization program should be fully imple-mented, and then its effectiveness should beverified by more sampling and analyses,which amount to an extension of the waste-water characterization study.
A cautionary note is appropriate here con-cerning maintenance of the wastes minimi-zation program. If a treatment facility isdesigned and, more specifically, sized based onimplementation of a wastes minimizationprogram, and that program is not maintained,causing wastewater increases in volume,

strength, or both, the treatment facility willbe underdesigned and overloaded at thestart. It is extremely important that realisticgoals be set and maintained for the wastesminimization program, and that the designteam, as well as the industry's managementteam, is fully aware of the consequences ofoverloading the treatment system.
Step 3: Determine TreatmentObjectivesAfter the volume, strength, and substancecharacteristics of the wastewater have beenestablished, the treatment objectives must bedetermined. These objectives will depend onwhere the wastewater is to be sent after treat-ment. If the treated wastewater is discharged
Figure 1-2 Typical industrial process block diagram for a woven fabric finishing process (from the EPA Development Doc-ument for the Textile Mills Industry).
WovenGreigeGoods
Enzymes orH2SO4
NaOH andAuxiliary Chem.
Desize
Scour
ConcentratedNaOH
Water H2O2 or NaOCI
DyestuffsAuxiliary Chem.
Print PastesAuxiliary Chem.
Mercerize
Bleach
Dye
Finishing AgentsFinal Finish
Liquid Waste
Liquid Waste
Caustic WasteLiquid Waste
Liquid Waste
Liquid Waste
Liquid Waste
Liquid Waste
FinishedWovenFabric
(From Cleanup)

to another treatment facility, such as aregional facility or a Publicly Owned Treat-ment Works (POTW), it must comply withpretreatment requirements. As a minimum,compliance with the Federal PretreatmentGuidelines issued by the Environmental Pro-tection Agency (EPA) and published in theFederal Register is required. Some municipalor regional treatment facilities have pretreat-ment standards that are more stringent thanthose required by the EPA.
If the treated effluent is discharged to anopen body of water, permits issued by theNational Pollutant Discharge EliminationSystem (NPDES) and the appropriate stateagency must be obtained. In all cases, Cate-gorical Standards issued by the EPA apply,and it is necessary to work closely with oneor more government agencies while develop-ing the treatment objectives.
Step 4: Select Candidate TechnologiesOnce the wastewater characteristics and thetreatment objectives are known, candidatetechnologies for treatment can be selected.Rationale for selection is discussed in detailin Chapter 7. The selection should be basedon one or more of the following:
• Successful application to a similar waste-water
• Knowledge of chemistry, biochemistry,and microbiology
• Knowledge of available technologies, aswell as knowledge of their respectivecapabilities and limitations
Then, bench-scale investigations shouldbe conducted to determine technical as wellas financial feasibility.
Step 5: Bench-Scale InvestigationsBench-scale investigations have the purposeof quickly and efficiently determining thetechnical feasibility and a rough approxima-tion of the financial feasibility of a giventechnology. Bench-scale studies range from
rough experiments, in which substances aremixed in a beaker and results observedalmost immediately, to rather sophisticatedcontinuous flow studies, in which a refriger-ated reservoir contains representative indus-trial wastewater, which is pumped through aseries of miniature treatment devices that aremodels of the full-size equipment. Typicalbench-scale equipment includes the six-placestirrer shown in Figure 1-3(a); small columnsfor ion exchange resins, activated carbon, orfiltration media, shown in Figure l-3(b); and"block aerators," shown in Figure l-3(c), forperforming microbiological treatability stud-ies, as well as any number of custom-designed devices for testing the technical fea-sibility of given treatment technologies.
Because of scale-up problems, it is seldomadvisable to proceed directly from the resultsof bench-scale investigations to the design ofa full-scale wastewater treatment system.Only in cases in which there is extensiveexperience with both the type of wastewaterbeing treated and the technology and typesof equipment to be used can this approach bejustified. Otherwise, pilot-scale investiga-tions should be conducted for each technol-ogy that appears to be a legitimate candidatefor reliable, cost-effective treatment.
The objective of pilot-scale investigationsis to develop the data necessary to determinethe minimum size and least-cost system ofequipment that will enable a design of atreatment system that will reliably meet itsintended purpose. In the absence of pilot-scale investigations, the design team isobliged to be conservative in estimatingdesign criteria for the treatment system. Thelikely result is that a pilot test will pay foritself by allowing less conservative design cri-teria to be used.
Step 6: Pilot-Scale InvestigationsA pilot-scale investigation is a study of theperformance of a given treatment technologyusing the actual wastewater to be treated,usually on site and using a representative

Figure 1-3 (a) Photograph of a six-place stirrer.
model of the equipment that would be usedin the full-scale treatment system. The termrepresentative model refers to the capability ofthe pilot treatment system to closely dupli-cate the performance of the full-scale system.In some cases, accurate scale models of thefull-scale system are used. In other cases, thepilot equipment bears no physical resem-blance to the full-scale system. For example,fifty-five gallon drums have been successfullyused for pilot-scale investigations.
It is not unusual for equipment manufac-turers to have pilot-scale treatment systemsthat can be transported to the industrial siteon a trailer. A rental fee is usually charged, andthere is sometimes an option to include anoperator in the rental fee. It is important,however, to keep all options open. Operationof a pilot-scale treatment system that is rentedfrom one equipment manufacturer mightproduce results that indicate that another typeof equipment, using or not using the sametechnology, would be the wiser choice. Figure1-4 presents a photograph of a pilot-scalewastewater treatment system.
One of the difficulties in operating a pilot-scale treatment system is the susceptibility ofsystem upsets, which may be caused by slugdoses, wide swings in temperature, pluggingof the relatively small diameter pipes, or alack of familiarity on the part of the operator.Therefore, it is critical to operate a pilot-scaletreatment system for a sufficiently longperiod of time to:
1. Evaluate its performance on all combi-nations of wastes that are reasonablyexpected to occur during the foreseeablelife of the prototype system.
2. Provide sufficient opportunity to evalu-ate all reasonable combinations of oper-ation parameters. When operationparameters are changed—for instance,the volumetric loading of an air scrub-ber, the chemical feed rate of a sludgepress, or the recycle ratio for a reverseosmosis system—the system must oper-ate for sufficient time to achieve a steadystate before the data to be used for evalu-ation are taken. This can be particularly

Figure 1-3 (b) Illustration of a column set up to evaluate treatment methods that use granular media, (c) Diagrammaticsketch of a column set up to evaluate treatment methods that use granular media.
Rubber TubingScrew Clamp
Glass Tip
Ion ExchangeResin
Glass WoolPlug
(b)
Separatory Funnel
Rubber Stopper (#7)
3.1 cm. (LD.)Glass Tubing
Ion ExchangeResin45-90 cm.
Sintered GlassFilter
Rubber TubingScrew Clamp
GlassTip
FEED BOTTLE INFLUENTFEED LINEAIR SUPPLY
AIRNEEDLEVALVE
SIGMAPUMP
AIRDIFFUSERSTONE
SLIDINGBAFFLE
DRAIN LINE
ADJUSTABLEOVERFLOWWEIR
EFFLUENTBOTTLE
(c)

Figure 1-4 Photograph of a pilot-scale wastewater treatment system.

problematic in anaerobic biologicaltreatment systems, which can takemonths to equilibrate. Of course, it willbe necessary to obtain data during theperiod just after operation parametersare changed, to determine when a steadystate has been reached.
During the pilot plant operation period,observations should be made to determinewhether or not performance predicted fromthe results of the bench-scale investigations isbeing confirmed. If performance is signifi-cantly different from that which had beenpredicted, it may be prudent to stop the pilot-scale investigation work and try to determinethe cause for the performance difference.
Step 7: Prepare Preliminary DesignsThe results of the pilot-scale investigationsshow which technologies are capable ofmeeting the treatment objectives, but do notenable an accurate estimation of capital andoperating costs. A meaningful cost-effective-ness analysis can take place only after thecompletion of preliminary designs of thetechnologies that produced satisfactory efflu-ent quality in the pilot-scale investigations. Apreliminary design, then, is the design of anentire waste treatment facility, carried out insufficient detail to enable accurate estimationof the costs for construction, operation, andmaintenance. It must be complete to theextent that the sizes and descriptions of all ofthe pumps, pipes, valves, tanks, concretework, buildings, site work, control systems,and manpower requirements are established.The difference between a preliminary designand a final design is principally in the com-pleteness of detail in the drawings and in thespecifications. It is almost as though the teamthat produces the preliminary design coulduse it directly to construct the plant. Theextra detail that goes into the final design isprincipally to communicate all of the inten-tions of the design team to people notinvolved in the design process.
Step 8: Conduct EconomicComparisonsThe choice of treatment technology andcomplete treatment system between two ormore systems proven to be reliably capable ofmeeting the treatment objectives should bebased on a thorough analysis of all costs overthe expected life of the system. Because thisevaluation often drives the final choice, accu-rate cost estimates, based on an appropriatelevel of detail, are essential. How much detailis necessary? This is illustrated in the follow-ing example, which shows an actual evalua-tion of treatment alternatives for a manufac-turing facility considering a treatment systemupgrade. The example illustrates both thetypes of charges to be considered, as well asthe level of detail necessary to support tech-nology selection at this stage of the evalua-tion. Actual costs (which were accurate at thetime of the first edition of this book) areshown for illustrative purposes only, andshould not be used as a basis for current eval-uations.
Example 1-1: Estimating Costs forTreatment Technology SelectionThis example illustrates an economic com-parison of five alternatives for treating waste-water from an industrial plant producingmicrocrystalline cellulose from wood pulp.This plant discharged about 41,000 gallonsper day (GPD) of wastewater with a BODconcentration of approximately 20,000 mg/Lto the local POTW. The municipality thatowned the POTW charged the industry a feefor treatment, and the charge was propor-tional to the strength, in terms of the bio-chemical oxygen demand (BOD); total sus-pended solids (TSS); fats, oils and greases(FOG); and total daily flow (Q).
In order to reduce the treatment chargesfrom the POTW, the plant had the option ofconstructing and operating its own wastewa-ter treatment system. Since there was not analternative for discharging the treated waste-water to the municipal sewer system, therewould continue to be a charge from the
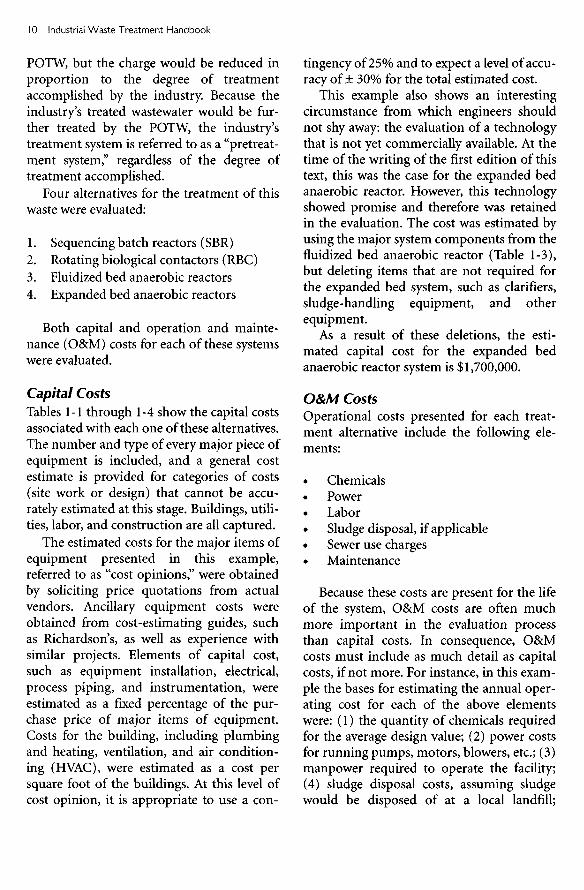
POTW, but the charge would be reduced inproportion to the degree of treatmentaccomplished by the industry. Because theindustry's treated wastewater would be fur-ther treated by the POTW, the industry'streatment system is referred to as a "pretreat-ment system," regardless of the degree oftreatment accomplished.
Four alternatives for the treatment of thiswaste were evaluated:
1. Sequencing batch reactors (SBR)2. Rotating biological contactors (RBC)3. Fluidized bed anaerobic reactors4. Expanded bed anaerobic reactors
Both capital and operation and mainte-nance (O&M) costs for each of these systemswere evaluated.
Capital CostsTables 1-1 through 1-4 show the capital costsassociated with each one of these alternatives.The number and type of every major piece ofequipment is included, and a general costestimate is provided for categories of costs(site work or design) that cannot be accu-rately estimated at this stage. Buildings, utili-ties, labor, and construction are all captured.
The estimated costs for the major items ofequipment presented in this example,referred to as "cost opinions," were obtainedby soliciting price quotations from actualvendors. Ancillary equipment costs wereobtained from cost-estimating guides, suchas Richardson's, as well as experience withsimilar projects. Elements of capital cost,such as equipment installation, electrical,process piping, and instrumentation, wereestimated as a fixed percentage of the pur-chase price of major items of equipment.Costs for the building, including plumbingand heating, ventilation, and air condition-ing (HVAC), were estimated as a cost persquare foot of the buildings. At this level ofcost opinion, it is appropriate to use a con-
tingency of 25% and to expect a level of accu-racy of ± 30% for the total estimated cost.
This example also shows an interestingcircumstance from which engineers shouldnot shy away: the evaluation of a technologythat is not yet commercially available. At thetime of the writing of the first edition of thistext, this was the case for the expanded bedanaerobic reactor. However, this technologyshowed promise and therefore was retainedin the evaluation. The cost was estimated byusing the major system components from thefluidized bed anaerobic reactor (Table 1-3),but deleting items that are not required forthe expanded bed system, such as clarifiers,sludge-handling equipment, and otherequipment.
As a result of these deletions, the esti-mated capital cost for the expanded bedanaerobic reactor system is $1,700,000.
O&M CostsOperational costs presented for each treat-ment alternative include the following ele-ments:
• Chemicals• Power• Labor• Sludge disposal, if applicable• Sewer use charges• Maintenance
Because these costs are present for the lifeof the system, O&M costs are often muchmore important in the evaluation processthan capital costs. In consequence, O&Mcosts must include as much detail as capitalcosts, if not more. For instance, in this exam-ple the bases for estimating the annual oper-ating cost for each of the above elementswere: (1) the quantity of chemicals requiredfor the average design value; (2) power costsfor running pumps, motors, blowers, etc.; (3)manpower required to operate the facility;(4) sludge disposal costs, assuming sludgewould be disposed of at a local landfill;

Table 1-1 Capital Cost Opinion, Sequencing Batch Reactors—Alternative #1
Equipment No. Units Size Installed Cost ($)
SBR Feed Pumps 3 220 GPM 20,000
Blowers 5 1,500ACFM 120,000
Aeration Equipment 2 6,000ACFM 77,000
Floating Mixer 2 15 HP 66,000
Floating Decanter 2 1,200 GPM 44,000
Decant Pump 2 1,200 GPM 26,000
Waste Sludge Pumps 2 450 GPM 13,000
Sludge Press 1 100 ft3 186,000
Filter Feed Pumps 2 60 GPM 8,000
Thickener 1 100 GPM 100,000
Thickener Feed Pumps 2 50 GPM 8,000
Air Compressor 1 100 CFM 44,000
Ammonia Feed System 1 360 PPD 22,000
Phosphoric Acid Feed System 1 15 GPD 6,000
Potassium Chloride Feed System 1 50 PPD 11,000
Sludge Tank Mixer 1 15HP 13,000
Filter Feed Tank Mixer 1 5 HP 7,000
Subtotal: 771,000
Site Work @ 5% 39,000
Electrical & Instrumentation @ 10% 77,000
Process Pipes & Valves @ 10% 77,000
30' x 60' Building @ $65/ft2 117,000
2-SBR Tanks (390,000 gal) 300,000*
Sludge Holding Tank (160,000 gal) 95,000
Equalization Tank (50,000 gal) 58,000
Subtotal: 1,534,000
OH & P @ 22% 337,000
Subtotal: 1,871,000
Engineering @ 12% 225,000
Subtotal: 2,096,000
Contingency @ 25% 524,000
Estimated Construction Cost: 2,620,000
Say: 2,600,000
* Total for both tanks.

Table 1-2 Capital Cost Opinion, Rotating Biological Contactors—Alternative #2
Equipment No. Units Size Installed Cost ($)
RBC Feed Pumps 3 220 GPM 20,000
Clarifiers 2 40° Diameter 195,000
Sludge Pumps 2 100 GPM 11,000
Sludge Press 1 100 ft3 186,000
Filter Feed Pumps 2 60 GPM 8,000
Thickener 1 100 GPM 100,000
Thickener Feed Pumps 2 50 GPM 8,000
Air Compressor 1 100 CFM 44,000
Ammonia Feed System 1 360 PPD 22,000
Phosphoric Acid Feed System 1 15 GPD 6,000
Potassium Chloride Feed System 1 60 PPD 11,000
Sludge Tank Mixer 1 15HP 13,000
Filter Feed Tank Mixer 1 5 HP 7,000
Blowers 5 500 CFM 63,000
Aeration System 1 2,000 CFM 44,000
Subtotal: 738,000
Site Work @ 5% 37,000
Electrical & Instrumentation @ 10% 74,000
Process Pipes & Valves @ 10% 74,000
30' x 60' Building @ $65/ft2 117,000
Sludge Holding Tank (160,000 gal) 95,000
RBC Tanks (Concrete) 350,000
Subtotal: 1,485,000
OH & P @ 22% 326,000
RBC Shafts & Enclosures 1,000,000
Subtotal: 2,811,000
Engineering @ 12% 337,000
Subtotal: 3,148,000
Contingency @ 25% 787,000
Estimated Construction Cost: 3,935,000
Say: 3,900,000
(5) the cost for sewer use charges based onpresent rates; and (6) maintenance costs as afixed percentage of total capital costs.
The estimated sewer use charges for eachtreatment alternative are given in Table 1-5and show the spread of estimated sewer costsalone among all alternatives. Tables 1-6through 1-9 show the yearly O&M costs for
the SBR, the RBC, the fluidized bed anaero-bic reactors, and the expanded bed anaerobicreactors; they show the types of fees consid-ered. For the fluidized bed system, additionalinformation on gas recovery is also includedto show the potential offsetting of O&Mcosts. O&M costs for the expanded bed systemwere estimated from the fluidized bed costs

Table 1-3 Capital Cost Opinion, Fluidized Bed Anaerobic Reactors—Alternative #3
Equipment No. Units Size Installed Cost ($)
Reactor Feed Pumps 3 220 GPM 20,000
Secondary Clarifiers 2 40'Diameter 195,000
Sludge Pumps 2 20 GPM 3,000
Filter Press 1 40 ft3 108,000
Filter Feed Pumps 2 60 GPM 8,000
Sludge Transfer Pumps 2 80 GPM 8,000
Sludge Tank Mixer 1 10 HP 1,000
Filter Feed Tank Mixer 1 5 HP 7,000
Compressor 1 100 CFM 44,000
Gas Recovery Blower 1 40 CFM 19,000
Subtotal: 413,000
Site Work @ 5% 21,000
Electrical & Instrumentation @ 10% 41,000
Process Pipes & Valves @ 10% 41,000
30' x 30' Building @ $65/ft2 59,000
Sludge Holding Tank (30,000 gal) 35,000
Subtotal: 612,000
OH&P@22% 135,000
Subtotal: 747,000
Upflow Fluidized Bed Reactor System 1,000,000
Subtotal: 1,747,000
Engineering @ 12% 210,000
Subtotal: 1,957,000
Contingency @ 25% 489,000
Estimated Construction Cost: 2,446,000
Say: 2,450,000
Table 1-4 Capital Cost Opinion, Expanded Bed Anaerobic Reactors—Alternative #4
Equipment No. Units Size Installed Cost ($)
Reactor Feed Pumps 3 220 GPM 20,000
Gas Recovery Blower 1 40 CFM 19,000
Subtotal: 39,000
Site Work @ 5% 2,000
Electrical & Instrumentation @ 10% 4,000
Process Pipes & Valves @ 10% 4,000
30' x 20' Building @ $65/ft2 39,000
Subtotal: 88,000
OH&P@22% 19,000
Subtotal: 107,000

Table 1-4 Capital Cost Opinion, Expanded Bed Anaerobic Reactors—Alternative #4 (continued)
Equipment No. Units
Upflow Fluidized Bed Reactor System
Engineering @ 12%
Contingency @ 35%
Estimated Construction Cost:
Size
Subtotal:
Subtotal:
Say:
Installed Cost ($)
1,000,000
1,107,000
133,000
1,240,000
434,000
1,674,000
1,700,000
Table 1-5 Estimated Sewer Use Charges
Scenario
No Treatment
SBR Alternative
RBC Alternative
Fluidized Bed Alternative
Expanded Bed Alternative
Yearly Cost ($f
928,000
325,000
325,000
384,000
335,000
* Based on flow, TSS, and BOD5 charges currently incurred.
Table 1-6 Yearly O&M Cost Summary, Sequencing Batch Reactors—Alternative #1
Item
Chemicals
Ammonia (Anhydrous)
Phosphoric Acid (85%)
Potassium Chloride (99%)
Polymer
Power
Labor
Sludge Disposal^
Sewer Use Charges*
Maintenance**
Unit
Ton
Ib
Ib
Ib
kw-hr
man-hr
Ton
—
—
Quantity
66
83,000
41,000
9,000
3,000,000
4,380
3,600
—
—
Unit Cost ($)
135
0.22
0.67
1.00
0.054
38
70
—
—
Total:
Say:
Yearly Cost ($f
8,900
18,300
27,500
9,000
162,000
166,400
252,000
325,000
52,000
1,021,000
1,000,000
* Total Rounded to nearest $50,000.tSludge assumed to be nonhazardous; includes transportation.tPer Table 1-5.**Assumed to be 2% of total capital cost.
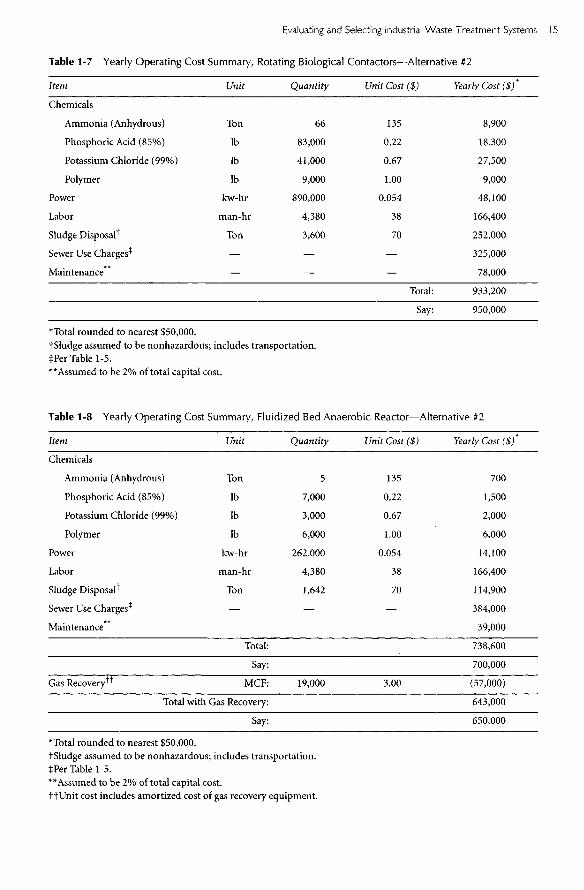
Table 1-7 Yearly Operating Cost Summary, Rotating Biological Contactors—Alternative #2
Item Unit
Chemicals
Ammonia (Anhydrous) Ton
Phosphoric Acid (85%) Ib
Potassium Chloride (99%) Ib
Polymer Ib
Power kw-hr
Labor man-hr
Sludge Disposal1 Ton
Sewer Use Charges* —
Maintenance —
Quantity
66
83,000
41,000
9,000
890,000
4,380
3,600
—
—
Unit Cost ($)
135
0.22
0.67
1.00
0.054
38
70
—
—
Total:
Say:
Yearly Cost ($f
8,900
18,300
27,500
9,000
48,100
166,400
252,000
325,000
78,000
933,200
950,000
''Total rounded to nearest $50,000.f Sludge assumed to be nonhazardous; includes transportation.$Per Table 1-5.** Assumed to be 2% of total capital cost.
Table 1-8 Yearly Operating Cost Summary, Fluidized Bed Anaerobic Reactor—Alternative #2
Item Unit
Chemicals
Ammonia (Anhydrous) Ton
Phosphoric Acid (85%) Ib
Potassium Chloride (99%) Ib
Polymer Ib
Power kw-hr
Labor man-hr
Sludge Disposal * Ton
Sewer Use Charges* —
Maintenance
Total:
Say:
Gas Recovery1"1" MCF:
Total with Gas Recovery:
Say:
Quantity
5
7,000
3,000
6,000
262,000
4,380
1,642
—
19,000
Unit Cost ($)
135
0.22
0.67
1.00
0.054
38
70
—
3.00
Yearly Cost ($)*
700
1,500
2,000
6,000
14,100
166,400
114,900
384,000
39,000
738,600
700,000
(57,000)
643,000
650,000
* Total rounded to nearest $50,000.tSludge assumed to be nonhazardous; includes transportation.$Per Table 1-5.**Assumed to be 2% of total capital cost.tfUnit cost includes amortized cost of gas recovery equipment.
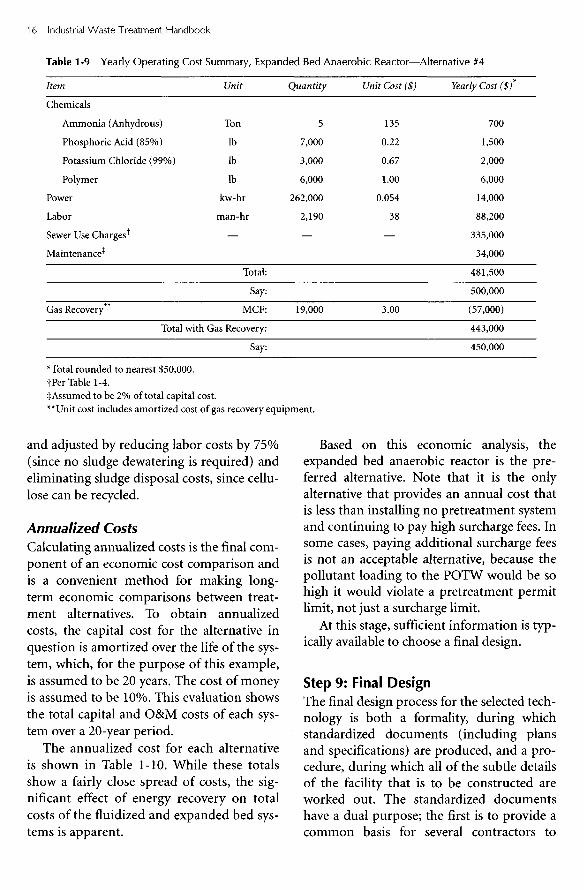
Table 1-9 Yearly Operating Cost Summary, Expanded Bed Anaerobic Reactor—Alternative #4
Item
Chemicals
Ammonia (Anhydrous)
Phosphoric Acid (85%)
Potassium Chloride (99%)
Polymer
Power
Labor
Sewer Use Charges^
Maintenance^
Gas Recovery
Unit
Ton
Ib
Ib
Ib
kw-hr
man-hr
—
Total:
Say:
MCF:
Total with Gas Recovery:
Say:
Quantity
5
7,000
3,000
6,000
262,000
2,190
—
19,000
Unit Cost ($)
135
0.22
0.67
1.00
0.054
38
—
3.00
Yearly Cost ($f
700
1,500
2,000
6,000
14,000
88,200
335,000
34,000
481,500
500,000
(57,000)
443,000
450,000
*Total rounded to nearest $50,000.tPer Table 1-4.^Assumed to be 2% of total capital cost.**Unit cost includes amortized cost of gas recovery equipment.
and adjusted by reducing labor costs by 75%(since no sludge dewatering is required) andeliminating sludge disposal costs, since cellu-lose can be recycled.
Annualized CostsCalculating annualized costs is the final com-ponent of an economic cost comparison andis a convenient method for making long-term economic comparisons between treat-ment alternatives. To obtain annualizedcosts, the capital cost for the alternative inquestion is amortized over the life of the sys-tem, which, for the purpose of this example,is assumed to be 20 years. The cost of moneyis assumed to be 10%. This evaluation showsthe total capital and O&M costs of each sys-tem over a 20-year period.
The annualized cost for each alternativeis shown in Table 1-10. While these totalsshow a fairly close spread of costs, the sig-nificant effect of energy recovery on totalcosts of the fluidized and expanded bed sys-tems is apparent.
Based on this economic analysis, theexpanded bed anaerobic reactor is the pre-ferred alternative. Note that it is the onlyalternative that provides an annual cost thatis less than installing no pretreatment systemand continuing to pay high surcharge fees. Insome cases, paying additional surcharge feesis not an acceptable alternative, because thepollutant loading to the POTW would be sohigh it would violate a pretreatment permitlimit, not just a surcharge limit.
At this stage, sufficient information is typ-ically available to choose a final design.
Step 9: Final DesignThe final design process for the selected tech-nology is both a formality, during whichstandardized documents (including plansand specifications) are produced, and a pro-cedure, during which all of the subtle detailsof the facility that is to be constructed areworked out. The standardized documentshave a dual purpose; the first is to provide acommon basis for several contractors to

prepare competitive bids for constructing thefacility, and the second is to provide com-plete instructions for building the facility, sothat what gets built is exactly what the designteam intended.
Step 10: Solicitation of CompetitiveBids for ConstructionThe purpose of the competitive biddingprocess is to ensure that the facility devel-oped by the design team will be built at thelowest achievable cost. However, the contrac-tors invited to participate in the bidding pro-cess should be carefully selected on the basisof competence, experience, workmanship,and reliability, so that quality is ensuredregardless of the bid price. In the end, thebest construction job for the lowest possibleprice will not have a chance of being realizedif the best contractor is not on the list ofthose invited to submit bids.
The foundation of the bidding process isthe "plans and specifications." The first dutyof the plans and specifications is to provideall information in sufficiently complete detailso that each of the contractors preparing bidswill be preparing cost proposals for exactlythe same, or truly equivalent, items. It isessential that each contractor's bid proposalbe capable of being compared on an "applesto apples" basis; that is, regardless of whichcontractor builds the facility, it will be essen-tially identical in all respects relating to per-formance, reliability, operation and mainte-
nance requirements, and useful life. The keyto obtaining this result is accuracy and com-pleteness, down to the finest details, of theplans and specifications.
As it has developed in the United States,the bidding process follows the block diagramshown in Figure 1-5. Figure 1-5 illustratesthat the first of six phases is to develop a list ofpotential bidders, as discussed previously.This list is developed based on past experi-ence, references, and dialog with contractorsregarding their capabilities. Other means fordeveloping the list can involve advertising forpotential bidders in local and regional news-papers, trade journals, or publications issuedby trade associations. In the second phase, aformal request for bids is issued, along withplans, specifications, a bid form, and a time-table for bidding and construction.
The third phase, shown in Figure 1-5, theprebid conference, is key to the overall suc-cess of the project. This phase involvesassembling all potential contractors andother interested parties, such as potentialsubcontractors, vendors, and suppliers, for ameeting at the project site. This site visit nor-mally includes a guided and narrated tour, apresentation of the engineer's/owner's con-cept of the project, and a question-and-answer period. This meeting can result inidentification of areas of the design thatrequire additional information or changes. Ifthis is the case, the additional informationand/or changes are then addressed to all par-
Table 1-10 Annualized Costs
Total Capital Alternative
#1 SBRs
#2 RBCs
#3 Fluidized Bed
#4 Expanded Bed
#5 No Treatment
Annual Capital Cost ($)
2,600,000
3,900,000
2,450,000
1,700,000
—
Cost($f
300,000
450,000
300,000
200,000
900,000
Total Annual O&M Cost ($)f
1,000,000
950,000
700,000
(650,000)
500,000
(450,000)
—
Cost ($)
1,300,000
1,400,000
1,000,000
(950,000)
700,000
(650,000)
900,000
* Assumes 20-yr. life, 10% cost of money.f Assumes no increase in future O&M costs. Numbers in parentheses reflect energy recovery.

Figure 1-5 Illustration of the bidding process.
ties by issuance of formal addenda to theplans and specifications.
The final three phases—receipt and open-ing of bids, bid evaluation, and award of con-tract—are highly interrelated. Upon receipt,the bids are reviewed to determine accuracyand completeness and to identify the lowestresponsible bidder. If all bids are higher thanwas expected, the industry's managementand engineers have the opportunity toexplore alternatives for redesign of theproject. Finally, the project is awarded to thecontractor submitting the lowest responsiblebid. Construction or implementation cannow begin.
These steps complete the normal sequenceof events for the identification, selection, andconstruction of an industrial wastewatertreatment system, either for pretreatment orfinal treatment of wastewater. These steps arecommon to most design approaches. In thefollowing section, the use of this approach isillustrated for an entirely different wastestream: pollutants in air emissions. Thiscomparison shows both the flexibility andoverall utility of the process.
Treatment Evaluation Process: AirEmissions
The control and treatment of air emissionsfrom a facility can be one of the more chal-lenging aspects of a manager's or engineer'sjob because of the number, type, and ofteninvisible nature of these emissions. Underfederal regulations, the discharge of sub-stances to the air, no matter how slight, isregarded as air pollution. A federal permit, aswell as a state license or permit, must coverall discharges over a certain quantity per unittime. Local ordinances or regulations mayalso apply.
Discharges to the air can be direct, bymeans of a stack or by way of leaks from abuilding's windows, doors, or other open-ings. The latter are referred to as "fugitiveemissions." Volatilization of organic com-pounds, such as solvents and gasoline fromstorage containers, transfer equipment, oreven points of use, is an important sources ofair discharges. Another source of discharge ofvolatile organics to the air is aerated waste-water treatment systems.
Management of discharges to the air isalmost always interrelated with managementof discharges to the water and/or the ground,since air pollution control devices usuallyremove substances from the air discharge(usually a stack) and transfer them to a liquidsolution or suspension, as with a scrubber, orto a collector of solids, as with a bag house.For this reason, a total system approach toenvironmental pollution control is preferred,
Prepare List ofPotential Bidders
Solicit Bids
PrebidConference
Bid Receipt andOpening
Bid Evaluation
Award ofContract

and this approach should include a pollutionprevention program with vigorous wasteminimization.
There are three phases to the air pollutioncycle. The first is the discharge at the source;the second is the dispersal of pollutants inthe atmosphere; and the third is the recep-tion of pollutants by humans, animals, orinanimate objects. Management of the firstphase is a matter of engineering, control, andoperation of equipment. The second phasecan be influenced by stack height, but meteo-rology dictates the path of travel of releasedpollutants. Since the motions of the atmos-phere can be highly variable in all dimen-sions, management of the third phase, whichis the ultimate objective of air pollution con-trol, requires knowledge of meteorology andthe influence of topography.
Chapter 3 presents a detailed synopsis oflaws and regulations pertaining to protectionof the nation's air resources. While these lawsdiffer significantly from those governingwastewater, the goals are the same: to mini-mize the mass and toxicity of pollutantsreleased to the environment. Likewise, theengineering process for identifying technolo-gies suitable for achieving this goal followsthe same general process as illustrated indetail for wastewater, with a few importanttwists and differences. The general steps,however, are the same:
• Analysis of the manufacturing process• Wastes minimization and characteriza-
tion study• Identification of treatment objectives• Selection of candidate technologies• Bench-scale investigations• Pilot-scale investigations• Preliminary design• Economic comparisons• Final design
In the following sections, this process isdescribed again (in less detail, since manysteps are the same as described previously)for specific application to the selection of airtreatment technologies. The treatment of
emissions from a cement manufacturingfacility is used as an example, since this sortof operation, like many industries, has bothpoint source and fugitive emissions.
Analysis of Manufacturing ProcessAs with wastewater, successful and cost-effec-tive air pollution control has its foundationin complete awareness of all of the individualsources, fugitive as well as point sources. Theprocess of cataloging each and every individ-ual air discharge within an industrial manu-facturing or other facility is most efficientlydone by first developing detailed diagrams ofthe facility as a whole. Depending on the sizeand complexity of the facility, it may beadvantageous to develop separate diagramsfor point sources and sources of fugitiveemissions. Next, a separate block diagram foreach air discharge source should be devel-oped. The purpose of each block diagram isto illustrate how each manufacturing processand wastewater or solid wastes treatment orhandling process contributes unwanted sub-stances to the air. Figures 1-6 through 1-8 areexamples that pertain to a facility that manu-factures cement from limestone.
Figure 1-6 is a diagram of the facility as awhole, showing the cement manufacturingprocess as well as the physical plant, includ-ing the buildings, parking lots, and storagefacilities.
At this particular facility, cement, manu-factured for use in making concrete, is pro-duced by grinding limestone, cement rock,oyster shell marl, or chalk, all of which areprincipally calcium carbonate, and mixingthe ground material with ground sand, clay,shale, iron ore, and blast furnace slag, as nec-essary, to obtain the desired ingredients inproper proportions. This mixture is dried ina kiln, and then ground again while mixingwith gypsum. The final product is thenstored, bagged, and shipped. Each of theindividual production operations generatesor is otherwise associated with dust, or "par-ticulates," and is a potential source of air pol-lutant emissions exceeding permit limits.
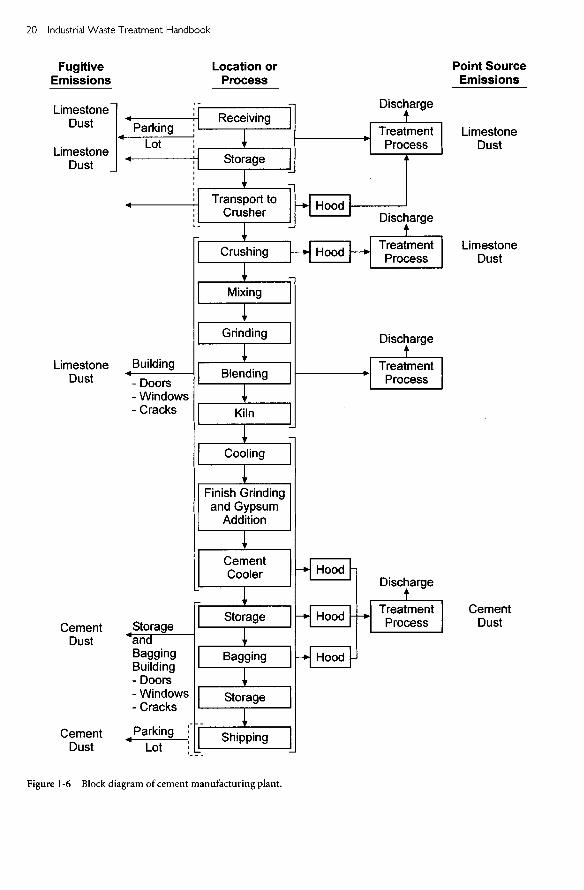
FugitiveEmissions
ParkingLot
Dust
CementDust
CementDust
Limestone Building- Doors- Windows- Cracks
Location orProcess
Receiving
Storage
Transport toCrusher Hood
Crushing —• Hood
Mixing
Grinding
Blending
Kiln
Cooling
Finish Grindingand Gypsum
Addition
CementCooler
StorageandBaggingBuilding- Doors- Windows- Cracks
Parking
Storage
Bagging
Storage
Shipping
Discharge
TreatmentProcess
Discharge
TreatmentProcess
Discharge
TreatmentProcess
Discharge
Point SourceEmissions
LimestoneDust
LimestoneDust
CementDust
LimestoneDust
LimestoneDust
Lot
TreatmentProcessHood
Hood
Hood
Figure 1-6 Block diagram of cement manufacturing plant.

Figure 1-7 illustrates that raw materialsare received and stockpiled at the plant andare potential sources of particulate emissionsdue to the fine particles of "dust" generatedduring the mining, transportation, and load-ing and unloading processes. Their suscepti-bility to being blown around if they are outin the open is also a factor. To control fugitiveemissions from these sources, it is necessaryto conduct all loading, unloading, grinding,and handling operations within enclosuresthat are reasonably airtight but are also venti-lated for the health and safety of employees.Ventilation requires a fresh air intake and adischarge. The discharge requires a treatmentprocess. Candidate treatment processes forthis application include bag houses, wetscrubbers, and electrostatic precipitators,possibly in combination with one or moreinertial separators. Each of these treatmenttechnologies is discussed in Chapter 8.
A very important aspect of air pollutioncontrol is to obtain and then maintain a highdegree of integrity of the buildings and otherenclosures designed to contain potential airpollutants. Doors, windows, and vents mustbe kept shut. The building or enclosure mustbe kept in good repair to avoid leaks. Inmany cases, it is necessary to maintain a neg-ative pressure (pressure inside buildingbelow atmospheric pressure outside build-ing) to prevent the escape of gases or particu-lates. Maintaining the integrity of the build-ing or enclosure becomes very important, inthis case, to minimizing costs for maintain-ing the negative pressure gradient.
As further illustrated in Figure 1-7, thenext series of processing operations consti-tutes the cement manufacturing processitself, and starts with crushing, then proceedsthrough mixing, grinding, blending, anddrying in a kiln. Each of these processes gen-erates large amounts of particulates, whichmust be contained, transported, and col-lected by use of one or more treatment tech-nologies, as explained in Chapter 8. In somecases, it may be most advantageous from the
points of view of reliability or cost effective-ness, or both, to use one treatment system forall point sources. In other cases, it mightprove best to treat one or more of the sourcesindividually.
Continuing through the remaining pro-cesses illustrated in Figure 1-6, the finishedproduct (cement) must be cooled, subjectedto "finish grinding," cooled again, stored,and then bagged and sent off to sales distri-bution locations. Again, each of these opera-tions is a potential source of airborne pollut-ants, in the form of "particulate matter," andit is necessary to contain, transport, and col-lect the particulates using hoods, fans, duct-work, and one or more treatment technolo-gies, as explained in Chapter 8.
The next step in the process of identifyingeach and every source of air pollutant dis-charge from the cement manufacturing plantbeing used as an example is to develop ablock diagram for each individual activitythat is a major emission source. Figure 1-8illustrates this step. Figure 1-8 is a block dia-gram of the process referred to as the "kiln,"in which the unfinished cement is driedusing heat. This diagram pertains to only themanufacturing process and does not includesources of emissions from the physical plant,most of which are sources of fugitive emis-sions.
Figure 1-8 shows that the inputs to thekiln include partially manufactured (wet)cement and hot air. The outputs include drypartially manufactured cement and exhaustair laden with cement dust, or particulates.The diagram then shows that there are fourcandidate technologies to treat the exhaustgas to remove the particulates before dis-charge to the ambient air. The four candidatetechnologies are:
• Electrostatic precipitator• Cyclone• Bag house• Wet scrubber

Figure 1-7 Flow sheet for the manufacture of Portland cement.
Raw Materials
Crushing
Wet Process Dry Process
Proportioningand Mixing of
Raw Materials inSlurry Tanks
Grinding
Homogenizingand Blending
Evaporation
Water
WaterProportioningand Mixing ofRaw Materials
Grinding
Homogenizingand Blending
Kiln
Clinker Storage
KilnKiln Dust
(See Figure 1-8)
Clinker Cooler
Finish Grindingand Gypsum
Addition
Cement Cooler
StorageBaggingShipping

Figure 1-8 Kiln dust collection and handling.
Discharge
Neutralization
Dry CementIntermediate
Return toKiln
Mixed withWater to
Form Slurry
Overflow Recycled
Evaporation
Settling PondOverflow
Wet CementIntermediate
Make-UpWater
LeachingBasin
(Thickener)
UnderflowReturned
to Kiln
Discharged
Bury orHaul
Dust Bin
ElectrostaticPrecipitator Cyclone Bag House
WetScrubber
Kiln DustTarget
Pollutant
Exhaust
Kiln
Heated Air

Each of these technologies is worthy offurther investigation, including investigationof technical feasibility and cost effectiveness.Also, each of these technologies results in aresidual, which must be handled and dis-posed of.
For instance, the bag house technologyproduces a residual that can be described as adry, fine dust—essentially, "raw" cement.This material can be stored in a "dust bin"(the dust bin must be managed as a potentialair pollution source), and from there manyoptions are possible. The dust could be:
• Returned to the kiln in an attempt toincrease the yield of the manufacturingprocess
• Buried• Mixed with water to form a slurry• Hauled (as a by-product) to another
point of use
The first of the above options is only apartial solution at best, since there must besome "blow down," if only to maintain qual-ity specifications for the finished product.Burial is a final solution, but it must beaccomplished within the parameters of goodsolid waste disposal practice. "Water slurry"is only an interim treatment step. Forming awater slurry transforms the air pollutionpotential problem to a water pollutionpotential problem (a "cross-media" effect).The slurry can be transported to anotherlocation without risk of air pollution, butonce there, it must be dewatered by sedimen-tation before final disposal within thebounds of acceptable solid waste and waste-water disposal practices.
The foregoing example illustrates how anentire manufacturing facility must be ana-lyzed and diagrammed to define each andevery source of discharge of pollutants to theair as an early step in a technically feasibleand cost-effective air pollution control pro-gram. The next steps are presented below.
Wastes Minimization andCharacterization StudyAfter all potential sources of air pollutantshave been identified, the objectives of theindustry's pollution prevention programshould be addressed. Wastes minimization isonly one aspect of a pollution preventionprogram, but it is a critical one. Each sourceshould first be analyzed to determinewhether it could be eliminated. Next, mate-rial substitutions should be considered todetermine whether less toxic or costly sub-stances can be used in place of the currentones. Then it should be determined whetheror not a change in present operations—forinstance, improved preventative mainte-nance or equipment—could significantlyreduce pollutant generation. Finally, itshould be determined whether or notimprovements in accident and spill preven-tion, as well as improved emergencyresponse, are warranted.
After a prudent wastes minimization pro-gram has been carried out, a period of timeshould be allocated to determine whether thechanges made appear to be permanent. Thisphase of the overall air pollution control pro-gram is important, because if the determina-tion of air pollutant flow rates and concen-trations is made on the basis of improvedmaintenance and operational procedures,and if the facility regresses to the way thingswere done previously, the handling and treat-ment equipment designed on the basis of theimproved procedures will be overloaded andwill fail.
Once all air pollution flows and loads havebecome stabilized, each of the sources shouldbe subjected to a characterization program todetermine flow rates and target pollutantconcentrations (flows and loads) for the pur-pose of developing design criteria for han-dling and treatment facilities. Examples ofhandling facilities are hoods, fans, and duct-work. Examples of treatment equipment areelectrostatic precipitators and fabric filters(bag houses, for instance). The characteriza-tion study amounts to developing estimates

of emission rates based on historical recordsof the facility under consideration or those ofa similar facility. For instance, material bal-ances showing amounts of raw materialspurchased and products sold can be used toestimate loss rates.
Treatment ObjectivesTreatment objectives are needed to completethe development of design criteria for han-dling and treatment equipment. The air dis-charge permit, either in-hand or anticipated,is one of the principal factors used in thisdevelopment, since it specifies permissiblelevels of discharge. Another principal factoris the strategy to be used regarding allow-ances—that is, whether or not to buy allow-ances from another source or to reduce emis-sions below permit limits and attempt torecover costs by selling allowances. Thisstrategy and its legal basis are discussed inChapter 3. Only after all treatment objectiveshave been developed can candidate treat-ment technologies be determined. However,it may be beneficial to employ an iterativeprocess in which more than one set of treat-ment objectives and their appropriate candi-date technologies are compared as compet-ing alternatives in a financial analysis todetermine the most cost-effective system.
Selection of Candidate TechnologiesAfter the characteristics of air discharges, interms of flows and loads, have been deter-mined (based on stabilized processes afterchanges were made for wastes minimiza-tion), and treatment objectives have beenagreed upon, candidate technologies forremoval of pollutants can be selected. Theprinciples discussed in Chapters 2 and 8 areused as the bases for this selection. The selec-tion should be based on one or more of thefollowing:
• Successful application in a similar set ofconditions
• Knowledge of chemistry
• Knowledge of options available, as wellas knowledge of capabilities and limita-tions of those alternative treatment tech-nologies
The next step is to conduct bench-scaleinvestigations to determine technical andfinancial feasibility.
Bench-Scale InvestigationsUnless there is unequivocal proof that a giventechnology will be successful in a given appli-cation, it is imperative that a rigorous pro-gram of bench-scale, followed by pilot-scale,investigations be carried out. Such a programis necessary for standard treatment technolo-gies as well as innovative technologies. Thecost for this type of program will be recov-ered quickly as a result of the equipmentbeing appropriately sized and operated.Underdesigned equipment will simply beunsuccessful. Overdesigned equipment willcost far more to purchase, install, and oper-ate.
The results of a carefully executed bench-scale pollutant removal investigation willprovide the design engineer with reliabledata on which to determine the technical fea-sibility of a given pollutant removal technol-ogy, as well as a preliminary estimate of thecosts for purchase, construction and installa-tion, and operation and maintenance. With-out such data, the design engineer is forcedto use very conservative assumptions anddesign criteria. The result, barring outra-geous serendipity, will be unnecessarily highcosts for treatment throughout the life of thetreatment process.
Pilot-Scale InvestigationsBench-scale investigations are the first step ina necessary procedure for determining themost cost-effective treatment technology.Depending on the technology, inherentscale-up problems may make it inadvisableto design a full-scale treatment system basedonly on data from bench-scale work. The

next step after bench-scale investigations isthe pilot-scale work. A pilot plant is simply asmall version of the anticipated full-scaletreatment system.
A good pilot plant should have the capa-bility to vary operational parameters. It is notsufficient to merely confirm that successfultreatment, in terms of compliance with dis-charge limitations, can be achieved using thesame operating parameters as those deter-mined by the bench-scale investigations.Again, it would be outrageous serendipity ifthe results of the bench-scale investigationstruly identified the most cost-effective, aswell as reliable, full-scale treatment systemdesign and operating parameters.
The pilot-scale investigation should becarried out at the industrial site, using a por-tion of the actual gas stream to be treated. Apilot-scale treatment unit (e.g., a wet scrub-ber or an electrostatic precipitator) can, inmany cases, be rented from a manufacturerand transported to the site.
The pilot plant should be operated con-tinuously over a representative period oftime, so as to include as many of the wastestream variations as reasonably possible thatthe full-scale unit is expected to experience.One difficulty in carrying out a pilot-scalestudy is that smaller units are more suscepti-ble to upset, fouling, plugging, or other dam-age from slug doses caused by spills or mal-functions in processing equipment. Also,unfamiliarity on the part of the pilot plantoperator, either with the gas stream beingtreated, the processing system from whichthe stream is generated, or the pilot plantitself, can result in the need for prolongedinvestigations.
As with wastewater treatment pilot plantinvestigations, it is critically important tooperate a pilot-scale treatment system for asufficiently long period of time to:
• Include as many combinations of wastesthat are reasonably expected to occurduring the foreseeable life of the proto-type system, as is reasonably possible.
• Evaluate combinations of operationparameters, within reason. When opera-tion parameters are changed (e.g., thevolumetric loading of an air scrubber, thechemical feed rate of a pH neutralizationsystem, or the effective pore size of a baghouse—type fabric filter), the system mustoperate for a long enough time to achievesteady state before any data to be used forevaluation are taken. Of course, it will benecessary to obtain data during theperiod just after operation parametersare changed, to determine when steadystate has been reached.
Observations should be made to deter-mine whether or not the performance of thepilot plant, using a particular set of parame-ters, is in the range of what was predictedfrom the results of the bench-scale investiga-tions. If the difference in performance is sig-nificant, it may be prudent to stop the pilot-scale investigation work and try to determinethe cause.
Preliminary DesignThe results of the pilot-scale investigationsshow which technologies are capable ofmeeting the treatment objectives, but do notenable an accurate estimation of capital andoperating costs. A meaningful cost analysiscan take place only after the completion ofpreliminary designs of those technologiesthat proved to produce satisfactory effluentquality in the pilot-scale investigations. Apreliminary design is a design of an entiretreatment facility, carried out in sufficientdetail to enable accurate estimation of thecosts for constructing and operating a treat-ment facility. It must be complete to theextent that the sizes and descriptions of all ofthe pumps, pipes, valves, tanks, concretework, buildings, site work, control systems,and manpower requirements are established.The difference between a preliminary designand a final design is principally in the com-pleteness of detail of the drawings and in the

specifications. It is almost as though the teamthat produces the preliminary design coulduse it directly to construct the plant. Theextra detail that goes into the final design isprincipally to communicate all of the inten-tions of the design team to people notinvolved in the design.
Economic ComparisonsThe choice of treatment technology andcomplete treatment system between two ormore systems proven to be reliably capable ofmeeting the treatment objectives should bebased on a thorough analysis of all costs overthe expected life of the system. This evalua-tion is conducted in a similar manner, and toa similar level of detail, as described in theprevious section on wastewater.
ConclusionThe engineering approach described in theprevious sections will provide a solid basisfor the evaluation of almost any industrialprocess technology or treatment train. It canbe applied, in abbreviated form, to the evalu-ation of individual equipment choices or, invery detailed form, to the design of an entiretreatment facility. Additional detail on spe-cific aspects of industrial waste treatment areprovided in subsequent chapters and reflectthe basic engineering tenets described in thischapter. This engineering approach, whencoupled with a sound understanding of thecost and consequences of final disposal, willhelp ensure a sound and effective treatmentsystem for even the most complex wastestream.
Treatment Evaluation Process: SolidWastes
Industrial wastes that are discharged to nei-ther air nor water are classified as solid,industrial, or hazardous waste. At the federallevel, these wastes are regulated primarily bythe Resource Conservation and Recovery Act
(RCRA), which contains specific design andmanagement standards for both hazardouswastes (Subtitle C) and municipal solidwastes (Subtitle D).
In general, the process of evaluating solidwaste treatment does not follow the sameprocess as liquid waste or air discharges. Acommon goal of the treatment of liquidwastes and air discharges is to produce a solidwaste for disposal. By the time solid waste iscreated, it is often implied that there are noremaining "treatment" options. That beingsaid, a solid waste "treatment evaluationprocess" would likely involve evaluation ofthe processes in the facility that generates thesolid wastes, as well as the liquid and airtreatment processes that contribute to thesolid wastes generated, with the goal of mini-mizing the solid waste that is handled, trans-ported, and ultimately disposed of.
An important aspect of the solid wastetreatment evaluation process is an under-standing of how solid wastes are character-ized and, subsequently, handled and dis-posed of so that a facility maintains compli-ance with the appropriate regulations. As isdiscussed in greater detail in Chapter 9, solidwaste management and disposal often repre-sent significant and constantly increasingcosts for industry. To minimize these costsand reduce the likelihood of enforcementactions by regulators, environmental manag-ers must ensure that a sound solid wastemanagement program is in place and that allpersonnel, from laborers to top managers,are vigilant in carrying it out. Some keypoints to bear in mind when evaluating thesolid waste generated by a facility and devel-oping a solid waste management programare as follows.
1. Know the facility waste streams. As withindustrial wastewaters, these are seldomthe same for different plants. As a firststep, facilities must know how much ofeach type of solid waste they are produc-ing.

2. Keep wastes segregated. Heavy fines, aswell as criminal sentences, are the penal-ties for improper waste disposal. Facili-ties must ensure that hazardous wastesare not put in the trash dumpster, thatlisted hazardous wastes are not mixedwith other nonhazardous materials, andgenerally that wastes are handled asthey're supposed to be.
3. Choose waste disposal firms carefully.Because facilities can be held responsiblefor cleanup costs of the waste facilitiesthey use, waste transporters and facilitiesshould be chosen carefully.
4. Institute a pollution prevention programthat includes a vigorous wastes minimiza-tion effort. Where possible, reduce thequantity or toxicity of materials used inproduction.
5. Keep areas clean. Frequent spills orreleases not only present safety hazards,but also increase the amount of facilitydecontamination necessary at closure.
6. Keep good records. Industry-wide, a greatdeal of money is wasted on testing anddisposing of unknown materials or ininvestigating areas with insufficient his-torical data. Good recordkeeping isessential to keep both current and futurewaste management costs to a minimum.
Excellent texts, which discuss in detail themany aspects of solid, industrial, and hazard-ous waste management, are available; thesereferences are listed in the bibliography at the
end of this chapter and can be consulted forspecific information.
Bibliography
American Society of Civil Engineers. Manualof Practice: Quality in the ConstructionProject—A Guide for Owners, Designers,and Contractors. New York: 1988.
CELDS: United States Army Corps of Engi-neers, Construction Engineering Research.
Chanlett, E. T. Environmental Protection. 2nded. New York: McGraw-Hill, 1979.
Dunne, T., and L. D. Leopold. Water in Envi-ronmental Planning. San Francisco: Free-man, 1978.
Pruett, J. M. "Using Statistical Analysis forEngineering Decisions." Plant Engineering(May 13, 1976): 155-157.
U.S. Environmental Protection Agency.Design Criteria for Mechanical, Electric,and Fluid System and Component Reliabil-ity. EPA-430-99-74-001. Washington, DC:U.S. Government Printing Office, 1974.
U.S. Environmental Protection Agency. ISO14000 Resource Directory, National RiskManagement Research Laboratory. EPA/625/R-97/003. Cincinnati, OH: 1997.
Vesilind, P. A. Environmental Pollution andControl. 2nd ed. Ann Arbor, MI: AnnArbor Science Publishers, 1983.
Willis, J. T., ed. Environmental TQM. 2nd ed.New York: McGraw-Hill, 1994.

2 Fundamentals
Although the laws and regulations thatrequire industrial wastewater treatment areconstantly changing, the fundamental prin-ciples on which treatment technologies arebased do not change. This chapter presents asummarized version of the basic chemistryand physics on which treatment technologiesare based, with the objective of showing thata command of these principles can enablequick, efficient identification of very effectivetreatment schemes for almost any given typeof wastewater.
The fundamental idea upon which theapproach suggested in this chapter is basedcan be stated as follows: if the mechanisms bywhich individual pollutants become incor-porated into a waste stream can be identified,analyzed, and described, the most efficientmethodology of removal, or "treatment," willbe obvious.
As an example of the usefulness of thisapproach to quickly develop an effective, effi-cient treatment scheme, consider the leachatefrom a landfill that is to be pretreated andthen discharged to a municipal wastewatertreatment facility (a publicly owned treat-ment works, or POTW). The waste sludgefrom the POTW is disposed of by land appli-cation, therefore, a restrictive limitation isplaced on heavy metals in the pretreatedleachate. Analysis of this leachate shows thatthe content of iron is higher than permiss-able by the landfill. Other metals, such ascadmium (probably from discarded batter-ies), zinc, copper, nickel, and lead, may alsobe present in excess of the concentrationsallowed by the landfill's pretreatment permitbut are substantially lower than the iron con-tent.
Knowledge of the following enabled quickconceptualization of a treatment scheme:
• All metals are sparingly soluble in water.• Iron in the divalent state (2+) is highly
soluble in water, whereas iron in thetrivalent state (3+) is not.
• Iron can be converted from the divalentstate to the trivalent state by passing airthrough the aqueous solution containingthe dissolved iron. (The oxygen in the airoxidizes the ferrous (divalent) ion to fer-ric [trivalent] ion.)
• Because substances such as cadmium,zinc, and lead are so sparingly soluble,they will tend to adsorb to the surface ofalmost any solid particle in an aqueoussolution.
In this scheme, the leachate was conveyedto a simple, open concrete tank, where airwas bubbled through it. The soluble ferrouscompounds in the leachate were oxidized toinsoluble iron oxide; the precipitated ironoxide coagulated and flocculated because ofthe gentle mixing action of the air bubbles;and the dissolved species of other metalsadsorbed to the iron oxide particles and co-precipitated with them. Next, the aeratedleachate was allowed to settle, which effec-tively removed all of the heavy metals towithin the limits of the pretreatment permit.
The following sections of this chapter havebeen developed to explain the fundamentalchemical, physical, and thermodynamicprinciples by which pollutants become dis-solved, suspended, or otherwise incorpo-rated into waste streams to form homoge-neous or heterogeneous mixtures. At the end

of this chapter, several simple examples aregiven to further illustrate the usefulness ofthe technique, whereby fundamental con-cepts of chemistry and physics can be appliedto efficiently deduce appropriate treatmentschemes.
Electron Configurations and EnergyLevels
According to the theory of quantummechanics, an electron is most likely to befound in a region in space known as anorbital. Several "rules" govern the orbitals inwhich electrons will be located within anatom or a molecule. The first has to do withenergy level. As atoms increase in size, theadditional protons always reside in thenucleus, but the additional electrons reside insuccessively larger orbitals, which, in turn,exist within successively larger concentricshells. The electrons within orbitals that arecloser to the nucleus are of lower energy levelthan those in larger orbitals. One of the strictrules of electron location is that no electroncan occupy an orbital of higher energy leveluntil all orbitals of lower energy are "full." Asecond rule is that only two electrons canoccupy any atomic orbital, and these elec-trons must have opposite spins. These elec-trons of opposite spin are called "electronpairs." Electrons of like spin tend to get as faraway from each other as possible. This rule,the Pauli exclusion principle, is the most
important of all the influences that deter-mine the properties and shapes of molecules.
Figure 2-1, (a) and (b), shows two ways todepict a spherical electron orbital. Figure2-1 (a) presents the orbital as a sphericalcloud surrounding the nucleus. Figure 2-l(b)is simply a convenient, two-dimensional rep-resentation of the orbital. Figure 2-2 showsthe shapes of the two orbitals of lowestenergy level, which are the two smallestorbitals as well.
Figure 2.2(a) shows that the smallest and,therefore, the lowest energy level orbital isdesignated the "Is" orbital and is approxi-mately spherical. The center of the Is orbitalcoincides with the center of the nucleus. Fig-ure 2.2(b) shows that the next larger orbitalis called the "2s" orbital and is also spherical,with its center coinciding with the center ofthe nucleus. Next in size (and energy level)are three orbitals of equal energy that havetwo approximately spherical lobes each andcan thus be described as having shapes simi-lar to dumbbells. These "2p orbitals" areshown in Figure 2-3(a), (b), and (c). Figure2-3(a), (b), and (c) show that the three two-lobed orbitals are arranged so as to be as faraway from one another as possible and arethus arranged such that the center of eachlobe lies on one of three axes that are perpen-dicular to one another. The center of theatomic nucleus coincides with the origin ofthe three axes. The axes are referred to as theX-, y-, and z-axes, and the three orbitals arecalled the 2px, 2py, and 2pz orbitals.
Figure 2-1 (a) Spherical electron orbital as a spherical cloud surrounding the nucleus, (b) Two-dimensional representationof the electron orbital.
(b)(a)

Figure 2-2 (a) Is orbital, (b) Is and 2s orbital.
2s Orbital
Is Orbital
Nucleus
Is Orbital
Nucleus(b)
(a)
(a)
(b)
Figure 2-3 (a) 2px orbital, (b) 2py orbital.

Figure 2-3 (c) 2pz orbital.
The electron orbitals exist within electronshells. The electron shells are concentric andare numbered 1, 2, 3, 4, and so on. Thesmaller shells, closer to the nucleus, mustbecome full before electrons will be found inorbitals in higher (larger) shells. Shell 1 is fullwith one (Is) orbital. The total number ofelectrons in shell 1, when it is full, then, istwo. Shell 2 is full when it contains four (one2s and three 2p) orbitals. Thus, a full shell 2contains eight electrons. Figure 2-4 shows anatom with the five orbitals of lowest energylevel. The Is orbital resides within shell 1, andthe 2s, 2px, 2py, and 2pz orbitals residewithin shell 2. The center of the nucleuscoincides with the origin of the three axes.
In the sections that follow, these orbitalswill be discussed as they relate to the stabilityof molecules.
Electrical and ThermodynamicStability
A fundamental and very important law ofnature is that all elements tend toward ever-greater stability. Chemical elements are elec-trically stable when the number of electronsequals the number of protons. They are ther-modynamically stable when their outermost,or largest, electron shell is full.
An element with more electrons than pro-tons or more protons than electrons carries an
(c)
Shell 2
Shell 1
Figure 2-4 Arrangement of electron orbitals within shells 1 and 2.

electric charge and is referred to as an "ion." Ifelectrons are in excess of protons, the charge isnegative, and the element is said to be ananion. If protons are in excess of electrons, thecharge is positive, and the element is said to bea cation. Both cations and anions are electri-cally active and are therefore said to be electri-cally unstable. Cations and anions areattracted to each other because of their oppo-site electric charges and thus form chemicalcompounds. When a cation and an anion jointo form a chemical compound, the respectivecharges cancel each other out and theybecome electrically stable.
Because of a strong tendency to attainthermodynamic stability, atoms tend toeither lose electrons until the next smallershell (being full) becomes the outermostshell or gain electrons until the original out-ermost shell becomes full. Electrons in shellsthat are not full are called "valence electrons"and are active in chemical bonding. Electronsin full shells are essentially unreactive. Theonly role these electrons play in chemicalbonding is that of insulating the valence elec-trons of other atoms from the attraction ofthe positively charged nucleus.
The elements at the far right of the peri-odic table have full outermost shells in theirnatural state. The number of electrons equalsthe number of protons. As they are both elec-trically and thermodynamically stable, theseelements are unreactive. They are known asthe "noble elements" or "noble gases."
teristics of water, it is useful to examine theconstruction of hydrogen, oxygen, and thesix elements that lie between them in size; itis also useful to consider, in a step-by-stepway, how each successive proton and its asso-ciated electron influence the characteristicsof each element.
Consider hydrogen first; it is the smallest ofthe elements. Hydrogen consists of one protonwithin a small, extremely dense nucleus andone electron contained within an orbital thatis more or less spherical and surrounds thenucleus. Figure 2-5 is a two-dimensional por-trayal of the three-dimensional hydrogenatom, but is sufficient to show that, at anygiven instant, the negatively charged electronis able to counteract the positively chargednucleus within only a small region of the spacethat the atom occupies.
Figure 2-5 illustrates that, if a chargedetector could be placed near the hydrogenatom, it would detect a negative charge in theregion near the electron and a positive chargeeverywhere else. The positive charge wouldregister strongest in the region opposite inspace to the region occupied by the electron.At any given instant then, a hydrogen atom isa polar object, having a negatively chargedregion and a positively charged region. Inthis sense, a hydrogen atom exhibits proper-ties of a tiny magnet. However, since the elec-tron is in continual motion, and at any giveninstant can be found anywhere within theapproximately spherical orbital surrounding
Chemical Structure and Polarity ofWater
Water molecules are polar in nature: similarto a magnet, one side has a positive "pole"and the opposite side has a negative "pole."This polarity arises from the spatial arrange-ment of protons and electrons in the individ-ual hydrogen and oxygen atoms that makeup each water molecule.
Before proceeding to an examination ofthe structure and electrically charged charac- Figure2-5 Diagram of hydrogen atom.
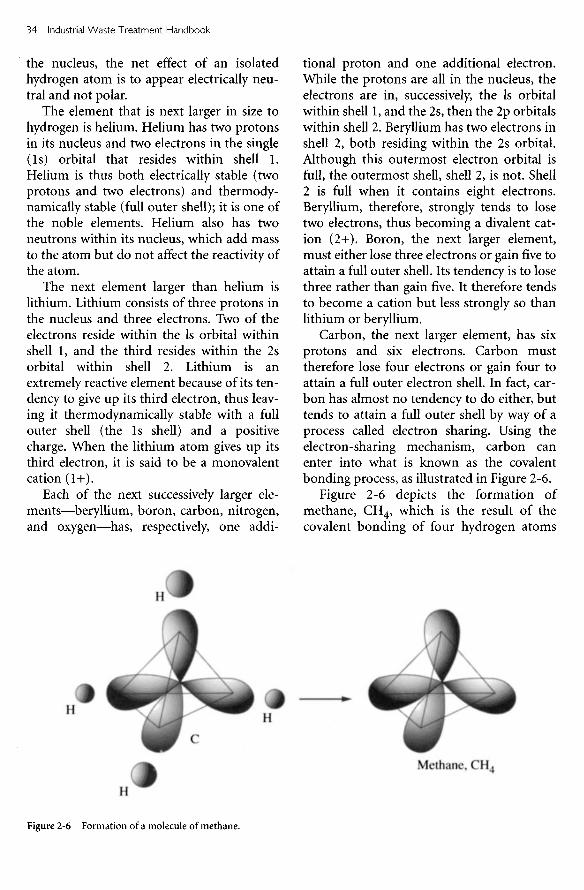
the nucleus, the net effect of an isolatedhydrogen atom is to appear electrically neu-tral and not polar.
The element that is next larger in size tohydrogen is helium. Helium has two protonsin its nucleus and two electrons in the single(Is) orbital that resides within shell 1.Helium is thus both electrically stable (twoprotons and two electrons) and thermody-namically stable (full outer shell); it is one ofthe noble elements. Helium also has twoneutrons within its nucleus, which add massto the atom but do not affect the reactivity ofthe atom.
The next element larger than helium islithium. Lithium consists of three protons inthe nucleus and three electrons. Two of theelectrons reside within the Is orbital withinshell 1, and the third resides within the 2sorbital within shell 2. Lithium is anextremely reactive element because of its ten-dency to give up its third electron, thus leav-ing it thermodynamically stable with a fullouter shell (the Is shell) and a positivecharge. When the lithium atom gives up itsthird electron, it is said to be a monovalentcation (1+).
Each of the next successively larger ele-ments—beryllium, boron, carbon, nitrogen,and oxygen—has, respectively, one addi-
tional proton and one additional electron.While the protons are all in the nucleus, theelectrons are in, successively, the Is orbitalwithin shell 1, and the 2s, then the 2p orbitalswithin shell 2. Beryllium has two electrons inshell 2, both residing within the 2s orbital.Although this outermost electron orbital isfull, the outermost shell, shell 2, is not. Shell2 is full when it contains eight electrons.Beryllium, therefore, strongly tends to losetwo electrons, thus becoming a divalent cat-ion (2+). Boron, the next larger element,must either lose three electrons or gain five toattain a full outer shell. Its tendency is to losethree rather than gain five. It therefore tendsto become a cation but less strongly so thanlithium or beryllium.
Carbon, the next larger element, has sixprotons and six electrons. Carbon musttherefore lose four electrons or gain four toattain a full outer electron shell. In fact, car-bon has almost no tendency to do either, buttends to attain a full outer shell by way of aprocess called electron sharing. Using theelectron-sharing mechanism, carbon canenter into what is known as the covalentbonding process, as illustrated in Figure 2-6.
Figure 2-6 depicts the formation ofmethane, CH4, which is the result of thecovalent bonding of four hydrogen atoms
Figure 2-6 Formation of a molecule of methane.
Methane, CH4

with a single carbon atom. Figure 2-6 showsa carbon atom with each of the four valenceelectrons arranged in space so that they areas far away from one another as they can beand still occupy the same electron shell.Some rearranging of orbitals is required tomake this configuration possible. Becausecarbon has a total of six electrons, it isexpected, on the basis of the foregoing dis-cussion, that two reside as a pair within theIs orbital, another pair resides in the 2sorbital, and one unpaired electron resides ineach of two 2p orbitals; however, thisarrangement would allow only two covalentbonds, yielding CH2 if those bonds werewith hydrogen atoms. This configurationwould result in carbon having six electronsin its outer shell, whereas eight are requiredfor a full outer shell. What actually happens,because of the very strong tendency for car-bon to attain a full outer shell of eight elec-trons, is that the 2s orbital and the three 2porbitals form four hybrid orbitals of equalenergy level having one unpaired electron ineach. These four hybrid orbitals are calledsp3 orbitals and are shaped as shown in Fig-ure 2-7. An sp3 orbital has two lobes ofunequal size, and the nucleus of the atomresides between the two lobes. Figure 2-8shows that the four hybrid sp3 orbitals of acarbon atom are arranged in such a way asto be as far from one another as possible.The carbon atom thus attains a shape suchthat, if straight lines were drawn to connectthe outer limits of each lobe, a tetrahedronwould be drawn. Thus, carbon atoms aresaid to exist in the shape of a regular (allsides equal in size) tetrahedron, with onevalence electron available to form a covalentbond at each corner of the tetrahedron andwith the center of the nucleus coincidingwith the center of mass of the tetrahedron.Figure 2-9 shows a two-dimensional repre-sentation of Figure 2-6. Figure 2-10 depictsfour hydrogen atoms, each of which needsone additional electron to fill its outer shell,combining with each of the four valenceelectrons of the carbon atom to form the
Figure 2-7 Configuration of a hybrid sp3 orbital.
methane molecule. Each of the four elec-tron pairs is shared in a covalent bond, andthe molecule exists as a cohesive unit. Thisis in contrast to compounds of lithium, forexample, which are formed by ionic bonds.In a water solution, lithium gives up its onevalence electron to another atom—chlorine,for instance—and exists as the discrete lith-ium ion, Li+, not physically attached toanother ion. This is the principal differencebetween covalent bonds and ionic bonds.
Moving on to an examination of the char-acteristics of oxygen and then water, it is seenthat oxygen has eight protons in its nucleusand eight electrons arranged such that tworeside in the Is orbital within shell 1, two arewithin the 2s orbital within shell 2, and fourare within the 2p orbitals in shell 2, such thatone 2p is full with a pair and the other two 2porbitals have one unpaired electron each.Two additional electrons are needed to fillshell 2. To accomplish this, the oxygen atomforms a covalent bond with each of twohydrogen atoms, as illustrated in Figure 2-11.
Figure 2-11 shows the spatial arrangementof the six valence electrons of oxygen. Four ofthe six electrons are arranged into two pairs,and two are arranged so that each can partic-ipate in a covalent bond and thus be includedin an electron pair. When the covalent bondshave been formed, the resulting four electron

Figure 2-8 The four sp3 orbitals of an atom of carbon.
pairs arrange themselves so as to be as faraway from one another as possible, resultingin another tetrahedral structure of four sp3
orbitals, similar to that of the carbon mole-cule. It is the mutual repulsion caused by likecharges (negative) associated with each of the
Figure 2-9 Two-dimensional representation of a carbon atom showing the four valence electrons.
Shell 2
Nucleus

electron pairs that cause them to form thetetrahedral structure and thus be as far awayfrom one another as possible while still occu-pying the same electron shell.
There is a difference between the tetrahe-dral structures of methane molecules andwater molecules. In the case of methane,there are equivalent hydrogen atom-carbonvalence electron structures at each of the fourcorners. In the case of water, two of the cor-ners of the tetrahedral structure contain the
hydrogen-oxygen valence electron pair, andtwo contain simply an electron pair. There isequal repulsion between the electron pairs inthe case of methane; therefore, a regular tet-rahedron structure results. The structure ofthe methane molecule is almost perfectlysymmetrical. In the case of water, however,there is not equal repulsion between thestructures at the corners of the tetrahedralmolecule, and a distorted tetrahedral struc-ture results.
Carbon Atom Plus Four Hydrogen Atoms
Figure 2-10 A carbon atom forms covalent bonds with each of four hydrogen atoms to produce a molecule of methane.
Molecule of Methane
Nucleus Nucleus
Oxygen Atom Plus TwoHydrogen Atoms
Water Molecule
Figure 2-11 An oxygen atom forms covalent bonds with each of two hydrogen atoms to produce a molecule of water.
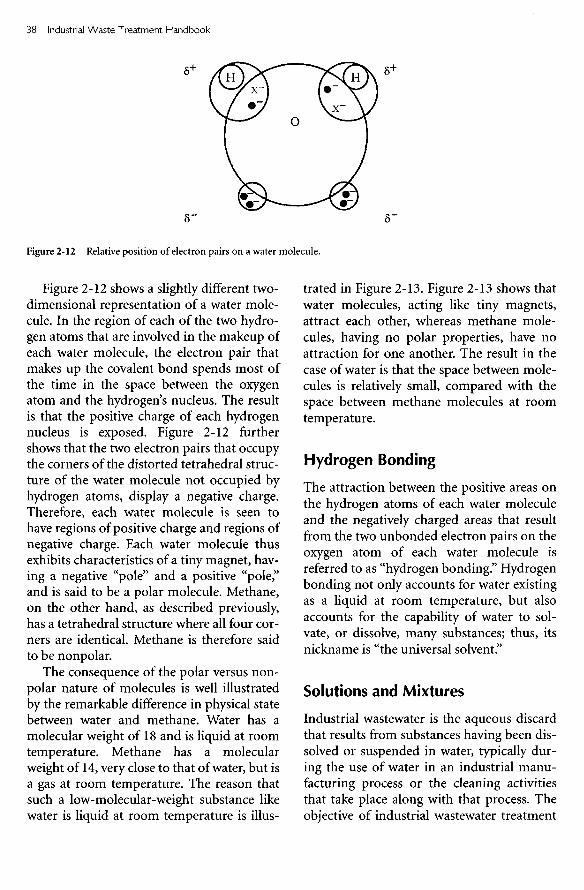
Figure 2-12 shows a slightly different two-dimensional representation of a water mole-cule. In the region of each of the two hydro-gen atoms that are involved in the makeup ofeach water molecule, the electron pair thatmakes up the covalent bond spends most ofthe time in the space between the oxygenatom and the hydrogen's nucleus. The resultis that the positive charge of each hydrogennucleus is exposed. Figure 2-12 furthershows that the two electron pairs that occupythe corners of the distorted tetrahedral struc-ture of the water molecule not occupied byhydrogen atoms, display a negative charge.Therefore, each water molecule is seen tohave regions of positive charge and regions ofnegative charge. Each water molecule thusexhibits characteristics of a tiny magnet, hav-ing a negative "pole" and a positive "pole,"and is said to be a polar molecule. Methane,on the other hand, as described previously,has a tetrahedral structure where all four cor-ners are identical. Methane is therefore saidto be nonpolar.
The consequence of the polar versus non-polar nature of molecules is well illustratedby the remarkable difference in physical statebetween water and methane. Water has amolecular weight of 18 and is liquid at roomtemperature. Methane has a molecularweight of 14, very close to that of water, but isa gas at room temperature. The reason thatsuch a low-molecular-weight substance likewater is liquid at room temperature is illus-
trated in Figure 2-13. Figure 2-13 shows thatwater molecules, acting like tiny magnets,attract each other, whereas methane mole-cules, having no polar properties, have noattraction for one another. The result in thecase of water is that the space between mole-cules is relatively small, compared with thespace between methane molecules at roomtemperature.
Hydrogen Bonding
The attraction between the positive areas onthe hydrogen atoms of each water moleculeand the negatively charged areas that resultfrom the two unbonded electron pairs on theoxygen atom of each water molecule isreferred to as "hydrogen bonding." Hydrogenbonding not only accounts for water existingas a liquid at room temperature, but alsoaccounts for the capability of water to sol-vate, or dissolve, many substances; thus, itsnickname is "the universal solvent."
Solutions and Mixtures
Industrial wastewater is the aqueous discardthat results from substances having been dis-solved or suspended in water, typically dur-ing the use of water in an industrial manu-facturing process or the cleaning activitiesthat take place along with that process. Theobjective of industrial wastewater treatment
Figure 2-12 Relative position of electron pairs on a water molecule.

is to remove those dissolved or suspendedsubstances. The best approach to workingout an effective and efficient method ofindustrial wastewater treatment is to under-stand how substances are dissolved or sus-pended in water and then to deduce plausiblechemical or physical actions that wouldreverse those processes. However, before weenter into a discussion on how solutions andmixtures are formed, it is important tounderstand the second law of thermodynam-ics, which is often the driving force behindthese phenomena.
Second Law of ThermodynamicsThe second law of thermodynamics statesthat, in nature, all systems tend toward a statein which free energy is minimized. The freeenergy of a system is given by the followingexpression, known as the Gibbs free energyequation:
G = H-TS (2-1)
where G is the free energy (often referred toas the Gibbs free energy) and is that portionof the heat content, or enthalpy, H, that isavailable to do work, isothermally; T is theabsolute temperature; and S is entropy.Entropy can be described as the "degree ofdisorganization," that is, the more highlyorganized a system is, the lower its entropy.Consider a glass of water into which a tea-spoon of sodium chloride (table salt) isplaced. Sodium chloride exists as a crystallinesolid in its pure form, and because it has adensity greater than that of water, the crystalsof sodium chloride will first sink to the bot-tom of the glass and sit there for a while.After a period of time, however, the salt crys-tals will "disappear," having gone into solu-tion. The sodium chloride ionizes to sodiumions and chloride ions (cations and anions,
Figure 2-13 Strong attractive forces between molecules of water as compared with weak attractive forces between mole-cules of methane.
(a) lntermolecular forces of
attraction between water molecules
Note :
= Covalent bond
- - = Hydrogen bond
(b) Absence of intermolecular forces
between methane molecules
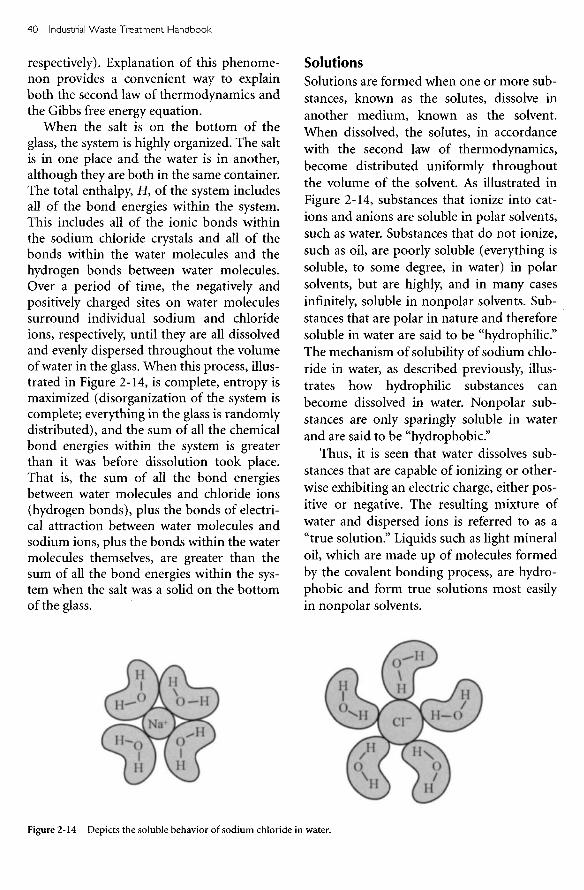
respectively). Explanation of this phenome-non provides a convenient way to explainboth the second law of thermodynamics andthe Gibbs free energy equation.
When the salt is on the bottom of theglass, the system is highly organized. The saltis in one place and the water is in another,although they are both in the same container.The total enthalpy, H, of the system includesall of the bond energies within the system.This includes all of the ionic bonds withinthe sodium chloride crystals and all of thebonds within the water molecules and thehydrogen bonds between water molecules.Over a period of time, the negatively andpositively charged sites on water moleculessurround individual sodium and chlorideions, respectively, until they are all dissolvedand evenly dispersed throughout the volumeof water in the glass. When this process, illus-trated in Figure 2-14, is complete, entropy ismaximized (disorganization of the system iscomplete; everything in the glass is randomlydistributed), and the sum of all the chemicalbond energies within the system is greaterthan it was before dissolution took place.That is, the sum of all the bond energiesbetween water molecules and chloride ions(hydrogen bonds), plus the bonds of electri-cal attraction between water molecules andsodium ions, plus the bonds within the watermolecules themselves, are greater than thesum of all the bond energies within the sys-tem when the salt was a solid on the bottomof the glass.
SolutionsSolutions are formed when one or more sub-stances, known as the solutes, dissolve inanother medium, known as the solvent.When dissolved, the solutes, in accordancewith the second law of thermodynamics,become distributed uniformly throughoutthe volume of the solvent. As illustrated inFigure 2-14, substances that ionize into cat-ions and anions are soluble in polar solvents,such as water. Substances that do not ionize,such as oil, are poorly soluble (everything issoluble, to some degree, in water) in polarsolvents, but are highly, and in many casesinfinitely, soluble in nonpolar solvents. Sub-stances that are polar in nature and thereforesoluble in water are said to be "hydrophilic."The mechanism of solubility of sodium chlo-ride in water, as described previously, illus-trates how hydrophilic substances canbecome dissolved in water. Nonpolar sub-stances are only sparingly soluble in waterand are said to be "hydrophobic."
Thus, it is seen that water dissolves sub-stances that are capable of ionizing or other-wise exhibiting an electric charge, either pos-itive or negative. The resulting mixture ofwater and dispersed ions is referred to as a"true solution." Liquids such as light mineraloil, which are made up of molecules formedby the covalent bonding process, are hydro-phobic and form true solutions most easilyin nonpolar solvents.
Figure 2-14 Depicts the soluble behavior of sodium chloride in water.

EmulsionsHydrophobic substances can be induced togo into a state that is equivalent in manyways to a water solution, by a process knownas emulsification. An emulsion is equivalentto a solution in that it consists of a stablemixture that will not separate under quies-cent conditions (except in the case of tempo-rary emulsions). A sample taken from any-where within the volume of the mixture isrepresentative of the mixture as a whole, andas the mixture flows from one place toanother, it does not change in character.
Pure hexane is a liquid that is sparinglysoluble in water. It is composed of a six-car-bon chain with hydrogen atoms bonded bycovalent bonds at all bonding sites other thanthose involved in the six-carbon chain. Fig-ure 2-15 depicts a hexane molecule.
Hexane has a molecular weight of about86 and exists as a liquid at room temperature.Very small electrical attractive forces existbetween molecules, resulting from the factthat, at the site of any given hydrogen atombonded by covalent bonds to a carbon atom,when both of the electrons involved in thebond are located between the hydrogen andthe carbon, the nucleus of the hydrogen pre-sents a positively charged site on the mole-cule. Figure 2-16 depicts this state.
In fact, the two electrons involved in eachhydrogen-carbon bond are in continuousorbital motion around the hydrogen nucleus,so the time during which the positivelycharged nucleus is exposed is very brief andintermittent, and the strength of the charge isrelatively weak. In exactly the same fashion,when one or both of the electrons involved inany given hydrogen-carbon bond are on the
H H H H H HI I I i I I
H - C - C - C - C - C - C - H1 1 1 1 1 1
H H H H H H
Figure 2-15 A single molecule of hexane.
C
H8 +
Figure 2-16 Carbon-hydrogen covalent bond exhibitingpositive charge.
side of the hydrogen nucleus that is awayfrom the carbon atom, a negative charge ispresented to the surrounding environment.At any given instant, then, there is a proba-bility that on each hexane molecule there willbe one or more positively charged sites andone or more negatively charged sites, andthere will be an electrical or magnetic-typeattraction between hexane molecules. Thesecharged sites are much weaker than thoseinvolved in the hydrogen bonding that ischaracteristic of water, however; and for thisreason, hexane is not soluble in water.
Hexane can be emulsified in water, how-ever, and the result is, for practical purposes,equivalent to true solution as far as industrialwaste is concerned. There are at least twoways to accomplish emulsification. One wayis to use an emulsifying agent, such as adetergent. The second way is to mix hexaneand water together vigorously. The mecha-nisms of these two methods for forming anemulsion are explained as follows.
Forming an Emulsion with anEmulsifying AgentFigure 2-17 presents a representation of atypical detergent.
The synthetic detergent molecule shownin Figure 2-17 consists of two active compo-nents: a group that will ionize in water, inthis case the sulfonate group (-S=O-); and agroup that is nonpolar in nature and is there-fore attracted to and soluble in organic mate-rial, such as fats, oils, and greases. Figure 2-18 depicts the process by which detergentmolecules form a link between water andsubstances that are not soluble in water(note—dirt usually adheres to a thin film ofoil on skin, clothing, etc.).
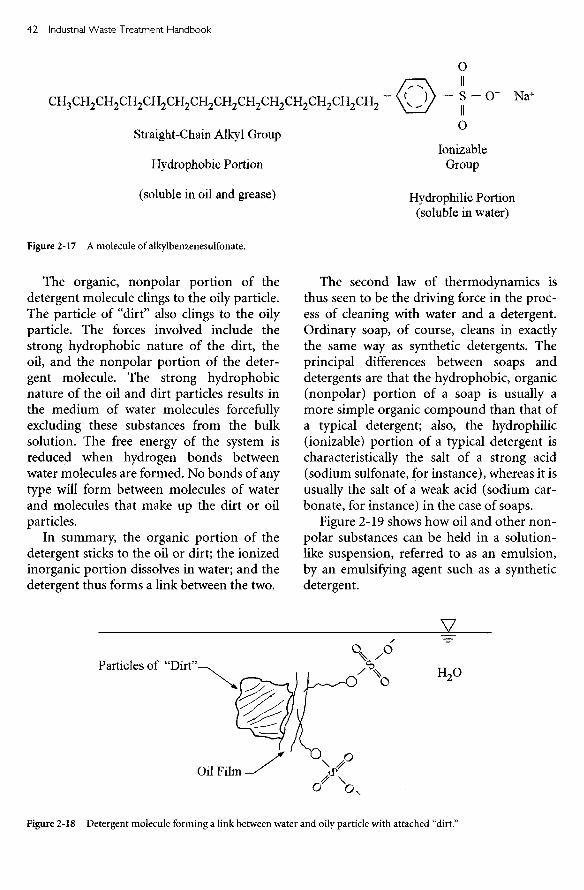
Figure 2-17 A molecule of alkylbenzenesulfonate.
The organic, nonpolar portion of thedetergent molecule clings to the oily particle.The particle of "dirt" also clings to the oilyparticle. The forces involved include thestrong hydrophobic nature of the dirt, theoil, and the nonpolar portion of the deter-gent molecule. The strong hydrophobicnature of the oil and dirt particles results inthe medium of water molecules forcefullyexcluding these substances from the bulksolution. The free energy of the system isreduced when hydrogen bonds betweenwater molecules are formed. No bonds of anytype will form between molecules of waterand molecules that make up the dirt or oilparticles.
In summary, the organic portion of thedetergent sticks to the oil or dirt; the ionizedinorganic portion dissolves in water; and thedetergent thus forms a link between the two.
The second law of thermodynamics isthus seen to be the driving force in the proc-ess of cleaning with water and a detergent.Ordinary soap, of course, cleans in exactlythe same way as synthetic detergents. Theprincipal differences between soaps anddetergents are that the hydrophobic, organic(nonpolar) portion of a soap is usually amore simple organic compound than that ofa typical detergent; also, the hydrophilic(ionizable) portion of a typical detergent ischaracteristically the salt of a strong acid(sodium sulfonate, for instance), whereas it isusually the salt of a weak acid (sodium car-bonate, for instance) in the case of soaps.
Figure 2-19 shows how oil and other non-polar substances can be held in a solution-like suspension, referred to as an emulsion,by an emulsifying agent such as a syntheticdetergent.
Straight-Chain Alkyl Group
Hydrophobic Portion
(soluble in oil and grease)
IonizableGroup
Hydrophilic Portion(soluble in water)
Particles of "Dirt"
Oil Film
Figure 2-18 Detergent molecule forming a link between water and oily particle with attached "dirt."

Figure 2-19 Emulsion by use of an emulsifying agent.
Forming an Emulsion by VigorousMixingFigure 2-20 shows an emulsion of a light oilin water. By vigorous mixing, as with akitchen blender, the oil has been separatedinto very fine droplets. There is an electriccharge on the surface of each oil droplet. Thischarge can be either positive or negative,depending on the type of oil and whicheverions or other substances exist in the waterthat adhere to the surface of the oil droplets,but it is almost always negative.
The fact that the charge is of the same typeon all droplets causes mutual repulsionbetween the droplets. It is this mutual repul-sion that is the source of stability of theemulsion. There are at least two forces at
work that tend to destabilize the emulsionand cause the oil and the water to separateinto distinct phases. Gravity is one force. Ifthe oil is less dense than water, gravity tendsto cause the water to sink below all of the oil,resulting in the oil forming a separate layeron top of the water. Gentle mixing tends tocause the droplets of oil to collide, where-upon the droplets would coalesce untilfinally the oil would form a completely sepa-rate phase over or under the water, depend-ing on its density. If the mutually repulsiveforces caused by similar surface charges onthe droplets are sufficiently strong, the desta-bilizing forces will not prevail, and the emul-sion will remain stable.
Ionized Sulfonate Group
Oil DropletsHydrophobieHydrocarbon Chain
NegativeSurface Charge
Very Small Oil Droplets
Figure 2-20 Emulsion by vigorous mixing.

Colloidal SuspensionsA third type of industrial wastewater mix-ture, in addition to true solutions (pollutantsdissolved in water) and emulsions (pollut-ants suspended in water by emulsification), isthe colloidal suspension. In all three types ofwastewater mixtures, the pollutants are heldin the water medium by electrical forces. Theforces are those of attraction in the case oftrue solutions and are those of repulsion inthe case of both emulsions and colloidal sus-pensions. In fact, colloidal suspensions areessentially identical to emulsions formed byvigorous mixing, described in the previoussection, in that the source of stability for themixture, mutual repulsion by like electriccharges, results from dissociated bonds (i.e.,the resulting sites of attraction and/or cohe-sion). Figure 2-21 illustrates the source ofstability of colloidal suspensions of clay. Fig-ure 2-21 shows the physical structure of clayas an indefinitely extended sheet of crystal-line hydrous aluminum silicate. Many of thechemical bonds within the crystal latticestructure are covalent. This arrangement ofsilicon, aluminum, oxygen, and hydrogenatoms results in a relatively strong negativecharge on each flat surface of the "indefi-nitely extended sheet." This charge attractscations, such as magnesium, aluminum, fer-rous and ferric iron, potassium, and so on,and these cations attract individual sheets
together to make up an indefinitely extendedthree-dimensional structural mass of clay.
When the clay is pulverized into verysmall (colloidal-sized) particles, the pulveriz-ing process amounts to the dissociation ofcountless covalent bonds, whereby each bro-ken bond results in a site having a negativecharge. Each of these sites contributes to anelectric charge surrounding the surface ofeach particle, and if the particles are mixedinto water, the particles repel each other.After the mixing has taken place, threeimportant forces act on the suspension: (1)gravity acts to cause the particles to settle tothe bottom of whatever contains the suspen-sion; (2) Brownian and other forces, referredto as "thermal agitation," keep the particlesin ceaseless motion, tending to make themcollide (these collisions, if successful, wouldresult in coalescence, reversing the dispersalprocess); and (3) repulsive forces caused bylike electric charges on the surface of eachparticle tend to prevent collisions and evensettling caused by the force of gravity. If therepulsive forces are strong enough to over-come the forces of gravity as well as the forcesof thermal agitation, then the particles willbe successfully held away from each other,and the colloidal suspension will be stable.
The principal difference, therefore, be-tween an emulsion and a colloidal suspen-sion as they relate to industrial wastes is that
OxygenHydroxyl GroupSiliconAluminum
Figure 2-21 Source of the negative charge that is present on the surface of particles of clay.
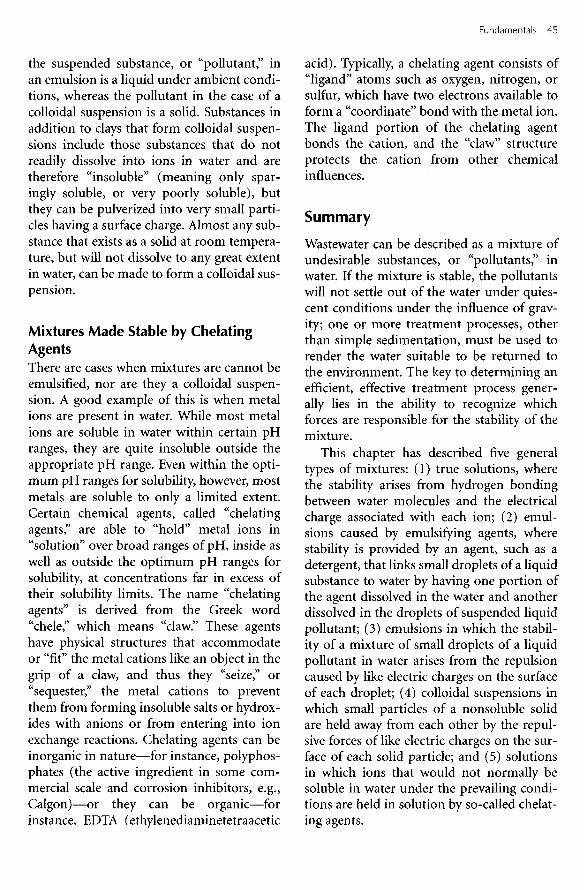
the suspended substance, or "pollutant" inan emulsion is a liquid under ambient condi-tions, whereas the pollutant in the case of acolloidal suspension is a solid. Substances inaddition to clays that form colloidal suspen-sions include those substances that do notreadily dissolve into ions in water and aretherefore "insoluble" (meaning only spar-ingly soluble, or very poorly soluble), butthey can be pulverized into very small parti-cles having a surface charge. Almost any sub-stance that exists as a solid at room tempera-ture, but will not dissolve to any great extentin water, can be made to form a colloidal sus-pension.
Mixtures Made Stable by ChelatingAgentsThere are cases when mixtures are cannot beemulsified, nor are they a colloidal suspen-sion. A good example of this is when metalions are present in water. While most metalions are soluble in water within certain pHranges, they are quite insoluble outside theappropriate pH range. Even within the opti-mum pH ranges for solubility, however, mostmetals are soluble to only a limited extent.Certain chemical agents, called "chelatingagents," are able to "hold" metal ions in"solution" over broad ranges of pH, inside aswell as outside the optimum pH ranges forsolubility, at concentrations far in excess oftheir solubility limits. The name "chelatingagents" is derived from the Greek word"chele," which means "claw." These agentshave physical structures that accommodateor "fit" the metal cations like an object in thegrip of a claw, and thus they "seize," or"sequester," the metal cations to preventthem from forming insoluble salts or hydrox-ides with anions or from entering into ionexchange reactions. Chelating agents can beinorganic in nature—for instance, polyphos-phates (the active ingredient in some com-mercial scale and corrosion inhibitors, e.g.,Calgon)—or they can be organic—forinstance, EDTA (ethylenediaminetetraacetic
acid). Typically, a chelating agent consists of"ligand" atoms such as oxygen, nitrogen, orsulfur, which have two electrons available toform a "coordinate" bond with the metal ion.The ligand portion of the chelating agentbonds the cation, and the "claw" structureprotects the cation from other chemicalinfluences.
Summary
Wastewater can be described as a mixture ofundesirable substances, or "pollutants," inwater. If the mixture is stable, the pollutantswill not settle out of the water under quies-cent conditions under the influence of grav-ity; one or more treatment processes, otherthan simple sedimentation, must be used torender the water suitable to be returned tothe environment. The key to determining anefficient, effective treatment process gener-ally lies in the ability to recognize whichforces are responsible for the stability of themixture.
This chapter has described five generaltypes of mixtures: (1) true solutions, wherethe stability arises from hydrogen bondingbetween water molecules and the electricalcharge associated with each ion; (2) emul-sions caused by emulsifying agents, wherestability is provided by an agent, such as adetergent, that links small droplets of a liquidsubstance to water by having one portion ofthe agent dissolved in the water and anotherdissolved in the droplets of suspended liquidpollutant; (3) emulsions in which the stabil-ity of a mixture of small droplets of a liquidpollutant in water arises from the repulsioncaused by like electric charges on the surfaceof each droplet; (4) colloidal suspensions inwhich small particles of a nonsoluble solidare held away from each other by the repul-sive forces of like electric charges on the sur-face of each solid particle; and (5) solutionsin which ions that would not normally besoluble in water under the prevailing condi-tions are held in solution by so-called chelat-ing agents.

In each of the five cases, the most efficientway to develop an effective treatment schemeis to directly address the force responsible forthe stability of the wastewater mixture.
Examples
The following descriptive examples areintended to show how a working knowledgeof the foregoing fundamental concepts canbe used to quickly deduce the proper tech-nologies for efficiently treating differenttypes of industrial waste streams.
Poultry Processing WastewaterThe processing of poultry involves receivinglive birds and preparing them for retail sale.As shown in Figure 2-22, a typical poultryprocessing operation includes at least sixoperations in which water is used, contami-nated, then discharged, including washdownfor plant cleanup. Several of the operationsinvolve water having direct contact with thebirds as they are being processed (defeath-ered, washed, eviscerated, washed again,chilled, then cut up if desired), leading one toexpect that any and all of the constituents of
Receiving
Killing
Bleeding
Scalding
Defeathering
Washing
Eviscerating
Washing
Chilling
Packing
Washdown at night
Ice Machine
WaterSupply
Storage
RotaryScreen Effluent
Plant Wastewater
Screening toRendering Plant
Cooling Waterto Sewer
Figure 2-22 Schematic of a poultry processing system.

chicken flesh and blood will be found in thewastewater. These substances would beexpected to include blood cells, fats and oils,protein materials, and suspended solids ofvarious makeup, including dirt.
Most of the materials in the wastewaterwould be expected to be organic in natureand therefore biodegradable. For this reason,a biological treatment process, aerobic oranaerobic, would appear to be a good choicefor treatment. Laboratory analysis of thecombined wastewater from a typical poultryprocessing plant, however, as shown in Table2-1, reveals that the oil and grease content isrelatively high. Also, it is reasonable to expectthat much of the biochemical oxygendemand (BOD) would result from the pres-ence of blood. Poultry fat is known to be rel-atively soft and therefore more soluble, espe-cially in hot water, than other animal fats; itwould likely exist in "solution" as a colloidalsuspension, or emulsion. The pertinent indi-cation here is that the fats, oil, and grease(FOG) component of poultry processingwastewater would be relatively slowlydegraded by a biological treatment process.On the other hand, a combined physical/chemical treatment process should workwell, because surface chemistry holds theFOG material in suspension. A gravity sepa-
ration process should work well, once thesuspension is destabilized, by taking advan-tage of surface chemistry phenomena.
A second major component of poultryprocessing wastewater is blood. This is obvi-ous from Figure 2-22, which shows that twoof the major steps in the processing of poul-try are killing followed by bleeding and thatequipment used in these steps is cleaned bywashing with water each day. Because bloodcontains red blood cells, which can bedescribed as large particles that will not trulydissolve in water but will disperse uniformlythroughout a volume of water in which theyare placed, the conclusion is that blood mustform a stable suspension in water. The stabi-lizing force in the suspension of blood ismost likely electric surface charge; therefore,chemical coagulation would quickly come tomind as an efficient method for its removal.
The previous considerations, takentogether with the knowledge that (1) poultryfat has a specific gravity less than 1.0, and (2)red blood cells have a specific gravity veryclose to that of water, indicate that chemicalcoagulation followed by dissolved air flota-tion (DAF) should be a very promising can-didate technology for treatment of poultryprocessing wastewater.
Table 2-1 Characteristics of Raw Wastewater Poultry Processing*
Sampling Point Flow (MGD) BOD (Ib/day) SS (Ib/day) Grease (Ib/day)
Main Drain 0.052 430 460 40
New York Room (excluding feather flush)
Main Drain 0.448 1,680 1,140 850
Processing Room
Evisceration 0.30 910 930 520
Carriage Water
Chiller Overflow 0.05 240 150 90
Chiller Dump 0.09 440 270 115
Scalder Overflow 0.027 200 210 5
ScalderDump 0.015 110 80 2
Washdown (night) 0.36 240 810 750
Total for Plant 0.860 2,850 2,410 1,640
* Data based on a 34-day average; production averaged 72,000 broilers/day.

Wastewater from Metal GalvanizingWastewater from a metal galvanizing processcan be expected to contain dissolved zinc. Aquick check of the properties of various com-pounds reveals that zinc hydroxide, zinc sul-fide, and zinc phosphate are all very poorlysoluble in water within certain ranges of pH.Therefore, treatment of the wastewater usingcaustic, a sulfide compound, or a solublecompound of phosphate would probably beviable candidates for treatment of the waste-water. However, zinc phosphate is seen to bethe least soluble in the acid pH range; there-fore, it would likely produce a sludge thatwould be more stable than either the hydrox-ide or the sulfide. For this reason, wastewaterfrom a galvanizing process would seem to bebest treated by addition of a soluble com-pound of phosphorus (phosphoric acid, forinstance, or super phosphate fertilizer). Afurther check would reveal that the phos-phate compounds of all metals likely to bepresent in wastewater from a galvanizingprocess (iron, lead, nickel, and tin) are allvery poorly soluble in water of low or neutralpH ranges, further indicating treatment withphosphorus as a likely optimal treatmentapproach.
Removal of Heavy Metals fromIndustrial Wastewater ContainingDissolved IronMany industrial wastewaters contain iron aswell as other heavy metals, all of which mustbe removed to one degree or another. It isoften possible to take advantage of two char-acteristics of metal ions: the first being spe-cific to iron, and the second being commonto many metal ions.
Iron is soluble in water in its plus-twovalence state (ferrous form) but is insolublein its plus-three valence state (ferric form).Moreover, the ferrous form can readily beoxidized to the ferric form by contact withatmospheric oxygen (air). Therefore, it iseasy to remove iron from wastewater by sim-ply bubbling air through it (which accom-plishes the conversion of the dissolved fer-
rous ions to insoluble ferric ions); then pro-viding a slow mix time of 5 or 10 minutes toallow flocculation of the ferric oxide parti-cles, then passing the mixture through agravity separation device, such as a tube orplate settler.
It is a characteristic of nearly all heavymetal ions that they are only weakly solublein water and tend to adsorb onto the surfaceof small particulates in suspension wheneverthey are available. Iron floes, precipitated bybubbling air through wastewater containingdissolved ferrous ions, present just such asurface.
On the basis of the above two characteris-tics of metal ions, an extremely simple andinexpensive system, consisting of an aerationstep, a flocculation step, and a sedimentationstep, can be used to remove the ions of manymetal species to concentrations of between 2and 6 mg/L. This often a very worthwhilepretreatment prior to ion exchange or anyother more expensive process; it can then beused to polish the wastewater to very lowconcentrations suitable for discharge. Theinexpensive pretreatment process can greatlyprolong the life of the more expensive pro-cess, resulting in a lower total cost.
Wastewater from a Parts CleaningProcessWastewater from a parts cleaning processwithin an automobile gear manufacturingfacility was shown to contain a high concen-tration of oil, but the oil could not beremoved in a standard API separator (plainsedimentation device). It was determinedthat treatment of this waste stream at thesource was desirable because the FOG loadcontributed by this process to the total wastestream from the manufacturing facility wasso great as to be a cause for failure of themain wastewater treatment facility. Investi-gation of the parts washing process revealedthe presence of a detergent of the sulfonatetype, giving rise to the thought that additionof calcium chloride, an inexpensive sub-stance, would result in the formation of

insoluble calcium sulfonate at the water-sol-uble sulfonate site on the detergent molecule.This caused the oil emulsion, which was sta-bilized by the detergent, to "break," allowingthe droplets of oil to coalesce and then rise tothe surface in the American Petroleum Insti-tute (API) separator, enabling easy removal.
Air Pollution from a Trash IncineratorA trash incinerator burning a mixture ofindustrial and municipal solid wastes wasequipped with a full complement of scrub-bers, electrostatic precipitators, bag house fil-ters, and so on, but was discharging heavymetals in excess of permit limitations. Severaldifferent chemicals had been added to thescrubber solutions, including chelatingagents, but none with success. On the basisthat metal phosphates, in general, areextremely insoluble in water, it was theorizedthat if an inexpensive source of soluble phos-
phates were added to the scrubber solution,the phosphates would react with the metalsto form insoluble precipitates. The scrubberwater could then be recycled with only a rela-tively small blow-down, and the metalswould not pass out of solution and back intothe air being discharged. Ordinary triplesuper phosphate fertilizer, as used by farmersin the area, was determined to be ideal forthis purpose.
Bibliography
Seinfeld, J. H. Air Pollution: Physical andChemical Fundamentals. New York:McGraw-Hill, 1975.
Streitwieser, A., Jr., and C. H. Heathcock.Introduction to Organic Chemistry. NewYork: Macmillan, 1985.

3 Laws and Regulations
Introduction
The plethora of laws, rules, regulations, ordi-nances, and restrictions that regulate the dis-charge of industrial liquid wastes, the man-agement and disposal of industrial solidwastes, and the emission of airborne pollut-ants present a truly formidable challenge toanyone attempting to become knowledgeablein the area of environmental compliance.These environmental laws and regulationsare published in hundreds of documents;and new laws and regulations are written,passed, and promulgated every year by doz-ens of local, county, state, and federal legisla-tive bodies and executive rule-making agen-cies. The great majority of the presentlyenforceable laws and their implementing reg-ulations have been promulgated during thepast 35 years.
History of Permitting and ReportingRequirements
Most states have had regulations forbiddingthe "pollution" of surface water and ground-water since well before the 1950s. Forinstance, the Pennsylvania State Legislaturepassed the Clean Streams Act in 1937, whichcreated the Sanitary Water Board andempowered it to administer the law as inter-preted by the Board and implemented by a"bureau." The Clean Streams Act expresslyprohibited the discharge of industrial wastesto "waters of the Commonwealth," whichincluded groundwater as well as surfacewater. "Industrial waste" was broadly definedas any liquid, gaseous, or solid substance, notsewage, resulting from any manufacturing orindustry. As one of its first items of business,
the Board issued a number of rules, includ-ing a requirement that all facilities for indus-trial waste treatment apply for and begranted a permit before commencing con-struction. The Pennsylvania Department ofHealth served as administrative and enforce-ment agent for the Sanitary Water Board.
Other states had similar laws, which,essentially, made it illegal for an industry todischarge wastes in such a way as to cause thereceiving water to be unhealthful or unus-able. The State of Maine promulgated a set oflaws in 1941 that created a Sanitary WaterBoard and made it illegal to pollute watersused for recreation, among other restrictions.Maine's law, in fact, was similar to Pennsylva-nia's law regarding the intent to protectwaters of the state. As further examples, theState of Illinois enacted legislation in 1929that "establish[ed] a sanitary water board tocontrol, prevent, and abate pollution of thestreams, lakes, ponds, and other surface andunderground waters in the state." SouthCarolina enacted a statute in 1925 that madeit, "unlawful for any person, firm, or corpo-ration to throw, run, drain, or deposit anydye-stuffs, coal tar, sawdust, poison, or otherdeleterious substance or substances in any ofthe waters, either fresh or salt, which are fre-quented by game fish, within the territorialjurisdiction of this State, in quantities suffi-cient to injure, stupefy, or kill any fish orshellfish, or be destructive to their spawn,which may inhabit said waters."
In fact, almost all the states had laws simi-lar to those of these four states prior to 1950.However, because each of the states' environ-mental regulatory agencies had limitedresources, and these limited resources werefocused, for the most part, on wastes from

municipalities, little (but nonetheless some)enforcement against industries took place.
Involvement of the federal government inprosecuting industries for pollution has aremarkably limited history prior to the 1970sand the creation of the U.S. EnvironmentalProtection Agency (the EPA) in 1970. Priorto 1948, when Congress passed the FederalWater Pollution Control Act (FWPCA), theonly legislation under which a discharger ofpollutants could be prosecuted was theRefuse Act of 1899 (Section 13 of the Riversand Harbors Act). In 1956, Congress enactedthe FWPCA, thus establishing the first fed-eral water quality law. This law was amendedseveral times, including the Water QualityAct of 1965, the Clean Water Restoration Actof 1966, and the Water Quality ImprovementAct of 1970. Here, again, however, despite thereality of federal laws, actual prosecution ofindustries for polluting was very limitedbefore the 1970s.
Development of the intense regulatory cli-mate that industrialists must operate withinduring the 2000s began with passage of the1972 amendments to the Clean Water Act,Public Law 92-500 (PL 92-500), whichreplaced the entire language of the original1956 Water Quality Act, including all amend-ments. This comprehensive legal milestonehad the broad objective of returning all bod-ies of water in the United States to a condi-tion in which they could be safely and enjoy-ably fished and swum within a few years ofpassage of the law itself. Specifically, anational goal was established to eliminate thedischarge of pollutants into the navigablewaters by 1985. A national interim goal wasestablished that, wherever attainable, waterquality would provide for the protection andpropagation of fish and provide for recre-ation in and on the water by July 1, 1983.Many rivers, streams, and lakes in 1972 werevirtually open sewers, and it was rare that anysignificant water body within the bounds ofcivilized development was not polluted,owing to the lack of enforcement of existinglaws at the federal and state level.
As an example of the prevailing attitudetoward clean water during the 1940s, a foot-bridge was built across a major river so work-ers could walk from a town to a large inte-grated pulp and paper mill in the Northeast.A garbage chute was built into the side of thefootbridge as a convenience to these workersso they could carry bags of household trashand garbage on their way to work and simplydrop them into the river.
There is, however, a tendency to overex-trapolate the apparent indifference towardpollution of the environment that prevailedprior to the 1970s. Synthetic organic chemi-cals with a high degree of toxicity were notwidely available and not widely recognized asa threat to environmental quality before the1960s. The prevailing thought was that allgarbage and other household wastes werebiodegradable and would ultimately "disap-pear" by, eventually, simply being incorpo-rated into the environment "from whence itcame." The Superfund sites and other prob-lems of gross environmental degradation ofthe 1980s and 1990s for the most partinvolved the historical release and disposal ofsynthetic chemicals and other hazardoussubstances such as PCBs, pesticides, herbi-cides, and other chlorinated hydrocarbons.
In addition to the unacceptable state ofthe nation's waterways, a significant portionof the nation's groundwater became contam-inated by the unregulated disposal of solidand liquid wastes in open, unlined dumps.Much of this material was toxic. Beginning inthe 1980s, a number of lawsuits and federaland state environmental enforcement actionswere brought against industries whose wastedisposal practices resulted in contaminationof groundwater supplies that served entirecities.
The uncontrolled emission of air pollut-ants has also degraded the quality of air inthe United States to the point where signifi-cant numbers of people with respiratory ill-nesses have been pushed to the point ofdeath, and many thousands of others havesuffered health impairment. Visibility has

become substantially reduced in manyregions of the country. It has even reachedthe point where nations have threatened legalaction against other nations because massivequantities of air pollutants have crossedinternational boundaries. As with the qualityof the nation's water resources, a low pointwas reached during the 1970s and 1980s. Dueto the installation and operation of air pollu-tion control technologies at industrial facili-ties and in motor vehicles, the overall qualityof air in most regions of the United States hasimproved. There are still many regions of theUnited States, however, that are consideredto be in "nonattainment" of specifiednational air-quality standards, and thus thebusiness of air-quality protection is a robustone.
Water Pollution Control Laws
The foundation of all federal, state, and localwater pollution control laws and regulationscontinues to be PL 92-500, the 1972 amend-ments to the FWPCA, commonly referred toas the Clean Water Act. Prior to passage ofthis watershed legislation, water pollutioncontrol laws were based on an approach thatfocused on water-quality standards and efflu-ent limitations tailored to those standards.The degree of treatment required of a givenindustrial discharger depended upon theassimilative capacity of the receiving waterbody. The foundation of this approach wasthat the "solution to pollution is dilution,"and the amount of dilution available was thebasis of the degree of treatment required.One doctoral thesis, written during the late1960s, used dissolved oxygen monitors in ariver to control a valve to regulate the rate ofdischarge from an industrial facility. Theflow of treated industrial wastewater to theriver was from a reservoir into which theeffluent from the treatment plant flowed.Treated wastewater would build up in vol-ume in the reservoir when the allowable dis-charge to the river was low, and the reservoirwould be discharged into the river during
periods of times when the allowable dis-charge rate (as indicated by a relatively highconcentration of dissolved oxygen in theriver) was high.
The approach used in developing modernenvironmental policy, which is found in theClean Water Act and its implementing regu-lations, was to require equal treatment by alldischargers, regardless of the assimilativecapacity of the receiving water. The assimila-tive capacity of the receiving water took on adifferent role, which was that of an indicatorof minimum degree of treatment required, asopposed to its former role as an indicator ofmaximum degree of treatment required. Themodern use of mathematical water-qualitymodels is to determine whether the "categor-ical pretreatment standard" for a specifiedindustrial waste stream will ensure that thewater body never violates legislated water-quality standards. If the model indicates apotential water violation, additional treat-ment is typically required. Accordingly,under the Clean Water Act, no pollutant maybe discharged that would interfere with theattainment or maintenance of water-qualitystandards or cause the water body to fail toattain its designated uses.
PL 92-500 has been amended severaltimes since 1972; it is a comprehensive lawthat is difficult to summarize in a few pages.Some of the more important requirementsare identified in the following statements:
• All dischargers must have a permit underthe National Pollutant Discharge Elimi-nation System (NPDES). The permit hasthree major parts: (1) effluent limita-tions, (2) compliance schedules, and (3)monitoring and reporting requirements.
• All dischargers must meet applicablerequirements for: effluent limitations;standards of performance; toxic and pre-treatment effluent standards; and moni-toring and self-reporting (dischargemonitoring reports or DMRs).
• Each industry has been classified underthe Standard Industrial Classification

(SIC). One of the principal purposes ofthe CWA is to maintain a baseline set ofminimum requirements among indus-tries of the same type, so as to prevent acompetitive disadvantage on the part ofany individual industrial plant. The EPAhas developed national standards of per-formance for most industrial categories;these standards are designed to reflectthe application of the best-availabledemonstrated control technology.
• Individual states are authorized to adoptand enforce their own laws to regulatedischarge of pollutants, which may bemore restrictive than the correspondingfederal effluent limitation, standard ofperformance, or toxic pretreatment stan-dard in effect.
• Within most every SIC category, a study,leading to production of a guidance doc-ument called a "development docu-ment," has been carried out. Eachdevelopment document identifies typicalcharacteristics of wastewater from thatindustry, discusses methods for mini-mizing waste production, and definesachievable as well as acceptable levels ofwastewater treatment.
• Penalties for noncompliance are setforth.
• Industries that discharge to publiclyowned treatment works (POTWs) areregulated by the so-called PretreatmentRegulations. The EPAs General Pretreat-ment Regulations are promulgated underTitle 40 of the Code of Federal Regulations(C.F.R.), Part 403, and the CategoricalPretreatment Regulations are found at 40C.F.R., Parts 405 through 471.
• Receiving waters for which the provi-sions of PL 92-500 are applicable includeall rivers, streams, brooks, creeks, lakes,ponds, bogs, swamps, and territorial seaswithin the three-mile limit, as well aswetlands, drainage ditches, and intermit-tent streams. In short, if a receiving bodyof water has a free surface that is open to
the atmosphere, it is wise to assume thatthe provisions of PL-92-500 apply.
• Discharge of toxic pollutants is regulatedunder separate provisions from dis-charge of conventional pollutants.
• In 1983 an amendment was enacted thatrequired each state to adopt an antideg-radation policy, known as "antibackslid-ing," which prohibits the relaxation ofany permit limitation unless one of thespecified exceptions is applicable.
• Nonpoint sources of pollution, includ-ing stormwater runoff from industrialsites, municipal stormwater systems, andconstruction projects over one acre insize, are now regulated under so-calledPhase I and Phase II stormwater regula-tions.
• Combined sewer overflows (CSOs) areregulated.
• Development and implementation ofarea-wide waste treatment managementplans are authorized.
• Water-quality standards are establishedfor water bodies and for water bodiesthat are considered "impaired," andimplementation plans for achievingthose standards are required.
• If the desired quality in the receivingwater (water-quality standard) cannot beachieved by the so-called "categoricaleffluent limitations" for a given dis-charger, additional treatment is required.
• New sources are held to more restrictivedischarge limitations than existingsources—that is, sources that were inexistence and in operation at or prior tothe promulgation of the applicable efflu-ent limitation, standard of performance,or applicable pretreatment standard.
• Before a federal NPDES permit can begranted, the industry must obtain a statecertification to ensure compliance withapplicable water-quality requirements.
• States can be delegated the authority toissue and administer NPDES permits bythe EPA.

Each state has its own body of water pol-lution control laws. Any individual state'slaws and/or regulations can be more restric-tive than the comparable federal law or regu-lation.
Groundwater Pollution ControlLawsby Adam SteinmanWhereas PL 92-500 is primarily addressed toprotection of the quality of waterways, otherlaws have been enacted that have protectionof the ground, the groundwater, and the airas primary objectives. The primary federallaw that is addressed to protection of boththe groundwater and the ground itself is theResource Conservation and Recovery Act(RCRA) (PL 94-580), passed by the U.S.Congress in 1976. RCRA Subtitle C estab-lishes a federal program to manage hazard-ous waste from "cradle to grave" through anextensive set of rules that regulates the identi-fication, storage, treatment, manifesting/transportation, and disposal of hazardouswastes. RCRA thereby restricts activities thatwould lead to pollution of the ground,directly, and the groundwater, via the forma-tion of leachate and subsequent percolationdown through the soil to the groundwater.RCRA also protects the groundwater bystrictly regulating and licensing hazardouswaste Treatment, Storage, and Disposal(TSD) facilities.
RCRA, as amended, along with its imple-menting regulations, also defines the termhazardous waste and identifies substances towhich this term is to be applied (40 CRR.Part 261). These definitions are discussed inChapter 6 of this text. Disposal of all "solidwastes" (the term includes solid wastes, liq-uid wastes, and contained gases) that aredetermined to be hazardous wastes (by char-acteristic or listed) can be done only asallowed in the provisions of RCRA.
RCRA completely replaced the SolidWaste Disposal Act of 1965 and supple-mented the Resource Recovery Act of 1970.
RCRA was amended extensively in 1980 andagain in 1984 by the Hazardous and SolidWaste Amendments (HSWA).
The principal objectives of RCRA are to:
• Promote the protection of human healthand the environment from potentialadverse effects of improper solid andhazardous waste management
• Conserve material and energy resourcesthrough waste recycling and recovery
• Reduce or eliminate the generation ofhazardous waste as expeditiously as pos-sible
RCRA authorizes the EPA to regulate thegeneration, management, treatment, stor-age, transportation, and disposal of hazard-ous wastes, solid wastes, and undergroundstorage tanks. This authorization is put forthin the form of nine subtitles (A-I), three ofwhich contain the specific laws and regula-tions that industrial facilities must operate incompliance with. Subtitles C and D containthe programs for hazardous wastes and non-hazardous wastes, respectively. Subtitle I con-tains the program for underground storagetanks.
Subtitle C authorizes the EPA to:
• Promulgate standards governing hazard-ous waste generation and management
• Promulgate standards for permittinghazardous waste treatment, storage, anddisposal facilities (TSDs)
• Inspect hazardous waste managementfacilities
• Enforce RCRA standards• Authorize states to manage the RCRA
Subtitle C program, in whole or in part,within their respective borders, subjectto EPA oversight
Through RCRA, as amended, each state isboth required and authorized to set up andadminister regulations that govern the gener-ation, management, and disposal of all sub-stances that fall within the definition of "haz-ardous waste."

The 1984 Hazardous and Solid WasteAmendments (HSWA) to RCRA addedrequirements for the handling and disposalof present wastes and regulated the cleanup(site investigation and corrective action)resulting from past disposal of solid (includ-ing hazardous) wastes.
The Comprehensive EnvironmentalResponse, Compensation, and Liability Act(CERCLA) and the 1986 Superfund Amend-ments and Reauthorization Act (SARA) arelaws in addition to RCRA and HSWA uponwhich solid (including hazardous) wastes areregulated. CERCLA and SARA provide forand regulate the cleanup and restoration ofabandoned hazardous waste disposal sites.
Among the more prominent provisions ofRCRA is the requirement to document thetransportation and ultimate disposal point ofall hazardous wastes through a comprehen-sive manifest system. Known as "cradle tograve" documentation, this section of RCRArequires that a manifest, or written record,accompany all hazardous wastes from theirgeneration to disposal. An example manifestis shown in Chapter 6. RCRA's core regula-tions establish the "cradle to grave" programthrough the following major sets of rules:
• Identification and listing of regulatedhazardous wastes (40 CRR. Part 261)
• Standards for generators of hazardouswastes (40 CRR. Part 262)
• Standards for transporters of hazardouswastes (40 CRR. Part 263)
• Standards for owners/operators of haz-ardous waste treatment, storage, and dis-posal (TSD) facilities (40 CRR. Parts264, 265, and 267)
• Standards for the management of spe-cific hazardous wastes and for specifictypes of hazardous waste managementfacilities (40 CRR. Part 266)
• Land disposal restrictions (40 CRR. Part268)
• Requirements for the issuance of permitsto hazardous waste facilities (40 CRR.Part 270)
• Standards and procedures for authoriz-ing state hazardous waste programs to beoperated in lieu of the federal program(40 CRR. Part 271)
The EPA may authorize a state to adminis-ter and enforce its hazardous waste programin lieu of the federal Subtitle C program(pursuant to Section 3006 of RCRA). For astate to receive authorization for its program,its rules must:
• Be consistent with and no less stringentthan the federal program
• Provide adequate enforcement to ensurecompliance with Subtitle C requirements
In practical terms, state programs mustfollow the same general approach and be atleast as stringent as federal hazardous wasterules. State law must include penalties thatare at least equal to federal penalties(although the penalties do not have to beidentical); and state enforcement activitiesmust be equivalent to those performed by theEPA. Because state rules can be more strin-gent than federal rules, and each state's rulesare somewhat different, large corporationsthat have manufacturing plants or otherfacilities in more than one state must makeaccommodations for the differences.
States have generally received authoriza-tion incrementally, consistent with the grad-ual implementation of the federal RCRA pro-gram. This is due to the unavoidable lagbetween federal promulgation of Subtitle Cstandards and adoption of similar standardsby the states. Consequently, a state may beauthorized to administer and enforce its pro-grams regulating certain types of waste man-agement units and practices within the statebut may not be authorized for other types ofunits. Typically, states are more likely to beauthorized to enforce rules adopted pursuantto RCRA than rules adopted pursuant toHSWA. As a result, some facilities in a statemay be subject to state enforcement, whileothers are subject to federal enforcementthrough EPA regional offices. Some facilities

may be subject to joint federal/state enforce-ment.
Some federal rules do not apply in a statewith an authorized program until the stateadopts those federal rules. Federal rules thatare adopted under HSWA apply as a matterof federal law when they are promulgated,even if a state's rules have not incorporatedthem. However, only the EPA may enforcethese rules.
In general, where a facility is subject tojoint federal/state authority, complianceinspections may be conducted by the EPA,the state, or both.
Any industrial establishment that gener-ates hazardous wastes and intends to disposeof some or all of them on the land is subjectto certain requirements referred to collec-tively as "land disposal restrictions" (LDRs).AU waste generators are required to deter-mine the concentrations of certain constitu-ents in their wastes. Depending on the con-stituents present, and their concentrations,the generators may be required to treat theirwastes, or the residues from treatment ofthese wastes, using certain specified technol-ogies. This requirement, referred to as the"Universal Treatment Standards," is con-tained in 40 CRR. §268.42. In order to deter-mine which treatment standard is applicable,the generator must determine whether or nota listed waste exhibits any characteristic (40CRR. §262.11 [c]) and, if it does, whether thelisted waste treatment standard specificallyaddresses the characteristic. For example,F005 wastes are listed for both toxicity andignitability. For treatment standard purposesunder 40 CRR. Part 268, the waste must beconsidered as F005/D001, because the F005treatment standard does not specificallyaddress ignitability.
If a waste is restricted, the generator mustcertify, on a land disposal restriction notifi-cation form that accompanies the hazardouswaste manifest, whether it:
• Meets applicable treatment standards orexceeds applicable prohibition levels atthe "point of generation"
• Can be land-disposed without furthertreatment
• Is subject to a "national capacity vari-ance" or a "case-by-case extension"
A generator of a hazardous waste may notrely on transporters or TSD facilities to makedeterminations regarding land disposalrestrictions on the wastes they generate. Theregulations are clear that the responsibilityfor these determinations rests solely with thegenerators themselves. Although this doesnot appear to be a widely known or appreci-ated reality, it is very important. If a trans-porter or TSD facility neglects to make adetermination, or makes an incorrect deter-mination, it is the generator who is subject toenforcement for violating LDR rules. If afacility treats hazardous waste to meet appli-cable treatment standards, it must developand make available a written waste analysisplan. The plan must describe how the proce-dures it uses results in compliance with theLDRs (40 CRR. §268.7 [a][4]).
The LDRs prohibit dilution from beingused in any way to achieve compliance withany of the requirements or restrictions. TheLDR dilution prohibition states that:
1. No one shall in any way dilute arestricted waste, or residual from treat-ment of a restricted waste, as a substitutefor adequate treatment to achieve com-pliance with Subpart D, to circumventeffective dates, or to circumvent a statu-tory prohibition under RCRA §3004.
2. Dilution of wastes that are hazardousonly because they exhibit a characteristicin a treatment system that subsequentlydischarges pursuant to a permit issuedunder §402 of the CWA or pretreatmentof waste discharged under §307 of theCWA, or dilution of D003 reactive cya-nide waste, is permissible unless a spe-cific treatment method is specified as thetreatment standard at 40 CRR. §268.42.
For instance, if a waste is hazardous onlybecause it is an acid and therefore exhibits

the characteristic of corrosivity, and if thatwaste stream is subsequently treated in a sim-ple pH neutralization system and then fur-ther treated in a treatment system that dis-charges under a CWA permit, mixing thatwaste with other waste streams does not con-stitute prohibited dilution under LDR regu-lations. Furthermore, the residuals from thattreatment system do not, for reasons of onlythe acid waste stream, have to be managedunder LDR regulations. However, if thatsame acid waste stream also contains cad-mium in concentrations that exceed applica-ble prohibition levels, then it does fall under40 CRR. §268.3 and cannot be diluted in anyway to achieve compliance with Subpart D.However, one of the specific exceptions tothe dilution prohibition is that it is permissi-ble to combine waste streams for centralizedtreatment if appropriate treatment of thewaste is occurring. Therefore, if the central-ized wastewater treatment plant has one ormore processes that are specifically designedand operated to remove cadmium (as well asother heavy metals), combining the wastestreams is not considered inappropriate orprohibited under LDRs.
Air Pollution Control Laws
GeneralThis section presents, first, a brief history ofthe development of air pollution control lawsand regulations, as well as a synopsis of theprovisions of each of the major laws. Then asynopsis of the laws and regulations that werein effect as of the year 2005, including adescription of the major requirements of theClean Air Act (CAA) that are pertinent to theregulations of air emissions from industrialfacilities, as affected by those regulations, ispresented.
Prior to 1963, the only federal law underwhich an industrial facility could be penal-ized or otherwise required under law to con-trol (manage) discharges to the air was undereither general nuisance statutes or publichealth laws. General nuisance laws had their
roots in the 600-year-old rule of commonlaw—"sic utere tuo, ut alienum non laedas"(use your own property in such a manner asnot to injure that of another) {Black's LawDictionary, 1551 [4th ed., 1951]).
Federal involvement in air pollution con-trol had humble beginnings in 1955, withpassage of the Air Pollution Control Act of1955, Public Law 84-159. This act was verynarrow in scope, and, because of the reluc-tance of Congress to encroach on states5
rights, considered prevention and control ofair pollution to be primarily the responsibil-ity of state and local governments. In 1955,the federal government considered itself aresource, as opposed to an enforcer, and thisperception was reflected in the provisions ofthe Air Pollution Control Act, which were asfollows:
• The Public Health Service was mandatedto initiate research on the effects of airpollution
• There were provisions for:
— Technical assistance to the states— Training of individuals in the area of
air pollution— Research on air pollution control
Although modest in its impact at the time,the 1955 law served as a wake-up call to statesthat air pollution was to be taken seriouslyand that enforceable laws regulating emissionof pollutants would be forthcoming.
The 1955 law was amended in 1960 to theextent that it directed the Surgeon General toconduct research into the health effects ofautomobile exhaust. A report was submittedin 1962, and, as a result, the 1955 law wasfurther amended to require the SurgeonGeneral to conduct still more research. Theresult of the further research was the CleanAir Act of 1963, Public Law 88-206 (CAA),which has been amended several times, themost dramatic (in fact, earth-shaking) beingthe 1970 amendments, the 1977 amend-ments, and the present, prevailing law, the1990 amendments.

The Clean Air Act of 1963 provided for:
• A stepped-up research and training pro-gram
• A matching grants program, wherebystates and local agencies would receivefederal assistance in promulgating airpollution regulation
• The development of air-quality criteria• Federal authority to require abatement
of interstate flow of air pollutants
The 1963 Clean Air Act designated sixpollutants as "criteria pollutants," thought tobe the most important substances affectingthe public's health and welfare. These criteriapollutants, still regarded as such in the year2005, are as follows:
• Sulfur dioxide (SO)• Nitrogen oxides (NOx)• Carbon monoxide (CO)• Lead (Pb)• Ozone (O3)• Particulate matter (Pm)
The 1970 amendments established thebasic framework for regulation of air emis-sions and air quality from the time of itsenactment through 2005. The 1970 amend-ments authorized the EPA to establishNational Ambient Air Quality Standards(NAAQS) to "protect the public health" and"public welfare." Following promulgation ofan NAAQS, states are required to developplans (State Implementation Plans) to attainand maintain compliance with the NAAQS.If a state fails to submit a sufficient plan, theEPA promulgates a plan for the state. The1970 amendments also authorize the EPA toestablish emission standards for categories ofsources that, in the EPAs judgment, cause orcontribute significantly to air pollution.Under this authority, the EPA has promul-gated standards (New Source PerformanceStandards) for dozens of categories ofsources (e.g., electric utility steam-generatingunits; industrial, commercial, institutional
steam-generating units; sewage treatmentplants; and kraft pulp mills).
The 1977 amendments provide the EPAwith the additional authority to developemission standards for categories of existingsources of hazardous air pollutants. Underthis authority, the EPA promulgated rela-tively few National Emission Standards forHazardous Air Pollutants (NESHAPs). Theslow rate of progress for developing NES-HAPs was one of the primary drivers forenactment of Title III of the 1990 amend-ments (discussed in the sections that follow).
The 1977 amendments established new airpermitting requirements for the constructionof new major sources or major modificationsto existing sources. The applicable permit-ting requirements depend on whether or notan area experiences air quality not meetingNAAQS, in which case it is considered a"nonattainment area." New major sourcesand major modifications in attainment areasare subject to Prevention of Significant Dete-rioration (PSD) requirements. In short,under PSD, a facility is required to obtain apreconstruction permit from the EPA or astate with an EPA-approved PSD program.To obtain a permit, the proposed sourcemust demonstrate that the new emissionswill receive Best Available Control Technol-ogy (BACT) and that the emissions, in con-junction with other nearby sources, will notcause or contribute to an exceedance of theNAAQS. BACT is considered the best level ofcontrol that is technically and economicallyfeasible. In nonattainment areas, new majorsources and major modifications must dem-onstrate that emissions will receive the Low-est Achievable Emission Rate (LAER), whichis essentially the lowest level of emissionattained in practice by a similar source.Unlike BACT, LAER does not consider eco-nomic feasibility. In addition to LAER, thenew source or modification must obtain off-sets, which are emission reductions fromother facilities in an amount equal to orgreater than the proposed emissionsincreases.

The 1990 amendments to the Clean AirAct made additional sweeping changes, espe-cially with regard to industrial sources. TitleV established a new operating permittingsystem that had the effect of permanentlychanging the way environmental managersin industry must do their jobs. Among themajor provisions of Title V are monitoringand reporting requirements that are greatlyexpanded, compared with previous require-ments. It is now required to identify all "reg-ulated pollutants" emitted by a facility, tomonitor emissions (continually or periodi-cally), to operate the equipment in compli-ance with standards written into the permit,and to certify compliance with all standardsin the permit on an annual basis.
In addition to the new permitting, moni-toring, and reporting requirements, thenumber of designated hazardous air pollut-ants or air toxics (Title III) was increased to189 and subsequently (in 1999) reduced byone to 188. Also, significant changes weremade regarding nonattainment areas, emis-sions from automobiles (Title II), acid rainprovisions (Title IV), and stratosphericozone production provisions (Title VI), all ofwhich are pertinent to the job of the indus-trial environmental manager.
Air Pollution Control Law, as of theYear 2005Major sources of criteria pollutants and haz-ardous air pollutants (HAPs) are regulated bythe Clean Air Act as amended in 1990 and asadministered by state or local air-qualitymanagement agencies in which the industryoperates. Some industrial establishmentsmay be regulated by one or more state oragency requirements that are more restrictivethan the CAA. The federal government,through the EPA, issues regulations thatmust be followed by the administratingauthorities and oversees that administration.
As prescribed by the CAA, as amended,the EPA is charged with setting NationalAmbient Air Quality Standards (NAAQSs), aprocess that began in the 1970s and under-
goes revision periodically. Each state hasdeveloped a state implementation plan (SIP)to attain those standards.
Industrial establishments, referred to as"sources," are categorized as a "major source"if their air emissions exceed certain specifiedamounts. The specified amounts are differ-ent, depending on whether or not the sourceis in an attainment area or a nonattainmentarea, and on whether that nonattainmentarea has been designated as either "mar-ginal," "moderate," "serious," "severe," or"extreme," or if the source is located in a des-ignated "ozone transport region." For pur-poses of PSD preconstruction permittingrequirements under Title I, a source is cate-gorized as "major" in an attainment area if itis in one of 27 listed categories and emits, orhas the potential to emit, 100 tons per year(tpy) or more of any criteria pollutant. If it isnot in one of the 27 listed categories, thesource is major if it emits, or has the poten-tial to emit, 250 tpy or more of any criteriapollutant. Sources in nonattainment areashave lower major source thresholds depend-ing on the nonattainment designation. Forpurposes of operating permit requirementsunder Title V, a source is major if it emits, orhas the potential to emit, 100 tpy of any regu-lated pollutant, or lesser amounts in certainnonattainment areas. Further, a source isconsidered major for both Title V permittingand for purposes of hazardous air pollutant(HAP) regulation under Title III if it emits,or has the potential to emit, 10 tpy or moreof any single HAP or 25 tpy or more of allHAPs combined. Major sources have signifi-cantly more requirements regarding applyingfor and operating under a CAA permit thando nonmajor sources. If a source is subject tonew source performance standards (NSPS),is subject to national emissions standards forHAPs (NESHAPs), or is an "affected source"subject to the acid rain program under TitleIV, it also has significantly greater require-ments.
For industries in one of the 27 listed cate-gories, "fugitive emissions" are to beincluded in the emission totals. "Fugitive

emissions" are those that issue from openwindows and doors; cracks in buildings orductwork; or, in general, via any outlet otherthan a stack, vent, or other device specificallydesigned and built to discharge substances tothe air.
It is possible for industrial establishmentsto avoid major source classification and thusbecome a "synthetic minor source" by agree-ing to limit emissions to below the desig-nated maximums (even though they have thepotential). Some states have actively encour-aged such agreements in order to reduce theconsiderable cost of administrating andenforcing the air permitting program.
The CAA is organized into 11 titles, 6 ofwhich (listed below) are of direct concern tothe industrial environmental manager.
• Title I, Attainment and Maintenance ofNational Ambient Air Quality Standards(NAAQS)
• Title III, Air Toxics Control• Title IV, Acid Rain Control• Title V, Permits and Reporting• Title VI, Stratospheric Ozone Protection• Title VII, Enforcement
The following paragraphs present a syn-opsis of the provisions of each of these sixtitles that are of most concern to the indus-trial environmental manager.
Title I, Attainment and Maintenance ofNational Ambient Air QualityStandards (NAAQS)If an industrial facility is located in a nonat-tainment area, the classification of that areahas a significant influence on the financialburden that facility must bear to maintaincompliance with requirements of the CAA.For instance, if an industrial plant is locatedin an ozone nonattainment area classified as"moderate," it will be subject to "reasonablyavailable control technology" (RACT)requirements if it emits more than 100 tonsper year of volatile organic compounds(VOCs). If the same plant is located in a non-
attainment area classified as "extreme," it willbe subject to RACT requirements if it emitsmore than 10 tons per year of VOC emis-sions. The basic structure for designations onnonattainment areas resides in Title I.
Simply put, an area is designated as "non-attainment" if the ambient air is not of aspecified quality. Nonattainment, then, refersto a deficiency in quality regarding one ormore specific substances. If an area is desig-nated as nonattainment in particulate matter,that situation may be of little consequence toan industry having no significant particulatematter emissions. The opposite is equallyimportant; an industry having significantparticulate emissions would be well advisednot to locate in this area.
Title III, Air Toxics ControlThe requirements of Title III, control of haz-ardous air pollutants, include limiting therelease of 188 substances referred to as "airtoxics." The approach that Congress adoptedin writing and promulgating the require-ments of Title III was to mandate the pub-lishing by the EPA of emission standards foreach of the 188 hazardous substances, basedon what could reasonably be expected to beachievable by the best technology available. Itwas intended that the EPA would issue thenational standards for significant sources for40% of the source categories by November15, 1992; another 25% of source categoriesby November 15, 1994; another 25% byNovember 15, 1997; and the remaining byNovember 15, 2000. Compliance with thesenational standards was to be complete withinno more than three years of issuance of thestandards (facilities are allowed to delaycompliance for up to six years if they reduceemissions before standards are issued).
Maximum Achievable ControlTechnology (MACT)Under Title III, MACT can include processchanges, materials substitutions, enclosures,and other containment strategies, as well asactive treatment for pollutant removal.

Record keepingIndustrial facilities permitted under Title Vand subject to the requirements of Title IIImust keep records of processing and moni-toring for at least five years and retain themon site for at least two years.
Title IV, Acid Rain ControlStrategies that are being pursued for the pur-pose of acid rain control are based on therealization that the mobility of the acidiccompounds in the atmosphere, which resultfrom emissions of sulfur and nitrogen oxides,make acid rain impossible to control on alocal basis. The essence of these strategies isto achieve reduction of SO2 emissions by useof a market-based approach, and NOx emis-sions through emission limits. For instance,sources that generate heat and/or power byburning coal are allocated certain "allow-ances" regarding SO2 emissions. The allow-ances that have been allocated were done sowith the goal of reducing annual emissions ofSO2 by 10 million pounds from 1980 levelsnationwide. What is unique about the acidrain reduction approach is that the allow-ances can be bartered (bought and sold on amarket). If a given source emits less than theallowance, it can sell the excess or "bank" itfor future use.
A given source has the options of selectinglow-sulfur fuel, making use of emissiontreatment technologies, or buying allowancesfrom another source to meet its own allow-ance. A given source can also sell excessallowance that it has obtained by selectinglow-sulfur fuel, for instance, to reduce thenet cost of the selected option.
NOx emission limits are levied on thecoal-burning, electricity-generating units,with the nationwide goal of reducing NOx
emissions by 2 million tons a year from 1980levels. The strategy is to achieve attainmentof acid rain control goals through the emis-sion limits, then to institute an allocationbartering system similar to that in use for
SO2 emissions to achieve regional ozone levelissues if necessary.
Title V, Permits and ReportingThe requirements that pertain to applyingfor, obtaining, and operating within compli-ance of air discharge permits is a major con-cern of the industrial environmental man-ager. Either the states or the EPA can enforcethe permits. The cost of administration isrecovered through a fee system, throughwhich each permitee pays not less than $25per ton of regulated pollutant (excluding car-bon monoxide). This fee can be adjustedeach year, based on the consumer priceindex.
ApplicationEach state has developed standard forms forapplying for air discharge permits. The formsdiffer somewhat from state to state, but, inaccordance with Title V, certain "key ele-ments" must be included. One key element isidentification and description of each andevery emission point. Also required are acomplete list of regulated substances to bedischarged; compliance and monitoringplans; an assessment of past compliance,alternative operating scenarios; and identifi-cation and description, including location, ofany and all air pollution control equipment.Determination of whether or not the sourceis "major" is one of the most importantrequirements of the application.
Regulated Air PollutantsThe substances that are regulated under theCAA include the six criteria pollutants thatwere originally regulated under the CAA of1963 (sulfur dioxide, nitrogen oxides, carbonmonoxide, lead, ozone, and particulate mat-ter) and volatile organic compounds(VOCs), as well as those substances alreadyregulated under new source performancestandards (NSPS), which include hydrogensulfide, reduced sulfur compounds, totalreduced sulfur, sulfuric acid mist, dioxin/

furan, fluorides, and hydrogen chloride. Inaddition, 188 hazardous air pollutants areregulated on a "technologically achievable"basis, including substances that depleteozone and those chemicals that are subject tothe accidental release provisions.
National Emission Standards forHazardous Air Pollutants (NESHAPs)NESHAPs are addressed directly in Title III,and are very important regarding completionof the permit application. In the case ofmajor sources, the NESHAPs becomeMACTs, "maximum achievable control tech-nologies." In the case of small or area sources,they become GACTs, "generally availablecontrol technologies." These control technol-ogies are intended to reduce emissions ofeach of the 188 designated HAPs. Affectedsources are generally given three years tocomply with a newly promulgated MACTstandard. If the EPA has not issued a MACTstandard for a particular type of majorsource, then the state permitting authoritywill determine MACT for that source on acase-by-case basis.
Monitoring and ReportingOperating permits, issued under Title V, con-tain the monitoring procedures and testmethods to be used for each substance regu-lated under the permit. Reporting is nor-mally required at six-month intervals. Cer-tain industrial facilities are subject to "com-pliance assurance monitoring" (CAM),which involves additional requirements.These facilities, generally, are those majorsources that rely on pollution control equip-ment to comply with the terms of the permit,as opposed to restricting operations, or anyother strategy. In addition to semiannualreports of deviations from air permit condi-tions, Title V permitted sources must submitto the state permitting authority or the EPA acertification of compliance with all Title Vpermit terms on an annual basis.
New Source Performance Standards(NSPS)NSPSs have been issued for several types ofindustrial establishments. (A new source isone that commences construction or recon-struction after a standard that applies to thatsource has been proposed.) In general,NSPSs reflect cutting-edge control technol-ogy for major sources. In some cases, moni-toring and reporting requirements are morecomprehensive. For instance, regarding VOCemissions, requirements for recordinginclude the quantities of solvents used inmanufacturing processes and calculations ofsolvent usage versus the quantity emitted tothe air.
In summary, each source that is subject tothe operating permit program is required toprepare and submit an application for a per-mit. The application must describe each andevery source of air pollutants, as well as perti-nent air pollution control requirements andstandards. Whenever a facility is in a non-compliance situation, compliance plans andremedial measures must be developed andsubmitted. Actual emissions must be moni-tored, and monitoring reports must be sub-mitted periodically. At least once a year, eachsource must certify its status of compliance.
Whenever the operating status of a sourcechanges, applications for permit modifica-tions must be submitted. Also, it is requiredthat permit renewals be submitted at leastevery five years. The sources that are subjectto the operating permit program include thefollowing:
• Major sources, as defined by the CAA, or(more restrictively) by the applicablestate or local air-quality control agency
• "Affected sources," which includes anystationary source that contains one ormore units subject to an acid rain emis-sion limitation, or reduction (Title IV)
• Any source (including area sources) thatis subject to new source performancestandards (NSPSs)

• Any source (including area sources) thatis subject to standards, limitations, orother restriction of the NESHAPs.
Title Vl, Stratospheric OzoneProtectionCertain requirements under the CAA relateto the prevention of leaks and servicing ofstationary and mobile air conditioning andrefrigeration units containing chlorofluoro-carbons (CFCs) or hydrochloroflourocar-bons (HCFCs). These requirements are con-tained in Sections 608 and 609 of the CAA.These provisions prohibit knowingly vent-ing CFCs and HCFCs to the atmospherefrom air conditioners or refrigeration equip-ment; require the repair of certain leaks ofCFCs and HCFCs; and require that certainpractices be followed for the service, repair,and disposal of air conditioning or refrigera-tion units.
Title VII, EnforcementThe best strategy for environmental manag-ers to follow regarding enforcement is to useall reasonable means to avoid enforcementactions. Enforcement actions can be initiatedby the federal government, the state govern-ment, local agencies, citizen groups, or indi-vidual citizens.
The foundation of avoiding enforcementactions is in corporate policy toward compli-ance. "Fighting city hall" is exceedinglyexpensive and has a poor track record. Expe-rience bears out that getting actively involvedin the permit process, developing a goodworking relationship with regulators, foster-ing among employees a sound policy of care-ful handling and use of potential environ-mental pollutants, substituting nonpollutingsubstances where possible, and prudentlymaintaining and operating pollution controlequipment are far preferable to dealing withenforcement actions.
Bibliography
Army Corps/U.S. Environmental ProtectionAgency, Section 404(b) (1) Guidelines Mit-igation MOA. February 7, 1990. U.S. Envi-ronmental Protection Agency/ArmyCorps. Memorandum to the Field: Appro-priate Level of Analysis Required for Evalu-ating Compliance with the Section 404(b)(1) Guidelines Alternatives Requirements.August 23, 1993.
Clean Water Act. 33 U.S.C. 1251 et seq.(1948-1987).
Clean Water Act. 404, 33 U.S.C. 1344.Coastal Zone Management Act. 16 U.S.C.
1451 et seq. (1972-1986).Comprehensive Environmental Response,
Compensation and Liability Act. 42 U.S.C.9601 et seq. (1980-1987).
Council on Environmental Quality. Imple-mentation of Procedural Provisions ofNEPA, Final Regulations. 43FR, No. 230,November 19, 1978.
Endangered Species Act. 16 U.S.C. 153 1-1542et seq. (1973-1984).
Federal Insecticide, Fungicide, and RodenticideAct. 7 U.S.C. 136 et seq. (1972-1991).
Fish and Wildlife Coordination Act. 16 U.S.C.661 et seq. (1958-1965).
National Academy of Sciences, NationalAcademy of Engineering. Water Quality—1972. Washington, DC: U.S. GovernmentPrinting Office, 1974.
National Environmental Policy Act. 42 U.S.C.4321 et seq. (1970-1975).
National Historic Preservation Act. 16 U.S.C.470-47Ot et seq. (1966-1992).
National Technical Advisory Committee.Federal Water Pollution Control Adminis-tration. Water Quality Criteria. Washing-ton, DC: 1968.
Pollution Prevention Act. PL 101-508, TitleVI, subtitle F. Sections 6601-6610) et seq.(1990).
Resource Conservation and Recovery Act. 42U.S.C. 6901 et seq. (1976-1992).

Safe Drinking Water Act. 42 U.S.C. 30Of etseq. (1974-1996).
Superfund Amendments and ReauthorizationAct. 42 U.S.C. 11001 et seq. (1986).
Toxic Substances Control Act. 15 U.S.C. 2601et seq. (1976-1988).
U.S. Environmental Protection Agency. Leg-islation, Programs and Organization.Washington DC: Government PrintingOffice, 1979.
U.S. Environmental Protection Agency."National Discharge Elimination System."Code of Federal Regulations. Title 40, Part122. Washington, DC: U.S. GovernmentPrinting Office, 1983-1995.
U.S. Environmental Protection Agency."National Emission Standards for Hazard-ous Air Pollutants." Code of Federal Regu-lations. Title 40, Part 61. Washington, DC:U.S. Government Printing Office, 1997.
U.S. Environmental Protection Agency."National Primary and Secondary Ambi-ent Air Quality Standards." Code of FederalRegulations. Title 40, Part 50. Washington,DC: U.S. Government Printing Office,1997.
U.S. Environmental Protection Agency. "Pre-treatment Standards." Code of Federal Reg-ulations. Title 40, Part 403. Washington,DC: U.S. Government Printing Office,1997.
U.S. Environmental Protection Agency.Quality Criteria for Water. Washington,DC: U.S. Government Printing Office,1976.
U.S. Environmental Protection Agency. "Sec-ondary Treatment Regulation." Code ofFederal Regulations. Title 40, Part 133.Washington, DC: U.S. Government Print-ing Office, 1985.
U.S. Environmental Protection Agency."Standards of Performance for New Sta-tionary Sources." Code of Federal Regula-tions. Title 40, Part 60. Washington, DC:U.S. Government Printing Office, 1997.
U.S. Environmental Protection Agency.Office of Water Program Operations.Federal Guidelines—State and Local Pre-treatment Programs. EPA-43019-76-017c.Washington, DC: U.S. Government Print-ing Office, January 1977.
Wild and Scenic Rivers Act. 16 U.S.C. 1271 etseq. (1968-1987).

4 Pollution Prevention
Pollution Prevention Pays
Waste minimization has been a primaryobjective of wastewater, hazardous waste, air,and solid waste management programs sincethe earliest days of industrial waste treat-ment. Many academic programs haveinstructed that a crucial responsibility for anenvironmental engineer is to reduce theamount of pollutants that require treatmentprior to discharge.
The Clean Water Act (CWA) is the corner-stone of surface water-quality protection inthe United States. It was enacted to sharplyreduce direct pollutant discharges intowaterways, finance municipal wastewatertreatment facilities, and manage pollutedrunoff. The broader goal is restoring andmaintaining the chemical, physical, and bio-logical integrity of the nation's waters so thatthey can support "the protection and propa-gation of fish, shellfish, and wildlife and rec-reation in and on the water."
What may not be included in environ-mental engineering curricula is the conceptthat pollution prevention and waste minimi-zation can result in a significant decrease inoverall operating costs and a consequentincrease in profitability. During the 1980s,the U.S. Congress authorized in-depth stud-ies to analyze the financial impacts of pollu-tion prevention on businesses and industries.The result was the emergence of pollutionprevention as a central concept within indus-try. According to the U.S. EnvironmentalProtection Agency, "the nation is coming tounderstand pollution prevention's value—as
1 http://www.epa.gov/watertrain/cwa/(accessed May 24, 2005).
an environmental strategy, as a sustainablebusiness practice, as a fundamental principlefor all our society" (U.S. EPA, 2004).2.
The term pollution prevention includes allaspects of waste minimization and pollutionreduction and includes a thorough consider-ation of each product throughout its lifecycle, from initial product development tofinal disposal. For each stage in a product'slife cycle, an engineer must consider the pol-lutants and potentially toxic wastes thatcould be discharged to the atmosphere, sur-face water bodies, and the land. Existingprocesses and facilities must minimize flowsand loads, and nontoxic substances must besubstituted for toxic substances, to the maxi-mum extent practicable. While the productlife cycle analysis is vital to a successful pollu-tion prevention program, it is also the natu-ral precursor to significant cost savings.
National Pollution Prevention PolicyCongress established the Pollution Preven-tion Act3 in 1990, indicating that the follow-ing should be adhered to, whenever feasible:
• Pollution should be prevented orreduced at the source.
• Pollution that cannot be preventedshould be recycled in an environmen-tally safe manner.
• Pollution that cannot be prevented orrecycled should be treated in an environ-mentally safe manner.
2 http://www.epa.gov/p2/(accessed November 30, 2004).
3 http://www.epa.gov/opptintr/p2home/p2policy/defmitions.htm (accessed November 30, 2004).

• Disposal or other releases into the envi-ronment should be employed only as alast resort and should be conducted inan environmentally safe manner.
Important definitions to grasp within thePollution Prevention Act include "pollutionprevention" and "source reduction." The Actdefines "pollution prevention" as sourcereduction and other practices that reduce oreliminate the creation of pollutants through:
1. Increased efficiency in the use of rawmaterials, energy, water, or otherresources
2. Protection of natural resources by con-servation
"Source reduction" is defined to mean anypractice that reduces:
• The amount of any hazardous substance,pollutant, or contaminant entering anywaste stream or otherwise released intothe environment (including fugitiveemissions4) prior to recycling, treat-ment, or disposal
• The hazards to public health and theenvironment associated with the releaseof such substances, pollutants, or con-taminants
Methods of source reduction includeequipment or technology modifications;process or procedure modifications; refor-mulation or redesign of products; substitu-tion of raw materials; and improvements inhousekeeping, maintenance, training, orinventory control. This chapter focuses onsome of these methods more specifically, butthe possibilities for employing one or severalof them within an industrial pollution pre-vention program are limitless.
4 Fugitive emissions refer to pollutant emissionsthat cannot reasonably be collected or ventedthrough one or more point sources (e.g., vent orstack).
One important distinction to considerwith respect to the National Pollution Pre-vention Policy and the concept of pollutionprevention itself is that recycling, energyrecovery, treatment, and disposal are NOTincluded within the definition of pollutionprevention. If materials require recycling,they have already become waste that needs tobe managed. Similarly, treatment and dis-posal are activities restricted to waste man-agement. Pollution prevention means muchmore than preventing pollution—it meanspreventing waste to begin with. Within thegreater context of this book, pollution pre-vention, if successfully incorporated into theindustrial process, should reduce or poten-tially eliminate the need for industrial wastetreatment.
The positive impact that pollution pre-vention can have on industries and our envi-ronment is potentially so great that environ-mental engineers, environmental scientists,and all others involved in the environmentalfield should consider it a professional obliga-tion to communicate this message to clients,regulators, colleagues, and communities.
Considerations of CostDuring the 1990s, it became well establishedthat the conscientious application of pollu-tion prevention principles, including a thor-ough consideration of industrial activitiesand their costs, could result in increasedprofitability for industries and the businesscommunity as a whole. A salient realizationduring the inception of a pollution preven-tion program is that emissions of all forms—water pollutants, air pollutants, and solidwastes—are, in fact, materials that originatedfrom purchased raw materials and that emis-sions represent a quantifiable loss. It wouldbe grossly simplistic to view the cost of envi-ronmental protection as merely the cost totreat and dispose of waste. Rather, the truecost is calculated after a complete accountingof all costs involved in an industrial process,including purchase of raw materials; equip-ment maintenance; waste management sys-
terns; and costs associated with recycling,treatment, transportation, and disposal. Forexample, one pound of hydrocarbon emittedfrom a smoke stack at a power-generatingstation was previously paid for as a pound ofcoal or oil. If combustion performance canbe improved, more power can be produced,and fewer emissions require treatment.
Regulatory DriversIndustries are required to comply with avariety of federal, state, and local environ-mental regulations. Many of the applicableregulations (e.g., Resource Conservation andRecovery Act, Toxic Substances Control Act,Clean Water Act, Clean Air Act) require reg-ulated activities and operations to be con-ducted to minimize potential environmentalimpacts. Therefore, while meeting manda-tory regulations, industries should already bedevoting time, energy, and resources toensure compliance and, where required,minimize their waste generation. For exam-ple, adopting and implementing a HazardousWaste Minimization Plan (which is requiredof all large-quantity hazardous waste genera-tors) not only will reduce the regulatory bur-den associated with hazardous wastes, butalso will reduce the amount of waste gener-ated, lower disposal and treatment costs, andminimize the amount of potential environ-mental impacts associated with hazardouswastes. If the plan includes process optimiza-tion, the same amount of product can beproduced using fewer raw materials, and thequantity of waste generated can be reduced.This is just one example of how environmen-tal compliance and pollution prevention gohand in hand. In fact, environmental sustain-ability is often the next step once complianceis achieved.
Pollution Prevention Leads toEnvironmental SustainabilityOnce pollution prevention practices areimplemented throughout the industrialprocess, a business will be well on its way toachieving environmental sustainability. Sus-
tainability, as defined by the BrundtlandCommission in 1987, is "development thatmeets the needs of the present without com-promising the ability of future generations tomeet their own needs." While cost savingsand regulatory drivers are important, envi-ronmental sustainability represents a highergoal—one that should be strived for becauseit's the right thing to do.
The benefits of pollution prevention andenvironmental sustainability not onlyinclude cost savings and regulatory compli-ance, but also improved working conditionsfor employees, competitive advantages withenvironmental-savvy clients and consumers,and improved community and regulatorrelations.
Benefits of Pollution PreventionIn addition to satisfying key policy require-ments of federal and state regulatory agen-cies, an effective pollution prevention pro-gram can have major benefits. A new look atexisting and traditional production methodscan lead to improvements in production effi-ciencies, reduced costs for treatment and dis-posal, and reduced risk. Other benefits caninclude:
• Reduced liability as a future "PotentiallyResponsible Party" (PRP) at off-site finaldisposal locations
• Improved relations with customers seek-ing associations with environmentallyconscious or "green" suppliers
• Reduced costs for handling and storageof wastes
• Improved economic and environmentalbottom lines
• Improved public image• Increased production capacity• Enhanced regulatory relations• Better work environment for employees• Increase in positive community rela-
tions—facilities are welcomed, ratherthan tolerated, by communities

General Approach
When a pollution prevention program isimplemented, either to comply with regula-tory requirements, pursue environmentalsustainability, or as part of necessary facilityupgrades, the primary steps include:
1. Secure unequivocal support from man-agement.
2. Develop a company-wide philosophy ofwaste minimization.
3. Clearly establish realistic objectives andtargets.
4. Establish a baseline and ways to measureprogress.
5. Develop an accurate cost accounting sys-tem.
6. Implement a continual improvementprogram.
While implementation methods may varybetween facilities, these five steps provide astarting point. Each step is described ingreater detail below.
Secure Unequivocal Support fromManagementIt is vital to get as much support as possiblebefore a pollution prevention program canget started. Having the support of peoplewho agree that pollution prevention "is agood idea" is helpful, but without supportfrom top management and the necessaryresources to effect operational changes,material substitutions may not be available.Even if top management is in agreement thatpollution prevention is necessary, they mustbe willing to offer genuine, active support,including budgetary help and a strong voiceof support when internal obstacles arise.Internal obstacles may include: lack ofunderstanding of the benefits of pollutionprevention, not allowing employees adequatetime or incentives to complete pollution pre-vention tasks, and lack of capital for requiredprocess improvements.
When top management assigns or dele-gates the "responsibility" for implementing apollution prevention program, real progressis often difficult to achieve and sustain. Therehave been numerous attempts to institutewaste minimization programs in the absenceof overt support from top management.Progress can be made soon after programimplementation, only to gradually revert toformer wastefulness and inefficiency wheneffective management support is absent. Theunequivocal and visible support of top man-agement, who are instrumental to programsuccess, is required to make the paradigmshifts necessary to implement an effectivepollution prevention program.
The key to gaining enthusiastic supportfrom the top management of an industrialfacility is to educate managers about thepotential increased profitability and con-crete cost savings associated with wastereduction, pollution prevention, and sustain-ability. Managers can be taught that emis-sions of "pollutants" should be viewed asexpenditures that have been lost. Once pol-lutants are included in the accounting ledgeras lost resources, their reduction shows up asa smaller loss. Additionally, managers mustbe coached into realizing that the costs fortreatment and disposal of pollutants decreaseas the quantity, and especially the toxicity, ofthose pollutants decreases. Again, it is theethical responsibility of environmental man-agement professionals to carry this messageforward and to spearhead the paradigm shiftfrom pollution control as a bottomless pit ofexpense to pollution prevention as a way toincrease company profits.
In addition to securing support frommanagement, it is good practice to inviteothers to participate in the process. Managerswhose work influences the quantity andcharacteristics of wastes produced, as well asemployees who are responsible for purchas-ing raw materials, should be involved at theinception of a pollution prevention program.Each stakeholder must be involved in devel-oping an explicit scope and clear objectives

and targets for their facility's pollution pre-vention program. The team of stakeholdersmust be completely cross-functional, thusrepresenting all of the activities at the facilitythat in any way affect the quantity and char-acteristics of wastes produced. At a typicalindustrial facility, the stakeholders wouldinclude:
• Plant manager• Operations management• Engineering• Maintenance• Purchasing• Environmental health and safety• Production employees and their repre-
sentative
The following is an example of how pur-chasing can be directly involved in the wasteminimization aspect of pollution prevention.Purchasing is directly involved in communi-cating with suppliers regarding packaging ofitems that will be delivered to the industrialfacility. On one end of the scale there arereturnable (and reusable) containers. On theother end of the scale are multilayered, non-recyclable packages, characterized by exces-sive bulk, that must all be discarded and dis-posed of. It is not unusual for electronic
equipment to be delivered in plastic wrap-ping, surrounded by foam blocks, packedinside a box, covered by paper, covered inturn by plastic, and all bound by plastic ormetal strapping. In many cases purchasingagents must be guided to "think outside thebox" and to demand packaging from suppli-ers that minimizes creation of solid wastes.One of the very first examples of pollutionprevention was when Henry Ford requiredvehicle components to be delivered in cratesmade of oak slats. Instead of throwing thecrates away, Ford workers disassembled thecrates, and used the oak slats as automobilefloorboards.
Clearly Establish Objectives andTargetsMeasuring the success of a pollution preven-tion program is impossible without the abil-ity to compare progress with establishedgoals. However, if unrealistic goals are made,program participants may end up discour-aged because success seems so unattainable.
Significant work is involved in developingan explicit scope for a pollution preventionprogram. It is also critically important thatall of the stakeholders are actively involved inscope development. The worst approach is
Table 4-1 Environmental Objectives and Targets
Objectives
Prevent Chemical Releases
Improve Workman Compensation Statistics
Sustainability
Targets
No chlorine gas releases
No liquid/solids/chemical spills greater than the Reportable Quantity
No chemical dust releases
Eliminate confined space in the workplace
No chemical exposure to staff
Maintain pump noise at less than 70 db
No vehicle accidents
Reduce energy use by 10% by December 2006
Reduce truck miles by 10% by December 2006
Operate alternative or hybrid vehicle by December 2006
Eliminate the use of chlorine gas in water treatment plant by Decem-ber 2005
Reduce hazardous materials use by 50% by December 2006

for one person to take on the entire task ofdeveloping the scope of a pollution preven-tion program. Not only will it be regarded asthat person's demands on coworkers, butworse, the person may not be sufficientlyfamiliar with the industrial processes thatcreate the pollutants.
The International Standard for Environ-mental Management Systems (ISO 14001)defines an environmental objective as anoverall environmental goal that is consistentwith an organization's environmental policy.An environmental target, by contrast, is a de-tailed performance requirement that arisesfrom the environmental objectives and thatneeds to be set and met in order to achievethe objectives. In other words, the objective isgeneral and the target is specific. ISO 14001also specifies that objectives and targetsshould be measurable and consistent withenvironmental policies, including commit-ments to pollution prevention, compliancewith applicable legal requirements and otherfacility requirements, and continual im-provement. Other considerations whendeveloping objectives and targets include:legal requirements; environmental impacts;technological options; financial, operational,and business requirements; and stakeholderinterests. Table 4-1 provides examples ofgood and bad objectives and targets.
Establish a Baseline and Ways toMeasure ProgressAfter a detailed scope has been developed, aclear set of objectives and targets for the pol-lution prevention program can be developed.Here, it is important to shoot high, but notso high as to intimidate those who willimplement the program. It is imperative thatthe stated objectives can be understood, areachievable, and can be evaluated by readilyunderstood measurements and comparisons.
Success cannot be measured without abaseline. Existing conditions must be mea-sured to develop an accurate baseline againstwhich pollution prevention achievements
can be compared. Establishing a baseline thatencompasses all potential levels of pollutionprevention may be too much. The baselineshould be developed only for matricesdirectly related to the objectives and targetsfor the pollution prevention program.
Once a clear set of objectives and targetshas been developed, and measurement meth-ods have been determined and agreed upon,action must begin and be sustained. Mea-surements that are truly indicative of successor failure must be taken. "What gets mea-sured gets done" is a good guiding rule. Ameaningful reward system should be imple-mented to acknowledge success and toencourage continuous improvement.
Another necessity is establishment of abaseline from which to evaluate the degree ofsuccess or failure of the pollution preventionprogram. Whichever accounting system isagreed upon must be applied to the facilitybefore implementation of the pollution pre-vention program. Also, the cost accountingsystem must be applied at regular intervals inorder to keep track of progress or lack ofprogress.
Accurate Cost Accounting SystemFor a pollution prevention program to besuccessful, prevailing attitudes that wastereduction and environmental compliancecost money and cut into company profitsmust be replaced with an understanding thata well-designed and -executed pollution pre-vention program can reduce costs and addvalue to the product, thus bolstering com-pany profits. An accounting system that canaccurately track all the true costs of produc-tion, distribution, and final disposal of theproduct, as well as the costs of managing,handling, and disposal of all wastes—solid,liquid, and air—is essential to convince bothmanagement and production personnel ofthe true value of a pollution prevention pro-gram.
It is important here to note that the ideaof the "bottom line" is increasingly beingreplaced with the "Triple Bottom Line." The

Triple Bottom Line is a measurement of acompany's economic state, environmentalstewardship, and social responsibility. Cor-porations that are striving for sustainabilityand committed to more than just profits areincreasingly relying on the Triple BottomLine.
In order to enable advantageous applica-tion of an accurate cost accounting system,an accurate materials balance, inclusive ofthe entire life cycle of a product, is needed.Although this may seem a daunting task, andcostly in and of itself, a materials balance is anecessary ingredient in the total picture ofcost effectiveness. It is another example of aninvestment that leads to significant savings inthe long run.
It has been found to be highly advanta-geous to employ so-called "activity-basedcosting" (ABC) to evaluate the degree of suc-cess or failure of a given pollution preventionprogram. ABC involves meticulous identifi-cation of each of the cost items within thegeneral ledger that are related in any way to agiven activity. As an example, in identifyingall costs related to emission control, the costsfor chemicals used in wet scrubbers are iden-tified. Wet scrubbers are part of the air pollu-tion control system; they are, therefore, partof the overall pollution control system. Asanother example, the proportion of each per-son's time spent in the performance of dutiesrelated to pollution control is determined.For example, if a maintenance worker spendsone hour per week adding chemicals to a wetscrubber, then the corresponding proportionof that individual's salary and benefits is allo-cated to emission control.
An effective cost accounting method thatoften produces pollution prevention benefitsentails assigning the cost of waste disposal orenergy or water use to individual depart-ments, based on their individual use. Whenthe costs are allocated directly to individualdepartment managers, they become aware ofthe true cost of these items, creating anincentive to conserve and reduce.
Companywide Philosophy of WasteMinimizationIn addition to the absolute requirement forunequivocal support from top managementfor a pollution prevention program to suc-ceed, it is equally important that everyoneinvolved in receiving, preparation, produc-tion, packaging, storage, and shippingbelieve in waste minimization as a necessarycomponent to the company's financial suc-cess and, thus, the security of their jobs. Asexplained below, a pollution prevention pro-gram consists of active waste minimization ateach stage of the life of a product, from initialdevelopment, through manufacturing, andon to final disposal of the product at the endof its life. Every person involved in everystage of the product has an influence on theefficiency of use of raw materials, includingleaks and spills, cleanup, and damage to rawmaterials; intermediate stages, or final prod-uct; and containment of wastes. A pervasive,company-wide belief in the direct influenceof a well-executed pollution prevention pro-gram on the security of each person's job isneeded for success of the program.
Promoting a belief in the benefits of wasteminimization can be achieved in a variety ofways. Specific strategies include communi-cating how extra work may not always berequired to achieve waste minimization, andday-to-day tasks may actually become easier.Certain individuals or groups who are work-ing toward waste minimization and theprogress of the pollution prevention pro-gram should be congratulated for successes,and these successes should be communicatedto the entire organization. Additionally,employee incentive programs are an excellentway to recruit new help and reward stake-holders.
Implement Environmental PolicyA significant step in establishing a successfulpollution prevention program is developinga facility environmental policy. According toISO 14001, a company's top management

should develop an environmental policy, andthe policy should:
• Be appropriate to the nature, scale, andenvironmental impacts of its activities,products, and services
• Include a commitment to continualimprovement and prevention of pollu-tion
• Include a commitment to comply withapplicable legal requirements and withother requirements to which the organi-zation subscribes that relate to its envi-ronmental aspects
• Provide the framework for setting andreviewing environmental objectives andtargets
• Be documented, implemented, andmaintained
• Be communicated to all persons workingfor or on behalf of the organization
• Be available to the public
Continual Improvement and EducationNew technology is being developed andbrought to light through various publica-tions on a continuing basis. New andimproved techniques and technologies forimproving efficiencies in product produc-tion, materials handling, substitution of non-toxic substances for toxic substances, andwaste handling and disposal can significantlyaid in furthering the objectives of a pollutionprevention program. It is vitally importantthat key participants in an industry's pollu-tion prevention program attend seminars,short courses, and regional and nationalmeetings at which new techniques and tech-nologies are presented. It is equally impor-tant that these key participants then hold in-house seminars and meetings where the newinformation is shared with other participantsin the pollution prevention program.
Pollution Prevention AssessmentAn "environmental audit" (Chapter 5) hasthe purpose of assessing a company's compli-
ance (or risk of noncompliance) with envi-ronmental regulations. A "waste minimiza-tion audit" has the objective of assessingopportunities to improve materials utiliza-tion efficiency at an operating industrialfacility or individual process. A "pollutionprevention assessment" is a more compre-hensive program conceived to determineeach source at which wastes are generated,from product development through manu-facturing, use of the product, and on throughto the end of the life of the product. The gen-eral approach of a pollution preventionassessment has two phases. The first phaseidentifies and quantifies the types of wastegenerated and analyzes the manner in whichthose wastes are generated. The second phaseinvolves performing a materials balance oneach of those sources, determining alterna-tives for reducing or eliminating thosewastes, and analyzing the benefits and costsof each alternative. The following step-by-step process outlines the sequence of a pollu-tion prevention assessment.
Phase IDetermine how wastes will be identified andmeasured and develop baseline. Aspects ofthe industrial process that are important tomeasure include:
1. Raw materials used2. Utility use (electricity, fossil fuels, water,
steam)3. Air emissions (direct and fugitive)4. Wastewater (flows and loads)5. Solid and hazardous wastes
It is best to quantify these items on a perunit product made basis, so that their costcan be allocated as such.
1. For each waste stream, identify the stageof the product's life cycle responsible forits generation. For example, wood palletsreceived at a facility from suppliers aregenerated at the procurement stage andshould be the responsibility of product

developers or purchasing personnel toeliminate or minimize.
2. Identify the source of each waste constit-uent. For example, soluble BOD dis-charge from an industrial wastewatertreatment plant at a food processingfacility can be traced to production ves-sel heels containing acetic acid (vinegar).
3. Quantify each waste stream and associ-ated waste constituent.
Phase Il1. Develop a mass balance for the manufac-
turing process, quantifying each wasteconstituent from raw material receipt towaste discharge. Quantify each wastesource and perform a comprehensivematerials balance around each stage ofthe life of the product.
2. Prioritize target waste streams based onthe realistic, measurable goals developedat program inception. Issues to addressin this prioritization process include:
• Which processes are generating themost waste?
• Which are inflicting the most envi-ronmental impact?
• Are there any quick fixes or low-hanging fruit?
• Which waste streams can be signifi-cantly changed?
3. Brainstorm alternatives and potentialsolutions to waste-generating activities,industry examples, and experience.Employees who work on the waste-gen-erating processes on a daily basis must beinvolved, as they might be able to pro-vide valuable insights.
4. Analyze the technical and economicalfeasibility of the alternatives for elimi-nating or minimizing waste sources by:
• Elimination of the source• Raw materials that could result in
fewer waste streams and/or lessenvironmental impacts
• Improved housekeeping• Increased efficiency through manu-
facturing process optimization, pro-duction scheduling, or preventivemaintenance
5. Perform a life-cycle cost-benefit analysison the complete set of feasible alterna-tives to identify areas where cost savingscan be realized (Table 4-2). It is impor-tant to compare the costs for pollutionprevention program implementation.
6. Select alternatives to implement basedon the cost-benefit analysis and meetingstated environmental objectives and tar-gets.
Costs
Capital Equipment
Engineering
Installation
Operational Costs
Downtime
Benefits
Higher Raw Material Yield
Reduced Waste and Waste Treatment Costs
Reduced Labor, Chemicals, and Energy
Reduced Energy
Reduced Waste Disposal Fees
The following may be costs or benefits,so they must be quantified:
Operation and maintenance
Labor
Chemicals
Raw materials
Energy
Table 4-2 Typical Costs and Benefits of Pollution Prevention Program Implementation

Hierarchy of PotentialImplementation Strategies
Once an organization has committed todeveloping a pollution prevention program,developed and communicated an environ-mental policy, established a baseline withobjectives and targets, and identified wastesources, it must begin implementing strate-gies to minimize pollution and achieve theobjectives and targets. This should involveshifting the focus from the end-of-pipe treat-ment back into the process and processequipment within the facility—from initialphases of product development, throughmanufacturing, to final disposal of the prod-uct.
The strategies can be selected at the finalstages of the Pollution Prevention Assess-ment, as described above. Feasible optionsshould be developed in detail, including afull description of each option, the require-ments for implementation, and the costs andbenefits. Implementation of the option oroptions finally agreed upon must include athorough and accurate performance evalua-tion. An accurate cost accounting systemmust be in place for this process to produceresults of value (see cost-benefit discussion,above).
The following sections present a hierarchyof pollution prevention strategies based onthe following six steps.
1. Prevent pollution through product andprocess design, housekeeping, processchanges, increased raw material yield,and preventive maintenance.
2. Reduce the amount and toxicity of wastesgenerated by process optimization,material substitution, and manufactur-ing scheduling.
3. Reuse materials that would otherwise beconsidered waste. Develop new or alter-native uses for "waste."
4. Recycle materials that cannot be reused.5. Treat waste using effective and efficient
methods, while minimizing energy usage
and the creation of new waste streams(e.g., wastewater sludge).
6. Dispose any wastes that can not bereused, recycled, or treated in the mostenvironmentally safe manner possibleand in compliance with all applicablefederal, state, and local regulations.
Potential Implementation Strategies
PreventionPrevention is the strategy with the highestpotential for minimizing wastes and prevent-ing pollution. If operations, manufacturingprocesses, or activities can be altered toensure that pollution prevention is achievedand the generation of waste is prevented,often raw material yield and the cost perpiece of manufacturing is lowered. For exam-ple, waste generated from product packagingcan be reduced or eliminated if the amountof materials used to package a product isreduced. Similarly, operational processes canbe changed and equipment upgraded toreduce the amount of waste generated in anindustrial operation.
Immaculate housekeeping is consideredone important way to prevent pollution. Theadjective "immaculate" is used here toemphasize that extra effort, beyond the rou-tine "good" housekeeping, is required toachieve and maintain the levels of perform-ance in housekeeping that are expected for
A food processing facility added sequencemanufacturing campaigns and dedicatedmanufacturing lines to its largest solubleBOD-generating product. As a result, thefacility minimized reactor vessel cleanoutand thereby reduced wastewater treatmentplant energy and chemical use, extendedthe treatment capacity of its plant, andavoided treatment plant expansion as pro-duction levels increased.

an effective pollution prevention program.Constant attention must be devoted to pre-venting waste before it occurs through pre-ventive maintenance. Waste must be pre-vented; if it is not, it must be cleaned upimmediately, and then an analysis must beconducted to determine why the wasteoccurred, followed by action taken to preventthe same type of waste from reoccurring.Then procedures must be developed andimplemented to prevent reoccurrence.
Spill containment and isolation tech-niques must be developed and continuallyimproved. A key characteristic of immaculatehousekeeping is that no leak, spill, or correct-able inefficiency occurs twice. There must bean effective program in place whereby eachundesirable occurrence is reported and ana-lyzed, its cause is determined, and a correc-tive action is implemented.
A food processing facility was able todevelop housekeeping procedures and pro-vide sanitation staff with equipment capa-ble of capturing soluble BOD-containingwastes, such as marinade and batter, thatwere not treated in their DAF wastewaterpretreatment system. This practice low-ered surcharge fees and helped the facilityavoid a costly upgrade to biological treat-ment.
Reduce"Reduce" is very similar to "prevent" withone notable difference. Methods of preven-tion may prevent the waste from being ini-tially generated, whereas methods of reduc-tion reduce the amount of waste that actuallyis generated.
Material substitution is an importantmethod to reduce wastes. There are manyinstances where nontoxic substances can besubstituted for toxic substances in industrialprocesses. Many more will be available in thefuture, as research and development efforts
produce alternatives to former processes thatuse toxic materials. Keeping up with thesenew developments is crucial to continualimprovement and education, which are dis-cussed above.
A few highly successful examples of non-toxic materials replacing toxic materialsthroughout industry are:
• The use of oxygen, rather than chlorine,to bleach wood pulp
• The use of alcohol for pickling, ratherthan acid, in the manufacture of copperwire
• The use of ozone or ultraviolet light fordisinfection rather than chlorine
• The use of water-based, rather than oil-based, paints (eliminates the need forsolvents and thinners for cleanup)
• The use of nonphenolic industrial deter-gents, rather than those that containphenolics
• The use of water-soluble cleaning agentsor citrus degreasers, rather than organicsolvents
Substandard biological wastewater treat-ment at a power plant was found to becaused by toxic zinc levels in the sanitarywastewater coming from the office build-ing. This situation was corrected by substi-tuting a metal-free floor wax for the zinc-laden wax used by custodians, which hadcaused the problem.
Wastes can also be prevented and/orreduced by changing manufacturing proc-esses and equipment. Many products can bemanufactured by use of two or more alterna-tive processes. Often, one of the process typeswill involve the use of substances that are lesstoxic than others. In addition, within anysingle process type, there is usually a choiceto make between several sources for theequipment, and one type may be more desir-able from a pollution prevention standpoint

than others. For instance, an item of equip-ment that is air-cooled might perform as wellas an item that is water-cooled but wouldalso preclude the need to discharge wastecooling water. Of course, it should be ascer-tained that the air used to cool the equip-ment would not become degraded in qualitybefore a decision is made regarding replace-ment.
A textile mill avoided possible dischargepermit excursions for metals by analyzingall process chemicals, reducing overallchemical use by implementing processautomation, changing to metal-free chem-icals where possible, and scheduling pro-duction to average out metal-loading to itswastewater treatment plant. This productsubstitution and manufacturing schedul-ing approach avoided a costly metalremoval treatment project.
In cases where equipment is old, worn,and subject to leaks, spills, and inefficiencies,it might be cost effective to replace it, basedon the savings in cost of materials, cost ofoperation, and cost of handling and dispos-ing of wastes. However, a comprehensive andaccurate materials balance around the entirelife cycle of the product, from initial develop-ment to final disposal, is needed to make thecorrect decisions.
A textile mill replaced large, manual-feddye baths with smaller, computer-con-trolled chemical feed systems that pre-vented as much as 80% of bath waste atthe end of each run.
Cleaning and washing are activities withinan industrial process that almost always pro-duce wastes (e.g., solvents) that require man-agement and disposal. Often, cleanup wastescontain underutilized raw material and
actual product, in addition to the chemicalconstituents of the cleaning agent.
The following is a list of some examples ofchanging manufacturing processes andequipment for pollution prevention withinthe cleaning and washing areas:
• Conical-bottom tanks to reduce theamount of heel after a production run
• Line-pigging systems to capture residualproduct and prevent heavy waste loadsfrom line cleaning
• Counterflow washing and rinsing systemin continuous manufacturing process toreduce water and energy use
• Heat exchangers on hot water cleaningor sanitation wash water prior to dis-charge for energy conservation
• Microfiltration membrane systems tocapture raw material or product nor-mally washed, to drain for reuse
• Use of high-pressure wands to reducewater use and energy
ReuseIf wastes cannot be prevented, and reductionmethods have been implemented, facilitiescan develop ways to reuse wastes. Wastes canbe returned to the industrial process to beused again or reused for a different purpose.
Water is an example of a "waste" that isoften returned to the industrial process forreuse. If a plant's fresh water supply has to betreated before use in the process, it might beless expensive to treat the wastewater andreuse it, rather than treat the wastewater fordischarge, in addition to treating more freshwater for "once-through" use. There is a limitto the extent to which water, or any othersubstance, can be reused. The reason is thatwater evaporates and leaves nonvolatile sub-stances, such as salts, behind. The result isthat nonvolatile substances build up, increas-ing one or more undesirable characteristicssuch as corrosivity and/or scaling.
The following example illustrates a meth-odology for determining the rate of blow-down required to maintain a minimum

Figure 4-1 Water recycle loop with treatment and blow-down.
desired level of water quality for the waterundergoing recycle for reuse.
Example 4-1The schematic diagram presented in Figure4-1 shows a water recycle loop in use at a fac-tory. There is a treatment system for removalof organics and TSS. However, dissolvedinorganics, such as chlorides, are notremoved. These dissolved inorganics, there-fore, build up in the recycle loop and can beprevented from building to above a desiredmaximum concentration only by use of ablow-down, also illustrated in Figure 4-1.
ProblemFor a blow-down rate of 10%, calculate theequilibrium concentration of chloride ions inthe water in the recycle loop, given the fol-lowing information:
• Total volume of water in the entire fac-tory recycle loop, including the in-linetreatment system =1.0 million gallons.
• Chloride ion (Cl") concentration in rawwater supply =10 mg/L as Cl"
• Chloride ion (Cl ) added by factory =90.5 lb/day
• 0 mg/L Cl" removed by in-line treatmentBlow-down = 10% = 100,000 gpd
• Evaporative loss = 5% = 50,000 gpd
Solution
Chloride in system on the first day:
10 mg/L x 8.34 X 1.0 = 83.4 lbs
Chloride added each day in make-up water:
10 mg/L x 8.34 x (0.1 + 0.05)= 12.5 lb/day
Chloride removed each day via blow-down:
X mg/L x 8.34 X 0.1 = 12.5 + 90.5= 103 pounds.
The concentration, X, of chloride ions in theblow-down must equal the concentration (x)in the recycle loop:
X =103= 123 mg/L8.34X0.1
Discharge
Treatment
Blowdown
Treatment
Recycle Loop
FactoryOut
WaterWaterMakeupWater

RecycleRecycle is a term that is often used in con-junction with reuse, as the terms are verysimilar. While people may often associaterecycling with being "green" or "environ-mentally friendly," recycling should be con-sidered as similar to disposal. If a waste isready to be recycled, it has already been gen-erated. Preventing waste generation in thefirst place precludes the need to recycle.
However, once wastes have been pre-vented, reduced, and reused to the extentpossible, recycling is the next step. Recyclingwater can be a significant part of an indus-trial pollution prevention program. Even ifsome degree of treatment is required beforetwo or several reiterative uses, this may bemuch less costly than the "once-through-use" approach. The quality of water, in termsof conventional and/or priority or other pol-lutants, may not need to be nearly as "good"for the industrial process as for discharge incompliance with an NPDES or other dis-charge permit. Therefore, treatment for recy-cling purposes might be less costly thantreatment for discharge.
A cotton-dying operation was paying ahigh COD surcharge to the wastewaterutility Consideration of pollution preven-tion alternatives led to pilot-scale studiesthat showed dye baths could be reused upto five times, rather than dumped aftereach run, by making up less than 25% ofnew raw materials. Implementation of thisdye bath reuse not only resolved the highCOD surcharge fee, but dramaticallyreduced chemical costs with no effect onproduct quality
Recycling Smokestack EmissionsIncreasingly, there are technologies availablefor reusing industrial waste streams. Smoke-stack emissions are traditionally considered afinal "waste" product. However, there aretechnologies available for recycling these
emissions. One example is an algae bioreac-tor system developed by GreenFuel Technol-ogies Corporation in Cambridge, MA."Using the sun as a free energy source,GreenFuePs proprietary algae bioreactor sys-tem produces commercial-grade biodieselfrom smokestack emissions. In most cases,our biodiesel costs the same as or less thanconventional petroleum diesel and recyclesup to 85% OfNOx and 45% of CO2 from thesmokestack stream" (http://www.greenfuel-online.com/index.htm). A technology of thiskind, which turns a waste product into ausable product, is important to researchwhen considering potential recycling effortswithin a mature pollution prevention pro-gram.
A food processor reduced its food wastedisposal costs by 50% by changing its dis-posal outlet from a rendering facility to acomposting facility.
It has become common in the textileindustry to use polyvinyl chloride as a sizingagent. While it is more expensive than thetraditionally used starch, which imparts asubstantial organic load on wastewater treat-ment plants, polyvinyl chloride is readilyrecoverable and reusable through the imple-mentation of membrane filtration technol-ogy-
A metal foundry had to install a sodiumbisulfite dechlorination system to removechlorine from its once-through coolingwater system (using chlorinated publicdrinking water) to meet state dischargepermit limitations. A cooling tower wasinstalled and the cooling water loop closed,saving $500 per day in water use andeliminating the need for the dechlorina-tion system and the discharge permit.

TreatTreating wastes prior to disposal, providedthe treatment is conducted in accordancewith applicable regulations, can reduce thequantity of wastes that require disposal. If thetreatment costs are reasonable, this canreduce the overall cost of waste disposal. Inmany cases it is advantageous to isolate one(or more) waste stream in an industrial plantand treat it separately from the other wastestreams (e.g., gaseous, liquid, or solid) ratherthan allowing it to commingle with otherwaste streams prior to treatment. The segre-gated waste stream can then be treated andrecycled, mixed with other treated effluentsfor discharge to the environment, or dis-charged separately. The following are amongthe many advantages of wastes segregation:
• Many substances are readily removed byspecialized techniques when they are inthe relatively pure and concentratedstate, but are difficult to remove afterbeing mixed with other substances anddiluted by being mixed with other wastestreams. For instance, certain organics,such as chlorophenols, that slowly bio-degrade, are efficiently removed by acti-vated carbon. Treating a waste streamcontaining these substances at the sourcemay be more cost effective than mixingthe waste with other substances that arebiodegradable and on their way to a bio-logical treatment system.
• There is more likelihood of producing ausable by-product from a segregated,relatively pure waste stream.
• There is more likelihood that the streamcan be recycled if it has not been mixedwith other waste streams.
• The segregated stream can be treated ona batch basis, or other campaign basis,depending of the operating schedule ofthe process.
A variation of the wastes segregationapproach involves selective mixing of certainwaste streams. This can take advantage ofcommonality in compatibility to certain
treatment processes. Also, acid waste streamscan be mixed with caustic waste streams formutual neutralization before additionaltreatment.
One industry's waste might be a valuableresource for another. For instance, waste acidfrom one industry might be suitable foreither a processing step or for neutralizationof caustic wastes from another industry. Par-ticipation in waste exchanges is an attractivealternative to waste treatment and disposal.There are many networks of business that areconstantly seeking uses for the wastes theygenerate. In addition, there may be wasteexchange brokers operating in a given indus-try's geographical area.
A promising opportunity to reduce oper-ating costs at a manufacturing facility is toconduct a comprehensive review of all treat-ment operations. This is especially importantafter a facility has implemented successfulpollution prevention measures, especiallywater use reduction measures. Treatmentsystems designed 10 and 20 years ago mightnot be properly arranged for today's wasteflows and loads, and minor adjustmentscould save considerable costs in chemical andenergy use and could dramatically improvetreatment efficiency.
DisposeRegardless of the success of a pollution pre-vention program, some quantity of waste willrequire disposal. Proper disposal is a crucialpart of a successful pollution prevention pro-gram, as improperly disposed wastes havehistorically led to significant pollution. Thefollowing guidelines should be consideredwhen considering disposal options: performa hazardous waste characterization for eachwaste stream to determine if it is regulated ashazardous waste. If it is hazardous waste,ensure that it is managed in accordance withall applicable hazardous waste regulations. Ifit is not hazardous waste, ensure that it ismanaged and disposed of in accordance withpotentially applicable solid waste or otherregulations.

A heavy industrial manufacturing facilitywas paying for 30 cubic yard dumpsterremoval on a cubic yard basis, and thedumpsters were picked up weekly, regard-less of their content. While the facility hada long-term contract that was not easilybroken or amended, it did cease usingthese dumpsters for wood pallet disposal.The wood pallets, in all phases of disrepair,shape, and size, took up a large volumeand contributed very little weight to thedumpsters. The facility began a wood pro-gram, in which employees were allowed tosalvage the wood for their own use. Even-tually, the facility negotiated better termsthat included dumpster rental and wastedisposal by weight.
Waste disposal in total is often a signifi-cant operating cost, and facilities are ofteninvolved in long-term disposal contracts. It isoften useful to undertake a careful review ofhow each waste stream is being disposed of,in some instances with the assistance of cur-rent or potential future waste disposal con-tractors. It is extremely important for bothenvironmental consideration and corporaterisk management to fully understand who istransporting and who is accepting yourwaste. It is facility environmental manage-ment's responsibility to properly characterizeeach waste stream and to ensure each wastestream is being disposed of properly, legally,and with the minimum present and futureenvironmental risk.
Bibliography
GreenFuel Technologies Corporation. Website: http://www.greenfuelonline.com/index.htm.
Miller, H. "In-Plant Water Recycling—Industry's Answer to Shortages and Pollu-tion." Design News—OEM (November 5,1973): 81-88.
U.S. Environmental Protection Agency..RCRA Waste Minimization National Plan.EPA 530-D-94-001. Washington, DC: U.S.Government Printing Office, 1994.
U.S. Environmental Protection Agency. Sum-mary of the RCRA Hazardous Waste Mini-mization National Plan—Draft. EPA 53 O-5-94-002. Washington, DC: U.S. Govern-ment Printing Office, 1994.
U.S. Environmental Protection Agency.Waste Minimization National Plan. EPA530-F-97-010. Washington, DC: U.S. Gov-ernment Printing Office, 1997.
U.S. Environmental Protection Agency. Haz-ardous Waste Engineering Research Labo-ratory. Waste Minimization OpportunityAssessment Manual. EPA/625n-881003.Cincinnati, OH: 1988.
U.S. Environmental Protection Agency.Waste Minimization—EnvironmentalQuality with Economic Benefits. EPA 530-SW-87-026. Washington, DC: U.S. Gov-ernment Printing Office, 1987.
U.S. Environmental Protection Agency.WasteWise. Web site: http://www.epa.gov/wastewise/.
U.S. Environmental Protection Agency. Pol-lution Prevention. Web site: http://www.epa.gov/p2/.
U.S. Environmental Protection Agency. TheNational Waste Minimization Program.Web site: http://www.epa.gov/wastemin/.
U.S. Environmental Protection Agency. Cen-ter for Sustainability. Web site:http://www.epa.gov/region03/chesapeake/center.htm.
U.S. Environmental Protection Agency. Pol-lution Prevention Information Clearing-house. Web site: http://www.epa.gov/opptintr/library/ppicindex.htm.
U.S. Environmental Protection Agency.Greening the Supply Chain. Web site:http://www.epa.gOv/opptintr//dfe/tools/greening.htm.

5 Waste Characterization
Waste Characterization Study
Waste characterization is the term used forthe process of determining the chemical, bio-logical, and physical characteristics, as well asthe quantity, mass flow rates, strengths (interms of concentration), and dischargeschedule, of a wastewater stream, air dis-charge, or solid waste stream. A waste char-acterization program must be carefullythought out and properly executed. Thefoundation of the study is a sampling andanalysis program, which must be performedon representative samples. The equipmentused to measure rates of flow and to physi-cally obtain samples must be appropriate tothe application and accurately calibrated.
There are three general categories of wastecharacterization study in common use: theWastewater (or Air Discharge, or SolidWastes Stream) Characterization Study, theEnvironmental Audit, and the Waste Audit.The appropriate choice among these threecategories, for a given application, dependsupon the principal purpose of the study. AWaste Characterization Study (Wastewater,Air Discharge, or Solid Wastes Stream) isusually carried out for the purpose of obtain-ing design criteria for a waste treatment facil-ity, with a concurrent pollution preventionprogram. An Environmental Audit is per-formed for the purpose of assessing a plant'sstate of compliance with various environ-mental regulations, and a Waste Audit is car-ried out for the purpose of assessing oppor-tunities to minimize the amount of wastegenerated through improved efficiency orthrough substitution of nonhazardous sub-stance^) for one or more of those that areclassified as hazardous. In each case, choices
are made as to the location of samplingpoints, equipment to be used, the samplingschedule, and the laboratory and field analy-ses to be performed. There is always a bal-ance to be struck between the cost of the pro-gram and the ultimate value of the dataobtained.
Choice of Sampling LocationSince pollution prevention is always a pri-mary objective of any waste managementprogram, waste sampling programs shouldalways be designed to determine at whichlocations in an industrial processing plantsignificant amounts of waste are generated.Otherwise, it would be necessary to sampleonly the final composite effluent from theentire plant. The following example illus-trates some of the choices to be made whendesigning a wastes sampling program.
Figure 5-1 is a schematic of an electroplat-ing shop with four different plating pro-cesses, designated Process 1, Process 2, Proc-ess 3, and Process 4. At the present time, allfour processes discharge to a common drainthat leads to the municipal sewer system. Thetask at hand is to develop a waste samplingand analysis program to provide data for awaste reduction program, as well as to enablecalculation of design criteria for one or moretreatment devices to pretreat the wastewaterprior to its discharge into the municipalsewer system, within compliance with allapplicable regulations. If the sole objectivewere to treat the wastewater to within com-pliance with the regulations, it would makesense to locate one composite sampler at theend of the building to sample the mixedeffluent from all four plating processes. The

questions then, would be, "How many daysshould the sampling period cover?" and"Over how long a time should each compos-iting period take place?"
The answer to the first question dependson the processing schedule and whether ornot different processes are run on a cam-paign basis in one or more of the four proc-essing units. It is more or less standard prac-tice to sample the wastes from a given process(or set of processes) over a three-consecu-tive-day period. Five would be better thanthree, but a decision has to be made betweenthe greater costs for the longer samplingperiod and the greater risk associated withthe shorter sampling period. A prudent engi-neer will develop more conservative designcriteria if the risk of not having accuratewaste characteristics is higher. The highercost for the more conservatively designedtreatment system may well be more than thehigher cost for the longer sampling period.
The second question addresses the lengthin time of each compositing period. Four six-hour composites per day produce four dis-crete samples to be analyzed, whereas two12-hour composite samples taken each daywill cost only half as much to have analyzed.Using any statistical approach available, themore discrete samples taken during the 24-
hour operating day (that is, the shorter thecompositing periods), the more accurate theresults of the wastes characterization studywill be. Here, again, a prudent engineer willrecognize that more conservatism, and,therefore, higher cost, will have to bedesigned into a system. When the composit-ing periods are long, the number of discretesamples each day is low, and the risk of nothaving accurate, detailed characterizationinformation is higher.
If the four plating processes are quite dif-ferent from each other, a less expensive over-all treatment system might result if one ormore are treated separately. If such is thecase, it would be appropriate to locate com-posite samplers at the discharge point of eachof the four processes. Now, the number ofsamples to be analyzed for a given number ofsampling days and a given number of com-posites each day is multiplied by four. Still,the considerations of risk, conservatism indesign, and total cost apply, and it is oftencost effective to invest in a more expensivewastes characterization study to obtain alower total project cost.
It is seldom prudent to consider that thesole reason for carrying out a wastes charac-terization study is to obtain data from whichto develop design criteria for a wastes treat-
Process1
Process3
Process4
Process2
To MunicipalSewer
Figure 5-1 Schematic of an electroplating shop with four different processes.

ment system. Rather, pollution preventionshould almost always be a major objective, asit should be with any wastes managementinitiative. As discussed in Chapter 4, themany benefits of pollution preventioninclude lower waste treatment costs, as wellas lower costs for disposing of treatmentresiduals.
When taken in the context of a pollutionprevention program, a wastes characteriza-tion study takes on considerations in addi-tion to those discussed above. Using the sameexample illustrated in Figure 5-1, it is seenthat locating only one composite sampler tosample the combined wastewater from allfour plating processes would yield littleinformation useful for pollution preventionpurposes. For pollution prevention pur-poses, it is necessary to locate at least onecomposite sampler at the wastes dischargefrom each of the four plating processes. Fur-thermore, there is an important consider-ation of timing regarding execution of thesampling program. In order to enable mea-surement of the effectiveness and thereforethe value, in terms of cost savings, of the pol-lution prevention program, a completewastes characterization study should be car-ried out before wastes minimization or otheraspects of pollution prevention take place.These data, however, will not be useful fordeveloping design criteria for wastes treat-ment, since implementation of the pollutionprevention program will, hopefully, signifi-cantly change the characteristics of the wastestream to be treated.
A second wastes characterization study,then, should be conducted after the imple-mentation and stabilization of the pollutionprevention program. Stabilization is empha-sized here, because improved housekeep-ing—in the form of spill control, contain-ment, and immediate in-place cleanup; waterconservation, containment, and recycling of"out of spec, product or intermediate"(rather than dumping these "bad batches" tothe sewer); and other process efficiencyimprovement measures—is implemented (aspart of the pollution prevention program). If
some of the former poor housekeeping andmaterials control inefficiency creeps backinto the industry's routine operations, treat-ment processes designed using data obtainedduring full implementation of the pollutionprevention program will be overloaded andwill fail.
The principal objectives of a waste man-agement program, which include pollutionprevention along with wastes characteriza-tion, are to ensure: (1) that truly representa-tive samples are taken, (2) that the appropri-ate samples are taken and the appropriateanalyses performed, as dictated by the CleanWater Act and .RCiM, (3) that the informa-tion obtained is appropriate and sufficient toproduce an optimal waste-minimizationresult, and (4) that the optimum balance isstruck between the cost of the waste charac-terization study and the cost for the treat-ment facilities ultimately designed and con-structed.
Sampling EquipmentIn general, there are two types of automaticsamplers: (1) discrete and (2) integrated, ortotalizing. Discrete samplers place each indi-vidual sample into its own container. Thesesamplers are used when it is deemed to beworth the extra expense to determine thevariability of the waste stream over the sam-pling period. Integrated samplers place eachindividual sample into a common container.Figure 5-2 shows a picture of a typical auto-matic sampler.
Sample PreservationIt is always desirable to perform laboratoryanalyses of samples as soon after the sampleis taken as possible. However, appropriatemeasures must be taken to ensure that thecharacteristics of the sample that are to bemeasured in the laboratory will not change,no matter how soon (or late) after the sam-ples are taken the analyses are performed.One of the most common problems thatresults in changes in sample characteristics is

again, care must be taken not to change thecharacter of the sample. The best way todetermine the effect of sample preservation isto perform a small number of laboratoryanalyses immediately after taking a sampleand compare the results to samples subjectedto exactly the same preservation protocol,including elapsed time between sample-tak-ing and preservation and laboratory analyses,as is anticipated for the actual waste charac-terization program.
Sampling for Oil and GreaseSpecial sampling techniques must be usedwhen assaying a waste stream for certain sub-stances. Nonmiscible substances in wastewa-ter, such as oils, greases, and waxes, areexamples of substances where special sam-pling is required. In general, these substancesmust be sampled by taking grab samples,using a dipping action that ensures takingsome liquid from throughout the depth ofwastewater flow, including the surface. Thecurrent edition of Standard Methods, as wellas any special instructions issued by the EPAor other appropriate authority, must alwaysbe consulted to determine the currentlyaccepted techniques.
Sampling for Volatile SubstancesSubstances such as trichloroethylene (TCE)that have vapor pressures significantly higherthan water and that will volatilize at ambienttemperatures are additional examples of sub-stances that require special sampling tech-niques. Again, the current edition of StandardMethods, in addition to any special instruc-tions (current) issued by the EPA or otherappropriate authority, must be consultedbefore embarking on a sampling program.
Waste Audit
A Waste Audit has the primary purpose ofassessing opportunities to improve efficien-cies, decrease waste, or substitute nonhazard-ous materials for hazardous materials, and
Figure 5-2 Illustration of a typical automatic wastewatersampling device. (Courtesy of ISCO, Inc.)
bacterial action. If conditions within thesample allow bacterial metabolism, the sam-ple will not be representative of the wastestream it was taken from by the time itarrives at the laboratory.
Two common methods of preventing orminimizing bacterial growth are: (1) lower-ing the temperature of the sample, and (2)reducing the pH of the sample.
The rate of bacterial metabolism or,indeed, the metabolism of most life forms,decreases by half for every 10-degree centi-grade decrease in temperature. Metabolismessentially stops at O0C. For this reason,refrigeration, mechanically or with ice, isaccepted as a good method for preservingsamples. It must be determined prior to sam-pling, however, whether or not the refrigera-tion itself will change the characteristics ofthe sample. A possible reason for suchchange is decreased solubility of one or moresubstances in the sample, which might thenresult in precipitation of that substance.
A second method of preserving samples isto lower the pH to between 1 and 2. Here

research and development use and for labo-ratory use must also be scrutinized. It is mostimportant, especially in the case of propri-etary products, to determine each individualchemical component.
As an example, at a very large aluminumdie cast plant belonging to one of the giantsof the automobile industry, there was a prob-lem with excessive quantities of phenoliccompounds in the effluent from the waste-water treatment facility. Noncomplianceproblems forced extensive work to try toimprove removal of phenolics by the waste-water treatment equipment. At the sametime, a thorough, and unsuccessful, searchfor the source of the phenolics was carriedout. Finally, the facility management decidedto purchase and install a large activated car-bon system to use as tertiary treatment toremove the phenolic substances. It was alsodetermined that the activated carbon systemwould have to be preceded by a large sand fil-ter system. While the preliminary engineer-ing for the new tertiary system was inprogress, the search for the source of the phe-nolic substances was greatly intensified. Itwas finally determined that a detergent thatwas used every night by an outside cleaningservice was the source. The service changedto a different detergent and the entire prob-lem disappeared. Fortunately, the sand filter-activated carbon tertiary treatment systemhad not yet reached the construction stage.
Identify Hazardous Substances Leavingthe FacilityAll discharges of wastewater, solid wastes,and air must be thoroughly characterized todetermine which hazardous substances leavethe facility and in what form. This mayinclude raw materials that either were notconsumed in the process, or became a com-ponent of the final product, a portion ofwhich might be discharged as waste.
For example, chlorine is used in the man-ufacture of paper from wood pulp. One ofthe uses of chlorine is to solubilize ligninfragments that cause the pulp and, conse-
Figure 5-3 Waste Audit procedure.
thereby minimize waste generation. Anaccounting procedure is to be used, alongwith a materials balance approach to accountfor the fates of as many important substancesas possible. Figure 5-3 presents a suggestedwork plan for a Waste Audit whose focus ison hazardous substances. The sections thatfollow address each step in the Waste Audit.
Identify Purchased HazardousSubstancesThe records of the purchasing agent or thepurchasing department, along with inven-tory records, can be examined to determineall basic and proprietary chemicals and prod-ucts that are brought into the facility. Insome cases, records are maintained at corpo-rate headquarters. Materials purchased for
Identify HazardousSubstances Purchased
Identify HazardousSubstances Leaving
the Facility
Determine theSource of Hazardous
Substances
Prioritize Reductionof Waste Streams
Analyze Feasibility ofReducing Toxic Load of
Waste Streams
Evaluate PollutionPrevention Alternative
quently, the paper to have a brown color.Another function that chlorine performs isto add across the double bonds in the organicstructure of the lignin molecule, whichchanges the molecule (or molecular frag-ment) from having a brown color to beingcolorless. In summary, chlorine is used to"bleach" wood pulp in order to make whitepaper by allowing the removal of one portionof the lignin (which becomes solubilized,then rinsed away with water) and making theother portion, which stays with the pulp (andultimately the paper), colorless. The rinsewater is then wastewater, which must betreated and discharged. The chlorine thatenters into the process of adding across dou-ble bonds goes out of the plant with thepaper (product).
For each pound of chlorine purchased, aportion leaves the plant as a component ofthe wastewater, and a portion leaves the plantas a component of the salable product of theplant. Closer scrutiny will reveal that yetanother portion leaves the plant as a compo-nent of the airborne emissions, some withthe fugitive emissions and some with thestack emissions. This is because chlorine is agas at ambient temperatures, and it volatil-izes at every opportunity. It requires a verythorough and detailed study to determinethe fate of chlorine that is purchased by anintegrated pulp and paper mill.
Determine the Source of HazardousSubstancesOnce each waste stream leaving the facility(solid, liquid, and airborne) has been thor-oughly characterized, and all hazardous sub-stances are identified and/or accounted for,the next step is to determine the source ofeach one. This can be done by use of anaccounting procedure, together with princi-ples of chemistry and knowledge of the indi-vidual industrial processes. The accountingprocedure is used as a format to ensure thatall chemical reactants and products areaccounted for.
For some large industrial facilities, such adetailed accounting is a very significantundertaking. In the long term, however, theentire process is almost guaranteed to pro-duce a financial gain, rather than a long-termloss, for the industrial facility. The exampleof the floor washing detergent given above isa graphic demonstration of the benefit ofbeing tenacious in determining the source ofeach hazardous substance.
Prioritize Reduction of the WasteStreamsThe objective of this step is to identify, inorder of degree of adverse effect on the envi-ronment, which waste streams should beaddressed first, to achieve maximum benefitto the environment. Although in some casessuch prioritization will present itself as obvi-ous, in other cases an in-depth study of theaffected environment will be required todetermine proper prioritization. Forinstance, if chlorinated (halogenated) organ-ics are being discharged to an extremely largeriver, and, at the same time, a much smallerquantity per day of chlorine gas is being dis-charged to the atmosphere, but the plant is ina nonattainment area for ozone (anotherstrong oxidizing substance), the waste streamthat should receive the higher priority is notobvious. On the other hand, if the facility hasa solid waste stream that is very concentratedin a chlorinated solvent that could bereduced dramatically by installation of a new,highly efficient vapor degreaser plus a newstill for recovery and reuse of the solvent, thechoice of top priority for action is more eas-ily identified.
Analyze the Feasibility of Toxic LoadReductionTo continue with the example of the papermill, an alternative process for accomplishingthe bleaching of wood pulp to obtain whitepaper is to use oxygen, rather than chlorine,as the bleaching agent to remove about 50%of the lignin. However, to make the change,

new equipment would have to be purchasedand installed, at significant capital expense,and the value of the paper (product) mightwell be reduced because of a lesser degree ofwhiteness, though not necessarily. In order tomake an informed decision, then, a detailedanalysis of both technical feasibility and eco-nomic feasibility must be carried out.
Regarding technical feasibility, there aremany questions, including:
• Can the oxygen process, known as "oxy-gen delignification," produce pulp thatcan ultimately be "bleached" to thedesired degree of whiteness?
• Is the necessary equipment available?• Can the existing water pollution, air
emission, and solid waste control facili-ties function properly if the change ismade? Will they perform better? Will anycomponents be redundant?
• Are there other facilities and/or equip-ment in the plant that will have to bechanged?
• Will the environmental permit require-ments be met using the new process?
Regarding financial feasibility, the ques-tions include:
• Does a cost-benefit analysis support thefinancial viability of making the change?
• Can the facility actually obtain sufficientfunds to make the change?
• Can the facility survive the periodbetween the time of initial investmentand the time when overall net savingsbecome a reality?
Evaluate the Economics of PollutionPreventionIt is one thing to ascertain the financial feasi-bility of a project; it is quite another thing todetermine the short-term and long-termeffects on the overall profit and loss positionof the company. Evaluation of the economicsof pollution prevention versus otherapproaches to waste management means
evaluating the financial effects on all phasesof the product, from initial production,throughout the useful life, to final disposal.This evaluation is a very extensive undertak-ing, and interim findings must be continu-ously updated as new information becomesavailable. Continuing with the paper millexample, the decision to be made is whetherto continue with the (ever-increasing)expense of managing the wastes from thechlorine bleaching process or to invest a largecapital expenditure in an oxygen delignifica-tion system and thereby reduce waste man-agement costs. In this case, the costs of man-agement throughout the useful life and thecosts for final disposal will not be affected,because the product is, for practical pur-poses, identical whether chlorine bleachingor oxygen delignification is used. However,there are large differences in:
• Costs for the "bleaching agent" itself(chlorine compounds versus oxygencompounds)
• Costs for processing equipment• Costs for air pollution control• Costs for wastewater treatment• Costs for management of the solid
wastes (certain chlorine wastes must bemanaged as "hazardous waste")
• Costs for obtaining discharge permits• Costs for monitoring air discharges,
wastewater discharges, and solid wastesdisposal facilities
There are many more categories of coststhat are affected by a major change in indus-trial process, especially one that changesfrom a process that generates hazardouswastes to a process that does not. In the finalanalysis, it is the size of the long-term netfinancial gain or loss on which the decisionof whether or not to change a process shouldbe based.
A properly executed Waste Audit shouldresult in an overall savings in the cost ofoperation of an industrial facility, especiallyas regards the impact of the cost of wastes

handling and disposal on the annual cost ofplant operations.
Environmental Audit
An Environmental Audit is normally con-ducted to assess the state of compliance of anindustrial facility with laws and regulations.As such, there is no need to sample and ana-lyze waste streams, since typically the auditwould include analyzing previously collectedsample data. What is important, however, isto ensure that the sampling and analysiswork that has been done is appropriate to thelaw or regulation under consideration.
The two federal laws that waste (solid andliquid) discharged from industrial facilitiesmust comply with are the Clean Water Act(CWA) and the Resource Conservation andRecovery Act (RCRA). These two laws notonly place restrictions on different sub-stances, but require different protocols forsampling and analysis work in the case of
some of the substances. A third law, theClean Air Act, which sets compliance stan-dards for air emissions, will be discussed laterin this chapter.
Table 5-1 presents an example of a list ofsubstances for which the CWA and RCRA,respectively, may specify restrictions. Noticethat the CWA requires more compounds tobe analyzed than RCRA. For example, theCWA restricts the discharge of 23 metals,whereas RCRA prohibits the discharge of 8metals above certain concentrations. Mini-mum testing requirements for the CWA aredefined by Tables I through III of AppendixD to 40 CRR. Part 122. The facility may alsobe expected to report on compounds listed inTables IV and V, if there is reasonable expec-tation that the pollutant may be present.Table 5-1 is not intended to be used as guid-ance for what a facility would be expected totest for. Rather, it is intended to illustrate thatdifferent regulations require testing for dif-ferent pollutants.
Table 5-1 Requirements for Chemical, Physical, and Bacterial Analyses
Parameters
Volatile Organics
Acrolein
Acrylonitrile
Benzene
Bromobenzene
Bromodichloromethane
Bromoform
Bromomethane
Carbon tetrachloride
Chlorobenzene
Chloroethane
2-Chloroethylvinyl ether
Chloroform
Chloromethane
Dibromochloromethane
1,2-Dibromoethane
Dibromomethane
CWA NPDES List
(D
X
X
X
X
X
X
X
X
X
X
X
X
X
X
X
RCRAHazardous Waste
(2)
X
X
X
X
SDWASDWA List
(3)
P-R
U
U
P-R
P-R
U
P-R
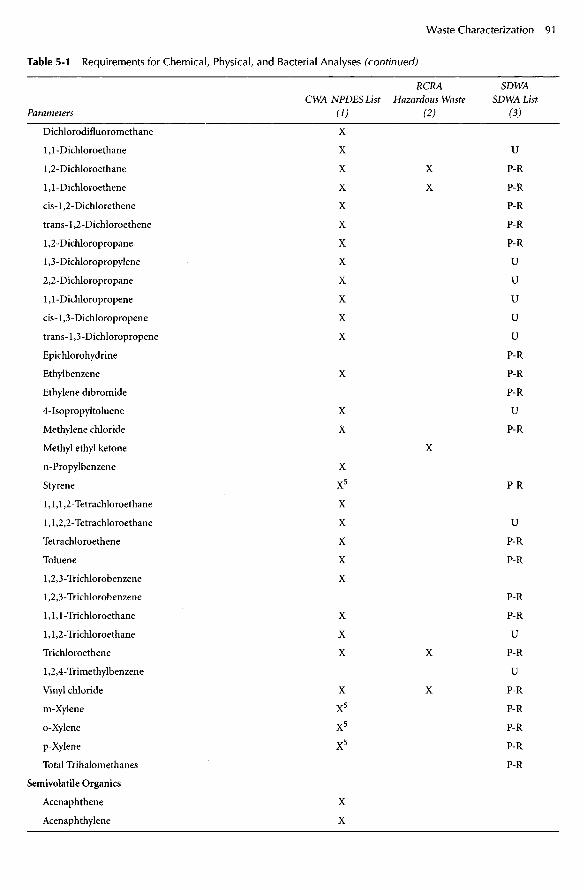
Table 5-1 Requirements for Chemical, Physical, and Bacterial Analyses (continued)
Parameters
Dichlorodifluoromethane
1,1 -Dichloroethane
1,2-Dichloroethane
1,1-Dichloroethene
cis-1,2-Dichlorethene
trans-1,2-Dichloroethene
1,2-Dichloropropane
1,3-Dichloropropylene
2,2-Dichloropropane
1,1 -Dichloropropene
cis-1,3-Dichloropropene
trans-1,3-Dichloropropene
Epichlorohydrine
Ethylbenzene
Ethylene dibromide
4-Isopropyltoluene
Methylene chloride
Methyl ethyl ketone
n-Propylbenzene
Styrene
1,1,1,2-Tetrachloroethane
1,1,2,2-Tetrachloroethane
Tetrachloroethene
Toluene
1,2,3-Trichlorobenzene
1,2,3-Trichlorobenzene
1,1,1 -Trichloroethane
1,1,2-Trichloroethane
Trichloroethene
1,2,4-Trimethylbenzene
Vinyl chloride
m-Xylene
o-Xylene
p-Xylene
Total Trihalomethanes
Semivolatile Organics
Acenaphthene
Acenaphthylene
CWA NPDES List
(DX
X
X
X
X
X
X
X
X
X
X
X
X
X
X
X
X5
X
X
X
X
X
X
X
X
X
X5
X5
X5
X
X
RCRAHazardous Waste
(2)
X
X
X
X
X
SDWASDWA List
(3)
U
P-R
P-R
P-R
P-R
P-R
U
U
U
U
U
P-R
P-R
P-R
U
P-R
P-R
U
P-R
P-R
P-R
P-R
U
P-R
U
P-R
P-R
P-R
P-R
P-R
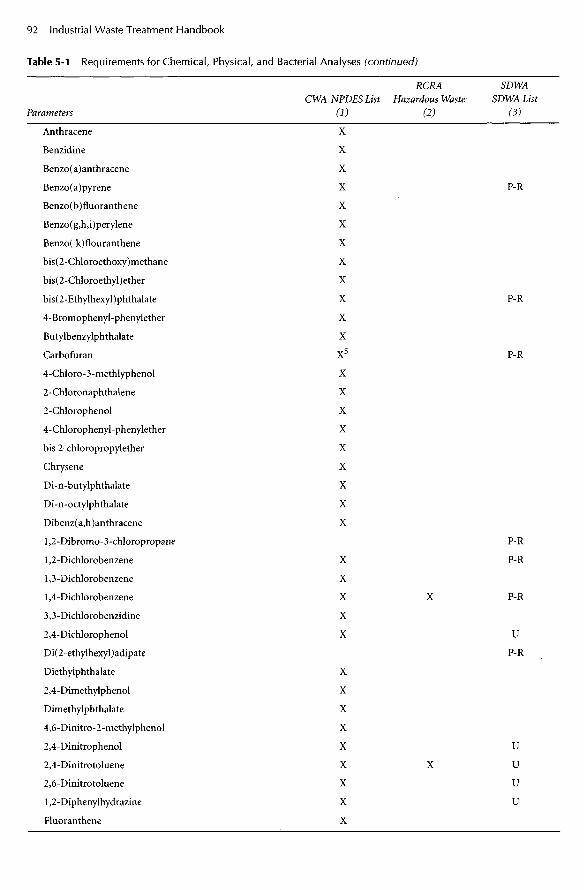
Table 5-1 Requirements for Chemical, Physical, and Bacterial Analyses (continued)
Parameters
Anthracene
Benzidine
Benzo (a) anthracene
Benzo(a)pyrene
Benzo (b)fluoranthene
Benzo(g,h,i)perylene
Benzo( k)flouranthene
bis(2-Chloroethoxy)methane
bis(2-Chloroethyl)ether
bis(2-Ethylhexyl)phthalate
4-Bromophenyl-phenylether
Butylbenzylphthalate
Carbofuran
4-Chloro-3-methlyphenol
2-Chloronaphthalene
2-Chlorophenol
4-Chlorophenyl-phenylether
bis 2-chloropropylether
Chrysene
D i- n -butylphthalate
Di-n-octylphthalate
Dibenz(a,h)anthracene
l,2-Dibromo-3-chloropropane
1,2-Dichlorobenzene
1,3-Dichlorobenzene
1,4-Dichlorobenzene
3,3-Dichlorobenzidine
2,4-Dichlorophenol
Di(2-ethylhexyl)adipate
Diethylphthalate
2,4-Dimethylphenol
Dimethylphthalate
4,6-Dinitro-2-methylphenol
2,4-Dinitrophenol
2,4-Dinitrotoluene
2,6-Dinitrotoluene
1,2-Diphenylhydrazine
Fluoranthene
CWA NPDES List
(VX
X
X
X
X
X
X
X
X
X
X
X
X5
X
X
X
X
X
X
X
X
X
X
X
X
X
X
X
X
X
X
X
X
X
X
X
RCRAHazardous Waste
(2)
X
X
SDWASDWA List
(3)
P-R
P-R
P-R
P-R
P-R
P-R
U
P-R
U
U
U
U

Table 5-1 Requirements for Chemical, Physical, and Bacterial Analyses (continued)
Parameters
Fluorene
Hexachlorobenzene
Hexachlorobutadiene
Hexachlorocyclopentadiene
Hexachloroethane
Indeno( 1,2,3-cd)pyrene
Isophorone
2-Methylphenol
3,4-Methylphenol
Naphthalene
Nitrobenzene
2-Nitrophenol
4-Nitrophenol
N-Nitroso-di-n-propylamine
N-Nitrosodimethylamine
N-Nitrosodiphenylamine
Pentachlorophenol
Phenanthrene
Phenol
Pyrene
Pyridine
Simazine
1,2,4-Trichlorobenzene
2,4,5-Trichlorophenol
2,4,6-Trichlorophenol
Pesticides/PCBs
Arochlor-1016
Arochlor-1221
Arochlor-1232
Arochlor-1242
Arochlor-1248
Arochlor-1254
Arochlor-1260
Polychlorinated biphenyls (as Arochlors) (as Decachlorobi-phenyl)
Aldrin
alpha-BHC
beta-BHC
CWA NPDES List
(DX
X
X
X
X
X
X
X
X
X
X
X
X
X
X
X
X
X
X
X
X
X
X
X
X
X
X
X
X
X
RCRAHazardous Waste
(2)
X
X
X
X
X
X
X
X
X
X
SDWASDWA List
(3)
P-R
P-R
U
U
P-R
P-R
P-R
U
P-R

Table 5-1 Requirements for Chemical, Physical, and Bacterial Analyses (continued)
Parameters
delta-BHC
gamma-BHC (Lindane)
Chlordane
4,4'-DDD
4,4'-DDE
4,4'-DDT
Dieldrin
Endosulfan I
Endosulfan II
Endosulfan sulfate
Endothall
Endrin
Endrin aldehyde
Heptachlor
Heptachlor epoxide
Methoxychlor
Oxamyl
Toxaphene
Herbicides
Alachlor
Atrazine
2,4-D
Dalapon
Dinoseb
Diquat (as Diquat dibromide monohydrate)
Glyphosate
Picloram
2,4,5-TP (Silvex)
Metals
Aluminum, total
Antimony, total
Arsenic, total
Barium, total
Beryllium, total
Boron, total
Cadmium, total
Chromium, total
Cobalt, total
CWA NPDES List
(1)
X
X
X
X
X
X
X
X
X
X
X
X
X
X
X
X5
X
X
X5
X
X5
X
X
X5
RCRAHazardous Waste
(2)
X
X
X
X
X
X
X
X
X
X
X
X
X
SDWASDWA List
(3)
P-R
P-R
U
P-R
P-R
P-R
P-R
P-R
P-R
P-R
P-R
P-R
P-R
P-R
P-R
P-R
P-R
P-R
P-R
S-R
P-R
P-R
P-R
P-R
U
P-R
P-R
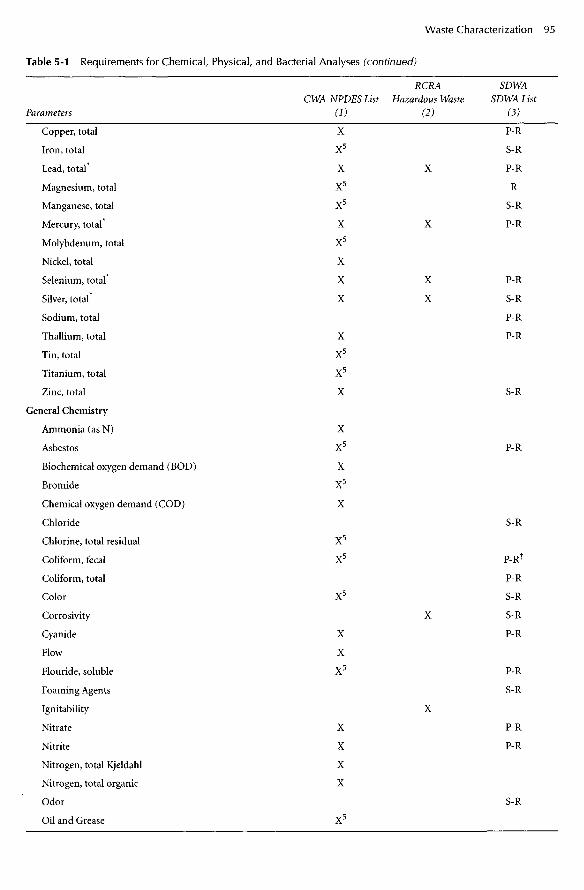
Table 5-1 Requirements for Chemical, Physical, and Bacterial Analyses (continued)
Parameters
Copper, total
Iron, total
Lead, total
Magnesium, total
Manganese, total
Mercury, total
Molybdenum, total
Nickel, total
Selenium, total*
Silver, total
Sodium, total
Thallium, total
Tin, total
Titanium, total
Zinc, total
General Chemistry
Ammonia (as N)
Asbestos
Biochemical oxygen demand (BOD)
Bromide
Chemical oxygen demand (COD)
Chloride
Chlorine, total residual
Coliform, fecal
Coliform, total
Color
Corrosivity
Cyanide
Flow
Flouride, soluble
Foaming Agents
Ignitability
Nitrate
Nitrite
Nitrogen, total Kjeldahl
Nitrogen, total organic
Odor
Oil and Grease
CWA NPDES List
(D
X
X5
X
X5
X5
X
X5
X
X
X
X
X5
X5
X
X
X5
X
X5
X
X5
X5
X5
X
X
X5
X
X
X
X
X5
RCRAHazardous Waste
(2)
X
X
X
X
X
X
SDWASDWA List
(3)
P-R
S-R
P-R
R
S-R
P-R
P-R
S-R
P-R
P-R
S-R
P-R
S-R
P-R1
P-R
S-R
S-R
P-R
P-R
S-R
P-R
P-R
S-R

Table 5-1 Requirements for Chemical, Physical, and Bacterial Analyses (continued)
Parameters
pH
Phenols
Phosphorus, total (as P)
Radioactivity, total alpha
Radioactivity, total beta
Radium 226, total
Radium 228
Radium, total
Radon, 222
Reactivity
Silica
Sulfate (as S04)
Sulfide (as S)
Sulfite (as S03)
Surfactants
Temperature
Total dissolved solids (TDS)
Total organic carbon (TOC)
Total suspended solids (TSS)
Turbidity
Uranium
Other
2,3,7,8-Tetrachloro-dibenzo-p-dioxin
CWA NPDES List
(V
X
X
X5
X
X
X
X
X
X
X5
X5
X5
X5
X
X
X
X
X
X
RCRAHazardous Waste
(2)
X
SDWASDWA List
(3)
S-R
P-R
P-R
P-R
P-R
P-R
P-R
S-R
S-R
P-R
S-R
P-R
P-R
P-R
Notes:
P = Primary drinking water analyte.
R = Regulated parameter.
S = Secondary drinking water analyte.
U = Unregulated parameter.
X = Parameter regulated by this list.
(1) This table is an example of what could be required for an NPDES permit; refer to 40 CRR. Part 122 for specific details.NPDES = National Pollutant Discharge Elimination System.
(2) Current reference list: 55FR 11862, March 29,1990, as amended at 55 FR 22684, June 1,1990; 55 FR 26987, June 29, 1990;58 FR46049, August 31, 1993; 67 FR 11254, March 13, 2002.
(3) Current reference list: 40 CRR. Part 141 Subpart F (56 FR 3593, January 30, 1991, as amended).
(4) Information provided by Katahdin Analytical Services, Westbrook, ME.
*RCRA regulates hazardous waste based on toxic characteristic leaching procedure (TCLP) and the characteristics ofignitability, corrosivity, and reactivity.
fOnly required if total Coliform analysis is positive.

To further illustrate the point that it isimportant to understand which testing isrequired under the governing permit, theSafe Drinking Water Act (SDWA) contains alist of restricted substances that is different insome respects from either CWA or RCRAand requires different protocols to analyzefor some substances. It is very importantwhen engaging the services of an analyticallaboratory to inform the analysts of theappropriate law (CWA, RCR, SDWA, etc.) towhich the analyses should conform.
RCRA requires waste generators to deter-mine whether each segregable waste stream isa hazardous waste. The determination can bemade one of two ways: either by samplingand specified analyses, or based on the gener-ator's knowledge of the process generatingthe waste and the chemistry of the waste. Forpurposes of determining whether a wastestream is hazardous waste, the determinationmust be made at the point of generation, asopposed to after it has been commingledwith other (separate) waste streams. In somecases, it is necessary to store certain wastestreams and manage them separately, ratherthan discharge them to an industrial wastetreatment facility or to a POTW.
Characteristics of Industrial WasteIndustrial wastes are classified as wastewater,solid wastes, or air discharges. There is someoverlap of physical characteristics of the sub-stances contained in each of these three clas-sifications of wastes, since wastewater cancontain dissolved gases and suspended andsettleable solids, solid waste streams caninclude compressed gases, liquids, and cer-tain solids, and air discharges can containvaporized liquids, liquids in the aerosol state,and solid particles known as particulateemissions. The basis of the classification isthe environmental medium to which thewaste is discharged, and the characterizationof the waste is normally based on the body oflaws and regulations that govern thatmedium.
Characteristics of IndustrialWastewater
Priority PollutantsWhereas the term hazardous waste is nor-mally associated with solid waste and is regu-lated under 40 CRR. Subpart C, the termpriority pollutant is used in association withwastewater constituents that are of a hazard-ous nature. At the writing of this text, therewere 126 substances, in the five categories of(1) Metals, (2) Pesticides/PCBs, (3) Semivol-atile Organics, (4) Volatile Organics, and (5)General Chemistry, designated by the EPA aspriority pollutants, as shown in Table 5-2.
Atomic adsorption (AA) analysis andinductively coupled plasma (ICP) analysisare typical methods used to determine con-centrations of metals. A technique that com-bines gas chromatography with the massspectrometer, referred to as "GC-mass spec,"is used to analyze for the volatile and semiv-olatile organics listed in Table 5-2. In thistechnique, the gas chromatograph is used toseparate the organics from each other, andthe mass spec is used to determine the con-centration of each specific organic com-pound.
The characteristics of industrial wastewa-ters are determined in accordance with sev-eral sets of laws and regulations that governthe quality of water bodies, both surfacewater and ground water. These laws and reg-ulations include the Clean Water Act (CWA),the Resource Conservation and Recovery Act(RCRA), and the Safe Drinking Water Act(SDWA), as explained above. Each of theselaws defines a number of physical, chemical,and biological characteristics and specifies aprotocol to be used in determining each ofthe characteristics. The following text pre-sents general descriptions of many of thecharacteristics regulated by one or more ofthe CWA, RCRA, or SDWA.
BODThe standard five-day BOD test is the mostcommonly used method to estimate the totalquantity of biodegradable organic material

Table 5-2 Priority Pollutants
Parameter U.S. EPA Method # Typical Laboratory PQL
Volatile Ug/L
Acrolein 624 5
Acrylonitrile 624 50
Benzene 624 5
Carbon tetrachloride (tetrachloromethane) 624 5
Chlorobenzene 624 5
1,2-dichloroethane 624 5
1,1,1-trichloreothane 624 5
1,1-dichloroethane 624 5
1,1,2-trichloroethane 624 5
1,1,2,2-tetrachloroethane 624 5
Chloroethane 624 10
2-chloroethyl vinyl ether (mixed) 624 10
Chloroform (trichloromethane) 624 5
1,1-dichloroethylene (dichloroethene) 624 5
1,2-trans-dichloroethene 624 5
1,2-dichloropropane 624 5
1,2-dichloropropylene (1,3-dichloropropene) 624 5
Ethylbenzene 624 5
Methylene chloride (dichloromethane) 624 10
Methyl chloride (chloromethane) 624 5
Methyl bromide (bromomethane) 624 10
Bromoform (tribromomethane) 624 5
Dichlorobromomethane (dibromochloromethane) 624 5
Chlorodibromomethane (bromodichloromethane) 624 5
Tetrachloroethylene 624 5
Toluene 624 5
Trichloroethylene 624 5
Vinyl chloride (chloroethylene) 624 10
Semivolatile Ug/L
Acenaphthene 625 5
Benzidine 625 25
1,2,4-trichlorobenzene 625 5
Hexachlorobenzene 625 5
Hexachloroethane 625 5
Bis(2-chloroethyl) ether 625 6
2-chloronaphthalene 625 5
2,4,6-trichlorophenol 625 5
Parachlorometa cresol 625 5

Table 5-2 Priority Pollutants (continued)
Parameter U.S. EPA Method # Typical Laboratory PQL
2-chlorophenol 625 5
1,2-dichlorobenzene 625 5
1,3-dichlorobenzene 625 5
1,4-dichlorobenzene 625 5
3,3-dichlorobenzidine 625 10
2,4-dichlorophenol 625 5
2,4-dimethylphenol 625 5
2,4-dinitrotoluene 625 5
2,6-dinitrotoluene 625 5
1,2-diphenylhydrazine 625 5
Fluoranthene 625 5
4-chlorophenyl phenyl ether 625 5
4-bromophenyl phenyl ether 625 5
Bis(2-chloroisopropyl) ether 625 5
Bis(2-chloroethoxy) methane 625 5
Hexachlorobutadiene 625 5
Hexachloromyclopentadiene 625 5
Isophorone 625 5
Naphthalene 625 5
Nitrobenzene 625 5
2-nitrophenol 625 5
4-nitrophenol 625 5
2,4-dinitrophenol 625 25
4,6-dinitro-o-cresol (4,6-dinitro-2-methylphenol) 625 25
N-nitrosodimethylamine 625 5
N-nitrosodiphenylamine 625 5
N-nitrosodi-n-propylamine 625 5
Pentachlorophenol 625 5
Phenol 625 5
Bis(2-ethylhexyl) phthalate 625 5
Butyl benzyl phthalate 625 5
Di-N-butyl phthalate 625 5
Di-n-octyl phthalate 625 5
Diethyl phthalate 625 5
Dimethyl phthalate 625 5
1,2-benzanthracene (benzo(a) anthracene) 625 5
Benzo(a)pyrene (3,4-benzo-pyrene) 625 5
3,4-Benzofluoranthene (benzo(b) fluoranthene) 625 5
11,12-benzofluoranthene (benzo(b) fluoranthene) 625 5

Table 5-2 Priority Pollutants (continued)
Parameter U.S. EPA Method # Typical Laboratory PQL
Chrysene 625 5
Acenaphthylene 625 5
Anthracene 625 5
1,1,2-benzoperylene (benzo(ghi) perylene) 625 5
Fluorene 625 5
Phenanthrene 625 5
1,2,5,6-dibenzanthracene (dibenzo(a,h) anthracene) 625 5
Indeno(l,2,3-cd) pyrene (2,3-o-pheynylene pyrene) 625 5
Pyrene 625 5
Pesticides/PCBs Ug/L
Aldrin 608 0.05
Dieldrin 608 0.1
Chlordane (technical mixture and metabolites) 608 0.05
4,4-DDT 608 0.1
4,4-DDE (p,p-DDX) 608 0.1
4,4-DDD (p,p-TDE) 608 0.1
Alpha-endosulfan 608 0.05
Beta-endosulfan 608 0.05
Endosulfan sulfate 608 0.1
Endrin 608 0.1
Endrin aldehyde 608 0.1
Heptachlor 608 0.05
Heptachlor epoxide (BHC-hexachlorocyclohexane) 608 0.05
Alpha-BHC 608 0.05
Beta-BHC 608 0.05
Gamma-BHC (lindane) 608 0.05
Delta-BHC (PCB-polychlorinated biphenyls) 608 0.05
PCB-1242 (arochlor 1242) 608 0.5
PCB-1254 (arochlor 1254) 608 0.5
PCB-1221 (arochlor 1221) 608 1.0
PCB-1232 (arochlor 1232) 608 0.5
PCB-1248 (arochlor 1248) 608 0.5
PCB-1260 (arochlor 1260) 608 0.5
PCB-1016 (arochlor 1016) 608 0.5
Toxaphene 608 1.0
Metals mg/L
Antimony 200.7 0.008
Arsenic 200.7 0.005
Beryllium 200.7 0.005

Table 5-2 Priority Pollutants (continued)
Parameter U.S. EPA Method # Typical Laboratory PQL
Cadmium 200.7 0.010
Chromium 200.7 0.015
Copper 200.7 0.025
Lead 200.7 0.005
Mercury 245.1 0.2 ug/L
Nickel 200.7 0.040
Selenium 200.7 0.010
Silver 200.7 0.015
Thallium 200.7 0.015
Zinc 200.7 0.025
Other
2,3,7,8-tetrachloro-dibenzo-p-dioxin (TCDD) 613 lOppt
Cyanide, total 335.4 0.01 mg/L
Asbestos 100.2 7MF/L>10um
Notes:
40 CRR. Part 423-126 Priority Pollutants, Appendix A.
PQL = Practical Quantitation Limit.
Laboratory limits are from a commercial laboratory, Katahdin Analytical Services, Inc., Westbrook, ME.
in wastewater. The results of the five-dayBOD test (abbreviated BOD5) are consideredto be estimates of the amount of oxygen thatwould be consumed by microorganisms inthe process of using the organic materialscontained in a wastewater for food forgrowth and energy. Some of the organicmaterial will thus be converted to additionalmicroorganisms, some will be converted tocarbon dioxide, and some to water. Oxygen isneeded for all three purposes, as seen inequation 5-1.
Organic matter + microorganisms+ O2 "^ more microorganisms (5-1)+ CO2 + H2O
CODChemical Oxygen Demand (COD) is a sec-ond method of estimating how much oxygenwould be depleted from a body of receivingwater as a result of bacterial action. While theBOD test is performed by using a population
of bacteria and other microorganisms toattempt to duplicate what would happen in anatural stream over a period of five days, theCOD test uses a strong chemical oxidizingagent (potassium dichromate or potassiumpermanganate) to chemically oxidize theorganic material in the sample of wastewaterunder conditions of heat and strong acid.The COD test has the advantage of not beingsubject to interference from toxic materials,as well as requiring only two or three hoursfor test completion, as opposed to five daysfor the BOD test. It has the disadvantage ofbeing completely artificial, but is neverthe-less considered to yield a result that may beused as the basis upon which to calculate areasonably accurate and reproducible esti-mate of the oxygen-demanding properties ofa wastewater. The COD test is often used inconjunction with the BOD test to estimatethe amount of nonbiodegradable organicmaterial in a wastewater. In the case of biode-gradable organics, the COD is normally inthe range of 1.3 to 1.5 times the BOD. When

the result of a COD test is more than twicethat of the BOD test, there is good reason tosuspect that a significant portion of theorganic material in the sample is not biode-gradable by ordinary microorganisms. As aside note, it is important to be aware that thesample vial resulting from a COD test cancontain leachable mercury above regulatorylimits. If such is the case, the sample must bemanaged as a toxic hazardous waste.
Ultimate BODThe term "ultimate BOD," designated byBOD11, refers to the quantity of oxygen thatwould be used by microorganisms in con-verting the entire amount of organic materialin a given volume of wastewater to carbondioxide and water, given unlimited time asopposed to a time limit of five days. The ulti-mate BOD of a known substance can be esti-mated as shown in the following example.
Example 5-1Estimate the BOD11 of a waste stream con-taining 100 mg/L of pure ethanol.
SolutionThe first step is to write out and balance anequation depicting the complete oxidation,with oxygen, of a molecule of the appropriatesubstance (ethanol, in this case):
C2H5OH + 2 O2 -» 2CO2
+ 3H2O (5-2)
Next, using the mole ratio of oxygen toethanol as calculated by balancing the equa-tion, as well as the respective molecularweights of each substance, multiply the con-centration in mg/L of ethanol in the waste-water by this mole ratio, and by the molecu-lar weight of oxygen divided by the molecu-lar weight of ethanol, to obtain the BOD11 ofthat wastewater:
Mole ratio, oxygen/ethanol = 2/1 = 2.0mol. wt. of ethanol = 38mol. wt. of oxygen =16
Therefore, given the ratio of molecularweights, oxygen/ethanol = 0.42, and the ulti-mate BOD of the solution of ethanol is calcu-lated by:
100 mg/L x 2 mole O2/mole ethanolX 0.42 = 84 mg/L (5-3)
pH, Acidity, and AlkalinityThe term pH refers to the concentration ofhydrogen ions in an aqueous solution, where"aqueous solution" means either pure wateror water with small (in terms of molaramounts) quantities of substances dissolvedin it. Strong solutions of chemicals, such asone-molar sulfuric acid or a saturated solu-tion of sodium chloride, do not qualify asaqueous solutions. In those solutions, thenormal pH range of 0 to 14, which equals thenegative logarithm of the hydrogen ion con-centration in moles per liter, has no meaning.Since the pH of an aqueous solution isnumerically equal to the negative log of thehydrogen ion concentration (in moles perliter), it can be readily calculated using thefollowing equation:
pH = log (1/[H+] (5-4)
It is therefore indicative of the acidic or basiccondition of a wastewater (pH valuesbetween 0 and 7.0 indicate acidic conditions,and pH values between 7.0 and 14 indicatealkaline conditions). However, pH is notequivalent to acidity or alkalinity. A wastewa-ter may have a pH of 2.0 but have lower acid-ity than another wastewater having a pH of4.0. Likewise, a wastewater having a pH of9.0 may, or may not, have more alkalinitythan a wastewater having a pH of 10.6.
Alkalinity and acidity are defined as theability of an aqueous solution to resist achange in pH. Alkalinity and acidity are mea-sured by determining the quantity of a solu-tion of acid or base, as appropriate, of knownconcentration that is required to completelyneutralize the acidity or alkalinity of theaqueous solution.

Aqueous solutions (wastewaters, forexample) that are high in either acidity oralkalinity are said to be highly buffered andwill not readily change in pH value as a resultof influences such as bacterial action orchemical reaction. Depending on the anionspecies involved in the alkalinity or acidity,an aqueous solution can be buffered in lowpH ranges, high pH ranges, or neutral (nearpH 7) pH ranges.
D.O.Dissolved Oxygen (D.O.) concentration isusually determined by either a wet chemistrymethod known as "the azide modification ofthe Winkler method," or by use of a probeand meter. The wet chemistry method is con-sidered to be the standard for comparison,when the color and other properties of theaqueous solution (industrial waste and soon) do not preclude its use. However, theprobe and meter method is the most com-monly used.
The standard D.O. probe consists of twosolid electrodes emersed in an electrolyte andseparated from the solution being tested by aplastic membrane that is permeable to oxy-gen. The oxygen can be in the dissolved stateor the gaseous state. When the probe isemersed in the test solution, oxygen passesfrom the solution through the membraneand into the electrolyte in direct proportionto its concentration in the solution. As theoxygen enters the electrolyte, it changes theconductivity. This change is detected by thetwo electrodes and is registered on the meter.
Oxygen is only sparingly soluble in water,and its solubility decreases with increasingtemperature. Increasing dissolved solids con-centrations also decrease the solubility ofoxygen. The saturation concentration of oxy-gen in deionized water at 1.00C and standardair pressure is 14.2 parts per million (ppm);this is equivalent to about one drop from aneye-dropper in one gallon. This is in contrastto the concentration of oxygen in air, whichis about 230,000 ppm, or 23%. Still, the spe-cies that live in water are sensitive to rela-
tively small changes in the already extremelylow quantity of oxygen available to them.Trout, for instance, do very well when theD.O. concentration is 7 ppm, but die whenthe D.O. concentration falls below 5 ppm.The microorganisms in activated sludgethrive when the D.O. concentration is 1.5ppm, a seemingly negligible amount (or, touse the previous example, about one drop inten gallons). Moreover, small differences inD.O. concentration in aerobic wastewatertreatment systems, such as activated sludge,result in significant changes in the popula-tions of different species of microorganisms.These changes, in turn, change the settleabil-ity of the sludge, the clarity of the treatedeffluent, and the overall performance of thetreatment system.
MetalsWhile the term heavy metals can mean differ-ent things depending on the context in whichit is used, for the purpose of this discussion,heavy metals are those elements located in ornear the middle of the periodic table. Figure5-4 shows the periodic chart with the ele-ments considered heavy metals highlighted.Many of these heavy metals are toxic to livingentities, including humans and bacteria. Forthis reason, heavy metals are regulatedthrough the various environmental laws.
Table 5-3 shows the heavy metals that areregulated by the Clean Water Act (CWA),RCRA, and the SDWA. Table 5-4 lists all themetals that are regulated by the CWA, as wellas the applicable U.S. EPA Method Numberand the corresponding "Practical Quantita-tion Limit," which is essentially the limit ofdetection for that method. The standardmethod for measuring the concentration ofall of the heavy metals listed in Table 5-3 is byatomic adsorption analysis (AA).
ColorColor is measured using visual comparisonto an arbitrary standard. The standard ismade, normally, by dissolving potassiumchloroplatinate (K2PtCl6) and cobalt chlo-

Mokeur's Periodic table of the elements
Figure 5-4 The periodic table.
18VIIIAHe 2
4.002602
HeliumNeIO20.1797
NeonAr 1839.948
Argon
17VIIA
F918.9984032
4.0 I -
FluorineCl 1735.4527
3.0 1-
Chlorine
16VIA08
15.9994
3.5 2-
OxygenS 1632.066
1.8 4+
Sulfur
15VAN7
14.00674
3.0 3+,3-
P 1530.973762
2.1 5+
Phosphorus
14IVAC612.011
2.5 A+A-
CarbonSi 1428.0855
1.8 4+
Silicon
13III AB5
10.811
2.0 3+
BoronAl 13
26.981539
1.5 3+
Aluminum
12H B
11IB
109— VIII -
^ Relativeatomic mass
^- Most frequentoxidation number
7 8
VIIB /~
1.00794 ^
- 2.1 1 + N
Hydrogen
Name
6VIB
Electronegativity
4 5IVB V B
3III B
2HA
Mg 1224.3050
1.2 2+
Magnesium
IA
Hl1.00794
2.1 1 +
HydrogenLi 36.941
1.0 1 +
LithiumNail22.989768
0.9 1 +
Sodium
1
2
3
Kr 3683.80
Xe 54131.29
XenonRn 86
222.0176
RadonUuo 118
293
Ununoctium
79.904
2.8 1-
Bromine153
126.90447
2.5 1-
IodineAt 85209.9871
2.2 1-
Astatine
Te 52127.60
2 I 4+
TelluriumPo 84208.9824
2.0 2+
PoloniumU u h l l 6
289
Ununhexium
Bi 83208.98037
1.9 3+
Ge 3272.61
1.6 4+
GermaniumSn 50118.71
1.8 4+
Tin
Uuq 114289
Ununquadium
69.723
1.6 3+
GalliumIn 49114.82
1.7 3+
Indium
Uu 112in
Ununbium
Au 79196.96654
2.4 3+
GoldUuu 111
272
Unununium
Pd 46106.42
2.2 2+
PalladiumPt 78
195.08
2.2 4+
PlatinumUun 110
269
Ununnilium
Co 2758.9332
1.8 2+
Rh 45102.9055
2.2 3+
RhodiumIr 77192.22
2.2 4+
IridiumMt 109266.1378
Maitnerium
Fe 2655.847
1.8 3+
IronRu 44
101.57
2.2 3+,4+
RutheniumOs 76
190.2
2.2 4+
OsmiumHs 108
264
Hassium
Tc 4398.9063
1.9 7+
Re 75186.207
1.9 7+
Bh 107262.12
Bohrium
Mo 4295.94
1.8 6+
MolybdenumW 74183.85
1.7 6+
TunsstenSg 106
263.12
Seaborsium
V 2350.9415
Nb4im
92.90638
1.6 ^ 5+
Ta 73180.9479
1.5 5+
Db 105262.11
Tantalum
Ti 2247.88
1.5 4+
TitaniumZr 4091.224
1.4 4+
ZirconiumHf 72178.49
1.3 4+
HafniumRf 104
261.11
Rutherfordium
Sc 2144.955910
13 3+
ScandiumY 39
88.90585
13 3+
YttriumLa 57138.9055
1.1 3+
227.0278
1.1 3+
Actinium
Ca 2040.078
1.0 2+
CalciumSr 38
87.62
1.0 2+
StrontiumBa 56137.327
0.9 2+
BariumRa 88226.0254
0.9 2+
Radium
K 1939.0983
0.8 1 +
PotassiumRb 3785.4678
0.8 1 +
RubidiumCs 55
132.90543
0.7 1 +
CesiumFr 87223.0197
0.7 1 +
Francium
4
5
6
7
Atomic numberSymbol
Lu 71174.967
1.2 3+
LutetiumLr 103260.1053
Lawrencium
Yb 70173.04
1.1 3+
YtterbiumNo 102259.1009
1.3
Nobelium
Tm 69168.93421
1.2 3+
Md 10?258.01
1.3
167.26
1.2 3+
ErbiumFmIOO257.0951
1.3
Fermium
Ho 67164.93032
1.2 3+
Holmium
252.03
1.3
Einsteinium
Dy 66162.50
1.2 3+
Dysprosium
251.0796
1.3 3+
Californium
168.92534
1.2 3+
247.0703
1.3 3+
Berkelium
Gd 64157.25
1.2 3+
GadoliniumCm 96
247
1.3 3+
Curium
Eu 63151.965
1.2 3+
EuropiumAm 95243.0614
1.3 3+
Americium
Sm 62150.36
1.2 3+
SamariumPu 94
244.0642
1.3 4+
Plutonium
Pm 61144.9127
1.1 3+
PromethiumNp 93237.082
1.3 5+
Neptunium
Nd 60144.24
1.1 3+
NeodymiumU 92
238.0289
1.4 6+
Uranium
140.90765
1.1 3+
Pa 91231.03588
1.5 5+
Protactinium
Ce 58140.115
1.1 3+
CeriumTh 90232.0381
1.3 4+
Thorium
6
7
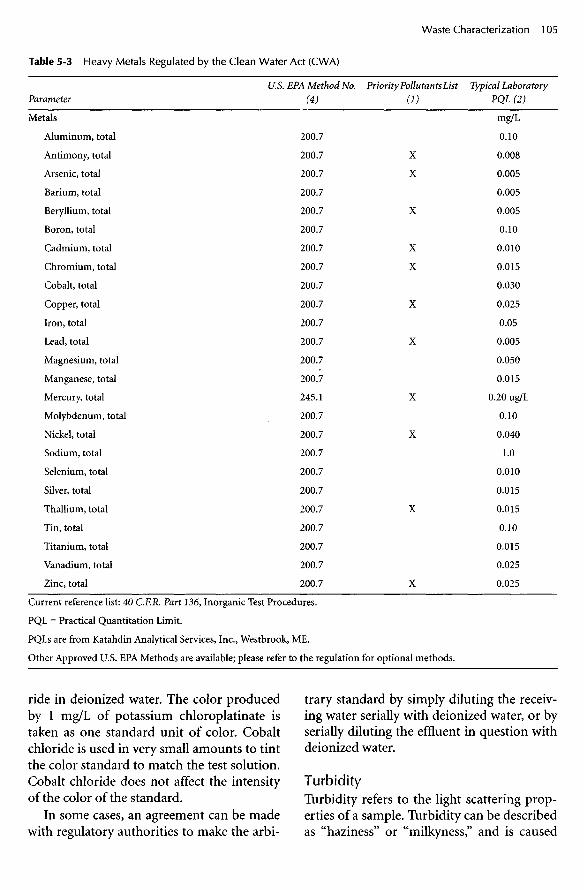
Table 5-3 Heavy Metals Regulated by the Clean Water Act (CWA)
Parameter
Metals
Aluminum, total
Antimony, total
Arsenic, total
Barium, total
Beryllium, total
Boron, total
Cadmium, total
Chromium, total
Cobalt, total
Copper, total
Iron, total
Lead, total
Magnesium, total
Manganese, total
Mercury, total
Molybdenum, total
Nickel, total
Sodium, total
Selenium, total
Silver, total
Thallium, total
Tin, total
Titanium, total
Vanadium, total
Zinc, total
U.S. EPA Method No.(4)
200.7
200.7
200.7
200.7
200.7
200.7
200.7
200.7
200.7
200.7
200.7
200.7
200.7
200.7
245.1
200.7
200.7
200.7
200.7
200.7
200.7
200.7
200.7
200.7
200.7
Priority Pollutants List
(D
X
X
X
X
X
X
X
X
X
X
X
Typical LaboratoryPQL (2)
mg/L
0.10
0.008
0.005
0.005
0.005
0.10
0.010
0.015
0.030
0.025
0.05
0.005
0.050
0.015
0.20 ug/L
0.10
0.040
1.0
0.010
0.015
0.015
0.10
0.015
0.025
0.025
Current reference list: 40 C.F.R. Part 136, Inorganic Test Procedures.
PQL = Practical Quantitation Limit.
PQLs are from Katahdin Analytical Services, Inc., Westbrook, ME.
Other Approved U.S. EPA Methods are available; please refer to the regulation for optional methods.
ride in deionized water. The color producedby 1 mg/L of potassium chloroplatinate istaken as one standard unit of color. Cobaltchloride is used in very small amounts to tintthe color standard to match the test solution.Cobalt chloride does not affect the intensityof the color of the standard.
In some cases, an agreement can be madewith regulatory authorities to make the arbi-
trary standard by simply diluting the receiv-ing water serially with deionized water, or byserially diluting the effluent in question withdeionized water.
TurbidityTurbidity refers to the light scattering prop-erties of a sample. Turbidity can be describedas "haziness" or "milkyness," and is caused

by fine particles scattering light at more orless 90 degrees to the direction from whichthe light enters the sample. Turbidity is notto be confused with color, nor color with tur-bidity.
Turbidity is normally measured using anelectronic device in which a beam of ordi-nary white light is directed through a certainpath length of the sample. Photometersplaced at right angles to the direction oftravel of the light beam detect the amount oflight diverted, which is directly proportionalto the turbidity, expressed in NTUs(Nephelometric Turbidity Units).
Compounds Containing PhosphorusWhen treated wastewaters are discharged tonatural water systems, various effects canresult, depending on which substancesremain in the treated effluent and in whichform. One of the more significant effects isenhancement of eutrophication within thereceiving water system if significant quanti-ties of phosphorus, in forms available toalgae, are discharged.
Eutrophication, or the growth and prolif-eration of plant life, including algae, is alwaysunder way in any natural fresh water system:rivers, streams, ponds, or lakes. However, it islimited by the scarcity of nutrients such asphosphorus and nitrogen. At a minimum,plants, including algae, need carbon, nitro-gen, and phosphorus in relatively abundantamounts, and potassium, sodium, calcium,magnesium, sulfur, and a host of additionalelements in smaller amounts. Any one ofthese required substances can be the limitingsubstance that holds growth to a given level,when the substance becomes depleted as aresult of that growth. In a majority of cases inthe natural environment, that limiting sub-stance is phosphorus.
If treated wastewater discharged to a natu-ral water system significantly increases theinventory of phosphorus, the natural controlon the quantity of plant growth that can besupported by that natural water system willbe removed, and a disastrous level of
Table 5-4 Phosphorus Compounds CommonlyEncountered in Environmental Engineering Practice
Name Formula
Orthophosphates
Trisodium phosphate Na3PO4
Disodium phosphate Na2HPO4
Monosodium phosphate NaH2PO4
Diammonium phosphate (NH4)2HPO4
Polyphosphates
Sodium hexametaphosphate Na3(PO3)6
Sodium tripolyphosphate Na5P3O10
Tetrasodium pyrophosphate Na4P2O7
eutrophication can result. For this reason,many waste discharge permits include arestriction to limit the discharge of phospho-rus.
Phosphorus exists in wastewater in manyforms, the most basic of which is orthophos-phate, PO4
=. Several forms of orthophos-phate are encountered in industrial wastewa-ter. A list of the most common is presented inTable 5-4. Table 5-4 also lists several poly-phosphates encountered in industrial waste-water treatment. Polyphosphates are simplychains of orthophosphate (PO4
=) unitsformed by dehydration. All polyphosphatesin aqueous solution gradually hydrolyze andrevert back to the orthophosphate form inthe natural environment.
Compounds Containing NitrogenAs explained in the previous section onCompounds Containing Phosphorus, disas-trous eutrophication can result in a naturalwater body if the substances that constitutethe growth limiting nutrients for algae andother plants are augmented in quantity bythe discharge of treated wastewaters. Sincenitrogen, needed for production of proteinsand other components of living cells, can bethe substance that limits the level of algaegrowth, it is often one of the substancesrestricted in wastewater discharge permits.

Nitrogen can exist in as many as sevenvalence states, as shown:
3" 0 I+ 2+ 3+ 4+ 5+
NH3 N2 N2O NO N2O3 NO2 N2O5
(5-5)
All but the valence states of I+ and 4+ areoften encountered in industrial waste dis-charge management (the 2+ valence state isvery often encountered in discharges to theair), and each valence state can be convertedto any other valence state by natural biologi-cal processes. Accordingly, the total amountof nitrogen, or the sum of all the differentforms, is commonly limited by wastewaterdischarge permits.
Total SolidsSubstances can exist in aqueous solution ineither the dissolved or the nondissolved state.The residue that is left after evaporating asample of water at 1030C is referred to as thetotal solids value of that sample. It is gener-ally regarded as everything that was in thesample that was not water. However, any ofthe substances originally present, organic orinorganic, that volatilized at 1030C, or less,will not be in the residue. Figure 5-5 presentsa schematic breakdown of substances thatcan be measured as total solids in a sample ofwastewater.
Suspended SolidsSolids that will not pass through a 0.45-micron filter are referred to as total sus-pended solids (TSS). Since the standardmethod for measuring TSS involves shakingthe sample thoroughly before filtering, theTSS actually includes all nondissolved solids,as opposed to simply the dissolved solids thatwill not settle under the influence of gravity.Results of the test for settleable solids cannotbe subtracted from the results of the test fortotal suspended solids to obtain the value ofthe quantity of nondissolved solids in a sam-ple that will not settle under the influence of
gravity, because the standard test for settle-able solids yields a value in terms of ml/L,while the standard test for TSS yields a valuein terms of mg/L. If it is desired to estimatethe quantity of nonsettleable TSS, a specialprocedure must be devised and thendescribed thoroughly in the presentation ofresults.
Settleable SolidsSettleable solids are nondissolved solids thatwill settle to the bottom of a container underthe influence of gravity. The standard devicefor measuring settleable solids is the Imhoffcone, pictured in Figure 5-6. The standardtest for settleable solids involves shaking asample thoroughly, filling the 1-liter Imhoffcone to the full mark, and then allowing thesample to settle for one hour under quiescentconditions. Settleable solids are reported asmilliliters of settleable materials per liter ofsample (ml/L). In order to obtain a value ofthe weight of settleable material, it would benecessary to remove the supernatant and toevaporate to dryness that volume of samplethat contained the settleable solids. Theresult, of course, will include the dissolvedsolids contained in the liquid remaining withthe settled solids. If this volume is small com-pared to the total (one liter) sample, the"error" will be small. This procedure is neverdone in the context of a wastewater dischargepermit but may be done for the engineeringor planning purposes of the discharger.
Total Volatile Suspended Solids (TVSS)The standard method for estimating thequantity of nondissolved organic material ina wastewater sample is to perform a TSS test,as explained above, and then to place the0.45-micron filter with the solids depositedthereon in a furnace at 6000C for a sufficienttime to "burn" all of the material that willoxidize to carbon dioxide at that tempera-ture. The material that remains on the filterafter this procedure is the material that willnot combine with oxygen and volatilize as

Total Solids
Filter through0.45^1 Filter
Solids Heldon FilterFiltrate
Evaporation
Total DissolvedSolids
Muffle Furnaceat 6000C
NonsettleableSuspended
Solids
Evaporation
Total SuspendedSolids
SettleableSuspended
Solids
Muffle Furnaceat 6000C
Remaining
Fixed Volatile
Remaining
FixedVolatileFixed
DissolvedSolids
VolatileDissolved
Solids
Figure 5-5 Solids in wastewater.

Figure 5-6 Imhoff cones used to measure settleable solids.
carbon dioxide at 6000C. These solids arereferred to as "fixed" solids and are consid-ered to be the inorganic portion of the sus-pended solids in the wastewater sample. Thisvalue, subtracted from the TSS value, pro-duces the total volatile suspended solids por-tion of the wastewater sample and is thus anestimate of the quantity of undissolvedorganic material in the original wastewatersample.
Oil and GreaseThere are three methods of estimating thequantity of oil and grease in a wastewatersample, each of which is considered a stan-dard method. When reporting results, how-ever, the method used is actually part of theresult. In other words, as stated in StandardMethods, ". . . oils and greases are defined bythe method used for their determination."The three methods are:
1. The partition-gravimetric method2. The partition-infrared method3. The Soxlet extraction method
All three involve extracting the oil andgrease substances from the raw sample by useof a solvent. Also, all three require that thesample be acidified to pH 2.0 or lower byadding hydrochloric or sulfuric acid beforethe extraction process takes place.
The Partition-Gravimetric MethodThe partition-gravimetric method involvesextracting dissolved or emulsified oil and
grease by intimate contact with an extractingsolvent, which can be one of the following:
• n-Hexane• Methyl-tert-butyl ether (MTBE)• Solvent mixture, 80% n-hexane/20%
MTBE, v/v
The sample and the solvent are placedtogether in a separatory funnel and shaken.Then the solvent (with dissolved oil andgrease from the sample) is drawn off andpassed through a funnel containing filterpaper and 1Og sodium sulfate. The solvent isevaporated at 85°C, and the quantity of oiland grease is determined gravimetrically.
The Partition-Infrared MethodThe partition-infrared method makes use oftrichlorotrifluoroethane as the extractionsolvent. Use of this solvent allows use ofinfrared light, which is absorbed by the car-bon-carbon double bond that is characteris-tic of oil and grease substances. Thus, sub-stances that are dissolved by trichlorotrifluo-roethane and are volatilized at 850C aredetected by this method. The extraction pro-cedure is the same as for the partition-gravi-metric method. Following the extraction, thequantity of oil and grease is determinedusing photometric techniques with light inthe infrared zone (3,200 cm"1 to 2,700 cm"1).
The Soxlet Extraction MethodThe Soxlet extraction method uses the samethree choices of solvent as for the partition-gravimetric method: n-hexane, MTBE, or an80/20 v/v mixture of the two. The extractionprocedure, however, is carried out in a refluxapparatus as opposed to a separatory funnel.After extraction, the quantity of oil andgrease is determined gravimetrically.
The oil and grease tests are subject to largeerror, since anything that will dissolve in theextraction solvent, whether it is truly oil orgrease or not (in the sense that it will causeproblems by coating sewerage, forminggreaseballs, or will exhibit resistance to bio-degradation), will be measured as oil and

grease. In addition to this problem, the diffi-culty of obtaining a representative sample ofthe wastewater for measurement of oil andgrease content must be kept in mind wheninterpreting or evaluating laboratory results.The reason for this is that oil and grease sub-stances are only sparingly soluble in waterand tend to either float on the surface, as isthe case with animal fat, or sink to the bot-tom, as is the case with trichloroethylene.Accordingly, an automatic sampler that takessamples from the bulk flow is not useful. Totake samples for laboratory determination offat, oil, and grease (FOG) content, it is neces-sary to hand dip to obtain grab samples,attempting, in doing so, to obtain portions ofthe flow from throughout the depth of waste-water flow.
"Other Characteristics" (Pollutants)
Chlorine Demand and ChlorineResidualChlorine, in the form of either chlorine gasor one of the hypochlorites, is routinelyadded to wastewaters for the purpose of dis-infection. However, disinfection will not takeplace if there are substances in the wastewa-ters that will quickly react with chlorine orhypochlorite, becoming oxidized themselvesand reducing the chlorine to chloride ion(Cl"), which is nonreactive. These substancesare "reducing agents" relative to chlorine.Therefore, enough chlorine must be added toreact with all of the reducing agents beforeany chlorine becomes available for disinfec-tion. "Contact time" is then required for thechlorine to kill the microorganisms and thusaccomplish disinfection. The amount of con-tact time required is in inverse proportion tothe concentration of chlorine residual, whichis the concentration of chlorine that remainsat any point in time after reactions with otherchemicals or substances (reducing agents)have taken place. The mathematical relation-ship between chlorine dose, chlorine resid-ual, and chlorine demand is as follows:
chlorine residual = chlorine dose- chlorine demand (5-6)
The quantity of chlorine "used up" as aresult of the disinfection process is consid-ered part of the chlorine demand. Therefore:
chlorine demand = chlorine reactedwith reducing agents
+ chlorine used for disinfection (5-7)
ChloridesThe importance of the presence of chloridesin wastewaters relates to their ability to par-ticipate in the conduction of electric current,and, therefore, their active role in enhancingcorrosion, particularly galvanic corrosion.Chlorides are otherwise benign, being unre-active and unlikely to participate in any pre-cipitation activity except the salting out proc-ess. Chlorides do affect the osmotic pressureof an aqueous solution and, as such, can havea deleterious effect on a biological wastewa-ter treatment system. It has been determinedthrough both laboratory experimentationand full-scale treatment plant operation thatbiological treatment systems are able to oper-ate under conditions of chloride concentra-tions up to 2,000 mg/L, but the chloride con-centration must be reasonably stable. Oncethe population of microorganisms acclimatesto a given range of chloride concentration, asignificant increase or decrease in chlorideconcentration will adversely affect the treat-ment process, probably because of thechange in osmotic pressure and its effect onthe microbial cell membranes.
HardnessThe test for hardness in water was originallydeveloped to determine the soap-consumingproperties of water used for washing. Theoriginal test involved placing a measuredamount of a standard soap in a bottle con-taining the water being tested, shaking themixture in a standard manner, then observ-ing the nature of the suds, if any, on the sur-

face of the water. Then, more soap wasadded, using a step-by-step procedure, untila permanent layer of suds remained on thesurface of the water. The total quantity ofsoap required to produce the stable suds layerwas proportional to the hardness of thewater. It was eventually realized that thehardness was due almost entirely to the pres-ence of calcium and magnesium ions in thewater, and as soon as analytical procedureswere developed that would analyze for theconcentrations of these ions directly, ratherthan indirectly, as with the shaking bottletest, the newer analytical procedures becamethe standard for the hardness test. In the con-text of use of water in industrial processes,however, and especially the reuse of treatedwastewaters in a recycle and reuse system, thesignificance of hardness is in the scale-form-ing properties of calcium and magnesiumsalts.
Iron and ManganeseIron and manganese are normally consideredtogether as problems in raw water suppliesfor industrial process use, as well as in proc-ess effluents. The reason is that these metalsare very often found together in groundwatersupplies and in some surface water supplies,under certain conditions. Iron and manga-nese are objectionable for two principal rea-sons. First, iron can be oxidized by oxygen inwater to insoluble ferric oxide, which precip-itates to form fine granules that can foul dis-tribution systems and cooling devices. Sec-ond, both iron and manganese react withchlorine to form highly colored chloridesthat stain many of the objects they come incontact with.
Characteristics of Discharges to theAir
There are three categories of air pollutantcharacterization: (1) stack discharge charac-terization, (2) fugitive emissions character-ization, and (3) ambient air quality charac-
terization. The three involve quite differentsampling procedures but similar, and in mostcases identical, analysis methods. Stack dis-charge and fugitive emission characterizationare done primarily to determine the state ofcompliance with one or more discharge per-mits. Ambient air quality characterization isdone primarily to determine the quality ofair in a given area.
Ambient air quality data are used formany purposes, including:
• Issuance of construction permits forindustrial projects
• Determination of state of compliancewith National Ambient Air Quality Stan-dards (NAAQS)
• Determination of the effectiveness ofameliorating activities
• Establishment of baseline informationprior to construction of a significantcontributor of substances to the atmos-phere
Stack SamplingThe most common reason for conducting astack sampling program is to determine thestate of compliance with regulatory require-ments. As such, the substances sampled forare usually dictated by the list of substancesincluded in the air discharge permits issuedto the facility.
The purpose of stack sampling is to deter-mine, with as much accuracy as is practicable,the quantity (magnitude) of the total gassource flow rate and the quality (types andamounts of air contaminants) of the totalsource gas discharge. The equipment includedin a typical stack sampling station includesdevices to measure characteristics from whichgas flow rate can be calculated, devices to mea-sure certain characteristics directly, and equip-ment to collect and store samples for subse-quent analyses in the laboratory.
In general, the equipment used to obtaindata from which to calculate gas flow rateincludes pitot tubes to measure gas velocity;a device to measure the static pressure of the
Next Page

face of the water. Then, more soap wasadded, using a step-by-step procedure, untila permanent layer of suds remained on thesurface of the water. The total quantity ofsoap required to produce the stable suds layerwas proportional to the hardness of thewater. It was eventually realized that thehardness was due almost entirely to the pres-ence of calcium and magnesium ions in thewater, and as soon as analytical procedureswere developed that would analyze for theconcentrations of these ions directly, ratherthan indirectly, as with the shaking bottletest, the newer analytical procedures becamethe standard for the hardness test. In the con-text of use of water in industrial processes,however, and especially the reuse of treatedwastewaters in a recycle and reuse system, thesignificance of hardness is in the scale-form-ing properties of calcium and magnesiumsalts.
Iron and ManganeseIron and manganese are normally consideredtogether as problems in raw water suppliesfor industrial process use, as well as in proc-ess effluents. The reason is that these metalsare very often found together in groundwatersupplies and in some surface water supplies,under certain conditions. Iron and manga-nese are objectionable for two principal rea-sons. First, iron can be oxidized by oxygen inwater to insoluble ferric oxide, which precip-itates to form fine granules that can foul dis-tribution systems and cooling devices. Sec-ond, both iron and manganese react withchlorine to form highly colored chloridesthat stain many of the objects they come incontact with.
Characteristics of Discharges to theAir
There are three categories of air pollutantcharacterization: (1) stack discharge charac-terization, (2) fugitive emissions character-ization, and (3) ambient air quality charac-
terization. The three involve quite differentsampling procedures but similar, and in mostcases identical, analysis methods. Stack dis-charge and fugitive emission characterizationare done primarily to determine the state ofcompliance with one or more discharge per-mits. Ambient air quality characterization isdone primarily to determine the quality ofair in a given area.
Ambient air quality data are used formany purposes, including:
• Issuance of construction permits forindustrial projects
• Determination of state of compliancewith National Ambient Air Quality Stan-dards (NAAQS)
• Determination of the effectiveness ofameliorating activities
• Establishment of baseline informationprior to construction of a significantcontributor of substances to the atmos-phere
Stack SamplingThe most common reason for conducting astack sampling program is to determine thestate of compliance with regulatory require-ments. As such, the substances sampled forare usually dictated by the list of substancesincluded in the air discharge permits issuedto the facility.
The purpose of stack sampling is to deter-mine, with as much accuracy as is practicable,the quantity (magnitude) of the total gassource flow rate and the quality (types andamounts of air contaminants) of the totalsource gas discharge. The equipment includedin a typical stack sampling station includesdevices to measure characteristics from whichgas flow rate can be calculated, devices to mea-sure certain characteristics directly, and equip-ment to collect and store samples for subse-quent analyses in the laboratory.
In general, the equipment used to obtaindata from which to calculate gas flow rateincludes pitot tubes to measure gas velocity;a device to measure the static pressure of the
Previous Page

stack gas; and devices to measure barometricpressure, moisture content, and temperature.Equipment used to characterize stack dis-charges in terms of specific substances is clas-sified in two broad categories: particulateand gaseous. The objective of this equipmentin both categories is to quantitatively removeair contaminants in the same condition asthey occur when they are discharged to theair. Many individual devices as well as inte-grated systems are commercially available toaccomplish this objective.
Sample CollectionSamples of ambient air or gas streams(including stack emissions and fugitive emis-sions) are sampled to determine the presenceof, and concentrations of, particulate andgaseous pollutants by use of the followingequipment and mechanisms:
• Use of a vacuum pump, hand operatedor automatic
• Vacuum release of an evacuated collec-tion container
• Tedlar bags• Adsorption on a solid• Condensation (freeze-out) in a trap
Vacuum PumpsVacuum pumps are the standard type ofequipment used to draw samples of ambientair of stack gas or other gas stream throughor into collection devices. Hand-operatedvacuum pumps are used extensively toobtain grab samples. Motor-driven vacuumpumps are the standard for continuous orintermittent monitoring. Vacuum pumpscan be fitted with, or connected in serieswith, gas flow meters to obtain data for cal-culation of concentrations.
Vacuum Release of an Evacuated CollectionContainerContainers (having appropriate linings) canbe evacuated by use of a vacuum pumpbefore traveling to sampling locations. Thecollection apparatus (soil gas sampling well,for instance) can be connected to the evacu-
ated container, the valve on the containeropened, and a sample of known volume willbe collected.
Tedlar BagsTedlar bags are made of a nonreactive, non-adsorbing (relatively) material, and are stan-dard equipment for sampling gaseous sub-stances in the air of a stack or other emission.They are purchased as a completely emptybag and are inflated with the collected sam-ple of air or other gas. Samples should beanalyzed as soon as possible after being col-lected in the Tedlar bag. Tedlar bags can bepurchased in different volume capacities,including 1-liter and 10-liter bags.
Adsorption on a SolidSolid adsorbents, such as activated carbon,can be used to collect certain airborne sub-stances, after which the substances can bedesorbed for further analysis or other work.Normally, a vacuum pump is used to draw avolume of air or other gas through a con-tainer of the adsorbent. In the case of certainsubstances (e.g., carbon monoxide), an indi-cator chemical can be incorporated with theadsorbent to directly indicate the presence ofthe substance.
Condensation (Freeze-Out) in a TrapCertain substances present in air or other gasstream as a result of volatilization can be col-lected by drawing a stream of the carrier airor other gas through a trap held at low tem-perature.
Equipment used to collect particulatematter and to determine the concentration,in ambient air as well as stack emission andother gas streams, uses one or more of thefollowing mechanisms:
• Filtration• Electrostatic impingement• Centrifugal force• Dry impingement• Wet impingement• Impaction

FiltrationThe standard method for determining theconcentration of particulate matter in emis-sions from stationary sources, as publishedin the Federal Register (40 CRR. Part 60, July1, 1998), is to withdraw, isokinetically, par-ticulate-laden air (or other gas) from thesource and collect it on a glass fiber filtermaintained at a temperature in the range of120 + 14°C (248 + 25°F), or such other tem-perature as specified by an applicable subpartof the published standards, or approved bythe Administrator, U.S. Environmental Pro-tection Agency for a particular application.The total quantity of particulates sampled isthen determined by weighing the dried filter.The standard sample train for this determi-nation, illustrated in Figure 5-7, includesequipment to measure gas flow rate as well astotal gas volume sampled. These data canthen be used to calculate particulate matterconcentration.
Electrostatic ImpingementFigure 5-8 shows a schematic of a typicalelectrostatic impingement device for collect-ing particulate matter from ambient air orother gas source. In order to determine theconcentration of particulate matter in the gassource sampled, additional equipment, dis-cussed above, must be used to determine therate of flow of the gas sampling system, or thetotal volume of source gas from which theparticulates were extracted. Then, the totalweight of particulate matter collected mustbe determined by weighing.
The principle of operation of the electro-static impingement apparatus is that of elec-trostatic attraction. The electrostaticimpingement surface is given an electrostaticcharge of polarity opposite to the polarity(positive or negative) of the particles in ques-tion.
Centrifugal ForceA typical particulate matter collector thatoperates on the principle of centrifugal forceis shown in Figure 5-9. This device acceptsthe sample of particulate-laden air, which
can be ambient air, stack gas, or another gasstream, and directs it through a circular pathon its way to the outlet. In traveling the cir-cular path, particulates are forced, by centrif-ugal action, to the collection device shown.As with other particulate collection devices,equipment to measure the rate of flow ofsample taken, or total volume from whichthe particulates were extracted, must be usedto enable calculation of particulate matterconcentration.
Dry ImpingementFigure 5-7 shows a "sample train" containingfour impingers. These impingers can be usedeither wet or dry and can be used to collectparticulates from ambient air of stack gasesor particulates from other gas streams.
Wet ImpingementWet impingement methods for collectingparticulate samples from ambient air, a stackemission, or other gas train operate by trap-ping the particulates in a liquid solution. Thetotal weight of particulate matter is thendetermined by filtering and weighing theentire volume of the liquid or by evaporatingthe liquid and weighing. A volume of freshliquid is also evaporated, and the residual (ifany) is weighed and compared with theweight of the dried sample to determine theactual weight of particulate matter. Again,equipment to measure the sample flow rateor the total volume sampled is necessary inorder to determine particulate concentra-tion.
ImpactionFigure 5-10 shows a schematic of a typicalimpaction particulate collector. The princi-ple upon which this collection device oper-ates is that of entrapment on a plate with afilm of sticky material on its surface. Collec-tion of pollen for pollen assay purposesmakes use of this type of equipment.
Particulates can be physically extractedfrom glass fiber filters or from the other col-lection devices for analysis as to individualconstituents, such as metals, radioactive ele-

Figure 5-7 Particulate sampling train.
TEMPERATURE SENSOR
PITOT TUBE
PROBE
PROBE
REVERSE-TYPEPITOT TUBE
PITOT MANOMETER
ORIFICE
TEMPERATURESENSOR
STACKWALL
HEATED AREA THERMOMETER
FILTER HOLDER
IMPINGEMENT TRAIN OPTIONAL, MAY BE REPLACEDBY AN EQUIVALENT CONDENSER
THERMOMETER
THERMOMETERS
DRY GAS METER AIR-TIGHTPUMP
MAINVALVE
VACUUMGAUGE
IMPINGERSBY-PASS VALVE
ICE BATH
VACUUMLINE
CHECKVALVE

Figure 5-10 Schematic of a typical impaction particle collector.
Pump and MeterFromSource
Figure 5-9 Schematic diagram of a centrifugal particlecollector.
merits or other materials. The analyst shouldconsult the appropriate Code of Federal Reg-ulations to determine acceptable procedures.
Figure 5-11 presents a schematic of anexample of a stack sampling system and illus-trates several of the methods employed fordata management.
Sample AnalysisAlthough it is realized that once a sample iscollected it is subject to change as a result ofchemical reaction, chemical degradation,absorption or adsorption onto the walls ofthe container or to other substances in thecontainer, or other phenomena. Not much ispresently known with certainty about howmuch change will take place in a sample onceit is collected. For this reason, it is extremelyimportant to perform the chemical or other
analyses as soon as possible after the samplesare collected.
Ambient Air SamplingDetermination of the quality of ambient airas it relates to the presence and concentrationof substances regarded as pollutants is theobjective of ambient air sampling. The spe-cialized devices and techniques for carryingout this task have been developed over half acentury. Here, again, obtaining representa-tive samples is a major objective of the workplan. Decisions about air sampling muststrike a balance between the cost of the char-acterization program and the value of thedata; these decisions include the duration ofthe sampling period, number of discretesamples taken, the size of each sample, andthe number of substances sampled for.
Particulate matter in ambient air is mea-sured by use of a "high-volume sampler,"which is an integrated filter holder/vacuumpump (high volume). A glass fiber filter isheld in the filter holder, and a high flow rateof ambient air is drawn through it over ameasured period of time. Calculations ofparticulate matter concentration in theambient air are carried out using the weightof particulate matter collected on the filter
Figure 5-8 Schematic of a typical electrostatic impingement collector.
Elect
Pump and MeterSourceFrom
AirOut
InAir Particles
Out

Storage andRemoval system
Punch Tape
Card File
Magnetic Tape
Off Line/On LineReal timeCostMaintenanceOperation
Data Analysisand Presentation
Video DisplayPlotterPrinterOff Line/On LineReal times
Computer
Manual
Other
Data Transmitted
Telemetry
Telephone
Manual
Other
CostOperationMaintenance
CostOperationMaintenanceOn site/Off site
Manual
Semi-continuous
Continuous
In-Situ Detector
Extraction Detector
Analyzer
Detector/Analyzer
ProbeStock
SampleConditioner(s)• Filters
CondensersHumidifiersPressureRegulators
• Temperature
Figure 5-11 Continuous monitoring system.
Data Recording

and the flow rate (or total volume) of airdrawn through the filter.
Air PollutantsThe following paragraphs present a brief dis-cussion of the major air pollutants that areregulated by the Clean Air Act, as amended.
Air Toxics. Control of the release of so-called "air toxics" took on a new impor-tance—in fact, a dominant importance—with promulgation of Title III of the 1990Clean Air Act Amendments (CAA). Previousto these amendments, the EPA had issuedstandards for only eight hazardous sub-stances over a 20-year period. The 1990 CAAlists 188 substances that must be controlled.
The designated air toxics are required tobe managed by use of "Maximum AchievableControl Technology" (MACT). In addition,residual risk after implementation of MACTmust be assessed. Industries are also subjectto a time schedule, by source category, forimplementation of MACT. All sources mustbe in compliance with the applicable stan-dard within a published time schedule. TheEPA published the initial list of source cate-gories in 1992 and since that time has issuedseveral revisions/updates to the list and pro-mulgation schedule.
There are significantly different require-ments for sources that qualify as a "majorsource" compared with those that do not. Amajor source is any stationary source thatemits in excess of 10 tons per year of any ofthe listed 188 hazardous substances or 25tons per year or more of any combination ofthose substances.
The list of 188 air toxics includes pesti-cides, metals, organic chemicals, coke ovenemissions, fine mineral fibers, and radionu-clides. The EPA is required to add to this listpollutants that may be shown to present,through inhalation or other routes of expo-sure, a threat of adverse effect on humanhealth or the environment. The EPA may alsoremove substances from the list if it can beshown that the reasons for placing them onthe list were in error.
There are also significantly elevated con-trol requirements for the sources that repre-sent 90% of the area sources that emit the 30hazardous air pollutants presenting thegreatest threat to public health in the largestnumber of urban areas.
Ozone. Ozone has the chemical formulaO3 and is a relatively strong oxidizing agent.Ozone is emitted directly by some sources,and is also a product of chemical and/or pho-tochemical reaction between other air pollut-ants in the atmosphere. Ozone is an irritantand can damage sensitive tissues in animals(including humans) as well as plant tissues.
Oxides of Sulfur (SOx). Sulfur dioxide isthe major sulfur oxide of concern in theatmosphere, although sulfur trioxide (SO3)and sulfate (SO4) are important. The pri-mary source of sulfur oxides in the nation'satmosphere is the burning of fossil fuels (oiland coal) to generate electrical power andheat. Since sulfur is an important componentof protein, and protein is an important com-ponent of virtually all plants and animals,sulfur is consequently a component of thefossil remains of these once-living entities.When oil or coal is burned, oxygen combineswith the sulfur and the resulting sulfur oxidesare emitted with the gaseous releases fromthe combustion process. The principal harm-ful effects of sulfur oxides are their eventualreaction with atmospheric moisture andreturn to the earth as acid rain, as well astheir participation in photochemical reac-tions in the atmosphere to produce smog.
Oxides of Nitrogen (NOx). Nitrogenoxides, principally nitrogen dioxide, NO2,and nitric oxide, NO, are produced duringthe combustion of all types of fuels. Thesegases are referred to together as NOx. Sinceair consists of nitrogen in the N2 gas form,and about 21% oxygen in the O2 gas form,there is an unlimited supply of both nitrogenand oxygen available to react with each other,which they will do at elevated temperatures.
The other source of nitrogen that resultsin the formation of significant amounts ofNOx is the nitrogen content of the fuel itself.For instance, Number 6 fuel oil typically con-
tains from 3% to 7% by weight of nitrogen. Ithas been observed that the NOx content ofstack gases increases linearly with a linearincrease in the nitrogen content of the fueloil. It is therefore to be concluded that: (1)the nitrogen content of fuel oil is convertedto NOx during the combustion process, and(2) a reasonable strategy for helping to com-ply with limits on NOx emissions is to obtainand burn fuel oil having a relatively lownitrogen content.
The source of nitrogen in fossil fuels issimilar to that of sulfur—namely, the livingtissue from which the fossil remains werederived. All living entities, since life began,have had deoxyribonucleic acid (DNA), ribo-nucleic acid (RNA), and protein materials askey components. Nitrogen has always been acomponent of these three substances, and thefossil remains contain nitrogen as well.
The principal harmful effect of the nitro-gen oxides is their reaction with atmospherichydrocarbons and other substances to formsmog.
Carbon Monoxide (CO). Carbon monox-ide is the product of incomplete combustionof organic matter, including fossil fuels.While complete combustion of materialcomposed of organic carbon produces car-bon dioxide, CO2, incomplete combustion,due to inadequate supply of oxygen, resultsin the production of some carbon monoxide,CO. Carbon monoxide is hazardous to thehealth of humans and other animals.
Carbon Dioxide (CO2). Carbon dioxide isa product of complete combustion. Theprincipal sources of carbon dioxide in theatmosphere are the respiration of plants, ani-mals, and microorganisms, which use oxygenas an electron acceptor, and the burning offossil and other fuels for generation of heatand power.
The principal harmful effect of carbondioxide in the atmosphere is its contribution,along with methane, to the promotion ofglobal warming due to the so-called "green-house effect."
Particulates. Particulates, known as "fineparticulate matter" or "PMlO," are very small
particles of any substance. The harmfuleffects of particulates are their tendency tolodge in the lungs and their objectionableeffect on visibility.
The sources of particulate matter in theatmosphere are many and varied. Every timesomething is burned, there is generation andrelease of particulate matter. Wind generatesparticulate matter by blowing dust and otherparticulates from places of deposition intothe ambient air. Automobiles and movingheavy equipment disturb land and generateairborne particulate matter.
Volatile Organic Carbon Compounds(VOCs). Volatile organic carbon compoundsare a class of chemicals that is emitteddirectly to the air as a result of evaporation orother type of volatilization. Sources includestored gasoline, stored solvents and otherindustrial chemicals, and certain industrialprocesses. Incomplete combustion of fuels ofmany types is also an important source ofVOC discharge to the ambient air.
The principal harmful effects of VOCs aretoxicity, possible contribution to smog viaphotochemical reactions in the atmosphere,and possible contribution to the greenhouseeffect and consequent global warming.
Malodorous Substances. There are manysubstances, including compounds of sulfurin the reduced state (such as hydrogen sul-fide, methyl and ethyl mercapatans, anddimethyl sulfide) and degradation productsof proteins (such as amines, amides, putri-cine, and cadaverine) that have extremelyobjectionable odors. Many of these com-pounds can be detected by the human olfac-tory apparatus in atmospheric concentra-tion ranges of only a few parts per billion byvolume. Although their common objection-able property is their bad smell, some ofthem are toxic.
Hydrogen Sulfide (H2S). Hydrogen sulfideis toxic as well as malodorous. Worse yet, ithas the characteristic of being able to desen-sitize the olfactory apparatus in a few min-utes' time if the concentration is higher thana few parts per billion by volume. Personswho have entered confined spaces containing

hydrogen sulfide gas have died because, soonafter entering the contaminated space, theywere unable to smell the H2S, did not realizethey were breathing H2S, and were overcomeby a fatal dose.
Other Reduced Sulfur Compounds. Areduced sulfur compound is a chemical sub-stance of low molecular weight that containsone or more sulfur atoms in the minus-two(sulfide) valence state. These substances,along with hydrogen sulfide, are referred toin the aggregate as TRS. Many air dischargepermits contain restrictions on TRS. SomeTRS compounds are toxic. All are objection-able because of their extremely strong, foulodors.
Common sources of hydrogen sulfide andother reduced sulfur compounds includetanneries, rendering plants, kraft pulp mills,and malfunctioning POTWs.
Organics. Several categories of organicmaterial are regulated through restrictionscontained in air discharge permits.
Hydrocarbons. Low molecular weightorganic compounds consisting of carbon andhydrogen are discharged to the air via evapo-ration and as a result of incomplete combus-tion of fossil fuels, including gasoline. Thesesubstances undergo photochemical reactionswith other substances in the atmosphere toform smog.
Methane. Methane, the lowest molecularweight hydrocarbon, enters the atmosphereas a result of natural gas extraction, coalextraction, management of solid waste,anaerobic degradation of organic material inthe natural environment, and the gaseousexpulsions of cattle and other animals associ-ated with agriculture.
The principal harmful effect of methanereleased to the atmosphere is its contribu-tion, along with carbon dioxide, to the causeof global warming, or the greenhouse effect.
Sampling Methods for Air Toxics. Compli-ance with the requirements of Title III of theCAA is based on the implementation of spec-ified (MACT) control technologies and/orachieving specific HAP limits. Ultimately,sampling and analysis work are required to
determine compliance with one or more ofthe 188 listed substances present in the dis-charge. This information is needed, in somecases, to determine whether or not a givencontrol technology must be installed.
Characteristics of Solid WasteStreams from Industries
The Resource Conservation and RecoveryAct (RCRA), as amended, is the primary lawgoverning the handling, transportation, anddisposal of solid and hazardous wastes. Thelaw is contained in its entirety, including theregulations that specifically regulate thesampling and analyses of hazardous andnonhazardous solid waste streams, in vol-ume 40 of the Code of Federal Regulations.Subtitles C and D are addressed to the man-agement of hazardous and nonhazardouswastes, respectively.
Hazardous WastesIn 40 CRR. 260, the EPA defines a genera-tor as "any person, by site, whose act or pro-cess produces hazardous waste identified orlisted in Part 261 or whose act first causes ahazardous waste to become subject to regu-lation." Further, the EPA has establishedthree categories of generator, depending onthe quantity of hazardous waste generatedper month. Table 5-5 provides a descriptionof generator categories. As the quantity ofwaste that is generated per month increases,the regulatory requirements also increase. Avery important first order of business,therefore, is to determine whether or not agiven industrial facility qualifies as a genera-tor, and, if so, which category of generatorthe facility is. This situation could change atany time, due to changes in raw materialsused, production chemicals and other mate-rials used, manufacturing processes, andeven changes in state or federal laws and/orregulations.
The generator categories described inTable 5-5 are based on EPA definitions. Moststates have been delegated the authority to

implement RCRA regulations and have theauthority to make more stringent regula-tions. It is important to check the regulationsfor the individual state where the facility islocated.
RCRA defines hazardous wastes in termsof specific properties. According to RCRA, asolid waste is hazardous if it meets one ofthree conditions and is not excluded fromregulation as a hazardous waste:
1. Exhibits, on analysis, any of the charac-teristics of a hazardous waste
2. Has been named a hazardous waste andappears on an appropriate list
3. Is a mixture containing a listed hazard-ous waste and any other solid wastematerial
RCRA has identified four characteristics,which, if exhibited by a solid waste, designateit as a hazardous waste:
• Ignitable• Corrosive• Reactive• Toxic
These four characteristics are described asfollows:
Ignitable• A liquid, except aqueous solutions con-
taining less than 24% alcohol, that has aflash point of less than 600C (1400F)
• A substance that is not a liquid and iscapable, under standard temperatureand pressure, of causing fire througheither friction, contact with moisture, orspontaneous chemical change
• A substance that is an ignitable com-pressed gas per Department of Transpor-tation (DOT) regulations
• An oxidizer per DOT regulations• Examples of ignitable substances are
waste solvents, paints, and some wasteoils
Corrosive• An aqueous material having a pH less
than or equal to 2.0 or greater than 12.5• A liquid that corrodes steel at a rate
greater than 1/4 inch per year at a tem-perature of 55°C (1300F)
• Examples of corrosive wastes are auto-mobile battery acid and waste pickleliquor from the manufacturing of steel
Reactive• Reacts violently with water• Normally unstable and reacts violently
without detonating
Table 5-5 Quantity Determines Which Regulations Apply
Generator
Large Quantity (LQG)
Small Quantity (SQG)
Conditionally Exempt
Small Quantity (CESQG)
Quantity
1,000 kg/month (approximately 2,200 Ib)
> 1 kg/month acute (approximately 2.2 Ib)
> 100-kg residue or contaminated soil fromcleanup of acute hazardous waste spill
Between 100 and 1,000 kg/month (approxi-mately 220 to 2,200 Ib)
100 kg/month
1 kg acute
100-kg residue or contaminated soil fromcleanup of acute hazardous waste spill
Regulation
All Part 262 Requirements
Part 262, Subparts A, B, C (§262.34[d] isspecific to SQGs); Subparts E, F, G, H if ap-plicable; and portions of Subpart D as speci-fied in §262.44
§261.5

• Generates toxic gases, vapors, or fumeson mixing with water
• Forms a potentially explosive mixturewith water
• Contains cyanide or sulfide and gener-ates toxic gases, vapors, or fumes at a pHof between 2.0 and 12.5
• Capable of detonation if heated underconfinement or subjected to a strongdetonating force
• Capable of detonation at standard tem-perature and pressure
• Listed as a Class A or B explosive by theDepartment of Transportation
ToxicA solid waste exhibits the characteristic oftoxicity if the extract from a sample obtainedfrom conducting the Toxicity CharacteristicLeaching Procedure (TCLP) contains any ofthe contaminants listed in Table 1 of 40 CRR.261.24 at concentrations equal to or greaterthan the respective value given in that table.
The Toxic Characteristic Leaching Proce-dure (TCLP) test was developed as a methodfor determining whether or not a wastematerial, after being placed in a landfill,would leach metals or other substances atrates greater than what was consideredacceptable. The TCLP test attempts to simu-late worst-case landfill leaching conditions,where low pH precipitation (acid rain)would percolate down through the landfilledwastes and cause metals to dissolve into solu-tion.
In performing the TCLP test, the materialto be landfilled is first pulverized to particlesizes no larger than one millimeter in diame-ter. Then, 5.0 grams of the solid phase of thewaste are placed in a 500-ml beaker or Erlen-meyer flask. Next, 96.5 ml of "reagent water"(deionized water) are added; then the beakeror flask is covered with a watchglass andstirred vigorously for five minutes. This pro-cedure is normally carried out in a beaker,with a magnetic stirrer keeping the granulesof waste material suspended and well mixedwith the reagent water.
It is very important that the instruction"cover with a watchglass" be followed. Afterthe five minutes of stirring, the pH of themixture is determined. If the pH is below 5.0,the mixture is subjected to the specifiedextraction procedure using extraction fluid#1, which is prepared by mixing 5.7 ml gla-cial acetic acid, 500 ml of reagent water, and64.3 ml IN sodium hydroxide. The pH ofthis mixture is 4.93 + 0.05. If the pH of themixture of pulverized waste and reagentwater (after mixing for five minutes) ishigher than 5.0, the mixture is subjected tothe specified extraction procedure usingextraction fluid #2, which is prepared bydiluting 5.7 ml glacial acetic acid to a volumeof 1 liter with reagent water. Extraction fluid#2 has a pH of 2.88 + 0.05, is thus a strongeracid solution than extraction fluid #1 (nosodium hydroxide is added during prepara-tion of extraction fluid #2), and will morestrongly dissolve metals from the waste mate-rial.
The reason it is important to keep the bea-ker covered with a watchglass during the stir-ring process is that carbon dioxide gas willeither escape from, or dissolve into, the mix-ture, causing the pH to change and possiblyresulting in the requirement to use the stron-ger extraction solution. Analysts sometimesdo not use the watchglass in order to enableleaving pH probes in the mixture during thestirring process.
After the extraction process has been car-ried out, the extract is analyzed for suspectedor possible substances. If the results of thisanalysis show that any of the substances arepresent in the extract in an amount exceed-ing the published limit, the waste is deemedto be "hazardous" and must be handled anddisposed of in accordance with all the appli-cable hazardous waste laws and regulations.See Table 5-5.
ExemptionsCertain materials under certain circum-stances have been specifically exempted fromhaving to be handled and disposed of as haz-

ardous waste. When applicable conditionsare met, these exempted materials can behandled and disposed of as ordinary solidwastes.
DelistingSome solid wastes can be removed from the"hazardous waste" category by goingthrough a process that enables the waste tobe delisted. Any generator or waste handlercan petition the EPA to exclude a listed wastefrom regulation under Subtitle C. The peti-tioner must prove to the EPA that, due tofacility-specific differences in raw materials,processing, or other factors, the waste is nothazardous and will therefore pose no risk topersons, animals, or the environment. If theEPA, upon examining all other factors inaddition to those cited by the petitioner,finds no reason for not delisting the waste,the waste may be handled and disposed of asordinary solid waste as regulated under 40CER., Subtitle D. It is noted here that thedelisting process can be time consuming andexpensive. Delisting is typically sought forhigh-volume waste streams.
Cradle to Grave ManifestingA significant requirement for all shipmentsof hazardous wastes subject to the regula-tions of Subtitle C is that they be accompa-nied by a written document called a mani-fest. Figure 5-12 shows an example of thestandard form, titled "Uniform HazardousWaste Manifest." At the time of this printing,the manifest was undergoing changes tomake it federally standardized. The manifestprovided in Figure 5-12 is intended to beillustrative of the type of information thatwould be required when filling out a mani-fest. It is the responsibility of the generator ofany hazardous waste to initiate the manifestby writing in the appropriate information. Ifthe waste is hauled away from the generator'sfacility by a second party, the hauler assumespossession of and responsibility for the man-ifest, although the generator retains a copy.Then, when the waste reaches the place ofultimate treatment, storage, or disposal (the
grave), the manifest again changes hands,with the hauler retaining a copy.
As shown on the example manifest pre-sented in Figure 5-12, information containedon the completed manifest may include, butis not limited to, the following:
• Name and EPA identification number ofthe generator, the hauler(s), and thefacility where the waste is to be treated,stored, or disposed ofU.S. EPA and U.S. DOT descriptions ofthe waste
• Quantities• Complete address of the treatment, stor-
age, or disposal facility
In addition, the manifest must certify thatthe generator has in place a program toreduce the volume and toxicity of hazardouswastes to the degree that is economicallypracticable, as determined by the generator,and that the treatment, storage, or disposalmethod chosen by the generator is a practi-cable method currently available that mini-mizes the risk to human health and the envi-ronment.
Once the waste is delivered to the finalplace of disposition (treatment, storage, ordisposal facility), the owner or operator ofthat facility must sign the manifest, retain acopy, and return a copy to the generator ofthat waste. If 35 days pass from the date onwhich the waste was signed for by the initialtransporter, and the generator has notreceived a copy of the manifest from the finalsite of disposition, the generator must con-tact the initial transporter to determine thefate of the waste. If 45 days pass and the gen-erator still has not received a copy of themanifest, the generator must submit anexception report.
Nonhazardous Solid Wastes from IndustriesSome industrial solid wastes can be disposedof in municipal solid wastes landfill facilities(MSWLF). The federal law that governs suchdisposal is contained in its entirety in 40CRR. Part 258. (Part 257 contains the provi-
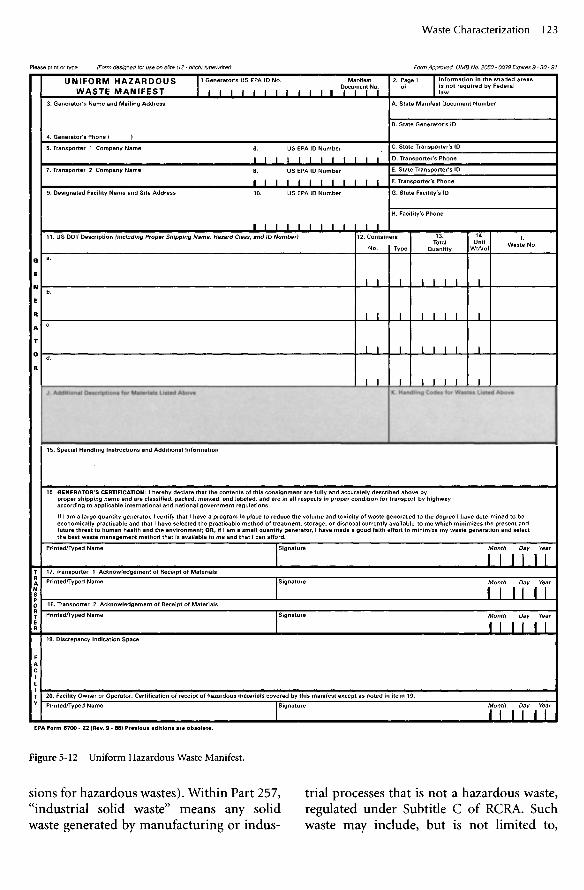
Figure 5-12 Uniform Hazardous Waste Manifest.
sions for hazardous wastes). Within Part 257,"industrial solid waste" means any solidwaste generated by manufacturing or indus-
trial processes that is not a hazardous waste,regulated under Subtitle C of RCRA. Suchwaste may include, but is not limited to,
3lease print or type (Form designed for use on elite (12 - pitch) typewriter) Form Approved. OMB No. 2050 - 0039 Expires 9-30-91UNIFORM HAZARDOUSWASTE MANIFEST
3. Generator's Name and Mailing Address
4. Generator's Phone ( )5. Transporter 1 Company Name
7. Transporter 2 Company Name
9. Designated Facility Name and Site Address
1 Generator's US EPA ID No. ManifestDocument No.I I I I I I I I I I I I I I I I
6. US EPAID NumberI I I I I i I I I I I8. US EPA ID NumberI I I I I I I I10. US EPA ID Number
I I I I I I I I11. US DOT Description (Including Proper Shipping Name, Hazard Class, and ID Number)
b.
C.
d.
I ' '
I I
2. Pageiof lnformstion in thtshaded areas
A. State Manifest Document Number
B. State Generator's ID
C. State Transporter's IDD. Transporter's PhoneE. State Transporter's IDF. Transporter's PhoneG. State Facility's ID
H. Facility's Phone
12. ContainersNo. Type
I I
I I
! I
I I
I
I
I
I
13.TotalQuantity
t i l l
I
I
I
I i
! I
I I
14.UnitWt/Vol
I
I
I
I
I.Waste No.
I-CC < Z (O Q. O K H LU OCu. < O
I - H >•
15. Special Handling Instructions and Additional Information
16. GENERATOR'S CERTIFICATION: I hereby declare that the contents of this consignment are fully and accurately described above byproper shipping name and are classified, packed, marked, and labeled, and are in all respects in proper condition for transport by highwayaccording to applicable international and national government regulations.economically practicable and that I have selected the practicable method of treatment, storage, or disposal currently available to me which minimizes the present andfuture threat to human health and the environment; OR, if I am a small quantity generator, I have made a good faith effort to minimize my waste generation and selectthe best waste management method that is available to me and that I can afford.
Printed/Typed Name Signature Month Day YearI I I I I I
17. Transporter 1 Acknowledgement of Receipt of MaterialsPrinted/Typed Name
Printed/Typed Name
Signature Month Day YearI I I l I I
Signature Month Day YearI I I I I I
19. Discrepancy Indication Space
20. Facility Owner or Operator: Certification of receipt of hazardous materials covered by this manifest except as noted in item 19.Printed/Typed Name
EPA Form 8700 - 22 (Rev. 9 - 88) Previous editions are obsolete.
Signature Month Day YearI I I I I I

waste resulting from electric power genera-tion; fertilizer/agricultural chemicals pro-duction; food and related products or by-products production; inorganic chemicalsmanufacturing; iron and steel manufactur-ing; leather and leather products production;nonferrous metals manufacturing; organicchemicals production; plastics and resinsmanufacturing; pulp and paper manufactur-ing; rubber and miscellaneous plastic prod-ucts manufacturing; the manufacture ofstone, glass, and concrete products; textilemanufacturing; transportation equipmentmanufacturing; and water treatment. Notincluded are wastes resulting from mining oroil and gas production.
MSWLF facilities are required by SubtitleD regulations to have, as a minimum, a linersystem composed of a single composite linerthat is part of a leachate collection andremoval system. A low-permeability covermust be installed when the landfill reachesmaximum capacity. In addition, a ground-water monitoring system must be used todetect liner failure during the 30-year man-dated postclosure care period.
States, of course, may promulgate lawsand regulations that are more restrictive thanthe federal laws and regulations. Again, it isthe responsibility of the owner of the facilityto determine which set of laws and regula-tions is the most restrictive, and this determi-nation should be used as the basis for designof discharge control equipment.
Bibliography
American Society for Testing and Materials.A Standard Guide for Examining theIncompatibility of Selected HazardousWaste Based on Binary Chemical Mixtures.Philadelphia, PA: 1983.
De Renzo, D. J. Solvent Safety Handbook.Park Ridge, NJ: Noyes Publications, 1986.
Dyer, J. C , A. S. Vernick, and H. D. Feiler.Handbook of Industrial Wastes Pretreat-ment. New York: Garland STPM Press,1981.
Flick, Ernest W. Industrial Solvents Hand-book. 3rd ed. Park Ridge, NJ: Noyes Publi-cations, 1985.
Grant, D. M. Open Channel Flow Measure-ment Handbook. Lincoln, NE: Instrumen-tation Specialties Co., 1979.
Harris, J. P., and S. A. Kacmar. "Flow Moni-toring Techniques in Sanitary Sewers." InDeeds and Data, Water Pollution ControlFederation: July 1974.
Higgins, I. J., and R. G. Burns. The Chemistryand Microbiology of Pollution. New York:Academic Press, 1975.
Jain, R. K., L. V. Urban, G. S. Stacey, and H.E. Balbach. Environmental Assessment.New York: McGraw Hill, 1993.
Leupold and Stevens, Inc. Stevens WaterResources Handbook. Beaverton, OR: 1975.
Merrill, W. H., Jr. "Conducting a Water Pol-lution Survey." Plant Engineering October15, 1970.
Merrill, Wm. H., Jr. "How to Conduct anInplant Wastewater Survey." Plant Eng.January 7, 1971.
Sax, N. I. Dangerous Properties of HazardousMaterials. 6th ed. New York: Van Nos-trand Reinhold, 1984.
Shelley, P. E. "Sampling of Wastewater." U.S.Environmental Protection Agency Tech-nology Transfer, June 1974; The MerckIndex. 9th ed. Rahway, NJ: Merck and Co.,Inc., 1976.
Shelley, P. E. An Assessment of AutomaticSewer Flow Samplers. U.S. EnvironmentalProtection Agency. Office of Research andMonitoring. EPA-R2-73-261. June 1973.
Shelley, P. E., and G. A. Kirkpatrick. "SewerFlow Measurement—A State of the ArtAssessment." EPA-60012-75-027. 1975.
Sittig, M. Handbook of Toxic and HazardousChemicals and Carcinogens. 2nd ed. ParkRidge, NJ: Noyes Publications, 1985.
Sittig, M. Priority Toxic Pollutants—HealthImpacts and Allowable Limits. Park Ridge,NJ: Noyes Publications, 1980.
Standard Methods for the Examination ofWater and Wastewater. 20th ed. New York:American Public Health Association,1998.

Thompson, R. G. "Water-Pollution Instru-mentation." Chemical Engineering June 21,1976: 151-154.
U.S. Department of the Interior. "Methodsfor Collection and Analysis of Water Sam-ples for Dissolved Minerals and Gases." InTechniques of Water Resources, Investiga-tions of the United States Geological Survey.Book 5. Chapter Al. 1970.
U.S. Department of the Interior. Bureau ofReclamation. Water Measurement Manual.Denver, CO: 1979.
U.S. Environmental Protection Agency. Man-ual of Methods for Chemical Analysis ofWater and Wastes. Methods Developmentand Quality Assurance Research Labora-tory, National Environmental ResearchCenter. Cincinnati, OH: 1974.
U.S. Environmental Protection Agency.Method for Chemical Analysis of Water andWaste. EPA 600/4-79/020. Washington,DC: U.S. Government Printing Office,1979.
U.S. Environmental Protection Agency."Announcement of the Drinking WaterContaminant Candidate List." 63 FR10273. Washington, DC: U.S. Govern-ment Printing Office, March 1998.
U.S. Environmental Protection Agency."Designation of Hazardous Substances."Code of Federal Regulations. Title 40, Part116. Washington, DC: U.S. GovernmentPrinting Office, 1980.
U.S. Environmental Protection Agency.Office of Water. "Drinking Water ProgramRedirection Strategy." EPA 810-R-96-003.Washington, DC: U.S. Government Print-ing Office, June 1996.
U.S. Environmental Protection Agency."General Provisions for Effluent Guide-lines and Standards." Code of Federal Reg-ulations. Title 40, Part 401. Washington,DC: U.S. Government Printing Office,1997.
U.S. Environmental Protection Agency."Guidelines Establishing Procedures forAnalysis of Pollutants." Code of FederalRegulations. Title 40, Part 136. Washing-
ton, DC: U.S. Government PrintingOffice, 1979.
U.S. Environmental Protection Agency."Hazardous Waste Management System:General." Code of Federal Regulations. Title40, Part 260. Washington, DC: U.S. Gov-ernment Printing Office, 1980.
U.S. Environmental Protection Agency."Identification and Listing of HazardousWaste." Code of Federal Regulations. Title40, Part 261. Washington, DC: U.S. Gov-ernment Printing Office, 1980.
U.S. Environmental Protection Agency."Interim Status Standards for Owners andOperators of Hazardous Waste Treatment,Storage, and Disposal Facilities." Code ofFederal Regulations. Title 40, Part 265.Washington, DC: U.S. Government Print-ing Office, 1987.
U.S. Environmental Protection Agency."National Primary Drinking Water Regu-lations." Code of Federal Regulations. Title40, Part 141. Washington, DC: U.S. Gov-ernment Printing Office, 1975.
U.S. Environmental Protection Agency."National Secondary Drinking Water Reg-ulations." Code of Federal Regulations.Title 40, Part 143. Washington, DC: U.S.Government Printing Office, 1988.
U.S. Environmental Protection Agency."Standards Applicable to Transporters ofHazardous Waste." Code of Federal Regula-tions. Title 40, Part 263. Washington, DC:U.S. Government Printing Office, 1986.
U.S. Environmental Protection Agency."Toxic Pollutant Effluent Standards." Codeof Federal Regulations. Title 40, Part 129.Washington, DC: U.S. Government Print-ing Office, 1977.
U.S. Environmental Protection Agency."Standards Applicable to Generators ofHazardous Waste." Code of Federal Regula-tions. Title 40, Part 262. Washington, DC:U.S. Government Printing Office, 1980-1987.
U.S. Environmental Protection Agency.Office of Research and Development. AMethod for Determining the Compatibility

of Hazardous Wastes. EPA 60012-80/076.Cincinnati, OH: 1980.
U.S. Environmental Protection Agency. Ana-lytical Methods for Determination of Asbes-tos Fiber in Water. Washington, DC: U.S.Government Printing Office, 1983.
U.S. Environmental Protection Agency.Handbook for Monitoring IndustrialWastewater. Technology Transfer. Wash-ington, DC: U.S. Government PrintingOffice, August 1973.
U.S. Environmental Protection Agency.Office of Research and Development.Environmental Monitoring and SupportLaboratory. Handbook for Sampling andSample Preservation of Water and Waste-water, EPA-600/4-82-029. Cincinnati, OH:1982.
U.S. Environmental Protection Agency.Microbiological Methods for Monitoring theEnvironment. EPA 600/8-78/017. Wash-ington, DC: U.S. Government PrintingOffice, 1978.
U.S. Environmental Protection Agency. Officeof Public Awareness. Hazardous WasteInformation. SW-737. Washington, DC:U.S. Government Printing Office, 1980.
U.S. Environmental Protection Agency.Office of Water and Waste Management.Hazardous Waste Information—Identifica-tion and Listing. SW-850. Washington.DC: U.S. Government Printing Office,1980.
U.S. Environmental Protection Agency.Office of Water and Waste Management,Hazardous Wastes Information—Trans-porters. SW-830. Washington, DC: U.S.Government Printing Office, 1980.
U.S. Environmental Protection Agency.Office of Water and Waste Management.Hazardous Waste Information—FacilityPermits. SW-852. Washington, DC: U.S.Government Printing Office, 1980.
U.S. Environmental Protection Agency.Office of Water and Waste Management.Hazardous Wastes Information—Genera-tors. SW-839. Washington, DC: U.S. Gov-ernment Printing Office, 1980.
U.S. Environmental Protection Agency. Sam-plers and Sampling Procedure for Hazard-ous Waste Streams. EPA 600/2-80/018.Washington, DC: U.S. Government Print-ing Office, 1980.
U.S. Environmental Protection Agency.Effluent Guidelines Division. Samplingand Analysis Procedure for Screening ofIndustrial Effluents for Priority Pollutants.Washington, DC: U.S. Government Print-ing Office, 1977.
U.S. Environmental Protection Agency. TestMethods for Evaluating Solid Waste—Phys-ical/Chemical Methods. 2nd ed. SW-846.Washington, DC: U.S. Government Print-ing Office, 1985.
U.S. Environmental Protection Agency.Water Quality Standards Handbook. 2nded. EPA-823-B-94-005a. Washington, DC:U.S. Government Printing Office, 1994.
U.S. Environmental Protection Agency."Standards for Owners and Operators ofHazardous Waste Treatment, Storage, andDisposal Facilities." Code of Federal Regu-lations. Title 40, Part 264. Washington,DC: U.S. Government Printing Office,1980-1987.
Vernick, A. S. "How to Conduct a Wastewa-ter Survey." Plant EngineeringJuly 7, 1977.
Vernick, A. S. "How to Conduct a Wastewa-ter Survey." Plant Engineering August 4,1977.
Weiss, G. Hazardous Chemical Data Book.2nd ed. Park Ridge, NJ: Noyes Publica-tion, 1986.

6 Industrial StormwaterManagement
General
Precipitation of all types falls on industrialfacilities and, in so doing, transports chemi-cals and inert solids from wherever it physi-cally contacts them to other parts of the envi-ronment. Any industrial site will have somecontamination on all surfaces, includingroofs, parking lots, storage facilities, roads,sidewalks, and grassy areas.
Since all substances are soluble to someextent in water (the universal solvent), anychemical substances in either liquid or solidform will become dissolved (to an extentequal to or less than the solubility limit forthat substance) and will either percolate intothe ground or be carried with the stormwaterrunoff. Particles that are not dissolved will betransported with the runoff, which will alsocontain some amount of gases that are dis-solved in the runoff. Most, if not all, of theprecipitation that percolates into the groundwill eventually reach groundwater.
The types and amounts of materials thatbecome incorporated into stormwater runoffdepend upon the state of cleanliness of theindustrial facility (i.e., the roof areas, parkinglots, roadways, etc.), as well as the character-istics of the precipitation itself, in terms ofintensity, duration, pH, temperature, andchemical constituents. As well, factors suchas the topography of the plant site, the char-acteristics of the surfaces over which the run-off flows, and the stormwater managementpractices that have been employed will have amajor influence on the quality of the storm-water as it flows off the site or percolates intothe ground.
It is the quality and, in some cases, thequantity of the stormwater that leaves the
industrial site, whether via overland flow tosurface waters or percolation into thegroundwater, that are of importance fromthe standpoint of compliance with environ-mental laws, regulations, and permits. Assuch, stormwater runoff quality and quantityare the focus of an overall stormwater man-agement strategy, which incorporates, asappropriate, comprehensive pollution pre-vention practices; collection, diversion, andtreatment facilities; and regulatory compli-ance monitoring.
Prevention and control of contaminationof groundwater and surface water by storm-water percolation or runoff are a matter ofpreventing or managing the following activi-ties:
• Contamination of surfaces with whichstormwater can come into contact, suchas roofs, parking areas, plant roadways,outdoor storage areas, industrial yardareas, tanks, piping systems, and out-door equipment
• Spills, leaks, or releases of pollutants as aresult of accidents or as a consequence ofinadequate preventive maintenance
Prevention of spills, leaks, and releases isbest accomplished through proper designand operation of industrial equipment andstorage facilities, an exemplary preventivemaintenance program, and thorough workertraining programs.
Federal Stormwater Program
Federal regulation of stormwater originatedwith the 1987 Clean Water Act amendments,which established the authority for the EPA

to develop a phased approach to stormwaterdischarge permitting and management. Twostormwater rules followed in 1990 and 1992:the stormwater application rule and thestormwater implementation rule. The storm-water application rule of November 1990identified the types of facilities subject topermitting under the National Pollutant Dis-charge Elimination System (NPDES) pro-gram (found at 40 CRR. Part 122), and thestormwater implementation rule of April1992 described the requirements for NPDESstormwater permits.
Under the Phase I regulations, promul-gated in 1990, a stormwater discharge permitis required for:
• "Stormwater discharges associated withindustrial activity" as defined by 40CRR. §122.26(b)(14) (primarily relatingto specific Standard Industrial Classifica-tion [SIC] codes)
• Stormwater discharges from large andmedium municipal separate storm sewersystems (MS4s). A large MS4 is definedas a separate storm sewer with a servicepopulation of more than 250,000 people,and a medium MS4 is a system thatserves more than 100,000 and less than250,000 people
• Stormwater discharges from large con-struction sites (more than five acres ofdisturbed land)
• Facilities already covered by an NPDESpermit for a combined wastewater/stormwater dischargeFacilities that the EPA or a NPDES stateadministrator determines to have storm-water discharges contributing to a viola-tion of water quality or that are"significant contributors" of pollutantsto waters of the United States
Phase II of the federal stormwater permit-ting program was adopted on December 8,1999, and includes permit requirements forthe following types of discharges:
• Stormwater discharges from "regulated"small MS4s in urbanized areas (UAs)1
• Stormwater discharges from small con-struction sites (between one and fiveacres of disturbed land)
• Stormwater discharges associated withindustrial activities from small munici-pal facilities temporarily exempted fromthe Phase I requirements by provisionswithin the Intermodal Surface Transpor-tation Efficiency Act (ISTEA)
The Phase II rules also contain a condi-tional no-exposure exclusion that is availableto Phase I dischargers who can certify that allindustrial activities and materials at their siteare protected from exposure to precipitation.This "conditional no exposure certification"allows such facilities to "opt out" of the fed-eral stormwater program.
It is important to note that the federalstormwater rules are not applicable in thefollowing situations (though there may bestate or local rules that are applicable):
• Nonpoint source discharges of stormwa-ter
• Discharges of stormwater to municipalsewer systems that are combined storm-water and sanitary sewers
• Discharges of stormwater to groundwa-ter
State Stormwater PermittingPrograms
Provisions within the Clean Water Act allowstates to request authorization to implementthe federal NPDES permitting programwithin their states. As of 2006, only five states
1 An "urbanized area" is defined as a land areacomprising one or more places—centralplace(s) and the adjacent densely settled sur-rounding area—that together have a residentialpopulation of at least 50,000 and an overall pop-ulation density of at least 1,000 people persquare mile.

(Alaska, Idaho, Massachusetts, New Hamp-shire, and New Mexico) and the District ofColumbia do not have NPDES permittingauthority for stormwater. The EPA remainsthe NPDES permitting authority for storm-water, as well as wastewater, discharges inthese jurisdictions.
Most states with NPDES permittingauthority have followed the EPA's lead anddeveloped general permits for stormwaterdischarges to surface waters based on theEPA's original baseline general permit. Thestate permitting programs must be at least asstringent as the EPA's program and may bemore stringent. States that have been dele-gated NPDES permitting authority oftenincorporate elements of their preexistingstormwater management programs into ageneral permitting process. Industrial dis-chargers located in NPDES-delegated statesmust check with their state agencies to deter-mine their stormwater permit options andrequirements. Stormwater that discharges togroundwater, as opposed to surface water,will likely be regulated under the state'sgroundwater discharge laws and regulations.
Types of Stormwater PermitsIndustrial facilities are required to complywith the stormwater rules if they meet thefollowing three criteria:
• Does the facility discharge stormwatervia one or more point sources (e.g., apipe, swale, or ditch) into waters of theUnited States (either directly or indi-rectly through a municipal separatestorm sewer)?
• If the facility falls within one of the fol-lowing categories:
— Engaged in industrial activity(defined by SIC code)
— Already covered under an NPDESpermit
— Identified by the EPA as contributingto a water-quality violation
There are currently two types of federalstormwater discharge permits issued toindustrial dischargers by the EPA: the Multi-Sector General Permit and the IndividualPermit. NPDES-delegated states typicallyoffer both general and individual permits, aswell. Most permits are issued for a maximumterm of five years, after which they may berenewed.
Multi-Sector General PermitThe NPDES Stormwater Multi-Sector Gen-eral Permit (MSGP) is the simplest form ofNPDES permit coverage an industrial facilitycan obtain, although there are circumstancesthat would cause a facility to be ineligible forMSGP coverage. The original MSGP wasissued in the Federal Register on September29, 1995 and incorporates requirements for29 industrial sectors. On September 30, 1998,the modified MSGP was issued to cover addi-tional industrial dischargers not previouslyincluded in the MSGP. In 2000, the MSGPwas reissued for another five-year term,which ends on September 30, 2005. The EPAis currently in the process of renewing thepermit prior to its expiration.
Industrial facilities that have activitiescovered under one or more of the industrialsectors in the MSGP are eligible for coverage.To obtain MSGP coverage, the facility mustsubmit a Notice of Intent (NOI) for coverageand prepare and implement a StormwaterPollution Prevention Plan (SWPPP). TheMSGP contains some general requirementsspecific to all permittees, as well as industry-specific requirements for stormwater moni-toring, reporting, and, in some cases, specificbest management practices (BMPs) to mini-mize contamination of runoff.
Individual PermitThe NPDES Individual Permit requires thepreparation and submittal of NPDES Forms1 and 2F, which request specific informationabout the facility; the industrial operations;and the results of stormwater sampling, anal-ysis, and flow measurement. A facility-

specific Individual Permit is issued by theNPDES permitting authority and typicallycontains discharge limits, monitoring andreporting requirements, and may requireimplementation of BMPs or pollution pre-vention measures. Industrial facilities thatare required to apply for an Individual Per-mit include:
• Facilities that are not covered under theMSGP
• Facilities that have previously had anNPDES permit for stormwater
• Facilities that are determined by the per-mitting authority to be contributing to aviolation of a water-quality standard
Because of the backlog of applications andthe lengthy application review and permit-writing process for Individual Permits, per-mitting authorities typically recommend thatdischargers seek coverage under the MSGP, ifeligible. In some EPA regions, applicantsseeking Individual Permits have waited threeto five years or more to receive their permits.
Construction-Related PermitsOne additional stormwater permitting issuethat an industrial or environmental managermust be aware of is the NPDES StormwaterConstruction General Permit. This permit isapplicable to construction projects that dis-turb one or more acres of land area. The per-mitting process is the same as for the MSGP:submittal of an NOI for coverage and imple-mentation of a Stormwater Pollution Preven-tion Plan (SWPPP) that focuses on BMPsrelating to sediment and erosion control dur-ing construction. NPDES-delegated statesoffer similar permits for stormwater dis-charges from construction sites. In somestates, local governments also have site planapproval requirements relating to stormwa-ter runoff that overlap with NPDES storm-water requirements. When planning for con-struction projects at an industrial facility, anenvironmental manager must consider the
potential applicability of stormwater permit-ting at all levels of government—federal,state, and local. Also, construction projectsthat result in changes in the site drainagecharacteristics, exposure of industrial activi-ties, or potential pollutant sources could trig-ger the requirement to update the facility'sstormwater permit and/or the SWPPP.
Stormwater Pollution Prevention Plan(SWPPP)Among the important requirements of thefederal MSGP is the development and imple-mentation of a Stormwater Pollution Preven-tion Plan (SWPPP). The goal of the SWPPP isto reduce or eliminate the amount of pollut-ants in stormwater discharges from an indus-trial site. The SWPPP should be developedwith the involvement of and input from a des-ignated stormwater pollution prevention teamcomprised of facility staff representing keymanufacturing, operations, and environmen-tal management areas. The SWPPP mustidentify all potential pollutant sources andinclude descriptions of control measures toeliminate or minimize contamination ofstormwater. The SWPPP must contain:
• A map of the industrial facility, identify-ing the contributing areas that drain toeach stormwater discharge point
• Identification of the manufacturing orother activities that take place withineach area
• Identification of the potential sources ofpollutants within each area
• An inventory of materials that can beexposed to stormwater
• An estimate of the quantity and type ofpollutants likely to be contained in thestormwater runoff
• A history of spills or leaks of toxic orotherwise hazardous materials from thepast three years
Best Management Practices (BMPs) mustbe identified. BMPs should include good
housekeeping practices, structural controlmeasures where needed, a preventive mainte-nance program for stormwater control mea-sures, and procedures for spill preventionand response. Traditional stormwater man-agement controls, such as oil/water separa-tors and retention/equalization devices, mustalso be addressed as appropriate.
• For facilities that are subject to Section313 of the Emergency Planning andCommunity Right-to-Know Act(EPCRA 313) reporting, the SWPPPmust address those areas where the listedSection 313 "water priority chemicals"are stored, processed, or handled. Theseareas typically require stricter BMPs, inthe form of structural control measures,and additional stormwater monitoring.
• The facility must have a Certification ofNon-Stormwater Discharges, certifyingthat their stormwater discharge does notcontain actual or potential sources ofnonstormwater discharges such as washwaters, contact cooling waters, and floordrain connections. It should be notedthat the MSGP contains a list of permis-sible nonstormwater discharges, includ-ing fire hydrant flushings and buildingwash water that does not contain deter-gents. However, no other types of mate-rials are permissible under this permit.In order to make this certification, acomprehensive facility survey shouldalso be conducted to identify activitiesthat may result in unpermitted dis-charges. As-built piping diagrams shouldbe reviewed to confirm there are no non-stormwater connections to the stormsewer. Otherwise, all outfalls must betested during dry weather conditions,using a dye or other tracer, to ensure thatthere are no discharges.
• A recordkeeping system must be devel-oped and maintained, and there must bean effective program for trainingemployees in matters of controls andprocedures for pollution prevention.
The SWPPP should also describe thestormwater monitoring program and report-ing procedures.
Prevention of GroundwaterContamination
Measures and facilities to prevent contami-nation of groundwater should be developedconcurrently with those that have the pur-pose of protecting against surface water con-tamination. The most important of thesemeasures include:
• Construction of impermeable barriers,such as concrete pads, to prevent perco-lation of stormwater after it has becomecontaminated
• Installation of foolproof automatic shut-off devices to prevent spills from over-flowing tanks
• Alarms• An aggressive preventive maintenance
program to prevent the occurrence ofleaks
• Control of particulate and aerosol emis-sions and routine cleaning of all surfaceson the industrial site
Stormwater Management Concepts
Development of a successful industrialstormwater management program requiresconsideration of three important concepts:
• Pollution prevention• Source segregation• Collection and treatment
Pollution prevention applies to both rou-tine and accidental exposure of stormwaterto pollutants. Pollution prevention measuresmay be functional (requiring people toimplement them) or structural (not depend-ent upon people); they must be practicedand maintained on an ongoing basis.

Source segregation is the separation of"clean" and "dirty" areas and activities, so asto result in stormwater runoff from thoseareas that is clean or dirty. It can be an ele-ment of both pollution prevention and treat-ment. Source segregation has the effect ofmaximizing the concentration of contami-nants in runoff since, presumably, the quan-tity of contaminants at a given industrial siteat a given time is fixed by the circumstancesand events that have occurred prior to astorm event. Therefore, the smaller theamount of stormwater in which the contami-nants are dissolved or suspended, the moreconcentrated they will be. Source segregationis an important precursor to stormwatertreatment, since for treatment devices suchas oil skimmers and sedimentation basins, ahigher pollutant concentration will lead tomore effective treatment. Furthermore, areduction in the volume of runoff to be col-lected and treated will result in more cost-effective treatment.
It is the goal of pollution prevention andsource segregation to eliminate and/or reducecontamination of stormwater runoff at thesite to the point where compliance with appli-cable regulations and permits occurs withoutthe necessity of expensive collection, reten-tion, treatment, and discharge facilities.Stormwater treatment should be the final stepin a stormwater management program, afterpollution prevention and source segregationmeasures are already in effect. However, forfacilities that are regulated under permitswith strict effluent limits (or that choose totreat and recycle stormwater in lieu of dis-charging it), treatment may be required toattain the desired water quality.
Stormwater Treatment SystemDesign Considerations
Quantity and QualityDesigning for stormwater treatment involvesdetermining the quantity and quality of thestormwater. The quantity is determined bystudying the hydrology at the site, and the
quality is based upon the water-quality limitsspecified in the discharge permit, or thedesired water quality criteria required forfacilities that recycle stormwater. Control ofthe quantity and quality of stormwater dis-charges is possible only if effective segrega-tion, collection, retention, and treatment arein use.
Basic HydrologyThe quantity of stormwater runoff from anindustrial site must be determined in orderto design a collection and treatment system.To do this, the rainfall intensity, duration,and frequency must be determined for thegiven geographical location. The runoff fromthe site must then be determined; it isdependent upon the topographic features atthe location and the time it takes the rainfallto travel to the outlet.
PrecipitationRainfall at a given location can be quantifiedusing several different methods. Some of themore common methods and sources of dataare as follows:
• Gauged Data—Available from theNational Weather Service or the U.S.Army Corps of Engineers.
• Synthetic Distributions—The Soil Con-servation Service's (SCS) 24-hour rain-fall distributions (Types I, IA, II, andIII), available dimensionless, can beapplied to different rainfall depths.
• J-D-JP Curves—Statistical methods usedto create intensity-duration-frequencycurves for several design storms.
• Design Storm—Reoccurrence frequencyof a storm event. Typically 2, 5, 10, 25,50, or 100-year storms. By definition,there is a 4% probability that the 25-yearstorm will be exceeded in any given year.
It is also important to consider snowfalland snowmelt as a significant contribution torunoff.

RunoffThe rate of stormwater runoff is of concernto prevent erosion of downstream receivingwaters. The volume of runoff from a devel-oped site will be greater and reach the outletfaster due to impervious surfaces that pre-vent infiltration. Because the increased run-off volume reaches the outlet faster, it leadsto a faster time of concentration. Time ofconcentration is defined as the time for awave to propagate from the most distantpoint in the watershed to the outlet.
In the sections that follow, two commonmethods of determining runoff are pre-sented: the rational method and thehydrograph method. However, there are sev-eral other methods that can be used, eachwith their own applications and limitations.
The peak flow from a site is typically esti-mated using the rational method. The ratio-nal method assumes that equilibrium isreached within the watershed (i.e., inflowequals outflow). Therefore, the storm dura-tion must be as long as the time of concen-tration to achieve steady-state conditions.For this reason, this method should not beused for large areas (generally, more than 200acres). The rational method is typically usedfor sizing storm sewer systems because of itssimplicity. However, the method does notcalculate flow rate versus time or the volumeof runoff. Therefore, to design a downstreamtreatment system, the development of ahydrograph is necessary.
The stormwater discharge from a water-shed is represented by a hydrograph, which isa continuous plot of instantaneous dischargeversus time. Hydrographs are a representa-tion of the physical geography of and themeteorological conditions in a watershed,and they include the combined effects of cli-mate, hydrologic losses (e.g., evaporation,infiltration, and so on), surface runoff, sub-surface stormwater flow, and groundwaterflow. The peak of the hydrograph indicatesthe peak flow of a storm event, which is usedto determine whether the flow is too high fordownstream receiving waters. The area underthe curve of the hydrograph represents the
volume of water discharged during the stormevent. The hydrograph method provides theinformation needed for sizing downstreamretention/detention ponds and other treat-ment systems.
Selecting a Design StormIn general, the size of the collection, reten-tion, and treatment facilities is derived fromprecipitation records and selection of adesign storm. Since the concept of a designstorm event implies periodic "failure," it isnecessary to include, within the design ofstormwater facilities, provisions to preventdamage to those facilities or violations ofpermit when the design storm capacity isexceeded.
The 25-year, 24-hour storm event is con-sidered an appropriate design basis for moststormwater management facilities at anindustrial plant when "conventional" pol-lutants are the only substances of concern.In situations where PCBs or other toxic sub-stances are potential pollutants, a 50- or100-year storm would be more appropriate.A risk assessment should be carried out todetermine if the benefits of designing for astorm event that would yield a greater vol-ume and/or peak flow rate, such as the 50-year, 24-hour storm, or even the 100-yearstorm, would outweigh the risk of an over-flow and, potentially, a permit exceedance.Factors to be considered in such a riskassessment include the water quality stan-dards of the receiving water, the dischargepermit limits, and the potential enforce-ment consequences should a permit viola-tion occur.
Collection System DesignThe typical stormwater collection systemconsists of roof drains, catch basins, stormdrains, pumping stations, and open chan-nels. The design storm peak runoff rate isused to size the collection, conveyance, andpumping systems. Collection systems mustbe well maintained and kept clean and free of

leaks. Also, easy access to the collection sys-tem for sampling and flow measurement,when required, should be designed and builtinto the system.
Stormwater Retention/DetentionStormwater retention or detention can beaccomplished in lined, earthen basins, or inabove- or below-ground concrete or steeltanks. Retention basins are also referred to aswet ponds or wetlands, because they retain apermanent pool of water. Detention basinsare referred to as dry ponds, because theyremain dry once they have drained after astorm event. An industrial plant in a nonur-ban location with large areas of unused landwould consider the cost effectiveness of alined earthen basin first, while a plant in anurban location with limited available unusedland might first consider an above- or below-ground concrete basin. The size of the storm-water retention facility is typically based onthe total volume from a design storm event.Additional factors that must be included are:
• Precipitation that falls directly into theretention device
• The rate at which water is taken out ofthe basin, as it relates to the probabilityof another storm event taking place verysoon after the design storm has occurred
The procedures presented in Chapter 7 fordesigning the size (volume) of a flow equal-ization facility are appropriate to be used forthe design of a stormwater retention basin,once the total volume and characteristics ofthe design storm have been determined.
Table 6-1 outlines the advantages and dis-advantages of various options for retentionand detention, as well as other methods ofreducing the volume and rate of stormwaterrunoff.
System Failure ProtectionSince, by definition, the stormwater manage-ment system will "fail" periodically, in terms
of capacity of the retention device and/or theconveyance facilities, it is extremely impor-tant to design and construct overflow devicesand other excess water management facili-ties. The overflow and excess water convey-ance devices must protect against erosionand contamination of surface water orgroundwater. These devices must also bemaintained and kept clean, and should,therefore, be designed to allow easy access.Overflow facilities should be designed withsufficient capacity to accommodate any con-ceivable storm event.
Technologies to Achieve TreatmentGoalsDesign of treatment systems for stormwaterrunoff is always based upon the degree andtype of treatment required, which dependupon:
• The water-quality limits specified in thedischarge permit
• The water-quality criteria required foruse in the plant
Table 6-2 presents typical stormwater pol-lutant parameters, some treatment options,and considerations for design.
Design of treatment facilities for stormwa-ter runoff must always include considerationof future requirements, such as more strin-gent limits in future NPDES permits. Suchconsideration might result in simply provid-ing room to add additional treatmentdevices. However, it is possible that the mostcost-effective procedure is to provide a highlevel of treatment and reuse stormwater inone or more processes within the industrialplant. This solution would require the peri-odic discharge, or "blow-down," of water tocontrol TDS and/or temperature. The blow-down would have to be discharged as treatedprocess water in compliance with the appli-cable permit(s).

Table 6-1 Stormwater Retention/Detention Options
Option
Wet Retention Pond
Detention Basin
Inline StormwaterDetention Systems
Grassed Swale
Permanent Seeding/Planting
Infiltration Basin/Trench
Description
Wet basin or pond maintains apermanent pool of water, in ad-dition to temporarily detainingstormwater
Basin designed to detain storm-water runoff from a storm forsome minimum duration (e.g.,24 hours)
Underground chamber used toprovide temporary storage ofexcess stormwater runoff
Broad, shallow earthen chan-nels (usually with a side slopeof a minimum of 3:1)
Grass areas and shrubs/ plant-ings that decrease runoff byslowing velocity and permittinggreater infiltration
Stone-filled excavation used totemporarily store runoff so itcan infiltrate into the ground
Advantages
• Applicable to all site sizes,depending on availablespace
• Can achieve high removalrate of pollutants
• Most cost effective forlarger, intensively devel-oped sites.
• Applicable to all site sizesdepending on availablespace
• Easy to clean and maintain
• Entire structure is under-ground
• Easy to construct
• Inexpensive to construct
• Easy to construct andmaintain
• Relatively inexpensive
• Easy to construct andmaintain
• Improves aesthetics of a site
• Provides stabilization andfiltering of sediments
• Easy to construct
• Suitable to most sites
Disadvantages
• May have to be pumped outif insufficient topographicrelief available
• No exfiltration with highgroundwater or underlyingbedrock
• Expensive to construct inbedrock
• Wildlife habitat maybecome problematic at cer-tain sites
• May have to be pumped outif insufficient topographicrelief available
• No exfiltration with highgroundwater or underlyingbedrock
• Expensive to construct inbedrock
• Confined access
• Difficult to monitor andclean
• Can be subject to severedamage during heavystorms
• Can affect downstreamdrainage patterns
• May require significantamount of space
• Not effective for intenserainfall events
• May require irrigation tosustain cover during dryweather
• Dependent on climate andweather
• Cannot be used with a highgroundwater table
• Not applicable in bedrockand clay subsoil
• Usually used for small areas
Stormwater as a Source of ProcessWater Makeup
If collected stormwater is to be used asmakeup water for one or more manufactur-
ing, cleaning, cooling, or other processes inthe facility, treatment and considerations canbecome much different from those that areappropriate to simple discharge to complywith a permit. For example, a storage facility
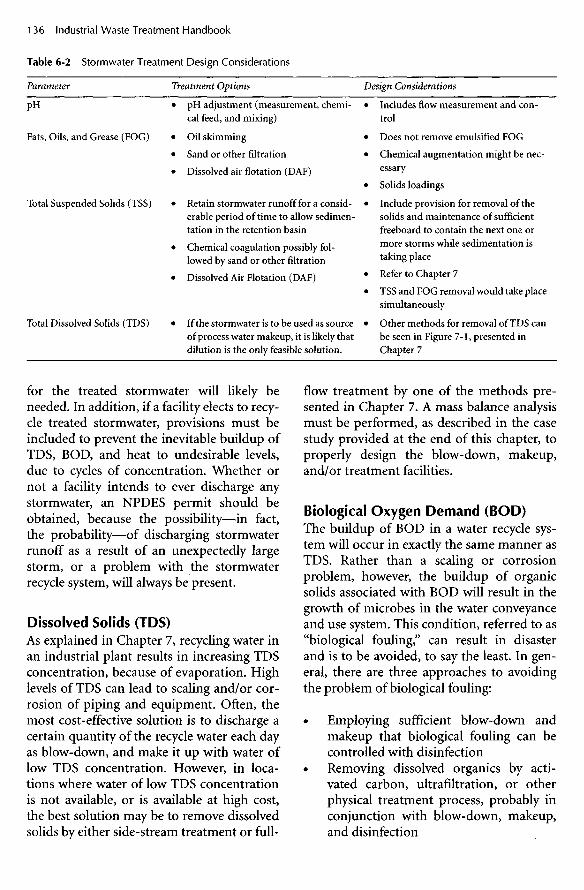
Table 6-2 Stormwater Treatment Design Considerations
Parameter
pH
Fats, Oils, and Grease (FOG)
Total Suspended Solids (TSS)
Total Dissolved Solids (TDS)
Treatment Options
• pH adjustment (measurement, chemi-cal feed, and mixing)
• Oil skimming
• Sand or other filtration
• Dissolved air flotation (DAF)
• Retain stormwater runoff for a consid-erable period of time to allow sedimen-tation in the retention basin
• Chemical coagulation possibly fol-lowed by sand or other filtration
• Dissolved Air Flotation (DAF)
• If the stormwater is to be used as sourceof process water makeup, it is likely thatdilution is the only feasible solution.
Design Considerations
• Includes flow measurement and con-trol
• Does not remove emulsified FOG
• Chemical augmentation might be nec-essary
• Solids loadings
• Include provision for removal of thesolids and maintenance of sufficientfreeboard to contain the next one ormore storms while sedimentation istaking place
• Refer to Chapter 7
• TSS and FOG removal would take placesimultaneously
• Other methods for removal of TDS canbe seen in Figure 7-1, presented inChapter 7
for the treated stormwater will likely beneeded. In addition, if a facility elects to recy-cle treated stormwater, provisions must beincluded to prevent the inevitable buildup ofTDS, BOD, and heat to undesirable levels,due to cycles of concentration. Whether ornot a facility intends to ever discharge anystormwater, an NPDES permit should beobtained, because the possibility—in fact,the probability—of discharging stormwaterrunoff as a result of an unexpectedly largestorm, or a problem with the stormwaterrecycle system, will always be present.
Dissolved Solids (TDS)As explained in Chapter 7, recycling water inan industrial plant results in increasing TDSconcentration, because of evaporation. Highlevels of TDS can lead to scaling and/or cor-rosion of piping and equipment. Often, themost cost-effective solution is to discharge acertain quantity of the recycle water each dayas blow-down, and make it up with water oflow TDS concentration. However, in loca-tions where water of low TDS concentrationis not available, or is available at high cost,the best solution may be to remove dissolvedsolids by either side-stream treatment or full-
flow treatment by one of the methods pre-sented in Chapter 7. A mass balance analysismust be performed, as described in the casestudy provided at the end of this chapter, toproperly design the blow-down, makeup,and/or treatment facilities.
Biological Oxygen Demand (BOD)The buildup of BOD in a water recycle sys-tem will occur in exactly the same manner asTDS. Rather than a scaling or corrosionproblem, however, the buildup of organicsolids associated with BOD will result in thegrowth of microbes in the water conveyanceand use system. This condition, referred to as"biological fouling," can result in disasterand is to be avoided, to say the least. In gen-eral, there are three approaches to avoidingthe problem of biological fouling:
• Employing sufficient blow-down andmakeup that biological fouling can becontrolled with disinfection
• Removing dissolved organics by acti-vated carbon, ultrafiltration, or otherphysical treatment process, probably inconjunction with blow-down, makeup,and disinfection

• Removing BOD with biological treat-ment, using one of the methods pre-sented in Chapter 7, probably inconjunction with blow-down, makeup,and disinfection
Again, a mass balance must be performed,as was the case for TDS, to properly designBOD control facilities for water recycle andreuse systems.
HeatIn certain situations, heat can build up toundesirable levels in a water recycle/reusesystem. There are, in general, threeapproaches to solving this problem:
• Passing the recycle water through a heatexchanger to transfer some of the heat toa process stream or to plant utility waters
• Making use of a cooling tower to wastesome of the heat
• Diluting the recycle stream with coldwater from another source
In all three of the above approaches, thequantity of water in the recycle system mustbe maintained within an acceptable range byadding makeup water or discharging excesswater.
Case Study: Metals ForgingManufacturing FacilityA metals forging manufacturing facility islocated on a 189-acre parcel of land alongsidea river having a 7Q10 flow of 240 cfs. Theplant performs various metalworking opera-tions, such as forging, heat treating, chemicaletching, and grinding. The manufacturingcomplex is comprised of two primary manu-facturing buildings, a forge shop, and a proc-ess and maintenance (P&M) building. Othersupport buildings include an office andadministration building, several air pollutioncontrol (APC) buildings, a rinsewater pre-treatment plant (RPP), and an oily wastewa-
ter treatment plant (OWTP), as shown inFigure 6-1.
Stormwater runoff from the building roofand yard areas in the northern, eastern, andnorthwestern portions of the site flows bygravity to an existing impoundment(Impoundment 001) and is discharged at anNPDES-permitted Outfall 001. Remainingroof and yard areas are collected and directlydischarged at four other NPDES-permittedOutfalls onsite. In addition to stormwaterrunoff, Impoundment 001 receives somepretreated process wastewaters from theforge shop and P&M building, fire protec-tion water from the forge shop, and noncon-tact cooling water. The plant uses lubricatingand cutting oils, greases, coolants, and acidsin its forging and associated processes.
Forge Shop Area Stormwater ProjectThe Forge Shop Area Stormwater Projectaddressed the stormwater and process waste-water that drained to NPDES Impoundment001. The objectives of this project were three-fold:
• Segregate uncontaminated and contami-nated stormwater s
• Construct a new Runoff ManagementFacility to replace Impoundment 001
• Identify Best Management Practices tomanage stormwater quality
Preliminary Engineering StudiesAs a result of studies to identify and charac-terize the sources of flows to Impoundment001, it was determined that the storm drain-age system had been used for the discharge ofsome process wastewaters, that there was apotential for spills to enter the system, andthat a limited number of source areas wereresponsible for a large portion of the totalconstituent loading to Impoundment 001.
Next, an evaluation was conducted ofavailable options for eliminating or segregat-ing process wastewaters and contaminatedstormwater from uncontaminated stormwa-ter. The results of this work indicated that:

QUINSIGAMOND RIVERWATER PUMP STATION
NPDESOUTFALL010
FORMER SLUDGEDRYING BEDS
FORMER SEWAGEDISPOSAL PLANT
WATER TOWERS
DRAINAGE SWALE
COOLINGTOWER
BOSTON & ALBANY RAILROAD
BONNY BROOK
PROCESS & MAINTENANCE(P&M)BUILDING
NPDES OUTFALL 001
IMPOUNDMENT 001
OILY WASTEWATERTREATMENT PLANT(OWTP)
DRAINAGESWALE
GRAFTON RINSEWATERPRETREATMENT PLANT(GRPP)
NPDES OUTFALL 009
OFFICE BLDG.
GUARDHOUSE
Figure 6-1 Rinsewater pretreatment and wastewater treatment facilities plan.
NPDESOUTFALL Oil
NPDESOUTFALL 008
NPDESOUTFALL 003
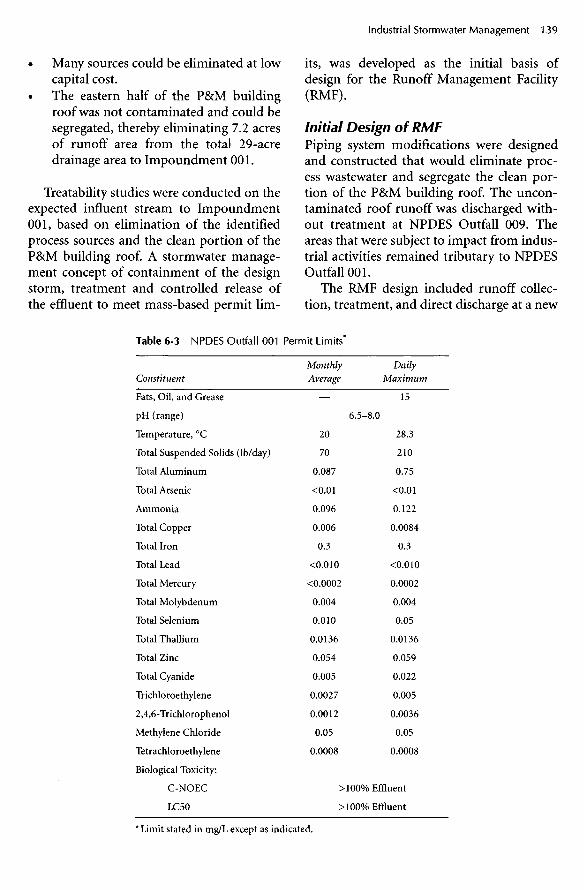
• Many sources could be eliminated at lowcapital cost.
• The eastern half of the P&M buildingroof was not contaminated and could besegregated, thereby eliminating 7.2 acresof runoff area from the total 29-acredrainage area to Impoundment 001.
Treatability studies were conducted on theexpected influent stream to Impoundment001, based on elimination of the identifiedprocess sources and the clean portion of theP&M building roof. A stormwater manage-ment concept of containment of the designstorm, treatment and controlled release ofthe effluent to meet mass-based permit lim-
its, was developed as the initial basis ofdesign for the Runoff Management Facility(RMF).
Initial Design of RMFPiping system modifications were designedand constructed that would eliminate proc-ess wastewater and segregate the clean por-tion of the P&M building roof. The uncon-taminated roof runoff was discharged with-out treatment at NPDES Outfall 009. Theareas that were subject to impact from indus-trial activities remained tributary to NPDESOutfall 001.
The RMF design included runoff collec-tion, treatment, and direct discharge at a new
Table 6-3 NPDES Outfall 001 Permit Limits*
Constituent
Fats, Oil, and Grease
pH (range)
Temperature, 0C
Total Suspended Solids (lb/day)
Total Aluminum
Total Arsenic
Ammonia
Total Copper
Total Iron
Total Lead
Total Mercury
Total Molybdenum
Total Selenium
Total Thallium
Total Zinc
Total Cyanide
Trichloroethylene
2,4,6-Trichlorophenol
Methylene Chloride
Tetrachloroethylene
Biological Toxicity:
C-NOEC
LC50
MonthlyAverage
DailyMaximum
15
6.5-8.0
20
70
0.087
<0.01
0.096
0.006
0.3
<0.010
<0.0002
0.004
0.010
0.0136
0.054
0.005
0.0027
0.0012
0.05
0.0008
28.3
210
0.75
<0.01
0.122
0.0084
0.3
<0.010
0.0002
0.004
0.05
0.0136
0.059
0.022
0.005
0.0036
0.05
0.0008
> 100% Effluent
> 100% Effluent
* Limit stated in mg/L except as indicated.

NPDES Outfall 001. The treatment conceptconsisted of grit removal, sedimentation, oilskimming, and pumped discharge of theeffluent, at a rate that would meet currentmass-based NPDES permits, as follows:
Total Suspended Solids (TSS) 70 lb/dayFats, Oil, and Grease (FOG) 50 lb/day
Provisions were included for containmentof spills within the drainage area of the RMF,and consideration was given to future efflu-ent polishing (by means of polymer additionand adsorption clarification) in the eventthat the RMF was not able to meet the limitsof the NPDES permit. Subsequent to thedevelopment of this concept, the EPA issueda renewed NPDES permit containing thewater quality-based limits presented in Table6-3, which could not be met with the pro-posed treatment scheme.
Revised Design of RMFBecause of the high cost for an advancedtreatment system, and the lack of guaranteeof meeting the new discharge limits, it wasdecided to institute a stormwater recycle pro-gram to eliminate the regular discharge atOutfall 001, and reduce the demand forwater from process water supply sources. Thedesign concept was thus revised to incorpo-rate sand filtration and recycle of the treatedwater for use in the manufacturing process.The original design features of grit and oilremoval, sedimentation, and equalizationwere retained.
The following design criteria for the RMFwere agreed upon:
Design storm:
Mode ofoperation:
25-year, 24-hour stormevent
Incorporate process watereffluent into stormwaterretention and treatmentsystem. Recycle and reusecontinuously. Blow-downas necessary to maintaindesired water quality.
Recycle water TSS: < 1-10 mg/Lquality: FOG: < 1 mg/L
pH: 5.0-8.0
In order to determine the buildup of TDS,TSS, BOD, and heat due to the "cycles ofconcentration" effect, mass balances of water,constituent substances, and heat were per-formed.
Water BalanceSince the RMF would receive both stormwa-ter runoff and process wastewaters, dry andwet weather flows had to be considered. Awater balance was performed to represent theflow of waters before and after the recyclesystem was put into effect. Incoming water tothe site originated from several sources:
• On-site wells for process use and fireprotection
• Municipal water for process and sanitaryuse
• River water for process use and fire pro-tection
• Stormwater
Flow measurement data were collected,and average annual rainfall data were used toestimate average wet weather flow. The waterbalance representing the "before recycle" sce-nario is presented in Figure 6-2.
Discharges from the site originated fromthe following sources:
NPDES permitted outfalls• RPP effluent• Sanitary wastewater• Miscellaneous losses
As with the incoming flows, flow datawere collected and water use records wereused to estimate sanitary and process waste-water flows. An internal cooling water towerwas responsible for most of the losses, due toevaporation. Also, some water was lost fromthe system as dilution water for acid andcaustic solutions. The "after recycle" water

Wells10,00OGPD
Stormwater36,000 GPD
Figure 6-2 Water balance before recycle.
Water Balance Envelope
Wyman-GordonManufacturing
Facility
Municipal Water Supply160,000GPD
Quinsigamond River (process)81,000GPD
Quinsigamond River (fire water)27,000 GPD
212,000GPD
32,000 GPD
68,000 GPD
2,000 GPDLosses
Sanitary
GRPP
Impoundment001
NPDESOutfall 001
POTW
POTW
212,000GPD
32,000 GPD
68,000 GPD
2,000 GPD

Municipal Water Supply68,000 GPD
Wells10,000GPD
Stormwater36,000 GPD
Figure 6-3 Water balance after recycle.
Quinsigamond River (fire water)27,000 GPD
Wyman-GordonManufacturing
Facility
Water Balance Envelope
Recycle212,000GPD
RMF
GRPP
Sanitary
Losses
212,000GPD
71,000GPD
68,000 GPD
2,000 GPD
POTW
POTW
71,000GPD
68,000 GPD
2,000 GPD

balance, presented in Figure 6-3, shows thatall stormwater runoff could be used as proc-ess water makeup. In addition to reducingthe water withdrawn from the river, lessmunicipal water would be used (68,000 vs.160,000 GPD).
Mass BalanceAlthough the existing levels of TDS, TSS, andBOD were very low, the mass balance showedthat levels of BOD in the recycle loop couldreach 10 to 15 mg/L, indicating a need fordisinfection to prevent biological fouling ofthe water distribution piping and equipment.It was determined that TDS would not reachproblematic levels, and because of the sandfilter in the treatment train, TSS was notexpected to be a problem. A heat balanceshowed that the temperature within the recy-cle loop could reach 1020F during the sum-mer, indicating the possible need for a heatexchanger or cooling tower. A cooling tower,of course, would have the effect of increasingthe concentration of TDS, TSS, and BODand would require revision of the mass bal-ances if considered further.
Stormwater Collection and RetentionThe RMF was designed to serve three stormdrain lines and the effluent from the pro-posed Oily Wastewater Pretreatment System(OWPS), a pretreatment system that wasbeing designed to remove free oils and emul-sified oils from presswaters. All of these flowswere routed to the eastern portion of the siteto Outfall 001, but required interceptionprior to the Outfall and rerouting to thenortheast to the proposed RMF location.This was accomplished via the design of acast-in-place concrete junction chamber atthe head end of the Impoundment. Thejunction chamber was designed to interceptand reroute the flows without "throttling"the storm drainage system or allowing solidsto settle out. The structure was designed sothat it could be constructed in a phasedapproach that would maintain the discharges
to Impoundment 001 until the RMF wasready to receive flow.
The sedimentation basin was sized toretain the design storm volume, provide thesurface area and retention time for solids set-tling, and serve as an equalization tank.Design of the basin (configuration anddepth) was controlled by site hydraulic limi-tations imposed by the invert elevations ofthe existing storm drain lines relative to thewater surface elevation of the receiving waterfor the overflow discharge.
Treatment and Recycle StorageThe layout of the RMF site is shown in Figure6-4. The unit processes of the RMF are repre-sented in Figure 6-5. The unique designaspects of each unit process are described inthe following sections.
PLC Control and Operator InterfaceControl of the RMF was semiautomatic withthe use of a programmable logic controller(PLC) for pump control and alarms. AnOperator Interface Terminal (OIT) wasplaced in the RMF for operator control. Asecond OIT was placed in the plant engineer-ing office for monitoring purposes.
Grit ChamberThe grit chamber was designed to lower theinfluent flow velocity, thereby allowing forthe removal of particles with a specific grav-ity greater than 2.65 and of a size that wouldbe retained on a 100-mesh screen. Initial oilskimming was also performed by means of aslotted pipe skimmer that drained theskimmed oil and water mixture to the sumpwithin the RMF Treatment Building, wherethe oil was removed. The grit chamber alsoprovided added storage capacity (188,000gals.).
Sedimentation BasinThe sedimentation tank was a below-gradeconcrete tank, open to the air and divided bya center wall. The tank was sized to contain

Figure 6-4 RMF site layout.
the design storm runoff volume of 2.06 mil-lion gallons and allow for two feet of free-board, for a total capacity of 2.34 million gal-lons. The tank size (100 ft X 180 ft X 17 ft)and configuration provide the surface areaand retention time for additional settling ofsolids. Due to a high groundwater table ele-vation, the structural design of the tankincorporated a combination of antiflotationtechniques that added mass to offset buoyantforces.
Oil SkimmingOil skimming is accomplished in two loca-tions: (1) in the grit chamber (as previouslydescribed), and (2) in the baffled effluentsump located inside the RMF TreatmentBuilding. A floating tube-type oil skimmerwill remove floating oils, which will be tem-porarily stored for use as a fuel source in a
waste oil burner in the RMF TreatmentBuilding. In the state where the facility waslocated, waste oil was considered a hazardouswaste; therefore, secondary containment of100% of the storage tank volume wasrequired.
pH AdjustmentDue to the acidic nature of rainfall in theNortheast (pH levels as low as 5.8 had beenmeasured in the existing Impoundment001), provisions for pH adjustment wereincluded in the RMF design. Sodium carbon-ate was fed into the line as the wastewaterwas pumped from the sedimentation tank tothe sand filters. In addition to meeting theprocess water pH needs, a more neutral pHwould meet the NPDES permit limit range of6.5 to 8.0 in the event of an overflow,intended or not, through the Outfall 001.
Wyman Gordon CompanyNorth Grafton, MARMF Site Layout
ExistingNPDES Outfall
OverflowChannel
RecycleStorage Tanks
GritDewatering Pad
Grit ChamberSpill Tank
ExistingWater Pump
Station
ExistingWater Tower
RecycleTreatment Building
RMF InfluentJunctionChamber

WATER TOWER
RECYCLE DISTRIBUTION PUMPS
RECYCLE STORAGE TANKS
RECYCLE STORAGE PUMPS
SAND FILTERSAND FILTERS
SPLITTER BOX
RMF EFFLUENT PUMPSSEDIMENTATION TANKGRIT CHAMBER
OIL SKIMMER
GRIT TANK
TO SAND FILTEREFFLUENTTANK
FROMJUNCTIONCHAMBER
WASTEWATER
LOCKINGQUICKCONNECT
SPILLTANK
TO EXISTINGHEATING OILSTORAGETANK
SKIMMED OILTRANSFER PUMP
Figure 6-5 Process flow diagram.
SKIMMED OILDECANT TANK
LOCKINGQUICKCONNECT
DECANTSUMP
SODIUM CARBONATE FEED SYSTEM SAND FILTER AIR COMPRESSORS SODIUM HYPOCHLORITEFEED SYSTEM
TO SEDIMENTATIONTANK EFFLUENT UMP
MONITORING PUMPOVERFLOW DH
OVERFLOW CHANNEL
BAFFLE
PLANTWATER
MIXER
TO TRENCHDRAIN
TO TRENCHDRAIN
FLOOR DRAIN
STATICMIXER
TREATMENTBUILDING
DISTRIBUTIONSYSTEM
OUTFALL
OUTFALL

Sand FiltrationFiltration was achieved by two Parksonup flow sand filters. This type was selectedbecause the continuous backwash systemeliminated the need for large volumes ofbackwash water (backwash flow was approxi-mately 5% to 7% of the forward flow for theupflow filter).
Recycle Water DisinfectionIt was recognized that recycle of the treatedrunoff could result in increased BOD con-centrations in the recycle water and create aproblem with biofouling in the process waterdistribution system. A sodium hypochloritefeed system was therefore included.
Recycle Water Storage and DistributionRecycle water was stored in two A. O. Smithglass-fused-to-steel aboveground tanks (ASTs)with aluminum domes, each with a capacityof 1.5 million gallons. This type of tankrequires no sandblasting, welding or paintingand, therefore, little maintenance. Recyclewater was pumped from the ASTs to theexisting process water distribution system asneeded. In the event that there is not enoughrecycle water in storage, the existing riverwater pumps receive a signal to provide sup-plemental water.
Hydraulic OverflowThe RMF was designed to handle the 2 5-year,24-hour design storm without a discharge toNPDES Outfall 001. In the event that there isa storm in excess of the design storm, or aseries of small storms occurring in rapid suc-cession so as to exceed the capacity of theRMF, two options have been included forhydraulic relief. Minor overflows (up to 1.4cfs) can be routed to NPDES Outfall 010 viaan existing outfall pipe that dischargesdirectly to the river. Hydraulic overflows inexcess of 1.4 cfs spill over a kneewall in theoverflow channel and discharge at NPDESOutfall 001, in a location tributary to the
river. Flow measurement at Outfall 010 isachieved using an orifice plate located in thefloor of the overflow channel. An H-flumecan be used to handle the larger range offlows that may be experienced at Outfall 001.
Spill ContainmentA spill containment tank has been located atthe influent end of the sedimentation tank,adjacent to the grit chamber, to provide plantpersonnel with the opportunity to divert aspill from the sedimentation basin. Spill-contaminated runoff can be contained sepa-rately, rather than be allowed to further con-taminate a potentially large volume of runoffcontained in the sedimentation basin.
Treatment ResidualsWastewater treatment residuals generated bythe RMF consist of skimmed oil, grit, andsludge from the sedimentation tank.Skimmed oil is burned in the RMF waste oilburner to recover the heat value. The gritchamber and sedimentation tank are cleanedon an annual basis. The method of disposalof grit and sludge depend on their character-istics.
Operations StrategyIn order to minimize the size of the sedimen-tation basin, it was designed for an operatingdepth between 1.5 and 3.0 feet during dryweather conditions. The 3.0-foot level givesthe treatment system eight hours of continu-ous operation, thereby avoiding frequentequipment starts and stops. With this type ofoperations strategy, the sedimentation basinhas been capable of containing the 25-year,24-hour design storm runoff volume withoutan overflow. However, it was also necessaryto consider what would happen during astorm event in excess of the design storm.The approach was to fully utilize both the in-ground and aboveground storage capabilitiesby stopping the pumps that fill the ASTs ifthey are at the overflow level and the sedi-

mentation basin is not full. At the pointwhere the sedimentation basin reaches itscapacity, treatment will resume and overflowshould occur from the ASTs to Outfall 010(depending on the overflow rate), thereforeeliminating the discharge of untreatedstormwater runoff.
SummaryThe design of the RMF, the subject of thiscase study, was driven by a need to complywith NPDES permit limits at Outfall 001.However, the benefits that have been realizedfrom this case study and design include thefollowing:
• Reduced rates of water withdrawal fromthe river and potable water supply
• Reduced annual costs for potable watersupply usage
• Increased ability to capture spills withinthe drainage area of the RMF
• Reduced potential for discharge of pol-lutants to the environment and NPDESpermit excursions
• Reduced capital and operating costs forcompliance with the NPDES permit
Bibliography
Aron, G., and C. E. Egborge. "A Practical Fea-sibility Study of Flood Peak Abatement inUrban Areas." In Report to U.S. ArmyCorps of Engineers, Sacramento District,Sacramento, CA; 1973.
Bendiet, P. B., and W. C. Huber. Hydrologyand Floodplain Analysis. 2nd ed. Reading,PA: Addison-Wesley, 1992.
Chow, V. T. Open Channel Hydraulics. NewYork: McGraw-Hill, 1959.
Chow, V. T. (ed.). Handbook of AppliedHydrology. New York: McGraw-Hill, 1964.
Federal Aviation Agency. "Department ofTransportation Advisory Circular on Air-port Drainage" Report A/C 150-5320-SB.Washington, DC: 1970.
Henderson, F. M. Open Channel Flow. Tor-onto: Macmillan, 1966.
Kibler, D. E, et al. Recommended HydrologicProcedures for Computing Urban Runofffrom Small Developing Watersheds inPennsylvania. University Park, PA: Insti-tute for Research on Land & WaterResources. 1982.
Morgali, J. R., and R. K. Linsley. "ComputerSimulation of Overland Flow." Journal ofthe Hydraulics Division ASCE, 1965.
Rantz, S. E. "Suggested Criteria for Hydro-logic Design of Storm-Drainage Facilitiesin the San Francisco Bay Region, Califor-nia." U.S. Geological Survey ProfessionalPaper 422-M, 1971.
Schulz, E. E, and Lopez, O. G. "Determina-tion of Urban Watershed Response Time."Colorado State University HydrologyPaper No. 71. Fort Collins, CO: 1974.
U.S. Army Corps of Engineers. HydrologicEngineering Center. "Storage Treatment,Overflow, Runoff Model: STORM." User'sManual. Davis, CA: 1976.
U.S. Department of Agriculture. Soil Conser-vation Service. "A Method for EstimatingVolume and Rate of Runoff in SmallWatersheds." TP-149. n.d.
U.S. Soil Conservation Service. "UrbanHydrology for Small Watersheds." SCSTechnical Release, No. 55. Washington,DC: 1975.
Viessman, W., Jr., T. E. Harbaugh, and I. W.Knapp. Introduction to Hydrology. NewYork: Intext Educational Publishers, 1972.
Wanielista, M. P. Storm Water Management:Quantity and Quality. Ann Arbor, MI:Ann Arbor Science Publishing, 1978.

7 Methods for TreatingWastewaters from Industry
General
Technologies for treating industrial wastewa-ters can be divided into three categories:chemical methods, physical methods, andbiological methods. Chemical methodsinclude chemical precipitation, chemical oxi-dation or reduction, formation of an insolu-ble gas followed by stripping, and otherchemical reactions that involve exchangingor sharing electrons between atoms. Physicaltreatment methods include sedimentation,flotation, filtering, stripping, ion exchange,adsorption, and other processes that accom-plish removal of dissolved and nondissolvedsubstances without necessarily changingtheir chemical structures. Biological methodsare those that involve living organisms usingorganic or, in some instances, inorganic sub-stances for food. In so doing, the chemicaland physical characteristics of the organicand/or inorganic substance are changed.
Most substances found as pollutants inindustrial wastewaters can be categorized asto whether chemical, physical, or biologicaltreatment should be the most appropriate.For instance, dairy wastewater should mostappropriately be treated by biological means,because the bulk of the pollution load from atypical dairy is organic material from wholemilk, which is readily biodegradable. As ageneral rule, biological treatment is moreeconomical than any other type of treatmentwhere reasonably complete treatment isrequired and wherever it can be made towork successfully.
It is very often possible to make prelimi-nary selections of candidate treatment tech-nologies based on fundamental properties ofthe pollutants and experience. For instance,
when candidate treatment technologies totreat wastewaters from a metal plating opera-tion are being considered, none of the bio-logical treatment technologies would beappropriate, since metal ions are not biode-gradable. However, both chemical precipita-tion (a chemical treatment technology) andion exchange (a physical treatment technol-ogy) should work well, based on the funda-mental properties of the substances to beremoved (dissolved inorganic cations andanions). The question then reduces to a com-parison between the advantages and disad-vantages of these two technologies, and expe-rience provides much of the informationappropriate to this evaluation.
For example, experience has shown that,for most metal plating wastewaters, chemicalprecipitation is far less costly than ionexchange; however, chemical precipitation isnot reliably capable of reducing metal con-centrations to less than approximately 5 mg/L,principally because the process of removingprecipitated metals by settling in a clariflertypically does not remove the very small par-ticles of precipitate. Sand (or other) filtrationeffectively removes most of the particles ofmetal precipitate that will not settle. Theconcentrations of dissolved metals even afterchemical precipitation and sand filtration arestill no lower than 1 to 2 mg/L, at best. Fur-thermore, ion exchange can "polish" theeffluent from chemical precipitation andsand filtration to very low concentrations (20to 50 ppb). Ion exchange could do the entirejob of removing metals from industrialwastewater to very low concentrations with-out being preceded by chemical precipitationand sand filtration, but usually the cost of

doing so is much higher than the cost of thethree processes in combination.
It follows, then, that it would not be pru-dent to spend effort, time, and money toconduct a large-scale investigation into tech-nologies for treating wastewaters from metalplating beyond the line of thinking outlinedabove. The pollutants in these wastewatersare not organic and therefore not biodegrad-able; extensive experience has shown that:
• Chemical precipitation is the most cost-effective method for removing the bulkof the dissolved metals.
• Sand, diatomaceous earth, or othermedia filtration is the most cost-effective"next step" to follow the chemical pre-cipitation process.
• If still further reduction in metals con-centration is required, ion exchange isthe best candidate.
Having said that, it must now be said thatin many cases there will be substances in cer-tain metal plating wastewaters that requiremore than straightforward alkaline precipita-tion, filtration, and ion exchange. Forinstance, if chelating agents are present, itmay be necessary to destroy or otherwiseinactivate them, in order to expose the metalions to the full effect of the precipitatinganions. In other cases, if the concentration oforganic matter is high, it may interfere withthe precipitation process and have to beremoved by biological or other treatment,prior to the metals removal steps.
Figure 7-1 presents a categorization of thecomponents of industrial wastewater andpreliminary selections of treatment technol-ogies based on the appropriateness of themechanism of each technology comparedwith the fundamental properties of the pol-lutants. Different versions of Figure 7-1could be generated by beginning with a char-acterization other than dissolved or undis-solved—for instance, organic or inorganic—but all would ultimately result in the samelist of appropriate treatment technologies.
In Figure 7-1, the first level of categoriza-tion of pollutant characteristics is that of dis-solved or undissolved state. For instance,trichloroethylene as a pollutant in wastewa-ter would be dissolved (albeit to only verylow concentrations), organic and volatile.Figure 7-1 can be used to develop a list ofcandidate technologies. The list can be nar-rowed further by considering characteristicssuch as biodegradability, technical feasibility,and economic feasibility. Candidate technol-ogies, then, would be stripping, activatedcarbon adsorption, and chemical oxidation.
Figure 7-2 presents a schematic of "theindustrial waste system," showing that rawmaterials, water, and air enter the system,and, as a result of the industrial process(es),products and by-products exit the system,along with airborne wastes, waterbornewastes, and solid wastes. Since discharge per-mits are required for each of the waste-bear-ing discharges, treatment systems arerequired. Each of the treatment systems hasan input, the waste stream, and one or moreoutputs. The output from any of the treat-ment systems could be an air discharge, awaterborne discharge, and/or a solid wastestream.
Principle and NonprincipleTreatment Mechanisms
Most treatment technologies will removesubstances other than the target substances.For instance, "biological treatment" caneffectively remove a certain amount of metalions from wastewater. Because metal ions donot particularly like to be dissolved in water(they are hydrophobic), they are driven bythe second law of thermodynamics to beadsorbed on the surface of solids—just aboutany solids, including activated sludge solids.
This mechanism for removing metalsfrom wastewater is often undesirable, sincethe presence of the metal ions in the wastesludge may render the sludge unsuitable for adesired disposal method. Composting withwood chips to produce a horticultural soil

Wastewater Characterization
Individual PollutantsUndissolved
ColloidalInorganic
Dissolved
Organic
Charged Uncharged
OrganicVolatile Nonvolatile Inorganic
Settleable
Organic Inorganic
Figure 7-1 Candidate treatment technologies, based on fundamental characteristics of pollutants.
• Biological Treatment-Aerobic- Anaerobic
• Steam Stripping• Scrubbing• Membrane Separation
- Electrodialysis• Chemical Precipitation• Ion Exchange• Chemical Oxidation- Chlorine- Permanganate-Wet Air- Oxygen- Ozone- Hydrogen Peroxide- Free Radical
- Fenton's Reagent- Ozone + UV- Peroxide + Ozone- Peroxide + UV
• Catalytic Oxidation• Thermal Destruction• Chemical Reduction• Electrolysis• Hydrolysis• COAG/SED.• COAG. Flotation• COAG/DAF• Solvent Extraction• Distillation
• Stripping• Adsorption
-PACT-GAC- AlternativeAdsorber
• Chemical Oxidation- Chlorine- Permanganate-Wet Air- Oxygen- Ozone- Hydrogen Peroxide- Free Radical
- Fenton's Reagent- Ozone + UV- Peroxide + Ozone- Peroxide + UV
• Catalytic Oxidation• Thermal Destruction• Biological Treatment-Aerobic- Anaerobic- Solvent Extraction
• Distillation
• Biological Treatment- Aerobic- Anaerobic
• Adsorption-PACT- GAC-AlternativeAdsorber
• Chemical Oxidation- Permanganate- Ozone- Hydrogen Peroxide- Free Radical
- Fenton's Reagent-Ozone+ UV- Peroxide + Ozone- Peroxide + UV
• Catalytic Oxidation• Thermal Destruction• Electrolysis• Flotation•DAF• Sedimentation/Flotation- Open Tank-Plate or Tube- Centrifuge
• Solvent Extraction• Distillation
• COAG/SED.• COAG Flotation• COAG/DAF• Chemical Precipitation• Ion Exchange• Chemical Oxidation
- Chlorine- Permanganate-Wet Air- Oxygen- Ozone- Hydrogen Peroxide- Free Radical
- Fenton's Reagent- Ozone + UV- Peroxide + Ozone- Peroxide + UV
• Catalytic Oxidation• Membrane separation
- Electrodialysis• Chemical Reduction
• Biological Treatment-Aerobic-Anaerobic
• Membrane Separation- Ultrafiltration- Reverse Osmosis
• COAG/SED.• COAG Flotation• COAG/DAF»Flotation•DAF• Filtration
- Deep Bed Granular- Precoat- Microscreen
• Sedimentation/Flotation- Open Tank-Plate or Tube- Centrifuge
• Membrane Separation- Ultrafiltration- Reverse Osmosis
• COAG/SED.• COAG Flotation• COAG/DAF• Flotation•DAF• Filtration
- Deep Bed Granular- Precoat- Microscreen
• Sedimentation/Flotation- Open Tank- Plate or Tube- Centrifuge
• Biological Treatment-Aerobic- Anaerobic
• Flotation•DAF• Sedimentation/
Flotation- Open Tank- Plate or Tube- Centrifuge
• Thermal Destruction
• Sedimentation/Flotation- Open Tank- Plate or Tube- Centrifuge
•DAF

DISCHARGE
AIREMISSION
WASTEWATERTREATMENT
RESIDUALS
TREATMENT
•THICKEN•DEWATER
•DRY
SOLIDS
LIQUIDS
PROCESSWASTEWATER
OUT
LIQUIDS
DISCHARGE
TREATMENTSOLIDS
AIREMISSION
INDUSTRIALPROCESS
BY-PRODUCTS
PRODUCTS
AIREMISSIONS
RAW ORPREPROCESSED
MATERIALS
WELL
WATERIN
SURFACEWATER
RESIDUALS
WATERTREATMENT
Figure 7-2 The industrial waste system.
SOLIDWASTES
DISPOSAL
RECYCLE FOR REUSE
RESIDUALS
ADDITIONALTREATMENT

conditioner is an example. Another exampleis simple disposal in an ordinary municipallandfill. In other instances, the removal ofmetal ions from a wastewater that has verylow concentrations of them may serve as afortuitous polishing step. In any case, biolog-ical treatment is a "principle" technology forremoval of organics from wastewaters, andits unintended removal of metal ions is a"nonprinciple" mechanism.
Waste Equalization
Among the most effective waste managementprocedures is equalization of the wastestream. Equalization can be of two types:flow equalization and constituent equaliza-tion. Flow equalization refers to changing thevariations in rate of flow throughout theprocessing and cleanup cycles to a moresteady flow rate that is more nearly equal tothe average flow rate for that period of time.Constituent equalization refers to the con-centration of the target pollutants in thewaste stream. Throughout the 24-hour day,the concentrations of individual constitu-ents in a given industrial waste stream typi-
cally vary over wide ranges, as processes arestarted up, operated, shut down, andcleaned. Waste treatment systems that aredesigned for given ranges of concentration oftarget pollutants often do not perform wellwhen those constituents are in concentra-tions significantly different from the designvalues.
Equalization can be either online, as dia-grammed in Figure 7-3(a), or off-line, as dia-grammed in Figure 7-3(b). On-line flowequalization is accomplished by allowing thewaste stream to flow into a basin. The wasteis then transferred from the basin to thetreatment system at a constant (or morenearly constant) rate. The fundamentalrequirement of the basin is that it be suffi-ciently large that it never overflows and thatit always contains enough waste that it neverbecomes empty, causing the flow to the treat-ment system to stop.
As shown in Figure 7-3(b), offline equal-ization is accomplished by restricting theflow into the treatment system by means ofeither a flow-regulating valve or a constant-speed positive displacement pump. Whenthere is excess waste flow, it is directed to the
Figure 7-3 Flow equalization configurations.
(b) Offline Flow Equalization
TREATMENTSYSTEM
TREATMENTSYSTEMONLINE FLOW
EQUALIZATIONRAW
WASTE
(a) Online Flow Equalization
OFFLINE FLOWEQUALIZATION

equalization tank. When there is insufficientflow, it is made up from the equalizationtank.
With respect to constituent equalization,offline equalization can be used advanta-geously when the generation of wastes atnight is significantly less than during the day.A portion of the strong daytime wastes canbe stored in the equalization facility and thendirected to the treatment system at night.The treatment system can be significantlysmaller, since it is not required to treat wastesat the high rate that they are generated dur-ing the daytime.
A certain amount of constituent equaliza-tion will take place as a consequence of flowequalization, but this amount will not beoptimal. Flow equalization is best donewithin a cycle in which the equalization basinis close to overflowing during highest flowsand close to empty during lowest flow rates.Constituent equalization, in contrast, is bestdone by dilution. There are several differentapproaches to constituent equalization bydilution, ranging from dilution to a constantconcentration of the target substance withclean water to simply retaining the wastestream in a completely mixed basin of con-stant volume.
The following are alternative approachesto constituent equalization:
1. Batch treatment. This is the ultimate inconstituent equalization. The processingand cleanup wastewaters are collected ina well-mixed basin that is large enoughto contain the entire processing andcleanup flows. Treatment can take placesubsequently, either in the same tank orby being pumped at a constant ratethrough a continuous flow treatmentsystem.
2. Offline equalization tank. As describedpreviously, a portion of the flows con-taining high concentrations of pollutantsare diverted to an offline equalization
basin and are mixed with less concen-trated flows at a later time.
3. Completely mixed, inline equalizationtank. A tank that is equipped with suffi-cient mixing capability to maintain com-pletely mixed conditions and that hassufficient volume to hold the flowbetween peak high and low flow rates, isthe most common type of constituentequalization device. The larger the vol-ume, the better the constituent equaliza-tion, but the higher the cost to bothconstruct, maintain, and mix. The tankis maintained full; therefore, this devicedoes not achieve flow equalization.
4. Dilution with clean water or treated efflu-ent. Stormwater runoff, cooling water, orother previously used but clean waterrelative to the wastewater being treatedmay be used. Target substances that canreadily be measured with a probe andmeter, such as a specific ion probe andmeter, are the best candidates for thistype of substance equalization. Thismethod of constituent equalization, ofcourse, increases the total flow throughthe treatment system.
As mentioned earlier, the principal valueof waste equalization is that in most cases thetreatment system can be made smaller, sincethe maximum values for both flow rate andconstituent concentration will be reduced(method number 4 is an exception). Thetreatment system will, therefore, have a lowercapital cost as well as lower operating andmaintenance costs; hence, by definition, itwill have a lower life-cycle cost.
Flow EqualizationFigure 7-3(a) illustrates flow equalization bymeans of an online flow equalization basin.Flow into the basin is by gravity and varies asthe waste generation rate varies. Flow out ofthe basin to the treatment system is madeconstant by either an appropriate valve or apositive displacement pump. An aerator and/

or a mixer are provided to prevent undesir-able occurrences, such as settling out of sol-ids; biological activity that would result inanaerobic conditions with consequent odorproblems; or chemical or biological reactionsthat would change the nature of the wastes.
The principal design parameter of a flowequalization basin is size. Since the cost ofthe basin will be a direct function of its size,and since operation of the basin, in terms ofmaintaining complete mixing and maintain-ing aerobic conditions, is also a direct func-tion of basin size, the flow equalization basinshould be no larger than necessary to accom-plish the required degree of equalization.
Development of a "mass diagram" is anexcellent method for determining therequired size of a flow equalization basin. A
mass diagram is developed by plotting accu-mulated quantity of flow of the waste streamversus time.
A truly representative period of time maybe one day, one week, or even longer. Then,as illustrated in Figure 7-4, the line that isrepresentative of a constant rate of flow forthe accumulated volume flowing at a steadyrate over the total time period is drawn.Then, lines are drawn that are (1) parallel tothe line that represents the average rate offlow, and (2) tangent to the mass diagram atpoints that are the maximum distances aboveand below the average-rate-of-flow line. Thestorage volume required for the equalizationbasin is that volume represented by the verti-cal distance between the two tangent lines. Insome cases, the mass diagram may be at all
CU
MU
LA
TIV
E I
NF
LO
W V
OL
UM
E,
GA
L
AVERAGE RATE OFFLOW LINE
MASS DIAGRAMOF INFLOW
REQUIREDVOLUMEOFEQUALIZATIONTANK
TIMEOFDAY
Figure 7-4 Mass diagram with illustration of the method used to determine the required volume of equalization basin.

points below, or in other cases at all pointsabove, the average rate of flow line. In thesecases, there will be only one tangent line,which will be drawn at the point on the massdiagram that is furthest distant from theaverage-rate-of-flow line. The volumerequired for the equalization basin in thesecases will be the volume represented by thevertical distance between the single tangentline and the average rate of flow line.
As with many other unit processes, it isusually prudent to provide an equalizationbasin that is 10% to 20% larger than the sizedetermined by the mass diagram method.This will account for changes in flow rategreater than experienced when the data weretaken for the mass diagram, or other uncer-tainties. In fact, the percent increase in sizeshould be inversely proportional to thedegree of confidence the design engineer hasin how accurately the data obtained are rep-resentative of the full range of conditions tobe experienced by the treatment system.
Example 7-1 illustrates the procedure fordetermining the size of a flow equalizationbasin. Example 7-2 illustrates how a flowequalization basin can significantly reducethe size of treatment facility required for agiven industrial facility.
Example 7-1The flow of wastewater from a poultry proc-essing plant is shown in Table 7-1. If it isdesired to pump this flow at a constant rateover a 24-hour period, what is the minimumsize required for an online flow equalizationtank?
Example 7-2Determine the size, in terms of design flowrate, of a dissolved air flotation (DAF) systemto treat the wastewater described in Example7-1: (a) without an equalization tank, and(b) with an equalization tank of 310,000 gal-lons, plus 10% to 20%.
1. The data presented in Example 7-1 anddiagrammed in Figure 7-5 show that the
Table 7-1 Cumulative Flow for Equalization Tank
Cumulative FlowHour Ending (Thousands of Gallons)
0100 5
0200 11
0300 14
0400 20
0500 25
0600 31
0700 62
0800 120
0900 200
1000 240
1100 309
1200 320
maximum hourly rate of flow occursbetween 9:00 and 10:00 P.M., whencleanup operations and probably dump-ing baths are taking place. This equatesto 154,000 gallons per hour, or 2,600gpm. Thus, a DAF facility would have tobe sized for at least 2,600 gpm if no flowequalization is provided.
2. If an inline tank of at least 310,000 gal-lons is provided, the design flow for theDAF system should be that of the averagerate of flow for the 24-hour period, or1.2 MG/24 hrs. = 834 gpm. Thus, theinclusion of a flow equalization tankallows the treatment facility to be 68%smaller.
Constituent EqualizationAs stated previously, some amount of con-stituent equalization always takes place dur-ing flow equalization. In fact, it is standardpractice to design for flow equalization andthen operate to attain the degree of constitu-ent equalization needed to achieve treatmentobjectives. One way this is done is by manu-ally or automatically decreasing rates of flowduring periods when constituent concentra-tions are high. The simple dilution equation

shown as equation 7-1 can be used to calcu-late concentrations of constituents that resultwhen volumes of a given concentration ofthat constituent are mixed with known vol-umes of the same constituent at a differentconcentration.
where
C1 = Concentration of constituent inquestion in the first considered vol-ume
V1 = First considered volumeC2 = Concentration of constituent in
question in the second consideredvolume
V2 = Second considered volumeC3 = Concentration of the constituent in
question when the volumes V1 andV2 are mixed together
pH Control
Although pH control is a form of chemicaltreatment, it is presented here in the generalsection because, like flow equalization, it isused with biological and physical treatmentsystems as well as with chemical treatmentsystems.
Water, the basic substance of all industrialwastewaters, is composed of hydrogen andoxygen. Water dissociates into hydrogen ionsand hydroxide ions, as shown in equation 7-2.
H2O^H++OH~ (7-2)
In accordance with the law of mass action,discussed in the section entitled "Reaction toProduce an Insoluble Solid," the quantities ofhydrogen and hydroxide ions are such thatthe mathematical product of the hydrogenion concentration, expressed as moles perliter ([H+]), and the hydroxide ion concen-tration ([OH"]) is always 10 , as shown inequation 7-3.
Figure 7-5 Mass diagram: Cumulative volume of wastewater flow over time.
T i m e of Day
Cum
ulat
ive
Vol
ume
of W
aste
rwat
er F
low
(tho
usan
ds o
f gal
lons
)
Average Rateof Flow Line
Tangent LineParallel toAverage Rateof Flow Line
Mass Diagram ofWastewater Flow

[H +][O H"~] = 10~14 (7-3)
The hydrogen ion concentration is thus afundamental property of any aqueous solu-tion. Any liquid for which equation 7-3 doesnot hold is not an "aqueous solution." Astrong solution of sulfuric acid is an example.It is a strong acid solution, not an aqueoussolution, and its pH value really has nomeaning.
The hydrogen ion concentration of anaqueous solution, such as an industrialwastewater, has a major influence on its char-acteristics. Which substances will dissolve ina given wastewater, as well as how much of agiven substance can be dissolved, are twoimportant characteristics. Another is that pHstrongly influences the corrosivity of waste-water. The value of the pH of an aqueoussolution must be within a certain range forbacteria and other microorganisms to liveand thrive and for fish and plants to live andthrive. A host of other characteristics thatinfluence the success of wastewater treatmentmethods, such as chemical coagulation, acti-vated carbon adsorption, ion exchange,chemical oxidation, and the release of gasessuch as hydrogen sulfide and ammonia areabsolutely dependent for success on theproper range of pH.
Because the hydrogen ion concentrationof wastewaters is so commonly dealt with,and since it is cumbersome to express hydro-gen ion concentration in terms of molar con-centrations, the concept of pH was devel-oped. Very simply, the term p preceding anyitem means "the negative logarithm of thatitem." Thus, pKa means "the negative log ofthe numerical value of Ka," and pH means"the negative log of the numerical value ofthe hydrogen ion concentration, in moles perliter." Equation 7-4 illustrates the pH con-cept.
PH= log[H+] = log (7.4)
Example 7-3Calculate the pH of an aqueous solution thathas a concentration of hydrogen ions equalto 2.3 x 10~3 moles per liter.
Solution:
pH = -logrH+~Ulogr ^ = 2.64L J [2.3xl(T3J
or
pH = - log ̂ H+ J = - Iog(2.3xl0~3) = 2.64
Example 7-4Calculate the hydroxide ion concentration ofan industrial waste with a pH of 5.4.
Solution:
pH-log r l -.- log[H+J-5.4H+ L J
The concentration of hydrogen ion in thiswastewater, then, is 10~5'4 moles/liter, but:
(10-5'4)x[oH-] = 10-14
or
OH" = \ A = 10"8*6 moles/literio"5-4
Thus, it is seen that the pH scale, which, inaccordance with equation 7-3, is a logarith-mic scale, ranges between the values of O and14; and a change in pH value of 1.0 equatesto a change in concentration of hydrogen ionof a factor of 10. If the pH of a wastewaterchanges from 5.1 to 7.1, the molar concen-tration of hydrogen ions will have decreasedby two orders of magnitude.

Typically, industrial waste discharge per-mits require that the pH be within the valuesof 6.5 and 8.5, and many industrial wastetreatment processes require that the pH beheld within a range of plus or minus 0.5 pHunits. Some treatment processes require aneven smaller pH range for successful opera-tion. For these reasons, pH control is one ofthe most important aspects of industrialwastewater treatment.
A common procedure used to control pHin industrial waste treatment is illustrated inFigure 7-6. Basically, a mixing chamber isused to mix acidic and/or basic reagents withthe wastewater. pH electrodes are placedeither in the discharge from the mixingchamber or, in some cases, in the chamberitself. The electrical signal from the pH elec-trodes is amplified and relayed to a control-ler, which activates valves or pumps to regu-late the flow of acidic or basic reagent intothe mixing tank.
Many pH control applications are simple,straightforward, and require only that theelectrodes be kept clean and well calibrated,and the control system well-maintained, forsuccess. If the system is "well behaved" (thepH of the wastewater entering the mixingtank does not change very often, or verymuch), a simple control system such as thatshown in Figure 7-6 is adequate. However, ifthe pH, as well as the acidity and/or the alka-linity of the wastewater entering the mixingtank, changes appreciably throughout theprocessing and cleanup day, the simple con-trol system depicted in Figure 7-6 may beinadequate. In fact, pH control can beextremely difficult and can require a muchmore extensive control system than thatshown in Figure 7-6.
A basic reason for the potential difficultywith satisfactory pH control relates to theextremely large range of values of hydrogen
Figure 7-6 pH control system.
Key:PFM = Pulse frequency modulatorpHY= pH, downstream of reagent additionpHIC = Signal characterizerIA = Raw pH signalIB = Characterized pH signal
REAGENT
CHARACTERIZER
FEED
PFM

ion concentration within the 0 to 14 pH scalerange. Fourteen orders of magnitude is arange that few, if any, other detection devicesmust contend with. Another reason relates tothe high sensitivity of commonly availablepH detection electrodes. These electrodestypically can respond to changes in pH assmall as 0.001.
The extremely large range of the substancedetected (hydrogen ion), coupled with thehigh sensitivity of detection capability, mustbe relayed electronically and, ultimately,mechanically to a control system that regu-lates the flow of reagent to the mixing tank. Ifthe system is not well behaved, two completecontrol systems in series (and, in some cases,three) are required to attain satisfactoryresults. The multiple systems should havesuccessively smaller control valves or pumps,in order to overcome the difficulty in trans-lating, on the one hand, a change of severalorders of magnitude in hydrogen ion con-centration and, on the other hand, a verysmall change in a valve setting.
Chemical Methods of WastewaterTreatment
Chemical methods of wastewater treatmenttake advantage of two types of properties: (1)the chemical characteristics of the pollutants,regarding their tendency to react with, orinteract with, treatment chemicals; and (2)the chemical characteristics of the productsof reaction between pollutants and treatmentchemicals, regarding their solubilities, vola-tilities, or other properties that relate to theinability of the product to remain in watersolution or suspension.
In general, six chemical processes can betaken advantage of to remove substancesfrom wastewater:
1. Reaction to produce an insoluble solid2. Reaction to produce an insoluble gas3. Reduction of surface charge to produce
coagulation of a colloidal suspension
4. Reaction to produce a biologicallydegradable substance from a nonbiode-gradable substance
5. Reaction to destroy or otherwise deacti-vate a chelating agent
6. Oxidation or reduction to produce anonobjectionable substance or a sub-stance that can be removed more easilyby one of the methods listed above
Table 7-2 presents an enumeration ofchemical treatment technologies and classi-fies them in these six categories.
Reaction to Produce an Insoluble SolidThe industry standard procedure for remov-ing metals from wastewaters is alkaline pre-cipitation. Alternative methods include pre-cipitation of the metal as the sulfide; precipi-tation as the phosphate; precipitation as thecarbonate; or coprecipitation with anothermetal hydroxide, sulfide, phosphate, or car-bonate. All of these technologies take advan-tage of the law of mass action, illustrated asfollows:
When a chemical system is in equilibrium,expressed as:
A + B^C + D (7-5)
it must obey the equation:
[CM[A]lB]-K (7"6)
where K is a constant. In words, equation 7-6states that for a given system of chemical sub-stances that have reacted to the point of equi-librium, the mathematical result of multiply-ing the products, each expressed as moles perliter, divided by the mathematical product ofthe reactants, is always the same number.Consequently, for K to remain constant, anincrease in either A or B shifts the equilib-rium to the right, causing a correspondingdecrease in B or A, respectively. Likewise,removal of some or all of either C or D will
Next Page

ion concentration within the 0 to 14 pH scalerange. Fourteen orders of magnitude is arange that few, if any, other detection devicesmust contend with. Another reason relates tothe high sensitivity of commonly availablepH detection electrodes. These electrodestypically can respond to changes in pH assmall as 0.001.
The extremely large range of the substancedetected (hydrogen ion), coupled with thehigh sensitivity of detection capability, mustbe relayed electronically and, ultimately,mechanically to a control system that regu-lates the flow of reagent to the mixing tank. Ifthe system is not well behaved, two completecontrol systems in series (and, in some cases,three) are required to attain satisfactoryresults. The multiple systems should havesuccessively smaller control valves or pumps,in order to overcome the difficulty in trans-lating, on the one hand, a change of severalorders of magnitude in hydrogen ion con-centration and, on the other hand, a verysmall change in a valve setting.
Chemical Methods of WastewaterTreatment
Chemical methods of wastewater treatmenttake advantage of two types of properties: (1)the chemical characteristics of the pollutants,regarding their tendency to react with, orinteract with, treatment chemicals; and (2)the chemical characteristics of the productsof reaction between pollutants and treatmentchemicals, regarding their solubilities, vola-tilities, or other properties that relate to theinability of the product to remain in watersolution or suspension.
In general, six chemical processes can betaken advantage of to remove substancesfrom wastewater:
1. Reaction to produce an insoluble solid2. Reaction to produce an insoluble gas3. Reduction of surface charge to produce
coagulation of a colloidal suspension
4. Reaction to produce a biologicallydegradable substance from a nonbiode-gradable substance
5. Reaction to destroy or otherwise deacti-vate a chelating agent
6. Oxidation or reduction to produce anonobjectionable substance or a sub-stance that can be removed more easilyby one of the methods listed above
Table 7-2 presents an enumeration ofchemical treatment technologies and classi-fies them in these six categories.
Reaction to Produce an Insoluble SolidThe industry standard procedure for remov-ing metals from wastewaters is alkaline pre-cipitation. Alternative methods include pre-cipitation of the metal as the sulfide; precipi-tation as the phosphate; precipitation as thecarbonate; or coprecipitation with anothermetal hydroxide, sulfide, phosphate, or car-bonate. All of these technologies take advan-tage of the law of mass action, illustrated asfollows:
When a chemical system is in equilibrium,expressed as:
A + B^C + D (7-5)
it must obey the equation:
[CM[A]lB]-K (7"6)
where K is a constant. In words, equation 7-6states that for a given system of chemical sub-stances that have reacted to the point of equi-librium, the mathematical result of multiply-ing the products, each expressed as moles perliter, divided by the mathematical product ofthe reactants, is always the same number.Consequently, for K to remain constant, anincrease in either A or B shifts the equilib-rium to the right, causing a correspondingdecrease in B or A, respectively. Likewise,removal of some or all of either C or D will
Previous Page

Table 7-2 Chemical Treatment Technologies andAppropriate Technology Category
TechnologyChemical Treatment Technology Category
Alkaline precipitation of metals 1
Alkaline chlorination of cyanide 2,6
Breakpoint chlorination removal of 2ammonia
Precipitation of metals as the sulfide 1
Precipitation of metals as the phosphate 1
Precipitation of metals as the carbonate 1
Chemical coagulation 3
Chemical oxidation of nitrite 2
Hydroxyl free radical oxidation of organics 4, 5, 6
• Ozone + hydrogen peroxide
• Ozone + ultraviolet light
• Hydrogen peroxide + ultraviolet light
• Fenton's reagent (H2O2 + Fe ++)
Precipitation of phosphorus as metal 1phosphate
Removal of arsenic, first by oxidation of 1,6arsenite to arsenate, followed bycoprecipitation of arsenate with ferric salt
Reduction of ionic mercury to metallic 1, 6form using hydrazine, sodiumborohydride, or other reducing agent
Precipitation of barium as the sulfate 1
Reduction of hexavalent chromium to 1,6insoluble trivalent chromium, pHadjustment to 8.2-8.6
Precipitation of fluoride as calcium 1fluoride, insoluble at high pH
Oxidation of ferrous to ferric, precipitation 1, 6of ferric oxide, insoluble in the neutral pHrange
shift the equilibrium to the right, causingdecreases in both A and B.
It follows, then, that if substance A is apollutant, and substance B will react with Ato produce an insoluble precipitate (C or D),which would constitute removal from solu-tion, substance B can be added until sub-stance A has essentially disappeared.
A step-by-step procedure that can be usedto develop an effective, efficient, cost-effec-tive treatment technology is as follows:
1. Identify one or more insoluble com-pounds of which the target pollutant isan ingredient.
2. Identify one or more soluble compoundsthat are reasonably inexpensive sourcesof the remaining substances in the insol-uble compound(s), making certain thatthe soluble compounds are not a pollut-ant as well, since it is undesirable totrade one pollutant for another.
3. Perform experiments in the laboratoryto confirm the technical and financialfeasibility of each promising treatmentmethod.
As an example of the foregoing procedure,consider that lead is the target pollutant.Review of Langels, or another appropriatehandbook, shows that the compounds oflead shown in Table 7-3 are highly insoluble.
Of these three compounds, lead carbonateand lead sulfide are seen to be essentiallyinsoluble in water. Executing the second step,it is determined that a relatively inexpensivesource of carbonate ions is common sodaash, Na2CO3, while a somewhat more expen-sive material, sodium sulfide, is a source ofsulfide ions. A promising treatment methodfor removing lead from an industrial waste-water, then, would be to add soda ash andprecipitate the lead as the insoluble carbon-ate.
Table 7-4 presents a list of heavy metalswith theoretical solubilities of their hydrox-ides, carbonates, and sulfides.
Another method of removing certain met-als is illustrated in Table 7-5, which presentsa summary of pH range and other conditionsthat have been found to effectively removeiron, aluminum, arsenic, and cadmium,
Table 7-3 Insoluble Compounds of Lead
Compound Solubility in Water (mg/L)
Lead hydroxide (Pb(OH)2) 2.1
Lead carbonate (Pb(CO3)) 7.0 x 10~3
Lead phosphate (Pb3(PO4)2) 20 x 10"3
Lead sulfide (PbS) 3.8 x 10"9

Solubility of metal ion; mg/L
Metal
Cadmium (Cd++)
Chromium (Cr+++)
Cobalt (Co++)
Copper(Cu++)
Iron (Fe++)
Lead (Pb++)
Manganese (Mn++)
Mercury (Hg++)
Nickel (Ni++)
Silver (Ag+)
Tin (Sn++)
Zinc (Zn++)
As hydroxide
2.3 x 1(T5
8.4 x KT4
2.2 x 1(T1
2.2 x 10"2
8.9 x 1(T1
2.1
1.2
3.9 x 1(T4
6.9 x 10"3
13.3
1.1 x 1(T4
1.1
As carbonate
1.0 XlO-4
—
—
—
—
7.0 X 10"3
—
3.9 x 10~2
1.9XlO"1
2.1 x 10"1
—
7.0XlO"4
As sulfide
6.7 xl0~1 0
No precipitate
LOxIO-8
5.8 x 10~18
3.4 x 10~5
3.8 x 10~9
2.1xlO~3
9.0 x 10⁻²⁰
6.9xlO~8
7.4 x 10~12
3.8 x 10~8
2.3xlO~7
Table 7-4 Theoretical Solubilities of Hydroxides, Sulfides, and Carbonates for Selected Heavy Metals(Palmer eta l . , 1988)
Table 7-5 Summary of pH Ranges and Conditions Found to Produce Good Removals of Indicated Metals
pH and other condition
Iron
7-8 all Fe oxidized toFe+++
Substance
Aluminum
6-7, but up to 8.5may be okay
to be Removed
Arsenic
Co-ppt with iron;therefore, pH 7-8
Cadmium
10 or so, but pH 8with carbonate is best
Table 7-6 Common Methods and pH Values for Removal of Heavy Metals
Chromium Reduction to trivalent state by bisulfite or metabisulfite, followed by precipitation at pH 8-9.5.
Copper pH 10-12, or as the sulfide (by adding sodium sulfide). Evaporative recovery or ion exchange for recov-ery.
Lead pH 10—11, or precipitation as the carbonate (by adding soda ash) or as the phosphate (by adding phos-phoric acid or a soluble phosphate).
Manganese Oxidation to insoluble manganous dioxide by chemical oxidants (free chlorine residual, ozone, potas-sium permanganate), ion exchange.
Mercury Precipitation as the sulfide, at pH values between 5 and 8. Also, ion exchange, coagulation, and activat-ed carbon.
Nickel Generally, pH 11-12. In some cases, pH values ranging from 5-10 have produced good results. Precip-itation as the carbonate or sulfide has worked well at pH values close to neutral.
Selenium Dissolved selenium is removed by precipitation at pH 11-12, or by coprecipitation with iron at pH 5.5-
8, or with alum at pH 6 or so. Undissolved selenium is removed by sedimentation and/or filtration.
Silver Because of the value of silver, ion exchange removal followed by recovery of the silver is very common.
Zinc Wide range of pH values, depending on other substances in the wastewater. Phosphate precipitation atpH 8-9 has worked well.
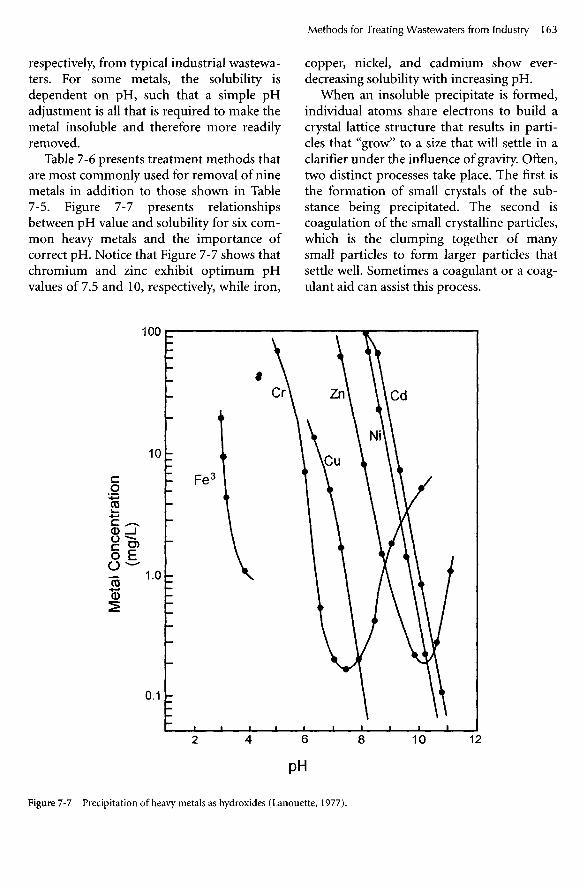
respectively, from typical industrial wastewa-ters. For some metals, the solubility isdependent on pH, such that a simple pHadjustment is all that is required to make themetal insoluble and therefore more readilyremoved.
Table 7-6 presents treatment methods thatare most commonly used for removal of ninemetals in addition to those shown in Table7-5. Figure 7-7 presents relationshipsbetween pH value and solubility for six com-mon heavy metals and the importance ofcorrect pH. Notice that Figure 7-7 shows thatchromium and zinc exhibit optimum pHvalues of 7.5 and 10, respectively, while iron,
copper, nickel, and cadmium show ever-decreasing solubility with increasing pH.
When an insoluble precipitate is formed,individual atoms share electrons to build acrystal lattice structure that results in parti-cles that "grow" to a size that will settle in aclarifier under the influence of gravity. Often,two distinct processes take place. The first isthe formation of small crystals of the sub-stance being precipitated. The second iscoagulation of the small crystalline particles,which is the clumping together of manysmall particles to form larger particles thatsettle well. Sometimes a coagulant or a coag-ulant aid can assist this process.
Figure 7-7 Precipitation of heavy metals as hydroxides (Lanouette, 1977).
Meta
l C
once
ntr
atio
n(m
g/L
)

It is common practice to include a deepbed granular filter or, in some cases, ultrafil-tration as the final step in the removal of sub-stances by the formation of an insolublesolid. Typically, chemical precipitation fol-lowed by sedimentation results in 10 mg/L orless of the target substance remaining in thetreated effluent. Polishing this effluent nor-mally reduces the residual to 1 to 3 mg/L.
It is always necessary to confirm a chemi-cal treatment process by laboratory experi-mentation. Even though there are volumi-nous books and research papers that describehow various substances, such as heavy met-als, are "removed," the presence of interferingsubstances such as chelating agents, com-plexing substances, and substances that willcompete for the proposed treatment chemi-cal can sometimes render a method ineffec-tive in any given application.
A suggested procedure for determining, inthe laboratory, optimum doses of reagentchemicals and ranges of pH is as follows:
Using a "jar test apparatus," shown in Fig-ure 7-8:
1. Place wastewater, pretreated by sedimen-tation or otherwise, as anticipated forfull-scale treatment plant, in "jars" ofabout 1,200-ml volume; 1,000-ml bea-kers can be used, but jars of square cross-section produce better mixing action.
2. Determine reagent doses to bracket theanticipated optima, regarding:
a. pHb. Precipitantc. Coagulant (if any)d. Flocculant aid (if any)
(These determinations have to be madeon the bases of (1) experience, (2) the lit-erature, or (3) educated guesses.
Figure 7-8 Jar test apparatus.

3. With all stirrers in the "rapid mix"mode, add the selected doses to each jaras nearly simultaneously as possible.One method is to place each dose in asmall beaker and have several people,with a beaker in each hand, dose each jarat the same time.
4. "Rapid mix" for 30 seconds.5. "Slow mix," so as to achieve good coagu-
lation. Observe the coagulation process(appearance of particles in the test solu-tions) and the flocculation process(building of particles into large, floccu-lent solids with attendant decrease in theturbidity of the test solution). Recordobservations. Carry on for up to 30 min-utes.
6. Allow to settle. Observe flocculation andsettling characteristics. Record observa-tions.
7. Measure results of the following:
a. Target substance concentrationb. pHc. Turbidityd. TSSe. Residual reagents, if desired
Table 7-7 presents a listing of chemicalsthat have been used successfully to produceinsoluble precipitates and thus effect removalof pollutants such as metals, phosphorus,sulfide, and fluoride.
The Use of CarbamatesCarbamates, a class of organic compoundsthat was developed for use as pesticides dur-ing the 1940s, have been found to functionextremely well as precipitants for certainmetals. In some cases, one or more carbam-ates have been found to be capable of precip-itating metals in the presence of chelatingagents and other substances that interferedwith removal of the metals using more con-ventional methods, such as pH adjustment.Several chemical manufacturers now market
Table 7-7 Chemical Substances Commonly Used forIndustrial Wastewater Treatment by Removal of TargetPollutants as a Precipitate
Chemical Application
Lime Heavy metals, fluoride,phosphorus
Soda ash Heavy metals
Sodium sulfide Heavy metals
Hydrogen sulfide Heavy metals
Phosphoric acid Heavy metals
Fertilizer-grade phosphate Heavy metals
Ferric sulfate Arsenic, sulfide
Ferric chloride Arsenic, sulfide
Alum Arsenic, fluoride
Sodium sulfate Barium
Carbamates Heavy metals
proprietary substances, which are carbam-ates, as effective precipitants.
Figure 7-9 presents a suggested sequentialprocedure for developing a treatment system,from initial concept to the point of initiatingfinal design documents. Although the proc-ess depicted in Figure 7-9 is addressed todevelopment of a treatment system forremoval of target substances by formation ofan insoluble substance, it can be easilyadapted to development of many other typesof treatment systems.
Disadvantages of Treatment byProduction of an Insoluble CompoundCertain problems are common to treatmentprocesses wherein the mechanisms ofremoval are formation of an insoluble solid,followed by separation of the solids from theliquid by sedimentation. One is the occa-sional inability of the precipitated solid tobuild into particles that are sufficiently largeto settle, under the influence of gravity, in theclarifier. Another is the often-voluminoussludge, which is difficult to dewater.
Often, sludge produced by precipitationof heavy metals must be handled and dis-

Figure IS Suggested procedure for developing a treatment system.
posed of as "hazardous waste" because of itsinability to "pass" the TCLP test (see Chapter5), although there are methods of treating orconditioning these sludges to render themcapable of passing. Some of these methodsare proprietary; some are not. For instance,under certain circumstances, the phosphateprecipitate of zinc will pass the TCLP test.Each individual sludge must be experi-
mented with in the laboratory, using princi-ples discussed in this text, to develop a pre-cipitation process that yields a sludge thatcan be dewatered economically to produce aresidual that can be disposed of as nonhaz-ardous.
One method of avoiding the expense andfuture liability of disposing of sludge as haz-ardous waste is to dewater, dry, then store the
Characterize wastewater
Determine effluent limitations
Select candidate precipitation or othertreatment
Conduct bench-scale and/or pilot-scale studies (include evaluation oftechniques for controlling precipitate
properties)
Prepare one or more alternativefull-scale process designs
Select materials of construction
Analyze economics of alternativeprocesses
Select process

dried material for later recycle and reuse.Even though this would require licensing as ahazardous material storage facility, it mightprove to be the most cost-effective option.
Suggested Approach for Treatment ofIndustrial Wastewater by Formation ofan Insoluble SubstanceFigure 7-10 presents a suggested approach,or model, for treatment of industrial waste-waters to remove substances by formation ofan insoluble substance. First, as in all indus-trial wastewater treatment applications, thecost effectiveness of primary treatment,including plain sedimentation, should beevaluated. The second step should be pHadjustment to the range required for opti-mum effectiveness of the third step, whichshould include whichever conditioning stepsare to take place prior to the principal treat-ment process. Examples are reduction ofhexavalent chromium to the trivalent state,oxidation of arsenite to arsenate, anddestruction of chelating agents by oxidationwith Fenton's reagent.
Next, a second pH adjustment step may berequired for optimum performance of theprincipal treatment process, shown in Figure7-10 to be chemical precipitant addition,mixing, flocculation, sedimentation, and,finally, filtration. Figure 7-10 shows thatthere is a return of a small amount of thesludge from the sedimentation device to theinfluent to the flocculation device. This islabeled "return for seed." In this context,
"seed" refers to the particles of sludge, actu-ally chemical precipitates that were formedpreviously, acting as nucleation sites for newprecipitates. In certain applications, thisgreatly enhances the precipitation process,enabling a significantly higher degree ofremoval.
Reactions to Produce an Insoluble GasConsidering, again, equations 7-5 and 7-6, itcan be seen that if product C or D is a gasthat is very poorly soluble in the wastewaterbeing treated, it will remove itself from solu-tion as it is formed, thus forcing the equilib-rium to the right until the target substance(A or B) has essentially disappeared. Anexample of this treatment technology is theremoval of nitrite ion by chlorination, asshown by equation 7-7:
2NO~ + Cl2 + 8H+ -> N2 T 4H2O + 2OT (7-7)
As chlorine is added in the form of chlo-rine gas or hypochlorite, or other chlorinecompound that dissolves in water to yieldfree available chlorine, the nitrite ions areoxidized to nitrogen gas and water. Nitrogengas, being only sparingly soluble in water,automatically removes itself from the chemi-cal system, driving the equilibrium to theright until all of the nitrite ion has beenremoved.
Figure 7-10 Schematic of suggested model for design of facility for removal by forming an insoluble substance.
SludgeDewater,
Dry
Flocculation Sedimentation Filtration
Return for Seed
PHAdjustment
orChemicalAddition
Steps
Oxidationor
ChelatingAgent
Destruction
PHAdjustment
Raw
Waste
Conditioning

Table 7-8 Chemical Substances that Can Be Applied to Remove Appropriate Target Substances as an Insoluble Gas
Chemical Substance
Chlorine gas or other chlorine compound (hypochlorite, or chlorinedioxide, for instance)
Sulfuric or hydrochloric acids (technical grade or waste acids)
Table 7-8 presents a listing of chemicalsubstances that can be added to remove theappropriate pollutants as an insoluble gas.
Breakpoint Chlorination to RemoveAmmoniaFor many years, breakpoint chlorination hasbeen used to produce a free chlorinationresidual in drinking water. The basic processof breakpoint chlorination is that chlorinereacts with ammonia in four different stagesto ultimately produce nitrogen gas, hydrogenions, chloride ions, and possibly somenitrous oxide, and some nitrate, as shown inequations 7-8 through 7-12.
First, chlorine reacts with water to yieldhypochlorous and hydrochloric acids:
CZ2 + H2O <-> HOCl + CF + H+ (7-8)
Then, hypochlorous acid reacts withammonia:
HOCl + NH ^ NH2Cl + H2O (7-9)
HOCl+ NH2Cl ^NHCl2+H2O (7-10)
HOCl + NHCl2 <r+NCl3+H2O (7-11)
HOCl + NCl3<->N2+N2O + NOf (7-12)
Breakpoint chlorination can be used toconvert ammonia to nitrogen gas in waste-water treatment. However, since many sub-stances that are stronger reducing agentsthan ammonia will exert their demand, thismethod is suitable only if such substances arenot present in significant amounts.
Treatment Technology
Breakpoint chlorination to remove ammonia
Alkaline chlorination of cyanide
Removal of sulfide as hydrogen sulfide gas
Alkaline chlorination of cyanide isincluded in Table 7-8 as a process that useschlorine in a reaction to produce an insolu-ble gas. Since this reaction, taken to comple-tion, is also an oxidation process, it isaddressed later in this chapter.
Reduction of Surface Charge toProduce Coagulation of a ColloidalSuspensionA very high percentage of industrial wastewa-ters consist of colloidal suspensions. In fact, itis very often possible to destabilize industrialwastewaters by chemical coagulation; allowseparation of the destabilized colloidal mate-rial from the water; further treat the water toachieve discharge quality by a polishing step, ifnecessary; and then recover the coagulantfrom the separated waste substances. Thecoagulant can be reused, and the waste sub-stances can be further treated, if necessary.The advantage is that the polishing step can besignificantly more economical than if it wereused to treat the raw wastewater, and, in somecases, the separated colloidal material can berecovered as a by-product.
A colloidal suspension consists of onesubstance in a fine state of aggregation evenlydispersed throughout a second. The firstphase, which may consist of single polymersor aggregates of smaller molecules, is calledthe dispersed or discontinuous phase, andthe second phase is called the dispersingmedium or continuous phase. The distin-guishing characteristics of a colloid systemare the size of the dispersed particles and thebehavior of the system, which is governed bysurface phenomena rather than the chemicalproperties of the components. The size of thedispersed particles ranges between 1 and 100microns, placing them between molecules

and true particles. Colloidal systems can befurther classified into emulsions, gels, or sols.
Emulsions consist of two immiscible liq-uids, one being finely dispersed throughoutthe other. They must be stabilized by a sur-face-active agent, called an emulsifier, whichreduces the surface tension at the interfacebetween the two phases. Free energy from theincreased surface area otherwise would tendto destabilize the emulsion. When an emulsi-fier is present, the repulsive forces, due to likeelectrostatic charges on each of the dispersedaggregates, exert the principal stabilizingforce. These charges arise by several differentmeans depending on the nature of the emul-sion. The principal destabilizing forces arethe Brownian movement, which causes theaggregates to come into contact with eachother, and the London-van der Waal forcesof attraction, which tend to cause the emulsi-fied aggregates to coalesce after moving towithin a critical distance from each other.
A gel results when organic colloids oflong, thin dimensions are dispersed in a liq-uid medium, resulting in the formation of anonuniform lattice structure when suitablegroups on the colloidal particles come intocontact. The dispersed phase is like a "brushheap" in this respect, and the gel assumes asemisolid texture. Gelatin is a familiar exam-ple of a substance that forms a gel.
The most common colloidal systemencountered in industrial wastes consists oforganic particles or polymers, and/or inor-ganic particles, dispersed in a liquid to yield afluid system known as a sol. This differs froman emulsion in that an emulsifying agent is
not required. The particles or polymersbelong to one of two classes, depending uponwhether or not they have an attraction forthe dispersing medium: lyophobic (solvent-hating) for those substances that do not havean attraction, and lyophilic (solvent-loving),for those substances that do. In the case ofindustrial wastes, where the dispersionmedium is water, the classes are called hydro-phobic and hydrophilic.
Lyophobic SolsGiant molecules or polymers that have noattraction for a particular liquid, and thuspossess no tendency to form a true solutionwith the liquid, can be induced to form a lyo-phobic sol by the application of sufficientenergy to uniformly disperse the particlesthroughout the liquid medium. If the dis-persed particles contain groups that are ion-izable in the dispersing medium, or if certainelectrolytes are present in the dispersingmedium, the anion or cation of which ispreferentially adsorbed by the dispersed par-ticles, the sol will be stabilized by mutualrepulsion of like electrostatic charges on eachof the particles of the dispersed phase.
Figure 7-11 illustrates a colloidal suspen-sion wherein particles (which can be organicor inorganic, macromolecules or aggregatesof smaller molecules, or finely divided solids)are dispersed in water. The dispersed parti-cles have a surface charge, negative in allcases, which can have resulted from ioniza-tion of certain groups, breaking of covalentbonds, or adsorption of previously dissolvedions from the water medium.
Figure 7-11 Illustration of a colloidal suspension.

An example of a hydrophobic sol, whichowes its surface charge to selective adsorp-tion of ions from solution, is the silver bro-mide sol, which results from mixing potas-sium bromide and silver chloride in water.Both potassium bromide and silver chlorideare soluble in water. Silver bromide is not.Therefore, when potassium bromide and sil-ver chloride are mixed together in water, sil-ver bromide will be formed as an insolubleproduct and will precipitate from solution inthe form of many tiny silver bromide crys-tals, in accordance with equation 7-13:
K++Br~+Ag++O~(7-13)
-^AgBr + K+ +Cl
When potassium bromide is in excess, thesilver ions will all be tied up as the silver bro-mide precipitate. There will therefore beunprecipitated bromide ions in solution, andthese will be adsorbed to the precipitated sil-ver bromide crystalline particles. The sol,consequently, will possess a negative surfacecharge. At the exact equivalence point(equivalent silver and bromide), the silverbromide will precipitate from solution,because there will be neither bromide ionsnor silver ions in excess. When silver nitrateis in excess, the sol will possess a positivecharge. Mutual electrostatic repulsion resultswhen either silver or bromide is present inexcess.
Soap micelles are examples of colloid sys-tems whose stabilizing surface charge arisesfrom ionization of certain groups on themicelles. Long hydrocarbon "tails" of thesoap molecules clump together to escapewater, as illustrated in Figure 7-12 (theabsence of the hydrocarbon chain in thewater allows the water to form more hydro-gen bonds, thus lowering the free energy ofthe entire system). Clumping together of thehydrocarbon chains of many soap moleculescreates a micelle with many ionizable groupsat its periphery. Since the charge due to thedissociated ions is the same for each micelle,electrostatic repulsion prevents the micellesfrom agglomerating.
Lyophobic sols are thus characterized bytwo phenomena—the absence of an attrac-tion of the dispersed particles for the dispers-ing medium, and stabilization by mutualrepulsion of like electrostatic charges on eachof the suspended particles.
Lyophilic SolsIf, in the formation of a sol, the dispersedparticles have an attraction for the moleculesof the dispersing medium, each dispersedparticle will adsorb a continuous layer of sol-vent molecules on its surface. The usual driv-ing force involved in the formation of ahydrophilic sol is the reduction of free energyin the system as a result of stronger bondingbetween the solvent molecules and the dis-persed particles than between the solvent
Figure 7-12 Colloidal suspension of soap micelles.

molecules themselves. This adsorbed layerserves as a protective shell for each of the dis-persed particles, thus constituting the princi-pal stabilizing factor for the sol. Additionalstability can result from repulsion of likeelectrostatic charges on each particle, ifchemical groups on these particles ionize orif ions are adsorbed onto the surfaces of theparticles from the solution. These chargesoriginate in a manner similar to those in lyo-phobic sols but are far less important to thestability of lyophilic sols than of lyophobicsols.
Electrokinetics of Lyophobic SolsA graphical representation of the charge dis-tribution on a lyophobic colloidal particle ispresented in Figure 7-13. The model colloi-dal particle used for this figure has a nega-tively charged surface. This negative chargecould have arisen from one or more of sev-eral electrochemical activities undergone bythe particle when placed in the suspendingmedium, including those explained above, orsimply from the adsorption of OH" or otheranions because of the greater affinity of thesuspending medium for cations.
ELECTRIC POTENTIALSURROUNDING THE PARTICLE
ZETA POTENTIAL
BULK OF SOLUTION
EXTENT OF DIFFUSE LAYEROF COUNTERIONS
RIGID LAYER ATTACHED TOPARTICLE
CONCENTRATION OF POSITIVE IONS
CONCENTRATION OF NEGATIVE IONS
Figure 7-13 "Layers" or "shells" surrounding a negatively charged colloid.
ELECTRO-NEGATIVEPARTICLE

The negatively charged particle attracts alayer of positive ions, which may originateeither from dissociated electrolytes present inthe suspending medium or from dissociatedgroups on the particle itself. These ions,oppositely charged to the inherent charge ofthe colloidal particle, are called "counter-ions." They are drawn to the particle by elec-trostatic attraction, while thermal agitationor Brownian motion tends to distribute themuniformly throughout the solution. The layerof counterions, referred to as the "Sternlayer," is relatively rigid. The Stern layer doesnot entirely neutralize the charge on the col-loid; the excess charge gives rise to a diffuselayer of co- and counterions, intermingled,but having a higher density of counterionsclose to the colloid and a higher density ofcoions at the outer reaches of the layer. Thisdiffuse layer is often referred to as the "Gouy-Chapman layer." The Stern layer-Gouy-Chapman layer combination is called the"Helmholtz double layer" or the "diffusedouble layer."
When the suspended colloid shown inFigure 7-13 is placed in an electric field, itwill migrate toward the positive pole. As itmoves through the suspending medium, theions in the Stern layer move as a fixed part ofthe colloid, while those in the diffuse Gouy-Chapman layer tend to slough off, or staybehind. A plane of shear is developed at acertain distance from the surface of the col-loid, and this plane of shear, or "slipping sur-face," defines the boundary between theStern and Gouy-Chapman layers. Immedi-ately below the colloid particle in Figure 7-13is a graphical representation of the electricalpotential at increasing distance from the sur-face of the colloid. The potential decreaseslinearly between the surface of the particleand the inner periphery of the Stern layer ofcounterions. From the inner periphery of theStern layer outward, the potential drops at adecreasing rate. The potential at the outerperiphery of the Stern layer (that is, at thesurface of shear) is termed the "zeta poten-tial." The value of the zeta potential is directlydependent upon the same factors that deter-
mine the thickness of the Stern layer, namely,the strength of the charge at the surface of thecolloid; the nature—especially the value ofthe ionic charge—and degree of solvation ofthe ions in the Stern layer; and the frictionaldrag exerted by the suspending medium onthe double layer as the particle migratesunder the influence of an applied electricfield.
Each of the ions in the Stern layer is sol-vated; thus, a layer of tightly bound solventmolecules surrounds each lyophobic colloid.In contrast to the water layer associated withhydrophilic colloids (a detailed discussion ofwhich follows) the water layer in the case of ahydrophobic colloid is bound only by attrac-tion to the ions in the Stern layer and not byattraction to the colloid surface itself. Thezeta potential in the case of hydrophobic col-loids gives a direct indication of the distanceover which the colloidal particles can repeleach other and thus of the stability of the col-loid system.
Electrokinetics of Lyophilic SolsWhen an organic macromolecular solid isplaced in a given liquid, one of three possiblestates of solute-solvent interaction will result(solubility in this instance is defined as a lim-ited parameter indicating compatibility withthe solvent but not true solubility in the strictsense of the definition):
1. The macromolecular solid is insoluble inthe liquid.
2. The solid swells, but has a limited solu-bility.
3. The substance is soluble in the liquid.
In cases 1 and 2 the systems are always lyo-phobic, whereas in case 3, the only possibilityis that of a lyophilic sol. As an example ofcase 3, when amylose is placed in water,hydrogen bonds are formed between mole-cules of water and the hydroxyl groups onamylose that are at least as strong or stronger(that is, involve at least as much or morebond energy) than hydrogen bonds betweenthe molecules of water itself. If a charge exists

on the macromolecule because of factorssimilar to those accounting for the charge onlyophobic colloids, and if an electric field isapplied across a portion of the sol, the parti-cle will migrate toward one of the poles. Asthe particle moves, water molecules that arebound to the macromolecules by hydrogenbonds, plus those interlaced, again by hydro-gen bonding, migrate as an integral part ofthe particle. This layer of water, usuallymonomolecular, defines what is known asthe "solvated solvent layer" around the mac-romolecules and serves as a protective shellagainst influences that could be exerted bythe chemical and physical properties of thesuspending environment.
Secondary stabilizing forces possessed by acharged hydrophilic colloid arise principallyfrom ionic dissociation of constituent groupson the macromolecule rather than byadsorption of ions. It is convenient to picturea charged lyophilic colloid as having a diffusedouble layer of ions collected around it. Thezeta potential is interpreted in the same man-ner as for lyophobic colloids, being thepotential at the surface of shear in the diffusedouble layer, and is measured in the sameway, that is, by use of a zeta potential meteror by electrophoresis techniques.
Coagulation of Colloidal WasteSystems
Lyophobic ColloidsCoagulation, or agglomeration of the parti-cles in a lyophobic colloidal system, can bebrought about by neutralization of the sur-face charge on each particle to the pointwhere the repulsive forces will be less thanthe London-van der Waal forces of attrac-tion. Since the zeta potential directly indi-cates the strength of the net charge on eachparticle, a reduction of the zeta potential issynonymous with a reduction of the stabiliz-ing forces of the sol. A zeta potential of zero(the isoelectric point of the system) corre-sponds to minimum stability. However, thezeta potential need not be zero for coagula-tion to take place. It must be reduced only to
within a certain minimum range, referred toas the "critical zeta potential zone."
The zeta potential can be reduced by oneor a combination of several methods, includ-ing increasing the electrolyte concentrationof the sol, reducing the potential on the sur-face of the dispersed solid by external manip-ulation of the pH, and/or by adding multiva-lent counterions. The Schulze-Hardy rulestates that the sensitivity of a colloid systemto destabilization by addition of counterionsincreases far more rapidly than the increaseof the charge of the ion. That is, in increasingfrom a divalent charge to a trivalent charge,the effectiveness of a coagulant increases farmore than a factor of 3/2. Overbeek illus-trated this rule by showing that a negativelycharged silver iodide colloid was coagulatedby 140 millimoles per liter of NaNO3, 2.6millimoles per liter of Mg(NO3)2> 0.067 mil-limoles per liter of Al(NO3)3, and 0.013milllimoles per liter of Th(NO3)4.
The distinction between primary stability,imparted by the surface charge, and second-ary stability, pertaining to the effective repul-sion of colloidal particles because of the mag-nitude of the zeta potential, is useful forinterpreting the coagulation of these particlesby the addition of multivalent ions counterto the surface charge of the colloid. The pres-ence of the multivalent counterions bringsabout a condition whereby the charges in thedouble layers are so compressed that thecounterions are eventually contained, for themost part, within the water layers that origi-nally contained the solvated ions in the dou-ble layer. The primary stability is thusreduced as a consequence of neutralization ofthe charge on the surface of the colloid, andthe secondary stability is reduced since theparticles can now approach each other towithin a distance corresponding to coales-cence of their water sheaths (water solvatingthe counterions and coions in the diffusedouble layer) (recall that, if an ion is dis-solved, it has, by definition, many water mol-ecules surrounding it and "bonded" to it by"hydrogen bonding") without prohibitive

repulsion between their respective diffusedouble layers of ions.
Lyophilic ColloidsThe principal stabilizing factor in the case oflyophilic sols is the solvating force exerted onthe particles (not on the ions in the diffusedouble layer) by the suspending medium.Electrolytic repulsion between the particles,though of lesser importance to the total sta-bilizing force, is also a factor that must bedealt with for the ultimate coagulation of alyophilic colloid system. Two methods can beemployed to desolvate lyophilic colloids.
In the first method, a liquid that is both apoor solvent for the suspended particle andhighly miscible with the suspending mediumcan be added to the system. When this isdone, the colloid is no longer able to formbonds with the medium that are stronger
than the internal bonds between elements ofthe medium, and the principal stabilizingfactor is removed. This process is called"coacervation."
The other method is to add a substance,such as a sulfate salt, which can form stron-ger solvation bonds with the solvent than thesolvent can with the suspended colloids.When this is done, the added salt effectivelypulls the hydrated water layer from the sur-face of the colloid, again destroying the prin-cipal stabilizing factor. This process is knownas "salting out."
The actual destabilizing mechanism, aswell as the overall effect, of both of thesemethods is the same. In each case, the dis-persing medium is able to form strongerbonds (thus decrease its free energy more)with the additive than with the dispersedphase. If the previously solvated particles
Figure 7-14 Diagrammatic representation of the various types of colloids. The colloids in the upper row are lyophilic; thosebelow are lyophobic. pH increases from right to left.
PPT.
Negative HydratedColloid
Neutral HydratedColloid
Positive HydratedColloid

carry no net charge at this point, that is, theyhave either zero or very small zeta potential,they will flocculate and separate from thedispersing phase once coacervation has beenaccomplished.
If they do possess a net charge, resulting ina significant zeta potential and thus repulsiveforces stronger than the London-van derWaal forces of attraction, the colloids will notcoagulate but will remain in suspension as alyophobic sol. Coagulation must then beeffected according to the methods presentedin the "Lyophobic Sols" section.
Figure 7-14 presents a diagrammatic rep-resentation of the various types of colloidalsystems and how destabilization results inremoval.
CoagulantsCoagulants such as alum, ferric sulfate, andcationic polyelectrolytes all work by sup-pressing the zeta potential of the colloidalsystem to a value sufficiently low that the col-loidal particles will collide and then coalesceunder the influence of slow stirring. Anionicand nonionic polyelectrolytes can greatly aidin the building of much larger flocculatedparticles that will both settle faster and pro-duce a less turbid effluent. Used in this man-ner, the anionic and nonionic polyelectro-lytes are referred to as "coagulant aids."
When alum (Al2(SO4J3.18H2O) dissolvesin water, some of the aluminum goes intotrue solution as the trivalent aluminum ion,Al+++. If there are colloidal particles with anegative surface charge, the trivalent alumi-num ions, plus other aluminum species suchas Al(OH)++ and Al(OH)2
+, will be attractedto these negatively charged surfaces and willsuppress the net negative surface charge,which is to say they will suppress the zetapotential. Other metal salts that dissolve toyield trivalent ions, such as ferric sulfate, fer-ric chloride, and aluminum chloride, coagu-late colloidal suspensions with effectivenesssimilar to that of alum.
Salts that dissolve to yield divalent ions,such as calcium chloride or manganous sul-fate, also effect reduction of the zeta potential
and eventual coagulation, but with an effi-ciency far less than the difference in ioniccharge might indicate. As explained above,the Shultz-Hardy rule states this effect.
Laboratory experimentation is alwaysrequired to determine the optimum doses ofcoagulants and coagulant aids. There is nocharacteristic, substance, or property of awastewater that can be measured and thenused as an indicator of the quantity of coagu-lant required. There is no substitute for per-forming "jar tests."
A suggested procedure for conducting ajar test program to determine the optimumquantities of reagents and pH range is pre-sented in the section entitled "Reaction toProduce an Insoluble Solid." This procedureis identical to that recommended for deter-mining the optimum doses of coagulants.The observations made during steps 5 and 6will be oriented toward the disappearance ofthe turbidity originally present in the testsolution, as opposed to the turbidity causedby the initial appearance of precipitated tar-get substances (as in the case of the reactionsto produce an insoluble solid).
Reaction to Produce a BiologicallyDegradable Substance from aNonbiodegradable SubstanceSome substances that are resistant to biodeg-radation can be chemically altered to yieldmaterial that is biodegradable. Examples arelong chain aliphatic organics" made solubleby attachment of ionizable groups, and cellu-lose or cellulose derivatives.
Hydrolysis, under either acidic or alkalineconditions, can be used to break up manylarge organic molecules into smaller seg-ments that are amenable to biological treat-ment. Hydrolysis derives its name from thefact that when a carbon-carbon bond is"broken," a hydrogen atom attaches to thesite on one of the carbon atoms, and an OHgroup attaches to the site on the other carbonatom. Heat may be required for effectivehydrolytic action, and consideration ofproper reaction time is very important.

Certain fats and oils are made water solu-ble by chemically attaching ionizable groupssuch as sulfonates or ammonium groups totheir long-chain hydrocarbon structures foruse in leather tanning, conditioning and fin-ishing, and other industrial uses. These watersoluble fats and oils are found in wastewatersfrom the industries that produce them, aswell as in the wastes from the industries thatuse them. They are characteristically resistantto biodegradation, which is one of the rea-sons for their usefulness.
Hydrolysis of these water soluble fats andoils can break them into small segments thatare still soluble in water and readily degrad-able by anaerobic microorganisms, aerobicmicroorganisms, or both. Laboratory experi-mentation is required to determine the tech-nological feasibility for a given industrialwaste, as well as a cost-effective process.
Substances that are made from celluloseor derivatives of cellulose are resistant to bio-logical degradation, even though the basicbuilding block for cellulose is glucose, a sub-stance that is among the most readily biode-graded substances in existence. The reasonfor the nonbiodegradability of cellulose isthat microorganisms found in aerobic bio-logical treatment systems are not capable ofproducing an enzyme that can break the par-ticular linkage structure, known as the "betalink," that joins the individual glucose mole-cules end to end to produce the very longchain that ultimately winds around itself tobecome cellulose.
Acid hydrolysis, usually requiring someheat, is capable of breaking cellulose intosmall segments. Just how small depends onthe conditions of the hydrolysis process, asregards acidity, heat, catalysts, and reactiontime. In general, anaerobic microorganismsare capable of rapidly biodegrading segmentsof cellulose that are in the size range of a fewhundred glucose units, while aerobic micro-organisms require that the cellulose be bro-ken down into much smaller units.
A patented process that is based on theprinciples described above uses hydrolysis toalter the structures of refractive organics that
remain in wasted biological treatment sludgeafter aerobic or anaerobic digestion has beencarried out to essential completion. As analternative to dewatering and disposing ofthis digested sludge, which, by definition, isnot biodegradable, it can be broken intosmaller organic units by hydrolysis, then sentback through the industry's biological treat-ment process from whence it came. Advan-tage can be taken of periods of low loading,such as weekends, holidays, periods of plantshutdown for maintenance, or during shiftswhen loadings to the treatment plant are low.
Reaction to Destroy or OtherwiseDeactivate a Chelating AgentOften, removal of metals from an industrialwastewater by simple pH adjustment, with orwithout addition of sulfide, carbonate, phos-phate, or a carbamate, is ineffective becauseof the presence of chelating agents. Chelatingagents, discussed in chapter two, are of vari-ous makeup, and include organic materialssuch as EDTA or inorganic materials such aspolyphosphates. The following is an enumer-ation of methods that are candidates for solv-ing this type of wastewater treatment prob-lem.
Organic Chelating Agents
1. Destroy the chelating agent by acidhydrolysis.
2. Destroy the chelating agent by hydroxylfree radical oxidation, using one of thefollowing technologies, as discussed inthe section entitled "Oxidation orReduction to Produce a Nonobjection-able Substance."
a. Fenton's reagent (H2O2 + ferrousions)
b. Hydrogen peroxide + ultraviolet lightc. Ozone + hydrogen peroxided. Ozone + ultraviolet light
3. Destroy the chelating agent by addingpotassium permanganate and heating

(the manganese ions will then have to beremoved along with the target metals).
4. Pass the wastewater through granularactivated carbon. In some cases, thechelating agent will adsorb to the car-bon. In some of those cases, the chelatedmetal will remain chelated, and thus beremoved on the carbon. In other cases,adsorption to the carbon effects releaseof the metals, which can then be precipi-tated without interference from thechelating agents.
Inorganic Chelating Agents
1. Add a stronger chelating agent, such asheptonic acid or EDTA, both of whichare organic. Then use one of the meth-ods given in step 1 for organic chelatingagents.
2. Add a stronger chelating agent, such asheptonic acid or EDTA. Then it is some-times possible to remove the metals bypassing the wastewater through a strongcationic exchange resin generated on thehydrogen (acid) cycle.
3. If the chelating agent is polyphosphate, itmay be feasible to hydrolyze it with acidand heat.
As with most cases involving industrialwastewater treatment, a proper program oflaboratory experimentation followed by trulyrepresentative pilot plant work must be con-ducted to develop a cost-effective treatmentscheme. The "throw some method," whereinone throws some of a candidate reagent intoa sample of wastewater to "see if anythinggood happens," is perfectly proper to do dur-ing periods of break or frustration, but mustnever be used to eliminate forever consider-ation of a reagent or technology that comesto mind based on fundamental properties orchemistry.
CoprecipitationAlthough technically a physical treatmentmethod, since adsorption is the mechanism,
coprecipitation is discussed here because it isoften brought about as a result of chemicaltreatment to produce an insoluble substanceof another target pollutant. For instance,both arsenic and cadmium are effectivelycoprecipitated with aluminum or iron. Ifthere is dissolved iron (the soluble form isthe ferric, or +3 state) and arsenic and/orcadmium in an industrial wastewater,sodium hydroxide can be added to forminsoluble ferric hydroxide, which then buildsa rather loose crystal lattice structure. Thisprecipitate exists in the wastewater mediumas a suspension of particulate matter. Asthese particles are building, arsenic and/orcadmium ions, which are relatively hydro-phobic, adsorb to them, effectively removingthem from solution. As the particles settle tothe bottom of the reaction vessel, and theresulting "sludge" is removed, the treatmentprocess is brought to completion. However,the removed sludge must now be dealt with.As discussed in the section entitled "PhysicalTreatment Methods," the usual procedure isto separate the water from the particles usingvacuum filtration, sludge pressing, or otherphysical separation process followed by evap-oration. The resulting dry mixed metals canbe subjected to metal recovery processes,stored for later metals recovery, or properlydisposed of.
Table 7-9 presents an enumeration of suc-cessful applications of coprecipitation forindustrial wastewater treatment.
In wastewaters containing iron plus othermetals, the wastewater can be aerated to oxi-dize soluble ferrous ions to insoluble ferricions. As the ferric ions precipitate from solu-tion, dissolved species of other metals willadsorb to the growing crystalline precipitatesand will thus be removed from solution.
In wastewaters of low pH that contain alu-minum ions, adjusting the pH to 6.3 or sowill cause the aluminum to precipitate. Thealuminum precipitate particles, whichinclude oxides and hydroxides, act as effec-tive adsorption sites for other metals.
One of the most effective methods forremoving arsenic from wastewaters is to oxi-

Table 7-9 Applications of Coprecipitation of Metals as a Wastewater Treatment Method
1. In wastewaters containing iron plus other metals, the wastewater can be aerated to oxidize soluble ferrous ions toinsoluble ferric ions. As the ferric ions precipitate from solution, dissolved species of other metals will adsorb tothe growing crystalline precipitates and will thus be removed from solution.
2. In wastewaters of low pH that contain aluminum ions, adjusting the pH to 6.3 or so will cause the aluminum toprecipitate. The aluminum precipitate particles, which include oxides and hydroxides, serve as effective adsorptionsites for other metals.
3. One of the most effective methods for removing arsenic from wastewaters is to oxidize all of the arsenic to arsen-ate, then add a source of ferric ion, such as ferric sulfate. Then, by maintaining the pH in the neutral range, and al-lowing oxygen to react with ferrous ions and precipitate as Fe2O3 crystals, the arsenate will adsorb to the growingcrystals, become entrapped, and be effectively removed.
dize all of the arsenic to arsenate, then add asource of ferric ion, such as ferric chloride orferric sulfate. Then, by maintaining the pH inthe neutral range and allowing oxygen toreact with ferric ions and precipitate as Fe2O3
crystals, the arsenate will adsorb to the grow-ing crystals, become entrapped, and be effec-tively removed.
Oxidation or Reduction to Produce aNonobjectionable SubstanceSome highly objectionable substances can bechemically oxidized to produce nonobjec-tionable substances, such as carbon dioxideand water. An example is the destruction ofthe common rodenticide warfarin by potas-sium dichromate, acid, and heat, as repre-sented by equation 7-14.
^ ^ ^ ^ ^ CHCH2COCH3
O H p TT
+134H++4K2Cr2O7, (7-14)heat ) 19CO2 + 24H2O + 8Cr+++
As shown in equation 7-14, highly toxicwarfarin is oxidized to harmless carbon diox-ide and water. Also shown in equation 7-14 is
the presence of Cr+++ in the effluent, whichmay have to be removed in a subsequent step.
The removal of chromium from industrialwastewaters by chemically reducing hexava-lent chrome ions, which are soluble in waterand highly toxic, to the trivalent state, whichis neither soluble (in the correct pH range)nor toxic, is another example of treatment bychemical oxidation or reduction to producenonobjectionable substances. Reducingagents that have been found to work wellinclude sulfur dioxide, sodium or potassiumbisulfite or metabisulfite, and sodium. orpotassium bisulfite plus hydrazine. The cor-rect range of pH, usually in the acid range,must be maintained for each of these chemi-cal reduction processes to proceed success-fully.
Table 7-10 presents additional examples oftreatment of industrial wastewater by oxida-tion or reduction of an objectionable sub-stance to produce one or more nonobjec-tionable substances.
Alkaline Chlorination of CyanideCyanide has been used for many years as theanion to associate with metals used in metalplating baths, since many metal cyanides aresoluble in water to relatively high degrees.Because of the extreme toxicity of cyanide, itsremoval from industrial wastewaters was oneof the earliest industrial wastewater treat-ment processes to be developed and usedwidely.

Table 7-10 Examples of the Use of Chemical Oxidation or Reduction to Produce Nonobjectionable Substances
1. Alkaline chlorination of cyanide to produce carbon dioxide, nitrogen gas, and chloride ion.
2. Chemical reduction of hexavalent chromium (toxic) to produce insoluble, less-toxic trivalent chromium.
3. Oxidation of (soluble) ferrous ions to the insoluble ferric state by exposure to oxygen (air).
4. Destruction of organic materials such as toxic substances (solvents and pesticides, for example) and malodoroussubstances (methyl mercaptan and dimethyl sulfide, for instance) by oxidation by free radicals:
a. Hydrogen peroxide + ultraviolet light
b. Fenton's reagent (H2O2 + ferrous ions)
c. Ozone + hydrogen peroxide
d. Ozone + ultraviolet light
5. Oxidation of organics with ozone, which may or may not involve free radicals
6. Oxidation of organics with hydrogen peroxide, which may or may not involve free radicals.
7. Destruction of toxic organics by oxidation with heat, acid, and either dichromate or permanganate. Products arecarbon dioxide, water, and some nonobjectionable refractory compounds. Just about any organic compound canbe destroyed by this method.
8. Wet air oxidation of various organics, such as phenols, organic sulfur, sulfide sulfur, and certain pesticides. Thisprocess takes place under pressure, with oxygen supplied as the oxidizing agent by compressed air.
9. Chlorination of hydrogen sulfide to produce elemental sulfur. Subsequent neutralization is usually required.
Chlorine will react instantaneously withcyanide, at all pH levels, to produce cyanogenchloride, as follows:
CN"+ CZ2 ->CNCl + Na+ +CF (7-15)
At pH levels other than alkaline (that is,below 8.5), the cyanogen chloride will persistas a volatile, toxic, odorous gas. In the pres-ence of hydroxide alkalinity, however, cyano-gen chloride is converted to cyanate, which isa thousand times less toxic than cyanide:
CNCl + 2OH"(7-16)
-^CNO'+ H2O + Cl~
If chlorine is present in excess, that is, inan amount significantly greater than thatrequired for stochiometric completion of thereaction indicated in equation 7-15, and thechlorine that will be consumed in reactionswith reducing reagents and organics presentin the wastewater (side reactions), it will oxi-dize the cyanate (produced as shown inequation 7-16) to carbon dioxide and nitro-
gen gases, both only sparingly soluble inwater:
2CNO~+4OH"+3C/2(7-17)
-> 2CO2 + 6C/" + N2 + 2H2O
which accounts for the effectiveness of theso-called "alkaline-excess chlorine process"for destruction of cyanide.
Because chlorine is subject to side reac-tions as indicated above, the chlorine doserequired to produce satisfactory destructionof cyanide must be determined in the labora-tory, and extreme caution must always beexercised to never allow the cyanide solutionto attain an acidic pH, which will allowdevelopment of cyanide gas:
CN~+H+^HCN (7-18)
another sparingly soluble gas, but anextremely toxic one.
Usually, the caustic-excess chlorine proc-ess for destruction of cyanide is carried outat pH 8.5. Automatic pH control is nor-

mally employed, with suitable fail-safe pro-cesses. Automatic chlorine dosing can beaccomplished by use of an ORP probe andcontroller.
Oxidation of (Soluble) Ferric Ions to(Insoluble) Ferrous Ions by OxygenIron is soluble in water in the +2 (ferrous)valence state. Ferrous ions are very easily oxi-dized to the +3 (ferric) valence state, solubleonly in strongly acidic aqueous solutions.The oxygen content of air is a sufficientlystrong oxidizing agent to bring about thisoxidation.
Aeration, followed by sedimentation, hasbeen used successfully to remove iron fromindustrial and other wastewaters, includinglandfill leachate. The aeration step accom-plishes conversion of the dissolved ferrousions to the insoluble ferric state. The ferricions quickly and readily precipitate fromsolution as hydrous and anhydrous ferricoxides (Fe(OH)3 and Fe2O3, respectively).These oxides form crystal lattices that buildto particle sizes that settle well under theinfluence of gravity. Coagulants and/or coag-ulant aids are often used to assist the coagu-lation and flocculation process, producing ahigher-quality effluent.
A benefit that often results from theremoval of iron by oxidation followed bysedimentation is that other metal ions, all ofwhich are inherently hydrophobic, "auto-matically" adsorb to the particles of ferricoxides as they are forming via precipitation.They are thus removed from solution alongwith the iron. This process, known as "copre-cipitation," is sometimes augmented by actu-ally adding more ferrous ions to the wastewa-ter in the form of ferrous sulfate or other fer-rous salt in an amount sufficient to coprecip-itate other metals.
Oxidative Destruction of Organics byFree RadicalsFree radicals are powerful oxidizers that canconvert many organics all the way to carbon
dioxide, water, and fully oxidized states ofother atoms that were part of the originalorganic pollutants, including sulfates andnitrates. Free radicals can be generated in acontrolled manner to destroy a host of objec-tionable organic substances, including pesti-cides, herbicides, solvents, and chelatingagents. As discussed previously, chelatingagents interfere with the mechanismsemployed to remove metals (by precipita-tion, for instance).
A free radical is an atom, or group ofatoms, possessing an odd (unpaired) elec-tron (one that has no partner of oppositespin). A free radical has such a powerful ten-dency to obtain an electron of opposite spin,and thus complete a thermodynamically sta-ble pair, that it will easily extract one from anorganic molecule. When this happens, theorganic molecule, or a portion of it, becomesa free radical itself, and goes after anothermolecule, organic or otherwise, forminganother free radical, and so on. A chain reac-tion is thus set up and, if managed properly,can be induced to continue until nearly all ofthe target substance has been removed.
Management of the chain reaction consistsof maintaining the pH of the system within arange favorable for the reaction, and supply-ing enough of the free radical-generating sub-stance (discussed as follows) to keep the pro-cess going. Side reactions (with reducingagents) "kill" free radicals. If the rate of "kill-ing" free radicals exceeds the rate of genera-tion of free radicals for a long enough time,the treatment process terminates.
A free radical, then, has one unpairedelectron and has the same number of elec-trons as protons. A negatively charged ion, incontrast, has an even number of electrons,each paired with another electron of oppositespin, and has more electrons than protons.
Free radicals can be generated by the fol-lowing methods:
• Addition of hydrogen peroxide• Addition of hydrogen peroxide to a solu-
tion that contains ferrous ions, either

present in the wastewater or added alongwith the hydrogen peroxide (Fenton'sreagent)
• Addition of hydrogen peroxide, followedby irradiation with ultraviolet light
• Addition of both ozone and hydrogenperoxide
• Adding ozone and irradiating with ultra-violet light
Oxidation with Hydrogen PeroxideHydrogen peroxide has the chemical formulaH2O2 and is an oxidizing agent that is similarto oxygen in effect but is significantly stron-ger. The oxidizing activity of hydrogen per-oxide results from the presence of the extraoxygen atom compared with the structure ofwater. This extra oxygen atom is described asa "peroxidic oxygen" and is otherwise knownas "active oxygen."
Hydrogen peroxide has the ability to oxi-dize some compounds directly; for instance,alkenes, as shown below. The peroxidic oxy-gen adds to the double bond, producing ahydroperoxide, as shown in equation 7-19.
The hydroperoxide then autooxidizes toalcohols and ketones.
Hydrogen peroxide consists of two hydro-gen atoms and two oxygen atoms bonded byshared electron pairs, as shown in Figure7-15.
The oxygen-oxygen single bond is rela-tively weak and is subject to breakup to yield•OH free radicals:
H -O-O- H -^•OH + •OH
or
peroxide —> Rad •
The two «OH free radicals sometimessimply react with each other to produce anundesirable result; however, the radical canattack a molecule of organic matter, and in sodoing, produce another free radical. This iscalled a chain-initiating step:
•OH + RH^H2O + R*chain-initiating step
As discussed previously, in free radicaloxidation of organics, this process continuesin such a way that the organics are broken
2 atomsof hydrogen
2 atoms of oxygen Hydrogen peroxide
Figure 7-15 Formation of hydroxyl free radicals.

down, all the way to carbon dioxide andwater.
R^+R-C->R + R^+C^chain propagation steps
RH + R9+O^CO2+H2O
RH + C • +O-> CO2 + H2O
Hydrogen Peroxide Plus Ferrous Ion(Fenton's Reagent)Hydrogen peroxide will react with ferrousions to produce ferric ions, hydroxide ions,and hydroxyl free radicals, as shown in equa-tion 7-20:
ft+++H^ (7.20)-^Fe++++OH~+^H
The hydrogen peroxide thus dissociatesinto one hydroxide ion (nine protons and tenelectrons [OH~]) and one hydroxyl free radi-cal (nine protons and nine electrons [•OH]),as shown in equation 7-21:
H2O2+e~ -^-^•OH + OH~ (7-21)
In this case, there is only one »OH freeradical, as opposed to two *OH free radicals,when hydrogen peroxide breaks down in theabsence of ferrous ions as discussed previ-ously. The single •OH then attacks a mole-cule of organic material as discussed previ-ously, initiating a chain reaction (chain-initi-ating step), with the result that the organicmaterial is eventually oxidized all the way tocarbon dioxide and water.
Hydrogen Peroxide Plus Ultraviolet LightWhen hydrogen peroxide is added to anaqueous solution that is simultaneously irra-diated with ultraviolet light (UV), the resultis that the hydrogen peroxide more readilybreaks down into *OH free radicals than
when the UV is not present, as illustrated inequation 7-22:
H2O2 — ^ 2 • O H (7-22)
There are, therefore, significantly morehydroxyl free radicals to enter into chain-ini-tiating steps, as discussed previously, than isthe case without UV.
Ultraviolet light thus greatly increases theoxidative power of hydrogen peroxide, in amanner similar to that of metal activation(Fenton's reagent). Although it has not beenmade clear how the reaction proceeds, itseems likely that the ultraviolet energyenables hydrogen peroxide to either separateinto two hydroxyl free radicals, each havingnine protons and nine electrons, as suggestedby equation 7-23:
H2O2 - ^ 2 « O H (7-23)
or to obtain an electron from some source,probably the target organic compounds, andthus dissociate into one hydroxide ion (nineprotons and ten electrons [OH"]) and onehydroxyl free radical (nine protons and nineelectrons [•OH]), as shown in equation 7-24:
H2O2 +e~ -^ •OH+ OH" (7-24)
The hydroxyl free radicals then go on toenter or perpetuate a chain reaction, asshown previously.
Oxidation with OzoneOzone, having the chemical formula O3, is agas at ambient temperatures. Ozone hasphysical characteristics similar to oxygen butis a far stronger oxidizing agent. Ozone reactswith organic compounds in a manner similarto that of oxygen, adding across doublebonds and oxidizing alcohols, aldehydes, andketones to acids. Ozone requires less assis-tance than oxygen does, as from heat, cata-lysts, enzymes, or direct microbial action.

Ozone Plus Hydrogen PeroxideAddition of both ozone and hydrogen perox-ide has the effect of oxidizing many organicsto destruction much more strongly andeffectively than by adding either ozone orhydrogen peroxide alone. When both ozoneand hydrogen peroxide are present in watercontaining organics, •OH free radicals areformed through a complex set of reactions.The result of the complex reactions is thattwo *OH radicals are formed from onehydrogen peroxide and two ozone molecules:
H2O2 + 2O3 -> !{•OH) + 3O2 (7-25)
The »OH radicals then react with organicsto form harmless carbon dioxide, water, andother smaller molecules. As an example,•OH radicals react with trichloroethyleneand pentachlorophenol. The products inboth cases are carbon dioxide, water, andhydrochloric acid:
C2HCU + 6 •OH
-> 2CO2+2H2O+ 3HCl
C6HCl5O + 18* OH
^6CO2 + 1H1O + 5HCl ( ?"2 7 )
The ozone plus hydrogen peroxide systemhas the advantage (compared to, say, Fenton'sreagent) that ozone itself will react in a first-order reaction with organics, resulting in fur-ther reduction of pollutants.
In addition to the formation of »OH radi-cals, as shown by equation 7-28, there mayalso be formation of oxygen free radicals:
H2O2 +O 3 -* 2(#O) + H2O (7-28)
Oxygen free radicals may then enter intochain reactions to break up organics, asshown in equations 7-29 and 7-30 (below).
This chain reaction may continue so as todestroy many organics in addition to thosedestroyed by ozone and the «OH radicals.
Ozone Plus Ultraviolet LightOzone can be used in combination withultraviolet light to, in some cases, producemore rapid and more complete oxidation ofundesirable organic matter than with eitherozone or ultraviolet light alone. Equation7-31 illustrates this alternative process:
Organic matter + ozone + UV light
-^CO2+H2O+O2 ( 7"3 1 )
Here again, free radicals may or may notbe involved.
Chlorination of Hydrogen Sulfide toProduce Elemental SulfurHydrogen sulfide is objectionable for a num-ber of reasons, including its contribution tocrown corrosion in sewers and its malodor-ous character. Hydrogen sulfide can be oxi-dized to elemental sulfur, as shown in equa-tion 7-32:
H2S+ Cl2 ->2HCl + S° (7-32)
It may then be necessary to neutralize thehydrochloric acid by one of the usual meth-ods.
(7-29)
(7-30)

Additional methods of oxidizing hydrogensulfide to either sulfate ion or elemental sul-fur (both odor free) include:
• Raising the level of dissolved oxygen(beyond the level of saturation at atmos-pheric pressure) by adding oxygen underpressure
• Adding hydrogen peroxide• Adding potassium permanganate
In the cases of oxygen under pressure orhydrogen peroxide, oxygen oxidizes (takeselectrons away from) sulfur atoms. Normally,if the pH is in the alkaline range, the sulfuratoms will be oxidized to elemental sulfur,and one gram of hydrogen sulfide willrequire about 2.4 grams of H2O2, dependingon side reactions. If the pH is in the acidrange, the sulfur will be oxidized all the wayto sulfate ion, and each gram of hydrogensulfide will require four times more hydrogenperoxide (about 9.6 grams) as the purechemical. In contrast, each gram of hydrogensulfide will require about 4.2 grams of chlo-rine (as Cl2) or 11.8 grams of potassium per-manganate (KMnO4) to oxidize the sulfur toelemental sulfur.
Thermal OxidationCertain highly toxic organics, such as PCBsand dioxin, are best destroyed by thermaloxidation. Dow Chemical Co., as well as oth-ers, constructed incinerators in the 1940s tosafely dispose of wastes from the manufac-ture of many different chemicals.
PCBs, which are resistant to biodegrada-tion (meaning that they are biodegraded veryslowly), are destroyed completely by inciner-ation, but temperatures of 2,3000F or moreare required. Other organics are destroyed atlower temperatures, and each applicationmust be tested and proven.
Thermal oxidation has often been used toremediate contaminated soil. The mecha-nism and products of thermal oxidation arethe same as for chemical oxidation with oxy-gen. The mechanism is electrophilic attack,
and the products are carbon dioxide, water,and oxidized ions and molecules such as sul-fate, sulfur oxides, and nitrogen oxides.Equation 7-33 represents the thermal oxida-tion process.
Organic matter + O2
heat ) CO2 +H2O + SOx+ NOx
When thermal oxidation is required, asopposed to chemical oxidation, it is becausethe energy of activation required for the reac-tants shown in equation 7-33 is too great forthe reaction to proceed without heat. It isheat that supplies the energy of activationneeded.
Catalytic OxidationWhen the energy of activation required foroxygen, or another oxidizing agent, to reactwith a certain organic substance is too greatfor the reaction to proceed under normalconditions, there are two ways to overcomethis deficiency: (1) add heat to supply theenergy of activation; and (2) add a catalyst,which reduces the energy of activation.When heat is added, the process is calledthermal oxidation. When a catalyst is added,the process is called catalytic oxidation. Theprincipal products are the same, namely, car-bon dioxide and water (when the oxidationprocess is allowed to go to completion), andthe mechanism of oxidation is basically thesame, except for the effect of the catalyst inreducing the activation energy. In manycases, the catalyst is not consumed in theprocess, as illustrated in equation 7-34.
Organic matter + O2+ catalyst
-> CO2 + H2O + catalyst (7~34^
Solvent ExtractionSolvent extraction operates on the principleof differential solubilities. When a substance(solute) is dissolved in one solvent, and that

combination is mixed vigorously with a sol-vent in which the substance is more solublethan it is in the first solvent (and the two sol-vents are not soluble in each other), the dis-solved substance will pass from the first sol-vent into the second. The driving forcebehind this transfer is the second law of ther-modynamics, as explained in Chapter 2. Thestronger bond energies that result when thesubstance is dissolved in the second solventresult in a lower level of free energy than wasthe case with the first solvent.
Biological Methods of WastewaterTreatment
Biological treatment of industrial wastewa-ter is a process whereby organic substancesare used as food by bacteria and other micro-organisms. Almost any organic substance canbe used as food by one or more species ofbacteria, fungi, ciliates, rotifers, or othermicroorganisms. In being so used, complexorganic molecules are systematically brokendown, or "disassembled," then reassembledas new cell protoplasm. In aerobic or anoxicsystems, oxygen, which acts as an electronacceptor, is required in either the dissolvedmolecular form or in the form of anions suchas nitrate and sulfate. The end result is adecrease in the quantity of organic pollutantsand an increase in the quantity of microor-ganisms, carbon dioxide, water, and otherby-products of microbial metabolism. Inanaerobic systems, substances other thanoxygen act as the electron acceptor. Each ofthese systems is described in greater detaillater in this chapter.
Equation 7-35 (below) describes the aero-bic or anoxic biological treatment process.The specific component of this process areexplained in following sections.
Organic Matter
1. Is regarded as pollution prior to thetreatment process.
2. Is used as food by the microorganisms.3. Might have been formed by a natural
process, by a living plant or animal, ormight have been formed synthetically bya chemical manufacturing process.
4. Is composed of the elements carbon,hydrogen, oxygen, nitrogen, phospho-rus, and many additional elements inmuch smaller amounts. These elementsare connected by chemical bonds, eachof which is characterized by a certainquantity of energy called "bond energy."As the microorganisms disassemble theorganic matter, they are able to capturemuch of this energy and use it to makenew chemical bonds, in the synthesis ofnew protoplasm. However, the process isless than 100% efficient. Fewer chemicalbonds can be assembled in the process ofcell synthesis than were disassembledduring the microbial degradation proc-ess. Because of this, the microorganismsneed a way to get rid of carbon, hydro-gen, and other atoms that result from theprocess of degradation but for whichthere is not sufficient energy to form car-bon-carbon and other high-energybonds required in the cell synthesis proc-ess. Because relatively low energy bondscan be formed with oxygen, the microor-ganisms get rid of excess carbon atoms asCO2 and excess hydrogen atoms as H2O.Other elements, if in excess, can be com-bined with oxygen as well and passed offinto solution as the oxide. Nitrate andsulfate are examples.
Organic matter + microorganisms + oxygen + nutrients
—> more microorganisms + CO2 + H2O + oxidized organic matter

Microorganisms1. Include bacteria, fungi, protozoa, nema-
todes, and worms.2. Exist in a hierarchical food chain within
which bacteria and fungi feed directly onthe organic matter (pollutants), and thehigher life forms (protozoa, nematodes,etc.) feed on the bacteria.
OxygenIs referred to as:
1. A hydrogen acceptor2. An electron acceptor
NutrientsInclude the following:
1. Nitrogen2. Phosphorus3. Sulfur4. Micronutrients
More Microorganisms1. Are the result of growth of the microor-
ganisms originally present.2. Must be handled and disposed of as
waste sludge.3. Typically amount, in mass, to one-third
to one-half the amount of organic mat-ter (pollutants) originally present in theuntreated wastewater, when the organicmaterial is measured as BOD and themicroorganisms are measured as driedsolids.
CO2
1. Is a waste product, in that it is a methodused by the microorganisms to get rid ofcarbon atoms that have resulted fromthe degradation of the organic pollut-ants, but for which there is not sufficientenergy to make carbon-carbon andother higher-energy bonds needed to
make new cell material in the cell growthprocess.
2. Microorganisms do not disassembleorganic molecules for the fun of it. Theydo it because they have a compulsion togrow (i.e., increase in numbers).
H2O1. Is a waste product.2. Is the mechanism used by microorgan-
isms to get rid of excess hydrogen atomsderived during the process of disassem-bling organic matter.
With respect to oxidized organic matter:
1. The degradation of organic matter bythe microorganisms is not 100% com-plete.
2. The organic matter in the untreatedwastewater may contain some organicmolecules that the microorganisms areunable to degrade.
All biological treatment processes—aero-bic, anaerobic, suspended growth, and fixedgrowth (also referred to as "fixed film")—areaccurately represented by this relationship.The differences in the various configurationsof processes are in the speed of reaction; theform of oxygen used; the relative amounts of"more microorganisms" and "oxidizedorganic matter" produced; and the types oftankage and equipment and amount of landrequired.
The overall process depicted by equation7-35 involves diffusion of the molecules oforganic matter through the aqueous medium(the wastewater itself), and adsorption (orother type of attachment) of these organicmolecules onto the surface of the microor-ganisms. Then, the microorganisms to whichthe molecules, or particles, of organic matterare attached, must manufacture enzymescapable of breaking the organic molecules orparticles down into elementary segmentsthat can pass through the microorganism's

cell membranes. Then, the cells' metabolicmachinery "metabolizes" the elementary seg-ments of organic material, rearrangingmolecular structures and building more cellprotoplasm in order to grow by binary fis-sion and "wasting" a certain amount of thefood as carbon dioxide, water, and some low-molecular-weight organics ("oxidizedorganic material").
Bacteria and fungi are the primary con-verters of whatever organic materials are inthe wastewater to new cell protoplasm andwaste materials. However, these single-celledmicroorganisms make up only a portion ofthe multitudinous diverse life forms thatpopulate a biological treatment system. In amature treatment system, a food chain hier-archy becomes established, ranging from thesingle-celled primary converters through anumber of species of protozoa, rotifers,worms, and in some cases algae and manyother types of microscopic life forms. Therotifers and successively higher life formsgraze on one or more of the lower life forms(the primary converters). The trick to man-aging a well-operating biological treatmentsystem is to manipulate the "feeding" of themicroorganisms and remove certain quanti-ties of the microorganisms on a periodicbasis ("wasting") in such a way as to main-tain optimum relative numbers of the vari-ous life forms. In activated sludge systems,this is best done by controlling sludge age towithin a range that works best for each indi-vidual system.
Development of Design Equationsfor Biological Treatment ofIndustrial Wastes
Two equations are used to mathematicallydescribe the fundamental kinetics of the"treatment" that takes place as a result ofmicroorganisms converting organic materialto new cell mass, carbon dioxide, water, andresidual material (referred to as "oxidizedorganic material," "other low-molecular-
weight compounds," or "refractory organ-ics)" These equations are empirical, areapplicable to the treatment of wastes in allenvironmental media (e.g., activated sludgetreatment of wastewater containing organics;biofiltration of air streams containing hydro-gen sulfide; and biodegradation of organicsin landfilled sludge) and are stated as follows:
(7-36)
(7-37)
where
X = Mass of microorganisms (grams orpounds)
F = Mass of organic matter used as foodby the microorganisms (normallyexpressed as BOD) (milligrams orpounds)
Y = Constant, represents the proportionof organic matter that gets convertedto new microorganism cell material(dimensionless)
kj = Constant, represents the proportionof the total mass of microorganismsthat self-degrade (endogenous respi-ration) per unit time (inverse days)
K = Maximum rate at which the micro-organisms represented by the sym-bol X are able to degrade the organicmatter, no matter how muchorganic matter is present
Se = Mass of F at the conclusion of thedegradative process; equivalent tomass of BOD in the treated effluent.
Ks = Mass of organic matter, F, thatinduces the microorganisms, X, todegrade that organic matter at a rateequal to one-half the maximumpossible rate, k
Two additional parameters are defined asfollows:
Next Page

cell membranes. Then, the cells' metabolicmachinery "metabolizes" the elementary seg-ments of organic material, rearrangingmolecular structures and building more cellprotoplasm in order to grow by binary fis-sion and "wasting" a certain amount of thefood as carbon dioxide, water, and some low-molecular-weight organics ("oxidizedorganic material").
Bacteria and fungi are the primary con-verters of whatever organic materials are inthe wastewater to new cell protoplasm andwaste materials. However, these single-celledmicroorganisms make up only a portion ofthe multitudinous diverse life forms thatpopulate a biological treatment system. In amature treatment system, a food chain hier-archy becomes established, ranging from thesingle-celled primary converters through anumber of species of protozoa, rotifers,worms, and in some cases algae and manyother types of microscopic life forms. Therotifers and successively higher life formsgraze on one or more of the lower life forms(the primary converters). The trick to man-aging a well-operating biological treatmentsystem is to manipulate the "feeding" of themicroorganisms and remove certain quanti-ties of the microorganisms on a periodicbasis ("wasting") in such a way as to main-tain optimum relative numbers of the vari-ous life forms. In activated sludge systems,this is best done by controlling sludge age towithin a range that works best for each indi-vidual system.
Development of Design Equationsfor Biological Treatment ofIndustrial Wastes
Two equations are used to mathematicallydescribe the fundamental kinetics of the"treatment" that takes place as a result ofmicroorganisms converting organic materialto new cell mass, carbon dioxide, water, andresidual material (referred to as "oxidizedorganic material," "other low-molecular-
weight compounds," or "refractory organ-ics)" These equations are empirical, areapplicable to the treatment of wastes in allenvironmental media (e.g., activated sludgetreatment of wastewater containing organics;biofiltration of air streams containing hydro-gen sulfide; and biodegradation of organicsin landfilled sludge) and are stated as follows:
(7-36)
(7-37)
where
X = Mass of microorganisms (grams orpounds)
F = Mass of organic matter used as foodby the microorganisms (normallyexpressed as BOD) (milligrams orpounds)
Y = Constant, represents the proportionof organic matter that gets convertedto new microorganism cell material(dimensionless)
kj = Constant, represents the proportionof the total mass of microorganismsthat self-degrade (endogenous respi-ration) per unit time (inverse days)
K = Maximum rate at which the micro-organisms represented by the sym-bol X are able to degrade the organicmatter, no matter how muchorganic matter is present
Se = Mass of F at the conclusion of thedegradative process; equivalent tomass of BOD in the treated effluent.
Ks = Mass of organic matter, F, thatinduces the microorganisms, X, todegrade that organic matter at a rateequal to one-half the maximumpossible rate, k
Two additional parameters are defined asfollows:
Previous Page

Figure 7-16 Specific utilization versus substrate concen-tration.
engineering literature, and have ranged from0.01 to 5.0, a difference of a factor of 5,000! Itis always necessary to understand the condi-tions under which a value of k was deter-mined before using that value for any kind ofcalculation of size of treatment facility.
In the case of a mixture of substances suchas is typical of industrial wastewater, there isa k rate that is applicable to each individualsubstance. Moreover, when a mixture of sub-stances is utilized by a population ofmicrobes, the substances that are mostreadily utilized (glucose, for instance) exhibitthe highest value of k. As each of the moreeasily utilized substances in the original mix-ture is depleted, the apparent value of kdecreases. Figure 7-17 illustrates how theapparent value of k changes with time, as amixture of substances is utilized.
As shown in Figure 7-17, as a populationof microorganisms begins utilizing a mixtureof substances, the apparent value of k for themixture is relatively high. As the most easilyutilized substance becomes scarce, the micro-organisms begin utilizing, successively, thosesubstances that are more difficult to utilize,and the apparent value of k decreases. For themixture as a whole, then, the most appropri-ate value for k is an approximate "average"value, or one that is observed over a lengthyperiod of time.
In fact, all of the rate constants in theabove equations are specific for the particu-
Figure 7-16 illustrates the parameters kand Ks. As shown, when the concentration offood, or substrate (designated by F, S, BOD,etc.) is very low, it is therefore limiting, andan increase in concentration of food willresult in a proportionate (described by theslope of the line that extends from the originin a straight manner) increase in utilization(eating) rate. Once the concentration of sub-strate reaches a certain level (Smax), fromthat concentration on, food is not limiting,and the microorganisms utilize the food attheir maximum rate, k. At the concentrationof substrate equal to one-half Smax, the rateof substrate utilization is equal to Ks. Thenumerical value of k, as described above, isspecific for a given population of microor-ganisms feeding upon a given type, or mix-ture, of organic substances. As will be shownbelow, the value of k that is chosen by adesign engineer will have a direct effect onthe size of treatment system and, therefore,its cost, not to mention performance. Theappropriate value of k for given treatmentsystems has been the subject of heateddebate, and even lawsuits. More appropri-ately, however, it has been the subject of con-siderable research. Values of k have beenreported throughout the environmental
the average amount of time a com-ponent of the microbial populationspends in the reactor before exitingas effluent solids or being removedas daily wasting, in order to main-tain a constant amount of microor-ganisms in the reactor
(7-39)
(7-38)
mean cell residence time
sludge age
day

ance between systems that have differentfood-to-microorganism mass-loadingparameters. The result of this mathematicaloperation is U, the specific substrate utiliza-tion rate, as shown in equation 7-39. Theparameter U^ would be equal to the food-to-microorganism ratio, F/M, if 100% treat-ment were taking place.
The fundamental relationships givenabove can be rearranged to develop equa-tions, which can be used for design purposes.Table 7-11 presents several versions of designequations derived from one or more of thebasic relationships shown previously. Theparameters X, X0, t, F, and Se are measureddirectly. 0C can be calculated, and theparameters Y, kd, k, and Ks can be deter-mined from the results of either bench-scalepilot plant data or data from full-scale treat-ment systems, as shown in the following text.
Development of Biological TreatmentKinetics in The LaboratoryBench scale pilot treatment systems can beused to generate values for the kinetic coeffi-cients and constants needed in design equa-tions as follows. Four or more treatment sys-tems are operated for several days at steadystate and are identical in all respects except
Figure 7-17 Apparent value of k versus time for a mixtureof substances.
lar population or "mix" of the microbespresent at any given time, as well as for thetype or mixture of types of organic matter.These equations were developed using com-pletely soluble substrate ("food") and purecultures of bacteria. Monod, who developedequation 7-37, used pure cultures of E. coliand B. subtilis in broths of glucose and man-nose.
Dividing dF/dt by X normalizes the rate ofsubstrate removal to a unit weight of micro-organisms, enabling comparison of perform-
Ti me
App
aren
t k
Table 7-11 Design Equations for Biological Treatment Systems
Complete Mix
Characteristics No Recycle With Recycle Plug Flow with Recycle
HydraulicResidence Time
ConcentrationOfBOD5 inEffluent
Active BiomassConcentration
Sludge Age

for food-to-microorganism ratio (F/M) andthose parameters that F/M affects. Thoseparameters include mixed liquor volatile sus-pended solids concentration (MLVSS),which is directly related to the value of X. Asthe four or more laboratory bench-scale pilotunits are run simultaneously, the parametersX, X6, t, F, and Se are determined each day forseveral consecutive days. Alternatively, a sin-gle larger-sized pilot unit, or a full-scaletreatment plant, can be used. In this case, thesystem must be operated under conditions ofone value of F/M at a time. After four periodsof steady-state operation at four or more val-ues of constant but different F/M values, theanalysis can be carried out. Each time the F/M value is changed, the treatment unit mustbe operated at that F/M value for a timeperiod equal to at least three sludge age peri-ods before it can be ensured that "steadystate" has been achieved.
The analysis consists of first plotting val-ues of the inverse of 0C vs. U, as in Figure7-18. The value of Y is the slope of thestraight line of best fit for the plotted datapoints, as shown in Figure 7-18, and thevalue of kd is that of the vertical intercept.
Next, the inverse of the values of U foreach of the four or more treatment systems is
Figure 7-19 Plot of values of U vs Se.
plotted against the inverse of the correspond-ing values of Se, as shown in Figure 7-19.
The vertical intercept in Figure 7-19 is thevalue of k, and the slope of the line of best fit(Figure 7-19) is equal to Ks/k. Having thusdetermined values for all the parameters thatappear in the design equations presented inTable 7-11, the design of a new or modifiedmicrobiological treatment system, or trou-bleshooting an existing treatment system,can proceed.
Example 7-5Design an aeration tank to reduce the BOD5
of an industrial wastewater to below 50 mg/L. The BOD5 of the raw wastewater averages1,714 mg/L. Primary treatment is expected toremove 30% of the BOD5. The average rateof flow is 250,000 gallons per day.
Use complete mix with recycle.
Step 1: Determine design values for theappropriate kinetic constants:
K = 0.51 hr"1
Ks = 325 mg/L BODY = 0.57
Kd = 2 .4x l0- 3 hr" 1
0 = 12 hrs = HRT0 C = 10 days = Sludge Age
a = 1.5 mg COD/mg MLVSSb = COD/BOD = 1.4Figure 7-18 Plot of values of inverse 0C vs U.

Step 2: Estimate the soluble BOD of thetreated effluent using the following relation-ship:
Note that this is soluble BOD, whichshould always be 10 mg/L or less if biologicaltreatment is reasonably complete. It wouldnot be uncommon that the total five-dayBOD would be in the range of 30 to 50 mg/Lfor a wastewater with a BOD as high as 1,714mg/L.
Step 3: Calculate reactor volume:
Step 4: Calculate required MLVSS concentra-tion:
Step 5: Calculate the recycle ratio if the con-centration of solids in the recycle is 20,000mg/L:
Therefore, Recycle Q = 0.84 x Influent Q
Step 6: Calculate solids generation rate:
Step 7: Calculate the oxygen consumptionrate:
Oxygen Demand
Volume x Time
Because the volume of the reactor is16,700 ft3:
The Role of Oxygen in WastewaterTreatmentAll forms of biological metabolism involvethe disassembly of organic compounds (thefood) and reassembly into new cell proto-plasm (growth) and waste products. Not allof the food can be converted to new cell pro-toplasm, however. It takes a certain amountof energy, in the form of chemical bondenergy, to assemble new protoplasm (i.e., tocomplete the chemical bonds that hold thecarbon, hydrogen, and other elemental unitstogether). The source of that energy is the

relatively high energy bonds in the moleculesof the organic matter used as food. Forinstance, when a molecule of glucose is disas-sembled to obtain energy to build proto-plasm material, carbon-carbon bonds arebroken with the consequent release of 60 to110 kcal/mole of bond energy, depending onwhich atoms are bonded to the carbon atombeing worked on.
Having obtained the energy from the car-bon-carbon bond (and other bonds the car-bon atoms were involved in), the organismhas no further use for the carbon atoms.These "waste" carbon atoms cannot simplybe discharged to the environment by them-selves, however. They must be attached toother atoms and discharged to the environ-ment as simple compounds. Since this proc-ess also requires energy, the "waste" com-pounds must be of lower bond energy thanthose of the food that was disassembled. Thebalance is then available for constructing newcell protoplasm.
The atoms to which the "waste" atoms arebonded are known as "ultimate electronacceptors." This name arises from the factthat the electrons associated with the wastecarbon atoms are paired with electrons of the"ultimate electron acceptor" in constructingthe molecule of waste substance.
The function of oxygen in cell metabolism(any cell—animal, plant, or bacterial) is thatof ultimate electron acceptor. If the source ofoxygen is molecular O2 dissolved in water,the process is termed aerobic; it is depicted inequation 7-40 (below).
Bacterial growth is not shown in equation7-40.
Notice that equation 7-40 shows thatunwanted hydrogen atoms from the "food"are wasted by attaching them to oxygen anddischarging them to the environment aswater (H2O).
If the source of oxygen is one or more dis-solved anions, such as nitrate (NO3) or sul-fate (SO4), and if there is no dissolved molec-ular oxygen present, the process is termedanoxic; it is depicted in equation 7-41(below).
Microbiological growth is not shown inequation 7-41.
If there is no oxygen present, either in themolecular O2 form or in the form of anions,the condition is said to be anaerobic. Underanaerobic conditions, cell metabolism takesplace as a result of substances other than oxy-gen functioning as the ultimate electronacceptor. Equation 7-42 depicts this type ofmicrobiological treatment.
organic matter + dissolved oxygen -»carbon dioxide + water
organic matter + sulfate anions —» carbon dioxide +hydrogen sulfide +methane
reduced organic compounds + CH4
(7-41)
(7-42)
(7-40)
The microorganisms involved in the proc-ess depicted by equation 7-42 are extremelyuseful in certain industrial waste treatmentapplications; for instance, treatment of sugarrefinery wastes and fruit processing wastes,which characteristically contain very lowquantities of nitrogen and phosphorus com-pared with the amount of BOD. In a properlydesigned and operated facultative lagoon(discussed further on in this chapter), inwhich there is enough mixing to maintainmovement of essentially all the liquid (toenhance contact between dissolved organicsand to reduce short-circuiting), but notenough aeration is applied to maintain morethan the upper two or three feet of the lagoonin an aerobic state, incoming dissolved BODis rapidly "sorbed" onto microbial cells,which eventually settle to the lagoon bottom.Then, within the sludge layers at the lagoonbottom, anaerobic degradation takes place,whereby the sorbed organics are metabo-lized, and new (anaerobic) bacterial cells areproduced as a result of bacterial "growth."The production rate of new cells, in terms ofpounds of new cells produced per pound oforganic matter treated (measured as BOD) issignificantly less than is the normal case foraerobic treatment. The advantageous result issignificantly less waste sludge requiring dis-posal.
As indicated in the parenthetical notes,equations 7-40, 7-41, and 7-42 show only theprocess of wasting excess carbon, hydrogen,and, in the case of equation 7-41, sulfuratoms, and do not include the growth proc-ess whereby some of the carbon, hydrogen,sulfur, nitrogen, and other atoms are reas-sembled to produce new cell protoplasm.These equations show only that the energyrecovered from some of the disassemblyprocess must be used to create bonds forwaste products, such as carbon dioxide,water, and other compounds or anions.
Biological Treatment TechnologiesFigure 7-20 presents an enumeration of theprincipal variations of biological methods of
wastewater treatment. As Figure 7-20 illus-trates, it is convenient to classify biologicaltreatment processes as either aerobic oranaerobic (notice that, as used in this sense,the term anaerobic includes both anoxic andanaerobic). Within each of those two majorcategories, there are two principal types ofsystems: suspended growth and attachedgrowth. The suspended growth systems allhave diverse populations of microbes sus-pended in a mixture of liquid that includesthe wastewater being treated. When the con-centration of microbes is relatively high, as inthe case of activated sludge, the mixture ofsuspended microbes, wastewater beingtreated, and other substances, both dissolvedand suspended, is referred to as "mixedliquor suspended solids" (MLSS). The termMLVSS is used to designate that portion ofthe MLSS that is active microbes (the V inthis term stands for "volatile"). That theMLVSS concentration is only an approximateindicator of the actual concentration ofactive microbes in a mixture of activatedsludge is discussed in Chapter 5.
Attached growth systems all have massesof microbes attached to a medium. Wastewa-ter to be treated flows in contact with thismedium and, especially, the attached micro-organisms. The microbes are able to accessthe organic matter in the wastewater as aresult of the wastewater flowing over,around, and through the media to which themicrobes are attached. The trickling filterand the rotating biological contactor arefamiliar examples of fixed-growth systems.
As explained earlier, aerobic wastewatertreatment systems require that dissolvedmolecular oxygen, as the molecule O2, bepresent and available to the microbes as theydisassemble organic pollutant molecules. It isconvenient to categorize aerobic wastewatertreatment systems according to their relative"intensity of treatment." A treatment systemof high intensity is one in which the concen-trations of both pollutants and microorgan-isms are high. Oxygen must be added in highquantity to maintain aerobic conditions, andthe system is said to be relatively highly
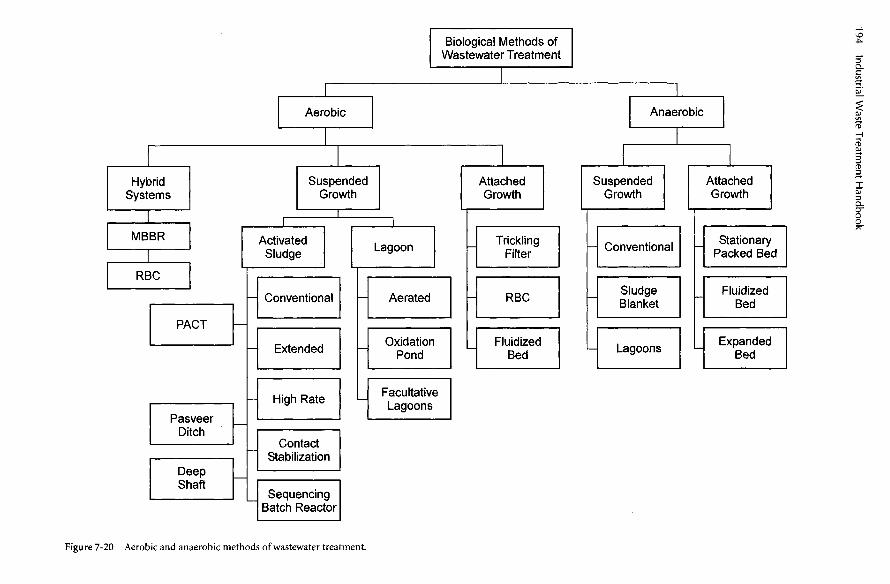
Biological Methods ofWastewater Treatment
Anaerobic
AttachedGrowth
SuspendedGrowth
StationaryPacked Bed
FluidizedBed
ExpandedBed
Conventional
SludgeBlanket
Lagoons
AttachedGrowth
TricklingFilter
RBC
FluidizedBed
Aerobic
SuspendedGrowth
Lagoon
Aerated
OxidationPond
FacultativeLagoons
ActivatedSludge
Conventional
Extended
High Rate
ContactStabilization
SequencingBatch Reactor
Figure 7-20 Aerobic and anaerobic methods of wastewater treatment.
HybridSystems
MBBR
RBC
PACT
PasveerDitch
DeepShaft

stressed. Aerobic biological treatment sys-tems range in intensity from high-rate acti-vated sludge, which has MLVSS concentra-tions as high as 10,000 mg/L and hydraulicretention times as low as a few hours, to verylow stressed aerobic or facultative nonaer-ated lagoons, which have MLVSS concentra-tions of less than 100 mg/L and hydraulicretention times of over 100 days. Figure 7-21presents an ordering of aerobic suspendedgrowth wastewater treatment systems, rang-ing from stabilization ponds to high-rateactivated sludge. Fixed-growth systems alsovary in treatment intensity, but normallyover a smaller range than suspended growthsystems.
Development of the most cost-effectivesuspended growth system is usually a matterof tradeoff between capital cost and opera-tion and maintenance (O&M) costs. Thepresent value of the total capital cost, spreadover the useful life of the facility, and the
O&M costs, also expressed as present value inorder to allow direct comparison, oftenchange in inverse proportion to each other.Low-intensity systems require larger tankageand more land area, but lower O&M costs interms of electrical power for aeration andlabor costs for operators. High-intensity sys-tems require more skilled operators and sig-nificantly more oxygen supplied by mechani-cal means but smaller tankage and land area.
Treatment of IndustrialWastewaters Using AerobicTechnologies
Suspended Growth Systems: ActivatedSludgeAn activated sludge wastewater treatmentsystem has at least four components, asshown in Figure 7-22: an aeration tank and asettling tank (clarifier); a return sludge
LOW mass loading of BOD, Ib BOD/lOOOft 3/day HIGH
Lagoon systems high rate systems
oxidationponds
aerobiclagoonfacultativelagoon
conventionalactivated sludge
high rateact. sludge
LOW
LOW
LOW
LOW
HIGH
relative intensity of treatment HIGH
HIGH
HIGH
HIGH
LOW
relative stress on treatment system
MLVSS concentration
% of aeration by artificial means
% of aeration from natural means
Figure 7-21 Distribution of various types of activated sludge treatment systems, based on treatment intensity, in terms ofmass loading of BOD (lbs/BOD/ft3/day).
Next Page

stressed. Aerobic biological treatment sys-tems range in intensity from high-rate acti-vated sludge, which has MLVSS concentra-tions as high as 10,000 mg/L and hydraulicretention times as low as a few hours, to verylow stressed aerobic or facultative nonaer-ated lagoons, which have MLVSS concentra-tions of less than 100 mg/L and hydraulicretention times of over 100 days. Figure 7-21presents an ordering of aerobic suspendedgrowth wastewater treatment systems, rang-ing from stabilization ponds to high-rateactivated sludge. Fixed-growth systems alsovary in treatment intensity, but normallyover a smaller range than suspended growthsystems.
Development of the most cost-effectivesuspended growth system is usually a matterof tradeoff between capital cost and opera-tion and maintenance (O&M) costs. Thepresent value of the total capital cost, spreadover the useful life of the facility, and the
O&M costs, also expressed as present value inorder to allow direct comparison, oftenchange in inverse proportion to each other.Low-intensity systems require larger tankageand more land area, but lower O&M costs interms of electrical power for aeration andlabor costs for operators. High-intensity sys-tems require more skilled operators and sig-nificantly more oxygen supplied by mechani-cal means but smaller tankage and land area.
Treatment of IndustrialWastewaters Using AerobicTechnologies
Suspended Growth Systems: ActivatedSludgeAn activated sludge wastewater treatmentsystem has at least four components, asshown in Figure 7-22: an aeration tank and asettling tank (clarifier); a return sludge
LOW mass loading of BOD, Ib BOD/lOOOft 3/day HIGH
Lagoon systems high rate systems
oxidationponds
aerobiclagoonfacultativelagoon
conventionalactivated sludge
high rateact. sludge
LOW
LOW
LOW
LOW
HIGH
relative intensity of treatment HIGH
HIGH
HIGH
HIGH
LOW
relative stress on treatment system
MLVSS concentration
% of aeration by artificial means
% of aeration from natural means
Figure 7-21 Distribution of various types of activated sludge treatment systems, based on treatment intensity, in terms ofmass loading of BOD (lbs/BOD/ft3/day).
Previous Page

pump; and a means of introducing oxygeninto the aeration tank. Wastewater, some-times pretreated and sometimes not, entersthe aeration tank (and is therefore the "influ-ent"); it is mixed with a suspension ofmicrobes in the presence of oxygen. Thismixture is referred to as "mixed liquor." Themicrobes "metabolize" the organic pollutantsin the wastewater, converting them to moremicrobes, carbon dioxide, water, and somelow-molecular-weight organics, as depictedin equation 7-35. After spending, on theaverage, an amount of time equal to thehydraulic residence time (0) in the aerationtank, the mixed liquor flows into the clarifier,where the solids (MLSS) separate from thebulk liquid by settling to the bottom. Theclarified "effluent" then exits the system. Thesettled solids are harvested from the clarifierbottom and are either returned to the aera-tion tank or are "wasted." The MLVSS solidsthat are returned to the aeration tank aremicrobes in a starved condition, having beenseparated from untreated wastewater for anextended period of time, and are thusreferred to as "activated." It is this process ofreturning microbes from the clarifier to theaeration tank that enables buildup of theirconcentrations to high levels (1,800 to 10,000mg/L), and that, indeed, characterizes theactivated sludge process itself.
The MLSS solids that are taken out of thesystem and therefore referred to as "wasted"represent the main means of controlling the"mean cell residence time" or "sludge age."
Sludge age is an extremely important param-eter in the successful operation of an acti-vated sludge treatment system. Activatedsludge systems that are maintained at a verylow sludge age, on the order of two days orso, will contain what is known as a veryyoung population, which is typically highlyactive and mobile and difficult to induce tosettle well in the clarifier. Activated sludgeswith somewhat longer sludge ages, between 7and 15 days, have many more microorgan-isms per unit of organic "food." They are,therefore, in a much more starved conditionthan a sludge of young sludge age and tend topredation and cannibalism. When foodbecomes very scarce, the microorganismsthemselves become food. The live bacteriaand fungi are food for higher life forms, andthose that die break apart and spew their cellcontents into the fluid medium, providingfood for other bacteria and fungi.
To defend themselves against predationand cannibalism, some microbial species areable to exude and surround themselves witha protective mass of polysaccharide material.In addition to affording protection, thisgelatinous material helps to flocculate themicrobes that make up the MLVSS, enablingbetter settling characteristics in the clarifier.
When the sludge age increases to over 20days or so, the microbes become so advancedin predatory behavior that they develop theability to manufacture enzymes that canbreak down the polysaccharide protectivematerial. The sludge thus loses its excellent
Figure 7-22 Basic components of an activated sludge system.
ReturnSludge Pumps
Waste
EffluentClarifie
AerationTank
Blower
Influent

flocculent nature and, consequently, its goodsettling characteristics.
The best settling activated sludge, andtherefore the system that produces the clear-est effluent, will be the system in which thegelatinous polysaccharide protective materialis maintained in optimum amounts.
In terms of treated effluent quality, theeffluent from activated sludge systems withvery low sludge ages is typically high in sus-pended solids; those with sludge ages ofaround ten days have low suspended solids,and those with a very high sludge age areoften very high in suspended solids.
An excellent tool for use in maintainingan optimum activated sludge culture (interms of treatment performance, settleability,and low concentration of solids in the efflu-ent) is the microscope. The usefulness ofmicroscopic examination of activated sludgeas an aid for process control can be explainedas follows.
Consider a container of fresh, biodegrad-able wastewater, inoculated with a "seed" of
activated sludge from a well-operating treat-ment system. The container is aerated, mixedwell, and provided with a steady supply ofbiodegradable organics, but at a rate that isslower than the growth rate of the microbialpopulation that develops. (Figure 7-22depicts such a system.) Initially, there is avery high concentration of "food" comparedwith the numbers of microorganisms. Underthis condition, bacteria will multiply at theirmaximum rate. Each individual bacterial cellwill "grow," and through the process ofbinary fission, become two cells within atime period corresponding to the maximumattainable growth rate of that particular spe-cies, which can be as short a time as 20 min-utes. A logarithmic increase in numbers ofthe fastest growing bacteria that can readilymetabolize the organics in the wastewatertakes place, and those bacteria dominate thepopulation during the first few hours. Exam-ination of a sample of the contents of thecontainer, using a microscope, will show thisto be the case.
Rel
ativ
e nu
mbe
rs o
f m
icro
orga
nism
s
Bacteria
Free-swimmingdilates
Suctoria
Stalked ciliates
Rotifers
Time
Sarcodina
Phytoflagellates
Zoo flagellates
Figure 7-23 Progressive growths and deaths of microorganisms in activated sludge.
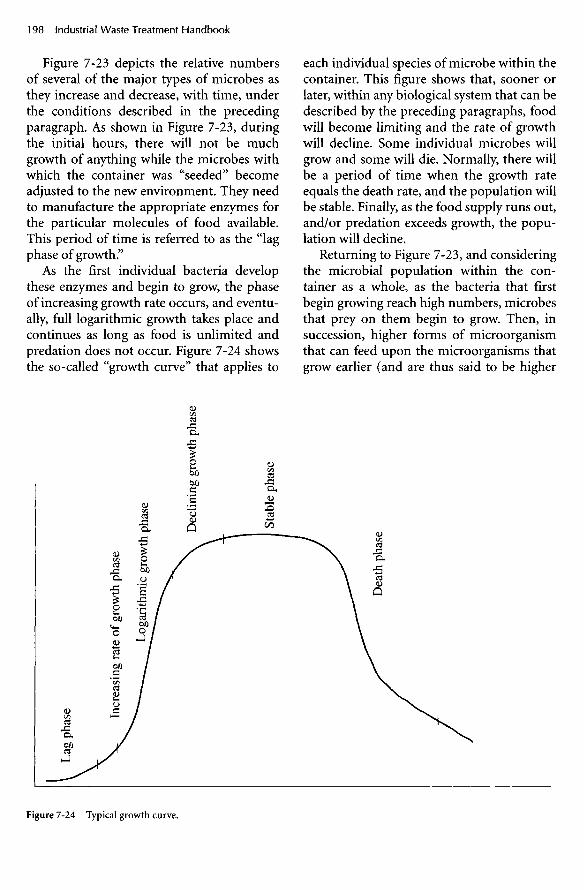
Figure 7-23 depicts the relative numbersof several of the major types of microbes asthey increase and decrease, with time, underthe conditions described in the precedingparagraph. As shown in Figure 7-23, duringthe initial hours, there will not be muchgrowth of anything while the microbes withwhich the container was "seeded" becomeadjusted to the new environment. They needto manufacture the appropriate enzymes forthe particular molecules of food available.This period of time is referred to as the "lagphase of growth."
As the first individual bacteria developthese enzymes and begin to grow, the phaseof increasing growth rate occurs, and eventu-ally, full logarithmic growth takes place andcontinues as long as food is unlimited andpredation does not occur. Figure 7-24 showsthe so-called "growth curve" that applies to
each individual species of microbe within thecontainer. This figure shows that, sooner orlater, within any biological system that can bedescribed by the preceding paragraphs, foodwill become limiting and the rate of growthwill decline. Some individual microbes willgrow and some will die. Normally, there willbe a period of time when the growth rateequals the death rate, and the population willbe stable. Finally, as the food supply runs out,and/or predation exceeds growth, the popu-lation will decline.
Returning to Figure 7-23, and consideringthe microbial population within the con-tainer as a whole, as the bacteria that firstbegin growing reach high numbers, microbesthat prey on them begin to grow. Then, insuccession, higher forms of microorganismthat can feed upon the microorganisms thatgrow earlier (and are thus said to be higher
Figure 7-24 Typical growth curve.
Lag
pha
se Incr
easi
ng r
ate
of g
row
th p
hase
Log
arit
hmic
gro
wth
pha
se
Dec
lini
ng g
row
th p
hase
Stab
le p
hase
Dea
th p
hase

on the food chain) go through their owngrowth curve process. In a biological treat-ment system, that succession is typically flag-ellated bacteria (bacteria equipped with a"tail" that propels them), free-swimming cil-iates, stalked ciliates, rotifers, and finallyworms. Microscopic examination of a sam-ple of the microbial population from a giventreatment system, then, can reveal the cur-rent stage of development of the system, interms of "young sludge" or "old sludge."
Experience has shown that, usually, opti-mum operation of activated sludge occurswhen the relative proportions of amoeboids,flagellated bacteria, free-swimming ciliates,stalked ciliates, and rotifers are as shown inthe middle of the bar graph presented in Fig-ure 7-25. Figure 7-25 shows that, when acti-vated sludge is in a young condition, the rela-tive numbers of flagellated bacteria and free-swimming bacteria are high, and there arealmost no stalked ciliates. The effluent fromthe secondary clarifier will be high in sus-pended solids, and many of those solids willconsist of long, thin bits and pieces of ill-formed activated sludge, referred to as"stragglers." The cure for this condition is todecrease the food-to-microorganism ratio bywasting less sludge and allowing the concen-tration of MLVSS in the aeration tank toincrease.
Figure 7-25 shows further that when therelative proportions of rotifers, stalked cili-ates, and nematodes become high comparedwith the flagellated bacteria and free-swim-ming ciliates, there will again be high solidsin the effluent from the secondary clarifier.In this case, the solids will appear as tiny,more or less spherical bits and pieces of acti-vated sludge, referred to as "pin floe." Thecure for this condition is to increase the rateof sludge wasting, thus increasing the food-to-microorganism ratio.
Unfortunately, it is not always the casethat adjusting the rate of sludge wasting willcure problems of high suspended solids inthe treatment system effluent. Conditionsother than sludge age that can affect effluent
quality are: concentration of dissolved oxy-gen in the aeration tank, degree of mixing,the changing nature of the influent to theaeration tank, temperature, and the presenceof toxic materials. High numbers of filamen-tous organisms within the activated sludgecommunity, as explained in the section enti-tled "Selectors," is a common cause of pooreffluent quality.
SelectorsAmong the most common problems associ-ated with activated sludge treatment systemsis the poor settling of the activated sludgeitself, referred to as "bulking sludge," causedby the presence of so-called "filamentous"microorganisms. Filamentous microorgan-isms, sometimes called "filaments," are char-acterized by long strands of "hair-like fila-ments." A small amount of these microbes isgood to have, since they help to produce clar-ity in the effluent, but too many lead to anunacceptably slow settling rate.
There are three principal causes for thedevelopment of excess numbers of filamen-tous microbes within an activated sludge sys-tem: (1) low concentrations of nutrients,especially nitrogen and/or phosphorus; (2)low levels of dissolved oxygen, eitherthroughout the aeration tank or in pocketswithin the aeration tank (resulting frominadequate mixing); and (3) low levels oforganic loading (low food-to-microorganismratio, F/M). So-called "selectors" have beenproven to be very effective in preventing thedevelopment of dominant populations of fil-amentous microorganisms.
A selector is a device that has the purposeof counteracting the third of these causes. Itis basically a chamber in which the activatedsludge experiences high F/M conditions fora period of time that is short compared withthe time spent in the aeration tank. Underthe high F/M conditions, the "good"microbes out-compete the bad (filamentous)microbes, preventing their growth. In thehigh F/M environment, the nonfilamentousmicrobes adsorb most of the dissolved
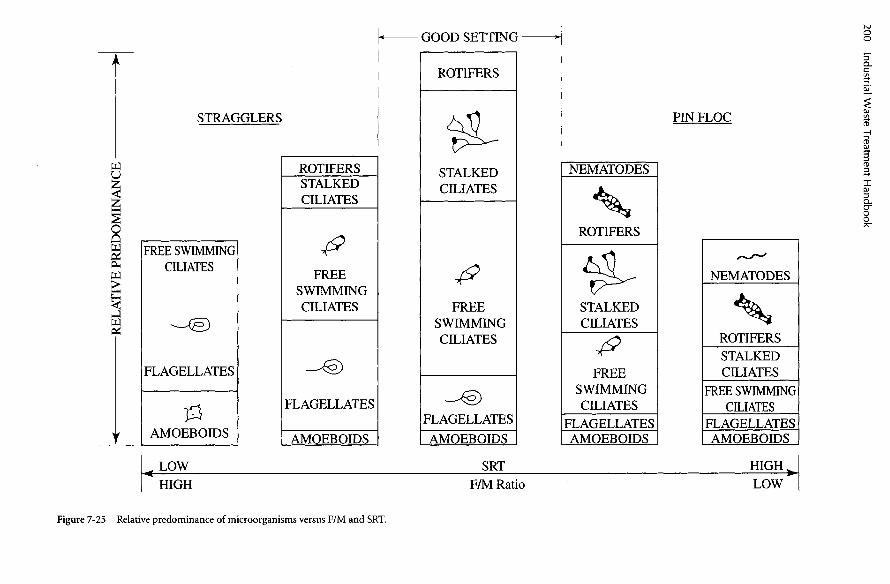
RE
LA
TIV
E P
RE
DO
MIN
AN
CE
Figure 7-25 Relative predominance of microorganisms versus F/M and SRT.
LOW
HIGH
AMOEBOIDS
FLAGELLATES
FREE SWIMMINGCILIATES
STRAGGLERS
ROTIFERSSTALKEDCILIATES
FREESWIMMINGCILIATES
FLAGELLATES
AMOEBOIDS
F/M RatioSRT
AMOEBOIDS
FLAGELLATES
FREESWIMMINGCILIATES
STALKEDCILIATES
ROTIFERS
GOOD SETTING
PIN FLOC
NEMATODES
ROTIFERS
STALKEDCILIATES
FREESWIMMINGCILIATES
FLAGELLATESAMOEBOIDS
HIGHLOW
AMOEBOIDSFLAGELLATES
FREE SWIMMINGCILIATES
STALKEDCILIATES
ROTIFERS
NEMATODES

Figure 7-26 Variations in selector configuration.
organics, leaving insufficient food for the fil-amentous organisms in the more dilute envi-ronment of the aeration tank.
The most common type of selector is atank of 10 to 30 minutes' hydraulic retentiontime, completely mixed, in which returnsludge and untreated wastewater are com-mingled before proceeding to the aerationtank. This tank can be separate from the aer-ation tank, or it can be a compartmentwithin the aeration tank. Often, the latter canbe done at lower construction cost. Figure7-26 shows several variations of constructionof selectors.
Selectors can be aerobic, anoxic, or anaer-obic but must always be mixed well. There-fore, a selector should be equipped with bothmechanical mixing and aeration, in order toprovide the flexibility to operate aerobicallyor otherwise, as experience indicates whichproduces the best results.
Variations of the Activated SludgeProcessActivated sludge is essentially a biologicalwastewater treatment process in whichmicroorganisms feed upon waste organicmatter in an aeration tank; grow in numbersas a result; are separated from the treatedwastewater in a clarifier that follows, hydrau-lically, the aeration basin; and are thenreturned to the aeration basin in a starvedcondition in order to greatly increase the
numbers of microorganisms in the aerationtank. The basic process is extremely flexibleand capable of many different configura-tions. Table 7-12 lists nine alternative config-urations and presents comments regardingthe characteristics and appropriate use ofeach.
Conventional Plug FlowIf there is a standard of reference for the acti-vated sludge wastewater treatment process, itis the conventional plug flow system. How-ever, conventional plug flow is by no meansthe most common variation of biologicaltreatment systems used for industrial wastes.Figure 7-27 presents a schematic of conven-tional plug flow. Table 7-12 notes severalimportant features or characteristics that dis-tinguish this system from other variations ofthe activated sludge process. As shown inFigure 7-27 and noted in Table 7-12, themost outstanding characteristic of plug flowis the long, narrow pathway the wastewatermust traverse in flowing from the inlet to theoutlet of the aeration tank. The reason forthis is to ensure that the microbes, havingentered the aeration tank as return sludge atthe tank inlet, have sufficient time to be incontact with the organic matter contained inthe volume of wastewater they originallymixed with, in order that as little mixedliquor as possible gets through the tank in aperiod of time shorter than the theoretical
(a) Tank of 10-30 min,hydraulic retentiontime, located withinaeration tank
(b) Tank of 10-30 min,hydraulic retentiontime, located outsideaeration tank

Table 7-12 Variations of the Activated Sludge Process
Process Variation
Conventional Plug Flow
Conventional Complete Mix
PACT Process
Extended Aeration
High Rate Aeration
Contact Stabilization
Sequencing Batch Reactor
Pasveer Ditch
Deep Shaft
Comment
Aeration tanks are long and narrow to minimize short-circuiting. Operational parametersrange as follows: HDT: 4-6 hrs, F/M: 0.3-0.6; MCRT: 7-14 days, F/M is high at head oftank, low at effluent end.
Aeration tanks square or circular, concentration of substances everywhere equal to con-centration in effluent; shock effects minimized; operational parameters as for conventionalplug flow.
Aeration tanks either plug flow or complete mix. Powdered activated carbon added to aer-ation tank to remove nonbiodegradable organics. Operational parameters as for othervariations.
Aeration tanks as for either plug flow or complete mix; sludge wasting rate low; MCRT: 20days or more; MLVSS: 1,200-2,500 mg/L; F/M: 0.05-0.1; hydraulic retention time: 20hours or more.
Aeration tanks as for complete mix; F/M: 0.8-1.2; MLVSS: 5,000-10,000 mg/L, aerationrate very high, HRT: 3-6 hrs; MCRT: 15-25 days.
Influent enters contact tank. HRT: 30 min, conventional clarifier removes MLVSS, returnsludge to stabilization tank (similar to plug flow or complete mix); MLVSS: 3,000-6,000mg/L; HRT: 3-8 hrs, discharge from stabilization tank mixed with influent prior to contacttank.
Aeration tank as for complete mix, operational parameters as for conventional, aerationtank and clarifier are one and the same.
Aeration tank unique configuration, see description. Operational parameters similar toconventional plug flow.
Aeration tank unique configuration, see description. Operational parameters similar toconventional plug flow.
RAW WASTEWATEROR
PRIMARY EFFLUENT
AERATIONTANK
SECONDARYCLARIFIER
SLUDGE
Figure 7-27 Basic flow pattern of the conventional plug flow variation of the activated sludge process.

(a) Horizontal Flow Baffles
Figure 7-28 Baffle arrangements in a flow-through tank.
detention time. An important design objec-tive, then, is to minimize short-circuiting.
Several different approaches have beenused to create a long, narrow flow paththrough the aeration tank. The most com-mon approach has been to make use of baf-fles in a rectangular tank, as shown in Figure7-28(a, b). However, research has shown thatbaffles create dead volumes, as depicted inFigure 7-29. Figure 7-29 shows that as themixed liquor flows from the inlet to the out-
(b) Over-and-Under Baffles
let, dead volumes exist in the regions of cor-ners and wherever flow proceeds around theend of a baffle. The undesirable effects of thedead volumes are (1) reduction of the work-ing volume of the aeration tank, with conse-quent reduction of actual hydraulic retentiontime (HRT); and (2) development of anaero-bic conditions in the dead volumes, withconsequent bad odors and development offilamentous bacterial populations.
ELEVATION VIEWPLAN VIEW
DEADVOLUMES(TYP)
Figure 7-29 "Dead volume" in a baffled, flow-through tank.
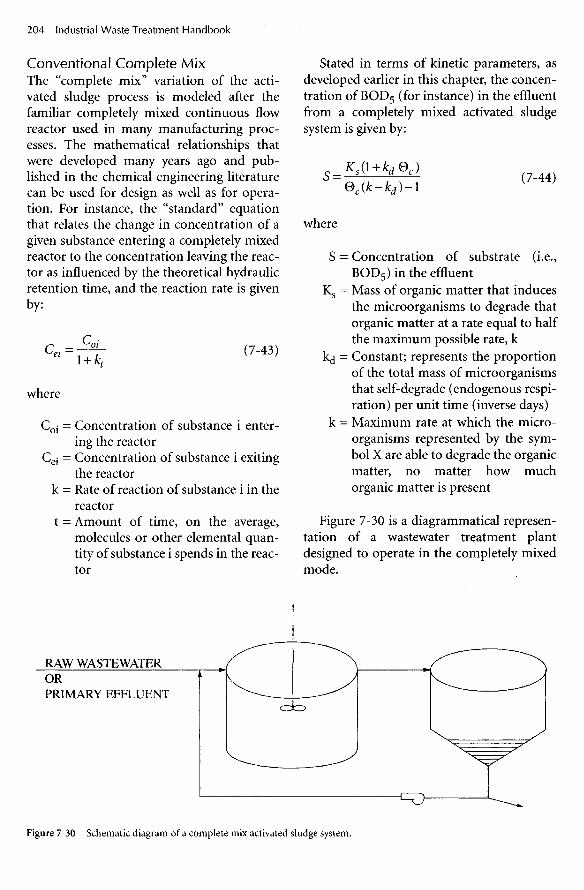
Conventional Complete MixThe "complete mix" variation of the acti-vated sludge process is modeled after thefamiliar completely mixed continuous flowreactor used in many manufacturing proc-esses. The mathematical relationships thatwere developed many years ago and pub-lished in the chemical engineering literaturecan be used for design as well as for opera-tion. For instance, the "standard" equationthat relates the change in concentration of agiven substance entering a completely mixedreactor to the concentration leaving the reac-tor as influenced by the theoretical hydraulicretention time, and the reaction rate is givenby:
(7-43)
where
Coj = Concentration of substance i enter-ing the reactor
Cej = Concentration of substance i exitingthe reactor
k = Rate of reaction of substance i in thereactor
t = Amount of time, on the average,molecules or other elemental quan-tity of substance i spends in the reac-tor
where
S = Concentration of substrate (i.e.,BOD5) in the effluent
Ks = Mass of organic matter that inducesthe microorganisms to degrade thatorganic matter at a rate equal to halfthe maximum possible rate, k
kd = Constant; represents the proportionof the total mass of microorganismsthat self-degrade (endogenous respi-ration) per unit time (inverse days)
k = Maximum rate at which the micro-organisms represented by the sym-bol X are able to degrade the organicmatter, no matter how muchorganic matter is present
Figure 7-30 is a diagrammatical represen-tation of a wastewater treatment plantdesigned to operate in the completely mixedmode.
Stated in terms of kinetic parameters, asdeveloped earlier in this chapter, the concen-tration OfBOD5 (for instance) in the effluentfrom a completely mixed activated sludgesystem is given by:
RAW WASTEWATERORPRIMARY EFFLUENT
Figure 7-30 Schematic diagram of a complete mix activated sludge system.
(7-44)

One of the major differences between theconventional plug flow system and the com-plete mix system is in regards to short-cir-cuiting. In the plug flow variation, the objec-tive of both design and operation is to keepshort-circuiting to an absolute minimum. Aslittle as possible of the incoming pollutantsshould reach the effluent in amounts of timeshorter than the theoretical hydraulic reten-tion time, calculated by dividing the volumeof the tank by the flow rate. In the case of thecomplete mix system, the objective is tomanage short-circuiting, recognizing that acertain quantity of the pollutants will reachthe effluent almost immediately after enter-ing the aeration tank.
Figure 7-30 illustrates that when an incre-mental volume of flow enters the reactor, it isimmediately dispersed throughout the reac-tor. The effluent, at any instant in time, issimply an instantaneous sample of the com-pletely mixed contents of the reactor. There-fore, the concentration of any given sub-stance in the effluent will be the same as itsconcentration in the reactor, and the effluentnecessarily contains a small amount of unre-acted substance.
The primary advantages, then, of thecomplete mix variation of the activatedsludge process, are:
1. Slug doses of any given constituent arequickly diluted to the maximum extentafforded by the aeration tank.
2. The amount of short-circuiting, andtherefore the amount of unreacted pol-lutant, can be controlled in a direct man-ner by manipulation of the flow rate (fora given volume of aeration tank) anddetermined by calculation.
The complete mix variation of the acti-vated sludge process is often favored forapplication to industrial wastewaters, largelybecause of its ability to dilute slug doses ofsubstances and to withstand periodicchanges in wastewater characteristics due tochanges in activity within the manufacturingplant. Either diffused or mechanical aeration
can be used, and in some cases, when theconcentration of substances to be treated islow (relatively, volume of aeration tank ishigh), a combination of mechanical mixingdevices plus diffused or mechanical aerationis the least expensive system.
The PACT Modification of ActivatedSludgeThe PACT modification of the activatedsludge process is a proprietary process thatwas developed during the mid-1970s to solveproblems that related to the nonbiodegrad-ability of certain synthetic organics. ThePACT process is essentially one of the famil-iar variations of the activated sludge process,with the additional feature that powderedactivated carbon is added to the aerationtank. (PACT is an acronym for "powderedactivated carbon technology") The activatedcarbon is incorporated into the MLSS for thepurpose of adsorbing organics that are dis-solved in the wastewater. The activated car-bon will adsorb almost any organic, whetherbiodegradable or not, but the adsorbed bio-degradable organics tend to be removed bymicrobial action, while the nonbiodegrad-able organics do not. The result is that theactivated carbon becomes saturated withnonbiodegradable organics and eventuallymust be removed from the system. Figure7-31 shows, diagrammatically, the PACTmodification of activated sludge in the com-plete mix mode.
Since the powdered activated carbon isincorporated into the MLSS within the acti-vated sludge system, it is removed as a conse-quence of the normal sludge wasting done tocontrol the mean cell residence time (sludgeage). The wasted sludge can then be inciner-ated to reduce the volume of excess biologicalsolids and, at the same time, regenerate theactivated carbon. Experience has shown thatabout 20% of the adsorptive capacity of theactivated carbon is lost with each regenera-tion; therefore, continual makeup with newactivated carbon is required.

FRESHACT. CARBON
MAKEUP
PRIMARYEFFLUENT
Figure 7-31 PACT modification of the activated sludge process, complete mix configuration.
WASTETODISPOSALORREUSEAT
ANOTHER FACILITY
CARBONREGENERATED REGENERATION
FURNACE
SLUDGEDEWATER,
DRY
EFFLUENT
SECONDARYCLARIFIERS
AERATION TANKS

The appropriate quantity of powderedactivated carbon must be determined, first bylaboratory experimentation and then byoperating experience. To prevent discharge ofexcessive nonbiodegradable organics duringstartup and during the first few weeks ofoperation of a PACT system, an excessivequantity of activated carbon should beadded, then the concentration reduced grad-ually until one or more of the target sub-stances begins to be detected.
Predictive Mathematical Model of thePACT ProcessA predictive mathematical model that can beused to analyze laboratory-scale pilot data todevelop design parameters for a full-scalePACT system is presented as follows.
The parameters needed to design the bio-logical portion of the PACT process are thesame as for ordinary activated sludge—namely, the coefficients Y, kd, k, and Ks, asexplained previously. Furthermore, the labo-ratory procedures used to develop values forthese parameters are the same as presentedabove—namely, the use of "block aerators"and the daily monitoring of food in, food out,sludge growth, and oxygen utilized. In the caseof the PACT process, however, it is necessaryto determine and then subtract the influencesof organic matter removed and daily sludgeincrease, in order to determine those valuesthat were due to biological activity.
Extended Aeration Activated SludgeThe extended aeration modification of acti-vated sludge has the design objective of lowercosts for waste sludge handling and disposal,at a sacrifice of higher capital costs due tolarger tankage and more land area per unit ofBOD loading. There may be a savings inO&M costs resulting from a lower level ofintensity required from the operators, butthere is an increase in the amount of oxygenrequired per pound of BOD in the influent,due to the increased amount of autooxida-tion (there is some increase in aeration via
the surface of the aeration tank, due to thelarger surface area). The reduction inamount of wasted sludge to be disposed ofper pound of BOD removed results from theincrease in autooxidation (use of the con-tents of the cells of dead microbes for food)because of a longer sludge age. Table 7-12shows the range of values for F/M loading,hydraulic detention time, sludge age, andMLVSS concentrations appropriate to theextended aeration modification of the acti-vated sludge process.
High-Rate Modification of ActivatedSludgeThe high-rate modification of the activatedsludge process is simply one of the previouslydescribed modifications (plug flow, completemix, or other) in which the MLVSS concen-tration is maintained at a significantly higherconcentration than is normal for conven-tional processes, and hydraulic retentiontime is significantly shorter than "normal."The high-rate process can be used to treatreadily biodegradable wastes such as fruitprocessing wastewaters, but effective equal-ization is required to prevent short-termchanges in waste characteristics.
Advantages of the high-rate process are itseffectiveness in overcoming the problem ofthe tendency toward bulking due to domi-nance of filamentous organisms in completemix systems, as well as its lower constructioncosts due to smaller tankage. Disadvantagesinclude relatively intense operational controlrequirements, as well as relatively large quan-tities of waste sludge due to less autooxida-tion.
Contact Stabilization Modification ofActivated SludgeThe contact stabilization modification differsfrom the conventional process in that theactivities that normally take place in the aera-tion tank (adsorption of substances onto themicroorganisms, then metabolism or con-version of these substances to more micro-

organisms plus waste products) are sepa-rated. As shown in Figure 7-32, the untreatedwastewater is mixed with return sludge in arelatively small "contact tank." It is here thatthe rapid process of pollutant adsorptiontakes place. The mixture then moves on to anaeration tank or "stabilization tank" wheremicrobial metabolism takes place. The aera-tion tank is also relatively small comparedwith conventional activated sludge, sinceonly the sludge, after separating from thebulk liquid in the clarifier, proceeds to theaeration tank. The bulk liquid is either dis-charged from the clarifier as final effluent oris subjected to further treatment, such as dis-infection, sand filtration, or other process. Itis because only the sludge (with its load ofadsorbed organic material) proceeds to theaeration tank that the energy requirementsfor mixing are lower.
The principal advantage of contact stabili-zation is the lower capital cost due to smallertankage. However, this modification is usefulonly on wastes that are rapidly adsorbed. Ingeneral, those wastes are characterized by ahigh proportion of dissolved, relatively sim-ple, organics.
Sequencing Batch Reactor Modificationof the Activated Sludge ProcessThe sequencing batch reactor process (SBR)is a modification of complete mix activatedsludge. As diagrammed in Figure 7-33, thetwo principal sequential processes of acti-vated sludge, aeration and settling, take placein the same tank. Settling occurs after suffi-cient aeration time for treatment has takenplace, after turning off all aeration and mix-ing. Then, clarified supernatant is decanted;the reactor is refilled with fresh, untreatedwastewater; and the cycle is repeated. Wastesludge is withdrawn immediately after thereact phase has been completed.
An SBR is normally operated in sixsequential stages, or phases, as follows:
1. Fill phase. The reactor is filled until thedesired food-to-microorganism (F/M)ratio has been reached.
2. React phase. The reactor is mixed andaerated. Treatment takes place.
3. Sludge wasting phase. A quantity ofmixed liquor that corresponds to thequantity of solids, on a dry basis, is with-drawn from the completely mixed con-tents of the reactor. For instance, if a ten-
Figure 7-32 Schematic of contact stabilization modification of activated sludge.
W a s t eSludge
Clarifier
Effluent
PreliminaryEffluent
R a w or ContactTank
AerationTank

Figure 7-33 Schematic of sequencing batch reactor process.
day sludge age is desired, one-tenth ofthe volume of the reactor is withdrawneach day.
4. Settle phase. Aeration and mixing are ter-minated, and the reactor functions as aclarifier.
5. Decant phase. Clarified, treated wastewa-ter is withdrawn from the top one-quar-ter to one-third of the reactor.
6. Idle phase. The system can be mixed andaerated at a low rate for a few days at atime needed between periods of wastegeneration.
There are several modifications to thebasic procedure outlined previously. Forinstance, it has been found advantageous insome cases to either mix, aerate, or bothwhile filling is taking place. In these cases, thefirst one or two stages are referred to as the"mixed fill phase" followed by the "react fillphase" (phases land 2) or just "the react fillphase" (phase 1). Also, some operators havefound it acceptable to waste sludge from thebottom of the reactor after settling has takenplace. While this practice results in handlingless water with the waste sludge, it does notensure the removal of the same fraction ofthe active microbial solids each day, as does
the practice of wasting a certain fraction ofthe mixed reactor contents each day.
Among the several important advantagesof the SBR process is its capability of extend-ing the react phase for as long as is necessaryto achieve the desired degree of treatment. Inthis respect, it is good design practice to haveat least two parallel SBR units, each of at leasthalf the design capacity. In the absence of aparallel unit, a collection tank, designed andoperated as an equalization basin, can receiveand store wastewater until the SBR unit isable to receive more wastewater.
With two parallel SBR units, the followingtroubleshooting procedures are available tothe operator:
1. If one of the units receives a large slugdose, the second unit can be used to per-form double duty while the first unit isallowed to continue to react until thesupernatant is suitable for discharge.
2. If one of the SBR units becomes upsetdue to toxicity or any other reason, thesecond unit can be placed in "double-duty mode." Then the contents of theupset unit can be bled into the operatingunit at as slow a rate as is necessary forcomplete treatment as well as recovery ofthe upset unit to take place. During
OrPrimary
EffluentIn
Aerators
Raw
Low Level
(React)
High Level
DecantSystem
DecantPump
EFR

extended periods of low waste genera-tion, such as for yearly maintenanceshutdown of the processing plant, all theMLSS can be placed in one of the SBRunits. It can then be "fed" a smallamount of synthetic waste to maintainviability of the microbes.
3. As is the case for duplicate systems of anyunit process, one can be used for treat-ment while the other is emptied formaintenance.
In short, the operator has more flexibilityand control with SBR technology than withflow-through technology. Any or all of thecycle stages can be lengthened or shortenedto achieve desired treatment. The "idlephase" allows taking up the slack between thetotal lengths of time of the other five phasesand the 24-hour day.
SBR technology has successfully, and verycost effectively, been used for removal ofnitrogen (by the nitrification-denitrificationprocess). It has also, but less frequently, beenused to remove phosphorus.
The nitrification-denitrification processcan be incorporated into the operation of anSBR system as follows:
1. Allow nitrification (conversion ofammonia and organically bound nitro-gen to nitrate ions, NO2") to take placeduring the react phase by:
a. maintaining dissolved oxygen (DO)level above 2 mg/L
b. maintaining the temperature withinthe reactor higher than 17°C
c. maintaining sufficient react time
If these conditions are maintained, and ifthere are no substances in the wastewaterthat are toxic to the nitrosomonas species,nitrification of the ammonia released fromthe organic matter in "treating" the BOD willtake place. Then, denitrification (conversionof the nitrate ions to nitrogen gas) can beinduced:
2. Discontinue aeration, but maintain mix-ing after the react phase.
During this period, the contents of thereactor will become anoxic. Facultative bac-teria (nitrobacter) will continue to oxidizeorganic matter (BOD) and will use the oxy-gen atoms from the nitrate ions for an elec-tron acceptor.
There are tricks to achieving successfulnitrification-denitrification, as well asdesired BOD removal, using SBR technology.One trick is to maintain the proper amountsof time for each phase. Another is to managethe amount of BOD remaining after the reactcycle (by addition of methanol, if necessary)so there is enough to support the denitrifica-tion process but not enough to cause non-compliance.
SBR technology can be used to achieve alower quantity of phosphorus in the indus-trial waste discharge, but only with the suc-cessful application of more operator skillthan for ordinary operation. Some phospho-rus will always be removed with the wastesludge, since all animal and plant cells con-tain phosphorus. The microbial cells of theactivated sludge can be induced to take upmore than the normal amount of phospho-rus (referred to as "luxury uptake of phos-phorus"). If this is done successfully, morephosphorus than normal will be includedwith each pound of waste sludge. The proce-dure for inducing luxury uptake of phospho-rus in an SBR system is as follows:
1. Allow anaerobic conditions to developwithin the contents of the reactor by theabsence of aeration during the fill cycle.As soon as the small amount of nitratethat is contained in the MLSS at thispoint has been used up for its oxygen(electron acceptor) content, anaerobicconditions result. At this point, the high-energy phosphate bonds in the organ-isms are broken as an energy source,allowing them to out-compete otherorganisms. Once the air is turned backon and conditions become aerobic,

acenitobacter (and other organisms thatperform the "luxury phosphorusupdate") store excess phosphorus in theform of high-energy phosphate bonds.This energy source then allows them toout-compete other organisms for VFA(food) uptake when the anaerobic cycleis repeated. This is a "selection" processthat favors organisms that release phos-phorus in the anaerobic phase anduptake excess phosphorous in the aero-bic phase.
2. Allow sufficient time during and possi-bly after the fill phase for the "luxuryuptake" of phosphorus to take place tothe maximum. Experimentation that iscarefully controlled, with observationsrecorded, is required.
3. Conduct the sludge-wasting phase at thispoint, or from the settled sludge after thesettling phase. An advantage to wastingthe sludge at this point is sludge age iseasily controlled. For example, wasting1/20 of the volume of the reaction tankeach day yields a 20-day sludge age. Theadvantage to wasting from the settledsludge is that less volume is handled;however, the calculations of sludge con-centration and volume can be lengthy.
4. Begin aeration and, consequently, thereact phase.
The contents of the reactor should be wellmixed, in order to maintain contact betweenthe microbes and the dissolved phosphateions, throughout steps 1 through 4.
Procedure for Design of an SBR SystemThe following procedure can be used todesign an SBR wastewater treatment system.In all instances where the word "select"appears, the design engineer must have avail-able either extensive experience with thewastewater in question or the results ofextensive laboratory and/or pilot treatabilitystudies.
1. Select a hydraulic retention time.2. Select an F/M loading.
3. Obtain the kinetic coefficients:4. Select a value for the concentration of
settled sludge.5. Select a value for the specific gravity of
the settled sludge.6. Determine how much of the reactor will
be decanted during the decant phase.7. Select a depth of liquid (working depth).8. Determine nutrient requirements.9. Estimate, using the following calcula-
tion, the concentration of soluble BODin the effluent:
(7-45)
(7-46)
The result of performing several trialsto balance a desired value for 0C and theresulting value of Se will produce thedesign value for 0C.
10. Compute the mass of MLVSS required:
11. Select a desired range for MLVSS con-centration.
12. Calculate the size of the reactor, balanc-ing the required volume for the desiredHRT, the required volume to achieve thedesired MLVSS concentration (takinginto consideration the calculated MLVSSmass required), and the volume neededto decant the desired volume each day.
Pasveer Oxidation Ditch and VariationsDuring the 1930s, Pasveer invented the"brush aerator," which consisted of a cylin-drical street brush immersed to about 20% ofits diameter in the mixed liquor of an acti-vated sludge aeration tank. Figure 7-34 illus-trates how, when the brush was rotated, itwould throw droplets of the mixed liquorinto the air, thus accomplishing aeration asoxygen molecules from the air dissolved inthe water droplets. As with other mechanicalaeration devices, the very large surface-to-

Figure 7-34 Pasveer's "brush aerator."
volume ratio of the very large number ofwater droplets provided for effective dissolu-tion of oxygen into the water. This inexpen-sive aerator was combined with an innova-tive aeration basin to produce a cost-effectiveextended aeration activated sludge treat-ment system. Figure 7-35 shows that the aer-ation basin was built in the shape of an oval,similar in appearance to a race track. One ormore brush aerators were placed so as toaccomplish both aeration, by throwing drop-lets of mixed liquor (MLSS plus the bulk liq-uid) into the air, and mixing, by causing themixed liquor to flow around and around theoval basin. In addition, a high degree of dis-
solution of oxygen into the mixed liquorthrough the liquid surface was accomplished.The movement of the mixed liquor, inducedby the brush aerator, kept the mixed liquormixed and continually renewed the surfacewith unaerated mixed liquor. Since the aera-tion basin was simply an oval ditch, con-struction cost was small, and since the sur-face-to-volume ratio of the mass of mixedliquor was high, surface aeration accountedfor a large fraction of the total; thus, the costfor aeration was low. The system came to beknown as the "Dutch Ditch," acknowledgingPasveer's nationality as well as the materialsof construction of the aeration basin.
Rotating AeratorRaw or Primary
Effluent Effluent
Figure 7-35 Schematic of Pasveer oxidation ditch.

Since Pasveer's time, several variations tohis basic ideas have been developed. In somecases, the earthen basin has been replacedwith other materials of construction, includ-ing concrete, asphalt, plastic membrane, andsteel. A number of devices have been used inplace of the brush aerator. All such systems,however, have in common the high surface-to-volume ratio afforded by the shallow,oval-type aeration tank configuration,enabling relatively low cost for aeration andmixing.
Deep Shaft AerationTwo perplexing problems with activatedsludge treatment systems in general, andextended aeration systems in particular, are(1) the characteristically low efficiency oftransfer of oxygen from the air supplied, toactual use by the microorganisms (typically2% to 15%), and (2) the relatively large landarea required. In the case of conventionalextended aeration systems, which attempt toreduce operation costs by autooxidatingsludge rather than having to dispose of it bylandfilling, the more extended the aeration,the more land area is required. The deepshaft aeration system was developed to solve,or significantly diminish, these two prob-lems.
With respect to low efficiency of oxygentransfer, one of the basic causes is the lowdriving force for dissolution of oxygen,which, as explained earlier, is simply the dif-ference between the saturation concentrationin the mixed liquor and the concentrationthat actually exists. This driving force can beincreased in direct proportion to the value ofthe saturation concentration for any givenvalue of the actual concentration. The satu-ration concentration can be increased indirect proportion to the pressure of oxygenin the gas volume that is in contact with themixed liquor, and this pressure can beincreased in direct proportion to the depthbeneath the surface of the aeration basin atwhich bubbles of gas containing oxygen exist.These facts led to the realization that if an
aeration basin were configured as a very longU-tube of small diameter, and if this U-tube-shaped basin were oriented vertically so as toattain very high hydraulic pressure at thebottom, due to the very deep column of liq-uid above it, the saturation concentration ofoxygen would be many times higher thanusually experienced with activated sludge.The result would be a driving force manytimes greater, and transfer efficiency wouldincrease accordingly. Thus, the deep shaftaeration system, shown diagrammatically inFigure 7-36, was developed.
Figure 7-36 shows a "deep shaft aerationsystem" consisting of a 20-foot diameter bor-ing into the earth, similar to a mine shaft. Apartition separates the shaft into two com-partments. Raw or, in some cases, pretreatedwastewater enters the compartment on theleft and is drawn down toward the bottom ofthe shaft by a small difference in hydrostatichead between the two sides. Air bubbles areblown into the compartment containing"fresh" wastewater, only a few feet below thesurface. Thus, the pressure against which theblowers work to force air into the mixedliquor is small. These air bubbles are carrieddown to the bottom of the shaft with themixed liquor because the velocity of the fluidtoward the bottom of the shaft is greater thanthe rise rate of the bubbles. As the bubblesare carried deeper into the shaft, the hydro-static pressure becomes greater; thus, thepressure within the bubbles becomes greater.The greater pressure in the bubbles causesthe saturation concentration of oxygen in themixed liquor to increase proportionately;thus, the driving force for dissolving oxygeninto water increases.
Pressure does not influence microbialactivity; therefore, the bacteria and othermicrobes throughout the full depth of theshaft can utilize the oxygen within the airbubbles that were introduced into the mixedliquor under low-pressure conditions. Theresult is a profound increase in the efficiencyof transfer of oxygen.

Figure 7-36 Schematic of deep shaft treatment system.
Membrane Bioreactor Modification ofthe Activated Sludge ProcessThe membrane bioreactor (MBR) modifica-tion of the activated sludge process has theobjectives of (1) decreasing the tank volumenecessary to accomplish treatment by pro-viding an environment where very high con-centrations of bacteria can thrive, and (2)eliminating reliance on gravity clarification.These improvements come at the expense ofcapital and operating cost of a membrane fil-tration system, which requires periodiccleaning to maintain transmembrane pres-sure and effective filtration. Another benefitof this system is that the concentrated massof mixed liquor can manage fluctuating
loads, and the membrane filtration processallows all the mixed liquor to be capturedand maintained in the aeration tank.
A number of manufacturers have intro-duced membrane systems to the market-place. Figures 7-37, 7-38, and 7-39 showthree fundamentally different configurations.
Each of these systems offers filtration sur-faces with pore spaces in the range of 0.2 to0.4 micrometers. Each needs to be placed inan agitated environment to control thebuildup and plugging due to biomass accu-mulations, and each periodically needs to betaken out of service and cleaned using specialcleaning solutions to recover the filtrationcapabilities. Some manufacturers offer an
Air In
Effluent
Waste SludgeR.A.S.
Raw orPrimary Effluent
Blower
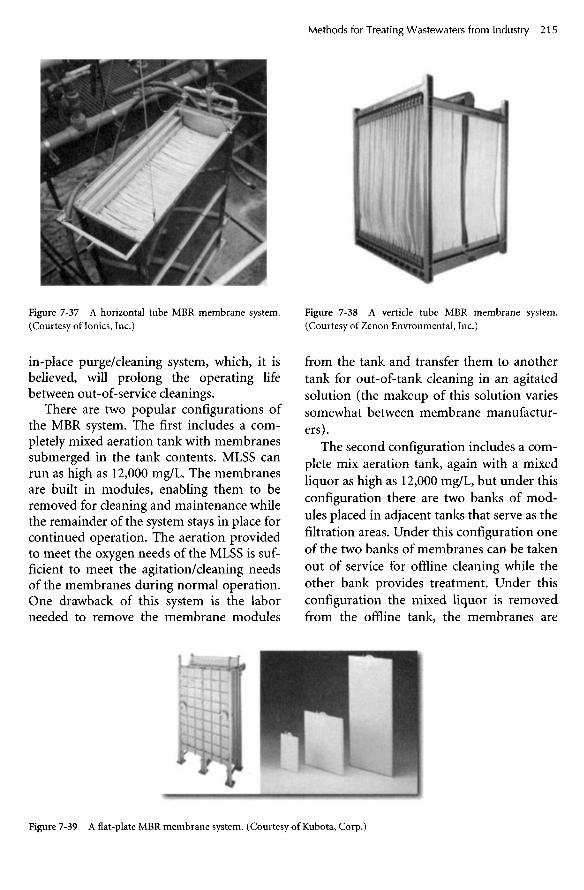
Figure 7-37 A horizontal tube MBR membrane system.(Courtesy of Ionics, Inc.)
in-place purge/cleaning system, which, it isbelieved, will prolong the operating lifebetween out-of-service cleanings.
There are two popular configurations ofthe MBR system. The first includes a com-pletely mixed aeration tank with membranessubmerged in the tank contents. MLSS canrun as high as 12,000 mg/L. The membranesare built in modules, enabling them to beremoved for cleaning and maintenance whilethe remainder of the system stays in place forcontinued operation. The aeration providedto meet the oxygen needs of the MLSS is suf-ficient to meet the agitation/cleaning needsof the membranes during normal operation.One drawback of this system is the laborneeded to remove the membrane modules
Figure 7-38 A verticle tube MBR membrane system.(Courtesy of Zenon Envronmental, Inc.)
from the tank and transfer them to anothertank for out-of-tank cleaning in an agitatedsolution (the makeup of this solution variessomewhat between membrane manufactur-ers).
The second configuration includes a com-plete mix aeration tank, again with a mixedliquor as high as 12,000 mg/L, but under thisconfiguration there are two banks of mod-ules placed in adjacent tanks that serve as thefiltration areas. Under this configuration oneof the two banks of membranes can be takenout of service for offline cleaning while theother bank provides treatment. Under thisconfiguration the mixed liquor is removedfrom the offline tank, the membranes are
Figure 7-39 A flat-plate MBR membrane system. (Courtesy of Kubota, Corp.)

washed down, and the cleaning solution isadded to the tank to allow cleaning to takeplace without removing the membranes. Thedrawback of this system is that aeration mustbe provided to both the aeration tank (toprovide for the oxygen needs of the MLSS)and to the filtration tanks (to agitate andclean the membranes).
Some benefits of MBR systems include:
1. Small footprint2. Very clean effluent, single numbers3. Normally undesirable mixed liquor bac-
terial characteristics, such as filamentousor bulking sludges, are less significant inan MBR than in a conventional activatedsludge process
4. Lower bacteria levels in the effluent dueto micro filtration, easier disinfection
5. Modular units for ease of installation,maintenance, and replacement
6. Ability to manage fluctuating loads andflows
Some limitations of MBRs include:
1. Pretreatment needs2. Limited ability to handle grease and oil3. Inorganics will build to a higher level
than conventional systems4. Fine screening necessary5. Membrane life is uncertain
Finally, things to keep in mind when con-sidering MBR technology include:
1. Out-of-tank or out-of-process cleaningrequired
2. At the time of this printing, modules aremore expensive than some alternatives
3. Foam and undesirable organisms getcaptured in the aeration tank
4. Ability to handle peak flow is limited bythe number of modules online
Design and Operational Characteristicsof Activated Sludge SystemsTable 7-13 presents important design andoperational characteristics of five alternativeconfigurations of the activated sludgemethod of wastewater treatment.
The parameters presented in Table 7-13are "average" values, applicable to wastewa-ters that have concentrations of BOD, TSS,FOG, and other common parameters that arenot far outside the normal ranges found inmunicipal wastewater. In cases of activatedsludge treatment systems for industrialwastewaters that have concentrations ofBOD or other characteristics that are signifi-cantly outside these ranges, laboratory and/or pilot studies must be conducted. There isno reliable way to transpose or interpolatethe performance characteristics of one ofthese biological treatment processes (asachieved with one type of wastewater) ontoanother, unless the fundamental characteris-tics of the pollutants in the wastewater aresimilar.
Parameter System Type
Conventional
Extended
High Rate
Contact Stabilization
Sequencing Batch Reactor
HRT
6-8 hrs
20hrs
3-4 hrs
0.5 hrs
6-8 hrs
Sludge Age
7-12 days
20 days
6-10 days
7-12 days
7-12 days
MLVSSmg/L
2,000-3,000
1,200-2,500
2,500-4,000
2,000-3,000
2,000-3,000
Table 7-13 Design and Operational Characteristics of Activated Sludge Systems

Aeration Systems for Activated SludgeAir must be supplied to activated sludge sys-tems to provide oxygen for microbial respira-tion. A wide range of alternative air supplysystems is available, and there can be as muchas a 150% difference in total annual costsfrom one system to another. Figure 7-40 pre-sents an enumeration of the major types ofaeration devices available. Mixing is alsorequired in activated sludge systems, and aer-ation can often provide all of the mixing thatis necessary. Sometimes, however, supple-mental mixing is more economical.
As shown in Figure 7-40, the two principaltypes of aeration devices are mechanical anddiffuser. The basic difference between thetwo is that the mechanical aerators causesmall droplets of the mixed liquor to bethrown up out of the aeration tank, throughthe air above the tank, and back down intothe tank. These mechanical devices also mixthe contents of the aeration tank, with theobjectives of (1) there being no "dead zones"and (2) each portion of the liquid mass in theaeration tank being thrown into the air everyfew minutes. Oxygen transfer takes placethrough the surface of each droplet. For thisreason, the more efficient mechanical aera-tors are those that create the largest surface-to-volume ratio of the activated sludge massper unit of energy expended per unit of time.This principle is explained in the paragraphsthat follow. It should also be noted that incold climates, mechanical aeration tends tocool the MLVSS, and diffused aeration tendsto heat it. This may be a factor to considerduring selection.
The driving force for oxygen transfer inthe case of mechanical aerators is the gradi-ent between the oxygen concentration in theair and the concentration of dissolved oxygenwithin a given droplet. As illustrated in Fig-ure 7-41, the transfer of oxygen from the airinto a droplet is a four-step process. First,oxygen diffuses through the bulk air mediumto the surface of the droplet. Next, each oxy-gen molecule must diffuse through the dou-
ble-layered "skin" of the droplet, which con-sists of a layer of nitrogen and oxygen mole-cules covering a layer of water molecules.This diffusion through the two layers can beconsidered one step, and is thought to be therate-limiting step for the process as a whole.The final two steps are diffusion of oxygeninto the bulk liquid of the droplet, followedby diffusion into the bulk liquid contents ofthe aeration tank, once the droplet returns tothe tank.
The reason that diffusion through thedouble "membrane" at the surface of thedroplet is the rate-limiting step is illustratedin Figure 7-42. Within either the bulk air orthe bulk liquid, each molecule of themedium is attracted to other moleculesequally in all directions (across the entiresurface area of the molecule). At the interfacebetween liquid and air, however, each mole-cule of the medium is attracted to other likemolecules in only the directions where thelike media are present (across only half of thesurface area, or the bottom half in the case ofthe liquid molecules). Therefore, since thetotal attractive force is the same as in the bulkmedium, but the force is distributed overonly half the area, the effective attraction isessentially doubled. This causes the mole-cules of both gas and liquid to be more denseand, therefore, to be less permeable to thepassage of other molecules.
Air diffusers introduce bubbles of air intothe bulk liquid within the aeration tank, asillustrated in Figure 7-43. In this case, asopposed to the case for mechanical aerators,the oxygen transfer process is from a more orless spherical "container" of air directly to thebulk liquid. Again, the driving force for oxy-gen transfer is the difference in concentrationbetween oxygen molecules in the air bubbleand the concentration in the bulk liquid.There is still the process of diffusion of oxy-gen molecules through, first, the air, exceptthat here, the air is contained in a small"package," which is the bubble. Next, theoxygen molecules must diffuse through the

Figure 7-40 Alternative types of devices for aeration: (a) aeration panel (courtesy of Parkson Corp.); (b) flexible membranediffuser (courtesy of Parkson Corp.); (c) dome diffuser (courtesy of Parkson Corp.); (d) coarse bubble (courtesy of ParksonCorp.); (e) fine-bubble membrane diffuser (courtesy of Eimco Process Equipment, a Baker Hughes Company); (f) disk dif-fuser (courtesy of U.S. Filter/Envirex).
(a) (b)
(d)(c)
(e)
(f)

(g)
(h)
Figure 7-40 Alternative types of devices for aeration: (g) submerged static aerator (courtesy of IDI/Infilco Degremont,Inc.); (h) alternative device for aeration (courtesy of IDI/Infilco Degremont, Inc.).
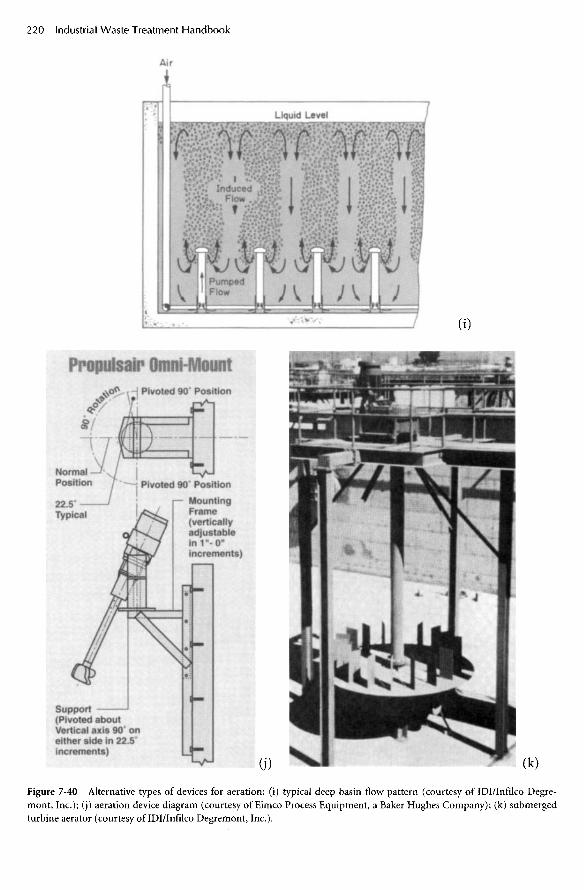
Air
(i)
O) (k)
Figure 7-40 Alternative types of devices for aeration: (i) typical deep basin flow pattern (courtesy of IDI/Infilco Degre-mont, Inc.); (j) aeration device diagram (courtesy of Eimco Process Equipment, a Baker Hughes Company); (k) submergedturbine aerator (courtesy of IDI/Infilco Degremont, Inc.).

WalkwayOptional
Figure 7-40 Alternative types of devices for aeration: (1) aeration device diagram (courtesy of IDI/Infilco Degremont, Inc.)-
(D
RegisteredFit Coupling
Handrail 3'-6"High with KickpiateJackingStudsLiftingLug
Drive
Vortair RotorIntegral Shaft

Figure 7-40 Alternative types of devices for aeration: (m) pontoon-mounted, aspirating aerator (courtesy of Eimco ProcessEquipment, a Baker Hughes Company); (n) fixed-mounted, aspirating aerator (courtesy of Eimco Process Equipment, aBaker Hughes Company).
double "membrane" of gas, then through liq-uid molecules that surround the bubble, theninto the bulk liquid. Here, the process hasfour steps rather than five, and the rate-limit-ing step is still considered to be the rate ofdiffusion through the double-layered mem-brane.
Air diffusers manufactured for the pur-pose of supplying air to activated sludgewastewater treatment systems are dividedinto two categories: coarse bubble diffusersand fine bubble diffusers (also called "finepore diffusers"). In general, coarse bubblediffusers require less maintenance than fine
(n)
(m)

bubble diffusers and require somewhat lessair pressure to pass a given flow rate of air(therefore less power per unit of air supplied)but achieve a lower degree of oxygen transferefficiency (OTE). Fine bubble diffusers char-acteristically provide higher OTE values thancoarse bubble diffusers, owing to the signifi-cantly higher surface-to-volume ratio of thesmaller air bubbles. Since the rate-limitingstep of the oxygen transfer process is diffu-sion through the double layered "membrane"surrounding each air bubble, and since theflux of oxygen, in terms of pounds of oxygenper unit area of bubble surface, will be thesame regardless of bubble size, increasing thebubble surface area will directly increase thetransfer of oxygen.
Fine bubble diffusers have been shown tohave significant disadvantages comparedwith coarse bubble diffusers or mechanicalaerators in certain specific instances, due to ahigher tendency to cause foaming and a ten-dency to clog or otherwise become fouled. Iffoaming occurs and antifoam agents areadded, the antifoam agents act to cause the
BULKAIR
WATERDROPLET
WATERAIR
SK
INO
FW
AT
ER
SK
INO
FA
IR
Figure 7-40 Alternative types of devices for aeration: (o)sequencing batch reactor (SBR) (courtesy of Paques ADISystems, Inc.); (p) fixed submerged aerator (courtesy ofABS, a company in the Cardo Group).
Figure 7-41 Illustration of the mass transfer of oxygenmolecules from air into a droplet of water.
(o)
(P)

Surface tension
Surface
Attractive forces
Figure 7-42 Illustration of the rate-limiting step for oxygen transfer.
fine bubbles to coalesce and become largebubbles. The tendency for fine pores to clogor become otherwise fouled results in thenecessity for periodic cleaning or replace-ment. In addition, the lower air supply rateneeded by fine bubble diffusers for therequired oxygen transfer results in less air formixing, an important component of aera-tion. The addition of one or more alterna-tives to satisfy mixing requirements, forinstance, by supplying more air than isrequired for oxygen transfer, or making useof mechanical mixers along with the finebubble aerators, sometimes results in thelong-term economics favoring coarse bubblediffusers.
Some industrial wastes have chemical orphysical characteristics that make them badcandidates for fine bubble diffusers. Some-times, the reason is obvious. Treatment sys-
tems for potato starch processing wastewater,which foams copiously due to the types ofproteins present, and treatment of pulp millwastewaters, which contain chemical compo-nents (possibly including sulfonated rem-nants of lignin) that cause small bubbles tocoalesce, are examples.
Basics of Oxygen TransferThe basic relationship that describes the oxy-gen transfer process is as follows:
(7-47)
where
dC = Change in concentration of oxygenwith time, dt
Figure 7-43 Diffusion of oxygen from inside air bubble to bulk liquid.
Next Page
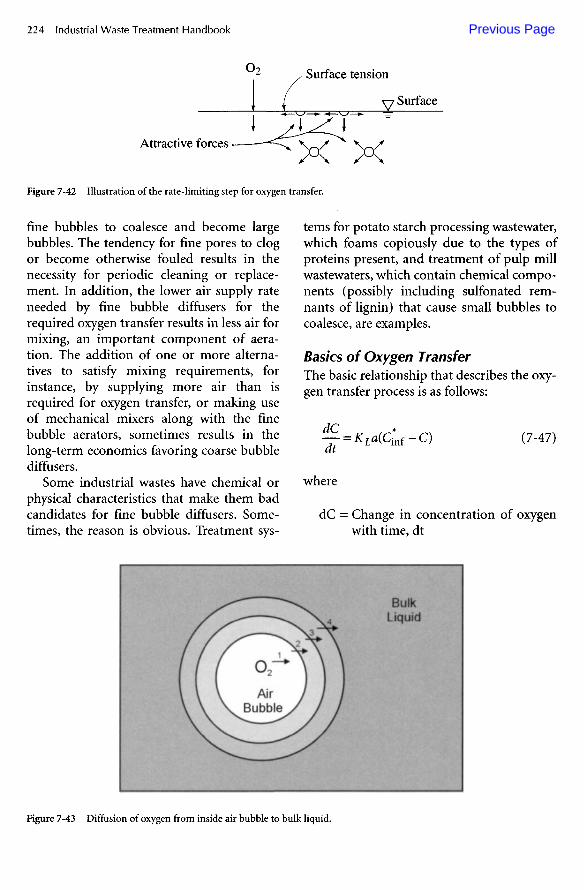
Surface tension
Surface
Attractive forces
Figure 7-42 Illustration of the rate-limiting step for oxygen transfer.
fine bubbles to coalesce and become largebubbles. The tendency for fine pores to clogor become otherwise fouled results in thenecessity for periodic cleaning or replace-ment. In addition, the lower air supply rateneeded by fine bubble diffusers for therequired oxygen transfer results in less air formixing, an important component of aera-tion. The addition of one or more alterna-tives to satisfy mixing requirements, forinstance, by supplying more air than isrequired for oxygen transfer, or making useof mechanical mixers along with the finebubble aerators, sometimes results in thelong-term economics favoring coarse bubblediffusers.
Some industrial wastes have chemical orphysical characteristics that make them badcandidates for fine bubble diffusers. Some-times, the reason is obvious. Treatment sys-
tems for potato starch processing wastewater,which foams copiously due to the types ofproteins present, and treatment of pulp millwastewaters, which contain chemical compo-nents (possibly including sulfonated rem-nants of lignin) that cause small bubbles tocoalesce, are examples.
Basics of Oxygen TransferThe basic relationship that describes the oxy-gen transfer process is as follows:
(7-47)
where
dC = Change in concentration of oxygenwith time, dt
Figure 7-43 Diffusion of oxygen from inside air bubble to bulk liquid.
Previous Page

KLa = Overall mass transfer coefficient,made up of the coefficients KL, theliquid film coefficient, and the unitinterfacial area a.
C jnf = The saturation concentration foroxygen in water. It is the concentra-tion to which oxygen would becomedissolved in water if a gas containingoxygen was in contact with water foran infinite period of time. Its value isproportional to the mole fraction ofoxygen in the gas that is in contactwith water.
C = Concentration of dissolved oxygenat time t.
The value of KLa in the above equation isnormally determined by experiment. C infand C are measured directly. KLa is deter-
mined by performing a regression analysis ofoxygen uptake data, obtained by conductingexperiments during which oxygen concen-tration is measured at progressive times afteraeration of a test liquid has begun, startingwith a concentration of approximately zero.Figure 7-44 presents a typical graph of theconcentration of dissolved oxygen in anaqueous solution after the aeration processhas begun at time equal to zero, starting witha dissolved oxygen concentration of aboutzero. As shown in Figure 7-44, the concentra-tion of dissolved oxygen increases at adecreasing rate (first-order kinetics) untileither the saturation concentration (C -mf) isreached or an equilibrium is reached atwhich the rate of dissolution of oxygen isequal to the rate at which dissolved oxygen isconsumed, by either microbiological respira-tion or chemical reaction.
TIME (MIN)
Figure 7-44 Determination of the value of KLa.
(Cfn
f-C
Km
g/L
)

Extensive experimentation has shown thatthe value of KLa, the overall mass transfercoefficient, depends upon a number of char-acteristics and factors. In fact, within a givenaeration basin in which oxygen is being dis-solved into a given industrial wastewater, thevalue of KLa is different in different locationswithin that basin. Some of the characteristicsand factors include:
• Temperature• Chemical makeup of the wastewater as it
changes from one location to anotherwithin the basin (the principal reason forthis change is the treatment processitself)
• Liquid depth• Barometric pressure• Relative humidity• Intensity of mixing or turbulence• Variation in physical characteristics of
the aeration devices at different locationswithin the basin (if there is, indeed, avariation; usually, there is significantvariation due to different degrees ofclogging and other "wear and tear"effects of service)
It is not possible, therefore, to comparethe effectiveness of one aeration device withanother, unless all of the influencing charac-teristics are equal except the aerators them-selves, or unless procedures are applied toaccount for the differences. Such procedureshave been developed and are described inStandard Guidelines for In-Process OxygenTransfer Testing, American Society of CivilEngineers (ASCE) publication No. ASCE-18-96. Two approaches are described in thispublication. The first is referred to as the"nonsteady-state method." The second iscalled the "off-gas method." A summary ofthese procedures is as follows.
Nonsteady-state MethodThis method has the objective of determin-ing the average oxygen transfer coefficient(KLa) under actual process conditions bymeasuring the change in dissolved oxygen
(DO) concentration over time after produc-ing a sudden change in the prevailing steady-state conditions. DO concentrations are thentaken at successive time intervals, at one ormore locations within the operating aerationbasin. The DO concentration vs. time char-acteristics, as the contents of the basinprogress toward a new equilibrium condi-tion, are thus determined. The followingassumptions accompany this procedure:
• The system is completely mixed.• The oxygen uptake rate and KLa values
remain constant during the test.• DO probes are located so that each
detects a DO concentration that is repre-sentative of equal basin volumes.
One of two methods is used to producethe sudden change in (departure from)steady-state conditions. The first is to (assuddenly as possible) change the level ofpower supplied to the aerators. The second isto quickly pour a volume of hydrogen perox-ide (H2O2) into the operating basin. Whenthe level of power is increased, the value ofKLa is determined by analysis of the increasein DO concentration as it approaches thenew equilibrium value. When the hydrogenperoxide method is used, the excess DO isstripped out in a manner equivalent to themanner in which it would increase. KLa isthus determined by use of a "curve," whichmirrors the expected characteristics ofincrease to the equilibrium value. A nonlin-ear regression (NLR) technique is used todetermine the values of KLa.
It is important to maintain constant loadand oxygen uptake conditions throughoutthe test. This can be managed by eitherdiverting some of the load or by conductingthe test during periods when the load isexpected to be constant.
Off-gas MethodThis method employs a tentlike hood to cap-ture and measure gas-phase oxygen emergingfrom the surface of an operating aerationbasin. The mole fraction of oxygen in the

"off-gas" is then compared with the molefraction of oxygen in the air supplied to thebasin. A gas-phase mass balance is then usedto directly determine the oxygen transfer effi-ciency of the diffused air aeration devices inservice at the time the test was conducted.Devices for measuring the oxygen content ofair and the flow rate of air are used to deter-mine the mass of oxygen that enters the aera-tion basin over a defined period of time.Equivalent devices are used to measure themass of oxygen exiting the basin through thesurface of the liquid over the same period oftime. This ratio is used to calculate the massrate of oxygen input to the aeration basin.Typically, the performance curves suppliedwith the air blower equipment (mass of airper horsepower-hour, for instance) are usedto determine (or to check, if a flow meter isused) to determine the mass of air suppliedto the aeration basin.
The tentlike device, or "hood," isequipped with pressure-sensing devices aswell as oxygen concentration sensing equip-ment and gas flow rate measurement capa-bility. The oxygen concentration sensingequipment is used to determine the molefraction of oxygen in the gas that is exitingthe aeration basin via the surface of themixed liquor. The pressure-sensing devicesare used to determine when the flow of gasinto the hood is equal to the flow exiting thehood. This "flow equilibrium" will be shownto be the case when the pressure within thehood remains constant over a period of time.It is recommended that the hood be main-tained under a slight positive pressure, withrespect to the atmosphere outside the hood,i.e., + 1.27 to 2.54 mm [0.05 to 0.10 in.]water gauge.
The area of the base of the hood,expressed as a ratio of the total area of theaeration basin, is used to calculate the totalmass rate of oxygen exiting the aerationbasin. The difference between the quantity ofoxygen entering the aeration basin in a unitof time and the quantity exiting the basin inthe same unit of time is then used to deter-mine the oxygen transfer characteristics of
As was the case with the nonsteady- statemethod described above, the resulting esti-mates of the value of KLa, oxygen transferefficiency, and other characteristics are appli-cable, strictly speaking, to only those particu-lar conditions of temperature, atmosphericpressure, chemical characteristics of themixed liquor, and all other variables thatexisted when the test was conducted. The"standard oxygen transfer rate" (SOTR)equation has been developed to provide amethod to enable comparison, on a best-
(7-49)
the particular aeration system (blowers, airdelivery system, and diffusers) used for thattest.
A gas-phase mass balance of oxygen overthe liquid volume is written as:
Oxygen removed from gas stream— oxygen dissolved into the liquid
or
p(qiYl-qeYe) = KLa(Clf-C)xV (7-48)
where
p = Density of oxygen at temperatureand pressure at which gas flow istaking place
qp qe = Volumetric rate of gas flow into andout of the volume of liquid, respec-tively
Yj, Ye = Mole fraction of oxygen in gas (air)flow into and out of the liquid,respectively
C = Concentration of dissolved oxygenin the liquid (aqueous solution)
V = Volume of basin
as illustrated in Figure 7-45.The value of KLa, then, is calculated
directly by rearrangement of equation 7-48:

OUTLETGAS
(LIQUID)
INLETGAS
Figure 7-45 Gas-phase mass balance.
estimate basis, of the performances of differ-ent aeration devices by mathematicallyadjusting the value of KLa to account fornonstandard conditions when actual testswere conducted.
The standard oxygen transfer rate (SOTR)is defined as:
SOTR = KLa(C i n f) (7-50)
Standard conditions are considered to beas follows in the United States:
• Temperature = 2 0C• Barometric pressure = 760 mm Hg• Tap water
In Europe, standard conditions are con-sidered to be as follows:
• Temperature = 100C• Barometric pressure = 760 mm Hg• Tap water
In the United Kingdom, a surfactant(commercial detergent) is added to the tapwater.
Three factors a, (3, and 0 are used tomathematically adjust the value of KLa toaccount for the effects of differences inwastewater characteristics (chemical content,etc.), differences in the saturation value ofdissolved oxygen, and the effects of tempera-ture, respectively. The alpha factor (a) isused to compare the oxygen transfer effec-tiveness in a given wastewater to its effective-ness in clean water:
a = KLaww/KLacw (7-51)
where
KLaww = The value of KLa, the overall mass-transfer coefficient, in the wastewa-ter that is under consideration
KLacw = The value of KLa in clean water,under the same conditions of tem-perature, barometric pressure, andrelative humidity that prevailed forthe determination of KLa
In other words, then, the value of alpha(a) is the ratio of the rate of oxygen transferin the wastewater under consideration to therate of oxygen transfer in clean water, whenall other physical and environmental charac-teristics are equal.
Usually, the value of alpha is less than one,meaning that there are few substances nor-mally found in wastewater that enhance thedissolution of oxygen. If one aeration deviceis able, somehow, to "produce" an alphavalue higher than that "produced" byanother (several have been reported in theliterature), and if the difference in the valuesof KLa do not negate this effect, the aeratorproducing the higher alpha value is shown tobe the better performer.
The beta factor, used to account for thedifference in the saturation value of dissolvedoxygen in a given wastewater, as opposed to

the saturation value in clean water, isexpressed as:
The saturation concentration of thewastewater in question in contact with aircan be determined by testing the wastewaterin the laboratory. Published tables are used toobtain the appropriate value for the satura-tion concentration of oxygen in tap waterthat is in contact with air.
A reasonably accurate correction for dif-ferences in temperature is as follows:
(7-52)
(7-53)
where:
^La(T)= Value of KLa at temperature TT = Temperature in 0C0 = 1.024
"Standard" correction factors for differ-ences in barometric pressure and relativehumidity are presented in Guidelines forQuality Assurance of Installed Fine Pore Aera-tion Equipment (ASCE, 1998).
The standard oxygen transfer rate (SOTR)is used to estimate the actual oxygen transferrate (OTR) under "actual" (as opposed tostandard) conditions by use of equation7-54:
where
C wait = The saturation concentration of oxy-gen (from ambient air) in tap water,corrected for the increased satura-tion concentration at the depth ofoperation of the aeration devices,i.e., C*walt = C*TP X fd, where:
where:
SOTR = Oxygen transfer rate under standardconditions, Ib O2 /hr
SOTE = Oxygen transfer efficiency understandard conditions, %
Q = Rate of flow of air under standardconditions, SCFM
pa = Density of air at standard conditions= 0.075 lb/ft3
fa = Weight fraction of oxygen in air,decimal (0.231)
60 = Minutes per hour100 = Conversion from percent to decimal
Under standard conditions, then,
(7-54)
(7-56)
(7-55)
C2Q = Saturation concentration atthe surface, under standard condi-tionsCL = The target value of dissolvedoxygen under normal operatingconditions
Progressing one step further, it is conve-nient to determine air-flow requirements forany given wastewater treatment process byuse of equation 7-55:
C TP = The saturation concentra-tion of oxygen (from air) in water atthe prevailing temperature andatmospheric pressurefd = Factor accounting for increasedsaturation concentration at depth

Shop TestsAn alternative method for estimating thevalue of KLa, as well as other parameters andcharacteristics of oxygen transfer effective-ness by various aeration devices, is the so-called "shop test."
A given vessel is filled with a given liquid(water or an industrial wastewater). The aer-ator being evaluated is activated, with thedissolved oxygen concentration equal to zero.Measurements of dissolved oxygen concen-tration are made at periodic time intervals,and a plot of the data (as shown in Figure7-45) will enable determination of the valueof KLa at the temperature, barometric pres-sure, and relative humidity that prevailed atthe time of the testing. The aeration devicethat produces the highest value of KLa will beshown to be the most effective, as far as oxy-gen transfer is concerned, of those evaluatedunder the specific, identical conditions.
As another alternative, a slight modifica-tion of the "shop test" is to make use of a cyl-inder, two feet, or so, in inside diameter,mounted alongside the aeration basin, onsite. The aeration device(s) to be evaluated isinstalled at the bottom of the cylinder, thecylinder is fitted with air-flow rate, gas phaseoxygen, and dissolved oxygen sensing equip-ment, and the cylinder is filled with mixedliquor from the aeration basin. Tests asdescribed above are run to determine valuesof both a and KLa. The primary advantagesof this system are that the tests can be run onfresh MLVSS and wastewater, as opposed tohaving to transport these substances to the"shop," and that close control can be main-tained over chemical and physical condi-tions, as opposed to the lack of control thatattends the off-gas method described above.
Aerated LagoonsAerated lagoons usually consist of earthenbasins equipped with mechanical or diffusedaeration equipment. There is no secondaryclarifier except for a quiescent zone at theoutlet. There is no controlled sludge returnfrom the bottom of this quiescent zone.
As an alternative to the quiescent zone, aseparate pond is sometimes used, in whichcase the pond is referred to as a polishingpond. In other cases, a mechanical clarifiercan be used. A considerable number of pulpand paper mills, in fact, have installedmechanical clarifiers as part of aeratedlagoon systems. These alternatives are desir-able if the design of the lagoon makes use ofcomplete mix conditions as a method toavoid short-circuiting.
There are two distinct types of aeratedlagoon systems: (1) aerobic and (2) partiallymixed, facultative.
An aerobic lagoon must have sufficientmixing to suspend all of the solids and musthave enough aeration capacity to satisfy all ofthe BOD removal aerobically.
A partially mixed, facultative (combinedaerobic/anaerobic) lagoon requires onlyenough mixing to keep all of the liquid inmotion. A significant portion of the biologi-cal and other solids resides at the lagoon bot-tom and undergoes anoxic and anaerobicdegradation. Enough aeration is applied tomaintain aerobic conditions in only theupper two to three feet of liquid in a partiallymixed, facultative lagoon.
The advantage of a partially mixed, facul-tative lagoon over an aerobic lagoon is sig-nificantly lower operating cost. In a properlyoperated partially mixed, facultative lagoon,much of the dissolved BOD in the rawwastewater is "sorbed" (via adsorption andabsorption) onto and into the microbialcells, which then settle to the bottom andundergo anoxic and anaerobic degradation.There is no requirement to supply oxygenfor this degradation process. Furthermore,anoxic and anaerobic metabolisms result inthe generation of far less sludge, in the formof growth of new microbial cells, per unit ofBOD degraded, than is the case with aerobicmetabolism.
The advantage of an aerobic lagoon over apartially mixed, facultative lagoon is in proc-ess control. There is no positive control overhow much sludge settles and how much staysin suspension in a partially mixed lagoon.

Since there is no settling out of sludge solidsin a properly operated aerobic lagoon, thereis no lack of control. There is, however, a sig-nificant price to pay for the extra aerationcapacity required for an aerobic lagoon overthat required for a partially mixed, facultativelagoon.
The anoxic and anaerobic microbial activ-ity that takes place at the bottom of a prop-erly operated partially mixed, facultativelagoon converts organic solids within thesludge to soluble organic acids, which diffuseinto the upper strata of the lagoon. Thesecompounds are volatile and highly odorous,and constitute a potential odor problem;however, if there is sufficient aerobic micro-bial activity in the upper strata of the lagoon,the organic acids will be converted to carbondioxide, water, and microbial cell proto-plasm. Properly designed and operated par-tially mixed, facultative lagoon systems donot emit noticeable odors.
Aerated lagoons require relatively littleoperator attention, since there is no wastingor returning of sludge to manage sludge age.Technically, sludge age is infinite, andautooxidation is at the maximum. For thisreason, the effluent TSS concentration is typ-ically high (relatively, compared with acti-vated sludge). Aerated lagoons eventuallycollect sufficient inert solids that sludgeremoval is required.
The frequency of sludge removal can varyfrom yearly to once every ten or so years. Thehigh-cost (relatively) aspects of lagoon sys-tems include large land area as well as thecost of construction of a liner system to pro-tect the groundwater. In the case of partiallymixed, facultative lagoons, periodic losses ofsolids (via the effluent) that had previouslysettled to the bottom, plus periodic episodesof algae blooms within the lagoon, combineto make them unreliable in complying witheffluent TSS restrictions. Some facultativelagoon installations have incorporated addi-tional facilities that are used only whenneeded, such as a sand filter, or a final, set-tling lagoon, to ensure compliance with dis-charge permits. Here, again, a well-developed
life-cycle cost analysis is needed to determinethe wisdom of selecting any of the variouslagoon alternative configurations.
Nonaerated Facultative LagoonsNonaerated facultative lagoons are designedand constructed similarly to aerated lagoons;but there is no aeration other than thatwhich diffuses naturally through the surface.These systems are termed "facultative"because, properly operated, the upper thirdor so of the depth is aerobic, the lower thirdor so is anoxic to anaerobic, and the middlethird phases in and out of the aerobic andanoxic states and is therefore facultative. Inorder to achieve aerobic conditions through-out a significant portion of the depth (one-third or so), the organic loading must be suf-ficiently low that the rate of diffusion of oxy-gen from the air above the lagoon is as highor higher than the rate of oxygen utilizationby the aerobic microbial population. As withother types of lagoons, anoxic and anaerobicdegradation take place within the sludge atthe bottom. Organic solids are converted todissolved organic acids, which diffuse intothe aerobic region near the surface, present-ing a potential odor problem. In a properlydesigned and operated system, however,these volatile organic acids are converted tocarbon dioxide, water, and microbial cellprotoplasm by the aerobic microbial popula-tion in the aerobic zone. Well-functioningfacultative lagoon systems, aerated or not, donot give off significant objectionable odors.
Oxidation PondsOxidation ponds are designed and con-structed similarly to facultative lagoons, inthat they are usually earthen basins of verylong hydraulic detention time. The designobjective is different from that of facultativelagoons, however. Oxidation ponds must besufficiently shallow and have sufficiently loworganic loading that aerobic conditions aremaintained everywhere. For this condition tohold, the rate of production of oxygen byalgae, plus the rate of diffusion of oxygen

through the surface and from there to thebottom of the pond, must always be greaterthan the rate of utilization of oxygen by themicrobes within the system as they metabo-lize the organic pollutants.
Because of their shallow construction,oxidation ponds are useful only in warm cli-mates. Also, since algae are usually a princi-pal source of oxygen, sunlight intensity is animportant design consideration. Therequirement for liner systems to protect thegroundwater is a major cost consideration,since oxidation ponds typically have thehighest area to volume ratio of the com-monly used biological treatment systems.
Design of Lagoon SystemsThe discussions above have shown that, ingeneral, there is a tradeoff between detentiontime and aeration capacity in the design ofaerobic biological treatment systems. Thequestion, then, is, "Which combination ofdetention time and aeration capacity willproduce the desired quality of effluent for thelowest life-cycle cost?" Factors on which theanswer bears include wastewater strength,
characteristics relating to biodegradability ofthe organics in the wastewater, cost for land,soil type as it relates to construction costs,and temperature, as well as others.
While activated sludge systems for treat-ment of industrial wastes are best designedusing the procedures presented previously,lagoon systems have been most successfullydesigned using one of the empiricalapproaches presented and discussed brieflyin Table 7-14.
In general:
• Temperature affects both the rate ofmicrobial respiration and the rate atwhich oxygen dissolves in the bulk liquidin the lagoon.
• Algae affect the quality of the effluentfrom a lagoon by:— Adding to the TSS of the lagoon
effluent— Adding oxygen to the bulk liquid of
the lagoon during the daylight hours— Depleting the oxygen in the bulk liq-
uid of the lagoon during the nonday-light hours
Table 7-14 Alternate Approaches to Design of Lagoon Systems
Approach
Areal Loading
Plug Flow
Complete Mix
Marais and Shaw
Gloyna Method
Wehner-Wilhelm
Comment
Lagoon system size is determined by simply applying an area loading rate of, for instance, 15 IbBOD/ac/d, with no more than 40 lb/ac/d in any one of several lagoons in series. Depth is a separatedesign parameter, which increases with colder climates. Depth is first determined to provide re-quired detention time, then is increased to accommodate anticipated ice thickness, sludge storage,and accommodation of direct rainfall, if significant. Experience is the principal design guide.
Useful when long, narrow ponds can be constructed. Construction cost is relatively high becauseof the high perimeter-to-volume ratio. If baffles are used to create a long, narrow flow path, con-siderable dead space results and must be taken into consideration regarding hydraulic detentiontime.
Complete mix operation is useful for controlling short-circuiting. Best treatment results whenthree or more ponds are operated in series. Successful design depends on selecting the correct re-action rate constant, k. Value of k decreases with consequent increase in lagoon system size withdecreasing operating temperature.
A variation of the complete mix method approach. Design considerations are identical to com-plete mix approach.
Applicable to warm climates with high solar radiation. Assumes solar energy for photosynthesis isabove saturation.
Requires knowledge of hydrodynamic equation characteristics of each pond, as well as reactionrate.
Experience has shown that the amount ofalgae present in the lagoon systems increasesfrom aerobic to partially mixed, facultative tononaerated, facultative to those highest inalgae mass, oxidation ponds. In all but com-plete mix aerobic systems, algae are integralparts of the treatment system and must beexpected. Furthermore, lightly loaded (rela-tive to design) systems are likely to have sig-nificantly more algae. The EPA has recog-nized that compliance with typical secondarypermit limits for total suspended solids(TSS) may be impossible for certain lagoonsystems and has provided for "equivalent tosecondary" alternative TSS limits on a case-by-case basis.
In the course of the normal day-in andday-out operation of a lagoon system overthe full calendar year, solids, includingthose that were contained in the raw waste-water and the microbial solids that resultfrom the microbial purification action ofthe lagoon system, and algae settle to thebottom of the lagoon to form a sludgedeposit, referred to as the benthic deposit,or benthos. Anoxic/anaerobic conditionsdevelop in the benthos, and anoxic/anaero-bic bacterial action reduces the volume of thebenthos and releases volatile acids to theoverlying bulk liquid. This adds to the BODload to be treated by the lagoon system. Dur-ing the spring months, lagoons located incold climates experience an overturn whenthe benthos rises into the bulk liquid. This isknown as a "benthal release." The BOD ofthe bulk liquid increases significantly duringthese periods, typically causing nearly com-plete depletion of the dissolved oxygen sup-ply. When this happens, aerobic biologicaltreatment is limited to what can be sup-ported by the immediate dissolution of oxy-gen by the aerators and by diffusion throughthe surface. In some locations, a similarbenthal release occurs during the autumnmonths. Very often, under these conditions,concentrations of both BOD and TSS in thelagoon effluent will rise to exceed permit
limitations. It is extremely important toinclude the effects of benthal release in thedesign of a lagoon system as well as in theplan of operation.
One solution is to design and build athree-lagoon system. Treat with two lagoonsand use the third lagoon to store effluent notsuitable for release (have a high- and a low-discharge pipe). The stored wastewater canbe routed through the two treatment lagoonsduring periods of low wastewater flow.
Low-Energy Complete Mix ApproachExperience has shown that short-circuitinghas been the most significant cause of failureof lagoon systems to perform as intended.Many techniques have been used to solveshort-circuiting problems, including the useof baffles and the strategic placement of inletand outlet devices. However, perhaps themost positive approach has been to employ alow-energy complete mix technique. In thisapproach, the shape of the individual pondsthat make up the lagoon system, combinedwith the type of aeration device, has enabledcomplete mix hydrodynamics, as evaluatedusing chemical tracer studies.
BOD Test ConsiderationsWhen aerobic treatment systems, especiallylagoons, are operated in an underloaded (rel-ative to design) condition, there is a potentialproblem with use of the standard five-daybiological oxygen demand (BOD5) test fordetermining plant performance as well ascompliance with permit limits. When thecarbonaceous BOD (CBOD) has beenremoved, the microorganisms within thetreatment system (lagoon), under certainconditions, begin oxidizing ammonia thathas been liberated from proteins and othersubstances. This "extra treatment" leads tothe development of a robust population ofnitrifying bacteria (nitrosomonas and nitro-bacter), which are present in the treatedeffluent. Consequently, when samples of thetreated effluent are placed in BOD bottles,

nitrification of ammonia (including thatintroduced with the dilution water) takesplace during the five-day BOD test. Theresult is that the BOD5 test will include bothCBOD from the treated wastewater and anamount of nitrogenous oxygen demand(NBOD) (about 4.6 mg of oxygen arerequired to oxidize 1 mg of ammonia). Expe-rience shows that a treated effluent with aCBOD of less than 10 mg/L can exhibit aBOD5 of more than 50 mg/L using the stan-dard five-day BOD test. For this reason, analternative test has been developed, in whichnitrification inhibitors are added to the BODbottle in the standard five-day BOD test. Thistest is referred to as the CBOD test. The EPAand, essentially, all state environmental agen-cies can authorize this test to be used insteadof the standard BOD5 test, on a case-by-casebasis. In fact, some state agencies have autho-rized the CBOD test to be used at the ana-lyst's option.
Attached Growth SystemsAttached growth wastewater treatment proc-esses are characterized by a microbiologicalslime mass attached to a solid surface. As thewastewater flows over the slime mass,organic substances and other nutrients dif-fuse into it, providing food for microbialgrowth. In the case of aerobic systems, oxy-gen also diffuses into the slime mass. Typi-cally, the microbes grow, increasing the mass(referred to as the "slime layer"), and theslime layer develops as shown in Figure 7-46.
As depicted in Figure 7-46, organics, othernutrients, and oxygen diffuse from wastewa-ter, which is moving over the surface of theslime layer. As the slime layer grows, itbecomes so thick that oxygen becomes con-sumed before it can diffuse more than a fewmillimeters into the slime layer. An anaerobiczone thus becomes established even thoughthe process as a whole is said to be aerobic.The anaerobic zone is usually a fortuitousdevelopment, however, because the anoxicand anaerobic activity acts to consumemicrobes that have grown in the aerobiczone, as well as some of the organics that
Figure 7-46 Characteristics of attached growth slimelayer.
have diffused in from the wastewater. Thisactivity reduces the quantity of waste sludgethat must be handled and disposed. There isalmost always some sloughing off of excessslime layer, however, and for this reason aclarifier is usually included in the attachedgrowth treatment system.
Three aerobic attached growth wastewatertreatment processes that are in common use,shown in Figure 7-47, are the trickling filter,the rotating biological contactor (RBC), andthe fluidized bed.
Trickling FiltersTrickling filters make use of solid "media,"usually contained in a steel or concrete tankwith a perforated bottom. The tank can beround, square, rectangular, or another shape.Wastewater is applied to the top of the mediaby distribution devices and, under the influ-ence of gravity, trickles down over the sur-faces of the media. Air flows from the bottomup through the media to supply oxygen. Airblowers can be used for this purpose, butnormally, sufficient air flows by gravity. Thisis because the biological activity in the filter
SLIMELAYER
SOLID
MEDIUM
ORGANICS
NUTRIENTS

gives off enough heat to cause the air toexpand, thus becoming lighter and buoyantcompared with the ambient air.
The earliest trickling filters (from the early1900s through the 1950s) made use of stonesof one to four inches in size for the mediumover which the wastewater was caused to flowor "trickle." Stone, or in some cases slag orcoal, is still used, but many trickling filtersystems now use media manufactured fromplastic. Also, some trickling filter systemsemploy horizontal flow, referred to as "crossflow." Figure 7-48 shows photographs ofstone media, as well as representative types ofplastic media. The plastic media are oftenreferred to as "packing." Filters making use ofstone media are normally three to eight feet
in depth. Plastic media trickling filters havebeen built as shallow as 6 feet and as deep as40 feet.
The system used to distribute wastewaterover the top of the media can be either move-able or stationary. A grid of stationary noz-zles supplied with wastewater by pumps iscommon in the case of plastic media filters.So-called "rotary distributors," shown in Fig-ure 7-49, are normally used with stone mediafilters. The rotary distributor is fed from thecenter of the circular filter. The action of thewastewater issuing from one side of the dis-tributor arm supplies what is needed to turnthe distributor, thus spreading an even appli-cation of wastewater over the top of the bedof media.
Figure 7-47 Aerobic fixed-film systems: (a) rotating biological contactor (courtesy of U.S. Filter/Envirex); (b) trickling fil-ter (courtesy of NSW Corporation); (c) fluidized bed (courtesy of NSW Corporation).
(a)
(b) (c)

RecirculationIt is important to manage the operation of atrickling filter in such a way as to control thethickness of the slime layer. If the slime layeris too thin, there will be insufficient microor-ganisms to accomplish the desired degree oftreatment. Also, a slime layer that is too thinallows the applied wastewater to flow tooquickly through the filter and thus receiveinsufficient treatment. If the slime layerbecomes too thick, the flow of air becomesimpeded due to insufficient open spacebetween adjacent surfaces of the filter media.
Successful operational performance of atrickling filter results when the organic load-ing rate and the hydraulic loading rate are inproper balance. The ability to recycle waste-water that has already passed through thetrickling filter is the operator's best means tocontrol this balance, as illustrated in Figure7-50.
Figure 7-50 shows a trickling filter fol-lowed by a clarifier. A recycle pump isincluded so that varying effluent flow ratesfrom the clarifier can be recycled back to theinfluent to the trickling filter, thus affording
Figure 7-48 Various types of trickling filter media, (a) courtesy of NSW Corporation, (b, c) Courtesy of Marley CoolingTower, a United Dominion Industries Company.
(c)
(b)(a)
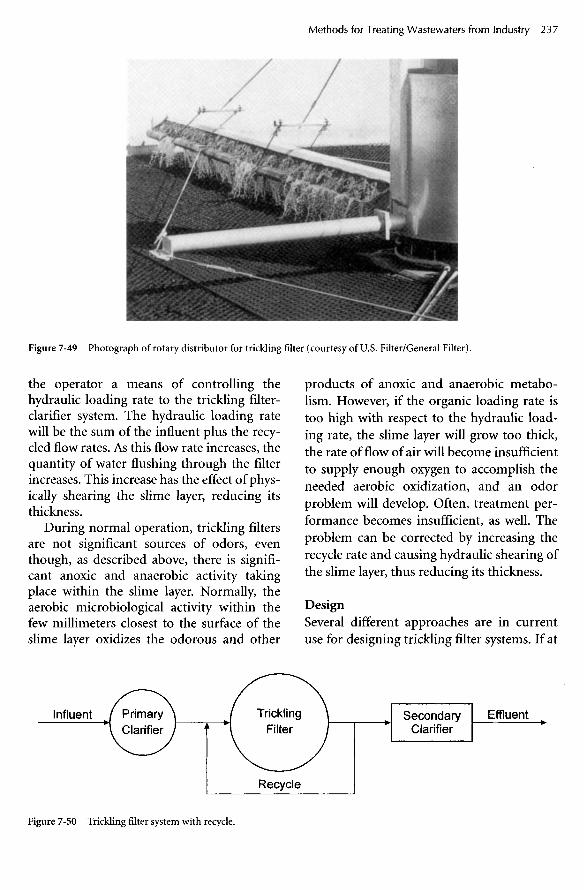
Figure 7-49 Photograph of rotary distributor for trickling filter (courtesy of U.S. Filter/General Filter).
the operator a means of controlling thehydraulic loading rate to the trickling filter-clarifier system. The hydraulic loading ratewill be the sum of the influent plus the recy-cled flow rates. As this flow rate increases, thequantity of water flushing through the filterincreases. This increase has the effect of phys-ically shearing the slime layer, reducing itsthickness.
During normal operation, trickling filtersare not significant sources of odors, eventhough, as described above, there is signifi-cant anoxic and anaerobic activity takingplace within the slime layer. Normally, theaerobic microbiological activity within thefew millimeters closest to the surface of theslime layer oxidizes the odorous and other
products of anoxic and anaerobic metabo-lism. However, if the organic loading rate istoo high with respect to the hydraulic load-ing rate, the slime layer will grow too thick,the rate of flow of air will become insufficientto supply enough oxygen to accomplish theneeded aerobic oxidization, and an odorproblem will develop. Often, treatment per-formance becomes insufficient, as well. Theproblem can be corrected by increasing therecycle rate and causing hydraulic shearing ofthe slime layer, thus reducing its thickness.
DesignSeveral different approaches are in currentuse for designing trickling filter systems. If at
Influent PrimaryClarifier
TricklingFilter
SecondaryClarifier
Effluent
Recycle
Figure 7-50 Trickling filter system with recycle.

all possible, it is best to take advantage ofwhat has been learned by operating an exist-ing wastewater system with as close to identi-cal characteristics as possible. While this maybe feasible for municipal wastewaters, it isoften impossible in the case of an industrialwastewater. There is no substitute for a well-designed and executed laboratory study, fol-lowed by a pilot-scale program. Several man-ufacturers of trickling filter systems havepilot-scale treatment units that can be movedto an industrial site on a flat-bed trailer andoperated for several months to obtain realis-tic design criteria and other valuable infor-mation. As a preliminary step in the designof a trickling filter system for an industrialapplication, the following methods can beused.
NRC equations, an empirical approach todesigning trickling filters, were developed inthe 1940s by analyzing records from a num-ber of military installations. This approach is,therefore, more applicable to domesticwastewater, but some industrial wastes, suchas certain food processing wastewaters,might be sufficiently similar in characteris-tics to warrant its use. The design engineershould give careful and thorough consider-ation to such similarities and possible differ-ences before proceeding very far. The benefitof the NRC equation approach is the quick-ness and low cost of developing an initialestimate of cost for a trickling filter treatmentsystem.
The BOD removal efficiency can be esti-mated by:
(7-57)
where
E = BOD removal efficiency (%)W = Organic loading rate (Ib. BOD/day)V = Volume of filter media, thousands of
a3
F = Recirculation factor (dimensionless)
The recirculation factor is determined by:
(7-58)
where
R = Recirculation ratio (Qr/Q)Q r = Rate of recycle flow (GPM)Q = Rate of flow of wastewater to filter
(GPM)
Usually, the organic loading rate can bedetermined by a wastewater characterizationstudy, as described in Chapter 5. In the caseof an industrial plant yet to be built, theorganic loading rate can be estimated usinginformation obtained from an existing facil-ity, where it is reasonable to expect similarwastewater characteristics. Caution is war-ranted, however. The NRC equations havebeen shown to yield reasonable estimateswhen applied to municipal wastewater with atemperature close to 200C. If the wastewaterto be treated is expected to be of a signifi-cantly lower temperature, the expected treat-ment efficiency would be significantly less fora given organic loading rate.
Eckenfelder's equations, another approachto designing trickling filters, were developedby analyzing laboratory, pilot-scale, and full-scale trickling filters with various types ofplastic media and treating various industrialwastes. As is the case for use of the equationspresented earlier for design of activatedsludge treatment systems, it is necessary toobtain a microbiological reaction rate, K, touse this approach:
(7-59)
where
Se = BOD5 of effluent from filter, afterclarifier (mg/L)

Sj = BOD5 of wastewater applied totrickling filter (mg/L)
K = Reaction-rate constant (see below)m = Empirical constant (see below)n = Empirical constant (see below)
Sa = Specific surface area of trickling fil-ter
D = Depth of trickling filter (ft)Qv = Hydraulic loading rate(ft3/day/ft2)
where
Surface area of trickling filter (ft ) /^Sa- 3 (7-60)
Volume of trickling filter (ft )
The reaction-rate constant, K, is specificfor a given depth of trickling filter. The rea-son for this is that as wastewater tricklesdown through progressive depths of the fil-ter, the more easily assimilated organic com-pounds are removed first. Because of this, the"localized" rate of removal or "treatment"decreases with the increasing depth of trick-ling filter, and consequently the "localized"value of K decreases with increasing depth.However, the value of K for the trickling filteras a whole increases with increasing depth,since the deeper the trickling filter, the moreBOD5 is removed. The rate of increase in thevalue of K decreases with increasing depth.
This decreasing rate of increase in overallreaction rate is impossible to predict in theabsence of laboratory and pilot-scale data.For this reason, values of K that are calcu-lated from data taken at an operating, full-scale trickling filter are applicable for onlythe depth of that filter.
Similarly, values for the empirical con-stants m and n are specific for the conditions(including temperature, depth of tricklingfilter, wastewater, and filter media) thatexisted when the data from which the valueswere calculated were obtained. Published val-ues of these constants, including values forthe reaction-rate constant K, are useful asindicators of the relative treatability of somewastewaters, taking into account compara-
ble filter depths and temperatures, but arenot useful for design of new systems or retro-fit of existing systems unless all of the physi-cal and operating conditions are substantiallythe same. Once again, in the case of indus-trial wastewaters, as opposed to municipalwastewaters, there is no substitute for a well-designed and executed laboratory, followedby pilot-scale study, to generate values ofdesign parameters for a trickling filter waste-water treatment system.
Roughing FiltersThere are many instances where trickling fil-ters have been used to reduce, or "knockdown," the BOD5 of industrial wasters priorto a principal, or main, treatment system.Trickling filters are useful for this purpose,because they are robust processes, are rela-tively resilient, and require relatively littleoperator attention. In short, roughing filtersoften present a very cost-effective alternativefor significant BOD removal when reliableadditional treatment facilities follow.
Roughing filters are, typically, operated athigh hydraulic loading rates, in part to pre-vent them from becoming anaerobic andthus sources of odor nuisance, as explainedabove. Usually, high recycle rates are used forthis purpose.
Roughing filters have been successfullyused to "absorb" shock loads due to dailycleanup or occasional spills. In this role, theroughing filter protects the main treatmentsystem and thus provides effective protectionagainst noncompliance episodes.
Two very important effects of roughingfilters on the overall wastewater treatmentsystem are:
1. The roughing filter removes the mosteasily assimilated organic material. Theeffect on the reaction-rate constant ofdownstream treatment facilities must beconsidered in the design and operationof the main treatment system.
2. Because of the high hydraulic loadingrates and the high microbiologicalgrowth rates (due to the easily assimi-

lated organics), sloughing from rough-ing filters is typically high. This mustalso be considered in the design of themain treatment system.
Usually, plastic filter media are used.Depths of roughing filters can range up to 40feet. There is always the potential for rough-ing filters to become an odor nuisance. Themost effective means an operator has to solvean odor problem is the recycle rate.
Rotating Biological ContactorsRotating biological contactors (RBCs) areattached growth processes consisting of aseries of parallel discs made of highly resil-ient plastic. The discs rotate about a metalrod, the ends of which are attached to theends of a basin that contains the wastewaterto be treated. As the discs rotate, only a por-tion of the disc assembly is immersed in thewastewater. While the discs are immersed,microbes that have attached themselves tothe discs adsorb and absorb organic materialand other nutrients from the wastewater. Aseach portion of each disc rotates out of thewastewater, it comes into contact with air,thus supplying oxygen for microbial assimi-lation of the organic substances. The emer-sion depth determines the relative amountsof time the discs, with their attached growth,are in contact with wastewater and air. Therotation speed determines the actual amountof time. Drive mechanisms for RBCs can beprovided by mechanical systems or by airdrive systems (where air drive can vary thespeed of the rotation and shear forces). Usu-ally, the depth of emersion is both a designand an operation parameter, while the speedof rotation is only a design parameter. Theoperator can vary the depth of emersion byadjusting overflow weirs on the basin, butseldom has the capability to vary the speed ofrotation.
RBC systems can consist of a single basincontaining one or more rotating disc assem-blies, or can be arranged such that two ormore basins, each containing one or morerotating disc assemblies, are in series. When
two or more basins are in series, each iscalled a stage. Because the stages are separate,and because the most easily assimilatedorganics will be removed in the first stageand so on through the final stage, a differentpopulation of microbes will become estab-lished on each one. Also, reaction kineticswill be successively slower from the first stageto the last. This characteristic of RBC systemshas been used advantageously in treatmentsystems where nitrification must take place.The final stage(s) can be managed so as tomaintain an optimum environment fornitrosomonas organisms.
As an additional note, one or more RBCstages can be operated in the anoxic mode,following the nitrification stage, by com-pletely immersing the rotating disc assemblyin a basin of effluent from the nitrificationstage. The denitrification stage, of course,should be covered. The denitrification stagecan be prevented from becoming anaerobic,and thus an odor nuisance, by controlling thehydraulic residence time by use of recycle. Asodors are noticed, the recycle rate can beincreased, preventing anoxic respirationfrom going to completion.
Two problems that RBC systems haveexperienced, and which can be prevented byappropriate design and operation, are (1)physical failure of the shaft and/or driveassembly that turns the shaft and (2) odornuisance.
Experience with a large number of RBCsystems has resulted in knowledge of what isrequired, with respect to materials of con-struction and appropriate equipment sizing,to prevent shaft failure. The treatment proc-ess design engineer must aggressively ensurethat the equipment supplier is well aware ofpast shaft failure problems and has specifi-cally designed the equipment to withstand allconceivable stresses. Written guarantees areno conciliation for the devastating disrup-tion of having to replace a rotating discassembly.
Experience has shown that addressing theroot cause of the problem can prevent odornuisance issues, which have plagued some

RBC systems. In some cases, severe odorproblems have resulted from excess growthof the microbiological slime layer. The slimelayer becomes so thick that it bridges acrossthe space between the discs, preventing airfrom flowing in these spaces. The consequentabsence of oxygen results in anoxic andanaerobic conditions and the production ofvolatile acids, hydrogen sulfide, and otherreduced sulfur compounds, all of which arestrongly malodorous. At the lowered pHcaused by the volatile acids the hydrogen sul-fide becomes insoluble and passes into theatmosphere. Hydrogen sulfide can besmelled by humans in the low parts per bil-lion ranges and can quickly cause an intoler-able odor problem. This problem can beavoided by preventing the slime layer frombridging across the space between the discs.Techniques that have been successfullyapplied include installing a coarse bubble airdiffuser (holes drilled in a pipe) at the lowpoint of the emersion of the discs so that thebubbles travel up through the wastewaterbetween the discs. This action causes agita-tion, which strips the organisms from thediscs, allowing the remaining organismsaccess to the oxygen in the air. This techniquealso acts to supply additional oxygen to themicrobes within the slime layer.
A second technique that has been helpfulin solving odor problems associated withRBC wastewater treatment systems addressesthe fact that free molecular oxygen is poison-ous to the microorganisms that produce theodorous substances. Adding a small quantityof hydrogen peroxide to the influent of anRBC stage that appears to be developing anodor nuisance problem has worked well. Thistechnique can be used while a permanentsolution is being developed and imple-mented.
Another method to resolve odor problemshas been developed by some manufacturers.This method incorporates an air drive systemwhere cups or buckets are incorporated intothe media discs such that they capture bub-bles from the aeration system and cause abuoyant force that makes the shaft turn. See
Figure 7-51 for a diagram of this system. Thebenefits of this system include:
• Shaft speed can change by varying theaeration rate.
• The agitation caused by the aeration lim-its the buildup of biomass on the discs.
Limitations include:
• Denitrification is not possible with an airdrive system.
DesignIn practice, the design of an RBC wastewatertreatment facility is carried out by selectingone or more proprietary systems and work-ing through the design procedures suppliedby the vendors of those systems. Typically,the design engineer will work with a repre-sentative of the manufacturer of the propri-etary system to first establish the necessarycharacteristics of the wastewater. In the caseof an existing facility, it will probably be nec-essary to carry out a full-blown wastewatercharacterization study, as presented in Chap-ter 4, making sure to include the pollutionprevention phases. In the case of a newindustrial production facility, it will be nec-essary to estimate the wastewater characteris-tics, making maximum use of data fromexisting plants reasonably expected to besimilar.
After design values of wastewater charac-teristics have been selected, the designparameters for the treatment system aredetermined. These parameters include thefollowing:
1. Organic loading rate (Ib BOD5 per 1,000ft2 of disc surface per day)
2. Hydraulic loading rate (gal per ft2 of discsurface per day)
3. Number of stages4. Number of shafts per stage5. Diameter of discs6. Number of discs per shaft7. Submergence depth of each rotating disc
assembly
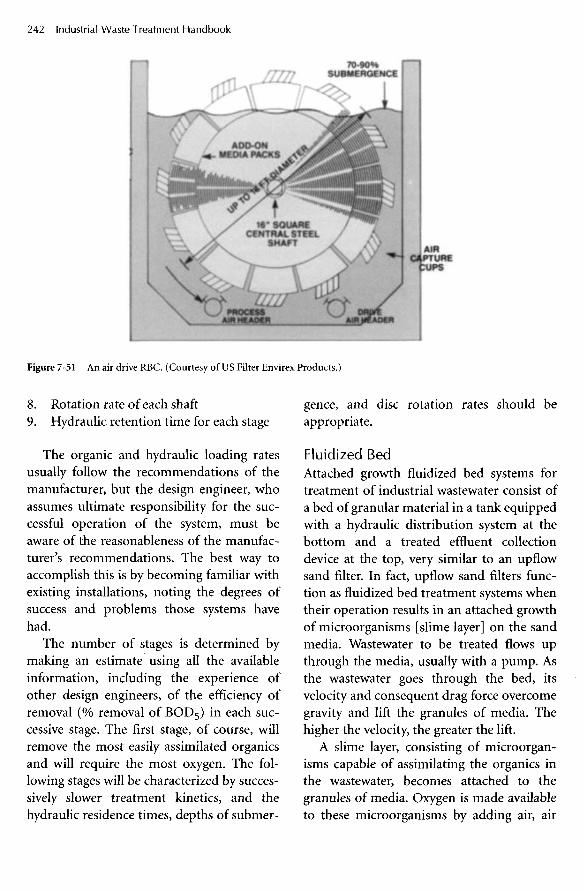
8. Rotation rate of each shaft9. Hydraulic retention time for each stage
The organic and hydraulic loading ratesusually follow the recommendations of themanufacturer, but the design engineer, whoassumes ultimate responsibility for the suc-cessful operation of the system, must beaware of the reasonableness of the manufac-turer's recommendations. The best way toaccomplish this is by becoming familiar withexisting installations, noting the degrees ofsuccess and problems those systems havehad.
The number of stages is determined bymaking an estimate using all the availableinformation, including the experience ofother design engineers, of the efficiency ofremoval (% removal of BOD5) in each suc-cessive stage. The first stage, of course, willremove the most easily assimilated organicsand will require the most oxygen. The fol-lowing stages will be characterized by succes-sively slower treatment kinetics, and thehydraulic residence times, depths of submer-
gence, and disc rotation rates should beappropriate.
Fluidized BedAttached growth fluidized bed systems fortreatment of industrial wastewater consist ofa bed of granular material in a tank equippedwith a hydraulic distribution system at thebottom and a treated effluent collectiondevice at the top, very similar to an upflowsand filter. In fact, upflow sand filters func-tion as fluidized bed treatment systems whentheir operation results in an attached growthof microorganisms [slime layer] on the sandmedia. Wastewater to be treated flows upthrough the media, usually with a pump. Asthe wastewater goes through the bed, itsvelocity and consequent drag force overcomegravity and lift the granules of media. Thehigher the velocity, the greater the lift.
A slime layer, consisting of microorgan-isms capable of assimilating the organics inthe wastewater, becomes attached to thegranules of media. Oxygen is made availableto these microorganisms by adding air, air
Figure 7-51 An air drive RBC. (Courtesy of US Filter Envirex Products.)

enriched in oxygen, pure oxygen, or anothersource of oxygen to the influent flow.
Because wastewater generation within amanufacturing or other industrial facility isnever steady, day in and day out throughoutthe calendar year, it is necessary to use aneffluent recycle system to maintain a con-stant velocity of flow. A clarifier follows thefluidized bed to separate biological materialthat has sloughed off from the media, as wellas particles of the media itself that get carriedover the effluent weir.
DesignDesign of an attached growth fluidized bedwastewater treatment system is necessarilybased on laboratory and pilot-scale studies.
The choice of media should take intoaccount surface-to-volume ratio, potentialreactivity with substances in the wastewater,and specific weight. Heavier media requiremore pump energy to attain fluidization.
Hybrid SystemsThese systems are a new generation of proc-esses that combine the strengths of sus-pended growth systems with those of fixed-film systems. These systems improve the cap-ture of fines and eliminate the cloudy efflu-ents typical for fixed-film systems, while pro-viding the resilience of fixed-film systemsand their capability to perform well in swingsin flow and load and in the maintenance ofsystem performance following shock loads.Sludge-settling characteristics are improvedin comparison to some suspended growthsystems. The combination allows more bio-mass to be incorporated in a given reactorvolume, decreasing the footprint comparedwith conventional systems.
Moving Bed Bioreactor System (MBBR)This system uses a complete mix activatedsludge reactor with the addition of a floatinginert media. The mixed liquor is removed inconventional secondary clarifiers, and returnsludge is pumped to the head of the aeration
tank as in conventional activated sludge sys-tems. Control of the concentration of MLSSis accomplished through wasting sludgefrom the return sludge stream. A number ofmanufacturers offer proprietary media; seeFigure 7-52. The media provide attachmentsites for attached growth organisms withinthe MLSS.
One advantage of this system is that thevolume, size, and geometry of inert mediacan be varied to meet the specific needs ofthe user in such a way that present needs mayeven be met without media, and growth orexpansion of the industrial process can beaccommodated through the addition ofmedia. The media are retained in the aera-tion tank through the use of proprietaryscreening systems. Some of the manufactur-ers claim that the media cause a shearingaction that enables coarse bubble diffusers toact like fine bubble systems, due to the shear-ing action caused by the floating inert media.
Benefits of MBBR systems include:
• More biomass per unit volume of aera-tion tank
• Flexibility, can add more media withindustrial growth
• Improved settleability• Higher WAS concentration• Retrofit opportunities
Limitations include:
• Pretreatment required to eliminate plug-ging of the screens
• Oil and grease may coat the media
Rotating Biological Contactors (RBC)with RecycleThis system uses traditional RBC shafts in aconventional configuration and adds an aer-ation system and a return sludge stream tocreate a combination fixed-film/suspendedgrowth system. This system is a meld of a tra-ditional activated sludge system and an RBCsystem and offers similar benefits and

improvements to the MBBR systemdescribed previously.
The oxygen and mixing requirements ofthe MLSS may be partially met by the aera-tion and mixing action of the mechanicallydriven rotating shafts. This may reduce theaeration requirements of these systems andoffer a lower operation cost. The benefits andlimitations are similar to the MBBR alterna-tive, with the following additions:
Benefits of the RBC with return include:
• No screens are necessary to contain themedia,
• If baffles are not installed, foam andundesirable organisms will not accumu-late in the reaction tanks, and
• Low energy costs, if mechanically driven.
Limitations of the RBC:
• Traditionally, RBC basins are shallow;oxygen transfer from the diffused aera-tion system will be limited if new basinconfigurations are not provided for theaeration system, and
• If air-driven, then the aeration systemnecessary for the hybrid system is alreadyin place and all that is necessary to create
Figure 7-52 Typical MBBR media, (a) Courtesy of Parkson Corporation, (b) Courtesy of Anox Kaldnes.
(a)
(b)
a hybrid and increase the treatmentpotential of the system is to add returnsludge to the head of the RBC tank.
Treatment of Industrial WastewatersUsing Anaerobic TechnologiesAnaerobic wastewater treatment, accom-plished through microbiological degradationof organic substances in the absence of dis-solved molecular oxygen, has undergone acomplete change in role since the mid-1980s.Used for decades as a slow-rate processrequiring long retention times and elevatedtemperatures, it was considered economi-cally viable on only wastes of high organicstrength. Its principal role in wastewatertreatment was for stabilization of waste bio-solids from aerobic treatment processes. Itwas also used as a treatment step precedingaerobic treatment, in which large, complexmolecules were broken down to more readilybiodegradable substances. It is now used rou-tinely at ambient temperatures on industrialwastewaters with organic strengths as low as2,000 to 5,000 mg/L COD. In fact, the eco-nomic attractiveness of treating wastewatersby first using anaerobic technology and thenpolishing with one of the aerobic technolo-gies certainly has the potential to turn thewastewater treatment world upside down.
More recent developments have enableduse of anaerobic treatment at cold tempera-tures for wastewaters with COD values as lowas 100 to 200 mg/L. Research conductedsince the mid-1970s has shown that, byaddressing the fundamental reasons for theapparently slow treatment capability ofanaerobic systems, modifications could bedeveloped to overcome them. The result hasbeen the development of anaerobic technolo-gies that are capable of treatment perfor-mance comparable to aerobic systems, at sig-nificantly lower overall cost. Additionally,anaerobic systems are capable of treatingsome substances that are not readily treatedby aerobic systems, such as cellulosic materi-
als, certain aromatic compounds, and certainchlorinated solvents.
In this chapter, all microbiological mecha-nisms carried out in the absence of dissolvedmolecular oxygen (O2), whether anoxic ortruly anaerobic, are referred to as anaerobic.In this sense, the term anaerobic simplymeans "in the absence of free, molecular oxy-gen."
Although it can be argued that conclusiveproof has yet to be produced, it is useful, ininterpreting the performance of modernanaerobic treatment technologies, to assumethat the fundamental reason for the appar-ently slow kinetics of anaerobic treatment isjust that—it is a slow microbiological pro-cess. On an individual microorganism-to-organic-molecule basis, anaerobic degrada-tion is slower than aerobic degradation. Themethod by which anaerobic treatment hasbeen made capable of competing with aero-bic treatment has been to greatly increase thenumbers of anaerobic organisms per unit oforganic matter to be treated. For instance, ifaerobic metabolism is 10 times faster thananaerobic metabolism, then the timerequired for complete treatment by eitherprocess can be made nearly equal by increas-ing the number of active anaerobic organ-isms to ten times the number of aerobicorganisms, for a given volume of wastewater.
Figure 7-53 illustrates the means by whichanaerobic treatment has been successfullytransformed from a slow process, comparedwith aerobic treatment, to one with arequired hydraulic retention time that isessentially the same as what is considerednormal for aerobic treatment. Figure 7-53(a)illustrates the "old" type of suspended anaer-obic culture, characterized by large clumps ofbiological solids. The active microorganismscan be found within only a limited thicknessof active biofilm on the surface. Since thesurface-to-volume ratio is small, the totalnumber of active anaerobic microorganismsis small for a given volume of reactor.
Figure 7-53 (b) illustrates two of the newertypes of suspended microbiological cultures.
Next Page

a hybrid and increase the treatmentpotential of the system is to add returnsludge to the head of the RBC tank.
Treatment of Industrial WastewatersUsing Anaerobic TechnologiesAnaerobic wastewater treatment, accom-plished through microbiological degradationof organic substances in the absence of dis-solved molecular oxygen, has undergone acomplete change in role since the mid-1980s.Used for decades as a slow-rate processrequiring long retention times and elevatedtemperatures, it was considered economi-cally viable on only wastes of high organicstrength. Its principal role in wastewatertreatment was for stabilization of waste bio-solids from aerobic treatment processes. Itwas also used as a treatment step precedingaerobic treatment, in which large, complexmolecules were broken down to more readilybiodegradable substances. It is now used rou-tinely at ambient temperatures on industrialwastewaters with organic strengths as low as2,000 to 5,000 mg/L COD. In fact, the eco-nomic attractiveness of treating wastewatersby first using anaerobic technology and thenpolishing with one of the aerobic technolo-gies certainly has the potential to turn thewastewater treatment world upside down.
More recent developments have enableduse of anaerobic treatment at cold tempera-tures for wastewaters with COD values as lowas 100 to 200 mg/L. Research conductedsince the mid-1970s has shown that, byaddressing the fundamental reasons for theapparently slow treatment capability ofanaerobic systems, modifications could bedeveloped to overcome them. The result hasbeen the development of anaerobic technolo-gies that are capable of treatment perfor-mance comparable to aerobic systems, at sig-nificantly lower overall cost. Additionally,anaerobic systems are capable of treatingsome substances that are not readily treatedby aerobic systems, such as cellulosic materi-
als, certain aromatic compounds, and certainchlorinated solvents.
In this chapter, all microbiological mecha-nisms carried out in the absence of dissolvedmolecular oxygen (O2), whether anoxic ortruly anaerobic, are referred to as anaerobic.In this sense, the term anaerobic simplymeans "in the absence of free, molecular oxy-gen."
Although it can be argued that conclusiveproof has yet to be produced, it is useful, ininterpreting the performance of modernanaerobic treatment technologies, to assumethat the fundamental reason for the appar-ently slow kinetics of anaerobic treatment isjust that—it is a slow microbiological pro-cess. On an individual microorganism-to-organic-molecule basis, anaerobic degrada-tion is slower than aerobic degradation. Themethod by which anaerobic treatment hasbeen made capable of competing with aero-bic treatment has been to greatly increase thenumbers of anaerobic organisms per unit oforganic matter to be treated. For instance, ifaerobic metabolism is 10 times faster thananaerobic metabolism, then the timerequired for complete treatment by eitherprocess can be made nearly equal by increas-ing the number of active anaerobic organ-isms to ten times the number of aerobicorganisms, for a given volume of wastewater.
Figure 7-53 illustrates the means by whichanaerobic treatment has been successfullytransformed from a slow process, comparedwith aerobic treatment, to one with arequired hydraulic retention time that isessentially the same as what is considerednormal for aerobic treatment. Figure 7-53(a)illustrates the "old" type of suspended anaer-obic culture, characterized by large clumps ofbiological solids. The active microorganismscan be found within only a limited thicknessof active biofilm on the surface. Since thesurface-to-volume ratio is small, the totalnumber of active anaerobic microorganismsis small for a given volume of reactor.
Figure 7-53 (b) illustrates two of the newertypes of suspended microbiological cultures.
Previous Page

Anaerobic microorganisms are induced togrow on the surfaces of particles that are verysmall, compared with the clumps of biosolidsshown in Figure 7-53(a), or are induced todevelop small beads rather than largeclumps. The surface-to-volume ratios in the(b) illustrations are orders of magnitudegreater than in the (a) illustration. The resultis that there are orders of magnitude moreactive microbes in a given volume of reactorin the newer anaerobic treatment systems.
The question arises, then, as to whetherthis same strategy could be used to make aer-obic treatment even faster. The answer is thatfor aerobic treatment, the rate-limiting stepbecomes oxygen transfer, or getting oxygenfrom the outside air (or in some cases from asource of pure oxygen) to the inside of eachmicrobe. There is no such limitation in thecase of anaerobic treatment. For anaerobictreatment, the sources of oxygen are nitrate,sulfate, and other anions, already present inthe wastewater and in water itself.
The principal cost-saving characteristicsof the newer anaerobic treatment technolo-gies, compared with aerobic technologiessuch as activated sludge, are (1) the absenceof need for aeration, which represents thelargest portion of O&M costs for aerobic sys-tems, and (2) the fact that the amount ofwaste biosolids (sludge) that must be han-dled, dewatered, and disposed of is less than
that for aerobic systems by approximately afactor of ten. Added to these advantages isthe cost recovery capability represented bymethane. Methane recovered from anaerobictreatment processes has routinely been usedas a source of energy to operate motors forpumps or for space heating, either at thetreatment plant itself or in another location.As a general rule, about 5.62 ft of methanecan be harvested as a result of anaerobic deg-radation of one pound of COD.
The reason for the smaller quantity ofwaste biosolids is that anaerobic metabolismis much less efficient, in terms of units of cellgrowth per unit of organic matter metabo-lized, than is aerobic metabolism. Conse-quently, more of the organic matter beingtreated is used for energy, and correspond-ingly less is used for cell growth. For the samereason, correspondingly less nitrogen, phos-phorus, and other nutrients are needed perunit of organic matter removed for treatmentto take place. For most anaerobic treatmentapplications approximately 80% to 90% ofthe COD removed is converted to methaneand carbon dioxide. Five percent or lessbecomes incorporated into new cell proto-plasm, and the balance is lost as heat orrefractory organic "junk."
A corollary to the characteristics of lowrate of conversion of organic material to newcells and low rate of excess biosolids produc-
Figure 7-53 Illustration of the increase in active biomass with decreased size of film support media.
(b)(a)
Growth onsmall particles
Anaerobicorganismsgrown oncolonies ofsmall beads
Film ofActive Biomass

tion is the characteristic of very long meancell residence times, compared with aerobictreatment systems. In many anaerobic treat-ment systems, mean cell residence times,otherwise known as sludge age, are on theorder of 100 to 200 days or more.
Two important characteristics of indus-trial wastewaters regarding their suitability ascandidates for treatment by one of the anaer-obic technologies are alkalinity and sulfurcontent. The anaerobic degradation oforganic substances in industrial wastewatersincludes conversion of complex materials toorganic acids. If the alkalinity within thetreatment system in insufficient, the pH willdecrease to the point of toxicity to the sys-tem's microbial population. Similarly, if thesulfate content of an industrial wastewater ismore than about 200 mg/L, the concentra-tion of hydrogen sulfide, which is a by-prod-uct of the anaerobic degradation process, willincrease to the range of toxicity to the sys-tem's microbial population.
Development of AnaerobicTechnologiesThe development of anaerobic wastewatertreatment from a very slow process to a veryfast treatment process is illustrated in Figure7-54. Hydraulic retention time is used as theindication of treatment speed. The earliestanaerobic reactors were open tanks or openearthen ponds. There was no attempt to con-trol anything. The content of the reactors wassimply allowed to react at its own speed, atwhichever temperature resulted, and todevelop its own characteristics of biosolids,gas production, and inert solids buildup.Eventually, the organic material wouldbecome stabilized (witness the absence ofmassive accumulations of organics aftermany years).
Taking advantage of the fact that, in gen-eral, all biochemical reactions approximatelydouble in rate for every 100C increase in tem-perature, the next generation of anaerobicreactors was managed to attain faster treat-ment performance by heating. Usually, a
degree of mixing was accomplished either asa separate objective or as a fortuitous conse-quence of the heating process. This alsoadded to the increase in treatment efficiencyby increasing the effectiveness of contactbetween the microbes and the organic mate-rial.
Mechanisms of Anaerobic MetabolismAnaerobic treatment of organic wastes can bedescribed as a progression of events that startswith hydrolysis, proceeds through acidogene-sis, and ends with methanogenesis. Theseprocesses are symbiotic in the sense that nonecan proceed for very long without one ormore of the others, explained as follows.
As illustrated in Figure 7-55, complexorganics, such as lipids (fats), proteins,polysaccharides, polynucleotides, and aromat-ics, are first broken down to their elementalbuilding blocks. Hydrolysis is the principalmechanism for this process, and there is noreduction of COD. Exoenzymes secreted by avariety of anaerobes carry out this hydrolysis.The basic building blocks include fatty acidsin the case of lipids, amino acids in the case ofproteins, simple sugars for polysaccharides,nucleic acids for nucleotides, and benzenederivatives for aromatic compounds. Thesebasic building materials are further brokendown, again by hydrolysis, to alcohols andthen to fatty acids of relatively small molecularsize. Acetic acid, plus smaller amounts ofproprionic, butyric, and valeric acids, is theproduct of this process, which is known as aci-dogenesis. Molecular hydrogen is also pro-duced during this process.
The final steps include conversion of theproducts of hydrolysis and acidogenesis tomethane and carbon dioxide. This process isknown as methanogenesis.
The portion of organic matter thatbecomes converted to new microbial cells isnot necessarily represented in Figure 7-55.Some of the intermediate and some of thefinal products of hydrolysis and acidogenesisare diverted to various metabolic pathways ofcell material construction. Most likely, thenew cell material is made via the two-carbon
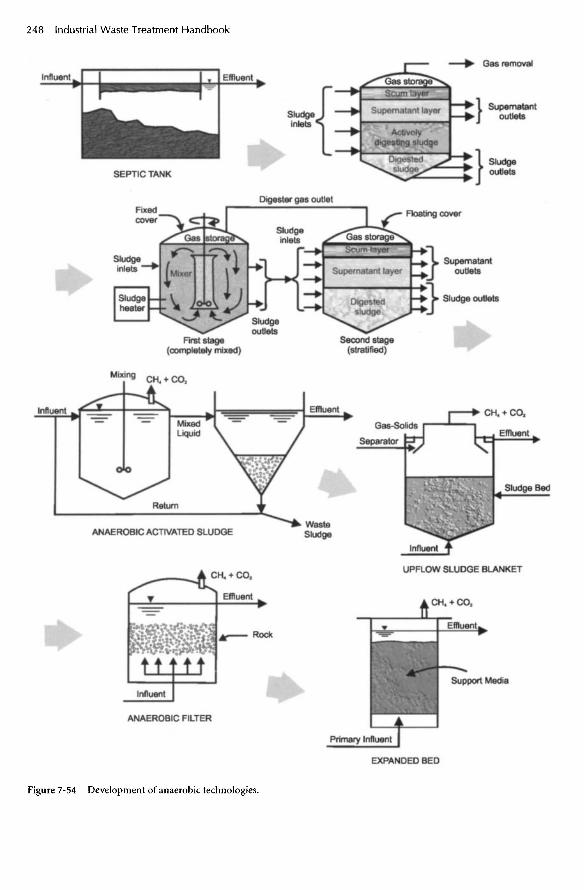
Figure 7-54 Development of anaerobic technologies.
EXPANDED BED
ANAEROBICACTIVATED SLUDGE
SEPTICTANK
EffluentInfluent
Primary InfluentANAEROBIC FILTER
Influent
Effluent
Support Media
Effluent
UPFLOW SLUDGE BLANKET
WasteSludge
Return
SeparatorGas-Solids
Effluent
Sludge Bed
EffluentMixedLiquid
Influent
Mixing
First stage(completely mixed)
Sludgeoutlets
Second stage(stratified)
Sludge outlets
Supernatantoutlets
Sludgeheater
Sludgeinlets '
Sludgeinlets Gas storage"Gas storage*
Fixedcover
Digester gas outletFloating cover
Sludgeoutlets
Sludgeinlets
Supernatantoutlets
Gas removal
Rock

precursor of acetate, which is ethanol, beingcarried into the cells. It is then acted upon bythe cell's construction machinery, whichincludes the RNA, the DNA, and the mito-chondria.
The primary product of the hydrolyticbreakdown of complex organic substances isethanol. At this point, very little, if any, CODhas been removed from the wastewater, and
very little, if any, energy has been captured bythe anaerobes for use in reassembling someof the organic breakdown products into newcell protoplasm. The method used by mostanaerobes to liberate this needed energy is toconvert the ethanol to methane and carbondioxide. This process releases almost 21 kcalper mole of ethanol converted. The anaer-obes cannot convert ethanol directly to
Figure 7-55 The groups of bacteria and the principal transformations performed in converting organic particulates tomethane and carbon dioxide during anaerobic digestion (after Mosey and Mclnerny & Bryant; each rectangle represents abacterial group).
AcetateDecarboxylation
ReductiveMethane Formation
P r o d u c t

methane and carbon dioxide, however, butmust first convert ethanol to acetic acid, withthe consequent release of molecular hydro-gen:
CH3CH2OH + H2O
-> CH3COO" + H+ + 2H2 (7-61)
The acetic acid that is produced directlyby hydrolysis and acidogenesis, as well as thatproduced as shown in equation 7-61, is con-verted to methane and carbon dioxide:
CH3COO" + H+-» CH4 + CO2 + 6.77 kcal/mole (7-62)
The energy made available by this trans-formation, 6.77 kcal/mole of acetate con-verted (minus losses due to inefficiencies), isused by the anaerobes to make new chemicalbonds in the assembly of new cell proto-plasm. There are many products of hydroly-sis and acidogenesis other than acetic acid,however, including ethyl alcohol, propylalcohol, propionic acid, butyl alcohol, andothers. Many of these substances cannot beconverted directly to methane and carbondioxide. Current thinking is that at leastthree species of anaerobeic organisms areinvolved in a three- (or more) step process, atleast one of which is an energy-consumingprocess. The three-step process for conver-sion of ethanol is shown in equations 7-63through 7-65. Equation 7-63 shows that firstethanol is converted to acetate and molecularhydrogen, a process that consumes 1.42 kcalof energy per mole of ethanol converted:
CH3CH2OH + H2O + 1.42 kcal/mole
^ CH3COO" + H+ + 2H2 (7-63)
Then, both the acetate and the hydrogenare converted to methane and carbon diox-ide, each by a different species of anaerobe:
CH3COO" + H+
-» CH4 + CO2 + 6.77 kcal/mole (7-64)
2 H2 + 1/2 CO2
•» 1/2 CH4 + H2O -I- 15.63 kcal/mole(7-65)
As shown, 6.77 kcal of energy per mole ofacetate converted is made available (minuslosses due to inefficiencies) from the conver-sion of acetate to methane and carbon diox-ide. Two and a half times more than that,15.63 kcal/mole, is made available by theconversion of hydrogen and carbon dioxideto methane and water.
As is the case with many microbiologicalmetabolic processes, one of the products ofmetabolism, as shown in equation 7-63, ishighly toxic to the species that carries out theprocess. In the case shown by equation 7-63,the substance that is toxic to the species thatcarries out that reaction is molecular hydro-gen. Consequently, in order for the process tocontinue in an anaerobic reactor, the hydro-gen must be removed by the species respon-sible for the reaction represented by equation7-65, almost as soon as it is formed. The twoanaerobic species are thus symbiotic, sinceone depends on the other for food (molecu-lar hydrogen) and the other depends uponthe first to remove the hydrogen, which istoxic to it. In addition, the two species aresymbiotic in that, by a means that is not fullyunderstood at this time, some of the energyreleased by the reaction shown in equation7-65 is made available and used by the spe-cies that carries out the reaction shown inequation 7-63.
In a manner similar to that shown inequations 7-64 and 7-65, propionic, butyric,and other alcohols and acids are converted tomethane and carbon dioxide with the releaseof energy that can be used for cell synthesis.As an example, equation 7-66 illustrates thebreakdown of propionate to acetate andhydrogen, which are then converted to meth-ane and carbon dioxide, as shown in equa-tions 7-64 and 7-65.
CH3CH2COO" + 2H2O
-> CH3COO" + CO2 + 3H2 (7-66)

Here, again, molecular hydrogen is highlytoxic to the species that carries out the reac-tion shown in equation 7-66. The success ofthe overall process is dependent upon a sym-biotic relationship between two anaerobicspecies, as described above.
Variations of Anaerobic TreatmentSystemsThere are two types of anaerobic wastewatertreatment systems: suspended growth andattached growth, as is the case with aerobicwastewater treatment systems. Attachedgrowth systems are commonly referred to asfixed-film (FF) systems.
Suspended growth systems are those inwhich anaerobic microorganisms feed uponthe organic content of wastewater in a vesselor lagoon that contains no managed supportmedium to which the microorganismsattach. As microbial growth takes place, it isretained in the reactor by settling before thetreated effluent is decanted. The microbesform particles that grow to a size dictated bythe solids management characteristics of thatparticular system. In general, the solids man-agement capability and characteristics differ-entiate between the several types of anaero-bic treatment systems in common use.
Attached growth systems, otherwiseknown as fixed-film systems, have a supportmedium, often called "packing," to which theanaerobic microorganisms attach as theygrow. The media can be stationary or not.Stationary media include rocks, coal, plasticor metal discs, and plastic packing. Sand is anexample of media that is not stationary.
Suspended Growth Systems
Upflow Anaerobic Sludge Blanket (UASB)Figure 7-56 presents a diagrammatic sketchof the UASB system, one of the more techno-logically advanced high-rate anaerobicwastewater treatment systems. These systemsare capable of removing 80% to 90% of CODfrom wastewaters with influent COD con-centrations as low as 2,000 mg/L, with
hydraulic retention times of eight to tenhours.
The distinguishing characteristic of theUASB system is the granular bead, one to twomillimeters in diameter, that contains theanaerobic microbes. These active beads aredeveloped within the anaerobic reactor bythe most basic process that is characteristic oflife itself, natural selection. As wastewater isinduced to flow up through the anaerobicsludge blanket, hydrodynamic drag causesthe blanket to be fluidized or expanded.Because the food is there, under anaerobicconditions, anaerobic microbes of all typeswill use it and experience growth. Those spe-cies that tend, for whatever reason, to forminto solid bead-like structures will becomeincorporated into solids that are too heavy tobe carried up and over the effluent weir.Those that do not tend to form into relativelyheavy solids will be carried up, over the weir,and out of the system. Eventually, themicrobes that tend to form into rather dense,bead-like solids come to predominate thebiological growth and become, themselves,the sludge blanket.
If the velocity of upflow through thesludge blanket is managed by use of effluentrecycle when wastewater flow rate decreases,the bead-like microbial solids that make upthe sludge blanket will rub against oneanother and will continually roll and abradeeach other's surfaces. This action keeps thesizes of the individual beads to within thedesired range and maintains the desired highvalue of "active microorganism-to-organicsubstance," which accounts for the high per-formance of the system.
As illustrated in Figure 7-56, the principalcomponents and operational characteristicsof the UASB system are:
• An influent distribution system• A sludge "blanket" consisting of beads of
active anaerobic (and/or anoxic) micro-organisms, formed as described above
• A gas collection system

• An effluent collection and discharge sys-tem that excludes air from the interior ofthe reactor
As influent wastewater enters the reactorvia the influent distribution system, it flowsup through the sludge blanket. Dependingon the rate of flow, the velocity of the risinginfluent will cause a certain amount ofexpansion of the sludge. Furthermore,depending on the cross-sectional area of thesludge blanket, there will be a certain vari-ability in the distribution of the influentwastewater. There is a choice to be madehere. For a given volume of sludge blanket(i.e., quantity of active microorganisms), thesmaller the ratio of the cross-sectional area ofsludge blanket to its depth, the more uniformwill be the distribution of influent and thegreater the head against which the influentwastewater pump(s) must pump. Recently,design practice has favored deeper sludgeblankets of relatively small cross-section.
Mixed, Heated Anaerobic DigesterThe mixed, heated anaerobic digester, usuallyarranged in two stages, as illustrated in Fig-ure 7-57, is what could be called "the typical'high-rate' sludge digester." It represents anadvanced version of the "old" anaerobictreatment technology, in which only mixingand temperature elevation were used toreduce required hydraulic retention time.The principal objective of mixing was toimprove contact between active microbes
and organic material, often in solid form.The objective of heating was simply to takeadvantage of the fact that almost all micro-bial metabolism doubles in rate for each100C rise in temperature. As an attendingbenefit, some organics, more soluble at theelevated temperature, are more readilymetabolized because of their more directavailability to the microorganisms.
Methane harvested from the treatmentprocess itself is normally used to heat thedigester contents. This accounts for the factthat the process is simply not economicallyfeasible if the organic content is less than thatrepresented by 8,000 to 10,000 mg/L COD.
As shown in Figure 7-57, the first stage ofa mixed, heated anaerobic digester is thereactor. Nearly all of the anaerobic degrada-tion of organics takes place in the first stage.The second stage is not mixed. This stagenormally has a floating cover, and gas pro-duced in the first stage is piped to this vessel.The functions of the second stage are solidsseparated by sedimentation, sludge storage,and gas storage. Clarified supernatant isdecanted and, normally, returned to the headof the treatment system, possibly represent-ing a significant organic and TSS load. Gasand stabilized solids are periodically trans-ferred to processing and final use or disposal.
Anaerobic Contact ReactorThe anaerobic contact reactor is a technolog-ically advanced variation of the "old" mixed,heated anaerobic digester. It is technologi-
Figure 7-56 Upflow anaerobic sludge blanket system (USAB) (drawing courtesy of Biothane Corporation).
A : in f luent
B: S l u d g e B e d
C: Sepa ra to r s
D: Ef f luent
E: B iogas
F: S l u d g e B lanke t

cally advanced in that it attempts to maintaina high ratio of active microbes-to-organicmatter by providing sufficient mixing energyto keep the size of biological solids small byshearing action and by returning "seed"organisms to the reactor from the clarifier.Hydraulic retention times of less than a dayhave been reported with treatment perform-ance approaching 90% removal of COD.
As shown in Figure 7-57, the mixed,heated anaerobic reactor is followed by aclarifier. If a plain sedimentation clarifier isused, it is normally preceded by a degasifier.Otherwise, a vacuum flotation solids separa-
tion device may be used. The raw or pre-treated wastewater enters the anaerobic reac-tor, which is normally operated in the com-pletely mixed mode (CMR). Active anaer-obes are continually recycled back from theclarifier, maintaining high-rate treatmentkinetics.
Anaerobic contact reactors have proven tobe of significant value as a first stage forremoving COD from high-strength wastewa-ters, such as those from meat packing andrendering plants. Subsequent stages haveusually been aerobic. The impressive costeffectiveness of the anaerobic first stage is
Figure 7-57 Mixed-heated anaerobic digester.
First stage(completely mixed)
Second stage(stratified)
Figure 7-58 Anaerobic contact reactor.
Solids recycle
Clarifier
Effluent
Degasifier
Off-gases
Wastewater
Digestedsludge
Fixed cover Digester gas outlet Floating cover
Sludgeinlet
Sludgeheater
MixerSupernatant layer
Gas storage
Slud
geou
tlets
Slud
gein
lets
SLU
DG
E S
UPE
RN
AT
AN
TO
UT
LE
TS
OU
TL
ET
SGas storage

due to (1) the rapid hydrolysis of complexorganics to simple, easy-to-treat compoundswith very little energy input (equation 7-61),(2) the small quantity of excess biosolids thatresults, and (3) the advantageous use that ismade of the heat that accompanies someindustrial wastewaters. This heat would bedetrimental to the aerobic technologies, sincethe saturation concentration of oxygen, andthus the driving force to dissolve oxygen intothe mixed liquor, is significantly lowered.
Fixed-Film Systems
Expanded Bed ReactorThe expanded bed system is among the mosttechnologically advanced anaerobic wastewa-ter treatment options. This technology, illus-trated in Figure 7-59, was developed with theobjectives of (1) achieving the maximumpossible active microbe-to-organic matterratio, (2) optimizing the effectiveness of con-tact between organic substances andmicrobes, and (3) minimizing the energyrequirement to expand, or "fluidize" the bed,as well as to pump wastewater through thesystem.
As illustrated in Figure 7-59, the objectiveof maximizing the (FIM) ratio has beenachieved through use of a "packingmedium," that has a surface-to-volume ratiowhich is as large as possible. The objective ofmaximizing the efficiency of contact betweenmicrobes and organic matter was achieved byutilizing the up flow (fluidized bed) configu-ration. The objective of minimizing theenergy needed to fluidize the bed (expandthe bed, in this case) has been achieved byutilizing material of low specific weight (spe-cific gravity only slightly greater than one) asthe packing medium.
Referring again to Figure 7-59, raw or pre-treated wastewater blended with recycledeffluent is pumped into the bottom of thereactor. A distribution system distributes thismixture as uniformly as possible across thefull cross-section of the reactor. The waste-water then flows up through the packingmedium, which is coated with a thin film of
active anaerobic microbes. As mentionedabove, the velocity of upflow of wastewaterbeing treated has several purposes, and itsvalue is critical to the success of the system.The first purpose is to expand the bed andcause the organic molecules in the wastewa-ter to follow a tortuous path, contactingmany coated grains of the medium. The sec-ond purpose is to carry biological and othersolids that were knocked off the grains ofmedium up through the bed. The third pur-pose is to cause the grains of medium toabrade against one another, rubbing offexcess biological and other solids and, thus,maintaining the active microbes on themedium in as thin a film as possible.
The velocity of upflow through theexpanded bed system, coupled with the recy-cle rate, also determines the hydraulic reten-tion time (HRT). The rate at which microbialsolids are produced, removed from the grainsof medium by the abrasive action of theexpanded bed, and carried up through andout of the bed determines the mean cell resi-dence time, or sludge age.
As the biological and other solids emergefrom the top of the bed, the upflow velocityof flow decreases, due to the absence of solidparticles of the medium from the cross-sec-tion of the flow. Here, the solids are not car-ried upward, but "settle." Solids thus accu-mulate in the settling zone above theexpanded bed and must be removed at a ratethat precludes them from being swept overthe outlet weir at the top of the reactor.
Methane and carbon dioxide gases arecontinually produced within the microbialfilms surrounding the particles of bedmedium. These gases result in bubbles thatgrow in size until their buoyancy carriesthem up and out of the bed. They then risemore slowly through the solids settling zoneand are collected by a device located abovethe settling zone.
Fluidized Bed ReactorThe fluidized bed reactor resembles theexpanded bed system in physical appearanceand differs principally in three respects: (1)

the media used are typically much heavier(sand rather than diatomaceous earth), (2)the velocity of wastewater upflow is signifi-cantly higher (needed to fluidize the heaviermedia), and (3) the amount of expansion issignificantly greater (20% rather than 5%).
Figure 7-60 shows a diagram of an anaero-bic fluidized bed wastewater treatment sys-tem. As shown in Figure 7-60, raw or pre-treated wastewater, combined with recycledeffluent, is pumped through a distributionsystem at the bottom of the reactor and upthrough the media, which might be sand.The upflow velocity serves to expand the bed,which allows any given molecule of water ororganic material to take a tortuous paththrough the bed, contacting many grains ofmedia and, consequently, the microbial filmattached thereto. The upflow velocity of thewastewater also causes the grains of the
media to constantly rub against each other,and the abrasive action keeps the microbialfilm from growing too thick and from bridg-ing between grains to form blockages to flow.Biological and other solids that are knockedloose from the media are carried up throughthe media by the relatively high velocity ofthe upflowing wastewater.
As the wastewater emerges from the top ofthe bed of sand (or other media), the effec-tive cross-sectional area for the flow increasesgreatly due to the absence of solid media.Consequently, the upflow velocity decreasesso that it no longer can carry solids upward.The solids thus "settle" in the zone just abovethe bed.
As methane and carbon dioxide gases areproduced within the microbial films on thesurfaces of the media, bubbles form andgrow in size until their buoyancy carries
Figure 7-59 Anaerobic attached film expanded bed reactor (AAFEB).
Recycle Pump
Distribution
Influent
SludgeDrawoff
Media&
AttachedBiomass
Excess Gas
EffluentClarification
Gas Collection
Digestion
ExpandedBed

Figure 7-60 Anaerobic fluidized bed reactor.
them up through and out of the bed. Thesegas bubbles then rise through the solids set-tling zone and are collected at the top of thereactor. The type of gas collection device isone of the characteristics that distinguishesbetween different proprietary fluidized bedsystems.
Packed Bed ReactorAn anaerobic packed bed reactor consists of avessel (round steel tank, rectangular concretebasin, earthen lagoon, etc.) filled with a sta-tionary solid medium to which microbes canattach and through which wastewater flowsand comes into contact with the microbes.An anaerobic packed bed reactor can beoperated in either the upflow or downflowmode, and effluent recycle can be used toeven out variations in raw wastewater flowrate. Many different types of packing can beused, but the most common are (1) stonesand (2) plastic devices of various shapes. Thedesign objectives of the plastic media includehigh surface-to-volume ratio, structuralstrength, and being nonreactive with anychemical that might be in the wastewater.Figure 7-61 shows a diagram of a packed bedreactor.
Anaerobic LagoonsAnaerobic lagoons are subjected to such ahigh organic loading that anoxic or anaero-bic conditions prevail throughout the entirevolume. The biological treatment processesthat take place are the same as those that takeplace in anaerobic digesters. However, thereis no mixing, no heating, and no attempt tocontrol or manage either the size or locationof the "clumps" of biological solids thatdevelop. Consequently, the progress of treat-ment is relatively slow, although highly costeffective in many applications.
Basically, the typical anaerobic lagoon is arelatively deep earthen basin with an inlet, anoutlet, and a low surface-to-volume ratio. Ifthe basin is not excavated from soil of verylow permeability, it must be lined to protectthe groundwater below. Because of the ever-present potential for problems due to odors,it is usually necessary to cover anaerobiclagoons. Covers have been manufacturedfrom synthetic membranes and Styrofoam.In some cases, the layer of solids that formedon the surface of the lagoon due to floatinggreases, oils, and the products of microbialmetabolism (the scum layer) has successfullyprevented intolerable odor problems.
PrimaryEffluent
Raw or
Recycle
Effluent
Gas

Figure 7-61 Anaerobic packed bed reactor.
Organic loading rates reported for anaer-obic lagoons have varied from 54 to 3,000pounds of BOD5 per acre per day. BOD5
removal performance has varied from 50%to 90%. Lagoon depths have varied from 3.5to 7 feet, and hydraulic detention times havevaried from 4 to 250 days. More typicalorganic loadings have been in the range of1,000 pounds ofBOD5 per acre per day, withBOD5 removals in the range of 70% to 80%.Depths have been typically in the range offive to seven feet. More typical hydraulicdetention times have been in the range of 30to 50 days, and have varied with climate,being longer in colder climates.
Physical Methods of WastewaterTreatment
Physical methods of wastewater treatmentaccomplish removal of substances by use ofnaturally occurring forces, such as gravity,electrical attraction, and van der Waal forces,as well as by use of physical barriers. In gen-eral, the mechanisms involved in physicaltreatment do not result in changes in chemi-cal structure of the target substances. Insome cases, physical state is changed, as in
vaporization, and often dispersed substancesare caused to agglomerate, as happens duringfiltration.
Physical methods of wastewater treatmentinclude sedimentation, flotation, andadsorption, as well as barriers such as barracks, screens, deep bed filters, and mem-branes.
Separation Using Physical BarriersThere are many separation processes thatmake use of a physical barrier through whichthe target pollutants cannot pass, simplybecause of their size. These physical barriersare classified according to the size of the pas-sageways through which all but the targetpollutants (and larger) can pass, and theyrange from bar racks to reverse osmosis. Barracks, screens, and sieves are considered to beeither part of the headworks or part of pri-mary treatment, while filters, microscreens,dialysis processes, and reverse osmosis arenormally considered either secondary or ter-tiary treatment, depending on specific use.
In the cases of the physical barriers withsmaller pores (filters and microscreens, forinstance), particles are often caught on the
PrimaryEffluent
Raw or
Effluent
Recycle
Gas
Next Page

Figure 7-61 Anaerobic packed bed reactor.
Organic loading rates reported for anaer-obic lagoons have varied from 54 to 3,000pounds of BOD5 per acre per day. BOD5
removal performance has varied from 50%to 90%. Lagoon depths have varied from 3.5to 7 feet, and hydraulic detention times havevaried from 4 to 250 days. More typicalorganic loadings have been in the range of1,000 pounds ofBOD5 per acre per day, withBOD5 removals in the range of 70% to 80%.Depths have been typically in the range offive to seven feet. More typical hydraulicdetention times have been in the range of 30to 50 days, and have varied with climate,being longer in colder climates.
Physical Methods of WastewaterTreatment
Physical methods of wastewater treatmentaccomplish removal of substances by use ofnaturally occurring forces, such as gravity,electrical attraction, and van der Waal forces,as well as by use of physical barriers. In gen-eral, the mechanisms involved in physicaltreatment do not result in changes in chemi-cal structure of the target substances. Insome cases, physical state is changed, as in
vaporization, and often dispersed substancesare caused to agglomerate, as happens duringfiltration.
Physical methods of wastewater treatmentinclude sedimentation, flotation, andadsorption, as well as barriers such as barracks, screens, deep bed filters, and mem-branes.
Separation Using Physical BarriersThere are many separation processes thatmake use of a physical barrier through whichthe target pollutants cannot pass, simplybecause of their size. These physical barriersare classified according to the size of the pas-sageways through which all but the targetpollutants (and larger) can pass, and theyrange from bar racks to reverse osmosis. Barracks, screens, and sieves are considered to beeither part of the headworks or part of pri-mary treatment, while filters, microscreens,dialysis processes, and reverse osmosis arenormally considered either secondary or ter-tiary treatment, depending on specific use.
In the cases of the physical barriers withsmaller pores (filters and microscreens, forinstance), particles are often caught on the
PrimaryEffluent
Raw or
Effluent
Recycle
Gas
Previous Page

barrier bridge cross the openings and form afilter themselves. For some substances, thissurface filter is very effective with respect todegree of suspended solids removal, andbuilds to appreciable thickness. Often, thisprocess contributes to longer filter or screen-ing runs. Some substances, however, areprone to clogging the surface of the filter orscreen and are thus not appropriate candi-dates for filtration or screening.
Racks and ScreensScreening is a physical treatment methodthat uses a physical barrier as the removalmechanism. Screening ranges from coarsebar racks, used to remove objects of an inchor more in size, to microscreening, used toremove particles as small as macromolecules(ten or so millimicrons in size).
The success of screening as a treatmentmethod depends on the appropriateness ofthe mesh size of the screening device com-pared with the sizes of the target substances;the clogging characteristics of the materialremoved on the screen; and the self-cleaning,or nonclogging, characteristics of the screen-ing device. Bar racks can either be equippedwith mechanical self-cleaners or must beperiodically cleaned by hand. Smallerscreens, including microscreens, are moredifficult to clean, and the clogging character-istics of the wastewater must always be takeninto account.
Screening is not to be confused with filtra-tion in regard to mechanism of removal.Screening employs the mechanism of physi-cal barrier as the primary removal method.Filtration employs adsorption, sedimenta-tion, and coagulation in conjunction withthe physical barrier.
All screening devices that have mesh sizessmaller than one-half inch must be pilottested before design. The objectives of thepilot test program should include the clog-ging characteristics of both the screen andthe materials in the wastewater, the build-upof head loss over time, and the potential fordamage to the screen.
Bar RacksBar racks, often the first treatment devices tobe encountered by wastewaters en route torenovation, have the primary purpose ofprotecting pumps and other equipment fromdamage. These devices remove objects suchas pieces of product or raw material, brokenor dropped items of maintenance equip-ment, gloves, plastic wrapper material, orother foreign objects that inadvertently gainaccess to the industry's system of drains andsewers. A self-cleaning feature is consideredwell worth the extra cost, since organic andother materials that are objectionable in
Figure 7-62 Bar rack with automatic moving mechanicalcleaning system (photo courtesy of U.S. Filter).

many ways, including production of odors,tend to accumulate on these types of equip-ment. Materials of construction, as theyrelate to corrosiveness of both the wastewaterand the atmospheric environment in whichthe equipment must operate, are vitallyimportant design considerations.
Two types of bar racks in general useinclude racks with stationary bars equippedwith a moving automatic mechanical clean-ing system, and so-called "rack conveyors,"which have a slotted conveyor that passes allbut the target objects. These objects are con-veyed away from the wastewater by "fingers"attached to the slotted conveyor. Figures 7-62and 7-63 show examples of a bar rack withan automatic moving mechanical cleaningsystem and a rack conveyor, respectively.Rack conveyors have been used with exem-
plary success at fish processing plants, tan-neries, woolen mills, and sugar refineries, toname a few.
Vibrating ScreensAn example of a vibrating screen, usedwidely and successfully at vegetable process-ing plants, metal milling shops, and poultryprocessing plants, is the so-called "Swecoscreen," pictured in Figure 7-64. This screenoperates by receiving a wastewater stream atits center. The vibrating action of the screencauses particles or objects larger than themesh size of the screen to migrate to theperiphery, while everything else goes onthrough the screen. Alternative types ofvibrating screens include inclined vibratingscreens and drum-type vibrating screens.
Figure 7-63 Rack conveyor (photo courtesy of U.S. Filter).
SCREEN GRID
BY-PODSUPPORT
HEAD SECTIONWITH DRIVE

Figure 7-64 Vibrating screen (courtesy of SWECO).
Tangential ScreensTangential screens, also known as "sidehillscreens," have the advantage of having nomoving parts. Various devices have beenused to clean these screens while in use,including water sprays, steam blasts, and airblasts.
The tangential screen shown in Figure7-65 operates in the following manner.Wastewater enters the reservoir at the back ofthe screen and, after filling the reservoir,overflows the top of the screen and flowsdown over the inclined face of the screen.Water and solids smaller than the mesh sizeof the screen proceed through the screen tothe collection device, and are then conveyedto the next treatment step. All other solidsslide down the incline to be collected at thebottom. The name derives from the fact thatthe wastewater actually approaches thescreen tangentially as it overflows the reser-
voir at the top of the screen and down theincline until it proceeds through the screen.
Rotating Cylindrical ScreensRotating cylindrical screens are designed tocontinuously clean themselves, using theflushing action of the screened water itself.Figure 7-66 shows a photograph of a typicalrotating cylindrical screen. Figure 7-67 illus-trates how the self-flushing action cleans therotating screen on a continuous basis. Asshown in Figure 7-67, wastewater enters thereservoir on one side of the rotating screen.Water and solids that are smaller than themesh size of the screen flow on through thescreen, while larger solids are carried on thesurface of the rotating screen, over the top,down the side, and are removed by the doc-tor blade located on the side of the screencylinder opposite the raw wastewater reser-voir. Small solids that are caught in thespaces between the wedge-shaped bars that
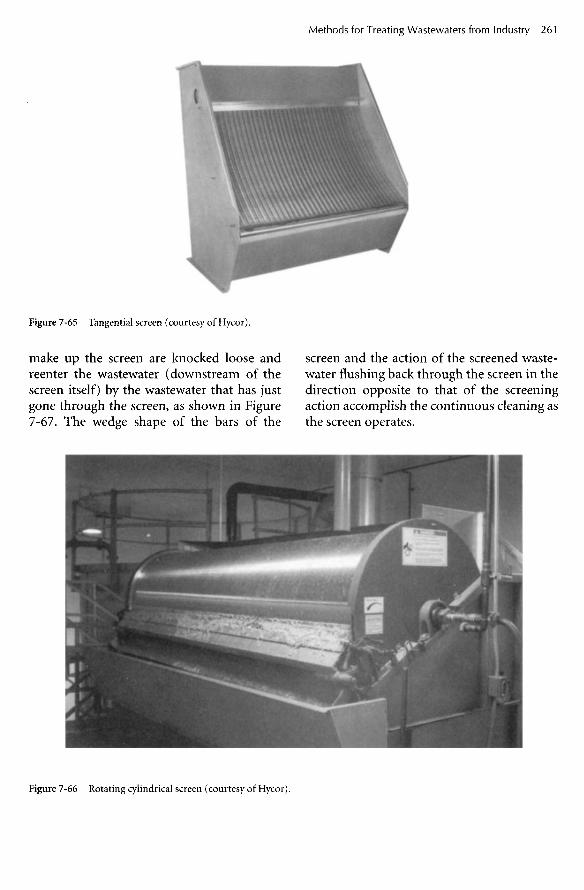
Figure 7-65 Tangential screen (courtesy of Hycor).
make up the screen are knocked loose andreenter the wastewater (downstream of thescreen itself) by the wastewater that has justgone through the screen, as shown in Figure7-67. The wedge shape of the bars of the
screen and the action of the screened waste-water flushing back through the screen in thedirection opposite to that of the screeningaction accomplish the continuous cleaning asthe screen operates.
Figure 7-66 Rotating cylindrical screen (courtesy of Hycor).

Microscreening of the rotating drum. These collected solidsMicroscreening, often called microstraining, flow via a trough to a collection tank. Theis a physical treatment process that closely screened wastewater flows over a weir, which,resembles the rotating screen described as illustrated in Figure 7-68, serves to main-above. The major differences are the size of tain a certain degree of submergence of thethe screen mesh openings and the flow path microscreen. Because of this submergence, ataken by the wastewater being screened. certain amount of screened wastewater flowsScreen mesh openings used by microscreens back through the filter fabric (from the out-are in the range of 20 to 35 m. The filter side to the inside), dislodging particles thatmedium is usually a fabric made of synthetic have been wedged into the mesh. In additionfiber. to this filter fabric cleaning action, there is
As shown in Figure 7-68, the microscreen usually a system of spray nozzles that cleansis a rotating drum with filter fabric around the fabric. In total, the fabric cleaning proc-its periphery. The drum is mounted into one ess consumes from 2% to 5% of the wastewa-wall of a reservoir of wastewater, which ter flow that has already been screened,enters the drum through that end. The Microscreens have been used to removewastewater then flows through the filter fab- algae and other solids from oxidation pondric from the inside to the outside of the effluents, as well as from other types ofdrum. Solids that are too large to pass wastewater treatment lagoons. Reportedthrough the filter fabric are removed from removal performance has usually been in thethe fabric by a mechanism at the highest part range of 50%. Hydraulic loading rates have
Figure 7-67 Rotating cylindrical screen (self-cleaning process).
SOLIDS REMOVEDFROM SCREEN
ACCUMULATEDSOLIDS NOTPASSINGTHROUGHSCREEN
DOCTORBLADE
SCREENEDEFFLUENT
SCREENEDWASTEWATERFLUSHES SOLIDSFROM SURFACEINTO EFFLUENTSTREAM
SOLIDS CAUGHTON SURFACE OFROTATING SCREEN
SURFACE OFROTARY SCREEN
SCREENED WASTEWATER
RA
W W
AST
EW
AT
ER
IN
.

been in the range of 75 to 150 gallons persquare foot of filter medium per minute (gal/ft2/min.).
Plate and Frame FiltersPlate and frame filter presses, normallythought of in the context of waste treatmentas sludge dewatering devices, have been usedwith excellent results as separation processesfor precipitated metals and other substances,immediately following flocculation. A plateand frame filter can also be used, sometimeswith and sometimes without precoat and/orbody feed, as shown in Figure 7-69.
Figure 7-69 presents an illustration of aplate and frame filter press. The feed slurry,which may contain diatomaceous earth oranother "body feed," such as "perlite," entersthe center of each framed cavity. The liquid isforced by pressure created by the feed pumpto proceed through the filter media, whichcan consist of fabric made of natural, syn-thetic, or metal fibers. The target particlesthat, by virtue of their size, cannot gothrough the filter media (fabric plus bodyfeed, if any) accumulate within the framedcavities until the cavities are full, or until theresistance to flow equals or nearly equals the
Figure 7-68 Microscreening process (courtesy of U.S. Filter/Envirex).
Influent
Screenings return
Drum support wheels Screening trough Backwash spray
Grid
Effluent

pressure created by the pump. At this point,the filter run is stopped, and the plates areopened to discharge the accumulated cake.
A principal advantage of using a plate andframe filter press immediately following floc-culation of a precipitated or coagulated sub-stance is that the product is in an easily han-dled form. It is also a noteworthy advantagethat there is no gravity-settling device used,thus eliminating the expense and manpowerneeded for operation and maintenance forthat unit process.
Membrane SeparationMembrane separation processes includemicro filtration (MF), ultrafiltration (UF),nanofiltration (NF), reverse osmosis (RO),dialysis, and electrodialysis. They make useof one or more membranes, which can bethought of as physical barriers betweenphases, through which only limited compo-nents of the phases can pass. These processesare used to separate molecular or ionic spe-cies from waste streams. The properties ofpollutants to be removed that bear upon theappropriateness of these processes, or,indeed, that influence the selection of one ofthese processes over the others, are particlesize, diffusivity, and/or ionic charge. Each ofthese membrane processes functions by wayof something in the wastewater stream pass-
ing through one or more membranes andbeing concentrated in a stream known as the"reject." The treated effluent is less concen-trated in the target pollutants than the influ-ent by an amount that is proportional to thedriving force as well as to the length of timeover which the treatment takes place.
The rejection (removal) capability of agiven membrane is rated on the basis of itsnominal pore size, or molecular weight cut-off (MWCO). MF, UF, and NF membranestypically have pore sizes that allow them toeffectively remove micron-sized (10 m)substances from water. UF membranesremove substances that are 10~9 m and larger.
Nanofilters are usually rated by the small-est molecular weight substance that is effec-tively removed. These substances includeorganic molecules. Molecular shape andpolarity are influential, as well as molecularsize, in determining removal effectiveness.
Reverse osmosis, also referred to as"hyperfiltration," effectively removes ion-sized substances such as sodium, calcium,sulfate, chloride, and nonpolar organic mol-ecules.
Membrane materials are made fromorganic polymers, such as cellulose acetate,polysulfone, polycarbonate, and polyamide,and inorganics, including aluminum oxide(ceramic) and porous carbon. The prepara-
Figure 7-69 Plate and frame filter press (courtesy of U.S. Filter/JWI).

tion of a given polymer can be varied to pro-duce membranes of different porosity, orMWCO. These membranes can be config-ured in stacks of plates, spiral-wound mod-ules, or bundles of hollow fibers. Figure 7-70shows several different configurations inwhich commercial membranes can beobtained.
Probably the greatest deterrent to morewidespread use of membrane processes is thetendency of the membranes to becomefouled, or blocked, by colloidal and othersubstances in wastewater. This phenomenon,sometimes referred to as concentrationpolarization, leads to flux inhibition, or
(a)
Figure 7-70 Commercial membrane configurations, (a) Courtesy of U.S. Filter/Memcore. (b) Courtesy of IDI/InfilcoDegremont, Inc.
(b)

reduction in throughput. Various techniqueshave been, and are being, developed to com-bat this problem, including flow perturba-tions such as back-flushing and pulsing.
Another problem with use of membraneprocesses for wastewater treatment is that ofbiological fouling. Various microorganismscan become deposited on membrane sur-faces, where they can flourish as a result offresh nutrients constantly being transportedto them by action of the treatment processitself. Sometimes, this problem can be con-trolled by disinfection of the wastewater bychlorination, ultraviolet, or other treatment,upstream of the membrane system. Caremust be taken to avoid damage to the mem-brane by the disinfection activity.
Removal MechanismsAs explained above, microfiltration, ultrafil-tration, and nanofiltration are membraneseparation processes that differ principally inthe size range of the target substances. Thesefiltration processes involve physical filtrationof wastewater by using pressure to forcewater molecules through a membrane that isnot permeable to the target substances. Thesetarget substances can vary in size from smallparticles to molecules. While this descriptioncan be applied equally well to reverse osmo-sis, the two processes differ in respect to thetypes of membranes used. There is only verysmall osmotic pressure to overcome in thecase of ultrafiltration, for instance.
The membranes used for ultrafiltrationare not of the "semipermeable" type associ-ated with osmosis. Therefore, although pres-sure is the principal driving force for bothreverse osmosis (RO) and ultrafiltration(UF), the required pressure is significantlyless and the cost for power is less for UE Typ-ical operating pressures for ultrafiltrationsystems vary from 5 to 100 psig, comparedwith 300 to 1,500 psig for RO systems. Whilereverse osmosis has the ability to remove dis-solved ions such as sodium and chloride, aswell as organic molecules and nondissolvedsolids, these filtration processes do notremove low-molecular-weight ions and mol-
ecules. Ultrafiltration and nanofiltration areuseful for removing higher-molecular-weightorganic and inorganic molecules as well asnondissolved solids.
Ultrafiltration has been used in "direct fil-tration" of precipitated metal ions. Thisprocess involves addition of a precipitatingagent, such as sodium hydroxide or sodiumsulfide, followed directly by ultrafiltration.The coagulation and sedimentation steps areeliminated. Ultrafiltration has also been usedto clarify dilute colloidal clay suspensions, aswell as to remove microorganisms.
As with all other applications of treatmentdevices applied to industrial wastewater, anextensive pilot program must be conductedprior to final design. For the purpose of eval-uating preliminary alternatives, it is probablybest to use recommendations of the variousmanufacturers and equipment representa-tives for this developing treatment technol-ogy.
Reverse OsmosisReverse osmosis operates by allowing watermolecules to pass through a membrane thatwill not pass the molecules or ions regardedas pollutants. In any system where two vol-umes of water are separated by a membranethat is pervious to water molecules but not tothe particular molecules or ions that are dis-solved in the water, and the concentration ofthose molecules or ions is greater on one sideof the membrane than it is on the other,water molecules will pass through the mem-brane from the less concentrated volume tothe more concentrated volume, in an attemptto equalize the concentration on each side ofthe membrane, in conformance with the sec-ond law of thermodynamics. This movementof water from one side of the membrane tothe other will cause the depth of water toincrease on one side and decrease on theother, resulting in a differential head, thus,differential pressure, on one side of the mem-brane with respect to the other. The differen-tial pressure will counteract the tendency ofwater to move across the membrane until thepoint is reached that the differential pressure

resisting movement of water through themembrane equals the "pressure" caused bythe desire of the system to equalize the con-centration of all dissolved substances on eachside of the membrane. At that point, equilib-rium is reached, and the net movement ofwater across the membrane will be zero. Thedifferential pressure at equilibrium will beequal to the "osmotic pressure," and isdirectly proportional to the difference inconcentration of dissolved substances in thetwo water volumes.
The process described above, of course, is"osmosis," and it takes place whenever vol-umes of water of different concentrations inone or more dissolved substances are sepa-rated by a membrane (known as a "semiper-meable membrane") that is permeable towater but not to the dissolved substances. Ifthe water on one side of a semipermeablemembrane is very low in dissolved solids,and wastewater is placed on the oppositeside, there will be a relatively strong osmoticpressure tending to drive water moleculesfrom the clean water side to the dirty waterside. Now, if pressure greater than theosmotic pressure is imposed on the dirtywater side, the osmotic pressure will be over-come. Because the membrane is permeableto water molecules, the pressure will forcewater through the membrane, from thewastewater into the clean water compart-ment, against the osmotic pressure, whichincreases in proportion to the increasing dis-solved solids concentration differential. Theresult is concentration of the wastewater andproduction of clean water.
The membrane's ability to pass water mol-ecules but not other ions and moleculesaccounts for the wastewater treatment mech-anism. The osmotic pressure that must beovercome, added to additional pressurerequired to force water molecules throughthe membrane, accounts for the relativelyhigh cost of energy to operate a reverseosmosis wastewater treatment system. Typi-cal operating pressures for RO systems rangefrom 300 to 1,500 psig.
Reverse osmosis systems have been suc-cessfully applied to removing fats, oils, andgreases (FOG), as well as salts and other dis-solved substances, from wastewaters in orderto comply with discharge limitations. In anumber of cases, the substances removed byRO have been successfully recycled andreused, substantially reducing the real costfor this treatment step. In fact, since reverseosmosis is more widely used as a manufac-turing process than for wastewater treat-ment, it should always be considered as partof a wastes reduction or pollution preventionprogram.
ElectrodialysisThe mechanism of separating pollutantsfrom wastewater using electrodialysis is thatof electrical attraction of ions and conse-quent movement through a solution towardan electrode, of opposite charge, combinedwith selective transport of ionic speciesthrough membranes. The driving force iselectrical attraction, and the selectivity of themembranes makes possible the separation oftarget pollutants from wastewater. Figure7-71 presents a diagrammatic representationof an electrodialysis cell. Electrodes of oppo-site charge are on either end of the cell.Within the cell are placed, alternately, cation-permeable and anion-permeable mem-branes. When the cell is filled with wastewa-ter and the electrodes are charged, cationsmigrate toward the cathode, and anionsmigrate toward the anode. In cell 2, cationsmigrate toward cell 1 and are admitted intocell 1 because the membrane between thetwo is cation-permeable. Anions migratefrom cell 2 toward cell 3, drawn by the anode,and are admitted to cell 3 through the anion-permeable membrane. At the same time,anions migrate in cell 1 toward cell 2, drawnby the anode, but are not admitted to cell 2because the membrane between cells 1 and 2is not anion-permeable. Likewise, in cell 3,cations migrate toward cell 2, drawn by thecathode, but are not admitted to cell 2because the membrane separating cells 2 and3 is anion-permeable, not cation-permeable.
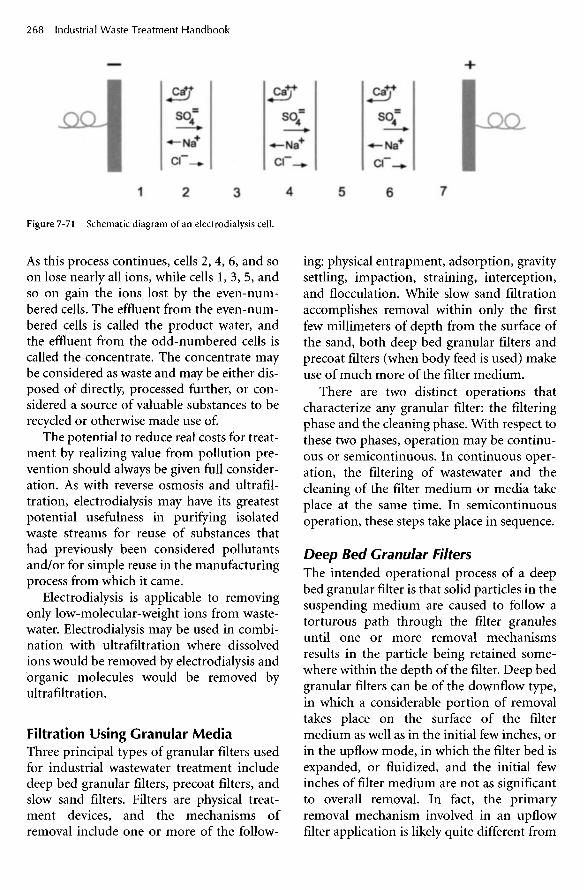
Figure 7-71 Schematic diagram of an electrodialysis cell.
As this process continues, cells 2, 4, 6, and soon lose nearly all ions, while cells 1, 3, 5, andso on gain the ions lost by the even-num-bered cells. The effluent from the even-num-bered cells is called the product water, andthe effluent from the odd-numbered cells iscalled the concentrate. The concentrate maybe considered as waste and may be either dis-posed of directly, processed further, or con-sidered a source of valuable substances to berecycled or otherwise made use of.
The potential to reduce real costs for treat-ment by realizing value from pollution pre-vention should always be given full consider-ation. As with reverse osmosis and ultrafil-tration, electrodialysis may have its greatestpotential usefulness in purifying isolatedwaste streams for reuse of substances thathad previously been considered pollutantsand/or for simple reuse in the manufacturingprocess from which it came.
Electrodialysis is applicable to removingonly low-molecular-weight ions from waste-water. Electrodialysis may be used in combi-nation with ultrafiltration where dissolvedions would be removed by electrodialysis andorganic molecules would be removed byultrafiltration.
Filtration Using Granular MediaThree principal types of granular filters usedfor industrial wastewater treatment includedeep bed granular filters, precoat filters, andslow sand filters. Filters are physical treat-ment devices, and the mechanisms ofremoval include one or more of the follow-
ing: physical entrapment, adsorption, gravitysettling, impaction, straining, interception,and flocculation. While slow sand filtrationaccomplishes removal within only the firstfew millimeters of depth from the surface ofthe sand, both deep bed granular filters andprecoat filters (when body feed is used) makeuse of much more of the filter medium.
There are two distinct operations thatcharacterize any granular filter: the filteringphase and the cleaning phase. With respect tothese two phases, operation may be continu-ous or semicontinuous. In continuous oper-ation, the filtering of wastewater and thecleaning of the filter medium or media takeplace at the same time. In semicontinuousoperation, these steps take place in sequence.
Deep Bed Granular FiltersThe intended operational process of a deepbed granular filter is that solid particles in thesuspending medium are caused to follow atorturous path through the filter granulesuntil one or more removal mechanismsresults in the particle being retained some-where within the depth of the filter. Deep bedgranular filters can be of the downflow type,in which a considerable portion of removaltakes place on the surface of the filtermedium as well as in the initial few inches, orin the upflow mode, in which the filter bed isexpanded, or fluidized, and the initial fewinches of filter medium are not as significantto overall removal. In fact, the primaryremoval mechanism involved in an upflowfilter application is likely quite different from
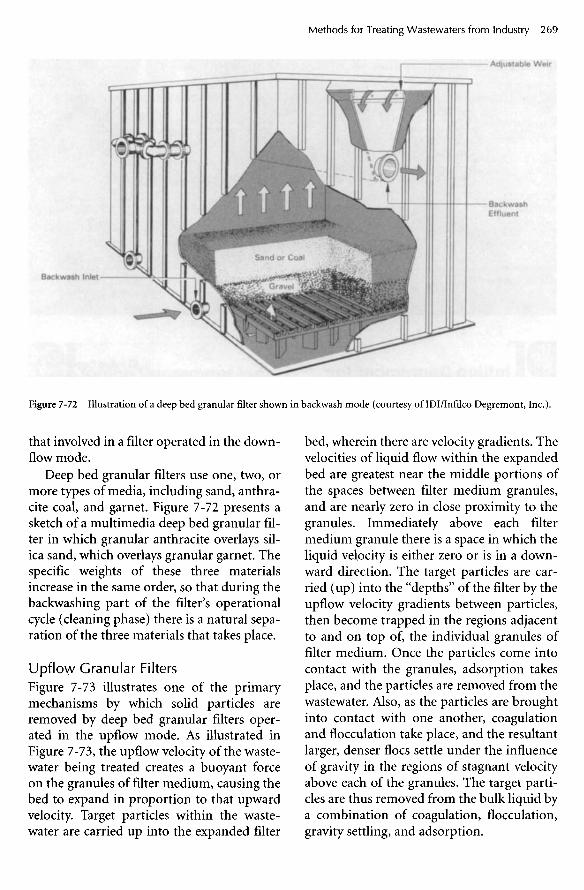
that involved in a filter operated in the down-flow mode.
Deep bed granular filters use one, two, ormore types of media, including sand, anthra-cite coal, and garnet. Figure 7-72 presents asketch of a multimedia deep bed granular fil-ter in which granular anthracite overlays sil-ica sand, which overlays granular garnet. Thespecific weights of these three materialsincrease in the same order, so that during thebackwashing part of the filter's operationalcycle (cleaning phase) there is a natural sepa-ration of the three materials that takes place.
Upflow Granular FiltersFigure 7-73 illustrates one of the primarymechanisms by which solid particles areremoved by deep bed granular filters oper-ated in the upflow mode. As illustrated inFigure 7-73, the upflow velocity of the waste-water being treated creates a buoyant forceon the granules of filter medium, causing thebed to expand in proportion to that upwardvelocity. Target particles within the waste-water are carried up into the expanded filter
bed, wherein there are velocity gradients. Thevelocities of liquid flow within the expandedbed are greatest near the middle portions ofthe spaces between filter medium granules,and are nearly zero in close proximity to thegranules. Immediately above each filtermedium granule there is a space in which theliquid velocity is either zero or is in a down-ward direction. The target particles are car-ried (up) into the "depths" of the filter by theupflow velocity gradients between particles,then become trapped in the regions adjacentto and on top of, the individual granules offilter medium. Once the particles come intocontact with the granules, adsorption takesplace, and the particles are removed from thewastewater. Also, as the particles are broughtinto contact with one another, coagulationand flocculation take place, and the resultantlarger, denser floes settle under the influenceof gravity in the regions of stagnant velocityabove each of the granules. The target parti-cles are thus removed from the bulk liquid bya combination of coagulation, flocculation,gravity settling, and adsorption.
Figure 7-72 Illustration of a deep bed granular filter shown in backwash mode (courtesy of IDI/Infilco Degremont, Inc.).
Backwash Inlet
BackwashEffluent
Adjustable Weir
Sand or Coal

PARTICLES GETCAUGHTINFLOW" E D D Y 1 1 A N D S E T T L E
OUT
ISOLATEDGRANULEOFFILTERMEDIUM
FLOW OFWASTEWATER
Figure 7-73 Removal mechanism of an upflow granular
filter.
There is no widely accepted mathematicalmodel for use in designing an upflow deepbed granular filter as described above. Expe-rience has shown that filter performance is afunction of the filtration rate; the concentra-tion and characteristics of the particles to beremoved; and the size, surface characteristics,density, and other characteristics of the filtermedia. An extensive pilot program is alwaysrequired to develop reliable design parame-ters.
Within the limits allowed by the size andnumbers of filter units available and thequantity of wastewater to be treated, theoperator has the most control over effluentquality by controlling the filtration rate. Ifthe filtration rate is too high, excess solidswill be swept up and out of the filter. If thefiltration rate is too low, there will not beadequate bed fluidization, and the removalmechanisms described above will not be ableto manifest themselves. The most desirablefiltration rate is that which results in thegreatest quantity of satisfactory filtrate, on along-term basis, per unit time of filter use.
Downflow Granular FiltersDeep bed granular filters operated in thedownflow mode remove solid particles bymechanisms that are quite different fromthose that take place in the upflow mode. Inthe downflow mode, particles that aresmaller than the sizes of the pores and pas-sageways between filter medium granules arecarried down into the depths of the filteruntil they contact, and are adsorbed onto,one of the granules of filter medium. Figure7-74 illustrates the currently accepted modelof filtration mechanisms within downflowgranular filters.
Figure 7-74 illustrates that particles aretransported to the vicinity of filter granules(collectors) more or less along the paths offluid streamlines, where attachment, andsometimes detachment, occur. Figure 7-74shows that several transport mechanisms areoperative, including hydrodynamics, diffu-sion, gravity-settling, inertia, and intercep-tion.
As a deep bed granular filter is operated inthe downflow mode, many of the larger par-ticles are intercepted and removed by sieveaction at the surface of the filter bed. Also, tosome extent, these particles bridge acrosseach other and form their own filter, whichfurther filters out new particles brought tothe filter surface. This is the primary removalmechanism in the case of slow sand filters,precoat-body feed filters, and other "surface-type" filters. However, in the case of deep bedgranular filters, it is necessary that the filtra-tion rate be sufficiently high that hydrody-namic forces carry most of the particles pastthe media surface and into the depths of thefilter, where the mechanisms of diffusion,sedimentation, interception, etc., as illus-trated in Figure 7-74, lead to attachment and,thus, removal.
In the case of precoat-body feed filters,described in more detail below, the filter bedcontinually builds in depth as the filter runprogresses, and there is a continuallyrenewed "surface" on which to collect parti-cles by sieving action.

Filtration rate, then, is a critical opera-tional parameter in downflow filters as wellas up flow filters. In the case of downflow fil-ters, too low a filtration rate will result in toomuch removal of solids in the upper layers ofthe filter. The head loss will become too highfor further operation before the deeper por-tions of the filter are made use of. Too high afiltration rate, on the other hand, will resultin flushing too many solids through the filter,causing the filtrate to be unacceptable.
Head loss is a major operational factor inthe case of downflow granular filters, since itis hydraulic head, or pressure, that causesflow through the filter. As particles areremoved on and in the filter, resistance to
flow through the filter increases. This resis-tance to flow manifests itself in hydraulichead loss. Eventually, head loss builds to thepoint where the rate of flow through the filter(filtration rate) is unacceptable, and the par-ticles must be removed by backwashing. Usu-ally, previously filtered water is used forbackwashing. The backwash water ispumped through a manifold and distribu-tion system at the bottom of the filter. Thebackwashing rate of flow is sufficient toexpand the bed so that the scouring action ofhydrodynamic forces and the filter mediumgranules bumping and rubbing against eachother dislodge the particles removed duringfiltration. The upflowing backwash then
Figure 7-74 Removal mechanism of a downflow granular filter.
Adsorption
Bridging
FLOWOFWASTEWATER

carries the removed solids up and out of thefilter media and into a trough or other collec-tion device above the expanded filter bed.
Auxiliary scouring is sometimes necessary,and is normally provided by one or a combi-nation of high-pressure sprays onto the sur-face layers of the filter medium, mechanicalstirring or racking within the filter bed, andthe introduction of air bubbles at the bottomof the filter.
Downflow deep bed granular filters areoperated either as constant head with declin-ing rate of flow or as constant rate of flowwith either increasing head or constant headloss. Constant head loss is achieved by use ofan artificial head loss device, such as a valveon the outlet that gradually decreases itseffect to maintain a constant total head lossacross both the filter and the valve during thefilter run. Constant rate of flow with increas-ing head is achieved by either graduallyincreasing the depth of water over the filterthroughout the filter run or by applying pres-sure with air or a pump to an enclosed filterinfluent chamber. It is common practice toattach a manifold that applies water at a con-stant head to each of several parallel filtersthat then operate in the declining rate of flowmode. As the head loss in one filter increases,more flow proceeds to the other filters untilthe flow rate through the entire group of fil-ters becomes unacceptable, either because ofinadequate total filtration rate or because ofunacceptable filtrate quality. At this point,backwashing takes place.
Often, filter performance can be signifi-cantly improved by use of chemical coagu-lants. It is critically important to provide ade-quate and appropriate chemical feed andrapid mixing, but it is not necessary to provideslow mixing (flocculation), since flocculationtakes place very effectively within the filter ineither the upflow or downflow mode. Thismode of operation, referred to as direct filtra-tion, can be used when the load to the filter isnot such that it would be less expensive in thelong term to provide a solids removal stepconsisting of chemical feed, rapid mix, slow
mix (flocculation), and gravity settling priorto filtration. One technique for removal ofphosphorus, as explained in the section onchemical methods of wastewater treatment, isto add alum prior to the filter.
Deep bed granular filters, both upflowand downflow, can be operated in configura-tions where the filtration media are continu-ously washed. Sometimes referred to as"moving bed filters," these systems haveworked well in certain applications. Usually,a reasonably constant solids loading is desir-able for successful continuous washing appli-cations.
Figure 7-75 shows four types of deep bedgranular filters.
A. FeedB. Opening between
feed pipeand airlift house
C. Feed radialsD. Sand bed
E. Filtrate exitF. Airlift pipeG. Top of airliftH. Central reject
compartmentI. Washer/separatorJ. Filtrate weirK. Reject weirL. Continuous reject
exit.
Figure 7-75 Granular filters for industrial waste (courtesyof Parkson Corporation)

FilteringWash Trough
Influent Piping
Filter Bay
Effluent Piping
Fre-FloUnderdrain
Figure 7-75 Granular filters for industrial waste (both courtesy of IDI/Infilco Degremont, Inc.).
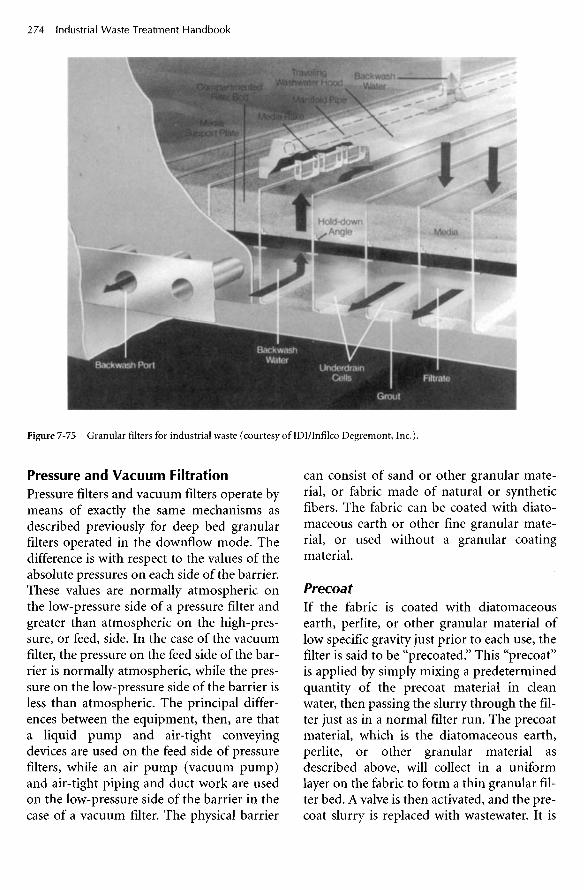
Pressure and Vacuum FiltrationPressure filters and vacuum filters operate bymeans of exactly the same mechanisms asdescribed previously for deep bed granularfilters operated in the downflow mode. Thedifference is with respect to the values of theabsolute pressures on each side of the barrier.These values are normally atmospheric onthe low-pressure side of a pressure filter andgreater than atmospheric on the high-pres-sure, or feed, side. In the case of the vacuumfilter, the pressure on the feed side of the bar-rier is normally atmospheric, while the pres-sure on the low-pressure side of the barrier isless than atmospheric. The principal differ-ences between the equipment, then, are thata liquid pump and air-tight conveyingdevices are used on the feed side of pressurefilters, while an air pump (vacuum pump)and air-tight piping and duct work are usedon the low-pressure side of the barrier in thecase of a vacuum filter. The physical barrier
can consist of sand or other granular mate-rial, or fabric made of natural or syntheticfibers. The fabric can be coated with diato-maceous earth or other fine granular mate-rial, or used without a granular coatingmaterial.
PrecoatIf the fabric is coated with diatomaceousearth, perlite, or other granular material oflow specific gravity just prior to each use, thefilter is said to be "precoated." This "precoat"is applied by simply mixing a predeterminedquantity of the precoat material in cleanwater, then passing the slurry through the fil-ter just as in a normal filter run. The precoatmaterial, which is the diatomaceous earth,perlite, or other granular material asdescribed above, will collect in a uniformlayer on the fabric to form a thin granular fil-ter bed. A valve is then activated, and the pre-coat slurry is replaced with wastewater. It is
Figure 7-75 Granular filters for industrial waste (courtesy of IDI/Infilco Degremont, Inc.).

important that the hydraulic pressure used toprecoat be maintained continuously from thestart of the precoat process to the end of thefilter run to maintain the integrity of the pre-coat.
Body FeedAfter the precoat has been applied, and theprocess of filtering the wastewater throughthe precoat has commenced, a prescribedconcentration of the same material as usedfor precoat (diatomaceous earth, perlite, orother granular material) is added to thewastewater. Figure 7-76(a) shows that aslurry of filter media can be metered in to thestream of wastewater as it is being pumped tothe filter. Figure 7-76(b) shows that, alter-nately, a predetermined amount of the filtermedium can be mixed into the wastewaterthat is to be filtered by use of a mixing tank.The mixing tank can be of a size that holdsone day's contribution of wastewater, one fil-ter run, or another convenient cost-effectivesize.
Figure 7-77 illustrates the way in whichthe granules of body feed add to the thick-ness of the precoat to develop a filter ofincreasing depth as the filtration process pro-ceeds in time. As shown in Figure 7-77, thegranules of body feed, which are evenly dis-persed throughout the wastewater, collect onthe outside of the precoated filter supportsurface as the wastewater is forced through.These granules thus build a filter of ever-increasing thickness, preventing the originalprecoat from blinding over with suspendedsolids from the wastewater. Rather, the sus-pended solids, which are the target pollutantsintended to be removed by the filter, areremoved in the ever-increasing depth of thebody feed filter as it builds.
Pressure or vacuum filters (examples ofwhich are shown in Figure 7-78) are rou-tinely used to remove solids from diluteindustrial wastewaters, usually with chemicalconditioning, as well as to dewater sludges.One common use of pressure or vacuum fil-ters is to dewater precipitated metals.
SLURRYOFBODYFEED
FILTEREDEFFLUENT
FILTER
WASTE-WATER
SLURRY OF BODY FEED
FILTERFILTEREDEFFLUENT
(a)
(b)
MIXER
WASTEWATER
Figure 7-76 (a) Body feed added to precoat filter, (b) Body feed added to mixing tank.

WASTEWATER
FLOW
BODYFEEDCOLLECTSANDBUILDS HLTER
FILTER SUPPORT
PRECOATGRANULESOFBODY FEED
Figure 7-77 Body feed increases filter depth.
Figure 7-78 Pressure and vacuum filters, (a) Courtesy of IDI/Infilco Degremont, Inc.
(a)

Vertical Filters Influent
Underdrain Piping
Effluent
(b)False Bottom
Horizontal Filters Influent Air Relief Air Release
Upper Baffle
False BottomD-20Nozzles
Manhofe(c)Effluent
Air inlet
Swimming Pool FiltersIn some cases of short-term need, an off-the-shelf packaged, automated deep bed granularor septum-type filter assembly, intended forswimming pool use, is a cost-effective alter-native to achieve treatment by filtration.These items are inexpensive and are designedand constructed to provide reliable, auto-mated service for a few years, assuming anonaggressive water mixture.
Packaged Water Treatment SystemsThere are many packaged treatment systemsthat were designed and manufactured for thepurpose of treating potable water. Many ofthese systems can be used to treat many dif-ferent industrial wastewaters, with little or nomodification. Some wastewaters that are can-didates for these systems include dilute,small-volume process wastes, stormwater
Figure 7-78 Pressure and vacuum filters, (b, c) Courtesy of IDI/Infilco Degremont, Inc.

MEDIAFLUIDIZATfON
VEICT
FILTERMEDIA
SCRUBBERSCREEN andHOZZLB
SUPPORTSCREEN
DIRTYWATERINLET
MEDIAOUTLET
CONTAMiNANTDISCHARGE
CLEAM WATER OUTLET (d)DRAIN
Figure 7-78 Pressure and vacuum filters, (d, e) Courtesy of Eimco Process Equipment, a Baker Hughes Company.
(e)

runoff, contaminated groundwater, andcooling water.
Several issues must be thoroughlyaddressed during the concept or preliminarydesign phase of such a project, including cor-rosivity, effects of any hazardous materials;or other properties, such as heat, intermit-tent flow, color, susceptibility to weather, andvariability of wastewater characteristics.
Slow Sand FilterSlow sand filters are characterized by a load-ing rate that is significantly lower than themore conventional (sometimes referred to as"rapid sand filter") filter described earlier. Ingeneral, slow sand filters are useful for pol-ishing small quantities of treated wastewater,water that has been used for scrubbing gasesand is to be either discharged or renovatedfor another use, or simply as a final "emer-gency" barrier before discharge of water thatis normally very clean.
Slow sand filters are loaded at ratesbetween two and four gallons per day persquare foot of filter surface area. Bed depthsare typically two to four feet.
The mechanisms of removal in slow sandfiltration include entrapment, adsorption,biological flocculation, and biological degra-dation. In fact, one of the reasons for the verylow hydraulic loading rate of slow sand filter isto allow aerobic conditions within the firstinch or two of the sand filter depth. The aero-bic conditions allow for aerobic and, thus, rel-atively complete, biological removal of theorganic portion of the material removed fromthe waste stream. Sand filters are cleaned peri-odically by removal of the top one-half to twoinches of sand from the surface.
Plain SedimentationPlain sedimentation can be described as theseparation of particulate materials fromwastewater as a result of the influence ofgravity. The more quiescent (nonmoving)the hydraulic regime, the more effective isthis removal process; therefore, a principalobjective of plain sedimentation equipmentis to produce "quiescent conditions." Theprocess of plain sedimentation is oftenreferred to as "clarification," and the devicesused to accomplish plain sedimentation arecalled "clarifiers" or "settling tanks."
Figure 7-78 Pressure and vacuum filters, (f) Courtesy of Waterlink Separators, Inc.
(f)

There are three modes by which particlesundergo the plain sedimentation process:discrete settling, flocculent settling, and zonesettling. Discrete settling is that process bywhich individual particles proceed at a steadyvelocity, governed principally by the specificgravity of the particle and the viscosity of thewastewater, toward the bottom of the settlingdevice. The settling of sand in water is anexample of discrete settling. Flocculent set-tling is undergone by particles, often organic,that agglomerate to larger, faster-settling par-ticles as the settling process takes place overtime. The settling of activated sludge in theupper several feet of a secondary clarifier (aclarifier that follows, hydraulically, an acti-vated sludge aeration tank or a fixed growthtreatment process) is an example of floccu-lent settling. Zone settling is typically under-gone by a suspension of relatively concen-trated solid particles (sludge) as it concen-trates even more. The vertical distance anindividual particle moves decreases withincreasing depth in the sludge mass itself.
The overall objective of any physicalwastewater treatment device, including clari-fiers, is to remove as much solid material aspossible, as inexpensively as possible, with aresulting sludge that has as low a water con-tent as possible. The final residuals of thetreatment processes must undergo final dis-posal, and it is usually the case that the costof final residuals disposal is proportional tosome degree to the water content.
Discrete SettlingUnder the influence of gravity, a particleimmersed in a body of fluid will acceleratedownward until the forces relating to viscos-ity that resist its downward motion equal theforce due to gravity. At this point, the particleis said to have reached terminal velocity,described by equation 7-67:
(7-67)
where
Vs = Velocity of sedimentation (ft/sec)g = Acceleration due to gravity (ft/sec2)s = Density of the particle (lb/ft3)I = Density of the fluid (lb/ft3)
D = Diameter of particle (ft)CD = Coefficient of drag
The coefficient of drag, CD, is dependentupon a number of factors, including thediameter of the particle, if hydraulic turbu-lence is significant within the settling device.For the small size of particles usually encoun-tered in clarification of industrial wastewater,and the relatively low turbulence encoun-tered in a well-operating clarifier, the rela-tionship presented in equation 7-68 is con-sidered to hold:
(7-68)
where
NR = Reynolds number
Because Reynolds number increases withincreasing turbulence of the fluid, it is seenthat the settling velocity, analogous to therate of clarification, increases with decreasingturbulence.
There are interesting relationships, asshown by Hazen and Camp, between particlesettling velocity, the surface loading of a clar-ifier, and the theoretical effect of depth of theclarifier on particle removal efficiency. Theserelationships are based on the conditions of auniform distribution of particles throughoutthe entire clarifier at its influent end, and ofwhether a particle can be considered to beremoved as soon as it reaches the bottom ofthe clarifier. If the rate of settling, expressedas vertical distance settled per unit of hori-zontal distance of forward flow (in ft/ft) of aparticle in a clarifier is multiplied, top andbottom (numerator and denominator), bythe rate of wastewater flow, in cubic feet per

Figure 7-79 Illustration of the effect of increasing clarifier depth.
day, the units of gallons per day can be devel-oped in the numerator, and the units of area,or square feet, can be developed in thedenominator.
Therefore, equation 7-69 can be written:
vs(ftift)7 (7-69)
= surface loading rate (GPDlft1)
which states that particle settling velocity, inft/ft, is numerically equivalent to a termcalled "surface loading rate," having theunits, gallons (of wastewater) per square foot(of clarifier surface area) per day, indicatingthat only clarifier surface area, to the exclu-sion of clarifier depth, is of significance to theperformance of a clarifier.
Figure 7-79 illustrates that the majoreffect of increasing clarifier depth is simply toincrease the time it takes to remove a givenparticle, rather than to have any effect onremoval effectiveness or efficiency.
Figure 7-79 illustrates that all particleswith settling velocities equal to or greaterthan Vs will be completely removed. All parti-cles having settling velocities less than Vs willbe removed as described by the ratio V/Vs.
Flocculent SettlingMany solid particles found in wastewaterstend to agglomerate as they settle under qui-escent hydraulic conditions, and becausethey become denser as they coagulate andagglomerate, their terminal velocitiesincrease over time. The paths followed bysolid particles undergoing flocculent settling,then, are illustrated in Figure 7-80.
Often, a given industrial wastewater willcontain a mixture of solids; some settle asdiscrete particles and others undergo floccu-lent settling. When sufficient particles reachthe lower portion of the clarifier, the accu-mulated mass ("sludge blanket") undergoeszone settling. Normally, either discrete orflocculent settling predominates in the upperportion of the clarifier and, therefore,becomes the basis for design. Those gravityclarification devices that combine the pro-cesses of primary sedimentation and sludgethickening are called "clarifier-thickeners."For these devices, the thickening characteris-tics of the settled sludge are also a basis fordesign.
Sludge ThickeningOnce solids have settled under the influenceof gravity, they must be removed from thebottom of the clarifier and ultimately dis-posed of. In order to reduce the cost of han-dling this material, it is desirable to reducethe moisture content, and thereby the vol-ume, to a minimum as soon as practicable.To this end, "gravity-thickeners" are oftendesigned and built as integral components ofwastewater treatment systems. Some clarifi-ers incorporate a thickening capability intothe sludge zone and are thus called "clarifier-thickeners."
Kynch, Talmage and Fitch, Behn and Lieb-man, and Edde and Eckenfelder have devel-oped various methods for predictingperformance of thickeners based on results oflaboratory bench-scale tests. These thickeningtests have the common procedure of usingstandard two-liter graduated cylinders, which
Next Page

Figure 7-79 Illustration of the effect of increasing clarifier depth.
day, the units of gallons per day can be devel-oped in the numerator, and the units of area,or square feet, can be developed in thedenominator.
Therefore, equation 7-69 can be written:
vs(ftift)7 (7-69)
= surface loading rate (GPDlft1)
which states that particle settling velocity, inft/ft, is numerically equivalent to a termcalled "surface loading rate," having theunits, gallons (of wastewater) per square foot(of clarifier surface area) per day, indicatingthat only clarifier surface area, to the exclu-sion of clarifier depth, is of significance to theperformance of a clarifier.
Figure 7-79 illustrates that the majoreffect of increasing clarifier depth is simply toincrease the time it takes to remove a givenparticle, rather than to have any effect onremoval effectiveness or efficiency.
Figure 7-79 illustrates that all particleswith settling velocities equal to or greaterthan Vs will be completely removed. All parti-cles having settling velocities less than Vs willbe removed as described by the ratio V/Vs.
Flocculent SettlingMany solid particles found in wastewaterstend to agglomerate as they settle under qui-escent hydraulic conditions, and becausethey become denser as they coagulate andagglomerate, their terminal velocitiesincrease over time. The paths followed bysolid particles undergoing flocculent settling,then, are illustrated in Figure 7-80.
Often, a given industrial wastewater willcontain a mixture of solids; some settle asdiscrete particles and others undergo floccu-lent settling. When sufficient particles reachthe lower portion of the clarifier, the accu-mulated mass ("sludge blanket") undergoeszone settling. Normally, either discrete orflocculent settling predominates in the upperportion of the clarifier and, therefore,becomes the basis for design. Those gravityclarification devices that combine the pro-cesses of primary sedimentation and sludgethickening are called "clarifier-thickeners."For these devices, the thickening characteris-tics of the settled sludge are also a basis fordesign.
Sludge ThickeningOnce solids have settled under the influenceof gravity, they must be removed from thebottom of the clarifier and ultimately dis-posed of. In order to reduce the cost of han-dling this material, it is desirable to reducethe moisture content, and thereby the vol-ume, to a minimum as soon as practicable.To this end, "gravity-thickeners" are oftendesigned and built as integral components ofwastewater treatment systems. Some clarifi-ers incorporate a thickening capability intothe sludge zone and are thus called "clarifier-thickeners."
Kynch, Talmage and Fitch, Behn and Lieb-man, and Edde and Eckenfelder have devel-oped various methods for predictingperformance of thickeners based on results oflaboratory bench-scale tests. These thickeningtests have the common procedure of usingstandard two-liter graduated cylinders, which
Previous Page
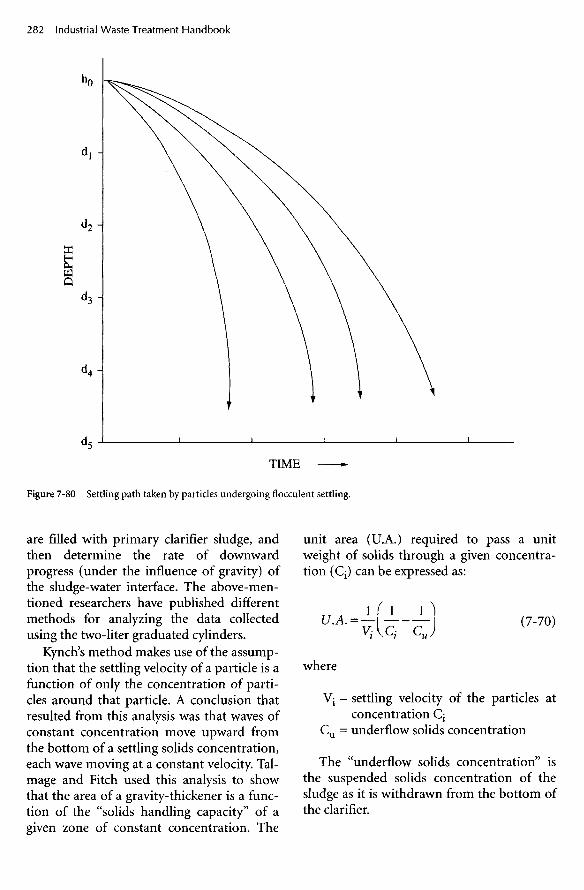
are filled with primary clarifier sludge, andthen determine the rate of downwardprogress (under the influence of gravity) ofthe sludge-water interface. The above-men-tioned researchers have published differentmethods for analyzing the data collectedusing the two-liter graduated cylinders.
Kynch's method makes use of the assump-tion that the settling velocity of a particle is afunction of only the concentration of parti-cles around that particle. A conclusion thatresulted from this analysis was that waves ofconstant concentration move upward fromthe bottom of a settling solids concentration,each wave moving at a constant velocity. TaI-mage and Fitch used this analysis to showthat the area of a gravity-thickener is a func-tion of the "solids handling capacity" of agiven zone of constant concentration. The
Figure 7-80 Settling path taken by particles undergoing flocculent settling.
TIME
DE
PTH
unit area (U.A.) required to pass a unitweight of solids through a given concentra-tion (Q) can be expressed as:
(7-70)
where
Vj = settling velocity of the particles atconcentration Cj
C11 = underflow solids concentration
The "underflow solids concentration" isthe suspended solids concentration of thesludge as it is withdrawn from the bottom ofthe clarifier.

Behn and Liebman developed a relation-ship for the depth of the sludge compressionzone as a function of the initial sludge con-centration, rate of elimination of water fromthe mass of compressing sludge, dilutionratio, specific gravities of the solids andwater, underflow concentration, and thick-ener area.
Edde and Eckenfelder developed a proce-dure for scale-up from bench-scale results todesign parameters for prototype thickeners.Thickener design is based upon the followingmathematical model relating thickener massloading (ML) to underflow concentration
(Cu):
(7-71)
The depth of sludge in a batch test (D^) isrelated to depth of sludge in the prototype(Dt) based on conditions observed in thefield.
The design procedure presented belowmakes use of a "settling column" (for discreteand/or flocculant settling) and a two-litergraduated cylinder (for sludge thickening) toobtain laboratory data for use in design of anindustrial wastewater clarifier- thickener.
Design ProcedureFigure 7-81 shows a standard laboratory set-tling column used to generate data for use indesigning a clarifier. Figure 7-82 shows aphotograph of a settling column in use. Usu-ally, two or more six-inch diameter transpar-ent plastic pipe sections are bolted togetherto make a column that is 12 to 16 feet long.The column is fitted with sampling ports ateach foot of depth when the pipe is standingon end. A plate seals the bottom, and a clean-out port is located as close to the bottom aspossible.
The settling column is filled with mixed,raw wastewater and allowed to achieve quies-cent conditions. At intervals of 5 to 15 min-utes, samples are withdrawn from each of thesample ports for suspended solids analysis.
Figure 7-81 Settling column.
Figure 7-83 presents a plot of the results ofsuspended solids analyses obtained at pro-gressive time intervals from each of the sam-pling ports in the settling column. Lines thatconnect the data points from each samplingport represent given fractions of TSS removaland describe the approximate path thatwould be taken by particles settling in anideal settling tank (no physical or other influ-ences on the settling particles other thangravity and viscous resistance to motion).The data plotted in Figure 7-83 are analyzed,and criteria for design of a clarifier are devel-oped, as shown in the following example.
SAMPLING PORT
CLAMP

Figure 7-82 Settling column.
Example 7-6: Development of designcriteria for a clarifier-thickenerUsing a standard settling column and theprocedures described by Eckenfelder andFord develop design criteria for the settlingportion of a combination clarifier-thickenerto remove and concentrate suspended solidsfrom wastewater from a paper mill. Usingstandard two-liter graduated cylinders,develop design criteria for the sludge-thick-ening portion of the combination clarifier-thickener.
Solution: Raw wastewater was collectedfrom the paper mill effluent at an integratedkraft pulp and paper mill. The standard set-tling column shown in Figure 7-81 was filled
with the (well-mixed) wastewater, and quies-cent conditions were allowed to develop.Then, samples were withdrawn from each ofthe ports simultaneously at various timeintervals. Each sample was analyzed for sus-pended solids concentration. The BOD5 wasdetermined on samples from the port locatedthree feet below the top of the column. Twoof these procedures were carried out, one at atemperature of 3.5°C and another at 18.5°C
The data thus developed were plotted asshown in Figures 7-84 and 7-85. Figure 7-84presents the results of data from the proce-dure performed at the temperature of 3.5°C.Figure 7-85 presents the results of data takenat 18.5°C. Comparison of these results shows

that higher settling rates were obtained at thehigher temperature, a result to be expecteddue to the higher viscosity, thus greater drag,and thus slower settling of particles throughthe more viscous medium at the lower tem-perature.
Figure 7-86 presents suspended solidsremoval versus detention time for the waste-water at 3.5°C and at 18.5°C. The corre-sponding overflow rates are presented in Fig-ure 7-87. BOD5 removal as a function of sus-pended solids removal is presented in Figure7-88. These results, as expected, show thatBOD5 removal increased with increasing sus-pended solids removal but at a decreasingrate, as the limit OfBOD5 contributed by sus-pended solids (as opposed to dissolvedorganics).
These three figures, then, are the principalproduct of the settling column analysis pro-cedure. The next step is to determine the costfor the different 'sizes of clarifier, as deter-
mined by overflow rate and the desired per-cent removal of suspended solids and/orBOD5.
Thickener Portion of Clarifier-ThickenerSamples of primary clarifier sludge were col-lected at a paper mill that was very similar intype of manufacturing process to the mill forwhich the column-settling analyses presentedabove were being performed. The samples ofsludge were diluted (with primary effluent)to the desired initial suspended solids con-centration, then placed in the two-liter grad-uated cylinders. The initial suspended solidsconcentration, temperature, and specificweight of the water were determined for eachcylinder. The liquid-solids interface level wasrecorded at regular intervals until a constantlevel was reached. The results of these dataare presented in Figure 7-89, which presentsplots of solids-liquid interface height versustime for four initial sludge concentrations.
Figure 7-83 Plot of percent removal of TSS at given depths versus time (settling column analysis).
TIME, MIN.
DE
PTH
, ft

DE
PT
H, f
t.D
EP
TH
, ft.
Figure 7-84 Solids removal for depth versus time (3.5°C).
TIME, min.
TIME, min.
Figure 7-85 Solids removal for depth versus time (18.5°C).
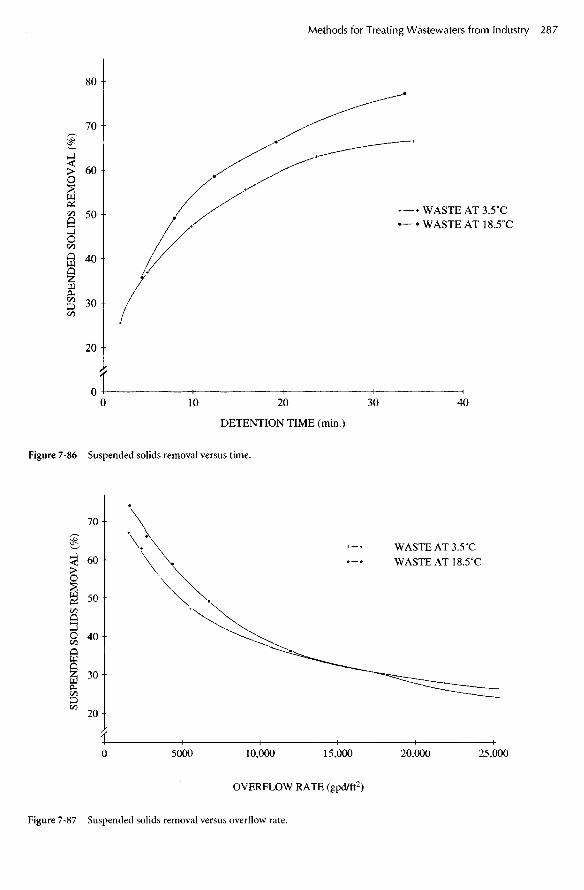
WASTE AT 3.5°CWASTE AT 18.5°C
DETENTION TIME (min.)
Figure 7-86 Suspended solids removal versus time.
WASTE AT 3.5°C
WASTEAT 18.5°C
OVERFLOW RATE (gpd/ft2)
Figure 7-87 Suspended solids removal versus overflow rate.
SU
SP
EN
DE
D S
OL
IDS
RE
MO
VA
L (
%)
SUSP
EN
DE
D S
OL
IDS
RE
MO
VA
L (
%)

SUSPENDED SOLIDS REMOVAL (%)
Figure 7-88 BOD5 removal versus suspended solids removal.
TIME (minutes)
Figure 7-89 Liquid-solids interface height versus time.
BO
D5
RE
MO
VA
L (
%)
INT
ER
FAC
E H
EIG
HT
(in
ches
)
C0 = 3800 mg/L
Cn = 4800 mg/L
C0 = 6600 mg/L
C0 = 9800 mg/L

CO
NC
EN
TR
AT
ION
(lb
s/ft
3)
TIME (min.)
Figure 7-90 Sludge concentration versus time.
Using the mathematical models presentedby Talmage and Fitch and Behn and Lieb-man, the solids concentration, Q, at theinterface at time, tp and the settling velocity,Vj, of the particles at concentration Q can bedetermined.
Figure 7-90 presents solids concentration,Cj, versus time relationships for the foursludge slurries examined, and Figure 7-91presents the concentration-velocity relation-ships.
The next step is to determine the unit area(ft /Ib/day) required for given values ofsludge-liquid interface settling velocities forthree or more different values of initialsludge concentrations. These results are pre-sented in Figure 7-92, which shows that for
given values of initial sludge concentrationthere is a maximum unit area (high point oneach curve). As discussed by Behn and Lieb-man and Talmage and Fitch, the maximumunit area for a given underflow (initialsludge) concentration is the theoreticalcross-sectional area required for a sludge-thickener.
Figure 7-93 is then constructed in order todetermine the depth required for thickenersfor given values of underflow (initial sludge)concentration. As discussed by Behn andLiebman, the depth of a thickener is a frac-tion of the volume represented by a given"dilution" of the solids, or "dilution factor."Figure 7-93 presents plots of dilution factorsversus time for the appropriate values of
9800 mg/L6600 mg/L4800 mg/L3800 mg/L
Co

CO
NC
EN
TR
AT
ION
(lb
s/ft
3)
SETTLINGVELOCITY (ft/min) x 104
9800 mg/L = 0.617 lb/ft3
6600 mg/L = 0.4124800 mg/L = 0.3003800 mg/L = 0.237
Figure 7-91 Sludge concentration versus settling velocity.
sludge underflow concentration. The slopesof the appropriate lines are equal to the val-ues of k in equation 7-72:
Figure 7-94 can be constructed to illus-trate the analysis of data described by Eddeand Eckenfelder. In this analysis, the resultsof sludge-liquid interface height versus timeand unit area versus settling velocity are plot-ted as presented in Figures 7-89 and 7-92.Then, the values of maximum unit area fordifferent feed and underflow concentrationsare constructed, as shown in Figure 7-94.The next step is to construct the semilog plotof the depth in the batch test versus the origi-nal solids concentration, as presented in Fig-ure 7-95. Figures 7-94 and 7-95 can be inter-polated to obtain values needed for designcalculations that are not identical to thoseused in the laboratory analysis.
(7-72)
Design Calculationsby Kurt MarstonHaving constructed the curves presented inFigures 7-84 through 7-95, the appropriatesize of clarifier-thickener for wastewaters ofgiven solids settling characteristics can bedetermined, as illustrated in the followingdemonstrative calculations.
Example 7-7Design a clarifier-thickener for the pulp andpaper wastewater using the testing datadescribed in Figures 7-84 through 7-95 toaccommodate an influent design flow of 10million gallons per day (MGD) and toachieve 60% suspended solids removal at3.5°C with an underflow concentration of10,000 mg/L. Influent suspended solids (theraw wastewater) were measured at approxi-mately 300 mg/L.
Clarifier requirements can be derivedfrom Figures 7-86 and 7-87. Based upon thedata curves for wastewater at 3.5°C, Figure7-86 shows a minimum detention time ofapproximately 20 minutes, and Figure 7-S7

9800 mg/L6600 mg/L4800 mg/L3800 mg/L
Co
VELOCITY (ft/min.)
Figure 7-92 Unit area versus velocity.
shows a minimum overflow rate of approxi-mately 2,500 gpd/ft2 required to achieve 60%suspended solids removal.
Minimum area for clarification
= (10,000,000 gpd) / (2,500 gpd/ft2)
= 4,000 ft2
Minimum depth for clarification= (Flow) (detention time)/Clarifier area= 4.6 ft
These values represent results obtainedunder ideal (laboratory) settling conditions.It is necessary to apply scale-up factors
Uni
t Are
a (f
t2/lb/
day)

DIL
UT
ION
FA
CT
OR
TIME (min)
Figure 7-93 (a) Dilution factor versus time.
Log(Di-Doo)
Co = 9800 mg/L
Log Di

DIL
UT
ION
FA
CT
OR
TIME (min)
Figure 7-93 (b) Dilution factor versus time.
Log (Di - Doo)
Log Di
Co = 6600 mg/L

DIL
UT
ION
FA
CT
OR
TIME (min)
Figure 7-93 (c) Dilution factor versus time.
Log (D/ - D°o)
Log D/
Co = 4800 mg/L

I
S
Figure 7-93 (d) Dilution factor versus time.
TIME (min)
Log (Di - Doo)
Log Dz*
Co = 3800 mg/L

ML (Ib/ft2/day)
Figure 7-94 Ratio of underflow to feed solids concentration versus mass loading.
appropriate to each type of clarifler. Scale-upfactors are normally selected based uponexperience reported in the literature andthrough discussions with manufacturers.Typical scale-up factors are in the range of1.5 to 2.0.
Thickener requirements calculated usingthe Behn & Liebman methods:
Cu - Underflow Concentration = 10,000mg/L = 0.624 lb/ft3
From Figure 7-90, the maximum time forreaching a concentration of 10,000 mg/L (tu)
is the data curve for the 6,600 mg/L test sam-ple with a value of approximately 440 min-utes.
Figure 7-92 shows a maximum unit areaof approximately 0.28 ft2/lb/day for the fam-ily of curves for the 6,600 mg/L test sample.
Solids loading to the thickener would be60% of the 300 mg/L entering the clarifler =180 mg/L in 10 MGD = 15,200 lb/day.
Minimum area for thickening
= (15,200 lb/day) (0.28 ft2/lb/day)
= 4,260 ft2
3800 mg/L4800 mg/L6600 mg/L9800 mg/L

CONCENTRATION, C0 (Ibs/ft3)
Figure 7-95 Depth versus concentration.

Sludge Depth (H) required for thickeningis calculated using equation 7-72.
From Figure 7-93, the value for k is theslope of the lower curve or 7.76 X 1(T3 and,using the upper curve, D11 - 85 for tu = 440minutes, Dc = 118 for tc = 120.
Plate, Lamella, and Tube SettlersExamination of Figure 7-80 reveals that aparticle settling at terminal velocity, Vs in anideal settling tank of hydraulic retentiontime, Q/V (where Q is the flow rate and V isthe tank volume), will not become"removed" until it reaches the end of thetank, if it starts at the surface. Furthermore,the deeper the tank, the longer the requiredHRT to remove the particle. There is a temp-tation, then, to imagine a very shallow tank,in which particles would reach the bottomvery quickly, thus achieving removal in a veryshort amount of time and with relatively lit-
tle cost (owing to the small size of the clari-fier). Common sense reveals, however, thatturbulence resulting from such a shallowflow path would prevent effective settling(the clarifier would not be able to attain qui-escent conditions). The theoretical implica-tion still remains, however, that the shallowerthe settling tank the quicker the removal.
What, then, is the optimum depth for aclarifier, given, on the one hand, that surfaceloading is the only parameter that affectsremoval in an ideal clarifier and, on the otherhand, that hydraulic turbulence affectsremoval in a negative way in a "real" clarifier?
Looking again at Figure 7-80, it can beseen that, no matter what the depth of theideal settling tank, removal (by virtue of hav-ing reached the "bottom") of solids havingsettling velocities much slower than vs couldtheoretically be achieved if a series of falsebottoms were placed within the tank, similarto a stack of trays. Figure 7-96 illustrates sucha concept.
While there is no disputing the theoreticalvalidity of the concept illustrated in Figure7-96, the actual occurrence of hydraulic tur-bulence imposes limits on application. Sev-eral devices based on the theoretical advan-tage illustrated in Figure 7-96 have beendeveloped and are in widespread use. The
Effluent
Influent
Sludge
Figure 7-96 Illustration of conceptual increase in removal efficiency by adding a series of false bottoms to an open, idealsettling tank.

device illustrated in Figure 7-97, known as a"plate settler" is an example.
Figure 7-97 shows a tank that contains astack of flat plates that nearly fills the tank.The plates are inclined at an angle of 60°. Theinfluent end of the tank is equipped with adevice to distribute incoming flow uniformlyacross the tank so that, to the extent possible,equal amounts of raw wastewater are causedto proceed through the spaces between eachof the plates.
It is a fundamental principle of hydraulicflow, in both theory and fact, that fluidsflowing in contact with a solid surface estab-lish a velocity gradient. The velocity of flow isvery small close to the solid surfaces, and
increases with distance from solid surfaces.Within the spaces between the plates shownin Figure 7-97, then, the velocity of flow fromthe influent end of the tank to the effluentend is greatest near the midpoints betweenthe plates and is very small close to the plates.Therefore, if the velocity of flow of waste-water flowing through the "plate settler"shown in Figure 7-97 is less than the settlingvelocity of some of the solid particles con-tained in the wastewater, these particles will"settle." As these particles settle, they quicklyapproach one of the plate surfaces, where theflow velocity steadily decreases. Eventually,the solid particles become very close to the
Figure 7-97 "Plate" or "lamella" separator (courtesy of Parkson Corporation).
UNDERFLOW{SLUDGE)
SU)0<3€ HOPPER
PLATgS
FEEDUNFtUENTj
COAGULANTAID
FLASH MIXTAHK
FlOGCWJkTlQU TPkHK
P£ED BOX
OiSCHABGE FIUM6SFLOW DISTRIBUTION OBIRCES
OVERFLOW BOX
OVERFLOW(SFFLUENnn
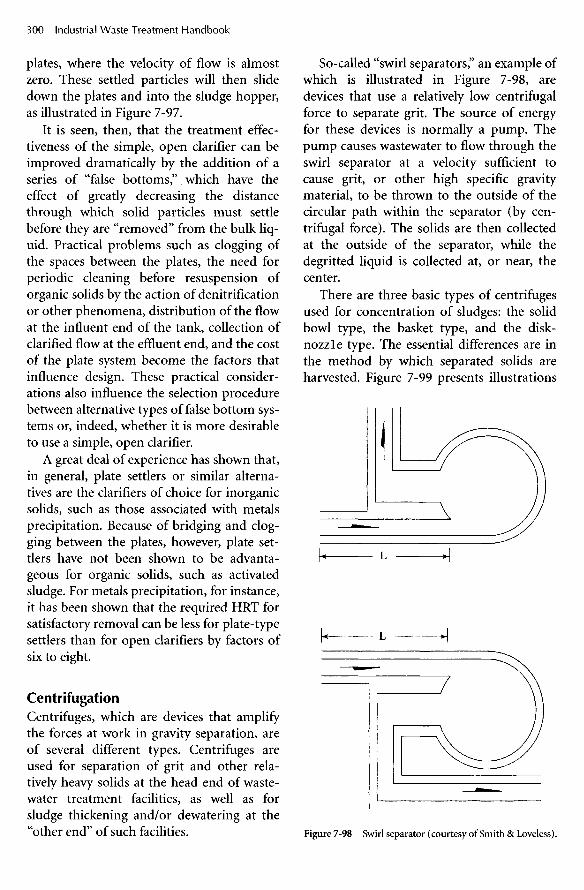
plates, where the velocity of flow is almostzero. These settled particles will then slidedown the plates and into the sludge hopper,as illustrated in Figure 7-97.
It is seen, then, that the treatment effec-tiveness of the simple, open clarifier can beimproved dramatically by the addition of aseries of "false bottoms," which have theeffect of greatly decreasing the distancethrough which solid particles must settlebefore they are "removed" from the bulk liq-uid. Practical problems such as clogging ofthe spaces between the plates, the need forperiodic cleaning before resuspension oforganic solids by the action of denitrificationor other phenomena, distribution of the flowat the influent end of the tank, collection ofclarified flow at the effluent end, and the costof the plate system become the factors thatinfluence design. These practical consider-ations also influence the selection procedurebetween alternative types of false bottom sys-tems or, indeed, whether it is more desirableto use a simple, open clarifier.
A great deal of experience has shown that,in general, plate settlers or similar alterna-tives are the clarifiers of choice for inorganicsolids, such as those associated with metalsprecipitation. Because of bridging and clog-ging between the plates, however, plate set-tlers have not been shown to be advanta-geous for organic solids, such as activatedsludge. For metals precipitation, for instance,it has been shown that the required HRT forsatisfactory removal can be less for plate-typesettlers than for open clarifiers by factors ofsix to eight.
CentrifugationCentrifuges, which are devices that amplifythe forces at work in gravity separation, areof several different types. Centrifuges areused for separation of grit and other rela-tively heavy solids at the head end of waste-water treatment facilities, as well as forsludge thickening and/or dewatering at the"other end" of such facilities.
So-called "swirl separators," an example ofwhich is illustrated in Figure 7-98, aredevices that use a relatively low centrifugalforce to separate grit. The source of energyfor these devices is normally a pump. Thepump causes wastewater to flow through theswirl separator at a velocity sufficient tocause grit, or other high specific gravitymaterial, to be thrown to the outside of thecircular path within the separator (by cen-trifugal force). The solids are then collectedat the outside of the separator, while thedegritted liquid is collected at, or near, thecenter.
There are three basic types of centrifugesused for concentration of sludges: the solidbowl type, the basket type, and the disk-nozzle type. The essential differences are inthe method by which separated solids areharvested. Figure 7-99 presents illustrations
Figure 7-98 Swirl separator (courtesy of Smith & Loveless).

(a)
(b)
(c)
Figure 7-99 (a) Disk-stack centrifuge, (b) Basket-type centrifuge, (c) Solid-bowl centrifuge. (All courtesy of Alfa-Laval,Inc.)
of the three types of sludge concentratingcentrifuges.
Centrifuges have also been used to a lim-ited extent for separation of lighter-than-water substances, such as oil. In these cases,the aqueous discharge is collected at theopposite outlet from that where solids havinga specific gravity greater than one are the tar-get substances for separation.
A solid bowl-type centrifuge is dia-grammed in Figure 7-100. The horizontalcylindrical-conical bowl rotates so as to causesolid particles to be thrown against its wall as
they enter the bowl, with the liquid to bedewatered at the center of the cylinder. Ahelical scroll within the bowl rotates at aslightly slower rate than the bowl itself, oper-ating in a manner similar to a screw conveyorto scrape the solids along the wall of the bowlto the solids discharge area. Centrate (the liq-uid from which solids have been removed) isdischarged at the opposite end of the bowl.
The effectiveness of solids concentration issomewhat proportional to the speed of rota-tion of the bowl and inversely proportional,to a certain degree, to the feed rate. In some

Figure 7-100 A solid-bowl centrifuge. (Courtesy of Alfa-Laval, Inc.)
instances, chemical conditioning of the feedenhances operational effectiveness. Variouspolymers, as well as lime, ferric chloride, andother chemical conditioning agents, haveproven to be cost-effective performanceenhancers in various applications. Variationsin operating parameters of the solid bowlcentrifuge can also affect performance, suchas scroll rotation rate and pool volume.
Figure 7-101 shows a diagram of a basket-type centrifuge. Here, feed (liquid plus thesolids to be removed) enters the basket at thebottom. The basket rotates about its verticalaxis, and solid particles are caused by centrif-ugal force to be thrown against the sides ofthe basket. The basket gradually fills up withsolids as liquid spills out over the top of thebasket. When the basket becomes sufficientlyfull of solids, the feed is stopped, and a set ofknives removes the solids from the basket.Machine variables that affect performanceinclude basket spin rate, solids dischargeinterval, and skimmer nozzle dwell time andtravel rate. Performance is normally inversely
proportional, to some degree, to feed rate,and, often, conditioning chemicals are notused.
The disc-stack centrifuge, diagrammed inFigure 7-102, is composed of a series of coni-cal disks and channels between the cones,which rotate about a vertical axis. Feed entersthe top, and solid particles are forced by cen-trifugal force against the cones. Centrate isdischarged at the top of the unit just belowthe feed port, and solids exit the bottoms ofthe conical discs to a compaction zone. Asmall fraction of the wastewater is used toflush out the compacted solids. The moisturecontent of the dewatered solids is propor-tional to the feed rate. Normally, condition-ing chemicals are used to enhance opera-tional performance.
Flotation
Gravity FlotationGravity flotation is used, sometimes in com-bination with sedimentation and sometimes
Next Page

Figure 7-100 A solid-bowl centrifuge. (Courtesy of Alfa-Laval, Inc.)
instances, chemical conditioning of the feedenhances operational effectiveness. Variouspolymers, as well as lime, ferric chloride, andother chemical conditioning agents, haveproven to be cost-effective performanceenhancers in various applications. Variationsin operating parameters of the solid bowlcentrifuge can also affect performance, suchas scroll rotation rate and pool volume.
Figure 7-101 shows a diagram of a basket-type centrifuge. Here, feed (liquid plus thesolids to be removed) enters the basket at thebottom. The basket rotates about its verticalaxis, and solid particles are caused by centrif-ugal force to be thrown against the sides ofthe basket. The basket gradually fills up withsolids as liquid spills out over the top of thebasket. When the basket becomes sufficientlyfull of solids, the feed is stopped, and a set ofknives removes the solids from the basket.Machine variables that affect performanceinclude basket spin rate, solids dischargeinterval, and skimmer nozzle dwell time andtravel rate. Performance is normally inversely
proportional, to some degree, to feed rate,and, often, conditioning chemicals are notused.
The disc-stack centrifuge, diagrammed inFigure 7-102, is composed of a series of coni-cal disks and channels between the cones,which rotate about a vertical axis. Feed entersthe top, and solid particles are forced by cen-trifugal force against the cones. Centrate isdischarged at the top of the unit just belowthe feed port, and solids exit the bottoms ofthe conical discs to a compaction zone. Asmall fraction of the wastewater is used toflush out the compacted solids. The moisturecontent of the dewatered solids is propor-tional to the feed rate. Normally, condition-ing chemicals are used to enhance opera-tional performance.
Flotation
Gravity FlotationGravity flotation is used, sometimes in com-bination with sedimentation and sometimes
Previous Page
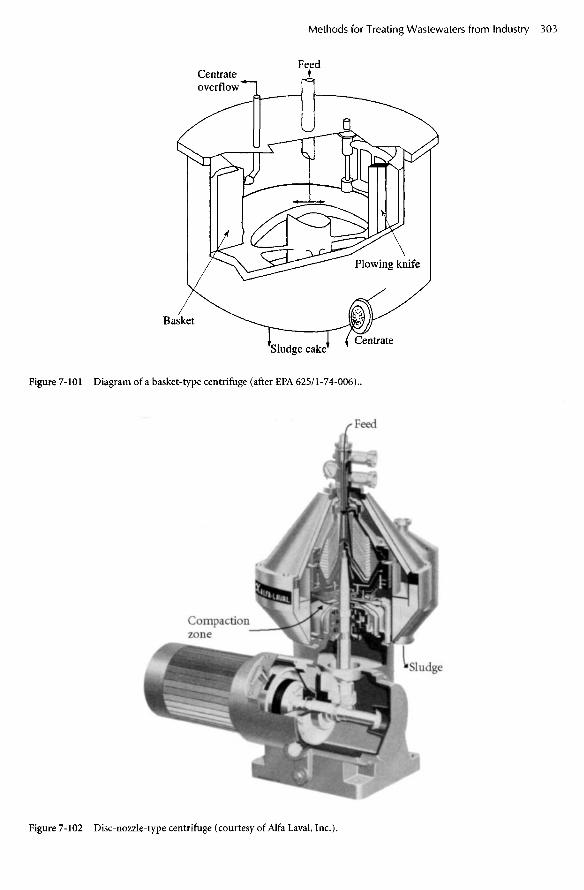
Centrateoverflow
Feed
Plowing knife
Figure 7-101 Diagram of a basket-type centrifuge (after EPA 625/1-74-006)..
Figure 7-102 Disc-nozzle-type centrifuge (courtesy of Alfa Laval, Inc.).
Basket
Sludge cakeCentrate
Feed
Compactionzone
Sludge

alone, to remove oils, greases, and otherflotables, such as solids, that have a low spe-cific weight. Various types of "skimmers"have been developed to harvest floated mate-rials, and the collection device to which theskimmers transport these materials must beproperly designed. Figure 7-103 shows differ-ent types of gravity flotation and harvestingequipment.
Dissolved Air FlotationDissolved air flotation (DAF) is a solids sepa-ration process, similar to plain sedimenta-tion. The force that drives DAF is gravity, andthe force that retards the process is hydrody-namic drag. Dissolved air flotation involves
the use of pressure to dissolve more air intowastewater than can be dissolved under nor-mal atmospheric pressure and then releasingthe pressure. The "dissolved" air, now in asupersaturated state, will come out of solu-tion, or "precipitate," in the form of tiny bub-bles. As these tiny bubbles form, they becomeattached to solid particles within the waste-water, driven by their hydrophobic nature.When sufficient air bubbles attach to a parti-cle to make the conglomerate (particle plusair bubbles) lighter than water (specific grav-ity less than 1.0), the particle will be carriedto the water surface.
A familiar example of this phenomenon isa straw in a freshly opened bottle of a carbon-
Figure 7-103 Gravity flotation and harvesting equipment, (a) Courtesy of IDI/Infilco Degremont, Inc.

(b)
(c)
Figure 7-103 Gravity flotation and harvesting equipment, (b, c) Courtesy of U.S. Filter/Envirex.
HOPPER
SCRAPER
TOP OF 880UTAT SIOE«ALL
SCRAPER BLAOE
'«/SQUEEsee
SLUDGE ORAW-OfF PIPE
HORIZONTALTIE BAR
ROTATINGORAFT TUBE
STRUT
INFLUENT PIPE
-EFFLUENTPIPE
RACIAL TURSINE
MAX WATERSURFACE
ORIVE UHlT
ACCESS SRIOGEtf/HANDRAIL& TQEPLATE
TOP OF TANK MALL
TOP OF WALKWAY
RSACTION COHE
UPPEft OBAFT TUBE
SIO
C
«AT
£R
OE
FTH
SCRAPG8 ARMASSY
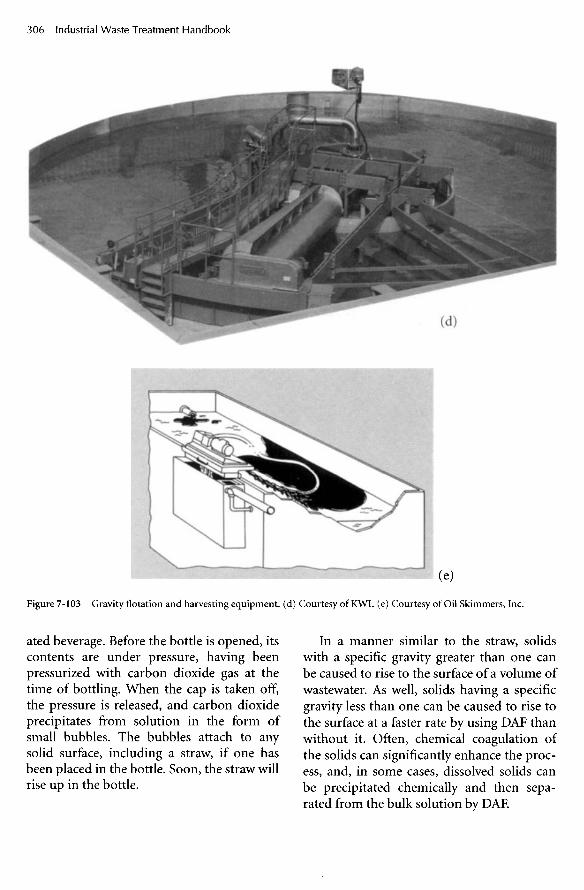
Figure 7-103 Gravity flotation and harvesting equipment, (d) Courtesy of KWL (e) Courtesy of Oil Skimmers, Inc.
ated beverage. Before the bottle is opened, itscontents are under pressure, having beenpressurized with carbon dioxide gas at thetime of bottling. When the cap is taken off,the pressure is released, and carbon dioxideprecipitates from solution in the form ofsmall bubbles. The bubbles attach to anysolid surface, including a straw, if one hasbeen placed in the bottle. Soon, the straw willrise up in the bottle.
In a manner similar to the straw, solidswith a specific gravity greater than one canbe caused to rise to the surface of a volume ofwastewater. As well, solids having a specificgravity less than one can be caused to rise tothe surface at a faster rate by using DAF thanwithout it. Often, chemical coagulation ofthe solids can significantly enhance the proc-ess, and, in some cases, dissolved solids canbe precipitated chemically and then sepa-rated from the bulk solution by DAE
(d)
(e)

Dissolution of Air in WaterExamination of the molecular structures ofboth oxygen and nitrogen reveals that neitherwould be expected to be polar; therefore, nei-ther would be expected to be soluble inwater.
:O::6: :N::N:
Molecular oxygen Molecular nitrogen
The question arises, then, as to how non-polar gases like oxygen and nitrogen can bedissolved in water. The answer, of course, isthat they cannot. Nonpolar gases are"driven" into a given volume of water by themechanism of diffusion. Molecules of nitro-gen and oxygen in the gaseous state createpressure as a result of constant motion of themolecules. The generalized gas law:
pV = nRT (7-73)
where
p = Pressure, psiV = Volume, in3
n = Number of moles of gas in a givenvolume of gas
R = Universal gas constant 0.082 literatmospheres/mole/° Kelvin
T = Temperature, ° Kelvin
rewritten as
nRTP= v (7-74)
states that the pressure exerted by a givennumber of molecules of a gas is directly pro-portional to the temperature and inverselyproportional to the size of the volume inwhich those molecules are confined.
Dalton's law of partial pressures states fur-ther that, in a mixture of gases, each gasexerts pressure independently of the others,
and the pressure exerted by each individualgas, referred to as its "partial pressure," is thesame as it would be if it were the only gas inthe entire volume. The pressure exerted bythe mixture, therefore, is the sum of all thepartial pressures. Conversely, the partialpressure of any individual gas in a mixture,such as air, is equal to the pressure of themixture multiplied by the fraction, by vol-ume, of that gas in the mixture.
Henry's law, which mathematicallydescribes the solubility of a gas in water interms of weight per unit volume, is written as
C = Hp (7-75)
where
C = concentration of gas "dissolved" inwater (mg/L)
H = Henry's constant, dimensionless,specific for a given gas
The consequence of the above is that, byway of the process of diffusion, molecules ofany gas in contact with a given volume ofwater will diffuse into that volume to anextent that is described by Henry's law, aslong as the quantity of dissolved gas is rela-tively small. For higher concentrations,Henry's constant changes somewhat. Thisprinciple holds for any substance in the gas-eous state, including volatilized organics. Themolecules that are forced into the water bythis diffusion process exhibit properties thatare essentially identical to those that are trulydissolved. In conformance with the secondlaw of thermodynamics, they distributethemselves uniformly throughout the liquidvolume (maximum disorganization), andthey will react with substances that are dis-solved. An example is the reaction of molec-ular oxygen with ferrous ions. Unlike dis-solved substances, however, they will bereplenished from the gas phase with whichthey are in contact, up to the extentdescribed by Henry's law, if they are depleted

by way of reaction with other substances orby biological metabolism. The differencebetween a substance existing in water solu-tion as the result of diffusion and one that istruly dissolved can be illustrated by the fol-lowing example.
Consider a beaker of water in a closedspace—a small, airtight room, for instance.An amount of sodium chloride is dissolvedin the water, and the water is saturated withoxygen; that is, it is in equilibrium with theair in the closed space. Now, a container ofsodium chloride is opened, and, at the sametime, a pressurized cylinder of oxygen isreleased. The concentration of sodium chlo-ride will not change, but because the quan-tity of oxygen in the air within the closedspace increases (partial pressure of oxygenincreases), the concentration of dissolvedoxygen in the water will increase. The oxygenmolecules are not truly dissolved; that is,they are not held in solution by the forces ofsolvation or hydrogen bonding by the watermolecules. Rather, they are forced into thevolume of water by diffusion, which is to say,by the second law of thermodynamics. Themolecules of gas are constantly passingthrough the water-air interface in both direc-tions. Those that are in the water are con-stantly breaking through the surface toreturn to the gas phase, and they are continu-ally replaced by diffusion from the air intothe water. An equilibrium concentrationbecomes established, described by Henry'slaw. All species of gas that happen to exist inthe "air" participate in this process: nitrogen,oxygen, water vapor, volatilized organics, orwhichever other gases are included in thegiven volume of air.
The concentration, in terms of mass ofany particular gas that will be forced into thewater phase until equilibrium becomesestablished, depends upon the temperature,the concentration of dissolved substancessuch as salts, and the "partial pressure" of thegas in the gas phase. As the temperature ofthe water increases, the random vibrationactivity, "Brownian motion," of the waterincreases. This results in less room between
water molecules for the molecules of gas to"fit into." The result is that the equilibriumconcentration of the gas decreases. This isopposite to the effect of temperature on dis-solution of truly soluble substances in water,or other liquids, where increasing tempera-ture results in increasing solubility.
Some gases are truly soluble in waterbecause their molecules are polar, and thesegases exhibit behavior of both solubility anddiffusivity. Carbon dioxide and hydrogensulfide are examples. As the temperature ofwater increases, solubility increases, but dif-fusivity decreases. Also, since each of thesetwo gases exists in equilibrium with hydro-gen ion when in water solution, the pH of thewater medium has a dominant effect on theirsolubility, or rather their equilibrium con-centration, in water.
In the example above, where a beaker ofwater is in a closed space, if a flame burningin the closed space depletes the oxygen in theair, oxygen will come out of the water solu-tion. If all of the oxygen is removed from theair, the concentration of "dissolved oxygen"in the beaker of water will eventually go tozero (or close to it), and the time of thisoccurrence will coincide with the flameextinguishing, because of lack of oxygen inthe air.
Dissolved Air Flotation EquipmentThe dissolved air flotation process takesadvantage of the principles described above.Figure 7-104 presents a diagram of a DAFsystem, complete with chemical coagulationand sludge handling equipment. As shown inFigure 7-104, raw (or pretreated) wastewaterreceives a dose of a chemical coagulant(metal salt, for instance) and then proceedsto a coagulation-flocculation tank. Aftercoagulation of the target substances, the mix-ture is conveyed to the flotation tank, whereit is released in the presence of recycled efflu-ent that has just been saturated with airunder several atmospheres of pressure in thepressurization system shown. An anionicpolymer (coagulant aid) is injected into the

Figure 7-104 Dissolved air flotation system.
coagulated wastewater just as it enters theflotation tank.
The recycled effluent is saturated with airunder pressure as follows: a suitable centrifu-gal pump forces a portion of the treatedeffluent into a pressure holding tank. A valveat the outlet from the pressure holding tankregulates the pressure in the tank, the flowrate through the tank, and the retention timein the tank, simultaneously. An air compres-sor maintains an appropriate flow of air intothe pressure holding tank. Under the pres-sure in the tank, air from the compressor isdiffused into the water to a concentrationhigher than its saturation value under nor-mal atmospheric pressure. In other words,about 24 ppm of "air" (nitrogen plus oxygen)can be "dissolved" in water under normalatmospheric pressure (14.7 psig). At a pres-sure of six atmospheres, for instance (6 X14.7 = about 90 psig), Henry's law wouldpredict that about 6 X 23, or about 130 ppm,of air can be diffused into the water. In prac-tice, dissolution of air into the water in thepressurized holding tank is less than 100%efficient, and a correction factor, f, whichvaries between 0.5 and 0.8, is used to calcu-late the actual concentration.
After being held in the pressure holdingtank in the presence of pressurized air, therecycled effluent is released at the bottom ofthe flotation tank, in close proximity towhere the coagulated wastewater is beingreleased. The pressure to which the recycledeffluent is subjected has now been reduced toone atmosphere, plus the pressure caused bythe depth of water in the flotation tank. Here,the "solubility" of the air is less, by a factor ofslightly less than the number of atmospheresof pressure in the pressurization system, butthe quantity of water available for the air todiffuse into has increased by the volume ofthe recycle stream.
Practically, however, the wastewater willalready be saturated with respect to nitrogen,but may have no oxygen, because of biologi-cal activity. Therefore, the "solubility" of airat the bottom of the flotation tank will beabout 25 ppm, and the excess air from thepressurized, recycled effluent will precipitatefrom "solution." As this air precipitates in theform of tiny, almost microscopic, bubbles,the bubbles attach to the coagulated solids.The presence of the anionic polymer (coagu-lant aid), plus the continued action of thecoagulant, causes the building of larger solidconglomerates, entrapping many of the
Coagulant
Polymer
feedRaw
Chemmix
Coagulation-flocculation
tank
Back Pressure ValveControl Handle wheel
Coagulated
Feed
PressurizedRecycle with
DissolvedAir
AirSaturation
Tank
Air FlowPanel
PressurizedRecycle
Recycle Pump
Air Compressor
RecycleFlow
Settled Sludge
FloatedSludgeDrawoff Sludge
Press
Dissolved AirFlotation Unit
EffluentRelease Point

adsorbed air bubbles. The net effect is thatthe solids are floated to the surface of the flo-tation tank, where they can be collected bysome means and thus be removed from thewastewater.
Some DAF systems do not have a pressur-ized recycle system, but, rather, the entireforward flow on its way to the flotation tankis pressurized. This type of DAF is referred toas "direct pressurization" and is not widelyused for treatment of industrial wastewatersbecause of undesirable shearing of chemicalfloes by the pump and valve.
Air-to-Solids RatioOne of the principal design parameters for aDAF wastewater treatment system is the so-called air-to-solids ratio (A/S). The mass ofair that must be supplied per day by the com-pressor and air delivery system is calculatedby multiplying the mass of solids to beremoved each day by the numerical value ofthe A/S. If the A/S is too low, there will not besufficient flotation action within the treat-ment system. If, on the other hand, the A/Svalue is too high, there will be many more airbubbles than can attach to the solids. Manyof the unattached fine bubbles will coalesce,and large bubbles will result, causing turbu-lence in the flotation tank. Experience hasshown that A/S values in the range 0.02 to0.06 result in optimal flotation treatment.
Calculations of Recycle Ratio andQuantity of AirThe quantity of air needed for a given indus-trial waste treatment application can be cal-culated directly from the air-to-solids ratio,once its value has been determined by labo-ratory and pilot experimentation:
Weight of air, lb/day= (Ib solids/day) X A/S (7-76)
Optimum Pressure for the AirDissolving SystemThe optimum pressure for the air dissolvingsystem is determined by balancing the cost
for operating the water pressurizing pumpand the compressor against the capital costsfor the individual components of the system,which include the pressurization tank. Gen-erally, the higher the pressure, the greater thecost for power but the smaller the recycleflow and, therefore, the smaller the size of thecomponents. However, as shown by theequation for pump horsepower:
HP = QpH X pump efficiency (7-77)
where
HP = Horsepower required to operatepump
Q = Rate of flow being pumped (ft3/sec)p = Specific weight of water (lb/ft3)H = Pressure or "head" against which the
pump is pumping. In this case, Hequals the pressure of the pressur-ization tank, in feet of water
As shown in equation 7-77 ̂ the horse-power required for the pressurization pumpincreases directly with increasing pressureand decreases with decreasing rate of flow.Therefore, there is a compensating tradeoff.As the pressure is increased to dissolve moreair in a given flow rate of water or to dissolvea given quantity of air in a smaller flow rateof water, power requirement increases. Powerrequirement decreases, however, as the rateof flow decreases due to less water needed bythe higher pressure. The fact that higherpressure results in the need for more heavy-duty equipment, coupled with the fact thathigher pressure requires more power con-sumption by the air compressor (the airrequirement is governed by the solids load,which is not related to the pressure), resultsin increased costs for increasing pressure.
Because of these counteracting effects oncosts, it is not a simple matter to select anoperating pressure that will minimize overallcosts. In most applications, operating pres-

sures between 60 and 120 psig have beenused.
Design of the air-dissolving portion of aDAF treatment system includes the follow-ing:
1. Determination of the size (i.e., air flowrate, working pressure, and, conse-quently, the motor horsepower of thecompressor)
2. Determination of the water flow rate,total dynamic head, and, consequently,the motor horsepower of the recyclepump
3. Determination of the size and pressurerating of the pressure holding tank
4. Selection of the appropriate valve forcontrol of flow rate from the pressureholding tank, as well as the pressure tobe maintained
5. Selection of the appropriate sizes of pip-ing and materials of construction
Competing considerations that concernthe working pressure for the pressurization-air dissolving system are that the higher thepressure, the more air can be dissolved butthe more horsepower is required, and there-fore the operating costs will be higher for therecycle pump motor and the compressormotor.
AdsorptionAdsorption can be defined as the accumula-tion of one substance on the surface ofanother. The substance undergoing accumu-lation, and thus being adsorbed, is called theadsorbate, and the substance on which theaccumulation is taking place is called theadsorbent. The adsorbate can be dissolved, inwhich case it is called the solute, or it can beof the nature of suspended solids as in a col-loidal suspension. Colloidal suspensions ofliquids or gases can also be adsorbed. Thediscussion presented here addresses sub-stances such as ions or organic compoundsdissolved in water adsorbing onto solidadsorbents. However, the principles hold for
solid, liquid, or gaseous adsorbates adsorbingonto solid, liquid, or gaseous adsorbents.
The mechanism of adsorption can be oneor a combination of several phenomena,including chemical complex formation at thesurface of the adsorbent, electrical attraction(a phenomenon involved in almost all chem-ical mechanisms, including complex forma-tion), and exclusion of the adsorbate fromthe bulk solution, resulting from strongerintermolecular bonding between moleculesof solvent (hydrogen bonding, in the case ofwater) than existed between molecules of sol-vent (water) and the solute. As is almostalways the case, the driving force is explainedby the second law of thermodynamics. Thesum total energy of all bonds is greater afteradsorption has taken place than before.
As a wastewater treatment process,adsorption is of greatest use when the sub-stance to be removed is only sparingly solu-ble in water. Many organic substances havegroups that ionize weakly or have very fewionizable groups per unit mass of substance.These groups form hydrogen bonds withwater molecules that are of sufficientstrength to hold the organic molecules insolution, but a good adsorbent will reversethe solvation process because, as statedabove, the sum total of all chemical bonds isgreater after adsorption than before.
The AdsorbentActivated carbon is the most common adsor-bent in use for industrial wastewater treat-ment. Other adsorbents include syntheticresins, activated alumina, silica gel, fly ash,shredded tires, molecular sieves, and sphag-num peat. Because adsorption is a surfacephenomenon, a desirable characteristic of anadsorbent is a high surface-to-volume ratio.Surface-to-volume ratios are increased intwo ways: by decreasing the size of particlesof adsorbent and by creating a network ofpores or "tunnels" within the particles ofadsorbent.
Activated carbon is manufactured bypyrolyzing organic materials such as bones,coconut shells, or coal andthen oxidizing

residual hydrocarbons using air or steam.The result is a granular material with anintricate, interconnected network of poresranging in size from a few angstroms to sev-eral thousand angstroms in diameter. Thepores that are 10 to 1,000 angstroms in diam-eter are referred to as micropores and areresponsible for most of the adsorptive capa-bility of the material. The larger pores are rel-atively unimportant in adsorptive treatmentcapability, but are important passagewaysthrough which ions and dissolved organicscan diffuse to reach the innermost adsorptivesurfaces.
Most adsorbents have weak negativecharges on their surfaces; therefore, the pHof the wastewater being treated has an influ-ence on the adsorptive process. This isbecause hydrogen ions repress the negativesurface charges at lower pH values. Also, atlow pH conditions, there is an increase inadsorption of dissolved or suspended sub-stances that tend to have a negative surfacecharge.
Adsorption EquilibriaWhen wastewater is successfully treated byadsorption, the substances being removedadsorb onto and thus "coat" the adsorbentuntil equilibrium is established between themolecules of substance adsorbed and thosestill in solution. Depending on the character-istics of both the adsorbate and the adsor-bent, equilibrium will be reached wheneither a complete monolayer of moleculescoats the adsorbent or when the adsorbent iscoated with layers of adsorbate several mole-cules thick.
A standard laboratory procedure that isused to determine the effectiveness withwhich a given wastewater can be treated witha given adsorbent is described as follows:Several flasks containing samples of thewastewater (containing the adsorbate) aredosed with different quantities of adsorbent,which is in either granular form or has beenground in a ball mill to powder form. Theflasks are shaken using a device that shakes
all the flasks together, and the temperature isheld constant. Shaking continues until thecontents of all flasks have reached equilib-rium, as determined by the concentration ofadsorbate remaining constant with time. Theadsorbate may be a specific chemical com-pound, such as trichloroethylene, or a groupof compounds measured as COD, forinstance. Then a plot is constructed showingthe relationship between the concentrationof adsorbate in solution after equilibrium hasbeen reached and the quantity of adsorbateadsorbed per unit mass of adsorbent. Such aplot is called an isotherm, owing to the con-ditions of constant temperature heldthroughout the test.
Several standardized isotherm modelshave been developed to provide the ability tocalculate estimates of adsorbent efficiencyand costs after generating a relatively smallamount of laboratory data. The model devel-oped by Langmuir is one of the most widelyused, and is stated as follows:
where
q = Mass of adsorbate adsorbed/mass ofadsorbent
qm = Mass of adsorbate adsorbed/mass ofadsorbent if a complete layer, onemolecule thick, were adsorbed
Ka = Constant (related to enthalpy ofadsorption)
C = Concentration of adsorbate presentin solution at equilibrium
Langmuir's model is based on (1) theassumption that only a single layer of mole-cules of adsorbate will adsorb to the adsor-bent, (2) the immobility of the adsorbateafter being adsorbed, and (3) equal enthalpyof adsorption for all molecules of adsorbate.It has long been accepted as a good, general-ized model for use in making estimates based

Laboratory data can be plotted as shownin Figures 7-105 and 7-106.
Values for the constants Ka and qm canthen be determined from the slopes andintercepts. These constants can then be usedin the original Langmuir equation (equation7-79) to estimate the quantity of adsorbent
Figure 7-105 Plot of laboratory data for Langmuir iso-therms.
needed given a known quantity of adsorbateto be removed (inverse of q).
If adsorption is known or suspected totake place in multiple layers, a more appro-
on very little data. It is most useful when lin-earized as follows:
(7-79)
or
(7-80)
Figure 7-106 Plot of laboratory data for Langmuir isotherms.

(7-81)
priate model is given by the Brunauer-Emmett-Teller (BET) equation (7-81):
As shown in Figure 7-107, this relation-ship is not linear; however, the BET modelcan be rearranged to the following linearform:
(7-82)
and the plot of laboratory data shown in Fig-ure 7-108 can be used to determine themathematical value of the constant Kb.
Perhaps the most widely used model forestimating adsorbent efficiency and costs isan empirical model developed by Freundlich,stated as follows:
(7-83)
where
Cs = Concentration of adsorbate in thewastewater when all layers of adsor-bate on the adsorbent are saturated
K̂ = Constant related to energy ofadsorption
Figure 7-107 shows the approximate rela-tionship between the concentration of adsor-bate in the wastewater after adsorption hastaken place to the point of equilibrium andthe amount adsorbed.
Figure 7-107 Concentration of adsorbate in bulk liquid versus amount adsorbed.

Figure 7-108 Plot of laboratory data for BET isotherms.
where
Kf = Constantn = Empirical constant greater than one
Freundlich's model requires no assump-tions concerning the number of layers ofadsorbed molecules, heats of adsorption, orother conditions. It is strictly a curve-fittingmodel and works very well for many indus-trial wastewater applications.
Freundlich's model is made linear by tak-ing the logarithm of both sides:
(7-84)
Plotting q vs. C on log-log paper yields astraight line, the slope of which is the inverseof n, and the vertical intercept is the value ofKf5 as shown in Figure 7-109.
In practice, candidate adsorbent materials(different types of activated carbon, forinstance) are evaluated for effectiveness in
treating a given industrial wastewater by con-structing the Freundlich, Langmuir, or BETisotherms after obtaining the appropriatelaboratory data. The isotherms provide aclear indication as to which candidate adsor-bent would be most efficient in terms ofpounds of adsorbent required per pound ofadsorbate removed, as well as an indicationof the quality of effluent achievable. Example7-8 illustrates this procedure.
Example 7-8Wastewater from a poultry processing plantwas treated to the extent of greater than 99%removal of COD and TSS using chemicalcoagulation, dissolved air flotation, and sandfiltration. The question then arose as to theeconomic feasibility of using activated car-bon to further treat the water for (re)use inthe plant as cooling water or for initial wash-down during daily plant cleanup. Table 7-15presents the data obtained from the iso-therm tests using the adsorbate designatedCarbon A.
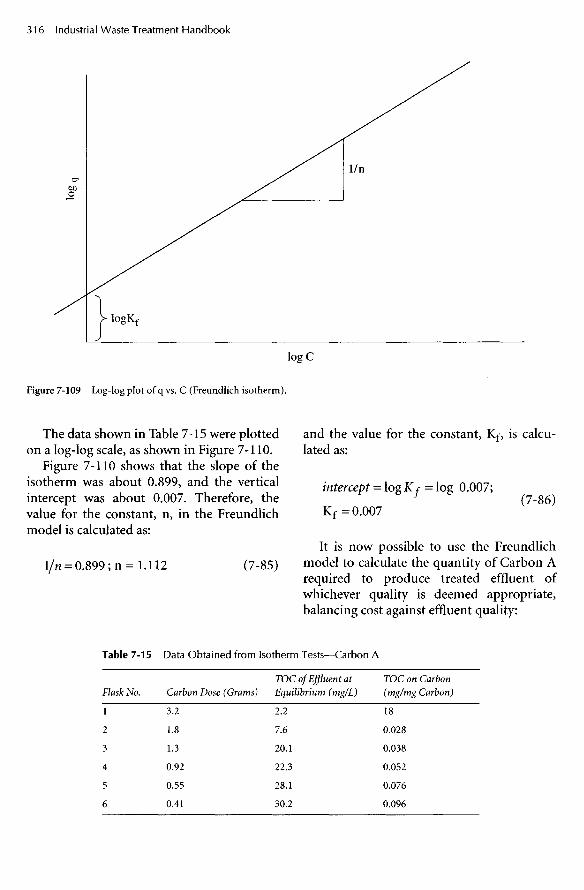
Figure 7-109 Log-log plot of q vs. C (Freundlich isotherm).
The data shown in Table 7-15 were plottedon a log-log scale, as shown in Figure 7-110.
Figure 7-110 shows that the slope of theisotherm was about 0.899, and the verticalintercept was about 0.007. Therefore, thevalue for the constant, n, in the Freundlichmodel is calculated as:
and the value for the constant, Kf, is calcu-lated as:
intercept = logKf= log 0.007;7 (7-86)
Kf =0.007
It is now possible to use the Freundlichmodel to calculate the quantity of Carbon Arequired to produce treated effluent ofwhichever quality is deemed appropriate,balancing cost against effluent quality:
Table 7-15 Data Obtained from Isotherm Tests—Carbon A
Flask No.
1
2
3
4
5
6
Carbon Dose (Grams)
3.2
1.8
1.3
0.92
0.55
0.41
TOC of Effluent atEquilibrium (mg/L)
2.2
7.6
20.1
22.3
28.1
30.2
TOC on Carbon(mg/mg Carbon)
18
0.028
0.038
0.052
0.076
0.096
(7-85)

Carbon Dose (Grams)TOC Effluent at Equilibrium (mg/L)TOC on Carbon (mg/mgCarbon)
Flask Number
Figure 7-110 Log-log plot of data from poultry processing wastewater.
For a desired effluent quality of TOC = 1 0mg/L = C:
One is the relative capability for removingimpurities from the wastewater to a suffi-ciently low level to satisfy requirements forreuse or for discharge. The second character-istic is the relative efficiency of several differ-ent carbon products, that is, the quantity ofactivated carbon required to remove a givenquantity of pollutants, as illustrated in Figure7-111.
Figure 7-111 shows Freundlich isothermsfor three different activated carbon productsplotted on the same graph. In such a com-posite graph, the further to the right the iso-therm, the less efficient the activated carbonproduct in terms of pounds of the carbonproduct required to remove one pound ofTOC. Figure 7-111 further shows that if aTOC concentration of no more that 10 mg/L(for instance) can be tolerated, Carbons A
q = 0.007(10)
= 0.06 mg TOC adsorbed/mg adsorbent
or, 1/0.06 = 1 8 pounds carbon adsorbentrequired for each pound of TOC removedfrom the sand filter effluent.
Evaluating Relative Effectivenessbetween Different Carbon ProductsTwo characteristics of activated carbon canbe evaluated from the Freundlich isotherms.
(7-87)

C (mg/LofTOC)
Figure 7-111 Composite plot of isotherms of three different carbon products.
and C have potential use, while Carbon Bneed not be considered further.
As additional notes, it has been found thatin general, high-molecular-weight (greaterthan 45) organics that are not readily biode-gradable tend to be good candidates forremoval by adsorption on activated carbonor other adsorbates. Also, certain inorganicsthat are not highly soluble in water (someheavy metals, reduced sulfur gases, and chlo-rine, are examples) are good candidates forremoval by adsorption.
Activated carbon can be very effective inremoving metal ions from wastewater by firstchelating the metal ions with an organicchelant, such as citric acid or EDTA. Whenthe chelated mixture is treated using acti-vated carbon, the organic chelant will adsorbto the carbon, removing the chelated metalsalong with it.
Ion ExchangeIon exchange is a physical treatment processin which ions dissolved in a liquid or gasinterchange with ions on a solid medium.
The ions on the solid medium are associatedwith functional groups that are attached tothe solid medium, which is immersed in theliquid or gas.
Typically, ions in dilute concentrationsreplace ions of like charge and lower valencestate; however, ions in high concentrationreplace all other ions of like charge. Forinstance, calcium ions or ferric ions in diluteconcentrations in water or wastewaterreplace hydrogen or sodium ions on the ionexchange medium. The divalent or trivalentions move from the bulk solution to the sur-face of the ion exchange medium, where theyreplace ions of lesser valence state, which, inturn, pass into the bulk solution. The ionexchange material can be solid or liquid, andthe bulk solution can be a liquid or a gas.
However, if a bulk solution has a highconcentration of ions of low valence stateand is brought into contact with an ionexchange material that has ions of highervalence state, the higher valence ions will bereplaced by the lower valence state ions. Forinstance, if a strong solution of sodium chlo-ride is brought into contact with an anion

exchange material that has nitrate ions asso-ciated with its functional groups, the chlo-ride ions will replace the nitrate ions.
In these examples, the ions that exchangeare referred to as mobile, and the functionalgroups are referred to as fixed. Ion exchangematerials occur extensively in nature; ionexchange materials of high capacity can bemanufactured. Clays are examples of natu-rally occurring ion exchange materials.Approximately one-tenth of a pound of cal-cium (expressed as calcium carbonate), forinstance, per cubic foot of clay is a typicalcation exchange capacity for a naturallyoccurring clay. So-called zeolites are natu-rally occurring materials of much higherexchange capacity. About one pound of cal-cium per cubic foot of zeolite is a good aver-age value for this material. Synthetic ionexchange materials are produced that havecapacities of over 10 pounds of calcium percubic foot of exchange material.
Naturally occurring materials that haveion exchange capability include soils, lignin,humus, wool, and cellulose. The ion exchangecapacity of soils is made use of by land treat-ment systems. Synthetic ion exchange resinsof high capacity are manufactured, typically,as illustrated in Figure 7-112.
As shown in Figure 7-112, a "good" ionexchange material consists of a foundation ofan insoluble, organic, or inorganic three-dimensional matrix having many attachedfunctional groups. In the example shown inFigure 7-112, the three-dimensional matrixis formed by polymerization, in three dimen-sions, of styrene and divinylbenzene mole-cules. The functional groups are soluble ionsthat are able to attract ions of oppositecharge; they are attached by reacting variouschemicals with the basic matrix material. Inthe example shown in Figure 7-112, the solu-ble ions are sulfonate ions, attached to thethree-dimensional matrix by reacting thematrix with sulfuric acid. The term resin isused for the foundation matrix material.
Materials that exchange cations haveacidic functional groups such as the sulfonicgroup, R-SO3"; carboxylic, R-COO"; phe-nolic, R-O"; or the phosphonic group, R-PO3H". In each case the R represents thefoundation matrix. Materials that exchangeanions have the primary amine group,R-NH+; the secondary amine group, R-R'N+;or the quaternary amine group, R-R'3N+.The tertiary amine group can also be used.Cation exchange resins with a high degree of
Styrene Divinylbenzene
Figure 7-112 Typical process for manufacturing ion exchange resins.
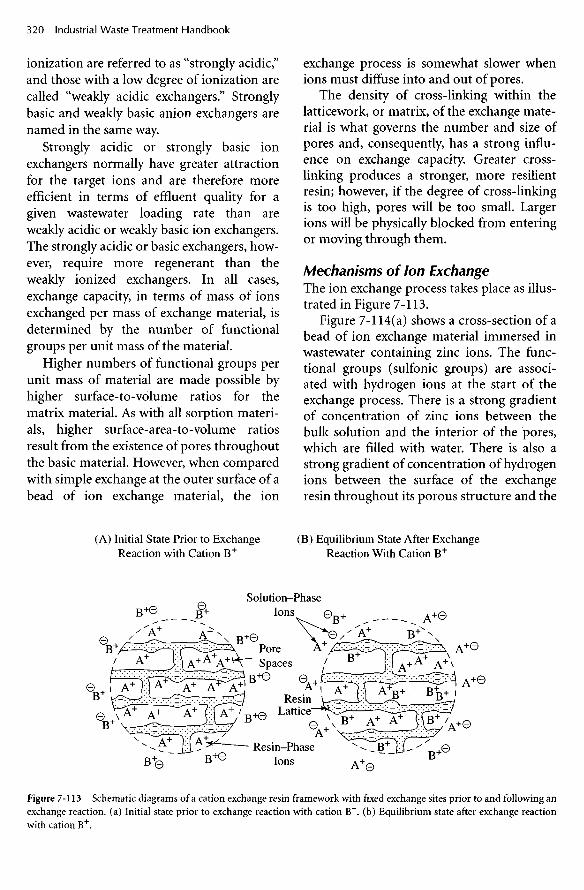
ionization are referred to as "strongly acidic "and those with a low degree of ionization arecalled "weakly acidic exchangers." Stronglybasic and weakly basic anion exchangers arenamed in the same way.
Strongly acidic or strongly basic ionexchangers normally have greater attractionfor the target ions and are therefore moreefficient in terms of effluent quality for agiven wastewater loading rate than areweakly acidic or weakly basic ion exchangers.The strongly acidic or basic exchangers, how-ever, require more regenerant than theweakly ionized exchangers. In all cases,exchange capacity, in terms of mass of ionsexchanged per mass of exchange material, isdetermined by the number of functionalgroups per unit mass of the material.
Higher numbers of functional groups perunit mass of material are made possible byhigher surface-to-volume ratios for thematrix material. As with all sorption materi-als, higher surface-area-to-volume ratiosresult from the existence of pores throughoutthe basic material. However, when comparedwith simple exchange at the outer surface of abead of ion exchange material, the ion
(A) Initial State Prior to ExchangeReaction with Cation B+
exchange process is somewhat slower whenions must diffuse into and out of pores.
The density of cross-linking within thelatticework, or matrix, of the exchange mate-rial is what governs the number and size ofpores and, consequently, has a strong influ-ence on exchange capacity. Greater cross-linking produces a stronger, more resilientresin; however, if the degree of cross-linkingis too high, pores will be too small. Largerions will be physically blocked from enteringor moving through them.
Mechanisms of Ion ExchangeThe ion exchange process takes place as illus-trated in Figure 7-113.
Figure 7-114(a) shows a cross-section of abead of ion exchange material immersed inwastewater containing zinc ions. The func-tional groups (sulfonic groups) are associ-ated with hydrogen ions at the start of theexchange process. There is a strong gradientof concentration of zinc ions between thebulk solution and the interior of the pores,which are filled with water. There is also astrong gradient of concentration of hydrogenions between the surface of the exchangeresin throughout its porous structure and the
(B) Equilibrium State After ExchangeReaction With Cation B+
Solution-PhaseIons
PoreSpaces
ResinLattice
Resin-PhaseIons
Figure 7-113 Schematic diagrams of a cation exchange resin framework with fixed exchange sites prior to and following anexchange reaction, (a) Initial state prior to exchange reaction with cation B+. (b) Equilibrium state after exchange reactionwith cation B+.

PORE SPACERESIN SOLID
Figure 7-114 Schematic diagram of a cation exchange resin exchanging two monovalent (H ) ions for one divalent ion(ZN
++).
water within the pores. Because of this,hydrogen ions have a strong tendency toleave the functional groups and diffusethroughout the pores, but the stronger ten-dency to maintain electrical neutrality pre-vents this from taking place. However, as thezinc ions are driven into the interior of thepores by molecular diffusion, due to theirconcentration gradient (Figure 7-114[b]),they are available to interchange with thehydrogen ions (Figure 7-114[c]). Thus, theforce tending to distribute hydrogen and zincions uniformly throughout the aqueous sys-tem (entropy) is satisfied, and the tendency
to maintain electrical neutrality is also satis-fied (Fig 7-114[d]). The tendency to main-tain electrical neutrality results in stoichio-metric exchange (i.e., one divalent ionexchanges with two monovalent ions, etc.).
Kinetics Of Ion ExchangeAlthough the description given above of theexample illustrated in Figure 7-114 is useful,there is more to the overall ion exchange pro-cess. In general, the rate-controlling processis either the rate of diffusion of ions throughthe film (the region of water molecules sur-rounding the ion exchange resin material) or
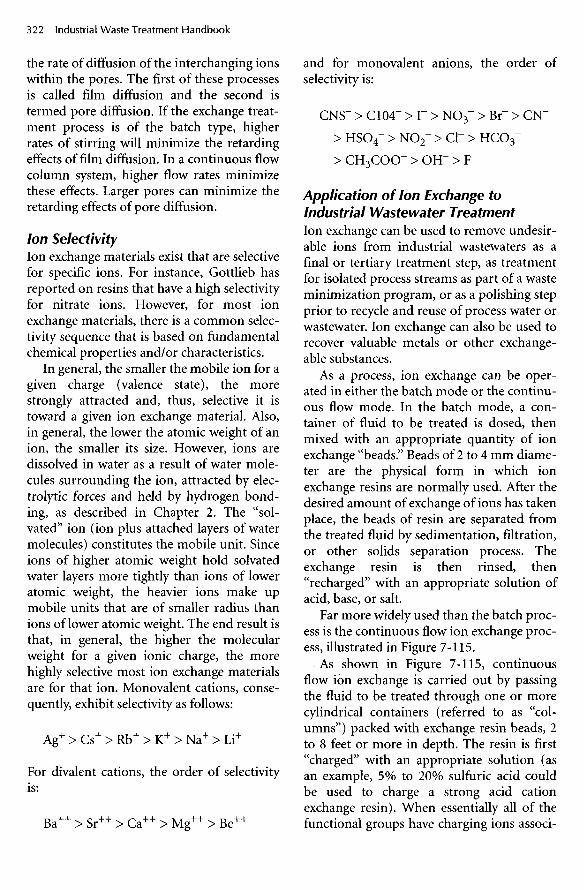
the rate of diffusion of the interchanging ionswithin the pores. The first of these processesis called film diffusion and the second istermed pore diffusion. If the exchange treat-ment process is of the batch type, higherrates of stirring will minimize the retardingeffects of film diffusion. In a continuous flowcolumn system, higher flow rates minimizethese effects. Larger pores can minimize theretarding effects of pore diffusion.
Ion SelectivityIon exchange materials exist that are selectivefor specific ions. For instance, Gottlieb hasreported on resins that have a high selectivityfor nitrate ions. However, for most ionexchange materials, there is a common selec-tivity sequence that is based on fundamentalchemical properties and/or characteristics.
In general, the smaller the mobile ion for agiven charge (valence state), the morestrongly attracted and, thus, selective it istoward a given ion exchange material. Also,in general, the lower the atomic weight of anion, the smaller its size. However, ions aredissolved in water as a result of water mole-cules surrounding the ion, attracted by elec-trolytic forces and held by hydrogen bond-ing, as described in Chapter 2. The "sol-vated" ion (ion plus attached layers of watermolecules) constitutes the mobile unit. Sinceions of higher atomic weight hold solvatedwater layers more tightly than ions of loweratomic weight, the heavier ions make upmobile units that are of smaller radius thanions of lower atomic weight. The end result isthat, in general, the higher the molecularweight for a given ionic charge, the morehighly selective most ion exchange materialsare for that ion. Monovalent cations, conse-quently, exhibit selectivity as follows:
Ag+ > Cs+ > Rb+ > K+ > Na+ > Li+
For divalent cations, the order of selectivityis:
Ba++ > Sr++ > Ca++ > Mg++ > Be++
and for monovalent anions, the order ofselectivity is:
CNS" > C104" > r > NO3" > Br" > CN"
> HSO4" > NO2" > Cl" > HCO3"
> CH3COO" > OH" > F
Application of Ion Exchange toIndustrial Wastewater TreatmentIon exchange can be used to remove undesir-able ions from industrial wastewaters as afinal or tertiary treatment step, as treatmentfor isolated process streams as part of a wasteminimization program, or as a polishing stepprior to recycle and reuse of process water orwastewater. Ion exchange can also be used torecover valuable metals or other exchange-able substances.
As a process, ion exchange can be oper-ated in either the batch mode or the continu-ous flow mode. In the batch mode, a con-tainer of fluid to be treated is dosed, thenmixed with an appropriate quantity of ionexchange "beads." Beads of 2 to 4 mm diame-ter are the physical form in which ionexchange resins are normally used. After thedesired amount of exchange of ions has takenplace, the beads of resin are separated fromthe treated fluid by sedimentation, filtration,or other solids separation process. Theexchange resin is then rinsed, then"recharged" with an appropriate solution ofacid, base, or salt.
Far more widely used than the batch proc-ess is the continuous flow ion exchange proc-ess, illustrated in Figure 7-115.
As shown in Figure 7-115, continuousflow ion exchange is carried out by passingthe fluid to be treated through one or morecylindrical containers (referred to as "col-umns") packed with exchange resin beads, 2to 8 feet or more in depth. The resin is first"charged" with an appropriate solution (asan example, 5% to 20% sulfuric acid couldbe used to charge a strong acid cationexchange resin). When essentially all of thefunctional groups have charging ions associ-
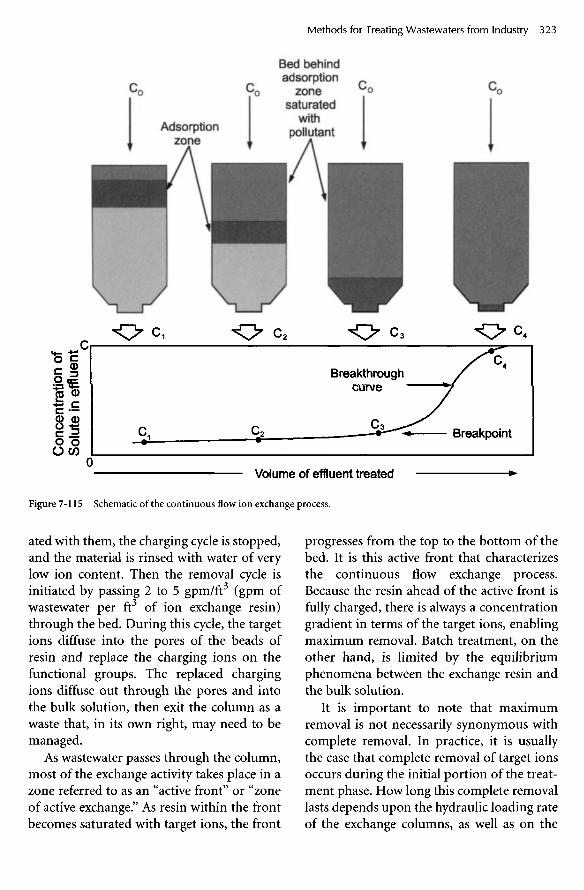
Figure 7-115 Schematic of the continuous flow ion exchange process.
ated with them, the charging cycle is stopped,and the material is rinsed with water of verylow ion content. Then the removal cycle isinitiated by passing 2 to 5 gpm/ft (gpm ofwastewater per ft of ion exchange resin)through the bed. During this cycle, the targetions diffuse into the pores of the beads ofresin and replace the charging ions on thefunctional groups. The replaced chargingions diffuse out through the pores and intothe bulk solution, then exit the column as awaste that, in its own right, may need to bemanaged.
As wastewater passes through the column,most of the exchange activity takes place in azone referred to as an "active front" or "zoneof active exchange." As resin within the frontbecomes saturated with target ions, the front
progresses from the top to the bottom of thebed. It is this active front that characterizesthe continuous flow exchange process.Because the resin ahead of the active front isfully charged, there is always a concentrationgradient in terms of the target ions, enablingmaximum removal. Batch treatment, on theother hand, is limited by the equilibriumphenomena between the exchange resin andthe bulk solution.
It is important to note that maximumremoval is not necessarily synonymous withcomplete removal. In practice, it is usuallythe case that complete removal of target ionsoccurs during the initial portion of the treat-ment phase. How long this complete removallasts depends upon the hydraulic loading rateof the exchange columns, as well as on the
Bed behindadsorption
zonesaturated
withpollutantAdsorption
zone
Breakthroughcurve
Breakpoint
Volume of effluent treated
Co
nce
ntr
atio
n o
fS
olu
te i
n e
fflu
ent

influent
Degasifier
Effluent
Figure 7-116 Treatment train for removal of both cations and anions.
strength of attraction between the exchangesites and the target ions. Sooner or later, tar-get ions begin to bleed through and appear inthe effluent (referred to as "breakthrough")until, at some point, the effluent becomesunacceptable. At this point, the treatmentrun is stopped, and the exchange resin isbackwashed with water to remove debris andto regrade the resin.
If both cations and anions are to beremoved, the treatment train is set up asshown in Figure 7-116, with the cationexchangers preceding the anion exchangers.Otherwise, metal cations that might appearduring noncomplete removal would precipi-tate with hydroxide ions within the anionexchanger and cause fouling.
A familiar example of cation-anionremoval is the "demineralization" of water.In this process, the cation exchanger ischarged with hydrogen ions and is said to beon the acid cycle or on the hydrogen cycle.The anion exchanger is charged by passingsodium or potassium hydroxide solutionthrough it and is said to be on the hydroxidecycle. Cations (metals, calcium, etc.) areexchanged for hydrogen ions, which thenreact with hydroxide ions exchanged for
anions (sulfate, chloride, etc.) to form water,the only intended substance in the effluentfrom the anion exchanger.
In many cases, a mixed bed process isadvantageous. The cation and anionexchange resins are mixed and packed into asingle column. The two resins must be sepa-rated, however, prior to recharging and thenmixed again for the next ion exchange cycle.
Often, ions that have just been exchangedare soon replaced by ions for which theexchange material is more highly selective.This process results in the less stronglyselected ions being pushed along at the frontof the zone of active exchange. When break-through occurs, the effluent will be enrichedin the less strongly selected ions.
Practical limitations to the ion exchangeprocess include the following:
1. The fluid to be treated must be reason-ably free of nondissolved solids. The eco-nomics of ion exchange are such that it iscost effective to install and operate solidsremoval facilities prior to the process,rather than lose capacity due to fouling.
2. Corrosion-resistant materials of con-struction are required for the column

containers as well as the pumps and pip-ing.
3. Disposal of spent regenerant (whichcontains the target ions that have beenremoved), as well as rinse waters, maypose an expensive problem if they can-not be discharged to the municipal seweror to the industry's main wastewatertreatment system.
Significant advantages of ion exchange asa process, compared with chemical precipita-tion, include:
1. No significant sludge disposal problem.2. No chemical feeders, mixers, etc., other
than what is required to make up andfeed regenerant.
3. The systems are simple to operate and donot require much attention.
Design CriteriaDesign criteria, including brand and type ofexchange resins, volumes of resins, treat-ment train configuration, charging sub-stances, and hydraulic loading rates, are nor-mally generated in the laboratory. Also, it issometimes cost effective to perform a seriesof batch studies wherein varying quantitiesof a fully charged exchange resin are placedinto Erlenmeyer flasks containing the liquidto be treated and then mixed in a standard-ized manner. Plots are then made in thesame manner as they are made for carbonadsorption isotherms, discussed previously.While these plots may not be able to be usedexactly as adsorption isotherms are used,they show important trends needed in thedesign process.
Removal of Specific OrganicSubstancesIn general, ion exchange is useful for remov-ing inorganic substances, but not organicsubstances, and the reverse is normally thecase for activated carbon. However, activatedcarbon can be very effective in removingmetal ions from wastewater by simply chelat-
ing the metals with an organic chelant, suchas EDTA, and certain organics can beremoved by ion exchange-type resins manu-factured for that specific purpose. Thesemacroreticular resins are available for use inremoving specific nonpolar organic materi-als. Passing a liquid that is a solvent for thetarget substance regenerates these resins.
StrippingStripping is a physical treatment technology,in the sense that there are no chemical reac-tions involved. Stripping is a method of mov-ing one or more chemical substances fromone medium, either liquid or gas, to another,also either liquid or gas, but usually theopposite of the first medium. That is, if thefirst medium is liquid, the second is gas, andvice versa. An example of stripping as a treat-ment technology is the stripping of acetonefrom water with air, described in the follow-ing text and illustrated in Figure 7-117.
Acetone is highly soluble in water, but canbe removed from water solution by bubblingair through an acetone-water mixture or bycausing droplets of the liquid mixture to passthrough the air as takes place duringmechanical aeration.
The mechanism of removal is accountedfor by a combination of Henry's law of solu-bility and Dalton's law of partial pressures.Acetone is volatile compared with water;therefore, molecules of acetone will passfrom a container of the mixture, through theacetone-water surface, into the air until thepartial pressure of acetone in the air is equalto the vapor pressure of the acetone. If thecontainer is covered, and there is enough ace-tone in the mixture, equilibrium will bereached and the concentration of acetone inthe mixture will then remain constant. If thevessel is not covered, equilibrium will neverbe reached. This fact alone will result in allthe acetone eventually being removed fromthe water mixture, given enough time. How-ever, because of the length of time required,this arrangement hardly qualifies as a waste-water treatment method. The process can be

greatly accelerated by increasing the surfacearea of the acetone-water mixture. This caneasily be accomplished by introducing a hostof air bubbles to the bulk volume of the ace-tone-water mixture or by converting the bulkvolume of the mixture to a host of tiny drop-lets.
Either way, the surface area of the acetone-water mixture will be greatly increased; mol-ecules of acetone will pass from the mixture,through the surface films of either the airbubbles or the liquid droplets, into the airphase, in an attempt to raise the partial pres-sure of acetone in the air phase to a valueequal to the vapor pressure of acetone (at theprevailing temperature). The result will beessentially complete removal of the acetonefrom the water.
In the case of volatile substances, whichare toxic or otherwise objectionable, the sub-stance must be contained after stripping andsubjected to appropriate reuse or final dis-posal. In many cases, activated carbon hasbeen used to capture organic substances thathave been removed from aqueous solution(polluted groundwater, for instance). Inother cases, stripped organics have been dis-posed of directly, by incineration using a
flame in a conduit leading from the enclosedstripping reactor to the atmosphere.
ScrubbingScrubbing, like stripping, is a physical treat-ment technology, because no chemical reac-tions are involved. Also, like stripping, itsmechanism is accounted for by a combina-tion of Henry's law of gas solubility and DaI-ton's law of partial pressures. Usually, scrub-bing is used to remove one or more targetgases from a stream of mixed gases, whereasstripping is used to remove one or more sub-stances that have a higher vapor pressurethan water from a wastewater stream.
An example of scrubbing as a treatmentmethod is that of the removal of hydrogensulfide from air using chlorine in a watersolution of high pH. Figure 7-118 shows astream of waste air being passed through a"scrubber." The scrubber resembles a dis-charge stack and operates as follows: a fandraws the air stream through the duct workto the scrubber, then forces it up through thescrubbing apparatus, then into the atmos-phere. The scrubbing apparatus consists oftwo parts. The first is a chamber filled with"telerets," known as the "packing," which are
Figure 7-117 Stripping as a waste treatment technology, (a) Air bubble stripping molecules of Acetone as it rises throughthe Acetone-bearing water, (b) Acetone being stripped out of Acetone-bearing water cascading over packing.
Acetone Acetone (a) (b)
Air Flow
Acetone
Acetone
Air
Water

Figure 7-118 Illustration of the air "scrubbing" process.
solid objects with a high surface-to-volumeratio. The second is a system for circulating asolution of dissolved chlorine plus dissolvedsodium or potassium hydroxide (in water)through the scrubbing chamber by pumpingfrom the reservoir through spray nozzlesdown onto the telerets. The caustic chlorinesolution flows over the surface of the pack-ing, where it contacts the air to be treated.During this contact period the hydrogen sul-fide gas dissolves in the water, where it existsin equilibrium according to the following:
H2St-* HS'+H+ (7-88)
Because the solution is of a high pH, OH~ions "remove" almost all of the H+ ions:
H+ +OH" -> H2O (7-89)
causing the equilibrium (equation 7-88) todisplace to the right. In so doing, essentiallyall of the hydrogen sulfide that was dissolvedout of the stream of contaminated air exists
H2S= laden airWater containing SO4"
Packing
Watercontaining
- OH"andCl2

as dissolved sulfide ion, which reacts withdissolved chlorine as follows:
HS2+4CZ2+4H2O(7-90)
->SO 4"+9H++8Cr
Thus, hydrogen sulfide is "scrubbed" fromthe air and oxidized to soluble, nonodoroussulfate ion. Of course, it can be reduced backto the sulfide state and come out of solutionas hydrogen sulfide under favorable condi-tions of neutral to low pH. Therefore, it isnecessary to dispose of the waste scrubbersolution in an appropriate manner. In manyapplications, the "spent" scrubber solution issimply discharged to the industrial wastewa-ter sewer, after which it is treated in theindustry's wastewater treatment system.
Magnetically Enhanced SolidsSeparation (CoMag Process)This patented process, referred to as the"CoMag Process," makes use of finely granu-lated magnetite as a nucleation site for pre-cipitation and then coagulation of suspendedsolids or dissolved substances, such as phos-phorus. The granular magnetite is added tothe (usually treated) wastewater, mixed vig-orously for a short period of time (five sec-onds), then mixed slowly for a somewhatlonger time (five minutes). The rapid mixaccomplishes complete dispersion of themagnetite, and the slow mix accomplishescoagulation of the chemical precipitates, aswell as agglomeration into large floes. Coag-ulants and coagulant aids (polymers) aretypically used, as well.
The flocculated material then flows to asettling chamber where a magnet, actingupon the entrained magnetite, greatly aidsthe process of separating the floes from thebulk liquid. Use of the magnetite and magnetallows loading of the clarifier at rates that aremore than ten times greater than is typicalfor a conventional physical-chemical process.Therefore, the cost of construction of the
clarifier is very low, and the footprint is farsmaller than would be required for a conven-tional clarifier.
Figure 7-119 is a process flow diagram ofthe CoMag system.
Other Wastewater Treatment Methods
Land ApplicationThere are several versions of land applicationas a wastewater treatment method, includingspray irrigation, wetlands treatment, over-land flow, hyponics, and a relatively new pro-prietary process called "snowfluent," inwhich pretreated wastewater is made intosnow by use of the same equipment used atski areas. In all land application systems, thetreatment mechanisms include evaporation,evapotranspiration, microbiological metabo-lism, adsorption, and direct plant uptake. Aswell, land application systems rely upon thegroundwater for final disposal of the waterafter treatment has taken place. For this rea-son, land application is appropriate for usewith only wastewaters that have all biode-gradable organics. Bacteria and other micro-organisms living in the soil use the organicsas food for energy and reproduction. To thisextent, a land treatment site is regenerativeand can be used for many years, with appro-priate rest periods. To the extent that somesubstances are removed by adsorption to soilparticles, as is the case for phosphorus, a landapplication site has a limited life.
Land application systems are subject tolimitations, some of which are as follows:
1. Land application systems must not beused if it is unacceptable, or even unde-sirable, for the wastewater, raw ortreated, to enter the groundwater. Thegroundwater is the ultimate disposaldestination of all the wastewater thatdoes not evaporate, transpire, or find itsway via overland flow to a surface waterbody (a form of system failure).

Rec
over
ed M
agne
tite
Slud
ge
Back
was
h
Metal Salt
Polymer
ChemicalTreatment
Recycle
MagnetiteRecovery
Figure 7-119 Process flow diagram for magnetically enhanced solids separation (CoMag).

2. The hydraulic application rate must bemore than the evapotranspiration rate.Otherwise, salts will be left in the soil,rather than washed down into thegroundwater. The consequence will beplugged soil, i.e., a failed wastewatertreatment system.
3. There are many laws, rules, and regula-tions governing rates of application. Fac-tors that must be considered include:
a. The hydraulic conductivity of the soilb. The rates of evaporation and transpi-
ration in the geographical areac. The allowable nitrogen loading in the
soild. The type of cover crop used and
whether or not it is to be harvested ona regular basis (subnote: There MUSTbe a cover crop)
e. The substances in the wastewater
With respect to allowable applicationrates, each state has its own regulations. Typ-ically, hydraulic application rates are limitedto 5,000 to 10,000 GPD/acre (1/4 to 1/2 inchper day). Nitrogen loading rates are typicallylimited to 400 lb/acre/yr if the cover crop isharvested, or to 200 lb/acre/yr if the covercrop is not harvested.
Spray IrrigationSpray irrigation sites are used in rural areasfor food processing wastewaters generated ona seasonal basis, as well as for many otherindustrial wastewaters that contain no non-biodegradable substances. In arid regions,the wastewater treatment process serves alsoto supply the water needs of appropriatecrops. In cold regions, sufficient storage mustbe provided during the nongrowing season.
Design criteria for spray irrigation systemsinclude wastewater application rate, distribu-tion system pipe sizing, and storage facilitysizing.
Wastewater Application RateThe water-balance equation (7-91) is used todetermine the acceptable rate of application
of wastewater, based on soil hydraulic con-ductivity considerations. In many cases, oneof the substances contained in the wastewater(nitrogen, for instance) might govern therate of wastewater application. The waterbalance equation is stated as:
Lw(p) = ET-p + Wp (7-91)
where
L^p) = wastewater application rate, in./month
ET = Rate of evapotranspiration, in./month
p = Rate of precipitation, in/monthWp = Rate of percolation into soil, in./
month
Notice that if the rate of precipitationexceeds the combined rates of evapotranspi-ration and percolation, spray cannot takeplace.
Wetlands TreatmentWetlands treatment can be described as bio-logical and microbiological treatment ofwastewater resulting from the use of pollut-ants as food for living organisms in a naturalor artificial wetlands. Sedimentation (inregions of slow flow and eddy currents),adsorption onto soils and the root systemsand other parts of plants, photooxidation,direct plant uptake, cation exchange, andphotosynthesis are also important mecha-nisms of pollutant removal. In wetlandstreatment, wastewater, usually pretreated to arather high degree in the case of natural wet-lands, is allowed to flow, very slowly, throughthe wetlands system. Bacteria, fungi, andmany other types of organisms inhabit theaqueous medium and use pollutants con-tained in the wastewater for food. Wetlandssystems are usually no more than two feetdeep, in order to enable photosynthesis anddiffusion from the air to maintain aerobicconditions. Area loading rates must be man-aged so as to avoid the development of anaer-

obic zones. Flow through them is very slow,so that hydraulic retention times are verylong, due to the lack of input of energy of thetypes used with mechanical treatment sys-tems. There is no return of sludge or otherattempt to increase the numbers of organ-isms.
Artificial or constructed wetlands aresometimes used for raw industrial wastewa-ters, or wastewaters that have had only mini-mal pretreatment. The organic strength ofthese wastewaters is typically low. Con-structed wetlands are of two types: thosewith a free water surface (FWS), as with nat-ural wetlands, and those with subsurfaceflow systems (SFS), also known as "rock-reedfilters" and "root zone filters." These systemshave highly porous media, such as sand orrocks, that support the growth of plants andthrough which the wastewater flows at a slowrate.
Wetlands treatment makes use of all of thebiological treatment mechanisms that areinvolved in any of the conventional biologicaltreatment processes, and, as such, these sys-tems require nutrients and trace elements.Wintertime operation requires special con-sideration.
The fact that most natural wetlands occurin areas of groundwater discharge or areunderlain by impermeable material makesthem unlikely sources of future groundwatercontamination. However, protection of thegroundwater must be positively ensured dur-ing the design and construction process. Inthe case of artificial or constructed wetlands,protection of groundwater by installation ofan appropriate liner is a major design consid-eration.
Reeds, cattails, sedges, and bullrushes aretypes of emergent plants that have performedwell in wetlands treatment systems. Floatingplants such as water hyacinths and duckweedare also effective. In particular, the root sys-tems of water hyacinths project a mesh intothe flow that effectively adsorbs both dis-solved and suspended matter. Microbial deg-radation, however, is responsible for the bulkof the treatment of dissolved and suspended
organic matter. The plant life participates inreaeration. If the plant life is used for nutri-ent removal, nitrogen and/or phosphorus,for instance, there must be a periodic har-vesting of these plants to prevent reintroduc-tion of these nutrients to the water flow whenthe plants die. The bioaccumulation of traceelements such as heavy metals must be con-sidered when selecting final disposal meth-ods for the plants.
Design parameters for wetlands systemsinclude system geometry; hydraulic retentiontime; type, size, and porosity of media;hydraulic loading rate; organic or nutrientloading rate; temperature; and slope.
The area and length-to-width ratio of thebasin are determined by either hydraulicretention time or organic or nutrient loadingrate, and whether the system is FWS or SFS.Temperature is a very important consider-ation, closely paralleling lagoons and stabili-zation ponds in that respect.
Bibliography
American Public Health Association, Ameri-can Society of Civil Engineers, AmericanWater Works Association, and Water Pol-lution Control Federation. Glossary, Waterand Wastewater Control Engineering. 1969.
American Society of Civil Engineers. Stan-dard Guidelines for In-Process OxygenTransfer Testing. Publication No. ASCE-18-96, 1997.
American Society of Civil Engineers. "Waste-water Treatment Plant Design." Water Pol-lution Control Federation Manual of Prac-tice, 8; ASCE Manuals and Reports onEngineering Practice, No. 36, 1977.
Amirtharajah. Journal of the American WaterWorks Association. Dec. 1988.
Behn, V. C , and J. C. Liebman. "Analysis ofThickener Operation." Journal of the Sani-tary Engineering Division, American Soci-ety of Civil Engineers 89 (1963).
Burd, R. S. "A Study of Sludge Handling andDisposal." Federal Water Pollution Con-

trol Administration, WP-20-4. Washing-ton, DC: 1968.
Butler, J. N. Ionic Equilibrium—A Mathemat-ical Approach. Reading, MA: Addison-Wesley, 1964.
Cummins, M. D., and J. J. Westrick. "PackedColumn Air Stripping for Removal of Vol-atile Compounds." Proceedings of NationalConference on Environmental Engineering,American Society of Civil Engineers. Min-neapolis, MN: 1982.
Eckenfelder, W. W. "Trickling Filter Designand Performance." Transcript of the ASCE128, pt. Ill (1963): 371.
Eckenfelder, W. W., and W. Barnhart. "Per-formance of a High-Rate Trickling FilterUsing Selected Media." Journal of theWater Pollution Control Federation 35, No.12(1963).
Eckenfelder, W. W., and D. L. Ford. WaterPollution Control: Experimental Proceduresfor Process Design. New York: PembertonPress, 1970.
Edde, H. J., and W. W. Eckenfelder. "Theo-retical Concept of Gravity Sludge Thick-ening; Scaling-up Laboratory Units toPrototype Design." Journal of the WaterPollution Control Federation 40 (1968).
Fair, G. M., J. C. Geyer, and D. A. Okun. Ele-ments of Water Supply and WastewaterDisposal. New York: John Wiley & Sons,1971.
Gailer, W. S., and H. B. Gotaas. "Analysis ofBiological Filter Variables." Journal of theSanitary Engineering Division, ASCE 90,No. 6(1964).
Germain, J. E. "Economical Treatment ofDomestic Waste by Plastic-Medium Trick-ling Filters." Journal of the Water PollutionControl Federation 38, No. 2 (1966).
Great Lakes-Upper Mississippi River Boardof State Sanitary Engineers. RecommendedStandards for Sewage Works. Albany, NY:Health Education Service, Inc., 1978.
Hawkes, H. A. Microbial Aspects of Pollution.London: Academic, 1971.
Kavanaugh, M. C , and P. R. Trussell. "Designof Aeration Towers to Strip Volatile Con-taminants from Drinking Water." Journal
American Water Works Association 72, No.12.(1980).
Kynch, G. J. "A Theory of Sedimentation."Transactions of the Faraday Society 48(1952).
Lanouette, K. H. "Heavey Removal," Chemi-cal Engineering Journal 84, No. 10 (1977):73-80.
McKinney, R. E. Microbiology for SanitaryEngineers. New York: McGraw-Hill, 1962.
Metcalf 8c Eddy, Inc. Wastewater Engineer-ing—Treatment, Disposal, and Reuse.Edited by G. Tchobanoglous and F. L.Burton. New York: McGraw-Hill, 1991.
National Fire Protection Association. "Rec-ommended Practice for Fire Protection inWastewater Treatment and CollectionFacilities." ATFPA Standard 820 (1992).
Novotny, V, and A. J. Englande, Jr. "Equal-ization Design Techniques for Conserva-tive Substances in Wastewater TreatmentSystems." Water Research 8, No. 325(1974).
Novotny, V, and R. M. Stein. "Equalizationof Time Variable Waste Loads." Journal ofEnvironmental Engineering, ASCE 102,No. 613 (1916).
Schulze, K. L. "Load and Efficiency of Trick-ling Filters." Journal of the Water PollutionControl Federation 32, No. 3 (1960): 245.
"Sewage Treatment at Military Installations."National Research Council. Sewage WorksJournal 18, No. 5(1946).
Shinskey, F. G. pH and pION Control. NewYork: John Wiley & Sons, 1973.
Smith, J. M. Chemical Engineering Kinetics.2nd ed. New York: McGraw-Hill, 1972.
Smith, R., R. G. Eilers, and E. D. Hall."Design and Simulation of EqualizationBasins." For the U.S. Environmental Pro-tection Agency. Advanced Waste Treat-ment Research Laboratory. Cincinnati,OH: 1973.
Stenstrom, M. K., and R. G. Gilbert. "Effectsof Alpha, Beta, and Theta Factor Upon theDesign, Specification, and Operation ofAeration Systems." Water Research 15(1981).

Talmage, W. P., and E. B. Fitch. "DeterminingThickener Unit Areas." Industrial andEngineering Chemistry 47 (1955).
The Soap and Detergent Association. Phos-phorus and Nitrogen Removal from Munic-ipal Wastewater: Principles and Practice.2nd ed. Edited by R. Sedlak. New York:Lewis Publishers, 1991.
U.S. Congress. Office of Technology Assess-ment. Technologies and ManagementStrategies for Hazardous Waste Control.Washington, DC: U.S. Government Print-ing Office, 1983.
U.S. Environmental Protection Agency.Chemical Aids Manual for WastewaterTreatment Facilities. EPA 430/9-79-018,MO-25. Washington, DC: U.S. Govern-ment Printing Office, 1979.
U.S. Environmental Protection Agency.Design Manual—Phosphorus Removal.EPA/621/1-87/00 1. Washington, DC: U.S.Government Printing Office, 1987.
U.S. Environmental Protection Agency. Dis-infection of Wastewater Task Force Report.EPA-430/9-75-012. Washington, DC: U.S.Government Printing Office, 1976.
U.S. Environmental Protection Agency. Elec-troplating Industry. EPA 625/5-79-016.Washington, DC: U.S. Government Print-ing Office, 1979.
U.S. Environmental Protection Agency. Eval-uation of Sludge Management Systems.EPA 430/9-80-00 1. Washington, DC: U.S.Government Printing Office, 1980.
U.S. Environmental Protection Agency. FlowEqualization. Technology Transfer. EPA625/4-74-006. Washington, DC: U.S. Gov-ernment Printing Office, 1974.
U.S. Environmental Protection Agency. Lin-ing of Waste Impoundment and DisposalFacilities. SW-870. Washington, DC: U.S.Government Printing Office, 1983.
U.S. Environmental Protection Agency. Man-ual for Nitrogen Control. EPA/625/R-93/010. Washington, DC: U.S. GovernmentPrinting Office.
U.S. Environmental Protection Agency.Meeting Hazardous Waste Requirements for
Metal Finishers. EPA 625/4-87/018. Cin-cinnati, OH: 1987.
U.S. Environmental Protection Agency.Nitrification and Denitrification Facilities,Wastewater Treatment. Technology Trans-fer. Washington, DC: U.S. GovernmentPrinting Office, 1973.
U.S. Environmental Protection Agency.Operations Manual for Anaerobic SludgeDigestion. EPA 430/9-76-001. Washington,DC: U.S. Government Printing Office,1976.
U.S. Environmental Protection Agency. Oxy-gen-Activated Sludge Wastewater Treat-ment Systems. Technology Transfer Semi-nar Publication. Washington, DC: U.S.Government Printing Office, 1973.
U.S. Environmental Protection Agency. Proc-ess Control Manual for Aerobic BiologicalWastewater Treatment Facilities. EPA III—A-524-77. Washington, DC: U.S. Govern-ment Printing Office, 1977.
U.S. Environmental Protection Agency. Proc-ess Design Manual for Carbon Adsorption.Technology Transfer. EPA 625/1-71/0022.Washington, DC: U.S. Government Print-ing Office, 1973.
U.S. Environmental Protection Agency. Proc-ess Design Manual for PhosphorusRemoval. Technology Transfer. EPA 625/1-76-00Ia. Washington, DC: U.S. Govern-ment Printing Office, 1976.
U.S. Environmental Protection Agency. Proc-ess Design Manual for Sludge Treatmentand Disposal. Technology Transfer. EPA625/1-74-006. Washington, DC: U.S. Gov-ernment Printing Office, 1974.
U.S. Environmental Protection Agency. Proc-ess Design Manual for Suspended SolidsRemoval. Technology Transfer. EPA62511-75-003a. Washington, DC: U.S.Government Printing Office, 1975.
U.S. Environmental Protection Agency. Proc-ess Design Manual for Upgrading ExistingWastewater Treatment Plants. TechnologyTransfer. EPA 625/1-71-004a. Washing-ton, DC: U.S. Government PrintingOffice, 1974.

U.S. Environmental Protection Agency. Pro-cess Manual for Carbon Adsorption. Tech-nology Transfer. Washington, DC: U.S.Government Printing Office, 1971.
U.S. Environmental Protection Agency. Phys-ical-Chemical Nitrogen Removal, Wastewa-ter Treatment. Technology Transfer. Wash-ington, DC: U.S. Government PrintingOffice, 1974.
U.S. Environmental Protection Agency.Upgrading Trickling Filters. EPA 430/ 9-78-004. Washington, DC: U.S. GovernmentPrinting Office, 1978.
U.S. Environmental Protection Agency.Wastewater Filtration, Design Consider-ations. Technology Transfer. EPA 62514-74-007a. Washington, DC: U.S. Govern-ment Printing Office, 1974.
U.S. Environmental Protection Agency.Industrial Environmental Research Labo-ratory. Control and Treatment Technologyfor the Metal Finishing Industry. EPA 625/8-82-008. Cincinnati, OH: 1982.
U.S. Environmental Protection Agency.Industrial Environmental Research Labo-ratory. Control and Treatment Technologyfor the Metal Finishing Industry—SulfidePrecipitation. EPA 625/8-80/003. Cincin-nati, OH: 1980.
U.S. Environmental Protection Agency.Municipal Environmental Research Labo-ratory. Innovative and Alternative Technol-ogy Assessment Manual. EPA 430/9-78-009, MCD 53. Cincinnati, OH: 1978.
U.S. Environmental Protection Agency.Office of Research and Development.Control of Organic Substances in Water andWaste Water. EPA 600/8-83/01 1. Cincin-nati, OH: 1983.
U.S. Environmental Protection Agency.Office of Research and Development. Esti-mating Costs of Granular Activated CarbonTreatment for Water and Wastewater.Washington, DC: U.S. Government Print-ing Office, 1983.
U.S. Environmental Protection Agency.Office of Research and Development.Research Summary—Industrial Wastewa-ter. EPA-60018-80-026. Washington, DC:U.S. Government Printing Office, June1980.
U.S. Environmental Protection Agency.Office of Wastewater Enforcement andCompliance. Ultraviolet Disinfection Tech-nology Assessment. EPA 832-R-92-004.Washington, DC: U.S. Government Print-ing Office, 1992.
VeIz, C. J. "A Basic Law for the Performanceof Biological Filters." Sewage Works Jour-nal 20 (1948): 607.
Wachinski, A. M., and J. E. Etzel. Environ-mental Ion Exchange—Principles andDesign. New York: Lewis Publishers, 1997.
Wallace, A. T. "Analysis of EqualizationBasins." Journal of the Sanitary Engineer-ing Division, ASCE 9>4, No. 1161 (1968).
Water Environment Federation. Design ofMunicipal Wastewater Treatment Plants;WEF Manual of Practice. No. 8. Alexan-dria, VA: 1992.
Water Environment Federation. Odor Con-trol in Wastewater Treatment Plants; WEFManual of Practice. No. 22. Alexandria,VA: 1995.
Wei, J., and C. D. Prater. "A New Approach toFirst Chemical Reaction Systems." AlChEJournal 9, No. 77'(1963).
Wei, J., and C. D. Prater. Advances in Cataly-sis, Vol. 13. New York: Academic Press,1962.

8 Treatment of Air Dischargesfrom Industry
Air Discharges
The discharge, or release, of substances to theair, no matter how slight, is regarded as airpollution. Discharges can be direct, by meansof a stack, vent, hood, or the like, or indirect,by way of leaks from a building's windows,doors, or other openings. These indirectemissions are referred to as fugitive emis-sions. Fugitive emissions must be consideredto evaluate a facility's total emissions; theyinclude any emission that is generated froman outlet not specifically designed and builtto discharge substances to the air.
For example, when evaluating air dis-charges at a paper mill, discharges fromboiler stacks and laboratory hoods would beconsidered direct emissions. If the same facil-ity used calcium carbonate in the process,and dust generated in its handling enteredthe atmosphere, this would be considered afugitive emission.
Other examples of fugitive emissionsinclude volatilization of organic compoundssuch as solvents and gasoline from storagecontainers, transfer equipment, and evenpoints of use.
Discharges can be in only one of two cate-gories: within compliance or out of compli-ance. Major sources of criteria pollutants andhazardous air pollutants (HAPs) are regu-lated by the Clean Air Act, as amended in1990, and administered by state or local air-quality management agencies. Some indus-trial establishments may be regulated by oneor more state or agency requirements that aremore restrictive than the CAA. The federalgovernment, through the EPA, serves twofunctions:
1. Issue regulations that must be followedby the administrating authorities
2. Oversight of the administration
The following sections summarize theregulations governing discharges of air.Chapter 3 provides a more comprehensivediscussion of air pollution control laws.
Air Pollution Control Laws
Federal involvement in air pollution controlbegan in 1955 with the passage of the AirPollution Control Act of 1955, Public Law84-159. While very narrow in scope, the Actserved as a wake-up call to states that air pol-lution control was to be taken seriously.
Subsequent amendments eventually led tothe Clean Air Act of 1963, Public Law 88-206,which, since its inception, has been amendedseveral times, resulting in today's prevailinglaw, the 1990 amendments.
The 1963 Clean Air Act designated six pol-lutants as "criteria pollutants," thought to bethe most important substances affecting thepublic's health and welfare. These criteriapollutants, still regarded as such in the year2005, are as follows:
• Sulfur dioxide (SO)• Nitrogen oxides (NOx)• Carbon monoxide (CO). Lead (Pb)• Ozone (O3)• Particulate matter (Pm)
The 1970 amendments established thebasic framework under which the Clean AirAct exists today. In addition to authorizingthe EPA to establish National Ambient Air

Quality Standards (NAAQS), the 1970amendments authorized the EPA to establishemission standards for categories of sources.Such categories include major sources andnonmajor sources. There are significantlydifferent requirements for sources that qual-ify as a "major source" compared with thosethat do not. A "major source" is any station-ary source that emits in excess of ten tons peryear of any listed hazardous substance, or 25tons per year of any combination of thosesubstances. The emission standard that anindustrial facility is held to is dictated, inpart, by whether it is categorized as a majorsource or a nonmajor source. This facet ofthe Clean Air Act is discussed in greaterdetail in Chapter 3.
The 1990 amendments to the Clean AirAct made some of the most notable changeswith regard to industrial sources. Theamendments established a new operatingpermitting system that had the effect of per-manently changing the way environmentalmanagers in industry must do their job.Monitoring and reporting requirements weregreatly expanded compared with previousrequirements. Furthermore, the require-ment was established to identify all "regu-lated pollutants" emitted by a facility, tomonitor emissions (continually or periodi-cally), to operate the equipment in compli-ance with standards written into the permit,and to certify compliance with all standardsin the permit on an annual basis .
In addition to the new permitting, moni-toring, and reporting requirements, thenumber of designated hazardous air pollut-ants (air toxics) was increased to 189 andthen subsequently (in 1999) reduced by oneto 188.
The list of 188 "air toxics" includes pesti-cides, metals, organic chemicals, coke ovenemissions, fine mineral fibers, and radionu-clides.
With a clear understanding of the lawsgoverning a facility, and the air emissionsstandards it is required to meet, a facility canbegin the process of controlling air emis-sions.
Air Pollution Control
After all potential sources of air pollutantshave been identified, the process of develop-ing an air pollution control plan can begin.Control of the discharges of air pollutantsfrom industries can be organized into threecategories:
1. Waste minimization and reduction atthe source
2. Containment3. Removal by use of one or more treat-
ment technologies
In the sections that follow, each of thesecategories will be discussed in greater detail.
Waste Minimization and Reduction atthe SourceAs explained in Chapter 4, waste minimiza-tion is an important aspect to any pollutionprevention program, and as a means of con-trolling pollution, is it the preferred method.Reduction at the source can be accomplishedusing the following strategies.
• Identification of each and every sourcewithin the entire industrial facility. Thismust include the full range of air pollut-ant generation activities, from the boil-ers used for hot water and space heating,to each separate manufacturing processstep, to dust blowing around the parkinglot.
• Analysis of each source to determinewhether it can be eliminated.
• If elimination is not an option, substi-tute nonobjectionable process materialsfor those that are hazardous or otherwiseobjectionable.
• Determination of whether or not achange in present operations can reducepollutant generation. For example,maintaining vigorous maintenance andpreventive maintenance programs toensure that all process equipment is gen-erating a minimum of pollutants, all

containment facilities are performing asdesigned so as to minimize fugitiveemissions, and all treatment equipmentis operating at top efficiency in terms ofpollutant removal.
• Maintenance of accident and spill pre-vention procedures and facilities toensure that they are up-to-date, well-known to those who should know them,and reviewed and revised at regularintervals.
• Maintenance of emergency responseprocedures and facilities to ensure thatthey are up-to-date and well known.
• Maintenance of a rigorous program ofanalyzing past spills and emergencieswith the objective of determining (1)how to prevent each and every spill eventfrom ever happening again, and (2) howto improve responses to emergencyevents over past responses.
A formal Air Pollution Management Plan(APMP) is a necessity. The APMP must be aliving, active document, used often, andreviewed and revised frequently. The APMPis truly the key to minimizing the cost for airpollution control.
ContainmentAfter prevention at the source, containmentis the most cost-effective method of air pol-lution control. Containment refers to theabsence of leaks, or of any type of breach instructural integrity in buildings, ductwork,storage tanks, or any location from which airpollutants could enter the environment with-out such entrance resulting from the expressintention of the environmental managers.Such unwanted discharges are called "fugi-tive emissions" and are the primary target ofa pollutant containment program.
One of the most effective methods ofcontainment to prevent release of fugitiveemissions is to maintain a "negative pres-sure" inside buildings—that is, to maintaina lower pressure inside the building than theatmospheric pressure outside the building.
This can be accomplished by use of one ormore wet scrubbers installed in such a waythat air from any location within the plantmust go through one of the scrubbersbefore reaching the outside. Induced airfans continually evacuate air from thebuilding and force this air to pass throughthe scrubbers. If the fans and scrubber sys-tems are sized properly, occasional openingof doors can take place without significantrelease of air pollutants.
Hoods and Isolation ChambersAppropriate and effective use of hoods isimportant to the objective of containing airpollution. Containing pollutants with hoodsand isolation chambers can prevent air pol-lutants from contaminating large volumes ofair. Furthermore, it is always less expensive totreat a smaller volume of more highly con-centrated pollutant than to remove the samemass of pollutant from a larger volume of airor other gas.
Fans and DuctworkProperly designed, operated, and maintainedfans and ductwork are key to successful con-tainment of air pollutants. Fans with inade-quate capacity allow air pollutants to driftout of the containment system at the source.Fans with unnecessarily abundant capacitywill dilute the target pollutants excessively,leading to increased cost of treatment.
StabilizationAfter a prudent waste minimization programhas been carried out, a stabilization periodshould occur before sizing the equipment. Ifair pollutant flow rates and concentrationsare calculated based on improved mainte-nance and operational procedures, and theseprocedures are not maintained, the handlingand treatment equipment designed on thebasis of the improved procedures will beoverloaded and will fail.
Once the sources of air discharges havebecome stabilized, each of the sources shouldbe subjected to a characterization program to
determine flow rates and target pollutantconcentrations (flows and loads) for the pur-pose of developing design criteria for han-dling and treatment facilities. Examples ofhandling facilities are hoods, fans, and duct-work. Examples of treatment equipment areelectrostatic precipitators and fabric filters(bag houses, for instance). The characteriza-tion study consists of developing estimates ofemission rates based on either the historicalrecords of the facility under consideration orthose of a similar facility. For instance, mate-rials balances showing amounts of raw mate-rials purchased and products sold can beused to estimate loss rates.
In Chapter 5, the waste characterizationprocedure is discussed in detail. A summaryof the process is provided in the sections thatfollow.
Characterization of Discharges tothe AirThere are three categories of air pollutantcharacterization work: (1) stack dischargecharacterization, (2) fugitive emissions char-acterization, and (3) ambient air-qualitycharacterization. An effective air dischargecharacterization includes each of these cate-gories. The three involve quite different sam-pling procedures but similar (in most cases,identical) analysis methods. Stack dischargeand fugitive emission characterization workare done primarily to determine the state ofcompliance with one or more discharge per-mits. Ambient air-quality characterization isdone primarily to determine the quality ofair in a given area and establish a baseline forcomparison of air discharge quality.
Stack SamplingThe most common reason for conducting astack sampling program is to determine thestate of compliance with regulatory require-ments. As such, the substances sampled areusually dictated by the list of substancesincluded in the air discharge permits issuedto the facility.
The purpose of stack sampling is to deter-mine, with as much accuracy as is practica-ble, the quantity (magnitude) of the total gassource and the quality (types and amounts ofair contaminants) of the total source gas dis-charge. The equipment included in a typicalstack sampling station includes devices tomeasure characteristics from which gas flowrate can be calculated, devices to measurecertain characteristics directly, and equip-ment to collect and store samples for subse-quent analyses in the laboratory.
In general, the equipment used to obtaindata from which to calculate gas flow rateincludes pitot tubes to measure gas velocity;a device to measure the static pressure of thestack gas; and devices to measure barometricpressure, moisture content, and temperature.Equipment used to characterize stack dis-charges in terms of specific substances is clas-sified in two broad categories: particulateand gaseous. The objective of equipment inboth categories is to quantitatively removeair contaminants in the same condition asthey occur when they are discharged to theair. Many individual devices as well as inte-grated systems are commercially available toaccomplish this objective.
Sample CollectionAmbient air or gas streams (including stackemissions and fugitive emissions) are sam-pled to determine the presence of, and con-centrations of, gaseous pollutants by use ofthe following equipment and mechanisms:
• Vacuum pumps, hand operated or auto-matic
• Vacuum release of an evacuated collec-tion container
• Tedlar bags• Adsorption on a solid• Condensation (freeze-out) in a trap
Equipment used to collect particulatematter and to determine the concentration,in ambient air as well as stack emission andother gas streams, uses one or more of thefollowing mechanisms:

• Filtration• Electrostatic impingement• Centrifugal force• Dry impingement• Wet impingement• Impaction
Each of the mechanisms for particulateand gaseous pollutant sampling is describedfurther in Chapter 5.
Sample AnalysisOnce a sample is collected, it is subject tochange as a result of chemical reaction,chemical degradation, absorption or adsorp-tion onto the walls of the container or toother substances in the container, or otherphenomena. There is uncertainty about howmuch change will take place in a sample onceit is collected. For this reason, it is extremelyimportant to perform the chemical or otheranalyses as soon as possible after the samplesare collected.
Ambient Air SamplingThe objective of ambient air sampling isdetermining the quality of ambient air as itrelates to the presence and concentration ofsubstances regarded as pollutants. The spe-cialized devices and techniques for carryingout this task have been developed over half acentury. Obtaining representative samples isa major objective of the work plan. Decisionsto be made must strike a balance between thecost of the characterization program and thevalue of the data and include the duration ofthe sampling period, number of discretesamples taken, the size of each sample, andthe number of substances sampled.
Particulate matter in ambient air is mea-sured by use of a "high-volume sampler,"which is an integrated filter holder-vacuumpump. A glass fiber filter is held in the filterholder, and a high flow rate of ambient air isdrawn through it over a measured period oftime. Calculations of particulate matter con-centration in the ambient air are carried outusing the weight of particulate matter col-
lected on the filter and the flow rate (or totalvolume) of air drawn through the filter.
TreatmentTreatment of air discharges and, therefore,removal of pollutants from gas streams priorto discharge to the air are the major subjectsof this chapter. Often the most expensive, butalso the most important in terms of compli-ance with the law, treatment is considered alast resort after minimization and contain-ment.
Treatment Systems for Control ofParticulatesIn general, there are five methods used forcontrolling particulate emissions:
1. Gravity separators2. Inertial separators3. Electrostatic precipitators4. Fabric filters5. Wet scrubbers
Gravity and inertial separators, includingso-called "cyclones," are dry, "no-moving-parts" devices. They take advantage of therelatively high specific gravity of certaintypes of particulate matter, including fly ash,dust, cement particles, and organic solids.Electrostatic precipitators take advantage ofthe electrostatic charge on the surface of par-ticles, either present from natural phenom-ena or induced. Fabric filters make use ofphysical blocking and adsorption, and wetscrubbers make use of a liquid to entrap par-ticulates, thus removing them from a gasstream.
Gravity SeparatorsGravity separators are devices that providequiescent conditions, thus counteracting thetendency of a particulate-laden gas stream tosweep the particulates along with it as a resultof aerodynamic drag. Most gravity separatorsare simple, open chambers, sometimes with amechanism at the bottom to remove col-lected material. As is the case with other,

AIRIN
AIR OUT
Particulates collecton plates
Figure 8-1 An example of a gravity settling device for removal of particulates as an element in an air pollution control sys-tem.
rather passive particulate removal devices,gravity separators are normally used as pre-treatment devices, upstream of more sophis-ticated equipment. The greatest value ofgravity separators is to prolong the life of themore sophisticated equipment. Figure 8-1shows an example of a gravity settling devicefor removal of particulates as an element inan air pollution control system.
lnertial SeparatorsInertial separators make use of the differen-tial specific gravity between particulates and
the gas that contains them. Inertial separa-tors cause the stream of flowing gas tochange directions. The inertia of the particu-lates, being directly proportional to theweight of each particle, causes them to resistthe change in direction; thus, they are pro-pelled out of the stream. Cyclones of variousdesigns are the most common examples ofinertial separators. Some dry venturi devicesmake use of the inertia of particulates mov-ing along in a gas stream to effect removal.Figure 8-2 illustrates typical inertial separa-tors.
Cleangas
Dirtygas
Dust
Figure 8-2 Cyclone separator: example of a typical inertial separator (from Buonicore and Davis, © 1992; reprinted by per-mission of John Wiley & Sons, Inc.).

Electrostatic PrecipitatorsElectrostatic precipitators (ESPs) are moreactive (as opposed to passive) than gravityseparators but still have no moving parts.There is, however, a constant input of energy.Electrostatic precipitators consist of a seriesof elements having an electrostatic polaritythat attracts particulates because of an elec-trostatic charge of opposite polarity on thesurfaces of the particulates. Figure 8-3(a)through (c) shows, schematically, the princi-ple of operation of electrostatic precipitators.
Even though there is a naturally occurringsurface charge on essentially all particles innature, the corona that is generated in thechambers of ESPs induces an even greatersurface charge.
There are five types of electrostatic precip-itators in general use:
• The plate-wire precipitator• The flat-plate precipitator• The two-stage precipitator• The tubular precipitator• The wet precipitator
The wet precipitator is a variation of anyof the other four types.
The Plate-Wire PrecipitatorThe plate-wire precipitator is shown sche-matically in Figure 8-3(b). This device con-sists of parallel metal plates and wire elec-trodes of high voltage. Voltages rangebetween 20,000 and 100,000 volts, asrequired. As the particulate-laden gas flowsbetween the parallel plates, the particulatesare attracted to, and adhere to, the plates.The plates must be cleaned periodically, usu-ally by "rapping" and in some cases by waterspray, and the wires must be cleaned of col-lected dust, as well. The plate-wire precipita-tor is the most commonly used ESP byindustry.
The Flat-Plate PrecipitatorThe flat-plate precipitator is shown schemat-ically in Figure 8-3(c). The flat-plate ESPconsists of a series of parallel flat plates inwhich some of the plates serve as the high-voltage electrodes. Corona, needed to
H.V. BUS DUCT
HIGH - VOLTAGE SUPPORT INSULATOR
ROOF DOORTRANSFORMER / RECTIFIER
WEATHER ENCLOSURE
GAS PASSAGE
(SIDE LOCATION AVAILABLE)
SIDEWALL
SIDEWALL DOOR
COLLECTING SURFACE
COLLECTING SURFACE RAPPER
DISCHARGE ELECTRODE
HIGH - VOLTAGE SUPPORT FRAME
SLIDE BEARING
GAS DISTRIBUTION DEVICE
INLET NOZZLE
Figure 8-3 (a) Electrostatic precipitator components (from Buonicore and Davis, © 1992 by Van Nostrand Reinhold. Cour-tesy of the Institute of Clean Air Companies and reprinted by permission of John Wiley & Sons, Inc.).
(a)

COLLECTOR PLATE
DISCHARGEWIRE(b)
COLLECTOR PLATE
DISCHARGE PLATE
( c )
increase the surface charge on the particles tobe removed, is generated in chambers pre-ceding the ESP itself. As with wire-plateESPs, the plates have to be cleaned periodi-cally.
The Two-Stage PrecipitatorIn the two-stage precipitator, the high-volt-age electrodes precede the collector elec-trodes, as opposed to their being arranged inparallel, as is the case with the wire-plate ESPand the flat-plate ESP. The plates are nor-mally cleaned by spraying with water. Insome instances, detergents are added to thewater.
The Tubular PrecipitatorThe tubular precipitator is named for itsshape and has its high-voltage wire coincid-
ing with the axis of the tube. Tubular ESPscan fit into the stack because their shape issimilar to that of the stack. Tubular ESPs arecleaned with a water spray
The Wet PrecipitatorIf an ESP, wire-plate, flat-plate, two-stage, ortubular precipitator, is operated with wetwalls, it is properly referred to as a wet pre-cipitator. Wet walls are used where theincrease in particulate removal efficiencywarrants the added cost for capital, opera-tion, and maintenance.
Fabric FiltersFabric filters make use of the "physical bar-rier" mechanism and are aided by a degree ofadsorption. Fabric woven from a wide variety
Figure 8-3 (b) Plate-wire precipitator components; (c) flat-plate precipitator components (from Buonicore and Davis, ©1992 by Van Nostrand Reinhold; courtesy of the Institute of Clean Air Companies and reprinted by permission of John Wiley& Sons, Inc.).

PARTICLES COLLECTING
DIRTYAIR
FABRICFILTER
Figure 8-4 The process of "developing the filter."
CLEANAIRSIDE
SHAKERMECHANISM
OUTLETPIPE
INLETPIPE
BAFFLEPLATE
DUSTY AIRSIDE
FILTERBAGS
CELLPLATE
HOPPER
Figure 8-5 Bag house air filter installation (from Cooper and Alley, Air Pollution Control: A Design Approach, 2nd ed., 1986;reprinted by permission of Waveland Press, Inc., Prospect Heights, IL).
of materials collects particulates from a gasthat is forced through it. As a coating of fil-tered-out particles builds up on the surfaceof the filter fabric, this layer becomes anadditional filter, usually more effective thanthe fabric alone. This process is referred to asdeveloping the filter (as shown in Figure8-4). Eventually, the layer becomes so thickthat the filter as a whole is too restrictive topass the desired flow rate of gas undergoingtreatment. At this point the filter must betaken off line and either cleaned or disposedof and replaced.
Fabric filters can be obtained in many dif-ferent configurations. Figure 8-5 shows a"bag house," which is a type of fabric filterthat is used for a large number of industrialapplications.

Wet ScrubbersWet scrubbers, used for removal of gases andother chemicals, as well as particulates, arethe most common type of air pollution con-trol in use by industries. They are also themost extensive, in terms of complexity ofequipment, moving parts, requirement forcontrols, and operation and maintenancerequirements. Wet scrubbers can be designedfor a single target pollutant—for instance,particulates—but while in operation theywill remove, to some degree, any other pol-lutant that will react with, or dissolve in, thescrubber fluid. As well, wet scrubbers can be
designed for multipurpose removal. Forinstance, a scrubber can be designed toremove both particulate matter and sulfuricacid fumes by using a caustic solution as thescrubbing fluid in a system also configured toremove particulates.
Wet scrubbers that are intended for differ-ent target pollutants have several design andconstruction features in common. Figure 8-6presents a schematic drawing of a basic wet"scrubbing tower," which has physical fea-tures that are common to wet scrubbers usedfor many different target pollutants.
CLEANAIROUTEXHAUST BLOWER
Final DropletMist Eliminator
SPRAY NOZZLEASSEMBLY
PACKED BED
FLOWCONTROL
UNIT
WATER
CHEMICAL
RECYCLEANDSEPARATION TANK
DRAIN
Figure 8-6 Schematic of a basic wet scrubber.

As diagrammed in Figure 8-6, the compo-nents of a basic scrubber include a vessel,some type of packing (of which there aremany different types), a fan or blower, a res-ervoir for the scrubber fluid, and a pump forthe fluid. There are many options for addi-tional features, and many optional configu-rations for the system as a whole.
Venturi ScrubbersVenturi scrubbers are intended only forremoval of particulates. Figure 8-7 shows adiagram of a venturi scrubber, which consistsof a restriction in the air transport duct workand spray nozzles located either in therestricted zone, referred to as the "throat" ofthe venturi, or just upstream of the throat.The throat is preceded by a "converging sec-tion" and is followed by a "diverging section."These two sections together make up theventuri.
The mechanism for removing particu-lates from the air stream with a venturiscrubber is as follows: as the stream of gasapproaches the throat of the venturi, itsvelocity increases dramatically. The kineticenergy imparted by the high velocity has theeffect of shearing the fluid sprayed into thegas stream into tiny droplets. Particulatesand other substances in the gas streambecome adsorbed onto the extremely largesurface area of the fluid droplets. Then, as thegas stream slows down to its original velocityin the diverging section and beyond, thedroplets coalesce, become too heavy to bepropelled along with the gas stream, andconsequently settle out of the stream underthe influence of gravity.
Venturi scrubbers have the advantage ofbeing relatively inexpensive in terms of bothinitial cost and costs for operation and havefew, if any, moving parts other than theblower. On the other hand, venturi scrubbersare relatively low-efficiency treatmentdevices. They are most often used as pretreat-ment devices, upstream from devices withhigher removal efficiency, such as packed wetscrubbers.
Tray ScrubbersTray scrubbers, shown in Figure 8-8, aresomewhat more extensive than venturiscrubbers. Tray scrubbers may be used forpretreatment or as the only treatment forcertain air streams. Figure 8-8 shows a sche-matic drawing of a tray scrubber.
As shown in Figure 8-8, the basic compo-nents of a tray scrubber include a set of ori-fices, or nozzles, and a set of trays, which maybe perforated, in addition to the basic com-ponents. The mechanism by which trayscrubbers remove particulates from gasstreams is as follows: The orifices or nozzlesdirect the gas stream onto the trays, whichare covered with the scrubber fluid. As thestream of gas proceeds through the orifices,the velocity of the gas increases rather sud-denly. The particulates are carried by inertiainto the scrubber fluid and are thus removedfrom the air stream. The high velocity of thegas as it strikes the fluid-covered plates servesa second purpose, which is to cause the fluidto become frothy, greatly increasing the fluidsurface area and thus particle-capture effi-ciency.
Treatment Objectives
Treatment objectives are needed to completethe development of design criteria for han-dling and treatment equipment. The air dis-charge permit, either in hand or anticipated,is one of the principal factors used in thisdevelopment. Another principal factor is thestrategy to be used regarding allowances, i.e.,whether or not to buy allowances fromanother source or to reduce emissions belowpermit limits and attempt to recover costs byselling allowances. This strategy and its legalbasis are discussed in Chapter 3. Only afterall treatment objectives have been developedcan candidate treatment technologies bedetermined. However, it may be beneficial toemploy an iterative process whereby morethan one set of treatment objectives and theirappropriate candidate technologies are com-

Figure 8-7 Diagram of a venturi scrubber.
pared as competing alternatives in a financialanalysis to determine the most cost-effectivesystem.
Treatment Systems for Control ofGaseous PollutantsThere are five methods in general use forremoving gaseous pollutants from gasstreams.
1. Adsorption2. Absorption3. Condensation4. Incineration5. Biofiltration
Activated carbon is the technology mostused for treating gas streams by the mecha-nism of adsorption. Those that employ themechanism of absorption, condensation, or
SOLIDS OUT
EXHAUSTAIR
SPRAYWATER
PLANT
PARTICULATELADENAIR

Figure 8-8 Schematic drawing of tray scrubber (courtesyof Sly Manufacturing Co.).
both often use wet scrubbers as the basicequipment. Incineration is normally accom-plished in a chamber of more sophisticateddesign than either carbon columns or scrub-bers and normally requires a high degree ofsafety assurance technology.
AdsorptionRemoval of air pollutants by adsorption ontogranules of activated carbon is an extremelyeffective technology for volatile organic com-pounds (VOCs) and other organic pollut-ants. It is not effective for removing mostinorganic substances. Activated carbon is anonreactive material having an extremelyhigh surface-to-volume ratio. Activated car-bon is normally manufactured in a two-stepprocess: The first is to char the raw material(bituminous coal and coconut shells are
examples) to eliminate hydrocarbons; thesecond is to heat the charred material to7500C to 9500C in the presence of steam andthe absence of oxygen. The result is a veryhighly porous residual. Many activated car-bon products have surface areas of 1,000 to1,500 m2/gram. The highly developed systemof pores accounts for the extremely large sur-face area. The large surface area accounts forthe highly effective adsorptive characteristicof activated carbon.
The mechanism by which adsorptionworks as a treatment process is explained indetail in Chapter 2. In being removed from agas stream by adsorption, the pollutantmoves from a gas phase to a solid phase andmust now be managed as a solid waste. Anadvantage of activated carbon is that thespent carbon can be reheated so that theadsorbed pollutants are incinerated (con-verted to carbon dioxide, water [vapor] andash), and the activated carbon is regeneratedfor reuse. With each regeneration cycle, how-ever, a certain amount of adsorptive capacityis lost. There is always the requirement formakeup with some portion of new activatedcarbon.
Activated carbon treatment systems fortreating gas streams are usually configured asillustrated in Figure 8-9. Cylindrical contain-ers referred to as "carbon columns" are filled("packed") with beds of activated carbongranules, through which the gas stream to betreated is forced to flow by use of a blower.Very often, several containers are connectedin series. The multiple container arrange-ment allows for a factor of safety, as well asprovides a means to remove one or more col-umns for maintenance or bed replacementwithout stopping the flow of gas for longerthan the time required to shunt out the col-umn to be removed.
As the contaminated gas stream travelsthrough the bed, adsorption of the pollutantstakes place. The purified effluent gas exits thelast column in the series. The portion of thebed that is closest to the inlet receives a con-tinuous dose of concentrated pollutants and

is thus driven to the point of saturation bythe highest possible driving force (the con-centration gradient). Portions of the bed thatare downstream of the inlet receive progres-sively less concentrated amounts of the pol-lutants. As the portions of the bed closest tothe inlet become progressively saturated, a"front of saturation" moves steadily towardthe outlet end. In this manner, a "concentra-tion profile" develops and progressivelymoves toward the outlet end of the system, asillustrated in Figure 8-10.
Eventually, dilute concentrations of pol-lutants appear in the effluent. When theseconcentrations increase to the point of non-acceptability, "break-through" is said to haveoccurred, and it is necessary to remove thecolumns from service.
One strategy for operation of a gas streamtreatment system as described above is toremove the most upstream column from theseries system at the occurrence of break-through, and, at the same time, to install afresh column as the most downstream col-
umn. The carbon from the spent column canthen be regenerated or disposed of andreplaced with virgin activated carbon.
Adsorbents Other Than ActivatedCarbonCertainly, activated carbon is the most com-monly used adsorbent for treatment of gasstreams for removal of gaseous pollutants.Other adsorbents that have been successfullyused include a variety of resins, activated alu-mina, silica gel, and so-called molecularsieves. One of the primary characteristics of agood adsorbent, of course, is a high surfacearea per unit weight. While no commerciallyavailable products compare to activated car-bon in this respect, other characteristics incombination with reasonably high surfacearea per unit weight make some adsorbentsuseful for certain applications.
ResinsResins are produced by inducing controlledcross-linking between certain organic sub-
Figure 8-9 Activated carbon adsorption system for removal of gaseous pollutants and other chemicals from gas streams(from Bounicor and Davis © 1992; reprinted by permission of John Wiley & Sons, Inc.).
(a) (b)
Solventto
storage
Decanter
Cleanairout
Solventvaporstrapped
incarbon
bedWaste-water Steam
CondenserVapor-ladenair in

Figure 8-10 Concentration profile along adsorption column.
FIXED BED
OUT
FRESHZONE
BED DEPTH
MASSTRANSFERZONE
ADSORPTIONZONE
SATURATEDZONE
CO
NC
EN
TR
AT
ION
stances. Resins with a surface area of 100 toabout 700 m2 per gram can be produced soas to exhibit a high selectivity for certain sub-stances. For instance, phenolic resins havebeen successfully used to remove odoroussubstances from air streams.
Resins can be produced in granular formsuch that they resemble activated carbon inphysical size and shape. Resins can thereforebe used in a packed bed configuration, usingthe same vessels and equipment as are usedfor activated carbon.
Activated AluminaActivated alumina is produced by a special-ized heat treatment of aluminum trihydrate,a primary ingredient of bauxite as it ismined. It can be obtained in granular formsimilar in size and shape to activated carbon
granules. Therefore, it can be directly substi-tuted for activated carbon so as to use thesame physical setup and equipment.Although activated alumina is most oftenused to remove moisture from air, it has beenused, and has potential use, for removal ofcertain air pollutants from gas streams thatare either being discharged to the air or arebeing recycled. A potential use is in serieswith another adsorbent. Surface areas of acti-vated alumina products are in the range of300 m per gram.
Silica GelSilica gel has been used to remove sulfur com-pounds from a gas stream and to removewater from gas. It is produced by neutralizing,washing, drying, and roasting sodium silicate.It can be obtained in granular form, and, as is

the case with resins and activated alumina, itcan be used in the same physical setup asactivated carbon. Silica gel products have sur-face areas of about 700 to 800 m per gram.
Molecular SievesMolecular sieves have been effectively usedfor removing odorous chemical substances,such as hydrogen sulfide, and methyl andethyl mercaptans from gas streams. They arecrystalline substances manufactured fromaluminosilicate and can be obtained in gran-ular form and used as a substitute for acti-vated carbon, using the same equipment inthe same configuration. Molecular sieveshave surface areas comparable to activatedcarbon. Typically, the surface area of molecu-lar sieve products averages about 1,200 mper gram.
AbsorptionThe chemical mechanism of absorption isthat of dissolution. In a gas stream treatmentsystem that employs absorption as the treat-ment technology, the stream of gas to be dis-charged to the air or recycled for reuse isbrought into intimate contact with a liquid.Substances dissolve into the liquid and arethus removed from the gas stream. In somecases the removed substance changes in char-acter; in other cases it does not. Either way,the removed substances have been convertedfrom an air pollutant to a potential waterpollutant and must be dealt with further.Absorption systems, then, are not completeas treatment systems in themselves but arecomponents of treatment systems.
The primary purpose of absorptionequipment is first to contain the pollutantsand then to maximize the opportunity forpollutants to move from the gas phase to theliquid phase. This purpose is accomplishedby maximizing the surface area of the liquidabsorbent and causing the gas stream tomove past as much of the liquid surface aspossible. Time of contact, of course, is amajor parameter.
Where the target pollutants are highly sol-uble in water, the liquid absorbent can be
water. However, it is the usual case that achemical substance present in the liquidabsorbent readily reacts with the target pol-lutant to form a product that is either highlysoluble in the liquid absorbent or forms aprecipitate. For instance, sulfur dioxide, a gasat ambient temperatures, can be removedfrom a stream of air by contacting it with asolution of sodium hydroxide. Solublesodium sulfate will quickly form and remainin the liquid. As another example, a stream ofair containing silver sulfate in aerosol formcan be contacted with an aqueous solution ofsodium chloride. Insoluble silver chloridewill form and remain suspended in the liquiduntil it is removed by an additional treat-ment step.
The "packed tower," an air pollution treat-ment system that resembles the wet scrubbersystem used for removal of particulates anddiscussed earlier, is the most common tech-nology used for removal of gaseous (andaerosol) pollutants. The basic components ofpacked tower technology are illustrated inFigure 8-11.
The packed tower system, also called a"packed column," consists of the followingelements:
• A vessel (tower), usually cylindrical, usu-ally constructed of steel and coated asneeded to prevent corrosion or otherform of destruction
• Packing to promote intimate contactbetween molecules of target pollutantsand the liquid absorbent
• A spray distribution system to apply theliquid absorbent evenly over the entiretop surface of the packing
• A reservoir, usually at the bottom to thetower, to serve as a wet well for the pump
• A pump to transfer liquid absorbentfrom the reservoir to the spray system
• A blower to force the gas stream from itssource to the packed tower and upthrough the packing
• A support floor, highly perforated, toperform several functions: holding thepacking above the reservoir so as to pro-

vide a space for incoming gas (influent)to distribute itself evenly across thecross-section of the tower; serving as aninlet device to promote even applicationof the influent gas to the bottom of thecolumn of packing; and allowing the liq-uid absorbent to readily drain away fromthe packing
Additional elements that are oftenincluded as components of a packed towerabsorption system are the following:
• A packing restrainer to prevent the indi-vidual units of packing material frombeing carried up by the gas as it passesthrough the packing
• A demister to prevent droplets of liquidfrom exiting the tower with the exitingtreated gas stream
• An overflow device to maintain theproper depth of liquid absorbent in thereservoir
• A liquid redistributor located within thedepth of the packing to collect liquidabsorbent after it has flowed through aportion of the packing and redistribute itover the top surface of the next portionof packing
A description of the operation of thepacked tower is as follows. The liquid absor-bent is pumped continuously from the reser-voir to the spray distribution system. After
Figure 8-11 Schematic drawing of a packed tower absorber (from Alley © 1998; reprinted by permission of McGraw-Hill, Inc.).
ENTRAINMENT SEPARATOR(DEMISTER)
LIQUID DISTRIBUTOR
PACKING RESTRAINER
SHELL
RANDOM PACKING
ACCESS MANWAY FORPACKING REMOVAL
LIQUIDREDISTRIBUTOR
ACCESS MANWAY FORPACKING REMOVAL
PACKING SUPPORT
GAS INLET
OVERFLOW
LIQUID OUTLET
GAS OUTLET
LIQUIDINLET

being applied evenly over the top surface ofthe packing material, the liquid absorbentflows slowly down over the surfaces of thepacking. As the gas stream, which hasentered the tower in the space between thereservoir and the bottom of the packing,flows up through the packing, substancesthat can dissolve in the liquid do so. Thesesubstances have thus been removed from thegas stream, which continues its upward flowand exits the tower at the top. Excess mois-ture in the form of aerosol-size droplets orlarger are trapped by the demister as the gasstream passes through.
Design parameters for a packed tower sys-tem include the quantity of packing materialand the flow rate capacity of the blower.These parameters, in addition to the flowrate capacity of the liquid absorbent pump,determine the time of contact between thegas stream and the absorbent. The physicalcharacteristics of the packing material have agreat effect on the mass transfer efficiency,since the thinner the film of liquid absorbentas it flows down over the packing, and themore turbulent the flow of this thin film, thegreater the opportunity for each molecule oftarget pollutant to contact nonsaturatedabsorbent in which it can dissolve or other-wise interact. In the same manner, the physi-cal characteristics of the packing materialinfluence the characteristics of flow of the gasstream up through it. The more torturousthe flow paths and turbulent the flow of thegas, the greater will be the opportunity forindividual molecules of target pollutant toactually physically contact the liquid absor-bent. The greater contact will lead to higherremoval efficiency, all other influences beingequal.
CondensationGases can be changed to liquids by decreas-ing temperature or increasing pressure orboth. Thus, the mechanism by which con-densation technology accomplishes air pol-lutant removal is based on the generalizedgas law, stated as:
where
V = Volume of a given weight of gas orvolume/unit wt (m3/g)
n = Number of moles of gas in the vol-ume V
R = Universal gas constantP = Pressure exerted on the volume of
gasT = Absolute temperature of the gas in
volume V
which states that the volume that a givenweight of gas will occupy decreases as tem-perature decreases and pressure increases. Atsome point, the gas will change from the gas-eous state to the liquid state, after which it nolonger obeys the gas laws.
The most commonly used equipment thatemploys condensation technology uses tem-perature decrease as the mechanism. Often,water-cooled condensers are used as pre-treatment devices to remove easily con-densed substances (such as vapors of sulfuricacid) to protect or prolong the operatingcycle times of downstream equipment. Fig-ure 8-12 presents schematic drawings ofthree types of condensers used to removegaseous pollutants from gas streams.
IncinerationThe fundamental mechanism on whichincineration technology for air pollutioncontrol is based is combustion. Combustionof organic pollutants entails conversion tocarbon dioxide, water, and ash. Some inor-ganic materials, such as sulfur and nitrogen,are often oxidized to problematic substancesduring the combustion process. Other inor-ganic materials—for instance, heavy metals,
PV = nRT (8-1)
or
(8-2)

become incorporated in the ash and can inthis way add to ultimate disposal problems.
As an air pollution abatement technology,incineration is used for many purposes,including odor control, reduction of releasesof hydrocarbons to the air (flares at petro-leum refineries, for example), and destruc-tion of volatile organic compounds (VOCs).
In the context of air pollution control,incinerators are of two types: thermal oxidiz-ers and catalytic oxidizers. The differencebetween the two is that thermal oxidizersaccomplish combustion by use of heat alone.Catalytic oxidizers use a catalyst to decreasethe activation energy of the combustionprocess, or to otherwise effect acceleration ofthe combustion process, and are thus able toaccomplish reasonably complete combus-tion at significantly lower temperatures.
Thermal OxidizersThe basic components of a thermal oxidizerfor air pollution control are illustrated in Fig-ure 8-13.
A typical thermal oxidizer consists of acombustion chamber in which the combus-
tion process takes place; a burner for the pur-pose of combusting a support fuel needed toelevate the temperature in the combustionchamber as necessary; an injection device,used to inject what is to be treated into thecombustion chamber; and a flue, used totransport the treated gas stream to the dis-charge location.
Additional components that can be addedto a thermal oxidizer include heat recoveryequipment and a system to "preheat" the gasstream containing pollutants.
Catalytic OxidizersAs explained above, the process of catalyticoxidization is essentially the same as thermaloxidization, except that a catalyst enables thecombustion process to take place at lowertemperatures. The advantages include lessexpensive construction costs for the equip-ment and reduced use of auxiliary fuel.
A schematic drawing of a typical catalyticoxidizer is shown in Figure 8-14. A photo-graph of a catalytic oxidizer in operation ispresented in Figure 8-15.
Figure 8-12 Three types of condensers for air pollution control.
BAROMETRIC SPRAY JET
DISCHARGECOOLANT
DISCHARGEDISCHARGE
(a) (b)
VAPORVAPOR
DRIP PLATESWITHWIER
COOLANT DEMISTERS
COOLANTVENTVENT
VAPOR
(C)
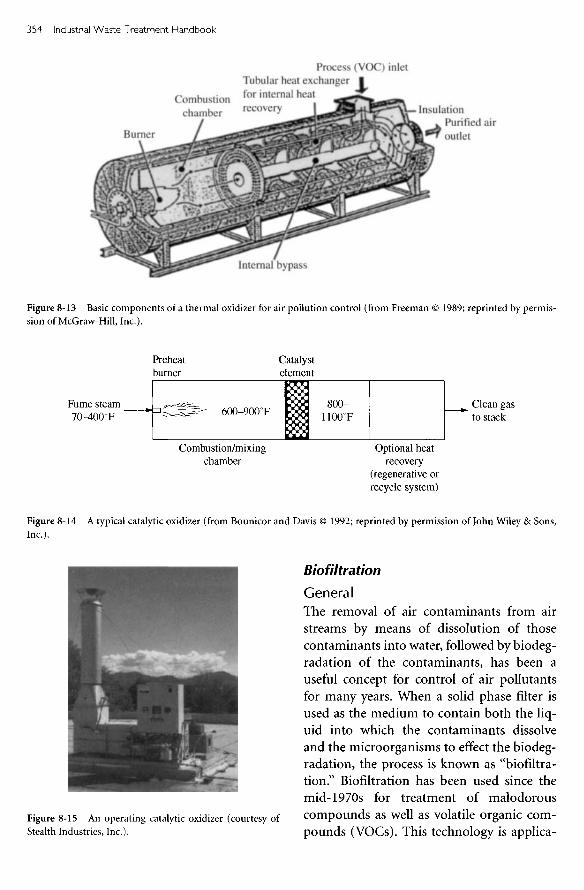
Figure 8-15 An operating catalytic oxidizer (courtesy ofStealth Industries, Inc.).
Biofiltration
G e n e r a l
The removal of air contaminants from airstreams by means of dissolution of thosecontaminants into water, followed by biodeg-radation of the contaminants, has been auseful concept for control of air pollutantsfor many years. When a solid phase filter isused as the medium to contain both the liq-uid into which the contaminants dissolveand the microorganisms to effect the biodeg-radation, the process is known as "biofiltra-tion." Biofiltration has been used since themid-1970s for treatment of malodorouscompounds as well as volatile organic com-pounds (VOCs). This technology is applica-
Figure 8-14 A typical catalytic oxidizer (from Bounicor and Davis © 1992; reprinted by permission of John Wiley 8c Sons,Inc.).
Figure 8-13 Basic components of a thermal oxidizer for air pollution control (from Freeman © 1989; reprinted by permis-sion of McGraw-Hill, Inc.).
Preheatburner
Catalystelement
800-11000F
Clean gasto stack
Optional heatrecovery
(regenerative orrecycle system)
Combustion/mixingchamber
Fume steam70-400°F
Internal bypass
Combustionchamber
Tubular heat exchangerfor internal heatrecovery
Process (VOC) inlet
Burner
InsulationPurified airoutlet

ble to the treatment of contaminated air thatcontains the normal concentration of oxygenand dilute concentrations of biodegradableorganic gases.
The solid phase filter is normally compost,sphagnum peat, or soil. The solid media aresurrounded by a film of aqueous liquor,which is teeming with microorganisms. Asthe stream of contaminated air flows throughthe filter, the contaminants dissolve into theaqueous liquor (driven by entropy). Thesedissolved contaminants are then consumedas food by the microorganisms. Carbondioxide, water, oxidized organic compounds,and more microorganisms are the end prod-ucts. When reduced sulfur compounds, suchas hydrogen sulfide, dimethyldisulfide, andmercaptans, are present as contaminants tobe removed from the stream of contaminatedair, mineral acids are among the end prod-ucts.
Oxygen contained in the stream of con-taminated air is necessary to maintain aero-bic conditions within the biofilter. Also,nitrogen, phosphorus, and other nutrientsare required for maintenance of a robustmicrobial population. Typically, a solution ofwater containing sufficient nutrients issprayed onto the biofilter to supply sufficientmoisture as well as nutrients. In addition, thestream of contaminated air is humidifiedbefore it is applied to the biofilter. The drying
action (by means of evaporation) of thestream of air flowing through the biofiltermust be counterbalanced by the humidifierand the applied liquid spray.
Figure 8-16 presents a schematic of a typi-cal biofilter system, which consists of a bed offilter material, an air distribution system, asystem to supply nutrients, a humidifier, ablower, and ductwork. The filter material canbe composed of compost material, sphag-num peat, or highly porous soil. The filterbed is typically about one meter (three feet orso) in depth.
DesignA primary design parameter of a biofilter sys-tem is residence time, i.e., the stream of con-taminated air must remain within the filterbed for sufficient t ime for the contaminantsto dissolve into the liquid that surrounds thefilter media. A second design parameterrelates to the quantity of liquid to be main-tained within the filter bed. If too much liq-uid is supplied to the bed, the pores, or pas-sageways, for air will be blocked, with theconsequence that anoxic or anaerobic condi-tions will develop. If insufficient liquid ispresent within the filter bed, the target con-taminants will not dissolve out of the air-stream, with the consequence that treatmentwill not take place. Other design parameters
N, P, K, etc
CLEAN GAS
DUCTING
BLOWER HUMIDIFIER DRAINAGE
AIR DISTRIBUTION SYSTEM
FILTER MATERIAL
BIOFILTER
RAW GAS
Figure 8-16 Schematic of a typical biofilter system.

include quantity and type of nutrients to besupplied, temperature control, pH control,and removal of excess liquid.
The residence time for the biofilter is afunction of rate of flow of contaminated airas well as volume of filter media. Since it hasbeen determined through operating experi-ence that a filter bed depth of about onemeter is optimum, the parameter of filtervolume reduces to one of filter area, that is,the horizontal dimensions of the filter bed.Successful biofilter systems have filter areasthat range from 100 to 22,000 ft2 (10 to 2,000m2). Flow rates of contaminated gases haveranged from 600 to 90,000 cfm (1,000 to150,000 m /hr), These parameters are com-patible with air pollutant treatment rates of10 to 100 g/m /hr and surface loads of up to16 scfm/ft2 (300 m3/hr/m2). The optimal val-ues for these parameters for any given appli-cation depend upon the filter media, theconcentration of pollutants, and the natureof the pollutants, as well as the temperature,pH, and alkalinity.
The nature of the filter media has a majorinfluence on the economics of constructionand operation of a biofilter system, in thatthe cost of operation is highly dependent onthe amount of electrical energy used to blowcontaminated air through the filter. Theamount of electrical energy, in turn, is afunction of the backpressure created by thefilter. The backpressure increases with rate offlow, decrease in filter media porosity, andincrease in filter moisture content, and isaffected by temperature. Also, increased bio-logical growth on the filter media has theeffect of increasing the backpressure.
Sphagnum peat has proved to be an excel-lent medium for biofilters. This material,when handled and installed properly, pro-vides for extremely large surface area, enablesa relatively free flow of air, holds moisturewell, and provides an excellent medium forthe growth and maintenance of a robustmicrobial population. In particular, sphag-num peat has been found to harbor micro-bial populations that have a high percentageof fungi species, which are very effective in
breaking down certain air pollutants. Sphag-num peat can be obtained in large quantitiesthrough agricultural supply outlets.
Compost material has also proved to be aneffective medium for biofilters. Use of com-post derived from municipal solid waste,bark, tree trimmings, and leaves has theadditional benefit of avoiding the creation ofmore solid waste.
Eitner and Gethke have developed valuesfor parameters for filter material as follows:
• Pore volume > 80%• pH = between 7 and 8
d60 > 4 mm• Total organic matter content > 55%
Operation and MaintenanceOver time, biofilter beds have undergone set-tling and consolidation to such an extent that"fluffing" is required to avoid excess back-pressure and channeling of air flow. Typi-cally, beds have required reworking at two-year intervals, with complete replacementevery five to six years.
Routine and periodic maintenance of bio-filters includes:
• Daily check of major operating parame-ters:
— Off-gas temperature— Off-gas humidity— Filter temperature— Backpressure
• Periodic check of filter moisture contentand pH
When designed, operated, and main-tained properly, biofilter technology offers aneffective, low-cost solution to control air pol-lution caused by dilute concentrations ofmalodorous reduced sulfur compounds, cer-tain VOCs, and many other biodegradableorganics. Industries that have made success-ful use of biofilters worldwide include:
• Fish rendering• Print shops

• Pet food manufacturing• Flavors and fragrances• Residential wastewater treatment plants• Landfill gas extraction• Tobacco processing• Chemical manufacturing• Chemical storage• Industrial wastewater treatment plants
Bibliography
Alley, R. E., 8c Associates, Inc. Air QualityControl Handbook. New York: McGraw-Hill, 1998.
Avallone, E. A., and T. Baumeister III (eds.).Marks' Standard Handbook for Mechani-cal Engineers. 9th ed. New York: McGraw-Hill, 1987.
Billings, C. E. (ed.) The Fabric Filter Manual.Northbrook, IL: Mcllvaine Co..
Billings C. E., and J. Wilder. Handbookof Fabric Filter Technology, Vol. 1:Fabric Filter Systems Study. Bedford,MA: GCA Corp., PB-200-648; Spring-field, VA: NTIS, December 1970.
Bilotti, J. P. and T. K. Sutherland. In Air Pol-lution Control Equipment: Selection,Design, Operation and Maintenance. L.Theodore and A. J. Buonicore (eds.).Englewood Cliffs, NJ: Prentice Hall, 1982.
Borgwardt, R. H. "Limestone Scrubbing ofS02 at EPA Pilot Plant." Progress Report 12.St. Louis, MO: Monsanto Research Com-pany, 1973.
Buonicore, A. J., and W. T. Davis, Air Pollu-tion Engineering Manual. New York: VanNostrand Reinhold, 1992.
Cheremisinoff, P. N., and R. A. Young (eds.)Pollution Engineering Practice Handbook.Ann Arbor, MI: Ann Arbor Science, 1975.
Cooper, C. D., and F. C. Alley. Air PollutionControl: A Design Approach. 2nd ed. Pros-pect Heights, IL: Waveland Press, Inc.,1986.
Crawford, M. Air Pollution Control Theory.New York: McGraw-Hill, 1976.
Davis, W. T., and R. E Kurzynske. "The Effectof Cyclonic Precleaners on the Pressure
Drop of Fabric Filters." Filtration Separa-tion 16, No. 5.
Davis, W. T., and W. F. Frazier. "A LaboratoryComparison of the Filtration Performanceof Eleven Different Fabric Filter MaterialsFiltering Resuspended Flyash." Proceedingsof the 75th Annual Meeting of the Air Pollu-tion Control Association, 1982.
Dennis, R., and H. A. Klemm. Fabric FilterModel Format Change, Vol. 1: DetailedTechnical Report. EPA-600/7-79-0432.U.S. Environmental Protection Agency,Research.
Dennis, R., R. W. Cass, D. W. Cooper, et al.Filtration Model for Coal Flyash with GlassFabrics. EPA-600-7-77- 084. August 1977.
Donovan, R. P., B. E. Daniel, and J. H.Turner. EPA Fabric Filtration Studies, 3.Performance of Filter-Bags Made fromExpended PTFE Laminate. U.S. Environ-mental Protection Agency. EPA-600/2-76-168c. NTIS PB-263-132. Research Trian-gle Park, NC: December 1976.
Durham, J. F. and R. E. Harrington. "Influ-ence of Relative Humidity on FiltrationResistance and Efficiency of Fabric DustFilters." Filtration Separation 8 (July/August 1971): 389-393.
Eitner, D., and Gethke, H. G. "Design Con-struction and Operation of Bio-filters forOdor Control in Sewage TreatmentPlants." Presented at the 80th AnnualMeeting of the Air Pollution ControlAssociation, New York, 1987.
Ellenbecker, M. J., and D. Leith. "DustRemoval from Non-Woven Fabrics." Pre-sented at the Annual Meeting of the AirPollution Control Association, Montreal,June 22-27, 1980.
Fernandes, I. H. "Incinerator Air PollutionControl." Proceedings of National Incinera-tor Conference. New York: ASME, 1970.
Frazier, W. R, and W. T. Davis. Effects of Fly-ash Size Distribution on the Performance ofa Fiberglass Filter. "Symposium on theTransfer and Utilization of ParticulateControl Technology." Vol. II: Particulate

Control Devices. EPA-600/9-82-0050c. July1982: 171-180.
Frederick, E. R. Electrostatic Effects in FabricFiltration: Vol. 11, Turboelectric Measure-ments and Bag Performance (annotateddata). EPA-600/7-78-142b NTIS PB-287-207. July 1978.
Freeman, H. M. (ed.) Standard Handbook ofHazardous Waste Treatment and Disposal.New York: McGraw-Hill, 1989.
Greiner, G. P., J. C. Mycock, and D. S.Beachler. "The IBFM, a Unique Tool forTroubleshooting and Monitoring Bag-houses." Paper 85-54.2, Annual Meetingof the Air Pollution Control Association.Detroit, MI: June 1985.
Hotchkiss C. B., and L. F. Cox. "Fabric andFinish Selection, Manufacturing Tech-niques and Other Factors Affecting BagLife in the Coal-Fired Boiler Applica-tions." Proceedings: Second EPRI Confer-ence on Fabric Filter Technology for Coal-Fired Power Plants. EPRI CS-3257. PaloAlto, CA: Electric Power Research Insti-tute, November 1983.
Katz, J. The Art of Electrostatic Precipitation.Munhall, PA: Precipitator Technology,Inc., 1979.
Ketchuk, M. M., A. Walsh, O. F. Fortune, etal. "Fundamental Strategies for CleaningReverse-Air Baghouses." Proceedings,Fourth Symposium on the Transfer andUtilization of Particulate Control Technol-ogy, Vol. 1: Fabric Filtration. U.S. Environ-mental Protection Agency. EPA-600/9-84-025a. Research Triangle Park, NC:November 1984.
Larson, R. I. "The Adhesion and Removal ofParticles Attached to Air Filter Surface."AIHA Journal 19 (1958).
Licht, W. Air Pollution Control Engineering.New York: Marcel Dekker, 1980.
Liptak, B. G. (ed.) Environmental Engineers7
Handbook, Vol. II: Air Pollution. Radnor,PA: Chilton Book Company, 1974.
Lund, H. F. (ed.) Industrial Pollution ControlHandbook. New York: McGraw-Hill, 1971.
Magill, P. L., F. R. Holden, and C. Ackley(eds.) Air Pollution Handbook. New York:McGraw-Hill, 1956.
Ottmers, D. M. et al. "Evaluations of Regen-erable Flue Gas Desulfurization Proc-esses." Vol. 11. EPRI RP-535-1. Palo Alto,CA: Electric Power Research Institute,1976.
Perry, R. et al. (eds.) Perry's Chemical Engi-neers' Handbook. New York: McGraw-Hill.
Rafson, H. J. (ed.) Handbook of Odor andVOC Control. New York: McGraw-Hill,1998.
Reisinger A. A., and W. T. Grubb. "FabricEvaluation Program at Coyote Unit #1,Operating Results Update." Proceedings,Second EPRI Conference on Fabric FilterTechnology for Coal-Fired Power Plants.EPRI CS03257. Palo Alto, CA: ElectricPower Research Institute, November 1983.
Robinson, J. W. R. E. Harrington, and P. W.Spaite. "A New Method for Analysis ofMulticompartmented Fabric Filtration."Atmospheric Environment 1, No. 4 (1967)499.
Siebert, P. C. Handbook on Fabric Filtration.Chicago: ITT Research Institute, 1977.
Stern, A. C. (ed.) Air Pollution. 3rd ed. NewYork: Academic Press, 1977.
Strauss, W. Industrial Gas Cleaning. 2nd. ed.New York and Oxford: Pergamon Press,1975.
Theodore, L., and A. Buonicore. IndustrialAir Pollution Control Equipment. Cleve-land, OH: CRC Press, 1976.
U.S. Department of Health, Education andWelfare. Recommended Industrial Ventila-tion Guidelines. Publication No. (NIOSH)76-162. Washington, DC: U.S. Govern-ment Printing Office, 1976.
U.S. Department of the Interior. Bureau ofMines. Methods and Costs for StabilizingFine-Sized Mineral Wastes. RI 7896. Wash-ington, DC: 1974.
U.S. Environmental Protection Agency:National Research Council. Odors fromStationary and Mobile Sources. Contract68-01-4655. Washington, DC: U.S. Gov-ernment Printing Office, 1979.

U.S. Environmental Protection Agency. Eval-uation of the Efficiency of Industrial Flares:Test Results. EPA 600/2784/095. Washing-ton, DC: U.S. Government PrintingOffice, 1984.
U.S. Environmental Protection Agency. FlueGas Desulfurization System Capabilities forCoal-Fired Steam GeneratorsyVol 11. EPA600/7-78/032b. Washington, DC: U.S.Government Printing Office, 1978.
U.S. Environmental Protection Agency. FlueGas Desulfurization: Lime/Limestone Proc-esses. Technology Transfer. EPA 625/8-81/006. Research Triangle Park, NC: 1981.
U.S. Environmental Protection Agency. Fugi-tive Emissions from Integrated Iron andSteel Plants. EPA 600/2-78/050. Washing-ton, DC: U.S. Government PrintingOffice, 1978.
U.S. Environmental Protection Agency. Man-ual of Electrostatic Precipitator Technology.APTD 061 0. Washington, DC: U.S. Gov-ernment Printing Office, 1970.
U.S. Environmental Protection Agency."Menard Cleaning of a Fabric Filter DustCollector." Proceedings, Fourth Symposiumon the Transfer and Utilization ofParticu-late Control Technology, Vol. 1: Fabric Fil-tration. EPA-600/9-84-025a. Research Tri-angle Park, NC: November 1984.
U.S. Environmental Protection Agency. "Stan-dards of Performance for New StationarySources." Code of Federal Regulations. Title40, Part 60. Washington, DC: U.S. Govern-ment Printing Office, 1971-1997.
U.S. Environmental Protection Agency. Adi-pic Acid-Enhanced Lime/Limestone TestResults at the EPA Alkali Scrubbing TestFacility. Technology Transfer. EPA 625/2-82/029. Research Triangle Park, NC: 1982.
U.S. Environmental Protection Agency. AirPollution Engineering Manual. 2nd ed. AP-40. Research Triangle Park, NC: 1973.
U.S. Environmental Protection Agency. AnUpdate of the Wellman-Lord Flue Gas Des-ulfurization Process. EPA 600/2-76/136a.Washington, DC: U.S. Government Print-ing Office, 1976.
U.S. Environmental Protection Agency.Assessment of the Use of Fugitive EmissionControl Devices. EPA 600/7-79/045. Wash-ington, DC: U.S. Government PrintingOffice, 1979.
U.S. Environmental Protection Agency. Capi-tal and Operating Costs of Selected Air Pol-lution Control Systems. EPA 450/5-80/002.Washington, DC: U.S. Government Print-ing Office, 1978.
U.S. Environmental Protection Agency. Com-pilation of Air Pollutant Emission Factors.EPA AP-42. Research Triangle Park, NC:1973.
U.S. Environmental Protection Agency. Con-trol of Volatile Organic Compound Emis-sions from Manufacture of High-DensityPolyethylene, Polypropylene, and Polysty-rene Resins. EPA 450/3-83/008. ResearchTriangle Park, NC.
U.S. Environmental Protection Agency. Con-trol of Volatile Organic Compound Leaksfrom Synthetic Organic Chemical and Poly-mer Manufacturing Equipment. EPA 450/3-83/006. Research Triangle Park, NC: 1983.
U.S. Environmental Protection Agency. Con-trol of Volatile Organic Emissions fromExisting Stationary Sources, Vol. 1: ControlMethods for Surface Coating Operations.EPA 450/2-76/028. Research TrianglePark, NC: 1976.
U.S. Environmental Protection Agency. Con-trol Techniques for Particulate Emissionsfrom Stationary Sources, Vol. 1. EPA 450/3-8 IA/05a. Research Triangle Park, NC:1982.
U.S. Environmental Protection Agency. Eval-uation of Control Technologies for Hazard-ous Air Pollutants—Appendices. EPA 600/7-86/0096. Washington, DC: U.S. Govern-ment Printing Office, 1985.
U.S. Environmental Protection Agency. Eval-uation of the Efficiency of Industrial Flares:Test Results. EPA 600/2-84/095. Washing-ton, DC: U.S. Government PrintingOffice, 1984.
U.S. Environmental Protection Agency. FlueGas Desulfurization and Sulfuric Acid Pro-duction Via Magnesia Scrubbing. Technol-

ogy Transfer. EPA 625/2-75/077. Washing-ton, DC: U.S. Government PrintingOffice, 1975.
U.S. Environmental Protection Agency. FlueGas Desulfurization: Dual Alkali Process.Technology Transfer. EPA 625/8-80/004.Research Triangle Park, NC: 1980.
U.S. Environmental Protection Agency. Fugi-tive and Fine Particle Control Using Elec-trostatically Charged Fog. EPA 600/7-79/078. Washington, DC: U.S. GovernmentPrinting Office, 1979.
U.S. Environmental Protection Agency. Fugi-tive Emissions from Iron Foundries. EPA00/7-79/195. Washington, DC: U.S. Gov-ernment Printing Office, 1979.
U.S. Environmental Protection Agency. Fugi-tive Emissions Sources of Organic Com-pounds. EPA 450/3-82/010. Research Tri-angle Park, NC: 1982.
U.S. Environmental Protection Agency.Guidelines for Development of ControlStrategies in Areas with Fugitive Dust Prob-lems. EPA 45012-77/029. Washington,DC: U.S. Government Printing Office,1977.
U.S. Environmental Protection Agency.Handbook—Control Technologies for Haz-ardous Air Pollutants. EPA 625/6-86/014.Cincinnati, OH: 1986.
U.S. Environmental Protection Agency.Handbook—Permit Writer's Guide to TestBurn Data—Hazardous Waste Incinera-tion. EPA 625/6-86/012. Cincinnati, OH:1986.
U.S. Environmental Protection Agency.Industrial Guide for Air Pollution Control.Technology Transfer. EPA 625/6-78/004.Washington, DC: U.S. Government Print-ing Office, 1978.
U.S. Environmental Protection Agency.Inspection Manual for Evaluation of Elec-trostatic Precipitator Performance. EPA340/1-79/007. Washington, DC: U.S. Gov-ernment Printing Office, 1981.
U.S. Environmental Protection Agency.Investigation of Fugitive Dust—Vol. I:Sources, Emissions and Control. EPA 450/
3-74/036a. Washington, DC: U.S. Govern-ment Printing Office, 1974.
U.S. Environmental Protection Agency.Organic Chemical Manufacturing, Vol. 4:Combustion Control Devices. EPA 450/3-80/026. Washington, DC: U.S. Govern-ment Printing Office, 1980.
U.S. Environmental Protection Agency. Phys-ical Coal Cleaning for Utility Boiler SO,Emission Control. EPA 600/7-78/034.Washington, DC: U.S. Government Print-ing Office, 1978.
U.S. Environmental Protection Agency. Pro-cedures Manual for Fabric Filter Evalua-tion. EPA 600/7-78/113. Washington, DC:U.S. Government Printing Office, 1978.
U.S. Environmental Protection Agency. Reg-ulatory Options for the Control of Odors.EPA 450/5-85/003. Research TrianglePark, NC: 1980.
U.S. Environmental Protection Agency. Stan-dards Support and Environmental ImpactStatement, Vol. I: Proposed Standards ofPerformance for Grain Elevator Industry.EPA 450/2-77/001 a. Washington, DC:U.S. Government Printing Office, 1977.
U.S. Environmental Protection Agency. Tech-nical Guidance for Development of ControlStrategies in Areas with Fugitive Dust Prob-lems. EPA 450/3-77/0 1 0. Washington,DC: U.S. Government Printing Office,1977.
U.S. Environmental Protection Agency. Tech-nical Guide for Review and Evaluation ofCompliance Schedules. EPA 3401 1-73/00Ia. Washington, DC: U.S. GovernmentPrinting Office, 1973.
U.S. Environmental Protection Agency. WetScrubber Handbook. EPA R/72/1 18a.Research Triangle Park, NC: 1972.
U.S. Environmental Protection Agency. WetScrubber Performance Model. EPA 600/2-77/127. Washington, DC: U.S. Govern-ment Printing Office, 1977.
U.S. Environmental Protection Agency. WetScrubber System Study. EPA R2/ 72/118a.Research Triangle Park, NC: 1972.
U.S. Environmental Protection Agency.Emission Standards and EngineeringDivision. Control Techniques for SulfurOxide Emissions from Stationary Sources.2nd ed. EPA 45013-811064. Research Tri-angle Park, NC: 1981.
U.S. Environmental Protection Agency. Officeof Research and Development. ControlTechnologies for Hazardous Air Pollutants.EPA/625/6-91/014. Washington, DC: U.S.Government Printing Office, 1991.
U.S. Environmental Protection Agency. Officeof Air Quality and Standards. EmissionMeasurement Branch. Enhanced Monitor-ing Reference Document, Washington, DC:U.S. Government Printing Office, 1993.
U.S. Environmental Protection Agency. Hand-book of Fabric Filter Technology. APTD-0690. Research Triangle Park, NC: 1970.
U.S. Environmental Protection Agency. Airand Energy Engineering Research Labora-tory. Operation and Maintenance Manualfor Electrostatic Precipitators. EPA 625/1-85/017. Research Triangle Park, NC: 1985.
U.S. Environmental Protection Agency. Airand Energy Engineering Research Labora-tory. Operation and Maintenance Manualfor Fabric Filters. EPA 625/1-86/020.Research Triangle Park, NC: 1986.
U.S. Environmental Protection Agency. Cen-ter for Environmental Research Informa-tion. Organic Air Emissions from WasteManagement Facilities. EPA/625/R-92/003.Cincinnati, OH: 1992.
U.S. Environmental Protection Agency. Cen-ter for Environmental Research Informa-tion. EPA 625/6-86/ 014. Cincinnati, OH:1986.
U.S. Environmental Protection Agency.Energy Engineering Research Laboratory.EPA 625/1-85/019. Research TrianglePark, NC: 1985.
U.S. Environmental Protection Agency.Emission Standards and EngineeringDivision. Control Techniques for NitrogenOxides Emissions from Stationary Sources.Rev. 2nd ed. EPA 450/3-83/002. ResearchTriangle Park, NC: 1983.
U.S. Environmental Protection Agency.Industrial Environmental Research Labo-ratory. Paniculate Control by Fabric Filtra-tion on Coal-Fired Industrial Boilers. EPA625/2-79/02 1. Research Triangle Park,NC: 1979.
U.S. Environmental Protection Agency.Office of Air Quality Planning and Stan-dards. Fugitive VOC Emissions in the Syn-thetic Organic Chemicals ManufacturingIndustry. EPA 625/10-84/004. ResearchTriangle Park, NC: 1984.
U.S. Environmental Protection Agency.Office of Research and Development.Handbook-Control Technologies for Haz-ardous Air Pollutants. EPA 625/6-86/014.Cincinnati, OH: 1986.
U.S. Environmental Protection Agency.Office of Research and Development.Continuous Emission Monitoring Systemsfor Non-criteria Pollutants Handbook. EPA1625/R97/001. Cincinnati, OH: 1997.
Vesilind, P. A., and J. J. Pierce. EnvironmentalEngineering. Ann Arbor, MI: Ann ArborScience: 1982.
Zimon, A. D. Adhesion of Dust and Powder.New York: Plenum Press: 1969, 112.

9 Solid Waste Treatmentand Disposal
In an industrial facility, solid waste is gener-ated in a number of ways. For example, if amanufacturing process generates "scrap" thatcannot be reused, it may be treated as solidwaste. Think of a shoemaking facility; it iseasy to imagine scraps of leather, rejectedfrom the cutting equipment, that cannot bereused. As another example, a facility mightpurchase components of the manufacturingprocess from a third party; those compo-nents may be received in boxes. The boxesmay in turn be treated as solid waste. Theways a facility can generate solid waste arevirtually limitless.
Another contribution to the solid wastethat a facility generates is derived from thewastewater and air treatment processes. Formany of these processes, sludges are gener-ated that can be a large percentage of thewaste a facility generates. It is important torecognize that a sludge generated by a waste-water treatment process, for example, maynot represent the end of the treatment train.Thickening and dewatering techniques areavailable to further reduce the volume ofsludge that will eventually be disposed.Those treatment technologies will not be dis-cussed here, as there are texts devoted solelyto that subject. The Bibliography providesrecommended reading resources.
Likewise, in Chapter 4, the principles ofwaste minimization are discussed. The easi-est way to treat and ultimately dispose ofsolid waste is by not generating it in the firstplace. However, when there are no furthermeans of waste treatment and no options forwaste reduction, solid waste must be han-dled. The discussion that follows is intendedto address that scenario.
When a final residue is produced that can-not be further treated or disposed of eco-nomically on-site, it must be shipped off-sitefor disposal. The residues are often sludges orsolid wastes, which may be regulated by state,local, and federal law. This waste material cantake a variety of forms, from highly toxichazardous waste to bulk material for thedumpster, but it all constitutes an expenseand liability for the environmental manager.Because the cost of storing and disposing of afinal residue varies widely in accordance withthe characteristics of the waste, a knowledgeof the regulatory framework governing finaldisposal is important for both the managerand the engineer, since low treatment costscan be outweighed by high disposal costs andliabilities.
From a disposal standpoint (whichdoesn't necessarily correspond to the physicalform of the waste) final residues generally fallinto one of three categories: normal solidwaste (trash), industrial or "special" waste,or federally regulated hazardous waste.Knowledge of the differences and require-ments of each is important when designingany waste treatment system. This chapterprovides a background for effective disposaldecisions by describing the various categoriesof wastes, strategic and technical consider-ations for disposing of nonhazardous indus-trial wastes, and the major types of disposalfacilities currently in use. Although a com-prehensive treatment of each of these topicsis outside the scope and focus of this book, aworking knowledge of the issues associatedwith each is necessary to make sound andcost-effective choices.

Background
Before the Industrial Revolution in the mid-1800s, almost all wastes—industrial, com-mercial, and domestic—were derived fromnatural substances and were, therefore, bio-degradable. Pollution of any portion of theenvironment was caused by pathogens fromhuman wastes or was the result of simplyoverwhelming the ability of the environmentto undergo self-purification. Either way, thepollution was temporary, and the self-purifi-cation capability of "Mother Earth" wouldeventually prevail.
The Industrial Revolution was attended bythe production of industrial residuals thatcould never be removed by the natural proc-esses of microbiological degradation, chemi-cal oxidation and reduction, adsorption,absorption, or other natural phenomena. Inconsequence, some former dumps are nowsites of very large amounts of heavy metalspollution. Other sites, where coal gasificationtook place, are still polluted with tarry resid-uals that are classified as hazardous becauseof toxic organics.
The problem of soil and groundwater pol-lution greatly accelerated with the develop-ment of synthetic organics, beginning a fewyears before World War I and greatly increas-ing during and after World War II. New syn-thetics were developed and produced in greatquantity during that period of time, includ-ing chlorinated solvents; synthetic rubber; anumber of pesticides and herbicides; poly-chlorinated biphenyls (PCBs); and plasticssuch as polyethylene, polyurethane, and ahost of others. Microorganisms did not havethe ability to produce enzymes necessary todegrade these synthetic organics, since theorganics were not present on the Earth dur-ing the millions of years of development ofthe microorganisms. Consequently, the Earthwas unable to undergo self-purification, andthese substances were carried via percolatingrainwater and other precipitation to thegroundwater.
To prevent the recurrence of such prob-lems, extensive and sophisticated safeguards
have become standard and required compo-nents of landfills, incinerators, compostingfacilities, or any alternative solid waste dis-posal technology. As described in later sec-tions, modern landfills have double linerswith leachate collection and treatment andleak detection. Some landfills have triple lin-ers. All landfills must be closed, according tostrict regulations, upon reaching the end oftheir useful life. Typically, an impermeablecap equipped with gas collection and erosioncontrol means are required.
Incinerators have stack emission controlsand are subject to strict regulations regardinghandling and disposal of ash and residualsfrom stack emission controls. Compostingfacilities have extensive safeguards to protectagainst groundwater pollution. All three dis-posal technologies are subject to strict andextensive regulations regarding what isallowed to be disposed of using their technol-ogy. As well, all three technologies are subjectto the requirement of groundwater monitor-ing at their sites.
Of paramount importance to the area ofsolid wastes handling and disposal is themandate for pollution prevention, discussedin Chapter 4. The pollution prevention man-date requires that industries develop, planfor, and provide for handling and disposal ofall wastes associated with any productthroughout its life cycle, including minimiz-ing the sum total of those wastes. Minimiza-tion involves source reduction as well as recy-cling and reuse.
Among the most desirable methods ofwaste reduction is the production of a salablesubstance or material, either by modificationof the waste itself or by combining it withanother waste material. Chipboard is anexample: used as a substitute for plywood bythe construction industry, it was originallydeveloped using wastes from woodworking.Composted food processing wastes, includ-ing wastes from the processing of fish, poul-try, meat, and vegetables, have been exten-sively used for soil conditioning and fertiliza-tion. Rendering plants have developed capa-bilities to process many organic wastes into

animal feed supplements that were formerlydisposed of. Potato processing wastes are fur-ther processed to produce starch. Manyindustries have constructed and used facili-ties to store solid wastes that contain metalsor other substances of value until animproved recovery process is developed oruntil market conditions become more favor-able. These are more examples of a continu-ing effort on the part of industry to reducethe quantity of solid wastes that requires dis-posal.
Categories of Wastes
Disposal of final treatment residues andplant wastes in general depends on thesource and chemical characteristics of thewaste material itself. Thus, the first step is todetermine into which category the wastebelongs. From a functional standpoint,wastes can generally be categorized into thefollowing types:
1. Hazardous waste, which meets theexplicit criteria for a hazardous waste asdefined by federal and state regulations
2. Nonhazardous solid waste
Nonhazardous waste is further catego-rized as industrial or "special" waste or solidwaste. Industrial or "special" wastes do notmeet the definition of hazardous waste, butthey are excluded from most municipal land-fills because of physical or chemical charac-teristics. Examples include ash and some tan-nery sludge. Solid waste is general trash andrefuse. This material goes into the dumpsterand can be disposed of at a municipal landfillor incinerator.
Industrial residues and process wastes canfall into any of these categories, and identify-ing which category the waste belongs in issolely the responsibility of the facility pro-ducing the waste. Depending on the advice ofa waste contractor is risky, since the genera-tor of a waste is always liable for the conse-quences of its disposal regardless of the role
of a waste contractor. Criminal charges canbe levied for the improper disposal of haz-ardous waste, yet significant unnecessarycosts will be incurred if a nonhazardouswaste is mistakenly disposed of as hazardous.Thus, a working knowledge of these wastetypes is essential for the environmental man-ager, and the services of an environmentalattorney or consultant may be necessary intricky cases.
General information about each wastetype is provided below; however, managersshould consult their own state regulations forspecific and current requirements for theirwaste type.
Hazardous WastesHazardous waste is typically the most toxic,expensive, and regulated type of industrialwaste. Hazardous wastes are governed at thefederal level, primarily by the Resource Con-servation and Recovery Act (RCRA), whichboth defines which wastes are hazardous andincludes extensive requirements for theirmanagement and disposal. Most states areauthorized to implement RCRA on behalf ofthe EPA and so will have their own require-ments, which may be more stringent than thefederal ones. Determining whether a waste ishazardous is the responsibility of the wastegenerator and can be based on a review of theregulations, actual waste testing, or simplegenerator knowledge. Consulting these regu-lations to determine whether a waste is haz-ardous and thus subject to RCRA regulationis the first step in the waste disposal process.Regulations for the identification of hazard-ous waste are included in the federal regula-tions at 40 C.F.R., Part 261, or at the appro-priate corresponding section in state regula-tions.
Under RCRA, solid wastes (which caninclude liquids) are categorized as hazardousif they meet one of two conditions:
1. The waste is included on one of three"lists" of hazardous wastes included inthe regulations.

2. The waste has one or more specified"characteristics" of a hazardous waste.
"Listed hazardous wastes" include wastecommercial products, wastes from specificindustrial processes, and wastes (e.g., spentsolvents) from nonspecific sources. For thegenerator, the first step is thus to review theseregulations to see if the waste, or the processproducing the waste, is listed in the regula-tions. If a waste is listed on one of thesetables, it must be managed as a hazardouswaste. Also, if a nonhazardous waste is mixedwith a listed hazardous waste, the wholequantity must be regarded as hazardous.
The three types of listed hazardous wastesare as follows:
1. Hazardous wastes from specific sources:Wastes produced by specific, listedindustrial sources are automatically reg-ulated as hazardous. They are designatedas K wastes (40 CRR. 261.32) and arehighly industry-specific. Examples are asfollows:
• K004: wastewater treatment sludgefrom the production of zinc yellowpigments
• K083: distillation bottoms fromaniline production
2. Hazardous wastes from nonspecificsources (40 CRR. 261.31): These wastesare produced by many industries and areassociated with common industrialprocesses. They are designated as Fwastes. Examples are as follows:
• FOOl: the following spent halogenatedsolvents used in degreasing: tetrachlo-roethylene, trichloroethylene, methyl-ene chloride, 1,1,1 -trichloroethane,carbon tetrachloride, and chlorinatedfluorocarbons; all spent solvent mix-tures/blends used in degreasing thatcontain, before use, a total of 10% ormore (by volume) of one or more ofthe above halogenated solvents orthose solvents listed in F002, F004,
and F005; and still bottoms from therecovery of these spent solvents andspent solvent mixtures.
• F008: Plating bath residues from thebottom of plating baths from electro-plating operations where cyanides areused in the process.
3. Discarded chemical commercial prod-ucts, off-specification species, containerresidues, and spill residues thereof.These are specific chemicals that are haz-ardous when disposed of, regardless ofthe industrial source or activity. They areconsidered acute wastes (designated asP wastes) or toxic wastes (designated asU wastes). Many common feedstock andproduct chemicals are included on theselists, as follows:
• P051:Endrin
• P076: Nitric oxide
• U002: Acetone
• UO19: Benzene
• U051: Creosote
If a waste is not included on one of theselists, it may still be regulated as hazardousbecause it has a hazardous waste characteris-tic. "Characteristic" hazardous wastes arethose that meet specific criteria for ignitabil-ity (low flashpoint), reactivity (as deter-mined by a cyanide reaction), corrosivity(very acid or alkaline), or toxicity. The toxic-ity characteristic is a measure of how muchspecific contaminants leach from the waste.For this test, the waste (a solid) is subject to aToxicity Characteristic Leaching Procedure(TCLP) analysis, and the concentration ofspecified contaminants present in theleachate (in mg/L) is compared with RCRAstandards (40 CRR. 261.24). Both organicand metals are included as compounds that,when leached in sufficient quantities, maycause a waste to be designated as a character-istic hazardous wastes.
Many routine, and especially nonroutine,industrial wastes fall into this category, and

must be tested to determine whether theymeet hazardous waste characteristics. Mostcommercial laboratories offer an analyticalpackage that includes all these "hazardouswaste characteristics" parameters for a singleprice. Samples must be representative of thewaste, and a generator may use his or herown knowledge to specify test analytes, basedon knowledge of the waste. For instance, awaste need not be tested for TCLP organics ifthe generator knows that no organics are inthe waste.
If a waste is determined to be hazardous, itmust be labeled, stored, inspected, shipped,and disposed of in accordance with strictRCRA regulations. Only licensed hazardouswaste transporters may be used to transporthazardous wastes, which must only be dis-posed of at a licensed treatment, storage, anddisposal facility (TSDF). An appropriatewaste code (as listed in the RCRA regula-tions) is applied, and the waste is shippedunder a special hazardous waste manifest. Ifthe waste stream will remain consistent andthe initial sampling was representative, itneed not be sampled again for every ship-ment; the same waste code applies.
RCRA regulations are among the mostcomplex of all environmental regulations,and a thorough understanding of the manyrequirements is essential for those involvedwith managing these wastes. While this sec-tion presents a brief overview of the processfor identifying hazardous wastes, it is no sub-stitute for the regulations themselves, whichprovide significant additional detail, qualifi-cations, and exemptions.
Nonhazardous Industrial orSpecial WastesIn many cases, an industrial waste may notbe hazardous but may still be barred, at leastin significant quantities, from municipallandfills and incinerators because of thecomposition of the waste. Examples of these"special" wastes vary by state and facility butmay include tannery leather scraps, feathersand other wastes from poultry processing,
ash, nonhazardous sludge, and some con-struction debris. These materials are nor-mally disposed of in an industrial landfill,which is generally more strictly regulated andmanaged than municipal landfills. As withhazardous waste, prior waste testing andapproval are necessary before an industrycan ship waste to the site. The disposal facil-ity will provide a list of required testingparameters.
Industrial wastes are normally regulatedon the state and local levels, and most facili-ties are licensed to accept only certain kindsof waste. Special state approval is often nec-essary for unusual waste streams. While areputable waste disposal contractor usuallyknows the requirements and limitations of anumber of special waste facilities, directcommunication with the facility regardingthe acceptability of your waste is prudent toensure that the waste will indeed be managedappropriately.
While nonhazardous industrial wastes areless tightly regulated than hazardous waste,they can still be the source of significant dis-posal expense. Recycling, waste exchangewith other industries, and waste minimiza-tion are useful and wise approaches to reduc-ing these expenses, especially for wastes thathave been produced and disposed of in thesame manner for a long time: new technolo-gies and recycling opportunities may now beavailable for these materials. These and otheroptions for disposing of industrial wastes aredescribed in the sections that follow.
Nonhazardous Solid WasteSolid waste (i.e., trash) includes such routinewastes as office trash, unreusable packaging,lunchroom wastes, and manufacturing orprocessing wastes that are not otherwise clas-sified as "hazardous" under RCRA. Thesewastes are normally deposited in trashcansand dumpsters and collected by a local trashhauler for disposal in a municipal landfill ortreatment at a municipal incinerator. For theenvironmental manager or design engineer,this is the ideal category for a final treatment

residue to fall into, since these wastes are typ-ically of relatively low toxicity and thus theirdisposal is relatively inexpensive. AlthoughRCRA contains design and other standardsfor municipal waste management facilities,these facilities are normally governed prima-rily by state and local regulation.
For the waste generator, the challenge isusually keeping industrial or hazardouswaste out of the solid waste dumpster. Whenestablishing a contract with a waste hauler,be sure to get a clear understanding (prefera-bly a written list) of what is and is notallowed in the trash receptacles. Many RCRAviolations arise from improper disposal inthe dumpster of common shop items, such assolvent-soaked rags or absorbent material.Clear guidelines for workers, ready access toproper disposal areas, and constant vigilanceof workers and subcontractors are some ofthe tools that work.
The major methods of solid waste disposalare described in further detail in the follow-ing sections. For some larger facilities, on-site disposal of waste at on-site landfills orincinerators is a viable option. As with indus-trial waste, however, a focus on recycling andreuse can help reduce the costs of solid wastedisposal and should be an ongoing compo-nent of a facility's waste management prac-tice.
The distinctions between each of the wastecategories (hazardous, industrial, and solidwaste) described above are not always clear,and the onus is on the individual industry, orappropriate facility, to make the correctdetermination. Some states, for instance,consider waste oils and PCBs to be hazardouswaste, even though federal law does not.Cans of dried paint are generally regarded asa normal solid waste that can go in a dump-ster; cans of wet paint, especially those thatcontain lead or chromate, are usually desig-nated hazardous. Tannery wastes with triva-lent chrome usually can go to an industriallandfill, but some states consider these mate-rials hazardous.
Waste management and disposal oftenrepresent significant and constantly increas-
ing costs for industry. To minimize thesecosts and reduce the likelihood of enforce-ment actions by regulators, environmentalmanagers must ensure that a sound programis in place and that all personnel, from labor-ers to top managers, are vigilant in carrying itout. The following guidelines are often help-ful:
• Know the facility waste streams. These areseldom the same for different plants. Asa first step, facilities must know howmuch of each type of solid waste they areproducing.
• Keep wastes segregated. Heavy fines, aswell as criminal sentences, are the penal-ties for improper waste disposal. Facili-ties must ensure that hazardous wastesare not put in the trash dumpster, thatlisted hazardous wastes are not mixedwith other nonhazardous materials, andgenerally that wastes are handled as theyare supposed to be.
• Choose waste disposal firms carefully.Since facilities can be held responsiblefor cleanup costs of the waste facilitiesthey use, waste transporters and facilitiesshould be chosen carefully. Check withyour state's environmental enforcementdivision to uncover any violations ortour and interview the facility or trans-porter directly.
• Institute a pollution prevention programthat includes a vigorous wastes minimiza-tion effort. Although, as described inChapter 1, this is one of the first steps ina waste treatment system design, imple-menting a waste minimization study as astand-alone task is a common and effec-tive means of reducing disposal costs.Reducing the quantity or toxicity ofmaterials used in production reducesboth disposal and health and safety-related liabilities.
• Keep areas clean. Frequent spills or rou-tine drippage not only present safetyhazards but also increase the amount offacility decontamination necessary atclosure.

• Keep good records. Industry-wide, a greatdeal of money is wasted on testing anddisposing of unknown materials or ininvestigating areas with insufficient his-torical data. Good recordkeeping isessential to keep both current and futurewaste management costs to a minimum.
Characterization of Solid Wastes
Each significant solid waste stream shouldundergo characterization in order to deter-mine the following:
• Opportunities for waste reduction• Volume rate of waste generation• Whether or not the waste is hazardous• Suitability of the waste for landfilling• Physical properties as they relate to suit-
ability for landfilling• Chemical properties as they relate to
suitability for landfilling• Estimation of leachate characteristics• Suitability of the waste for incineration• Estimated requirement for auxiliary fuel• Estimated characteristics of stack emis-
sions• Estimated characteristics of ash• Suitability of the waste for composting
Opportunities for Waste ReductionThe first and most important order of busi-ness in a solid waste management program isto identify any and all opportunities forreducing the volume, strength, and hazard-ous nature of wastes, always with the goal ofelimination. For instance, the solid wastesmanager should constantly be seekingopportunities for given wastes to be used asraw material in another manufacturing proc-ess, even if there is a cost. The cost should becompared with the cost of processing anddisposing of the waste, and an appropriateamount should be added as insuranceagainst having to deal with the disposedwaste in the future for one reason or another.If the waste can be safely incorporated into
another product, a permanent solution willhave been implemented.
As a very simple example, a certain card-board manufacturing plant had a daily pro-duction capacity of 1,000 tons per day ofheavy brown paper. The plant had a waste-water treatment plant that produced aboutthree tons (dry basis) of waste biosolids perday. After years of landfilling this sludge, thesuggestion was made to simply incorporatethe waste biosolids into the brown paper. Therelatively tiny amount of biosolids, whichhad been a sizable solid waste disposal prob-lem, "got lost" in the 1,000 tons of brownpaper, forever solving a previously expensiveproblem.
As another example, during the 1970s, thenumber of poultry farms and poultry proc-essing facilities increased dramatically inresponse to a growing desire on the part ofthe American public to reduce intake of cho-lesterol. Many of the poultry processingplants made use of dissolved air flotation(DAF) for wastewater treatment. The resid-ual from the DAF process is a sludge that isvery difficult and expensive to dispose of. Asolution that was developed and used bysome of the processing plants was to incor-porate the DAF residual into the raw materi-als that were being used to produce feed forthe poultry. Since the DAF residual wasessentially all poultry parts and pieces, it wasperfect as a feed additive, to be fed right backto the chickens. Again, an expensive andproblematic solid waste disposal problemwas resolved. In this case, the result was a sig-nificant savings of money for both waste dis-posal and feed production.
Volume Rate of Waste GenerationOften rigorous attention paid to managingproduction processes so as to "do it right thefirst time," and having little or no off-specproduct to dispose of, can significantly reducethe volume of solid wastes. Also, improvedpreventive maintenance and improved oper-ation and maintenance (O&M) practices, soas to reduce leaks, spills, and accidents, can

have the effect of significantly reducing thevolumes of solid wastes, as well as wastewaterand air pollutants.
Whether or not the waste is hazardous hasa major effect on both the cost of solid wastehandling and disposal and the risk of futureliability. It is always a good idea to substitutenonhazardous materials for hazardous mate-rials used in production, if the resultingwastes become nonhazardous. An example isto use hot water and detergent or a hot caus-tic solution as a degreaser fluid, rather thanone of the chlorinated organic solvents. Inmany cases, the hot detergent or caustic solu-tion outperforms the chlorinated solvent.The principal value of this substitution, how-ever, is that the sludge from the hot detergentor caustic process will likely not require dis-posal as a hazardous substance.
As another example, certain sludges fromindustrial processes or industrial waste treat-ment facilities are required to be handled anddisposed of as hazardous wastes because, onbeing subjected to the Toxic CharacteristicLeaching Procedure (TCLP) test, the quan-tity of metals leached is more than is allowed.It has been possible, in some instances, tomix "superphosphate" fertilizer into thesludge, with the result that the sludge is thenable to "pass" the TCLP test. The treatmentmechanism at work here is that the metalions become tied up as extremely insolublemetal phosphates. The acid solution used forthe TCLP test is unable to leach the metalions from the sludge, and rainwater percolat-ing through the landfilled sludge will cer-tainly not be able to leach the metals andbecome a groundwater pollution threat.
Suitability of the Waste for LandfillingWhether or not a particular solid waste issuitable for landfilling depends upon itsphysical characteristics, chemical characteris-tics, and its probable leachate characteristics,i.e., whether or not there will be hazardoussubstances in the leachate.
Physical PropertiesPhysical properties that influence suitabilityfor landfilling include those that influencestructural stability. Often, water content isused to determine suitability for landfillingin the case of waste sludges. Another prop-erty is physical size. Still another relates tothe ability of landfill machinery to handle thewaste at the landfill site.
Chemical PropertiesChemical properties that influence suitabilityfor landfilling, in addition to those proper-ties that determine whether or not a waste ishazardous (corrosivity, toxicity, ignitability,and reactivity) include foaming agents(methylene blue active substances), iron andmanganese, odor, and odor generationpotential, for instance, sulfate.
Formal testing procedures for determin-ing whether or not a waste is hazardous arepresented in Chapter 5.
Suitability of the Waste for IncinerationWhether or not a waste can be destroyed byincineration (often referred to as "combus-tion"), and the quantity of auxiliary fuel thatwould be required to maintain a sufficientlyhigh temperature in the combustion cham-ber to accomplish complete combustion,depends on several characteristics of thewaste. Water content and chemical composi-tion are major factors. Water content isimportant because of the demand that waterplaces on auxiliary fuel usage and thus thecost of incineration. Chemical compositioninfluences the following:
• The fraction of the total waste streamthat can be converted to carbon dioxideand water
• The characteristics of the stack emissions• The characteristics of the ash• The quantity of auxiliary fuel required
Within a total waste stream, the only ele-ments that will be converted to carbon diox-ide and water are carbon and hydrogen. All

other elements will be converted to othersubstances or will remain unchanged. Someelements will be converted to anions of highoxidation state; for instance, sulfur will beconverted to sulfur dioxide or sulfur trioxide.Some elements will be liberated as the freecation; for instance, mercury that has beenincorporated into organic material (methylmercury) will most likely exit the stack asfree Hg+. Chunks of ferrous metals will tendto remain unchanged. Sand and other inertswill end up in the ash. Some heavy metalswill end up in the ash, while a portion willexit the stack.
It is critically important, then, to be awareof the chemical composition of any wastestream for which treatment by incineration isbeing contemplated. The word "treatment" isused here rather than "disposal" becauseincineration yields residuals from stack emis-sion treatment (for instance, electrostaticprecipitation) as well as ash. These residualsthen become the subjects of evaluation ofalternatives for disposal method.
Suitability of the Waste for CompostingCertain industrial solid wastes—vegetableprocessing, for instance—may be excellentcandidates for composting. Composting is amethod of converting waste material tousable material and is thus highly desirable.A very large composting facility has beenoperated for many years in the U.S. midwestfor the purpose of converting meat process-ing wastes to a soil enhancement product.
Solidification and Stabilization ofIndustrial Solid WastesSolid wastes from industries, including bothfly ash and bottom ash from combustion pro-cesses, can sometimes be conveniently, safely,and cost-effectively stabilized by one or moreof the processes that are characterized as"solidification and stabilization" (S/S). In thiscontext, "safely" refers to compliance with alllaws and regulations, as well as with respectto potential harm to people or the environ-
ment. "Stabilized" refers to transformationof a substance from a form in which it isleachable, hazardous, or otherwise objection-able to a form in which it cannot be leached,vaporized, or enter into a reaction withanother substance.
Solidification and stabilization technolo-gies are used with the objective of convertingthe solid waste, with or without any free-flowing liquid that may be associated with it,to a state such that it can be landfilled or oth-erwise applied to the land without danger offorming unacceptable leachate or gas. Thereare a number of technologies that can beused, depending on the characteristics of thewaste material.
Laws and regulations regarding S/S meth-ods of solid waste treatment before disposalare ever changing, and this poses a problem.It can be said that if the S/S product can"pass" all applicable tests, such as the PaintFilter Liquids Test (PFLT) and the ToxicCharacteristic Leaching Procedure (TCLP), itis "safe" to be disposed of in an approvedlandfill. However, the criteria for passingthose tests, as well as the procedures of thetests themselves, have been changing overtime—thus, the moving target problem.Nevertheless, there are certain industrialsolid wastes, with certain hazardous or oth-erwise objectionable characteristics, that canbe treated using certain S/S techniques thatwould seem essentially certain to complywith any present or future acceptance testingprocedure. For instance, the objectionablecharacteristic of certain industrial solidwastes that contain formaldehyde is that theformaldehyde, which is toxic, can be leachedout by water and become a groundwater pol-lution threat. The solid waste mass may betreated by mixing it with phenol (anothertoxic substance) to produce (stoichiometri-cally) a "phenol-formaldehyde resin," whichis extremely insoluble—resin that does dis-solve is relatively inert and nontoxic.Whether or not such a treatment process canbe reliably and cost effectively (in the contextof alternatives) carried out is largely depen-dent on the characteristics of the solid waste.

A second problem regarding S/S methodsfor treatment of solid wastes prior to landfill-ing is that additional volume is added. As "airspace" at approved landfills increases in itsalready high value, this consideration willincrease in importance.
Notwithstanding the moving target prob-lem, a number of S/S technologies exist thatwarrant serious consideration, which meansa very close examination of the characteris-tics of the solid waste and the characteristicsof the S/S product. It is to be emphasized thatthe feasibility of using any given S/S technol-ogy for treatment prior to disposal of a givensolid waste stream must be closely evaluatedusing a four-step process:
• Evaluate the likelihood of successfulapplication of each alternative S/S tech-nology on a theoretical basis (basicchemistry and physics). This evaluationshould include a thorough search todetermine whether or not any of theavailable alternative S/S technologieshave been used successfully on a similarwaste stream at another location.
• Perform bench-scale tests using thosetechnologies that appear promising.Testing must include all product evalua-tion tests such as TCLP and PFLT proce-dures, where applicable.
• Perform pilot plant evaluations using S/Stechnologies with the most favorablebench-scale tests. Include product evalu-ation tests.
• Perform a detailed preliminary design ofthe prototype treatment system(s). Athorough and detailed cost opinion anal-ysis must be included.
There are at least three systems by whichS/S technologies are categorized:
• By process system• By binder used• By S/S mechanism
S/S Process SystemsThere are at least four systems in use toaccomplish S/S treatment of industrial wastestreams: in the 55-gallon drum in which thewaste materials to be treated have been col-lected; in a specially designed and con-structed facility to carry out the S/S processon site; in a mobile facility; or in a sludge pit,lagoon, or other collection facility of thesolid waste stream.
In the case of the "in-drum" system, treat-ment chemicals or binders are added directlyinto the 55-gallon steel drums used to collectthe solid wastes. Stirring and reaction arecarried out, and the stabilized product isoften placed in a landfill or other facility stillin the drum.
Specially built S/S plants, similar to incin-erators, are operated either on site or at cen-tral locations. The process can be batch-typeor continuous. These facilities are appropri-ate for large quantities of solid wastes.
In some cases, the reaction chemicals orbinders are added directly into a collectiontank, storage tank, or lagoon in which thetarget solid wastes have collected. In the caseof lagoons, it might be feasible, safe, and costeffective to simply close the lagoon, underRCRA or other approved procedures, withthe stabilized solid wastes remaining. Thistype of procedure is referred to as "in situtreatment and disposal."
Binders Used for S/S TechnologiesSolidification agents that have been success-fully used to stabilize industrial solid wastesinclude both organic and inorganic sub-stances, as listed below:
Organic Binding Agents• Epoxies• Asphalt• Urea-formaldehyde• Polyesters• Polyolefins

In all of these technologies, appropriatepretreatment of the solid wastes is veryimportant.
EpoxiesSeveral different epoxy mixes have been usedas binders for the S/S treatment of industrialwastes, including proprietary substances andprocedures. Epoxies have been successfullyused for S/S treatment in 55-gallon drums, asdiscussed above. Epoxies make use of at leasttwo reactants; therefore, mixing must berapid and thorough. If executed properly, thehardened epoxy will incorporate the solidwaste substances within its polymerizedmatrix, effectively reducing, by orders ofmagnitude, the surface area of the targetmaterial that can be contacted by water orother potential leaching liquid. Epoxies arecharacteristically nonreactive and areexpected to prevent leaching or other reac-tion of the target substances for extremelylong periods of time.
There are different types of epoxy, usingdifferent reactants and producing polymer-ized matrices having different chemicalproperties. Some are more resistant to cer-tain organic solvents or strong acids or caus-tic substances. For these reasons, the mostappropriate epoxy for a given applicationshould be the subject of considerableresearch before a given S/S technology isselected or rejected. As well, the results ofbench-scale trials should be evaluated inlight of these characteristics.
AsphaltMany industrial solid wastes have been suc-cessfully solidified and stabilized by simplyincorporating them into an asphalt mix at aconventional asphalt batch plant. In othercases, special asphalt mixes using speciallydesigned and constructed mixing equipmenthave been used. Factors that must be consid-ered include reactivity potential between theasphalt binder and any of the components ofthe solid waste stream; the future effects of
heat on the physical integrity of the asphalt;the potential for substances that are solventsfor the asphalt coming in contact with thedisposed products; and the potential forwearing or abrading of the asphalt product.
Urea-formaldehydeAn epoxy-like matrix can be formed by thepolymerization that occurs when urea andformaldehyde are mixed in proper propor-tions. As with the epoxy S/S treatments dis-cussed above, target substances in solidwastes can be incorporated into this matrix,effectively solidifying and thus stabilizing thetarget substances. The choice between urea-formaldehyde and epoxy as the S/S treatmentdepends largely on potential reactionsbetween substances in the solid waste streamand the urea-formaldehyde mixture.
PolyestersSeveral polyesters can be used for S/S treat-ment of certain solid waste target substances.As with epoxy and urea-formaldehyde tech-nologies, the binding effect that polyesterscan have on solid waste target substancescomes about as a result of incorporating thetarget substances (and other substancespresent with the target substances) in theinner mass of the matrix that forms when thepolymerization process takes place, in whichsmall organic ester molecules combine toproduce a relatively huge monolithic mass. Itis not (necessarily) that the target substancesbecome chemically incorporated into thematrix but rather that the target substancesbecome trapped within the matrix. Becausethe target substances are trapped, it is impos-sible for water or other dissolving or reactingsubstance to come in contact with them.Thus, the goal of the S/S technology isaccomplished.
PolyolefinsPolyethylene and polyethylene-butadiene aretwo polyolefins that can be used in the sameway as is described for polyesters, above, to
solidify and thus stabilize certain solid wastestreams. The choice between polyesters andpolyolefins is, again, based on the chemicalproperties of the solid waste substances andthe chemical and physical properties andcharacteristics of the environment of the dis-posal site. The mechanisms of stabilizationare essentially the same. For example, if asolid waste is first, conditioned by evapora-tion to dryness and grinding to a fine granu-lar consistency, it can be mixed together withappropriate proportions of ethylene andbutadiene, plus a catalyst. In the presence ofthe catalyst, ethylene and butadiene poly-merize to form a monolithic mass. As thepolymerization process takes place, the gran-ules of solid waste material becomeentrapped within the polymeric mass.
Inorganic Binding Agents• Portland cement• Pozzolan substances• Lime• Gypsum• Silicates
Portland CementOne of the first S/S techniques to be used wasto simply mix conditioned solid wastes withPortland cement, sand, and water and thenallow the mixture to harden into concrete. Inmany cases, fly ash has been mixed in. The flyash contains silica and thus enters into a poz-zolan reaction that adds to the structure ofthe concrete mass. Also, the fly ash may havebeen a disposal problem in itself. In this case,including fly ash in the mixture with cementand another waste material has solved twohazardous waste disposal problems concur-rently.
Solidification with Portland cementachieves stabilization of solid wastes by pre-venting water from any source(e.g., percolat-ing rainwater or groundwater) from beingable to leach substances from the solid waste,because the water can no longer come intocontact with the waste material. In this case,the waste material has been trapped within a
monolithic block of relatively high strength.Even if cracks eventually develop in the con-crete mass, the surface area of the wastematerial that can be contacted by water willbe orders of magnitude less than before thesolidification process.
There are at least two stabilization mecha-nisms involved when Portland cement isused as the solidification agent:
1. Entrapment within a monolithic mass2. Incorporation into the chemical struc-
ture of the monolithic substance
Any water that is included in the solidwaste stream will be taken into the structureof the concrete as the curing process takesplace.
Use of Portland cement as the solidifica-tion agent or "binder" is relatively safe, butrelatively expensive. The decision to usePortland cement rather than a less expensivesolution is usually made to reduce perceivedfuture risk to a minimum.
Pozzolan SubstancesFly ash, from the burning of fossil fuels andother substances, contains fine grains of non-crystalline silica. When fly ash is mixed withlime and water, the calcium in the lime reactswith the silica from the fly ash to produce alow-strength cement-like solid substance.This reaction is referred to as a "pozzolan"reaction. Conditioned solid wastes can bemixed into the lime-fly ash-water mixture,as described for the Portland cement S/Stechnology above. The result is much thesame, in that the target substances in thesolid waste stream have become immobilizedand are protected form the leaching process.The reactants are less expensive, and one ofthem, the fly ash, is a solid waste in its ownright. This technology, then, accomplishestreatment for safe disposal of two, or at leastportions of two, solid waste streams.
As was the case with Portland cement asthe binder, there are at least two stabilizationmechanisms involved when the pozzolan-type solution is used:

1. Entrapment within a monolithic mass2. Incorporation into the chemical struc-
ture of the monolithic substance
Any water that is included in the solidwaste stream will be taken into the structureof the monolithic mass as it forms via the"curing process."
LimeSome solid waste streams, having certaincharacteristics of chemical composition andmoisture content, can simply be mixed withlime and allowed to dry. On drying, a lowstructural strength solid mass with low solu-bility in water is formed. Many metal ionspecies that were present in the waste streamwill have been precipitated as the highlyinsoluble hydroxide, except for those metalion species, such as lead and zinc, that havethe lowest solubilities in the lower pH range.pH, of course, has no meaning in a solid sub-stance; however, a metal that is precipitatedas the hydroxide and is then placed in a dryenvironment will not dissolve into water thateventually comes into contact with it to adegree higher than its theoretical solubilitylimit.
If there are significant quantities of leadand/or zinc, or other metal whose hydroxideis more soluble than desired in the solidwaste stream (along with those metals thatdo precipitate best at high pH levels), thereare at least two alternatives. One is to add asource of water-soluble sulfide ions to thelime (e.g., sodium sulfide); the second is toadd a source of soluble phosphate ions (e.g.,triple-super-phosphate fertilizer). The sul-fide or phosphate ions will precipitate thosemetal ions that remain in water solution afterthe pH has been raised to the 12 to 13 rangeby the solubilized lime.
The security of a lime-treated solid wastemass can be enhanced significantly by encap-sulating the final product in an impermeablemembrane, either by spraying it onto thesurfaces and allowing it to cure or by wrap-ping the final product in an already formedmembrane.
GypsumGypsum is another relatively inexpensivesubstance, like lime, that will form a solidmass on drying. Unlike lime, however, gyp-sum is not an alternative for treating wastesin which metal ions are among the targetsubstances. Whereas the anion associatedwith lime is hydroxide, the anion associatedwith gypsum is sulfate. Metal sulfates are sol-uble in water. Gypsum is therefore an alter-native substance for treating certain solidwaste streams where incorporation into a lowstructural strength solid mass is the principalobjective. Importantly, gypsum itself (cal-cium sulfate) is very sparingly soluble inwater; therefore, the substances that werecomponents of the original solid wastestream and are incorporated into the driedmonolithic mass product are "sheltered"from contact with water. If disposed of prop-erly, by placing in a suitable burial facility,the problem of future leachate will have beensolved.
SilicatesSilicates represent another category of sub-stances that can be mixed as a liquid withproperly conditioned solid wastes and then,on drying, form a monolithic matrix that is:
• Insoluble in water and water repellent• Relatively inert regarding reaction with
most chemical substances• Stable over time• Capable of incorporating the target sub-
stances into its monolithic mass
An advantage of the silicates comparedwith pozzolans, lime, and gypsum is that thesilicates form a gel that is pliable and, there-fore, resistant to cracking if physicallydeformed. The basic objective of treatment isthe same as for pozzolans and gypsum; thatis, to make it extremely difficult, if notimpossible, for water to produce leachatefrom the treated solid waste in the future.Treatment using silicates is different, how-ever, from treatment with lime or Portland

cement, in that metal ions will not be precip-itated as a water insoluble substance by usingsilicates. For this reason, silicate technologywould likely not be a good choice for treat-ment prior to disposal of a solid waste streamin which metal ions are target compounds.
Mechanisms Involved in S/S TreatmentProceduresSome of the mechanisms by which individualS/S technologies accomplish stabilization oftarget substances in solid waste streams havebeen discussed in the preceding paragraphs.A more thorough discussion of these andother mechanisms is presented below.
To restate the overall objective of S/S treat-ment: it is to produce a product that can bereliably and safely disposed of, usually in anappropriate landfill, without danger of gen-erating an objectionable leachate in thefuture. The mechanisms employed by theindividual solidification technologies dis-cussed above, are as follows:
• Incorporation into a monolithic solidmass
• Precipitation of target substances toform nonleaching products
• Adsorption of target substances to formnonleaching products
• Absorption of target substances to formnonleaching products
• Adsorption of water from the solid wastemass
• Absorption of water from the solid wastemass
• Encapsulation
Incorporation into a MonolithicSolid MassIn order for leachate to form, water mustcome into contact with a soluble material,dissolve an amount of that material, and thencontinue to flow (under the influence ofgravity) away from the solid waste material.One effective way to prevent leachate forma-tion, then, is to make it impossible for waterfrom outside a mass of solid waste material
to contact target substances. One way thisobjective can be accomplished is to incorpo-rate the target substances within a mono-lithic mass of an insoluble solid. Any waterapproaching this solid mass will be forced toflow around it and thus will never achievecontact with the target substances.
The mechanism is simple, but the objec-tive is not. The most difficult problem has todo with all of the counterobjective activitiesthat take place over a very long period oftime. Destruction of the structural integrityof the monolithic solid mass, either slowlyover time, or as a result of physical damage,must be prevented. The long-term effects of"natural" phenomena, such as acid rain,must be carefully considered and designedinto the overall technological solution.
There are basically two ways by which tar-get substances can be incorporated into aformed monolithic mass: (1) by chemicalreaction and actual incorporation into thelattice structure of the monolithic solid as itis forming, for instance, by polymerization,and (2) by entrapment within the physicalstructure of the monolithic solid as it is beingformed.
Precipitation of Target Substances toForm Nonleaching ProductsThere are several alternative technologiesthat make use of precipitation of target sub-stances. As discussed above, using lime as abinder is one of them. Other alternativesinclude mixing with soluble carbonate, sul-fide, or phosphate compounds, usually com-bined with a substance to form a monolithicsolid mass.
Adsorption of Target Substances to FormNonleaching ProductsCertain adsorbents, such as activated carbon,can be mixed into a slurry of solid wastematerials with the result that water is notable to desorb the target substances overtime. Before this technology can be deemedappropriate for a given waste stream, how-ever, extensive testing must be carried out to

determine the edegree of adsorption, as wellas resistance to desorption. Moreover, it isseldom that the optimum adsorbent isselected early in the evaluation procedure.There are many different activated carbons aswell as alternatives to activated carbon. Also,there are many different chemical character-istics regarding the potential leaching solu-tion that must be evaluated—for instance,different values of pH, acidity, alkalinity,ORP, and TDS content, to name a few.
Absorption of Target Substances to FormNonleaching ProductsRegarding S/S technologies, there are certainmaterials that can absorb and hold targetsubstances in a solid waste stream in themanner that a sponge absorbs and holdswater. This technology type has potentialapplication when the target substanceswithin a solid waste stream are part of theliquid portion of the stream.
Adsorption of Water from the SolidWaste MassIn some cases, activated carbon, or anotheradsorbent, has been used to adsorb waterfrom a solid waste mass to change its physicalcharacteristics to a more manageable state.Substances that are dissolved in the water areoften incorporated into the bulk activatedcarbon (or other adsorbent) product andmust be dealt with appropriately. One alter-native for this requirement is incineration todestroy the adsorbed target substances and toreactivate and recover the activated carbonfor extended use.
Absorption of Water from the SolidWaste MassMaterials having the capability of absorbingwater from a solid waste stream have beenused for two purposes: (1) to prepare thesolid waste for further treatment in a less wetstate, and (2) to isolate target substances thatare dissolved in the water phase of the solidwaste stream. Once absorbed into theabsorbing material, that material can be fur-
ther processed by treating the material, thewater, and the dissolved target substances asa whole, or by physically removing theabsorbed water phase and then treating thatliquid for recovery (for reuse), fixation, ordestruction of the target pollutants.
EncapsulationEncapsulation has the objective of preventingcontact between water and target substancesby forming a physical, impermeable barrieraround a volume of solid waste, or a volumeof solid waste that has been treated using oneof the technologies discussed above. Alterna-tive methods for encapsulation includewrapping a volume of the treated or "raw"solid waste in a membrane of high-densitypolyethylene (HDPE) or other material;spraying it with one of the commerciallyavailable products that then polymerizes toform a seamless, impermeable coat; or dip-ping a volume of treated or "raw" solid wastein a solution that will then polymerize toform a seamless, impermeable coating.
The Solid Waste Landfill
The Conventional LandfillModern landfills are highly secure facilitieswith sophisticated features to prevent pollu-tion of groundwater or soil. Modern landfillsalso have safeguards against blowing trashproblems, odor problems, rodent and flyproblems, fires, and contamination of sur-face waters.
There are alternatives, but most modernlandfills are constructed as described below.
First, the site is cleared and grubbed. Thetopsoil is removed and stored. Access roadsare built, and physical facilities such as anoffice building, maintenance and storagebuilding, scales, hot load pit with firefightingequipment, and laboratory facility are con-structed and/or installed.
After excavation to provide a basin inwhich the solid wastes will be placed hasbeen completed, the liner system is con-structed.

Landfill Liner SystemFigure 9-1 presents a cross-section of a land-fill liner system constructed in 1999 and isherewith discussed as a typical modern land-fill liner system. The landfill liner systemshown in Figure 9-1 can be described as a"double composite with primary and sec-ondary leachate collection." This particulardesign can also be described as having leakdetection, since any leachate collected by thesecondary leachate collection is direct andpositive evidence of a leak in the primaryliner.
It is convenient to describe the landfillliner system illustrated in Figure 9-1 bydescribing how it is constructed. After exca-vating the landfill "basin" to the subgrade,(shown in Figure 9-1), an 18-inch thick layerof "secondary barrier soil" is placed. Thismaterial constitutes a liner in its own right,since the hydraulic conductivity (the rate atwhich water can move through the soil underthe influence of gravity) can be no greaterthan 10 centimeters per second, equivalentto about 1 foot in 30 years. Federal regula-tions (Subtitle D) require that a soil liner ofnot less than two feet of soil having a coeffi-
cient of permeability ("k") equal to or lessthan 1 x 10~7 be an integral component ofthe liner system for all landfills. In the case ofthe landfill used for this example, the stateregulatory agency as well as the EPA agreedthat 18 inches of soil with a "k" value of 1 x10 plus 12 inches of soil with a "k" value of1 x 10~5, plus the geosynthetic clay liner asdiscussed below, more than satisfied thisrequirement.
Some states will not accept a substitute fora soil liner at least two feet thick with a "k"value of 1 x 10 or less. One solution for thissituation, if it is not possible to obtainenough soil of that low hydraulic conductiv-ity within a reasonable distance of the landfillsite, is to augment native soil (of higherhydraulic conductivity [larger value of "k"])with powdered sodium bentonite. Bentoniteis a natural clay that exhibits a high degree ofswelling on contact with water. In fact, it willswell to 25 times its volume when dry. Whenrelatively small amounts of this material aremixed into soil of higher hydraulic conduc-tivity, the particles of bentonite fit into thevoid spaces. Then, when a water solution (for
PRIMARY LCR HEADERPIPE 12" PERF. HDPE MAINTAIN 12" CRUSHED
STONE ABOVE LCR HEADER
2' MIN.
PRIMARYLINER
SYSTEM
SECONDARYLINER
SYSTEM
PRIMARY LATERAL LCR PIPE6" PERF. HDPE16 OZ. NONWOVENGEOTEXTILE
80 MIL TEXTURED HDPEPRIMARY GEOMEMBRANE
GEOSYNTHETIC CLAY LINER(GCL) 1/2"
DRAINAGE GEOCOMPOSITESECONDARY LEACHATECOLLECTION
80 MIL TEXTURED HDPESECONDARY GEOMEMBRANE
12" OF 1-1/2" DIA.CRUSHED STONE
12" PRIMARY BARRIER SOIL(k=lxlO"5 cm/sec)
18" SECONDARY BARRIER SOIL(k=l x 10~7 cm/sec)
LANDFILL LINER SUBGRADENOTE:
SPACEPIPINGAS SHOWN ONSITE DEVELOPMENT PLAN
Figure 9-1 Double composite landfill liner system.

instance, leachate) comes into contact withthe mixture, the particles of bentonite swell.This swelling action closes off the void spacesin the more highly permeable soil, with theresult that the mixture as a whole has a "k"value that satisfies the Subtitle D mandate of1 x 10"7 or less.
Next, an impermeable membrane isplaced over the secondary soil barrier. In thesystem illustrated in Figure 9-1, that mem-brane consisted of 80-mil (thick) texturedhigh-density polyethylene (HDPE). This bar-rier is referred to as a "synthetic membrane"and constitutes the secondary liner for thelandfill.
Over the top of the synthetic membranesecondary liner is placed a fabric that isreferred to as a "geocomposite." This fabric,which is loosely woven using threads of syn-thetic material, performs two functions. Oneis to protect the HDPE membrane frombeing punctured by anything in the layer ofsoil above it. The other is to act as a leachatecollection and conduit device. Its openlywoven texture allows it to perform this func-tion.
Over the top of the geocomposite fabric isplaced a one-foot layer of compacted soilreferred to as the "primary soil barrier." Thislayer of compacted soil, like the secondarybarrier soil, is strictly regulated as to charac-teristics of aggregate size and uniformitycoefficient, and its hydraulic conductivitymust be no higher than 10~5 centimeters persecond.
Over the top surface of the primary bar-rier soil is placed a sheet of a manufacturedmaterial called a "geosynthetic clay liner"(GCL). This material, which is delivered tothe site in large rolls and is about one-halfinch thick, consists of a mat-like fabric that isfilled with clay. The clay is used for its imper-meability and resistance to chemical attack,which is a possibility in the case of HDPE,though a very remote one. The synthetic fab-ric has the function of providing the GCL asa whole with structural strength and thecapability of constructing a layer of clay thatis quite thin.
The next layer, placed over the top of theGCL, is the primary liner for the landfill, asheet of 80-mil-thick textured HDPE. Thismembrane is constructed by rolling out verylarge rolls of the HDPE material as it is deliv-ered to the site and welding sheets edge toedge (actually, the edges overlap) to form acontiguous membrane underlying the entirelandfill. The same procedure is used to con-struct the secondary liner. If everything wereas intended throughout time, there would beno passage of leachate through the primarymembrane, and everything below it would besuperfluous.
The final layer of fabric in the landfill linersystem shown in Figure 9-1 consists of a"nonwoven geotextile" placed over the top ofthe primary synthetic liner. The primaryfunction of this layer of synthetic fabric is toprotect the primary liner from being punc-tured or otherwise breached by the crushedstone, or anything inadvertently put in thecrushed stone, above it.
A bed of crushed stone consisting ofaggregates of one to one-and-a-half inches indiameter is placed on top of the nonwovengeotextile, along with the primary leachatecollection system. The crushed stone bed hasthe multiple functions of (1) holding theleachate collection and transport pipe systemin place, (2) providing a high degree ofhydraulic conductivity to enable leachate toflow to the collection and transport system,and (3) serving as a bed for the solid wastesplaced in the landfill.
The primary leachate collection andtransport system is a grid of plastic pipe(HDPE in the example illustrated in Figure9-1), perforated at all locations within thelandfill and solid outside the landfill. Thelayout of the pipe grid, the size and spacingof the laterals and headers, and the materialof construction of the pipes themselves aresubject to guidelines and regulations issuedby each state or solid waste authority. Thetreatment and disposal of leachate, once col-lected, is addressed in Chapter 7.
There are landfill liner designs that have alayer of groundwater protection in addition

to the two that are included in the designillustrated in Figure 9-2. The landfill linersystem shown in Figure 9-2, which wasinstalled in 1999 in Augusta, Maine, has pri-mary and secondary synthetic membraneliners with primary and secondary leachatecollection, as shown in Figure 9-2, plus athird synthetic membrane liner below theprimary and secondary systems. There is asystem of liquid collection and transport pip-ing just above the third liner, which is cor-rectly referred to as "leak detection" since itsfunction is to show evidence of leaks in the"conventional" landfill liner system above it.
Landfill Cover and Cap Systems
Daily and Intermediate CoverAn important feature of any landfill is a prac-tice that began with the earliest landfills inthe 1940s—that of daily, intermediate, andfinal cover. Daily cover consists of soil orother approved material that is placed overthe deposited wastes as soon as is practicalthroughout, and without fail at the end of,each day of landfill operation. The purposes
of daily cover include control of flies androdents, fire, odors, VOC emissions, andscavenging, as well as the prevention of itemsbeing blown out of place by wind. A six-inchdepth of soil is mandated by the EPA (Title40, Subpart C, 258.21) for this purpose.However, because of the high value placed onlandfill "air space," the six inches taken up byeach lift when soil is used for the daily coverhas been looked upon as a candidate forreplacement by much thinner alternativematerials. Although each time a substitutematerial is used it must be approved on acase-by-case basis, a significant number oflandfills have been successful in doing so.Alternative materials have included speciallyconstructed membranes (referred to as"tarps"), sludge from primary clarifiers, pro-prietary fiber slurries, foam-in-place prod-ucts, and spray-on asphalt membranes.
Intermediate cover is soil that was earlierremoved from the landfill excavation andstockpiled. The same is true for daily cover.In some instances, another (approved) mate-rial has been used for daily cover. An exam-ple is sludge from primary clarifiers at paper
Figure 9-2 Landfill liner with three synthetic membranes and two leachate collection systems.
FAILURE DETECTION - DRAINAGEPIPE, PERFORATED HDPE PIPE6" DIA. SDR 15.5
COMMON BORROW
40 MIL HDPE FML
16 OZ. FILTERFABRIC
8 OZ. HLTERFABRIC
SECONDARY LCR - DRAINAGEPIPE. PERFORATED HDPE PIPE.6" DIA. SDR 15.5
16 OZ. FILTERFABRIC
PRIMARY LCR - DRAINAGEPIPE PERFORATED HOPEPIPE, SDR 15.5 (DIA. ASSHOWN ON PLAN)
3/4" CRUSHEDSTONE
12" SAND
80 MILHOPE FML
8 OZ. FILTERFABRIC
24" CLAY
12" SAND80 MIL.HDPE FML
12" CLAY3/4" CRUSHEDSTONE
12" SAND
6" SPECIAL FILL
PRIMARYLCRANDCOMPOSITE LINER
SECONDARY LCRAND COMPOSITE
LINER
FAILUREDETECTION
12"MIN.

mill wastewater treatment plants. The fre-quency of placement of intermediate coverdepends on the characteristics of the materialbeing landfilled but is typically required to beplaced on any portion of the landfill if it is tobe inactive for 60 or more days. The thick-ness of intermediate cover is typicallyrequired to be no less than 12 inches.
Final Cover and/or CapWhen a landfill, or a discrete segment of alandfill, has reached capacity, it must be
"closed" in accordance with applicable regu-lations. Typically, a constructed "cap" isrequired, an example of which is illustratedin Figure 9-3. The primary purpose of thecap is to stop the formation of leachate bypreventing rainwater or other precipitationfrom being able to percolate into the land-filled waste. Therefore, the design objective isto provide an impermeable barrier that isable to dissipate methane and other gasesinto the ambient air, thus preventing anexplosion or fire hazard from developing.
SUPPLEMENTARY DRAINAGE PIPE6H PERFORATED HDPE WITHGEOTEXTILE FABRIC WRAP
EROSION CONTROL BLANKET(ALL SLOPES WITHOUT RIPRAP)
SEED
6" TOPSOIL
18'SELECTBORROWNORTH OF MASON DIXON LINE
12" SELECT BORROWSOUTH OF MASON DIXON LINE
GEOTEXTILE A WITHSEWN SEAMS
12" DRAINAGE SAND TEXTUREDLLDPEGEOMEMBRANE
24" BARRIER SOIL LIFT 2=6"
LIFT 1=12"
MIN. 9" GAS TRANSMISSION SAND
SOLID WASTE COMPLETELY COVER COMPACTEDWASTE WITH BASE COVER SOIL(DEPTH VARIES)
Figure 9-3 Typical cover section for a landfill.

As shown in Figure 9-3, it is first necessaryto completely cover the (compacted) wastewith soil of approved characteristics. Thisfirst layer is the base cover soil. Normally, aminimum thickness of 12 inches is required.
The base cover soil is then overlain with alayer of sand, 9 to 12 inches thick. The pri-mary purpose of this layer is to collect meth-ane and other gases that are generated withinthe wastes as a result of microbiological orother activity, and to provide for free flow ofthe gas to the pipe grid that constitutes thegas collection and relief system. The objectiveof the combined sand layer and pipe grid isto allow generated gas to pass continuouslyinto the ambient air and not build upbeneath the impermeable cap. Therefore, thegas transmission sand must be clean andproperly graded (high uniformity coeffi-cient) so as to have high gas conductivity.
Above the layer of gas transmission sand isplaced a two-foot layer of "barrier soil." Thebarrier soil is placed in three lifts, the first of12-inch thickness, the second and third of 6inches each. This layer of soil is then overlainwith a synthetic, impermeable membrane.The primary purpose of the combined bar-rier soil-synthetic membrane system is toprevent water from any source from perco-lating down through the landfilled waste. Ifthe cap is successful, leachate formation willcease.
What is placed on top of the impermeablemembrane system should support thegrowth of grass and conduct away rainwaterand water from any other source. In order tosupport the growth of grass, the system con-structed over the top of the impermeablemembrane must be able to allow rainwater topercolate through it and then be collectedand carried harmlessly off the site. To thisend, the synthetic membrane is overlain witha 12-inch layer of "drainage sand." The pur-pose of the drainage sand is to provide aneasy flow path for the percolated water toreach the drainage piping network. Thedrainage pipes then conduct this water to thestormwater collection and retention system
so as to prevent erosion or other harmfulactivity.
Above the drainage sand is a geotextilesheet, and above that is a 12- to 18-inch layerof common borrow. The geotextile preventspercolating water from carrying fines fromthe common borrow into the drainage sand,thus causing plugging. The purpose of thecommon borrow is to support the topsoilabove it in a way that helps the topsoil retainmoisture. If the topsoil were placed directlyon the sand, it would dry quickly and notsupport the growth of grass between periodsof rain events.
Topsoil is placed in a six-inch-thick layerover the borrow. It has been found to begood practice to place an erosion controlblanket over the topsoil before, or just after,seeding. The erosion control blanket is a fab-ric of synthetic or natural material thatresembles fine netting. It allows ready pene-tration of water and allows grass to grow upthrough it.
Gas VentingThe organic material that has been placed ina landfill will undergo anaerobic degrada-tion, with the consequent generation ofmethane, hydrogen, hydrogen sulfide, andother gases, possibly for many years. Explo-sions have occurred when one or more ofthese gases, principally methane, havemigrated through the soil and entered abuilding. To prevent such an occurrence, it isnecessary to provide for easy and continuousescape of these gases into the ambient air. Itis for this purpose that a well-designed andinstalled gas venting system is a necessarycomponent of a landfill or portion of a land-fill that has been closed and provided withfinal cover or an impermeable cap.
Figure 9-4 presents a drawing of a cross-section of a landfill cap, including a portionof the gas venting system. The standardinstallation procedure for a gas venting sys-tem is as follows. A grid system of trenches isexcavated a minimum of five feet into thefinal layer of deposited and compacted solid

waste material. Perforated plastic pipe, sixinches in diameter, is installed in each trench,surrounded by crushed stone. The crushedstone completely fills each trench, except forthe plastic pipe. The purpose of the crushedstone is to provide for ready migration of thegas generated in the landfill toward and intothe plastic (polyethylene [PE], in the caseshown if Figure 9-4) pipe. The purpose of theplastic pipe, of course, is to collect the gasand allow it to disperse into the ambient airvia the vertical vent pipes shown.
The mechanism of gas collection and dis-persion is accounted for by the low specificweight, compared with air, of the mix of
gases, which is predominantly methane.When the mixed gas reaches the vertical ventpipe, it rises, under the influence of gravity,thus creating a decrease in pressure (partialvacuum) behind it. This lowered pressuredraws gases within the solid waste masstoward and into the vent pipe system. Thesegases rise up the vent pipe and out the 90°bend, as shown, and the process perpetuatesitself.
In general, there are guidelines and regula-tions issued by each state or solid wasteauthority regarding the layout of the gas col-lection grid and the number and spacing ofvertical vents. Also, the characteristics of the
Figure 9-4 Cross-section of a portion of a landfill cap, showing a portion of gas venting system.
4 WAY CROSS FITTING
CAP OPEN ENDS (TYP.)
TEE FITTING
SOLID WASTE3' ENVELOPE OFCRUSHED STONE
SEE
NO
TE
5'M
IN.
(TYP.) GEOTEXTILEA
FOUR LENGTHS OF 6" PERFORATEDPEVENT PIPEAT RIGHT ANGLES
FERNCO COUPLER1070-66 OR EQUAL
MOUND SOILAROUNDVENT PIPE 6" MIN.ON UPHILL SIDE
TYPICAL COVER SECTION
WELD (TYP)
3" MIN.
LLDPE GEOMEMBRANEBOOT
6" SDR 17, HDPE PIPE
INSTALL INSECT SCREEN
2 - 90° BENDSVENT DOWNWARD
STAINLESS STEEL CLAMPS (2)AROUND GASKET
(Typ
.)
OV
ER
LA
P
6' M
IN.
6't
o 10
'

industrial solid waste that is landfilled mustbe taken into account regarding how readilygas can move through it to be collected by theventing system, when designing the system.
Stormwater ManagementThe objectives of stormwater management ata landfill site are to prevent runoff from con-tacting the landfilled waste material and toprevent erosion. Stormwater managementinvolves the use of berms, grading, catchbasins, a storm sewer system, and retentionbasins. Rip-rap-lined ditches and channelsare also used for stormwater managementand erosion control, during active use of thelandfill as well as after closure and capping ofthe landfill. There is always a slope to the capto prevent standing water at a minimum butusually as the result of placing the maximumpossible amount of waste in the landfill.
Rip-rap-lined ditches and channels areusually designed as an integral component ofthe final cover or cap for control of erosion.Detention basins are used to hold collectedstormwater for a period of time to allow sol-ids to settle out before discharge to thereceiving water body.
Essentially all solid waste managementfacilities, including transfer stations, inciner-ators, compost facilities, and certainly land-fills, should include a well-designed systemof groundwater sampling wells, sometimesreferred to as "sentinel wells," to detect theoccurrence of groundwater contamination.There should be at least one upgradient well,to show background or uncontaminatedgroundwater quality, and a sufficient numberof downgradient wells to detect contamina-tion from any reasonably possible location.The sentinel wells should be monitored, andrecords maintained, throughout the life ofthe facility, as well as for a reasonable periodof time after closure.
Discharges from LandfillsThere are two types of discharges from sani-tary landfills: liquid, in the form of leachate,
and gaseous, i.e., that which is dischargedfrom the vent system. Both are regulated byfederal and state statutes. In the case ofleachate, there are strict requirements to con-tain, collect, and treat it before ultimate dis-charge to the environment, which wouldnecessarily be either a surface water body orthe ground water.
Leachate is contained and collected by themandated landfill liner and leachate collec-tion system described above. Regardingtreatment, there are three alternatives: (1)traditional trucking or piping to the indus-trial facility's wastewater treatment plant orto a publicly owned treatment works(POTW), (2) treatment using a facilitydesigned specifically for the leachate, and (3)evaporating the leachate in a burner fueledby gas collected from the landfill. Of course,there is also the alternative of combining twoor more of these three alternatives. Forinstance, pretreatment facilities have beenused to render leachate from industrial solidwaste landfills compatible with either theindustrial facility's wastewater treatmentplant or a POTW. Alternative technologiesfor treating or pretreating landfill leachateare discussed in Chapter 7.
Regarding evaporation by use of a burnerfueled by gas from the landfill itself, Figure9-5 shows an example of a system that wasdeveloped for this purpose during the mid-1990s. Landfill gas (LFG), being primarilymethane, is fed in to the bottom of the com-bustion chamber shown on the right. Air isfed in very close to the gas inlet nozzle, so asto provide the correct quantity of oxygen forcomplete combustion of both the landfill gas(including the methane and the other gasessuch as hydrogen sulfide) and the vaporizedleachate, which enters this combustionchamber above the flame. A temperature of1,6000F, achieved in the combustion cham-ber, ensures complete destruction of VOCsor other hazardous substances from eitherthe landfill gas or the leachate.
The leachate is vaporized in the evapora-tion vessel shown on the left in Figure 9-5.Landfill gas enters the burner at the top of

Figure 9-5 Evaporation vessel (from White et al, 1996).
this vessel, and the hot gases from the burn-ing of the LFG are directed down and intothe leachate, which enters the evaporationvessel just outside the draft tube within thevessel. Evaporated leachate, plus completelyand incompletely oxidized LFG, exits the liq-uid surface within the draft tube and thenproceeds to the combustion chamber of theright. Those substances in the leachate thatwill not evaporate sink to the bottom of theevaporator vessel to form a concentrate,reportedly amounting to less than 5% of theoriginal leachate volume. This concentratemust be dealt with, and options includereturning it to the landfill. In order to dothis, however, the restrictions and provisionsof 40 C.F.R. 264.314 and 265.314 (solid wasteregulations) must be complied with.
Landfill gas discharges are regulated bySubtitle D (see Chapter 3) and the Clean AirAct, primarily to control greenhouse gasemissions. Methane is 21 times more potentin creating climate change than carbon diox-ide, on a carbon-to-carbon basis, accordingto the EPA. Moreover, it is the EPAs estimatethat 40% of the methane emitted to theatmosphere on a yearly basis is from activeand closed landfills. Consequently, the EPA
has been charged by Congress to enforcecontrols on methane emissions from land-fills. The result is an ever-increasing require-ment for landfill gas collection, with subse-quent management to minimize the effect onglobal climate change.
Gas collected from industrial waste land-fills usually requires a certain amount ofcleaning before use as fuel in a boiler or otherburner. Reasons for cleaning include the fol-lowing:
• Limiting pollutants released to theatmosphere
• Removing corrosive substances• Increase the fuel value in terms of BTUs
per cubic foot
Additionally, to limit emissions of NOx
and carbon monoxide (CO), it maybe neces-sary to use catalytic converters to removethese substances from postcombustion gas,as well as other technologies to addressVOCs, sulfur compounds, and silicon-basedcompounds. The latter have been the sourceof problems with the catalytic convertersused to control emissions of NOx and CO.
ConcentrateOut
30%Concentrate
Draft Tube
EvaporatorVessel
Leachate in
Gas Burner
Burner Combustion Air
LFG in
Downcomer
MistEliminator Combustion
LFG in
Oxidizer-Flare
T>1600°F
LegendLFG = Landfill GasTS=Total SolidsT=Temperature

Alternative LandfillsThe conventional modern landfill, withleachate containment, collection and treat-ment, and impermeable cap, is referred toafter closing as a "dry tomb." The combina-tion of impermeable cap, which preventsmoisture from reaching the landfilled mate-rial via percolating precipitation, and thelandfill liner system, which carries awayleachate resulting from the period of timewhen the landfill was active, ensures that thelandfill interior will be dry for a long periodof time. The dry conditions effectively pre-vent microbial activity. The advantage of thiscondition, of course, is that neither gas norleachate will be produced within the landfillin significant quantity. The disadvantage isthat the landfilled material will remain"entombed" for those many years. While thismay be a good thing regarding future recycleand reuse of some of the landfilled sub-stances, or for future beings from outer spaceto examine to reconstruct our civilization,there is a growing sentiment that, on balance,the disadvantages outweigh the advantages.
Probably the greatest disadvantage of thedry tomb approach is that the closed landfillremains a potential threat to the groundwa-ter for as long as it exists. Whenever theintegrity of the cap and liner are breached,for whatever reason—earthquakes, torna-does, accidents, or simply the passage oftime—water will reach the landfilled wastesand create leachate.
An alternative to the dry tomb approach isto manage the closed landfill to encouragemicrobial degradation of the landfilled mate-rial (i.e., manage the landfill as a biochemi-cal/chemical reactor). One way to do this isto continually recycle leachate back to the topof the landfilled wastes and to add water tothe leachate in order to keep the moisturewithin the landfill at a level that will result inmaximum gas generation. Then, the optionof collecting the gas for use as fuel is avail-able. The decision to manage an industrialwaste landfill as a biochemical/chemicalreactor, possibly for the purpose of generat-ing gas for fuel as well as to address the "time
bomb" problem where the landfill sits as athreat to groundwater pollution "in perpetu-ity" must be based in large part on the char-acteristics of the leachate. If hazardous sub-stances are in hazardous concentrations inthe leachate, the cost for proper (includinglegal) management becomes of overbearingimportance.
Solid Waste Incineration
There are many different types of incinera-tors, and several different conventions areused to classify them. One convention is toclassify incinerators as either "mass burn" or"refuse derived fuel" (RDF). Mass burn tech-nology involves combusting, as completely aspossible, all (combustible) substances in asolid waste stream. RDF systems attempt toseparate, by volatilization, as much of theorganic portion of a solid waste stream aspossible and then to clean and otherwiseprocess the resulting mixture of gases to pro-duce a low-, medium-, or even high-gradefuel. The remaining portion of the solidwaste stream (char and ash) is then disposedof or further processed and then disposed of.
Another convention used to classify incin-erators (or "combustors"—the terms inciner-ator and combustor are used synonymously)is based upon the equipment technologyitself. The following is a list of incineratortechnologies in use:
• Fluidized bed• Rotary kiln• Hearth-type• Liquid injection
Another convention is to classify incinera-tors as either "excess air" or "starved air," andstill another is to classify incineration sys-tems as either "hazardous waste incinerators"or "conventional waste incinerators."
Under any classification system, all incin-erators have certain characteristics in com-mon:
Next Page

Alternative LandfillsThe conventional modern landfill, withleachate containment, collection and treat-ment, and impermeable cap, is referred toafter closing as a "dry tomb." The combina-tion of impermeable cap, which preventsmoisture from reaching the landfilled mate-rial via percolating precipitation, and thelandfill liner system, which carries awayleachate resulting from the period of timewhen the landfill was active, ensures that thelandfill interior will be dry for a long periodof time. The dry conditions effectively pre-vent microbial activity. The advantage of thiscondition, of course, is that neither gas norleachate will be produced within the landfillin significant quantity. The disadvantage isthat the landfilled material will remain"entombed" for those many years. While thismay be a good thing regarding future recycleand reuse of some of the landfilled sub-stances, or for future beings from outer spaceto examine to reconstruct our civilization,there is a growing sentiment that, on balance,the disadvantages outweigh the advantages.
Probably the greatest disadvantage of thedry tomb approach is that the closed landfillremains a potential threat to the groundwa-ter for as long as it exists. Whenever theintegrity of the cap and liner are breached,for whatever reason—earthquakes, torna-does, accidents, or simply the passage oftime—water will reach the landfilled wastesand create leachate.
An alternative to the dry tomb approach isto manage the closed landfill to encouragemicrobial degradation of the landfilled mate-rial (i.e., manage the landfill as a biochemi-cal/chemical reactor). One way to do this isto continually recycle leachate back to the topof the landfilled wastes and to add water tothe leachate in order to keep the moisturewithin the landfill at a level that will result inmaximum gas generation. Then, the optionof collecting the gas for use as fuel is avail-able. The decision to manage an industrialwaste landfill as a biochemical/chemicalreactor, possibly for the purpose of generat-ing gas for fuel as well as to address the "time
bomb" problem where the landfill sits as athreat to groundwater pollution "in perpetu-ity" must be based in large part on the char-acteristics of the leachate. If hazardous sub-stances are in hazardous concentrations inthe leachate, the cost for proper (includinglegal) management becomes of overbearingimportance.
Solid Waste Incineration
There are many different types of incinera-tors, and several different conventions areused to classify them. One convention is toclassify incinerators as either "mass burn" or"refuse derived fuel" (RDF). Mass burn tech-nology involves combusting, as completely aspossible, all (combustible) substances in asolid waste stream. RDF systems attempt toseparate, by volatilization, as much of theorganic portion of a solid waste stream aspossible and then to clean and otherwiseprocess the resulting mixture of gases to pro-duce a low-, medium-, or even high-gradefuel. The remaining portion of the solidwaste stream (char and ash) is then disposedof or further processed and then disposed of.
Another convention used to classify incin-erators (or "combustors"—the terms inciner-ator and combustor are used synonymously)is based upon the equipment technologyitself. The following is a list of incineratortechnologies in use:
• Fluidized bed• Rotary kiln• Hearth-type• Liquid injection
Another convention is to classify incinera-tors as either "excess air" or "starved air," andstill another is to classify incineration sys-tems as either "hazardous waste incinerators"or "conventional waste incinerators."
Under any classification system, all incin-erators have certain characteristics in com-mon:
Previous Page

• All solid waste substances must be con-verted to the vapor state before they canbe ignited and burned.
• Two types of ash leave the system: fly ashand bottom ash. Both must be managedto prevent them from becoming envi-ronmental pollution problems. Incinera-tion is therefore regarded as a treatmentand volume reduction process, ratherthan a disposal process.
• Solid wastes almost always have to besubjected to a conditioning processbefore entering the combustion cham-ber. Conditioning may include one ormore of grinding, mixing, blending,dewatering, or other treatment.
Fluidized Bed TechnologyFluidized bed technology is considered tohave high potential for treating industrialwastes because of the capability of completecombustion and history of relatively low airemissions. Fluidized bed combustion can becombined with recovery of heat; therefore, ithas potential as a viable waste-to-energy(WTE) alternative, depending on the overallBTU value and moisture content of thewaste.
Fluidized bed incineration systems makeuse of a bed of sand or sand-like material thatis fluidized (suspended against the force ofgravity) by the drag force of air and othergases rising up through the bed, as illustratedin Figure 9-6. The bed is heated to incinera-tion temperature, which can range from6500C to more than 1,2000C (1,2000F to2,2000F or higher), depending on the charac-teristics of the waste. The heat content of thefluidized bed material, typically sand, pro-vides a substantial heat reservoir to maintaintemperature and combustion as new wastematerial is injected into the fluidized bed vol-ume. For instance, the heat content of thebed on a unit volume basis is about threeorders of magnitude greater than that of fluegas at the same temperature. Fluidized bedtechnology is used for hazardous as well asconventional solid wastes.
A generic fluidized bed combustor systemis illustrated in Figure 9-6(a). The character-istic component of a fluidized bed combus-tion system is the reaction chamber, illus-trated in greater detail in Figure 9-6(b). Fig-ure 9-6(b) shows that a grate supports thesand or sand-like bed material at the bottomof the primary combustion chamber. A cone-shaped collector-distributor beneath thegrate has the dual purpose of distributing airthat is blown into the section below the com-bustion chamber, as well as collecting inertsthat are not further combustible and tooheavy to be buoyed up by the rising air col-umn. The inerts are collected and removedfrom the lower chamber by a conveyor devicethat locks out air.
The air that is blown into the lower cham-ber is distributed evenly across the cross-sec-tion of the primary combustion chamber bythe cone-shaped collector-distributor. Thisair then rises up through the bed, supplyingoxygen for combustion and drag force to flu-idize the sand bed. The fluidized bed of sand(or sand-like material) fills most of the pri-mary reaction chamber. Waste materials arefed directly into the primary reaction cham-ber, along with auxiliary fuel, needed to startup the combustion process and to maintaindesired temperature, if necessary. Typically itis not necessary to supply auxiliary fuel tomaintain desired temperature while combus-tion is taking place, because the heat value ofthe organic solid wastes being incinerated ismore than enough for this purpose. In fact, itis usually necessary to supply excess air toprevent the temperature from rising toohigh, causing damage to the system.
As the waste is injected into the lower partof the fluidized bed within the combustionchamber, the heat from the sand grains firstgasifies the waste material and then ignites it.Complete combustion of this material fol-lows. The grains of sand are greatly agitatedby the column of air passing up through thebed, and this agitation has beneficial effects.The agitation tends to break up the heatedparticles of solid waste, enhancing the gasifi-cation process and resulting in quicker

Figure 9-6 (a) Fluidized bed combustor system (from Freeman © 1989; reprinted by permission of McGraw-Hill, Inc.).(b) Typical fluidized bed combustor (from Pope, 1999).
Bed Change-Out System ED. Fan (b)Tramp
BedMaterial
FuelStocker
UnderflreAir InletPlenum
CombustionAir
Over bedBurner
Drawdown
Cones
BucketElevator
FuelFeed
Nozzle
Overfire AirNozzle
Overfire AirPlenum
FluidizingNozzles andManifolds
Bed Material
Lower Vapor Space
Upper Vapor Space
Steel Shell,InsulationRefractory
Off Gas Flowto DownstreamDemand
Typical Fluidized Bed Combustor
Fluidizingair fan
Preheatburner
Largesterilizedinert s
Liquids andsludge-wastefeed tank
Fluidizedbed
Solid-wastefeed hopper
reactionchamber
Secondary
Dryash
Bed-recycleelevator
Packed-bedscrubber
(a)
Venturi
Hotcyclone
Induced-draft fan
Demister
Cleanoff gasQuench

ignition. The agitation also tends to abradethe bed material itself, and this tends to keepit clean. Without this self-cleaning action,the particles of bed material would tend tobecome coated with soot and other productsof the combustion of the solid waste mate-rial. The agitation also tends to mix andhomogenize the injected waste material,promoting faster and more thorough com-bustion. As the solid waste material under-goes combustion, liberated heat is trans-ferred back into the bed material (typicallysand) to perpetuate the gasification-igni-tion-combustion process.
The products of combustion rise out ofthe fluidized bed, toward the top of the reac-tor. Some systems have a secondary combus-tion chamber at this point to ensure com-plete destruction of the waste material. This,of course, is especially important when haz-ardous materials are being treated.
From the secondary combustion chamber,which may or may not have auxiliary fuelcapability, the products of combustion, alongwith the oxygen-depleted air stream, flowinto and through a system that cleans andcools them before discharge to the ambientair. The gas treatment devices included inthis system can include cyclones for collect-ing particulates; heat exchangers or quench-ers to lower the temperature; one or morepacked column scrubbers; activated carbonadsorbers; venturi scrubbers; or otherdevices. Chapter 8 presents discussionsregarding the mechanisms and uses of theseair pollution control devices.
Fluidized bed reactors are used in somewaste-to-energy (WTE) systems. In thesesystems, typically, only gasification takesplace in the fluidized bed reactor. The volatil-ized organic substances from this process areeither burned immediately in a boiler orother energy conversion device or are cap-tured and stored for later use. In some cases,the volatilized product (gases) from the flu-idized bed reactor are processed to removesubstances that degrade the fuel value; inother cases, other substances of highest fuelvalue are removed as a valuable by-product.
The remaining substances are then burned asa lower-grade fuel.
AdvantagesMany years of development and operatingexperience with fluidized bed combustorshave resulted in the following advantages,compared with other combustion systems fortreating solid wastes from industries:
• Air emissions are relatively low.• Generation of nitrogen oxides (NOx)
tends to be significantly less, due tolower excess air and lower temperatures.
• Low carbon monoxide (CO) emissionsdue to relatively quick and relativelycomplete combustion.
• Solids, liquids, and gases can all beburned simultaneously.
• Few moving parts are used.• Maintenance costs are relatively low.• The large surface area of bed grains and
waste particles enhances the gasification-ignition-combustion process.
• The large heat capacity of the bed toler-ates fluctuations in solid waste feed rate.
• The size of the facility is relatively small.• The high degree of agitation in the com-
bustion chamber practically eliminateshot spots and cold spots.
Disadvantages• There is a low tolerance for items such as
wire that get stuck in the grate.• Substances that tend to agglomerate can
plug up the sand bed.• Inerts are difficult to remove from the
bed if they are not heavy enough to fallthrough the grate against the air upflow.
Rotary Kiln TechnologyRotary kilns use an inclined cylinder as thecombustion chamber, which rotates slowly toaccomplish mixing of the materials and toattempt to expose all surfaces and substancesto oxygen within the chamber. Auxiliary fuel,mixed with air, can be injected into eitherend of the rotating combustion chamber or

at one or more injection nozzles along theside. Rotary kilns have been successfully usedto treat hazardous as well as conventionalwastes; solid, semisolid sludges, and liquids;alone or simultaneously. The kilns have beenoperated at temperatures as high as 1,5000C(3,0000F). Many rotary kiln combustors havebeen used to incinerate hazardous materialsat temperatures in the 1,1000C (2,0000F)degree range.
As with all incinerator technologies, resi-dence time, temperature, and quantity ofoxygen made available are important param-eters. Among other factors, residence time isinfluenced by the angle of incline, or slope, ofthe rotating combustion chamber and therate of rotation. The slope typically rangesfrom 0.02 ft/ft to 0.04 ft/ft. Speed of rotationranges from 0.5 revolutions per minute(rpm) to 3 rpm. Figure 9-7 illustrates charac-teristics of the rotation combustion chamber.Figure 9-8 illustrates a typical rotary kilnsolid waste incinerator system.
Figure 9-7 shows that the conditionedsolid waste is fed into the higher end of theinclined, rotating combustion chamber.Conditioning can include any or all of grind-ing, mixing, or dewatering. As the kilnrotates, the solid waste tumbles from the up-rotating side back toward the middle of thebottom of the cylinder. As the wastes tumble,they become heated, vaporize (gasify), mixwith oxygen, and ignite. They also progresstoward the lower end of the rotating combus-tion chamber. Finally, ash discharges fromthe lower end.
Figure 9-7(c), (e), and (f) also illustratesthat the auxiliary fuel-air mixture can beinjected into the combustion chamber atalternative locations, and that exhaust gasesexit at either (or both) the higher end or thelower end of the chamber.
Figure 9-8 is an example of a completerotary kiln incinerator system. As shown,after ignition, the gasified solid waste sub-stances burn in the upper portion of therotating cylinder (i.e., the combustion cham-ber), and the exhaust gases proceed to a post-
combustion chamber, sometimes referred toas the afterburner. The postcombustionchamber is the primary air pollution controldevice and is especially important if hazard-ous materials are contained in either thesolid waste stream or the products of com-bustion, or both. The postcombustion cham-ber is followed by a heat exchanger, which, inturn, is followed by a particle collector. Thecleaned exhaust gas is then discharged.
The heat exchanger is required to cool theexhaust gases in order to protect the particlecollector. It may also be the functional com-ponent of a waste-to-energy (WTE) system.In its simplest form, the heat exchanger canbe a water spray or radiator, to cause heat tobe wasted to the ambient air. In its most use-ful form, it can be a waste heat boiler or otherenergy conversion device.
The ash, of course, must be disposed of inan appropriate manner, and there are alter-natives to be evaluated. Landfilling in asecure facility designed and approved foreither "special" or "hazardous" solid wasteshas been most often used. Other alternativesinclude solidification with cement beforeburial, incorporation into asphalt, or solidifi-cation with epoxy.
Advantages• Proven technology, having been used for
incineration of many different industrialwastes over many years
• Flexible operation; the rate of rotationcan be varied to suit the needs of a largevariety of solid waste characteristics
• Has been used to incinerate solids, liq-uids, and gases, in any combination
• Requires less preparation (condition-ing) such as sorting, grinding, and mix-ing than certain other technologies
• Not subject to problems such as plug-ging of grates or from substances melt-ing before gasification
• Adaptable to many alternatives for airemission control, including quenchers,venturi scrubbers, wet gas scrubbers,

Axial movement through the reactor.
The slope of the kiln produces a slight forward movement toward the discharge end. (a)
MATERIAL IN
FEED RATEBULK DENSITYREPOSEANGLE
SIDE VIEW
REACTOR OR KILN
DIAMETERLENGTHSLOPE SRPMMATERIALCHARACTERISTICS
MATERIAL OUT
DISCHARGE RATEBULK DENSITYREPOSEANGLE
BED ANGLEDYNAMIC ANGLE
OF REPOSEBED HEIGHTBEDWIDTH
CROSS SECTIONKILNROTATION
LOAD FRACTION = % LOADINGAREA OF BED
TOTAL AREA OF KILN SECTION (b)
SOLIDFUEL AIRON
SOLID FUELAIR OFF
KILN LENGTH (C)TE
MPE
RA
TU
RE
Figure 9-7 Elements of a rotary kiln incinerator, (a) Axial movement through the reactor, (b) The kiln solids flow system;definition of terms, (c) Ported-kiln concept. (All from Freeman, © 1989; reprinted by permission of McGraw-Hill, Inc.)

electrostatic precipitators, and baghouses
• Provides mixing within the combustionchamber for exposure to heat and oxy-gen
• Can receive bulk containers in the feedstream
Disadvantages• Subject to formation of hot spots and
cold spots• High load of particulates on air pollu-
tion control devices• Relatively high capital cost
SHOULDER
TOE
ROTATION (d)
AIR
FUEL
KILN LENGTH (e)
AIR
AIR
AIR
AIR
FUEL
(f)KILN LENGTH
AIRAIR
Figure 9-7 Elements of a rotary kiln incinerator, (d) Solids flow in cross-section, (e) Primary burner concept, (f) Axialburner concept. (All from Freeman, © 1989; reprinted by permission of McGraw-Hill, Inc.)
TE
MP
ER
AT
UR
ET
EM
PE
RA
TU
RE

• High amounts of excess air lead to highdemand for auxiliary fuel
• Subject to damage to refractory lining ofkiln due to tumbling solids
Hearth Incinerator TechnologiesHearth incinerators are mass-burn systemsin which conditioned solid waste materialsare spread out on a (nearly) horizontal sur-face and burned. Auxiliary fuel is used forstartup and as necessary to maintain desiredtemperatures. In many cases, of course,excess air is used to maintain desired temper-atures. In these situations, the excess air pre-vents the burning solid wastes from develop-ing excessively high temperatures that woulddamage the combustion chamber and down-stream equipment.
The most common type of hearth inciner-ator is the multiple hearth incinerator, illus-trated in Figure 9-9. The multiple hearthincinerator system shown in Figure 9-9 hasfive hearths, stacked vertically. New, condi-tioned, solid waste is fed onto the uppermosthearth, where hot gases from materials burn-ing on lower hearths heat the new material,volatilizing water and the most volatile of theorganic materials in the solid waste stream. A
system of rakes slowly forces the wastestoward the middle of the uppermost hearth,and down through a passageway to the nextlower hearth. The temperature on this hearthis much higher, and active combustion takesplace. The rake system forces burning wasteson this hearth toward the outside, then downonto the next lower hearth, and so on, untilthe residual ash is raked from the lowesthearth to a collection and transport devicethat removes the ash from the combustionchamber.
As the solid wastes burn on the middlehearths, the gaseous products of combustionflow up to heat materials on the hearthsabove; then they exit the combustion cham-ber and pass through one or more devices toeither finish off combustion, especially oftoxic or otherwise hazardous substances, orto clean the exhaust gas stream of other emis-sions such as particulates, SOx, malodorousgases, or other substances. In the case ofcompleting the combustion process, a sec-ondary combustion chamber (or "postcom-bustion chamber" or "afterburner") with itsown fans and auxiliary fuel system can beused. In the case of cleaning the exhaust gasesbefore release to the ambient air, alternativeprocesses include a quenching system to cool
Figure 9-8 Hazardous waste incinerator system (from Freeman, © 1989; reprinted by permission of McGraw-Hill, Inc.).
ROTARY KILN
FUEL
CONTAMINATEDWASTE INPUT
POST-COMBUSTIONCHAMBER
EMERGENCYRELIEF
HEATEXCHANGER
PARTICULATECOLLECTOR
EXHAUST GASDISCHARGE
ROTARY COOLER& MOISTURIZER
DECONTAMINATEDSOLID WASTE

the exhaust gases to prevent damage to par-ticulate collection devices; the particulatecollection devices themselves; electrostaticprecipitators; and various types of wet scrub-bers.
Advantages• Useful when the water content of the
solid waste stream is relatively high• Extensive operating history with conven-
tional (nonhazardous) wastes
Disadvantages• Lack of sufficient control for use with
hazardous wastes• Subject to formation of cold spots and
hot spots• Occupies relatively large area
Modular SystemsA variety of incinerator systems available forindustrial use are referred to as "modular"because they are assembled in sections at the
Figure 9-9 Typical multiple hearth incinerator (from Metcalf and Eddy, © 1991; reprinted by permission of McGraw-Hill,Inc.).
Ash pump Ashhopper
Cooling air
To disposal
Makeup water
Fly ashslurry
Cyclonic jetscrubber Grease
skimmings
Induced draft fan
Filter cakescreenings
and grit
Floating damper
Bypass on poweror water stoppage
Clean gases toatmosphere
Waste cooling airto atmosphere

factory for final assembly on site. Some arecompletely mobile after assembly. The prin-cipal advantage of modular combustor sys-tems is lower cost due to preassembly underfavorable conditions at the factory.
Starved Air TechnologiesStarved air technologies, which includepyrolysis technologies, have been used as thefirst step in a two-step system for processingboth hazardous and conventional industrialsolid wastes. In this first step, the solid wastesare heated in a low-oxygen atmosphere toaccomplish volatilization of all componentsexcept char and ash. Then the volatilizedmaterial is burned, as in a conventionalincinerator. At some facilities, the volatilizedsubstances are processed to recover one ormore components before the rest is inciner-ated. The volatilization process is carried outat significantly lower temperatures than areused for more conventional incinerationtechnologies, with the advantage that equip-ment life is prolonged and maintenance costsare lower. More important in the case of haz-ardous materials, however, is the fact that theincineration step can be carried out undervery precisely controlled conditions, sinceonly gases are being handled in the combus-tor phase of the system.
The generally accepted definition ofpyrolysis is chemical decomposition by heat-ing in the absence of oxygen. Some of thestarved air industrial waste treatment sys-tems do not fit this definition, since they arecarried out in atmospheres of up to 2% oxy-gen by volume (compared with 21% inambient air). However, there are systems inoperation that are called pyrolysis systems,even though "gasification" or simply "starvedair" would be more appropriate.
Figure 9-10 is an example of a solid wastestarved air system. In Figure 9-10, the condi-tioned, wet solid wastes enter the dryer,which uses recovered heat from the combus-tion of waste materials downstream in the
same system. The dryer solid wastes arestored for a period of time (approximatelyone day) and then fed into the gasificationchamber, which is maintained within a tem-perature range of 425°C to 7500C (8000F to1,4000F). Residence times within the gasifi-cation chamber depend on the characteristicsof the material in the waste stream. Forinstance, chemical makeup and particle size,as well as bed thickness, all have a significanteffect on residence time. Typical residencetimes are as short as two minutes and as longas five hours. The concentration of oxygen inthe gasification chamber is maintained nearzero. Gasification chambers are maintainedunder slightly negative pressure to preventrelease of fugitive gases.
After completing the required residencetime in the gasification chamber, the nonvol-atilized solids (char and ash) are removedand are either further processed or landfilled.Further processing can be by high tempera-ture incineration (to further burn the char)or by solidification and stabilization usinglime, cement, epoxy, asphalt, or other sub-stance; chemical oxidation; or other process.The volatilized material can proceed toincineration in a one- or two-stage combus-tor or, preferably, to a cleaning and condi-tioning process for the preparation of a fuelof reasonably high value. This fuel can beburned on site or off site in a gas engine, itcan be used in a gas turbine to generate elec-tricity, or it can be burned in a boiler to gen-erate heat or steam to generate electricity. Inthe case of the system illustrated in Figure9-10, the heat given off by the combustingvolatilized gas stream is recovered and usedto dry incoming solid wastes as the first stepin the system.
It is also possible to separate by condensa-tion and thus recover certain components ofthe volatilized gas stream. Some of these sub-stances have considerable value, represent-ing a source of cost recovery for the system asa whole.

Another significant advantage of thestarved air process is that it results in a charor ash that is concentrated in potentiallyvaluable nonvolatile substances, such as met-als. For instance, solid waste streams thatcontain a significant quantity of lead and/orzinc can cause problems in conventionalcombustors, because at normal incineratortemperatures lead and zinc and certain othersubstances can volatilize and cause fouling ofheat exchangers and spalling of the refractorylinings of the combustion chamber.
Advantages• The volatilized gas stream can be used as
fuel for engines, turbines, or burning.• Valuable substances such as lead and
zinc can be recovered from the char andash residue.
• The vapor stream can be processed torecover substances of value.
• Lower temperatures lead to longerequipment life and lower maintenancecosts.
• Process control is relatively easy, becausethe gasification process is endothermic.There is no danger of self-overheating.
Disadvantages• One disadvantage of starved air technol-
ogies is that the process takes place in areducing atmosphere, with the resultthat the products are highly corrosive.Therefore, the materials of constructionare relatively expensive.
• In the case of certain highly toxic solidwaste streams, carcinogenic substancesare sometimes generated. This problemmay require construction and operationof very highly reliable and effective vola-tilized gas stream incineration.
Design ConsiderationsThere are choices to make regarding the tech-nology to employ for the gasification step, aswell as the subsequent processing and ulti-mate disposal of the volatilized gas stream,and the solid residuals. The gasification step
Figure 9-10 Battell gasification process (from Niessen, 1996).
DailyStorage
Wet FeedMaterial
Baghouse
Dryer
Product HeatRecovery
Waste HeatRecovery
CycloneSeparators
GasifierSurgeTanks Combustoi Sand
Make-up
Ash
AshRecoveryCyclone
Inert GasSystem
Medium ProductGas Btu
Scrubber
CoolingWater
Wastewater
CondensedOrganics
Steam or Recycled Product Gas
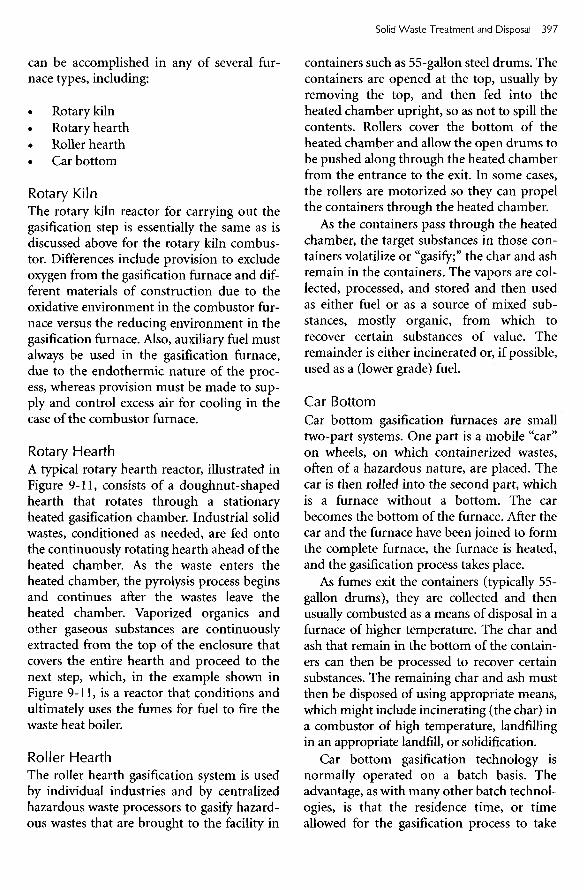
can be accomplished in any of several fur-nace types, including:
• Rotary kiln• Rotary hearth• Roller hearth• Car bottom
Rotary KilnThe rotary kiln reactor for carrying out thegasification step is essentially the same as isdiscussed above for the rotary kiln combus-tor. Differences include provision to excludeoxygen from the gasification furnace and dif-ferent materials of construction due to theoxidative environment in the combustor fur-nace versus the reducing environment in thegasification furnace. Also, auxiliary fuel mustalways be used in the gasification furnace,due to the endothermic nature of the proc-ess, whereas provision must be made to sup-ply and control excess air for cooling in thecase of the combustor furnace.
Rotary HearthA typical rotary hearth reactor, illustrated inFigure 9-11, consists of a doughnut-shapedhearth that rotates through a stationaryheated gasification chamber. Industrial solidwastes, conditioned as needed, are fed ontothe continuously rotating hearth ahead of theheated chamber. As the waste enters theheated chamber, the pyrolysis process beginsand continues after the wastes leave theheated chamber. Vaporized organics andother gaseous substances are continuouslyextracted from the top of the enclosure thatcovers the entire hearth and proceed to thenext step, which, in the example shown inFigure 9-11, is a reactor that conditions andultimately uses the fumes for fuel to fire thewaste heat boiler.
Roller HearthThe roller hearth gasification system is usedby individual industries and by centralizedhazardous waste processors to gasify hazard-ous wastes that are brought to the facility in
containers such as 55-gallon steel drums. Thecontainers are opened at the top, usually byremoving the top, and then fed into theheated chamber upright, so as not to spill thecontents. Rollers cover the bottom of theheated chamber and allow the open drums tobe pushed along through the heated chamberfrom the entrance to the exit. In some cases,the rollers are motorized so they can propelthe containers through the heated chamber.
As the containers pass through the heatedchamber, the target substances in those con-tainers volatilize or "gasify;" the char and ashremain in the containers. The vapors are col-lected, processed, and stored and then usedas either fuel or as a source of mixed sub-stances, mostly organic, from which torecover certain substances of value. Theremainder is either incinerated or, if possible,used as a (lower grade) fuel.
Car BottomCar bottom gasification furnaces are smalltwo-part systems. One part is a mobile "car"on wheels, on which containerized wastes,often of a hazardous nature, are placed. Thecar is then rolled into the second part, whichis a furnace without a bottom. The carbecomes the bottom of the furnace. After thecar and the furnace have been joined to formthe complete furnace, the furnace is heated,and the gasification process takes place.
As fumes exit the containers (typically 55-gallon drums), they are collected and thenusually combusted as a means of disposal in afurnace of higher temperature. The char andash that remain in the bottom of the contain-ers can then be processed to recover certainsubstances. The remaining char and ash mustthen be disposed of using appropriate means,which might include incinerating (the char) ina combustor of high temperature, landfillingin an appropriate landfill, or solidification.
Car bottom gasification technology isnormally operated on a batch basis. Theadvantage, as with many other batch technol-ogies, is that the residence time, or timeallowed for the gasification process to take

place, can be extended for as long as neededfor the process to go to completion.
In the United States, there are two inciner-ator technologies in wide use for treatment(volume reduction and characteristic trans-formation) of two classifications of solidwastes. The two incinerator technologies arehearth incinerators and rotary kiln incinera-tors. The two classifications of solid wastesare hazardous and conventional. Of all incin-erators in use for all purposes, those based onliquid-injection technology account forabout half, but they are not used for inciner-ating solid wastes.
Generally, incinerators for hazardous mate-rials are required to maintain significantlyhigher temperatures in the combustion cham-ber than are incinerators for conventionalwastes. For this reason, hazardous waste incin-erators are required to be built using moreexpensive materials and techniques.
The Process of CompostingIndustrial Wastes
Some industrial solid wastes are amenable tocomposting as a treatment process to prepare
the waste for future use as a soil conditioner.Typically, these solid wastes are close to 100%organic in composition, are readily biode-gradable, contain no hazardous materials,contain a moderate amount of moisture, andcan be handled with conventional equipmentsuch as front-end loaders and belt conveyors.The basic composting process is illustratedschematically in Figure 9-12.
As illustrated in Figure 9-12, microorgan-isms use the organic material within a pile ofmixed solid wastes for food. Initially, thetemperature will be close to the temperatureof the ambient air, and oxygen present in theair will occupy the void spaces between thesolid waste materials. Also, there must beenough moisture present for the microor-ganisms to live in. Bacteria can live only in anaqueous environment and can metabolizeonly substances that are dissolved in water.As the bacteria and other microorganismsmetabolize the food dissolved in the mois-ture content of the compost pile, heat is gen-erated. The source of the heat is as follows: asthe microorganisms disassemble the pro-teins, carbohydrates, lipids, and other mate-rials that make up the solid wastes in the
Figure 9-11 Rotary hearth pyrolyzer (from Freeman © 1989; reprinted by permission of McGraw-Hill, Inc.).
Waste-heat boilerRich-fume reactor
and dwell chamberCombustion air blower
Refractory ductworkRotary-hearth furnace
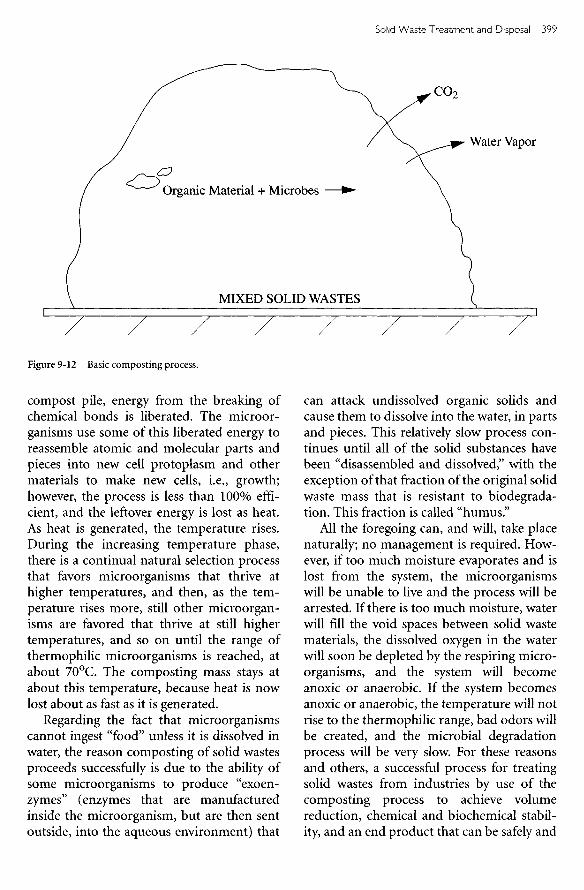
Figure 9-12 Basic composting process.
compost pile, energy from the breaking ofchemical bonds is liberated. The microor-ganisms use some of this liberated energy toreassemble atomic and molecular parts andpieces into new cell protoplasm and othermaterials to make new cells, i.e., growth;however, the process is less than 100% effi-cient, and the leftover energy is lost as heat.As heat is generated, the temperature rises.During the increasing temperature phase,there is a continual natural selection processthat favors microorganisms that thrive athigher temperatures, and then, as the tem-perature rises more, still other microorgan-isms are favored that thrive at still highertemperatures, and so on until the range ofthermophilic microorganisms is reached, atabout 7O0C. The composting mass stays atabout this temperature, because heat is nowlost about as fast as it is generated.
Regarding the fact that microorganismscannot ingest "food" unless it is dissolved inwater, the reason composting of solid wastesproceeds successfully is due to the ability ofsome microorganisms to produce "exoen-zymes" (enzymes that are manufacturedinside the microorganism, but are then sentoutside, into the aqueous environment) that
can attack undissolved organic solids andcause them to dissolve into the water, in partsand pieces. This relatively slow process con-tinues until all of the solid substances havebeen "disassembled and dissolved," with theexception of that fraction of the original solidwaste mass that is resistant to biodegrada-tion. This fraction is called "humus."
All the foregoing can, and will, take placenaturally; no management is required. How-ever, if too much moisture evaporates and islost from the system, the microorganismswill be unable to live and the process will bearrested. If there is too much moisture, waterwill fill the void spaces between solid wastematerials, the dissolved oxygen in the waterwill soon be depleted by the respiring micro-organisms, and the system will becomeanoxic or anaerobic. If the system becomesanoxic or anaerobic, the temperature will notrise to the thermophilic range, bad odors willbe created, and the microbial degradationprocess will be very slow. For these reasonsand others, a successful process for treatingsolid wastes from industries by use of thecomposting process to achieve volumereduction, chemical and biochemical stabil-ity, and an end product that can be safely and
MIXED SOLID WASTES
Organic Material + Microbes
Water Vapor
CO2

beneficially disposed of requires a highdegree of management.
Regarding the temperature within thecomposting mass, there are two major bene-fits to achieving and maintaining a thermo-philic condition (about 700C). The first isthat microbial degradation takes place veryfast. In general, the rate of microbial metabo-lism doubles for each 100C rise in tempera-ture. The benefit to solid waste treatment, ofcourse, is a shorter time required to reach astable condition. Organic material that hasbeen biologically stabilized will not undergosignificant further biodegradation, andtherefore will not become an odor or othernuisance or health problem. The secondmajor benefit of achieving and maintainingthe thermophilic range for a significantperiod of time is that pathogenic organisms,including bacteria and viruses, are killed.This is especially important if human wastes,usually in the form of sludge from wastewa-ter treatment facilities, are included in themix of solid wastes. In the context of treatingsolid wastes from industries, this ability tokill pathogens may or may not have value.What is always of value, however, is the abil-ity of the composting process to produce astable, inoffensive, useful product from aputrescible material that is inherently a dis-posal problem. Since sludge from industrialwastewater treatment systems is one of theindustrial waste candidates for treatment bycomposting, and since toilet wastes may betreated along with processing wastewaters ata given industrial plant, the ability to killpathogens obviously has value in someindustrial situations.
It is often beneficial to mix fresh solidwastes with a bulking agent, such as woodchips, at the start of the composting process.The bulking agent does not necessarilybecome involved in the composting processitself; that is, the bulking agent does not nec-essarily undergo biological degradation.Rather, the bulking agent helps to providespaces for air to reside, thus providing oxy-gen for microbial respiration as well as chan-nels for air to move from outside the com-
posting mass to the inner spaces where oxy-gen is being depleted. In some cases, fullycomposted product from the process is used.When an agent other than the compost itselfis used for bulking, it may or may not be sep-arated from the finished product for reuse.Sometimes it is left in the composted productto enhance the desirability and value of theproduct for certain uses. In other cases it isseparated from the final product by screen-ing, stored, and then used again with newbatches of solid wastes.
Because of the continual depletion of oxy-gen, it is necessary to continually renew theoxygen supply by providing fresh air to theentire composting mass. This is accom-plished by either turning and fluffing up thecomposting mass periodically or by blowingor drawing air through it. Also, if the mois-ture content becomes too low because ofevaporation, it is necessary to add moremoisture by spraying or other means.
It is important to maintain the oxygencontent in the void spaces within the com-posting mass between 5% and 15% by vol-ume (compared with about 21% in ambientair). Less than 5% will possibly allow localpockets of anaerobic or anoxic conditions todevelop, leading to an odor problem. Morethan 15% is indicative of overaeration, withconsequent inability of developing tempera-tures in the thermophilic range.
Moisture content must also be maintainedwithin a favorable range, but that range iswaste-specific. It is best determined throughexperience. The proper procedure is to con-duct, first, bench-scale laboratory tests, fol-lowed by a pilot-scale program. Once anoptimal range of moisture is determined byuse of these studies, the initial compost proc-ess is set up and then observed closely andcompared with the pilot-scale results. Theobjective is to reach thermophilic tempera-tures within a few days and to achieve com-plete composting within 14 to 28 days.
It is, in some cases, good practice, and inother cases, absolutely necessary, to grind thesolid waste material before composting.Grinding has the beneficial effects of greatly

increasing the surface area of the organicsubstances, thus enhancing the compostingprocess and rendering the material more eas-ily mixed with the bulking agent. Grindingalso produces more uniform moisture con-tent throughout the solid waste material.Mechanical grinders for this purpose areavailable from several vendors.
There are three general technologies usedin the United States for composting: wind-row, static pile, and mechanical. Windrowcomposting typically makes use of a verylarge, specialized mobile machine that strad-dles a windrow of composting solid wastesand works it over by fluffing and turning thewindrow. Static pile technology also typicallymakes use of a windrow or other type of pileand uses a blower to either maintain a partialvacuum within the pile, to cause air to flowfrom the ambient air into the pile, or to blowair out through the pile.
Windrow Composting TechnologySolid wastes to be composted by the windrowmethod are first mixed to produce a reason-ably uniform composition, so that the timerequired for complete composting will beclose to the same throughout the windrow.
In some cases a grinding procedure usingspecially made solid waste grinders eitherprecedes or follows the mixing procedure.Next, the mixture is processed to adjust themoisture content to the desired range; then,typically, the composting material is mixedthoroughly with a bulking agent such aswood chips or previously composted mate-rial. The next step is to arrange the mixturein a windrow using a front-end loader orother machinery. The windrows are 5 to 7feet high and are 10 to 20 feet wide at thebase. Figure 9-13 is an illustration of typicalwindrow dimensions. About once per day orin some cases more often, the windrowmachine travels the length of the windrows,mechanically works over the compostingmaterial, and, in some cases, blows air into it.The objective of working over or turning thecomposting material is to expose new por-tions of the mass to the open air, thus renew-ing the oxygen supply. As explained previ-ously, it is necessary to maintain an averageoxygen concentration in the void spaces of5% to 15% by volume (compared with 21%in ambient air) to prevent odor problems aswell as to enable the composting mass tomaintain a temperature in the thermophilic
Figure 9-13 Dimensions of typical windrows (from MSW Management, 1996).

as 28 days), after which the finished compostis stirred and allowed to "cure" for severalweeks or months. During curing the micro-bial population reduces and stabilizes byadjusting itself to a food-poor environment.Normally, minor odor problems that mayhave existed at the end of the compostingprocess disappear during the curing process,as the remaining species of microbes con-sume whatever is the source of the minorodors.
Static Pile TechnologyStatic pile technology makes use of a systemthat sucks air through the composting massby drawing a vacuum at the bottom of thepile. This method, originally developed inthe mid-1970s to treat sludge from sewagetreatment plants, is illustrated in Figure 9-15.
As shown in Figure 9-15, a grid of perfo-rated pipes supported on the top surface of aconcrete pad is connected to a blower. Thesolid waste to be composted is piled over thepipe grid after first undergoing conditioningby grinding and mixing with the bulkingagent. Then the pile is covered to insulate itand thus enable the temperature to build upto the thermophilic range. The compostingprocess begins immediately, due to the pres-ence of both bacteria and food; therefore, airflow should begin immediately to prevent thedevelopment of an odor problem. Theblower draws air through the compostingmaterial from the outside in to maintain theproper concentration of oxygen within thevoids in the composting material, as dis-cussed above. Standard procedure is to dis-charge the exhaust air from the blower into apile of finished compost, to filter out fineparticulates and to control minor odors.
Mechanical Composting TechnologyMechanical composting technology involvesthe use of a container and mechanical stir-ring equipment. The solid waste is first con-ditioned by grinding and mixing with a bulk-ing agent, as described for the windrow and
Figure 9-14 Windrow composting machine (courtesy ofScarab Manufacturing).
range. Figure 9-14 illustrates a windrowmachine.
A large compost facility in Puyallup,Washington, has modified the windrowturning machine to include a 10,000-gallonwater tank for the purpose of adjusting themoisture content of the composting mass.This facility uses grass clippings, picked upcurbside throughout the city, as a bulkingagent. Because the grass clippings have a ten-dency to settle and mat, it is necessary toblow (rather than draw) additional airthrough the composting mass to reestablishporosity and thus proper oxygenation. Theextra air, moved by use of three 50-horse-power centrifugal blowers, removes toomuch moisture from the composting mass,thus the need for the water tank.
Other problems unique to the compostingof a given solid waste or use of a given bulk-ing agent or other additive can often besolved by taking advantage of simple con-cepts. As another example, in Rockland,Maine, a compost facility that was used toconvert fish processing wastes to a soil condi-tioning agent made use of leather buffingdust (similar to sawdust, but of almost zeromoisture content and also a troublesomeindustrial solid waste) to adjust from toohigh a moisture content to the optimumrange.
The composting process is normally com-plete in 14 to 21 days (in some cases, as long

static pile technologies. Then, the mixture isplaced in the container-stirring system,which maintains even distribution of oxygen,temperature, and moisture while the com-posting process is taking place.
Two variations of mechanical compostingtechnology are the rotating drum system andthe vertical system. As it is now used, therotating drum system is a "precomposting"process or, more accurately a "compost start-ing" system. The conditioned (ground andmixed with bulking agent) solid waste isplaced in one end of an inclined, rotatingdrum, which may or may not have additionalmechanical devices inside to enhance mix-ing. The rotating of the drum mixes the com-posting material and brings about evenly dis-tributed temperature and moisture. Therotation action also accomplishes aeration ofthe composting mass, by rolling the com-posting mass in an atmosphere of ambientair.
After two to five days, the partially com-posted material exits the lower end of therotating drum. The composting process canbe finished by use of either windrow technol-ogy or static pile technology. The value of therotating drum process is that it significantlyreduces the total time required for complet-ing the composting process.
A second mechanical composting technol-ogy is referred to as a "vertical process." Thistechnology makes use of large silos or binsthat are maintained full of composting mate-rial, which is continually moving from thetop to the bottom. Composted product isharvested from the bottom and is replacedwith conditioned (ground and mixed with abulking agent and, in some instances, car-bonaceous material) solid waste at the top.Air is blown through, usually from the bot-tom to the top, to maintain the correct (5%to 15% by volume) oxygen content withinthe gas phase in the vertical composter. Theoxygen content, as well as temperature andmoisture content, are monitored by use ofsampling ports in the side of the verticalcomposter. The principal advantage of thistechnology, then, is the capability to closelymonitor and control the progress of the com-posting process.
Additional Considerations
NutrientsDepending on the nitrogen and phosphoruscontent and other nutrient levels of theindustrial solid waste, the nutrient content ofthe compost may be a significant benefit asfertilizer in the conventional sense. Some
Figure 9-15 Composting with forced aeration (from Corbitt © 1999; reprinted by permission of McGraw-Hill, Inc.).
Screenedcompost Woodchips
and sludgePerforatedpipe
Water trapfor condensates
Filter pilescreened compost
Exhaust fan

Figure 9-16 Containment for odor control.
nitrogen is lost during the composting proc-ess, however. Conversely, some industrialsolid wastes might be suitable candidates forcomposting as a treatment process, but theylack adequate nutrients. In these cases, itmight be cost effective to add nutrients suchas nitrogen and phosphorus, probably in theform of agricultural fertilizer. However, thecost of the fertilizer, added to the cost ofcomposting, minus the income from sale ofthe final composted product as a soil condi-tioner or other use, may be less than the costof disposing of the solid waste by use of analternate technology.
OdorsOne of the primary concerns expressed whencomposting is under consideration, is thepotential odor problem. The simple fact isthat almost all composting facilities experi-ence odor problems to some degree. The rea-son for the odors is simple: it is almost
impossible to maintain aerobic conditionsthroughout the entire composting mass at alltimes. When pockets of anoxic or anaerobicconditions develop, odors are produced.Whether or not the odors result in a problemdepends on how odor generation is managedand the odors that are actually generated.The most important management activity, ofcourse, is to do everything reasonably practi-cable to prevent odors from being generated.This comes down to managing the piles orwindrows to maintain optimum oxygen,temperature, and moisture conditions. Forthose odors that are generated despite allmanagement efforts, there are generally twocontrol strategies: (1) containment and treat-ment, and (2) "reodorization" (masking)before release.
Containment and treatment have beensuccessfully accomplished by conducting thecomposting process in an enclosure main-tained under a negative pressure. The
AirWetscrubber
Spraynozzles
Screenedcompost
Woodchipsand sludge
Header
Reservoirof deoderizingsolution
Figure 9-17 Dispensing system for odor-masking agent.

exhaust from the air withdrawal system istreated by a scrubber or flare. Figure 9-16illustrates the containment and treatmentapproach to odor management.
Reodorization, or "masking," can beaccomplished by using the same contain-ment facility illustrated in Figure 9-16 forcontainment and treatment. The difference isthat a masking agent is added to the exhauststream when needed. Another approach is toadd the masking agent to the air streamblown into the composting mass, if that isthe method used to manage the oxygen con-centration within the pile. There are a num-ber of masking agents used for this purpose,most of them proprietary. Still anotherapproach that has been successful is to use amisting system to dispense a masking agentonto the compost pile. Figure 9-17 illustratesa misting system that has been used success-fully to manage odor problems at compostfacilities.
Other candidates for application of com-posting technology for treating solid wastesfrom industry include meat processingwastes, feed lot wastes, vegetable processingwastes, and fish processing wastes.
Bibliography
Archinger, W. C , and L. E. Daniels. "An Eval-uation of Seven Incinerators." New York:Proceedings of National Incinerator Confer-ence. ASME, 1970.
American Society of Heating, Refrigerating,and Air Conditioning Engineers. ASHRAEHandbook and Product Directory. NewYork: 1977.
Baron, J. L. et al. Landfill Methane UtilizationTechnology Workbook. U.S. Department ofEnergy. CPE-8 101. Washington, DC:1981.
Baumeister, T. (ed.) Marks' Standard Hand-book for Mechanical Engineers. 8th ed.New York: McGraw-Hill, 1978.
Brunner, D. R., and D. J. Keller. "SanitaryLandfill Design and Operation." U.S.
Environmental Protection Agency ReportNo. SW65ts. Washington, DC: 1972.
Campbell, J. A. "Waste Fuel Densification:Review of the Technology and Applica-tion." Proceedings of the InternationalConference on Prepared Fuels and ResourceRecovery Technology. ANL/CNSV-TM-60.Argonne, IL: Argonne National Labora-tory, 1981.
Canter, L. W., and R. C. Knox. GroundwaterPollution Control. Chelsea, MI: Lewis Pub-lishers, 1985.
General Electric. Solid Waste Management:Technology Assessment. Schenectady, NY:1975.
Hasselriis, F. et al. "Eco-Fuel II: The ThirdGeneration." Proceedings of the Interna-tional Conference on Prepared Fuels andResource Recovery Technology. ANL/CNSV-TM-60. Argonne, IL: ArgonneNational Laboratory, 1981.
Hasselriis, F. Refuse Derived Fuel Processing.Woburn, MA: Butterworth Publishers,1984.
Hollander, H. L, and W. A. Sanders II. "Bio-mass: An Unlimited Resource." ConsultingEngineer 55 (1980).
Keitz, E. "Profile of Existing HazardousWaste Incineration Facilities and Manu-facturers in the United States." U.S. Envi-ronmental Protection Agency. EPA 600/2-84/ 052. Cincinnati, OH: 1984.
Lawrence Berkeley Laboratory. Characteriza-tion of Solid Waste Conversion and Cogen-eration Systems. U.S. Department ofEnergy. DOE/EV-0105. Washington, DC:1980.
Mitchel, G. et al. Small-Scale and Low-Tech-nology Resource Recovery Study. U.S. Envi-ronmental Protection Agency. Washing-ton, DC: 1979.
National Academy of Sciences of theNational Research Council. The Recoveryof Energy and Materials from Solid Waste.,Washington, DC: National AcademyPress, 1981.
National Center for Resource Recovery.Waste-to-Energy Compendium. DOE/CE/

20167-05. U.S. Department of Energy.Washington, DC: 1981.
Niessen, W. R., and S. H. Chansky. "TheNature of Refuse." Proceedings of NationalIncinerator Conference. New York: ASME1970.
Reilly, T. C , and D. L. Powers. "ResourceRecovery Systems, Part 2: Environmental,Energy and Economic Factors." In SolidWastes Management. New York: June 1980.
Risk Reduction Engineering Laboratory.Landfill Leachate Clogging of Geotextile(and Soil) Filters. EPA/600/2-91/025. Cin-cinnati, OH: 1991.
Schroeder, P. R., A. C , Gibson, J. M. Morgan,and T. M. Walski. The Hydrologic Evalua-tion of Landfill Performance (HELP) Model,Vol. 1—Users Guide for Version I (EPA/530-SW-84-009) and Vol. II—Documentationfor Version I (EPA/530-SW-84-010). U.S.Army Engineer Waterways ExperimentStation. Vicksburg, MS: 1984.
Schroeder, P. R. et al. "The Hydrologic Evalu-ation of Landfill Performance (HELP)Model." U.S. Environmental ProtectionAgency. U.S. Army Engineer WaterwaysExperiment Station. Vicksburg, MS: 1988.
Schroeder, R. L. et al. "Raytheon ServiceCompany Experience and Programs inResource Recovery." Proceedings of theInternational Conference on Prepared Fuelsand Resource Recovery Technology. ANL/CNSW-TM-60. Argonne, IL: ArgonneNational Laboratory, 1981.
Shepherd, K. R. "RDF Fuels in a Waste-to-Energy System—The Teledyne NationalExperience." Proceedings of the Interna-tional Conference on Prepared Fuels andResource Recovery Technology. ANL/CNSV-TM-60. Argonne, IL: ArgonneNational Laboratory, 1981.
Sommerlad, R. E. "Considerations AffectingDedicated Boiler Design for RefuseDerived Fuels (RDF)." Proceedings of theInternational Conference on Prepared Fuelsand Resource Recovery Technology. ANL/CNSV-TM-60. Argonne, IL: ArgonneNational Laboratory, 1981.
Tchobanoglous, G., H. Theisen, and R. Elias-sen. Solid Wastes: Engineering Principlesand Management Issues. New York:McGraw-Hill, 1977.
Theodore, L., and J. Reynolds. Introduction toHazardous Waste Incineration. New York:Wiley-Inter science, 1987.
Tittlebaum, M. E. "Organic Carbon ContentStabilization through Landfill LeachateRecirculation." Journal Water PollutionControl Federation 54, No. 5 (1982).
U. S. Environmental Protection Agency.Development Document for Proposed Efflu-ent Limitations, Guidelines, and Standardsfor the Landfills Category. EPA 821-R-97-022, Washington, DC: U.S. GovernmentPrinting Office, 1997.
U.S. Environmental Protection Agency."Interim Standards for Owners and Oper-ators of New Hazardous Waste Land Dis-posal Facilities." Code of Federal Regula-tions. Title 40, Part 267. Washington, DC:U.S. Governmental Printing Office, 1981.
U.S. Environmental Protection Agency.Development Document for Proposed Efflu-ent Limitations, Guidelines, and Standardsfor the Landfills Category. EPA 82 l-R-97-022. Washington, DC: U.S. GovernmentPrinting Office, 1997.
U.S. Environmental Protection Agency. Eco-nomic and Cost-Effectiveness Analysis forProposed Effluent Limitations, Guidelines,and Standards for the Landfills Category.EPA 821-B-97-005. Washington, DC: U.S.Government Printing Office, 1997.
U.S. Environmental Protection Agency. Envi-ronmental Assessment for Proposed EffluentLimitations, Guidelines, and Standards forthe Landfills Category. EPA 821-B-97-007.Washington, DC: U.S. Government Print-ing Office, 1997.
U.S. Environmental Protection Agency. Envi-ronmental Assessment for Proposed EffluentLimitations, Guidelines, and Standards forthe Landfills Category. EPA 821-B-97-007.Washington, DC: U.S. Government Print-ing Office, 1997.
U.S. Environmental Protection Agency.Guide to the Disposal of Chemically Stabi-
lized and Solidified Waste. SW-872. Cin-cinnati, OH: 1980.
U.S. Environmental Protection Agency.Handbook—Remedial Action at Waste Dis-posal Sites (revised). EPA 625/6-85/006.Washington, DC: U.S. Government Print-ing Office, January 1987.
U.S. Environmental Protection Agency. Pro-cedures Manual for Groundwater Monitor-ing at Solid Waste Disposal Facilities. EPA530/SW-61 1. Washington, DC: U.S. Gov-ernment Printing Office, 1977.
U.S. Environmental Protection Agency. Proc-ess Design Manual for Sludge Treatmentand Disposal EPA 625/1-74/006. Wash-ington, DC: 1974.
U.S. Environmental Protection Agency. Pro-tecting Health and Safety at HazardousWaste Sites: An Overview. TechnologyTransfer. EPA 625/9-85/006. Cincinnati,OH: 1985.
U.S. Environmental Protection Agency.Refuse-Fired Energy Systems in Europe: AnEvaluation of Design Practices, An Execu-tive Summary. Publication SW 771. Wash-ington, DC: U.S. Government PrintingOffice, 1979.
U.S. Environmental Protection Agency. Sta-tistical Support Document for ProposedEffluent Limitations, Guidelines, and Stan-dards for the Landfills Category. EPA 821-B-97-006. Washington, DC: U.S. Govern-ment Printing Office, 1997.
U.S. Environmental Protection Agency. Cen-ter for Environmental Research Informa-tion. Protection of Public Water Suppliesfrom Ground-Water Contamination. EPA625/4-85/016. Cincinnati, OH: 1985.
U.S. Environmental Protection Agency. Cen-ter for Environmental Research Informa-tion. Office of Research and Development.Requirements for Hazardous Waste LandfillDesign, Construction, and Closure. EPA/625/4-89/022. Cincinnati, OH: 1989.
U.S. Environmental Protection Agency.Office of Research and Development.Design and Construction of RCRA/CER-CLA Final Covers. EPA/625/4-91/025.
Washington, DC: U.S. Government Print-ing Office, 1991.
U.S. Environmental Protection Agency.Municipal Environmental Research Labo-ratory. Management of Hazardous WasteLeachate. SW-87 1. Cincinnati, OH: 1980.
U.S. Environmental Protection Agency.Office of Solid Waste and EmergencyResponse. Design, Construction, and Eval-uation of Clay Liners for Waste Manage-ment Facilities. EPA/530/SW-88/007F.Washington, DC: U.S. Government Print-ing Office, 1997.
U.S. Environmental Protection Agency.Office of Solid Waste and EmergencyResponse. Technical Guidance Document:Final Covers on Hazardous Waste Landfillsand Surface Impoundments. EPA/530-SW-89/047E Washington, DC: U.S. Govern-ment Printing Office, 1999.
U.S. Environmental Protection Agency. RiskReduction Engineering Laboratory. Cen-ter for Environmental Research Informa-tion. Office of Research and Development.Guide to Technical Resources for the Designof Land Disposal Facilities. EPA/625/6-88/018. Cincinnati, OH: 1988.
Velzy, C. O. "Energy from Waste Plants—AnOverview of Environmental Issues." Pre-sented at the Third U.S. Conference ofMayors/National Resource Recovery Asso-ciation Conference, Washington, DC,1984.
Velzy, C. O. "State of the Art of EmissionsControl." Presented at New York Academyof Sciences, New York, 1984.
Velzy, C. O. "The Enigma of IncineratorDesign." Incinerator and Solid Waste Tech-nology. New York: ASME, 1975.
Velzy, C. R., and C. O. Velzy, "Incineration,"Sec. 7. In Marks' Standard Handbook forMechanical Engineers. 8th ed. New York:McGraw-Hill, 1978.
Vence, T. D., and D. L. Powers, "ResourceRecovery Systems, Part 1: TechnologicalComparison." In Solid Wastes Manage-ment. New York: 1980.

Vesiland, R A., and A. E. Rimer. Unit Opera-tions in Resource Recovery Engineering.Englewood Cliffs, NJ: Prentice Hall, 1981.
Wilson, E. M. et al. Engineering and EconomicAnalysis of Waste to Energy Systems. U.S.Environmental Protection Agency. EPA-600/7-78-086. Washington, DC: 1978.

TO Wastes from Industries(Case Studies)
General
Wastes from industries include solid wastes,air pollutants, and wastewaters. These sepa-rate categories of wastes are regulated by sepa-rate and distinct bodies of laws and regula-tions. Solid wastes are regulated by RCRA,CERCLA, SARA, HSWA, and other federallaws and regulations, as well as certain statelaws and regulations. Air pollutants are regu-lated by the Clean Air Act (as well as other fed-eral and certain state laws and regulations).Wastewater discharges are regulated by theClean Water Act, as amended (as well as otherfederal and certain state laws and regulations).However, the three categories of wastes areclosely interrelated, both as they impact theenvironment and as they are generated andmanaged by individual industrial facilities. Asexamples, certain solid wastes handling, treat-ment, and disposal facilities are themselvesgenerators of both air discharges and waste-waters. Bag houses used for air pollution con-trol generate solid wastes; air scrubbers andother air pollution control devices generateboth liquid and solid wastes streams; andwastewater treatment systems generate slud-ges as solid wastes and release volatile organicsand aerosols as air pollutants.
The total spectrum of industrial wastes,then, must be managed as a system of inter-related activities and substances. Materialsbalances must be tracked, and overall costeffectiveness must be kept in focus. More-over, as discussed more fully in Chapter 4,the principles of pollution prevention mustbe implemented to the most complete extentpracticable. All wastes must be viewed aspotential resources. In some cases, wastes canbe used as raw materials for additional prod-
ucts, either on site or at other industrial facil-ities. In other cases, wastes can be used astreatment media for other wastes. In all cases,the generation of wastes must be minimizedby employment of scrupulous housekeep-ing; aggressive preventive maintenance; sub-stitution of nonhazardous substances forhazardous substances; and prudent replace-ment of old, inefficient process technologywith technology that results in generation ofless pollutants.
The objective of this chapter is to present13 industries as representative of many moreindustries regarding types of manufacturingprocesses; generation of solid wastes, air dis-charges, and wastewaters; strategies for pol-lution prevention; and wastes handling,treatment, and disposal technologies. A gen-eral description of manufacturing processesis given so as to show the "roots" of each sig-nificant solid, airborne, and waterborne pol-lutant. Then techniques for wastes minimiza-tion as part of an overall pollution preven-tion program are discussed. Finally, methodsfor "end of pipe" treatment are presented anddiscussed.
Discussion of the 13 representative indus-tries is preceded by a discussion of three pro-cesses that are common to many differentindustries: vapor degreasing, chemical des-caling (pickling), and rinsing. Pickling is aprocess used in the metal working industry,in which acid is used to remove foreign sub-stances from the metal surface. Vapordegreasing is used by nearly all industriesthat place a coating on metal as part of themanufacturing process. It is very commonfor these industries to require extensivecleaning of the metal surfaces before thecoating is applied, and vapor degreasing is

very often included in the cleaning process.As well, the process of rinsing is used by avery large number of industries to removeresidual substances from one manufacturingprocess in preparation for another.
Chemical DescalingMany manufacturing processes that involvemetal parts include a step for removing theproducts of corrosion from those metalparts. A common method for doing this is toimmerse the parts in a bath of aqueous solu-tion of acid or molten alkali. If acid is used, itis often sulfuric because of its relatively lowcost. If a caustic bath is used, it is usuallysodium hydroxide. This process is known as"pickling," and is usually followed by a rinseto remove residual acid or caustic acid. Otherchemical descaling agents include aqueoussolutions of nitric and hydrofluoric acids,molten salt baths, and various proprietaryformulations.
When sulfuric acid is used to descale fer-rous metals, some of the iron dissolves in theacid solution and exists there as FeSO4. Asthe quantity of dissolved FeSO4 builds upover time, the solution loses its effectivenessand must be renewed, by either batchreplacement or continuous makeup andoverflow. The spent solution must be treatedbefore disposal. Similar acid salts result fromthe use of acids other than sulfuric to descalemetals other than ferrous.
As with all other immersion processes, thepickling solution that fails to drip back intothe pickling bath after the piece is removed(dragout) must be dealt with. The quantityof dragout can be minimized by use of airsqueegees or longer drip times, or both.
Treatment of spent pickling solutionsinvolves neutralization and precipitation ofdissolved metals. The metals precipitate as aconsequence of the neutralization; however,the precipitation process must be well man-aged to prevent loss to the effluent due tononcompletion of the precipitation and/orsolids removal process. If the precipitation/solids removal process does not take place
before discharge, it will take place after dis-charge, potentially causing problems of tox-icity or, at a minimum, discharge permitexcursions.
DegreasingIndustries that are engaged in the working,forming, plating, or welding of metals almostalways apply and then remove one or moreoily or greasy substances to the metal sur-faces during the manufacturing process. As aresult, virtually all industries that apply acoating to metal in the course of their manu-facturing activities operate one or moreprocesses that remove greasy substances thatwere applied to prevent corrosion. A verycommonly used device for this purpose is thevapor degreaser. Simple immersion tanks,otherwise known as "dip tanks," are alsocommon. Vapor degreasers consist of the fol-lowing elements:
• A heated tank to contain and volatilizethe liquid degreaser substance
• An open chamber to contain the vaporsabove the heated tank
• A system to condense the vapors• A system of hangers or baskets, typically
mounted on a moving conveyor over-head, to hold the objects to be degreased("the work")
American Society for Testing Materials(ASTM) publication No. D 3698 - 99, enti-tled Standard Practice for Solvent VaporDegreasing Operations^ defines "solvent vapordegreasing operations" as "the process bywhich materials are immersed in vapors ofboiling liquids for the purpose of cleaning oraltering their surfaces, and are subsequentlyremoved from the vapors, drained, and driedin a solvent vapor degreaser. This publicationdefines a "solvent vapor degreaser" as "a sol-vent and corrosion-resistant tank with aheated solvent reservoir or sump at the bot-tom, a condensing means near the top, andfreeboard above the condensing means, inwhich sufficient heat is introduced to boil the

solvent and generate hot solvent vapor.Because the hot vapor is heavier than air, itdisplaces the air and fills the tank up to thecondensing zone. The hot vapor condenseson the cooled condensing means, thus main-taining a fixed vapor level and creating athermal balance."
Figure 10-1 shows a photograph of a typi-cal vapor degreaser. The system or "means"to cool the space above the heated tank typi-cally consists of coils containing cold wateror a refrigerant. As the objects to bedegreased move through the open chamber,vapors of the degreasing substance condenseon the (relatively cold) objects. The con-densed degreasing liquid dissolves grease onthe surfaces of the objects. As the degreasingliquid drips off the objects, it drops into asystem of troughs that carries it to a reser-voir, from which it then flows back into thetank. Anything that it dissolved or suspendedfrom the surfaces of the objects is carriedinto the reservoir (and then, in the case of aportion of this material, into the tank withthe condensed solvent).
Because only the vapors from the heatedtank contact the objects to be degreased, for-eign material from previously cleaned objectsis not brought into contact with the objects
being cleaned. As dirt and dissolved greaseaccumulate in the heated tank, they must bemaintained below a desired concentration byadding fresh degreaser. Some systems use abatch process where the tank is dumped peri-odically and refilled with fresh degreaser;others use a continuous overflow from thetank and continuous makeup with freshdegreasing substance.
Water also condenses from the ambientair in the (relatively cool) space above theheated degreasing tank. Some of this conden-sation takes place as the humid shop air con-tacts the (relatively cold) metal objects enter-ing the vapor degreaser. Some simply con-denses in the open space of the upper por-tion of the degreasing chamber. This con-densed water gradually accumulates in thetank, along with accumulating oil, grease,and dirt. As this water accumulates, it beginsto interfere with the effectiveness of the sol-vent. Water must, therefore, be maintainedbelow a certain level to achieve satisfactoryoperation.
Other sources of water contaminationinclude:
• Water brought in on the surfaces of thework
Figure 10-1 A typical vapor degreaser (courtesy of Greco Brothers Incorporated).

• Water remaining in the degreaser aftercleaning
• Leaks in the water coils or the steam coils
There are two methods by which thiswater is removed from the vapor degreasers.The first is by use of a separator that simplyprovides a quiescent volume within whichwater that is not dissolved in the solvent sep-arates from it under the influence of gravity.The second is by use of a still that makes useof the large difference between the boilingtemperatures of the water and the solvent.When the separated water and solvent exitthe gravity separator, there is water dissolvedin the solvent phase (as a contaminant), andthere is solvent dissolved in the water phase(also as a contaminant). Stills can then beused to remove the water contaminationfrom the solvent and to remove the solventcontamination from the water.
Many vapor degreaser systems includewhat is known as an "auxiliary still" for thepurpose of removing water contaminationfrom the solvent before returning the(reclaimed) solvent to the heated tank.
Desirable characteristics of the degreasingsubstance include high solubilities of thegreasy materials used to preserve metals anda high degree of volatility and chemical sta-bility. Substances used as degreasers haveincluded methylene chloride, methyl chloro-form, perchloroethylene, 1,1,1 trichloroet-hane, trichloroethylene, perchloroethane,n-propyl bromide, and trichlorotrifluoro-ethane.
Periodically, the vapor degreaser must beemptied, the sludge cleaned out, and thespent degreaser disposed of. Disposal ofspent degreasing liquids is best done by frac-tional distillation to recover relatively puredegreasing substance for reuse. The still bot-toms should be incinerated or placed in asecure landfill. Spent degreaser liquid shouldnever be landfilled directly because of itstoxic properties and the virtual impossibilityof containing it "forever." As well, the sludgethat is cleaned from the degreaser must be
disposed of by means similar to those usedfor the spent solvent.
Residual degreasing substance that fails todrip back into the degreaser before thedegreased object leaves the process (dragout)is a toxic contaminant that must be dealtwith. It can be minimized by use of air squee-gees and/or longer drip times.
Certain vapor degreasing facilities aresubject to air discharge restrictions of theNational Emission Standards for Haloge-nated Solvent Cleaning (Halogenated SolventCleaner NESHAP). These restrictions arecontained in 40 CRR. Part 63, Subpart T. Itis the responsibility of the user to determinethe applicability of these regulations.
RinsingRinsing processes are very common in manyindustries. Typically, parts and pieces under-going manufacturing processes are rinsed ina water bath after each process that involvesimmersion in an aqueous solution. Forinstance, a typical electroplating processinvolves immersion of the object beingplated (the work), typically a metal, in anaqueous solution (plating bath) of a salt ofthe plating material, usually a differentmetal. In order to dissolve the metal saltbeing plated, the plating bath must be highlyacidic. It will, therefore, be highly corrosive.For this reason, the plating bath is normallyfollowed immediately by two or three rinsetanks in succession.
After completing the process in the platingbath, the work is immersed in the first waterbath, where most of the residuals from theplating bath are removed. Since these residu-als simply dissolve in the rinse water, theywill be present on the surface of the rinsedwork in proportion to their concentration inthe rinse water. Therefore, it is necessary torinse the work in a cleaner bath after the firstrinse, and so on, until the work is sufficientlyclean. Each time an object is removed froman emersion tank it brings a certain amountof the bath solution (dragout) with it. Drag-out contaminates the next emersion solution

or rinsewater bath. Use of air squeegees and/or longer drip times can minimize dragout.Figure 10-2 shows a typical rinsing sequencefor an electroplating process.
It is common to have three rinse tanks inseries and advisable to have them set up sothat fresh makeup water is added to the finalrinse tank, ensuring a concentration of"impurities" sufficiently low that the rinsedwork is as clean as required. The final rinsetank should overflow into the preceding rinsetank, and so on, and the overflow from thefirst rinse tank should be used as makeupwater for fresh plating bath solution. Thissetup is referred to as "countercurrent rins-ing" and has largely replaced the older prac-tice of forward flow rinsing, where fresh rinsewater was added to the first rinse tank, whichoverflowed into the second rinse tank, and soon. Since it is the concentration of contami-nants in the final rinse tank (even when thereis only one tank) that governs the requiredflow rate of the clean makeup water, it fol-lows, then, that the concentration of contam-inants will always be lower, for any given flowrate of makeup water, in the second (or final)tank if the clean makeup water is added tothe final tank rather than the first tank.
In the forward flow setup, lightly contami-nated rinsewater from only the final rinse
tank had to be treated before dischargewithin permit compliance, and spent platingbath solution, heavily contaminated, had tobe treated by a separate system. Withcounter-current rinsing, where the overflowfrom the first rinse tank is used as makeupwater for fresh plating solution, only thespent plating solution has to be treated.
Treatment of spent plating solution orspent rinsewater involves removal of all thosesubstances used in the plating bath plus dis-solved ions from the object being plated (thework). The same is true for treatment ofspent plating solution, which is typicallymuch lower in volume and, consequently,more concentrated. Technologies for treat-ment of these wastewaters before reuse ordischarge are presented in Chapter 8.
Electroplating of Tin
Tin has been used for centuries as both a pri-mary metal with which to make tools, uten-sils, and other useful objects and as a cover or"plate" over other metals, such as iron, toprotect them from the elements. The tinningof iron, by hammering tin onto the surface ofthe iron, appeared around the 14th centuryin Bohemia. The largest simple use for tin inmodern times has been as a coating for steel
Mass Balance for Counter-Current Rinse System
Figure 10-2 Rinsing sequence for a typical electroplating process (from Bishop © 2000; reprinted by permission ofMcGraw-Hill, Inc.).
Effluent
Plating Bath
Workpiece

to make tin plate, used in the manufacture ofthe "tin can." Over half the tin used in theUnited States is for this purpose. Other usesfor tin include dairy and other food handlingequipment; washing machine parts; radioand electronic components; as a coating onrefrigerator evaporators; as a coating on cop-per wire; as a component of piston rings; andfor bearing surfaces. Tin is of great impor-tance to the electronics industry, which usescoatings of tin and tin-rich (greater than50% tin) tin-lead alloys ("solder plate"). Tin'sresistance to corrosion and chemicaletchants, as well as ease of soldering, arehighly desirable.
The favorable characteristics of tin as aplating material or coating are the following:
• Nontoxic properties• Resistance to corrosion• Ease of soldering• Ductility; ease to work with
Tin and its inorganic compounds andalloys are essentially nontoxic. This charac-teristic is extremely important to the foodindustry, the prepared foods industry, thedairy industry, and the environmental engi-neer or scientist. Considering that the ele-ments that are closest to tin on the periodicchart exhibit considerable toxicity, the non-toxic nature of tin is somewhat surprising.Elements near tin include arsenic, lead, cad-mium, antimony, and thallium. The onlyhazardous characteristics exhibited by inor-ganic tin substances are a result of propertiesother than toxicity; for instance, stannouschloride is acidic, and the various stannatesare strongly alkaline. Although there aremany organic compounds of tin, none ispresent in metal finishing operations.
Production ProcessesElectroplating is by far the most widelyencountered manufacturing process for tin.The basic tin electroplating process is illus-trated diagrammatically in Figure 10-3. Theobject to be plated, called "the work" is
immersed in an electrolyte (solution of metalsalts). The plating metal (tin) is alsoimmersed in the electrolyte or "bath." UsingDC current, the work is made the cathodeand the plating metal (tin, in this case) ismade the anode. The electric current causesions of tin to be dissolved into the bath andthen to be deposited ("plated out") on thesurface of the work. The quality, thickness,and other characteristics of the resulting tinplate are dependent upon the current amper-age, which is a function of the electrical con-ductivity of the electrolyte and the appliedvoltage. Also affecting the quality and thick-ness of the tin plate product are plating timeand the quality of preparation of the work.
PreplatingThe surface of the work must be very clean,as well as "activated," prior to plating. Conse-quently, as illustrated in Figure 10-3, the firstfive steps in a typical tin-plating operationare for the purpose of thoroughly cleaningand activating the surface of the work. Theactual mechanics of the operation of each ofthese five steps differ somewhat, dependingon the characteristics of the work. As well,two or more of the steps may be combinedfor certain types of work. Of interest to theenvironmental engineer or scientist, each ofthe preplating steps (as described below) isfollowed by a rinse with water, using one ormore rinse tanks or sprays.
PrecleanThe first step in preparing the work for tinplating is to remove all gross amounts of oil,grease, and dirt. Depending on the work andits condition on arrival at the plating shop,precleaning can include wiping, air spraying,brushing, vapor degreasing, emulsifiable sol-vent, solvent spray, hot alkaline spray, invertemulsion cleaners, or other processes, inorder to decrease, to the extent practicable,the load on the following cleaning processes.Various solvents are used for precleaning,including mineral spirits, kerosene, and chlo-rinated hydrocarbons such as perchloroeth-

Figure 10-3 Schematic diagram of the tin-plating process.
ylene. Extreme measures are required in han-dling these solvents and disposing of theresiduals because of their toxic nature. Whenvapor degreasing is used, the vapors as wellas the liquids must be contained. An advan-tage to the volatile solvents is that they can bereclaimed on site or by use of a commercialreclaiming service, and the concentratedresiduals from the reclaiming process can bedestroyed or encapsulated for safe landfilldisposal.
CleanThe second or "clean" step removes all resid-uals from the preclean step and removes anysubstances that were resistant to removal byvapor degreasing, solvent emulsion, or otherprocess or processes used in the precleanstep. Typically, the "clean" step makes use ofalkaline solutions to remove soils that havebeen softened but not completely removedby the precleaning step. Cleaning solutionscan be made up using various alkali soaps,detergents, chelating agents, complexingagents, and surfactants. Cleaning processesinclude manual brushing, mechanical brush-ing, soaking, spraying, or high-pressurespraying. Heat is often used. For instance,
one process involves immersion of the workin a detergent solution and heating the solu-tion to a rolling boil, followed by soaking fora period of time. Mechanical agitation, ultra-sonic energy, and high-pressure under-sur-face spraying are options for use in lifting thesoil off the surface of the work. Anotheroption, alkaline electrolytic cleaning, resultsin the production of bubbles of hydrogenand oxygen gas, which provide a scrubbingaction. After rinsing, the precleaned andcleaned work should be completely free ofany type of soil other than chemical deriva-tives of the work itself, such as oxides (rust)and scale.
PicklingPickling is an acid or alkaline (usually acid)dip process common to many metal cleaningoperations. Pickling has the purpose of dis-solving, by use of strong acids, corrosionproducts (rust, in the case of ferrous metals)or scale. Pickling processes vary from an aciddip to anodic treatment in a dry, alkaline salt.Sulfuric acid is widely used, due to its rela-tively low cost; other acids include hydro-chloric, phosphoric, and nitric.
TheWork Pre-Clean Rinse Clean Rinse
Pickle Rinse De-Smut Rinse
Acid Dip Tin PlatingBath Rinse Finished
Product

DesmuttingWhen steel is the material from which thework is made, a carbide film must beremoved after pickling. This carbide film,referred to as "smut," must be removed priorto plating. Several processes are available forthis purpose, including anodic treatment in adry, alkaline salt. If this type of treatment isused as the pickling step, desmutting willoccur simultaneously.
Acid DipThe final step in cleaning the work is an aciddip in relatively dilute sulfuric or hydrochlo-ric (or other) acid to remove residual alkali,remove any remaining oxides, and to "micro-etch" the surface. The microetching isreferred to as "activation" because of its effectof enhancing adhesion of the plating metal.
Plating BathsPlating baths for tin are either acid or alka-line. There are advantages and disadvantagesto each, and the choice depends on the spe-cific requirements of a given application.Acid baths are made up from stannous sul-fate or stannous fluoborate. When these sub-stances are used, the process can take place atroom temperature, the current density canbe relatively low, and deposition of tin ontothe work takes place from the stannous, orbivalent (+2), state. Acid bath plating has thedisadvantages of requiring so-called "addi-tion agents," and there is less "throwingpower." Throwing power refers to the unifor-mity of deposition of the plating metal overthe entire surface of the work. Another char-acteristic of acid bath plating is the bright-ness of the tin plate. This represents noadvantage when the tin plate is on the insideof a food can, but in other situations it mightrepresent enough of an advantage to tip thescale in favor of the acid bath process overthe alkaline bath process.
Alkaline bath plating uses sodium orpotassium stannate as the base material. Awide range of concentrations can be used as ameans of regulating the rate of plating, and
the formulation is relatively simple. No addi-tion agents are needed. Also, alkaline tinplating baths are characterized by havingexcellent throwing power. Another advantageis that insoluble anodes can be used, whichmeans that all of the plated tin has its originin the stannate ions. As well, hot stannatebaths are known for their ability to tolerateimperfect cleaning of the work. Disadvan-tages of alkaline bath plating compared withacid bath plating include the fact that the tinis plated from the stannic, or trivalent (+3),state, which requires higher current density.Another disadvantage is the requirement forthe bath to be heated. The hot bath is notsuitable for plating delicate work, such asprinted circuit boards.
DuPont has developed an alternative bathspecifically for the purpose of "electro-tin-ning" steel strips on a continuous through-put basis. Stannous chloride is used to pro-vide the tin, and fluoride salts provide con-ductivity. This bath is known as the "halogenelectrolyte bath. Table 10-1 lists componentsof typical plating baths, including acid, alka-line, and halogen baths.
RinseThe sequential steps of the tin-plating pro-cess must each be followed by a thoroughand complete rinse prior to the next sequen-tial step. For instance, if the work is notrinsed completely after the acid dip and priorto an alkaline plating bath, the alkalinity ofthe plating bath will be too quickly neutral-ized. As another example, if the cleaningsolution is not completely rinsed from thework, the detergents and contaminants fromthe wash water will contaminate the follow-ing bath or baths. Some rinse steps involveonly one tank. The work is dipped in thebath and then extracted from it. As the workis dipped in, any dragout from the previousprocess contaminates the rinse bath. Whenthe work is extracted, it drags out a certainquantity of the rinse water with it, along withwhatever contaminants are in the rinse water.Therefore, to keep the concentration of thesecontaminants low, fresh water must be con-

Table 10-1 Components of Typical Plating Baths*
Plating Bath Composition
Alkaline Stannate Baths
Bath Makeup (g/L)
Potassium stannate 100
Free potassium hydroxide 15
Potassium stannate 210
Free potassium hydroxide 22
Alkaline Stannate Baths
Bath Makeup (g/L)
Potassium stannate 420
Free potassium hydroxide 22
Sodium stannate 100
Free sodium hydroxide 10
Acid Baths
Stannous Sulfate Bath
Bath Makeup (g/L)
Stannous sulfate 72
Free sulfuric acid 50
Pheno-/cresolsulfonic acid 40
Gelatin 2
Acid Baths
Stannous Sulfate Bath
Bath Makeup (g/L)
Beta-napthol 1
Stannous Fluoborate Bath
Bath Makeup (g/L)
Stannous fluoborate 200
Fluoboric acid 150
Gelatin 6
Beta-napthol 1
Halogen Bath
Bath Makeup (g/L)
Stannous chloride 63
Sodium fluoride 25
Potassium bifluoride 50
Sodium chloride 45
Addition agents 2
*Lowenheim, 1978.
tinually added to the rinse tank. Conse-quently, an amount of flow leaves the rinsetank that is equal to the inflow minus thedragout. This "outflow" water constitutes awaste stream unless a use can be found for it.
One way to reduce the quantity of outflowis to use two rinse tanks in series, rather thana single tank. With two rinse tanks in series,the first tank can be allowed to build up inconcentration of contaminants to consider-able strength, and the work can still be rinsedcompletely with much less makeup (andeffluent) flow than with a single rinse tank.In fact, only if the first rinse tank builds up toa concentration equal to that in the preced-ing process tank will the rate of inflow ofclean makeup water need to equal that of thesingle rinse tank.
There is a choice to be made regarding thearrangement of inflow and outflow of cleanmakeup and contaminated rinse waters whentwo or more rinse tanks are arranged inseries. The clean makeup water can flow intothe first tank following the process tank, asshown in Figure 10-4. Also illustrated in Fig-ure 10-4, rinse water outflow, or wastewater,flows out from the second rinse tank. Thisarrangement is called "forward flow"makeup water. The second, and by far better,choice is to employ "counter-current"makeup water flow. In this arrangement,clean makeup water is added to the second ofthe two tanks in series (or final tank, if morethan two tanks in series are used). Since it isthe concentration of contaminants in thefinal rinse tank (even when there is only onetank) that governs the required flow rate ofthe clean makeup water, it follows, then, axi-omatically, that the concentration of con-taminants will always be lower, for any givenflow rate of makeup water, in the second (orfinal) tank if the clean makeup water is addedto the final tank rather than the first tank.
Where rinsing is the final step, it is neces-sary to dry the plated product completelybefore packing for shipping, to prevent stain-ing, corrosion, or other discoloration.

Figure 10-4 Alternative arrangements for rinsing.
Sources and Characteristics of Wastes
Solid WastesSolid wastes from the tin-plating industryinclude sludges from baths and from air andwastewater treatment facilities. Also includedare unrecyclable trash from packaging andshipping and construction debris from gen-eral repair, rebuilding, expansion, andremodeling that take place over time. Sludgesfrom baths include the preclean, clean,pickle, and desmut baths, and other devices,as well as the plating baths. The cleaningbaths contain products of corrosion and scal-ing, as well as oils, greases, and general dirt.
The still bottoms (from the stills that areused to regenerate volatile organic solventsused for cleaning oils and greases from thework that is being prepared for plating) aresolid wastes that must be managed as hazard-ous wastes.
Airborne WastesAir pollutants that must be managed includefumes from degreasing, etching, and platingoperations, plus the air discharges from boil-ers. Wet scrubbers are the standard devicesused to control fumes. The wet scrubbers con-vert air pollutants to water pollutants, with the
COUNTER-CURRENT FLOW MAKEUP
TO WASTE
PROCESSTANK
FLOWOF
WORKCLEAN
H2O
FORWARD FLOW MAKEUP
FLOWOF
WORK CLEANH2O
PROCESSTANK
RINSETANKNO. 1
RINSETANKNO. 2
TOWASTE

attendant production of a certain quantity ofsolid wastes in the form of sludges.
Waterborne WastesThere are three primary sources of wastewa-ter from tin-plating facilities: (1) rinsewaters, (2) cleaning and conditioning solu-tions, and (3) plating solutions. Rinse watersare normally produced on a continuousbasis, due to continuous fresh water makeupand consequent effluent overflow. Periodi-cally, rinse baths are dumped in order toclean the tanks.
Cleaning and conditioning solutions andplating solutions are normally discharged ona batch basis, as a result of the periodic needto dump "spent" cleaning and plating baths.
Spent Rinse WatersAs discussed previously and illustrated inFigures 10-2 and 10-3, a rinse step normallyfollows each cleaning, preparation, and plat-ing step. These rinsing processes can be diptanks, sprays, or both. Also, dip tanks can besingle tanks or multiple tanks in series. Mul-tiple (two or more) tanks can be operated asforward flow or counter-current flow,regarding the makeup of clean water and dis-charge of contaminated rinse water. Asexplained previously, for purposes of wasteminimization, counter-current flow is highlypreferred, to the extent that there is essen-tially no justification for forward flow.
Contaminated discharges from rinsingprocesses are basically dilute solutions of thecleaning, conditioning, or plating processesthat precede the rinsing process, along withsmall amounts of other contaminants. Forthis reason, the most advantageous methodfor "disposing" of "spent" rinse waters is touse them, to the extent possible, as the sourceof water for making up new batches of thepreceding cleaning, conditioning, or platingsolution. The excess rinse waters must thenbe treated before discharge, but their quan-tity will be minimized.
Spent Cleaning and ConditioningSolutionsCleaning and conditioning (conditioning isnormally considered part of cleaning) are thefirst processes used by the tin-plating indus-try, as illustrated in Figure 10-3. Since thepurpose of cleaning is to remove oils, grease,dirt, products of corrosion, and scaling, andto condition or "activate" the surface of thework to bond well with the tin, the spentcleaning and conditioning solutions containall of the oils, greases, dirt, and products ofcorrosion and scaling as well as the spent andunspent detergents, solvents, acids, alkalis,and other substances used for cleaning andconditioning. Since many cleaning solutionsare proprietary, it often takes some intensiveresearch to determine the individual compo-nents in the waste cleaning solutions.
Although not usually present in signifi-cant amounts, some spent cleaning and con-ditioning solutions contain chromium andcyanide. Chromium results from dissolutionfrom carbon steel during strong acid treat-ment. The chromium content of carbon steelranges from 0.5% to 1%. Cyanide, in theform of ferocyanide, is sometimes used in tinplating to scavenge other heavy metals fromthe surface of the work. Also, sodium cyanideis sometimes used as a cyanide dip or as anintegral part of one of the cleaning steps tohelp preserve work that will not be platedimmediately.
Spent Plating SolutionsThere is great variability in tin-plating opera-tions; therefore, it is not feasible to set forth a"typical" or "average" wastewater. As anexample of one industry's wastewater, Tables10-2 and 10-3 are presented to illustrate thewastewater characteristics from two continu-ous strip electro-tinning facilities.
Spent plating baths, although consideredhazardous in the as-is state because of corro-sivity, or possibly other characteristics, arenot normally considered toxic. This makestin-plating waste somewhat unique as a
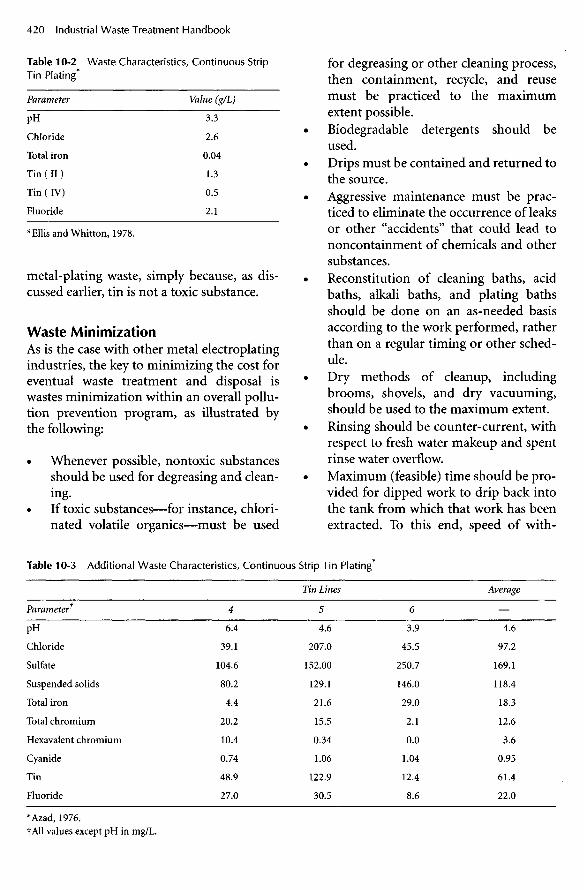
Table 10-2 Waste Characteristics, Continuous StripTin Plating*
Parameter Value (g/L)
pH 3.3
Chloride 2.6
Total iron 0.04
Tin ( I I ) 1.3
Tin (IV) 0.5
Fluoride 2.1
* Ellis and Whitton, 1978.
metal-plating waste, simply because, as dis-cussed earlier, tin is not a toxic substance.
Waste MinimizationAs is the case with other metal electroplatingindustries, the key to minimizing the cost foreventual waste treatment and disposal iswastes minimization within an overall pollu-tion prevention program, as illustrated bythe following:
• Whenever possible, nontoxic substancesshould be used for degreasing and clean-ing.
• If toxic substances—for instance, chlori-nated volatile organics—must be used
for degreasing or other cleaning process,then containment, recycle, and reusemust be practiced to the maximumextent possible.
• Biodegradable detergents should beused.
• Drips must be contained and returned tothe source.
• Aggressive maintenance must be prac-ticed to eliminate the occurrence of leaksor other "accidents" that could lead tononcontainment of chemicals and othersubstances.
• Reconstitution of cleaning baths, acidbaths, alkali baths, and plating bathsshould be done on an as-needed basisaccording to the work performed, ratherthan on a regular timing or other sched-ule.
• Dry methods of cleanup, includingbrooms, shovels, and dry vacuuming,should be used to the maximum extent.
• Rinsing should be counter-current, withrespect to fresh water makeup and spentrinse water overflow.
• Maximum (feasible) time should be pro-vided for dipped work to drip back intothe tank from which that work has beenextracted. To this end, speed of with-
Table 10-3 Additional Waste Characteristics, Continuous Strip Tin Plating*
Tin Lines Average
Parameter* 4 5 6 —
pH 6.4 4.6 3.9 4.6
Chloride 39.1 207.0 45.5 97.2
Sulfate 104.6 152.00 250.7 169.1
Suspended solids 80.2 129.1 146.0 118.4
Total iron 4.4 21.6 29.0 18.3
Total chromium 20.2 15.5 2.1 12.6
Hexavalent chromium 10.4 0.34 0.0 3.6
Cyanide 0.74 1.06 1.04 0.95
Tin 48.9 122.9 12.4 61.4
Fluoride 27.0 30.5 8.6 22.0
*Azad, 1976.tAll values except pH in mg/L.
drawal should be minimized. Also, shak-ing techniques are options to consider.
• Air squeegees should be used to themaximum extent to increase drippinginto source tanks, thus preventing drag-out and consequent contamination ofthe next sequential bath or other process.
• Temperature and viscosity of the bathshould be included in the variables thatcan be adjusted to minimize dragout.
• Purchasing should be guided by aggres-sive selection of raw materials to obtainthe cleanest possible materials.
• Purchasing should be guided to demandthat the packaging of materials deliveredto the plant be recyclable or otherwise oflow solid waste nature.
• There should be a constant and consis-tent program to substitute less pollutingand nonpolluting substances for thosethat require expensive treatment andexpensive disposal.
• There should be a constant and consis-tent program for replacing cleaning,conditioning, plating, and rinsing proc-esses with technologies that inherentlygenerate less wastes having even lessobjectionable characteristics.
• In concert with the above, there shouldbe a constant and consistent program forreplacing process controls, includingsensors, microprocessors, and hardware,with the objective of decreasing wasteand maximizing retention, containment,recycle, and reuse of all substances.
• Technologies for recovering and regener-ating chemicals, as well as separating andremoving contaminants, should beaggressively employed. Using reverseosmosis (RO) or ultrafiltration (UF) toremove oils from alkaline cleaning solu-tions are examples. Centrifugation hasalso been used for this purpose. Acti-vated carbon can be used to removeorganic impurities.
Both filtration and centrifugation produceconcentrated impurities that offer the possi-bility of recovery. If recovery of substances is
not feasible, the concentrated impurities arein a form more easily disposed of. Evapora-tion has also been used with success. If thetotal aqueous wastes or, alternatively, a sidestream, can be reduced in volume bycounter-current rinsing—the use of spentrinse waters as makeup for wash and/or plat-ing baths—the cost for energy to evaporatemay be less than for other treatment and dis-posal. The relatively pure water condensedfrom the vapor can be used as rinse watermakeup.
Processes to recover metals from spentplating baths and concentrated rinsing bathsby electrolytic techniques have been very welldeveloped. Metals that have been depositedon the cathode are relatively easy to recover.These metals can then be reused in the plat-ing bath. Even though complete recovery isnot feasible, the process is very effective inreducing overall costs by reducing costs forthe plating chemicals and reducing costs forwaste treatment and disposal. Evaporation,ion exchange, and reverse osmosis are addi-tional methods that can be used to enhancerecovery by concentrating the metals prior toelectrolytic recovery. As a final example, fer-rocyanide has been used as a chelating agentin tin plating to effect selective scavenging ofother metals in solution.
Wastewater TreatmentWhen wastes minimization has been imple-mented to the maximum extent, the contam-inants that remain must be treated and dis-posed of. In fact, a number of the waste min-imization methods discussed above can beconstrued to constitute waste treatment.However, there are other techniques that canbe employed that are truly end-of-pipe treat-ments.
Although some waste streams can be com-bined and managed as one, regarding wastetreatment processes, it is usually advisable totreat certain waste streams separately.
Treatment of tin-plating wastes usuallyinvolves removal of oils and greases from thepreplating operations, and recovery of tin,

and possibly other metals, from the platingbath and rinse wastes. The removal of oilsand greases can be done by reverse osmosis,ultrafiltration, or chemical coagulation, fol-lowed by dissolved or dispersed air flotationin combination with simple skimming.
As discussed in Chapter 7, recovery of tinand other metals is most often accom-plished by alkaline, sulfide, phosphate, orcarbonate precipitation. If the wastewaterscontain fluoride, use of lime as the precipi-tating agent will effect removal of fluoridesconcurrently. If the effluent containshexavalent chromium, addition of (slightlysoluble) ferrous sulfide will effect sulfideprecipitation of tin and other metals and atthe same time reduce the hexavalentchrome to trivalent chrome (far less toxic).If the pH is maintained between 8.0 and 9.0during this process, the trivalent chromewill be precipitated as the hydroxide. Thus,tin, other metals, and hexavalent chromecan be removed simultaneously by additionof ferrous sulfide, pH adjustment, slow mix-ing, sedimentation, and filtration. Thesecombined methods will produce an effluenthaving metals (tin plus other metals,including trivalent chromium) between 2and 5 mg/L. Ion exchange can then beemployed to reduce the concentrations ofthese substances to essentially nondetect-able levels, as discussed in Chapter 7. Theproduct water can then be returned to theprocess for use as either plating bathmakeup water or rinse makeup water.
Insoluble starch xanthate has been usedsuccessfully as a precipitant for tin and othermetals over pH levels from 3.0 to 11.0, withoptimal effectiveness above 7.0. This processis effective over a wide range of metals con-centration levels.
When metals, including tin, are precipi-tated, that is, removed by a reaction to pro-duce an insoluble compound (for instance,stannous sulfide), the precipitation stage isnormally followed by gravity sedimenta-tion, often by use of tube or plate settlers.Because simple precipitation often results in
small particles of precipitate that do not set-tle well, a coagulation step must be added.Coagulation (see Chapter 7) involves theaddition of a metal salt or an organic poly-mer, followed by a very short (15 to 30 sec-onds) rapid mix and then by slow mixingfor a period of 15 to 30 minutes prior to thegravity settling process. These processescombine to produce a large, relatively heavyfloe that settles much faster and more com-pletely than the original small precipitatedparticles. Three distinct processes areinvolved: (1) precipitation, brought aboutby addition of the chemical (sodiumhydroxide, for instance) that reacts with thetarget metal ions to produce an insolublecompound (metal hydroxide); (2) coagula-tion, brought about by addition of the coag-ulant (metal salt or organic polymer); and(3) flocculation, brought about by the slowmixing process. The result is an effluent thathas 5 to 15 mg/L of metal ions. Filtrationcan reduce the concentration to 2 to 5 mg/L.If it is desired to produce an effluent reli-ability lower than 5 mg/L of metals, ionexchange must be employed.
The Copper Forming Industry
Copper forming includes rolling, drawing,extruding, and/or forging copper and copperalloys. The products of copper forming varyfrom wires to brewery kettles.
The raw materials for the copper formingindustry are copper bars, square cross-sec-tion wire bars, rectangular cakes or slabs,sheets, stripe, and cylindrical billets, all ofwhich are cast in copper refineries. Othermetals are often mixed with copper at therefinery to improve corrosion resistance,electrical conductivity, and other propertiesof the end product of copper forming.
The products made by the copper formingindustry can be divided into six categories:plates, sheets, strips, wires, rods, and tubes.Bars and wires make up about 65% of thetotal, while sheets, strips, and plates account

for about 20%. The remaining 15% is madeup of tubes and pipes. Plates are usuallygreater than one-quarter inch thick and areused for the manufacture of processing ves-sels, heat exchangers, and printing equip-ment. Sheets are thin plates, and strips arebasically sheets with one long dimension.Sheets and strips are both used for roof flash-ing, gutters, radio parts, and washers. Rodsand wires have circular cross-sections and areused for springs, electrical conductors, fas-teners, and cables. Tubes and pipes are usedfor hydraulic lines, or by the plumbing andheating industry.
The Copper Forming ProcessFive different processes, plus variationswithin those five processes, are used to formcopper.
Hot RollingHot rolling is carried out at temperaturesabove the recrystallization temperature ofthe metal. The recrystallization temperatureis that temperature at which the crystal lat-tice structure of the metal becomes reori-ented. Consequently, the metal becomesmore workable and ductile.
Cold RollingLike hot rolling, cold rolling involves passingthe metal between a series of rollers, some ofwhich are opposite others, in such a way as tomake this cross-section of the metal piecebecome ever smaller. Since cold rolling isdone at temperatures below the recrystalliza-tion temperature, the product is less ductile.
ExtensionExtension involves forcing molten copper orcopper alloy through an orifice or "die" attemperatures of 1,2000F to 2,0000F.
ForgingForging involves intermittent application ofpressure, as with hammering, to force themetal into a desired shape.
AnnealingAnnealing involves heating the copper orcopper alloy, often by the combustion of nat-ural gas, for the purpose of reducing stressesintroduced into the metal by forging or coldrolling. "Electroneal" units work by passingelectrical current through the formed wire.In some cases, a quenching step follows theheating step, with the consequent productionof wastewater. Figure 10-5 presents a flowdiagram of a typical copper forming process.
water
Copper Slabs ColdRolling
Copper Sheets
Figure 10-5 Process flow diagram for the copper forming industry.
wastewater
PicklingBath
PicklingRinse
AnnealingAlkalineCleaning
Rec
ycle
Rec
ycle
Additional processes that may take placeat a copper forming plant include the follow-ing.
PicklingPickling, or treatment by immersion in anacid bath, is sometimes done to remove cor-rosion products before or after the copperforming process.
Alkaline CleaningAlkaline cleaning is similar to pickling,except that the bath contains some or all ofthe following: caustic, sodium, polyphos-phate, silicates, sodium carbonates, resin-type soap, organic emulsifiers, wettingagents, and chelating agents.
Solution Heat TreatmentAlso called quenching, solution heat treat-ment involves cooling the copper productsafter forming by immersion in a continuousflow bath, or by spraying. Water is normallyused. An exception is the quenching of prod-ucts formed by extension, in which case anoil and water solution is normally used.
Rolling and Drawing ProcessLubricants and coolants are used in the roll-ing process as well as the drawing process toprevent excessive wear on the rollers and tofacilitate the drawing process. Normally,dilute solutions of soluble or emulsified oil,or sometimes water alone, are used. Thesesolutions perform the functions of coolingand lubrication. They are normally sprayedon the rolls in the cases of the hot and coldrolling process, and they are sprayed on therod or wire as it enters the die. Alternately,the die may be immersed in the oil/watermixture, which is cooled externally, in thedrawing process. These solutions are oftentreated (by filtration, for instance) andreused, but there is always a blow-down(constant removal of a small portion of theflow) that requires management as a wastestream, as well as periodic dumps that arereplaced by fresh mixtures.
Solution Heat Treating and AnnealingQuenchesThere are both continuous and periodic dis-charges of wastewater streams, from two dif-ferent types of heat treatment quenches usedfor cooling the copper product after it exitsthe forming machine and from the quenchesfollowing the annealing process. Thesewastewater streams are generally similar toone another in characteristics, but normallyhave varying substance concentrations.These waste streams are usually continuousflow as well as occasional batch dump, asdescribed above for the rolling and drawingprocess lubricants and coolants.
Alkaline Cleaning Rinse and BathsAlkaline cleaning, which normally precedesthe annealing process, has the purpose ofremoving lubricants, tarnish, and dirt.Therefore, all of these substances, includingthe substances added into the alkaline clean-ing baths, are present in the waste streamsfrom those processes. The alkaline cleaningbath may contain some or all of the follow-ing: caustic, sodium polyphosphate, sili-cates, sodium carbonates, soaps, aquaticemulsifiers, wetting agents, and chelatingagents.
Pickling Baths, Rinses/ and FumeScrubbersPickling is basically a cleaning process. Acidsolutions are used to remove oxides from thesurface of the metal. In addition, other sub-stances on the surface of the metal will beremoved, in whole or in part, and will there-fore be present in the waste stream. In partic-ular, metal sulfates accumulate in picklingbaths when sulfuric acid is used as the pick-ling agent, as is generally the case. Forinstance, copper sulfate forms when copperis pickled, as follows:
CuO + H2SO4 -> CuSO4 + H2O (10-1)
Equation 10-1 shows that as the picklingprocess proceeds, the acid is gradually

depleted and copper sulfate builds up. Forthis reason, makeup acid must be added,either continuously or periodically.
When the metal parts are taken out of thepickling bath and placed in a rinse tank,dragout transfers a certain amount of thepickling solution to the rinse tank. Dragout isthe reason that the treated rinse waters havethe same substances as the pickling bath,except that they are far more dilute, and it isthe basic reason that these treated rinsewaters should be used as makeup water forfresh pickling solution in order to reduceoverall wastewater discharge.
Generation of WastesLubrication, cooling, and blow-down fromwet scrubbers are the most importantsources of wastes that require managementin the copper forming industry.
Solid WasteSolid waste streams include ordinary trashfrom shipping and packaging, sludges fromcopper forming processes, and sludges fromscrubbers and wastewater treatment.
Airborne WastesAir pollutants include fumes from furnaces,from pickling processes, and from othercleaning operations.
Waterborne Wastes, WastesMinimization, and WastewaterTreatmentThe following is a discussion of the primarytypes of substances that characterize wastewa-ters generated by the copper forming industry.Also discussed are waste minimization tech-niques and wastewater treatment technolo-gies. The primary pollutants from the copperforming process are listed in Table 10-4.
Oil and GreaseGlycerides of fatty acids consisting of 16 to 18carbon atoms are commonly used as lubri-cants throughout the copper forming proc-ess. The oil molecules are charged such thatthe water molecules reject them. Because ofthe specific gravity of the oils, they rise to thesurface and can be removed mechanically.However, since water-soluble oils or emulsi-fied oils are used, precipitation techniquesmust be used to separate them from thewater.
Table 10-4 Sources of Copper Forming Wastes
Process Waste Source Pollutants/Parameters
Hot Rolling Lubricant O&G, TM, TO, SS
Cold Rolling Lubricant O&G, TM, TO, SS
Drawing Lubricant O&G, TM, TO, SS
Solution Heat Treatment (SHT) Quench O&G, TM, TO, SS
Extrusion Press SHT Quench O&G, TM, TO, SS
Alkaline Cleaning Bath Dump O&G, SS, high pH
Alkaline Cleaning Rinse Water O&G, SS, high pH
Annealing Water O&G, SS
Annealing Oil O&G, SS
Pickling Bath TM, low pH
Pickling Rinse TM, low pH
Pickling Fume Scrubber TM, low pH
O&G = Oil and Grease; TM = Toxic Metals; TO = Toxic Organics;SHT = Solution Heat Treatment; SS = Suspended Solids.

Toxic Organics and MetalsToxic organics, such as chlorinated solventsused to clean oils and greases from the sur-faces of raw materials, intermediates, andproducts, should be replaced by nontoxicsolvents, such as detergents, and thus beeliminated from the waste stream. Metals,however, cannot be eliminated. Metals can beremoved from the waste stream by alkaline,sulfide, phosphate, or carbonate precipita-tion, followed by filtration and ion exchange,as discussed in Chapter 7. In many instances,metals can be recovered from sludges and ionexchange resins, and every opportunity to doso should be thoroughly investigated.
Suspended SolidsParticles of metals, metal oxides, and dirt arealways present in metal processing wastes,due to abrasion, both intended and other-wise. Airborne particles are often scrubbedusing wet scrubbers, converting these parti-cles from air pollutants to water pollutants. Itis usually a viable option to mix these wasteswith wastewaters from the process itself andthen to remove the combined suspended sol-ids by chemical coagulation and filtration.Maximum recycle and reuse of treated waste-water should be a continuous objective.
Prepared Frozen Foods
Prepared frozen foods are foods that havebeen mixed with other ingredients, some-times cooked or partially cooked, and pack-aged for easy consumer use. "TV Dinners"are examples. Prepared frozen foods varyfrom frozen single items to complete mealsarranged in segmented aluminum or plasticplates for convenient heat and consume ormicrowave and consume use.
There is evidence that prehistoric peoplefroze foods for later consumption. The rapidincrease in commercialization of frozenfoods (as opposed to "prepared" frozenfoods) began in the 1920s, when ClarenceBirdseye developed the process of quicklyfreezing foods in a way that preserved taste
and texture. Apparently, the quick freezingresults in smaller ice crystals, and the smallerthe ice crystals, the more closely the productresembles fresh product at the time of con-sumption. The rapid growth of prepared fro-zen foods began with the rapid increase intime spent viewing television, starting in the1950s.
The American Frozen Food Institute(AFFI) has divided the specialty foods indus-try into ten categories, the following five ofwhich are appropriately included under pre-pared frozen foods:
• Prepared dinners• Frozen bakery products• Italian specialties• Chinese and Mexican foods• Breaded frozen products
Prepared frozen foods can be character-ized as having value (and pollution potential)added when compared with frozen fruits,vegetables, and unprocessed meat, fish, andpoultry. In general, the substances addedduring the (factory) preparation of preparedfrozen foods are a larger source of pollutantsthat must be managed than are the basicfoods themselves.
Preparing frozen foods, like essentially allof the food processing industry, is not associ-ated with toxic wastes. Some of the wastesmay exhibit one or more hazardous charac-teristics, for instance, corrosivity due to lowpH or high pH resulting from one or morecleaning activities. These characteristics canreadily be corrected by simple treatmenttechniques such as neutralization, using oneor more acid or caustic substances.
Food processing of all types, including theprepared frozen foods industries, is charac-terized by a startup, operate, and plantcleanup sequence. It is essentially always truethat plant cleanup activities produce thegreatest quantities of wastes. Process startupis a distant second and, for well-operated and-maintained plants, the operation phase pro-duces a small quantity of pollutants. This isin contrast to operations such as pulp mills,

where the bulk of the pollutants are pro-duced on a continuous basis.
The food processing industry is here tostay. Furthermore, there is every indicationthat the prepared frozen foods industry willenjoy steady growth in the foreseeable future.
Because plant cleanup activities producemost of the wastes from prepared frozenfoods production facilities, the activities thatlead to starting and stopping processing lineswarrant close scrutiny regarding wastes min-imization. There is an inherent economy ofscale regarding wastes generation. The idealprocessing plant, from a wastes minimizationstandpoint, is a relatively large plant thatprocesses at near maximum capacity for twoor more shifts per day and undergoes plantcleanup only once per day. The most difficultprocessing plant in terms of wastes minimi-zation is a relatively small plant that changesproducts one or more times each shift andoften operates under capacity. Each timethere is a change of process on a given proc-essing line, the line, and much of the rest ofthe plant, must be thoroughly washed down.
Wastes Generation
Solid WastesThere are considerable solid wastes generatedat prepared frozen food plants, includingdebris from fresh raw materials that make upthe basic substance of the prepared food.Examples are as follows:
• Fish carcasses in the case of fish process-ing plants
• Feather and inedible body parts in thecase of poultry processing plants
• Dirt, stems, leaves, etc., in the case ofvegetable or fruit processing plants.
Some prepared frozen food plants initiateproduction with all "raw" materials proc-essed to some degree at other locations. Forinstance, certain producers of frozen chickenpotpies purchase chicken that has been proc-essed to the degree that it is ready for cook-
ing. In these cases, the solid wastes fromprocessing the live chickens do not have to bedealt with; however, packaging and shippingmaterials—boxes, wrappers, steel bands,etc.—make up an important portion of thesolid waste stream. Additional solid wastesinclude sludges from processing tanks, slud-ges from wastewater treatment processes,and the material that is collected duringplant cleanup operations using dry methodssuch as brooms, air squeegees, and shovels.
Many of the solid wastes from preparedfrozen foods as well as other food processingfacilities are putrescible; therefore, they arepotential nuisance odor problems (and rep-resent a source of air pollution). The bestmanagement practice to prevent such anodor problem from developing is to maintaina very clean plant throughout the premisesand to dispose of the solid wastes before aproblem develops.
Airborne WastesThe only airborne wastes from prepared fro-zen food processing plants should be thosenormally associated with the boilers. Nui-sance odor problems are often a potentialproblem but should never be allowed todevelop.
Waterborne WastesPlant cleanup operations produce the largestpercentage of waterborne wastes. The sub-stances included in these wastes are charac-teristic of the products produced, as dis-cussed in the following text.
Prepared DinnersThere are more plants producing prepareddinners than any other category of preparedfrozen foods. Frozen potpies represent a largeportion of the total. Some of these plantsprocess live chickens, turkeys, swine, or cat-tle; most purchase processed or partiallyprocessed poultry meat or beef. Characteris-tically, most of the wastewater is generated byplant cleanup operations, usually during a

late night or early morning cleanup shift.Additional cleanup takes place at changes ofshifts, changes of items being processed, orproducts being prepared, and as a result ofspills. Washing, rinsing, and blanching ofvegetables represent other sources of waste-water. Frying, breading, and cooking repre-sent other sources. Tables 10-5 and 10-6present "average" values of wastewater char-acteristics obtained from several preparedfrozen foods processing plants. These tableshave been reproduced from a report on astudy conducted by the AFFI during the1980s. These results are not presented as
"average" or even typical for the industry as awhole, since there is such great variabilityfrom one plant to another regarding rawmaterials taken in, processes taking place,frequency of cleanup, items produced, andplant maintenance procedures. Tables 10-5and 10-6 are presented here simply to illus-trate the wastewater characteristics observedat six individual prepared frozen food plants.
In general, it can be said that the wastewa-ters from prepared frozen dinner plants, asrepresented by the six plants that were thesubjects of Tables 10-5 and 10-6, were rela-tively strong, were organic in nature, and had
Table 10-5 Prepared Dinners' Average Pollutants Contained in Wastewater per Unit Production
Constituent (kg/kkg finished product)
Plant Code COD BOD SS VSS Total P TKN Grease and Oil
A 69 35 34 33 0.25 0.44 44
B 42 18 11 11 0.18 0.25 21
C 28 13 11 11 0.24 0.61 —
D 27 15 14 14 0.16 0.55 2.9
E 20 11 6.6 6.0 — — 3.8
F 17 8.8 6.2 6.2 0.12 0.37 4.8
Volume(L/kkg)
8,700
6,200
22,000
21,000
9,400
4,400
Average 34 17 14 14 0.19 0.44 15 12,000
Range 17-69 9-34 6-34 6-33 .12-.25 .25-.6I 2.9-44 4,400-22,000
* kg = kilogram; kkg = thousand kilogram.COD = Chemical Oxygen Demand; BOD = Biological Oxygen Demand; SS = Suspended Solids (Total);VSS = Volatile Suspended Solids; Total P = Total Phosphorus; TKN = Total Kjeldahl Nitrogen;L/kkg = Liters per thousand kilograms.
Table 10-6 Prepared Dinners, Average Wastewater Characteristics
Concentration (mg/L)
Plant Code COD BOD SS VSS Total P TKN Grease and Oil
A 7,900 4,000 3,900 3,800 29 51 5,100
B 6,800 2,900 1,800 1,700 30 34 3,400
C 1,300 620 530 510 11 28 —
D 1,300 720 680 650 7.6 26 140
E 2,100 1,240 700 640 — — 400
F 3,800 2,000 1,400 1,400 28 85 1,100
Average 3,900 1,900 1,500 1,500 210 45 2,000
Range 1,300-7,900 620-4,000 530-3,900 510-3,800 7.6-30 26-85 140-5,100
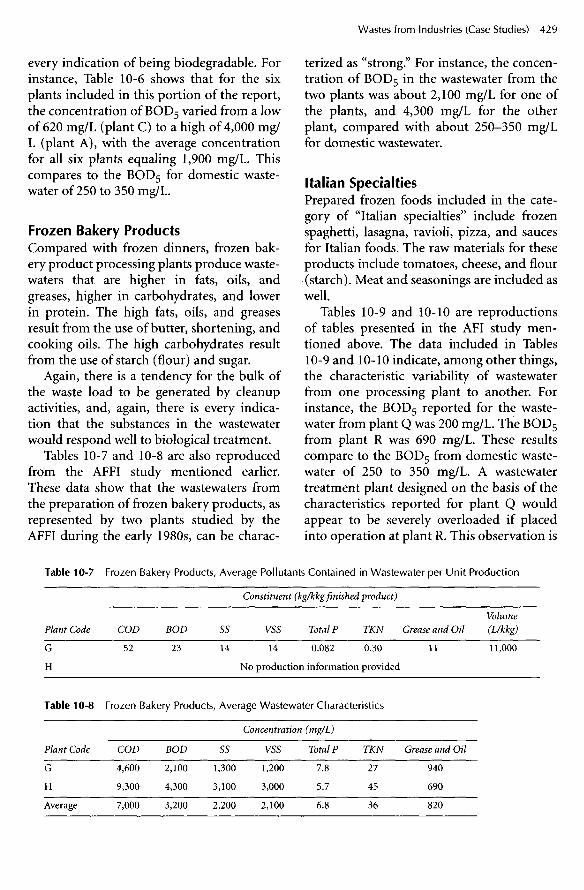
every indication of being biodegradable. Forinstance, Table 10-6 shows that for the sixplants included in this portion of the report,the concentration OfBOD5 varied from a lowof 620 mg/L (plant C) to a high of 4,000 mg/L (plant A), with the average concentrationfor all six plants equaling 1,900 mg/L. Thiscompares to the BOD5 for domestic waste-water of 250 to 350 mg/L.
Frozen Bakery ProductsCompared with frozen dinners, frozen bak-ery product processing plants produce waste-waters that are higher in fats, oils, andgreases, higher in carbohydrates, and lowerin protein. The high fats, oils, and greasesresult from the use of butter, shortening, andcooking oils. The high carbohydrates resultfrom the use of starch (flour) and sugar.
Again, there is a tendency for the bulk ofthe waste load to be generated by cleanupactivities, and, again, there is every indica-tion that the substances in the wastewaterwould respond well to biological treatment.
Tables 10-7 and 10-8 are also reproducedfrom the AFFI study mentioned earlier.These data show that the wastewaters fromthe preparation of frozen bakery products, asrepresented by two plants studied by theAFFI during the early 1980s, can be charac-
terized as "strong." For instance, the concen-tration of BOD5 in the wastewater from thetwo plants was about 2,100 mg/L for one ofthe plants, and 4,300 mg/L for the otherplant, compared with about 250-350 mg/Lfor domestic wastewater.
Italian SpecialtiesPrepared frozen foods included in the cate-gory of "Italian specialties" include frozenspaghetti, lasagna, ravioli, pizza, and saucesfor Italian foods. The raw materials for theseproducts include tomatoes, cheese, and flour(starch). Meat and seasonings are included aswell.
Tables 10-9 and 10-10 are reproductionsof tables presented in the AFI study men-tioned above. The data included in Tables10-9 and 10-10 indicate, among other things,the characteristic variability of wastewaterfrom one processing plant to another. Forinstance, the BOD5 reported for the waste-water from plant Q was 200 mg/L. The BOD5
from plant R was 690 mg/L. These resultscompare to the BOD5 from domestic waste-water of 250 to 350 mg/L. A wastewatertreatment plant designed on the basis of thecharacteristics reported for plant Q wouldappear to be severely overloaded if placedinto operation at plant R. This observation is

Table 10-9 Italian Specialties, Average Pollutants Contained in Wastewater per Unit Production
Constituent (kg/kkg product)
Plant Code COD BOD SS VSS Total P TKN Grease and Oil
O 39 19 14 13 0.79 0.59 —
P — 3.3 — — — 0.12 —
Q 8.8 5.2 3.4 3.1 0.052 0.15 4.7
R 2.6 1.1 0.65 0.59 0.011 0.061 —
Average 17 7.2 6.0 5.6 0.28 0.23 4..7
Table 10-10 Italian Specialties, Average Wastewater Characteristics
Concentration (mg/L)
Plant Code COD BOD SS VSS Total P TKN Grease and Oil
O 500 240 180 150 10 7.6 —
P — 340 — — — 11.8 —
Q 340 200 130 120 2.0 5.6 180
R 1,500 690 360 330 6.0 34 —
Average 780 370 220 200 6.0 15 180
Volume(L/kkg)
80,000
9,800
26,000
1,800
29,000
contradicted by the results presented in Table10-9. When expressed as units of BOD5 perthousand units of product, plant Q dis-charged 5.2 mg/kkg, but plant R dischargedonly 1.1 pounds. From these data, it wouldappear that the wastewater treatment plantdesigned on the basis of data obtained atplant Q would be severely underloaded ifplaced into operation at plant R.
Chinese Foods and Mexican FoodsPrepared frozen Chinese and Mexican foodsresult in the production of waste characteris-tics that are somewhat stronger in terms ofconventional pollutants (BOD, COD, TSS,O&G) than domestic wastes and are expectedto be biodegradable. Both types of plants usevegetables, some poultry, and some meats.Both use rice to a significant degree, and nei-ther of the two uses large amounts of oils orfats. It is common for producers of both pre-pared frozen Chinese foods and preparedfrozen Mexican foods to receive, as raw mate-rials, at least some fresh vegetables, and topreprocess them by cleaning and peeling.
Tables 10-11 and 10-12 present the charac-teristics of wastewater from two differentplants that produced frozen Chinese foods.Again, these tables are reproductions fromthe AFFI study discussed above. There wereno data presented for prepared frozen Mexi-can foods in the AFFI study. In lieu of dataon prepared frozen food production, theAFFI presented data on Plant "X," whichproduced canned Mexican foods. Since all ofthe processes are the same up to the point ofeither freezing or canning, and since neitherthe freezing nor canning processes shouldproduce significant wastes, solid, airborne,or waterborne, it appears to be a goodassumption to consider that wastes generatedduring the preparation of frozen Mexicanfoods should be similar in characteristics towastes generated during the preparation ofcanned Mexican foods.
As shown in Tables 10-11 and 10-12, theBOD5 of the two plants that prepared frozenChinese foods was 370 to 450 mg/L, reason-ably close to what would be expected for nor-mal domestic wastes. The BOD5 of thewastewater from the preparation of canned

Table 10-11 Frozen Chinese and Mexican Foods, Average Pollutants Contained in Wastewater per Unit Pro-duction
Constituent (kg/kkg finished product)
Plant Code COD BOD SS VSS Total P TKN Grease and Oil
V 12 6.3 2.4 2.2 0.084 0.36 1.2
W 12 6.7 4.0 3.8 0.041 0.27 4.7
X 12 7.8 1.9 1.2 0.29 0.21 —
Average 12 6.9 2.8 2.4 0.14 0.28 3.0
Table 10-12 Frozen Chinese and Mexican Foods, Average Wastewater Characteristics
Concentration (mg/L)
Plant Code COD BOD SS VSS Total P TKN Grease and Oil
V 830 450 170 160 6.0 26 85
W 670 370 220 210 2.3 15 260
X 1,300 900 210 140 34 22 —
Average 930 570 200 170 14 21 170
Volume(L/kkg)
14,000
18,000
8,900
14,000
Mexican foods was about 900 mg/L (seeTable 10-12), significantly higher than whatwould be expected in domestic wastes (250-350 mg/L).
Breaded Frozen ProductsMajor products from the breaded frozenproducts category are breaded "fish sticks,"
onion rings, mushrooms, and shellfish. Someplants purchase fresh raw material, such asfresh picked onions and mushrooms. Someplants purchase "raw material" already proc-essed and frozen, such as frozen processedfish or shellfish. These plants thaw the frozenraw material, process it further, then freeze itagain. Tables 10-13 and 10-14 are, again,
Table 10-13 Breaded Frozen Products, Average Pollutants Contained In Wastewater per Unit Production
Constituent (kg/kkg finished product)
Plant Code COD BOD SS VSS Total P TKN Grease and Oil
Y 40 15 23 23 0.12 0.33 1.2
Z 66 37 30 29 0.58 4.8 —
Average 53 26 26 26 0.35 2.6 —
Table 10-14 Breaded Frozen Products, Average Wastewater Characteristics
Concentration (mg/L)
Plant Code COD BOD SS VSS Total P TKN Grease and Oil
Y 12,000 4,500 7,100 7,100 37 100 360
Z 720 400 330 320 6.3 52 —
Average 6,400 2,400 3,700 3,700 22 76 —
Volume(L/kkg)
3,300
92,000
48,000

reproductions of tables presented in thereport of the AFFI study mentioned earlier.The data shown in these tables illustrates,again, that there is a great deal of variabilityin wastewater characteristics from one plantto another and that at least some of theseplants can be expected to have relativelystrong wastes. For instance, Table 10-14shows that one of the prepared frozen foodplants producing breaded products, plant Z,was discharging wastewater characterized bya BOD5 of 400 mg/L, slightly on the strongside compared with the strength of domesticwastewater. Another plant was dischargingwastewater with a concentration of BOD5 of4,500 mg/L. This plant's wastewater was verystrong compared with domestic wastewater.
Wastes MinimizationMost of the wastes that require managementin the form of containment, treatment, anddisposal from prepared frozen food indus-trial plants have been shown to have theirprincipal source in cleanup operations, spills,and leaks. The most important steps that canbe taken to reduce to a minimum the quan-tity of wastes generated are the following:
• Pursue an aggressive, ongoing, daily pro-gram to prevent accidental spills. Spillsare the most prevalent of the preventableoccurrences that add to the quantity andstrength of discharged wastes in foodprocessing plants of all types.
• Pursue an aggressive preventive mainte-nance program to eliminate the occur-rence of leaks of water or wastewaterfrom anywhere in the plant.
• Aggressively employ technologies forrecovering lost raw materials, as well asseparating and removing contaminants.The general objective should be to treatwastes as closely as possible to the source(individual manufacturing process) andto reuse as much material as possible.
• Limit plant cleanup occurrences to asfew as possible on any given day. Plan theprocessing of different products so as to
change what is being produced on eachline as few times per day as is feasible.
• During plant cleanup, use dry methodssuch as brooms, air squeegees, and shov-els to remove as much of what needs tobe cleaned up as possible. This materialbecomes solid waste, which can probablybe treated and disposed of, or used asanimal feed via a rendering facility, atmuch less cost than for wastewater treat-ment.
• Never let water run at wash stations notin use. Water should be turned on byhand-, knee-, or foot-actuated valvesand should turn off automatically whenthe user is finished.
• Never leave water running in hoses thatare not in use.
• Make sure ingredients of all detergentsare known and scrutinized to ensurecompatibility with wastewater treat-ment processes.
The AFFI study found that the attitude ofplant management was an extremely impor-tant factor regarding the quantity of wastesthat ultimately required handling and treat-ment. One specialty food processing plantemployed continuous monitoring to keeptrack of the loss of valuable product. Whenwaste quantity increased to 1% of the prod-uct produced, an investigation was initiatedto determine and correct the cause.
Other factors that have been shown toinfluence the quantity of wastes generated atprepared frozen foods processing plantsinclude plant size, number of shifts, relativeamounts of ingredients preprocessed at otherlocations, the cost of water, the cost of wastedisposal, the age of the plant, and the age ofthe individual processes and equipment.There definitely appears to be an economy ofscale regarding waste generated (propor-tional to product loss). Larger plants havebeen shown to generate less waste material(equivalent to "lose less product") thansmaller plants.

Treatment and Disposal of WastesTwo prominent characteristics of both solidand waterborne wastes from most processingplants engaged in the production of preparedfrozen foods are that they are amenable tobiological methods of treatment and thatthey tend to be relatively strong. For thesereasons, candidate treatment technologiesthat would appear to hold promise are com-posting, in the case of solid wastes, andanaerobic or aerobic biological treatment, forwaterborne wastes.
Solid WastesA significant portion of the solid wastestream from prepared frozen foods plantsconsists of normal industrial plant trash,such as packaging and shipping material(associated with both incoming and outgo-ing material), construction debris fromremodeling, plant expansion and regularmaintenance, and equipment and appurte-nances that are no longer usable. In fact,because packaging and shipping are suchmajor activities for this industry, the quantityof waste packaging and shipping material,such as cardboard boxes, paper boxes, paperwrapping, and strapping material, is consid-erable. Since much of this material is recycla-ble, a large portion of the solid wastes dis-posal problem can be avoided.
Success in solving waste disposal problemsby recycling is best enhanced by proper setupof storage facilities, proper arrangements fortransportation to a recycling facility, and anaggressive program for keeping recyclablematerials cleaned up around the plant andplaced in appropriate containers. Nonrecy-clable wastes can usually be landfilled, sincehazardous materials are not normallyincluded in wastes from food processingplants of this type.
Other than packaging and shippingwastes, the principal solid waste stream fromprepared frozen foods plants consists oftrimmings, rejected raw material, and otherportions of the organic (edible, for the mostpart) wastes from foods. Composting, there-
fore, presents itself as a potential disposalmethod that can accept all of this portion ofthe plant's solid waste stream and result in auseful product, namely soil conditioner andfertilizer. Another possibility for disposal oforganic solid wastes is by direct applicationon land, followed by tilling into the soil toavoid problems with odors and pests such asrodents and flies.
Waterborne WastesThree characteristics that strongly influenceselection of candidate treatment technologiesfor wastewaters from prepared frozen foodsindustrial plants are:
1. The wastes are amenable to biologicaltreatment.
2. In the case of most plants, the liquidwaste streams are relatively strong interms of concentration of BOD5, TSS(largely organic solids), and sometimesoil and grease.
3. The wastewaters tend to come in slugs,such as the high quantity of flow duringthe occurrence of plant cleanup and theemptying of processing facilities when aproduct line is changed.
The characteristic being generated inslugs, as opposed to being generated at asteady rate, strongly indicates that flowequalization should be one of the first com-ponents in the wastewater treatment system.The flow equalization device should be pre-ceded by bar racks, screens, or both, toremove large objects and screenable materi-als that would settle to the bottom of theequalization device. A grease trap or other oiland grease removal device should also beplaced upstream of the equalization device.As discussed in Chapter 7, if the equalizationdevice is a variable-depth holding basin, itshould be equipped with surface skimmingequipment as well as bottom scraping andsludge removal. The high degree of putresci-bility of food processing wastes requires thatthere be no opportunity for solids that areeither lighter than water or heavier than

water to collect and remain for any length oftime before being removed and processed.
The characteristics of amenability to bio-logical treatment, along with relatively highstrength, strongly suggest anaerobic biologi-cal treatment as a candidate treatment tech-nology, especially one of the high-rate anaer-obic technologies, such as the upflow anaero-bic sludge blanket (UASB) (a suspendedgrowth system) or one of the fixed-film sys-tems, such as the fluidized reactor or theexpanded bed reactor. These technologies arepresented and discussed in Chapter 7. Thereare two major advantages of anaerobic treat-ment technologies, as opposed to aerobicsystems. The first is a far lower requirementfor electrical energy. The second is a muchsmaller quantity (20% to 30%) of biologicalsolids generated that must be managed.
Notwithstanding the apparent advantagesof anaerobic treatment technologies, themost prevalent methods of wastewater treat-ment that have been used in the past havebeen aerobic systems. Aerobic lagoons,extended aeration activated sludge, and landdisposal have been used extensively. In manycases, wastewaters have been dischargeduntreated to municipal sewer systems wherethey were treated by means of the POTW.The principal advantage of having wastewa-ters treated by means of a POTW is conve-nience. The principal disadvantage is cost.POTW treatment normally involves a sub-stantial surcharge penalty for wastes withBOD and TSS concentrations significantlygreater than normal domestic wastewater.
Although in general food processingwastewaters are amenable to wastewatertreatment by nearly all of the available aero-bic and anaerobic treatment technologies,prepared foods sometimes involve the use ofsugar, flour, starch, and other high-carbon,low-nitrogen, and/or phosphorus sub-stances. Prepared frozen foods sometimesfall into that category. The report thatresulted from the AFFI study referenced ear-lier contained a table summarizing, by wayof averaging, the BOD5/TKN/phosphorusratios found for the five categories of pre-
Table 10-15 Carbon:Nitrogen:Phosphorus Ratios
Category BOD TKN Phosphorus
Prepared Dinners 100 2.4 1.1
Frozen Bakery Products 100 1.1 0.2
Italian Specialties 100 4.0 1.6
Chinese and Mexican Foods 100 3.7 2.5
Breaded Frozen Products 100 3.2 0.9
pared frozen food products, reproducedhere as Table 10-15.
Figure 10-6 presents a schematic of awastewater treatment facility that was in usewhen the AFFI study was conducted. Asshown in Figure 10-6, this particular waste-water treatment system, which was said tohave evolved over a considerable period oftime, was complex, had many sources of sol-ids or "sludge," and was obviously a relativelyexpensive system to operate. It is almost cer-tain that a single anaerobic system, such as aUASB or AAFEB, followed, possibly, by anaerobic polishing system, would be morereliable, efficient, and economical.
Wastepaper De-inking
Historically, paper has been produced in theUnited States primarily from virgin woodpulp. However, since the last half of the 20thcentury there has been an ever-increasingshift to produce paper from recycled fibers. Acommon process used in the production ofrecycled pulp (and subsequently paper) isde-inking.
De-inking wastes are regulated under 40CRR. Part 430, Subpart, pertaining to theDe-inking Division of the Secondary Fiberssubcategory of the Pulp, Paper, and Paper-board point source category. The SecondaryFibers subcategory includes all recycledpaper. The De-inking division includes thosesecondary fiber processes where ink isremoved prior to production of white (recy-cled) paper. The objective of the de-inkingprocess is to remove ink in order to brightenthe pulp and to remove other noncellulosicsubstances such as pigments, fillers, and

Figure 10-6 Wastewater treatment facility.
coatings. Therefore, wastes from de-inkingprocesses will contain all of these substancesplus a portion of additional substances addedin the de-inking process.
For purposes of federal regulation, thede-inking division is divided into three sub-divisions that correspond to differences infinal product production requirements, aswell as differences in wastewater characteris-tics. Those de-inking facilities that producepulp for tissue paper generally have the high-est pollutant load, in terms of daily flow,BOD5, and TSS. Those that produce pulp fornewsprint generally have the lowest pollutantloads, and those that produce fine paperssuch as office stationery, copier paper, andcomputer printout paper have pollutionalloads that are less than those of the tissuepaper mills and more than those of the news-print mills.
The De-inking Process—WastesGenerationWastepapers to be reused as secondary fiberproducts must first be sorted and classified as
to suitability for final product. Newer sec-ondary fiber processing facilities are capableof handling a much wider range of recycledpaper types, and are equipped to separate outwire, bottles, and a wide variety of unwantedforeign objects. Older mills are not as wellequipped. Once the "used" paper has beensorted, the following processes convert it to apulp product that is ready for the paper mill.In some cases, the recycled pulp is mixedwith virgin pulp. In many cases, it proceedsdirectly to the paper-making process by itself.
There are ten basic steps in the de-inkingprocess, and they are as follows:
1. Pulping2. Prewashing, heat and chemical loop3. Screening (coarse and fine)4. Through-flow cleaning (or reverse clean-
ing)5. Forward cleaning6. Washing7. Flotation8. Dispersion9. Bleaching
10. Water recirculation and makeup
CLARIFIERSACTIVATED SLUDGE
FINALEFFLUENT
CHLORINATION
SLUDGE THICKENER
TRICKLING FILTERS
PLANTEFFLUENT
RAW
SCREENING SEDIMENTATIONCENTRIFUGE
DISSOLVEDAIRFLOTATION
ANAEROBIC LAGOONS

Different de-inking facilities employ dif-ferent numbers and different sequences ofthese ten steps depending on the require-ments of the final product and the character-istics of the wastepaper. A brief description ofeach follows.
PulpingWaste paper is loaded into a pulper where itis mixed with hot water, alkali (pH = 9 to 11),and various solvents, detergents, and dispers-ants. This mixture is "cooked," which pro-duces a "stock" of the resulting pulverizedpaper. The added chemicals dissolve and dis-perse adhesives, fillers, sizes, ink pigments,binders, and coatings, all of which eventuallyend up in one or another waste stream fromthe process. A built-in coarse screen allowssmaller solids and liquids to continue on.Those solids that do not pass the screen areeither returned for another pass through thepulper or enter the waste stream.
PrewashingGross amounts of ink, clay, and other materi-als are removed by prewashing, which con-sists of fine screening, partial dewatering,dissolved or dispersed air flotation, and/orsettling.
ScreeningThe prewashed stock is next subjected toboth coarse and fine screening. The finescreens are sometimes operated under pres-sure.
Through-flow CleaningAlso called "reverse cleaning," this process istypified by a counter-current washing proc-ess. In one form, the stock flows down aninclined screen with several intermediatebarriers. The stock is sprayed with water ateach barrier, which washes substances suchas ink particles through the screen. Cleanwater is applied at the lowest barrier andrecycled. Progressively dirtier water isapplied at progressively higher barriers. Dueto the relatively large amount of water used,
this process is a significant source of waste-water.
Forward CleaningHeavy contaminants that pass through thethrough-flow and fine screening processesare the target pollutants for the forwardcleaning process. This process operates in amultistage sequence similar to that of thethrough-flow process. However, the stock ismuch more dilute (less than 1% solids).Large amounts of water are used. This wateris cleaner than that used for through-flowcleaning.
WashingThe washing process makes use of counter-current flow washing to remove ink from thestock that has not yet been successfullyremoved. Equipment includes sidehillscreens, gravity deckers, and dewateringscrews.
FlotationThose colloidal substances, including inksthat are resistant to screening and washingprocesses, are the target substances for theflotation process. Flotation does not makeuse of added water but may use coagulationchemicals, including organic polymers. Insome instances, the flotation process islocated ahead of the washing process. Thehigh pH from the pulping process sometimesaids significantly in flotation.
DispersionThose quantities of inks that are not removedby screening, through-flow cleaning, forwardcleaning, washing, and flotation are dis-persed in order to make them undetectablein the finished paper.
BleachingBleaching of the recycled pulp is highly spe-cific to each individual mill. Bleaching can bedone in the pulper, just after prewashing, orafter flotation and dispersion. Bleaching

chemicals can include chlorine, chlorinedioxide, peroxides, and/or hydrosulfites.
Water Recirculation and MakeupWhile water recirculation and makeup arenot a "step," they are inherent to each of theprocesses previously discussed.
The ten processes discussed previously arediagrammed in Figure 10-7. One of manyalternatives to the processing sequenceshown in Figure 10-7 is presented in Figure10-8. In the alternative process, some of thesteps shown in Figure 10-8 have been elimi-nated or combined, leaving seven of themajor processing steps in five processes.
Wastes Generation andWastes MinimizationDe-inking facilities produce significant solidwastes in the form of wastepaper sortingrejects, screening rejects, and sludges fromflotation and sedimentation. Air pollutantsare relatively few and are treated by use ofwet scrubbers, which creates more wastewa-ter and solid waste (sludge).
De-inking facilities use very large quanti-ties of water, which can be reduced by aggres-sive application of recycle. The differentprocesses, sequence of processes, and chemi-cals used result in varying wastewater loadsand characteristics from one de-inking plantto another.
The de-inking process illustrated in Figure10-7 shows that the major source of wastewa-ter is blow-down from recycle of rinsewatersand process water makeup. To this blow-down water is added contaminated waterfrom leaks and spills, which becomes incor-porated in the second major source of waste-water, plant washdown water. The plant mustbe washed down periodically because of theleaks and spills.
Consequently, aggressive preventive main-tenance to prevent leaks and careful manage-ment of spills and cleanup become amongthe most important waste managementactivities.
Contaminants in de-inking wastewater arethose substances extracted from the wastepaper, plus a portion of the detergents, dis-persants, coagulants, and other chemicalsadded during the de-inking process. A listingof the major pollutants of concern includesadhesives, starches, clays, ink particles andcarriers, sizing, fillers, detergents, dispers-ants, coagulants, lost fiber, solvents, andbleaching chemicals.
Wastewater CharacteristicsTable 10-16 presents average values of char-acteristics of wastewater from the de-inkingindustry, as published in the EPAs Develop-ment Document for the pulp, paper, andpaperboard point source category.
Toxic PollutantsPentachlorophenol (PCP) and trichlorophe-nol are among the most common toxic pol-lutants in de-inking wastewater. The sourceof these substances is the slimicides and bio-cides used to keep the growth of troublesomebiological growths under control. This factamounts to strong indications of biologicaltreatment as a candidate treatment processfor de-inking plant wastewaters.
Wastes MinimizationMinimization of wastes from the de-inkingindustry is best accomplished by the follow-ing:
• Substitution of nontoxic chemicals fortoxic chemicals
• Aggressive pursuit of good housekeeping• Preventive maintenance to eliminate
leaks• Equipment modifications to prevent
spills• Reuse of water to the maximum extent
feasible• Recovery of usable fiber• A continuous program to reduce usage
of water

Figure 10-7 Ten-step de-inking process flow diagram.
WastewaterFeed
PulpingChemicals
Washing
Dispersion
FinalStockChest
WhiteWaterChest
MakeupWater
Dilution andReverseCleaning
ForwardWashing
Flotation
Clarifier
Blowdown(Wastewater)
SolidsRemoval
Sludge
Dilutionand
Screening
One-StageBleaching
Prewashing
Stock
PulperHeat&
ChemicalChest
ClarifiedWaterChest

FinalStockChest
MakeupWater
Dilution andReverseCleaning
ClarifiedWaterChest
Sludge
Blowdown(Wastewater)
WhiteWaterChest
Clarifier
DispersionChemicals
Sludge/Foam
ForwardWashing
Flotation/Dispersion
Dilutionand
Screening
Screenings
Pulping andBleachingChemicals
StockPulperwithBleaching
WastepaperFeed
Figure 10-8 Seven-step de-inking modified process flow diagram.

Wastewater TreatmentAfter substitution of nontoxic materials fortoxic materials, the most advantageous tech-nology for treatment of wastewaters from thede-inking industry has often been deter-mined to be aerobic or anaerobic biologicaltreatment. When preceded by appropriateprimary treatment—for instance, pH neu-tralization, screening, flow equalization, andprimary clarification—biological secondarytreatment has garnered a history of success.Because of low nutrient levels, it is necessaryto add sources of nitrogen, phosphorus, andsome trace nutrients. The following biologi-cal treatment technologies have been used.
Aerated LagoonsAerated lagoons have been used extensivelyfor the treatment of wastewaters from manypulp- and paper-related industries, includingde-inking wastes. Two attractive features ofaerobic lagoons for these and other industrialwastes are (1) the low-stressed nature of thesystem, owing to relatively low organic load-ing rates, and (2) the fact that a significantfraction of aeration is atmospheric, asopposed to mechanical, or by way of diffus-ers. The low organic loading rates result inthe ability to absorb shock or "spike" loadsand require relatively low intensity of opera-
tor attention, and the atmospheric aerationresults in lower costs for power. As is the casewith all lagoons, aerated lagoons must belined to protect the groundwater.
Oxidation BasinsOxidation basins have been used in southernregions, where higher temperatures favorhigher biological reaction rates and moreintense sunlight provides more energy foroxygen generation by algae. These lagoonsshould be preceded by primary treatment,have excellent buffering capacity againstshock loads, and have no mechanicalrequirements. These facilities must be linedto protect the groundwater.
Activated SludgeModifications of the activated sludge processthat have been used with success to treatwastewaters from de-inking include com-plete mix, conventional, tapered aeration,step aeration, contact-stabilization, and pureoxygen. A two-stage activated sludge processhaving a detention time of four hours and anintegrated selector was discussed in thedevelopment document as being particularlyeffective for the treatment of wastewatersfrom de-inking.
Table 10-16 De-inking Wastewater—Average Values of Untreated Wastewater Characteristics by Subdivision*
Flow BOD5 TSS
kL/kkg kgal/ton kg/kkg Ib/ton kg/kkg Ib/ton
Fine Papers 88.1 21.1 37.3 74.6 174.1 348.1
Tissue 136.9 32.8 87.2 174.3 251.0 501.9
Newsprint 67.5 16.2 15.9 31.7 96.8 193.5
Toxic Pollutants—De-inked Pulp for Tissue Papers
2,4,6—Trichlorophenol, wg/L Pentachlorophenol, wg/L PCB-1242, wg/L
8.8 4.8 21.3
* All values obtained from the Development Document for Effluent Limitations, Guidelines, and Standards for the Pulp, Paper,and Paperboard Point Source Category, Tables V-14 and V-33.

Anaerobic Contact FilterThe anaerobic contact filter is essentially anonaerated trickling filter. This technologyhas proved to be successful at several de-ink-ing facilities. Detention times of up to threedays have been used.
Die Casting: Aluminum, Zinc, andMagnesium
Die casting is one of the oldest methods usedto shape metals. The metal or metal alloy ismelted, then poured into a prepared moldand allowed to cool. The molded piece isthen removed from the mold and processedfurther by one or more of a great variety ofprocesses. The mold, depending on the proc-ess used, may be used again as-is, may berebuilt to varying degrees and used again, ormay be completely destroyed during theprocess of removing the shaped piece. Moldsare normally made of a metal or metal alloythat has a significantly higher melting pointthan the metal being molded. There are threeprincipal elements to all die castingmachines: (1) a casting machine to hold thedie into which the molten metal to be cast isinjected, (2) the mold itself that receives themolten metal and is capable of ejecting thesolidified product, and (3) the casting metalor alloy. First, the metal is melted and anydesired additives are added. Then, a source ofhydraulic energy impacts a high velocity tothe molten metal, causing it to rapidly fill thedie. The die must absorb the stresses of injec-tion and dissipate the heat from the moltenmetal.
Two types of die casting machines are incommon use. The first is an air-operatedmachine. Compressed air forces the moltenmetal (or metal alloy) into the die by exertinghigh pressure on the surface of the moltenmetal in a special ladle referred to as the"goose." The second type of die castingmachine has a cylinder and piston sub-merged in the molten metal to force the mol-ten metal into the die.
There are three primary variations of thedie casting process: (1) the hot chamberprocess, used for lower-melting metals suchas zinc and magnesium; (2) the cold chamberprocess, used for higher-temperature meltingmetals such as aluminum; and (3) the directinjection process. In the hot chamber proc-ess, the hydraulically actuated cylinder andpiston are submerged in the molten metal. Inthe cold chamber process, the molten metalis fed to the cylinder and piston from a reser-voir. In the direct injection process, nozzlesdirectly inject molten metal into the dies.Large amounts of noncontact cooling waterare normally associated with the die castingprocess. Also, lubricants, referred to as "dielubes," are used to prevent adherence of thecasting to the die. Selection of the die lube isgoverned, first, by wastewater treatment anddischarge permit considerations and, second,by its performance in providing the castingwith a better finish (allowing the metal toflow into all cavities of the die) and handlingcharacteristics. Die lubes that were used his-torically contained complex phenolic com-pounds, and even PCBs have been replacedwith die lubes having a vegetable oil base.
Aluminum Die CastingFigure 10-9 presents a schematic of a typicalaluminum die casting process. Aluminumdie castings are used in automobiles andmany other products. The raw material foraluminum die castings is largely recycled alu-minum cans and other articles. The first stepin an aluminum die casting operation is tocrush, shred, and sort the raw material.Then, the raw material is melted, by use ofcoreless and channel induction furnaces,crucible and open-hearth reverberatory fur-naces fired by fuel oil or natural gas, or elec-tric resistance and electric radiation furnaces.Air flows from the furnaces to wet scrubbers.Furnace temperatures are in the range of425°F to 6000F.
Next, salts are added to remove oxidesfrom the melt and then hydrogen, which
Next Page

Anaerobic Contact FilterThe anaerobic contact filter is essentially anonaerated trickling filter. This technologyhas proved to be successful at several de-ink-ing facilities. Detention times of up to threedays have been used.
Die Casting: Aluminum, Zinc, andMagnesium
Die casting is one of the oldest methods usedto shape metals. The metal or metal alloy ismelted, then poured into a prepared moldand allowed to cool. The molded piece isthen removed from the mold and processedfurther by one or more of a great variety ofprocesses. The mold, depending on the proc-ess used, may be used again as-is, may berebuilt to varying degrees and used again, ormay be completely destroyed during theprocess of removing the shaped piece. Moldsare normally made of a metal or metal alloythat has a significantly higher melting pointthan the metal being molded. There are threeprincipal elements to all die castingmachines: (1) a casting machine to hold thedie into which the molten metal to be cast isinjected, (2) the mold itself that receives themolten metal and is capable of ejecting thesolidified product, and (3) the casting metalor alloy. First, the metal is melted and anydesired additives are added. Then, a source ofhydraulic energy impacts a high velocity tothe molten metal, causing it to rapidly fill thedie. The die must absorb the stresses of injec-tion and dissipate the heat from the moltenmetal.
Two types of die casting machines are incommon use. The first is an air-operatedmachine. Compressed air forces the moltenmetal (or metal alloy) into the die by exertinghigh pressure on the surface of the moltenmetal in a special ladle referred to as the"goose." The second type of die castingmachine has a cylinder and piston sub-merged in the molten metal to force the mol-ten metal into the die.
There are three primary variations of thedie casting process: (1) the hot chamberprocess, used for lower-melting metals suchas zinc and magnesium; (2) the cold chamberprocess, used for higher-temperature meltingmetals such as aluminum; and (3) the directinjection process. In the hot chamber proc-ess, the hydraulically actuated cylinder andpiston are submerged in the molten metal. Inthe cold chamber process, the molten metalis fed to the cylinder and piston from a reser-voir. In the direct injection process, nozzlesdirectly inject molten metal into the dies.Large amounts of noncontact cooling waterare normally associated with the die castingprocess. Also, lubricants, referred to as "dielubes," are used to prevent adherence of thecasting to the die. Selection of the die lube isgoverned, first, by wastewater treatment anddischarge permit considerations and, second,by its performance in providing the castingwith a better finish (allowing the metal toflow into all cavities of the die) and handlingcharacteristics. Die lubes that were used his-torically contained complex phenolic com-pounds, and even PCBs have been replacedwith die lubes having a vegetable oil base.
Aluminum Die CastingFigure 10-9 presents a schematic of a typicalaluminum die casting process. Aluminumdie castings are used in automobiles andmany other products. The raw material foraluminum die castings is largely recycled alu-minum cans and other articles. The first stepin an aluminum die casting operation is tocrush, shred, and sort the raw material.Then, the raw material is melted, by use ofcoreless and channel induction furnaces,crucible and open-hearth reverberatory fur-naces fired by fuel oil or natural gas, or elec-tric resistance and electric radiation furnaces.Air flows from the furnaces to wet scrubbers.Furnace temperatures are in the range of425°F to 6000F.
Next, salts are added to remove oxidesfrom the melt and then hydrogen, which
Previous Page

COOLINGTOWER
To FinishingDepartment
Scrap
TRIMMACHINE
Die Casting Water
DIE CASTINGMACHINERAM
Die Casting Water
Casting
HOLDINGFURNACE
MELTER
SCRUBBER
ExhaustWater
Wastew
ater
Die Lube Spray
DIE LUBE TANK
QUENCHTANK
WASTEWATERTREATMENT Discharge or
Recycle
Sludge toLandfillOil
Disposal
Figure 10-9 Schematic of an aluminum die casting process (from the EPA Development Document, 1980).

causes voids in the product casting, isremoved by addition of dry, chemically purenitrogen, argon, or chlorine.
The next step is to lubricate the die, whichis normally done by automatic spray. Then,the molten metal is injected into the mold.Cold chamber processing is typically used fordie casting aluminum. Processes referred toas gating and risering are sometimes used tominimize shrinkage and to produce direc-tional solidification.
Quenching in a water bath is then used torapidly cool the casting to room tempera-ture. Oil, salt baths, and various organicsolutions are alternative quenching solutions,but water is most often used. After quench-ing, the casting is sometimes "heat treated"by holding the casting at a temperature of95°C to 2600C. This process is sometimesreferred to as "aging." Finally, the casting iscleaned by use of alkaline and/or acid solu-tions.
Zinc Die CastingFigure 10-10 presents a schematic diagram ofa typical zinc die casting process. The firststep is to crush the scrap metal and prepare itfor melting. Then, the metal is melted attemperatures between 325°F and 475°F.Next, the molten metal alloy, having a typicalmixture of 1% copper, 3.9% aluminum,0.06% magnesium, and the rest zinc, ismaintained at the desired temperaturewithin ±6 degrees in the holding furnace.After the die has been lubricated, the moltenzinc alloy is injected into the mold. The hotchamber process is used. After solidifying,the casting is extracted, trimmed, thendropped into a quenching tank. Finishingmay include texturing by acid-etching orother process, electroplating, or polishing.
Magnesium Die CastingMagnesium die casting follows approxi-mately the same procedure as that shown forzinc die casting in Figure 10-11. Magnesiumalloy typically contains zinc plus aluminum,
beryllium, nickel, and copper. Oxygen maybe released from the molten alloy by use of aflux (magnesium chloride, potassium chlo-ride, or sodium chloride) or by use of a flux-less process that uses air/sulfur-hexafluoride.The temperature of the molten alloy is heldin the range of 475°F to 525°F by use of acrucible furnace. Before it is injected into thedie, the molten alloy is surface skimmed toremove oxides, and the die is lubricated verylightly (or, in some cases of magnesium diecasting, not at all).
The molten alloy is injected using the hotchamber procedure. Relatively low pressureis used. After solidification the casting isextracted, quenched, and then finished byuse of grinding.
Waste Streams and Waste ManagementWaste streams from each of aluminum, zinc,and magnesium die casting processes havesimilar sources, and the waste substances arecharacteristic of the alloys used and the stateof cleanliness of the raw material. The fol-lowing is an itemization of sources of wastescommon to all three die casting processes,with comments as to treatment.
Heating FurnaceOff-gases are normally treated by wet scrub-bers. Sludge from metal residuals develops inthe bottom of the furnace and can be recov-ered.
ScrubbersWet scrubbers are used extensively at die castfacilities. Ammonia, cyanide, magnesium,phenols, sulfide, copper, iron, and zinc, aswell as total suspended solids (TSS) and oiland grease, are waste substances that arecommon to the scrubber blow-down from allthree types of facilities. In addition, alumi-num and nickel are found in scrubber blow-down from aluminum die casting facilities.Copper is found in scrubber blow-downfrom magnesium die casting facilities, andcopper is a normal ingredient of scrubberblow-down from zinc die casting facilities.

Water
SCRUBBER
Wastew
ater
MELTER
Die Lube Spray
Die Cooling (NC)
HOLDING
FURNACE
DIE LUBE TANK
DISCHARGE OR
RECYCLE
WASTEWATER
TREATMENT
OIL
DISPOSAL
SLUDGE TO
LANDFILL
QUENCH TANK
Casting
Figure 10-10 Schematic of a zinc die casting process (from the EPA Development Document, 1980).
RAM
COOLINGTOWER
DIE CASTING
MACHINE
TRIMMACHINE
SCRAP
TO FINISHING
DEPARTMENT

Figure 10-11 Schematic of a magnesium die casting process (from the EPA Development Document, 1980).
VACUUMPUMP
L.F.
PRE-COAT
POLYMER
OIL
RECEIVINGTANK
FILTRATE
PUMP5.9 GPM(0.37 1/sec)
HOLDING
TANK
71 GPM
(0.45 1/sec)
47 GPM(3.0 1/sec)
ALUMINUM
DIE CASTING
PLANT
ZINC
DIECASTING
PLANT
14 GPM(0.88 1/sec)
MISC. WATERS
68 GPM(4.3 1/sec)
ALUM NaOH H2SO4
O/F
TO RECEIVING
TANK
TO RIVER
67 GPM
(4.2 1/sec)

Treatment of scrubber blow-down after recy-cle is carried out to the maximum extent itcan be by precipitation, coagulation, sedi-mentation, filtration, and ion exchange.
QuenchThe molded product is allowed to cool justenough to solidify in the die. It is then ejectedinto a water bath, or "quench tank." Thewater bath is continually renewed to preventthe buildup of impurities to levels that wouldadversely affect the casting and to keep itcool. The overflow goes to wastewater treat-ment. The principal objective of water man-agement in the die casting industry is to recy-cle as much of the treated wastewater as pos-sible. A certain fraction must always be bled,or "blown-down," from the system and anequal amount of clean water replaced, or"made up," thus eliminating the possibility ofcomplete recycle. The fraction that must beblown down is a function of the maximumconcentration allowable in the quench tankof the substance that is least well removed inthe wastewater treatment system. Blow-downfrom the quench tanks contains metal resid-uals, plus substances used to lubricate thedies. Biological treatment has been used suc-cessfully where the die lube has been derivedfrom vegetable oils. Metals have been a prob-lem and have resulted in the necessity of dis-posing of the dewatered sludge as hazardouswaste.
Die CastingSurface cooling sprays and machine andfloor wash-down waters, together with leaksfrom hydraulic systems, leaks from noncon-tact cooling water piping, and, in some cases,intermingling of all of the above with quenchwater, produce a waste stream that must bemanaged. Where all substances in this wastestream have been carefully selected to be bio-degradable, including the hydraulic oils andthe detergents used for machine, floor, andgeneral plant cleanup, biological treatmenthas been used successfully.
FinishingWaste characteristics differ between the threedie casting processes. In the case of alumi-num die casting, trim pieces are knocked offmechanically, as well as by hand. The solidwaste stream that results is recycled back tothe scrap aluminum crusher at the head ofthe process, and associated oils, greases, and"dirt" thus become a portion of the wastediscussed earlier. In the case of magnesiumand zinc die casting, trimming is done bygrinding, which creates dust. The wastes(dust) from this grinding operation are cap-tured by scrubbers. The scrubber blow-downthen becomes the principal waste streamfrom the magnesium die casting finishingprocess. This waste stream can be treated bychemical precipitation, coagulation, sedi-mentation, and filtration. Recycle and reuseof the clarified effluent as quench water,cooling water, and/or plant wash-down watercan significantly reduce overall waste dis-charges from the plant. Since lead and zincare listed as toxic pollutants, all steps in thewaste treatment and recycle system must becarefully managed.
Additional Waste ManagementConsiderationsSeveral substances that have normally beenused in aluminum, magnesium, and zinc diecasting operations are listed as hazardous.These substances include degreasing sol-vents, such as perchloroethane, perchloro-ethylene, trichloroethane, and other chlori-nated solvents, as well as cyanide, copper,lead, zinc, and nickel. In some cases, phe-nolic compounds are present. The followingdiscussion is arranged such that categories ofpollutant substances are grouped, regardlessof the individual sources, and treatmenttechniques are presented.
SolidsAs discussed in Chapter 7 under PhysicalTreatment Methods, suspended (TSS) andsettleable solids are normally removed fromwastewater streams by sedimentation, fol-
lowed by, or along with, chemical coagula-tion. Plate or tube settlers are often used.These processes can be followed by filtration.Dissolved solids, such as dissolved metals,can be removed by alkaline precipitation fol-lowed by sand or other filtration. Pressure fil-tration has been used with success. Other fil-tration processes that have been used prior torecycle and reuse or direct discharge includevacuum filtration and ultrafiltration. Result-ing sludges and filter cakes must be disposedof as hazardous waste, unless they fall in acategory that has been "delisted."
Dissolved OrganicsDissolved organics in wastewaters from diecasting processes can be successfully treatedby biological processes, if care is taken toensure that all products used in the manufac-turing process contain only biodegradableorganic substances.
Dissolved InorganicsThe principal dissolved inorganics in wastesfrom die casting processes include the metalbeing cast, plus those added as alloys, andtheir salts. Other inorganic substancesinclude sodium, calcium, compounds of sul-fur, nitrogen, and chloride and those addi-tional inorganics included in proprietaryproducts. In general, alkaline, carbonate, sul-fide, or phosphate precipitation, followed bysedimentation and filtration, are used toremove the metals. As discussed in Chapter7, the solubility characteristics of the variousmetal hydroxides, carbonates, sulfides, andphosphates must be carefully consideredwhen designing a metal removal process. Inaddition, the toxic or other hazardous char-acteristics of the treatment residuals are amajor factor regarding treatment and dis-posal of these wastes.
Oil and GreaseThe two principal methods for removingsubstances that are measured and reportedas"oil and grease" are mechanical skimmingfor the nondissolved fraction and chemical
coagulation (sometimes with just pH adjust-ment), often with dissolved air flotation, forthe dissolved and/or suspended (includingemulsified) fraction. Ultrafiltration orreverse osmosis can be used as polishingsteps, or, in some cases, as the only methodfor removal of oil and grease.
Destruction of PhenolicsEvery effort should be made to exclude phe-nolic substances from die casting processingand cleaning materials, and thus from thewastewater. Where unavoidably present, sim-ple phenolic compounds can quite easily beremoved by biological treatment. Some com-plex phenolics must be removed by activatedcarbon adsorption, which must be precededby sand (or other) filtration.
Anodizing and Alodizing
Anodizing and alodizing are industrial proc-esses that enhance the property that somemetals have of forming a protective coatingof the metal oxide on their surfaces. Thislayer of metal oxide is quite stable and pro-tects the metal from further contact withoxygen, hydrogen ions, and other substancesthat would otherwise cause further corro-sion.
Anodizing is an electrochemical process;alodizing is a strictly chemical process. Bothprocesses act to produce a thicker, moreeven, and more predictable coating thanwould be formed naturally. In addition, theanodized or alodized metals have a strongaffinity for paints and other organic coatings.
The processes by which anodizing oralodizing coatings form are complex. Basi-cally, oxygen from the hydrolysis of water, inthe case of anodizing, reacts with the metalitself to produce two results. One is the for-mation of pits on the surface of the metal; theother is the formation of metal oxide mole-cules and ions. The next step is an attach-ment of the metal oxide species to the newlyformed surfaces of the pits. As this processprogresses, the local areas on the metal sur-

face where the process has taken placebecome nonreactive. Consequently, thoselocal areas that have not yet been coatedbecome somewhat more reactive, until theentire surface of the metal becomes coated.
In nature, this progressive process is sel-dom complete. There are almost always localareas on the metal surface that are not com-pletely coated and are thus exposed to addi-tional corrosion. The controlled industrialprocesses have the objective of taking theprogressive self-coating process to comple-tion.
The thickness of the protective metaloxide coating can be increased by increasingthe intensity of the electrochemical (in thecase of anodizing) or chemical (in the case ofalodizing) process and the time over which itis allowed to take place. Thus, there is controlover the product in terms of money spent(energy, chemicals, and time).
AnodizingWhen aluminum, for example, is placed inan electrolytic (good conductor of electriccurrent) solution and is made the anode,oxygen from the electrolysis of water reactswith the aluminum at its surface, as illus-trated by the following simplified reactions:
2H2O +Elect-± O2 + 2H2 (10-2)
2Al + 3O2 ->2A/O3 (10-3)
As aluminum atoms are extracted fromthe surface of the metal, pits are formed. Aswell, the surfaces of the pits are particularlyreactive, probably because of the availabilityof electrons for covalent bonding. The alu-minum oxide that is in the process of form-ing also has available electrons; therefore,aluminum oxide bonds with the "raw" metalsurface of the pits, forming a relatively stablecomplex.
The desired properties of the electrolyteare that it conducts electric current effi-ciently and is a good solvent for the metal
species (aluminum ions, partially formedaluminum oxides) involved in the electrolysisprocess. It should not, however, be a solventfor the final coating product, which is thealuminum oxide-aluminum metal complex.
The electric current intensity, electrolytecharacteristics, temperature, and processduration all influence the characteristics ofthe pitting and the thickness and integrity ofthe coating. Higher applied voltage increasesthe speed of oxidation, the size of the pits,and the thickness of the coating. Longerduration increases coating thickness. Tem-perature and electrolyte characteristics influ-ence the rate of dissolution of the metal sur-face. Electrolyte characteristics affect poredensity. For instance, use of sulfuric acid willresult in more than twice the number ofpores generated, compared with use of chro-mic acid.
The size and density of the pores affectabrasion resistance as well as the capacity ofthe coating to absorb dyes for coloring andpaints for desired surface characteristics.Generally, coatings with a higher density ofsmaller pores have higher resistance to abra-sion.
AlodizingAlodizing produces a protective oxide coat-ing on metal surfaces similar to that pro-duced by electrolysis, but the process ispurely chemical. Often, the metal to becoated is "dipped" in an acid solution con-taining chromate, phosphate, and fluorideions. Alternatively, coatings can be applied bybrushing or swabbing. The acid acts to dis-solve metal from the surface, which thenreacts with oxygen in the alodizing bath toform the metal oxide, which then reacts withthe newly exposed metal surface to result inthe protective metal oxide coating. The coat-ing formed by alodizing is characteristicallythinner and has less abrasion resistance thandoes the coating formed by anodizing.Alodizing is an economical alternative toanodizing if resistance to abrasion is notrequired.

Processing Steps and WastesGenerationThe anodizing and alodizing processes havesimilar steps that produce wastes. The basicproduction steps are: cleaning, rinsing, deox-idizing, rinsing, etching, anodizing or alodiz-ing, rinsing, coloring, rinsing, and sealing.All steps produce wastes, described as fol-lows.
CleaningThe cleaning of metal objects to be processedproduces various wastes. If degreasing isrequired, an important waste that must bemanaged is the waste solvent, as well as thesubstance removed. In general, the mostappropriate way to manage the waste sol-vents is to regenerate for reuse, then disposeof the residuals. For instance, if a chlorinatedsolvent is used for degreasing, regeneration isaccomplished by use of a still. The still bot-toms are then treated and disposed of by oneof the methods described in Chapter 7.
RinsingIn general, rinsing after any of the five proc-essing steps (cleaning, deoxidizing, etching,anodizing or alodizing, and coloring) pro-duces wastes that are simply dilute forms ofthe wastes produced directly by those proc-essing steps. Often, rinsing wastes are bestmanaged by operating the rinsing process ina counter-current mode, where two or morerinsing baths are used for each of the proc-essing steps. Clean makeup water is continu-ally added to the final rinse tank, which over-flows in the rinse tanks that precede it in theprocessing steps, and so on, if more than tworinse tanks are used. The overflow from thefirst rinse tank after each processing step,anodizing, for instance, is then used asmakeup water for the process itself.
Deoxidizing and EtchingDeoxidizing and etching are both done witheither caustic or acid solutions. Deoxidizingmay use both, in series, if the metal to beanodized or alodized is badly oxidized. The
purpose of deoxidizing is to remove oxidesthat have formed naturally but in an undesir-able manner. The purpose of etching is toexpose a clean, fresh metal surface for theanodizing or alodizing process. Wastes con-tain spent acid or caustic solutions and ionsof the metal being coated.
Anodizing or AlodizingThe spent acid baths from the anodizing oralodizing process constitute the major wastefrom the coating process. These solutionsmust be maintained above a certain qualityfor the coating processes to be satisfactory.Build-up of metal salts (from the metal beingcoated) must be kept below a level wherethey interfere with the anodizing or alodizingprocess. Also, as the solution is weakened bydrag-in from the previous rinse process, theactive ingredients must be made up to main-tain a required minimum concentration. Incontinuous flow anodizing or alodizingoperations, continuous makeup of water andactive ingredients can maintain successfuloperation for a period of time; however, asthe acid or alkali bath solutions continuallyattack the metal being coated, eventually thebath must be dumped and the processrestarted with new anodizing or alodizingsolution. These dumps of spent solutions,which normally occur about once permonth, represent a major waste stream.
ColoringColoring, if included in the process, pro-duces wastes that are specific to the coloringprocess being used.
Tables 10-17 and 10-18 present typicalwastewater sources with typical flows andcharacteristics from an aluminum anodizingoperation, which includes acid polishingprior to the caustic etch. The process alsoincludes a coloring process.
Wastes MinimizationAs discussed previously, wastes from rinsingcan be minimized and sometimes eliminatedby use of counter-current rinsing and by

using the most concentrated rinse wastes asmakeup water for baths that precede thatparticular rinse. Other waste minimizingalternatives include use of air squeegees tominimize dragout and use of either staticrinses or maintaining makeup water flow-through at as low a rate as possible. Strictadherence to the rule of turning water off
Table 10-18 Wastewater Sources
Extrusion
Extrusion Press Cooling Tower NegligibleBlow-down
Extrusion Press Die Quelch 1,300
Caustic Die Cleaner 1,300
Fabrication Negligible
Finishing
Tap Water Rinses 52,000
Tap Water Sprays 2,400
Chiller Cooling Water Rinse 10,000
Deionized Water Rinse 2,000
Demineralized Water Rinse 15,000
Rectifier Cooling Water Rinse 15,000
Periodic Tank Dumping 3,500
Miscellaneous
Air Compressor Cooling Water 12,500
Regeneration of Water Deionizer Negligible
Demineralizer and Softener Units
Boiler Water Blow-down Negligible
Total 101,000
when the rinse line is not in use is an abso-lute requirement. Regarding the processingbaths, which may include cleaning baths,deoxidizing, caustic etching, acid etching,anodizing, alodizing, and coloring, all solu-tions should be rebuilt and/or maintained atworking strength according to need based onwork done rather than by a regular timetable.
In some cases usable and even marketableproducts have been prepared from spent acidetch solutions. When aluminum is the metalbeing coated, sodium hydroxide can berecovered using the Bayer reaction. This canbe accomplished by operating the causticsoda etch tank (where applicable) so as tofavor movement of the following chemicalequilibrium to the right:
NaAlO2 +2H2O
-> Al(OH)3 +NaOH ( 1 ° " 4 )
When operation is conducted in such amanner, it is said that the etching bath isoperated in a metastable range. However,crystallization nuclei are needed for sodiumaluminate to decompose to sodium hydrox-ide and aluminum hydroxide. A process pat-ented by Alcoa introduces the waste etchsolution to a reactor that contains 300 to 500g/L aluminum hydroxide. Precipitated alu-minum hydroxide is separated from thesodium hydroxide solution by filtration, andthe sodium hydroxide solution is returned tothe caustic etch process. The aluminum
Table 10-17 Wastewater from an Actual Anodizing Plant (anodizing capacity of the plant:2,500 tons aluminum per month)
Description Alkaline Wastewater Acidic Wastewater Rinsewater
pH Strong alkaline solution Strong acidic solution 4-5
Liquid Temp. (0C) 15-60 15-60 15-25
NaOH (%) 5-7 — —
H2SO4 (%) — 15 —
Al3+ (%) 5.0-9.0 1.5-1.8 —
SS*(mgl) — — 100-200
Flow Rate 56 cu m/day 60 cu m/day 250 cu m/hr
* Primarily insoluble Al(OH)3.

hydroxide can be marketed as a waste treat-ment chemical.
Another method that combines wastetreatment (of the caustic etch wastes) withwastes minimization is to precipitate andrecover calcium aluminate from spent causticetching solutions. High-calcium lime thatcontains aluminum ions at a high pH isadded to the spent etch solution. The recov-ered calcium aluminate can be sold or givento a cement manufacturer to be used as anadditive. Spent caustic etch solutions havebeen processed as shown by the followingchemical reaction:
NaAlO2 +2SiO3Na2 +9H2O
-> ANaOH + Al2O3 ^Na2O^ 2SiO2
(10-5)
The product, nephelin hydrate, can bemarketed as a toilet-cleaning product.
Regarding spent acid etch solutions, astrong base ion exchange resin can be used toseparate the acid from its salts.
Waste Treatment and DisposalTreatment and disposal of wastes, includingsolid wastes and liquid wastes, are bestaccomplished by recovering substances forreuse wherever feasible and then treatingremaining waste solutions and solids usingthe procedures presented in Chapter 7 so asto produce as few residuals for disposal aspossible. For instance, spent acid and causticsolutions can be combined to produce waterand nonhazardous salts such as sodium sul-fate. Precipitated metal salts can be treatedand conditioned so as to enable disposal asordinary nonhazardous waste.
Production and Processing of Coke
Coke is a dark gray, porous solid that is pro-duced when pulverized soft coal is heated inan oxygen-deprived atmosphere. It contains87% to 89% carbon and burns with intenseheat and very little smoke. Coke is used as
fuel in blast furnaces for the manufacture ofiron and steel.
The Coking ProcessThe process of producing coke involves heat-ing coal to about 2,0000F. Many of theorganic substances that make up coal volatizeat that temperature, leaving the "coke"behind. The volatilized gas is then subjectedto sequentially lower temperature condens-ing chambers (as shown in Figure 10-12),which capture tar (a mixture of many rela-tively heavy organic compounds), oils, lightoils, and then low-molecular-weight gases.The separated coke is then used as fuel or as acomponent of steel. Often, some of the cokeis used as fuel in the same coke ovens whereit was produced. Production of coke is one ofthe major processes in an integrated steelmill.
As illustrated in Figure 10-12, the firstcompounds (highest condensing tempera-ture) to be recovered are tars. Some cokeplants recover several high-molecular-weightmaterials from several separate high temper-ature condensers. Others simply use only onehigh-temperature condenser, which collectsall of the high-molecular-weight com-pounds together as the tar. The next succes-sively lower-temperature condensers collectoils, then light oils, and finally low-molecu-lar-weight (e.g., methane, ethane, propane,etc.) gases.
The heating of the coal is done in narrow,rectangular, silica brick ovens. The ovensstand in groups of 10 to 100 or more, calledbatteries. After about 18 hours of "cooking,"the remaining substance, "coke," whichamounts to 1,300 to 1,550 pounds for eachton of coal heated, is pushed into a quench-ing car that transports the coke to quenchingtowers. Here, the coke is sprayed with waterto lower the temperature. About 35% of thiswater evaporates and leaves the system assteam or water vapor. The remaining waterdrains to a settling basin where the coke finesare removed.

The vaporized organics produced in theovens are withdrawn during cooking byexhausters and then sprayed with water inthe first of several condensers. The sprayedwater saturates and cools the gas, causingcondensation of the tar. The mixture of"flushing liquid" or "flushing liquor" and tarflows to a separator where the water isdecanted. The remaining gas flows onthrough a tar extractor, which is an electro-static precipitator, which removes most ofthe remaining tar.
Ammonia can also be recovered from theflushing liquid, using one of two methods:the semidirect or the indirect processes. Inthe semidirect process, ammonia is recoveredby use of an ammonia absorber or saturatorafter the tar extractor. The gas is brought intocontact with 5% to 10% sulfuric acid solu-tion, causing ammonium sulfate to precipi-tate. The crystals of ammonium sulfate aredried and sold. In the indirect process, someof the ammonia dissolves into the flushingliquor. More ammonia is scrubbed from thegas with water and mixed with the flushingliquor. The flushing liquor is then distilled,dephenolized, and the recovered ammonia ismarketed.
The phenol that is removed from theammonia liquor is recovered as sodium phe-nolate. Light oil is recovered as the gas passesthrough a scrubber that uses an absorbentknown as straw oil. The straw oil absorbs 2%to 3% of its weight of light oil. The remaininggas is then used for fuel, either on site ormarketed. Steam distillation is then used tostrip the oils from the straw oil that was pre-viously the absorbent. The wash oil is thencooled and returned to the scrubbers as illus-trated in Figure 10-12. Hydrogen sulfide isremoved from the coke oven gas after thelight oil scrubbers.
Sources of WastesThe production of coke gives rise to consid-erable solid, airborne, and waterbornewastes. Phenolic compounds, which make upa considerable portion of coal, are found in
wastes discharged to all three media. It isessential, then, to determine the statusregarding hazardous nature of all wastes aspart of wastes management.
Solid WastesSolid wastes from the production of cokeinclude reject coal, reject coke, sludges fromclarification of quench water, as well as nor-mal packaging and shipping wastes. Theseare in addition to the normal solid wastestream from most "typical" industrial facili-ties, which includes construction debris fromplant maintenance, repair, and expansion.Also, there are normally items of broken orworn out equipment that must be managed.
Airborne WastesAir pollution is a major concern at coke pro-duction facilities. Blowing coal dust must becontrolled by containment. Since the cokingprocess is a heating and vaporization process,emissions from the oven stacks must be con-trolled. Also, there is the need to contain thevapors to prevent loss via fugitive emissionsor directly out of one or more stacks. Electro-static precipitators, bag houses, and wetscrubbers are used in conjunction withaggressive preventive maintenance to avoidleaks.
Waterborne WastesThe principal sources of wastewater from theproduction of coke are as follows:
• Excess flushing liquor• Final cooling water overflow• Light oil recovery wastes• Condenser wastes from the crystallizer• Gas stream desulferization• Sludges from air pollution control
equipment• Coal pile runoff• Overflows from sumps, including the
quench sump
The major source of wastewater is flushingliquor. The quantity of this wastewater varies

WASH OIL
FROM BENZOL
PLANT
WASH OIL
TO BENZOL
PLANT
GAS
SCRUBBER
FINAL
COOLER
NAPHTHALENE
SKIMMER BASIN
NAPHTHALENE
SUPPLY
MAKEUP
WATER
COOLING
TOWER
SULFURICACID
TO STORAGEFACILITIES
COOLINGWATER
BENZOL WASTES
AMMONIASULFATE
AMMONIA
TAR
WATERSUPPLY
TAR
TO STORAGEFACILITIES
COKE
FRESH WATERSUPPLY(INTERMITTENT)
WHARF
TAR
TAR
AMMONIA LIQUOR(EXCESS)
AMMONIALIQUOR
STORAGE
COKE
QUENCHSTATION
SETTLINGBASIN
SPRAYWATER
DECANTER
FLUSHINGLIQUOR
TARSEPARATOR
PRIMARYCOOLER
COKE
COKEOVENS
COAL SUPPLY
WATER SUPPLY
COOLINGCOILS
WATER RETURN
COOLING LIQUOR
EXHAUSTER
TARCOOLINGLIQUOR(EXCESS)
TAR
EXTRACTOR AMMONIAABSORBER
CRYSTALIZERSYSTEM
FINAL COOLINGSYSTEM OVERFLOW
OR CLEANOUT
TO TREATMENTPLANTRAILROAD CAR
TO COKE USERS
Figure 10-12 The coking process for producing coke and byproducts (from the EPA Development Document-, 1973).
WHARFDRAINAGE
COKE HNESRECLAIMED
MAKEUPWATER

with the moisture content of the coal andwith the process used for recovery of ammo-nia. Since it the first water to come into con-tact with the coke oven gases, it has the high-est concentrations of pollutants. Contami-nants include ammonia, phenol, sulfides,thiocyanates, and cyanides.
Final cooling water overflow results fromspraying the gas stream with water to removeremaining water-soluble components andnaphthalene crystals. After the naphthalenehas been removed from the stream, the watercan be used for cooling. Some process waste-waters have been recycled by using them forquenching; however, caution must be exer-cised. As the water is evaporated duringquenching, pollutants remaining in the proc-ess wastewater may be volatilized, causing airpollution. Those contaminants that are notvolatilized stay with the quenched coke andthus represent a potential problem duringsubsequent use of the coke.
Wastes MinimizationCover and containment are extremelyimportant in order to minimize wastes gen-erated at a coke production facility. If it is atall possible, the coal pile should be covered toprevent contamination of stormwater. Also,it is important to cover the quenching systemand to contain the quench water; that is, tonot allow quench water sumps to overflow.In addition, the following wastes minimiza-tion measures should be strictly adhered to:
• Drips must be contained and returned tothe source.
• Aggressive maintenance must be prac-ticed to eliminate the occurrence of leaksor other "accidents" that could lead tononcontainment of chemicals and othersubstances.
• Dry methods of cleanup, includingbrooms, shovels, and dry vacuuming,should be used to the maximum extent.
• Purchasing should be guided by aggres-sive selection of raw materials to obtainthe cleanest possible materials.
• Purchasing should be guided to demandthat the packaging of materials deliveredto the plant be recyclable or otherwise oflow solid waste nature.
• There should be a constant and consis-tent program to substitute less pollutingand nonpolluting substances for thosethat require expensive treatment andexpensive disposal. For instance, low-sulfur coal should be used to the extentthat financial feasibility allows to mini-mize the quantity of sulfides and othersulfur compounds in the waste air andwater.
Air Pollution ControlControl of blowing coal dust and coke finescan only be accomplished by covering thesources. Covering has the dual benefit ofreducing wastewater by preventing contami-nation of stormwater.
Scrubbers, both wet and dry, are usedextensively at coke production facilities. Also,bag houses are used in conjunction with sys-tems that have the purpose of maintainingclean air within the work areas of the pro-duction facilities. The blow-down from thewet scrubbing systems is a significant sourceof wastewater that must be managed.
Wastewater TreatmentBiological treatment systems have been usedto successfully treat wastewaters from thecoking process, even though these wastewa-ters normally contain significant amounts oftoxic substances. Two procedures are used toovercome the toxic effects of these sub-stances. The first is to remove some of themby use of a pretreatment step. The second isto employ the process of gradual acclimationof the biological treatment system to thewastewaters.
The removal step involves combiningwastewaters from light oil recovery, finalcooling, air pollution control blow-down,and excess flushing liquor. This combinedwastewater stream is then passed through the

free leg of the ammonia still. The waste fromthis process is then increased in pH by add-ing lime. It is then passed through the fixedleg of the ammonia still, where ammonia isremoved and recovered. The effluent fromthis process is then combined with wastewa-ter from the crystallizer (see Figure 10-12)and held in a storage tank for a period oftime. The pH of the effluent from this hold-ing tank is then lowered with acid to the neu-tral range. The pretreated wastewater is nowready for treatment by a properly acclimatedbiological system.
The acclimation step involves subjectingthe biological treatment system, activatedsludge, for instance, to gradually increasinglevels of the toxic substances in the fullstrength wastewater, until full-strengthwastewater is being treated. One way toaccomplish acclimation is to develop theactivated sludge system using domesticwastewater until it is fully functional as awastewater treatment system. Then, the pre-treated industrial wastewater is added to thedomestic wastewater starting with a mix ofabout 10% pretreated industrial wastewaterand 90% domestic wastewater. When it hasbeen established that the treatment system isworking well on the 10%/90% mixture, theproportion of pretreated industrial wastewa-ter is increased, and so on, until the treat-ment system is receiving and operating wellon full-strength pretreated wastewater. Whathappens during the acclimation procedure isthat the microorganisms develop the capabil-ity to produce enzymes that can metabolizethe toxic materials in the pretreated indus-trial wastewater and that can grow and flour-ish in the activated sludge (or other biologi-cal treatment medium). Those that cannotgradually die off are replaced over time. Theresult is an "acclimated" biological treatmentsystem that is able to successfully treat thepretreated industrial wastewater.
An acclimated biological treatment systemconsisting of three extended aeration basinsin series has been developed. Phenols areremoved in the first basin, oxidation of bothammonia and cyanide takes place in the sec-
ond basin, and the third basin (nonaerated)is used to remove nitrogen via the denitrifi-cation process. It is necessary to maintainfavorable concentrations of other nutrients,such as phosphorus, in each of the biologicaltreatment basins.
Chemical-physical treatment systemshave been used with some success. One ver-sion of chemical-physical treatment has beento use chemical oxidation to destroy organ-ics, ammonia, and cyanide and then to useactivated carbon to remove unreacted sub-stances as well as partially treated substances.Oxidation is accomplished by adding chlo-rine to the pretreated wastes in an aerationbasin. Oxygen from air and chlorine are theoxidizing agents. Spent activated carbon canthen be recovered (partially) by the processof heating (incinerating).
The Wine Making Industry
Production of wine is one of the oldestendeavors of human industry. The historicalrecord shows that the Egyptians as well as theAssyrians were making wine from grapes by3500 B.C. The basic process has remainedunchanged for centuries; however, some newwine products have been developed duringmore modern times.
In the year 2000, approximately 12% ofthe world's production of wine was takingplace in the United States. About 80% of theworld production was in Europe. Californiaproduced more than 20% of U.S. wine. Otherwine producing states, in approximate orderof quantity, were New York, Washington,Pennsylvania, and Oregon.
The most widely used grape for wine pro-duction is Vitis vinifera, known as the Euro-pean grape. It is grown throughout Europe,the United States, Australia, Chile, and inregions of Asia. Other grapes used for wineproduction include Vitis rotundifolia andVitis labruscciy but it is widely agreed thatsuperior wines are produced from viniferavarieties.
The Wine Production ProcessThe basic, age-old process for producingwine includes six steps: destemming, crush-ing, pressing, fermentation, racking, andbottling. While some destemming takes placebefore crushing, destemming is also accom-plished simultaneously with the crushingprocess.
When the grapes are ripe they are pickedby hand or by use of mechanical harvesters.They are transported to the winery, which istypically close by, and are destemmed andthen crushed. The amount of destemmingthat takes place before crushing depends onthe type of wine to be made. The stemsimpart tannins to the wine and thus influ-ence the color and flavor. The product of thegrape crushing process becomes what iscalled "must," sometimes before and in somecases after the solids are removed from thejuice. The must is what then enters the fer-mentation process. If white wine is to be pro-duced, the solids, including the skins, seeds,and the quantity of stems that remain, areremoved before fermentation. If red wine isto be produced, the solids are considered partof the must. Most of the pigments in grapesare located in the skins. Depending on thecharacteristics desired in the wine product,varying degrees of care are exerted to avoidbreaking the seeds during the crushing proc-ess.
Sulfur dioxide is often used to treat themust before fermentation. In some cases,sufficient sulfur dioxide treatment is used tokill all of the yeast and other microorganismsnaturally present in the must. Then thedesired species of yeast is added. Othereffects of treating the must with sulfur diox-ide include the following: settling character-istics for solids removal are improved, thusimproving clarification (desired for somewhite wines); the color of red wines ischanged somewhat; and, in some cases, stor-age characteristics are improved due to inhi-bition of undesirable enzyme activity.
After treatment, if any, the must ispumped into tanks for fermentation. Typi-cally, some of the juice is pumped over the
top of the "cap" that forms as a result of skinsand other solids collecting on the surface.This is done to increase the extraction of pig-ments from the skins. As ethanol increases inamount during the fermentation process, itincreases the rate of extraction of pigments.
When the desired intensity of color hasbeen achieved, the partially fermented mustis pressed to separate solids from the juice, asis done prior to fermentation for whitewines. Many types of presses are used, but allhave the common objective of gently squeez-ing juice from the skins, seeds, pulp, andother solids without extracting undesirablesubstances. At this point, the solids becomepart of the waste stream, while the juice isreturned to tanks to complete the fermenta-tion process. When fermentation is com-plete, the process called "racking" is initiated.The objective of racking is as follows: afterthe grapes have been pressed to remove theskins, stems, and seeds, and most of the pulpand the juice has been returned to vats forcompletion of fermentation, a layer of sedi-ment called "the lees," composed of deadyeast cells and bits of grape fragments, formson the bottom of the vat. If the developingwine is allowed to remain in contact with thelees, off-flavors develop from decompositionof the lees. Consequently, the developingwine is racked: drawn off and placed in cleanvats.
When fermentation has proceeded tocompletion, various substances are oftenadded, which are referred to as "finingagents." Fining agents act to remove colloidalsolids and include bentonite clay, egg whites,and gelatin. After clarification by sedimenta-tion, the wine is normally filtered and thenaged in wooden vats or bottled.
Variations on the wine process include theprocesses for making brandy, dessert wines,sparkling wines, and champagne. Brandy ismade by first distilling the alcohol from thewaste materials such as the solids, or pomace,left after pressing. Then, this alcohol is addedto the wine to raise the total alcohol contentto about 20%. In some cases, brandy is added

to other wines, along with sugar and possiblyother substances, to produce dessert wines.
Sparkling wines are made by allowing thefermentation process to take place in a closedcontainer. The CO2 produced during the fer-mentation process dissolves into the wineunder pressure. In some cases compressedCO2 is added to enhance the natural CO2
content of the sparkling wine.Champagne is normally produced by add-
ing sugar and more yeast to finished wine.The yeast ferments the added sugar to pro-duce more alcohol and CO2. The processtakes place in a closed container in order toretain the CO2, as explained previously forsparkling wines.
Winemaking WastesThe six major steps in wine production allproduce wastes, either solid or liquid, orboth. Air pollution is not a normal problemin winemaking, unless unusual circum-stances result in a problem with emissionsfrom boilers or in the production of odors.Figure 10-13 presents a schematic diagram ofan example winery, where production ofboth wine and brandy take place. As illus-trated in Figure 10-13, plant cleanup opera-tions produce plant washdown wastes fromessentially all the wine making steps.
The destemming step produces wastestems and "dirt" that can be land-applied.This can usually be done without causingpollution problems. The next step, crushing,results in normal plant cleanup wastes. Thewaste lees that result from the pressing steprepresent varying quantities of waste mate-rial depending on whether or not by-productrecovery is practiced. Fermentation alsoresults in normal plant cleanup wastes, plusthe dregs from the fermentation process itself(dead yeast cells and various settled or fil-tered solids from the grapes themselves).
Racking results in sediment in the bottomof the vats as well as normal plant washdownwastes. Finally, bottling results in more plantwashdown wastes. All of the above winemaking steps, except for destemming, con-
tribute wastes in the form of lost product,including the final step, bottling, where lostwine product from spillage, overfilling, bottlebreaking, and other unintentional releasescontribute to the BOD level of the overallplant waste stream.
Wastes MinimizationAs is the case with many food processingindustries, by-product recovery can reducethe quantity of wastes that require treatment.One example is the recovery of tartrates, saltsof tartaric acid that occur in lees, pomace,and on the surfaces of wine storage tanks.Tartrates are rinsed off the surfaces of storagetanks and extracted from pomace usingwater and are then precipitated with calciumcarbonate or lime. The dried precipitates areused in cooking as cream of tartar. Anotherexample is the recovery of an edible oil fromgrape seeds.
Pomace is sometimes used for animalfeed. Otherwise, it can be mixed with thestems and other solids and returned to thevineyards for use as a soil conditioner andfertilizer.
Treatment of Winery WastesThe principal liquid waste from wineries isthe wash water from general plant cleanup, aswell as from vat cleaning, bottle cleaning,and product loss. In general, biological treat-ment processes have been used with success,including anaerobic as well as aerobic proc-esses. Farmer, Friedman, and Hagin (1988)reported on a pilot plant project in which anupflow anaerobic sludge blanket (UASB) andan anaerobic contact process were used totreat high-strength wastes (Chemical OxygenDemand, COD, of about 15,000 mg/L) froma winery. Both processes were successful inremoving 98% of the soluble COD. Follow-ing the processes with aerobic treatmentincreased overall COD removal to more than99%. As expected, the principal advantagesof the anaerobic processes over using onlyaerobic treatment were that the anaerobic

Grapes in Bins
WashingContinuous
during Pressing
IntermittentWashing(yearly)
Bottle Rinse(yearly)
Bottle Rinse(yearly)
Intermittentduring
Non-pressing
Sugar & SO2
IntermittentWashing(yearly)
To S
ewer
Solids andSpent Filter Aid
to Vineyard
Sodium BisulfitePress Aid
Intermittent Washing (Pressing)
Stem to Vineyard
Crushed Grapes
Intermittent Washing (Pressing).
Truck Away Skin, Seeds,Pomace to Vineyard
Juice
Washing
SO2 AdditionCooling Water
Intermittent Washing (2 times/month)
Lees
Lees
Wash Water
Lees
Cuvee
For C
ham
pagn
e
Figure 10-13 Production of wine and brandy.
Shipping
Still Wine
Intermittent Washing (yearly)
Solids to Vineyards
Intermittent Washing (yearly)
WashingSmall
FractionWashing
Solids to Vineyards
To S
ewer

processes produced about 80% less sludgeand occupied a significantly smaller foot-print.
One of the most popular methods fortreating winery wastes has been that of landdisposal, especially the ridge and furrowmethod. Russell et al. (1976) reported on aland application system that treated up to50,000 gallons of wastewater per day in Cali-fornia. The operation was called an "unqual-ified" success, with negligible contaminationof groundwater.
Ryder (1973) reported on the successfuluse of an aerobic lagoon to treat winerywastes. Ryder emphasized the value of theaerated lagoon effluent as irrigation water forthe vineyards.
An aspect of winery waste treatment thatis different from most other industrial wastesis that the destruction of any waste contain-ing alcohol must be in accordance with regu-lations of the Bureau of Alcohol, Tobacco,and Firearms (BATF). The law specificallyregulates disposal of lees, requiring that winemust be completely pressed or drained fromthe lees before it can be used for animal feedor production of cream of tartar or otheruses.
The Synthetic Rubber Industry
There are many different types of syntheticrubber produced today and a host of prod-ucts made from them. Annual (world) pro-duction in the year 2000 exceeded 20 milliontons, accounting for well over 80% of all rub-ber products produced, including naturalrubber.
Nearly 300 years after Columbus discov-ered Haitian children playing with whatwould later be known as rubber balls, JosephPriestly, an English chemist, discovered thatthe gum from certain trees grown in SouthAmerica, Haiti, and nearby islands wouldrub out pencil marks. Hence, the name "rub-ber" was born. During the next 100 years, usefor this remarkable substance, produced
from the sap of Hevea brasiliensis, which wasstill confined to the jungles of South Americaand nearby islands, developed slowly. In1876, the British transplanted thousands ofthese trees in southeastern Asia and beganlarge-scale production of rubber, now knownas natural rubber. The milky sap from whichnatural rubber is made has, since that time,been called latex, from the Latin word formilky, lacteus.
Shortages during the war years, fromWorld War I through the early 1950s,prompted the development of synthetic rub-ber. During World War II, the effort putforth by the United States to develop its syn-thetic rubber manufacturing capability wassecond only to its efforts to develop theatomic bomb. The principal synthetic rubberproduced during that time period was calledGR-S, short for "Government Rubber—Sty-rene," which is still produced as SBR, StyreneButadiene Rubber.
The many different types of synthetic rub-ber produced in the early 2000s include sili-cone rubbers, used in the aerospace industryfor their usefulness over wide ranges of tem-perature; butyl rubber, used for the manufac-ture of inner tubes; chloroprene rubber, usedto line tanks to prevent corrosion; latex(foam rubber), used for the manufacture ofcushions, padding, and other things; nitrilerubber used in the manufacture of oil-resis-tant and heat-resistant hoses, gaskets, andother things; and styrene butadiene rubber(SBR), the most commonly used type of syn-thetic rubber. SBR is used in the manufactureof automobile tires, conveyor belts, noise andvibration insulators, foul weather gear, andmany other things. More than 500 differenttypes of SBRs are produced, most for theautomobile industry.
For purposes of regulation, the EPA hasdivided the rubber manufacturing industryinto two categories: the Tire and Inner TubeIndustry and the Synthetic Rubber Industry.Both categories make extensive use of SBR.Because the raw materials from which SBR is

manufactured are derived from petroleum,the synthetic rubber industry tends to belocated within two clusters. The plants thatproduce synthetic rubber are clustered in theoil producing states, mainly Louisiana andTexas, while those that produce productsmade from synthetic rubber are located inindustrialized areas, especially those associ-ated with the automobile industry.
Production of Synthetic RubberSo-called tire rubber, also used for manyother products, is produced as a substanceknown as "crumb rubber." There are twoprincipal methods for producing crumb rub-ber: solution crumb production and emul-sion crumb production. Solution crumb pro-duction involves mixing the raw materials ina homogenous solution, wherein polymer-ization takes place. Emulsion crumb produc-tion involves producing an emulsion of theraw materials, resulting in bulk polymeriza-tion of droplets of monomers suspended inwater. The mechanisms of solution polymer-ization are those of ionic interaction. Themechanisms of emulsion polymerizationrequire sufficient emulsifier, in the form of asoap solution, to maintain a stable emulsion,and proceed as explained below.
Emulsion Crumb ProductionProduction of crumb rubber by emulsionpolymerization has been the traditionalprocess for production of synthetic rubber. Itis still the most commonly used process,accounting for 90% of the world's produc-tion of SBR. Figure 10-14 presents a sche-matic diagram of the emulsion crumb rub-ber production process.
As illustrated in Figure 10-14, raw materi-als in the form of monomers, produced bythe petroleum industry, is delivered to tankfarms. The monomers include styrene andbutadiene. Because production facilities suchas these operate 24 hours per day, 365 daysper year, the tank farm always maintains aconstant supply. Other materials deliveredand stored in tank farms include soap (or
detergent), activator, catalyst, modifier,extender oil, and carbon black. Butadiene, aswell as certain other polymers, is deliveredwith polymerization inhibiters mixed in toprevent premature polymerization duringdelivery and storage.
The production process begins withremoval of the polymerization inhibiters, bypassing the monomer through a causticscrubber. The monomers to be polymerizedare mixed with soap solution, deionizedwater, catalyst, activator, and modifiers priorto entering the first of a series of reactors.The purpose of the soap solution (or deter-gent) is to hold the entire mixture in a stableemulsion throughout the polymerizationprocess. Rosin acid soap or fatty acid soap istypically used. The purpose of the catalyst isto generate free radicals to initiate and main-tain polymerization. Typical catalysts usedare hydroperoxides or peroxysulfates.
The function of the activator is to assistthe catalyst in generating free radicals, as wellas to enable reaction at a lower temperature.The modifier acts to control the length ofpolymerized chain and, consequently, thesize (and molecular weight) of the polymer.The process is operated as either "cold" (400Fto 45°F at 0-15 psig) or "hot" (122°F at 40-60 psig), to produce cold SBR or hot SBR,respectively. Cold SBR processes are stoppedat 60% polymerization. Hot SBR processes,the older of the two, are allowed to proceedto near completion of the polymerizationprocess.
"Cold rubbers" have improved properties,compared with hot rubbers but require moreextensive process management. The emulsi-fied mixture resulting from the initial mixingof monomers and additives must be keptcool by means of an ammonia refrigerantprior to entering the reactors. Also, a "short-stop" solution must be added to the solutionexiting the reactor, in order to halt the poly-merization process at 60% completion.Then, the unreacted monomers, as well asthe catalysts, activators, modifiers, water, andemulsifiers, must be separated from the poly-

Figure 10-14 General water flow diagram for an emulsion polymerized crumb rubber production facility.Co
agula
tion L
iquor
Retu
rnSc
reene
d Co
agula
tion L
iquor
Rinse
Wate
r Retu
rnRin
se W
ater F
iltrate
Waste-water
Overfl
ow
Overfl
ow
Waste-water
CoolingWaterReturn
CoolingWaterSupply
Wastewater
Blow-Down
CoolingTower
CoolingWater
TreatmentRaw Intake
Water
ProductStorage
andShipping
BalingDrying
Steam
LiveSteam
CrumbRinsing
andDewatering
Makeup-water
Equip.Cleanup
Wastewater
WaterRaw Intake
Treated ProcessWater
CondensateReturn
WaterTreatment
Units
RegenerationWaste
Wastewater
Boiler Feed WaterBoilerHouse
Blow-Down
Wastewater
Coagulationand
Screening
Equip.Cleanup
SupplyStream
WastewaterSpills Washdown
Carbon Black Slurry
Extender Oil
WastewaterWastewaterWastewaterWastewater
Equip.Cleanup
LiveSteamEquip.
CleanupEquip.
Cleanup
LatexStorage
SteamStripping
VacuumDistillation
Polymer-ization
Reactors
Antioxidant
Wastewater
Short Stop
Recycle
CoagulatingSulfuric
AcidCoagulating
Brine
Wastewater
LightMonomer
Separation
HeavyMonomer
SeparationRecycle
Carbon Black Slurry
Makeup Water
Carbon Black
Extender Oil
ActivatorCatalystModifier
ActivatorCatalystModifierSolutions
Treated Process Water
SoapSolution
Soap
Treated Process WaterWastewater
SpentCaustic
MonomerInhibitorRemoval
and Wash
InhibitedMonomer
MonomerStorageDelivery
Monomer
Uninhibited Monomer

merized material, reconditioned, andreturned for continued use.
The shortstop solution is made up ofsodium dimethyl dithiocarbonate andhydroquinone. The 60% reacted mixture, atthe point of being "stopped," is milky-whitein appearance and is called "latex." Althoughit resembles the sap from the natural rubbertree in appearance, the two are not to be con-fused with each other.
The next step is recovery of unreactedbutadiene by use of a vacuum flash tank.Recovery of styrene is accomplished by use ofperforated plate stripping columns. Thestripped latex must be protected from oxida-tion by oxygen or ozone. This is accom-plished by addition of an antioxidant in ablend tank. The polymerized material is thenseparated from the remaining latex by coagu-lation, which is brought about by the addi-tion of dilute sulfuric acid (pH 4 to 4.5) andsodium chloride (brine). At this point, theproduct is called "crumb." Carbon black andvarious oils are added to the crumb to pro-duce desired properties, including color.
Separation of the coagulated crumb isaccomplished on a shaker screen. The liquoris then returned for reuse, after recondition-ing by addition of fresh acid and brine. Thecrumb is washed by resuspension in water ina reslurry tank. Gravity separators, calledcrumb pits, are used as clarifiers to recoverfloatable crumb rubber from both the liquorthat passed through the shaker screen andthe overflow from the reslurry tank.
The filtered and washed crumb rubber isdried by use of hot air, then weighed, baled,and stored for shipping.
Solution Crumb ProductionProduction of crumb rubber by the solutioncrumb process allows the use of stereospe-cific catalysts that are able to produce poly-mers nearly identical to natural rubber. Inthe proper organic solvent, as opposed to anemulsion, as used in emulsion polymeriza-tion, the cis structure can be obtained in anamount up to 98% of the total.
Figure 10-15 presents a schematic dia-gram of a solution polymerized crumb rub-ber production facility. As can be seen, thereare similarities to the emulsion polymeriza-tion process, but there are several importantdifferences. Solution polymerization requiresthat the monomers be of a very high degreeof purity. As well, the solvent in which themonomers, catalyst, and modifiers are dis-solved must be absolutely anhydrous. Thepolymerization process proceeds to morethan 90% completion, in contrast to theemulsion polymerization process, which isstopped by the introduction of the shortstopsolution at the point of 60% completion.
Figure 10-15 shows that the stored mono-mers are pumped from the tank farmthrough caustic soda scrubbers to removepolymerization inhibitors. The monomersproceed to fractionater-drying towers wherewater is removed. These towers are also usedto remove water from recycled as well as freshsolvents. The monomers and solvents aremixed to produce "mixed feed," and catalystsare added. This begins the polymerizationprocess, which is exothermic. For this reason,the reaction vessels must be cooled, typicallyby an ammonia refrigerant. The shortstopsolution is added after the reaction hasreached 90% or more completion.
After the polymerization reaction hasbeen halted, additional substances are added,including antioxidants and oil for oil exten-sion. The mixture is then transferred to acoagulation vessel where the polymerizedmaterial precipitates as the crumb. Carbonblack is typically added at this point.
The mixture is now ready for separationof the crumb from the liquor and separationof some of the components of the liquor forreuse. A series of strippers is used to strip offsolvents as well as unreacted monomers. Thevapors of monomers and solvents are con-densed and sent to a decant system. Theorganic portion is returned to the fraction-ator. Decant is discharged as wastewater. Thestripped crumb slurry is separated furtherand proceeds to a vibrating screen where it iswashed with water. Most of the washwater

Scree
ned
Slurry
Wate
r
Slurry
Wate
r Retu
rn
NOTE:Extender oil and carbonblack are not added tonon-extended rubber types.
Raw IntakeWater
ProductStorage
andShipping
BalingDrying
Steam
DewateringScreening
CoolingWaterReturn
CoolingWater
Treatment
Wastewater
Blow-Down
CoolingTower
CoolingWaterSupply
Overflow
Wastewater
MakeupWater
CrumpSlurry
Treated ProcessWaterCondensate
Return
Raw IntakeWater
Wastewater
RegenerationWastes
WaterTreatment
Units
Boiler Feed WaterBoilerHouse
Blow-Down
Wastewater
SupplyStream
LiveSteam
SteamStripping
andCoagulation
Wastewater
CementStorage
Steam
WastewaterWastewater
HeavySlops
Steam
HeavyMonomerSeparation
To MonomerTo Monomer
Recovery
LightMonomer
Separation
Steam
SolventSeparation
Polymer-ization
Reactor
Extender Oil
FeedDrying
SpentCaustic
Wastewater
MonomerInhibitorRemoval
and Wash
Uninhibited Monomer
InhibitedMonomer
MonomerStorage
SolventStorage
MonomerDelivery
CatalystMonomer
Antioxidant
ExtenderOil
CarbonBlack
Makeup Water
Carbon BlackSlurry
Carbon Black Slurry
Spills WashdownWastewater
Figure 10-15 General water flow diagram for a solution polymerized crumb rubber production facility.

recycles to the coagulation stage; the rest isdiscarded as blow-down. The crumb is dried,baled, and stored for shipment to a proces-sor.
Specialty ProductsFar less important in terms of annual pro-duction totals, but important in terms ofpollutant generation, are the specialty rub-bers. These products have more diverse com-position as well as end uses. The largest ofthese, in terms of production volume, are thebutadiene rubbers, which are sold by pro-ducers in a latex form as opposed to thecrumb rubber form.
Production of latex is the same as emul-sion crumb production, except that the coag-ulation step for separation of the crumb rub-ber from the liquor is not carried out.Another difference, important in terms ofpollutants generated, is that in latex produc-tion polymerization is allowed to proceedessentially to completion. This is in contrastto the production of crumb rubber in whichthe polymerization process is stopped at thepoint of 60% completion. Consequently,recovery of unpolymerized monomer is notfeasible. Figure 10-16 presents a schematic ofthe latex production process.
Wastes GenerationThe generation of wastes at manufacturingfacilities engaged in the production of syn-thetic rubber is dependent to an unusuallyhigh degree on how well the entire facility ismanaged to prevent such generation. Rawmaterials are delivered as bulk liquids, andthe delivery process can be pollution-free ifthere are no spills and fumes are contained.The entire process, except for clarificationand decant steps, is contained within tanks,pumps, piping systems, and mixing vessels;therefore, the only opportunities for air pol-lution are from leaks and sloppy handling.The only solid material involved in the pro-duction process that is of significant volumeis the product rubber itself. Any loss of this
material to solid waste is a loss of valuableproduct.
Solid WastesSolid wastes requiring management at a typi-cal synthetic rubber production facilityshould be only nonproduction-relatedwastes, such as packaging and shippingwastes and construction debris from plantmaintenance, modifications, expansions, andperiodic facility upgrade projects. In addi-tion, sludges from wastewater treatment andwaste resins from process water deionizationrequire management.
Airborne WastesThe many scrubbers and strippers used atsynthetic rubber production facilities arepotential sources of air pollutants. Vents ontank farm storage facilities are also potentialsources.
Waterborne WastesFigures 10-14 through 10-16 show principalsources of wastewater from (1) the emulsioncrumb production process, (2) the solutioncrumb production process, and (3) the emul-sion latex production process, respectively.As shown in these figures, essentially everymajor processing unit is a source during thenormal processing schedule. For instance,Figure 10-14 shows that as the monomers arebeing transferred from storage to the poly-merization reactors, they are passed throughthe caustic scrubbers to effect removal of thepolymerization inhibitors. There is a blow-down of spent caustic wash solution, con-taminated with the polymerization inhibitormaterial, entering the wastewater stream.What is not shown is that each of these proc-essing units is a source of wastewater as aresult of periodic washdown. However, thesefigures do show that additional areas of theplant are at least potential sources of waste-water as the result of spills or overflows.When these largely unnecessary events occur,they must be managed properly to avoiddamage to the environment.
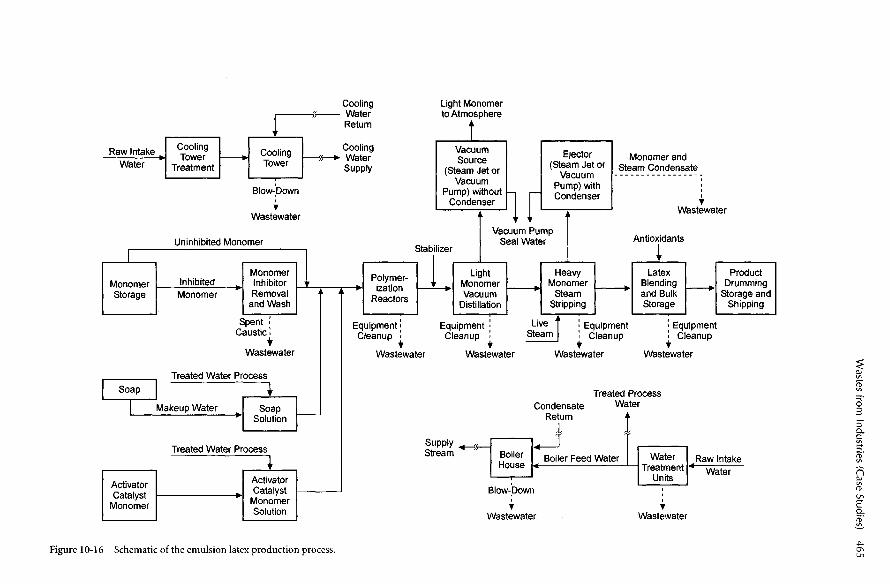
WaterRaw Intake Cooling
TowerTreatment
MonomerStorage
Uninhibited Monomer
Wastewater
Blow-Down
CoolingTower
InhibitedI1 MonomerInhibitorRemoval
and WashSpent
Caustic
Wastewater
Treated Water Process
Makeup Water SoapSolution
Soap
Treated Water Process
ActivatorCatalyst
MonomerSolution
ActivatorCatalyst
Monomer
Figure 10-16 Schematic of the emulsion latex production process.
CoolingWaterReturn
CoolingWaterSupply
Polymer-ization
Reactors
EquipmentCleanup
Wastewater
Stabilizer
VacuumSource
(Steam Jet orVacuum
Pump) withoutCondenser
LightMonomerVacuum
Distillation
EquipmentCleanup I
Vacuum PumpSeal Water
Ejector(Steam Jet or
VacuumPump) withCondenser
HeavyMonomer
SteamStripping
LiveSteam
Wastewater
EquipmentCleanup
Treated ProcessWaterCondensate
Return
Boiler Feed WaterBoilerHouse
BIOW-Down
Wastewater
SupplyStream
Light Monomerto Atmosphere
Monomer andSteam Condensate
Antioxidants
LatexBlendingand BulkStorage
Wastewater
ProductDrumming
Storage andShipping
EquipmentCleanup
Wastewater
WaterTreatment
Units
Wastewater
Raw IntakeWater
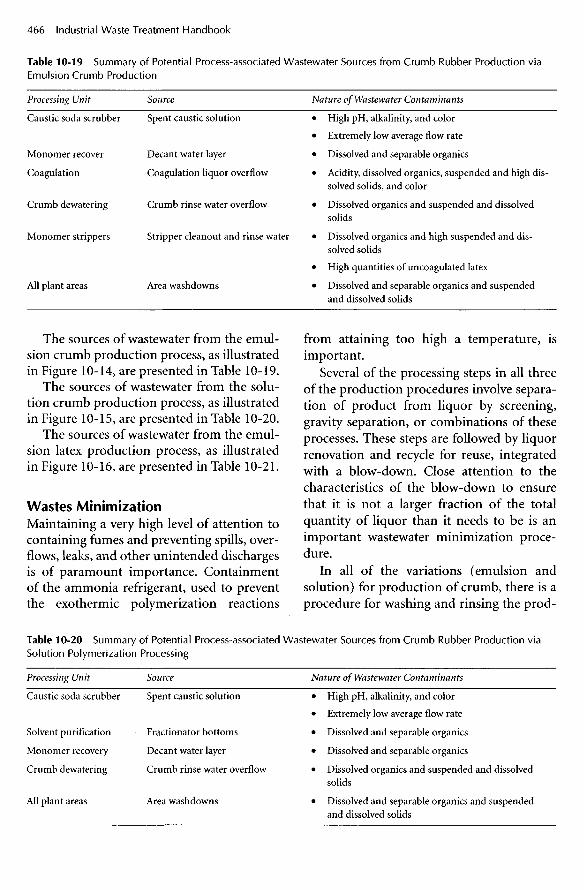
Table 10-19 Summary of Potential Process-associated Wastewater Sources from Crumb Rubber Production viaEmulsion Crumb Production
Processing Unit Source
Caustic soda scrubber Spent caustic solution
Monomer recover Decant water layer
Coagulation Coagulation liquor overflow
Crumb dewatering Crumb rinse water overflow
Monomer strippers Stripper cleanout and rinse water
All plant areas Area washdowns
The sources of wastewater from the emul-sion crumb production process, as illustratedin Figure 10-14, are presented in Table 10-19.
The sources of wastewater from the solu-tion crumb production process, as illustratedin Figure 10-15, are presented in Table 10-20.
The sources of wastewater from the emul-sion latex production process, as illustratedin Figure 10-16, are presented in Table 10-21.
Wastes MinimizationMaintaining a very high level of attention tocontaining fumes and preventing spills, over-flows, leaks, and other unintended dischargesis of paramount importance. Containmentof the ammonia refrigerant, used to preventthe exothermic polymerization reactions
Nature of Wastewater Contaminants
• High pH, alkalinity, and color
• Extremely low average flow rate
• Dissolved and separable organics
• Acidity, dissolved organics, suspended and high dis-solved solids, and color
• Dissolved organics and suspended and dissolvedsolids
• Dissolved organics and high suspended and dis-solved solids
• High quantities of uncoagulated latex
• Dissolved and separable organics and suspendedand dissolved solids
from attaining too high a temperature, isimportant.
Several of the processing steps in all threeof the production procedures involve separa-tion of product from liquor by screening,gravity separation, or combinations of theseprocesses. These steps are followed by liquorrenovation and recycle for reuse, integratedwith a blow-down. Close attention to thecharacteristics of the blow-down to ensurethat it is not a larger fraction of the totalquantity of liquor than it needs to be is animportant wastewater minimization proce-dure.
In all of the variations (emulsion andsolution) for production of crumb, there is aprocedure for washing and rinsing the prod-
Table 10-20 Summary of Potential Process-associated Wastewater Sources from Crumb Rubber Production viaSolution Polymerization Processing
Processing Unit Source
Caustic soda scrubber Spent caustic solution
Solvent purification Fractionator bottoms
Monomer recovery Decant water layer
Crumb dewatering Crumb rinse water overflow
All plant areas Area washdowns
Nature of Wastewater Contaminants
• High pH, alkalinity, and color
• Extremely low average flow rate
• Dissolved and separable organics
• Dissolved and separable organics
• Dissolved organics and suspended and dissolvedsolids
• Dissolved and separable organics and suspendedand dissolved solids

Table 10-21 Summary of Potential Process-associated Wastewater Sources from Latex Production via EmulsionPolymerization Processing
Processing Unit Source Nature of Wastewater Contaminants
Caustic soda scrubber Spent caustic solution • High pH, alkalinity, and color
• Extremely low average flow rate
Excess monomer stripping Decant water layer • Dissolved and separable organics
Tanks, reactors, and strippers Cleanout rinse water • Dissolved organics, suspended and dissolved solids
• High quantities of uncoagulated latex
Tank cars and tank trucks Cleanout rinse water • Dissolved organics, suspended and dissolved solids
• High quantities of uncoagulated latex
All plant areas Area washdowns • Dissolved and separable organics and suspended anddissolved solids
uct crumb with water. The spent wash waterenters the wastewater stream. Developmentof countercurrent washing and rinsing pro-cedures, by which fresh water is used only forthe final rinse and maximum recycle of alleffluents is practiced, is imperative. Forinstance, the effluent from the first rinseshould be used as makeup for the wash waterused in conjunction with the vibratoryscreen separation process, discussed above.
There are success stories involving wasteminimization by use of substitution in thesynthetic rubber production industry. Forinstance, coagulation of latex with acid-polyamine rather than brine solution resultsin significantly lower TDS in the wastewater.As another example, the use of a steamgrinding technique for the addition of thecarbon slurry has resulted in a significantreduction in spillage of carbon black. This, inturn, has resulted in significant reduction inwashdown and runoff wastewaters contami-nated with carbon black. As still anotherexample, the use of alum, on the spot, tocoagulate crumb material from spilled latexsolution can reduce the amount of wash-down water required. Finally, use of dualcrumb pits can effectively avoid resuspensionof colloids during cleaning.
Wastewater TreatmentIn general, all of the raw materials used in theproduction of synthetic rubber are biode-
gradable, and all of the wastewaters are ame-nable to biological treatment. Also, as a gen-eral rule, wastewaters generated by emulsioncrumb and emulsion latex production proce-dures require chemical coagulation (to breakthe emulsions) prior to chemical treatment.This is not true of the solution polymerizedproduction wastewaters. Following appropri-ate preliminary treatment, conventional pri-mary treatment by gravity clarification, pos-sibly aided by settling aids; secondary treat-ment by any of the variations of the activatedsludge processes, with appropriate additionof nitrogen and phosphorus as nutrients; andadditional treatment as required for compli-ance with receiving water classificationrequirements, have been successful. Theadditional treatment technologies haveincluded sand filtration and mixed media fil-tration.
An equalization system preceding thewastewater treatment system can effectivelyeven out the flows and loads and allow con-struction and operation of a smaller treat-ment system. Also, pH control in conjunc-tion with the equalization system has beeneffective in improving the performance ofprimary clarification. Settling aids such ascationic polymers may improve the perform-ance of primary clarification.
Wastewater characterization parametersthat have been of significance are the conven-tional parameters, namely, pH, TSS, BOD5,COD, and FOG. Other parameters have

included TDS, acidity, alkalinity, surfactants,color, and temperature. The COD-to-BODratio is typically high, due to COD demandof inorganic constituents. COD values haveranged from about 9 pounds per 1,000pounds of product for wastewaters from thesolution crumb process to about 35 poundsper 1,000 pounds of product for the emul-sion latex process. BOD values have rangedfrom about 1 pound per 1,000 pounds ofproduct (solution crumb) to about 5 poundsper 1,000 pounds of product in the case ofthe emulsion crumb process.
Wastewaters from emulsion crumb andlatex plants are characterized by high valuesof TSS, which are usually due to uncoagu-lated latex. In general, TSS values haveranged from about 3 pounds per 1,000pounds of product, for solution crumbwastewaters, to about 6 pounds per 1,000pounds of product for emulsion latex waste-waters. Total dissolved solids are typicallyattributable to carbonates, chlorides, sulfates,phosphates, and nitrates of calcium, magne-sium, sodium, and potassium. Traces of ironand manganese can also be present. A majorsource of TDS from the emulsion crumbprocess has been the liquor from the coagula-tion process used to separate the crumb.High TDS values are also characteristic ofwastewaters from the solution crumb andemulsion latex processes.
FOG in wastewaters from all syntheticrubber production processes has been attrib-utable to undissolved monomers andextender oils. Leaked or spilled machinelubricating oils and hydraulic fluids are alsopotential sources.
The Soft Drink Bottling Industry
In the late 1800s, the then-fledgling softdrink industry in the United States was partyto the introduction of a new drink madefrom an extract from the African kola nut, anextract from cocoa, and water saturated withcarbon dioxide. The first cola drink thus
began what is now one of the world's majorindustries. This industry is still experiencingsignificant growth in the early 2000s.
Production of Bottled Soft DrinksThe soft drink industry's products (in theUnited States) are divided into two catego-ries: soda water and colas, also known aspeppers. Soda water is simply water saturatedwith carbon dioxide. Saturation is defined asthat amount of carbon dioxide dissolved, atequilibrium, under a pressure of one atmo-sphere (about 15 psig) at a temperature of600R This quantity is referred to as one vol-ume of carbon dioxide. A cola (or pepper)must contain caffeine from the kola nut orfrom extracts of other natural substances. Inthe United States the quantity of caffeine isnot allowed to exceed 0.02% by weight. Theexact formulas for most commercial bever-ages are closely guarded; however, the follow-ing two formulas presented in Table 10-22are said to be representative.
Table 10-22 Typical Soft Drink Formulas
Carbonated Cola Beverage
Sugar syrup, 76 Brix 305.00 ml
Phosphoric Acid, 85% 1.25 ml
Caffeine solution, 4%* 10.00 ml
Caramel color, double strength 4.00 ml
Natural cola flavor 2.00 ml
Water 177.75 ml
Sodium benzoate 5%
Water 91%
Caffeine 4%
Pale Dry Ginger Ale
Pale dry ginger ale flavor 2.00 ml
Citric acid solution, 50% 9.20 ml
Sodium benzoate solution, 18% 5.00 ml
Carmel color 2X, 20% solution 0.30 ml
Sugar syrup, 76 Brix 248.00 ml
Water 235.50 ml
* Caffeine solution, 4% (wt/wt).

Table 10-23 presents a general summaryof the ingredients of various types of carbon-ated soft drinks.
Sweeteners include dry or liquid sucrose,invert sugars, dextrose, fructose, corn syrup,glucose syrups, sorbitol, or an artificial sub-stitute. Flavorings are often used in a carriersuch as ethanol, propylene glycol, or glycerin,or they may be in the form of fruit juiceextracts or the juices themselves, dehydratedor full strength, or in the form of extractsfrom bark, vegetables, roots, or leaves. Edibleacids used include acetic, citric, fumaric, glu-conic, lactic, malic, tartaric, or phosphoric.This statement of ingredients is by no meansintended to be complete; rather, it isintended to illustrate the variety of sub-stances the environmental engineer may beconfronted with in situations involving spills,leaks, or sloppy management of the produc-tion plant.
Figure 10-17 presents a flow diagram of atypical soft drink bottling industrial facility.The term bottling is used generically toinclude packaging, under a pressure of aboutone atmosphere, in bottles, cans, plastic con-tainers, kegs, or other bulk containers. Thefirst significant activity is delivery of rawmaterials to the receiving and storage facili-ties, usually a relatively small tank farm. Also,water is stored, after treatment to the specifi-cations of the bottling company and therequirements of applicable agencies and fed-
eral, state, and local regulations. Carbondioxide may be delivered to the site or may begenerated on site.
Treatment of the water may include sim-ple filtration or activated carbon adsorption,or it may include extensive treatment such ascoagulation, flocculation, and sedimenta-tion, followed by filtration, activated carbonadsorption, disinfection, and dechlorination.In addition to high-quality water from thestandpoint of health, the concerns of the bot-tling company are any substances in thewater that may affect taste or cause high car-bonate hardness, which can cause the bever-ages to go flat in a short amount of time.Also, certain heavy metal ions can causerapid loss of carbonation. Desirable charac-teristics of the water to be used in soft drinkproduction include complete absence of bac-teria, turbidity, dissolved carbon dioxide, andchlorine.
Preparation of the bottles (or other con-tainers) includes washing and sterilization.As will be discussed later, this represents oneof the most important, and largely unavoid-able (but not amenable to minimization),sources of wastewater. Reusable bottlesrequire washing in a hot caustic solution.They then are subjected to the washing andrinsing procedures used on new bottles.
The mixing of ingredients by transferringthem from storage to blending systems is oneof three major operations in the soft drink
Table 10-23 Types of Soft Drinks and Their Ingredients
Soft Drink Ingredients (General)
Soft Drink Flavors Color Sugar (%) Edible Acid
Cola
Orange
Ginger Ale
Root beer
Extract of kola nut, lime oil,spice oils, and caffeine
Oil of orange and orange juice
Ginger root oil or ginger andlime oil
Oil of wintergreen, vanilla, nut-meg, cloves, or anise
Caramel
Sunset yellow FCFwith someTartrazine
Caramel
Caramel
11-13 Phosphoric
12-14 Citric
7-11 Citric
11-13 Citric
Carbon Dioxide (CO2)(volume of gas)
3.5
1.5-2.5
4.0-4.5
3

Delivery
FlavoringEdible
Acids, etc.
Bottles
AlkalineDetergent
CrownClosures
CasesCartons, etc.
Figure 10-17 Flow diagram of standard manufacturing process: bottled and canned soft drinks.
Wastewater
Inspect
Bottle Washing(Sterilization)
Water
SugarStorage
SimpleSyrup
Filter
FlavoredSyrup
Filter
Bottle Filling(Beverage Blending)
CrownLabeling
Packaging
Inspect
To Storage orConsumer Outlet
Washdown
Plant
CarbonDioxideStorage
Source
Treatment
WaterStorage
WaterProcessing
Cooling
Carbonation
Delivery orGeneration
Wastewater

production process. However this is accom-plished—whether by means of pumps andpipes, by use of transfer vessels, by cleanupoperations at the end of each processing dayand in some cases throughout the processingday—represents a major source of waste gen-eration.
The next steps after mixing are carbon-ation and bottling, usually done concur-rently. Here, again, no true wastewater isgenerated, except unintentionally as fromspills, leaks, broken bottles, or other contain-ers, or, in very rare instances, the need to dis-card a "bad batch" because of contamination.Daily washdown of equipment, of course, isan ever-present major source of wastewater.
After bottling, the filled and sealed con-tainers are labeled and then packaged forstorage and/or shipment.
Wastes GenerationExcept for boiler operation, the bottled softdrink industry is not of concern as a signifi-cant source of air pollutants. Both solidwastes and waterborne wastes, however, areof major concern to plant and environmentalmanagers.
Solid WastesThere are several significant sources of solidwastes from the bottled soft drink industry.The first, using the flow-through of materialsfrom receipt and storage to shipment of finalproduct as the approach, is the discarded(and not recycled) material used for packag-ing and shipping raw materials to the facility.There are also the materials intended forrecycle that are found to be unacceptable forrecycling. Next, there are the residuals fromtreatment of the water to be used in theproduct. Then, there are the substancescleaned from the processing facility floorduring cleanup operations. This can includebroken bottles or other objects, lost caps, anddiscarded personal items from employees.The residuals from wastewater treatment
constitute a major source of solid wastes.Finally, there are the items discarded fromlabeling and packaging the product for stor-age and/or shipment.
Nonprocess-related solid wastes includeconstruction debris from plant upgrades,facility expansions, general facility repair andupkeep, and incidental wastes, such as gar-bage and trash from the cafeteria. In general,there are no hazardous wastes from thesefacilities.
Waterborne WastesThe major sources of wastewater from softdrink bottling operations include plantwashdown wastewater and the wastewaterfrom washing bottles (and other containers),as shown in Figure 10-17. Plant washdownwater includes the water to clean themachines, pumps, pipes, and mixing andbottling equipment, as well as washing thefloors and the general work area.
Wastes MinimizationWastes minimization at soft drink bottlingfacilities is best accomplished by the follow-ing:
• Installing overflow warning devices onall storage tanks, mixing tanks, blendingtanks, and holding tanks
• Using biodegradable detergents• Containing drips and returning them to
the source• Practicing aggressive maintenance to
eliminate the occurrence of leaks orother accidents that could lead to non-containment of sweeteners, finishedproduct, and other substances
• Using dry methods of cleanup, includingbrooms, shovels, and dry vacuuming, tothe maximum extent
• Rinsing bottles after cleaning in acounter-current manner, with respect tofresh water makeup and spent rinsewater overflow

Wastewater TreatmentBecause there are no nonbiodegradable sub-stances used at soft drink bottling facilities,all wastewaters are amenable to biologicaltreatment. As a general rule, no pretreatmentother than screening and pH adjustment isrequired before secondary treatment byeither an on-site biological treatment systemor a POTW. Adjustment of pH is requiredbecause of the caustic used for cleaning bot-tles, pipes, tanks, floors, and mixing and bot-tling machinery.
A two-stage aerated lagoon has been usedwith success at a bottling plant in NewEngland. The layout and characteristics ofthis system are as follows:
• The first lagoon is operated as a sequenc-ing batch reactor.
• The second lagoon is operated as a con-ventional aerobic lagoon.
• Potassium is added to both lagoons as anutrient.
The primary reasons for selecting the two-lagoon system were as follows:
• Lagoons, because of their relatively largevolume, are capable of withstandinglarge variations in flows and loads, pH,and concentrations of chlorine.
• The sandy nature of the soil in the areaof the plant would allow percolation ofliquid into the ground and to thegroundwater for removal from the area.
• There was ample distance to the ground-water for complete treatment (renova-tion of the wastewater) before reachingthe groundwater.
• The sandy nature of the soil allowed freemovement of oxygen into the soil to sup-port the in situ, on-site biological treat-ment.
• It was calculated that sludge would haveto be removed only once every five to tenyears.
Pepsi Corp. has patented a wastewatertreatment system with the following layoutand operational characteristics:
• Waste from the returned bottle prerinsewas directed to a trickling filter operatedas a roughing filter.
• The effluent, along with the sloughingsfrom the roughing filters was directed toan oxidation tank, which also receivedflow from the bottling area in the proc-essing plant, the plant washdown water,and the wastewater from a solids separa-tor used for the process water filter back-wash.
• The oxidation tank was aerated with airfor biological treatment as well as ozonefor chemical oxidation.
• The effluent from the oxidation tankflowed to an aerated mixing tank, whereit mixed with wastewater from the finalbottle rinse.
• This mixture flowed to an activatedsludge aeration tank followed by a finalclarifier and then a disinfection tank,where ozone was added as the disinfec-tant and the pH was given a final adjust-ment before discharge.
Production and Processing of Beef,Pork, and Other Sources of RedMeat
In the United States, over 90% of the proteinconsumed by the population was derivedfrom animals in the year 2000. This com-pares to about 55% in Western Europe, about40% in Eastern Europe, about 40% in Japan,and about 20% in Africa. As a general rule,people appear to increase their consumptionof animal-derived protein as their standardof living increases. It is therefore expectedthat as so-called third-world countriesdevelop, the raising, slaughtering, process-ing, and consumption of animals willincrease.
Processing animals for use as food resultsin very large quantities of wastes that must be
Next Page

Wastewater TreatmentBecause there are no nonbiodegradable sub-stances used at soft drink bottling facilities,all wastewaters are amenable to biologicaltreatment. As a general rule, no pretreatmentother than screening and pH adjustment isrequired before secondary treatment byeither an on-site biological treatment systemor a POTW. Adjustment of pH is requiredbecause of the caustic used for cleaning bot-tles, pipes, tanks, floors, and mixing and bot-tling machinery.
A two-stage aerated lagoon has been usedwith success at a bottling plant in NewEngland. The layout and characteristics ofthis system are as follows:
• The first lagoon is operated as a sequenc-ing batch reactor.
• The second lagoon is operated as a con-ventional aerobic lagoon.
• Potassium is added to both lagoons as anutrient.
The primary reasons for selecting the two-lagoon system were as follows:
• Lagoons, because of their relatively largevolume, are capable of withstandinglarge variations in flows and loads, pH,and concentrations of chlorine.
• The sandy nature of the soil in the areaof the plant would allow percolation ofliquid into the ground and to thegroundwater for removal from the area.
• There was ample distance to the ground-water for complete treatment (renova-tion of the wastewater) before reachingthe groundwater.
• The sandy nature of the soil allowed freemovement of oxygen into the soil to sup-port the in situ, on-site biological treat-ment.
• It was calculated that sludge would haveto be removed only once every five to tenyears.
Pepsi Corp. has patented a wastewatertreatment system with the following layoutand operational characteristics:
• Waste from the returned bottle prerinsewas directed to a trickling filter operatedas a roughing filter.
• The effluent, along with the sloughingsfrom the roughing filters was directed toan oxidation tank, which also receivedflow from the bottling area in the proc-essing plant, the plant washdown water,and the wastewater from a solids separa-tor used for the process water filter back-wash.
• The oxidation tank was aerated with airfor biological treatment as well as ozonefor chemical oxidation.
• The effluent from the oxidation tankflowed to an aerated mixing tank, whereit mixed with wastewater from the finalbottle rinse.
• This mixture flowed to an activatedsludge aeration tank followed by a finalclarifier and then a disinfection tank,where ozone was added as the disinfec-tant and the pH was given a final adjust-ment before discharge.
Production and Processing of Beef,Pork, and Other Sources of RedMeat
In the United States, over 90% of the proteinconsumed by the population was derivedfrom animals in the year 2000. This com-pares to about 55% in Western Europe, about40% in Eastern Europe, about 40% in Japan,and about 20% in Africa. As a general rule,people appear to increase their consumptionof animal-derived protein as their standardof living increases. It is therefore expectedthat as so-called third-world countriesdevelop, the raising, slaughtering, process-ing, and consumption of animals willincrease.
Processing animals for use as food resultsin very large quantities of wastes that must be
Previous Page

managed. Many of the processes discussed inthis section are applicable, with some modi-fication of actual characteristics, to the proc-essing of goats, sheep, and other animals pro-cessed throughout the world for the purposeof producing edible protein.
The Production and Processing of BeefCattle are grown, processed, and eatenaround the world. Table 10-24 presents asummary of the leading producers of cattleand the per capita consumption of beef inthose countries. As a general rule, cattle areprocessed for market in facilities owned andoperated by parties other than those thatbreed and raise cattle. Beef processing plantshave receiving and holding facilities to whichcattle are delivered by truck or by rail car,generally on the day they will be slaughteredand processed.
Plants engaged in the processing of beefrange from those that only slaughter (slaugh-terhouses) to those that perform many oper-
ations: killing, sticking, bleeding, dressing,trimming (hide removed), washing, process-ing, and packaging (processing plants). Manyplants perform all of the functions of a proc-essing plant, plus engage in what is known asfurther processing, which includes cooking,curing, smoking, pickling, canning, andmany other processes (packinghouses).
Figure 10-18 presents a flow diagram of a"typical" packinghouse. As shown, a typicalslaughterhouse, processing plant, or packing-house has facilities at which animals arereceived and held in pens. It is here thatwastes are first generated, consisting of excre-ment and washdown water.
The slaughtering operation begins withstunning, usually with electric shock or aplastic bullet to the brain, followed by hang-ing, sticking, and bleeding. Blood is collectedon the killing floor. The animals are thendressed (disemboweled), trimmed orskinned, washed, and then hung in coolingrooms.
Table 10-24 Leading Producers of Cattle and Per Capita Consumption of Beef: World Beef and Veal Production in1998
The four major areas of production are:
North America
35.5% of world production (14.7 million tons)
United States: 11.7 million tons; Mexico: 1.8; Canada: 1.0
South America
19.1% of world production (7.88 million tons)
Brazil: 4.96 million tons; Argentina: 2.55; Uruguay: 0.37
Western Europe
18.0% of world production (7.46 million tons)
France: 1.640 million tons; Germany: 1.438; Italy: 1.000; UK: 0.740; Ireland: 0.500; The Netherlands: 0.4900;Spain: 0.485; Belgium-Luxembourg: 0.325; at less than 0.200: Austria, Denmark, Sweden, Portugal, and Greece
Asia
12.6% of world production (5.22 million tons)
China: 4.400 million tons; Japan 0.485; Korea 0.233
Miscellaneous
Russia: 2.633 million tons
Australia: 1.775 million tons
New Zealand: 0.616 million tons

The finished product from slaughter-houses consists of the cooled carcasses, plushearts, livers, and tongues. The hides aresalted, folded, piled, and then shipped to atannery. Viscera, feet, and head bones areeither sent to a rendering facility or, in manycases, processed in an on-site renderingfacility.
The next series of operations is referred toas processing. The carcasses are cut intosmaller sections or into individual cuts. Atsome plants, curing, smoking, canning, and
possibly many additional activities takeplace.
Packinghouses are also capable, typically,of performing many by-product processingoperations, such as processing blood col-lected just after the animals are killed andrendering the nonedible materials. Render-ing refers to separating the fats and proteina-ceous materials by use of heat and sometimespressure. Fats are harvested as lard and otherproducts. Protein material is harvested asanimal feed supplement.
Figure 10-18 Flow chart for a packinghouse (from North Star Research & Development Institute, "Final Report, IndustrialWaste Study of the Meat Products Industry," EPA Contract No. 68-01-0031).
Grease Trap orFlotation Unit
SecondaryTreatment
Solid WasteComposting
Land Fill
ManureTrap
Process FlowWaste Flow
Meat Products
EdibleRendering
Processing• Grinding• Curing• Pickling• Smoking• Cooking• Canning
CuttingDeboning
Cooling
EvisceratingTrimming
Hide Removal
Hog Dehairing
Killing
LivestockPens
Animals
InedibleRendering
LardEdible Tallow
Tripe
Carcasses
By-Products
Cut Meat
LiverHeartKidneys
HidesHog Hair
Dried BloodBlood Processing
Hide Processing
Hog Hair Recovery
Viscera Handling
Pack
ing H
ouse
Proc
essin
g Pl
ant
Slau
ghte
r Hou
se

The Production and Processing of PorkAs is the case with the processing of beef, dis-cussed above, plants engaged in the process-ing of swine range from those that onlyslaughter (slaughterhouses) to those thatperform many operations: killing, scalding,dehairing, washing, eviscerating, processing,and packaging (processing plants). Manyplants perform all of the functions of a proc-essing plant plus engage in what is known asfurther processing, which includes cookingand producing bacon, sausage, and manyother products (packinghouses). There arealso many specialty plants that receive pro-cessed swine and produce items such as sum-mer sausage and specialty meats, all of whichcan be categorized as "further processing."
Production ProcessesIn the slaughterhouse portion of the opera-tion the animals are first stunned, usually byelectric shock, then hung over a bleedingtrough. Movement of the animals is continu-ous through the next several steps, enabledby a moving conveyor to which the hooksthat hang the animals are attached. As theanimals move over the bleeding trough theyare stuck (the jugular vein is cut), and thedraining blood is collected in the trough. Theanimals are then passed through a scaldingtank where very hot water softens the hairfollicles. After emerging from the scaldingtank the animals are dehaired, usually byabrasion from some type of rotating rubberfingers in a machine that becomes extremelyloaded with hair, bits of hide, and bloodthroughout the processing day. An openflame to remove the last traces of hair singesthe carcasses, and then they are sprayed withwater for the purposes of cooling and wash-ing.
At an increasing number of slaughteringfacilities, the animals are skinned, whicheliminates the scalding and dehairing. How-ever, the hides will eventually have to becleaned and dehaired, which amounts totransferring the waste management problemto another location.
The next step is to open the carcasses (byhandheld knives) for disemboweling,referred to as the eviscerating procedure. Thecarcasses are cut in half and hung in a coolerfor 24 hours or more. They are then cut intosmaller sections or into individual cuts, andit is at this point that major differences occurfrom one packinghouse to another. Swine(usually called hogs in the United States) arecut into hams, sides, shoulders, and loins. Atsome plants they are cured. Loins, however,are usually packaged without curing.
The heart, liver, and kidneys are washedand processed as edible meat products. Meatfor sausage is ground and emulsified andthen blended with herbs, spices, nitrite, andnitrate preservatives. The sausage mix maythen be packaged or extruded into casingsthat have been removed from the outside ofhog or other animal intestines. Cellulosematerials are also used for sausage casings.The sausage may then be cooked, smoked, orpackaged for sale as fresh. Smoking is accom-plished by hanging the meat or meat productin an (above 137°F to prevent botulism)atmosphere of smoke-generated by burninghardwood sawdust. The creosols from thisburning process are responsible for the char-acteristic flavor. An alternative process is tosoak or inject the meat or meat product in asolution of salt, sugar, and natural and/orartificial flavorings.
Wastes GenerationAnimal slaughtering operations result inlarge quantities of solid, airborne, and water-borne wastes. Even when all possible materi-als are contained and processed as by-prod-ucts, there are large quantities of solid wastesfrom paunch manure and sludges fromwastewater treatment to be managed. Thereare many airborne substances in the form ofodors and very large amounts of strongwaterborne wastes from blood, plant wash-down, and by-product operations such ason-site rendering facilities.

Solid WastesGeneration of solid wastes begins in thereceiving and holding pen area. Wastesinclude excrement, wash water, and oftenrainfall runoff. Unless the holding pen area iscovered and has a well-engineered, con-structed, and maintained stormwater man-agement system, the runoff can becomeheavily contaminated and represent a signifi-cant management problem. Well managed,the excrement can remain as solid waste andbe treated and disposed of by use of com-posting (see Chapter 9) or applied directly tofarmland.
Hides are major products of animalslaughtering facilities. Although the hidesthemselves are not solid waste, they typicallycontain large amounts of excrement and dirt.This material must be removed and managedas waste material somewhere, either at theslaughterhouse or at the tannery.
Airborne WastesAir pollution from animal processing facili-ties is typically a significant issue only if therelease of odors is not controlled. If a render-ing plant is operated on site, it is a majorissue. Rendering facilities are almost alwayssources of generation of nuisance odors. Typ-ically, containment and treatment by use ofwet scrubbers can keep the problem undercontrol.
Waterborne WastesAlmost every operation involving slaughter-ing and processing animals results in waste-water. Certain operations, such as the scald-ing of hogs as part of the cleaning and hairremoval process, produce large volumesdirectly. Other operations, such as butcher-ing, produce most of the wastewater duringcleanup activities.
Components of wastewater are blood,paunch manure, fat solids, meat solids,grease, oil, and hair. In-house laundry opera-tions also contribute. Each beef stomachcontains 55 to 80 pounds of paunch manure.One hundred gallons or more of water are
typically required to wash out a singlepaunch. This quantity can be reduced byusing dry removal and handling systems.
Blood, a major contributor to the highstrength of wastewater, has upwards of150,000 mg/L of BOD5. Sources of bloodwithin an animal processing facility begin atthe killing and bleeding facility and continueon through the processing facility. Normally,each successive processing operation at a(complete) packinghouse will be a lessimportant source of blood than the onebefore it. However, it is the usual practice atanimal processing facilities to combinewastewater from all sources before treatment.
Cutting and packaging operations (butch-ering or further processing) include addi-tional operations that contribute to wastewa-ter. Intestinal casings require squeezing orpressing to remove the contents. The casingused for production of edible foods, such assausages and hot dogs, has to be removedfrom the outside of the intestine. The intes-tine itself is sent to the rendering facility. Theintestine casing is salted and then drained.This operation, as a whole, results in waste-water that is high in grease, as well as sodiumchloride.
Scalding is used to process tripe, the mus-cular part of an animal's stomach. This proc-ess results in wastewater containing greaseand TSS. Again, all processing stations arewashed down each processing day, some sev-eral times each day. The washdown water is amajor source of wastewater from any animalprocessing facility.
In the case of slaughtering and processinghogs, the freshly killed and bled carcasses arescalded by immersion in a tank of near-boil-ing water to wash and prepare them forremoval of hair. The scalding tanks overflowat a certain constant rate to prevent solidsand dissolved materials (pollutants) frombuilding to an unacceptable level. This over-flow constitutes a major source of wastewaterfrom the processing of hogs. It is comparableto the scalder overflow encountered in theprocessing of chickens, turkeys, and ducks.The BOD5 of any of these scalder overflow

wastewaters is typically in the range of 2,000to 5,000 mg/L.
Wastes MinimizationWashing the cattle, hogs, or other animalsbefore delivery to the slaughtering facilitycan best minimize solid wastes that have theholding pens as the source. A second majorsource of solid materials to be managed is thesludges from wastewater treatment and fromair pollution control; however, if the proc-esses that create these residuals are managedproperly, they can be used as raw material tothe rendering facility. The result will be two-fold: a very large decrease in solid wastes tobe disposed of and an increase in the animalfeed supplement that is the product of therendering facility.
Paunch manure should be handled by drymethods, such as dry conveyors and dry col-lection systems. In addition, daily (or morefrequent) plant cleanup should begin bythorough sweeping, squeegeeing, air blast, orother feasible dry method. All of the materialthus removed from the killing, bleeding, andprocessing equipment and floors can beprocessed into animal feed supplement in anon-site or off-site rendering facility.
Regarding airborne wastes and, more spe-cifically, nuisance odors, the best minimiza-tion strategy is to maintain a scrupulouslyclean facility, in order to minimize putrefac-tion of organic substances. The products ofbiodegradation such as fatty acids, amines,amides, and reduced sulfur compounds suchas hydrogen sulfide and mercaptans, areresponsible for bad odors from meat process-ing facilities.
Treatment and DisposalThere is considerable similarity between themanagement of wastes from all types of redmeat production and processing facilities.Beef, pork, and most other red meat sourceanimals result in solid, airborne, and water-borne wastes that are appropriately managedin very much the same ways.
Solid WastesMost solids from meat packing facilities areorganic. As such, they have a potential use.The excrement and sometimes the paunchmanure have been successfully processed incomposting facilities and thus converted touseful material such as fertilizer or soilimprovement agent. Another use for paunchmanure is as feed to appropriate renderingfacilities.
All other solid materials resulting fromthe slaughtering and processing of animalscan be managed as feed for an appropriaterendering facility.
Airborne WastesThe treatment of nuisance odors, the only airpollutants of consequence at red meat proc-essing facilities, is done by containment andwet scrubbing. Containment usually meansprevention of the release of fugitive emis-sions. If there is a rendering facility on site,containment definitely includes maintenanceof a negative pressure in side buildings (com-pared with the atmospheric pressure outsidethe buildings). During windy periods, agreater differential pressure is required.Blowing significant quantities of air from theinside of the buildings to the outside, at aconstant rate, creates the negative pressure.Control of nuisance odors is accomplishedby exhausting the blowers through wetscrubbers. This technology is discussed morecompletely in the section titled "Rendering ofBy-Products from the Processing of Meat,Poultry, and Fish."
Waterborne WastesTreatment of wastewaters generated atslaughterhouses, processing plants, and/orpackinghouses, where red meat is producedand processed, typically consists of biologicaltreatment preceded by screening and pri-mary sedimentation. In some instances, dis-solved air flotation (DAF) has either replacedprimary sedimentation or has been placedbetween primary sedimentation and biologi-cal treatment. The solids harvested from the

DAF process (flot) can be used as raw mate-rial for rendering facilities, resulting in pro-duction of a valuable animal feed supple-ment.
Primary TreatmentScreening should be used to the maximumextent feasible, since the solids captured byscreening are excellent raw material for therendering process. Many different types ofscreens have been used successfully, includ-ing shaking screens, tangential screens, con-veyor screens, rotary screens, and staticscreens. It may be necessary to place a greasetrap ahead of the screening system to preventblinding.
Flow equalization has been found to bevaluable, and even necessary, in some casesto enable screening systems, gravity clarifiers,and DAF systems to operate successfully.There are many occurrences during the proc-essing day that cause significant change inboth rate of wastewater flow and wastewaterstrength. These occurrences include periodicplant washdown, daily plant washdown,spills, and dumps of unacceptable product orintermediate.
Flow equalization systems must beequipped to cope with floating and settlingsolids. The variable quantities of fats, oils,and settleable solids can cause debilitatingproblems if they are not so equipped.
Secondary TreatmentWastewaters from the processing of red meatare well suited to biological treatment, due totheir very high organic content. Either anaer-obic or aerobic methods can be used; how-ever, the high strength of these wastes, interms of BOD5, TSS, and FOG, make themparticularly well suited to anaerobic treat-ment. The elevated temperature of thesewastewaters is also a factor. Higher tempera-tures decrease the oxygen transfer efficiencyof aeration equipment, but tend to increasethe rate of anaerobic treatment. These con-siderations are discussed more fully in Chap-ter 7.
As discussed in Chapter 7, the morerecently developed anaerobic treatment tech-nologies, such as the upflow anaerobic sludgeblanket (USAB) and the anaerobic contactprocess, have had significant success treatingwastewaters from the dairy industry.Although there has not been significant suc-cess reported for the USAB process for themeat packing industry, it appears obviousthat significant potential exists.
Anaerobic contact systems have been usedwith success. These systems consist of a con-ventional anaerobic digester, with mixingequipment and a clarifier portion. Withdetention times of only 6 to 12 hours, 90%BOD5 removals have been typical. Using the6- to 12-hour detention time, solids havebeen separated in the clarifier portion and,for the most part, returned to the activedigester. It has been necessary to waste only arelatively small fraction of the biological sol-ids. In order to achieve good separation, it isnecessary to degas the solids as they aretransferred from the active digester to thesettling component.
There is a long history of use of anaerobiclagoons for treating wastewaters from theprocessing of cattle and hogs. The most suc-cessful of these treatment systems has beendesigned with low surface-to-volume ratiosto conserve heat and to minimize aeration.Depths of 12 to 18 feet have been used. Cov-ers are required for odor control. In somecases, the natural cover formed by floatinggreases has sufficed, but it has typically beennecessary to place covers made of Styrofoamor other floating material. Polyvinyl chlorideand nylon-reinforced hypalon have beenused with success. These lagoons, of course,must be lined to prevent contamination ofthe groundwater.
BOD5 loading rates of 15 to 20 pounds ofBOD5 per 1,000 cubic feet have been com-mon. Detention times of 5 to 10 days haveresulted in effluent BOD5 concentrations of50 to 150 mg/L, amounting to removals of70% to 85%. Additional treatment, usuallyby means of an aerobic stabilization pond orother aerobic biological treatment system, is

generally required to enable compliance withEPA standards. Ammonia is another issue.Anaerobic lagoons, as described here, typi-cally discharge effluents having up to 100mg/L of ammonia.
It has been found advantageous in severalinstances to place the inlet to the anaerobiclagoon near the bottom of the lagoon. Thisarrangement allows the incoming wastewaterto immediately contact the sludge blanket,which contains active microorganisms.
Aerobic lagoons have been used for sec-ondary treatment; however, because of thehigh cost of providing the large quantity ofoxygen required by these high-strengthwastewaters, they are most often used as astep following another technology, such as ananaerobic lagoon or anaerobic contact sys-tem. Aerated lagoons used for treatment fol-lowing anaerobic systems have operated withdetention times of two to ten days. Depths of8 to 18 feet have been used with mechanicalor diffused air systems.
In appropriate climates, oxidation pondshave been used as a final (polishing) treat-ment step, following either anaerobic or aer-obic biological treatment systems. Oxidationponds with depths of four to eight feet, sizedfor organic loadings of 20 to 40 pounds ofBOD5 per acre-day and having detentiontimes of one to six months, have worked withsuccess.
When preceded by effective equalization,the activated sludge process has successfullytreated wastewaters from red meat process-ing facilities. Various modifications havebeen used, including tapered aeration, stepaeration, extended aeration, and contact sta-bilization. Extended aeration appears to havehad the most success.
Trickling filters have been used as rough-ing filters and as components of nitrogenmanagement systems. As roughing filters, thetrickling filters receive a relatively heavy loadof BOD5 for a relatively short period of time.In this mode, trickling filters are capable ofremoving 25% to 40% of the BOD5, at a rela-tively low cost per unit of BOD5 removed. Ascomponents of nitrogen management sys-
tems, trickling filters are appropriate mediafor the nitrification step, preceding denitrifi-cation.
Rendering of By-Products fromthe Processing of Meat, Poultry,and Fish
Rendering is a process for separating fat fromanimal tissue. Heat is very often used, andsometimes one or more chemicals, pressure,and vacuum are used as well. Renderingserves the invaluable function of convertingwhat would otherwise be waste materials touseful products, including animal, poultry,or fish feed supplements, and oils for indus-trial and household use, such as soaps andrustproofing paints. A material made fromrendering feathers obtained from the pro-cessing of poultry has long been used tomanufacture a foam product used in fire-fighting. Edible rendering produces ediblelard, chicken fat, or specialty fats or oils.
The rendering process itself results in con-siderable, sometimes difficult-to-managewastes. In total, however, wastes resultingfrom rendering are only a small fraction ofthe wastes it makes use of. A huge number ofrendering plants operate in the United Statesand around the world. Virtually all facilitiesthat manufacture foods derived from animal,poultry, or fish produce by-products that canbe used as raw material at a rendering plant.
The Rendering ProcessThe rendering process is customized depend-ing on the products and the raw materials.However, the following discussion is applica-ble to the rendering process in general. Thewastes that result from most rendering oper-ations are remarkably similar. Figure 10-19presents a generalized schematic of a "typi-cal" rendering plant. There are both "wet"and "dry" rendering processes. In the wetrendering process, live steam is injected intothe rendering tank, along with the materialbeing rendered. In dry rendering, steam is

Figure 10-19 Schematic of a "typical" rendering plant.
confined in a jacket that surrounds the tankcontaining the material being rendered.
As illustrated in Figure 10-19, renderingplants have facilities for receiving and storingthe raw material. The materials are takenfrom storage and are usually ground andblended. The ground and blended material isthen pumped, conveyed, or placed by use of abucket loader, into a tank in which the ren-dering process takes place (the rendering sys-tem). Live steam at 40 to 60 psig is intro-duced, and the rendering process, not to beconfused with cooking, takes place. In somecases, pH is adjusted. Sometimes, otherchemicals are introduced. As the renderingprocess proceeds, fats and oils are drawn offthe top of the tank. The remaining liquid,called "stick water," contains the proteinmaterial. The stick water is typically evapo-rated and added to animal feed.
Dry rendering typically involves placingthe materials to be rendered in a steam-jack-eted rendering system that is placed undervacuum. Screening and centrifugation areused to separate the fats and oils from thesolids, which contain the protein matter.
A large rendering plant in the northeastrendered a variety of materials, including by-products (the mostly inedible substances
remaining after slaughtering and processing)from beef, poultry, and fish packing opera-tions. Table 10-25 presents a list of materialsrendered by this facility. Fat and bone, poul-try by-products (heads, feet, entrails, blood,and carcasses of rejected birds), fish, and fishby-products were converted to high proteinmeal by use of a continuous dry renderingprocess. In this system, diagrammed in Fig-ure 10-20(a), a slurry of recycled fat (fromrestaurants, butcher shops, and beef packingplants) and ground-up bones, meat, andother substances was dehydrated in a multi-ple effect evaporator. Vapors were vented to abarometric condenser. Expellers (centri-fuges) were used to separate the hot fat prod-uct from the protein meal. The process isoften referred to as, "cooking"; however,temperatures were maintained at 1400F orlower.
Feathers from chicken processing plantswere handled in a separate system. A sche-matic diagram of the feather processing isshown in Figure 20(b). The feathers werehydrolyzed using high temperature and pres-sure and then dried in a steam tube rotarydryer.
A variation of the rendering process islow-temperature rendering, in which the raw
Receiving Grinder Storage Disintegrator
StickWater
Centrifuge EvaporationRenderingSystem
Skim
Oil Filter
Oil
Oil Storage
Vapors toWet Scrubber
Protein MealStorage

materials are heated to just above the meltingpoint of the fat. Centrifugation is used toseparate the fats and oils from the proteinmatter.
Wastes GenerationSolid, airborne, and waterborne wastes aregenerated at rendering plants in considerablequantities. Some of these are relatively diffi-
cult to manage, largely because of their nui-sance odor-causing potential.
Solid WastesSolid wastes are generated at the receivingand storing area in the form of containersthat are no longer usable and broken pallets.Also, construction debris from plant mainte-nance, modifications, expansions, and peri-
Figure 10-20 Schematic of rendering systems.
FeatherStorage
FeatherCookers
FeatherDryer
Feather MealStorage
Receiving(C-1 Pit)
HogStorage
Bins Disintegrator C - GSystem
OilFilter
OilStorage
MealStorage Expellers
Table 10-25 Material Received and Produced by Rendering Facility
Raw Material
Fat, bone viscera
Poultry by-product
Sludge from treatment plant(poultry processing)
Fish by-products
Whole fish
Menhaden
Feathers
Restaurant grease
* Poultry feed supplement.
Mode of Delivery
Drum and truckload
Trailer truck
Trailer truck
Trailer truck
Trailer truck and boat
Trailer truck and boat
Trailer truck
Drum
Processing Steps
Carver- Greenfield
Carver- Greenfield
Carver-Greenfield
Carver- Greenfield
Carver-Greenfield
Carver- Greenfield
Feather cooker and dryer
Steam table and filtration
Final Product
Beef meal
Poultry meal
Poultry meaf
Poultry meal
Fish meal
Fish meaf
Feather meal for fire extin-guisher foam
Poultry feed supplement

odic facility upgrade projects contributes tothe solid wastes that must be managed.
Airborne WastesAirborne wastes are an ever-present potentialat typical rendering plants. All objects withwhich the raw material for the renderingplant comes in contact are subject to becom-ing the source of a nuisance odor problem.The process of anaerobic biodegradation ofthe easily degraded animal flesh proteinscauses the odors. This process is referred toas "putrefaction," and it produces foul-smell-ing amines, amides, indole, skatole, variousvolatile acids, and reduced sulfur compoundssuch as hydrogen sulfide and methyl as wellas ethyl mercaptans.
Waterborne WastesPrimary sources of wastewaters from render-ing plants are as follows:
• Blood and other "juices" that drain fromthe animal, poultry, and fish by-prod-ucts that are the raw material for the ren-dering facility
• Plant washdown water, which is con-stantly in use for the purpose of control-ling air pollution by foul odors
• Blow-down from wet scrubbers used forair pollution control
Plant washdown, as part of housekeepingpractices implemented to control nuisanceodors, is the major source of wastewater interms of volume. Constant washdown of theplant equipment and floors is necessitated bythe nature of the equipment as well as thenature of the material handled. Most render-ing plants produce nothing for human con-sumption. For this reason, the equipment isnot the easily cleaned, relatively expensivetype used in edible food processing plants.The material handling equipment typicallyconsists of screw conveyors and open impel-lor pumps. This equipment handles poultryand animal entrails, fish and fish parts, andsludge from wastewater treatment plants
(both on-site treatment plants and treatmentplants located at off-site meat, poultry, andfish processing plants). This combination ofsloppy material, along with the types of han-dling equipment, leads to almost continuousdripping and spilling.
In addition, oil vapors within the process-ing areas continually condense upon sur-faces, resulting in a biodegradable film thatwill get thicker as time goes on if it is not reg-ularly washed off. The consequence is thatplant washdown must continue in a never-ending fashion. As soon as an area is cleaned,it begins to downgrade. As well, wet scrub-bers must be constantly in operation to con-trol odors.
Wastes MinimizationNotwithstanding the fact that plant wash-down water creates most of the wastewaterthat requires treatment, good housekeepingpractices are still the most important wastesminimization technique for rendering facili-ties. The key is to make use of drip pans andother containment devices to decrease asmuch as possible the quantity of materialrequired to be cleaned from unconfmed areassuch as floors and walls and from the sur-faces of the machinery.
Dry methods of cleaning must always beused to the maximum extent feasible. Drymethods of cleaning, using brooms, shovels,vacuum cleaners, and air blowers, are animportant waste minimization technique inany industrial setting. It is especially impor-tant in the setting of a meat, poultry, or fishby-product rendering facility, because of theever-present "juices" of very high organiccontent.
Whenever possible, liquid drainings andjuices should be disposed of before they getto the rendering facility. This, of course,involves a tradeoff, since these liquids mustbe managed somewhere. From the point ofview of the rendering facility, the less of thismaterial the better.
One example of this type of waste mini-mization occurred at a trash fish ("nonedi-

ble" fish, such as menhaden) rendering facil-ity on the east coast of the United States.Before the wastes minimization measure wasinstituted, fishing boats would catch fish byuse of the "purse-seine method" and loadthem aboard boats. The boats would trans-port them to shore, where they were trans-ferred to trucks by use of a vacuum pump.During the earlier days of this industry, thevacuum pump routinely pumped the fish, aswell as the "fish juice," out of the boat.Because of the high water content of the fishjuice, it was sent overboard into the harbor,rather than put into the trucks and carried tothe rendering facility. Evaporation of thiswater was too costly. Eventually, however, itbecame illegal to dump this fish juice in theharbor. At this point, the juice was pumpedinto the trucks and then dumped on thereceiving room floor at the rendering facility.This caused a massive wastewater problem atthe rendering facility. The solution that waseventually worked out was to handle and dis-pose of this fish juice at dockside in a non-polluting manner.
In the case of wet rendering, there may beexcess tank water at the end of the renderingprocess. This water, which typically has aBOD5 in the range of 50,000 mg/L and a TSSvalue in the range of 2%, should be evapo-rated and blended into animal feed supple-ment.
Treatment and DisposalTreatment and disposal of wastes from meat,poultry, and fish by-product rendering facili-ties is a matter of minimizing contactbetween organic material and the solidwastes, in order to control odors from thesolid wastes, and handling and disposal ofthe solid wastes as ordinary (nonhazardous)waste. Regarding air pollutants, the key iscontainment and treatment by means of wetscrubbers. Wastewaters are entirely organic,with the possible exception of wet scrubberblow-down and chemicals used for pHadjustment and for cleaning the plant. Bio-
logical treatment should, therefore, beappropriate.
Solid WastesThe principal solid wastes from meat, poul-try, and/or fish by-products consist of pack-aging and transport materials, such as 55-gallon drums, broken pallets, steel strapping,and nonrecyclable containers previouslyused for chemicals, detergents, lubricants,and laboratory supplies. After aggressivewastes minimization and recycling, thesematerials can be disposed of as ordinary solidwastes. There should be no organic materialsin the solid waste stream, since any suchwastes should simply have been added to thefeed to the rendering system.
Airborne WastesFor many rendering facilities, the most trou-blesome problem is the nuisance odors fromthe anaerobic biodegradation of protein mat-ter. The solution is to rigorously contain anyodors so generated and to treat them by theoxidative action of the chemical solutions inwet scrubbers.
The foul odors that require containment,collection, and treatment emanate from han-dling and storage of the raw material, as wellas from the handling and processing equip-ment on the processing floor. The renderingprocess itself, as well as subsequent processessuch as pressing and drying, are generallyagreed to be the sources of strongest odors.These "high-intensity" sources emit varyingconcentrations of odors, depending on thetype and age of the raw material, and thetemperature of the raw material during thehours or days prior to its placement in therendering system. In general, the older theraw material and the higher its temperature,the more concentrated, or stronger, the badodors are.
Odors from rendering operations havebeen generally described as those of ammo-nia, ethylamines, and hydrogen sulfide. Ska-tole, other amines, sulfides, and mercaptans

also contribute to the blend of renderingplant odors.
The types of equipment normally used forcontrolling odors in the rendering industryare afterburners, condensers, adsorbers, andwet scrubbers. Gases from wet renderingprocesses are almost always condensed.Removing condensable odors results in asmuch as a tenfold volume reduction. Thecondensed gases can then be directed toadditional treatment.
Flame incineration (afterburning) offers apositive method of odor control. However,the cost of fuel makes afterburner operationexpensive. Scrubbing with chemical solu-tions is the primary method for controllingodors. Activated carbon has also been usedfor removing odors by the mechanism ofadsorption; however, its application is lim-ited to treatment of relatively cool and drygases.
The typical situation at rendering plantsof large size is to have from two to four wetscrubbers. Air from any location within theplant must go through one of these scrubbersbefore reaching the outside. Figure 10-21 isan illustrative diagram of a typical scrubbingsystem used for this purpose. The systemshown in Figure 10-21 consists of a venturi(fixed throat opening) section followed by apacked tower. A large induced-draft fan pullsair from within the building that houses therendering system and forces it through theventuri scrubber system shown in Figure10-21. Process gases are also forced to passthrough a venturi scrubber system, similar tothe system shown in Figure 10-21.
The wet scrubber portion of the venturiscrubber system is typically a tower packedwith plastic tellerettes, which provide a verylarge surface area. A solution of hypochlorite,with the pH adjusted for maximum effective-ness, is sprayed onto the top of the tellerettes.This solution flows down over the (verylarge) surface area of the packing. At thesame time, gases are forced up through thepacking by the action of the fan. As the gasescontact the scrubbing solution, the oxidizingaction of the hypochlorite changes the chem-
ical nature of the odor-causing substances.Also, many of these substances become dis-solved in the scrubbing solution.
One of the most important objectives ofthe odor control system described above ismaintaining a negative pressure within therendering plant building. If the barometricpressure inside the building is less than thebarometric pressure outside the building, itis more difficult for fugitive emissions to passfrom inside to outside. This negative pressure(negative inside relative to outside) is main-tained simply by keeping all the doors andwindows closed while operating the wetscrubber systems. It is necessary for thebuildings to have good structural integrity,that is, to be free of leaks in the walls, and tohave good, reasonably tight fits regardingdoors and windows. If the building is rela-tively sound, it is a simple matter to maintaina negative pressure and to maintain effectivecontrol over fugitive emissions. Occasionalopening and closing of doors for human andtruck traffic can be tolerated.
Waterbome WastesWastewaters from rendering plants using redmeat, poultry, and/or fish by-products as rawmaterial are amenable to biological treat-ment, since these wastewaters are almostentirely organic. The only sources of inor-ganic chemicals are the blow-down wastesfrom the air pollution control systems andpossibly inorganic agents used for cleaning.
Anaerobic as well as aerobic technologiesare valid potential treatment technologies.The normally very high strength character ofthese wastewaters, as well as elevated temper-atures, makes them particularly well suited toanaerobic treatment technologies. However,aerobic treatment has been used with successas well. A large rendering facility in NewEngland successfully treated wastewaters bymaking use of chemical coagulation and dis-solved air flotation (DAF) to remove most ofthe protein, fats, and oils (which accountedfor about 80% of the BOD5), followed byactivated sludge for removal of the dissolvedfraction of waterborne pollutants.

Figure 10-21 Schematic diagram of wet scrubber system.
This rendering facility used by-productsfrom red meat processing, poultry process-ing, fish processing, and sludge from waste-water treatment as raw material. Two render-ing systems were used. One was a continuousflow dry rendering system that operated atabout 1400F and under a vacuum. The sec-ond was a batch-type dry rendering system.On a typical day the continuous flow systemwas started up on poultry (offal, heads, feet,and blood) and operated at the rate of 30,000lb/hr for seven hours. It would be switched tofat and bone and run at the rate of 23,000 Ib/hr for 2Vi hours. It would then be switched tofat, bone, and meat scraps from red meatprocessing and butcher shops, as well as
grease from restaurants in the area. It wouldthen be switched to by-products from fishprocessing plants and operated at 50,000 Ib/hr for three hours, or so. Finally, it would beswitched to menhaden, a particularly oilyfish, for four to ten hours, depending on sup-ply.
The batch rendering system would bestarted up on feathers from poultry process-ing plants on Monday afternoons and run ata rate of about 3,000 pounds per hour untilthe supply of feathers was exhausted on Sat-urday.
The characteristics of the combinedwastewaters from this plant, including plantwashdown water, were as follows:
ODOROUSAIRIN
PLANT
WATER
SPRAY NOZZLEASSEMBLY
PACKED BED
NoncloggingMist
Eliminator
RECYCLEANDSEPARATIONTANK
DRAIN
FLOWCONTROL
UNIT
WATER
CHEMICAL
Final DropletMist Eliminator
EXHAUST BLOWER
CLEANAIROUT

. Flow 96,000 gpd
. BOD5 85,000 mg/L (68,000 lb/day)
. TSS 6,000 mg/L (4,800 lb/day)
Chemical coagulation in combinationwith DAF removed about 80% of the BOD5
and about 90% of the TSS. About 95% of theoil and grease was also removed by DAF. Allof the sludge (flot) from this system was usedas raw material in the continuous feed dryrendering system.
The aerobic, activated sludge system thatfollowed the DAF system was operated by useof MLVSS concentrations between 9,000 and11,000 mg/L and a hydraulic retention timeof about three days. An integral clarifier wasattached directly to the aeration tank, andsludge was wasted from the aeration tank.Sludge age was maintained at ten days. All ofthe waste sludge was used as raw material inthe continuous flow dry rendering system.
Overall BOD5 removal for the combinedDAF-complete-mix activated sludge systemconsistently exceeded 99%. TSS and oil andgrease removals exceeded 95%.
The Manufacture of Lead AcidBatteries
A battery, as the word is used in this section,is a modular source of electric power inwhich all or part of the fuel is containedwithin the unit and the electrical power isgenerated by a chemical reaction within theunit. The primary components are theanode, the cathode, and the electrolyte. Thefunction of the anode and cathode (the elec-trodes) is to convert chemical energy intoelectrical energy. If an electrical circuit out-side the unit is connected between the anodeand the cathode, electric current will becaused to flow through the circuit.
The EPA has divided the manufacturing ofbatteries into eight categories: cadmium, cal-cium, lead, leclanche, lithium, magnesium,nuclear, and zinc. The lead subcategory is thelargest, in terms of number of manufacturingplants and volume of batteries produced.
Products that use batteries included in thelead subcategory include automobiles, porta-ble hand tools, lanterns, and various imple-ments used in industry and the military.
There are four common types of lead acidbatteries: wet-charged, dry-charged, damp,and dehydrated. Wet-charged batteries areshipped after manufacture with electrolyte.All others are shipped without electrolyte.
Lead Battery ManufactureOnly production of the anode, the cathode,and ancillary devices are considered part ofbattery manufacture. Production of thestructural components, such as the cases, ter-minal fittings, electrode support grids, seals,separators, and covers, are all included inother manufacturing categories. However,any or all of them may be manufactured atthe same plant that manufactures the elec-trodes.
Anodes are metals when in their fullycharged state in a battery. In the case of mostlead acid batteries, anodes are manufacturedby applying a paste of lead oxide to a sup-port. The paste-support structure is allowedto dry. Cathode active materials are typicallymetal oxides. The lead oxide substance usedto make cathodes for lead acid batteries iscalled "leady oxide" within the battery man-ufacturing industry. This substance is a spe-cific oxidation state of lead oxide that is 24%to 30% lead free. It is used for the manufac-ture of both the anodes and cathodes in leadacid batteries and is manufactured by the so-called "Barton process" or by a ball millprocess.
Cathodes for use in lead acid batteries aremanufactured by applying a paste of theleady oxide to a structural grid. The gridmust be able to carry the desired electricalcurrent as well as be strong enough to sup-port the leady oxide. Thus, the fabrication ofanodes and cathodes for use in lead acid bat-teries is very similar. There is a difference,however, in that cathodes remain in the leadperoxide state.

Ancillary operations are operations of thebattery manufacturing process other thanfabrication of the anodes and cathodes.Included are battery assembly; production ofleady oxide; battery washing; and washing offloors, manufacturing equipment, and per-sonnel.
Figure 10-22 presents a flow diagram forthe process of manufacturing wet-chargedlead acid batteries using a closed formationprocess. It is more or less typical of all leadacid battery manufacturing processes, as faras wastes generation is concerned. As illus-trated in Figure 10-22, there are two "initial"processes. One is the production of leadyoxide to be used in fabricating anodes andcathodes. The other is casting of the grids tobe used for this same purpose.
Leady Oxide ProductionFinely divided metallic lead is mixed withlead oxides to produce the active materialsused for manufacturing the battery elec-trodes or plates. So-called "leady oxide" isproduced by placing high-purity lead parti-cles in a ball mill. The friction within the ballmill generates heat, and a forced flow of airprovides oxygen. The result is particles of redlead letharge and a certain percentage ofunoxidized metallic lead. Noncontact cool-ing, along with regulation of the air flow,governs the speed of oxidation of the lead.
An alternative process, the Barton process,produces leady oxide by feeding molten leadinto a pot and vigorously agitating it to breakthe lead into small droplets. Oxygen from astream of air oxidizes a certain percentage ofthe lead into a mixture of yellow lead, redletharge, and metallic lead.
Grid ManufacturingGrids are fabricated by casting lead alloyssuch as lead-antimony and lead-calcium.Trace amounts of arsenic, cadmium, sele-nium, silver, and tellurium are also added.
Paste Preparation and PastingThe anodes are fabricated by applying a pasteof lead oxides mixed with binders and othersubstances to the grids. The paste is preparedby mixing leady oxide and granular lead orred lead. The cathodes are prepared in thesame manner, except that the paste is pre-pared by mixing leady oxide, lead, sulfuricacid, water, and expanders such as lamp-black, barium sulfate, and various organicmaterials. One of the principal objects in fab-ricating the electrodes is to create a very largesurface area by preparing the paste so as tohave a porous, very rough texture. The pasteis often applied by hand. Some facilities usemechanized equipment.
CuringA principal objective of the curing process isto induce the electrodes to obtain properporosity and strength. To this end, the curingprocess is strictly controlled. The plates areflash-dried, stacked, and covered or placed ina humidity-controlled room for several days.Small crystals of tribasic lead convert to leadperoxide. One technique is to soak the platesin sulfuric acid to enhance sulfation andimprove mechanical properties. This soakingis done in the battery case or in a separatetank.
Stacking and WeldingThe cured plates are stacked for convenientaccess at the assembly line. Separators areplaced so as to prevent short-circuiting. Sep-arators are made from plastic, rubber, fiber-glass, or paper.
AssemblyThe assembly process involves placing thestacked, alternating anode-cathode plateswithin the battery case, welding the connect-ing straps, and installing the covers andvents. Also, the connections are made to thebattery posts.
There are two types of assembly: open for-mation and closed formation (formationrefers to charging the battery as a result of

Lead
Acid WaterLead OxideProduction
AcidCutting
PastePreparation Pasting Grid
Casting
Lead Alloy
Wastewater
Curing
Stacking andWelding Separators
Case, Covers,Terminals
Assembly
Acid Fill
Dump andRefill
ClosedFormation Wastewater
Wastewater
SGL Fill
Wash
Test
BoostCharge
DBL Fill
FinishedProduct
Figure 10-22 Production of wet-charged lead acid batteries using the closed formation process.

acid reacting with substances on the elec-trodes). Figure 10-22 is appropriate to theclosed formation process. In the closed for-mation process, the top and vents of the bat-tery are installed before the acid (electrolyte)is added. The opposite is true for the openformation process, which allows visualinspection of the plates, separators, strapwelds, and posts after the electrolyte has beenadded.
Electrolyte Preparation and Addition(Acid Fill)The electrolyte solution for the battery is pre-pared by diluting concentrated sulfuric acidwith water. This acid-cutting process is typi-cally performed in two steps: The first cut isdilution to 45% acid, by weight. This acidsolution is used for preparation of the paste,described earlier. The second acid cut is dilu-tion to 25% to 30%. This acid solution isused for battery formation and filling.
With respect to the quantity of wastewatergenerated, there are several different meth-ods used for filling lead acid batteries. One isto fill each battery to overflowing to ensurethat filling is complete. The other is toimmerse the batteries in a tank of the electro-lyte, after which the batteries are rinsed. Athird is to make use of sensing and relayequipment to automatically stop the fillingprocess at the proper time.
FormationThe active substance for the cathode is leadperoxide, although it is not a component ofthe paste that is applied to the cathode gridsduring fabrication of the cathodes. The for-mation of lead peroxide takes place after thenewly fabricated cathodes are immersed inthe electrolyte and an electric current isapplied. In the case of the closed formationbattery manufacturing process, this processtakes place just after the acid fill step.
The forming process itself consists ofapplying an electric current between theanodes within a newly filled battery and the
cathodes. When this is done, lead oxide andsulfate are converted to lead peroxide on thecathode, and lead oxide is converted to leadon the anode. The final composition on thecathode is 85% to 95% lead peroxide, and thecomposition on the anode is greater than90% lead.
The formation process takes time. Severalmethods are used to ensure proper forma-tion. Two of them are as follows: in onemethod, each battery is filled with full-strength electrolyte, and the battery is readyfor shipment after one to seven days,depending on the type of battery and thecharacteristics desired. The second methodinvolves filling each battery with a moredilute electrolyte and then emptying andrefilling with full-strength electrolyte beforeshipment. A boost charge is applied prior toshipment. The entire process takes place inone day, or less.
Battery WashdownTypically, batteries are washed before ship-ment. This washdown has the purpose ofremoving electrolyte and other materialsfrom the outside surfaces of the batteries,resulting from filling and forming. Deter-gents are usually used to remove oils anddirt.
Battery Testing and RepairTesting batteries seldom generates wastes;however, when testing determines that a bat-tery is faulty, it is taken apart for repair.When this is done, faulty parts are replaced,and the faulty parts become solid waste. Elec-trolyte drained from the battery becomeswaterborne waste.
Wastes GenerationLead acid battery manufacturing plants arehighly variable in terms of wastes generated.For instance, work done in preparation forproducing the EPA Development Documentfor the battery manufacturing point sourcecategory determined that total plant dis-

charges of wastewater ranged form 0 to390,000 gpd, with a median of 22,000 gpd.
Solid WastesSolid wastes are generated from packagingand shipping wastes and construction debrisfrom plant maintenance, modifications,expansions, and periodic facility upgradeprojects. In addition, sludges from wastewa-ter treatment and waste resins from processwater deionization require management.Lead acid battery manufacturing plants alsogenerate solid wastes as a result of reject bat-teries and faulty battery parts, includingcases, tops, posts, electrode grids, straps, andseparators.
Airborne WastesThe major source of air pollutants from leadacid battery manufacturing plants is acidfumes. Typically, these substances are con-trolled by use of scrubbers. There is always adischarge, owing to the less than 100% effi-ciency of the scrubbers; therefore, an aggres-sive operation and maintenance program,including aggressive preventative mainte-nance, is necessary.
Scrubbers are located throughout theprocessing plant, including the processes car-rying out the following production steps:leady oxide production, grid manufacturing,electrolyte preparation and addition, forma-tion, battery washdown, battery testing andrepair, and any acid storage and dispensingfacilities.
Waterborne WastesWastewater generated from the productionof lead acid batteries has three primarysources: the paste preparation and pastingoperations, the electrode forming opera-tions, and the washing of finished batteries.However, there are wastewaters from each ofthe manufacturing steps in the production oflead acid batteries, as illustrated in Figure10-21.
Leady Oxide ProductionLeady oxide production results in wastewa-ters from cooling and leakage from ball mills,contact cooling during grinding of oxides,and from wet scrubbers used for air pollu-tion control.
Paste Preparation and PastingPaste preparation and pasting results in waste-waters from washdown of the equipment aswell as the production area. These washdownwastewaters typically contain high concentra-tions of suspended solids and lead, as well asadditives used in making the paste.
Electrolyte Preparation and Addition(Acid Fill)There is almost always dripping, spilling, andoverflowing of acid in this area. Therefore,washdown and rinse waters are typicallyhighly acidic. Also, wet scrubbers are nor-mally used in this area because of the fumesfrom the dripped, leaked, spilled, or over-flowed acid.
FormationThe formation production area is subject toacid spills, similar to the fill area. The waste-waters generally contain significant concen-trations of various metals. Copper and ironin the wastewater result from corrosion,caused by the acid, of process equipment andcharging racks. Oil and grease also resultfrom equipment washdown. Wet scrubbersin this area generate significant wastewater.
Battery WashdownThis battery washdown process is the site ofconsiderable wastewater generation. Wetscrubbers, which generate significant waste-water, are used in this area as well.
Battery Testing and RepairWhen faulty batteries are detected, they areoften drained. The drained electrolyte can bea major source of wastewater. Wet scrubbersare often used in this area.

Wastes MinimizationThere are many opportunities for wastesminimization at lead acid battery manufac-turing facilities. Most fall within the categoryof good plant housekeeping. As is the casewith many other industries, the key to mini-mizing the cost for eventual waste treatmentand disposal is to aggressively implement thefollowing:
• Whenever possible, nontoxic substancesshould be used for degreasing and clean-ing.
• If toxic substances, for instance, chlori-nated volatile organics, must be used fordegreasing or other cleaning process,containment, recycle, and reuse must bepracticed to the maximum extent possi-ble.
• Biodegradable detergents should beused.
• Drips must be contained and returned tothe source.
• Aggressive maintenance must be prac-ticed to eliminate leaks and "accidents"that could lead to noncontainment ofchemicals and other substances.
• Reconstitution of cleaning baths, acidbaths, alkali baths, and plating bathsshould be done on an as-needed basisaccording to the work performed, ratherthan on a regular timing or other sched-ule.
• Water used for the first stages of batterywashdown should be recycled waterfrom other processes.
• Dry methods of cleanup, includingbrooms, shovels, and dry vacuuming,should be used to the maximum extent.
• Techniques such as treating wastewaterfrom washdown of the pasting areashould be treated in multistage clarifiers.At some plants, this technique hasenabled total reuse of the water. Theclarified water has been used for wash-down, and the solids have been reused innew batches of paste.
• Rinsing should be counter-current, withrespect to freshwater makeup and spentrinsewater overflow.
• Purchasing should be guided by aggres-sive selection of raw materials in order toobtain the cleanest possible materials.
• There should be a constant and consis-tent program to substitute less pollutingand nonpolluting substances for thosethat require expensive treatment andexpensive disposal.
• In concert with the aforementioned,there should be a constant and consis-tent program for replacing processcontrols, including sensors, micropro-cessors, and hardware, with the objectiveof decreasing waste and maximizingretention, containment, recycle, andreuse of all substances. For instance, thebattery filling system must be constantlymaintained and upgraded to keep over-flowing to a minimum.
• Technologies for recovering and regener-ating acids, lead, and other chemicals aswell as separating and removing con-taminants should be aggressivelyemployed. Ultrafiltration to effectremoval of oils from alkaline cleaningsolutions is an example. Centrifugationhas also been used for this purpose. Acti-vated carbon can be used to removeorganic impurities.
Both filtration and centrifugation produceconcentrated impurities that offer the possi-bility of recovery. If recovery of substances isnot feasible, the concentrated impurities arein a form more easily disposed of.
Wastewater TreatmentWastewaters from the manufacture of leadacid batteries are typically acidic, as the resultof contamination by the sulfuric acid used asthe electrolyte. In addition, dissolved leadand suspended solids containing lead aremajor components. Differences from oneplant to another regarding the presence ofpollutants other than acid and lead depend

on whether or not leady oxide is produced atthe plant, whether or not the electrode gridsare produced at the plant, and the type ofgrids fabricated (i.e., antimony alloy, purelead, or calcium alloy). Other factors includedifferences in the method of plate curing,forming, and assembly. Parameters that areregulated, and therefore have been found inwastewaters from plants manufacturing leadacid batteries, include antimony, cadmium,chromium, copper, lead, mercury, nickel, sil-ver, zinc, iron, oil and grease and TSS. pHvalue is also regulated. Some plants pretreatand discharge to a POTW. Others treat anddischarge on site. Either way, the wastewatertreatment system must be capable of pH con-trol and removal of multiple metals.
In general:
• Wastewaters containing significantquantities of oil and grease should beisolated, treated for removal of oil andgrease (for instance, by reverse osmosis,or RO), and then combined with otherwastes for removal of metals.
• Wastewater, including equipment wash-down water, from the paste makeup andpasting areas should be isolated andtreated on site by multiple clarifiers, andboth the clarified water and the solidsreused. The water should be used forpaste makeup and for acid dilution inthe electrolyte makeup area. The solidsshould be returned to paste makeup. Asusual, a certain amount of blow-downwill probably be required.
• The final wastewater stream from a typi-cal lead acid battery manufacturing facil-ity, after wastes minimization, wastessegregation and pretreatment, and com-bining of the pretreated flows, can bestbe treated by use of precipitation forremoval of metals, sedimentation forremoval of precipitated metals and othersuspended solids, and chemical coagula-tion, sedimentation, sand, mixed mediafiltration, final pH adjustment, and ionexchange as necessary to achieverequired levels of metals, TSS, pH, and
oil and grease. It may be necessary toperform the metals removal operationsin two or more stages in series, using dif-ferent values of pH for each stage, toremove all the metals (some of whichhave different values of pH for lowestsolubility). These wastewater treatmenttechniques are discussed in detail inChapter 7.
Bibliography
"A Report on Bottled and Canned SoftDrinks, SIC 2086, and Flavoring Extractsand Syrups, SIC 2087." Associated Waterand Air Research Engineers, Inc., August1971.
ABMS Non-Ferrous Metal Data, 1988.Amerine, M. A., H. W. Berg, R. E. Kunkee, C.
S. Ough, V. L. Singleton, and A. D. Webb.The Technology of Wine Making. 4th ed.Westport, CT: AVI Publishing, 1980.
Anonymous. "California Wine: On theGrapevine." Economist 307, No. 7547(April 23, 1988).
Apotheker, S. "Plumbing Lead from theWaste Stream." Resource Recycling (April1992): 34.
Azad, H. S. Industrial Waste ManagementHandbook. New York: McGraw-Hill, 1976.
Bagot, B. "Brand Report No. 161-DomesticWine: Wine Tastings." Marketing & MediaDecisions 24, No. 5 (May 1989).
Baker, D. A., and J. E. White. "Treatment ofMeat Packing Waste Using PVC TricklingFilters." Proceedings of the Second NationalSymposium on Food Processing Wastes. U.S.Environmental Protection Agency. Den-ver, CO: 1971.
Bethea, R. M., B. N. Murthy, and D. F. Carey."Odor Control for Rendering Plants."Environmental Science and Technology 7(June 1973).
Bishop, R I. Pollution Prevention: Fundamen-tals and Practice. New York: 2000. p. 426.
Blanc, E C , and S. H. Corr. "Treatment ofBeef Slaughtering and Processing WasteWaters Using Rotating Biological Contac-

tors." Proceedings of the 38th IndustrialWaste Conference. Purdue University,1983. pp. 133-140.
"Bottling Breakthrough at 1000 to 2000BPM." Food Engineering (March 1969).
Bramer, H. C. Industrial Wastewater Manage-ment Handbook. New York: McGraw-Hill,1975.
Brooks, C. S. "Metal Recovery from WasteSludges." Proceedings of the 39th PurdueIndustrial Waste Conference. Purdue Uni-versity, 1985. pp. 545-553.
Carron, H. Modern Synthetic Rubbers. NewYork: Van Nostrand Reinhold, 1937.
Chadwick, T. H., and E. D. Schroeder. "Char-acterization and Treatability of PomaceStillage." Journal of the Water PollutionControl Federation 45 (1978).
Considine, D. M. Chemical and Process Tech-nology Encyclopedia. New York: McGraw-Hill, 1974.
Considine, D. M., and G.D. Considine. Foodsand Foods Production Encyclopedia. NewYork: Van Nostrand Reinhold, 1982.
Crandall, C. J., and J. R. Rodenberg. "WasteLead Oxide Treatment of Lead Acid Bat-tery Manufacturing Wastewater." Proceed-ings of the 29th Purdue Industrial WasteConference. Purdue University, 1974. pp.194-206.
Crow, D. R., and R. R Secor. "The Ten Stepsof De-inking." TAPPI Journal 70, No. 7(July 1987).
Current Industrial Reports. U.S. DOC. Bureauof the Census. 1986, 1989.
Cushnie, G. C , Jr. Removal of Metals fromWastewater: Neutralization and Precipita-tion. Park Ridge, NJ: Noyes Publications,1984.
Eldridge, E. E "Michigan Engineering Exper-iment Station Bulletin #60." 1934.
Ellis, J., and R. W. Williams. "Recovery of Tinfrom Electroplating and Rinsewaters."Effluent and Water Treatment Journal 18,No. N8 (1978): 389.
Etzel, J. E. Private conversation. March 1989.Farmer, J. K., A. A. Friedman, and W. C.
Hagen. "Anaerobic Treatment of WineryWastewaters." Proceedings of the 43rd
Industrial Waste Conference. Purdue Uni-versity, May 1988.
"Frozen Foods." Supermarket Business 44,No. 9 (September 1989): 175.
Fukuyama, Yoji, Y. Misaka, and K. Kato."Recovery of Aluminum Hydroxide fromFabricating Plant of Aluminum Products."Proceedings of the 29th Industrial WasteConference. Purdue University, May 1974.
Gillies, M. T. "Soft Drink Manufacture." FoodTechnology Review 8 (1973).
Graham, A. Kenneth. Electroplating Engi-neering Handbook. New York: Van Nos-trand Reinhold, 1971.
Gudger, C. M., and J. C. Bailes. "The Eco-nomic Impact of Oregon's Bottle Bill."Corvalis, OR: Oregon State University,March 1974.
Hamilton, J. O. C. Abstract No. 88-17491."What Slump? It's a Vintage Year for Pre-mium California Wines." Business Week(Industrial Technology Edition) 2947(May 1986).
Hunt, G. E. et al. "Cost-Effective Waste Man-agement for Metal Finishing Facilities."Proceedings of the 39th Industrial WasteConference. Purdue University, 1985. pp.545-553.
"Increasing Wastewater Treatment." FoodEngineering 59, No. 8 (August 1987): 97.
Jones, D. D. "Biological Treatment of High-Strength Coke-Plant, Wastewater." Pro-ceedings of the 38th Industrial Waste Con-ference. Purdue University, 1983. pp. 561.
Kanicki, D. P. "Casting, Advantages, Applica-tions, and Market Size." In 45M HandbookV. 14: Castings. ASM International, 1988.
Krofta, M., and L. K. Wang. "Total Closing ofPaper Mills with Reclamation and De-ink-ing Installations." Proceedings of the 43rdIndustrial Waste Conference. Chelsea, MI:Lewis Publishers Inc., May 1988.
Labella, S. A., I. H. Thaker, and J. E. Tehan."Treatment of Winery Waste by AeratedLagoon, Activated Sludge and RotatingBiological Contactor." Proceedings of the27th Industrial Waste Conference. PurdueUniversity, May 1972.

Loehr, R. C. Pollution Control for Agriculture.2nd ed. Orlando, FL: Academic Press,1984.
Lowenheim, R A. Electroplating. Sponsoredby the American Electroplaters' Society.New York: McGraw-Hill, 1978.
Macauley, M. N., W. T. Stebor, and C. L.Berndt. "Anaerobic Contact Pretreatmentof Slaughterhouse Waste." Proceedings ofthe 42nd Industrial Waste Conference. Pur-due University, 1987. pp. 647-655.
Manzione, M. A., D. T. Merrill, M. McLearn,and W. Chow. "Meeting Stringent MetalsRemoval Requirements with Iron Adsorp-tion/Coprecipitation." Proceedings of the44th Industrial Waste Conference. PurdueUniversity, 1989.
Maxwell, J.C, Jr. "Coolers Have ChillingEffect on Wine Sales." Advertising Age 59,no. 27 (June 27, 1988).
Medbury, H. (ed.) The Manufacture of Bot-tled Carbonated Beverages. Washington,DC: American Bottlers of CarbonatedBeverages, 1945.
Mermelstein, H. H. "Water Purification forBeverage Processing." Food Technology(February 1972).
Metal Finishing 55th Guidebook Directory 85,No. IA (Mid-January 1987).
Metals Handbook. 9th ed. ASM International,1988.
MHR-VIANDES. World Beef and Veal Pro-duction in 1996: Meat Industry Statistics.France: Rond Point de l'Europe, 1998.
Modern Pollution Control Technology, Vol. 1,Air Pollution Control. New York: Researchand Education Association, 1978.
Morton, M. Rubber Technology. AmericanChemical Society. New York: Van Nos-trand Reinhold, 1973.
Nemerow, N. L. Liquid Waste of Industry.Reading, MA: Addison-Wesley, 1971.
Neveril, R. B., J. U. Price, and K. L. Engdahl."Capital and Operating Costs of SelectedAir Pollution Control Systems IV." ControlTechnology News 28 (November 1978).
Niles, C. E, and H. Gordon. "Operation of anAnaerobic Pond on Hog Abattoir Waste-water." Proceedings of the 26th Industrial
Waste Conference. Purdue University,1971.
Norcross, K. L., S. Petrice, R. Bair, and G.Beaushaw. "Start Up and OperationResults from SBR Treatment of a MeatProcessing Wastewater." Proceedings of the42nd Industrial Waste Conference. PurdueUniversity, 1987.
Osag, T. R., and G. B. Crane. Control of Odorsfrom Inedibles Rendering Plants. EPA 450/1-74-006. July 1974.
"PAC-Activated Sludge Treatment Coke-Plant Wastewater." Proceedings of the 40thIndustrial Waste Conference. Purdue Uni-versity, 1985.
Pandey, R. A. "Wastewater Characteristics ofLTC Process of Coal." Journal of Environ-mental Science and Health A24, no. 6(1989): 633.
Parsons, W. A. Chemical Treatment of Sewageand Industrial Wastes. Bulletin No. 215,National Lime Association. Washington,DC: 1965.
Patrick, G. C. et al. "Development of DesignCriteria for Treatment of Metal-Contain-ing Wastewaters at Oak Ridge NationalLaboratory." Proceedings of the 42ndIndustrial Waste Conference. Purdue Uni-versity, 1988. pp. 819-830.
Patterson, J. W. Industrial Wastewater Treat-ment Technology. Boston: Butterworth-Heinemann, 1985.
Patterson, J. W. "Metals Speciation, Separa-tion, and Recovery." International Sympo-sium on Metals Speciation, Separation, andRecovery. Chelsea, MI: Lewis Publishers,1987.
Perry, R. H. Perry's Chemical Engineers'Handbook. 6th ed. New York: McGraw-Hill, 1984.
Peters, R. W., and Young Ku. "The Effect ofCitrate, a Weak Chelating Agent, on theRemoval of Heavy Metals by Sulfide Pre-cipitation." In Metals Speciation, Separa-tion, and Recovery. Chelsea, MI: LewisPublishers, 1987.
"Pilot Study of Upgrading of Existing CokeOven Waste Treatment Facility WithTrickling Filter." Proceedings of the 41st

Industrial Waste Conference. Purdue Uni-versity, 1986. pp. 586.
Porges, R. and E. J. Struzeski. "Wastes fromthe Soft Drink Bottling Industry." Journalof the Water Pollution Control Federation33(1961): 167.
Potter, N. N. Food Science. 3rd. ed. Westport,CT: AVI Publishing, 1978.
Prokop, W. H. "Plant Operations." RendererMagazine (October 1979).
Prokop, W. H. "Wet Scrubbing of HighIntensity Odors from Rendering Plants."Presented at the APCA Specialty Confer-ence: State-of-the Art of Odor ControlTechnology II. Pittsburgh, PA. March 10-11, 1977.
Pulp and Paper Manufacture, Vol. II: ControlSecondary Fiber, Structural Board, andCoating. Joint Textbook Committee of thePaper Industry, 1969.
Ramierez, E. R., and O. F. D'Alessio. "Inno-vative Design and Engineering of a Waste-water Pretreatment Facility for a MetalFinishing Operation." Proceedings of the39th Industrial Waste Conference. PurdueUniversity, 1985. pp. 545-553.
Robertson, W. M., J. C. Egide, and J. Y. C.Huang. "Recovery and Reuse of WasteNitric Acid from an Aluminum Etch Proc-ess." Proceedings of the 35th IndustrialWaste Conference. Purdue University, May1980.
Rudolfs, W. Industrial Wastes: Their Disposaland Treatment. New York: L.E.C. Publish-ers, 1961.
Russell, J. M., and R. N. Cooper. "Irrigationof Pasture with Meat-Processing PlantEffluent." Proceedings of the 42nd Indus-trial Waste Conference. Purdue University,1987. pp. 491-497.
Russell, L. L., J. N. DeBoice, and W. W. Carey."Disposal of Winery Wastewater." Pro-ceedings of the 7th National Symposium onFood Processing Wastes. EPA 600/2-76-304.December 1976.
Ryder, R. A. "Winery Wastewater Treatmentand Reclamation." Proceedings of the 28thIndustrial Waste Conference. Purdue Uni-versity, May 1973.
Sawyer, C. N., and P. L. McCarty. Chemistryfor Environmental Engineering. 3rd ed.New York: McGraw-Hill, 1978.
Sell, N. J. Industrial Pollution Control. NewYork: Van Nostrand Reinhold, 1981.
Sirrine, K. L., P. H. Russell, Jr., and J. Make-peace. Winery Wastewater Characteristicsand Treatment. EPA 600/2-77-102.
Snoeyink, V. L., and D. Jenkins. Water Chem-istry. New York: John Wiley & Sons, 1980.
Stander, G. T. "Treatment of Wine DistilleryWaste by Anaerobic Digestion." Proceed-ings of the 22nd Industrial Waste Confer-ence. Purdue University, May 1967.
Steffan, A. J., and M. Bedker. "Operations ofa Full Scale Anaerobic Contact TreatmentPlant for Meat Packing Wastes." Proceed-ings of the 16th Industrial Waste Confer-ence. Purdue University, 1971.
Steffan, A. J. In-Plant Modifications to ReducePollution and Pretreatment of Meat Pack-ing Wastewater for Discharge to MunicipalSystems. Environmental ProtectionAgency. West Lafayette, IN: 1973.
Stevenson, T. Southby's World Wine Encyclo-pedia. Boston: Little Brown, 1988.
Supermarket Business 44, No. 3 (March1989): 85.
Synthetic Rubber: The Story of an Industry.New York: International Institute of Syn-thetic Rubber Production, 1973.
"The Looming Battle for Center of the Plate."Advertising Age 60, No. 49, SlO (Novem-ber 13, 1989).
Title 40. Code of Federal Regulations. EffluentGuidelines and Standards. Part 430. Sub-part Q De-ink Subcategory. January 30,1987.
U.S. Bureau of the Census. Statistical Abstractof the United States: 1988. Washington,DC: 1987.
U.S. Bureau of the Census. Statistical Abstractof the United States: 1990 (110th AnnualEdition). January 1990.
U.S. Department of Energy. Quarterly CoalReport. October-December 1989.
U.S. Department of Health, Education, andWelfare. An Industrial Guide to the MeatIndustry. Publication No. 386. Washing-

ton, DC: U.S. Government PrintingOffice, 1954.
U.S. Environmental Protection Agency. Bio-logical Removal of Carbon and NitrogenCompounds from Coke Plant Wastes. April1973.
U.S. Environmental Protection Agency.Development Document for Effluent Limi-tations, GuidelineSy and New SourcePerformance Standards for the Red MeatProcessing Segments of the Meat ProductsPoint Source Category. Washington, DC:U.S. Government Printing Office, 1974.
U.S. Environmental Protection Agency.Development Document for Effluent Limi-tations, Guidelines, and Standards for theFoundries (Metal Molding and Casting).EPA 440/1-80/07Oa. 1980.
U.S. Environmental Protection Agency.Development Document for Effluent Limi-tations, Guidelines, and Standards for theIron and Steel Manufacturing Point SourceCategory vol. II. December 1980.
U.S. Environmental Protection Agency.Development Document for Effluent Limi-tations, Guidelines, and Standards of Per-formance for the Battery ManufacturingPoint Source Category. EPA 440/1-82/067-b. Washington, DC: U.S. GovernmentPrinting Office, 1982.
U.S. Environmental Protection Agency.Development Document for Effluent Limi-tations, Guidelines, and Standards of Per-formance, Rubber Processing Industry. EPA440/1-74-013-A. Washington, DC: U.S.Government Printing Office, 1974.
U.S. Environmental Protection Agency. Pro-ceedings 8th National Symposium on FoodProcessing Wastes. Washington, DC: U.S.Government Printing Office, August 1977.
U.S. Environmental Protection Agency.Treatability Manual. EPA 600/2-82-001b.1982.
U.S. Environmental Protection Agency.Upgrading Meat Packing Facilities toReduce Pollution. Washington, DC: U.S.Government Printing Office, 1973.
U.S. Environmental Protection Agency.Wastewater Characteristics for the SpecialtyFood Industry. Washington, DC: U.S. Gov-ernment Printing Office, 1974.
U.S. Environmental Protection Agency.Office of Water. Development Documentfor Effluent Limitations, Guidelines, andStandards for the Pulp, Paper and Paper-board Point Source Category. EPA 440/1-82/025. October 1982.
U.S. Environmental Protection Agency.Office of Water Regulation and Standards,Effluent Guidelines Division. ProposedDevelopment Document for Effluent Limi-tations, Guidelines, and Standards for theCopper Forming Point Source Category.EPA 44011-82/074-b. October 1982.
Van Nostrand, N. J. Van Nostrand's ScientificEncyclopedia. New York: John Wiley &Sons, 1983.
Varley, P. C. The Technology of Aluminum andIts Alloys. Cleveland, OH: CRC Press,1970.
Ward, R. C. "Aluminum Anodizing Wastewa-ter Treatment and Reuse." Proceedings ofthe 36th Industrial Waste Conference. Pur-due University, May 1981.
Westra, M. A., and B. L. Rose. "Oil andGrease Removal from a ConcentratedSource in the Metal Finishing Industry."Proceedings of the 44th Industrial WasteConference. Purdue University, 1989.
Whitby, G. S. Synthetic Rubber. New York:John Wiley & Sons, 1954.

Glossary & Acronyms
aerobic—an environment in which oxygen isused as the terminal electron acceptor
agglomerate—to cluster togetheranaerobic—an environment in which no
oxygen, either as free O2 or in the form ofnitrite or nitrate are available and the shiftis toward less efficient electron acceptorslike SO4
2" Fe3+, etc.anode—the positively charged electrode of
an electrolytic cell, or a negatively chargedterminal
anoxic—an environment in which there islimited free oxygen (O2) present and theshift is toward nitrite and nitrate the ter-minal electron acceptors
anion—a negatively charged ionbag house—a filtration system for air pollu-
tion control which utilizes fabric bags asthe filter media
batch-type—occurring in discreet units fromstart to finish of process, as opposed to acontinuous process
binary fission—division into two partsblow-down—removal of a portion of the
process stream to prevent the concentra-tion of a contaminant from exceeding asetpoint. For example, in a cooling towercontaminants are concentrated due toevaporation of the water being cooled.Blow-down occurs when the a variable(typically conductivity) exceeds a set-point. A sidestream is removed andreplaced with fresh make up water to con-trol the desired concentration.
cathode—the negatively charged electrode ofan electrolytic cell, or a positively chargeterminal
cation exchange capacity—the ability of asoil to exchange cations on the soil parti-
cle for cations that may be introduced viapercolation of a waste stream.
caustic—a substance of pH greater than 7,also referred to as alkaline or basic
chelating agent—a chemical used to seques-ter or hold metal ions in solution over abroad range of process conditions, includ-ing pH and ORP.
clarification—removal of impurities by wayof gravity settling
colloid—a particle that does not settle to apractical extent (for waste treatmentpuposes) in a medium under the influenceof gravity
condenser—equipment designed to liquefygases via cooling
corona—ionized gas molecules created byhigh energy electrons in a strong electricalfield.
denitrification—the biological conversion ofnitrate to nitrogen gas (requires an anoxicenvironment)
diatomaceous earth—skeletal remains ofdiatoms (small invertebrates) used inwaste treatment as filtration media
divalent—an ion with a charge (negative orpositive) of two
drag-out—the liquid that is carried out of aplating batch by the pieces being plated
entropy—the measure of the disorder orrandomness in a system
evapotranspiration—water loss via evapora-tion and through plant leaves
exothermic—a reaction that gives off heatF/M ratio—food to microorganism ratiofacultative—able to function in aerobic,
anoxic and anaerobic environmentsfloe—an agglomeration of small particles to
form a larger one

flocculation—the process of gently agitatingparticles causing them to collide with oneanother and join together to form largerparticles
freeboard—the distance between theintended water level and the top of a tank
flux—1) a mineral added to the charge of afurnace to drive out oxygen and preventthe formation of oxides. 2) A rate of flowof a substance expressed as mass or vol-ume per unit time
mesophilic—an environment with a temper-ature range of 20° to 45°C that favors bac-teria with optimal growth in this range(mesophiles)
monomer—a single unit in a polymer chainof similar chemical units
monovalent—an ion with a charge (negativeor positive) of one
nitrification—the biological conversion ofammonia to nitrate (requires an aerobicenvironment)
osmotic pressure—pressure created by a dif-ference in concentration of a solute oneither side of a semi-permeable mem-brane
polymerization—a chemical process wheretwo or more monomers join to form apolymer
psychrophilic—an environment with a tem-perature less than 200C that favors bacte-ria with optimal growth in this range(psychrophiles)
putrescible—capable of biological decompo-sition under anoxic or anaerobic condi-tions
reverse osmosis—the application of pres-sure to a semi-permeable membrane tocreate a concentrated solution on one sideof the membrane and a clean, or less con-centrated solution on the other.
sequencing batch reactor—a single tankreactor for treating wastewater using aseries of timed steps
stoichiometric—the molar ratio of productsand reactants in a chemical reaction
surface loading—the rate of flow per unitarea of surface
thermophilic—an environment with a tem-perature range of 45° to 900C that favorsbacteria with optimal growth in this range(thermophiles)
trivalent—an ion with a charge (negative orpositive) of three
Acronyms
AA
AAFEB
ABC
AFFI
APC
APMP
A/S
ASCE
ASTs
ASTM
BATF
BET
BMPs
BOD
CAA
CBOD
CERCLA
CER.
CMR
COD
CSOs
CWA
DAF
atomic adsorption
anaerobic fixed-film expandedbed
activity-based costing
American Frozen Food Institute
air pollution control
Air Pollution Management Plan
air to solids ratio
American Society of Civil Engi-neers
above-ground storage tanks
American Society for TestingMaterials
Bureau of Alcohol, Tobacco andFirearms
Brunauer-Emmett-Teller equa-tion
best management practices
biochemical oxygen demand
Clean Air Act
carbonaceous BOD
Comprehensive EnvironmentalResponse, Compensation, andLiability Act
Code of Federal Regulations
completely mixed mode
chemical oxygen demand
combined sewer overflows
Clean Water Act
dissolved air flotation
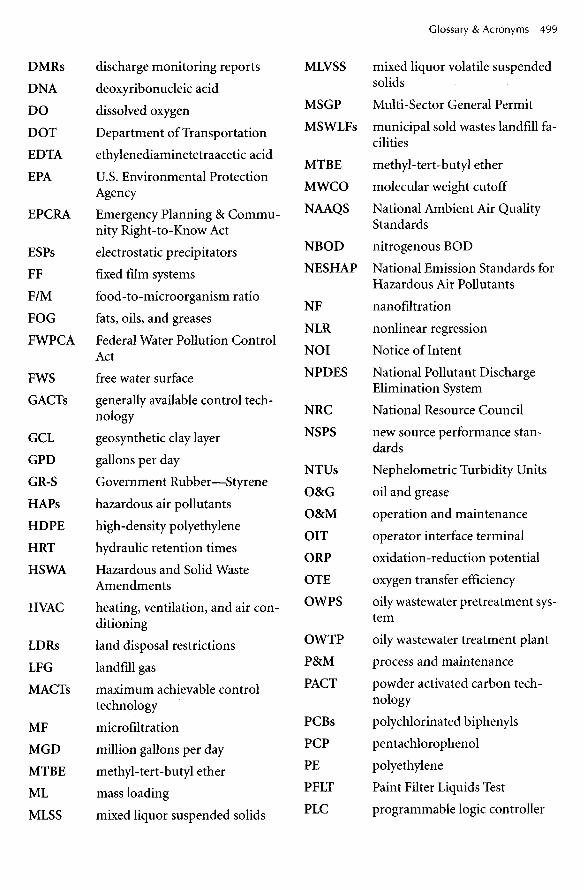
DMRs
DNA
DO
DOT
EDTA
EPA
EPCRA
ESPs
FF
F/M
FOG
FWPCA
FWS
GACTs
GCL
GPD
GR-S
HAPs
HDPE
HRT
HSWA
HVAC
LDRs
LFG
MACTs
MF
MGD
MTBE
ML
MLSS
discharge monitoring reports
deoxyribonucleic acid
dissolved oxygen
Department of Transportation
ethylenediaminetetraacetic acid
U.S. Environmental ProtectionAgency
Emergency Planning & Commu-nity Right-to-Know Act
electrostatic precipitators
fixed film systems
food-to-microorganism ratio
fats, oils, and greases
Federal Water Pollution ControlAct
free water surface
generally available control tech-nology
geosynthetic clay layer
gallons per day
Government Rubber—Styrene
hazardous air pollutants
high-density polyethylene
hydraulic retention times
Hazardous and Solid WasteAmendments
heating, ventilation, and air con-ditioning
land disposal restrictions
landfill gas
maximum achievable controltechnology
microfiltration
million gallons per day
methyl-tert-butyl ether
mass loading
mixed liquor suspended solids
MLVSS
MSGP
MSWLFs
MTBE
MWCO
NAAQS
NBOD
NESHAP
NF
NLR
NOI
NPDES
NRC
NSPS
NTUs
O&G
O&M
OIT
ORP
OTE
OWPS
OWTP
P&M
PACT
PCBs
PCP
PE
PFLT
PLC
mixed liquor volatile suspendedsolids
Multi-Sector General Permit
municipal sold wastes landfill fa-cilities
methyl-tert-butyl ether
molecular weight cutoff
National Ambient Air QualityStandards
nitrogenous BOD
National Emission Standards forHazardous Air Pollutants
nanofiltration
nonlinear regression
Notice of Intent
National Pollutant DischargeElimination System
National Resource Council
new source performance stan-dards
Nephelometric Turbidity Units
oil and grease
operation and maintenance
operator interface terminal
oxidation-reduction potential
oxygen transfer efficiency
oily wastewater pretreatment sys-tem
oily wastewater treatment plant
process and maintenance
powder activated carbon tech-nology
polychlorinated biphenyls
pentachlorophenol
polyethylene
Paint Filter Liquids Test
programmable logic controller

POTW
ppb
ppm
PQL
PRP
RBC
RCRA
RDF
RMF
RNA
RO
RPP
SARA
SBR
SBR
SDWA
SFS
SIC
publicly owned treatment works
parts per billion
parts per million
Practical Quantitation Limit
potentially responsible party
rotating biological reactor
Resource Conservation and Re-covery Act
refuse-derived duel
Runoff Management Facility
ribonucleic acid
reverse osmosis
rinsewater pretreatment plant
Superfund Amendments and Re-authorization Act
sequence batch reactor
Styrene Butadiene Rubber
Safe Drinking Water Act
subsurface flow system
Standard Industry Classification
SIP
SOTR
SP3
s/sTCE
TCLP
TDS
tpy
TRS
TSD
TSS
TVSS
UASB
UF
UV
VOCs
WTE
state implementation plan
standard oxygen transfer rate
Stormwater Pollution PreventionPlan
solidification and stabilization
trichloroethylene
Toxic Characteristics LeachingProcedure
total dissolved solids
tons per year
total reduced sulfer
treatment storage and disposal
total suspended solids
total volatile suspended solids
upflow anaerobic sludge blanket
ultrafiltration
ultraviolet light
volatile organic compounds
waste-to-energy

501 This page has been reformatted by Knovel to provide easier navigation.
Index
Index terms Links
A Absorption
defined 350 design parameters 352 elements 351 packed tower 350 351
Acid hydrolysis 176
Acidity 102
Acid rain control 62
Activated aluminum 349
Activated carbon 311 318 346
Activated sludge 195 aeration systems 217 aeration tanks 1 best settling 197 common problems 199 complete mix 204 components 195 contact stabilization modifications 207 conventional plug flow 201 deep shaft aeration 213 de-inking 440 design and operational statistics 216 extended aeration 207 high-rate modification 207 illustrated 196 membrane bioreactor (MBR) modification 214

502 Index terms Links
This page has been reformatted by Knovel to provide easier navigation.
Activated sludge (Continued) microorganisms in 197 optimum culture, maintaining 197 PACT modification 205 Pasveer oxidation ditch 211 process variations 201 selectors 199 sequencing batch reactor (SBR) modification 208 types of 195
Activity-based costing (ABC) 73
Adsorption 311 adsorbent 311 defined 311 effectiveness evaluation 317 equilibria 312 in gaseous pollutant treatment 347 mechanism 311 See also Industrial wastewater treatment
Aerated lagoons 230 de-inking 440 in red meat waste treatment 479 See also Lagoons
Aeration systems 217 aeration panel 218 alternative types of devices 218 coarse bubble diffuser 218 diffuser 217 dome diffuser 218 fine-bubble membrane diffuser 218 fixed submerged aerator 223 flexible membrane diffuser 218 mechanical 217 pontoon-mounted aspirating aerator 222 SBR 223 submerged static aerator 219 submerged turbine aerator 220

503 Index terms Links
This page has been reformatted by Knovel to provide easier navigation.
Aeration systems (Continued) See also Activated sludge
Aerobic wastewater treatment 194 195 activated sludge 195 methods 194
Air discharges 335
Air emissions treatment 335 ambient air sampling 339 bench-scale investigations 25 candidate technologies selection 25 cement manufacturing plant 20 challenges 18 characterization of discharges 338 characterization study 24 containment 337 economic comparisons 27 electrostatic precipitators 341 evaluation process 18 fabric filters 342 gaseous pollutants 346 gravity separators 339 inertial separators 340 kiln dust collection/handling 23 manufacture flow sheet 22 manufacturing process analysis 19 objectives 345 for particulates control 339 pilot-scale investigations 25 preliminary design 26 sample analysis 339 sample collection 338 stack sampling 338 treatment objectives 25 wastes minimization 24 336 wet scrubbers 344

504 Index terms Links
This page has been reformatted by Knovel to provide easier navigation.
Air pollution 117 ambient air sampling 115 carbon dioxide (CO2) 118 carbon monoxide (CO) 118 characterization categories 111 coke production 452 control 336 454 copper forming 425 cycle 19 electroplating 418 emission, uncontrolled 52 flows/loads 24 gaseous 346 hydrocarbons 119 hydrogen sulfide (H2S) 118 lead acid batteries 490 malodorous substances 118 methane 119 oxides of nitrogen (NOX) 117 oxides of sulfur (SOX) 117 ozone 117 particulates 118 prepared frozen foods 427 red meat production/processing 476 477 removal 1 rendering by-products 482 483 stack sampling 111 synthetic rubber 464 trash incinerator 49 VOCs 118
Air pollution control laws 58 335 2005 60 CAA 58 59
60 62 federal involvement 58 general 58

505 Index terms Links
This page has been reformatted by Knovel to provide easier navigation.
Air pollution control laws (Continued) Title I 61 Title III 61 Title IV 62 Title V 62 Title VI 64 Title VII 64
Air toxics control 61 sampling methods 119
Alkaline chlorination of cyanide 178
Alkaline cleaning 424
Alkalinity 102
Aluminum die casting 441
Ambient air sampling 115 339
American Frozen Food Institute (AFFI) 426 432
American Society of Testing Materials 410
Ammonia, removal 168
Anaerobic contact reactor 252
Anaerobic lagoons 256
Anaerobic wastewater treatment 245 at cold temperatures 245 cost-saving characteristics 246 defined 245 fixed-film systems 254 metabolism mechanisms 247 methods 194 suspended growth systems 251 suspended microbiological cultures 245 technology development 247 248 variations 251 See also Industrial wastewater treatment
Annealing 423
Annualized costs, industrial wastewater treatment 16 17

506 Index terms Links
This page has been reformatted by Knovel to provide easier navigation.
Anodizing/alodizing 447 cleaning 449 coloring 449 deoxidizing/etching 449 overview 447 rinsing 449 wastes minimization 449 waste treatment/disposal 451
Asphalt 373
Attached growth systems 234 defined 234 fluidized bed 242 hybrid systems 243 moving bed bioreactor system (MBBR) 243 rotating biological contactors (RBCs) 240 roughing filters 239 trickling filters 234
Automatic wastewater sampling device 86
B Bar racks 258
Basket-type centrifuges 301 303
Beef processing. See Red meat processing
Bench-scale investigations air emissions 25 industrial wastewater 5
Best Available Control Technology (BACT) 59
Bidding industrial wastewater 17 process illustration 18
Binding agents asphalt 373 epoxies 373 gypsum 375 inorganic 374

507 Index terms Links
This page has been reformatted by Knovel to provide easier navigation.
Binding agents (Continued) lime 375 organic 372 polyesters 373 polyolefins 373 Portland cement 374 pozzolan substances 374 silicates 375 urea-formaldehyde 373
Biochemical oxygen demand (BOD) 3 9 carbonaceous (CBOD) 233 234 five-day (BOD5) 233 234
478 lagoon design and 233 poultry processing wastewater 47 priority pollutants 98 stormwater 136
Biofiltration 354 design 355 filter media 356 general 354 industry use 356 maintenance 356 operation 356 residence time 355 356 sphagnum peat 356 system illustration 355
Biologically degradable substances 175
Biological wastewater treatment 185 CO2 186 design equations 187 H2O 186 kinetics development 189 methods 185 microorganisms 186 nutrients 186

508 Index terms Links
This page has been reformatted by Knovel to provide easier navigation.
Biological wastewater treatment (Continued) organic matter 185 oxygen 196 oxygen role 191 technologies 193 See also Industrial wastewater treatment
Bleaching 436
Body feed 275 added to mixing tank 275 added to precoat filter 275 filter depth and 276 See also Pressure/vacuum filtration
Boron 34
Brunauer-Emmett-Teller (BET) equation 314 315
Bulking sludge 199
Bureau of Alcohol, Tobacco, and Firearms (BATF) 459
C Capital costs
expanded bed anaerobic reactors 13 fluidized bed anaerobic reactors 13 industrial wastewater treatment 10 rotating biological contactors 12 sequencing batch reactors 11
Carbamates 165
Carbon 34 35 sp3 orbitals 36 two-dimensional representation 36
Carbon dioxide (CO2) 118
Carbon monoxide (CO) 118 385
Car bottom 397
Case studies 409 anodizing/alodizing 447 coke production/processing 451 copper forming 422

509 Index terms Links
This page has been reformatted by Knovel to provide easier navigation.
Case studies (Continued) de-inking 434 die casting 441 electroplating, tin 413 general 409 lead acid batteries 486 prepared frozen foods 426 red meat processing 472 rendering by-products 479 soft drink bottling 468 synthetic rubber 459 wine making 455
Catalytic oxidation 184
Catalytic oxidizers 353
Cement manufacturing plant block diagram 20 kiln dust collection/handling 23 manufacture flow sheet 22 See also Air emissions treatment
Centrifugal force 113
Centrifugation 300
Centrifuges 300 basket-type 301 303 defined 300 disc-nozzle-type 303 disk-stack 301 solid-bowl 301
Chelating agents 45 inorganic 177 organic 176 reaction to destroy/deactivate 176
Chemical descaling 410
Chemical oxygen demand (COD) 3 101
Chemical wastewater treatment 160 commonly used substances 165

510 Index terms Links
This page has been reformatted by Knovel to provide easier navigation.
Chemical wastewater treatment (Continued) coprecipitation 177 oxidation/reduction to produce nonobjectionable substance 178 properties 160 reactions to destroy/deactivate chelating agent 176 reactions to produce biologically degradable substance 175 reactions to produce insoluble gas 167 reactions to produce insoluble solid 160 reduction to produce coagulation of colloidal suspension 168 technologies 161 treatment system development procedure 166 See also Industrial wastewater treatment
Chlorides 110
Chlorination breakpoint, insoluble gas 168 of cyanide 178 of hydrogen sulfide 183
Chlorine 110
Clarifier-thickener 284 design 290 design criteria development 284 requirements 290 thickener portion 285
Clean Air Act (CAA) 58 59 60 62 335
Cleaning and washing 78
Clean Water Act (CWA) 53 90 heavy metals regulated by 105 requirements for chemical/physical, and bacterial analyses 90
Coagulants 175
Coagulation, of colloidal waste systems 173
Coke production/processing 451 airborne wastes 452 air pollution control 454 illustrated 453

511 Index terms Links
This page has been reformatted by Knovel to provide easier navigation.
Coke production/processing (Continued) process 451 solid wastes 452 wastes minimization 454 wastewater treatment 454 waterborne wastes 452 See also Case studies
Cold rolling 423
Collection system design 133
Colloidal suspensions 44 coagulation of 168 contents 168 illustrated 169 of soap micelles 170
Colloids lyophilic 174 lyophobic 173 types of 174
Color, priority pollutants 103
CoMag process 328 329
Combined sewer overflows (CSOs) 54
Complete mix activated sludge system 204
Compliance assurance monitoring (CAM) 63
Composting 398 with bulking agent 400 with forced aeration 403 grinding before 400 industrial wastes 398 mechanical technology 402 microorganisms 399 moisture content 400 nutrients 403 odors 404 oxygen 400 process illustration 399

512 Index terms Links
This page has been reformatted by Knovel to provide easier navigation.
Composting (Continued) reodorization 405 solid waste suitability 371 static pile technology 402 windrow technology 401
Comprehensive Environmental Response, Compensation, and Liability Act (CERCLA) 56
Condensation 352 353 for air pollution control 352 353 in a trap 112
Constituent equalization 156
Contact stabilization modification 207 advantage 208 defined 207 schematic 208 See also Activated sludge
Containment, air pollution 337
Conventional plug flow 201 defined 201 flow pattern 202 flow-through tank 203 See also Activated sludge
Copper forming 422 airborne waste 425 alkaline cleaning 424 annealing 423 cleaning rinse/baths 424 cold rolling 423 extension 423 forging 423 fume scrubbers 424 hot rolling 423 oil and grease 425 pickling 424 process 423 process flow diagram 423

513 Index terms Links
This page has been reformatted by Knovel to provide easier navigation.
Copper forming (Continued) quenches 424 rolling/drawing process 424 solid waste 425 solution heat treatment 424 suspended solids 426 toxic organics/metals 426 wastes generation 425 waterborne waste 425 See also Case studies
Coprecipitation 177
Corrosive wastes 120
Cost accounting system (pollution prevention) 72
Cyanide, alkaline chlorination of 178
D Deep bed granular filters 268
Deep shaft aeration 213 defined 213 illustrated 214 See also Activated sludge
Degreasing 410
De-inking 434 bleaching 436 dispersion 436 federal regulation 435 flotation 436 forward cleaning 436 overview 434 prewashing 436 process 435 process flow diagrams 438 439 pulping 436 screening 436 through-flow cleaning 436 toxic pollutants 437

514 Index terms Links
This page has been reformatted by Knovel to provide easier navigation.
De-inking (Continued) washing 436 wastes minimization 437 wastewater treatment 440 water recirculation/makeup 437 See also Case studies
Descaling, chemical 410
Desmutting 416
Die casting 441 aluminum 441 destruction of phenolics 447 dissolved inorganics 447 dissolved organics 447 finishing 446 heating furnace 443 magnesium 443 445 oil/grease 447 quench 446 schematics 442 444
445 scrubbers 443 solids 446 waste streams/management 443 zinc 443 444 See also Case studies
Discharges, air 111 air pollutants 117 sample analysis 115 stack sampling 111
Disc-nozzle-type centrifuges 303
Discrete settling 280
Disk-stack centrifuges 301
Disposal 81
Dissolved air floatation (DAF) 304 air-to-solids ratio 310 cycle ratio 310

515 Index terms Links
This page has been reformatted by Knovel to provide easier navigation.
Dissolved air floatation (DAF) (Continued) defined 304 dissolution of air in water 307 equipment 308 illustrated 309 poultry processing use 47 369 pressurization 310 quantity of air calculation 310 See also Flotation
Dissolved Oxygen (D.O.) 103
Downflow granular filters 270 auxiliary scouring 272 defined 270 filtration rate 271 head loss 271 operation 270 performance 272 removal mechanism 271 See also Granular filters
Dry impingement 113
Dry tomb approach 386
E Economic comparisons (air emissions) 27
Economic comparisons (industrial wastewater) 9 annualized costs 16 17 capital costs 10 O&M costs 10
Electrical stability 32
Electrodialysis 267
Electrons configuration 30 orbitals 30 31
32 shells 32

516 Index terms Links
This page has been reformatted by Knovel to provide easier navigation.
Electroplating, tin 413 airborne wastes 418 plating baths 416 417 preplating 414 production process 414 rinse 416 solid wastes 418 spent cleaning/conditioning solutions 419 spent plating solutions 419 spent rinse water 419 wastes minimization 420 wastewater treatment 421 waterborne wastes 419 See also Case studies
Electrostatic impingement 113
Electrostatic precipitators 341 flat-plate 341 plate-wire 341 tubular 342 two-stage 342 wet 342
Elements electrical stability 32 packed tower system 350 rotary kiln incineration 391 392 thermodynamic stability 32 See also specific elements
Emulsifying agents 41
Emulsion crumb production 460
Emulsions 41 contents 169 defined 41 forming, emulsifying agent 41 forming, vigorous mixing 43 hexane 41

517 Index terms Links
This page has been reformatted by Knovel to provide easier navigation.
Encapsulation 377
Environmental Audit 90
Environmental Protection Agency (EPA) 5 56 119
Environmental sustainability 69
Epoxies 373
Eutrophication 106
Expanded bed reactor 10 13 16 254
Extended aeration activated sludge 207
F Fabric filters 342
Fats, oils, and greases (FOG) 9 47
Federal Water Pollution Control Act (FWPCA) 52
Film diffusion 322
Filtration 113
Fixed-film systems 254 anaerobic lagoons 256 expanded bed reactor 254 fluidized bed reactor 254 packed bed reactor 256 See also Anaerobic wastewater treatment
Flat-plate precipitator 341
Flocculent settling 281 282
Flotation 302 dissolved air 304 gravity 302 See also Industrial wastewater treatment
Flow equalization 154 configuration 153 cumulative flow for equalization tank 156 on-line 153
Flow-through tank 203

518 Index terms Links
This page has been reformatted by Knovel to provide easier navigation.
Fluidized bed 242 anaerobic reactors 10 13
15 defined 242 design 243 reactors 254 slime layer 242 See also Attached growth systems
Fluidized bed incineration 387 advantages/disadvantages 389 combustor system 388 See also Solid waste incineration
Forge Shop Area Stormwater Project 137 defined 137 grit chamber 143 hydraulic overflow 146 mass balance 143 oil skimming 144 operations strategy 146 pH adjustment 144 PLC control and operator interface 143 preliminary engineering studies 137 process flow diagram 145 recycle water disinfection 146 recycle water storage/distribution 146 rinsewater pretreatment/wastewater treatment 138 Runoff Management Facility, initial design 139 Runoff Management Facility, revised design 140 Runoff Management Facility site layout 144 sand filtration 146 sedimentation basin 143 spill containment 146 stormwater collection/retention 143 treatment/recycle storage 143 treatment residuals 146 water balance 140

519 Index terms Links
This page has been reformatted by Knovel to provide easier navigation.
Forge Shop Area Stormwater Project (Continued) See also Stormwater treatment
Forging 423
Free radicals 180 defined 180 generation 180 hydroxyl 181
Freundlich’s model 314
G Gaseous pollutant treatment 346
absorption 350 activated aluminum 349 activated carbon 346 adsorption 347 biofiltration 354 condensation 352 incineration 352 molecular sieves 350 resins 348 silica gel 349
Gas venting 382 collection and 383 guidelines/regulations 383 illustrated 383 See also Landfills
Granular filters 268 deep bed 268 downflow 270 illustrated 272 273
274 upflow 269 See also Industrial wastewater treatment
Gravity flotation 302 harvesting equipment 304 305
306

520 Index terms Links
This page has been reformatted by Knovel to provide easier navigation.
Gravity flotation (Continued) skimmers 304 use of 302 See also Flotation
Gravity separators 339
Grinding wastes 400
Groundwater pollution control 55
Gypsum 375
H Hardness, testing for 110
Hazardous air pollutants (HAPs) 60
Hazardous and Solid Waste Amendments (HSWA) 55 56
Hazardous substances leaving facility, identifying 87 purchased, identifying 87 sources, determining 88
Hazardous wastes 119 365 corrosive 120 cradle to grave manifesting 122 defined 97 120 delisting 122 exemptions 121 ignitable 120 reactive 120 toxic 121 uniform manifest 123 See also Wastes
Hearth incinerators 393 advantages/disadvantages 394 defined 393 illustrated 394 types 393 See also Solid waste incineration
Helium 34

521 Index terms Links
This page has been reformatted by Knovel to provide easier navigation.
Hexane 41
High-density polyethylene (HDPE) 377 379
Hot rolling 423
Hydrocarbons 119
Hydrogen 33 37 44
bonding 38 ion 158
Hydrogen peroxide oxidation with 181 ozone plus 183
Hydrogen sulfide (H2S) 118
Hydrology 132
Hydrolysis 176
Hydroxyl free radicals 181
I Ignitable waste 120
Impaction 113
Incineration 352 catalytic oxidizers 353 combustion 352 solid waste 386 solid waste suitability 370 thermal oxidizers 353 354 See also Air emissions treatment
Incinerators classification 386 hearth 393 stack emission controls 364
Industrial stormwater management 127 concepts 131 federal program 127 general 127 groundwater contamination prevention 131

522 Index terms Links
This page has been reformatted by Knovel to provide easier navigation.
Industrial stormwater management (Continued) permit types 129 state permitting programs 128 treatment system design 147
Industrial waste treatment evaluation process (air emissions) 18 evaluation process (industrial waste water) 2 evaluation process (solid wastes) 27 in pollution prevention 81 processes 1 red meat production/processing 477 rendering by-products 483 substance dissolution/suspension and 39 system development approach 2 system illustration 152 wine making 457
Industrial wastewater as aqueous discard 38 characteristics 97 colloidal suspensions 44 defined 45 dissolved iron 48 emulsions 41 metal galvanizing 48 parts cleaning process 48 poultry processing 46 solids in 108 solutions 40
Industrial wastewater treatment adsorption 311 aerobic methods 194 195 anaerobic methods 194 245 annualized costs 16 17 attached growth systems 234 bench-scale investigations 5 bid solicitation 17

523 Index terms Links
This page has been reformatted by Knovel to provide easier navigation.
Industrial wastewater treatment (Continued) biological methods 185 candidate technologies 5 151 capital costs 10 centrifugation 300 chemical methods 160 coke production 454 de-inking 440 discrete settling 280 economic comparisons 9 electroplating 421 evaluation process 2 final design 16 flocculent settling 281 flotation 302 general 149 granular filtration 268 ion exchange 318 land application 328 lead acid batteries 491 magnetically enhanced solids separation 328 329 manufacturing process analysis 2 methods 149 nonprinciple mechanisms 150 objectives 4 O&M costs 10 pH control 157 physical barriers 257 pilot-scale investigations 5 plain sedimentation 279 plate, lamella, tube settlers 298 preliminary design preparation 9 pressure/vacuum filtration 274 principle mechanisms 150 scrubbing 326 slow sand filter 279

524 Index terms Links
This page has been reformatted by Knovel to provide easier navigation.
Industrial wastewater treatment (Continued) sludge thickening 281 soft drink bottling 472 spray irrigation 330 stripping 325 synthetic rubber 467 system development approach 2 waste equalization 153 wastes characterization study 3 wastes minimization 3 wastewater application rate 330 wetlands 330
Inertial separators 340
Inorganic binding agents 374
Inorganic chelating agents 177
Insoluble gas breakpoint chlorination 168 chemical substance application 168 reactions to produce 167
Insoluble solids carbamates and 165 reaction to produce 160 sludge 165 treatment approach suggestions 167 treatment disadvantages 165
International Standard for Environmental Management Systems 72
Ion exchange 318 advantages 325 application of 322 batch mode 322 continuous flow mode 322 defined 318 design criteria 325 film diffusion 322 ion selectivity 322 kinetics 321

525 Index terms Links
This page has been reformatted by Knovel to provide easier navigation.
Ion exchange (Continued) maximum removal 323 mechanisms 320 organic substance removal 325 practical limitations 324 resin manufacturing process 319 schematic diagram 320 321 treatment train 324 See also Industrial wastewater treatment
Iron 111
J Jar test apparatus 164
L Lagoons
aerated 230 440 479
alternative approaches 232 anaerobic 256 BOD test considerations 233 low-energy complete mix approach 233 nonaerated facultative 231 system design 232
Lamella settlers 298
Land application 328
Land disposal restrictions (LDRs) 57 58
Landfills 377 alternative 386 conventional 377 daily/intermediate cover 380 discharges from 384 evaporation vessel 385 final cover/cap 381 gas (LFG) 384 385 gas venting 382

526 Index terms Links
This page has been reformatted by Knovel to provide easier navigation.
Landfills (Continued) liner system 378 stormwater management 384 suitability 370
Langmuir’s model 312
Laws/regulations air pollution control 58 groundwater pollution 55 permitting/reporting history 51 water pollution control 53
Leachate 384
Lead acid batteries 486 airborne wastes 490 assembly 487 curing 487 electrolyte preparation/addition 489 formation 489 grid manufacturing 487 leady oxide production 487 manufacture 486 overview 486 paste preparation/pasting 487 production process illustration 488 solid wastes 490 stacking/welding 487 testing/repair 489 washdown 489 wastes generation 489 wastes minimization 491 wastewater treatment 491 waterborne wastes 490 See also Case studies
Lime 375
Liner system, landfill 378
Lithium 34
Lowest Achievable Emission Rate (LAER) 59

527 Index terms Links
This page has been reformatted by Knovel to provide easier navigation.
Lyophilic colloids 174
Lyophilic sols 170 electrokinetics 172 stability 171
Lyophobic colloids 173
Lyophobic sols 169 electrokinetics of 171 phenomena 170
M Magnesium die casting 443 445
Magnetically enhanced solids separation 328 329
Malodorous substances 118
Manganese 111
Manufacturing air emissions and 19 cement 19 industrial wastewater and 3 lead acid battery 486 resin 319
Material substitution 77
Maximum Achievable Control Technology (MACT) 61 117
Mechanical composting technology 402
Membrane bioreactor (MBR) modification 214 benefits 216 defined 214 flat-plate system 215 horizontal tube system 215 limitations 216 vertical tube system 215 See also Activated sludge
Membrane separation 264 configurations 265 electrodialysis 267 membrane materials 264

528 Index terms Links
This page has been reformatted by Knovel to provide easier navigation.
Membrane separation (Continued) problems 266 processes 264 removal mechanisms 266 reverse osmosis 266 See also Physical barriers
Metal galvanizing wastewater 48
Metals in copper forming 426 priority pollutants 100 103 regulated by CWA 105 removing from wastewater 150
Methane 119 384
Microorganisms 186 in activated sludge 197 in composting 399
Microscreening 262
Mixed, heated anaerobic digester 252
Mixed liquor suspended solids (MLSS) 193 196
MLVSS 193 196 concentration 199 solids 196
Modular incineration systems 394
Molecular sieves 350
Moving bed bioreactor system (MBBR) 243
Municipal solid wastes landfill facilities (MSWLF) 122 124
N National Ambient Air Quality Standards (NAAQS) 59 60
attainment/maintenance 61 defined 59
National Emission Standards for Hazardous Air Pollutants (NESHAPs) 59 60 63

529 Index terms Links
This page has been reformatted by Knovel to provide easier navigation.
National Pollutant Discharge Elimination System (NPDES) 5 53 54 128
dedicated permitting authority 129 expanded bed anaerobic reactor 16 Individual Permit 129 Stormwater Multi-Sector General Permit 129
New Source Performance Standards (NSPS) 63
Nitrogen, compounds containing 106
Nonaerated facultative lagoons 231
Nonsteady-state method 226
O Odors
composting 404 RBC 241
Off-gas method 226
Oil/grease copper forming 425 die casting 447 quantity, estimating 109 sampling 86
O&M costs fluidized bed anaerobic reactor 15 industrial wastewater treatment 10 rotating biological contactors 15 sequencing batch reactors 14
Organic binding agents 372
Organic chelating agents 176
Oxidation basins 440 catalytic 184 chemical, examples 179 destruction of organics by free radicals 180 of ferric ions 180 with hydrogen peroxide 181

530 Index terms Links
This page has been reformatted by Knovel to provide easier navigation.
Oxidation (Continued) with ozone 182 ponds 231 thermal 184
Oxides of nitrogen (NOX) 117
Oxides of sulfur (SOX) 117
Oxygen 35 37 44
in biofiltration system 355 as biological wastewater treatment method 186 191 in cell metabolism 192 in composting 400 diffusion 224 dissolved 103
Oxygen transfer 224 basics 224 KLa value determination 225 mass, illustration 223 nonsteady-state method 226 off-gas method 226 rate-limiting step 224 rate (OTR) 229 shop tests 230 standard rate (SOTR) 228 229
Ozone 117 oxidation with 182 plus hydrogen peroxide 183 plus ultraviolet light 183
P Packaged water treatment systems 277
Packed bed reactor 256
Packed tower system 350 defined 350 elements 350 illustrated 351

531 Index terms Links
This page has been reformatted by Knovel to provide easier navigation.
Packed tower system (Continued) operation 351
PACT modification 205 defined 205 illustrated 206 predictive mathematical model 207 See also Activated sludge
Paint Filter Liquids Test (PFLT) 371
Particulates 118
Particulate sampling train 114
Partition-gravimetric method 109
Partition-infrared method 109
Parts cleaning wastewater 48
Pasveer oxidation ditch 211 defined 211 illustrated 212 See also Activated sludge
Periodic table 104
Pesticides/PCBs 100
pH 102 adjustments 167 control 157 control system illustration 159 ranges, summary 162 values, common methods and 162
Phosphorus, compounds containing 106
Physical barriers 257 bar racks 258 membrane separation 264 microscreening 262 plate and frame filters 263 rotating cylindrical screens 260 tangential screens 260 vibrating screens 259 See also Industrial wastewater treatment

532 Index terms Links
This page has been reformatted by Knovel to provide easier navigation.
Pickling 415 424
Pilot-scale investigations air emissions 25 industrial wastewater 5 results 9
Pilot-scale treatment systems operation 6 operation period 9 photograph 8
Plain sedimentation 279
Plate and frame filters 263
Plate settlers 298
Plate-wire precipitator 341
Plating baths 416 417
Plating solutions, spent 419
Pollution prevention 67 assessment 74 baseline, establishing 72 benefits 67 69 companywide philosophy 73 continual improvement/education 74 cost accounting system 72 cost considerations 68 defined 67 dispose 81 economics, evaluating 89 environmental policy 73 environmental sustainability and 69 general approach 70 management support 70 national policy 67 objectives/targets 71 positive impact 68 potential implementation strategies 76 progress measurement 72

533 Index terms Links
This page has been reformatted by Knovel to provide easier navigation.
Pollution prevention (Continued) recycle 80 reduce 77 regulatory drivers 69 reuse 78 source reduction 68 strategy 76 treat 81
Pollution Prevention Act 67
Polyesters 373
Polyolefins 373
Pork processing. See Red meat processing
Portland cement 374
Poultry processing wastewater 46 BOD 47 DAF 47 FOG 47 raw processing schematic 47 system schematic 46 See also Industrial wastewater
Pozzolan substances 374
Precipitation 132
Prepared frozen foods 426 airborne wastes 427 breaded frozen products 431 Chinese/Mexican foods 430 frozen bakery products 429 Italian specialties 429 overview 426 prepared dinners 427 solid wastes 427 wastes minimization 432 waste treatment 433 waterborne wastes 427 See also Case studies

534 Index terms Links
This page has been reformatted by Knovel to provide easier navigation.
Preplating 414 acid dip 416 clean 415 desmutting 416 pickling 415 preclean 414 See also Electroplating, tin
Pressure/vacuum filtration 274 body feed 275 illustrated 276 277 packaged water treatment systems 277 precoat 274 swimming pool filters 277 See also Industrial wastewater treatment
Prevention of Significant Deterioration (PSD) requirements 59
Priority pollutants 97 alkalinity/acidity 102 BOD 97 COD 101 color 103 compounds containing nitrogen 106 defined 97 D.O. 103 metals 100 103 oil/grease 109 pesticides/PCBs 100 pH 102 semivolatile 98 settleable solids 107 suspended solids 107 total solids 107 total volatile suspended solids (TVSS) 107 turbidity 105 ultimate BOD 102 volatile 98
535 Index terms Links
This page has been reformatted by Knovel to provide easier navigation.
Publicly Owned Treatment Works (POTW) 5 9 29 54
Pulping 436
Pyrolysis 395
R Reactive wastes 120
Recirculation 236
Recycle 80
Red meat processing 472 airborne wastes 476 477 beef 473 overview 472 pork 475 production processes 475 solid wastes 476 477 treatment/disposal 477 wastes generation 475 wastes minimization 477 waterborne wastes 476 See also Case studies
Reduce 77
Rendering by-products 479 airborne wastes 482 483 plant schematic 480 process 479 solid wastes 481 483 system schematic 481 wastes generation 481 wastes minimization 482 waterborne wastes 482 484 See also Case studies
Reodorization 405
Representative models 6
Resins 319 348

536 Index terms Links
This page has been reformatted by Knovel to provide easier navigation.
Resource Conservation and Recovery Act (RCRA) 27 55 90
defined 119 hazardous wastes 365 hazardous wastes definition 120 program implementation 56 requirements for chemical, physical, and bacterial analyses 90 solid wastes 365 waste generator requirement 97
Reuse 78
Reverse osmosis 266
Rinsing 412 alternative arrangements 418 anodizing/alodizing 449 electroplating 416 processes 412 sequence for electroplating process 413
Roller hearth gasification system 397
Rotary hearth reactor 397 398
Rotary kiln incineration 389 advantages 390 defined 389 disadvantages 392 elements 391 392 illustrated 393 See also Solid waste incineration
Rotary kiln reactor 397
Rotating biological contactors (RBCs) 10 12 15 240
air drive 242 benefits 244 defined 240 design 241 limitations 244 odor, solving 241 problems 240

537 Index terms Links
This page has been reformatted by Knovel to provide easier navigation.
Rotating biological contactors (RBCs) (Continued) with recycle 243 See also Attached growth systems
Rotating cylindrical screens 260 defined 260 illustrated 261 self-cleaning process 262 See also Physical barriers
Roughing filters 239 defined 239 effects 239
Runoff 133
S Safe Drinking Water Act (SDWA) 90
Sampling air toxics 119 ambient air 115 339 automatic wastewater device 86 equipment 85 location 83 for oil/grease 86 sample preservation 85 stack 111 338 for volatile substances 86 See also Waste characterization studies
Sand filtration 146
Scrubbers die casting 443 fume 424 schematic 344 tray 345 venturi 345 346 wet 344
Scrubbing 326 apparatus 326

538 Index terms Links
This page has been reformatted by Knovel to provide easier navigation.
Scrubbing (Continued) defined 326 illustrated 327 See also Industrial wastewater treatment
Second law of thermodynamics 39 42
Selectors 199 configurations 201 defined 199 types of 201
Sequencing batch reactor (SBR) modification 208 advantages 209 defined 208 design procedure 211 luxury uptake of phosphorus 210 schematic 209 stages 208 troubleshooting procedures 209 See also Activated sludge
Sequencing batch reactors (SBR) 10 11 14
Settleable solids 107 109
Settling best 197 column 283 284 discrete 280 flocculent 281 282 path 282 velocity 290
Silica gel 349
Six-place stirrers 5 6
Slow sand filter 279
Sludge bulking 199 concentration vs. settling velocity 290 concentration vs. time 289

539 Index terms Links
This page has been reformatted by Knovel to provide easier navigation.
Sludge (Continued) depth 283 See also Activated sludge
Sludge thickening 281 clarifier-thickener 284 depth vs. concentration 297 design calculations 290 design procedure 283 dilution factor vs. time 292 feed solids concentration vs. mass loading 296 unit area vs. velocity 291 See also Industrial wastewater treatment
Sodium chloride 39
Soft drink bottling 468 flow diagram 470 formulas 468 ingredients 469 overview 468 production 468 wastes generation 471 wastes minimization 471 wastewater treatment 472 See also Case studies
Solid adsorbents 112
Solid-bowl centrifuges 301
Solids insoluble 160 liquid, interface height vs. time 288 magnetically enhanced separation 328 329 MLVSS 196 removal for depth vs. time 286 settleable 107 109 suspended 107 suspended, removal vs. overflow rate 287 suspended, removal vs. time 287 total 107

540 Index terms Links
This page has been reformatted by Knovel to provide easier navigation.
Solids (Continued) total suspended (TSS) 3 9
107 total volatile suspended (TVSS) 107 in wastewater 108
Solid waste incineration 386 fluidized bed technology 387 hearth incinerator technologies 393 modular systems 394 rotary kiln technology 389 starved air technologies 395 suitability 370
Solid wastes categories 365 characterization 369 code production 452 composting 398 composting suitability 371 copper forming 425 electroplating 418 grinding 400 hazardous 365 landfill suitability 370 lead acid batteries 490 nonhazardous 367 prepared frozen foods 427 433 RCRA 365 red meat production/processing 476 477 reduction opportunities 369 rendering by-products 481 483 soft drink bottling 471 solidification 371 S/S technologies 372 S/S treatment 372 stabilization 371 synthetic rubber 464

541 Index terms Links
This page has been reformatted by Knovel to provide easier navigation.
Solid wastes (Continued) volume rate of generation 369
Solid waste treatment 363 background 364 evaluation process 27 program development 27
Solution crumb production 462
Solutions 40
Solvent extraction 184
Soxlet extraction method 109
Sphagnum peat 356
Spray irrigation 330
S/S treatment binders 372 inorganic binding agents 374 organic binding agents 372 procedure mechanisms 376 systems 372 technology categories 372 See also Solid wastes
Stack sampling 111 adsorption on a solid 112 centrifugal force 113 condensation in a trap 112 continuous monitoring system 116 dry impingement 113 electrostatic impingement 113 equipment 111 filtration 113 impaction 113 particulate sampling train 114 purpose 111 338 reasons for conducting 111 reasons for using 338 Tedlar bags 112

542 Index terms Links
This page has been reformatted by Knovel to provide easier navigation.
Stack sampling (Continued) vacuum pumps 112 wet impingement 113
Standard oxygen transfer rate (SOTR) 228 229
Starved air technologies 395 advantages/disadvantages 396 car bottom 397 defined 395 design considerations 396 gasification process 395 396 pyrolysis 395 roller hearth 397 rotary hearth 397 rotary kiln 397 See also Solid waste incineration
State stormwater permitting programs 128
Static pile technology 402
Stormwater BOD 136 construction-related permits 130 groundwater contamination prevention 131 Individual Permit 129 management 127 management in landfills 384 Multi-Sector General Permit (MSGP) 129 permit types 129 retention/detention 134 135 as source of process water makeup 135 state permitting programs 128 TDS 136
Stormwater Pollution Prevention Plan (SWPPP) 130
Stormwater treatment case study 137 collection system design 133 design considerations 136 design storm 133
543 Index terms Links
This page has been reformatted by Knovel to provide easier navigation.
Stormwater treatment (Continued) heat 137 hydrology 132 precipitation 132 quantity and quality 132 runoff 133 system design considerations 132 system failure protection 134 technologies 134
Stratospheric ozone protection 64
Stripping 325 defined 325 illustrated 326 removal mechanism 325 volatile substances and 326 See also Industrial wastewater treatment
Superfund Amendments and Reauthorization Act (SARA) 56
Surface charge reduction 168
Suspended growth systems 251 anaerobic contact reactor 252 mixed, heated anaerobic digester 252 up flow anaerobic sludge blanket (UASB) 251 See also Anaerobic wastewater treatment
Suspended solids, copper forming 426
Swimming pool filters 277
Synthetic rubber 459 airborne wastes 464 emulsion crumb production 460 emulsion latex production process 465 overview 459 production 460 solid wastes 464 solution crumb production 462 specialty products 464 wastes generation 464

544 Index terms Links
This page has been reformatted by Knovel to provide easier navigation.
Synthetic rubber (Continued) wastes minimization 466 wastewater treatment 467 waterborne wastes 464 water flow diagrams 461 463 See also Case studies
T Tangential screens 260
Tedlarbags 112
Thermal agitation 44
Thermal oxidation 184
Thermal oxidizers 353 354
Thermodynamics second law of 39 42 stability 32
Tin, electroplating 413
Title I (NAAQS attainment/maintenance) 61
Title III (air toxics control) 61
Title IV (acid rain control) 62
Title V (permits and reporting) 62 application 62 monitoring/reporting 63 NESHAPs 63 regulated air pollutants 62
Title VI (stratospheric ozone protection) 64
Title VII (enforcement) 64
Total dissolved solids (TDS) 3 136
Total suspended solids (TSS) 3 9 107
Total volatile suspended solids (TVSS) 107
Toxicity Characteristic Leaching Procedure (TCLP) 370 371 analysis 366 test 370

545 Index terms Links
This page has been reformatted by Knovel to provide easier navigation.
Toxic wastes 121 copper forming 426 reduction feasibility 88
Trash incinerator air pollution 49
Tray scrubbers 345
Treatment, storage, and disposal facilities (TSDFs) 55 367
Treatment evaluation process 2 air emissions 18 industrial wastewater 2 solid wastes 27
Treatment objectives air emissions 25 industrial wastewater 4
Trickling filters 234 defined 234 design 237 Eckenfelder’s equations 238 media 236 recirculation 236 with recycle 237 rotary distributor 237 See also Attached growth systems
Tube settlers 298
Tubular precipitator 342
Turbidity, priority pollutants 105
Two-stage precipitator 342
U Ultraviolet light
hydrogen peroxide plus 182 ozone plus 183
Upflow anaerobic sludge blanket (UASB) 251
Upflow granular filters 269
Urea-formaldehyde 373
546 Index terms Links
This page has been reformatted by Knovel to provide easier navigation.
V Vacuum pumps 112
Vapor degreasers 410 degreasing substance 412 illustrated 411 water removal 412
Venturi scrubbers 345 346
Vibrating screens 259 defined 259 illustrated 260 See also Physical barriers
Volatile organic compounds (VOCs) 61 62 118
Volatile substances, sampling 86
W Waste Audit 86
hazardous substances leaving facility 87 hazardous substances sources 88 pollution prevention economics 89 procedure 87 purchased hazardous substance identification 87 purpose 86 toxic load reduction feasibility 88 waste stream reduction prioritization 88 See also Waste characterization studies
Waste characterization studies air emissions treatment 24 defined 83 Environmental Audit 90 industrial wastewater 3 oil/grease sampling 86 sample preservation 85 sampling equipment 85 sampling location 83 volatile substance sampling 86
547 Index terms Links
This page has been reformatted by Knovel to provide easier navigation.
Waste characterization studies (Continued) Waste Audit 86
Waste equalization 153 equalization 156 flow 154 flow configuration 153 offline 153 online 153
Wastes characteristics 96 disposal 81 hazardous 119 365 industrial wastewater 3 nonhazardous 367 production 1 reuse 78 See also Air pollution; Solid wastes; Waterborne wastes
Wastes minimization air emissions 24 anodizing/alodizing 449 coke production/processing 454 company philosophy 73 de-inking 437 electroplating 420 industrial wastewater 3 lead acid batteries 491 prepared frozen foods 432 rendering by-products 482 soft drink bottling 471 synthetic rubber 466 treatment/disposal 483
Waste-to-energy (WTE) 387 389
Wastewater application rate 330
Water in biological wastewater treatment 186 chemical structure 33

548 Index terms Links
This page has been reformatted by Knovel to provide easier navigation.
Water (Continued) composition 157 degreasing and 411 dissolution of air in 307 electron pairs 38 hardness 110 polarity 33 recycle loop 79 rinse, spent 419 sodium chloride behavior in 40
Waterborne wastes coke production 452 copper forming 425 electroplating 419 lead acid batteries 490 prepared frozen foods 427 433 red meat production/processing 476 477 rendering by-products 482 484 soft drink bottling 471 synthetic rubber 464
Water pollution control laws 53
Wet impingement 113
Wetlands treatment 330
Wet precipitator 342
Wet scrubbers 344 485
Windrows composting machine 402 composting technology 401 dimensions 401 problems 402
Wine making 455 overview 455 process 456 production illustration 458 wastes 457

549 Index terms Links
This page has been reformatted by Knovel to provide easier navigation.
Wine making (Continued) wastes minimization 457 wastes treatment 457 See also Case studies
Z Zinc die casting 443 444