Internet of Things (IoT) based Smart Agriculture Aiming ... - arXiv
Upload
khangminh22Category
view
1download
0
�����������������
Citation: Lee, Y.; Kim, C.; Hong, S.J.
Industrial Internet of Things for
Condition Monitoring and Diagnosis
of Dry Vacuum Pumps in Atomic
Layer Deposition Equipment.
Electronics 2022, 11, 375. https://
doi.org/10.3390/electronics11030375
Academic Editors: Matteo Golfarelli
and Enrico Gallinucci
Received: 6 January 2022
Accepted: 24 January 2022
Published: 26 January 2022
Publisher’s Note: MDPI stays neutral
with regard to jurisdictional claims in
published maps and institutional affil-
iations.
Copyright: © 2022 by the authors.
Licensee MDPI, Basel, Switzerland.
This article is an open access article
distributed under the terms and
conditions of the Creative Commons
Attribution (CC BY) license (https://
creativecommons.org/licenses/by/
4.0/).
electronics
Article
Industrial Internet of Things for Condition Monitoring andDiagnosis of Dry Vacuum Pumps in Atomic LayerDeposition EquipmentYongho Lee, Chanyoung Kim and Sang Jeen Hong *
Department of Electronics Engineering, Myongji University, 116 Myongji-ro,Yongin-si 17058, Gyeonggi-do, Korea; [email protected] (Y.L.); [email protected] (C.K.)* Correspondence: [email protected]; Tel.: +82-31-330-6374
Abstract: In the modern semiconductor industry, defective products occur with unexpected smallvariables due to process miniaturization. Managing the condition of each part is an effective way ofpreventing unexpected errors. The industrial internet of things (IIoT) environment, which can monitorand analyze the performance degradation of parts that affect process results, enables advanced processyield management. This paper introduces the IIoT concept-based data monitoring and diagnosticsystem construction results. The process of pump vibration data acquisition is explained to evaluatethe effectiveness of this system. The target process is deposition. The purpose of the system is todetect degradation of pumps due to by-products of the atomic layer deposition (ALD) process. Thesystem consists of three areas: a data acquisition unit using six vibration sensors, a Web access-basedmonitoring unit that can monitor vibration data, and an Azure platform that searches for outliers invibration data.
Keywords: industrial internet of things; web-access; azure; accelerometer; preprocessing
1. Introduction
Internet of things (IoT) is a technological innovation that creates an environmentof convergence around nature. Objects and conditions are digitally represented and re-motely monitored over the networks. They are maintained and controlled in intelligentways and conventional hard limits. Five layers of IoT technology were suggested to de-fine its key technology components: (1) perception layer (data gathering) by a physicalobject, sensor, and actuator; (2) network layer (data transmission) via network technolo-gies; (3) middleware layer (process information) for data analysis and decision making;(4) application layer (smart application) with graphic data representation; and (5) businesslayer (system management) for the benefits of business [1]. When IoT was conceptuallydeveloped, the network and middleware layers were more focused on building an IoTframework to utilize various IoT data from numerous perception layers. However, theutilization of the developed IoT has been applied within the limited scope of the domain.A great potential of the IoT convergence lies in industrial domains, where the entities forthe IoT needs are many and a huge business innovation opportunity, and the evolution ofIoT continued with industrial IoT (IIoT) [2].
With the advent of industry 4.0 strategy, factory automation with industry internetcan be represented by a programmable logic controller based supervisory control anddata acquisition, manufacturing excursion system, and converging information technology(IT) and operational technology of enterprise resource planning to achieve the goal ofmanufacturing technology to increase the productivity and flexibility to reduce productioncost. To achieve one step closer to the success of IIoT, Chen et al. suggested a frameworkfor collaborative sensing intelligence with a research challenge [3]; however, the actual dataacquisition considering data quality remains a practical challenge in a perception layer. The
Electronics 2022, 11, 375. https://doi.org/10.3390/electronics11030375 https://www.mdpi.com/journal/electronics

Electronics 2022, 11, 375 2 of 18
differences between the machine-oriented IIoT and human-centered consumer IoT includeexisting devices and standards for data acquisition, fixed connectivity with centralizednetwork management, and high data volume [4]. One of the most promising applicationsof IIoT is facility or equipment maintenance by automated condition monitoring dataacquisition and abnormal detection, which is called the predictive maintenance, or e-maintenance, in the manufacturing domain [5–8]. Rather simplified practice on facilitymanagement with temperature and humidity monitoring or standalone equipment withvibration sensors has been demonstrated in a capacity of characteristic condition sensingwith existing sensors, wireless data transmission, and data visualization. However, amore realistic facility-level IIoT requires a very complicated framework with subject matterexperts (SMEs). Recently, a comprehensive categorical framework for IIoT was proposed.Additionally, it is essential to set a practical classification scheme for the detailed andsuccessful IIoT framework [9].
Semiconductor chip manufacturing facilities, called FAB, consists of multiple facilitylayers/areas: a fan filter unit layer for cleaning air supply, cleanroom layer for operatingwafer production and inspection, service area for production equipment, and sub-fablayer of clean and facility sub-fab [10]. A plenum layer can be included, as shown inFigure 1. In current high-volume memory manufacturing, the facility expands four timeslarger than the soccer field to increase chip production. The manufacturing accordanceof thousands of production tools in the cleanroom layer and several thousands of drypumps and gas scrubbers in the clean sub-fab layer are essential to increase the productionefficiency by extending the preventive maintenance (PM) schedule. The next-generationsemiconductor devices require new materials to enhance chip performance. However, theformation of new materials with a gas-phase reaction leaves unexpected by-products tocall maintenance [11,12].
Electronics 2022, 11, x FOR PEER REVIEW 2 of 18
the actual data acquisition considering data quality remains a practical challenge in a per-
ception layer. The differences between the machine-oriented IIoT and human-centered
consumer IoT include existing devices and standards for data acquisition, fixed connec-
tivity with centralized network management, and high data volume [4]. One of the most
promising applications of IIoT is facility or equipment maintenance by automated condi-
tion monitoring data acquisition and abnormal detection, which is called the predictive
maintenance, or e-maintenance, in the manufacturing domain [5–8]. Rather simplified
practice on facility management with temperature and humidity monitoring or
standalone equipment with vibration sensors has been demonstrated in a capacity of char-
acteristic condition sensing with existing sensors, wireless data transmission, and data
visualization. However, a more realistic facility-level IIoT requires a very complicated
framework with subject matter experts (SMEs). Recently, a comprehensive categorical
framework for IIoT was proposed. Additionally, it is essential to set a practical classifica-
tion scheme for the detailed and successful IIoT framework [9].
Semiconductor chip manufacturing facilities, called FAB, consists of multiple facility
layers/areas: a fan filter unit layer for cleaning air supply, cleanroom layer for operating
wafer production and inspection, service area for production equipment, and sub-fab
layer of clean and facility sub-fab [10]. A plenum layer can be included, as shown in Figure
1. In current high-volume memory manufacturing, the facility expands four times larger
than the soccer field to increase chip production. The manufacturing accordance of thou-
sands of production tools in the cleanroom layer and several thousands of dry pumps and
gas scrubbers in the clean sub-fab layer are essential to increase the production efficiency
by extending the preventive maintenance (PM) schedule. The next-generation semicon-
ductor devices require new materials to enhance chip performance. However, the for-
mation of new materials with a gas-phase reaction leaves unexpected by-products to call
maintenance [11,12].
Figure 1. Semiconductor FAB structural layout.
Many processes in semiconductor fabrication require a vacuum environment to meet
the chemical and physical requirements, and the use of dry vacuum pumps prevails in
semiconductor manufacturing [13]. The dry vacuum pumps perhaps do keep the process
low in the process chamber. The pumping efficiency drifts along the time of use, which
can jeopardize the process quality; thus, several studies have been conducted on the diag-
nostics on dry pumps [14–17]. Current semiconductor fabrication technology employs di-
verse process gas to form or remove thin film materials in plasma. For instance, atomic
layer deposition (ALD) of TiN thin films with TiCl4 and NH3 process gases forms the un-
desired TiO2 by-product and coagulation of the undesired TiO2 by-product under the va-
por pressure in the foreline of the chamber and inside the dry vacuum pump. The scale,
formed from TiO2 power, degrades the pumping efficiency of dry vacuum pumps. It also
shortens the remaining useful time for the pump. Indeed, semiconductor production is
inevitable to hold for maintenance until the replacement and qualification for production
are made. The role of a dry vacuum pump is to maintain a constant pressure level as an
Figure 1. Semiconductor FAB structural layout.
Many processes in semiconductor fabrication require a vacuum environment to meetthe chemical and physical requirements, and the use of dry vacuum pumps prevails insemiconductor manufacturing [13]. The dry vacuum pumps perhaps do keep the processlow in the process chamber. The pumping efficiency drifts along the time of use, whichcan jeopardize the process quality; thus, several studies have been conducted on thediagnostics on dry pumps [14–17]. Current semiconductor fabrication technology employsdiverse process gas to form or remove thin film materials in plasma. For instance, atomiclayer deposition (ALD) of TiN thin films with TiCl4 and NH3 process gases forms theundesired TiO2 by-product and coagulation of the undesired TiO2 by-product under thevapor pressure in the foreline of the chamber and inside the dry vacuum pump. The scale,formed from TiO2 power, degrades the pumping efficiency of dry vacuum pumps. It alsoshortens the remaining useful time for the pump. Indeed, semiconductor production isinevitable to hold for maintenance until the replacement and qualification for productionare made. The role of a dry vacuum pump is to maintain a constant pressure level asan auxiliary facility; however, when it goes wrong, one should pay for the expensiveproduction loss in semiconductor chip manufacturing. Therefore, the monitoring and

Electronics 2022, 11, 375 3 of 18
diagnosis of dry vacuum pumps in semiconductor manufacturing with the scope of IIoTgive many benefits to avoid misprocessing from unexpected component drift or failure.
In the existing ALD environment, a pump is used as a method of conducting PM atregular intervals rather than finding and solving problems at the time of faulty occurrence.This is for the purpose of prevention, but it is because there is no means to feedback theabnormal state that has occurred in the pump. Therefore, the change of the pump wasobserved based on the amount of change in the vibration of the pump acquired in theenvironment where the by-product was accumulated. Through this, an IIoT monitoringsystem that can monitor changes in real time was created. By analyzing the vibrationdata of the pump in Azure, a cloud-based analysis platform, we created an analysissystem that accurately classifies outliers. Finally, it was integrated to build an IIoT pumpmonitoring and diagnostic system. This new system can monitor the pump status in theALD process environment and reflect the feedback of all major vibration points throughML, a multivariate analysis technique.
A literature survey on the condition monitoring and diagnosis of dry vacuum pumpsshows a good technical improvement for characterizing the system using advanced signalprocessing techniques. Jiang et al. proposed a wavelet cluster-based frequency responseanalysis for bearing defects, employing a vibrational transducer. They suggested thatmethods of filtering and modulation of the acquired frequency spectral data were effectivein fault diagnosis [18]. Similarly, fuzzy-model-based condition monitoring was suggestedby analyzing the exhaust pressure signal [19]. Additionally, a prediction of vacuum pumpdegradation in semiconductor processing was proposed to estimate the remaining usefultime of the pump [20]. This research also employed foreline pressure measurement toacquire pump status data in the perception layer of IIoT and data analysis for decisionmaking using an artificial neural network as a middleware layer. An interesting aspect ofthis research includes gas data as chamber data, whether the pump is idling or processingmodes. This is one aspect of SME. Along with the technology development of IT andcomputational intelligence technology, the development of the monitoring and diagnosticmethod of dry vacuum pumps can be found [21–23].
In the industrial field, machine learning has been utilized in various aspects to increasethe efficiency of the manufacturing process. A machine learning concept was used to detectanomalies based on data acquired by IoT in a Wi-Fi indoor localization environment [24].In addition, there has been a study using a virtual metrology model based on a treeensemble method, such as a random forest to reduce the measurement time and cost [25].In the semiconductor field, using plasma measurement sensors such as Optical EmissionSpectroscopy, machine learning analysis was performed as a means of linking the complexrelationship between sensor data and the process results [26].
In this study, we present a realistic practice of the in situ monitoring and diagnosisof the dry vacuum pump installed at the semiconductor fabrication equipment withinthe scope of the practical application of IIoT. The perception layer is established with sixvibrational transducers to collect in situ pump status data. The collected analog vibrationaldatasets are then converted to digital signals using a data acquisition module. For this,2.4 GHz Wi-Fi wireless data transmission is used. The data acquisition environment canuse wired instead of wireless to prevent data loss and enhance the security [27]. The datavisualization application layer is constructed with Wise-PaaS provided by Advantech Korea.The average deployment cost for data acquisition and monitoring system configuration isapproximately 3354 USD (Including six accelerometers and cables, data acquisition card,and Wise-PaaS). Finally, Microsoft Azure is employed as a middleware layer for dataanalysis considering the university research environment. There exists a virtual machineand storage usage fee for machine learning computation in the Azure environment. Avirtual machine with 4 vCPUs with 14 GB of RAM and 200 GB temporary storage costsabout 0.229 USD per hour. Figure 2 shows the cloud diagnostic system structure andedge monitoring system. By demonstrating the four layers of IIoT with the application

Electronics 2022, 11, 375 4 of 18
in a semiconductor manufacturing facility, the final business layer can easily be tried byindustry, confirming the potential of IIoT in the near future.
Electronics 2022, 11, x FOR PEER REVIEW 4 of 18
monitoring system. By demonstrating the four layers of IIoT with the application in a
semiconductor manufacturing facility, the final business layer can easily be tried by in-
dustry, confirming the potential of IIoT in the near future.
Figure 2. Edge monitoring system and cloud diagnostic system.
2. Subject Matter
2.1. Equipment Degradation Mechanism
By-products generated during the semiconductor process may degrade the function-
ality of the dry vacuum pump and shorten the remaining useful time before breakdown
maintenance (BM). TiO2 powder combined in the exhaust process after ALD of TiN thin
film is essential to the performance and lifespan of the pump. The combination of TiO2
powder and NH4Cl particles can be hardened inside the exhaust line and dry pump. The
solidified gas-phase by-products lower the conduction performance, creating an alarm on
the pressure controller of the main process equipment. When it leaches to the equipment
operational limits, a warning alarm from the pressure gauge inside the dry pump shuts
down the pump operation via interlock functions of the high-end fabrication equipment.
The dry pumps in the semiconductor manufacturing facility operate 24 h a day. It is de-
sired that they can be operated for more than a year without maintenance. However, in
reality, the lifetime of the dry pumps is as short as a month due to the undesired particles
in some processes.
Failure to properly treat process by-products in the IC manufacturing process can
lead to clogging of the exhaust system, damage to vacuum pumps and valves, and unex-
pected equipment failure. Foreline clogging decreases the flow conductance and increases
particles inside the chamber. It also causes a safety problem due to the accumulation of
by-products. For example, in the ZrO2 ALD process, by-products generated in the exhaust
pipe have a high risk of dust explosion [28].
Figure 2. Edge monitoring system and cloud diagnostic system.
2. Subject Matter2.1. Equipment Degradation Mechanism
By-products generated during the semiconductor process may degrade the function-ality of the dry vacuum pump and shorten the remaining useful time before breakdownmaintenance (BM). TiO2 powder combined in the exhaust process after ALD of TiN thinfilm is essential to the performance and lifespan of the pump. The combination of TiO2powder and NH4Cl particles can be hardened inside the exhaust line and dry pump. Thesolidified gas-phase by-products lower the conduction performance, creating an alarm onthe pressure controller of the main process equipment. When it leaches to the equipmentoperational limits, a warning alarm from the pressure gauge inside the dry pump shutsdown the pump operation via interlock functions of the high-end fabrication equipment.The dry pumps in the semiconductor manufacturing facility operate 24 h a day. It is desiredthat they can be operated for more than a year without maintenance. However, in reality,the lifetime of the dry pumps is as short as a month due to the undesired particles insome processes.
Failure to properly treat process by-products in the IC manufacturing process can leadto clogging of the exhaust system, damage to vacuum pumps and valves, and unexpectedequipment failure. Foreline clogging decreases the flow conductance and increases particlesinside the chamber. It also causes a safety problem due to the accumulation of by-products.For example, in the ZrO2 ALD process, by-products generated in the exhaust pipe have ahigh risk of dust explosion [28].
Semiconductor by-products depend on the type of process gas and condition underwhich the chemical reactions can occur. In the ALD process, the unreacted process gasis deposited inside the vacuum pump and causes pump failure [29]. TiN thin film ALD

Electronics 2022, 11, 375 5 of 18
process using NH3, N2, and TiCl4 gases generate TiO2 and NH4Cl by a chemical bond. Thechemical bonds of semiconductor by-products that occur in the ALD process are as follows:
TiCl4 + O2 → TiO2 + 2Cl2, (1)
NH3 → NH2− + H+, (2)
NH3 + H+ → NH4+, (3)
NH4+ + Cl− → NH4Cl. (4)
According to Equation (1), the TiCl4 gas exiting through the exhaust stage after theprocess meets O2 in the exhaust process and chemically bonds to TiO2, leaving 2Cl2. Then,NH3 gas is dissociated into NH2
− and H+ during the ionization process. The separated H+
recombines with the existingNH3, forming NH4+, as shown in Equation (3). Finally, NH4Cl
(Ahmonium Chloride; an organic compound similar to white crystalline salt) and TiO2 isformed as chemical reaction by-products.
The TiCl4 gas reacts with O2 in the exhaust process to form TiO2 powder; NH3 andTiCl4 combine to form NH4Cl. The basic nature of NH4Cl causes internal corrosion of thepump. One may concern a disruption of the flow inside the pump and the occurrence ofpump down due to the combination with TiO2. In fact, a more significant concern is therepeated metal surface corrosion of the dry pump rotor and shaft from NH4Cl and thecoagulation of TiO2 nanoparticles inside the dry pump parts, which affect the long-termreliability of the equipment.
Therefore, to prevent an undesired generation of corrosion of metal parts and gen-eration of by-product particles, the atmosphere of the pump is operated in a conditioncomparable to the melting point of the gas-phase by-products. Then, a cold trap is installedto convert gas-phase particles to powder to be captured in a filter. All these engineeringeffects may provide an indirect treatment, but more informative data for the pump condi-tion can be used for scheduling PM and preventing unnecessary BM. An in situ monitoringsystem for determining the changes inside the pump and detecting abnormal conditionsbefore the pump goes down is essential in a manufacturing environment. Therefore, thispaper presents a realistic construction of an in situ pump status monitoring system capableof a cloud computing-based IoT system. The suggested proactive aims are for data-drivenmaintenance efficiency for the clustered dry pump diagnostic system in a high-volumesemiconductor manufacturing environment.
2.2. Mechanical Vibration Analysis
Vibration is a phenomenon in a physical quantity that fluctuates around the averagevalue. Automated machines consisting of various moving and rotating parts vibrate inresponse to the force fluctuation during operation. Analyzing the change in vibrationcharacteristics due to a physical change can diagnose a defect of the specific part. The ISO18436-2 standard presents the effectiveness and rationale of analyzing such componentdefectives as a vibration mechanism [30]. By-product issues of the pump down occurdue to the pumping process load caused by the internal rotational limitation of the pump.Accumulated by-product particles inside the vacuum pump during the process can decreasethe pumping speed [31]. Time-domain and frequency-domain analyses are the most well-known methods used in vibration-based equipment diagnosis [32]. The time-domainanalysis is based on the amplitude or temporal fluctuation, impact, and symmetricity of thewaveform, using the probability density function of the amplitude and the peek-to-peek.The frequency-domain analysis method decomposes time-domain sinusoidal waves intofrequency components using fast Fourier transform (FFT). The frequency included in thesinusoidal wave and the amplitude of the frequency spectra can be analyzed. Figure 3shows an example of the decomposed complex waveform to the frequency by applyingFFT in this experiment.

Electronics 2022, 11, 375 6 of 18
Electronics 2022, 11, x FOR PEER REVIEW 6 of 18
included in the sinusoidal wave and the amplitude of the frequency spectra can be ana-
lyzed. Figure 3 shows an example of the decomposed complex waveform to the frequency
by applying FFT in this experiment.
Figure 3. Fast Fourier transform (FFT) example acquired from the experiment.
3. In Situ Vibration Data Acquisition
Finding a health index of the dry pump can help the condition monitoring and diag-
nosis to prevent undesired machine breakdowns. Feature extraction of the vibrational
data from the dry vacuum pump is the most well-known method. However, the structures
of the pumping mechanism and mechanical supports with the housing vary from the
pump manufacturer. Thus, the acquired data can vary from the different types of pumps
and pump manufacturers. A designated dry pump of AA220W manufactured by Ebara,
located at the semiconductor process diagnostic research center (SPDRC) at Myongji Uni-
versity was employed to collect the vibrational data in the experimental stage for the eas-
iness of IIoT application development. The AA200W for the high-speed exhaust of large
chambers has two-stage pumps, consisting of a screw-type dry pump and a root-type
blower pump. The designated dry pump is connected with the ICP type 300 mm produc-
tion etch chamber for the IIoT system development. However, it still conceptually holds
the purpose of the suggested research. Once the suggested system is ready, the developed
IIoT system is attached to the dry pump connected to the TiN deposition chamber for the
application test, which will be described in the later section.
The vibration sensor converts the vibration detected from the machine into a digital
signal, and their types are typically a velocity sensor, proximity probe, and accelerometer.
The sensitivities in the frequency range are different; the type of sensor should be consid-
ered with respect to the frequency response characteristics, signal-to-noise ratio, and sen-
sitivity. In this paper, we used a piezoelectric vibration acceleration sensor with a higher
frequency response and higher sensitivity than other vibration sensors to investigate two
different models of dry pumps. The employed vibration sensor has a frequency response
of about 10 kHz and a sensitivity of 100 mV/g. The noise density over the 10, 100, and 1000
Hz ranges are 14, 2.3, and 2 μg/√Hz, respectively. A suggested system sampling rate is
20.08 Hz (20.08 data per 1 s). It is also crucial for the data acquisition from the vibration
sensors to have concrete physical contact with the entity that affects the contact resonance.
The measurable frequency range reduces at low installation resonant frequencies. A mag-
netic stud that can be fixed with screws is used to minimize external vibrations that occur
during data acquisition. The closer and more fixed to the pump surface, the more advan-
tageous it is to acquire high-frequency region data.
For accurate vibration measurement, it is necessary to select an installation location
that best reflects the vibration characteristics of the pump. When the pump performance
decreases due to by-products being adsorbed inside, the load on the internal bearing in-
creases. Based on the domain knowledge and experience, TiO2 tends to be adsorbed near
the dry pump inlet and internal screw. We assumed that the vibration analysis of the rel-
evant area would also change significantly (perhaps, this is not always true). The vibration
sensor measures only the vibration in one direction; therefore, a single sensor cannot
measure the lateral vibration caused by the rotational motion of the facility. The lateral
vibration data can be used together for a more versatile analysis. Four acceleration sensors
Figure 3. Fast Fourier transform (FFT) example acquired from the experiment.
3. In Situ Vibration Data Acquisition
Finding a health index of the dry pump can help the condition monitoring anddiagnosis to prevent undesired machine breakdowns. Feature extraction of the vibrationaldata from the dry vacuum pump is the most well-known method. However, the structuresof the pumping mechanism and mechanical supports with the housing vary from the pumpmanufacturer. Thus, the acquired data can vary from the different types of pumps andpump manufacturers. A designated dry pump of AA220W manufactured by Ebara, locatedat the semiconductor process diagnostic research center (SPDRC) at Myongji Universitywas employed to collect the vibrational data in the experimental stage for the easiness ofIIoT application development. The AA200W for the high-speed exhaust of large chambershas two-stage pumps, consisting of a screw-type dry pump and a root-type blower pump.The designated dry pump is connected with the ICP type 300 mm production etch chamberfor the IIoT system development. However, it still conceptually holds the purpose of thesuggested research. Once the suggested system is ready, the developed IIoT system isattached to the dry pump connected to the TiN deposition chamber for the application test,which will be described in the later section.
The vibration sensor converts the vibration detected from the machine into a digitalsignal, and their types are typically a velocity sensor, proximity probe, and accelerometer.The sensitivities in the frequency range are different; the type of sensor should be consideredwith respect to the frequency response characteristics, signal-to-noise ratio, and sensitivity.In this paper, we used a piezoelectric vibration acceleration sensor with a higher frequencyresponse and higher sensitivity than other vibration sensors to investigate two differentmodels of dry pumps. The employed vibration sensor has a frequency response of about10 kHz and a sensitivity of 100 mV/g. The noise density over the 10, 100, and 1000 Hzranges are 14, 2.3, and 2 µg/
√Hz, respectively. A suggested system sampling rate is
20.08 Hz (20.08 data per 1 s). It is also crucial for the data acquisition from the vibrationsensors to have concrete physical contact with the entity that affects the contact resonance.The measurable frequency range reduces at low installation resonant frequencies. Amagnetic stud that can be fixed with screws is used to minimize external vibrations thatoccur during data acquisition. The closer and more fixed to the pump surface, the moreadvantageous it is to acquire high-frequency region data.
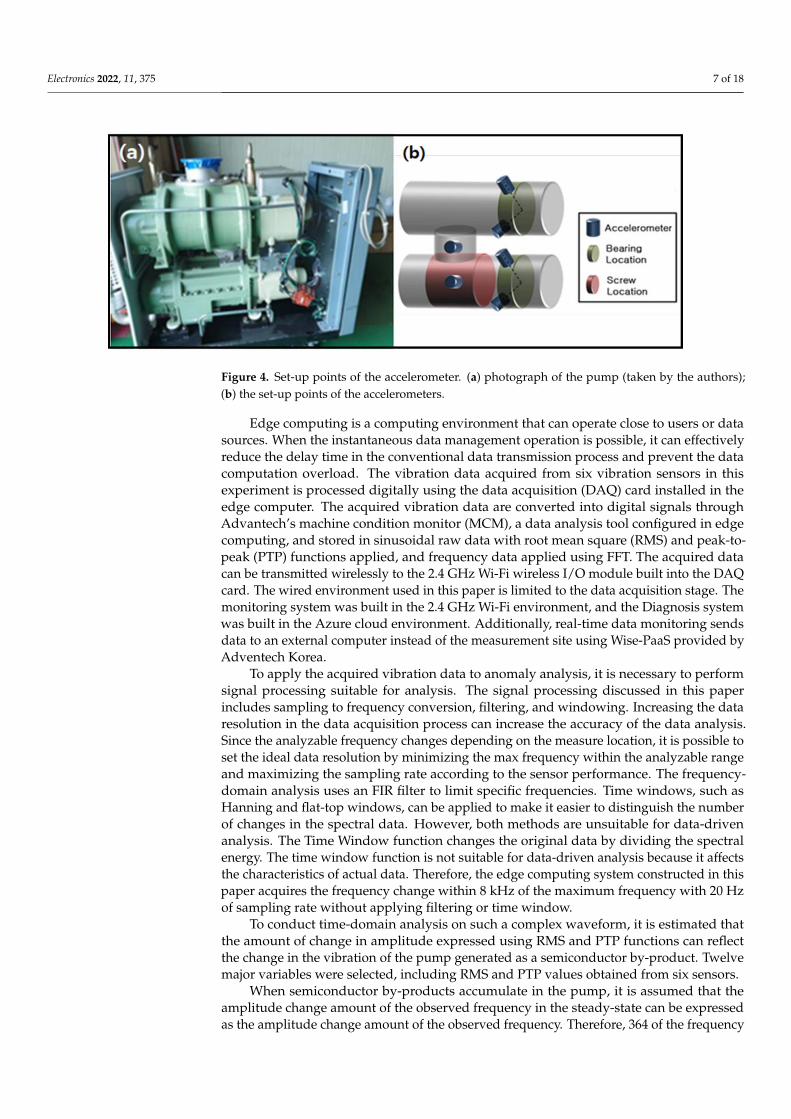
For accurate vibration measurement, it is necessary to select an installation locationthat best reflects the vibration characteristics of the pump. When the pump performancedecreases due to by-products being adsorbed inside, the load on the internal bearingincreases. Based on the domain knowledge and experience, TiO2 tends to be adsorbednear the dry pump inlet and internal screw. We assumed that the vibration analysis ofthe relevant area would also change significantly (perhaps, this is not always true). Thevibration sensor measures only the vibration in one direction; therefore, a single sensorcannot measure the lateral vibration caused by the rotational motion of the facility. Thelateral vibration data can be used together for a more versatile analysis. Four accelerationsensors are attached to the bearings of dry and booster pumps in the horizontal and verticaldirections. The remaining two sensors are attached to the inlet part and screw end of thedry pump. Figure 4 shows a photograph of the pump (taken by the authors) and the set-uppoints of the accelerometers for the vibrational data acquisition in this exercise.
Electronics 2022, 11, 375 7 of 18
Electronics 2022, 11, x FOR PEER REVIEW 7 of 18
are attached to the bearings of dry and booster pumps in the horizontal and vertical di-
rections. The remaining two sensors are attached to the inlet part and screw end of the dry
pump. Figure 4 shows a photograph of the pump (taken by the authors) and the set-up
points of the accelerometers for the vibrational data acquisition in this exercise.
Figure 4. Set-up points of the accelerometer. (a) photograph of the pump (taken by the authors);
(b) the set-up points of the accelerometers.
Edge computing is a computing environment that can operate close to users or data
sources. When the instantaneous data management operation is possible, it can effectively
reduce the delay time in the conventional data transmission process and prevent the data
computation overload. The vibration data acquired from six vibration sensors in this ex-
periment is processed digitally using the data acquisition (DAQ) card installed in the edge
computer. The acquired vibration data are converted into digital signals through Advan-
tech’s machine condition monitor (MCM), a data analysis tool configured in edge compu-
ting, and stored in sinusoidal raw data with root mean square (RMS) and peak-to-peak
(PTP) functions applied, and frequency data applied using FFT. The acquired data can be
transmitted wirelessly to the 2.4 GHz Wi-Fi wireless I/O module built into the DAQ card.
The wired environment used in this paper is limited to the data acquisition stage. The
monitoring system was built in the 2.4 GHz Wi-Fi environment, and the Diagnosis system
was built in the Azure cloud environment. Additionally, real-time data monitoring sends
data to an external computer instead of the measurement site using Wise-PaaS provided
by Adventech Korea.
To apply the acquired vibration data to anomaly analysis, it is necessary to perform
signal processing suitable for analysis. The signal processing discussed in this paper in-
cludes sampling to frequency conversion, filtering, and windowing. Increasing the data
resolution in the data acquisition process can increase the accuracy of the data analysis.
Since the analyzable frequency changes depending on the measure location, it is possible
to set the ideal data resolution by minimizing the max frequency within the analyzable
range and maximizing the sampling rate according to the sensor performance. The fre-
quency-domain analysis uses an FIR filter to limit specific frequencies. Time windows,
such as Hanning and flat-top windows, can be applied to make it easier to distinguish the
number of changes in the spectral data. However, both methods are unsuitable for data-
driven analysis. The Time Window function changes the original data by dividing the
spectral energy. The time window function is not suitable for data-driven analysis because
it affects the characteristics of actual data. Therefore, the edge computing system con-
structed in this paper acquires the frequency change within 8 kHz of the maximum fre-
quency with 20 Hz of sampling rate without applying filtering or time window.
To conduct time-domain analysis on such a complex waveform, it is estimated that
the amount of change in amplitude expressed using RMS and PTP functions can reflect
the change in the vibration of the pump generated as a semiconductor by-product. Twelve
major variables were selected, including RMS and PTP values obtained from six sensors.
Figure 4. Set-up points of the accelerometer. (a) photograph of the pump (taken by the authors);(b) the set-up points of the accelerometers.
Edge computing is a computing environment that can operate close to users or datasources. When the instantaneous data management operation is possible, it can effectivelyreduce the delay time in the conventional data transmission process and prevent the datacomputation overload. The vibration data acquired from six vibration sensors in thisexperiment is processed digitally using the data acquisition (DAQ) card installed in theedge computer. The acquired vibration data are converted into digital signals throughAdvantech’s machine condition monitor (MCM), a data analysis tool configured in edgecomputing, and stored in sinusoidal raw data with root mean square (RMS) and peak-to-peak (PTP) functions applied, and frequency data applied using FFT. The acquired datacan be transmitted wirelessly to the 2.4 GHz Wi-Fi wireless I/O module built into the DAQcard. The wired environment used in this paper is limited to the data acquisition stage. Themonitoring system was built in the 2.4 GHz Wi-Fi environment, and the Diagnosis systemwas built in the Azure cloud environment. Additionally, real-time data monitoring sendsdata to an external computer instead of the measurement site using Wise-PaaS provided byAdventech Korea.
To apply the acquired vibration data to anomaly analysis, it is necessary to performsignal processing suitable for analysis. The signal processing discussed in this paperincludes sampling to frequency conversion, filtering, and windowing. Increasing the dataresolution in the data acquisition process can increase the accuracy of the data analysis.Since the analyzable frequency changes depending on the measure location, it is possible toset the ideal data resolution by minimizing the max frequency within the analyzable rangeand maximizing the sampling rate according to the sensor performance. The frequency-domain analysis uses an FIR filter to limit specific frequencies. Time windows, such asHanning and flat-top windows, can be applied to make it easier to distinguish the numberof changes in the spectral data. However, both methods are unsuitable for data-drivenanalysis. The Time Window function changes the original data by dividing the spectralenergy. The time window function is not suitable for data-driven analysis because it affectsthe characteristics of actual data. Therefore, the edge computing system constructed in thispaper acquires the frequency change within 8 kHz of the maximum frequency with 20 Hzof sampling rate without applying filtering or time window.
To conduct time-domain analysis on such a complex waveform, it is estimated thatthe amount of change in amplitude expressed using RMS and PTP functions can reflectthe change in the vibration of the pump generated as a semiconductor by-product. Twelvemajor variables were selected, including RMS and PTP values obtained from six sensors.
When semiconductor by-products accumulate in the pump, it is assumed that theamplitude change amount of the observed frequency in the steady-state can be expressedas the amplitude change amount of the observed frequency. Therefore, 364 of the frequency

Electronics 2022, 11, 375 8 of 18
data showing effective changes in each sensor were selected as the main variables of furtherdata processing.
For the classification algorithm to be applied to the experimental data, the top sevenalgorithms with the highest performance for the data were selected based on the algo-rithm database in Azure. Dry pump vibration data of 300 mm ICP etcher were clas-sified using MinMaxScalerSVM [33], StackEnsemble [34], RobustScalerSVM, MaxAbsS-calerLightGBM [35], StandardScalerWrapperLightGBM, and SparseNormalizerXGBoost-Classifier [36].
As the main process of this paper, dry pump vibration data of the TiN depositionprocess were classified using MinMaxScaler_RandomForest [37], StandardScalerWrapper-RandomForest, SparseNormalizerXGBoostClassifier, MaxAbsScalerXGBoostClassifier, Min-MaxScalerExtremeRandomTrees [38], MaxAbsScalerLightGBM, and StandardScalerWrap-perExtremeRandomTrees. The pseudo-code of the algorithm used as the main structure ofeach algorithm, such as (a) SVM, (b) StackEnsemble, (c) LightGBM, (d) XGBoostClassifier,(e) RandomForest, and (f) ExtremeRandomTrees, are presented in Appendix A.
4. Monitoring and Diagnostic System
The data collected from the edge computer is stored in an external Web access PC asa 2.4 GHz Wi-Fi wireless I/O module. Data are transmitted according to the predefinedModbus communication value. The transmission period can be set-up to a 0.1 s period.The calculations of functions for time-domain and frequency-domain values are performedon the edge computer. Web access is designed to store the calculated function values ina database. The data stored in the database are displayed in real-time on the dashboardconfigured in Web access. As shown in Figure 5, the dashboard visualizes the maximumvalue of RMS, PTP, and FFT of each sine wave sensor with a control chart and singlestatus warning alarm. The control chart was configured to check the occurrence of outliersbased on the upper and lower levels of 10%, and the single status warning alarm wasconfigured to display a warning when each sensor deviates from a certain level. Throughthis, it is possible to review the entire data in addition to real-time monitoring. The IIoTbased in situ monitoring system can quickly provide equipment status information to users.Users can operate the process stably and find abnormal conditions based on the statusinformation. In addition, the time-series database can be used as a variable when analyzingprocess results.
The diagnostic system acts as a middle layer for machine learning analysis withthe data acquired from the pump. This system was built with Microsoft Azure, a cloudplatform with various advantages, such as algorithm optimization function, evaluation ofmulti-faceted model performance, and model variable validation evaluation. Vibration datapreprocessed through a data acquisition system configured on the MCM PC are applied to amachine learning algorithm configured on the cloud. A rather high initial installation cost isrequired to configure the proposed system. The cost for storing and calculating data in thecloud environment is added. Besides, proposed systems cannot give feedback to each otherbecause of differences in the Monitoring and Diagnosis systems operating environments.However, machine learning analysis can use multivariate analysis to calculate relationshipsbetween variables that are more complex than conventional statistical process controlmethods. Machine learning learned from accumulated data can show very high analyticalresults for multivariate data. In particular, higher diagnostic accuracy can be expected if analgorithm optimized for the acquired data is found among various algorithms. The clouddiagnosis system utilizes IIoT equipment data to optimize PM.
Vibration data obtained from the vacuum pump were used to test the diagnosticsystem. In the AA200W connected to a 300 mm ICP type etching chamber, it is not easy toacquire error data due to by-products. Therefore, the abnormal data extracted from normaldata were used for temporary classification accuracy evaluation. Anomalous labels wereselected using an isolated forest algorithm with a contamination value of 10%. Figure 6

Electronics 2022, 11, 375 9 of 18
shows a t-Stochastic Neighbor Embedding (t-SNE) graph that visualizes multivariate datain three-dimensional form to express the outlier distribution results.
Electronics 2022, 11, x FOR PEER REVIEW 9 of 18
Vibration data obtained from the vacuum pump were used to test the diagnostic sys-
tem. In the AA200W connected to a 300 mm ICP type etching chamber, it is not easy to
acquire error data due to by-products. Therefore, the abnormal data extracted from nor-
mal data were used for temporary classification accuracy evaluation. Anomalous labels
were selected using an isolated forest algorithm with a contamination value of 10%. Figure
6 shows a t-Stochastic Neighbor Embedding (t-SNE) graph that visualizes multivariate
data in three-dimensional form to express the outlier distribution results.
Figure 5. Dry pump vibration data monitoring system.
Figure 6. t-SNE graph in an etching environment.
Various data processing algorithms can be selected from the established dashboard
based on high classification accuracy when using the acquired data. Due to the recently
increased study of machine learning, eight machine learning algorithms were tested. The
Figure 5. Dry pump vibration data monitoring system.
Electronics 2022, 11, x FOR PEER REVIEW 9 of 18
Vibration data obtained from the vacuum pump were used to test the diagnostic sys-
tem. In the AA200W connected to a 300 mm ICP type etching chamber, it is not easy to
acquire error data due to by-products. Therefore, the abnormal data extracted from nor-
mal data were used for temporary classification accuracy evaluation. Anomalous labels
were selected using an isolated forest algorithm with a contamination value of 10%. Figure
6 shows a t-Stochastic Neighbor Embedding (t-SNE) graph that visualizes multivariate
data in three-dimensional form to express the outlier distribution results.
Figure 5. Dry pump vibration data monitoring system.
Figure 6. t-SNE graph in an etching environment.
Various data processing algorithms can be selected from the established dashboard
based on high classification accuracy when using the acquired data. Due to the recently
increased study of machine learning, eight machine learning algorithms were tested. The
Figure 6. t-SNE graph in an etching environment.
Various data processing algorithms can be selected from the established dashboardbased on high classification accuracy when using the acquired data. Due to the recentlyincreased study of machine learning, eight machine learning algorithms were tested. TheSVM model using MinMaxScaler achieved the highest classification accuracy. Classificationaccuracy alone cannot be evaluated by modeling errors of the algorithms; multi-faceted

Electronics 2022, 11, 375 10 of 18
model performance evaluation is essential. Therefore, we employ more categories ofperformance evaluation, as shown in Table 1. We observed that the Balanced_Accurancyof all models is quite low, whereas other criteria are moderately accepted. The result ofthe confusion matrix in Figure 7 explains the low Balanced_Accurancy, and it falls intothe data imbalance problem in machinery malfunction diagnosis. Suppose the equipmentmalfunction dataset can be compared to the number of nominal data available from themanufacturing site. In that case, we believe that the suggested methodology will workbetter for equipment diagnosis in real-time.
Table 1. Etching environment algorithm performance evaluation.
Experiment Condition Accuracy BalancedAccuracy F1_Score
RecallScoreMicro
Log_Loss
MinMaxScaler, SVM 0.918 0.672 0.918 0.918 0.217StackEnsemble 0.916 0.661 0.916 0.916 0.222
RobustScaler, SVM 0.909 0.609 0.909 0.909 0.235MaxAbsScaler, LightGBM 0.907 0.552 0.907 0.907 0.250StandardScalerWrapper,
LightGBM 0.908 0.563 0.908 0.908 0.248
SparseNormalizer,XGBoostClassifier 0.906 0.570 0.906 0.906 0.354
Electronics 2022, 11, x FOR PEER REVIEW 10 of 18
SVM model using MinMaxScaler achieved the highest classification accuracy. Classifica-
tion accuracy alone cannot be evaluated by modeling errors of the algorithms; multi-fac-
eted model performance evaluation is essential. Therefore, we employ more categories of
performance evaluation, as shown in Table 1. We observed that the Balanced_Accurancy
of all models is quite low, whereas other criteria are moderately accepted. The result of
the confusion matrix in Figure 7 explains the low Balanced_Accurancy, and it falls into
the data imbalance problem in machinery malfunction diagnosis. Suppose the equipment
malfunction dataset can be compared to the number of nominal data available from the
manufacturing site. In that case, we believe that the suggested methodology will work
better for equipment diagnosis in real-time.
Table 1. Etching environment algorithm performance evaluation.
Experiment Condition Accuracy Balanced
Accuracy F1_Score
Recall
Score
Micro
Log_Loss
MinMaxScaler, SVM 0.918 0.672 0.918 0.918 0.217
StackEnsemble 0.916 0.661 0.916 0.916 0.222
RobustScaler, SVM 0.909 0.609 0.909 0.909 0.235
MaxAbsScaler, LightGBM 0.907 0.552 0.907 0.907 0.250
StandardScalerWrapper,
LightGBM 0.908 0.563 0.908 0.908 0.248
SparseNormalizer,
XGBoostClassifier 0.906 0.570 0.906 0.906 0.354
Figure 7. MinMaxScaler.SVM confusion matrix.
Based on the above study, vibration analysis was conducted to evaluate whether the
TiN deposition affects the performance of the pump. Vibration data to be used for analysis
was acquired in an environment where TiN can be deposited inside a dry pump connected
by supplying NH3, N2, and TiCl4 gases to a temporary chamber manufactured by simulat-
ing the ALD equipment. The location of the sensor for the acquisition was the same. The
acquired data were stored as a database through MCM. The data acquisition period took
two months, and the data acquired at the first and last moments were classified as normal
and abnormal, respectively. Figure 8 shows the distribution of pump vibration data ob-
tained from the deposition process as a t-SNE graph. It was confirmed that normal and
abnormal data were classified to some extent on the graph.
Figure 7. MinMaxScaler.SVM confusion matrix.
Based on the above study, vibration analysis was conducted to evaluate whetherthe TiN deposition affects the performance of the pump. Vibration data to be used foranalysis was acquired in an environment where TiN can be deposited inside a dry pumpconnected by supplying NH3, N2, and TiCl4 gases to a temporary chamber manufacturedby simulating the ALD equipment. The location of the sensor for the acquisition was thesame. The acquired data were stored as a database through MCM. The data acquisitionperiod took two months, and the data acquired at the first and last moments were classifiedas normal and abnormal, respectively. Figure 8 shows the distribution of pump vibrationdata obtained from the deposition process as a t-SNE graph. It was confirmed that normaland abnormal data were classified to some extent on the graph.

Electronics 2022, 11, 375 11 of 18Electronics 2022, 11, x FOR PEER REVIEW 11 of 18
Figure 8. T-SNE graph in ALD environment.
The obtained vibration data were preprocessed for analysis, and a classification al-
gorithm was applied and evaluated through Azure. As a result of the evaluation, the ac-
curacy of all algorithms was calculated as 100%. Table 2 presents six algorithms selected
among the algorithms applied by Azure. All algorithms classified abnormal data with
100% accuracy. Algorithm ranking is listed as a log loss parameter, but there is no signif-
icant difference because all values converge to 0. To prevent class imbalance in the training
process, a dataset with a ratio of outliers to normal observations of 5:5 was used. Figure 9
shows that the MinMaxScalerRandomForest confusion matrix has no imbalance in the
data and no misclassification in the analysis process. Figure 10a shows that the local fea-
ture importance graph can check the value at the time point with the greatest importance
being among one variable in the overall learning. Figure 10b shows the affected feature to
model prediction list, showing all variables in the order of the highest feature importance
in the algorithm learning process. The key features found by analyzing the two results
indicate which variables to focus on in the subsequent algorithm development process.
Table 2. ALD environment algorithm performance evaluation.
Experiment Condition Accuracy Balanced
Accuracy F1_Score
Recall
Score
Micro
Log_Loss
MinMaxScaler, RandomForest 1.000 1.000 1.000 1.000 0.0000005
StandardScalerWrapper,
RandomForest 1.000 1.000 1.000 1.000 0.00001
SparseNormalizer,
XGBoostClassifier 1.000 1.000 1.000 1.000 0.00004
MaxAbsScaler, XGBoostClassifier 1.000 1.000 1.000 1.000 0.00005
MaxAbsScaler, LightGBM 1.000 1.000 1.000 1.000 0.0003
StandardScalerWrapper,
ExtremeRandomTrees 1.000 1.000 1.000 1.000 0.001
Figure 8. T-SNE graph in ALD environment.
The obtained vibration data were preprocessed for analysis, and a classification al-gorithm was applied and evaluated through Azure. As a result of the evaluation, theaccuracy of all algorithms was calculated as 100%. Table 2 presents six algorithms selectedamong the algorithms applied by Azure. All algorithms classified abnormal data with 100%accuracy. Algorithm ranking is listed as a log loss parameter, but there is no significantdifference because all values converge to 0. To prevent class imbalance in the trainingprocess, a dataset with a ratio of outliers to normal observations of 5:5 was used. Figure 9shows that the MinMaxScalerRandomForest confusion matrix has no imbalance in the dataand no misclassification in the analysis process. Figure 10a shows that the local featureimportance graph can check the value at the time point with the greatest importance beingamong one variable in the overall learning. Figure 10b shows the affected feature to modelprediction list, showing all variables in the order of the highest feature importance in thealgorithm learning process. The key features found by analyzing the two results indicatewhich variables to focus on in the subsequent algorithm development process.
Table 2. ALD environment algorithm performance evaluation.
Experiment Condition Accuracy BalancedAccuracy F1_Score
RecallScoreMicro
Log_Loss
MinMaxScaler, RandomForest 1.000 1.000 1.000 1.000 0.0000005StandardScalerWrapper,
RandomForest 1.000 1.000 1.000 1.000 0.00001
SparseNormalizer,XGBoostClassifier 1.000 1.000 1.000 1.000 0.00004
MaxAbsScaler,XGBoostClassifier 1.000 1.000 1.000 1.000 0.00005
MaxAbsScaler, LightGBM 1.000 1.000 1.000 1.000 0.0003StandardScalerWrapper,ExtremeRandomTrees 1.000 1.000 1.000 1.000 0.001

Electronics 2022, 11, 375 12 of 18Electronics 2022, 11, x FOR PEER REVIEW 12 of 18
Figure 9. MinMaxScalerRandomForest confusion matrix.
Figure 10. Model variable validation evaluation process; (a) local feature importance graph and (b)
affected feature to model prediction list.
5. Conclusions
This paper introduced a system to monitor and analyze pump failure as a by-product
of semiconductors generated in CVD in the ALD process. The monitoring system acquires
and accumulates vibration data generated by the vibration pump when semiconductor
by-products accumulate. In addition, the process operator can intuitively evaluate the in-
ternal state of the pump in real time. The system of this paper, which adds the ML analysis
environment, performs multivariate analysis using all significant frequency bands as var-
iables. Multivariate analysis algorithm has higher classification accuracy and result recall
than single-variable analysis.
As a result of applying the vacuum pump vibration change amount to the data diag-
nostic system in the ALD process environment, the top six algorithms showed high clas-
sification accuracy. This paper introduced a system to monitor and analyze pump failure
as a by-product of semiconductors generated in CVD during ALD. Since the abnormal
state of the vibration data is accumulated and recorded, it is expected that it will be easy
to prepare an analysis report through this. Additionally, the Azure cloud platform, to
which a machine learning algorithm is applied, can detect data-based outliers using accu-
mulated vibration data. Since it is based on multivariate analysis, it is expected to detect
Figure 9. MinMaxScalerRandomForest confusion matrix.
Electronics 2022, 11, x FOR PEER REVIEW 12 of 18
Figure 9. MinMaxScalerRandomForest confusion matrix.
Figure 10. Model variable validation evaluation process; (a) local feature importance graph and (b)
affected feature to model prediction list.
5. Conclusions
This paper introduced a system to monitor and analyze pump failure as a by-product
of semiconductors generated in CVD in the ALD process. The monitoring system acquires
and accumulates vibration data generated by the vibration pump when semiconductor
by-products accumulate. In addition, the process operator can intuitively evaluate the in-
ternal state of the pump in real time. The system of this paper, which adds the ML analysis
environment, performs multivariate analysis using all significant frequency bands as var-
iables. Multivariate analysis algorithm has higher classification accuracy and result recall
than single-variable analysis.
As a result of applying the vacuum pump vibration change amount to the data diag-
nostic system in the ALD process environment, the top six algorithms showed high clas-
sification accuracy. This paper introduced a system to monitor and analyze pump failure
as a by-product of semiconductors generated in CVD during ALD. Since the abnormal
state of the vibration data is accumulated and recorded, it is expected that it will be easy
to prepare an analysis report through this. Additionally, the Azure cloud platform, to
which a machine learning algorithm is applied, can detect data-based outliers using accu-
mulated vibration data. Since it is based on multivariate analysis, it is expected to detect
Figure 10. Model variable validation evaluation process; (a) local feature importance graph and(b) affected feature to model prediction list.
5. Conclusions
This paper introduced a system to monitor and analyze pump failure as a by-productof semiconductors generated in CVD in the ALD process. The monitoring system acquiresand accumulates vibration data generated by the vibration pump when semiconductorby-products accumulate. In addition, the process operator can intuitively evaluate theinternal state of the pump in real time. The system of this paper, which adds the MLanalysis environment, performs multivariate analysis using all significant frequency bandsas variables. Multivariate analysis algorithm has higher classification accuracy and resultrecall than single-variable analysis.
As a result of applying the vacuum pump vibration change amount to the datadiagnostic system in the ALD process environment, the top six algorithms showed highclassification accuracy. This paper introduced a system to monitor and analyze pump failureas a by-product of semiconductors generated in CVD during ALD. Since the abnormalstate of the vibration data is accumulated and recorded, it is expected that it will be easy toprepare an analysis report through this. Additionally, the Azure cloud platform, to which amachine learning algorithm is applied, can detect data-based outliers using accumulatedvibration data. Since it is based on multivariate analysis, it is expected to detect morevarious types of anomalies. If this is applied in an environment close to mass productionfor a longer period, it is expected that an outlier detection system with higher reliabilitycan be constructed.

Electronics 2022, 11, 375 13 of 18
Author Contributions: Conceptualization, principal investigation and supervision, funding acqui-sition, writing—review and editing, S.J.H.; methodology, visualization, data curation, writing—original draft preparation, Y.L. and C.K. All authors have read and agreed to the published version ofthe manuscript.
Funding: This work was supported by the Korean Ministry of Trade, Industry and Energy (MOTIE)via Advanced Institute of Convergence Technology (GID: AICT 006-T1), and Korea Institute forAdvancement of Technology (KIAT) grant funded by Korea Government(MOTIE). (P0008458, TheCompetency Development Program for Industry Specialist).
Acknowledgments: Authors are grateful to Advantech Korea for their technical support on Wise-PaaS, and Staff of Semiconductor Process Diagnosis Research Center.
Conflicts of Interest: The authors declare no conflict of interest.
Appendix A
Algorithm A1 SVM Pseudo-Code
1: Input: parameters:2: out = array of SVM outputs3: target = array of booleans: is ith example a positive example?4: prior1 = number of positive examples5: prior0 = number of negative examples6: Output: Parameters of sigmoid7: A = 08: B = log((prior0 + 1)/(prior1 + 1))9: log((prior0 + 1)/(prior1 + 1))
10: hiTarget = (prior1 + 1)/(prior1 + 2)11: loTarget = 1/(prior0 + 2)12: lambda = 1e−3
13: olderr = 1e300
14: pp = temp array to store current estimate of probability of examples15: set all pp array elements to (prior1 + 1)/(prior0 + prior1 + 2)16: count = 017: for it = 1 to 10018: a = 0, b = 0, c = 0, d = 0, e = 019: //First, compute Hessian & gradient of error function20: //with respect ro A & B21: for i = 1 to len {22: if (target[i])23: t = hiTarget24: Else25: t = loTarget26: d1 = pp[i] − t27: d2 = pp[i]∗(1 − pp[i])28: a + = out[i]∗out[i]∗d229: b + = d230: c + = out[i]∗d231: d + = out[i]∗d132: e + = d133: //If gradient is really tiny, then stop34: if (abs(d) < 1e−9 && abs(e) < 1e−9)35: Break36: oldA = A37: oldB = B38: err = 039: //Loop until goodness of fit increases40: while (1) {

Electronics 2022, 11, 375 14 of 18
41: det = (a + lambda)∗(b + lambda) − c∗c42: if (det == 0) {//if determinant of Hessian is zero,43: //increase stabilizer44: lambda∗ = 1045: Continue46: }47: A = oldA + ((b+lambda)∗d − c∗e)/det48: B = oldB + ((a + lambda)∗e − c∗d)/det49: //Now, compute the goodness of fit51: for i = 1 to len {52: p = 1/(1 + exp(out[i]∗A + B ))53: pp[i] = p54: //At this step, make sure log(0) returns -20055: err − = t∗log(p) + (1 − t)∗log(1 − p)56: }57: if (err < olderr∗(1 + 1e − 7)) {58: lambda∗ = 0.159: Break60: }61: //error did not decrease: increase stabilizer by factor of 1062: //& try again63: lambda∗ = 1064: if (lambda ≥ 1e6)//something is broken, Give up65: Break66: }67: diff = err-older68: scale = 0.5∗(err + olderr + 1)69: if (dif f > − 1e − 3∗ scale&&dif f < 1e − 7∗scale)70: count ++71: Else72: count = 073: older = err74: if (count == 3)75: Break76: }
Algorithm A2 Stacked Ensemble Classifier Pseudo-Code
1: Input: Dataset D = {(x1,y1),(x2,y2),· · · ,(xm,ym)};2: Base-classifier f 1 = RF1, f 2 = RF2, f 3 = ET1, f 4 = ET23: For t = 1,· · · ,4;4: Train the base-classifiers in the first stage5: ht = f t(D);6: End7: For i = 1,2,· · · ,m:8: for t = 1,· · · ,4:9: Generate new feature vector for each sample
10: zit = ht(xi);11: End12: D′ = D′∪((zi1,· · · ,zi4),yi);13: End14: Train the meta-classifier in the second stage15: h′ = f (D′);16: Output: H(x) = h′(h1(x), . . . ,h4(x))

Electronics 2022, 11, 375 15 of 18
Algorithm A3 LightGBM Pseudo-Code
1: Input: I: training data, d: max depth2: Input: m: feature dimension3: nodeSet←{0}.ree nodes in current level4: rowSet← {{0, 1, 2, . . . }} . data indices in tree nodes5: for i = 1 toddo6: for node in nodeSet do7: usedRows←rowSet[node]8: fork = 1 tomdo9: H← new Histogram()
10: . Build histogram11: forjinusedRowsdo12: bin← I.f[k][j].bin13: H [bin].y H [bin].y + I.y[j]14: H [bin].n H [bin].n + 115: Find the best split on histogram H.16: . . .17: Update rowSet and nodeSet according to the best split points.18: . . .19: Input: I: training data, d: iterations20: Input: a: sampling ratio of large gradient data21: Input: b: sampling ratio of small gradient data22: Input: loss: loss function, L: weak learner23: models← { }, fact← (1−a)/b24: topN←a × len(I),randN← b ×len(I)25: for i = 1 toddo26: preds←models.predict(I)27: g←loss(I, preds), w← {1,1, . . . }28: sorted← GetSortedIndices(abs(g))29: topSet← sorted [1:topN]30: randSet← RandomPick(sorted[topN:len(I)], randN)31: usedSet← topSet + randSet32: w[randSet] × = fact . Assign weight f act to the small gradient data.33: newModel← L(I [usedSet],− g[usedSet], w[usedSet])34: models.append(newModel)
Algorithm A4 XGboost Pseudo-Code
1: Input: I, instance set of current node2: Input: d, feature dimension3: gain← 04: G ← ∑i∈I gi, H ← ∑i∈I hi5: for q = 1 to Q do:6: GL←0,HL←07: for jinsorted (I, byxjq) do8: GL← GL + gj, HL← HL + hj9: GR←G−GL, HR←H − HL
10: score ← max(
score, G2L
HL+λ +G2
RHR+λ −
G2
H+λ )
11: End for12: End for13: Output: Split with max score

Electronics 2022, 11, 375 16 of 18
Algorithm A5 Random Forest Pseudo-Code
1: Require: IDT(a decision tree inducer),2: T(the number of iterations), S (the training set),3: µ (the subsample size), N (number of attributes used in each node)4: Ensure: Mt;t = 1, . . . ,T5: t← 26: Repeat7: St← Sample µ instances from S with replacement8: Build classifier Mt using IDT(N) on St9: t ++
10: until t > T
Algorithm A6 Extra-Trees Splitting Algorithm Pseudo-Code
1: Split_a_node(S)2: Input: the local learning subset S corresponding to the node we want to split3: Output a split [a < ac] or nothing4: If Stop_split(S) is TRUE then return nothing5: Otherwise select Kattributes {a1, . . . aK}6: among all non constant (in S) candidate attributes;7: Draw Ksplits {s1, . . . sK}, where si = Pick_a_random_split(S, ai), ∀i = 1, . . . K;8: Return a split s∗ such that Score(s∗, S) = maxi=1, . . . ,K Score(si, S).9:
10: Pick_a_random_split(S,a)11: Inputs: a subset S and an attribute a12: Output: a split13: Let aS
min and aSmax denote the maximal and minimal value of a in S;
13: Let aSmin and aS
max denote the maximal and minimal value of a in S;14: Draw a random cut-point acuniformly in
[aS
min, aSmax ];
15: Return the split [a < ac].16:17: Stop_split(S)18: Input: a subset S19: Output: a Boolean20: If |S | < nmin, then return TRUE;21: If all attributes are constant in S, then return TRUE;22: If the output is constant in S, then return TRUE;23: Otherwise, return FALSE.
References1. Antao, L.; Pinto, R.; Reis, J.; Goncalves, G. Requirements for Testing and Validating the Industrial Internet of Things. In
Proceedings of the 2018 IEEE International Conference on Software Testing, Verification and Validation Workshops (ICSTW),Västerås, Sweden, 9–13 April 2018; pp. 110–115. [CrossRef]
2. Serpanos, D.; Wolf, M. Internet-of-Things (IoT) Systems; Springer: Berlin/Heidelberg, Germany, 2018; pp. 37–54. [CrossRef]3. Chen, Y.; Lee, G.M.; Shu, L.; Crespi, N. Industrial Internet of Things-Based Collaborative Sensing Intelligence: Framework and
Research Challenges. Sensors 2016, 16, 215. [CrossRef] [PubMed]4. Sisinni, E.; Saifullah, A.; Han, S.; Jennehag, U.; Gidlund, M. Industrial Internet of Things: Challenges, Opportunities, and
Directions. IEEE Trans. Ind. Inform. 2018, 14, 4724–4734. [CrossRef]5. Civerchia, F.; Bocchino, S.; Salvadori, C.; Rossi, E.; Maggiani, L.; Petracca, M. Industrial Internet of Things monitoring solution for
advanced predictive maintenance applications. J. Ind. Inf. Integr. 2017, 7, 4–12. [CrossRef]6. Razmi-Farooji, A.; Kropsu-Vehkaperä, H.; Härkönen, J.; Haapasalo, H. Advantages and potential challenges of data management
in e-maintenance. J. Qual. Maint. Eng. 2019, 25, 378–396. [CrossRef]7. Lade, P.; Ghosh, R.; Srinivasan, S. Manufacturing Analytics and Industrial Internet of Things. IEEE Intell. Syst. 2017, 32, 74–79.
[CrossRef]8. Hong, S.J.; Lim, W.Y.; Cheong, T.; May, G.S. Fault Detection and Classification in Plasma Etch Equipment for Semiconductor
Manufacturing e-Diagnostics. IEEE Trans. Semicond. Manuf. 2011, 25, 83–93. [CrossRef]

Electronics 2022, 11, 375 17 of 18
9. Boyes, H.; Hallaq, B.; Cunningham, J.; Watson, T. The industrial internet of things (IIoT): An analysis framework. Comput. Ind.2018, 101, 1–12. [CrossRef]
10. Suh, Y.J.; Choi, J.Y. Efficient Fab facility layout with spine structure using genetic algorithm under various material-handlingconsiderations. Int. J. Prod. Res. 2021, 1–14. [CrossRef]
11. Kumar, A.; Bhattacharjee, N.; Patel, B.; Laloë, J.-B.; Famodu, O.O.; Ferain, L. Stratege for Reducing Particle Defects in Ti and TiNThin-Film Deposition Process. IEEE Trans. Semi. Manufac. 2018, 32, 48–53. [CrossRef]
12. Jones, C.P. Thin Film Processes: Abatement of Waste Gases from Plasma Assisted Material Processes. In Proceedings of the 2020China Semiconductor Technology International Conference (CSTIC), Shanghai, China, 26 June–17 July 2020; pp. 1–3. [CrossRef]
13. Lessard, P.A. Dry vacuum pumps for semiconductor processes: Guidelines for primary pump selection. J. Vac. Sci. Technol. A2000, 18, 1777–1781. [CrossRef]
14. Zhan, H.; Li, N.; Wang, Y.; Wang, X.; Lin, S. Fault Diagnosis Method for Vacuum Pump of Space Environment Simulator. InProceedings of the 2016 IEEE 11th Conference on Industrial Electronics and Applications (ICIEA), Hefei, China, 5–7 June 2016; pp.1703–1707. [CrossRef]
15. Ainapure, A.; Li, X.; Singh, J.; Yang, Q.; Lee, J. Deep Learning-Based Cross-Machine Health Identification Method for VacuumPumps with Domain Adaptation. Procedia Manuf. 2020, 48, 1088–1093. [CrossRef]
16. Rui, X.; Liu, J.; Li, Y.; Qi, L.; Li, G. Research on fault diagnosis and state assessment of vacuum pump based on acoustic emissionsensors. Rev. Sci. Instrum. 2020, 91, 025107. [CrossRef]
17. LaRose, J.; Barker, J.; Finlay, B.; Trinidad, A.; Guyer, C.; Weinstein, J.; Conerney, B.; Ray, D.; Perry, J.; Tarnawskyj, W.; et al.Predictive Maintenance of Pump and Abatement Equipment in a 300mm Semiconductor Fab. In Proceedings of the 2021 32ndAnnual SEMI Advanced Semiconductor Manufacturing Conference (ASMC), Milpitas, CA, USA, 10–12 May 2021; pp. 1–4.[CrossRef]
18. Jiang, W.; Spurgeon, S.K.; Twiddle, J.A.; Schlindwein, F.S.; Feng, Y.; Thanagasundram, S. A wavelet cluster-based band-passfiltering and envelope demodulation approach with application to fault diagnosis in a dry vacuum pump. Proc. Inst. Mech. Eng.Part C J. Mech. Eng. Sci. 2007, 221, 1279–1286. [CrossRef]
19. Twiddle, J.A.; Jones, N.B.; Spurgeon, S.K. Fuzzy model-based condition monitoring of a dry vacuum pump via time and frequencyanalysis of the exhaust pressure signal. Proc. Inst. Mech. Eng. Part C J. Mech. Eng. Sci. 2008, 222, 287–293. [CrossRef]
20. Butler, S.W.; Ringwood, J.V.; MacGearailt, N. Prediction of Vacuum Pump Degradation in Semiconductor Processing. IFAC Proc.Vol. 2009, 42, 1635–1640. [CrossRef]
21. Hsieh, F.-C.; Chou, S.-C.; Lin, P.-H.; Chang, S.-W.; Chen, F.-Z.; Liao, T.-S.; Liu, D.-R.; Chiang, D. Monitoring on dry vacuum pumpcharacteristics by mobile device. In Proceedings of the 2012 IEEE International Instrumentation and Measurement TechnologyConference Proceedings, Graz, Austria, 13–16 May 2012; pp. 2444–2447. [CrossRef]
22. Qiu, G.Q.; Gu, Y.K.; Chen, J.J. Selective health indicator for bearings ensemble remaining useful life prediction with geneticalgorithm and Weibull proportional hazards model. Measurement 2020, 150, 107097. [CrossRef]
23. Lee, K.; Song, D.; Lee, J.; Lee, C.-G.; Shin, G.-A.; Jung, S. Evaluating effectiveness of dust by-product treatment with scrubbers tomitigate explosion risk in ZrO2 atomic layer deposition process. J. Hazard. Mater. 2020, 400, 123284. [CrossRef]
24. Bhatti, M.A.; Riaz, R.; Rizvi, S.S.; Shokat, S.; Riaz, F.; Kwon, S.J. Outlier detection in indoor localization and Internet of Things(IoT) using machine learning. J. Commun. Netw. 2020, 22, 236–243. [CrossRef]
25. Kim, D.H.; Choi, J.E.; Ha, T.M.; Hong, S.J. Modeling with Thin Film Thickness using Machine Learning. J. Semicond. Disp.Technol. 2019, 18, 48–52. Available online: https://www.koreascience.or.kr/article/JAKO201919761177833.page (accessed on 6October 2021).
26. Puggini, L.; McLoone, S. An enhanced variable selection and Isolation Forest based methodology for anomaly detection withOES data. Eng. Appl. Artif. Intell. 2018, 67, 126–135. [CrossRef]
27. Shukla, S.; Meghana, K.M.; Manjunatrh, C.R.; Santosh, N. Comparison of Wireless Network over Wired Network and its Type.Int. J. Res. -Granthaalayah 2017, 5, 14–20. [CrossRef]
28. Bailey, C.; Hutchison, K.; Wilders, M. Vacuum Systems for ALD. Solid State Technol. 2006, 49, 30–33.29. Hur, M.; Lee, J.; Yoo, H.; Kang, W.; Song, Y.; Kim, D.; Lee, S. Reduction of byproduct particle size using low-pressure plasmas
generated by a cylindrical-shaped electrode. Vacuum 2012, 86, 1834–1839. [CrossRef]30. ISO 18436-2: 2014 Condition Monitoring and Diagnostics of Machines—Requirements for Qualification and Assessment of
Personnel—Part 2: Vibration Condition Monitoring and Diagnostics. Available online: https://www.iso.org/standard/50447.html (accessed on 6 October 2021).
31. Liu, F.T.; Ting, K.M.; Zhou, Z.-H. Isolation Forest. In Proceedings of the 2008 Eighth IEEE International Conference on DataMining, Pisa, Italy, 15–19 December 2008; pp. 413–422. [CrossRef]
32. Vishwakarma, M.; Purohit, R.; Harshlata, V.; Rajput, P. Vibration Analysis & Condition Monitoring for Rotating Machines: AReview. Mater. Today Proc. 2017, 4, 2659–2664. [CrossRef]
33. John, C.P. Probabilistic Outputs for Support Vector Machines and Comparisons to Regularized Likelihood Methods. Adv. LargeMargin Classif. 1999, 10, 61–74. Available online: https://citeseerx.ist.psu.edu/viewdoc/versions?doi=10.1.1.41.1639 (accessed on6 October 2021).

Electronics 2022, 11, 375 18 of 18
34. Chen, C.; Zhang, Q.; Yu, B.; Yu, Z.; Skillman-Lawrence, P.; Ma, Q.; Zhang, Y. Improving protein-protein interactions predictionaccuracy using XGBoost feature selection and stacked ensemble classifier. Comput. Biol. Med. 2020, 123, 103899. [CrossRef][PubMed]
35. Ke, G.; Meng, Q.; Finley, T.; Wang, T.; Chen, W.; Ma, W.; Ye, Q.; Liu, T.-Y. LightGBM: A Highly Efficient Gradient BoostingDecision Tree. Adv. Neural Inf. Processing Syst. 2017, 30, 3146–3154. Available online: https://proceedings.neurips.cc/paper/2017/hash/6449f44a102fde848669bdd9eb6b76fa-Abstract.html (accessed on 6 October 2021).
36. Zhang, W.; Zhao, X.; Li, Z. A Comprehensive Study of Smartphone-Based Indoor Activity Recognition via Xgboost. IEEE Access2019, 7, 80027–80042. [CrossRef]
37. Lior, R. Ensemble-Based Classifiers. Artif. Intell. Rev. 2010, 33, 1–39. [CrossRef]38. Geurts, P.; Ernst, D.; Wehenkel, L. Extremely randomized trees. Mach. Learn. 2006, 63, 3–42. [CrossRef]
Copyright © 2022 FDOKUMEN