Individualizing Student Instruction Precisely: Effects of Child × Instruction Interactions on First...
37
Individualizing Student Instruction Precisely: Effects of Child by Instruction Interactions on First Graders’ Literacy Development Carol McDonald Connor, Shayne B. Piasta, Barry Fishman, Stephanie Glasney, Christopher Schatschneider, Elizabeth Crowe, Phyllis Underwood, and Frederick J. Morrison Abstract Recent findings demonstrate that the most effective reading instruction may vary with children’s language and literacy skills. These child X instruction interactions imply that individualizing instruction would be a potent strategy for improving students’ literacy. A cluster-randomized control field trial, conducted in 10 high-moderate poverty schools, examined effects of individualizing literacy instruction. The instruction each first grader received (n=461 in 47 classrooms, mean age = 6.7 years), fall, winter and spring, was recorded. Comparing intervention- recommended amounts of instruction with observed amounts revealed that intervention teachers individualized instruction more precisely than did comparison teachers. Importantly, the more precisely children received recommended amounts of instruction, the stronger was their literacy skill growth. Results provide strong evidence of child X instruction interaction effects on literacy outcomes. Too many children in America fail to achieve proficient reading skills and the rate is particularly troubling, close to 60%, for children living in poverty and who belong to underrepresented minorities (NAEP, 2005). Whereas multiple factors can affect children’s literacy development including home, parenting, parent educational levels, preschool, community resources, as well as formal schooling (Connor, Son, Hindman, & Morrison, 2005; NICHD-ECCRN, 2004), classroom instruction is one of the most important sources of influence. Further, one reason children fail to achieve proficient reading skills is because they do not receive appropriate amounts of particular types of literacy instruction during the primary grades. Early literacy instruction that is balanced between phonics and more meaningful reading experiences has been shown to be more effective than instruction that focuses on one to the exclusion of the other (Mathes, Denton, Fletcher, Anthony, Francis, & Schatschneider, 2005; Xue & Meisels, 2004). Moreover, the impact of any particular instructional strategy may depend on the language and literacy skills children bring to the classroom. In other words, there are child characteristic-by-instruction interactions (child X instruction interactions; Connor, Morrison, & Katch, 2004a; Foorman, Francis, Fletcher, Schatschneider, & Mehta, 1998; Juel & Minden-Cupp, 2000). By implication, these findings point to the potential importance of individualizing (or personalizing or differentiating) instruction based on the child’s entering skill levels. To date, although child X instruction interactions have emerged across grades and outcomes (Al Otaiba, Connor, Kosanovich, Schatschneider, Dyrlund, & Lane, 2008; Connor, Jakobsons, Crowe, & Meadows, in press; Foorman, Schatschneider, Eakin, Fletcher, Moats, & Francis, 2006), these studies have been predominantly descriptive and correlational. Contact: Carol McDonald Connor, [email protected]. NIH Public Access Author Manuscript Child Dev. Author manuscript; available in PMC 2010 January 1. Published in final edited form as: Child Dev. 2009 ; 80(1): 77–100. doi:10.1111/j.1467-8624.2008.01247.x. NIH-PA Author Manuscript NIH-PA Author Manuscript NIH-PA Author Manuscript
-
Upload
independent -
Category
Documents
-
view
0 -
download
0
Transcript of Individualizing Student Instruction Precisely: Effects of Child × Instruction Interactions on First...

Individualizing Student Instruction Precisely: Effects of Child byInstruction Interactions on First Graders’ Literacy Development
Carol McDonald Connor, Shayne B. Piasta, Barry Fishman, Stephanie Glasney,Christopher Schatschneider, Elizabeth Crowe, Phyllis Underwood, and Frederick J.Morrison
AbstractRecent findings demonstrate that the most effective reading instruction may vary with children’slanguage and literacy skills. These child X instruction interactions imply that individualizinginstruction would be a potent strategy for improving students’ literacy. A cluster-randomizedcontrol field trial, conducted in 10 high-moderate poverty schools, examined effects ofindividualizing literacy instruction. The instruction each first grader received (n=461 in 47classrooms, mean age = 6.7 years), fall, winter and spring, was recorded. Comparing intervention-recommended amounts of instruction with observed amounts revealed that intervention teachersindividualized instruction more precisely than did comparison teachers. Importantly, the moreprecisely children received recommended amounts of instruction, the stronger was their literacyskill growth. Results provide strong evidence of child X instruction interaction effects on literacyoutcomes.
Too many children in America fail to achieve proficient reading skills and the rate isparticularly troubling, close to 60%, for children living in poverty and who belong tounderrepresented minorities (NAEP, 2005). Whereas multiple factors can affect children’sliteracy development including home, parenting, parent educational levels, preschool,community resources, as well as formal schooling (Connor, Son, Hindman, & Morrison,2005; NICHD-ECCRN, 2004), classroom instruction is one of the most important sources ofinfluence. Further, one reason children fail to achieve proficient reading skills is becausethey do not receive appropriate amounts of particular types of literacy instruction during theprimary grades. Early literacy instruction that is balanced between phonics and moremeaningful reading experiences has been shown to be more effective than instruction thatfocuses on one to the exclusion of the other (Mathes, Denton, Fletcher, Anthony, Francis, &Schatschneider, 2005; Xue & Meisels, 2004).
Moreover, the impact of any particular instructional strategy may depend on the languageand literacy skills children bring to the classroom. In other words, there are childcharacteristic-by-instruction interactions (child X instruction interactions; Connor, Morrison,& Katch, 2004a; Foorman, Francis, Fletcher, Schatschneider, & Mehta, 1998; Juel &Minden-Cupp, 2000). By implication, these findings point to the potential importance ofindividualizing (or personalizing or differentiating) instruction based on the child’s enteringskill levels. To date, although child X instruction interactions have emerged across gradesand outcomes (Al Otaiba, Connor, Kosanovich, Schatschneider, Dyrlund, & Lane, 2008;Connor, Jakobsons, Crowe, & Meadows, in press; Foorman, Schatschneider, Eakin,Fletcher, Moats, & Francis, 2006), these studies have been predominantly descriptive andcorrelational.
Contact: Carol McDonald Connor, [email protected].
NIH Public AccessAuthor ManuscriptChild Dev. Author manuscript; available in PMC 2010 January 1.
Published in final edited form as:Child Dev. 2009 ; 80(1): 77–100. doi:10.1111/j.1467-8624.2008.01247.x.
NIH
-PA Author Manuscript
NIH
-PA Author Manuscript
NIH
-PA Author Manuscript

To evaluate the causal implications of child X instruction interactions, we conducted arandomized control field trial. Results showed a significant treatment effect for anintervention that individualized students’ instruction based on students’ vocabulary andreading skills, utilizing homogeneous student groupings and computer software support(Connor, Morrison, Fishman, Schatschneider, & Underwood, 2007a). The multi-facetednature of the intervention, however, left open questions regarding the specific role ofindividualizing instruction on students’ growth. Thus, the present study aims to disentanglethe effect of individualizing instruction from other sources of influence (e.g., teacherqualifications) by examining the precision with which teachers provided recommendedamounts and types of instruction and the effect of this instruction on first graders’ literacyskill growth.
Aptitude-by-Treatment InteractionsThe idea that the effect of instruction may depend on students’ abilities is not new. Duringthe late 1950s Cronbach introduced the theory of aptitude-by-treatment interactions (ATI)(Cronbach, 1957). Chall (1967) and Bond and Dykstra (1967) examined whether students’abilities were related to how they responded to various types of reading instruction.Researchers of the era generally identified five aptitude factors for which there was someindication of interaction effects (Bond & Dykstra, 1967; Lo, 1973). These includedintelligence, perceptual speed, spatial perception, listening skills, and learning rate. In Barr’s(1984) Reading Handbook chapter on primary reading, ATIs were carefully described andsupporting evidence cited. While promising, research examining the construct of ATIsproduced a paucity of sound experimental evidence (Bracht, 1970; Cronbach & Webb,1975; R. E. Snow, 1991). This was despite decades of dedicated research onindividualization. In an extensive review and meta-analysis of the education literature,Cronbach and Snow (1977) argued that there was only suggestive evidence of ATIs.Moreover, they questioned the studies’ methodologies and, when they could not replicatethe findings using more rigorous analytic strategies, noted:
…well-substantiated findings regarding ATI are scarce. Few investigations havebeen replicated. Many reports (of both positive and negative results) must bediscounted because of poor procedure (p. 6).
As a field, however, education has never fully abandoned the promise of child X instructioninteractions. Predictable differential responses to reading instruction strategies have thepotential, theoretically, of explaining why some children respond well to schooling whileothers fail and, most importantly, how we might support all children’s literacy development.Indeed, this notion is at the heart of “responsiveness to intervention” protocols (D. Fuchs,Mock, Morgan, & Young, 2003 2003). Now, with a better understanding of the specificcognitive and social mechanisms underlying the skill of reading (Rayner, Foorman, Perfetti,Pesetsky, & Seidenberg, 2001; C. E. Snow, Burns, & Griffin, 1998), the advent of moresophisticated analytic strategies, such as hierarchical linear modeling (Foorman et al., 2006;Raudenbush & Bryk, 2002; Raudenbush, Hong, & Rowan, 2002), and multidimensionalconceptualizations of instruction (Connor, Morrison, & Slominski, 2006a; Morrison,Bachman, & Connor, 2005 2005), correlational evidence on the nature of child X instructioninteractions is converging.
Child-by-instruction Interactions and Multiple Dimensions of InstructionIn an earlier study (Connor et al., 2004a), which provided the underlying models for thecurrent study, the specific type of instruction first graders received interacted with theirvocabulary and word-reading skills. Instruction was conceptualized across multipledimensions, hypothesizing that within a school day, teachers used many types of literacyinstruction even if their overall curriculum was whole language or more focused on basic
Connor et al. Page 2
Child Dev. Author manuscript; available in PMC 2010 January 1.
NIH
-PA Author Manuscript
NIH
-PA Author Manuscript
NIH
-PA Author Manuscript

reading skills (Marilyn Jager Adams, 1990; Chall, 1967). Indeed, this multiple dimensionalapproach to investigating classroom literacy instruction represented importantmethodological progress towards identifying child X instruction interactions.
Three dimensions of instruction, which operated simultaneously to define a given literacyactivity (see Table 1) were included: (1) code versus meaning-focused, where code-focusedinstruction focused explicitly on the task of decoding, such as relating phonemes to letters,learning to blend them to decode words, and included alphabet activities, phonologicalawareness, phonics, and letter and word fluency. Meaning-focus activities supportedstudents’ efforts to actively extract and construct meaning from text (C. E. Snow, 2001) andincluded reading aloud, reading independently, writing, language, vocabulary, andcomprehension strategies.
(2) The dimension of teacher/child- versus child-managed instruction captures who isresponsible for focusing the child’s attention on the learning activity at hand, the teacher andstudents jointly, or the child. Thus an activity where the teacher is actively interacting withchildren is considered teacher/child managed. Activities where children are working withpeers or independently are considered child managed.
(3) The dimension of change-over-time or slope accepts that particular instructionalstrategies may be more important for students at certain times of the year. For example, Jueland Minden-Cupp (2000) found that when one teacher provided greater amounts of teacher/child-managed code-focused instruction in the fall, and decreased the amount over theschool year, children with weaker reading skills made greater progress in her classroom thandid children with similar skills in a classroom where substantial amounts of code-focusedinstruction were provided all year long. When instruction is observed at least three timesduring the school year, the slope of change in minutes per month can be computed.
These dimensions operate simultaneously (see Table 1). For example, a teacher discussing abook with students would be a teacher/child-managed meaning-focused activity. If theteacher then asks the children to read the rest of the story in the library corner or with abuddy, the activity would become a child-managed meaning-focused activity. If the teacheris conducting phonological awareness instruction, this would be considered teacher/child-managed code-focused instruction (in contrast to the previous teacher/child-managedactivity, which was meaning focused). If the children are then given a phonics worksheet tocomplete at their desks, that activity is child-managed code-focused. The month of theschool year contributes to the decision about how much time is spent in specific types ofactivities for a specific child at a particular point in time.
The advantage of this multi-dimensional conceptualization is that the dynamic and complexinteractions among teachers and students surrounding reading instruction can be captured inmore detail than can be accomplished with global curriculum-level conceptualizations.Additional dimensions can be used to define literacy activities more precisely. For example,the current study also considers whether the activity is presented to the entire class, to asmaller group of children, or individually. Utilizing more dimensions provides greaterprecision in defining literacy activities. At the same time, however, adding dimensionscreates more literacy instruction variables to include in statistical models.
Connor, Morrison and Katch (2004a) found significant child X instruction interactions thatpredicted first graders’ word recognition skill growth (i.e., residualized change) noting thattotal amounts of teacher/child-managed meaning-focused and child-managed code-focusedinstruction did not significantly predict students’ word reading skills. It is these specificchild X instruction interactions that we sought to investigate in this study. First, childrenwith weaker fall word recognition skills made greater progress when they were in
Connor et al. Page 3
Child Dev. Author manuscript; available in PMC 2010 January 1.
NIH
-PA Author Manuscript
NIH
-PA Author Manuscript
NIH
-PA Author Manuscript

classrooms where teachers provided substantial amounts of teacher/child-managed code-focused instruction than did children with similar skills in classrooms where very littleteacher/child-managed code-focused instruction was observed (in the 2004 study, differentterminology was used). In contrast, children with strong fall word recognition skills madeless progress in classrooms where substantial amounts of teacher/child-managed code-focused instruction were observed while students with similar skills made greater progressin classrooms where less teacher/child-managed code-focused instruction was observed.
Additionally, children who started first grade with weaker vocabulary skills demonstratedgreater word recognition skill growth in classrooms where they received small amounts ofchild-managed meaning-focused instruction in the fall with steady increases in amount untilspring (i.e., change over time or slope). This is in contrast to children with similar skills whomade less progress when they were in classrooms that provided greater amounts of child-managed meaning-focused instruction consistently all year long. Yet, in the latterclassrooms, children with stronger fall vocabulary scores showed greater word recognitionskill growth than they did in classrooms with small amounts of child-managed meaning-focused instruction. Teacher/child-managed meaning-focused and child-managed code-focused instruction was not systematically associated with students’ word reading skillgrowth. Because these results were correlational, a cluster-randomized control field trial wasconducted (Connor et al., 2007a).
Assessing the Efficacy of Individualizing Student InstructionFor the cluster-randomized control field trial, schools were matched by percentage ofstudents qualifying for Free or Reduced Priced Lunch, Reading First status, and third gradereading scores on the state mandated achievement test (see Table 2). Then one of eachmatched school pair was randomly assigned to the Individualizing Student Instruction (ISI)intervention condition with the remaining school assigned to a wait-list control comparisoncondition. Teachers in the comparison group received the intervention training the followingschool year.
The intervention group received training and professional development on how toindividualize literacy instruction in the classroom using the recommendations and planningstrategies provided by Assessment-to-Instruction (A2i) web-based software. A2i softwareincorporated algorithms that recommended amounts and types of instruction based on theinteractions observed in earlier studies (Connor et al., in press; Connor et al., 2004a; Connor,Morrison, & Underwood, 2007b 2007; Morrison et al., 2005) and relied on themultidimensional instructional framework. In this manuscript, we use a shorthand to refer tothe instructional approaches: teacher/child-managed, code-focused instruction is TCM-CFand in formulae simply TCMCF; child-managed, code-focused instruction is CM-CF orCMCF, and so on.
The hierarchical linear models were able to predict children’s word reading skill growthwhen the month of the school year (from the slope in the models), amounts of instruction,and initial word reading and vocabulary skills were known (Morrison et al., 2005, 2005). Itis these equations that provided the foundation for the A2i algorithms. The mixed-modelequation, using grade equivalent (GE) as the metric rather than raw scores, is as follows,where Yij is the predicted spring reading outcome for child i in classroom j:
Yij = .05 + 1.1*fall reading + .01*fall Vocabulary + .05*TCMCF-A − .82*TCMCF-S −.15*CMMF-A + .7*CMMF-S −.04*fall reading*TCMCF + .01*fall Vocabulary*CMMF-A− .01*fall Vocabulary*CMMF-S + u0j + rij
Connor et al. Page 4
Child Dev. Author manuscript; available in PMC 2010 January 1.
NIH
-PA Author Manuscript
NIH
-PA Author Manuscript
NIH
-PA Author Manuscript

Essentially, the A2i algorithms use a pre-set Yij, which is the end of year target outcome, thechild’s assessed reading and vocabulary scores, and then solve for recommended amounts ofTCMCF and CMMF. TCMCF-A and CMMF-A are the amounts of TCMCF and CMMF inthe fall. TCMCF-S and CMMF-S represent the slope or change over time, which is changein amount of TCMCF or CMMF per month. TCMMF and CMCF were set based on meanamounts observed across studies. The algorithms were then refined using evidence fromother studies (Al Otaiba et al., 2008, in press; Connor et al., in press; Connor, Morrison, &Petrella, 2004b 2004; Connor et al., 2006a; Connor et al., 2007b) and tested in this study.
The A2i algorithms used in this investigation solve for TCM-CF and CM-MF recommendedamounts in a series of steps. Additionally, because the classroom teachers in the Connor etal., 2004 study provided relatively small amounts of TCM-CF, a minimum of 13 minutes ofTCM-CF was added to the equation based on research with other samples (Connor et al., inpress; Connor, Morrison, & Underwood, 2006b; Foorman et al., 2006).
The two steps to solve for amount of TMCF are:
1. TCMCF-A = ((Target Outcome or Yij − (.2*reading grade equivalent))/(.05 + (.05*reading grade equivalent))) + 13
2. TCMCF-Recommended = TCMCF-A − (.82*Month)
Thus, to compute recommended amounts of teacher/child-managed code-focusedinstruction, first the target outcome (the Yij of the original model) is set at either grade levelor a school year’s gain in skill using grade equivalent (GE) as the metric. For example, if thechild is reading at a GE level of 1.3 at the beginning of first grade, the target outcome is 2.2(1.3 + .9). If the child begins first grade with skills below grade level expectations (e.g., .5),the target is set at grade level (i.e., 1.9). Then the assessed reading score, in GEs, is enteredand the equations are solved. Month is centered at August, thus September is equal to 1,October is equal to 2 and so on. The value −.82 represents the slope. Therefore, therecommended amount of TCM-CF decreases each month by .82 minutes. The relationbetween reading score, month, and recommended amount of TCM-CF is non-linear. Thismeans that the recommended amount of TCM-CF goes up exponentially as children fallfarther behind grade level expectations.
The algorithms for CM-MF are provided in Appendix A. The relation between vocabularyAE and recommended CM-MF over time resembles a fan. The open end of the fan showsthe amounts of CM-MF for children with lower vocabulary scores (age equivalent [AE] =3.0 years). These amounts begin with small amounts per day and increase monthly (about 8minutes/month) until they reach about 40 minutes in the spring. The hinge of the fanrepresents the children with very high vocabulary scores for whom the algorithmsrecommend about 40 minutes of CM-MF per day all year long. Children whose vocabularyscores fall within more typical ranges start out the school year with relatively less CM-MFrecommended and the amounts increase until they too have a recommendation of about 40minutes/day of CM-MF in the spring.
Importantly, the recommended amounts fall on a continuum varying incrementally asstudents’ reading and vocabulary scores vary. For both TCM-CF and CM-MF, the patternsof recommendations reflect the child X instruction interactions described in Connor,Morrison, and Katch (2004) and it is these interactions that this study was designed to test.
A2i grouping algorithms provided recommended homogeneous groupings of students basedon their word reading skills. The rationale for using small groups was based on the effectiveschools literature (Taylor, Pearson, Clark, & Walpole, 2000 2000; Wharton-McDonald,Pressley, & Hampston, 1998 1998) and on preschool research (Connor et al., 2006a), which
Connor et al. Page 5
Child Dev. Author manuscript; available in PMC 2010 January 1.
NIH
-PA Author Manuscript
NIH
-PA Author Manuscript
NIH
-PA Author Manuscript

suggested that (1) children in schools that used small homogeneous skill-based groups hadgenerally stronger reading skills compared to children in schools that did not, (2) there weremain effects for preschool instruction provided in small groups, and (3) that the effect ofsmall group instruction on students’ reading skill gains was greater than similar instructionprovided to the whole class.
A2i also incorporated planning software and indexed the schools’ core reading curriculum tothe multidimensional types of instruction. By indexing the core reading curriculum, weaimed to support teachers’ ability to differentiate the content of the instruction as well as theamount. The A2i software recommended only minutes per day for each type of instruction.We relied on teachers’ knowledge and decision-making, curriculum scope and sequence,and our professional development to help teachers differentiate the specific content of theinstruction. For example, although teaching letter-sound associations is a code-focusedactivity, it would not be an appropriate activity for a child who already knew how to readfluently. However, it would be an appropriate activity for a child who was just learning thealphabetic principle (Marilyn J. Adams, 2001).
Additionally, teachers received intensive training on how to use A2i and how toindividualize instruction in their classrooms based on the A2i recommendations. TheIndividualizing Student Instruction (ISI) intervention professional development used amentoring or reading coach model that is employed widely, particularly in Reading Firstschools (Gersten, Chard, & Baker, 2000; Showers, Joyce, & Bennett, 1987; US DOE, 2004;Vaughn & Coleman, 2004). In this model, teachers formed a grade-level community oflearners, guided by a highly trained reading specialist (the research partner), who alsoprovided classroom-based support to teachers. Research suggests that reflection as amember of a learning community or study group may have particular power (Lave &Wenger, 1991; Ramanathan, 2002). In addition, a genuine partnership between teachers andmentors (e.g., reading coaches, researchers), including respect for teachers’ expertise andresponsiveness to their thoughts and concerns, was used to foster receptiveness to the studygoals as well as to enhance the quality of the professional development itself (DuFour &Eaker, 1998; Freeman & King, 2003; Helterbran & Fennimore, 2004).
Individualizing Student Instruction Intervention—The ISI intervention was providedby the classroom teachers to all of the children in their classroom from September throughthe end of the school year in May. A description of the fully implemented intervention isprovided in Appendix B. The two-hour length of the literacy block was mandated by thedistrict for both intervention and comparison classrooms so the manipulation was the ISIintervention rather than the dedicated literacy block. Children were assessed in the fall,winter and spring on a battery of language and literacy skills.
Results of the analyses using HLM (Raudenbush, Bryk, Cheong, Congdon, & du Toit, 2004,2004) revealed a significant effect of treatment (Connor et al., 2007a). Children in the ISIintervention classrooms demonstrated greater growth in reading comprehension (i.e.,residualized changed) than did children in the control classrooms, on average. Thisdifference represented about a two month difference in grade equivalent scores (effect size,d = .25). Plus, the more teachers used A2i software, the greater was their students’ readingcomprehension skill growth and this effect was greater for children who began the schoolyear with weaker vocabulary skills.
Still, these results beg the question, what was the specific effect of individualizinginstruction on students’ literacy growth? Other sources of influence may be responsible forthe observed treatment effect. For example, might the treatment effect have been the resultof the professional development teachers received rather than the different amounts and
Connor et al. Page 6
Child Dev. Author manuscript; available in PMC 2010 January 1.
NIH
-PA Author Manuscript
NIH
-PA Author Manuscript
NIH
-PA Author Manuscript

types of instruction children received? More knowledgeable teachers may have been morelikely to use A2i or were more effective generally (Moats, 1994), which may have beenunrelated to individualizing instruction. There is some evidence that teachers’ qualificationscontribute to their effectiveness in the classroom, as measured by a number of practice andstudent outcomes (Darling-Hammond, 2000; Goldhaber & Brewer, 2000; NICHD-ECCRN,2002; Pianta, Howes, Burchinal, Bryant, Clifford, Early, & Barbarin, 2005), although theeffects are frequently small. Teachers’ knowledge about reading and language concepts hasbeen shown to relate to student outcomes as well (Moats, 1994; Moats & Foorman, 2003).
At the same time, control teachers may have been providing algorithm recommendedamounts (drift of the intervention), which would have tended to weaken documentedtreatment effects. Additionally, Reading First funds were available to five of the schools andthe training and extra services provided may have contributed to the treatment effect.Although we matched schools on Reading First status, we included that variable in ourmodels as well.
In the present study, we begin to disentangle the relative contribution of the instructionchildren received and other sources of influence on student achievement. By observing theamounts and types of literacy instruction provided in both the intervention and thecomparison classrooms during the fall, winter and spring and then comparing total amountsprovided in the classroom with the amounts recommended by the A2i algorithms, we canexamine the specific effects of instruction. Finding that amounts and types of instruction thatmore precisely match A2i recommended amounts predict students’ literacy skill growthwould provide strong evidence that child X instruction interactions contribute to individualdifferences in students’ literacy achievement.
Research QuestionsIn summary, there is accumulating evidence that child X instruction interactions may becausally related to the observed variability in student achievement within and acrossclassrooms. Most of these studies, however, are descriptive and correlational, examineinstruction at the classroom or curriculum level, or do not examine the instruction of bothintervention and comparison group teachers. The purpose of this study is to investigate theimplementation of the ISI intervention in the classroom and the precision with whichteachers taught the A2i recommended amounts for each type of instruction for individualchildren in their classroom. We hypothesize that it was the instruction that children received,and not other sources of influence, that should predict their reading outcomes if indeed childX instruction interactions are predicting student outcomes. Thus we asked the followingresearch questions:
1. Generally, what kinds of literacy instruction were provided in these first gradeclassrooms, did amounts and types of instruction differ for children who shared thesame classroom, and were there differences in instructional patterns between theintervention and comparison classrooms? We hypothesized that, compared toteachers in the comparison group, teachers in the intervention group would tend toprovide more instruction in small groups or individually rather than with the wholeclass. We also predicted that children who shared the same classroom wouldreceive differing amounts and types of instruction.
2. Did instruction that more precisely matched the A2i recommended amounts ofteacher/child-managed code-focused and child-managed meaning-focusedinstruction predict stronger student outcomes? First, we hypothesized that teachersin the intervention group would provide the A2i recommended amounts moreprecisely than would the comparison group teachers. Next, because predictablechild X instruction interactions affect the efficacy of particular instruction strategies
Connor et al. Page 7
Child Dev. Author manuscript; available in PMC 2010 January 1.
NIH
-PA Author Manuscript
NIH
-PA Author Manuscript
NIH
-PA Author Manuscript

for specific children, we predicted that total amounts of instruction would notpredict student outcomes. However, we predicted that the precision with whichteachers provided the A2i recommended amounts for each student would predictgrowth in student literacy skills, even when controlling for teacher, school andstudent characteristics that might be related to the efficacy of the ISI intervention.
MethodsParticipants
Four-hundred sixty-four students in 47 classrooms in 10 schools participated in this study.Schools, located in one school district in Florida, were highly diverse ethnically, and werelocated in neighborhoods that varied in SES. School SES was based on the percentage ofchildren qualifying for the free or reduced priced lunch program. Half of the schools wereparticipating in the Florida Reading First program, which is a federally funded program runby school districts and designed to improve instruction at historically low income andunderperforming schools. Descriptive information for each school is provided in Table 2.The district administration nominated 10 schools, which were matched based on percentageof children qualifying for free or reduced price lunch, the mandated Florida ComprehensiveAchievement Tests (FCAT) 3rd grade reading scores, and Reading First status. Then, onemember of each school pair was randomly assigned to the ISI intervention group. With thisdesign, teachers at the same school stayed together to improve professional developmentefforts, as well as to prevent drift of the intervention to the comparison group.
All of the students assigned to participating teachers were invited to join the study, includingchildren for whom English was a second language and who qualified for special services.Parental consent was obtained for 76% of the students (n = 616). Sixty percent of thechildren were girls. Fifty-nine percent of children qualified for free or reduced price lunch.Fifty-four percent were African American, 37% were European American, and theremaining children belonged to other ethnic groups.
From this group, students were randomly selected as target children for the classroomobservations. For each classroom, students were rank ordered by their fall Woodcock-Johnson-III Tests of Achievement (Mather & Woodcock, 2001) letter-word identification Wscore (description below) and divided into three groups of equal size. In this way, eachclassroom had a group of students who had weak, average, and strong reading skillsaccording to the norms of their classroom. Four students from each group were randomlyselected. If there were not 12 participating students in a particular classroom, then all of thechildren were selected. This method was utilized anticipating poorer attendance and moreattrition among the students with weaker reading scores, which was the case. In all, 464students were selected, observed and their instruction coded in their classroom at least once.Thirty-three children were observed only once, 87 were observed twice, and 344 wereobserved in the fall, winter, and spring. Using a Bonferroni Correction for multiple analyses(alpha was divided by the number of models [6] so α = .05/6 = .008), HLM revealed nosignificant differences in fall or spring scores when sub-samples and full samples werecompared. HLM analyses revealed no significant differences in fall letter-word reading andpassage comprehension W scores between groups. Children in the comparison classroomshad significantly higher fall vocabulary scores compared to children in the interventionclassrooms [coefficient = −5.26, t (45) = −3.887, p < .001].
Forty-nine teachers began the study, 23 in the treatment group and 27 in the control. In oneintervention school, children changed classrooms during the language arts block and, thus,one of the teachers taught second graders during the winter and spring observations.Therefore, his classroom was only observed in the fall shortly before he discontinued his
Connor et al. Page 8
Child Dev. Author manuscript; available in PMC 2010 January 1.
NIH
-PA Author Manuscript
NIH
-PA Author Manuscript
NIH
-PA Author Manuscript

participation in the study. We did code that classroom and these data are included in theanalyses. Also, two control teachers team-taught one classroom. Although both teacherswere videotaped, one teacher was selected at random and we coded her instruction. Thosedata were used in the analyses. Another control teacher left the study because of healthreasons before we could observe her classroom. A special education control classroom wasalso observed. However, children were also observed in their regular classroom, and so theclassroom data were included in the analyses. This left a total of 47 teachers and classroomsobserved at least once. Eighty-seven percent of the teachers were female, 64% wereEuropean American and the remaining 36% were African American.
Generally, teachers’ qualifications and characteristics were similar across the two groups.Means for intervention and comparison groups with confidence intervals are available inTable 3. Although control teachers started out the year with higher scores on our test ofknowledge about language and literacy concepts, teachers in the intervention groupdemonstrated greater gains on the assessment from fall to spring. Teachers in theintervention group were more likely to teach at a school with a higher percentage of childreneligible for free or reduced price lunch compared to teachers in the comparison group.
ProceduresUtilizing a wait-list control design, the teachers in the intervention classrooms received A2iand professional development in the 2005–2006 year and the teachers in the comparisonclassrooms received training and A2i technology during the 2006–2007 school year. Onlythe 2005–2006 results are included in this study. All schools in the district were required toprovide a 120 minute block of uninterrupted language arts instruction, of which 45 minuteswere supposed to include small group instruction. For this reason many of the controlteachers also used small groups during the dedicated language arts block. Thus the principalexperimental manipulation was providing the A2i recommended amounts of instruction foreach child.
In all, six research partners provided professional development to the teachers in theintervention group. Research partners were assigned to a specific school (one school hadtwo research partners) and no systematic differences among schools or research partnerswere observed for teacher ISI implementation or student outcomes.
Professional development focused on (1) teaching teachers how to plan instruction usingA2i and (2) how to implement the recommended amounts by individualizing instruction.This included training on: (a) classroom management and organization, (b) differentiatingcontent and delivery of instruction based on students’ assessed skills, and (c) using highquality research-based literacy activities, especially during child-managed activities.Research partners met with individual teachers at the schools every other week during theirliteracy block to provide classroom-based support and met with grade-level teams at theirrespective schools monthly following the established protocol. Teachers in the interventiongroup also participated in a half-day workshop (3 hours) in spring 2005 and a full dayworkshop (6 hours) in fall 2005. The amount of time spent with teachers was carefullymonitored to be as consistent as possible among teachers. Each teacher receivedapproximately 35 hours of professional development at their school in addition to the 9hours of workshop.
AssessmentsStudent Assessments—Students’ language and literacy skills were assessed in fall2005, and again in winter and spring 2006 using a battery of language and literacyassessments, including tests from the Woodcock Johnson Tests of Achievement-III (Mather
Connor et al. Page 9
Child Dev. Author manuscript; available in PMC 2010 January 1.
NIH
-PA Author Manuscript
NIH
-PA Author Manuscript
NIH
-PA Author Manuscript

& Woodcock, 2001). The WJ was selected because it is widely used in schools and forresearch. It is psychometrically strong (reliabilities on the tests used ranged from .81 to .94),and subtests are brief. All assessments were administered to children individually by atrained research assistant in a quiet place near the students’ classrooms.
We assessed students’ word reading skills using the Letter-Word Identification test, whichasks children to recognize and name increasingly unfamiliar letters and words out ofcontext. We assessed children’s reading comprehension skills using the PassageComprehension test, which utilizes a cloze procedure where children are asked to read asentence or brief passage and supply the missing word. To assess expressive vocabulary, weused the Picture Vocabulary test, which asks children to name pictures of increasinglyunfamiliar objects.
The letter-word identification grade equivalent (GE) and the picture vocabulary ageequivalent (AE) scores were entered into the A2i software. These scores were used tocompute recommended amounts of each instruction type for children in the intervention andcomparison classrooms. Mid-year, children were re-administered the alternate form of theLetter-word identification and Picture Vocabulary tests. Recommended amounts in A2i wererecomputed using the new scores. The intervention group teachers first gained access toalgorithm recommendations and assessment information provided by A2i software inSeptember 2005 and used the software continuously through May 2006. The comparisongroup teachers were provided written reports of the assessments results for their students inSeptember 2005 and February 2006.
Teacher Assessments—Teachers completed a survey in the fall designed to obtaininformation on their experience and education. Additionally, teachers’ knowledge of Englishlanguage and literacy was assessed using the Teacher Knowledge Assessment: Languageand Print (TKA:LP) in the fall and (Piasta, Connor, Fishman, & Morrison, 2008). TheTKA:LP was designed for this study to assess teachers’ understanding of Englishphonology, orthography, and morphology, as well as important concepts of literacyacquisition and instruction with an emphasis on metalinguistic and phonics concepts. Forexample, teachers were asked to select the word containing a short vowel sound (choices:treat, start, slip, paw, father), count the number of syllables in the word walked and thenumber of morphemes in the word unbelievable, and identify the following phonologicaltask: “I am going to say a word and then I want you to break the word apart. Tell me each ofthe sounds in the word dog” (choices: blending, rhyming, segmentation, deletion). Questionson the TKA:LP were adapted from earlier work (Bos, Mather, Dickson, Podhajski, & Chard,2001; Mather, Bos, & Babur, 2001; Moats, 1994; Moats & Foorman, 2003). The TKA:LPconsisted of 34 multiple choice items and 11 short answer items and had a reliability ofalpha = .87. Out of a possible 40 points, fall scores on the TKA:LP ranged from 9 to 36 (M= 23.45, SD = 7.27).
Classroom observation—All participating teachers were videotaped at theirconvenience three times throughout the year during the fall, winter, and spring. Observationswere rescheduled if a teacher was absent or requested that we observe them on another day.Across all classrooms, observations were conducted during the entire literacy block. Wevideotaped all day during the winter; however, full day analysis was beyond the scope ofthis study. In two schools (one intervention & one control), children changed classroomsduring the literacy block to achieve more homogeneous skill-based groupings. We reportobservation data for the child during the literacy block when they were with their readingteachers and not for the time they spent with their homeroom teachers. This decision wasbased on our observation that teachers were more likely to use small groups during the timestudents were in reading skills-based classes.
Connor et al. Page 10
Child Dev. Author manuscript; available in PMC 2010 January 1.
NIH
-PA Author Manuscript
NIH
-PA Author Manuscript
NIH
-PA Author Manuscript

Research assistants used two digital video cameras with wide-angle lenses for eachobservation so that we would be better able to capture as much of the classroom instructionas possible. Child descriptions were recorded for all participating students that were present,however, only the target students’ activities and instruction were coded from the video.Because video cameras were set up to capture the widest range of activities in eachclassroom, detailed field notes were also written throughout the observation period,recording specific information that might not be interpretable from the videotape alone.Notes included times when children entered and left the classroom, explanations of events oractivities that took place outside of the camera’s view, descriptions of worksheets and otheractivities (e.g. from field notes, “students are completing a vocabulary worksheet where theymust match words and pictures.”). We did not observe or code activities that took placeoutside of the classroom nor did we follow students who left their classroom during theobservation period.
Classroom video observations were coded in the laboratory using the Noldus Observer Proversion 5.0 software package (Noldus Information Technology, 2001). The coding systemwas expanded and adapted from the Pathways to Literacy Coding scheme (Connor et al.,2006a) and was designed to capture the amount of time, in minutes: seconds, that targetstudents spent in various classroom activities. Videos were coded by trained researchassistants, some of whom also did the video observations. To the extent possible, coderswere blind to condition. All activities lasting at least 15 seconds were coded, including bothacademic (e.g., literacy instruction) and non-academic (e.g., attendance) activities. Goodinter-rater reliability (Kappa = .80) was achieved on training videos among all coders beforeformal coding commenced. Additionally, approximately 5% of the completed observationswere randomly selected and 30 minutes were re-coded by another research assistant.Reliability among coders was moderate to almost perfect with a Cohen’s kappa mean of .76and a range from .50 to .92 (Landis & Koch, 1977).
In accordance with the study’s research questions and hypotheses, classroom activities werecoded with respect to three dimensions: management, grouping unit, and content. A sampletranscript is provided in Appendix C. Again, the management dimension (see Table 1)considered who was focusing the child’s attention on the learning opportunity, the child(CM), or the teacher and child together (TCM). Activities were coded as TCM when theteacher was actively interacting with students. CM activities were coded when the childcompleted activities without the support of the teacher. These included activities in whichthe child worked independently or with peers (e.g., silent reading, buddy reading,completing worksheets).
The second coding dimension considered the unit in which students were grouped for theactivity: Whole Class, Small Groups, Pairs, or Individual (see Table 1). Activities in whichthe entire class participated were designated as Whole Class. Small Group and Pair activitieswere coded when students worked together in smaller units to complete worksheets, readtexts, write and edit stories, etc. Small Group activities involved groups of three or morestudents while Pair activities involved groups of two students. Individual activities werecoded when children worked independently, including individual seatwork such asworksheets, journal writing, and silent reading.
The third dimension of the coding scheme captured the content of the classroom activities(see Table 1). Literacy, other academic (e.g., science) and non-academic (e.g., transitions)activities were coded. Literacy activities were first coded as to the broad content areatargeted by instruction (i.e., Phoneme Awareness, Syllable Awareness, MorphemeAwareness, Onset/Rime Awareness, Word Identification/Decoding, Word Identification/Encoding, Grapheme-Phoneme Correspondence, Fluency, Print Concepts, Oral Language,
Connor et al. Page 11
Child Dev. Author manuscript; available in PMC 2010 January 1.
NIH
-PA Author Manuscript
NIH
-PA Author Manuscript
NIH
-PA Author Manuscript

Print Vocabulary, Comprehension, Text Reading, and Writing). Subcategories within eachof the broad content areas were used to code activities more specifically (the completecoding manual is available upon request from the corresponding author). For example, acomprehension activity may have focused on a particular comprehension strategy, such aspreviewing text, making predictions or inferences, activating prior knowledge, etc. Thecoding scheme allowed all dimensions (management, grouping unit, content) to be coded foreach classroom activity for each individual child (see Appendix C).
ResultsChild Outcomes
In general, students made good gains in reading and vocabulary skills over the school yearbut there was substantial variability (see Table 4). For example, standard scores (mean =100, SD = 15) on the letter-word identification test improved from 104 in August to 110 byMay. Plus, there was a fair to high degree of stability (see Table 5) with fall scoresmoderately to highly correlated with spring scores. W scores, similar to Rasch scores(Mather & Woodcock, 2001), are on an interval scale and were used in all analyses.
Nature and Variation in Classroom InstructionDescriptions of Classroom Activities—Comparing total amounts of language andliteracy instruction provided during the language arts block across the school year (fall,winter, and spring) revealed fairly consistent amounts falling between 70 and 80 minutes perobservation, averaged across all children and classrooms. About 10 minutes were spent, onaverage, in organization, which includes explaining how to do activities, instructing childrenon classroom routines, etc. This amount was consistent across the school year. Amounts oftime students spent in non-instructional activities (e.g., waiting for instruction to begin,standing in line, etc.) increased from fall to winter and remained consistent through springand comprised approximately 25% of the time observed during the language arts block. Theremaining time was spent on content area instruction including science, social studies andmathematics (about 5% of the time observed).
Examining types of literacy instruction more closely (see Table 6) revealed substantialvariability among classrooms. Generally, over the school year, most of the time spent inliteracy instruction was spent reading text either aloud, in pairs, or individually (17 minutes,on average). Word identification encoding was the next most frequently observed type ofliteracy instruction observed (11 minutes on average), followed by writing (10 minutes). Onaverage, small amounts of time were spent on phonological awareness (2 minutes) andgrapheme-phoneme correspondence activities (4 minutes) and these amounts decreased fromfall to spring (8 to 2 minutes respectively). Generally, more time in basic decoding skillsinstruction (e.g., alphabet activities, grapheme-phoneme correspondence) was observed inthe fall compared to spring. More time in advanced meaning-focused activities (e.g.,comprehension strategies) was observed in the spring compared to the fall. When weexamined instruction amounts observed between children in the intervention andcomparison classroom, no clear pattern of difference emerged at this level of analyses (i.e.,management and grouping conflated).
Computing total amounts of instruction using multiple dimensions—Types ofliteracy instruction (see Table 1) were combined into either code- or meaning-focusedvariables and categorized by grouping (e.g., small group, individual) and management (e.g.,teacher/child managed or child managed). For TCM instruction, whole class instruction wasnot included in the total observed amounts to be compared to the A2i recommendedamounts. This provided 12 variables in all (see Table 1). Instruction provided by any adult in
Connor et al. Page 12
Child Dev. Author manuscript; available in PMC 2010 January 1.
NIH
-PA Author Manuscript
NIH
-PA Author Manuscript
NIH
-PA Author Manuscript

the classroom (teacher, specialists, aides, etc.) was considered teacher/child-managed.Child-managed instruction included peer-managed instruction. Although important,examining peer interactions was beyond the scope of this study. Overall across allclassrooms, 9 minutes of TCM-code focused small group instruction was observed in thefall, 6 minutes in the winter and 4 minutes in the spring. Approximately 12 minutes of CMcode-focused instruction was observed in the fall, 8 minutes in the winter and spring. Afairly steady amount of TCM-meaning focused small group instruction was observed acrossthe school year; 12 minutes in the fall, 13 minutes in winter and 11 minutes in spring.Generally increasing amounts of CM meaning focused instruction were observed during theschool year; 16 minutes in fall, 20 minutes in winter, and 22 minutes in spring.
Computing Distance from Recommendation (DFR)—Using the A2i algorithmstranslated into SPSS syntax (version 14.0.1), recommended amounts, in minutes, for all fourtypes of instruction were computed for each of the students (both intervention andcomparison groups) using his or her fall scores for the fall and winter observations and hisor her January scores for the spring observations.
The A2i recommended amount was subtracted from the actually observed amount ofinstruction for each child and histograms were examined for fall, winter and springobservations. Generally, teachers failed to provide recommended amounts and providedboth more and less than the recommended amounts of teacher/child-managed code-focused(TCM-CF) and child-managed meaning-focused (CM-MF) instruction during observations.Children who shared the same classroom received very different amounts and types ofinstruction. For example, in one classroom, one child received more than 40 minutes ofTCM-code focused instruction whereas another received less than 20. Moreover, only someof these amounts approximated the amounts recommended by A2i.
To compute mean amounts of instruction for each child across the fall, winter, and spring,while taking into account the nested nature of the observations (observations nested withinteachers) and to impute missing observation data, we created two-level HLM models withrepeated observations at level 1 and children at level 2. Empirical Bayes residuals for eachchild provided a mean amount and mean slope (minutes change per month) for eachinstruction type. Descriptive information is provided in Table 4.
To compute the distance from the A2i recommendation (DFR), we used the absolute valueof the observed minus the recommended amounts. Considering children nested inclassrooms, teachers were generally becoming more precise teaching the recommendedamounts of TCM-CF instruction from fall to spring (smaller DFR) but were becoming lessprecise teaching the recommended amounts of CM-MF instruction. Children who receivedmore precise amounts of TCM-CF instruction also tended to receive more precise amountsof CM-MF instruction (r = .179, p < .001).
Student Outcomes and Classroom InstructionTo examine the impact of classroom instruction on students’ letter-word identification andpassage comprehension skills, we built HLM models for each outcome. HLM was preferredbecause of the nested nature of our data, students nested in classrooms, nested in schools(Raudenbush & Bryk, 2002). We first examined 3-level models for each outcome (Wscores) with students at level 1, classrooms at level 2, and schools at level 3. There was littlevariability between schools for either outcome (letter-word reading intraclass correlation[ICC] = .05; passage comprehension ICC = .08), which was fully explained once schoollevel SES and Reading First status were added. Therefore, we used more parsimonious twolevel models with children nested in classrooms and school level variables, school SES andReading First status added at the classroom level.
Connor et al. Page 13
Child Dev. Author manuscript; available in PMC 2010 January 1.
NIH
-PA Author Manuscript
NIH
-PA Author Manuscript
NIH
-PA Author Manuscript

We built the two-level models systematically starting with an unconditional model (letter-word reading ICC = .17; passage comprehension ICC = .18), then added the classroom levelvariables, and then students’ fall scores and the number of times they were observed (nj) tolevel 1. In the passage comprehension model, there was significant between-classroomvariability in fall passage comprehension W scores so this variable was allowed to remainrandom at level 2. All other variables were tested and fixed at level 2. Although students’fall vocabulary did not significantly predict letter-word reading W score, we left it in themodel because the intervention groups varied significantly on the measure. Using thesemodels as our base, we then investigated the impact of total amounts of instruction types andthen the impact of DFRs for each instruction type. Descriptive statistics for the models areprovided in Table 4.
Total Amounts of Instruction—Entering total amounts of TCM-CF, CM-MF, TCM-MFand CM-CF instruction into our model at level 1 (remember these are child-level variables)revealed that, with one exception, TCM-MF, total amounts of instruction did not predicteither outcome (see Table 7). Most notably, TCM-CF and CM-MF total amounts were notsignificantly associated with students’ letter-word reading and passage comprehension scoregrowth (i.e., residualized change).
In contrast, the more time students spent in TCM-MF instruction, the greater was theirpassage comprehension skill growth. The magnitude of this effect depended on the numberof minutes of instruction above or below the mean (12 minutes). Thus, for example,according to these modeled results, children who received 30 minutes (18 minutes more thanthe mean amount) would be predicted to achieve passage comprehension scores about 5.6points higher than the intercept of 467, which is a small to moderate effect size (d) of .37.There was a similar effect for letter-word reading which was marginally significant[coefficient = .36, t(488) = 1.882, p=.06].
Distance from Recommended Amount (DFR) Predicting Outcomes—As wehypothesized, the HLM results revealed that students in the intervention group had smallerTCM-CF and CM-MF DFRs, controlling for fall vocabulary and reading scores, than didstudents in the comparison classroom. [TCM-CF amount, intervention group = 1, coefficient=−1.337, t(45) = −3.189, p = .003; CM-MF amount, intervention group = 1, coefficient =−2.724, t(45) = −2.865, p = .007]. Thus, generally, children in the treatment classroomswere more likely to receive the A2i recommended amounts of instruction than were childrenin the control classrooms.
As anticipated, children who received instruction that more precisely matched the amountsrecommended by the A2i algorithms (smaller DFR) achieved significantly stronger springletter-word identification and passage comprehension scores, controlling for fall status, thandid children who received less precise amounts (Table 8, Figure 4). Overall, the moreprecisely teachers provided the A2i algorithm recommended amounts of TCM-CF,controlling for slope, and CM-MF (i.e., smaller DFR) the stronger were their students’letter-word reading and passage comprehension score growth.
Additionally, TCM-CF slope predicted outcomes. Increasing precision over the school year(negative DFR slope) was associated with stronger letter-word reading and passagecomprehension score growth.
Because the DFR variables were continuous, the effect size (d) changed as the variables’values changed. The magnitude of the effects may be gauged by examining Figure 4, whichpresents the results graphically using standard scores (normative sample mean = 100, SD =15) as the outcome metric. Of note, there were no significant intervention/comparison group
Connor et al. Page 14
Child Dev. Author manuscript; available in PMC 2010 January 1.
NIH
-PA Author Manuscript
NIH
-PA Author Manuscript
NIH
-PA Author Manuscript

by DFR interactions [TCM-CF amount coefficient = −.28, t(446) = −.177; TCM-CF slopecoefficient = 2.59, t(466)=.435; CM-MF coefficient = .25, t(446) = 1.098], indicating thatDFR predicted student outcomes regardless of whether their teacher was in the interventionor comparison group.
Students with stronger fall vocabulary scores were less likely to receive A2i algorithmrecommended amounts of CM-MF than were students with weaker scores (see Figure 5) andthis held across intervention and comparison groups. There were no significant interactionswith either fall letter-word or passage comprehension score.
Neither teacher qualifications nor school characteristics predicted DFR and so were trimmedfrom the models. Specifically, the following variables did not predict TCM-CF or CM-MFDFR: teacher knowledge [TCM-CF amount coefficient = −.026, t(43)=−.853; CM-MFamount coefficient = .096, t(43) = 1.040] or experience [TCM-CF coefficient = −.040, t(43)= −.104, p = ; CM-MF coefficient = .513, t(43) = .649], school SES [TCM-CF coefficient= .009, t(43) = .665; CM-MF coefficient = −.031, t(43) = −.892], or Reading First status[TCM-CF coefficient = −.715, t(43) = −.972; CM-MF coefficient = 1.27, t(43) = .777]
DiscussionIn this study, we investigated the classroom instruction provided to students in ISIintervention and comparison classrooms, asking whether child X instruction interactionswere systematically related to students’ reading skill outcomes. Specifically, we askedwhether receiving A2i recommended amounts and types of instruction, informed by child Xinstruction algorithms, would lead to greater student reading achievement. Overall, studentsdemonstrated grade appropriate growth in word reading and reading comprehension skills.There was, however, substantial variability.
The total amounts of teacher/child-managed code-focused, child-managed meaning-focusedand child-managed code-focused instruction students received did not predict either letter-word reading or passage comprehension skill growth (see Table 7). When, for each child, wecomputed distance from recommendation (DFR), which was the absolute value of theobserved amount minus the A2i recommended amount, we discovered that precisionmattered. As hypothesized, teachers in the intervention group provided A2i recommendedamounts more precisely than did the teachers in the comparison group. That is, children inthe intervention group tended to have smaller DFRs than did children in comparisonclassrooms. We found that teachers in the intervention group were more likely to use smallgroups and to provide more child-managed meaning-focused instruction than were teachersin the comparison group. Both behaviors were encouraged through our professionaldevelopment and scaffolded in the A2i software, and most likely contributed to the smallerDFRs observed in the intervention classrooms.
Importantly, the smaller the DFR for teacher/child-managed code-focused and child-managed meaning-focused instruction, the greater was the students’ word reading andreading comprehension skill growth (see Table 8 & Figure 4). The effects were additive andwere large when the most precise and least precise instruction was considered.
Taken together, these results support our hypothesis that it was receiving the preciseamounts of individualized instruction that predicted students’ reading outcomes andcontributed to the significant overall treatment effect of the ISI intervention (Connor et al.,2007a). When we tested other sources of influence, they did not predict outcomes.Specifically, teachers’ qualifications, teacher professional development, and schoolcharacteristics did not predict student outcomes. These findings provide strong evidence that
Connor et al. Page 15
Child Dev. Author manuscript; available in PMC 2010 January 1.
NIH
-PA Author Manuscript
NIH
-PA Author Manuscript
NIH
-PA Author Manuscript

child X instruction interactions are causally implicated in the widely varying levels ofstudent achievement observed between and within many classrooms.
Implications of Child X Instruction InteractionsAs we conceptualize designing effective individualized instruction, there are severalfindings worth highlighting. First, our results indicated that the dimension change over timeinfluenced students’ literacy growth. That is, precisely providing recommended amounts ofinstruction, which change systematically over the course of the school year, as well as inresponse to students’ changing skills, is associated with stronger student reading outcomes.Our results suggest that amounts that were appropriate at the beginning of the year forcertain children were not by the end of the year.
Second, we found that going over the recommended amounts did not predict strongerachievement. It was not the case that more instruction was better.
Third, we verified that the relation between the amounts of instruction recommended andstudents’ reading skills is non-linear. For example, examining the relation between students’assessed word reading skills and the recommended amount of teacher/child-managed code-focused instruction revealed that children whose skills were above grade level expectationsneeded fairly similar and modest amounts of teacher/child-managed code-focusedinstruction, especially toward the end of the school year, whereas children whose skills fellbelow grade level required exponentially more as they fell farther and farther behind gradelevel expectations. A simple linear relation would tend to recommend too much code-focused instruction for grade level readers and not enough for children who were performingwell below grade level.
Taking these results together indicates that predicting appropriate amounts and types ofinstruction is not as straightforward as has been previously suggested (Fielding, Kerr, &Rosier, 2007). Much of reading research has focused on struggling readers (NRP, 2000;Rayner et al., 2001). Our results suggest that findings for struggling readers do notgeneralize seamlessly to more typical and above average readers. Such students appear torequire substantially less time on the alphabetic principle to achieve proficient reading skillscompared to children who begin first grade with weaker vocabulary and letter-word readingskills. Moreover, the complexity of the associations and the multidimensional nature ofinstruction may explain why so many teachers find it difficult to translate assessment resultsinto effective practice (Roehrig, Duggar, Moats, Glover, & Mincey, in press in press).
Classroom InstructionA compelling feature of observed classroom instruction was that, for the most part, teachersprovided both meaning- and code-focused instruction. Indeed, across intervention andcomparison classrooms, teachers provided substantial amounts of meaning-focusedinstruction using core reading curricula that are, by reputation and intent, principally code-focused (Foorman et al., 1998).
Notably, the more teacher/child-managed meaning-focused instruction children received, thestronger was their reading comprehension skill growth. This supports previous researchfindings (NRP, 2000; Pressley & Wharton-McDonald, 1997; C. E. Snow, 2001).Additionally, there were no child X instruction interactions; the effect of teacher/child-managed meaning focused instruction was a main effect. This indicates that meaning-focused instructional activities, such as reading with children and explicitly teachingcomprehension strategies, had a positive effect on students’ reading skill gains regardless ofwhether they had strong or weak reading skills. Although other studies have found evidenceof child X instruction interactions for teacher/child-managed meaning-focused instruction
Connor et al. Page 16
Child Dev. Author manuscript; available in PMC 2010 January 1.
NIH
-PA Author Manuscript
NIH
-PA Author Manuscript
NIH
-PA Author Manuscript

(Connor et al., in press; Connor et al., 2004a), these studies combined whole class and smallgroup. It may be that the small group nature of the meaning-focused instruction contributedto its efficacy. Altogether, the results underscore the importance of meaning-focusedinstruction for all children.
We also found that children with the highest vocabulary scores in the fall were less likely toreceive the recommended amounts of child-managed meaning-focused instruction whencompared to children with lower vocabulary scores. Recent studies indicate that this findingmay not be unique (Neal & Schanzenbach, 2007; Viadero, 2007). Many teachers tend to beless effective with children whose skills fall at the extremes compared with children whoseskills are more typical of the classroom. Another reason may be that children with strongervocabulary skills would be more likely to be reading above grade level. Especially in highpoverty schools, teachers and administrators may assume that they are “doing just fine” andnot provide them small group time and time to practice established skills. Although wemight assume that it would be relatively easy to hand these children a book to read orencourage them to write in their journals, these actions are relatively counterintuitive andunlikely to happen, especially if the teacher provides substantial amounts of whole classinstruction, which is almost necessarily directed at the children most typical of his or herclassroom. Another consideration is that the core curricula focused on basic code-focusedskills, especially at the beginning of the year. Thus independent reading and writing mayhave received less attention overall.
Research that includes careful observation of classrooms is expensive. However, theseresults and others (Pianta, 2006; Pianta et al., 2005; Pressley, Wharton-McDonald,Allington, Block, Morrow, Tracey, Baker, Brooks, & Crenin, 2001; Taylor et al., 2000)demonstrate that we cannot afford to treat the classroom like a black box. More distalsources of influence, while important and easier to measure (e.g., parental education, teacherqualifications), do not illuminate the mechanisms underlying student learning. Moreover, theresults of this study illustrate that children who share the same classroom receive, by designor not, very different amounts and types of instruction. This may be the case, as well, for thesocial and emotional support they receive, which, research shows, also contribute tostudents’ school success (Hamre & Pianta, 2005). Studying this within-classroom variabilitymay offer us a better understanding of the complex and dynamic classroom environment andhow we can optimize it to support all children.
AssessmentUsing assessment to guide instruction is at the heart of individualizing instruction but can bedifficult for many teachers (Roehrig et al., in press). A2i was developed with the specificpurpose of helping teachers translate assessment results into viable recommendations forinstruction, which could then be planned and implemented. Results illustrate that child Xinstruction interactions are really about precisely tailoring instruction to individual students’skills. Instruction that simply provides more time in reading without attending to children’sspecific reading strengths and weaknesses will be less effective overall.
A limitation of the A2i software used in this investigation was that although the algorithmsprovided recommended amounts, they did not suggest appropriate content or activities.More powerful algorithms are currently being developed that will provide teachers withguidance on appropriate content and activities, as well as recommended amounts ofparticular types of instruction. We are calling this the Smart Lesson Plan.
Spring DFRs predicted more of the variability in students’ reading outcomes whencomputed using the January reassessment results rather than fall scores. This suggests thatmore frequent monitoring of students’ skills should lead to more precise recommendations
Connor et al. Page 17
Child Dev. Author manuscript; available in PMC 2010 January 1.
NIH
-PA Author Manuscript
NIH
-PA Author Manuscript
NIH
-PA Author Manuscript

and, hence, more effective patterns of instruction. Raudenbush (Raudenbush) describes suchassessment informed instruction as a regime, where assessment and instruction form aniterative cycle with one informing the other (Cohen, Raudenbush, & Ball, 2003 Ball, 2003).
Complexity in the ClassroomThis study demonstrates that effective instruction is highly complex and that optimalpatterns of instruction differ for each child across a continuum. At the same time, theclassroom system of instruction is comprised of relatively simple, albeit nonlinear functions(e.g., child X instruction interactions). These work together, yielding a complex system thatappears to be chaotic but is, in fact, at least somewhat predictable in the presence ofadequate feedback (assessment of children’s skills). It is also dynamic because children arelearning and as they learn their optimal patterns of instruction change.
This complex and dynamical systems application to instruction (Ford & Lerner, 1992; Op’tEynde & Turner, 2006; Sameroff & MacKenzie, 2003) suggests that classroom instructionthat is (1) responsive to each student’s changing skills and needs (cognitive, behavioral,social-emotional), (2) is carefully planned but appropriately modified in the moment-by-moment context of instructional opportunities, and (3) that relies upon a solid bed ofrigorous research and specialized knowledge, may be more effective than instruction thatconsiders the classroom environment more globally, more intuitively, less dynamically, andless diagnostically. A fundamental challenge that follows this work is that, once valid childX instruction interactions have been identified, teachers will need specialized support to beable to enact instructional interventions with precision. The A2i software is one attempt tosupport more precise enactment, and professional development represents a range of supportsystems. As we elucidate the multiple sources of influence that affect children’sdevelopment and how children themselves influence the classroom learning environment,while continuing to identify effective strategies to improve the efficacy of instruction (andteachers’ ability to provide such instruction), more children will achieve the foundationalliteracy skills that are crucial for their ongoing academic success
AcknowledgmentsWe would like to thank Deanna Birdyshaw for her advice and support in the design and implementation of the ISIprofessional development protocol, Chantel Huddleston, Ummuhan Yesil-Dagli, and members of the video codinggroup for the hours they spent coding classroom videos, and David Francis for suggestions regarding the analyses.We also thank the ISI Project team members, as well as Andy Godsberg and Colleen Peterson for their work on A2iand ISIOnline. We appreciate the helpful feedback on early drafts of this manuscript from Stephanie Al Otaiba,Laura Lang, Alysia Roehrig, Sharilyn Steadman, and Jeanine Turner, all from Florida State University.Additionally, we thank the children, parents, teachers, and school administrators without whom this research wouldnot have been possible. This study was funded by grants R305H04013 and R305B070074, “Child by InstructionInteractions: Effects of Individualizing Instruction” from the US. Department of Education, Institute for EducationSciences and by grant R01HD48539 from the National Institute for Child Health and Human Development, and, inpart, by a pre-doctoral training grant R305B04074, from the Institute of Education Sciences. The opinionsexpressed are ours and do not represent views of the funding agencies.
ReferencesA2i. A teacher version of A2i will be available after August 1, 2007. More information about A2i is
available at http://know.soe.umich.edu/A2I/login.asp. The login is A2idemo and the password isISI06!. The software and protocol are currently freely available to other researchers upon request.
Adams, MJ. Beginning to Read: Thinking and Learning about Print. Cambridge, MA: The MIT Press;1990.
Adams, MJ. Alphabetic anxiety and explicit, systematic phonics instruction: A cognitive scienceperspective. In: Neuman, SB.; Dickinson, DK., editors. Handbook of early literacy research. Vol. I.New York: Guilford Press; 2001. p. 66-80.
Connor et al. Page 18
Child Dev. Author manuscript; available in PMC 2010 January 1.
NIH
-PA Author Manuscript
NIH
-PA Author Manuscript
NIH
-PA Author Manuscript

Al Otaiba S, Connor CM, Kosanovich M, Schatschneider C, Dyrlund AK, Lane H. Reading Firstkindergarten classroom instruction and students’ phonological awareness and decoding fluencygrowth. Journal of School Psychology. 2008; 48:281–314. [PubMed: 19083361]
Barr, R. Beginning reading instruction: From debate to reformation. In: Pearson, PD.; Barr, R.; Kamil,ML.; Mosenthal, P., editors. Handbook of reading research. Vol. 1. New York: Longman; 1984. p.545-581.
Bond GL, Dykstra R. The cooperative research program in first-grade reading instruction. ReadingResearch Quarterly. 1967; 2:5–142.
Borko, H.; Niles, J. Descriptions of teacher planning: Ideas for teachers and research. In: Richardson-Koehler, V., editor. Educators’ handbook: A research perspective. New York: Longman; 1987. p.167-187.
Bos C, Mather N, Dickson S, Podhajski B, Chard D. Perceptions and knowledge of preservice andinservice educators about early reading instruction. Annals of Dyslexia. 2001; 51:97–120.
Bracht GH. Experimental factors related to aptitude-treatment interactions. Review of EducationalResearch. 1970; 40:627–645.
Brophy JE. Teacher behavior and its effects. Journal of Educational Psychology. 1979; 71:733–750.Brophy, JE.; Good, TL. Teacher behavior and student achievement. In: Wittrock, MC., editor.
Handbook of research on teaching. 3. New York: Macmillan; 1986. p. 328-375.Cameron CE, Connor CM, Morrison FJ. Effects of variation in teacher organization on classroom
functioning. Journal of School Psychology. 2005; 43:61–85.Chall, JS. Learning to read: The great debate. New York: McGraw-Hill Book Co; 1967.Cohen DK, Raudenbush SW, Ball DL. Resources, instruction, and research. Educational Evaluation
and Policy Analysis. 2003; 25:119–142.Connor CM, Jakobsons LJ, Crowe E, Meadows J. Instruction, differentiation, and student engagement
in Reading First classrooms. Elementary School Journal. in press.Connor CM, Morrison FJ, Fishman BJ, Schatschneider C, Underwood P. THE EARLY YEARS:
Algorithm-guided individualized reading instruction. Science. 2007a; 315:464–465. [PubMed:17255498]
Connor CM, Morrison FJ, Katch EL. Beyond the reading wars: The effect of classroom instruction bychild interactions on early reading. Scientific Studies of Reading. 2004a; 8:305–336.
Connor CM, Morrison FJ, Petrella JN. Effective reading comprehension instruction: Examining childby instruction interactions. Journal of Educational Psychology. 2004b; 96:682–698.
Connor CM, Morrison FJ, Slominski L. Preschool instruction and children’s literacy skill growth.Journal of Educational Psychology. 2006a; 98:665–689.
Connor, CM.; Morrison, FJ.; Underwood, P. A Second Chance in Second Grade: The Independent andCumulative Impact of First and Second Grade Reading Instruction on Students’ Letter-WordReading Skill Growth; 2006b, June; Paper presented at the Annual Meeting of the Society for theScientific Study of Reading. Vancouver, BC.
Connor CM, Morrison FJ, Underwood P. A second chance in second grade? The independent andcumulative Impact of first and second grade reading Instruction and students’ letter-word readingskill growth. Scientific Studies of Reading. 2007b; 11:199–233.
Connor CM, Son S, Hindman A, Morrison FJ. Teacher qualifications, classroom practices, familycharacteristics and preschool experience: Complex effects on first graders’ vocabulary and earlyreading outcomes. Journal of School Psychology. 2005; 43:343–375.
Cronbach LJ. The two disciplines of scientific psychology. American Psychologist. 1957; 12:671–684.Cronbach, LJ.; Snow, RE. Aptitudes and instructional methods: A handbook for research on
interactions. New York: Irvington; 1977.Cronbach LJ, Webb N. Between-class and within-class effects in a reported aptitude X treatment
interaction: Reanalysis of a study by G. L. Anderson. Journal of Educational Psychology. 1975;67:717–724.
Darling-Hammond, L. Teacher quality and student achievement: A review of state policy evidence[Electronic Version]. Educational Policy Analysis and Archives. 2000. fromhttp://epaa.asu.edu/epaa/v8n1/
Connor et al. Page 19
Child Dev. Author manuscript; available in PMC 2010 January 1.
NIH
-PA Author Manuscript
NIH
-PA Author Manuscript
NIH
-PA Author Manuscript

DuFour, R.; Eaker, R. Professional learning communities at work: best practices for enhancing studentachievement. Alexandria, VA: Association for Supervision and Curriculum Development; 1998.
Fielding, L.; Kerr, N.; Rosier, P. Annual growth for all students, catch-up growth for those who arebehind. Kennewick, WA: The New Foundation Press; 2007.
Foorman BR, Francis DJ, Fletcher JM, Schatschneider C, Mehta P. The role of instruction in learningto read: Preventing reading failure in at risk children. Journal of Educational Psychology. 1998;90:37–55.
Foorman BR, Schatschneider C, Eakin MN, Fletcher JM, Moats LC, Francis DJ. The impact ofinstructional practices in grades 1 and 2 on reading and spelling achievement in high povertyschools. Contemporary Educational Psychology. 2006; 31:1–29.
Ford, DH.; Lerner, RM. Developmental systems theory: An integrative approach. Thousand Oaks, CA:Sage; 1992.
Freeman GD, King JL. A partnership for school readiness. Educational Leadership. 2003; 60:76–79.Fuchs D, Mock D, Morgan PL, Young CL. Responsiveness-to-intervention: Definitions, evidence, and
implications for the learning disabilities construct. Learning Disabilities Research & Practice.2003; 18:157–171.
Fuchs LS, Fuch D, Phillips N. The relation between teachers’ beliefs about the importance of goodstudent work habits, teacher planning, and student achievement. Elementary School Journal. 1994;94:331–345.
Gersten R, Chard D, Baker S. Factors enhancing sustained use of research-based practices. Journal ofLearning Disabilities. 2000; 33:445–457. [PubMed: 15495547]
Goldhaber DD, Brewer DJ. Does teacher certification matter? High school teacher certification statusand student achievement. Educational Evaluation and Policy Analysis. 2000; 22:129–146.
Hamre BK, Pianta RC. Can instructional and emotional support in the first-grade classroom make adifference for children at risk of school failure? Child Development. 2005; 76:949–967. [PubMed:16149994]
Helterbran VR, Fennimore BS. Collaborative early childhood professional development: building froma base of teacher investigation. Early Childhood Education Journal. 2004; 31:267–271.
Juel C, Minden-Cupp C. Learning to read words: Linguistic units and instructional strategies. ReadingResearch Quarterly. 2000; 35:458–492.
Landis JR, Koch GG. The measurement of observer agreement for categorical data. Biometrics. 1977;33:159–174. [PubMed: 843571]
Lave, J.; Wenger, E. Situate learning legitimate peripheral participation. Cambridge: CambridgeUniversity Press; 1991.
Lo, MY. Statistical analysis of interpretation and its application to data from the cooperative researchprogram in primary reading instruction Unpublished Dissertation. State University of New York;Buffalo, Buffalo: 1973.
Mather N, Bos C, Babur N. Perceptions and knowledge of preservice and inservice teachers aboutearly literacy instruction. Journal of Learning Disabilities. 2001; 34:472–482. [PubMed:15503595]
Mather, N.; Woodcock, RW. Woodcock Johnson III tests of achievement: Examiner’s manual. Itasca,IL: Riverside; 2001.
Mathes PG, Denton CA, Fletcher JM, Anthony JL, Francis DJ, Schatschneider C. The effects oftheoretically different instruction and student characteristics on the skills of struggling readers.Reading Research Quarterly. 2005; 40:148–182.
Moats LC. The missing foundation in teacher education: Knowledge of the structure of spoken andwritten language. Annals of Dyslexia. 1994; 44:81–102.
Moats LC, Foorman BR. Measuring teachers’ content knowledge of language and reading. Annals ofDyslexia. 2003; 53:23–45.
Morrison, FJ.; Bachman, HJ.; Connor, CM. Improving literacy in America: Guidelines from research.New Haven, CT: Yale University Press; 2005.
NAEP. The nation’s report card. Washington DC: National Center for Education Statisticso.Document Number); 2005.
Connor et al. Page 20
Child Dev. Author manuscript; available in PMC 2010 January 1.
NIH
-PA Author Manuscript
NIH
-PA Author Manuscript
NIH
-PA Author Manuscript
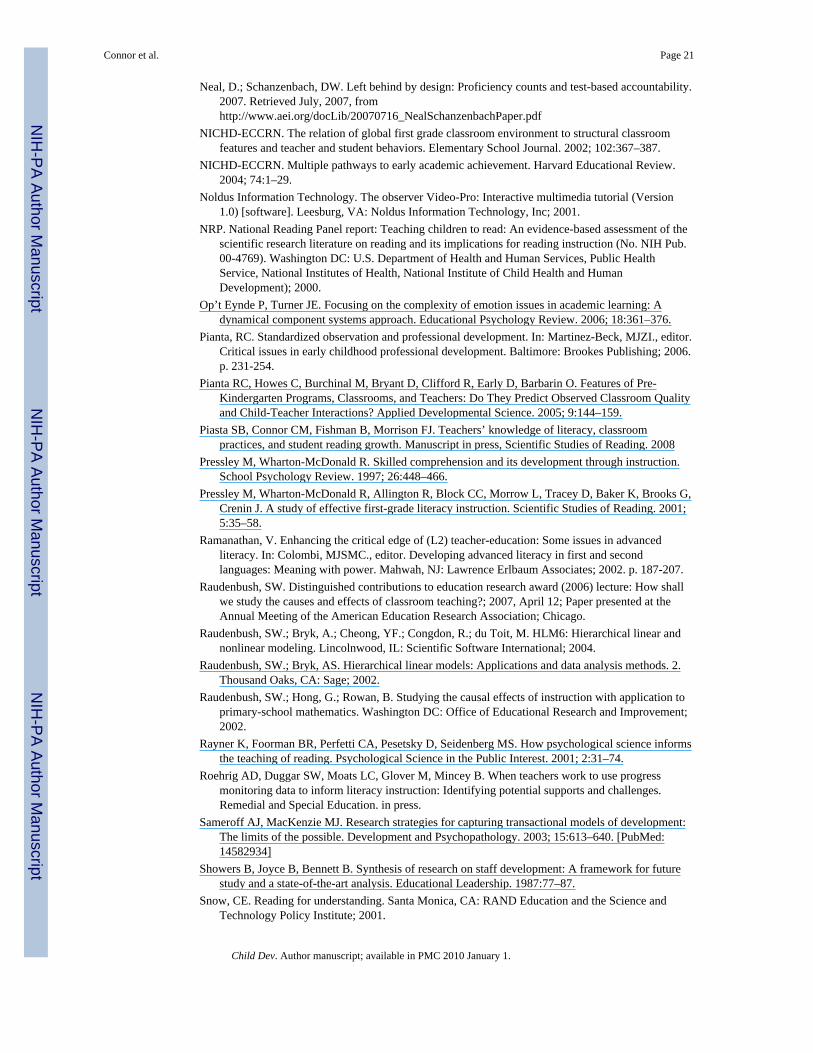
Neal, D.; Schanzenbach, DW. Left behind by design: Proficiency counts and test-based accountability.2007. Retrieved July, 2007, fromhttp://www.aei.org/docLib/20070716_NealSchanzenbachPaper.pdf
NICHD-ECCRN. The relation of global first grade classroom environment to structural classroomfeatures and teacher and student behaviors. Elementary School Journal. 2002; 102:367–387.
NICHD-ECCRN. Multiple pathways to early academic achievement. Harvard Educational Review.2004; 74:1–29.
Noldus Information Technology. The observer Video-Pro: Interactive multimedia tutorial (Version1.0) [software]. Leesburg, VA: Noldus Information Technology, Inc; 2001.
NRP. National Reading Panel report: Teaching children to read: An evidence-based assessment of thescientific research literature on reading and its implications for reading instruction (No. NIH Pub.00-4769). Washington DC: U.S. Department of Health and Human Services, Public HealthService, National Institutes of Health, National Institute of Child Health and HumanDevelopment); 2000.
Op’t Eynde P, Turner JE. Focusing on the complexity of emotion issues in academic learning: Adynamical component systems approach. Educational Psychology Review. 2006; 18:361–376.
Pianta, RC. Standardized observation and professional development. In: Martinez-Beck, MJZI., editor.Critical issues in early childhood professional development. Baltimore: Brookes Publishing; 2006.p. 231-254.
Pianta RC, Howes C, Burchinal M, Bryant D, Clifford R, Early D, Barbarin O. Features of Pre-Kindergarten Programs, Classrooms, and Teachers: Do They Predict Observed Classroom Qualityand Child-Teacher Interactions? Applied Developmental Science. 2005; 9:144–159.
Piasta SB, Connor CM, Fishman B, Morrison FJ. Teachers’ knowledge of literacy, classroompractices, and student reading growth. Manuscript in press, Scientific Studies of Reading. 2008
Pressley M, Wharton-McDonald R. Skilled comprehension and its development through instruction.School Psychology Review. 1997; 26:448–466.
Pressley M, Wharton-McDonald R, Allington R, Block CC, Morrow L, Tracey D, Baker K, Brooks G,Crenin J. A study of effective first-grade literacy instruction. Scientific Studies of Reading. 2001;5:35–58.
Ramanathan, V. Enhancing the critical edge of (L2) teacher-education: Some issues in advancedliteracy. In: Colombi, MJSMC., editor. Developing advanced literacy in first and secondlanguages: Meaning with power. Mahwah, NJ: Lawrence Erlbaum Associates; 2002. p. 187-207.
Raudenbush, SW. Distinguished contributions to education research award (2006) lecture: How shallwe study the causes and effects of classroom teaching?; 2007, April 12; Paper presented at theAnnual Meeting of the American Education Research Association; Chicago.
Raudenbush, SW.; Bryk, A.; Cheong, YF.; Congdon, R.; du Toit, M. HLM6: Hierarchical linear andnonlinear modeling. Lincolnwood, IL: Scientific Software International; 2004.
Raudenbush, SW.; Bryk, AS. Hierarchical linear models: Applications and data analysis methods. 2.Thousand Oaks, CA: Sage; 2002.
Raudenbush, SW.; Hong, G.; Rowan, B. Studying the causal effects of instruction with application toprimary-school mathematics. Washington DC: Office of Educational Research and Improvement;2002.
Rayner K, Foorman BR, Perfetti CA, Pesetsky D, Seidenberg MS. How psychological science informsthe teaching of reading. Psychological Science in the Public Interest. 2001; 2:31–74.
Roehrig AD, Duggar SW, Moats LC, Glover M, Mincey B. When teachers work to use progressmonitoring data to inform literacy instruction: Identifying potential supports and challenges.Remedial and Special Education. in press.
Sameroff AJ, MacKenzie MJ. Research strategies for capturing transactional models of development:The limits of the possible. Development and Psychopathology. 2003; 15:613–640. [PubMed:14582934]
Showers B, Joyce B, Bennett B. Synthesis of research on staff development: A framework for futurestudy and a state-of-the-art analysis. Educational Leadership. 1987:77–87.
Snow, CE. Reading for understanding. Santa Monica, CA: RAND Education and the Science andTechnology Policy Institute; 2001.
Connor et al. Page 21
Child Dev. Author manuscript; available in PMC 2010 January 1.
NIH
-PA Author Manuscript
NIH
-PA Author Manuscript
NIH
-PA Author Manuscript

Snow, CE.; Burns, MS.; Griffin, P., editors. Preventing reading difficulties in young children.Washington, DC: National Academy Press; 1998.
Snow RE. Aptitude-treatment interaction as a framework for research on individual differences inpsychotherapy. Journal of Consulting and Clinical Psychology. 1991; 59:205–216. [PubMed:2030178]
Taylor BM, Pearson DP, Clark K, Walpole S. Effective schools and accomplished teachers: lessonsabout primary-grade reading instruction in low-income schools. Elementary School Journal. 2000;101:121–165.
US DOE. No child left behind: A toolkit for teachers. Washington DC: US Department of Education,Office of the Deputy Secretary; 2004.
Vaughn S, Coleman M. The role of mentoring in promoting use of research-based practices in reading.Remedial and Special Education. 2004; 25:25–38.
Viadero, D. NCLB Seen as Curbing Low, High Achievers’ Gains [Electronic Version]; EducationalWeek. 2007. p. 7Retrieved July 2007, fromhttp://lnk.edweek.org/edweek/index.html?url=/ew/articles/2007/07/16/43nclb_web.h26.html&tkn=HN0YoGR4vSrb8IGv%2FEqP44BxjGf7b%2BBy
Wharton-McDonald R, Pressley M, Hampston JM. Literacy instruction in nine first-grade classrooms:Teacher characteristics and student achievement. Elementary School Journal. 1998; 99:101–128.
Xue Y, Meisels SJ. Early literacy instruction and learning in kindergarten: Evidence from the earlychildhood longitudinal study -- kindergarten class of 1998–1999. American Educational ResearchJournal. 2004; 41:191–229.
Appendix A
Algorithms for Recommended Amounts of Child-managed Meaning-focused (CMMF) instruction
The A2i algorithm for CMMF works in the same way as for TCMCF using the followingsteps. The assessment metric is Age Equivalent (AE) in years. CMMF-A is the amount,CMMF-S is the slope (minutes/month), and CMMF-Recommended is the amount that isprovided by the A2i software.
1. CMMF-A = ((3.76 − TO + 1.4*Vocabulary AE))/(.30)) − 14
2. CMMF-S = 10 − (.24*CMMF-A)
3. CMMF-Recommended = CMMF-A + .5*(CMMF-S*Month)
Thus the algorithms recommend that children with stronger vocabulary skills receive fairlyhigh amounts of CM-MF throughout the school year in contrast to children with weakerskills. For these children, small amounts in the fall with increases each month through theend of the school year are recommended. The fall amount and magnitude of the increasedepends on the child’s vocabulary skills.
Appendix B
The ISI Intervention in the ClassroomThere was considerable variability across the treatment group classrooms in how fully theISI intervention was implemented (Connor et al., 2007a). Thus, it is useful to consider whatcomprised full implementation, which was the goal of the professional developmentprovided. Teachers used the schools’ core reading curriculum supplemented with otherresearch-supported literacy activities during the schools’ two hour literacy block. Childrenin the same classroom were at different levels or lessons within the curriculum depending ontheir assessed reading skills. Explicit teacher/child-managed instruction, both-code and
Connor et al. Page 22
Child Dev. Author manuscript; available in PMC 2010 January 1.
NIH
-PA Author Manuscript
NIH
-PA Author Manuscript
NIH
-PA Author Manuscript

meaning-focused activities, were provided for the A2i recommended amounts of time insmaller groups. Group size varied from as many as 8 children to as few as one or two.Homogeneous groups based on learning needs were used consistently (Taylor et al., 2000;Wharton-McDonald et al., 1998) and there was a clear plan of instruction (Borko & Niles,1987; L. S. Fuchs, Fuch, & Phillips, 1994), using either the A2i lesson plan or other districtapproved lesson plan.
Children followed a daily routine with a clearly displayed organizational chart showingthem where to go and what to do (J. E. Brophy, 1979; Cameron, Connor, & Morrison, 20052005). During child-managed activities, students worked individually, in small groups, pairsor accomplished seat work. These activities were designed to provide practice for skills thathad been learned during teacher/child-managed instruction. Center activities and materialsdeveloped by the Florida Center for Reading Research(http://www.fcrr.org/curriculum/studentCenterActivities.htm) were provided to allintervention teachers and were available to teachers in the comparison group. Classroommanagement was important (J. E. Brophy, 1979; J.E. Brophy & Good, 1986), transitionswere quick and well rehearsed (Wharton-McDonald et al., 1998), and all of the childrenwere engaged in meaningful literacy activities for virtually the entire literacy block (Pressleyet al., 2001; Taylor et al., 2000; Wharton-McDonald et al., 1998).
Connor et al. Page 23
Child Dev. Author manuscript; available in PMC 2010 January 1.
NIH
-PA Author Manuscript
NIH
-PA Author Manuscript
NIH
-PA Author Manuscript

Figure 1.Comparing the effects of Distance from Recommendation (DFR, the absolute value of thedifference between the recommended and observed amounts of instruction) for instructiontypes on standard scores for Letter-word identification (LW) and Passage Comprehension(PC). Standard scores have a mean of 100 and a standard deviation of 15. Effect sizesincrease with decreasing DFR. DFR range on the x-axis represents the 90th to the 10th
percentile of the sample. All other variables, including TMCF DFR slope, were heldconstant at their sample mean.
Connor et al. Page 24
Child Dev. Author manuscript; available in PMC 2010 January 1.
NIH
-PA Author Manuscript
NIH
-PA Author Manuscript
NIH
-PA Author Manuscript
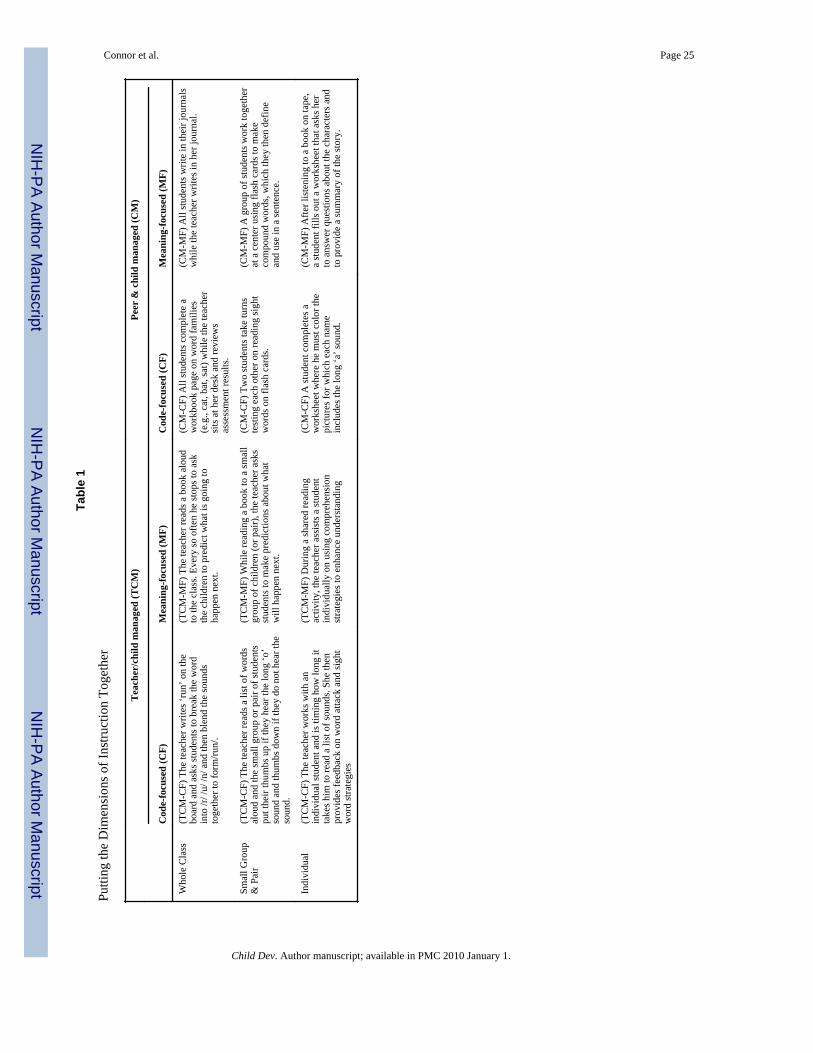
NIH
-PA Author Manuscript
NIH
-PA Author Manuscript
NIH
-PA Author Manuscript
Connor et al. Page 25
Tabl
e 1
Putti
ng th
e D
imen
sion
s of I
nstru
ctio
n To
geth
er
Tea
cher
/chi
ld m
anag
ed (T
CM
)Pe
er &
chi
ld m
anag
ed (C
M)
Cod
e-fo
cuse
d (C
F)M
eani
ng-fo
cuse
d (M
F)C
ode-
focu
sed
(CF)
Mea
ning
-focu
sed
(MF)
Who
le C
lass
(TC
M-C
F) T
he te
ache
r writ
es ‘r
un’ o
n th
ebo
ard
and
asks
stud
ents
to b
reak
the
wor
din
to /r
/ /u/
/n/ a
nd th
en b
lend
the
soun
dsto
geth
er to
form
/run/
.
(TC
M-M
F) T
he te
ache
r rea
ds a
boo
k al
oud
to th
e cl
ass.
Ever
y so
ofte
n he
stop
s to
ask
the
child
ren
to p
redi
ct w
hat i
s goi
ng to
happ
en n
ext.
(CM
-CF)
All
stud
ents
com
plet
e a
wor
kboo
k pa
ge o
n w
ord
fam
ilies
(e.g
., ca
t, ba
t, sa
t) w
hile
the
teac
her
sits
at h
er d
esk
and
revi
ews
asse
ssm
ent r
esul
ts.
(CM
-MF)
All
stud
ents
writ
e in
thei
r jou
rnal
sw
hile
the
teac
her w
rites
in h
er jo
urna
l.
Smal
l Gro
up&
Pai
r(T
CM
-CF)
The
teac
her r
eads
a li
st o
f wor
dsal
oud
and
the
smal
l gro
up o
r pai
r of s
tude
nts
put t
heir
thum
bs u
p if
they
hea
r the
long
‘o’
soun
d an
d th
umbs
dow
n if
they
do
not h
ear t
heso
und.
(TC
M-M
F) W
hile
read
ing
a bo
ok to
a sm
all
grou
p of
chi
ldre
n (o
r pai
r), t
he te
ache
r ask
sst
uden
ts to
mak
e pr
edic
tions
abo
ut w
hat
will
hap
pen
next
.
(CM
-CF)
Tw
o st
uden
ts ta
ke tu
rns
test
ing
each
oth
er o
n re
adin
g si
ght
wor
ds o
n fla
sh c
ards
.
(CM
-MF)
A g
roup
of s
tude
nts w
ork
toge
ther
at a
cen
ter u
sing
flas
h ca
rds t
o m
ake
com
poun
d w
ords
, whi
ch th
ey th
en d
efin
ean
d us
e in
a se
nten
ce.
Indi
vidu
al(T
CM
-CF)
The
teac
her w
orks
with
an
indi
vidu
al st
uden
t and
is ti
min
g ho
w lo
ng it
take
s him
to re
ad a
list
of s
ound
s. Sh
e th
enpr
ovid
es fe
edba
ck o
n w
ord
atta
ck a
nd si
ght
wor
d st
rate
gies
(TC
M-M
F) D
urin
g a
shar
ed re
adin
gac
tivity
, the
teac
her a
ssis
ts a
stud
ent
indi
vidu
ally
on
usin
g co
mpr
ehen
sion
stra
tegi
es to
enh
ance
und
erst
andi
ng
(CM
-CF)
A st
uden
t com
plet
es a
wor
kshe
et w
here
he
mus
t col
or th
epi
ctur
es fo
r whi
ch e
ach
nam
ein
clud
es th
e lo
ng ‘a
’ sou
nd.
(CM
-MF)
Afte
r lis
teni
ng to
a b
ook
on ta
pe,
a st
uden
t fill
s out
a w
orks
heet
that
ask
s her
to a
nsw
er q
uest
ions
abo
ut th
e ch
arac
ters
and
to p
rovi
de a
sum
mar
y of
the
stor
y.
Child Dev. Author manuscript; available in PMC 2010 January 1.

NIH
-PA Author Manuscript
NIH
-PA Author Manuscript
NIH
-PA Author Manuscript
Connor et al. Page 26
Tabl
e 2
Scho
ol D
escr
iptiv
es
Scho
olPe
rcen
tage
of s
tude
nts e
ligib
le fo
r Fr
ee a
ndR
educ
ed L
unch
Rea
ding
Fir
stM
ean
Thi
rd G
rade
FC
AT
Rea
ding
Scor
eC
ore
Cur
ricu
lum
Tot
al #
of f
irst
gra
de c
lass
room
sIn
terv
entio
n G
roup
193
yes
278
Rea
ding
Mas
tery
3no
296
yes
286
Ope
n C
ourt
6ye
s
388
yes
286
Ope
n C
ourt
6no
482
yes
296
Rea
ding
Mas
tery
5ye
s
569
no29
4O
pen
Cou
rt4
yes
667
no31
6O
pen
Cou
rt5
yes
757
yes
297
Ope
n C
ourt
5no
837
no32
6O
pen
Cou
rt7
no
929
no34
9O
pen
Cou
rt5
yes
1024
no34
0O
pen
Cou
rt6
no
Not
e. In
terv
entio
n G
roup
: yes
= tr
eatm
ent,
no =
con
trol;
Rea
ding
Firs
t: ye
s = R
eadi
ng F
irst,
no =
Not
Rea
ding
Firs
t
Child Dev. Author manuscript; available in PMC 2010 January 1.

NIH
-PA Author Manuscript
NIH
-PA Author Manuscript
NIH
-PA Author Manuscript
Connor et al. Page 27
Tabl
e 3
Teac
her a
nd S
choo
l Des
crip
tives
95%
Con
fiden
ce In
terv
al
Dep
ende
nt V
aria
ble
Gro
upM
ean
Std.
Err
orL
ower
Bou
ndU
pper
Bou
nd
Scho
ol P
erce
ntag
e of
Chi
ldre
n El
igib
le fo
r Fre
e or
Red
uced
Pric
e Lu
nch
(FR
L, (0
=not
elig
ible
, 1=e
ligib
le)
Com
paris
on51
.083
4.35
642
.305
59.8
62
Inte
rven
tion
76.3
184.
549
67.1
4985
.487
Rea
ding
Firs
t ( 1
= R
eadi
ng F
irst,
0= N
ot R
eadi
ng F
irst s
o m
ean
repr
esen
ts p
ropo
rtion
)C
ompa
rison
.458
.104
.248
.668
Inte
rven
tion
.500
.109
.281
.719
Teac
her K
now
ledg
e Su
rvey
tota
l cor
rect
fall1
Com
paris
on27
.500
1.21
725
.048
29.9
52
Inte
rven
tion
17.6
361.
271
15.0
7520
.197
Teac
her K
now
ledg
e Su
rvey
gai
n fr
om fa
ll to
sprin
gC
ompa
rison
.083
1.65
6−3.254
3.42
0
Inte
rven
tion
5.36
41.
729
1.87
88.
849
Hig
her D
egre
e (1
= H
ighe
r deg
ree
atta
ined
, 0=
No
high
er d
egre
e)C
ompa
rison
.208
.104
.000
.418
Inte
rven
tion
.455
.109
.236
.673
Yea
rs te
achi
ng e
xper
ienc
eC
ompa
rison
9.95
82.
032
5.86
314
.053
Inte
rven
tion
11.4
892.
122
7.21
215
.766
Yea
rs te
achi
ng G
rade
1C
ompa
rison
5.70
81.
122
3.44
87.
969
Inte
rven
tion
4.23
91.
172
1.87
76.
600
1 The
high
est p
ossi
ble
scor
e on
the
Teac
her K
now
ledg
e Su
rvey
is 4
0 po
ints
.
Child Dev. Author manuscript; available in PMC 2010 January 1.

NIH
-PA Author Manuscript
NIH
-PA Author Manuscript
NIH
-PA Author Manuscript
Connor et al. Page 28
Table 4
HLM Descriptives for Student- and Classroom-level Variables
Level 1 Student Descriptive Statistics
Mean SD Minimum Maximum
Number of Times Observed 2.67 0.61 1.00 3.00
Fall WJ Letter-Word W Score 410.38 31.14 324.00 519.00
Fall WJ Letter-Word Standard Score 104.01 16.71 50.00 194.00
Fall WJ Picture Vocabulary W Score 479.02 10.91 442.00 513.00
Fall WJ Picture Vocabulary Standard Score 102.31 11.15 71.00 139.00
Fall WJ Passage Comprehension W Score 449.60 21.09 377.00 497.00
Fall WJ Passage Comprehension Standard Score 100.17 15.46 44.00 148.00
Spring WJ Letter-Word W Score 454.61 25.51 367.00 525.00
Spring WJ Letter-Word Standard Score 109.72 14.28 60.00 149.00
Spring WJ Passage Comprehension W Score 466.27 15.79 404.00 506.00
Spring WJ Passage Comprehension Standard Score 102.09 12.86 64.00 136.00
Spring WJ Picture Vocabulary W Score 483.48 10.72 456.00 528.00
Spring WJ Picture Vocabulary Standard Score 102.72 10.88 77.00 149.00
Teacher/Child-Managed Code-Focused Amount Total 6.34 4.23 1.37 30.05
Child-Managed Meaning-Focused Amount Total 21.01 6.85 7.85 48.42
Teacher/Child-Managed Meaning Focused Amount Total 11.63 5.07 3.79 26.39
Child-Managed Code-Focused Amount Total 9.83 4.15 4.57 25.61
Teacher/Child-Managed Code-Focused Distance from Recommendation Amount 19.62 2.29 12.95 27.84
Teacher/Child-Managed Code-Focused Distance from Recommendation Slope −0.71 0.60 −3.15 1.00
Child-Managed Meaning-Focused Distance from Recommendation Amount 21.04 5.07 10.07 33.09
Child-Managed Meaning-Focused Distance from Recommendation Slope 0.57 0.41 −0.63 1.57
Level 2 – Classroom Descriptive Statistics Mean SD Minimum Maximum
24.8
Percentage of Students Eligible for FRL 62.43 8 24.00 96.00
School Participates in Reading First (=1) 0.47 0.50 0.00 1.00
Teacher in Intervention Group (=1) 0.49 0.51 0.00 1.00
Teacher Knowledge Survey Fall Score 22.77 7.63 9.00 36.00
Teacher Knowledge Survey Gain (Fall to Spring) 2.94 8.66 −19.00 20.00
Years of Education beyond Bachelor 0.32 0.52 0.00 2.00
Child Dev. Author manuscript; available in PMC 2010 January 1.

NIH
-PA Author Manuscript
NIH
-PA Author Manuscript
NIH
-PA Author Manuscript
Connor et al. Page 29
Tabl
e 5
Cor
rela
tions
Fall
WJ
Pict
ure
Voc
abul
ary
W S
core
Fall
WJ
Pass
age
Com
preh
ensi
on W
Sco
reSp
ring
WJ
Let
ter-
wor
d W
Sco
reSp
ring
WJ
Pass
age
Com
preh
ensi
on W
Sco
reSp
ring
WJ
Pict
ure
Voc
abul
ary
W S
core
Fall
WJ L
ette
r-w
ord
W S
core
.367
(** )
.795
(** )
.769
(** )
.677
(** )
.446
(** )
Fall
WJ P
ictu
re V
ocab
ular
y W
Sco
re-
.368
(** )
.302
(** )
.403
(** )
.735
(** )
Fall
WJ P
assa
ge C
ompr
ehen
sion
W S
core
-.7
33(*
* ).6
92(*
* ).4
04(*
* )
Sprin
g W
J Let
ter-
wor
d W
Sco
re-
.845
(** )
.398
(** )
Sprin
g W
J Pas
sage
Com
preh
ensi
on W
Sco
re-
.492
(** )
**N
ote.
Cor
rela
tion
is si
gnifi
cant
at t
he 0
.01
leve
l (2-
taile
d).
Child Dev. Author manuscript; available in PMC 2010 January 1.

NIH
-PA Author Manuscript
NIH
-PA Author Manuscript
NIH
-PA Author Manuscript
Connor et al. Page 30
Table 6
Mean Amounts of Literacy Instruction for all Observations by Content Summed across Grouping andManagement
Literacy Activity Mean (minutes) SD Minimum Maximum
Text reading total 17.48 19.86 .00 196.08
Word identification encoding total 10.83 15.23 .00 118.47
Writing total 10.22 16.88 .00 154.30
Comprehension total 9.22 11.55 .00 94.19
Print vocabulary total 8.50 9.84 .00 112.18
Word identification decoding total 7.98 10.19 .00 105.27
Grapheme-phoneme correspondence total 4.48 7.75 .00 63.45
Phonological awareness combined total 1.99 4.79 .00 64.71
Print concepts total 1.73 5.70 .00 59.49
Oral language total 1.63 3.47 .00 26.49
Sentence and text fluency total 1.07 3.37 .00 40.61
Phonological awareness total 1.05 3.03 .00 38.17
Letter and word fluency total 1.02 4.01 .00 67.36
Onset-rime total .69 3.51 .00 63.53
Morphological awareness total .63 2.50 .00 31.41
Oral vocabulary total .43 1.22 .00 8.04
Syllable awareness total .25 .94 .00 8.54
Child Dev. Author manuscript; available in PMC 2010 January 1.

NIH
-PA Author Manuscript
NIH
-PA Author Manuscript
NIH
-PA Author Manuscript
Connor et al. Page 31
Tabl
e 7
Effe
cts o
f Tot
al A
mou
nts o
f Ins
truct
ion
for S
prin
g Le
tter-
Wor
d R
eadi
ng (t
op) a
nd P
assa
ge C
ompr
ehen
sion
(bot
tom
)
Spri
ng W
J L
ette
r-W
ord
Out
com
e Sc
ore
as a
Fun
ctio
n of
Tot
al A
mou
nts o
f Ins
truc
tion
in M
inut
es
Fixe
d E
ffect
Coe
ffici
ent
Stan
dard
Err
ort-r
atio
App
rox.
df
p- v
alue
Sprin
g W
J Let
ter-
Wor
d W
Inte
rcep
t45
4.77
01.
751
259.
732
44<0
.001
Chi
ld L
evel
Var
iabl
es
N
umbe
r of T
imes
Obs
erve
d1.
032
1.36
30.
757
448
0.44
9
Fa
ll W
J Let
ter-
Wor
d W
scor
e0.
411
0.04
29.
818
448
0.00
0
Fa
ll W
J Pic
ture
Voc
abul
ary
W sc
ore
−0.009
0.06
6−0.130
448
0.89
7
Fa
ll W
J Pas
sage
Com
preh
ensi
on W
scor
e0.
380
0.06
75.
640
448
<0.0
01
Te
ache
r/Chi
ld-M
anag
ed C
ode-
Focu
sed
Am
ount
0.17
40.
248
0.70
244
80.
483
C
hild
-Man
aged
Mea
ning
-Foc
used
Am
ount
0.06
60.
135
0.48
644
80.
627
Te
ache
r/Chi
ld-M
anag
ed M
eani
ng-F
ocus
ed A
mou
nt0.
361
0.19
21.
882
448
0.06
0
C
hild
-Man
aged
Cod
e-Fo
cuse
d A
mou
nt−0.032
0.24
6−0.130
448
0.89
7
Cla
ssro
om L
evel
Var
iabl
es
Pe
rcen
t of S
tude
nts E
ligib
le fo
r FR
L−0.046
0.05
8−0.792
440.
433
R
eadi
ng F
irst
−0.215
3.17
2−0.068
440.
947
Ran
dom
Eff
ect
Stan
dard
Dev
iatio
nV
aria
nce
Com
pone
ntdf
Chi
- Squ
are
p-va
lue
Bet
wee
n C
lass
room
Res
idua
l4.
012
16.0
9344
80.1
490.
001
With
in C
lass
room
Res
idua
l14
.611
213.
494
Dev
ianc
e37
88.3
30
Spri
ng W
J Pa
ssag
e C
ompr
ehen
sion
Sco
re a
s a F
unct
ion
of T
otal
Am
ount
s of I
nstr
uctio
n in
Min
utes
Fixe
d Ef
fect
Coe
ffic
ient
Stan
dard
Err
ort-r
atio
App
rox.
d.f.
p-va
lue
Sprin
g W
J Pas
sage
Com
preh
ensi
on W
Sco
re In
terc
ept
466.
839
1.13
940
9.94
944
<0.0
01
Chi
ld L
evel
Var
iabl
es
N
umbe
r of T
imes
Obs
erve
d1.
307
0.86
11.
519
448
0.12
9
W
J Fal
l Let
ter-
Wor
d W
scor
e0.
147
0.02
75.
446
448
<0.0
01
W
J Fal
l Pic
ture
Voc
abul
ary
W sc
ore
0.19
50.
048
4.07
944
8<0
.001
W
J Fal
l Pas
sage
Com
preh
ensi
on W
scor
e0.
262
0.04
36.
063
448
<0.0
01
Child Dev. Author manuscript; available in PMC 2010 January 1.
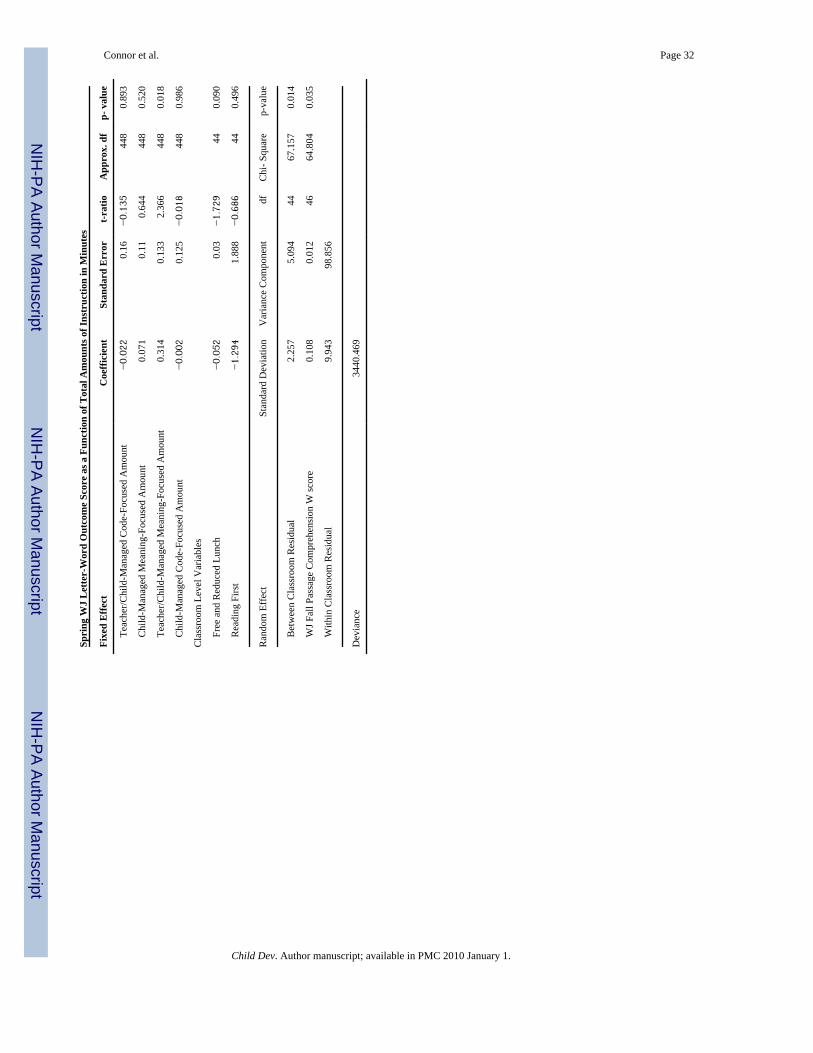
NIH
-PA Author Manuscript
NIH
-PA Author Manuscript
NIH
-PA Author Manuscript
Connor et al. Page 32
Spri
ng W
J L
ette
r-W
ord
Out
com
e Sc
ore
as a
Fun
ctio
n of
Tot
al A
mou
nts o
f Ins
truc
tion
in M
inut
es
Fixe
d E
ffect
Coe
ffici
ent
Stan
dard
Err
ort-r
atio
App
rox.
df
p- v
alue
Te
ache
r/Chi
ld-M
anag
ed C
ode-
Focu
sed
Am
ount
−0.022
0.16
−0.135
448
0.89
3
C
hild
-Man
aged
Mea
ning
-Foc
used
Am
ount
0.07
10.
110.
644
448
0.52
0
Te
ache
r/Chi
ld-M
anag
ed M
eani
ng-F
ocus
ed A
mou
nt0.
314
0.13
32.
366
448
0.01
8
C
hild
-Man
aged
Cod
e-Fo
cuse
d A
mou
nt−0.002
0.12
5−0.018
448
0.98
6
Cla
ssro
om L
evel
Var
iabl
es
Fr
ee a
nd R
educ
ed L
unch
−0.052
0.03
−1.729
440.
090
R
eadi
ng F
irst
−1.294
1.88
8−0.686
440.
496
Ran
dom
Eff
ect
Stan
dard
Dev
iatio
nV
aria
nce
Com
pone
ntdf
Chi
- Squ
are
p-va
lue
B
etw
een
Cla
ssro
om R
esid
ual
2.25
75.
094
4467
.157
0.01
4
W
J Fal
l Pas
sage
Com
preh
ensi
on W
scor
e0.
108
0.01
246
64.8
040.
035
W
ithin
Cla
ssro
om R
esid
ual
9.94
398
.856
Dev
ianc
e34
40.4
69
Child Dev. Author manuscript; available in PMC 2010 January 1.

NIH
-PA Author Manuscript
NIH
-PA Author Manuscript
NIH
-PA Author Manuscript
Connor et al. Page 33
Tabl
e 8
Effe
cts o
f Dis
tanc
e fr
om R
ecom
men
ded
Am
ount
s of I
nstru
ctio
n (D
FR) f
or S
prin
g Le
tter-
Wor
d R
eadi
ng (t
op) a
nd P
assa
ge C
ompr
ehen
sion
(bot
tom
). D
FRis
the
abso
lute
val
ue o
f the
diff
eren
ce b
etw
een
the
reco
mm
ende
d an
d ob
serv
ed a
mou
nts o
f ins
truct
ion.
Spri
ng W
J L
ette
r-W
ord
Scor
e as
a F
unct
ion
of D
ista
nce
from
Rec
omm
ende
d A
mou
nts
Fixe
d E
ffect
Coe
ffici
ent
Stan
dard
Err
ort-r
atio
App
rox.
df
p-va
lue
Sprin
g W
J Let
ter-
Wor
d W
scor
e In
terc
ept
533.
731
15.9
9433
.371
44<0
.001
Chi
ld L
evel
Var
iabl
es
N
umbe
r of T
imes
Obs
erve
d0.
850
1.37
80.
617
449
0.53
7
Fa
ll W
J Let
ter-
Wor
d W
scor
e0.
427
0.04
010
.707
449
<0.0
01
Fa
ll W
J Pic
ture
Voc
abul
ary
W sc
ore
0.01
90.
073
0.25
844
90.
797
Fa
ll Pa
ssag
e C
ompr
ehen
sion
W sc
ore
0.36
40.
066
5.52
544
9<0
.001
Teac
her/C
hild
-Man
aged
Cod
e-Fo
cuse
d D
ista
nce
from
Rec
omm
ende
d A
mou
nt−4.170
0.97
0−4.298
449
<0.0
01
Teac
her/C
hild
-Man
aged
Cod
e-Fo
cuse
d D
ista
nce
from
Rec
omm
ende
d Sl
ope
−14.407
3.98
0−3.619
449
0.00
1
Chi
ld-M
anag
ed M
eani
ng-F
ocus
ed D
ista
nce
from
Rec
omm
ende
d A
mou
nt−0.339
0.14
4−2.352
449
0.01
9
Cla
ssro
om L
evel
Var
iabl
es
Pe
rcen
tage
of S
tude
nts E
ligib
le fo
r FR
L−0.032
0.06
5−0.495
440.
623
R
eadi
ng F
irst
−0.934
3.54
9−0.263
440.
794
Ran
dom
Eff
ect
Stan
dard
Dev
iatio
nV
aria
nce
Com
pone
ntd.
f.C
hi- S
quar
ep-
valu
e
B
etw
een
Cla
ssro
om R
esid
ual
3.99
315
.941
4480
.721
0.00
1
W
ithin
Cla
ssro
om R
esid
ual
14.4
5420
8.91
4
Dev
ianc
e37
78.6
09
Spri
ng W
J Pa
ssag
e C
ompr
ehen
sion
Sco
re O
utco
me
as a
Fun
ctio
n of
Dis
tanc
e fr
om R
ecom
men
ded
Amou
nts i
n M
inut
es
Fixe
d Ef
fect
Coe
ffic
ient
Stan
dard
Err
ort-r
atio
App
rox.
d.f.
p- v
alue
Sprin
g W
J Pas
sage
Com
preh
ensi
on W
scor
e In
terc
ept
522.
622
13.8
2637
.801
44<0
.001
Chi
ld L
evel
Var
iabl
es
N
umbe
r of T
imes
Obs
erve
d1.
143
0.88
41.
293
449
0.19
7
Fa
ll W
J Let
ter-
Wor
d W
scor
e0.
164
0.02
66.
391
449
<0.0
01
W
J Fal
l Pic
ture
Voc
abul
ary
W sc
ore
0.21
60.
054
3.99
744
9<0
.001
W
J Fal
l Pas
sage
Com
preh
ensi
on W
scor
e0.
248
0.04
35.
699
46<0
.001
Child Dev. Author manuscript; available in PMC 2010 January 1.

NIH
-PA Author Manuscript
NIH
-PA Author Manuscript
NIH
-PA Author Manuscript
Connor et al. Page 34
Spri
ng W
J L
ette
r-W
ord
Scor
e as
a F
unct
ion
of D
ista
nce
from
Rec
omm
ende
d A
mou
nts
Fixe
d E
ffect
Coe
ffici
ent
Stan
dard
Err
ort-r
atio
App
rox.
df
p-va
lue
Te
ache
r/Chi
ld-M
anag
ed C
ode-
Focu
sed
DFR
Am
ount
−2.938
0.80
7−3.640
449
0.00
1
Te
ache
r/Chi
ld-M
anag
ed C
ode-
Focu
sed
DFR
Slo
pe (m
inut
es/m
onth
)−10.541
3.42
3−3.080
449
0.00
3
C
hild
-Man
aged
Mea
ning
-Foc
used
Dis
tanc
e fr
om R
ecom
men
ded
amou
nt−0.253
0.09
9−2.561
449
0.01
1
Cla
ssro
om L
evel
Var
iabl
es
Fr
ee a
nd R
educ
ed L
unch
−0.035
0.03
4−1.031
440.
309
R
eadi
ng F
irst
−2.017
1.98
2−1.017
440.
315
Ran
dom
Eff
ect
Stan
dard
Dev
iatio
nV
aria
nce
Com
pone
tdf
Chi
- Squ
are
p-va
lue
Bet
wee
n C
lass
room
Res
idua
l2.
014
4.05
544
64.2
210.
025
Fall
WJ P
assa
ge C
ompr
ehen
sion
W sc
ore
0.10
80.
012
4667
.747
0.02
0
With
in C
lass
room
Res
idua
l9.
890
97.8
13
Dev
ianc
e34
33.5
00
Child Dev. Author manuscript; available in PMC 2010 January 1.

NIH
-PA Author Manuscript
NIH
-PA Author Manuscript
NIH
-PA Author Manuscript
Connor et al. Page 35
App
endi
x C
The
follo
win
g is
a sa
mpl
e tra
nscr
ipt o
f a c
oded
obs
erva
tion
follo
wed
by
sele
cted
cod
e de
finiti
ons.
The
com
plet
e co
ding
man
ual i
s ava
ilabl
e up
on re
ques
tfr
om th
e co
rres
pond
ing
auth
or. S
tart
time
and
end
time
are
in se
cond
s, tim
emin
repr
esen
ts th
e to
tal t
ime
in th
e ac
tivity
in m
inut
es. C
hild
-man
aged
inst
ruct
ion
is c
oded
as C
M a
nd te
ache
r/chi
ld-m
anag
ed in
stru
ctio
n is
cod
ed T
CM
. Not
e th
at a
ctiv
ities
are
cod
ed fo
r eac
h st
uden
t (se
e ch
ildid
).
Star
t tim
eE
nd ti
me
Tim
emin
child
idG
roup
ing
Man
agem
ent
Con
tent
Mod
ifier
1M
odifi
er 2
1517
.56
2306
.33
13.1
4617
AIn
divi
dual
CM
Non
inst
ruct
iona
lTr
ansi
tion/
Act
2306
.33
2500
3.22
7833
AW
hole
clas
sTC
MW
ordI
D/e
ncod
ing
Spel
ling/
Writ
ten
Pape
r/Pen
cil
252.
949
2.33
3.99
05B
Indi
vidu
alC
MN
onin
stru
ctio
nal
Tran
sitio
n/A
ct
492.
3368
4.63
3.20
5B
Indi
vidu
alC
MW
ordI
D/e
ncod
ing
Cop
ying
Pape
r/Pen
cil
684.
6320
10.8
322
.103
33B
Indi
vidu
alC
MW
ordI
D/e
ncod
ing
Cop
ying
Pape
r/Pen
cil
2010
.83
2306
.33
4.92
5B
Indi
vidu
alC
MN
onin
stru
ctio
nal
Dra
win
g/co
lorin
g
2306
.33
2500
3.22
7833
BW
hole
clas
sTC
MW
ordI
D/e
ncod
ing
Spel
ling/
Writ
ten
Pape
r/Pen
cil
633.
968
4.6
0.84
5C
Indi
vidu
alC
MN
onin
stru
ctio
nal
Tran
sitio
n/A
ct
684.
677
0.96
1.43
9333
CIn
divi
dual
CM
Non
inst
ruct
iona
lTr
ansi
tion/
Act
770.
9614
77.6
311
.777
83C
Indi
vidu
alC
MW
ordI
D/e
ncod
ing
Cop
ying
Pape
r/Pen
cil
1477
.63
2306
.33
13.8
1167
CIn
divi
dual
CM
Text
read
ing
SSR
Text
/Tra
debo
ok
2306
.33
2500
3.22
7833
CW
hole
clas
sTC
MW
ordI
D/e
ncod
ing
Spel
ling/
Writ
ten
Pape
r/Pen
cil
198.
9630
1.4
1.70
7333
DIn
divi
dual
CM
Non
inst
ruct
iona
lTr
ansi
tion/
Act
301.
468
4.63
6.38
7167
DIn
divi
dual
CM
Wor
dID
/enc
odin
gC
opyi
ngPa
per/P
enci
l
684.
6320
20.1
322
.258
33D
Indi
vidu
alC
MW
ordI
D/e
ncod
ing
Cop
ying
Pape
r/Pen
cil
2020
.13
2306
.33
4.77
DIn
divi
dual
CM
Text
read
ing
SSR
Text
/Tra
debo
ok
2306
.33
2500
3.22
7833
DW
hole
clas
sTC
MW
ordI
D/e
ncod
ing
Spel
ling/
Writ
ten
Pape
r/Pen
cil
641.
2668
4.63
0.72
2833
EIn
divi
dual
CM
Non
inst
ruct
iona
lTr
ansi
tion/
Act
684.
6398
6.03
5.02
3333
EIn
divi
dual
CM
Non
inst
ruct
iona
lTr
ansi
tion/
Act
986.
0317
45.4
312
.656
67E
Indi
vidu
alC
MW
ordI
D/e
ncod
ing
Cop
ying
Pape
r/Pen
cil
1745
.43
2306
.33
9.34
8333
EIn
divi
dual
CM
Text
read
ing
SSR
Text
/Tra
debo
ok
2306
.33
2500
3.22
7833
EW
hole
clas
sTC
MW
ordI
D/e
ncod
ing
Spel
ling/
Writ
ten
Pape
r/Pen
cil
105.
568
4.63
9.65
2167
FIn
divi
dual
Com
pute
rMM
F-TB
Dvo
cabu
lary
gam
es
684.
6310
95.1
6.84
1167
FIn
divi
dual
Com
pute
rMM
F-TB
D
1095
.119
88.1
14.8
8333
FIn
divi
dual
CM
Wor
dID
/enc
odin
gC
opyi
ngPa
per/P
enci
l
1988
.123
06.3
35.
3038
33F
Indi
vidu
alC
MTe
xtre
adin
gSS
RTe
xt/T
rade
book
2306
.33
2500
3.22
7833
FW
hole
clas
sTC
MW
ordI
D/e
ncod
ing
Spel
ling/
Writ
ten
Pape
r/Pen
cil
Child Dev. Author manuscript; available in PMC 2010 January 1.

NIH
-PA Author Manuscript
NIH
-PA Author Manuscript
NIH
-PA Author Manuscript
Connor et al. Page 36
Star
t tim
eE
nd ti
me
Tim
emin
child
idG
roup
ing
Man
agem
ent
Con
tent
Mod
ifier
1M
odifi
er 2
316.
2364
1.26
5.41
7167
GIn
divi
dual
CM
Non
inst
ruct
iona
lTr
ansi
tion/
Act
641.
2668
4.63
0.72
2833
GIn
divi
dual
CM
Wor
dID
/enc
odin
gC
opyi
ngPa
per/P
enci
l
684.
6314
91.5
13.4
4783
GIn
divi
dual
CM
Wor
dID
/enc
odin
gC
opyi
ngPa
per/P
enci
l
1491
.519
10.3
6.98
GIn
divi
dual
CM
Text
read
ing
SSR
Text
/Tra
debo
ok
1910
.322
11.3
35.
0171
67G
Indi
vidu
alC
ompu
terM
CF-
TBD
soun
d&sp
ellin
g_ac
tiviti
es
2211
.33
2306
.33
1.58
3333
GIn
divi
dual
CM
Wor
dID
/enc
odin
gC
opyi
ngPa
per/P
enci
l
2306
.33
2500
3.22
7833
GW
hole
clas
sTC
MW
ordI
D/e
ncod
ing
Spel
ling/
Writ
ten
Pape
r/Pen
cil
7.6
87.6
1.33
3333
HIn
divi
dual
CM
Non
inst
ruct
iona
lTr
ansi
tion/
Act
87.6
316.
233.
8105
HIn
divi
dual
CM
Non
inst
ruct
iona
lTr
ansi
tion/
Act
316.
2368
4.63
6.14
HIn
divi
dual
CM
Wor
dID
/enc
odin
gC
opyi
ngPa
per/P
enci
l
684.
6314
92.5
613
.465
5H
Indi
vidu
alC
MW
ordI
D/e
ncod
ing
Cop
ying
Pape
r/Pen
cil
1492
.56
2306
.33
13.5
6283
HIn
divi
dual
CM
Non
inst
ruct
iona
lD
raw
ing/
colo
ring
2306
.33
2500
3.22
7833
HW
hole
clas
sTC
MW
ordI
D/e
ncod
ing
Spel
ling/
Writ
ten
Pape
r/Pen
cil
105.
530
1.4
3.26
5J
Indi
vidu
alC
MN
onin
stru
ctio
nal
Tran
sitio
n/A
ct
301.
468
4.63
6.38
7167
JIn
divi
dual
CM
Wor
dID
/enc
odin
gC
opyi
ngPa
per/P
enci
l
684.
6310
21.1
65.
6088
33J
Indi
vidu
alC
MW
ordI
D/e
ncod
ing
Cop
ying
Pape
r/Pen
cil
1021
.16
2306
.33
21.4
195
JIn
divi
dual
CM
Text
read
ing
SSR
2306
.33
2500
3.22
7833
JW
hole
clas
sTC
MW
ordI
D/e
ncod
ing
Spel
ling/
Writ
ten
Pape
r/Pen
cil
87.6
198.
931.
8555
KIn
divi
dual
CM
Non
inst
ruct
iona
lTr
ansi
tion/
Act
198.
9368
4.63
8.09
5K
Indi
vidu
alC
MW
ordI
D/e
ncod
ing
Cop
ying
Pape
r/Pen
cil
684.
6398
6.06
5.02
3833
KIn
divi
dual
CM
Wor
dID
/enc
odin
gC
opyi
ngPa
per/P
enci
l
986.
0623
06.3
322
.004
5K
Indi
vidu
alC
MTe
xtre
adin
gSS
R
2306
.33
2500
3.22
7833
KW
hole
clas
sTC
MW
ordI
D/e
ncod
ing
Spel
ling/
Writ
ten
Pape
r/Pen
cil
622
684.
631.
0438
33L
Indi
vidu
alC
MN
onin
stru
ctio
nal
Tran
sitio
n/A
ct
684.
6382
2.26
2.29
3833
LIn
divi
dual
CM
Non
inst
ruct
iona
lTr
ansi
tion/
Act
822.
2622
99.3
624
.618
33L
Indi
vidu
alC
MW
ordI
D/e
ncod
ing
Cop
ying
Pape
r/Pen
cil
2299
.36
2500
3.34
4L
Indi
vidu
alC
ompu
terM
Ass
essm
ent
Acc
eler
ated
Rea
der t
est
Sele
cted
Cod
e D
efin
ition
s:W
ord
Iden
tific
atio
n/En
codi
ng --
Sub
cate
gorie
s: S
ound
ing
Out
, Syl
labl
es, S
ylla
ble
Type
s, A
nalo
gy/W
ord
Fam
ilies
, Mor
phol
ogy,
Spe
lling
(Writ
ten,
Ora
l), R
ules
, Cop
ying
Wor
d Id
entif
icat
ion/
Enco
ding
was
cod
ed fo
r tho
se a
ctiv
ities
allo
win
g st
uden
ts to
dev
elop
and
pra
ctic
e th
eir s
pelli
ng sk
ills.
Thes
e ac
tiviti
es fo
cuse
d on
the
spel
ling
of si
ngle
wor
ds a
nd m
oved
from
pron
unci
atio
n to
prin
t. A
lso
incl
uded
in th
e W
ord
Iden
tific
atio
n/En
codi
ng c
ateg
ory
wer
e ac
tiviti
es in
whi
ch st
uden
ts c
opie
d si
ngle
wor
ds fr
om th
e bl
ackb
oard
(e.g
., co
pyin
g th
eir s
pelli
ng w
ords
for t
he w
eek)
and
activ
ities
in w
hich
stud
ents
gav
e or
al sp
ellin
gs o
f wor
ds.
Child Dev. Author manuscript; available in PMC 2010 January 1.

NIH
-PA Author Manuscript
NIH
-PA Author Manuscript
NIH
-PA Author Manuscript
Connor et al. Page 37Te
xt R
eadi
ng --
Sub
cate
gorie
s: R
eadi
ng A
loud
(Tea
cher
, Stu
dent
, Stu
dent
Cho
ral,
Teac
her/S
tude
nt C
hora
l, Te
chno
logy
), Si
lent
Sus
tain
ed R
eadi
ng
Text
Rea
ding
was
cod
ed fo
r act
iviti
es in
whi
ch c
onne
cted
text
was
read
with
out a
n ex
plic
it fo
cus o
n bu
ildin
g flu
ency
. Tex
t Rea
ding
act
iviti
es n
eces
saril
y in
volv
ed th
e us
e of
text
.
Non
inst
ruct
iona
l – S
ubca
tego
ries:
Dis
rupt
ion,
Dis
cipl
ine
(Ind
ivid
ual,
Cla
ss),
Wai
ting,
Tra
nsiti
on (A
ctiv
ity, C
lean
Up,
Lin
e U
p, B
athr
oom
), Lu
nch,
Sna
ck, N
ap, G
ame,
Fre
e Ti
me,
Son
g, S
witc
h M
ode,
Off
-Ta
sk
This
incl
udes
all
non-
acad
emic
act
iviti
es, d
efin
ed a
s tim
e sp
ent t
hat i
s not
dire
ctly
invo
lved
in in
stru
ctio
nal a
ctiv
ities
. Act
iviti
es in
clud
e tra
nsiti
ons b
etw
een
activ
ities
(Tra
nsiti
on/A
ct),
wai
ting
for i
nstru
ctio
nto
beg
in, l
inin
g up
for r
eces
s, an
d di
srup
tions
(e.g
., an
noun
cem
ents
ove
r the
loud
spea
ker)
.
Child Dev. Author manuscript; available in PMC 2010 January 1.