India Consumer Electricals - Systematix Group
185
Systematix Research is also available on Bloomberg SSSL <Go>, Thomson & Reuters Systematix Shares and Stocks (India) Limited Investors are advised to refer disclosures made at the end of the research report. 1 India Consumer Electricals A sustainable growth story
-
Upload
khangminh22 -
Category
Documents
-
view
1 -
download
0
Transcript of India Consumer Electricals - Systematix Group

Systematix Research is also available on Bloomberg SSSL <Go>, Thomson & Reuters Systematix Shares and Stocks (India) Limited
Investors are advised to refer disclosures made at the end of the research report.
1
India Consumer Electricals A sustainable growth story

29 April 2022
2 Systematix Research is also available on Bloomberg SSSL <Go>, Thomson & Reuters Systematix Shares and Stocks (India) Limited
India Consumer Electricals
Contents
Story in charts – Industry segments and growth outlook ......................................................................................................... 4
Story in charts – Companies (peer comparison) ....................................................................................................................... 5
Executive Summary .................................................................................................................................................................. 7
Wires & Cables (W&C): Industry dynamics and outlook ..........................................................................................................13
Fans: Industry dynamics and outlook ......................................................................................................................................16
Lighting: Industry dynamics, outlook .......................................................................................................................................18
Switchgears: Industry dynamics and outlook ..........................................................................................................................19
Switches: Industry dynamics and outlook ...............................................................................................................................20
Water-heaters: Industry dynamics and outlook ......................................................................................................................21
Stock Views .............................................................................................................................................................................22
Companies section
Bajaj Electricals ........................................................................................................................................................................31
KEI Industries ..........................................................................................................................................................................49
Finolex Cables ..........................................................................................................................................................................68
Crompton Greaves Consumer ..................................................................................................................................................84
Havells ...................................................................................................................................................................................106
Polycab ..................................................................................................................................................................................130
V-Guard ................................................................................................................................................................................151
Orient Electric ........................................................................................................................................................................167
29 April 2022
3 Systematix Research is also available on Bloomberg SSSL <Go>, Thomson & Reuters Systematix Shares and Stocks (India) Limited
India Consumer Electricals
India Consumer Electricals A sustainable growth story
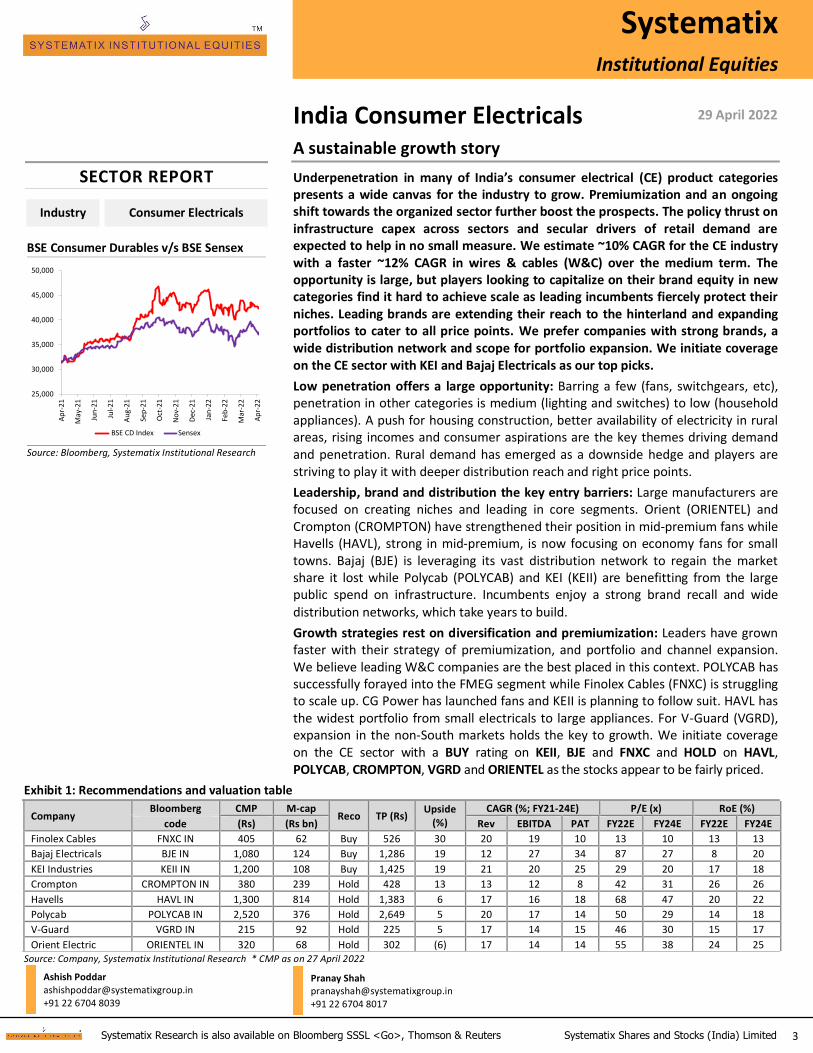
Underpenetration in many of India’s consumer electrical (CE) product categories presents a wide canvas for the industry to grow. Premiumization and an ongoing shift towards the organized sector further boost the prospects. The policy thrust on infrastructure capex across sectors and secular drivers of retail demand are expected to help in no small measure. We estimate ~10% CAGR for the CE industry with a faster ~12% CAGR in wires & cables (W&C) over the medium term. The opportunity is large, but players looking to capitalize on their brand equity in new categories find it hard to achieve scale as leading incumbents fiercely protect their niches. Leading brands are extending their reach to the hinterland and expanding portfolios to cater to all price points. We prefer companies with strong brands, a wide distribution network and scope for portfolio expansion. We initiate coverage on the CE sector with KEI and Bajaj Electricals as our top picks.
Low penetration offers a large opportunity: Barring a few (fans, switchgears, etc), penetration in other categories is medium (lighting and switches) to low (household appliances). A push for housing construction, better availability of electricity in rural areas, rising incomes and consumer aspirations are the key themes driving demand and penetration. Rural demand has emerged as a downside hedge and players are striving to play it with deeper distribution reach and right price points.
Leadership, brand and distribution the key entry barriers: Large manufacturers are focused on creating niches and leading in core segments. Orient (ORIENTEL) and Crompton (CROMPTON) have strengthened their position in mid-premium fans while Havells (HAVL), strong in mid-premium, is now focusing on economy fans for small towns. Bajaj (BJE) is leveraging its vast distribution network to regain the market share it lost while Polycab (POLYCAB) and KEI (KEII) are benefitting from the large public spend on infrastructure. Incumbents enjoy a strong brand recall and wide
distribution networks, which take years to build.
Growth strategies rest on diversification and premiumization: Leaders have grown faster with their strategy of premiumization, and portfolio and channel expansion. We believe leading W&C companies are the best placed in this context. POLYCAB has successfully forayed into the FMEG segment while Finolex Cables (FNXC) is struggling to scale up. CG Power has launched fans and KEII is planning to follow suit. HAVL has the widest portfolio from small electricals to large appliances. For V-Guard (VGRD), expansion in the non-South markets holds the key to growth. We initiate coverage on the CE sector with a BUY rating on KEII, BJE and FNXC and HOLD on HAVL, POLYCAB, CROMPTON, VGRD and ORIENTEL as the stocks appear to be fairly priced.
Exhibit 1: Recommendations and valuation table
Company Bloomberg CMP M-cap
Reco TP (Rs) Upside
(%)
CAGR (%; FY21-24E) P/E (x) RoE (%)
code (Rs) (Rs bn) Rev EBITDA PAT FY22E FY24E FY22E FY24E
Finolex Cables FNXC IN 405 62 Buy 526 30 20 19 10 13 10 13 13
Bajaj Electricals BJE IN 1,080 124 Buy 1,286 19 12 27 34 87 27 8 20
KEI Industries KEII IN 1,200 108 Buy 1,425 19 21 20 25 29 20 17 18
Crompton CROMPTON IN 380 239 Hold 428 13 13 12 8 42 31 26 26
Havells HAVL IN 1,300 814 Hold 1,383 6 17 16 18 68 47 20 22
Polycab POLYCAB IN 2,520 376 Hold 2,649 5 20 17 14 50 29 14 18
V-Guard VGRD IN 215 92 Hold 225 5 17 14 15 46 30 15 17
Orient Electric ORIENTEL IN 320 68 Hold 302 (6) 17 14 14 55 38 24 25 Source: Company, Systematix Institutional Research * CMP as on 27 April 2022
Systematix Institutional Equities
Systematix Institutional Equities
Systematix Institutional Equities
Systematix Institutional Equities
29 April 2022
xx December 2021
xx December 2021
xx December 2021
SECTOR REPORT
SECTOR REPORT
SECTOR REPORT
SECTOR REPORT
Industry
Industry
Industry
Industry
Consumer Electricals xxxxxx
xxxxxx
xxxxxx
Ashish Poddar [email protected] +91 22 6704 8039
Pranay Shah [email protected] +91 22 6704 8017
BSE Consumer Durables v/s BSE Sensex
25,000
30,000
35,000
40,000
45,000
50,000
Ap
r-2
1
May
-21
Jun
-21
Jul-
21
Au
g-2
1
Sep
-21
Oct
-21
No
v-2
1
Dec
-21
Jan
-22
Feb
-22
Mar
-22
Ap
r-2
2
BSE CD Index Sensex
Source: Bloomberg, Systematix Institutional Research

29 April 2022
4 Systematix Research is also available on Bloomberg SSSL <Go>, Thomson & Reuters Systematix Shares and Stocks (India) Limited
India Consumer Electricals
Story in charts – Industry segments and growth outlook
Exhibit 2: W&C is ~45% of the Rs 1.2trn CE industry… Exhibit 3: …with Polycab and Havells as the leaders
45%
19%
17%
8%
7%4%
C&W
Lighting
Switchgear
Fans
Others
Switches
86 81
48
36 33 24 20 19
0
10
20
30
4050
60
70
80
90100
PO
LYC
AB
HA
VL
CR
OM
PTO
N
KEI
BJE
FNX
C
OR
IEN
TEL
VG
RD
(Rs bn)Revenue (FY21)
Source: Polycab RHP, Systematix Institutional Research Source: Company, Systematix Institutional Research
Exhibit 4: W&C industry to continue growing the fastest Exhibit 5: Fans – industry growth and outlook
346
525 550
968
0
200
400
600
800
1,000
1,200
FY14 FY18 FY21 FY26P
(Rs bn)
63
80
99
131
0
20
40
60
80
100
120
140
FY14 FY18 FY21 FY26P
(Rs bn)
Source: Polycab annual report, Systematix Institutional Research Source: Polycab annual report, Systematix Institutional Research
Exhibit 6: Lighting – industry growth and outlook Exhibit 7: Switches and Switchgears – industry outlook
142
212227
365
0
50
100
150
200
250
300
350
400
FY14 FY18 FY21 FY26P
(Rs bn)
139
183210
337
0
50
100
150
200
250
300
350
400
FY14 FY18 FY21 FY26P
(Rs bn)
Source: Polycab annual report, Systematix Institutional Research Source: Polycab annual report, Systematix Institutional Research

29 April 2022
5 Systematix Research is also available on Bloomberg SSSL <Go>, Thomson & Reuters Systematix Shares and Stocks (India) Limited
India Consumer Electricals
Story in charts – Companies (peer comparison)
Exhibit 8: ECD – HAVL, CROMPTON and BJE are top-3 in sales Exhibit 9: ECD – Revenue CAGR (BJE to see strong revival)
49 48
33
20
10 8
1
0
10
20
30
40
50
60
HA
VL
CR
OM
PTO
N
BJE
OR
IEN
TEL
PO
LYC
AB
VG
RD
FNX
C
(Rs bn)Revenue (FY21)
43
74
8
18 16 16 18
36
25 24 17 17 16
13
0
10
20
30
40
50
60
70
80
FNX
C
PO
LYC
AB
BJE
VG
RD
OR
IEN
TEL
HA
VL
CR
OM
PTO
N
(%)
FY16-21 FY21-24E
Source: Company, Systematix Institutional Research Source: Company, Systematix Institutional Research
Exhibit 10: ECD – adj. EBIT margin trend Exhibit 11: ECD – outsourcing mix (%)
20
.5
18
.8
10
.3
8.9
5.5
3.7
5.5
20
.0
18
.0
10
.5
8.0
7.0
6.0
5.0
0
5
10
15
20
25
CR
OM
PTO
N
HA
VL
BJE
OR
IEN
TEL
PO
LYC
AB
FNX
C
VG
RD
(%)
FY21 FY24E
80
70
50 50 50
40
5
0
10
20
30
40
50
60
70
80
90
BJE
FNX
C
CR
OM
PTO
N
VG
RD
PO
LYC
AB
OR
IEN
TEL
HA
VL
(%)
Source: Company, Systematix Institutional Research Source: Company, Systematix Institutional Research
Exhibit 12: BJE has the largest network of retail touchpoints Exhibit 13: A&P spends (FY20) – 3-5% of B2C sales for leaders
0
50,000
1,00,000
1,50,000
2,00,000
2,50,000
BJE
CR
OM
PTO
N
HA
VL
PO
LYC
AB
OR
IEN
TEL
FNX
C
VG
RD
(No.)
3.4
3.6
2.3
2.2
1.2
2.4
0.9
4.5
4.0
3.8
3.1
3.1
3.0
1.3
0.00.51.01.52.02.53.03.54.04.55.0
HA
VL
OR
IEN
TEL
VG
RD
CR
OM
PTO
N
PO
LYC
AB
BJE
FNX
C
(%)
% Total sales % B2C sales (FMEG & wire)
Source: Company, Systematix Institutional Research Source: Company, Systematix Institutional Research

29 April 2022
6 Systematix Research is also available on Bloomberg SSSL <Go>, Thomson & Reuters Systematix Shares and Stocks (India) Limited
India Consumer Electricals
Exhibit 14: W&C – POLYCAB, KEII and HAVL are top-3 in sales Exhibit 15: W&C – Revenue CAGRs (revival expected for FXNC)
76
36 32
23
8
0
10
20
30
40
50
60
70
80
POLYCAB KEII HAVL FNXC VGRD
(Rs bn) FY21
23
13 13
3
8
24
20 19 19
17
0
5
10
15
20
25
KEII POLYCAB HAVL FNXC VGRD
(%)
FY16-21 CAGR FY21-24E CAGR
Source: Company, Systematix Institutional Research Source: Company, Systematix Institutional Research
Exhibit 16: W&C – adj. EBIT % (FNXC has a higher wire mix) Exhibit 17: RoE trend – CROMPTON ranks as the best
13
.4
12
.7
12
.5
10
.0
8.8
12
.2
11
.7
11
.5
10
.5
8.7
0
2
4
6
8
10
12
14
16
FNXC HAVL POLYCAB KEII VGRD
(%)
FY21 FY24E
32
26
20
12
1815 17
14
2625
2220 18 18 17
13
0
5
10
15
20
25
30
35
CR
OM
PTO
N
OR
IEN
TEL
HA
VL
BJE
PO
LYC
AB
KEI
I
VG
RD
FNX
C
(%)
FY21 FY24E
Source: Company, Systematix Institutional Research Source: Company, Systematix Institutional Research
Exhibit 18: Net WC cycle – a sharp improvement for BJE and KEII Exhibit 19: FCF – HAVL, POLYCAB, CROMPTON and BJE to lead
11 20
55 73
155
90 100
120
19 30
42 50 55
79 90 90
0
20
40
60
80
100
120
140
160
180
CR
OM
PTO
N
OR
IEN
TEL
HA
VL
VG
RD
BJE
PO
LYC
AB
FNX
C
KEI
I
(Days)
FY21 FY24E
10.1
6.5 6.1 5.4
1.8 1.8 1.5 1.4
0
2
4
6
8
10
12
HA
VL
PO
LYC
AB
CR
OM
PTO
N
BJE
FNX
C
KEI
I
VG
RD
OR
IEN
TEL
(Rs bn)FY21-24E (average)
Source: Company, Systematix Institutional Research Source: Company, Systematix Institutional Research

29 April 2022
7 Systematix Research is also available on Bloomberg SSSL <Go>, Thomson & Reuters Systematix Shares and Stocks (India) Limited
India Consumer Electricals
Executive Summary
The ~Rs 1.2trn Indian consumer electricals industry (including cables) has recovered smartly after the downturn induced by Covid-related disruptions for two years. Recovery was broad-based across the product categories and supported by pent-up demand initially. However, a strong revival in the housing market, consumer preference towards bigger and comfortable houses in a work-from-home (WFH) scenario, premiumization and underpenetration in many product categories have set the tone for a sustainable growth story for the industry. We initiate coverage on the Indian Consumer Electricals Sector with a positive outlook. Within the sector, we are more inclined towards Wires & Cables (W&C) companies owing to their robust growth prospects and scope for business diversification towards B2C wires and fast moving electrical goods (FMEG) segments, leading to a valuation re-rating. KEII and
BJE are our top picks in the space.
Exhibit 20: Consumer Electricals – Industry size, growth trends and key players
Product category FY21P FY14-21 FY21-24E Key players
Industry size (Rs bn)
CAGR (%) CAGR (%)
Wires & cables 550 7 12 Polycab, KEI, Havells, Finolex, V-Guard, RR Kabel, Apar Ind, Gupta Power
Lighting 227 7 10 Bajaj, Surya Roshni, Crompton, Havells, Orient, Philips, Syska, Wipro,
Polycab
Switchgear 210 6 10 ABB, Havells, Legrand, Schneider, Siemens, Polycab
Fans 99 7 6 Crompton, Bajaj, Havells, Orient, V-Guard, Polycab
Switches 50 8 10 Anchor, Cosmo Electro (Kolors brand), GM Modular, Havells, Philips,
Schneider, Polycab
Water Heater 23 10 6 AO Smith, Bajaj, Crompton, Havells, Racold, Venus, V-Guard, Polycab
Source: Company, Polycab RHP
Exhibit 21: Product portfolios of key manufacturers
Players Fans Lighting Switches Switchgears Water
Heaters Home
Appliances Kitchen
Appliances Wires & Cables
Bajaj Electricals ✓ ✓ ✓ ✓ ✓
CG Consumer ✓ ✓ ✓ ✓ ✓
Finolex Cables ✓ ✓ ✓ ✓ ✓ ✓
Havells ✓ ✓ ✓ ✓ ✓ ✓ ✓ ✓
KEI ✓
Orient Electric ✓ ✓ ✓ ✓ ✓ ✓ ✓
Philips ✓ ✓ ✓
Polycab ✓ ✓ ✓ ✓ ✓ ✓
Schneider Electric ✓ ✓ ✓ ✓
Stove Kraft ✓ ✓ ✓ ✓
Surya Roshni ✓ ✓ ✓ ✓ ✓
TTK Prestige ✓ ✓
Usha International ✓ ✓ ✓ ✓
V-Guard Industries ✓ ✓ ✓ ✓ ✓ ✓ Source: Polycab RHP, Systematix Institutional Research

29 April 2022
8 Systematix Research is also available on Bloomberg SSSL <Go>, Thomson & Reuters Systematix Shares and Stocks (India) Limited
India Consumer Electricals
Structural demand drivers remain in place
After significant demand destruction in the three months over March-May 2020 (the first phase of Covid-19 disruptions), the consumer electricals industry saw a swifter-than-expected recovery, with leading players at the forefront of the bounce-back. A subsequent resurgence in Covid-19 cases and the significant rise recorded in commodity costs did not deter consumers’ buying decisions, with sustained growth witnessed across retail categories. While the sharp rebound is partly attributable to pent-up demand in the aftermath of the pandemic, we believe the industry is on a secular growth trend. Demand is being stoked not only by the core drivers (a wide population base and increasing affordability), but also by industry trends like deeper penetration into rural areas, premiumization, government initiatives like electrification/ rural-urban infrastructure and the ‘Make in India’ push.
Increasing affordability with higher disposable incomes: Census 2011 put India’s population at ~1.2bn with ~246m households. After a 1.8% CAGR seen over 2001-2011, population is expected to touch 1.5bn by 2030 (1.2% CAGR) with India becoming the world’s most populous country. The proportion of the urban population (~35% of total) has been rising as people from rural areas move to cities for better job opportunities, education and a better life. India’s per capita income, a broad indicator of living standards, has been growing steadily over the years. According to media reports, the per capita net national income (NNI) at current prices and constant prices has recorded 10% and 6% CAGR respectively over FY12-18. These factors typically drive demand for housing and also accelerate expenditure on public infrastructure (railways, roads, malls, hospitals, educational institutes, etc) and purchase of discretionary items including consumer electricals.
Exhibit 22: India’s population growth Exhibit 23: Urbanization trend
0.4
0.60.7
0.91.0
1.21.3
1.5
0.0
0.2
0.4
0.6
0.8
1.0
1.2
1.4
1.6
1961 1971 1981 1991 2001 2011 2017E 2030P
(Bn)
Population
295 382 460 484
758 849
893 899
1,053
1,231 1,353 1,383
0
200
400
600
800
1,000
1,200
1,400
1,600
2000 2010 2018E 2020E
Urban Rural
(Mn Households)
Source: GoI, Industry reports Source: GoI, Industry reports
Underpenetration in key categories, especially in lower tier and rural regions: Except fans and lights, penetration levels of organized retail in other product categories are medium-to-low. Increasing electrification in rural areas, improving electricity availability in small towns/ cities, rising aspirations with disposable incomes, availability of energy-efficient products and a shift in consumer preference towards reliable and branded products are the key factors driving penetration levels higher in the hinterland and supporting growth during spells of the economy slowing.

29 April 2022
9 Systematix Research is also available on Bloomberg SSSL <Go>, Thomson & Reuters Systematix Shares and Stocks (India) Limited
India Consumer Electricals
Exhibit 24: Category-wise penetration levels
Category Overall penetration Organized penetration
Cables - domestic/ industrial High/ High Low/ Medium
Fans High High
Lighting & fixtures High Medium
Other appliances Low Low
Switches High Medium
Switchgears (MCB) High High
Water heaters Low Low
Source: Polycab RHP, Systematix Institutional Research
Premiumization helps ensure modest value growth even with lower demand: Rising aspirations with higher disposable incomes and customers’ growing preference for technology-driven and aesthetically appealing products are stoking the premiumization trend in many categories (fans, switches, appliances, etc). Despite low volume growth, the industry has managed to capture modest value growth in a few categories in the recently turbulent times. We believe the trend is likely to sustain in the medium to long term.
Exhibit 25: Share of premium fans rising rapidly
43 40 34
5150
46
6 1020
0%
10%
20%
30%
40%
50%
60%
70%
80%
90%
100%
FY14 FY18 FY23p
Economy Base Premium
CAGR ~4%
CAGR ~5%
CAGR ~21%
CAGR ~4%
CAGR ~5%
CAGR ~22%
Source: Polycab RHP, Systematix Institutional Research
29 April 2022
10 Systematix Research is also available on Bloomberg SSSL <Go>, Thomson & Reuters Systematix Shares and Stocks (India) Limited
India Consumer Electricals
Government initiatives providing additional growth impetus
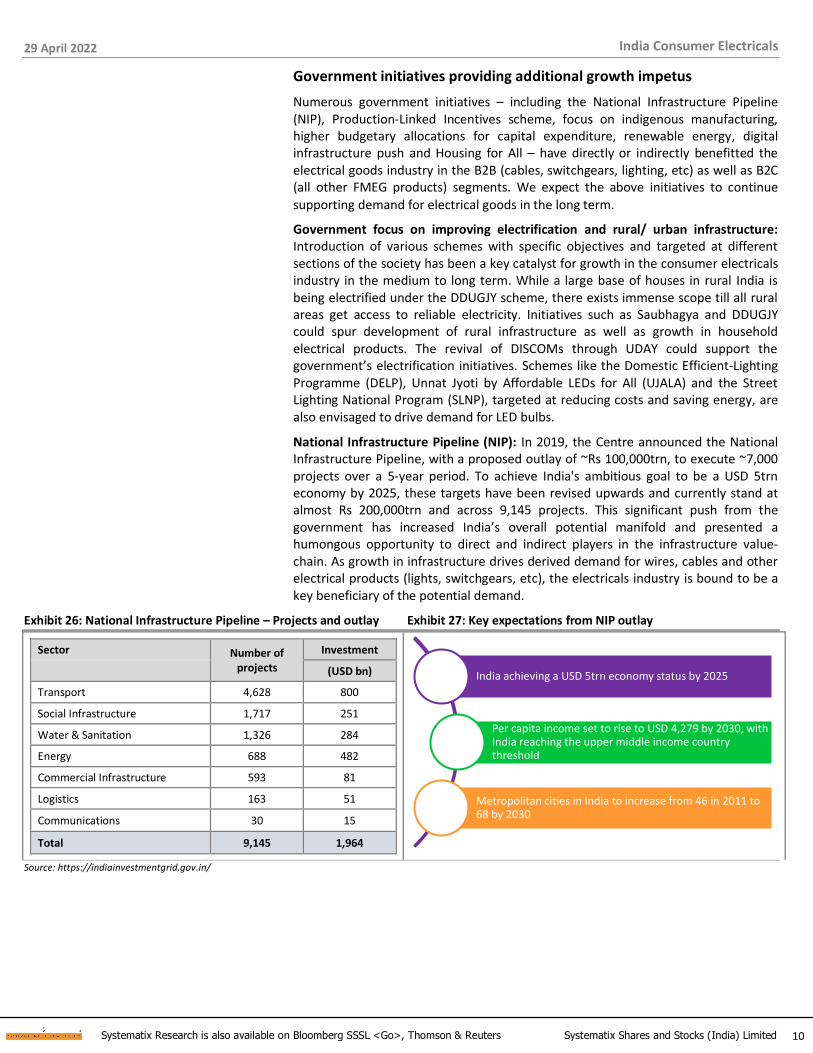
Numerous government initiatives – including the National Infrastructure Pipeline (NIP), Production-Linked Incentives scheme, focus on indigenous manufacturing, higher budgetary allocations for capital expenditure, renewable energy, digital infrastructure push and Housing for All – have directly or indirectly benefitted the electrical goods industry in the B2B (cables, switchgears, lighting, etc) as well as B2C (all other FMEG products) segments. We expect the above initiatives to continue
supporting demand for electrical goods in the long term.
Government focus on improving electrification and rural/ urban infrastructure: Introduction of various schemes with specific objectives and targeted at different sections of the society has been a key catalyst for growth in the consumer electricals industry in the medium to long term. While a large base of houses in rural India is being electrified under the DDUGJY scheme, there exists immense scope till all rural areas get access to reliable electricity. Initiatives such as Saubhagya and DDUGJY could spur development of rural infrastructure as well as growth in household electrical products. The revival of DISCOMs through UDAY could support the government’s electrification initiatives. Schemes like the Domestic Efficient-Lighting Programme (DELP), Unnat Jyoti by Affordable LEDs for All (UJALA) and the Street Lighting National Program (SLNP), targeted at reducing costs and saving energy, are also envisaged to drive demand for LED bulbs.
National Infrastructure Pipeline (NIP): In 2019, the Centre announced the National Infrastructure Pipeline, with a proposed outlay of ~Rs 100,000trn, to execute ~7,000 projects over a 5-year period. To achieve India's ambitious goal to be a USD 5trn economy by 2025, these targets have been revised upwards and currently stand at almost Rs 200,000trn and across 9,145 projects. This significant push from the government has increased India’s overall potential manifold and presented a humongous opportunity to direct and indirect players in the infrastructure value-chain. As growth in infrastructure drives derived demand for wires, cables and other electrical products (lights, switchgears, etc), the electricals industry is bound to be a key beneficiary of the potential demand.
Exhibit 26: National Infrastructure Pipeline – Projects and outlay Exhibit 27: Key expectations from NIP outlay
Sector Number of projects
Investment
(USD bn)
Transport 4,628 800
Social Infrastructure 1,717 251
Water & Sanitation 1,326 284
Energy 688 482
Commercial Infrastructure 593 81
Logistics 163 51
Communications 30 15
Total 9,145 1,964
India achieving a USD 5trn economy status by 2025
Per capita income set to rise to USD 4,279 by 2030, with India reaching the upper middle income country threshold
Metropolitan cities in India to increase from 46 in 2011 to 68 by 2030
Source: https://indiainvestmentgrid.gov.in/
29 April 2022
11 Systematix Research is also available on Bloomberg SSSL <Go>, Thomson & Reuters Systematix Shares and Stocks (India) Limited
India Consumer Electricals
Key trends shaping the consumer electricals industry
Incumbents enjoy a strong brand recall and wide distribution networks which take years to build. Rising consumer preference towards quality, innovative and branded products augurs well for the organized segment which has gained market share at the expense of the unorganized sector. In the last few years, leading players have grown ahead of the industry on the back of their portfolio and channel expansion initiatives as also focus on premiumization. We expect the trends to gain momentum in the coming period. Below we give a brief on the key trends prevailing in the consumer electricals industry:
Strong demand revival after the first Covid-19 wave: The first wave of Covid-19 had triggered widespread fears of demand destruction in the wake of job losses and a significant rise in commodity costs. However, the challenges were short-lived for the consumer electricals industry, especially leaders, across segments. Importantly, housing activity, one of the biggest drivers of demand for consumer electrical products, is witnessing some green shoots (after a prolonged lull) with reducing inventories. CE companies reported healthy EBITDA margins in FY21 as the impact of
lower demand was tackled by lower discretionary expenses including A&P spends.
Organized sector gaining market share via portfolio and distribution expansion: Large and organized players have gained significant market share in the last two years as smaller players were not resilient enough to survive the frequent lockdowns mandated during the Covid-19 pandemic. At the same time, larger players became aggressive on distribution expansion in untapped areas (including smaller towns) and innovative product launches to recover the sales lost during the lockdowns. Rural electrification and better quality of electricity supply in tier-3 and -4 cities and beyond are also helping generate demand for consumer durables and appliances. All key players are looking to strengthen their operations in the semi-urban and rural areas and gain market share through their less expensive portfolios under a different
brand targeted at these price-sensitive markets.
Emergence of alternate sales channels: Alternate channels (modern trade and e-Commerce) gained good traction (up to 35% share in sales in some kitchen appliance categories) owing to the ease of buying products at attractive discounts. We believe the traditional distribution channel will continue to dominate the overall sales in the longer term even as alternate channels will gradually gain market share.
Premiumization gaining good traction: Premiumization is another theme that has played out across categories in the last few years, and even accelerated during the pandemic as consumers spent more time at home and chose better quality and innovative products. The trend should continue given that buyer preference is
shifting towards technologically-advanced products offering innovative features.
Fast adoption of digitization to face unforeseen events like Covid-19: Technology helped leading companies manage their inventories and supply-chain issues better during the sudden challenge posed by Covid-19. We believe technology adoption at the back-end will further strengthen the market positioning of incumbents and be the differentiator vis-à-vis small regional players and the unorganized sector.
Exports limited to W&C; however, potential in other product categories too: India’s leading W&C companies (POLYCAB and KEII) have seen good traction in the global markets as they earn 10%+ of their total revenues from exports. Wide product portfolios and global certifications have helped these players to participate in prestigious global tenders and win orders as well. Given the government’s stated mission to make India a manufacturing hub for the world, we see a large opportunity in exports for other electrical goods categories as well.

29 April 2022
12 Systematix Research is also available on Bloomberg SSSL <Go>, Thomson & Reuters Systematix Shares and Stocks (India) Limited
India Consumer Electricals
Rising costs an overhang on growth and margins: While there are many structural drivers supporting demand for consumer electrical goods in the long term, the industry faces certain headwinds in the short to medium term. Currently, companies are facing margin pressure as most of the discretionary expenses have returned to normal levels and their limited ability to take adequate price hikes despite elevated raw material prices (copper, aluminium, ABS, etc) and other costs (freight among others). Leading companies have chosen to grow fast and gain market share at the cost of margins as they expect the margin pressure to be short lived and recoverable with adequate pricing action as also an eventual easing of commodity prices.
Exhibit 28: LME copper price trend Exhibit 29: LME aluminium price trend
0
2000
4000
6000
8000
10000
12000
Ap
r-1
2
Oct
-12
Ap
r-1
3
Oct
-13
Ap
r-1
4
Oct
-14
Ap
r-1
5
Oct
-15
Ap
r-1
6
Oct
-16
Ap
r-1
7
Oct
-17
Ap
r-1
8
Oct
-18
Ap
r-1
9
Oct
-19
Ap
r-2
0
Oct
-20
Ap
r-2
1
Oct
-21
Ap
r-2
2
(USD /t)
0
500
1000
1500
2000
2500
3000
3500
4000
4500
Ap
r-1
2
Oct
-12
Ap
r-1
3
Oct
-13
Ap
r-1
4
Oct
-14
Ap
r-1
5
Oct
-15
Ap
r-1
6
Oct
-16
Ap
r-1
7
Oct
-17
Ap
r-1
8
Oct
-18
Ap
r-1
9
Oct
-19
Ap
r-2
0
Oct
-20
Ap
r-2
1
Oct
-21
Ap
r-2
2
(USD /t)
Source: Bloomberg Source: Bloomberg
Positioning of leaders in various categories of the consumer electricals industry:
▪ HAVL continues to be a widely preferred brand among younger buyers owing to its mass-premium positioning, product design ability, quality of offerings and high advertisement and promotional spending. CROMPTON, on the other hand, is an older brand commanding loyalty from the older generation, while ORIENT is an emerging brand in premium fans.
▪ In fans, HAVL enjoys a 5-10% price premium to CROMPTON and a slightly higher premium to ORIENT and other brands. Likely introduction of energy ratings in
2022 will fuel a further market share shift towards the organized sector.
▪ CROMPTON and BJE are the preferred choice among builders owing to their competitive prices and wide product range
▪ For after-sales service, HAVL, CROMPTON and BJE are considered the best.

29 April 2022
13 Systematix Research is also available on Bloomberg SSSL <Go>, Thomson & Reuters Systematix Shares and Stocks (India) Limited
India Consumer Electricals
Wires & Cables (W&C): Industry dynamics and outlook
The W&C segment registered ~11% CAGR over FY14-18 (and a higher volume growth), followed by a flattish growth over FY18-21. At ~Rs 550bn, it comprises ~45% of the electrical equipment market in India (industry estimates). Upbeat construction activity in the housing sector and government initiatives in the power and infrastructure sectors has been the key factors driving growth. At 12% CAGR estimated over FY21-26, the W&C industry is expected to grow the fastest within the CE industry. POLYCAB, KEII, HAVL, FNXC, RR Kabel and VGRD are the key players in the category. Notably, W&Cs are manufactured fully in-house given customers’
technical requirement.
Exhibit 30: W&C segment – expect ~12% CAGR Exhibit 31: National Infrastructure Pipeline – Projects and outlay
346
525 550
968
0
200
400
600
800
1,000
1,200
FY14 FY18 FY21 FY26P
(Rs bn)
Source: Polycab annual report, Systematix Institutional Research Source: https://indiainvestmentgrid.gov.in/
Exhibit 32: Category-wise growth factors and key players
Category Apar Finolex Cables
Gupta Power
Havells KEC KEI Polycab R R Kabel V-Guard
Power Cables (LT/ HT) ✓ ✓ ✓ ✓ ✓ ✓ ✓ ✓
Growth drivers: (a) investments in power transmission and distribution (b) capacity addition in solar and wind energy, and (c) Smart Cities mission
Building Wires ✓ ✓ ✓ ✓ ✓ ✓ ✓ ✓ ✓
Growth drivers: (a) affordable Housing scheme (b) growing nuclearization of families, and (c) investments in commercial and residential infra
Flexible Cables/ Wires ✓ ✓ ✓ ✓ ✓ ✓ ✓ ✓ ✓
Growth drivers: (a) growing demand for household appliances and automobiles on revival in per capita income (b) increasing investments in railways for electrification, and (c) increased construction activity supported by growing infrastructure projects
EHV Cables ✓ ✓
✓ ✓ ✓
Growth drivers: (a) investments in power transmission and distribution, and (b) Smart Cities mission
Control/ Instrumentation Cables ✓ ✓ ✓ ✓ ✓ ✓ ✓ ✓
Growth drivers: (a) industrial capex rising across industries such as auto, steel, oil and gas, and power (b) Investment expenditure by Indian Railways and in other mass transit systems (c) Increased focus on automation in manufacturing and processing to monitor and control quality Source: Polycab RHP, Systematix Institutional Research
Number of
projects
Investment
USD bn
Transport 4,628 800
Social Infrastructure 1,717 251
Water & Sanitation 1,326 284
Energy 688 482
Commercial Infrastructure 593 81
Logistics 163 51
Communication 30 15
Total 9,145 1,964

29 April 2022
14 Systematix Research is also available on Bloomberg SSSL <Go>, Thomson & Reuters Systematix Shares and Stocks (India) Limited
India Consumer Electricals
Exhibit 33: Wires & Cables – trends, demand drivers and outlook
Market size Segment’s share in CE
industry (FY21) CAGR (FY14-21) CAGR (FY21-26E)
EBITDA margin range for key listed players
~Rs 550bn ~45% 7% 12%+ 10-15% (ECD division)
Trends
• Government focus on power, infrastructure and housing construction have been the key growth drivers
• The formal sector (comprising all-India brand-named manufacturers) capturing market share from the non-regulated sector (smaller regional manufacturers). Industry estimates put the share of organized at ~75% currently, and much higher in high voltage (HV) and extra-high voltage (EHV) products
• To protect margins, companies typically pass on any meaningful changes in raw material prices (mainly copper and aluminium) to the end-consumer within 15-30 days
• W&C manufactured fully in-house due to technical requirement of customers
Demand drivers
• Numerous government initiatives such as NIP, PLI scheme, focus on indigenous manufacturing, higher budgetary allocation for capital expenditure, renewable energy and digital infrastructure push, Housing for All
• Electrification of rural villages and households (schemes such as Power for All, Saubhagya, etc)
• Investments in modernizing transmission & distribution systems and for improving efficiency
• Increased demand from renewable power generation, particularly solar and wind energy
• Infrastructure development such as Smart Cities mission and mass-transit systems
• Commercial establishments and public utilities (metro-rail, airports, hospitals, educational institutions, etc)
• Industrial sectors (auto and FMEG) to drive demand for flexible cables & wires and control cables
Outlook The W&C industry expected to register ~12% CAGR by value over 2021-2026. Leading players likely to grow faster as they gain market share due to operational challenges faced by small regional players
Risks and challenges
• Realizations and profitability in W&C industry dependent on RM prices (mainly copper and aluminium). Companies usually pass on any meaningful changes in raw material prices to end-consumer within 15-30 days to protect margins. However, high volatility in RM prices may impact growth or margins, depending on the overall demand situation and economic outlook
• As a large part of key raw materials is imported by players given economies of cost and the quality required, margins are exposed to exchange rate fluctuations. To mitigate the risk, companies enter into a price escalation clause for long-term contracts and hedge their future purchases
Key players Polycab, KEI, Havells, Finolex Cables, RR Kabel and V-Guard
Source: Industry reports, Systematix Institutional Research
29 April 2022
15 Systematix Research is also available on Bloomberg SSSL <Go>, Thomson & Reuters Systematix Shares and Stocks (India) Limited
India Consumer Electricals
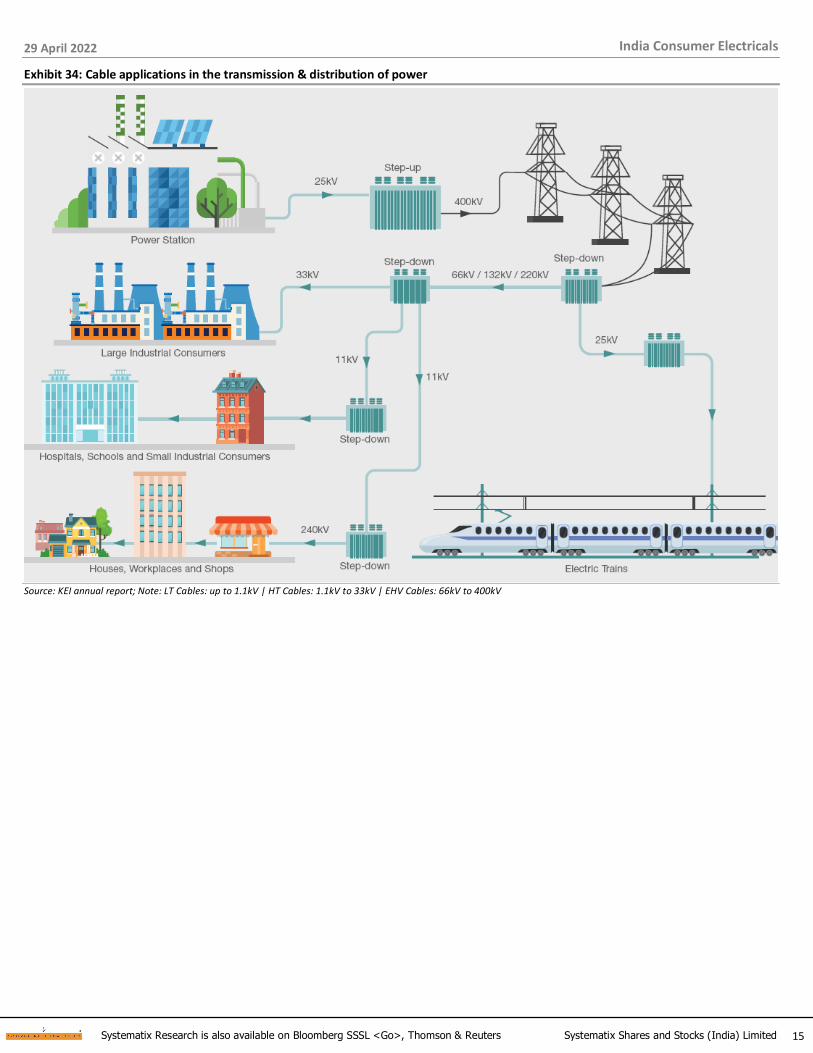
Exhibit 34: Cable applications in the transmission & distribution of power
Source: KEI annual report; Note: LT Cables: up to 1.1kV | HT Cables: 1.1kV to 33kV | EHV Cables: 66kV to 400kV

29 April 2022
16 Systematix Research is also available on Bloomberg SSSL <Go>, Thomson & Reuters Systematix Shares and Stocks (India) Limited
India Consumer Electricals
Fans: Industry dynamics and outlook
The ~Rs 100bn electric fans market in India is dominated by ceiling fans (~70% share by value). Domestic demand for fans is largely met locally. The trend of premiumization has been catching pace, driven by product innovation (decorative, anti-dust, tech-enabled fans, etc) – mainly in replacement demand which accounts for ~65% of the total demand. Therefore, the category’s dependency on new construction is relatively lower. The share of regulated players in the category is quite high at an estimated ~80%. CROMPTON (the market leader with ~25% share), ORIENTEL, Usha, HAVL, BJE and POLYCAB are the key players in the fans space. After
a 7% CAGR over FY14-21, the category is expected to report 6% CAGR over FY21-26.
Exhibit 35: Fans – growth trend
63
80
99
131
0
20
40
60
80
100
120
140
FY14 FY18 FY21 FY26P
(Rs bn)
Source: Polycab annual report, Systematix Institutional Research
Exhibit 36: Category-wise break-up of the fans segment Exhibit 37: Share of premium fans rising rapidly
71%
19%
5%5%
Ceiling
TPW
Exhaust
Industrial
43 40 34
5150
46
6 1020
0%
10%
20%
30%
40%
50%
60%
70%
80%
90%
100%
FY14 FY18 FY23p
Economy Base Premium
CAGR ~4%
CAGR ~5%
CAGR ~21%
CAGR ~4%
CAGR ~5%
CAGR ~22%
Source: Polycab RHP, Systematix Institutional Research Source: Polycab RHP, Systematix Institutional Research

29 April 2022
17 Systematix Research is also available on Bloomberg SSSL <Go>, Thomson & Reuters Systematix Shares and Stocks (India) Limited
India Consumer Electricals
Exhibit 38: Fans – trends, demand drivers and outlook
Market size Segment’s share in CE
industry (FY21) CAGR (FY14-21) CAGR (FY21-26E)
EBITDA margin range for key listed players
~Rs 100bn ~8% 7% 6% 10-15% (ECD division)
Trends
• While volume growth in ceiling fans (~70% of the fans sector) has been hit by the slowdown in real estate sector in the past few years, value growth has been driven primarily by increasing buyer preference for premium products (2-4x higher realizations), including decorative, energy-efficient and customized fans
• Various government initiatives towards facilitating electricity availability in rural areas have been driving demand for table, pedestal, and wall (TPW) fans
• The regulated (or formal) segment, at ~80%, has consistently gained market share with the rising preference for branded, aesthetically pleasing and quality products. Likely energy rating introduction in FY22 will further fuel the shift
• As the technology to manufacture fans is fairly standardized (mainly economy/ base segments), outsourcing production to smaller players is prevalent. The industry estimates that, given the cost-benefits from outsourcing production, the trend is expected to continue in the medium to long term
Demand drivers
• The economy and base fan sub-segments have seen a low ~5% CAGR, while the premium segment has registered >20% CAGR with its share in ceiling fans rising to 10%+
• Premium fans are likely to continue witnessing strong growth with rising preference for brand-named, aesthetic and quality products
• 2-4x higher realizations for premium fans would support value growth in the fans sector
• Demand for technology-driven higher-priced products (silent, dust-free and bladeless, with temperature or proximity sensors and those controlled by wi-fi or mobile apps) gaining traction
• Rising disposable incomes and changing preferences of the urban population are shortening home-improvement cycles and boosting replacement demand of fans.
• Also, improving electricity availability in rural areas resulting in deepening rural penetration and rising demand for economy ceiling, table, pedestal and wall-mounted (TPW) fans
• The focus on energy-efficient fans under the EESL-financed procurement and incentivization programmes would also drive demand for electric fans in the medium to long term
Outlook The fan category is expected to clock 6% CAGR over FY21-26 to Rs 131bn, driven by premium ceiling fans
Risks and challenges
• As penetration of fans is already quite high in urban areas, revival in housing activity is necessary to support volume growth, which already has a high base
• Air-coolers and air-conditioners are substitutes for fans. Demand for these is growing, especially in housing and offices in urban areas. Alternative products becoming more affordable may restrict growth in the fan industry
Key players Crompton, Bajaj Electricals, Havells, Orient Electric, Usha, Polycab, V-Guard, etc
Source: Industry reports, Systematix Institutional Research

29 April 2022
18 Systematix Research is also available on Bloomberg SSSL <Go>, Thomson & Reuters Systematix Shares and Stocks (India) Limited
India Consumer Electricals
Lighting: Industry dynamics, outlook
The lighting industry registered a 7% CAGR over FY14-21 to Rs 227bn, driven mainly by huge demand for LEDs from EESL (a government agency). We expect a 10% CAGR in the segment over FY21-26, driven by retail demand for LEDs after a significant price drop and better aesthetics vis-à-vis CFLs. BJE, CROMPTON, HAVL, ORIENTEL, Philips, Syska, Wipro and POLYCAB are the key players in the category and follow a mixed strategy of in-house manufacturing and outsourcing.
Exhibit 39: Lighting – growth trend
142
212227
365
0
50
100
150
200
250
300
350
400
FY14 FY18 FY21 FY26P
(Rs bn)
Source: Polycab annual report, Systematix Institutional Research
Exhibit 40: Lighting – trends, demand drivers and outlook
Market size Segment’s share in CE
industry (FY21) CAGR (FY14-21) CAGR (FY21-26E)
EBITDA margin range for key listed players
Rs 227bn ~19% 7% 10% 10-15% (ECD division)
Trends
• Rapid adoption of higher priced light-emitting diodes (LEDs), aided by government measures and a shift away from conventional lighting products including GLS, FTL and CFLs
• The initially high prices of LEDs had restricted growth to the institutional category (large organizations and government agencies like EESL) only. Street and flood lights are the key products targeted at institutions
• With technological advancement, LED chip prices have fallen significantly in the last few years. This, along with growing awareness about their energy efficiency, has resulted in increasing sales in B2C segment
• The formal sector, at ~65%, has significantly gained market share on the introduction of LEDs, which required investment in technology and were priced much higher than conventional lighting
• A large part of LED components is outsourced by the majors in this segment and the trend is expected to continue
Demand drivers
• Segment growth driven by LED sales over the last five years, largely to institutions due to high prices. From 2015 to 2017, EESL procured ~300m LED lamps out of the industry demand for 500m+
• Industry growth in the next five years to be mainly decided by growth of LEDs in retail after significant reduction in prices and enhanced aesthetics than CFLs
• Demand for conventional lighting to be limited to rural areas and low-income groups
Outlook The lighting industry expected to clock a 10% CAGR over FY21-26 to reach Rs 365bn, driven by LEDs in retail
Risks and challenges The longer life span of LEDs would restrict volume growth in the medium to long term
Key players Bajaj Electricals, Crompton, Havells, Orient Electric, Philips Lighting, Syska, Wipro Consumer, Polycab, etc
Source: Industry reports, Systematix Institutional Research

29 April 2022
19 Systematix Research is also available on Bloomberg SSSL <Go>, Thomson & Reuters Systematix Shares and Stocks (India) Limited
India Consumer Electricals
Switchgears: Industry dynamics and outlook
After a 6% CAGR over FY14-21 to Rs 210bn, we estimate ~10% CAGR in the switchgears segment over FY21-26 to Rs 337bn. Growth will be driven primarily by the low voltage (LV) segment (~70% of domestic switchgears). Revival in the real estate sector and industrial capex augur well for demand of these products. ABB, HAVL, Legrand, Schneider, Siemens and POLYCAB are the leading players having in-house manufacturing due to significant technology and certification requirements.
Exhibit 41: Switchgears – growth trend
139
183210
337
0
50
100
150
200
250
300
350
400
FY14 FY18 FY21 FY26P
(Rs bn)
Source: Polycab annual report, Systematix Institutional Research
Exhibit 42: Switchgears – trends, demand drivers and outlook
Market size Segment’s share in CE
industry (FY21) CAGR (FY14-21) CAGR (FY21-26E)
EBITDA margin range for key listed players
Rs 210bn ~17% 6% 10% 15-20%
Trends
• Sluggish activity in the real estate sector and industrial capex have kept demand subdued
• Low-voltage switchgears account for ~70% of the domestic switchgears industry. Demand of key products (MCBs, DBs, RCCBs, etc) primarily arises from residences and industries
• The MV/ HV segment products are used mainly in power distribution stations and sub-stations requiring high voltage. The segment experienced muted growth given the challenges in the power distribution sector
• At ~90% market share, LV and MV/ HV switchgears are regulated due to significant technology requirements
• The technology-intensive nature of the product driving most players to opt for in-house manufacturing
Demand drivers
• After modest growth in the last five years, LV switchgears expected to accelerate backed largely by the government's push for infrastructure development (affordable housing, Railways, metro-rail, etc)
• Higher use of power in residences and industries due to more electrification would drive demand for switchgears in the medium to long term
• GoI initiatives such as DDUGJY and Saubhagya schemes and the expected revival of DISCOMs under UDAY would aid growth of the MV/ HV category
Outlook Led by LV category, the switchgears segment is expected to clock a 10% CAGR over FY21-26 to Rs 337bn on account of consumption demand and electrification
Risks and challenges Any slowdown in real estate and industrial capex will restrict growth of switchgears
Key players ABB, Havells, Legrand, Schneider, Siemens, Polycab, etc
Source: Industry reports, Systematix Institutional Research
29 April 2022
20 Systematix Research is also available on Bloomberg SSSL <Go>, Thomson & Reuters Systematix Shares and Stocks (India) Limited
India Consumer Electricals
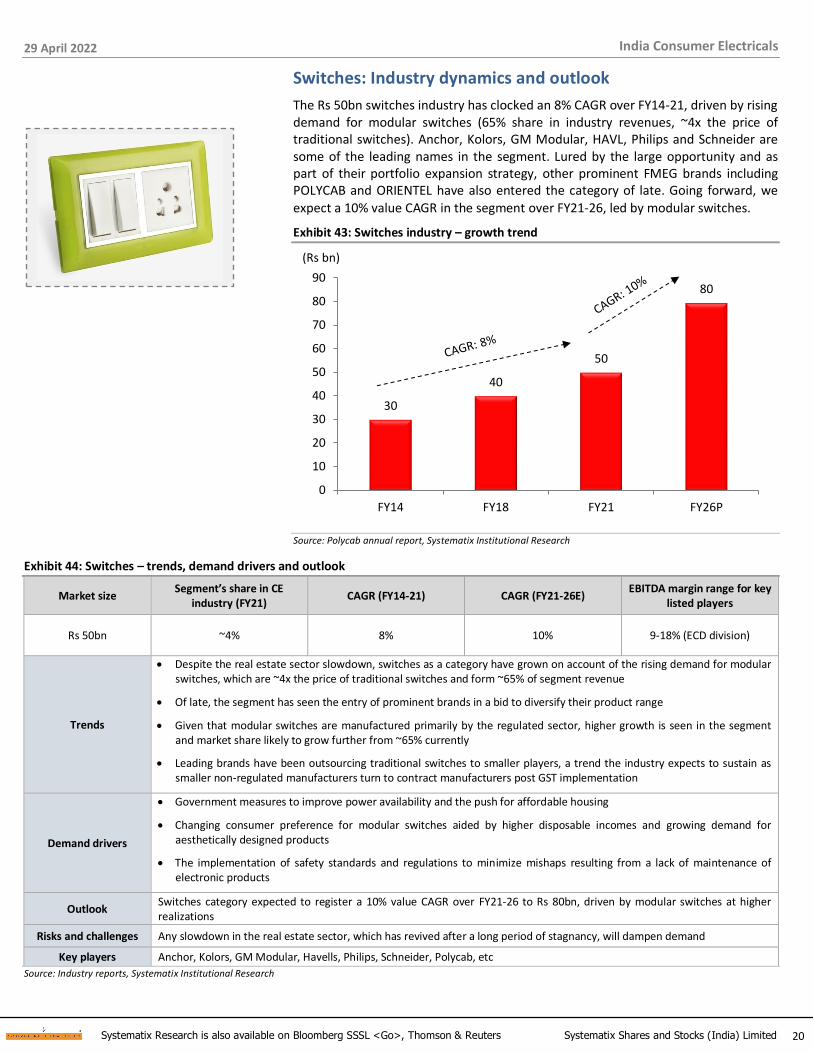
Switches: Industry dynamics and outlook
The Rs 50bn switches industry has clocked an 8% CAGR over FY14-21, driven by rising demand for modular switches (65% share in industry revenues, ~4x the price of traditional switches). Anchor, Kolors, GM Modular, HAVL, Philips and Schneider are some of the leading names in the segment. Lured by the large opportunity and as part of their portfolio expansion strategy, other prominent FMEG brands including POLYCAB and ORIENTEL have also entered the category of late. Going forward, we
expect a 10% value CAGR in the segment over FY21-26, led by modular switches.
Exhibit 43: Switches industry – growth trend
30
40
50
80
0
10
20
30
40
50
60
70
80
90
FY14 FY18 FY21 FY26P
(Rs bn)
Source: Polycab annual report, Systematix Institutional Research
Exhibit 44: Switches – trends, demand drivers and outlook
Market size Segment’s share in CE
industry (FY21) CAGR (FY14-21) CAGR (FY21-26E)
EBITDA margin range for key listed players
Rs 50bn ~4% 8% 10% 9-18% (ECD division)
Trends
• Despite the real estate sector slowdown, switches as a category have grown on account of the rising demand for modular switches, which are ~4x the price of traditional switches and form ~65% of segment revenue
• Of late, the segment has seen the entry of prominent brands in a bid to diversify their product range
• Given that modular switches are manufactured primarily by the regulated sector, higher growth is seen in the segment and market share likely to grow further from ~65% currently
• Leading brands have been outsourcing traditional switches to smaller players, a trend the industry expects to sustain as smaller non-regulated manufacturers turn to contract manufacturers post GST implementation
Demand drivers
• Government measures to improve power availability and the push for affordable housing
• Changing consumer preference for modular switches aided by higher disposable incomes and growing demand for aesthetically designed products
• The implementation of safety standards and regulations to minimize mishaps resulting from a lack of maintenance of electronic products
Outlook Switches category expected to register a 10% value CAGR over FY21-26 to Rs 80bn, driven by modular switches at higher realizations
Risks and challenges Any slowdown in the real estate sector, which has revived after a long period of stagnancy, will dampen demand
Key players Anchor, Kolors, GM Modular, Havells, Philips, Schneider, Polycab, etc
Source: Industry reports, Systematix Institutional Research

29 April 2022
21 Systematix Research is also available on Bloomberg SSSL <Go>, Thomson & Reuters Systematix Shares and Stocks (India) Limited
India Consumer Electricals
Water-heaters: Industry dynamics and outlook
The Rs 23bn water heater industry has registered a 10% CAGR over FY14-21. Introduction of energy-efficient products and rising consumer aspirations have accelerated the penetration level, which otherwise was slow due to seasonal nature of the product. Low volumes have led to companies (AO Smith, BJE, CROMPTON, HAVL, Racold, Venus, VGRD, etc.) outsourcing production to smaller players. We expect the outsourcing trend to prevail over the medium term.
Exhibit 45: Water heaters – growth trend
12
18
23
30
0
5
10
15
20
25
30
35
FY14 FY18 FY21 FY26P
(Rs bn)
Source: Polycab annual report, Systematix Institutional Research
Exhibit 46: Water heaters – trends, demand drivers and outlook
Market size Segment’s share in CE
industry (FY21) CAGR (FY14-21) CAGR (FY21-26E)
EBITDA margin range for key listed players
Rs 23bn ~2% 10% 6% 9-18% (ECD division)
Trends
• Largely seasonal demand for water heaters has translated into low penetration. Also, high operational cost (energy charges) deters adoption
• The formal segment’s share has increased to ~65% over the years with rising preference for branded and energy-efficient products, new brands’ extension into the category, rising compliance to meet energy-efficiency parameters and a growing network of service centers; the momentum likely to be sustained
• Low volumes have led to leading brands outsourcing production to smaller players. Given the cost benefits, the trend is likely to continue over the medium term
Demand drivers
• Rising disposable incomes and demand for energy-efficient products
• Better availability of electricity in smaller towns and rural areas
• New features (wi-fi-enabled, better coatings, auto temperature adjustments and leak detection) differentiate electric water heaters from solar and gas-operated ones
• Stricter compliance affecting non-regulated manufacturers
Outlook Low penetration, rising disposable incomes and energy-efficient products to drive an estimated 6% CAGR over FY21-26 in water heaters to ~Rs 30bn
Risks and challenges Solar water heaters rapidly gaining ground as a substitute. Operating on renewable energy, solar water heaters are more energy-efficient than the electric ones
Key players AO Smith, Bajaj, Crompton, Havells, Racold, Venus and V-Guard
Source: Industry reports, Systematix Institutional Research
29 April 2022
22 Systematix Research is also available on Bloomberg SSSL <Go>, Thomson & Reuters Systematix Shares and Stocks (India) Limited
India Consumer Electricals
Stock Views
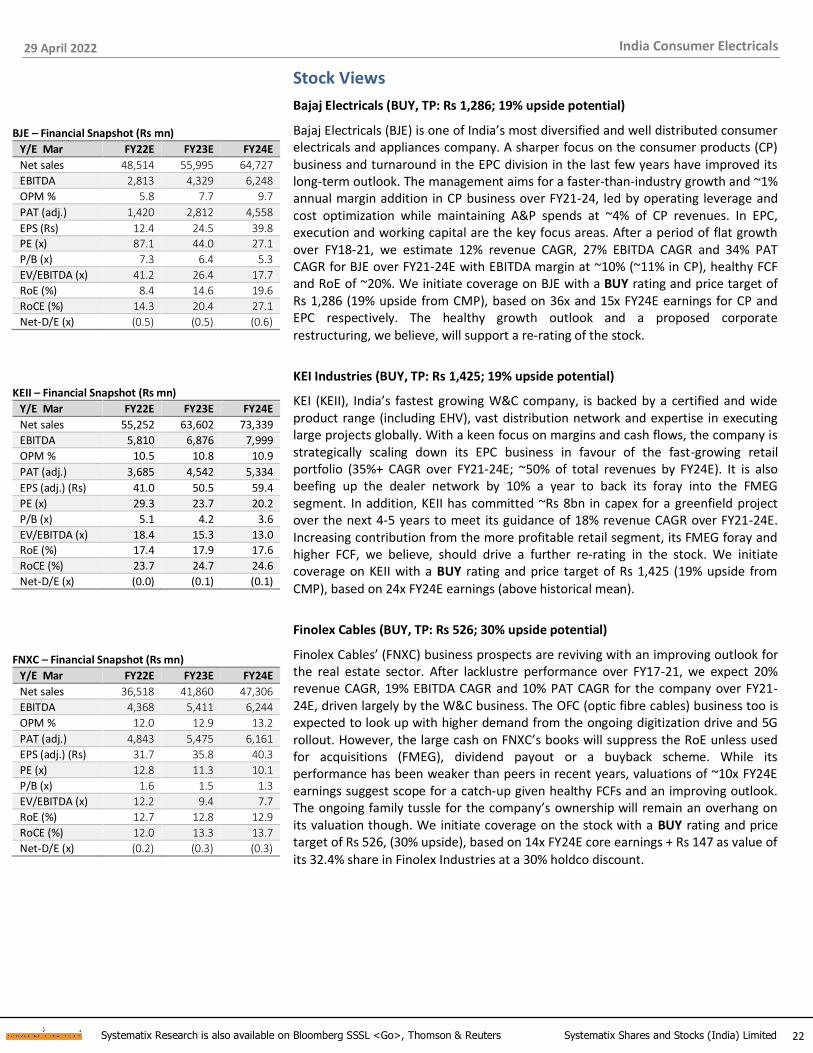
Bajaj Electricals (BUY, TP: Rs 1,286; 19% upside potential)
Bajaj Electricals (BJE) is one of India’s most diversified and well distributed consumer electricals and appliances company. A sharper focus on the consumer products (CP) business and turnaround in the EPC division in the last few years have improved its long-term outlook. The management aims for a faster-than-industry growth and ~1% annual margin addition in CP business over FY21-24, led by operating leverage and cost optimization while maintaining A&P spends at ~4% of CP revenues. In EPC, execution and working capital are the key focus areas. After a period of flat growth over FY18-21, we estimate 12% revenue CAGR, 27% EBITDA CAGR and 34% PAT CAGR for BJE over FY21-24E with EBITDA margin at ~10% (~11% in CP), healthy FCF and RoE of ~20%. We initiate coverage on BJE with a BUY rating and price target of Rs 1,286 (19% upside from CMP), based on 36x and 15x FY24E earnings for CP and EPC respectively. The healthy growth outlook and a proposed corporate
restructuring, we believe, will support a re-rating of the stock.
KEI Industries (BUY, TP: Rs 1,425; 19% upside potential)
KEI (KEII), India’s fastest growing W&C company, is backed by a certified and wide product range (including EHV), vast distribution network and expertise in executing large projects globally. With a keen focus on margins and cash flows, the company is strategically scaling down its EPC business in favour of the fast-growing retail portfolio (35%+ CAGR over FY21-24E; ~50% of total revenues by FY24E). It is also beefing up the dealer network by 10% a year to back its foray into the FMEG segment. In addition, KEII has committed ~Rs 8bn in capex for a greenfield project over the next 4-5 years to meet its guidance of 18% revenue CAGR over FY21-24E. Increasing contribution from the more profitable retail segment, its FMEG foray and higher FCF, we believe, should drive a further re-rating in the stock. We initiate coverage on KEII with a BUY rating and price target of Rs 1,425 (19% upside from
CMP), based on 24x FY24E earnings (above historical mean).
Finolex Cables (BUY, TP: Rs 526; 30% upside potential)
Finolex Cables’ (FNXC) business prospects are reviving with an improving outlook for the real estate sector. After lacklustre performance over FY17-21, we expect 20% revenue CAGR, 19% EBITDA CAGR and 10% PAT CAGR for the company over FY21-24E, driven largely by the W&C business. The OFC (optic fibre cables) business too is expected to look up with higher demand from the ongoing digitization drive and 5G rollout. However, the large cash on FNXC’s books will suppress the RoE unless used for acquisitions (FMEG), dividend payout or a buyback scheme. While its performance has been weaker than peers in recent years, valuations of ~10x FY24E earnings suggest scope for a catch-up given healthy FCFs and an improving outlook. The ongoing family tussle for the company’s ownership will remain an overhang on its valuation though. We initiate coverage on the stock with a BUY rating and price target of Rs 526, (30% upside), based on 14x FY24E core earnings + Rs 147 as value of
its 32.4% share in Finolex Industries at a 30% holdco discount.
BJE – Financial Snapshot (Rs mn)
Y/E Mar FY22E FY23E FY24E
Net sales 48,514 55,995 64,727
EBITDA 2,813 4,329 6,248
OPM % 5.8 7.7 9.7
PAT (adj.) 1,420 2,812 4,558
EPS (Rs) 12.4 24.5 39.8
PE (x) 87.1 44.0 27.1
P/B (x) 7.3 6.4 5.3
EV/EBITDA (x) 41.2 26.4 17.7
RoE (%) 8.4 14.6 19.6
RoCE (%) 14.3 20.4 27.1
Net-D/E (x) (0.5) (0.5) (0.6)
KEII – Financial Snapshot (Rs mn)
Y/E Mar FY22E FY23E FY24E
Net sales 55,252 63,602 73,339
EBITDA 5,810 6,876 7,999
OPM % 10.5 10.8 10.9
PAT (adj.) 3,685 4,542 5,334
EPS (adj.) (Rs) 41.0 50.5 59.4
PE (x) 29.3 23.7 20.2
P/B (x) 5.1 4.2 3.6
EV/EBITDA (x) 18.4 15.3 13.0
RoE (%) 17.4 17.9 17.6
RoCE (%) 23.7 24.7 24.6
Net-D/E (x) (0.0) (0.1) (0.1)
FNXC – Financial Snapshot (Rs mn)
Y/E Mar FY22E FY23E FY24E
Net sales 36,518 41,860 47,306
EBITDA 4,368 5,411 6,244
OPM % 12.0 12.9 13.2
PAT (adj.) 4,843 5,475 6,161
EPS (adj.) (Rs) 31.7 35.8 40.3
PE (x) 12.8 11.3 10.1
P/B (x) 1.6 1.5 1.3
EV/EBITDA (x) 12.2 9.4 7.7
RoE (%) 12.7 12.8 12.9
RoCE (%) 12.0 13.3 13.7
Net-D/E (x) (0.2) (0.3) (0.3)

29 April 2022
23 Systematix Research is also available on Bloomberg SSSL <Go>, Thomson & Reuters Systematix Shares and Stocks (India) Limited
India Consumer Electricals
Crompton Greaves Consumer (HOLD, TP: Rs 428; 13% upside potential)
Crompton Greaves Consumer (CROMPTON), leader in the fans and residential pumps segments, maintains a keen focus on innovation, brand-building and reach. While this helps the company further consolidate its position in core segments, product portfolio expansion enables it to capture market share in newer categories (geysers a case in point, where it has become the third largest player in 4-5 years). While the recently acquired Butterfly business will bring scale in kitchen appliances, it may not be earnings-accretive for the next two years. We are positive on CROMPTON’s prospects given its strong brand equity, product innovation skills and ample scope for portfolio/ network expansion. Its entry in other appliance categories should also allay investor concerns on product concentration. Excluding Butterfly business, we expect 13% CAGR each in revenue and PAT over FY21-24E with ~26% RoE by FY24E. Given the significant re-rating in the last two years, we initiate coverage on CROMPTON with a HOLD rating and price target of Rs 428 (13% upside from CMP), based on 35x FY24E earnings (in line with peers). Integration of Butterfly business is the key monitorable in the near to medium term.
Havells (HOLD, TP: Rs 1,383; 6% upside potential)
Havells (HAVL), one of India’s leading consumer durables companies, is among the top-3 in many of its product categories on the strength of its brand pull, vast distribution network and robust processes. The Lloyd acquisition gave it an entry into the large home appliances segment, wherein the long-term outlook is as strong as in FMEG. Several corrective measures (brand repositioning, sales channel re-structuring and in-house manufacturing) taken at Lloyd have placed the brand/ portfolio on the path of sustainable growth. Also, rising consumer preference for quality branded products augurs well for HAVL. We expect a 17% revenue CAGR and 18% PAT CAGR for the company over FY21-24E with RoE of ~22% by FY24E and healthy FCF. However, its rich valuations (47x FY24E earnings at CMP) compel us to initiate coverage on the stock with a HOLD rating and price target of Rs 1,383 (6% upside from here), based on 50x FY24E earnings. Strong growth/ FCF and a higher RoE are
key to the company sustaining such high valuations.
Polycab (HOLD, TP: Rs 2,649; 5% upside potential)
The leader in the Indian wires and cables (W&C) industry, Polycab’s (POLYCAB) entry in FMEG has been successful with the company emerging as a prominent B2C brand. A vast and backward-integrated manufacturing base, wide distribution network and enthusiastic promoters supported by a professional management team have helped it grow faster than the industry. Going forward, rising infra spends, export opportunities and expansion to adjacent categories would drive its B2B portfolio. In FMEG, we estimate 25%+ revenue CAGR as also margin expansion for POLYCAB. Project Leap (to achieve Rs 200bn+ in revenues by FY26E), we believe, sets the stage for holistic growth for the company. However, the stock price has run up significantly (4x since its listing in 2019) and we see limited room for further re-rating in the near term. We initiate coverage on POLYCAB with a HOLD rating and an SOTP-based price target of Rs 2,649 (5% upside from CMP), based on 32x P/E for W&C (Rs 2,454) and 35x P/E for FMEG (Rs 195) on FY24E earnings.
CROMPTON – Financial Snapshot (Rs mn)
Y/E Mar FY22E FY23E FY24E
Net sales 54,584 61,120 68,442
EBITDA 7,728 8,742 9,991
OPM % 14.2 14.3 14.6
PAT (adj.) 5,725 6,713 7,682
EPS (Rs) 9.1 10.7 12.2
PE (x) 41.7 35.5 31.0
P/B (x) 10.8 9.4 8.1
EV/EBITDA (x) 29.3 25.6 22.0
RoE (%) 25.9 26.4 26.2
RoCE (%) 35.3 37.0 37.3
Net-D/E (x) (0.6) (0.6) (0.6)
HAVL – Financial Snapshot (Rs mn)
Y/E Mar FY22E FY23E FY24E
Net sales 131,778 149,335 168,968
EBITDA 17,469 21,630 24,565
OPM % 13.3 14.5 14.5
PAT (adj.) 12,014 15,068 17,310
EPS (adj.) (Rs) 19.2 24.1 27.7
PE (x) 67.7 54.0 47.0
P/B (x) 13.8 11.8 10.1
EV/EBITDA (x) 45.5 36.4 31.7
RoE (%) 20.3 21.9 21.6
RoCE (%) 26.4 29.1 29.1
Net-D/E (x) (0.3) (0.4) (0.4)
POLYCAB – Financial Snapshot (Rs mn)
Y/E Mar FY22E FY23E FY24E
Net sales 117,302 133,513 152,164
EBITDA 11,477 14,559 18,114
OPM % 9.8 10.9 11.9
PAT (adj.) 7,585 10,104 12,792
EPS (adj.) (Rs) 50.9 67.8 85.8
PE (x) 49.5 37.2 29.4
P/B (x) 7.1 6.3 5.4
EV/EBITDA (x) 32.0 24.9 19.7
RoE (%) 14.3 16.8 18.3
RoCE (%) 19.8 23.5 25.8
Net-D/E (x) (0.2) (0.2) (0.3)

29 April 2022
24 Systematix Research is also available on Bloomberg SSSL <Go>, Thomson & Reuters Systematix Shares and Stocks (India) Limited
India Consumer Electricals
V-Guard (HOLD, TP: Rs 225; 5% upside potential)
V-Guard (VGRD), initially into voltage stabilizers, has diversified its portfolio to a wide range of light electrical products over the last decade. Already a leader in South India, it is now fortifying its pan-India footprint. While growth has remained muted in the last few years, robust traction in the non-South regions (~42% of revenues and ~60% of distribution reach) offers significant potential for growth. We estimate 17% revenue CAGR, 14% EBITDA CAGR and 15% PAT CAGR for VGRD over FY21-24E, led by growth across product categories and stable margins as RM cost pressure gets offset by operating leverage benefits. While we like the company for its pan-India aspiration, cash-rich status and healthy FCF, we believe the stock trades close to its fair valuations at ~30x FY24E earnings. We initiate coverage on VGRD with a HOLD rating and price target of Rs 225 (5% upside from CMP), based on 32x FY24E earnings (~10% discount to comparable peers due to a relatively weaker brand in markets outside the South and operating parameters).
Orient Electric (HOLD, TP: Rs 302; 6% downside potential)
Orient Electric (ORIENTEL), the leader in fans, is growing rapidly in new categories (lighting, appliances and switchgears) as well. A renewed focus on innovative new launches and portfolio premiumization have helped the company reposition itself as a vibrant and new-age brand. Higher A&P spends at ~4% of sales have enhanced brand visibility while its wide distribution network has supported entry in new categories. The company aspires to expand margins despite the RM cost headwind, aided by operating leverage and premiumization. We expect 17% revenue CAGR, 14% EBITDA CAGR and 14% PAT CAGR for ORIENTEL over FY21-24E with growth across categories and stable margins. We expect RoE to sustain at ~25% and healthy FCF generation to continue. While we like ORIENTEL’s business, current valuations at 38x FY24E earnings adequately capture the growth prospects. We initiate coverage on the stock with a HOLD rating and price target of Rs 302 (6% downside from CMP), based on 36x FY24E earnings (in line with peers vs its 42x 5-year mean). Increasing competitive intensity is a key risk to our earnings estimates.
VGRD – Financial Snapshot (Rs mn)
Y/E Mar FY22E FY23E FY24E
Net sales 34,769 39,157 44,102
EBITDA 3,270 3,946 4,579
OPM % 9.4 10.1 10.4
PAT (adj.) 2,017 2,569 3,042
EPS (adj.) (Rs) 4.7 6.0 7.1
PE (x) 45.9 36.0 30.4
P/B (x) 6.8 6.0 5.2
EV/EBITDA (x) 27.3 22.4 19.1
RoE (%) 14.9 16.7 17.2
RoCE (%) 21.4 24.0 25.0
Net-D/E (x) (0.2) (0.3) (0.3)
ORIENTEL – Financial Snapshot (Rs mn)
Y/E Mar FY22E FY23E FY24E
Net sales 25,681 28,762 32,214
EBITDA 2,291 2,738 3,228
OPM % 8.9 9.5 10.0
PAT (adj.) 1,244 1,511 1,781
EPS (adj.) (Rs) 5.9 7.1 8.4
PE (x) 54.6 44.9 38.1
P/B (x) 12.9 11.1 9.5
EV/EBITDA (x) 28.9 24.2 20.4
RoE (%) 23.6 24.6 24.8
RoCE (%) 35.0 33.4 32.3
Net-D/E (x) (0.3) (0.3) (0.3)

29 April 2022
25 Systematix Research is also available on Bloomberg SSSL <Go>, Thomson & Reuters Systematix Shares and Stocks (India) Limited
India Consumer Electricals
Exhibit 47: Peer comparison valuations
Company
Bloomberg
code
CMP M Cap Reco.
Target Price (Rs)
Upside (%)
Target P/E (x)
5-year P/E (x) P/E (x) RoE (%)
(Rs) (Rs bn) FY24E Mean +1 SD -1 SD FY22E FY24E FY22E FY24E
Finolex Cables FNXC IN 405 62 Buy 526 30 13 16 22 11 13 10 13 13
Bajaj Electricals BJE IN 1,080 124 Buy 1,286 19 32 46 63 29 87 27 8 20
KEI Industries KEII IN 1,200 108 Buy 1,425 19 24 16 20 12 29 20 17 18
Crompton CROMPTON
IN 380 239 Hold 428 13 35 35 42 27 42 31 26 26
Havells HAVL IN 1,300 814 Hold 1,383 6 50 48 58 39 68 47 20 22
Polycab POLYCAB IN 2,520 376 Hold 2,649 5 31 23 33 13 50 29 14 18
V-Guard VGRD IN 215 92 Hold 225 5 32 48 56 40 46 30 15 17
Orient Electric ORIENTEL IN 320 68 Hold 302 (6) 36 42 49 34 55 38 24 25
Source: Company, Systematix Institutional Research
Exhibit 48: Peer comparison
Company EPS (Rs) CAGR (%; FY16-21) CAGR (%; FY21-24E) RoIC (%) RoCE (%)
FY22E FY23E FY24E Rev EBITDA PAT Rev EBITDA PAT FY22E FY24E FY22E FY24E
Finolex Cables 31.7 35.8 40.3 3 1 7 20 19 10 15 17 12 14
Bajaj Electricals 12.4 24.5 39.8 (0) 3 12 12 27 34 11 41 14 27
KEI Industries 41.0 50.5 59.4 12 13 34 21 20 25 19 21 24 25
Crompton 9.1 10.7 12.2 6 11 24 13 12 8 66 74 35 37
Havells 19.2 24.1 27.7 7 16 (4) 17 16 18 28 37 26 29
Polycab 50.9 67.8 85.8 11 18 36 20 17 14 18 26 20 26
V-Guard 4.7 6.0 7.1 8 11 12 17 14 15 20 25 21 25
Orient Electric 5.9 7.1 8.4 8 17 23 17 14 14 43 37 35 32
Source: Company, Systematix Institutional Research

29 April 2022
26 Systematix Research is also available on Bloomberg SSSL <Go>, Thomson & Reuters Systematix Shares and Stocks (India) Limited
India Consumer Electricals
Exhibit 49: PE band and standard deviation (one-year forward)
FNXC BJE
0
5
10
15
20
25
30
35
Apr
-17
Jul-1
7
Oct
-17
Jan-
18
Apr
-18
Jul-1
8
Oct
-18
Jan-
19
Apr
-19
Jul-1
9
Oct
-19
Jan-
20
Apr
-20
Jul-2
0
Oct
-20
Jan-
21
Apr
-21
Jul-2
1
Oct
-21
Jan-
22
Apr
-22
P/E Mean +1 SD -1 SD
-1SD
+1SD
Mean
0
10
20
30
40
50
60
70
80
90
100
Apr
-17
Jul-1
7
Oct
-17
Jan-
18
Apr
-18
Jul-1
8
Oct
-18
Jan-
19
Apr
-19
Jul-1
9
Oct
-19
Jan-
20
Apr
-20
Jul-2
0
Oct
-20
Jan-
21
Apr
-21
Jul-2
1
Oct
-21
Jan-
22
Apr
-22
P/E Mean +1 SD -1 SD
-1SD
+1SD
Mean
Data points of this period is ignored due to distored PE band coming out of negative EPS in FY20.
KEII CROMPTON
0
5
10
15
20
25
30
Apr
-17
Jul-
17
Oct
-17
Jan-
18
Apr
-18
Jul-
18
Oct
-18
Jan-
19
Apr
-19
Jul-
19
Oct
-19
Jan-
20
Apr
-20
Jul-
20
Oct
-20
Jan-
21
Apr
-21
Jul-
21
Oct
-21
Jan-
22
Apr
-22
P/E Mean +1 SD -1 SD
-1SD
+1SD
Mean
0
10
20
30
40
50
60
Apr
-17
Jul-1
7
Oct
-17
Jan-
18
Apr
-18
Jul-1
8
Oct
-18
Jan-
19
Apr
-19
Jul-1
9
Oct
-19
Jan-
20
Apr
-20
Jul-2
0
Oct
-20
Jan-
21
Apr
-21
Jul-2
1
Oct
-21
Jan-
22
Apr
-22
P/E Mean +1 SD -1 SD
-1SD
+1SD
Mean
HAVL POLYCAB
0
10
20
30
40
50
60
70
80
Ap
r-17
Jul-
17
Oct
-17
Jan-
18
Ap
r-18
Jul-
18
Oct
-18
Jan-
19
Ap
r-19
Jul-
19
Oct
-19
Jan-
20
Ap
r-20
Jul-
20
Oct
-20
Jan-
21
Ap
r-21
Jul-
21
Oct
-21
Jan-
22
Ap
r-22
P/E Mean +1 SD -1 SD
-1SD
+1SD
Mean
0
5
10
15
20
25
30
35
40
45
Apr
-19
Jun-
19
Aug
-19
Oct
-19
Dec
-19
Mar
-20
May
-20
Jul-
20
Sep-
20
Nov
-20
Jan-
21
Mar
-21
May
-21
Jul-
21
Sep-
21
Dec
-21
Feb-
22
Apr
-22
P/E Mean +1 SD -1 SD
-1SD
+1SD
Mean
VGRD ORIENTEL
20
25
30
35
40
45
50
55
60
65
70
Apr
-17
Jul-
17
Oct
-17
Jan-
18
Apr
-18
Jul-
18
Oct
-18
Jan-
19
Apr
-19
Jul-
19
Oct
-19
Jan-
20
Apr
-20
Jul-
20
Oct
-20
Jan-
21
Apr
-21
Jul-
21
Oct
-21
Jan-
22
Apr
-22
P/E Mean +1 SD -1 SD
-1SD
+1SD
Mean
20
25
30
35
40
45
50
55
60
65
May
-18
Aug
-18
Nov
-18
Feb-
19
May
-19
Aug
-19
Oct
-19
Jan-
20
Apr
-20
Jul-
20
Oct
-20
Jan-
21
Apr
-21
Jul-
21
Oct
-21
Jan-
22
Apr
-22
P/E Mean +1 SD -1 SD
-1SD
+1SD
Mean
Source: BSE, Company, Systematix Institutional Research
29 April 2022
27 Systematix Research is also available on Bloomberg SSSL <Go>, Thomson & Reuters Systematix Shares and Stocks (India) Limited
India Consumer Electricals
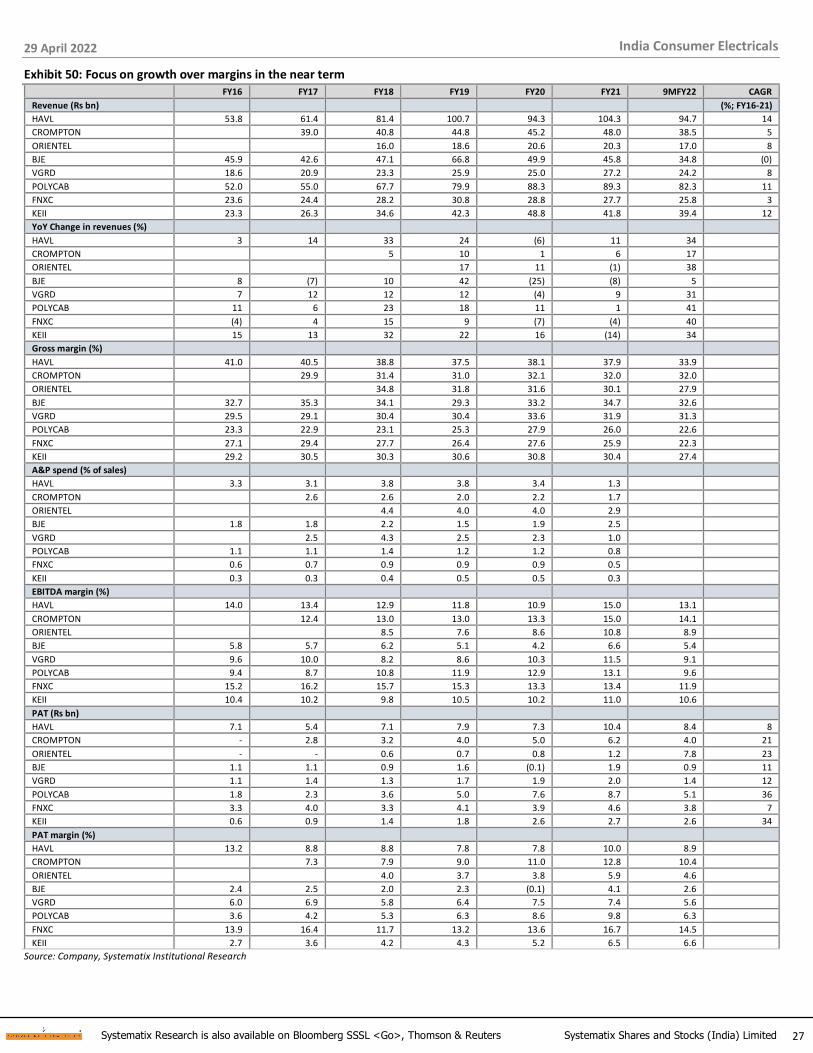
Exhibit 50: Focus on growth over margins in the near term
FY16 FY17 FY18 FY19 FY20 FY21 9MFY22 CAGR
Revenue (Rs bn) (%; FY16-21)
HAVL 53.8 61.4 81.4 100.7 94.3 104.3 94.7 14
CROMPTON 39.0 40.8 44.8 45.2 48.0 38.5 5
ORIENTEL 16.0 18.6 20.6 20.3 17.0 8
BJE 45.9 42.6 47.1 66.8 49.9 45.8 34.8 (0)
VGRD 18.6 20.9 23.3 25.9 25.0 27.2 24.2 8
POLYCAB 52.0 55.0 67.7 79.9 88.3 89.3 82.3 11
FNXC 23.6 24.4 28.2 30.8 28.8 27.7 25.8 3
KEII 23.3 26.3 34.6 42.3 48.8 41.8 39.4 12
YoY Change in revenues (%) HAVL 3 14 33 24 (6) 11 34 CROMPTON 5 10 1 6 17 ORIENTEL 17 11 (1) 38 BJE 8 (7) 10 42 (25) (8) 5 VGRD 7 12 12 12 (4) 9 31 POLYCAB 11 6 23 18 11 1 41 FNXC (4) 4 15 9 (7) (4) 40 KEII 15 13 32 22 16 (14) 34 Gross margin (%) HAVL 41.0 40.5 38.8 37.5 38.1 37.9 33.9 CROMPTON 29.9 31.4 31.0 32.1 32.0 32.0 ORIENTEL 34.8 31.8 31.6 30.1 27.9 BJE 32.7 35.3 34.1 29.3 33.2 34.7 32.6 VGRD 29.5 29.1 30.4 30.4 33.6 31.9 31.3 POLYCAB 23.3 22.9 23.1 25.3 27.9 26.0 22.6 FNXC 27.1 29.4 27.7 26.4 27.6 25.9 22.3 KEII 29.2 30.5 30.3 30.6 30.8 30.4 27.4 A&P spend (% of sales) HAVL 3.3 3.1 3.8 3.8 3.4 1.3 CROMPTON 2.6 2.6 2.0 2.2 1.7 ORIENTEL 4.4 4.0 4.0 2.9 BJE 1.8 1.8 2.2 1.5 1.9 2.5 VGRD 2.5 4.3 2.5 2.3 1.0 POLYCAB 1.1 1.1 1.4 1.2 1.2 0.8 FNXC 0.6 0.7 0.9 0.9 0.9 0.5 KEII 0.3 0.3 0.4 0.5 0.5 0.3 EBITDA margin (%) HAVL 14.0 13.4 12.9 11.8 10.9 15.0 13.1 CROMPTON 12.4 13.0 13.0 13.3 15.0 14.1 ORIENTEL 8.5 7.6 8.6 10.8 8.9 BJE 5.8 5.7 6.2 5.1 4.2 6.6 5.4 VGRD 9.6 10.0 8.2 8.6 10.3 11.5 9.1 POLYCAB 9.4 8.7 10.8 11.9 12.9 13.1 9.6 FNXC 15.2 16.2 15.7 15.3 13.3 13.4 11.9 KEII 10.4 10.2 9.8 10.5 10.2 11.0 10.6 PAT (Rs bn) HAVL 7.1 5.4 7.1 7.9 7.3 10.4 8.4 8
CROMPTON - 2.8 3.2 4.0 5.0 6.2 4.0 21
ORIENTEL - - 0.6 0.7 0.8 1.2 7.8 23
BJE 1.1 1.1 0.9 1.6 (0.1) 1.9 0.9 11
VGRD 1.1 1.4 1.3 1.7 1.9 2.0 1.4 12
POLYCAB 1.8 2.3 3.6 5.0 7.6 8.7 5.1 36
FNXC 3.3 4.0 3.3 4.1 3.9 4.6 3.8 7
KEII 0.6 0.9 1.4 1.8 2.6 2.7 2.6 34
PAT margin (%) HAVL 13.2 8.8 8.8 7.8 7.8 10.0 8.9 CROMPTON 7.3 7.9 9.0 11.0 12.8 10.4 ORIENTEL 4.0 3.7 3.8 5.9 4.6 BJE 2.4 2.5 2.0 2.3 (0.1) 4.1 2.6 VGRD 6.0 6.9 5.8 6.4 7.5 7.4 5.6 POLYCAB 3.6 4.2 5.3 6.3 8.6 9.8 6.3 FNXC 13.9 16.4 11.7 13.2 13.6 16.7 14.5 KEII 2.7 3.6 4.2 4.3 5.2 6.5 6.6
Source: Company, Systematix Institutional Research

29 April 2022
28 Systematix Research is also available on Bloomberg SSSL <Go>, Thomson & Reuters Systematix Shares and Stocks (India) Limited
India Consumer Electricals
Exhibit 51: Leading players spend heavily on advertisement & sales promotion
Polycab Experience Centre
29 April 2022
29 Systematix Research is also available on Bloomberg SSSL <Go>, Thomson & Reuters Systematix Shares and Stocks (India) Limited
India Consumer Electricals
Source: Company

29 April 2022
30 Systematix Research is also available on Bloomberg SSSL <Go>, Thomson & Reuters Systematix Shares and Stocks (India) Limited
India Consumer Electricals
COMPANIES SECTION

Systematix Research is also available on Bloomberg SSSL <Go>, Thomson & Reuters Systematix Shares and Stocks (India) Limited
Investors are advised to refer disclosures made at the end of the research report.
31
Bajaj Electricals
Restructuring and healthy FCF re-rating triggers
Bajaj Electricals (BJE) is one of India’s most diversified and well distributed consumer electricals and appliances company. A sharper focus on the consumer products (CP) business and turnaround in the EPC division in the last few years have improved its long-term outlook. The management aims for a faster-than-industry growth and ~1% annual margin addition in CP business over FY21-24, led by operating leverage and cost optimization while maintaining A&P spends at ~4% of CP revenues. In EPC, execution and working capital are the key focus areas. After a period of flat growth over FY18-21, we estimate 12% revenue CAGR, 27% EBITDA CAGR and 34% PAT CAGR for BJE over FY21-24E with EBITDA margin at ~10% (~11% in CP), healthy FCF and RoE of ~20%. We initiate coverage on BJE with a BUY rating and price target of Rs 1,286 (19% upside from CMP), based on 36x and 15x FY24E earnings for CP and EPC respectively. The healthy growth outlook and a proposed corporate restructuring, we believe, will support a re-rating of the stock.
A diversified consumer electricals and appliances company: BJE’s CP business comprises a wide range of SKUs in appliances, fans and lighting products. The largest in small appliances category, the company is the leader in irons, water heaters, OTGs and mixers. Its vast product range across price points also includes premium home appliances and cookware products in association with Morphy Richards and Nirlep respectively. BJE has an extensive network of 20+ branch offices, 550+ distributors and 218,000+ retail outlets pan-India, with 500+ consumer care centres fortifying its dominant presence in the CP segment.
Industry-leading growth in CP segment; EPC nearing break-even: BJE has grown ahead of the industry in CP since FY20 as focus returned to this business. It has also partly recouped the market share it lost in the previous years. We expect the momentum to be sustained with 16% revenue CAGR and ~100bps a year expansion in EBITDA margin over FY21-24E, led by operating leverage and cost optimization measures. In EPC, BJE has corrected course and recalibrated the pace of growth – it now bids for select orders offering reasonable margins. This has resulted in better cash flows and helped reduce the high debt taken for working capital. Nearing break-
even (FY23E), the EPC segment is likely to achieve 6% margins in the coming years.
Corporate restructuring to unlock value: Considering the varied nature of and potential opportunities in CP and EPC businesses as also the need for a focused approach in each, BJE plans to undertake a comprehensive review of its corporate structure. In this direction, it is evaluating viable options and alternatives including a demerger, subsidiarization, strategic partnerships, etc. The restructuring will help investors better understand and compare BJE’s CP business with peer group.
Healthy outlook and corporate restructuring to drive a re-rating: Considering the management’s focus on growth and margins in the CP segment and managing the working capital cycle and cutting debt in EPC, we estimate 12% revenue CAGR, 27% EBITDA CAGR and 34% PAT CAGR for BJE over FY21-24E. We expect EBITDA margin to improve to over 10% (11%+ in CP) with RoE of ~20% leading to healthy FCF. We also see potential value unlocking from the proposed corporate restructuring. We initiate coverage on the stock with a BUY rating and price target of Rs 1,286 (19% upside from CMP), based on 36x/ 15x FY24E earnings for CP/ EPC business. Any sharp volatility in commodity prices and pandemic-led supply chain disruptions are potential downside risks to our estimates.
Systematix Institutional Equities
29 April 2022
INITIATING COVERAGE
Sector: Consumer Electricals Rating: BUY
CMP: Rs 1,080 Target Price: Rs 1,286
Stock Info
Sensex/Nifty 57,521/17,244
Bloomberg BJE IN
Equity shares (mn) 114.6
52-wk High/Low 1,529/994
Face value Rs 2
M-Cap Rs 124 bn/ USD 1.7bn
3-m avg turnover USD 3.1mn
Financial Snapshot (Rs mn) Y/E Mar FY22E FY23E FY24E
Net sales 48,514 55,995 64,727
EBITDA 2,813 4,329 6,248
OPM % 5.8 7.7 9.7
PAT (adj.) 1,420 2,812 4,558
EPS (Rs) 12.4 24.5 39.8
PE (x) 87.1 44.0 27.1
P/B (x) 7.3 6.4 5.3
EV/EBITDA (x) 41.2 26.4 17.7
RoE (%) 8.4 14.6 19.6
RoCE (%) 14.3 20.4 27.1
Net-D/E (x) (0.5) (0.5) (0.6)
Shareholding Pattern (%) Mar'22 Dec'21 Sep'21
Promoter 63.0 63.0 63.1
- Pledged 2.55 2.55 -
FII 10.6 11.8 12.9
DII 12.0 11.6 11.1
Others 14.4 13.6 13.0
Stock Performance (1-year)
500
700
900
1,100
1,300
1,500
1,700
Ap
r-2
1
May
-21
Jun
-21
Jul-
21
Au
g-2
1
Sep
-21
Oct
-21
No
v-2
1
Dec
-21
Jan
-22
Feb
-22
Mar
-22
Ap
r-2
2
BJE Sensex
Ashish Poddar [email protected] +91 22 6704 8039
Pranay Shah [email protected] +91 22 6704 8017

29 April 2022
32 Systematix Research is also available on Bloomberg SSSL <Go>, Thomson & Reuters Systematix Shares and Stocks (India) Limited
Bajaj Electricals
Story in charts
Exhibit 1: Consumer Products – revenue and EBIT margin trend Exhibit 2: Net debt trend
0
2
4
6
8
10
12
0
10
20
30
40
50
60
FY18 FY19 FY20 FY21 FY22E FY23E FY24E
(%)(Rs bn)
Revenue EBIT % (RHS)
0
2
4
6
8
10
12
14
16
18
FY18 FY19 FY20 FY21 FY22E FY23E FY24E
(Rs bn)
Net-debt
Source: Company, Systematix Institutional Research Source: Company, Systematix Institutional Research
Exhibit 3: EPC – revenue and EBIT margin trend Exhibit 4: PAT and growth trend
-6
-4
-2
0
2
4
6
8
10
0
5
10
15
20
25
30
35
40
45
FY18 FY19 FY20 FY21 FY22E FY23E FY24E
(%)(Rs bn)
Revenue EBIT % (RHS)
CAGR: -2%
-1
0
1
2
3
4
5
FY18 FY19 FY20 FY21 FY22E FY23E FY24E
(Rs bn)
PAT
Source: Company, Systematix Institutional Research Source: Company, Systematix Institutional Research
Exhibit 5: RoE and RoCE trend Exhibit 6: OCF, Capex and FCF trend
-5
0
5
10
15
20
25
30
FY18 FY19 FY20 FY21 FY22E FY23E FY24E
(%)
RoE % RoCE %
-8
-6
-4
-2
0
2
4
6
8
10
12
OCF Capex FCF
(Rs bn)
FY18 FY19 FY20 FY21 FY22E FY23E FY24E
Source: Company, Systematix Institutional Research Source: Company, Systematix Institutional Research

29 April 2022
33 Systematix Research is also available on Bloomberg SSSL <Go>, Thomson & Reuters Systematix Shares and Stocks (India) Limited
Bajaj Electricals
Investment Analysis
A well-diversified consumer electricals and appliances company
BJE derives 72% of its revenues from the Consumer Products (CP) segment, with the portfolio mainly comprising appliances, fans and lighting products. The company is the largest in the small appliances market, and the leader in irons, water heaters, OTGs and mixers. Its vast product range across price points also includes premium home appliances and cookware with brands like Morphy Richards and Nirlep.
Exhibit 7: Consumer Products – revenue mix (FY21)
54%
27%
12%
7%
Appliances
Fans
Lighting
Morphy Richard
Source: Company
Strong revival attracting investor attention
After witnessing average growth in its CP portfolio in the last five years due to a higher emphasis on the EPC segment, the focus has returned to the CP business. We expect a strong revival in the CP business with 24% revenue CAGR for BJE over FY21-24E, the highest among leading players in the segment.
Exhibit 8: BJE’s CP business to grow faster than leading peers
43
74
8
18 16 16 18
36
25 24 17 17 16
13
0
10
20
30
40
50
60
70
80
FNX
C
PO
LYC
AB
BJE
VG
RD
OR
IEN
TEL
HA
VL
CR
OM
PTO
N
(%)
FY16-21 FY21-24E
Source: Company, Systematix Institutional Research

29 April 2022
34 Systematix Research is also available on Bloomberg SSSL <Go>, Thomson & Reuters Systematix Shares and Stocks (India) Limited
Bajaj Electricals
The largest and deepest pan-India presence
BJE, through the Range & Reach Expansion Programme (RREP), has strengthened its dealer network over the years vis-a-vis the traditional wholesale-led model. It currently has an extensive network of 20+ branch offices, 550+ distributors and 218,000+ retail outlets across India, with >500+ consumer care centres fortifying its dominance. BJE aims to improve revenue per store in its strong markets and add stores in weaker markets (the South). Along with the traditional channel, BJE has also increased its presence in the alternate channel (~36% of CP revenues currently).
To boost brand visibility and premium positioning, BJE has stepped up its spend on
advertisement and sales promotions to ~4% of CP revenues, in line with peers’.
Exhibit 9: BJE has the widest network of retail touchpoints Exhibit 10: A&P spend as a proportion of CP revenues
0
50,000
1,00,000
1,50,000
2,00,000
2,50,000
BJE
CR
OM
PT
ON
HA
VL
PO
LYC
AB
OR
IEN
TEL
FNX
C
VG
RD
(Number of retailers)
0
0.5
1
1.5
2
2.5
3
3.5
4
4.5
5
0
0
0
1
1
1
1
FY16 FY17 FY18 FY19 FY20 FY21
(%)(Rs mn)
A&P spend % revenue (RHS)
Source: Company, Systematix Institutional Research Source: Company, Systematix Institutional Research
Exhibit 11: Advertisements for its wide product portfolio
Source: Company
Focus on cost optimization and improving efficiency across verticals
Local sourcing. BJE management has identified many areas that present scope for cost optimization and efficiency improvement. Increasing local sourcing is one such area where it can reduce forex exposure and strive for better inventory management. Currently, the company has high dependency on outsourcing (~80% of CP revenues). However, it is focussing on localized sourcing and reducing its dependence on imports (~20% currently).
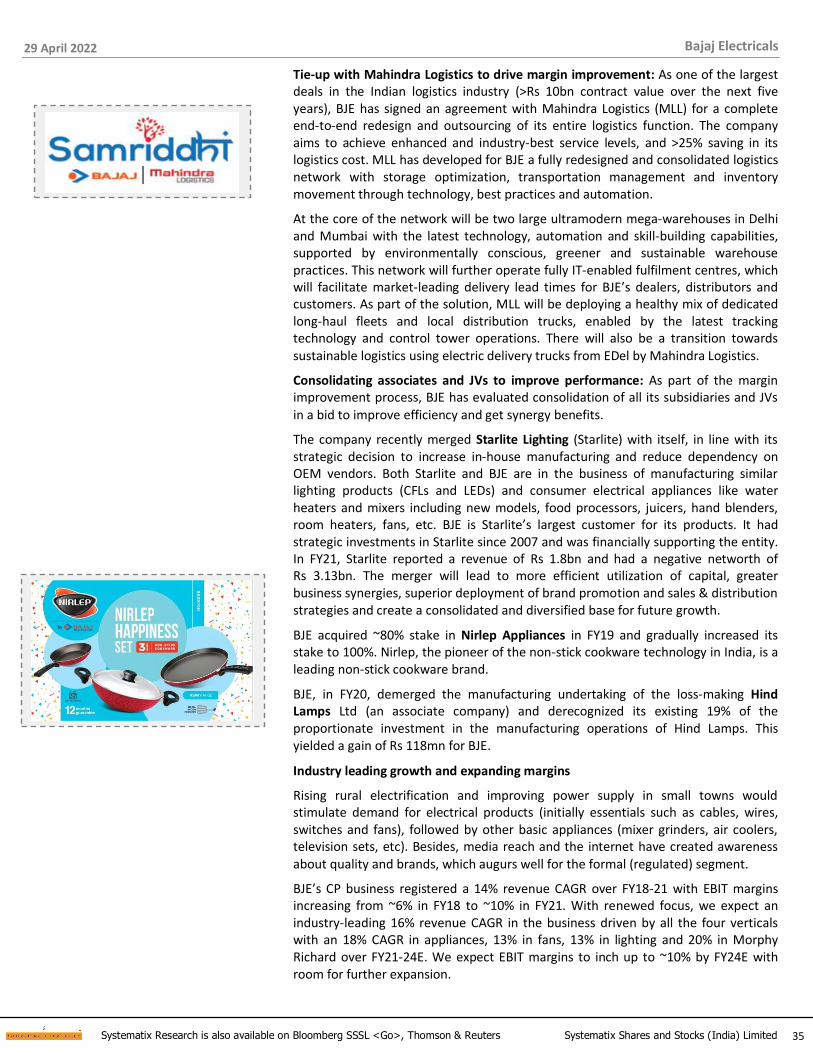
29 April 2022
35 Systematix Research is also available on Bloomberg SSSL <Go>, Thomson & Reuters Systematix Shares and Stocks (India) Limited
Bajaj Electricals
Tie-up with Mahindra Logistics to drive margin improvement: As one of the largest deals in the Indian logistics industry (>Rs 10bn contract value over the next five years), BJE has signed an agreement with Mahindra Logistics (MLL) for a complete end-to-end redesign and outsourcing of its entire logistics function. The company aims to achieve enhanced and industry-best service levels, and >25% saving in its logistics cost. MLL has developed for BJE a fully redesigned and consolidated logistics network with storage optimization, transportation management and inventory movement through technology, best practices and automation.
At the core of the network will be two large ultramodern mega-warehouses in Delhi and Mumbai with the latest technology, automation and skill-building capabilities, supported by environmentally conscious, greener and sustainable warehouse practices. This network will further operate fully IT-enabled fulfilment centres, which will facilitate market-leading delivery lead times for BJE’s dealers, distributors and customers. As part of the solution, MLL will be deploying a healthy mix of dedicated long-haul fleets and local distribution trucks, enabled by the latest tracking technology and control tower operations. There will also be a transition towards
sustainable logistics using electric delivery trucks from EDel by Mahindra Logistics.
Consolidating associates and JVs to improve performance: As part of the margin improvement process, BJE has evaluated consolidation of all its subsidiaries and JVs in a bid to improve efficiency and get synergy benefits.
The company recently merged Starlite Lighting (Starlite) with itself, in line with its strategic decision to increase in-house manufacturing and reduce dependency on OEM vendors. Both Starlite and BJE are in the business of manufacturing similar lighting products (CFLs and LEDs) and consumer electrical appliances like water heaters and mixers including new models, food processors, juicers, hand blenders, room heaters, fans, etc. BJE is Starlite’s largest customer for its products. It had strategic investments in Starlite since 2007 and was financially supporting the entity. In FY21, Starlite reported a revenue of Rs 1.8bn and had a negative networth of Rs 3.13bn. The merger will lead to more efficient utilization of capital, greater business synergies, superior deployment of brand promotion and sales & distribution strategies and create a consolidated and diversified base for future growth.
BJE acquired ~80% stake in Nirlep Appliances in FY19 and gradually increased its stake to 100%. Nirlep, the pioneer of the non-stick cookware technology in India, is a leading non-stick cookware brand.
BJE, in FY20, demerged the manufacturing undertaking of the loss-making Hind Lamps Ltd (an associate company) and derecognized its existing 19% of the proportionate investment in the manufacturing operations of Hind Lamps. This yielded a gain of Rs 118mn for BJE.
Industry leading growth and expanding margins
Rising rural electrification and improving power supply in small towns would stimulate demand for electrical products (initially essentials such as cables, wires, switches and fans), followed by other basic appliances (mixer grinders, air coolers, television sets, etc). Besides, media reach and the internet have created awareness about quality and brands, which augurs well for the formal (regulated) segment.
BJE’s CP business registered a 14% revenue CAGR over FY18-21 with EBIT margins increasing from ~6% in FY18 to ~10% in FY21. With renewed focus, we expect an industry-leading 16% revenue CAGR in the business driven by all the four verticals with an 18% CAGR in appliances, 13% in fans, 13% in lighting and 20% in Morphy Richard over FY21-24E. We expect EBIT margins to inch up to ~10% by FY24E with room for further expansion.
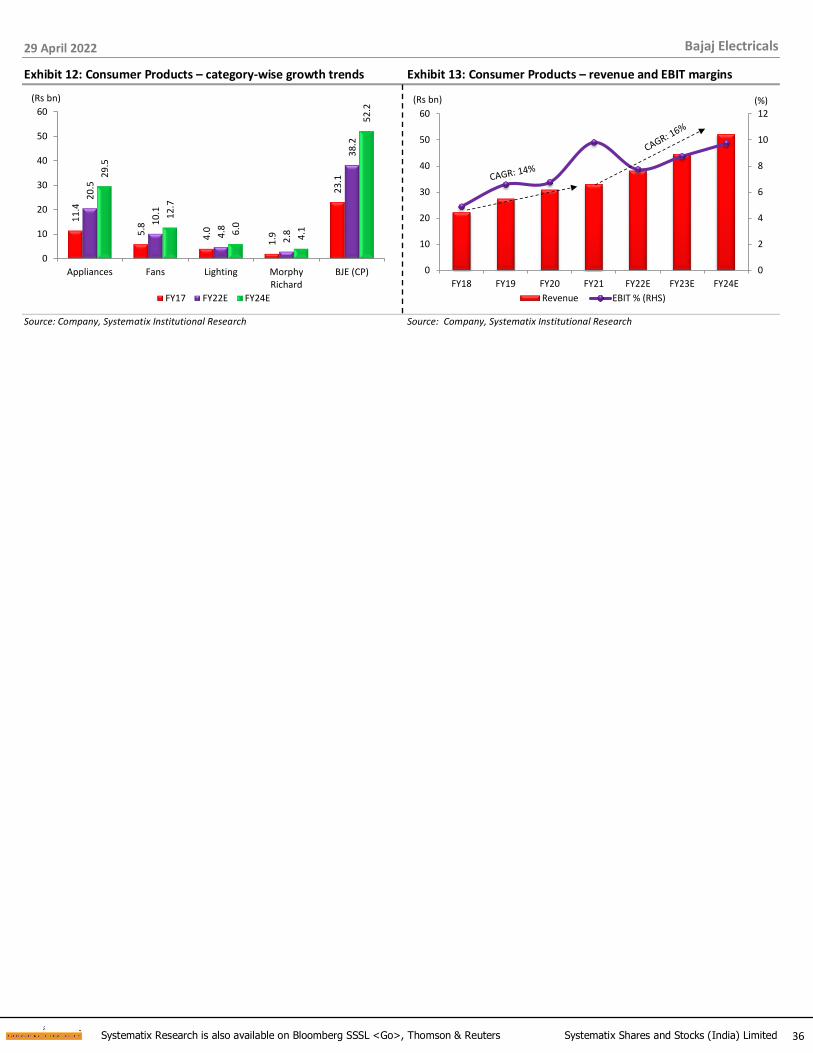
29 April 2022
36 Systematix Research is also available on Bloomberg SSSL <Go>, Thomson & Reuters Systematix Shares and Stocks (India) Limited
Bajaj Electricals
Exhibit 12: Consumer Products – category-wise growth trends Exhibit 13: Consumer Products – revenue and EBIT margins 1
1.4
5.8
4.0
1.9
23
.1
20
.5
10
.1
4.8
2.8
38
.2
29
.5
12
.7
6.0
4.1
52
.2
0
10
20
30
40
50
60
Appliances Fans Lighting MorphyRichard
BJE (CP)
(Rs bn)
FY17 FY22E FY24E
0
2
4
6
8
10
12
0
10
20
30
40
50
60
FY18 FY19 FY20 FY21 FY22E FY23E FY24E
(%)(Rs bn)
Revenue EBIT % (RHS)
Source: Company, Systematix Institutional Research Source: Company, Systematix Institutional Research

29 April 2022
37 Systematix Research is also available on Bloomberg SSSL <Go>, Thomson & Reuters Systematix Shares and Stocks (India) Limited
Bajaj Electricals
EPC: Focus on cash flows over just growth
BJE’s Engineering Procurement and Construction (EPC) segment includes Power Transmission & Distribution and Illumination Projects. The company bagged a few large power distribution projects and grew at a significant pace over FY17-19. However, the growth also led to ballooning of debt levels due to mounting receivables. Over the past few years, BJE has curtailed its power transmission order book and increased operational focus to ensure project closures, increased cash
flows, reduction in receivables and repayment of most of the debt.
Power Distribution. BJE is eyeing numerous opportunities for acquiring substation projects under the Feeder Separation Programme and securing monopole orders. It has also extended operations to export markets (the first international project commissioned in Zambia) given lesser competition in the power distribution segment, predictable cash flows and better margins. The main challenge to EPC business lies in the distribution segment and the management is striving to adopt a conservative outlook during order selection to sustain margins. BJE has successfully closed certain legacy projects, which has led to a reduction in its receivables.
Power Transmission. The monopole business is projected to grow further, mainly on account of various road widening, metro rail and flyover projects in tier-2 and -3 cities. BJE’s foray into the 400kV bay extension project from Power Grid Corporation
will pave the way for future growth in this niche segment.
Illumination: Various accomplished projects for EESL, NHAI, Delhi Metro, etc and its sound strategies and agile responses to mitigate the hit from the pandemic have helped BJE win incremental market share. The segment is profitable with a positive future outlook even as the semi-conductor chip shortage and price increases have
had a temporary adverse impact on LED lighting business.
Exhibit 14: BJE’s areas of operations in EPC
Illumination Power Transmission Power Distribution
Source: Company, Systematix Institutional Research
Legacy orders behind now; EPC business expected to turn profitable in FY23
BJE has successfully closed certain legacy projects and continues to reduce its receivables. The EPC business has shrunk due to intentional descaling and calibration from purely a capital employment perspective, due to which project selection is now based on assessment of the risk quantum. A sharp reduction in revenues led to losses in the segment over FY19-22 due to high overheads set up to support its FY19 EPC revenues of Rs 40bn. The company has significantly reduced these overheads since then and expects to be profitable by 4QFY22. From high growth earlier, BJE has now shifted operational focus to project closures. This would lead to increased cash
flows, lower receivables and repayment of most of the debt.

29 April 2022
38 Systematix Research is also available on Bloomberg SSSL <Go>, Thomson & Reuters Systematix Shares and Stocks (India) Limited
Bajaj Electricals
Exhibit 15: EPC – revenue and EBIT margin trend Exhibit 16: Net debt trend
-6
-4
-2
0
2
4
6
8
10
0
5
10
15
20
25
30
35
40
45
FY18 FY19 FY20 FY21 FY22E FY23E FY24E
(%)(Rs bn)
Revenue EBIT % (RHS)
CAGR: -2%
0
2
4
6
8
10
12
14
16
18
FY18 FY19 FY20 FY21 FY22E FY23E FY24E
(Rs bn)
Net-debt
Source: Company, Systematix Institutional Research Source: Company, Systematix Institutional Research
Exhibit 17: Illumination project executed for Mumbai CST Railway station
Source: Company
29 April 2022
39 Systematix Research is also available on Bloomberg SSSL <Go>, Thomson & Reuters Systematix Shares and Stocks (India) Limited
Bajaj Electricals
Corporate restructuring to unlock value in all segments
Considering the varied nature and potential opportunities offered by the CP and EPC segments as also the need for a focused approach to unlock these opportunities, the Board of BJE has decided to undertake a comprehensive review of the existing corporate structure. This will cover an evaluation of all the options and alternatives including a demerger, subsidiarization, strategic partnerships, etc.
The management will evaluate the following options and alternatives:
▪ Streamlining of the business structure to fortify market position and deliver long-term growth
▪ Attracting the right talent and providing enhanced growth opportunities to the existing talent – in line with a sharper strategic focus on each business segment under separate entities
▪ Tailored capital structure and capital allocation policies based on business-specific dynamics
▪ A sharper and well-defined corporate positioning coupled with value unlocking for all stakeholders
▪ Distinct investment profiles to attract a deeper and broader investor base
▪ Accelerating sustainability initiatives and expediting ESG practices
BJE will also evaluate demerging the Power Transmission & Distribution business verticals as a standalone or independent legal entity. It intends to appoint various advisors/ consultants to assist the board in evaluating and fast-tracking the options.
What does it mean for investors?
The restructuring will help investors better understand and compare BJE’s consumer products business with the peer group. The EPC business is stable now (less focus on power distribution) and is expected to be profitable FY23E onwards with an improved balance sheet as receivables are well under control.

29 April 2022
40 Systematix Research is also available on Bloomberg SSSL <Go>, Thomson & Reuters Systematix Shares and Stocks (India) Limited
Bajaj Electricals
Financial analysis
Healthy growth and FCF lead to a net cash positive status
After a period of almost flat overall revenue growth (14% CAGR in CP revenues) over FY18-21 with descaling of the EPC business, we expect a healthy 16% revenue CAGR for BJE over FY21-24, mainly led by the CP segment. Margins in the CP business are expected to expand further on the back of several cost optimization and efficiency improvement measures while EPC should also turn profitable from FY23. The
company is on the way to deliver healthy FCF given its tight control on WC cycle.
Exhibit 18: Total revenues and growth trend Exhibit 19: PAT and growth trend
0
10
20
30
40
50
60
70
80
FY18 FY19 FY20 FY21 FY22E FY23E FY24E
(Rs bn)
Revenue
CAGR: -1%
-1
0
1
2
3
4
5
FY18 FY19 FY20 FY21 FY22E FY23E FY24E
(Rs bn)
PAT
Source: Company, Systematix Institutional Research Source: Company, Systematix Institutional Research
Exhibit 20: Significant reduction in receivables… Exhibit 21: …helping in achieving net cash status and lower debt
0
20
40
60
80
100
120
140
160
180
200
Receivables Inventory Payables Net WC cycle
(Days)
FY18 FY19 FY20 FY21 FY22e FY23e FY24e
0
2
4
6
8
10
12
14
16
18
FY18 FY19 FY20 FY21 FY22E FY23E FY24E
(Rs bn)
Net-debt
Source: Company, Systematix Institutional Research Source: Company, Systematix Institutional Research

29 April 2022
41 Systematix Research is also available on Bloomberg SSSL <Go>, Thomson & Reuters Systematix Shares and Stocks (India) Limited
Bajaj Electricals
Exhibit 22: RoE and RoCE trend Exhibit 23: Healthy and sustainable FCFs
-5
0
5
10
15
20
25
30
FY18 FY19 FY20 FY21 FY22E FY23E FY24E
(%)
RoE % RoCE %
-8
-6
-4
-2
0
2
4
6
8
10
12
OCF Capex FCF
(Rs bn)
FY18 FY19 FY20 FY21 FY22E FY23E FY24E
Source: Company, Systematix Institutional Research Source: Company, Systematix Institutional Research
Exhibit 24: Dupont analysis FY18 FY19 FY20 FY21 FY22E FY23E FY24E
PAT margin (%) 2.0 2.3 (0.1) 4.1 2.9 5.0 7.0
Asset turnover (x) 2.8 2.5 2.3 2.4 2.5 2.7 2.6
Equity multiplier (x) 1.8 2.5 1.6 1.2 1.1 1.1 1.1
RoE (%) 8.9 14.8 (0.7) 12.1 8.4 14.6 19.6
Source: Company, Systematix Institutional Research

29 April 2022
42 Systematix Research is also available on Bloomberg SSSL <Go>, Thomson & Reuters Systematix Shares and Stocks (India) Limited
Bajaj Electricals
Valuation and Outlook
BJE has been on a consistent growth trajectory in its CP business with timely product launches, a wide geographical reach and the RREP program. After a substantial rise in EPC revenues in FY19, its strategy to bid only for select projects offering reasonable margins has resulted in cash flow generation and helped reduce the high debt taken for working capital.
Considering the management’s focus on growth and profitability in consumer products, tightening working capital and shrinking debt in EPC, we expect healthy cash flows and significant savings in interest costs in the coming years. We estimate 12% revenue CAGR, 27% EBITDA CAGR and 34% PAT CAGR for BJE over FY21-24E with EBITDA margins touching 10% (~11% in CP business), ~20% RoE and healthy FCF.
In addition to the strong growth prospects and an improving balance sheet, we believe the proposed corporate restructuring will unlock shareholder value and support a PE re-rating closer to that of peers. We initiate coverage on the stock with a BUY rating and price target of Rs 1,286 (19% potential from CMP), based on 36x and 15x FY24E earnings of CP and EPC business respectively.
Exhibit 25: SoTP valuation FY24E PAT Target P/E Target M-cap Target price (Rs m) (x) (Rs m) (Rs)
Consumer Products (CP) 3,762 36.0 135,432 1,182
Engineering & Projects (EPC) 796 15.0 11,935 104
Total 147,366 1,286
CMP 1,080
Upside/ (Downside; %) 19
Source: Company, Systematix Institutional Research
Exhibit 26: PE band and standard deviation (1-year forward)
0
10
20
30
40
50
60
70
80
90
100
Ap
r-1
7
Jul-
17
Oct
-17
Jan
-18
Ap
r-1
8
Jul-
18
Oct
-18
Jan
-19
Ap
r-1
9
Jul-
19
Oct
-19
Jan
-20
Ap
r-2
0
Jul-
20
Oct
-20
Jan
-21
Ap
r-2
1
Jul-
21
Oct
-21
Jan
-22
Ap
r-2
2
P/E Mean +1 SD -1 SD
-1SD
+1SD
Mean
Data points of this period is ignored due to distored PE band coming out of negative EPS in FY20.
Source: BSE, Systematix Institutional Research

29 April 2022
43 Systematix Research is also available on Bloomberg SSSL <Go>, Thomson & Reuters Systematix Shares and Stocks (India) Limited
Bajaj Electricals
Key risks and risk mitigation measures
Volatile commodity prices may suppress growth and margins
Prices of key raw materials, including for vendors, have risen significantly in the last year. While BJE was unable to take adequate price hikes to protect its gross margins, EBITDA margins remained healthy in the wake of strong demand. The company plans to take more price hikes gradually to maintain its growth and margins.
Aggressive bidding in EPC projects (as seen earlier)
BJE had historically bid aggressively for power distribution projects entailing significantly higher working capital requirement and the mounting debt deteriorated its balance sheet quality. However, focus on financial closure of the ongoing projects for the last two years has led to an improvement in the company’s cash flows and recovery. While BJE would be bidding for high growth projects of Railways and monopoles to drive growth and profitability in EPC, any aggressive bidding on its part can strain the balance sheet.
Intense competition in Consumer Products (CP)
New players are entering in hordes, pulled by the large opportunity offered by consumer products segment. Incumbents too are becoming aggressive on new launches and categories as also network expansion. We derive comfort from BJE’s ability to launch new products/ SKUs given that it has the strongest distribution
network in the industry and its proactive marketing initiatives.
Pandemic-led demand and supply chain disruptions
The Covid-19 pandemic has caused unprecedented hardships for the last two years with travel restrictions and lockdowns across the country. The restrictions have affected supply chains, labour availability and demand. BJE proactively initiated Work from Home (WFH) and managed the supply challenges through seeding-based supply forecasting with positive outcomes. Steps to boost production and ensure timely distribution of products across warehouses have minimized the impact of supply
disruptions on secondary and tertiary sales.

29 April 2022
44 Systematix Research is also available on Bloomberg SSSL <Go>, Thomson & Reuters Systematix Shares and Stocks (India) Limited
Bajaj Electricals
Annexures
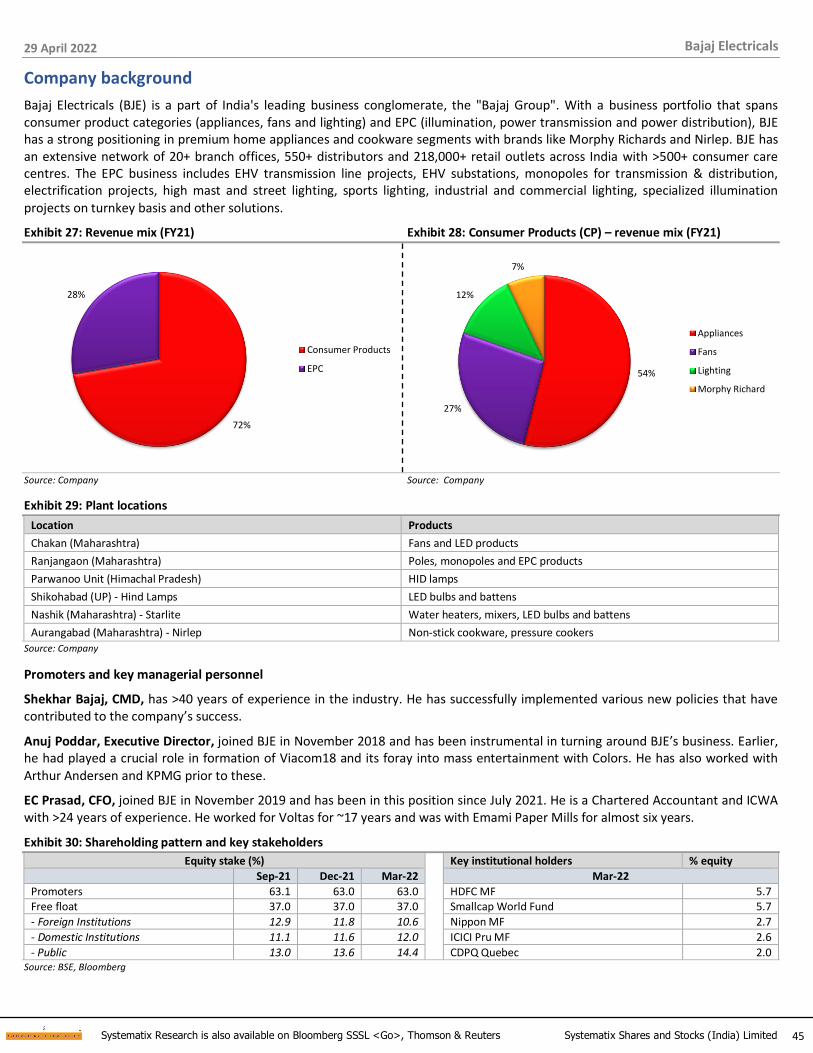
29 April 2022
45 Systematix Research is also available on Bloomberg SSSL <Go>, Thomson & Reuters Systematix Shares and Stocks (India) Limited
Bajaj Electricals
Company background
Bajaj Electricals (BJE) is a part of India's leading business conglomerate, the "Bajaj Group". With a business portfolio that spans consumer product categories (appliances, fans and lighting) and EPC (illumination, power transmission and power distribution), BJE has a strong positioning in premium home appliances and cookware segments with brands like Morphy Richards and Nirlep. BJE has an extensive network of 20+ branch offices, 550+ distributors and 218,000+ retail outlets across India with >500+ consumer care centres. The EPC business includes EHV transmission line projects, EHV substations, monopoles for transmission & distribution, electrification projects, high mast and street lighting, sports lighting, industrial and commercial lighting, specialized illumination
projects on turnkey basis and other solutions.
Exhibit 27: Revenue mix (FY21) Exhibit 28: Consumer Products (CP) – revenue mix (FY21)
72%
28%
Consumer Products
EPC
54%
27%
12%
7%
Appliances
Fans
Lighting
Morphy Richard
Source: Company Source: Company
Exhibit 29: Plant locations
Location Products
Chakan (Maharashtra) Fans and LED products
Ranjangaon (Maharashtra) Poles, monopoles and EPC products
Parwanoo Unit (Himachal Pradesh) HID lamps
Shikohabad (UP) - Hind Lamps LED bulbs and battens
Nashik (Maharashtra) - Starlite Water heaters, mixers, LED bulbs and battens
Aurangabad (Maharashtra) - Nirlep Non-stick cookware, pressure cookers
Source: Company
Promoters and key managerial personnel
Shekhar Bajaj, CMD, has >40 years of experience in the industry. He has successfully implemented various new policies that have contributed to the company’s success.
Anuj Poddar, Executive Director, joined BJE in November 2018 and has been instrumental in turning around BJE’s business. Earlier, he had played a crucial role in formation of Viacom18 and its foray into mass entertainment with Colors. He has also worked with Arthur Andersen and KPMG prior to these.
EC Prasad, CFO, joined BJE in November 2019 and has been in this position since July 2021. He is a Chartered Accountant and ICWA with >24 years of experience. He worked for Voltas for ~17 years and was with Emami Paper Mills for almost six years.
Exhibit 30: Shareholding pattern and key stakeholders
Equity stake (%) Key institutional holders % equity Sep-21 Dec-21 Mar-22 Mar-22
Promoters 63.1 63.0 63.0 HDFC MF 5.7 Free float 37.0 37.0 37.0 Smallcap World Fund 5.7
- Foreign Institutions 12.9 11.8 10.6 Nippon MF 2.7
- Domestic Institutions 11.1 11.6 12.0 ICICI Pru MF 2.6
- Public 13.0 13.6 14.4 CDPQ Quebec 2.0 Source: BSE, Bloomberg

29 April 2022
46 Systematix Research is also available on Bloomberg SSSL <Go>, Thomson & Reuters Systematix Shares and Stocks (India) Limited
Bajaj Electricals
Exhibit 31: A vast product portfolio
Consumer Appliances
Fans & Coolers
Consumer Lighting EPC – illumination
Morphy Richards
Mixer Grinder
Oven Toaster Griller
Pop-up Toaster
Water Heater
Microwave Oven
Source: Company

29 April 2022
47 Systematix Research is also available on Bloomberg SSSL <Go>, Thomson & Reuters Systematix Shares and Stocks (India) Limited
Bajaj Electricals
Annual Report Analysis (FY17 to FY21)
Exhibit 32: Annual Report Analysis
Year Demand Scenario and outlook Plans and initiatives
FY17
• The demonetization shock in November created a short-term aberration in 3Q and resulted in a 7.1% decline in revenues
• However, improved operational efficiency and implementation of redistribution strategy supported gross margins
• Satisfactory monsoon provided some green shoots in demand
• The company’s initiatives to strengthen its distribution network expected to start paying off in FY18
• Renewed trademark license agreement with Morphy Richards for marketing in India and SAARC countries; agreement for a 5-year extension from FY18 till FY22
• A key strategic development included the merger of four consumer-facing businesses – kitchen appliances, domestic appliances, fans and lighting – into one
• Operations of GLS bulbs and tube lights manufacturing unit located at Kosi, UP closed as it was unprofitable and beyond revival due to introduction of the latest LED tech in industry
• Rollout of new products catering to mass and premium market
FY18
• Demand disruption due to GST implementation as traders made initial adjustments for the new tax regime
• Performance also affected due to destocking by traders in June and the second quarter
• Sales picked up in the subsequent quarters
• Addressal of long-standing legacy issues and government investments in infrastructure development a boost to EPC business
• Successful rollout of Range and Reach Expansion Programme (RREP) in 80% of the country
• Proposal to acquire a 100% stake in Nirlep Appliances, a manufacturer of non-stick cookware in India
• Starlite Lighting became a JV after BJE increased its stake to 47% on exercising its right to acquire the shares in return for a short-term loan facility
• With transition of the distribution model from Push to Pull driven nearing completion, BJE ready for the next leg of its growth strategy i.e., launch of new products and capacity expansion by leveraging its dealer inventory programme
FY19
• Revenue growth of 41%, mainly from EPC and illumination segment with execution of power distribution projects received from the UP government
• EPC business marked its entry into export markets • Consumer small appliances, fans and lighting industry projected
to witness 9%, 11% and 14% YoY growth respectively in FY20
• BJE took steps to regain the market share lost in recent years due to intense competition
• Acquired a 79.9% share of Nirlep Appliances
• Capacity addition plans at plants for power transmission business in the coming years
• Illumination – target of capitalizing on various industry opportunities and openings such as smart city projects, orders from EESL, etc
• Reworking of the business model and positioning itself as an end-to-end solutions provider rather than as a product seller
• Exports – plans to explore the huge market potential offered by MEA markets to expand reach in the coming years
FY20
• Covid-19 related lockdowns led to a hit on economy as well as businesses in 4Q with a likely subdued performance in FY21
• Revenues from ECD up 12% and EPC down by 52% with 25% growth in export business
• Industry expected to see significant growth in coming years with a continuously expanding consumer market on rising disposable incomes, higher purchasing power and government initiatives towards encouraging LED tech
• Raised Rs 3.5bn via a rights Issue for repayment of loans due
FY21
• Revenues declined primarily due to the Covid-19 pandemic-induced lockdowns as well as calibration in EPC business
• However, growth in EBIT and PAT remained strong
• Supply chain disruption for unorganized players due to Covid lockdowns accelerated a market share shift to branded and national players
• Fans segment expected to grow exponentially with higher affordability and government support; however, star labelling regulations from FY22 may create price resistance
• Strong growth momentum expected to sustain in LED tech with urbanization, government initiatives and disposable incomes
• Demand uncertainty, commodity price rise and rising competition key risks to growth
• Collaborated with Mahindra Logistics to offer innovative logistics optimization and outsourcing services under ‘Project Samriddhi’ with the objective of achieving improved and best-in-class service levels, and lower logistics cost by >25% annually
• NCLT approved the demerger of Hind Lamp and derecognized its existing 19% of the proportionate investment, resulting in a gain of Rs 118mn for BJE
Source: Company, Systematix Institutional Research

29 April 2022
48 Systematix Research is also available on Bloomberg SSSL <Go>, Thomson & Reuters Systematix Shares and Stocks (India) Limited
Bajaj Electricals
FINANCIALS (CONSOLIDATED)
Profit & Loss Statement
YE: Mar (Rs mn) FY20 FY21 FY22E FY23E FY24E
Net revenues 49,872 45,846 48,514 55,995 64,727
Growth (%) (25.3) (8.1) 5.8 15.4 15.6
Raw material expenses 33,296 29,956 33,108 37,909 43,467
Gross Margin (%) 33.2 34.7 31.8 32.3 32.8
Employee & Other exp. 14,493 12,859 12,593 13,757 15,012
EBITDA 2,083 3,032 2,813 4,329 6,248
EBITDA margins (%) 4.2 6.6 5.8 7.7 9.7
Depreciation 737 752 688 734 790
Other income 462 692 593 513 708
Finance costs 1,708 764 761 556 351
PBT 100 2,463 1,860 3,553 5,815
Effective tax rate (%) 174.3 23.3 25.5 21.9 22.3
Associates/(Minorities) (18) 16 34 38 42
Net Income (93) 1,906 1,420 2,812 4,558
Adjusted net income (93) 1,906 1,420 2,812 4,558
Shares outstanding 114 115 115 115 115
FDEPS (Rs per share) (0.8) 16.6 12.4 24.5 39.8
FDEPS growth (%) - - (25.5) 98.0 62.1
Source: Company, Systematix Institutional Research
Balance Sheet
YE: Mar (Rs mn) FY20 FY21 FY22E FY23E FY24E
Share capital 228 229 229 229 229
Net worth 13,483 15,782 16,859 19,212 23,312
Total debt 8,250 2,977 2,377 1,777 1,177
Minority interest - - - - -
DT Liability/ (Asset) - - - - -
Capital Employed 21,733 18,759 19,235 20,989 24,488
Net tangible assets 4,260 3,670 3,482 3,448 3,458
Net Intangible assets 442 458 458 458 458
Goodwill - - - - -
CWIP 94 100 95 90 85
Investments (Strategic) - - - - -
Investments (Financial) 129 1,307 9,307 10,307 13,307
Current Assets 39,700 36,525 25,236 26,269 27,286
Cash 1,047 616 989 1,018 971
Current Liabilities 23,940 23,918 20,332 20,602 21,077
Working capital 15,760 12,607 4,904 5,667 6,209
Capital Deployed 21,733 18,759 19,235 20,989 24,488
Contingent Liabilities 3,510 2,977 - - -
Source: Company, Systematix Institutional Research
Cash Flow
YE: Mar (Rs mn) FY20 FY21 FY22E FY23E FY24E
EBIT (incl. other income) 1,485 2,707 2,374 3,945 5,811
Non-cash items 737 752 688 734 790
OCF before WC changes 2,222 3,459 3,062 4,679 6,602
Incr./(decr.) in WC (4,493) (3,239) (7,503) 963 742
Others including taxes 451 116 586 890 1,411
Operating cash-flow 6,264 6,582 9,979 2,825 4,450
Capex 310 403 495 695 795
Free cash-flow 5,954 6,179 9,484 2,130 3,655
Acquisitions - 0 - - -
Dividend 432 - 344 458 458
Equity raised 3,482 105 - - -
Debt raised (6,560) (5,466) (600) (600) (600)
Fin Investments 174 724 8,000 1,000 3,000
Misc. Items (CFI + CFF) 1,366 654 168 43 (357)
Net cash-flow 904 (560) 372 29 (47)
Source: Company, Systematix Institutional Research
Ratios
YE: Mar FY20 FY21 FY22E FY23E FY24E
P/E (x) (1,333.3) 64.9 87.1 44.0 27.1
EV/EBITDA (x) 62.8 41.2 41.2 26.4 17.7
EV/sales (x) 2.6 2.7 2.4 2.0 1.7
P/B (x) 9.2 7.8 7.3 6.4 5.3
RoE (%) (0.7) 12.1 8.4 14.6 19.6
RoCE (%) 7.5 14.7 14.3 20.4 27.1
ROIC (%) (0.4) 8.5 10.7 26.5 40.5
DPS (Rs per share) 2.0 - 3.0 4.0 4.0
Dividend yield (%) 0.2 - 0.3 0.4 0.4
Dividend payout (%) - - 24.2 16.3 10.1
Net debt/equity (x) 0.5 0.1 (0.5) (0.5) (0.6)
Receivables (days) 186 153 90 80 70
Inventory (days) 51 79 45 45 45
Payables (days) 67 76 60 60 60
CFO:PAT% 345 703 100 98
Source: Company, Systematix Institutional Research

Systematix Research is also available on Bloomberg SSSL <Go>, Thomson & Reuters Systematix Shares and Stocks (India) Limited
Investors are advised to refer disclosures made at the end of the research report.
49
KEI Industries
Recalibrated focus to improve balance sheet health
KEI (KEII), India’s fastest growing W&C company, is backed by a certified and wide product range (including EHV), vast distribution network and expertise in executing large projects globally. With a keen focus on margins and cash flows, the company is strategically scaling down its EPC business in favour of the fast-growing retail portfolio (35%+ CAGR over FY21-24E; ~50% of total revenues by FY24E). It is also beefing up the dealer network by 10% a year to back its foray into the FMEG segment. In addition, KEII has committed ~Rs 8bn in capex for a greenfield project over the next 4-5 years to meet its guidance of 18% revenue CAGR over FY21-24E. Increasing contribution from the more profitable retail segment, its FMEG foray and higher FCF, we believe, should drive a further re-rating in the stock. We initiate coverage on KEII with a BUY rating and price target of Rs 1,425 (19% upside from
CMP), based on 24x FY24E earnings (above historical mean).
Positive outlook for the W&C industry: The ~Rs 550bn Indian W&C Industry is the largest and among the fastest growing (an estimated 12-15% CAGR over the past decade) within the consumer electricals space. The growth outlook remains strong on i) sustained traction in infrastructure activity led by policy initiatives and private capex, ii) the ‘Make in India’ push, and iii) demand from emerging sectors (renewable energy, electric mobility, etc). High RM prices and supply chain-related issues, while impacting the unorganized sector, have helped the organized sector.
Fastest growing W&C company: KEII registered a revenue CAGR of 12% over FY17-21 versus 2-8% for peers. Its certified and wide product range, strong distribution network and expertise in executing large projects in rural electrification, railways, metro-rail, industry, and robust exports, have been the key growth enablers. It is among the few Indian players that have the capability to manufacture EHV (extra
high voltage) cables above 220kV and among the few globally for EHV 400kV cables.
Sharp focus on retail sales; to improve balance sheet health: KEII is scaling down its EPC business while aiming for a larger share of the more profitable and faster growing retail business. We expect its retail sales to register 35%+ CAGR over FY21-24E and account for ~50% of the total sales by FY24E (a leading consultant hired for developing strategies and policies to drive the shift). Even in EPC, it will largely focus on projects with significant cabling requirements (25-30% in LT/ HT, 75-80% in EHV). With an expected improvement in margins and cash flows, we expect a shorter WC-cycle and healthier balance sheet for KEII. Its foray into the large FMEG segment, we believe, offers potential for incremental growth in the medium to long term.
Healthy cashflows to support large capex; initiating coverage with BUY: After a 7% revenue CAGR, 11% EBITDA CAGR and 24% PAT CAGR over FY18-21, we expect KEII to achieve a higher 21% revenue CAGR, 20% EBITDA CAGR and 25% PAT CAGR over FY21-24E. The robust operating performance and lower EPC revenues would lead to strong FCF generation and facilitate re-investment in growth capex. We initiate coverage on the stock with a BUY rating and target price of Rs 1,425 (19% upside from CMP), based on 24x FY24E earnings. We have assigned a target multiple higher than its historical mean as we see scope for further re-rating in the stock, driven by its healthier balance sheet and strong FCF generation. Volatile RM prices and weak
economic activity are the key risks to our call.
Systematix Institutional Equities
29 April 2022
INITIATING COVERAGE
Sector: Consumer Electricals Rating: BUY
CMP: Rs 1,200 Target Price: Rs 1,425
Stock Info
Sensex/Nifty 57,521/17,244
Bloomberg KEII IN
Equity shares (mn) 89.9
52-wk High/Low 1,278/500
Face value Rs 2
M-Cap Rs 108 bn/ USD 1.4bn
3-m avg turnover USD 6.5mn
Financial Snapshot (Rs mn) Y/E Mar FY22E FY23E FY24E
Net sales 55,252 63,602 73,339
EBITDA 5,810 6,876 7,999
OPM % 10.5 10.8 10.9
PAT (adj.) 3,685 4,542 5,334
EPS (Rs) 41.0 50.5 59.4
PE (x) 29.3 23.7 20.2
P/B (x) 5.1 4.2 3.6
EV/EBITDA (x) 18.4 15.3 13.0
RoE (%) 17.4 17.9 17.6
RoCE (%) 23.7 24.7 24.6
Net-D/E (x) (0.0) (0.1) (0.1)
Shareholding Pattern (%) Mar’22 Dec'21 Sep'21
Promoter 38.0 38.0 38.0
- Pledged - - -
FII 25.2 21.8 19.4
DII 21.6 24.0 25.8
Others 15.2 16.2 16.8
Stock Performance (1-year)
300
500
700
900
1,100
1,300
1,500
Ap
r-2
1
May
-21
Jun
-21
Jul-
21
Au
g-2
1
Sep
-21
Oct
-21
No
v-2
1
Dec
-21
Jan
-22
Feb
-22
Mar
-22
Ap
r-2
2
KEII Sensex
Ashish Poddar [email protected] +91 22 6704 8039
Pranay Shah [email protected] +91 22 6704 8017

29 April 2022
50 Systematix Research is also available on Bloomberg SSSL <Go>, Thomson & Reuters Systematix Shares and Stocks (India) Limited
KEI Industries
Story in charts
Exhibit 1: KEII – revenue growth trend Exhibit 2: Rising gross and EBITDA margins despite high RM costs
0
10
20
30
40
50
60
70
80
FY18 FY19 FY20 FY21 FY22E FY23E FY24E
(Rs bn)
Revenue
0
5
10
15
20
25
30
35
FY18 FY19 FY20 FY21 FY22E FY23E FY24E
(%)
Gross margin EBITDA margin
Source: Company, Systematix Institutional Research Source: Company, Systematix Institutional Research
Exhibit 3: PAT growth trend Exhibit 4: Cables (EHV, LT and HT) – revenue trend
0
1
2
3
4
5
6
FY18 FY19 FY20 FY21 FY22E FY23E FY24E
(Rs bn)
PAT
57
58
59
60
61
62
63
64
65
0
5
10
15
20
25
30
35
40
45
50
FY18 FY19 FY20 FY21 FY22E FY23E FY24E
(%)(Rs bn)
Revenue % Contribution (RHS)
Source: Company, Systematix Institutional Research Source: Company, Systematix Institutional Research
Exhibit 5: Wires (HW, WW and Flexible) – revenue trend Exhibit 6: EPC – revenue trend
0
5
10
15
20
25
30
0
5
10
15
20
25
FY18 FY19 FY20 FY21 FY22E FY23E FY24E
(%)(Rs bn)
Revenue % Contribution (RHS)
0
2
4
6
8
10
12
14
16
18
20
0
1
2
3
4
5
6
7
8
9
FY18 FY19 FY20 FY21 FY22E FY23E FY24E
(%)(Rs bn)
Revenue % Contribution (RHS)
Source: Company, Systematix Institutional Research Source: Company, Systematix Institutional Research
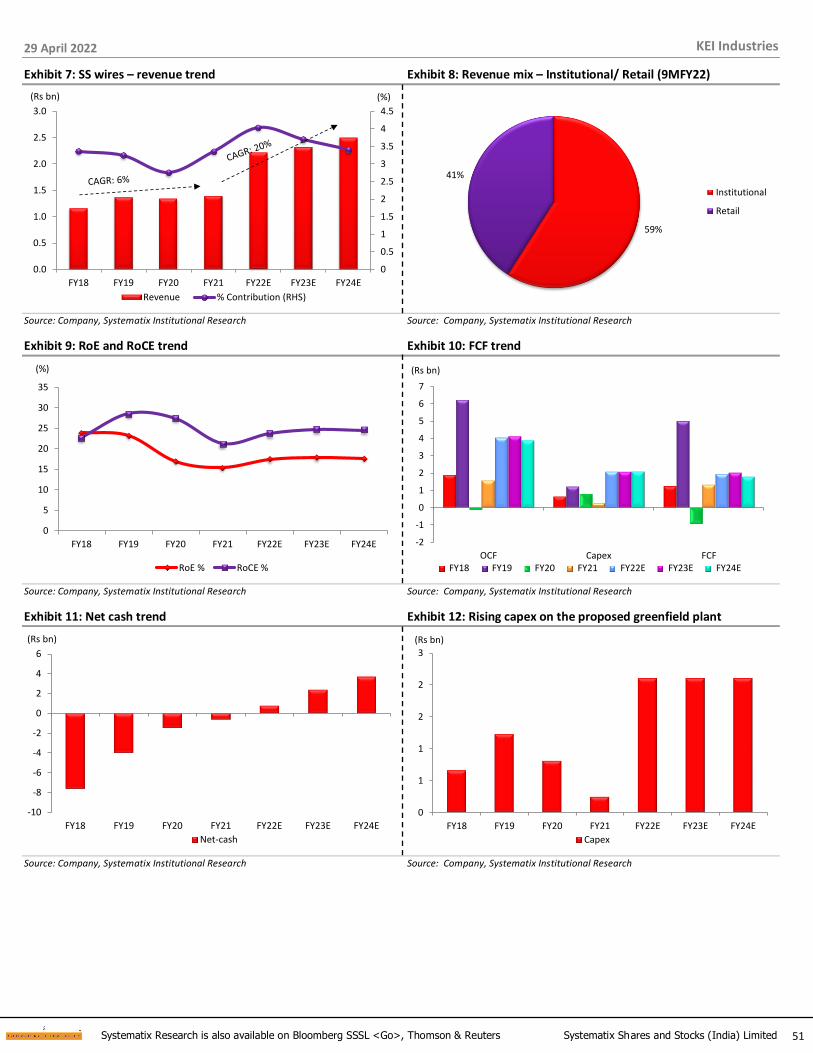
29 April 2022
51 Systematix Research is also available on Bloomberg SSSL <Go>, Thomson & Reuters Systematix Shares and Stocks (India) Limited
KEI Industries
Exhibit 7: SS wires – revenue trend Exhibit 8: Revenue mix – Institutional/ Retail (9MFY22)
0
0.5
1
1.5
2
2.5
3
3.5
4
4.5
0.0
0.5
1.0
1.5
2.0
2.5
3.0
FY18 FY19 FY20 FY21 FY22E FY23E FY24E
(%)(Rs bn)
Revenue % Contribution (RHS)
59%
41%
Institutional
Retail
Source: Company, Systematix Institutional Research Source: Company, Systematix Institutional Research
Exhibit 9: RoE and RoCE trend Exhibit 10: FCF trend
0
5
10
15
20
25
30
35
FY18 FY19 FY20 FY21 FY22E FY23E FY24E
(%)
RoE % RoCE %
-2
-1
0
1
2
3
4
5
6
7
OCF Capex FCF
(Rs bn)
FY18 FY19 FY20 FY21 FY22E FY23E FY24E
Source: Company, Systematix Institutional Research Source: Company, Systematix Institutional Research
Exhibit 11: Net cash trend Exhibit 12: Rising capex on the proposed greenfield plant
-10
-8
-6
-4
-2
0
2
4
6
FY18 FY19 FY20 FY21 FY22E FY23E FY24E
(Rs bn)
Net-cash
0
1
1
2
2
3
FY18 FY19 FY20 FY21 FY22E FY23E FY24E
(Rs bn)
Capex
Source: Company, Systematix Institutional Research Source: Company, Systematix Institutional Research

29 April 2022
52 Systematix Research is also available on Bloomberg SSSL <Go>, Thomson & Reuters Systematix Shares and Stocks (India) Limited
KEI Industries
Investment Analysis
The fastest growing W&C company; outlook remains robust
KEII, the fastest growing company in the W&C space, registered revenue CAGR of ~12% over FY17-21, much ahead of peers. The company has a globally certified and wide product range, vast institutional customer base (1,450+), strong distribution network (~1,700), expertise in executing large projects in rural electrification, railways, metro-rail, industry, etc and capabilities to manufacture EHV cables up to 400kV. These factors, along with its rapid growth in housing wires, have helped KEII
achieve the stellar topline growth.
Exhibit 13: W&C – revenue and EBIT growth trend vs peers
Revenues (Rs mn) FY17 FY21 CAGR (%) EBIT margin (%) FY17 FY21 bps change
POLYCAB 56,821 76,035 7.6 POLYCAB 7.0 11.8 479
KEII 22,794 35,742 11.9 KEII 9.3 10.9 160
HAVL 26,756 31,802 4.4 HAVL 10.0 12.7 266
FNXC 21,778 23,100 1.5 FNXC 17.7 12.9 (480)
VGRD 6,399 8,260 6.6 VGRD 12.2 12.9 69
Source: Company, Systematix Institutional Research
Exhibit 14: KEII has the widest product portfolio (up to 400kV cables) among peers
Power & Power Control cables
(LT/HT)
Power cables (EHV)
Control & Instrumentation
cables House wires
Flexible and industrial cables
including specialty cables
Apar Industries ✓ ✓ ✓ ✓
Finolex Cables ✓ ✓ ✓ ✓ ✓
Havells ✓ ✓ ✓ ✓ ✓
KEC International ✓ ✓ ✓ ✓ ✓
KEI Industries ✓ ✓ ✓ ✓ ✓
Polycab ✓ ✓ ✓ ✓ ✓
V-Guard ✓ ✓ ✓
Universal Cables ✓ ✓ ✓
Source: Company, Systematix Institutional Research
Strong industry outlook
The W&C industry has grown rapidly at an estimated 12-15% in the past decade, driven by government focus on development of rural as well as urban infrastructure (railways, metros, smart cities, etc). We see strong medium to long term prospects for the W&C sector given a pick-up in government orders as also private capex across sectors.
After a slow start in FY22, projects are being awarded in roads & highways, tunnels, railway, metro rail, power transmission & distribution, airports, and solar and nuclear power sectors. Also, the Centre has extended its USD 1.5trn National Infrastructure Pipeline (an umbrella programme integrating multi-sector infrastructure projects) to cover more projects by 2025. Capacity expansion/ upgradation at various state-owned oil refineries is also in progress. The Production Linked Incentive (PLI) Scheme will encourage private players to augment their domestic manufacturing capabilities. Smart city projects are underway while the expected pick-up in demand for real estate will aid recovery of the construction sector.

29 April 2022
53 Systematix Research is also available on Bloomberg SSSL <Go>, Thomson & Reuters Systematix Shares and Stocks (India) Limited
KEI Industries
Exhibit 15: W&C industry growth trend Exhibit 16: Sector-wise NIP – projects and outlay
346
525 550
968
0
200
400
600
800
1,000
1,200
FY14 FY18 FY21 FY26P
(Rs bn)
Source: Polycab RHP, Systematix Institutional Research Source: https://indiainvestmentgrid.gov.in/
Exhibit 17: W&C industry – key growth drivers
Structural demand for higher and efficient T&D infrastructure
to supply increasing energy requirement of the count
Infrastructure development projects such as road, highways, railways and metro rail projects, and dedicated freight corridor,
among others
The Government's focus on rural and railway electrification
programs
Reviving housing construction and the Government's impetus
to affordable housing and smart cities
Source: Company, Systematix Institutional Research
KEII’s strategy to capitalize on the opportunity
KEII has chalked out a multi-pronged strategy to capitalize on the large growth opportunities on the anvil. There measures have already started paying off for the company and the impact is already visible in its performance.
▪ Capacity expansion: KEII plans to add capacity in its existing product portfolio through brownfield as well as greenfield expansion
▪ Retail business: Continued focus to increase the share of retail business in overall sales mix to 50% over the next 2-3 years (vs ~30% 3-4 years ago)
▪ Distribution channel: Focus on increasing penetration by further expanding its distribution network by 10% a year to expand rapidly in wires and foray into the FMEG segment
▪ Overseas market: To further increase presence by expanding into existing
markets and entering new markets
▪ FMEG market: To be the next avenue of growth after 2-4 years (yet to enter)
Number of projects
Investment (USD bn)
Transport 4,628 800
Social Infrastructure 1,717 251
Water & Sanitation 1,326 284
Energy 688 482
Commercial Infrastructure 593 81
Logistics 163 51
Communication 30 15
Total 9,145 1,964

29 April 2022
54 Systematix Research is also available on Bloomberg SSSL <Go>, Thomson & Reuters Systematix Shares and Stocks (India) Limited
KEI Industries
KEII has the widest product range up to 400kV EHV cables
KEII’s product portfolio in the institutional segment covers a wide range across EHV cables, HT and LT power cables, stainless steel wires and EPC solutions. In India, the company serves more than 1,450 institutional customers and holds ~12% market share. Strong prequalification credentials are a key factor that have helped it gain steady footing in the institutional segment. Besides India, KEII also caters to the markets in Australia, Africa, and the Middle East among others. The company plans to further consolidate its position by enhancing its manufacturing capabilities and tapping the lucrative EHV cables space.
Exhibit 18: A wide product portfolio in the W&C segment
Source: Company, Systematix Institutional Research
EHV capabilities the key differentiator for KEII
EHV cables offer significant advantages over conventional overhead lines for sub-transmission and distribution of power in terms of higher power density, lower transmission losses and efficient bulk-power delivery.
KEII is one of the few players to have capabilities in EHV cables >220kV in India and EHV 400kV cables globally. It has a technological collaboration with Switzerland-based Brugg Kabel AG, a company with 100+ years of experience in manufacturing of EHV cables up to 550kV. KEII’s strategic collaboration enables it to provide high-end designs and process back-up services benchmarked to the highest global standards.
The EHV cable segment entails stringent requirements for meeting compliance standards and securing product approvals – these factors pose as high entry barriers, and it typically takes a new entrant at least eight years to penetrate the market. KEII’s established credentials give it a huge competitive advantage in the space.

29 April 2022
55 Systematix Research is also available on Bloomberg SSSL <Go>, Thomson & Reuters Systematix Shares and Stocks (India) Limited
KEI Industries
Exhibit 19: EHV segment – increasing share in KEII’s revenues
2.9
5.7
3.9
4.9 4.5
8.9
10.0
0
2
4
6
8
10
12
0.0
0.5
1.0
1.5
2.0
2.5
3.0
3.5
4.0
4.5
5.0
FY15 FY16 FY17 FY18 FY19 FY20 FY21
(%)(Rs bn)
Revenue % Contribution (RHS)
Source: Company, Systematix Institutional Research

29 April 2022
56 Systematix Research is also available on Bloomberg SSSL <Go>, Thomson & Reuters Systematix Shares and Stocks (India) Limited
KEI Industries
Strong growth in retail business; FMEG offers TAM expansion
A healthy 35%+ revenue CAGR expected in retail sales
KEII’s retail business is comprised of housing wires (~55%) and LT/ HT cables (~45%). The segment registered a healthy ~22% CAGR over FY14-19, driven by KEII’s investments in brand building and distribution network across regions. Notably, revenues remained largely flat over FY19-21 due to Covid-19 disruptions. The KEI brand has consistently been recognized as a ‘Super Brand’ in view of its strong proposition of trust and quality, high recall and reliable customer service. With better brand visibility and acceptability, the company hopes to narrow the ~5% gap
in pricing of its wires versus leaders (Polycab, Havells and Finolex).
Targets 50% revenue contribution: Within retail, KEII caters to the housing wires segment, a rapidly growing space. In line with the company’s strategy to increase the share of retail in the business mix, the segment accounted for ~41% of its revenues in 9MFY22 from 34% in FY21. To increase this share further to 50% in the next 2-3 years, KEII has hired a leading consultant for chalking out strategies and policies to achieve the target.
Capacities in place to support strong growth: KEII’s new housing wires facility at Silvassa, commissioned in FY20, is currently operating at ~65% utilization. This, we believe, leaves the company with ample headroom to ramp up production to suffice
for its growth expectations.
Benefits of retail over institutional/ B2B business: The retail business offers higher margins and lower working capital requirement vis-à-vis other business segments. A higher share of retail in overall sales would lower receivables days and lead to higher cash generation for the company.
Exhibit 20: Increasing share of retail in total sales Exhibit 21: Pan-India retail sales distribution
0
10
20
30
40
50
60
0
5
10
15
20
25
30
35
40
FY14 FY16 FY18 FY20 FY21 9MFY22 FY22E FY23E FY24E
(%)(Rs bn)
Retail sales % Contribution (RHS)
37%
28%
20%
15%
North
West
South
East
Source: Company, Systematix Institutional Research Source: Company, Systematix Institutional Research
Distribution reach to be increased by 10% every year
KEII has been beefing up its retail sales team to have better penetration not only in cities but also smaller cities/ towns and rural areas. The company has added more than 1,000 dealers and distributors since FY14 to ~1,700 currently across branches with recruitment across functions. The distribution network is supported by 21 depots, 36 marketing offices and 580 sales & marketing professionals. Even in FY21, a challenging period, the company inducted more than 100 people into the retail team. The two verticals – housing wires and LT/ HT cables – will have a separate team to ensure dedicated focus on each.
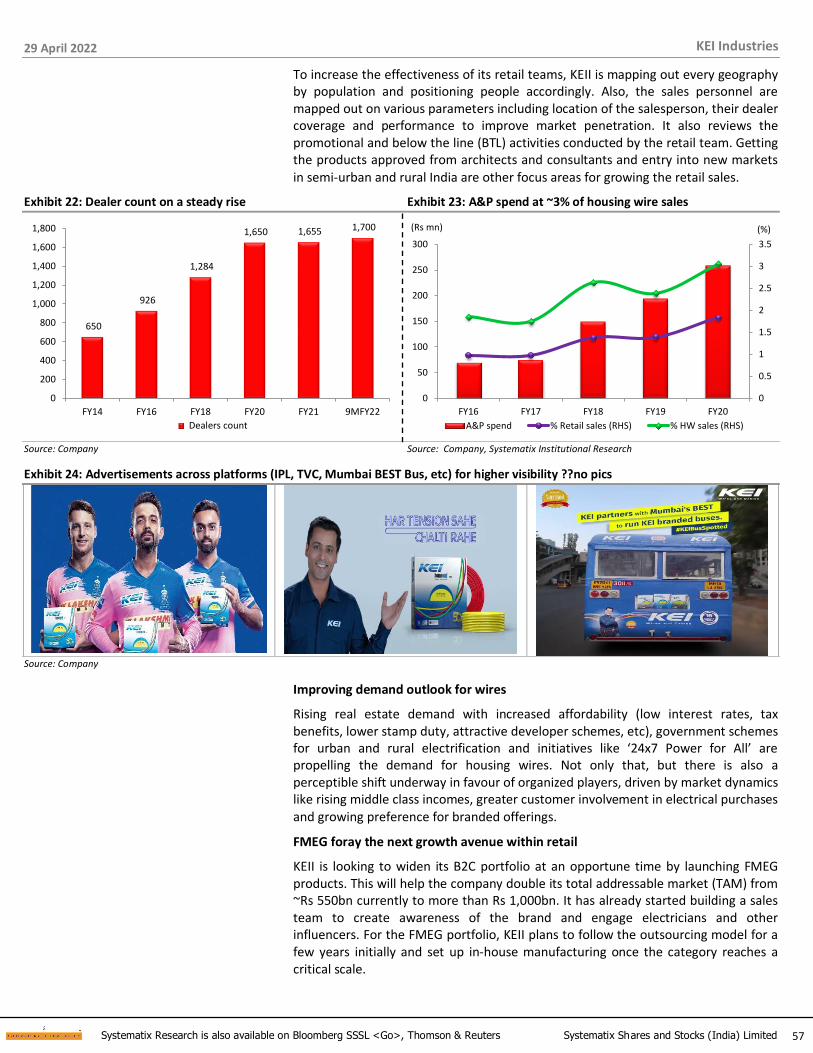
29 April 2022
57 Systematix Research is also available on Bloomberg SSSL <Go>, Thomson & Reuters Systematix Shares and Stocks (India) Limited
KEI Industries
To increase the effectiveness of its retail teams, KEII is mapping out every geography by population and positioning people accordingly. Also, the sales personnel are mapped out on various parameters including location of the salesperson, their dealer coverage and performance to improve market penetration. It also reviews the promotional and below the line (BTL) activities conducted by the retail team. Getting the products approved from architects and consultants and entry into new markets in semi-urban and rural India are other focus areas for growing the retail sales.
Exhibit 22: Dealer count on a steady rise Exhibit 23: A&P spend at ~3% of housing wire sales
650
926
1,284
1,650 1,655 1,700
0
200
400
600
800
1,000
1,200
1,400
1,600
1,800
FY14 FY16 FY18 FY20 FY21 9MFY22
Dealers count
0
0.5
1
1.5
2
2.5
3
3.5
0
50
100
150
200
250
300
FY16 FY17 FY18 FY19 FY20
(%)(Rs mn)
A&P spend % Retail sales (RHS) % HW sales (RHS)
Source: Company Source: Company, Systematix Institutional Research
Exhibit 24: Advertisements across platforms (IPL, TVC, Mumbai BEST Bus, etc) for higher visibility ??no pics
Source: Company
Improving demand outlook for wires
Rising real estate demand with increased affordability (low interest rates, tax benefits, lower stamp duty, attractive developer schemes, etc), government schemes for urban and rural electrification and initiatives like ‘24x7 Power for All’ are propelling the demand for housing wires. Not only that, but there is also a perceptible shift underway in favour of organized players, driven by market dynamics like rising middle class incomes, greater customer involvement in electrical purchases
and growing preference for branded offerings.
FMEG foray the next growth avenue within retail
KEII is looking to widen its B2C portfolio at an opportune time by launching FMEG products. This will help the company double its total addressable market (TAM) from ~Rs 550bn currently to more than Rs 1,000bn. It has already started building a sales team to create awareness of the brand and engage electricians and other influencers. For the FMEG portfolio, KEII plans to follow the outsourcing model for a few years initially and set up in-house manufacturing once the category reaches a critical scale.

29 April 2022
58 Systematix Research is also available on Bloomberg SSSL <Go>, Thomson & Reuters Systematix Shares and Stocks (India) Limited
KEI Industries
Exports a large emerging opportunity
Exports of LT/ HT cables have been a focus area for KEII for a long time now. While these exports have formed 12-15% of its revenues in the last few years, the share was higher in FY20 on account of an exceptionally large order of ~Rs 5bn from Dangote Oil Refinery in Africa executed in the year. Despite the Covid-induced disruptions in the last two years, it has managed to largely maintain its regular export orders arising from the key markets (Australia, Middle East and Africa).
Exhibit 25: Share of exports in KEII’s total revenues
8.2
14.2 13.2 12.6
18.4
14.5
0
2
4
6
8
10
12
14
16
18
20
0
1,000
2,000
3,000
4,000
5,000
6,000
7,000
8,000
9,000
10,000
FY16 FY17 FY18 FY19 FY20 FY21
(%)(Rs mn)
Exports % total revenue (RHS)
Source: Company, Systematix Institutional Research
KEII aims to further strengthen exports by entering new markets and growing its business in the existing geographies. To drive its customer outreach efforts and build on global relationships, it has set up overseas marketing/ project offices in Australia, Dubai, Nigeria, Gambia, Nepal and South Africa. Tie-ups with agents and distributors in international markets have further strengthened its ability to engage with customers. Physical proximity to customers also facilitates seamless approvals to drive faster revenue accretion.
Rising demand from various end-user sectors (including oil & gas, renewable energy, power and infrastructure sectors across key markets globally) continues to drive exports of W&C from India. To effectively capitalize on the opportunity, KEII plans to build a new authorized dealer and distribution network in international markets with focus on both housing and industrial cables & wires. Business development activities will also be stepped up once international travel resumes normalcy. While KEII has already secured many global certificates for quality standards, it continues to bolster its prequalification credentials to meet the stringent parameters in the international markets and expand the customer base.

29 April 2022
59 Systematix Research is also available on Bloomberg SSSL <Go>, Thomson & Reuters Systematix Shares and Stocks (India) Limited
KEI Industries
Robust capex plans to support growth targets
For the past five years, KEII has followed a practice of investing in small increments every year to augment capacity at its existing facilities (Bhiwadi, Chopanki and Pathredi in Rajasthan, and Rakholi and Chinchpada in Silvassa, Dadra and Nagar Haveli). After the Rakholi facility for housing wires hit full capacity utilization, the company set up a greenfield plant in Silvasa in 2019.
Currently, the EHV cable line is nearing optimal utilization while the capacity of LT/ HT and other cables too will reach maximum potential in the next 1-2 years. With no scope for further capacity addition at existing locations to support its projected 18% revenue CAGR over FY21-24E, KEII has committed ~Rs8bn over the next 4-5 years to set up a large greenfield facility that will be commissioned in phases.
Exhibit 26: Product-wise installed capacity
Particulars Installed Capacity
EHV Cables 900 Kms
HT Cables 11,100 Kms
LT Power & other Cables 116,600 Kms
Winding, Flexibles & House Wires 1,117,000 Kms
Stainless Steel Wires 7,200 MT
Source: Company
Exhibit 27: Rising capex on the proposed greenfield plant
0
1
1
2
2
3
FY18 FY19 FY20 FY21 FY22E FY23E FY24E
(Rs bn)
Capex
Source: Company, Systematix Institutional Research

29 April 2022
60 Systematix Research is also available on Bloomberg SSSL <Go>, Thomson & Reuters Systematix Shares and Stocks (India) Limited
KEI Industries
Financial Analysis
Strong growth in W&C; de-scaling ECP business for a leaner balance sheet
With emphasis on margins and cash flows, KEII is strategically reducing its EPC exposure and has shifted focus to the faster growing retail business. Within EPC, the company plans to largely focus on projects with significant cabling requirements (25-30% in LT/ HT and 75-80% in EHV). The initiatives have the potential to lead to a shorter WC-cycle and, therefore, an improvement in the quality of its balance sheet. The Rs 5bn fund raise through QIP in 4QFY20 helped the company to sail through a tough FY21 and significantly reduce its debt levels. The rising share of EHV cables,
exports and housing wires augur well for margin expansion.
Exhibit 28: Expect 21% CAGR in revenues… Exhibit 29: …with 25% CAGR in PAT over FY21-24E
0
10
20
30
40
50
60
70
80
FY18 FY19 FY20 FY21 FY22E FY23E FY24E
(Rs bn)
Revenue
0
1
2
3
4
5
6
FY18 FY19 FY20 FY21 FY22E FY23E FY24E
(Rs bn)
PAT
Source: Company, Systematix Institutional Research Source: Company, Systematix Institutional Research
Exhibit 30: KEII expected to turn net cash positive next year Exhibit 31: OCF, Capex and FCF trend
-10
-8
-6
-4
-2
0
2
4
6
FY18 FY19 FY20 FY21 FY22E FY23E FY24E
(Rs bn)
Net-cash
-2
-1
0
1
2
3
4
5
6
7
OCF Capex FCF
(Rs bn)
FY18 FY19 FY20 FY21 FY22E FY23E FY24E
Source: Company, Systematix Institutional Research Source: Company, Systematix Institutional Research
Exhibit 32: Dupont Analysis – a gradual expansion in RoE ahead FY18 FY19 FY20 FY21 FY22E FY23E FY24E
PAT margin (%) 4.2 4.3 5.2 6.5 6.7 7.1 7.3
Asset turnover (x) 2.3 3.0 2.6 2.0 2.3 2.2 2.2
Equity multiplier (x) 2.5 1.8 1.3 1.2 1.1 1.1 1.1
RoE (%) 23.9 23.2 17.0 15.4 17.4 17.9 17.6 Source: Company, Systematix Institutional Research

29 April 2022
61 Systematix Research is also available on Bloomberg SSSL <Go>, Thomson & Reuters Systematix Shares and Stocks (India) Limited
KEI Industries
Valuation and Outlook
We believe in KEII’s strong earnings growth potential, supported by healthy demand in its cable business across institutional, retail and exports verticals. With a lower proportion of EPC in sales, we expect a shorter working capital cycle for the
company, which would further deliver healthy FCF generation.
KEII registered 7% revenue CAGR and 11% EBITDA CAGR over FY18-21 with a much higher 24% PAT CAGR on the back of margin expansion and lower interest expenses after debt was cut from ~Rs 8.4bn to ~Rs 2.8bn in FY21. Over FY21-24E, we expect KEII to achieve 21% revenue CAGR, 20% EBITDA CAGR and 25% EPS CAGR on the
back of strong operating performance and additional capacity over these years.
Despite the fact that the stock has seen a significant re-rating in the last two years, we believe KEII’s promising growth prospects should potentially drive a further re-rating, especially in view of its improving balance sheet health. We initiate coverage on the stock with a BUY rating and target price of Rs 1,425 (19% upside from CMP),
based on 24x FY24E earnings.
Exhibit 33: One-year forward PE band and standard deviation
0
5
10
15
20
25
30
Ap
r-1
7
Jul-
17
Oct
-17
Jan
-18
Ap
r-1
8
Jul-
18
Oct
-18
Jan
-19
Ap
r-1
9
Jul-
19
Oct
-19
Jan
-20
Ap
r-2
0
Jul-
20
Oct
-20
Jan
-21
Ap
r-2
1
Jul-
21
Oct
-21
Jan
-22
Ap
r-2
2
P/E Mean +1 SD -1 SD
-1SD
+1SD
Mean
Source: BSE, Systematix Institutional Research

29 April 2022
62 Systematix Research is also available on Bloomberg SSSL <Go>, Thomson & Reuters Systematix Shares and Stocks (India) Limited
KEI Industries
Key risks and risk mitigating measures
Volatile raw material prices
Cost of key raw materials including copper, aluminium, PVC, galvanized iron wire, lead and XLPE form a significant ~70% of KEII’s revenues. The prices of these materials are governed by global commodity markets which, in turn, are driven by global supply and demand. The company procures raw material from both domestic and overseas (UAE and Malaysia) suppliers on a purchase order basis and usually does not enter into long-term supply contracts. KEII follows the policy to pass on any cost increase to customers and, therefore, has managed to protect its margins even
during periods of sharp volatility in commodity prices.
Risk of foreign exchange rate fluctuations
KEII’s business operations entail import of raw materials and export of finished goods. The company is a net user of foreign currency and any significant exchange rate fluctuations may adversely affect its financial performance.
Subdued economic activity
KEII is heavily dependent on industrial capex and government spend on infrastructure development including power for its business. Thus, any slowdown in
the economic activity has a large bearing on its business performance.
Defaults on payment credit extended to dealers
KEII helps its old dealers and distributors by facilitating funding from banks via channel financing arrangements. As the funding is on recourse to KEII, the repayment obligation lies with the company in case of any default in repayment of these loans. Further, most of the sales to dealers and distributors are ordinarily on an open credit basis (a 60-day cycle, without any security). To mitigate the risk of non-payments, KEII regularly monitors the dealers’ or distributors’ ability to repay and sets limits for lines of credit extended to them based on evaluation of their respective repayment records and creditworthiness. It has also taken trade credit insurance to mitigate the
risk of non-payments.
Inadequate capacities or underutilization of capacities
KEII’s plants are currently running at ~70% capacity utilization across product categories (barring EHV which is close to optimal utilization). Depending on the industry growth trends, the company may fall short of supply if new capacities do not keep pace with demand growth. On the other hand, a large capex planned over the next 4-5 years may be underutilized in case of a demand slowdown and will impact its financial performance.
29 April 2022
63 Systematix Research is also available on Bloomberg SSSL <Go>, Thomson & Reuters Systematix Shares and Stocks (India) Limited
KEI Industries
Annexures

29 April 2022
64 Systematix Research is also available on Bloomberg SSSL <Go>, Thomson & Reuters Systematix Shares and Stocks (India) Limited
KEI Industries
Company Background
Established in 1968 as a partnership firm, Krishna Electrical Industries’ key business was to manufacture house wiring rubber cables. The company was incorporated in Dec-92 as KEI Industries. In 1996, it acquired Matchless which manufactured stainless steel wires. Today, KEI has three divisions: cables & wires, stainless steel wires and turnkey projects (EPC) with good exposure to B2B and B2C markets. Over the years, it has invested in building flexible manufacturing facilities and expanding capacities. It has a technical tie-up with Brugg Kabel, Switzerland to manufacture extra-high-voltage (EHV) cables, above 220kV up to 400kV.
Exhibit 34: Revenue mix (FY21) Exhibit 35: Product portfolio
64%
22%
11%
3%
Cables (LT, HT, EHV)
Wires (housing, winding,flexible)
EPC
SS wires
Source: Company Source: Company
Exhibit 36: Manufacturing plant locations
Source: Company

29 April 2022
65 Systematix Research is also available on Bloomberg SSSL <Go>, Thomson & Reuters Systematix Shares and Stocks (India) Limited
KEI Industries
Promoters and key managerial personnel
▪ Anil Gupta, CMD, is a recognized and accomplished expert in the Indian cables & wires industry. As a partner in the erstwhile
Krishna Electrical Industries, he became a part of the KEI Group in 1979.
▪ Archana Gupta, Director, has played a pivotal role in transforming the stainless-steel wires division. She heads the planning,
organizing and optimizing of resources function and has been instrumental in the expansion of this division.
▪ Rajeev Gupta, Executive Director (Finance), is a B.Com. (Hons.) and CA and has been associated with KEII for ~27 years.
▪ Akshit Diviaj Gupta, Director, CMD Anil Gupta’s son, has a BBA degree in management and is currently involved in sales and marketing at KEII.
Exhibit 37: Shareholding pattern and key shareholders
Equity stake (%) Key institutional holders % equity
Sep-21 Dec-21 Mar-22 Mar-22
Promoters 38.0 38.0 38.0 Smallcap World Fund 5.0
Free float 62.0 62.0 62.0 DSP MF 4.2
- Foreign Institutions 19.4 21.8 25.2 HDFC MF 3.0
- Domestic Institutions 25.8 24.0 21.6 Franklin MF 2.7
- Public 16.8 16.2 15.2 Massachusetts Institute 2.4
Source: BSE, Bloomberg

29 April 2022
66 Systematix Research is also available on Bloomberg SSSL <Go>, Thomson & Reuters Systematix Shares and Stocks (India) Limited
KEI Industries
Annual Report Analysis (FY17 to FY21)
Exhibit 38: Annual Report Analysis
Year Demand Scenario and outlook Plans and initiatives
FY17
• Revenues increased 15% YoY with growth across segments including exports (up 98%)
• Various government schemes like UDAY, DDUGJY, Electricity for All, etc drove growth in the W&C sector; thus, expectations of 13% CAGR for the next few years
• Focus on rapidly increasing retail sales
• Expanded Chopanki plant capacity for 400kVA EHV cables
• Opened offices in Singapore and Nigeria
• ‘Jode Dilon Ke Taar’ ad campaign starring Irrfan Khan attracted significant attention of viewers
FY18
• Revenues up by 23% YoY with contribution from all segments incl. cables (25%)
• After a temporary setback faced due to demonetization and implementation of GST, the Indian economy started recovering in 2018
• New opportunities opening up after GST implementation to increase market share
• Energy demand in India expected to accentuate in the years to come on the back of sustained economic growth, rising urbanization and increasing per capita energy consumption
• Commissioned a Rs 0.5bn capex in LT cable at Pathredi having revenue potential of Rs 3bn
• Undertaking 2nd phase of expansion for HT cables with revenue potential of Rs 2bn
• Reduced its holding in KEI Cables Australia from 100% to 90%
FY19
• KEI achieved a 23% YoY revenue growth
• 15% growth expected in the W&C industry
• KEI sustained above-industry growth driven by focused business initiatives across segments
• From a strong player in B2B cables, KEI's incremental focus on expanding retail sales (33% of total sales)
• Expanded marketing network further by setting up a new office in Africa
• Augmented housing wires capacity through a new unit at Chinchpada (Silvassa)
• Target to enhance productivity at all facilities
• Key sponsors of the Rajasthan Royals team in the Indian Premier League (IPL)
FY20
• The nationwide lockdown from Mar-20 dented revenue collections; however, KEI achieved 15.5% revenue growth
• Sector outlook bright on government focus on power and infra sectors, supported via various policies, renewable energy push and schemes for electrification, housing development and smart cities
• Less competition in 400kV EHV cables as only a few companies in the world with established capability to manufacture such cables; stringent compliances and product approval process make it difficult for new players to enter
• Raised Rs 5bn through the QIP route for debt reduction, meeting working capital requirements and general corporate purposes
• Commissioned 1st phase of housing wire capex at Silvasa in July FY20
FY21
• Revenues declined by ~14% mainly because of lockdown restrictions and a calibrated approach to reducing EPC business
• Sector consolidation helping large, organized players to gain market share
• Sector continues to have robust outlook
• Planned ~Rs 7bn capex over five years to be funded from internal accruals for growing capacities for LT, HT and EHV cables
• Deliberately reducing its EPC portfolio given long working capital cycles and a low margin profile
• Shifting orientation towards the retail segment to capitalize on shorter working capital cycles and higher margins
• Target to achieve 40-50% of business from retail in 2-3 years
Source: Company, Systematix Institutional Research

29 April 2022
67 Systematix Research is also available on Bloomberg SSSL <Go>, Thomson & Reuters Systematix Shares and Stocks (India) Limited
KEI Industries
FINANCIALS (CONSOLIDATED)
Profit & Loss Statement
YE: Mar (Rs mn) FY20 FY21 FY22E FY23E FY24E
Net revenues 48,878 41,815 55,252 63,602 73,339
Growth (%) 15.5 (14.4) 32.1 15.1 15.3
Raw material expenses 33,822 29,097 40,364 46,403 53,437
Gross Margin (%) 30.8 30.4 26.9 27.0 27.1
Employee & Other exp. 10,085 8,114 9,078 10,322 11,902
EBITDA 4,971 4,605 5,810 6,876 7,999
EBITDA margins (%) 10.2 11.0 10.5 10.8 10.9
Depreciation 567 578 556 668 779
Other income 167 201 91 274 313
Finance costs 1,292 573 383 368 353
PBT 3,279 3,654 4,961 6,115 7,181
Effective tax rate (%) 21.8 25.2 25.7 25.7 25.7
Associates/(Minorities) - - - - -
Net Income 2,563 2,733 3,685 4,542 5,334
Adjusted net income 2,563 2,733 3,685 4,542 5,334
Shares outstanding 90 90 90 90 90
FDEPS (Rs) 28.5 30.4 41.0 50.5 59.4
FDEPS growth (%) 41.7 6.6 34.8 23.3 17.4
Source: Company, Systematix Institutional Research
Balance Sheet
YE: Mar (Rs mn) FY20 FY21 FY22E FY23E FY24E
Share capital 179 180 180 180 180
Net worth 15,072 17,781 21,196 25,378 30,263
Total debt 3,652 2,850 2,740 2,630 2,520
Minority interest (1) (0) (0) (0) (0)
DT Liability/ (Asset) 308 295 285 275 265
Capital Employed 19,031 20,925 24,220 28,282 33,047
Net tangible assets 5,507 5,353 6,797 8,129 9,350
Net Intangible assets 29 18 18 18 18
Goodwill - - - - -
CWIP 112 71 171 271 371
Investments (Strategic) - - - - -
Investments (Financial) 8 12 3,012 4,012 5,512
Current Assets 24,889 22,473 25,570 28,414 32,604
Cash 2,144 2,212 512 1,005 712
Current Liabilities 13,658 9,215 11,860 13,566 15,520
Working capital 11,232 13,258 13,711 14,848 17,084
Capital Deployed 19,031 20,925 24,220 28,282 33,047
Contingent Liabilities 13,455 11,926 - - -
Source: Company, Systematix Institutional Research
Cash Flow
YE: Mar (Rs mn) FY20 FY21 FY22E FY23E FY24E
EBIT (incl. other income) 4,615 4,285 5,244 6,199 7,210
Non-cash items 567 578 556 668 779
OCF before WC changes 5,182 4,863 5,800 6,866 7,989
Incr./(decr.) in WC 4,365 2,420 443 1,127 2,226
Others including taxes 947 904 1,296 1,593 1,867
Operating cash-flow (130) 1,539 4,062 4,147 3,896
Capex 805 240 2,100 2,100 2,100
Free cash-flow (935) 1,299 1,962 2,047 1,796
Acquisitions - - - - -
Dividend 276 180 270 359 449
Equity raised 5,020 79 - - -
Debt raised (2,333) (567) (110) (110) (110)
Fin Investments (781) (943) 3,000 1,000 1,500
Misc. Items (CFI + CFF) 1,283 567 283 84 30
Net cash-flow 974 1,007 (1,701) 493 (293)
Source: Company, Systematix Institutional Research
Ratios
YE: Mar FY20 FY21 FY22E FY23E FY24E
P/E (x) 43.1 40.4 30.0 24.3 20.7
EV/EBITDA (x) 22.5 24.1 18.9 15.7 13.4
EV/sales (x) 2.3 2.7 2.0 1.7 1.5
P/B (x) 7.3 6.2 5.2 4.4 3.7
RoE (%) 17.0 15.4 17.4 17.9 17.6
RoCE (%) 27.5 21.2 23.7 24.7 24.6
ROIC (%) 17.6 15.4 18.7 20.7 21.3
DPS (Rs per share) 1.5 2.0 3.0 4.0 5.0
Dividend yield (%) 0.1 0.2 0.2 0.3 0.4
Dividend payout (%) 5.3 6.6 7.3 7.9 8.4
Net debt/equity (x) 0.1 0.0 (0.0) (0.1) (0.1)
Receivables (days) 102 118 100 95 95
Inventory (days) 65 67 60 60 60
Payables (days) 87 65 65 65 65
CFO:PAT% (5) 56 110 91 73
Source: Company, Systematix Institutional Research

Systematix Research is also available on Bloomberg SSSL <Go>, Thomson & Reuters Systematix Shares and Stocks (India) Limited
Investors are advised to refer disclosures made at the end of the research report.
68
Finolex Cables
Improving outlook supports a case for re-rating
Finolex Cables’ (FNXC) business prospects are reviving with an improving outlook for the real estate sector. After lacklustre performance over FY17-21, we expect 20% revenue CAGR, 19% EBITDA CAGR and 10% PAT CAGR for the company over FY21-24E, driven largely by the W&C business. The OFC (optic fibre cables) business too is expected to look up with higher demand from the ongoing digitization drive and 5G rollout. However, the large cash on FNXC’s books will suppress the RoE unless used for acquisitions (FMEG), dividend payout or a buyback scheme. While its performance has been weaker than peers in recent years, valuations of ~10x FY24E earnings suggest scope for a catch-up given healthy FCFs and an improving outlook. The ongoing family tussle for the company’s ownership will remain an overhang on its valuation though. We initiate coverage on the stock with a BUY rating and price target of Rs 526, (30% upside), based on 14x FY24E core earnings + Rs 147 as value of its 32.4% share in Finolex Industries at a 30% holdco discount.
Improving housing industry outlook a positive for wires demand: The real estate sector is ready to shake off the after-effects of demonetization, GST implementation, RERA and NBFC crisis. A revival appears due led by stable property prices, low interest rates and demand for bigger houses. For FNXC, the leader in housing wires, the segment accounts for ~50% of revenues. With buoyancy returning in the segment (a tepid <5% demand CAGR over FY17-21, flat for FNXC), we expect 19% revenue CAGR for the company in W&C business over FY21-24E. However, we believe tough competition will prevent recoup of the market share lost due to its stringent credit terms for channel partners. In the JV with J-Power, FNXC has been
struggling to attain scale and break even despite pumping in Rs 2.2bn since 2010.
Challenges persist in OFC business but 5G rollout likely to trigger demand: Optic fibre cables (OFCs) has been a difficult business for FNXC given the volatility prevalent in the industry. After registering 16% CAGR over FY14-19, revenues in the communication cables segment slid 19% over FY19-21 on demand destruction and a sharp correction in optic fibre prices. Margins in this business are much lower and volatile than in wires. However, we see a strong rebound in demand for OFCs driven by the government’s thrust on digitization and rollout of 5G in the country, driving a 17% revenue CAGR for FNXC over FY21-24E. The weak financials of telecom players and any disruption in technology are the key risks to our projected numbers.
FMEG yet to be a meaningful contributor: FNXC’s entry into FMEG has not yielded the desired outcome even as the move was logical in terms of diversification and leveraging its pan-India dealer network for wires. The business has not scaled up even after a decade with revenues barely crossing Rs 1bn (~4% of total) in FY21. The management has missed its guidance of Rs 5bn in revenues many times in the past. While the industry outlook is robust, the journey for FNXC will remain tough unless it turns aggressive on product launches, dealer schemes and higher A&P spends.
Re-rating potential as valuations play catch up with peers: While FNXC has underperformed its peers, cheap valuations (~10x FY24E earnings at CMP), high cash on books, healthy FCF status and improving demand outlook provide scope for a re-rating. We initiate coverage on the stock with a BUY rating and price target of Rs 526, based on 14x FY24E core earnings + Rs 147 from the value of its 32.4% share in Finolex Industries at a 30% holdco discount. Despite attractive valuations, the ongoing family tussle for the company’s ownership may continue to be an overhang
on the stock’s performance.
Systematix Institutional Equities
29 April 2022
INITIATING COVERAGE
Sector: Consumer Electricals Rating: BUY
CMP: Rs 405 Target Price: Rs 526
Stock Info
Sensex/Nifty 57,521/17,244
Bloomberg FNXC IN
Equity shares (mn) 153.0
52-wk High/Low 600/357
Face value Rs 2
M-Cap Rs 62 bn/ USD 0.8bn
3-m avg turnover USD 3.6mn
Financial Snapshot (Rs mn) Y/E Mar FY22E FY23E FY24E
Net sales 36,518 41,860 47,306
EBITDA 4,368 5,411 6,244
OPM % 12.0 12.9 13.2
PAT (adj.) 4,843 5,475 6,161
EPS (Rs) 31.7 35.8 40.3
PE (x) 12.8 11.3 10.1
P/B (x) 1.6 1.5 1.3
EV/EBITDA (x) 12.2 9.4 7.7
RoE (%) 12.7 12.8 12.9
RoCE (%) 12.0 13.3 13.7
Net-D/E (x) (0.2) (0.3) (0.3)
Shareholding Pattern (%) Mar’22 Dec'21 Sep'21
Promoter 35.9 35.9 35.9
- Pledged - - -
FII 9.4 9.4 9.1
DII 15.7 16.5 16.2
Others 39.0 38.2 38.8
Stock Performance (1-year)
200
300
400
500
600
700
Ap
r-2
1
May
-21
Jun
-21
Jul-
21
Au
g-2
1
Sep
-21
Oct
-21
No
v-2
1
Dec
-21
Jan
-22
Feb
-22
Mar
-22
Ap
r-2
2
FNXC Sensex
Ashish Poddar [email protected] +91 22 6704 8039
Pranay Shah [email protected] +91 22 6704 8017

29 April 2022
69 Systematix Research is also available on Bloomberg SSSL <Go>, Thomson & Reuters Systematix Shares and Stocks (India) Limited
Finolex Cables
Story in charts
Exhibit 1: Total revenues and growth trend Exhibit 2: Gross and EBITDA margin trend
0
5
10
15
20
25
30
35
40
45
50
FY18 FY19 FY20 FY21 FY22E FY23E FY24E
(Rs bn)
Revenue
0
5
10
15
20
25
30
FY18 FY19 FY20 FY21 FY22E FY23E FY24E
(%)
Gross margin EBITDA margin
Source: Company, Systematix Institutional Research Source: Company, Systematix Institutional Research
Exhibit 3: PAT and growth trend Exhibit 4: Electrical W&C – revenue and EBIT margin trend
0
1
2
3
4
5
6
7
FY18 FY19 FY20 FY21 FY22E FY23E FY24E
(Rs bn)
PAT
0
2
4
6
8
10
12
14
16
18
0
5
10
15
20
25
30
35
40
45
FY18 FY19 FY20 FY21 FY22E FY23E FY24E
(%)(Rs bn)
Revenue EBIT margin % (RHS)
CAGR: 0%
Source: Company, Systematix Institutional Research Source: Company, Systematix Institutional Research
Exhibit 5: Communication cables – revenue and EBIT margin Exhibit 6: FMEG – revenue and EBIT margin trend
-4
-2
0
2
4
6
8
10
12
14
16
0
1
2
3
4
5
6
FY18 FY19 FY20 FY21 FY22E FY23E FY24E
(%)(Rs bn)
Revenue EBIT margin % (RHS)
-20
-15
-10
-5
0
5
10
0
1
1
2
2
3
3
FY18 FY19 FY20 FY21 FY22E FY23E FY24E
(%)(Rs bn)
Revenue EBIT margin % (RHS)
Source: Company, Systematix Institutional Research Source: Company, Systematix Institutional Research

29 April 2022
70 Systematix Research is also available on Bloomberg SSSL <Go>, Thomson & Reuters Systematix Shares and Stocks (India) Limited
Finolex Cables
Exhibit 7: Revenue mix (FY21) Exhibit 8: A&P as % sales
83%
12%
4% 1%
Electrical W&C
Communication cables
FMEG
Others
0
0
0
1
1
1
1
1
2
0
50
100
150
200
250
300
FY16 FY17 FY18 FY19 FY20 FY21
(%)(Rs mn)
A&P spend % Total sales (RHS) % B2C sales (RHS)
Source: Company, Systematix Institutional Research Source: Company, Systematix Institutional Research
Exhibit 9: RoE and RoCE trend Exhibit 10: OCF, Capex and FCF trend
0
5
10
15
20
25
FY18 FY19 FY20 FY21 FY22E FY23E FY24E
(%)
RoE % RoCE %
0
1
1
2
2
3
3
4
4
5
OCF Capex FCF
(Rs bn)
FY18 FY19 FY20 FY21 FY22E FY23E FY24E
Source: Company, Systematix Institutional Research Source: Company, Systematix Institutional Research
Exhibit 11: Net cash trend Exhibit 12: Net working capital cycle trend
0
2
4
6
8
10
12
14
FY18 FY19 FY20 FY21 FY22E FY23E FY24E
(Rs bn)
Net-cash
0
20
40
60
80
100
120
Receivables Inventory Payables Net WC cycle
(Days)
FY18 FY19 FY20 FY21 FY22E FY23E FY24E
Source: Company, Systematix Institutional Research Source: Company, Systematix Institutional Research

29 April 2022
71 Systematix Research is also available on Bloomberg SSSL <Go>, Thomson & Reuters Systematix Shares and Stocks (India) Limited
Finolex Cables
Investment Analysis
Wire industry outlook improving on recovery in the housing sector
Growth has been subdued in the electrical wires segment (<5% CAGR over the last five years) due to weak consumer sentiment and muted demand for housing units post demonetization, GST, RERA and the NBFC crisis. However, the real estate industry is expected to witness a strong revival on the back of stable property prices, low interest rates and surge in demand for larger houses due to the Covid-19 pandemic. This will drive demand of wires (10%+ CAGR expected over FY20-26E).
Exhibit 13: W&C industry estimated to register a healthy 11% CAGR over FY20-26E
0
200
400
600
800
1,000
1,200
FY16 FY18 FY20 FY26P
(Rs bn)
W&C - Market Size
Source: Company, Systematix Institutional Research
Housing wires make up ~50% of FNXC’s revenues
FNXC, with a 16% share in India’s electrical wires market, is a leading W&C brand in the country. The W&C segment contributes ~85% to its overall revenues. Within the segment, the company has high reliance on the construction industry with ~50% of the W&C revenues accruing mainly from housing wires. The remaining ~50% share is accounted for by industry, agriculture, automobiles and power T&D sectors, wherein growth has been largely sluggish.
Exhibit 14: Sector-wise revenue mix Exhibit 15: Electrical wires – 16% market share
50%
15%
15%
10%
10%
Construction
Auto
Industrial
Agriculture
Power T&D
25%
16%
15%
8%
6%
30%Polycab
Finolex Cables
Havells
KEI
V-Guard
Others
Source: Company, Systematix Institutional Research Source: Company, Systematix Institutional Research

29 April 2022
72 Systematix Research is also available on Bloomberg SSSL <Go>, Thomson & Reuters Systematix Shares and Stocks (India) Limited
Finolex Cables
Strict credit policy, keener competition led to market share loss
FNXC derives ~70% of its W&C sales through dealers/ distributors on a cash-and-carry basis – a key factor for its shorter receivables cycle (<25 days) vis-à-vis peers. However, strict adherence to this policy in times of weak demand has led to the company conceding market share even as peers offered extended credit periods to channel partners to win their loyalty.
Exhibit 16: Revenue/ EBIT growth trend – peer comparison
Revenue (Rs mn) FY17 FY21 CAGR (%) EBIT margin (%) FY17 FY21 bps change
POLYCAB 56,821 76,035 7.6 POLYCAB 7.0 11.8 479
KEII 22,794 35,742 11.9 KEII 9.3 10.9 160
HAVL 26,756 31,802 4.4 HAVL 10.0 12.7 266
FNXC 21,778 23,100 1.5 FNXC 17.7 12.9 (480)
VGRD 6,399 8,260 6.6 VGRD 12.2 12.9 69
Source: Company, Systematix Institutional Research
Finolex J-Power JV for EHV cables yet to be profitable
In 2007, FNXC entered into a 50:50 JV with J-Power Systems, Japan (a wholly owned subsidiary of Sumitomo Electric Industries, Japan), under which it invested Rs 1bn to set up an extra-high-voltage (EHV) cable plant to manufacture cables above 33kV. Notably, the JV could obtain final certification for 400kV-EHV cables only in Dec-17 –10 years after it was set up – and is struggling to get sizeable orders and reach breakeven. FNXC has infused >Rs 2.2bn in the JV so far for its 49% stake and will have to invest further until the entity breaks even (projected at revenues of ~Rs 2bn). In contrast, peer KEI Industries too entered the EHV cable segment (a technical tie-up with Brugg Kabel, Switzerland) about a decade ago and currently leads the segment
with ~Rs 5bn in annual revenues and healthy margins.
While the long-term outlook for Finolex J-Power JV is positive, it is an overhang on FNXC’s consolidated financials in the short term and, on net worth erosion, has
recognized a diminution in the value of its investment of Rs 270mn in FY21.
Exhibit 17: Finolex J-Power JV performance (FNXC holds a 49% stake)
Rs mn Revenues Profit/ (Loss) Equity infusion by
FNXC
FY17 354 (253) 196
FY18 317 (320) 159
FY19 481 (357) 189
FY20 687 (274) 434
FY21 506 (313) 245 Source: Company, Systematix Institutional Research
A Rs 2bn capex planned across product categories
FNXC has committed a capex of Rs 2bn over the next 18 months for augmenting its manufacturing capacity at Urse, Pune and Verna, Goa. The capex is targeted at creating incremental capacity to meet the requirements of solar power and automotive sectors, acquiring certain in-house value additions which are currently
being outsourced and a further expansion of the optic fiber line.

29 April 2022
73 Systematix Research is also available on Bloomberg SSSL <Go>, Thomson & Reuters Systematix Shares and Stocks (India) Limited
Finolex Cables
Expect 19% revenue CAGR in W&C business over FY21-24E
With demand in real estate and, thereby, housing wires expected to pick up, we estimate 19% revenue CAGR for FNXC in its W&C business over FY21-24E. However, we believe the company will find it difficult to reclaim its lost market share considering the aggressive plans of peers. Also, we see a recovery in its EBIT margins to ~15% by FY24E, led by the strong demand outlook. FNXC’s margins had contracted in the last two years as, according to the company, it paid incentives to dealers during the Covid-19 pandemic despite a shortfall in their sales targets.
Exhibit 18: Electrical Wires – revenue and margin trend
0
2
4
6
8
10
12
14
16
18
0
5
10
15
20
25
30
35
40
45
FY18 FY19 FY20 FY21 FY22E FY23E FY24E
(%)(Rs bn)
Revenue EBIT margin % (RHS)
CAGR: 0%
Source: Company, Systematix Institutional Research

29 April 2022
74 Systematix Research is also available on Bloomberg SSSL <Go>, Thomson & Reuters Systematix Shares and Stocks (India) Limited
Finolex Cables
OFC business: Challenges persist
FNXC is a leading operator in telecom cables including optic fibre cables (OFC). It was the first private company to manufacture jelly-filled telephone cables (JFTC) in the 1980s, later replaced by the optic fibre technology. The company has OFC facilities in Goa and Urse, Maharashtra for the manufacture of all types of communication cables. FNXC is backward integrated and has a plant to draw its own optical fibres.
Performance in OFC segment marred by weak demand
With a 60-70% share in FNXC’s communication cable revenues, the OFC segment has been struggling to grow for the last 2-3 years. Having registered 20%+ CAGR over FY14-19, weak demand and poor financials of telecom operators have kept growth capped in the segment since then. Given that ~80% of the business is B2B and driven by government tenders and private companies like D-Link, Schneider etc, it also entails lower EBITDA margins compared to electrical cables. Not only that, but the business is also more working capital intensive with 30+ days of credit to private
firms and 45-90 days for government orders.
Government’s focus on digitization to drive growth…
The OFC market size is expected to witness 12% CAGR to reach USD 11.8bn by 2028. According to industry sources, India’s consumption of OFC, at 16 optical-fibre km (fkm), is a fraction of that in China (390m fkm) and the global average (600m fkm). Going forward, we expect India’s fibre rollout to increase significantly as the government continues to invest (Project BharatNet) in building networks to bridge the digital divide. Also, network connectivity in India is abysmal and there is a dire need to replace cables with quality OFCs as the country progresses towards 5G network connectivity. Considering the robust economic growth and other demand factors, overall consumption of OFCs in India is bound to grow. However, telecom operators’ weak financials remain an area of concern.
…and financial health of FNXC
The communication cables segment, mainly OFCs, has been in doldrums for the last 2-3 years. For FNXC too, demand destruction in the wake of a sharp correction in optic fibre prices led to a steep 19% decline compounded annually over FY19-21 (vs a 16% CAGR over FY14-19). With improving industry prospects, we expect 16% revenue CAGR for the company over FY21-24E with EBIT margins expanding to 7.5% by FY24E. However, weak financial position of telecom players and advent of any new technology (like jelly-filled cables) are key risks to the sector outlook.
Exhibit 19: Communication cables – revenue and margin trend
-4-20246810121416
0
1
2
3
4
5
6
FY18 FY19 FY20 FY21 FY22E FY23E FY24E
(%)(Rs bn)
Revenue EBIT margin % (RHS)
Source: Company, Systematix Institutional Research
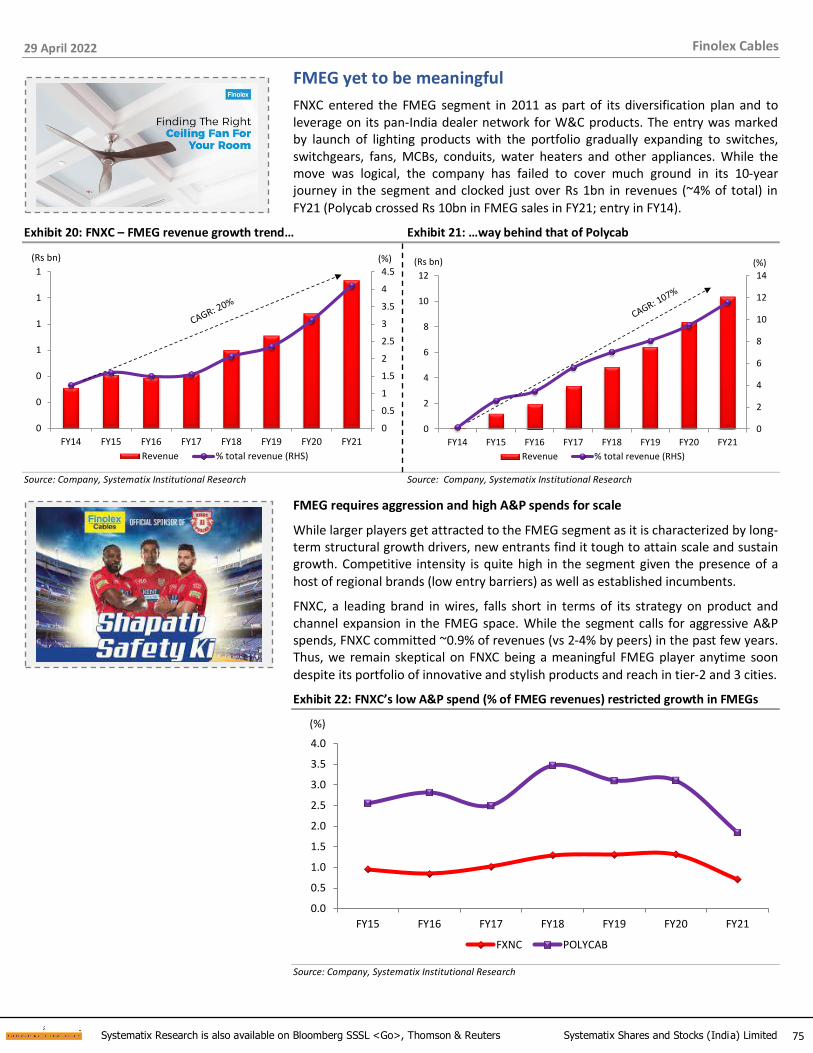
29 April 2022
75 Systematix Research is also available on Bloomberg SSSL <Go>, Thomson & Reuters Systematix Shares and Stocks (India) Limited
Finolex Cables
FMEG yet to be meaningful
FNXC entered the FMEG segment in 2011 as part of its diversification plan and to leverage on its pan-India dealer network for W&C products. The entry was marked by launch of lighting products with the portfolio gradually expanding to switches, switchgears, fans, MCBs, conduits, water heaters and other appliances. While the move was logical, the company has failed to cover much ground in its 10-year journey in the segment and clocked just over Rs 1bn in revenues (~4% of total) in
FY21 (Polycab crossed Rs 10bn in FMEG sales in FY21; entry in FY14).
Exhibit 20: FNXC – FMEG revenue growth trend… Exhibit 21: …way behind that of Polycab
0
0.5
1
1.5
2
2.5
3
3.5
4
4.5
0
0
0
1
1
1
1
FY14 FY15 FY16 FY17 FY18 FY19 FY20 FY21
(%)(Rs bn)
Revenue % total revenue (RHS)
0
2
4
6
8
10
12
14
0
2
4
6
8
10
12
FY14 FY15 FY16 FY17 FY18 FY19 FY20 FY21
(%)(Rs bn)
Revenue % total revenue (RHS)
Source: Company, Systematix Institutional Research Source: Company, Systematix Institutional Research
FMEG requires aggression and high A&P spends for scale
While larger players get attracted to the FMEG segment as it is characterized by long-term structural growth drivers, new entrants find it tough to attain scale and sustain growth. Competitive intensity is quite high in the segment given the presence of a
host of regional brands (low entry barriers) as well as established incumbents.
FNXC, a leading brand in wires, falls short in terms of its strategy on product and channel expansion in the FMEG space. While the segment calls for aggressive A&P spends, FNXC committed ~0.9% of revenues (vs 2-4% by peers) in the past few years. Thus, we remain skeptical on FNXC being a meaningful FMEG player anytime soon despite its portfolio of innovative and stylish products and reach in tier-2 and 3 cities.
Exhibit 22: FNXC’s low A&P spend (% of FMEG revenues) restricted growth in FMEGs
0.0
0.5
1.0
1.5
2.0
2.5
3.0
3.5
4.0
FY15 FY16 FY17 FY18 FY19 FY20 FY21
(%)
FXNC POLYCAB
Source: Company, Systematix Institutional Research

29 April 2022
76 Systematix Research is also available on Bloomberg SSSL <Go>, Thomson & Reuters Systematix Shares and Stocks (India) Limited
Finolex Cables
Dealer network expansion not yielding the desired outcome
FNXC’s entry into the FMEG segment banked on leveraging its vast distribution network of electrical wires and cables. Its 5,000+ channel partners (4,000 in FY19) and 90,000+ retailer touchpoints (30,000) are served through 28 depots pan-India. After establishing footprint in the South and West, the company is expanding rapidly in the North and East. Over a period, FNXC has also built a separate network for every product line and adopted a two-tier distribution platform, wherein distributors are allotted clearly defined territories to reach out to retailers. The company aims to partner with 500 distributors, each covering ~300 retailers, to take the total retailer coverage to 150,000 touchpoints. A clear policy related to working of the network, compensation, price management and flow of information has also been outlined.
Despite all these efforts, FNXC is yet to make its mark in the segment.
Exhibit 23: FMEG – FNXC’s region-wise revenue break-up… Exhibit 24: …and dealer network (5,000)
35%
30%
20%
15%
South
West
East
North
32%
25%
20%
23%
South
West
East
North
Source: Company, Systematix Institutional Research Source: Company, Systematix Institutional Research
The management has consistently missed its FMEG growth guidance
FNXC’s FMEG revenues registered 20% CAGR over the last five years, albeit on a low base, to just cross Rs 1bn in FY21. The management has missed its guidance of Rs 5bn sales multiple times. While the outlook for FMEG segment is robust, we believe the journey will remain tough for FNXC unless it goes aggressive on product launches, dealer schemes and A&P spends. Stiff competition in the segment remains a key risk.
Exhibit 25: FMEG – revenue and margin trend
-20
-15
-10
-5
0
5
10
0
1
1
2
2
3
3
FY18 FY19 FY20 FY21 FY22E FY23E FY24E
(%)(Rs bn)
Revenue EBIT margin % (RHS)
Source: Company, Systematix Institutional Research
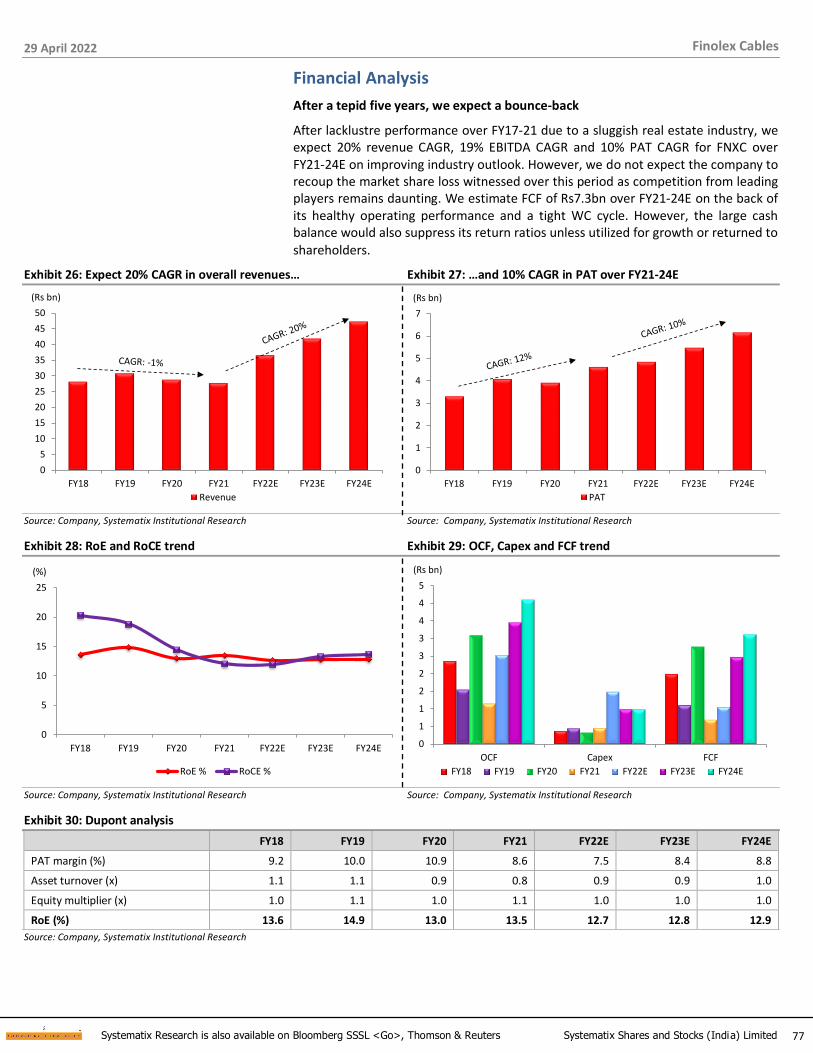
29 April 2022
77 Systematix Research is also available on Bloomberg SSSL <Go>, Thomson & Reuters Systematix Shares and Stocks (India) Limited
Finolex Cables
Financial Analysis
After a tepid five years, we expect a bounce-back
After lacklustre performance over FY17-21 due to a sluggish real estate industry, we expect 20% revenue CAGR, 19% EBITDA CAGR and 10% PAT CAGR for FNXC over FY21-24E on improving industry outlook. However, we do not expect the company to recoup the market share loss witnessed over this period as competition from leading players remains daunting. We estimate FCF of Rs7.3bn over FY21-24E on the back of its healthy operating performance and a tight WC cycle. However, the large cash balance would also suppress its return ratios unless utilized for growth or returned to
shareholders.
Exhibit 26: Expect 20% CAGR in overall revenues… Exhibit 27: …and 10% CAGR in PAT over FY21-24E
0
5
10
15
20
25
30
35
40
45
50
FY18 FY19 FY20 FY21 FY22E FY23E FY24E
(Rs bn)
Revenue
0
1
2
3
4
5
6
7
FY18 FY19 FY20 FY21 FY22E FY23E FY24E
(Rs bn)
PAT
Source: Company, Systematix Institutional Research Source: Company, Systematix Institutional Research
Exhibit 28: RoE and RoCE trend Exhibit 29: OCF, Capex and FCF trend
0
5
10
15
20
25
FY18 FY19 FY20 FY21 FY22E FY23E FY24E
(%)
RoE % RoCE %
0
1
1
2
2
3
3
4
4
5
OCF Capex FCF
(Rs bn)
FY18 FY19 FY20 FY21 FY22E FY23E FY24E
Source: Company, Systematix Institutional Research Source: Company, Systematix Institutional Research
Exhibit 30: Dupont analysis FY18 FY19 FY20 FY21 FY22E FY23E FY24E
PAT margin (%) 9.2 10.0 10.9 8.6 7.5 8.4 8.8
Asset turnover (x) 1.1 1.1 0.9 0.8 0.9 0.9 1.0
Equity multiplier (x) 1.0 1.1 1.0 1.1 1.0 1.0 1.0
RoE (%) 13.6 14.9 13.0 13.5 12.7 12.8 12.9
Source: Company, Systematix Institutional Research
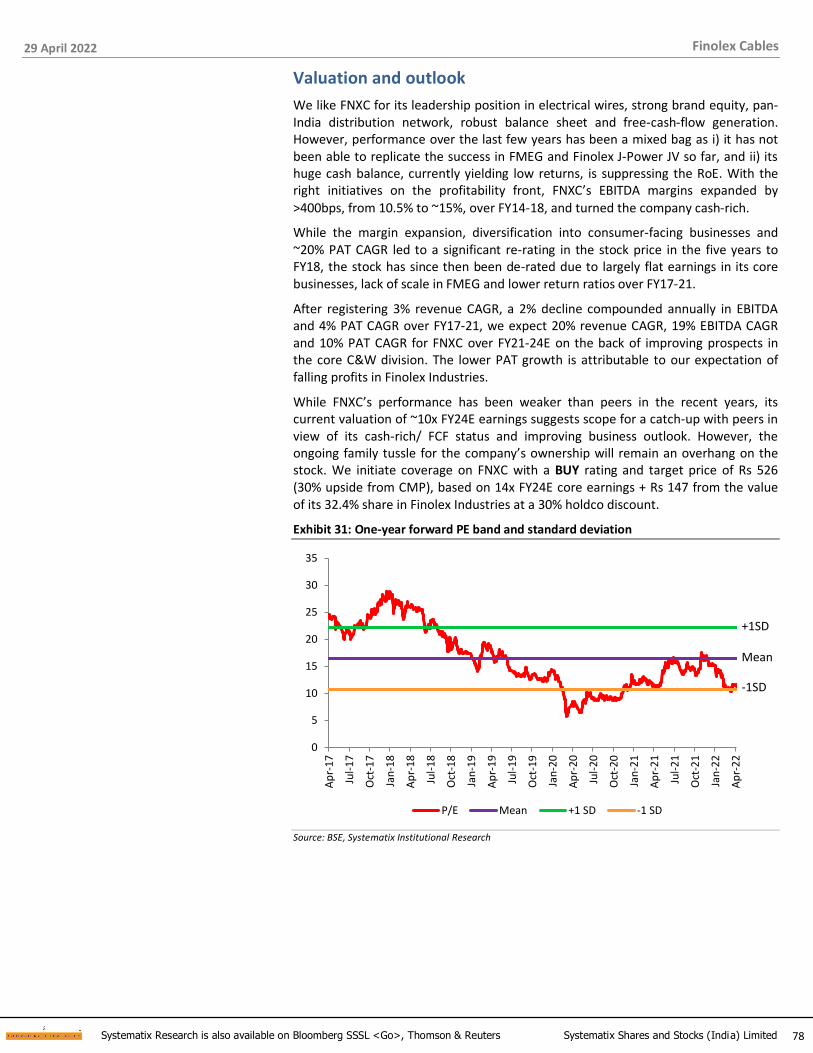
29 April 2022
78 Systematix Research is also available on Bloomberg SSSL <Go>, Thomson & Reuters Systematix Shares and Stocks (India) Limited
Finolex Cables
Valuation and outlook
We like FNXC for its leadership position in electrical wires, strong brand equity, pan-India distribution network, robust balance sheet and free-cash-flow generation. However, performance over the last few years has been a mixed bag as i) it has not been able to replicate the success in FMEG and Finolex J-Power JV so far, and ii) its huge cash balance, currently yielding low returns, is suppressing the RoE. With the right initiatives on the profitability front, FNXC’s EBITDA margins expanded by
>400bps, from 10.5% to ~15%, over FY14-18, and turned the company cash-rich.
While the margin expansion, diversification into consumer-facing businesses and ~20% PAT CAGR led to a significant re-rating in the stock price in the five years to FY18, the stock has since then been de-rated due to largely flat earnings in its core businesses, lack of scale in FMEG and lower return ratios over FY17-21.
After registering 3% revenue CAGR, a 2% decline compounded annually in EBITDA and 4% PAT CAGR over FY17-21, we expect 20% revenue CAGR, 19% EBITDA CAGR and 10% PAT CAGR for FNXC over FY21-24E on the back of improving prospects in the core C&W division. The lower PAT growth is attributable to our expectation of falling profits in Finolex Industries.
While FNXC’s performance has been weaker than peers in the recent years, its current valuation of ~10x FY24E earnings suggests scope for a catch-up with peers in view of its cash-rich/ FCF status and improving business outlook. However, the ongoing family tussle for the company’s ownership will remain an overhang on the stock. We initiate coverage on FNXC with a BUY rating and target price of Rs 526 (30% upside from CMP), based on 14x FY24E core earnings + Rs 147 from the value of its 32.4% share in Finolex Industries at a 30% holdco discount.
Exhibit 31: One-year forward PE band and standard deviation
0
5
10
15
20
25
30
35
Ap
r-1
7
Jul-
17
Oct
-17
Jan
-18
Ap
r-1
8
Jul-
18
Oct
-18
Jan
-19
Ap
r-1
9
Jul-
19
Oct
-19
Jan
-20
Ap
r-2
0
Jul-
20
Oct
-20
Jan
-21
Ap
r-2
1
Jul-
21
Oct
-21
Jan
-22
Ap
r-2
2
P/E Mean +1 SD -1 SD
-1SD
+1SD
Mean
Source: BSE, Systematix Institutional Research

29 April 2022
79 Systematix Research is also available on Bloomberg SSSL <Go>, Thomson & Reuters Systematix Shares and Stocks (India) Limited
Finolex Cables
Key risks and risk mitigating measures
Demand disruption from key user sectors (cyclicality risk)
FNXC’s business depends on construction (housing, etc), industry, agriculture, automobiles and power T&D industries, which are cyclical. Demand disruption in any
of these segments may impact its financial performance.
Mounting competition in formal and non-regulated segments
The electrical wires industry is fragmented due to low entry barriers. Brand-named operators face competition from peers as well as the vast non-regulated sector. Cables is a less fragmented category but is comprised of many large players having global presence. FNXC has strong brand recall in the wires segment even as it is struggling to scale up in EHV cables.
Sharp volatility in copper prices
Copper is the key raw material in cables & wires. Thus, producers’ margins are highly vulnerable to volatile copper prices. While FNXC passes on any change in raw-
material prices, large swings in copper prices could still dent margins.
Slowdown of government initiatives
A slowdown in government initiatives like Housing for All, etc due to any change in
the government or policies may affect the business of the company.
Continuing losses in newer businesses
Despite investing in advertising and brand-building and establishing a new dealer network and service centres for its FMEG business, FCXN may have to continue burning cash till the time this business scales up. Continuing losses in Finolex J-Power
JV are also a concern.

29 April 2022
80 Systematix Research is also available on Bloomberg SSSL <Go>, Thomson & Reuters Systematix Shares and Stocks (India) Limited
Finolex Cables
Annexures

29 April 2022
81 Systematix Research is also available on Bloomberg SSSL <Go>, Thomson & Reuters Systematix Shares and Stocks (India) Limited
Finolex Cables
Company Background
Established in 1958, FNXC is India’s leading and prominent manufacturer of electrical and communication cables. Its wires and cables are used in applications across automobiles, lighting, cable TVs, telephones and computers to industrial applications. The company has pioneered various new products (auto cables, FRLS wires and cables, coaxial cables, LAN cables, etc) using unique technology, which later became the industry standard. To diversify its revenue streams and become a complete electrical products company, it forayed into FMEG products such as switches, switchgears, MCBs, LED lights, fans and water heaters, and plans to add more products in the coming years. FNXC has 12 plants at five manufacturing locations (Roorkee, Urse, Pimpri, Verna and Ponda).
Exhibit 32: Revenue mix (FY21) Exhibit 33: Product-wise manufacturing plant locations
83%
12%
4% 1%
Electrical W&C
Communication cables
FMEG
Others
Source: Company Source: Company
Technical tie-ups and backward integration
Over the years, FNXC has joined hands with globally renowned companies such as NSW, Germany (for winding wire), Essex, USA (telephone cables and copper rods), GE, USA (compounds), AT&T, USA (fibre-optic cables), Sumitomo, Japan (EHV power cables) and Corning, USA (fibre) to access world-class technology and stay ahead of the curve. Some of these partnerships still exist. The company also enjoys a competitive cost structure due to backward integration in electrical cables (CCC rods and PVC compounds) and communications cables (optical fibre and fibre rods). FNXC is the only leading W&C player integrated backward till manufacturing copper rods.
Promoters and key managerial personnel
▪ Deepak Chhabria, CMD, is a B.Sc. in Engineering Management from the University of Evansville, Indiana, USA. He was instrumental in setting up nine manufacturing plants at four places in India. Under his stewardship, the company has achieved a leading position in all segments in which it operates.
▪ Mahesh Viswanathan, CFO, has been with the company since 2008. He is currently responsible for all key matters at the company. Before joining FNXC, he
was at the Philips Group with Senior Director, Finance as his last role there.
Exhibit 34: Shareholding pattern and key shareholders
Equity stake (%) Key institutional holders % equity
Sep-21 Dec-21 Mar-22 Mar-22
Promoters 35.9 35.9 35.9 DSP MF 3.6
Free float 64.1 64.1 64.1 Templeton MF 3.5
- Foreign Institutions 9.1 9.4 9.4 Nippon MF 3.2
- Domestic Institutions 16.2 16.5 15.7 L&T MF 2.2
- Public 38.8 38.2 39.0 LGOF Fund 1.9
Source: BSE, Bloomberg
Location Products manufactured
Roorkee, Uttarakhand Electrical wires, switches, switchgears
Urse, Pune, Maharashtra Electrical wires & cables, communication cables, optic fibre & cables, and lighting
Pimpri, Pune, Maharashtra Electrical cables
Verna, Goa Electrical cables, communication cables, optic fibre & cables, and conduit pipes
Ponda, Goa CCC rods

29 April 2022
82 Systematix Research is also available on Bloomberg SSSL <Go>, Thomson & Reuters Systematix Shares and Stocks (India) Limited
Finolex Cables
Annual Report Analysis (FY17 to FY21)
Exhibit 35: Annual Report Analysis
Year Demand scenario and outlook Plans/ Initiatives
FY17
• Healthy volume growth but a low ~4% value growth due to soft commodity prices; margins under pressure on low spread of cathode and rods
• W&C industry’s long-term outlook remains positive
• Rollout of GST expected to drive market share gains for organized players given narrowing of price gap
• Government programmes to improve connectivity augur well for communication cables segment
• Ventured into fans, switchgears and water heaters; delay in obtaining product certifications impacted Switchgears project
• Commenced work on the “Conduit Pipe” plant with expected completion by Dec-18
• Acquisition of ~40 acres land near Vadodara for expansions
• injected Rs 196mn in Finolex J-Power JV to take total equity infusion to Rs 1.2bn
FY18
• Revenues grew 9% YoY; volumes in electricals up 5% and in communication cables up 35%
• GST implementation and demonetization posed short-term challenges due to slowdown in trade
• Improving industry outlook on policy push for increasing power availability and accessibility
• Higher demand seen for copper-based electrical and communications cables with growing thrust on high-efficiency products such as motors and transformers
• Additional efforts towards expanding distribution reach and streamlining the team at market level to expand FMEG business
• Established an extensive network of service centers for fans, switchgears and water heaters
• Launched its own e-commerce site
• Principal sponsor of the ‘Kings XI’ team at the India Premier League (IPL)
FY19
• Revenues grew 6% YoY driven by 7% growth in wires business
• Floods in Kerala impacted business operations
• Wires affected due to subdued real estate market
• National Digital Communications Policy (NDCP), 2018 a key driver for growth of communication cables
• Copper cables expected to gain considerable traction, driven by the growing impetus on high-efficiency products such as motors and transformers
• Committed Rs 2bn capex over the next 18 months for enhancing manufacturing capabilities at Urse, Pune for products used by solar power and automotive industries
• Increasing certain value additions which were outsourced earlier and further expansion of the optic fiber line
• To enhance retail touch points from the existing 30,000
• Launched an exclusive retail store 'Finolex House' with a target to set up 50 more during FY20
• Infused Rs 189mn equity in J-Power JV taking, total equity participation up to Rs 1.53bn
FY20
• Revenues declined 7% YoY due to distress among banks and NBFCs, struggling real estate markets, prolonged monsoons and outbreak of COVID in India March 2020
• Key product segments under pressure (electricals down 5.3%, communication down 16.4%) excluding FMEG (up 24%)
• Robust industry outlook seen driven by massive infrastructure spending and urban development schemes
• GST implementation, preference for reputed brands, technology and quality driving a shift in favour of organized players
• Capex plans announced earlier of Rs 2bn to be completed over the subsequent 12-15 months, subject to more activities opening up post lockdown easing
• Opened four more Finolex House stores in Secunderabad, Jamshedpur, Bengaluru and Raipur
• Infused Rs 434mn in Finolex J-Power JV, taking the total participation up to Rs 1.96bn
FY21
• Revenues declined 4% YoY; significant drop in volumes offset by higher realization on increasing RM prices
• Exports grew by 20.2% YoY
• Government initiatives like Digital India, Smart Cities, metro rails, rollout of 5G services, etc require densification of transmission network; to provide boost to demand for cables
• Domestic demand for branded FMEG products likely to remain robust due to urbanization, rural electrification programmes of the government, etc
• As part of the Rs 2bn capex plan, commissioned a conduit plant at Goa; construction of electron beam-cured cables plant faced delays due to the pandemic and international travel restrictions on experts; planning to set up a new line to make tinned copper and foray into instrumentation cables
• Launched a new range of decorative fans and lighting products to strengthen the FMEG portfolio
• Infused Rs 245mn in Finolex J-Power JV, taking the total investment up to Rs 2.2bn so far
Source: Company, Systematix Institutional Research

29 April 2022
83 Systematix Research is also available on Bloomberg SSSL <Go>, Thomson & Reuters Systematix Shares and Stocks (India) Limited
Finolex Cables
FINANCIALS (CONSOLIDATED)
Profit & Loss Statement
YE: Mar (Rs mn) FY20 FY21 FY22E FY23E FY24E
Net revenues 28,773 27,681 36,518 41,860 47,306
Growth (%) (6.5) (3.8) 31.9 14.6 13.0
Raw material expenses 20,834 20,514 28,405 32,142 36,182
Gross Margin (%) 27.6 25.9 22.2 23.2 23.5
Employee & Other exp. 4,105 3,465 3,744 4,306 4,879
EBITDA 3,834 3,702 4,368 5,411 6,244
EBITDA margins (%) 13.3 13.4 12.0 12.9 13.2
Depreciation 389 390 399 437 467
Other income 915 770 615 661 709
Finance costs 16 8 6 6 6
PBT 4,345 4,075 4,577 5,630 6,480
Effective tax rate (%) 27.9 41.6 40.1 37.4 35.8
Associates/(Minorities) 776 2,234 2,102 1,948 1,999
Net Income 3,910 4,615 4,843 5,475 6,161
Adjusted net income 3,910 4,615 4,843 5,475 6,161
Shares outstanding 153 153 153 153 153
FDEPS (Rs per share) 25.6 30.2 31.7 35.8 40.3
FDEPS growth (%) (4.0) 18.0 4.9 13.1 12.5
Source: Company, Systematix Institutional Research
Balance Sheet
YE: Mar (Rs mn) FY20 FY21 FY22E FY23E FY24E
Share capital 306 306 306 306 306
Net worth 30,037 34,145 38,146 42,703 47,947
Total debt 3 3 4 5 6
Minority interest - - - - -
DT Liability/ (Asset) 1,460 2,042 1,992 1,942 1,892
Capital Employed 31,500 36,190 40,143 44,650 49,845
Net tangible assets 3,861 3,942 5,043 5,606 6,140
Net Intangible assets 5 2 2 2 2
Goodwill - - - - -
CWIP 273 257 241 226 210
Investments (Strategic) 6,089 8,453 8,653 8,853 9,053
Investments (Financial) 5,120 7,259 7,259 7,259 7,259
Current Assets 9,382 18,407 20,772 22,781 24,822
Cash 9,339 537 1,435 3,559 6,374
Current Liabilities 2,568 2,666 3,262 3,634 4,014
Working capital 6,814 15,741 17,510 19,146 20,808
Capital Deployed 31,500 36,190 40,143 44,650 49,845
Contingent Liabilities 2,547 2,415 - - -
Source: Company, Systematix Institutional Research
Cash Flow
YE: Mar (Rs mn) FY20 FY21 FY22E FY23E FY24E
EBIT (incl. other income) 3,802 3,484 5,333 6,185 7,039
Non-cash items 389 390 399 437 467
OCF before WC changes 4,191 3,873 5,732 6,621 7,506
Incr./(decr.) in WC 510 1,526 1,470 1,336 1,362
Others including taxes 593 1,204 1,449 1,715 1,930
Operating cash-flow 3,088 1,144 2,814 3,570 4,214
Capex 323 453 1,484 984 984
Free cash-flow 2,765 691 1,329 2,586 3,230
Acquisitions - - - - -
Dividend 826 841 841 918 918
Equity raised - - - - -
Debt raised (24) (0) 1 1 1
Fin Investments (6,597) 4,502 200 200 200
Misc. Items (CFI + CFF) 416 3,661 (608) (655) (702)
Net cash-flow 8,096 (8,314) 897 2,124 2,815
Source: Company, Systematix Institutional Research
Ratios
YE: Mar FY20 FY21 FY22E FY23E FY24E
P/E (x) 15.8 13.4 12.8 11.3 10.1
EV/EBITDA (x) 12.4 14.6 12.2 9.4 7.7
EV/sales (x) 1.7 2.0 1.5 1.2 1.0
P/B (x) 2.1 1.8 1.6 1.5 1.3
RoE (%) 13.0 13.5 12.7 12.8 12.9
RoCE (%) 14.5 12.1 12.0 13.3 13.7
ROIC (%) 19.4 18.4 15.1 15.7 16.6
DPS (Rs per share) 5.5 5.5 5.5 6.0 6.0
Dividend yield (%) 1.4 1.4 1.4 1.5 1.5
Dividend payout (%) 21.5 18.2 17.4 16.8 14.9
Net debt/equity (x) (0.5) (0.2) (0.2) (0.3) (0.3)
Receivables (days) 24 23 23 23 23
Inventory (days) 75 100 90 90 90
Payables (days) 20 23 23 23 23
CFO:PAT% 79 25 58 65 68
Source: Company, Systematix Institutional Research

Systematix Research is also available on Bloomberg SSSL <Go>, Thomson & Reuters Systematix Shares and Stocks (India) Limited
Investors are advised to refer disclosures made at the end of the research report.
84
Crompton Greaves Consumer
Segment leader with strong operating metrics
Crompton Greaves Consumer (CROMPTON), leader in the fans and residential pumps segments, maintains a keen focus on innovation, brand-building and reach. While this helps the company further consolidate its position in core segments, product portfolio expansion enables it to capture market share in newer categories (geysers a case in point, where it has become the third largest player in 4-5 years). While the recently acquired Butterfly business will bring scale in kitchen appliances, it may not be earnings-accretive for the next two years. We are positive on CROMPTON’s prospects given its strong brand equity, product innovation skills and ample scope for portfolio/ network expansion. Its entry in other appliance categories should also allay investor concerns on product concentration. Excluding Butterfly business, we expect 13% CAGR each in revenue and PAT over FY21-24E with ~26% RoE by FY24E. Given the significant re-rating in the last two years, we initiate coverage on CROMPTON with a HOLD rating and price target of Rs 428 (13% upside from CMP), based on 35x FY24E earnings (in line with peers). Integration of
Butterfly business is the key monitorable in the near to medium term.
Premiumization in fans; improved outlook for B2C lighting: Premium fans and appliances (geysers, mixer grinders, coolers and irons) continue to drive growth in CROMPTON’s electric consumer durables (ECD) business. After years of weak growth/ margins, outlook for the B2C LED business has improved structurally on a rebound in demand. However, the B2B/ B2G lighting business has yet to recover from the Covid-19 pandemic hit. We expect ~12% revenue CAGR each in
CROMPTON’s ECD and lighting segments over FY21-24E.
Portfolio and network expansion driving growth: CROMPTON has consistently been gaining market share in its core categories (~27% in fans and ~25% in domestic pumps in FY21). It has taken big strides in the recent forays as well with market share doubling to ~15% in geysers in the last 4-5 years. Also, the recently acquired Butterfly business will grow its kitchen appliances business, though it may not be earnings-accretive for the next two years. CROMPTON’s focus on product innovation, portfolio expansion (including inorganic initiatives), premiumization, network expansion (rural
and weaker regions) and digitization, we believe, will keep the momentum going.
Five-dimensional growth strategy to help retain the lead: CROMPTON’s consumer-centric five-dimensional growth strategy has helped it retain leadership status in fans, domestic pumps and B2C lighting in a highly competitive environment. Product innovation, brand-building and channel expansion have been the key factors driving its continued success. The strategy has been designed to deliver higher-than-industry revenue growth, profits in line with revenues and conversion of profits into cash.
Strong operating performance; integration of Butterfly the key monitorable: A strong distribution reach and lean cost structure have helped CROMPTON gain market share in key categories and maintain a superior margin profile. Over FY21-24E, we estimate 13% revenue CAGR, 12% EBITDA CAGR and 13% PAT CAGR for the company (vs 6%/ 11%/ 18% respectively over FY18-21) with ~15% EBITDA margin, ~26% RoE and strong FCF. We are positive on CROMPTON in view of its strong brand, scope for product/ reach expansion and healthy return ratios and FCFs. However, given the significant re-rating in the last two years, we initiate coverage on the stock with a HOLD rating and price target of Rs 428, based on 35x FY24E earnings. Integration of Butterfly business is the key monitorable in the near to medium term.
Systematix Institutional Equities
29 April 2022
INITIATING COVERAGE
Sector: Consumer Electricals Rating: HOLD
CMP: Rs 380 Target Price: Rs 428
Stock Info
Sensex/Nifty 57,521/17,244
Bloomberg CROMPTON IN
Equity shares (mn) 627.7
52-wk High/Low 492/355
Face value Rs 2
M-Cap Rs 239 bn/ USD 3.2bn
3-m avg turnover USD 13.4mn
Financial Snapshot (Rs mn) Y/E Mar FY22E FY23E FY24E
Net sales 54,584 61,120 68,442
EBITDA 7,728 8,742 9,991
OPM % 14.2 14.3 14.6
PAT (adj.) 5,725 6,713 7,682
EPS (Rs) 9.1 10.7 12.2
PE (x) 41.7 35.5 31.0
P/B (x) 10.8 9.4 8.1
EV/EBITDA (x) 29.3 25.6 22.0
RoE (%) 25.9 26.4 26.2
RoCE (%) 35.3 37.0 37.3
Net-D/E (x) (0.6) (0.6) (0.6)
Shareholding Pattern (%) Mar’22 Dec'21 Sep'21
Promoter 5.9 6.0 6.0
- Pledged - - -
FII 38.0 40.2 41.5
DII 44.4 43.2 42.3
Others 11.7 10.7 10.2
Stock Performance (1-year)
300
350
400
450
500
Ap
r-2
1
May
-21
Jun
-21
Jul-
21
Au
g-2
1
Sep
-21
Oct
-21
No
v-2
1
Dec
-21
Jan
-22
Feb
-22
Mar
-22
Ap
r-2
2
CROMPTON Sensex
Ashish Poddar [email protected] +91 22 6704 8039
Pranay Shah [email protected] +91 22 6704 8017

29 April 2022
85 Systematix Research is also available on Bloomberg SSSL <Go>, Thomson & Reuters Systematix Shares and Stocks (India) Limited
Crompton Greaves Consumer
Story in charts
Exhibit 1: Revenue growth trend Exhibit 2: Gross and EBITDA margin trend
0
10
20
30
40
50
60
70
80
FY18 FY19 FY20 FY21 FY22E FY23E FY24E
(Rs bn)
Revenue
0
5
10
15
20
25
30
35
FY18 FY19 FY20 FY21 FY22E FY23E FY24E
(%)
Gross margin EBITDA margin
Source: Company, Systematix Institutional Research Source: Company, Systematix Institutional Research
Exhibit 3: ECD – revenue and EBIT margin trend Exhibit 4: Lighting – revenue and EBIT margin trend
18.4
18.6
18.8
19
19.2
19.4
19.6
19.8
20
0
10
20
30
40
50
60
FY18 FY19 FY20 FY21 FY22E FY23E FY24E
(%)(Rs bn)
Revenue EBIT % (RHS)
0
2
4
6
8
10
12
14
16
0
2
4
6
8
10
12
14
16
FY18 FY19 FY20 FY21 FY22E FY23E FY24E
(%)(Rs bn)
Revenue EBIT % (RHS)
Source: Company, Systematix Institutional Research Source: Company, Systematix Institutional Research
Exhibit 5: RoE and RoCE trend Exhibit 6: OCF, Capex and FCF trend
0
5
10
15
20
25
30
35
40
45
50
FY18 FY19 FY20 FY21 FY22E FY23E FY24E
(%)
RoE % RoCE %
0
1
2
3
4
5
6
7
8
9
OCF Capex FCF
(Rs bn)
FY19 FY20 FY21 FY22E FY23E FY24E
Source: Company, Systematix Institutional Research Source: Company, Systematix Institutional Research
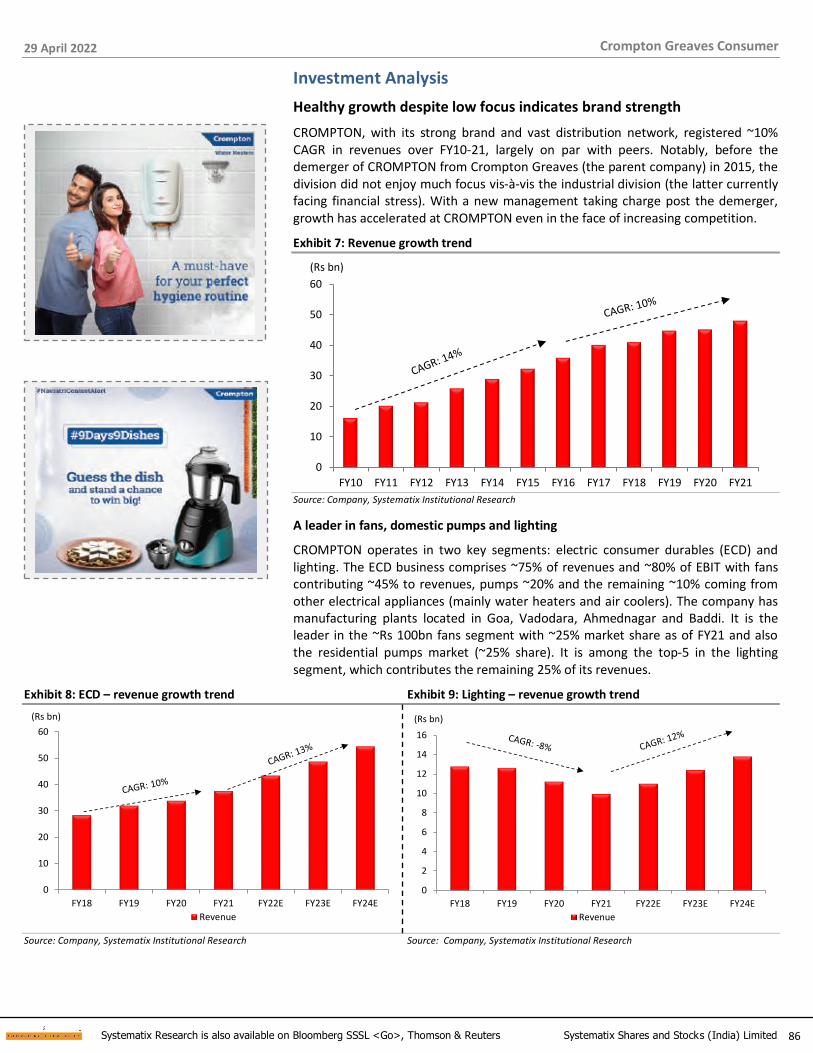
29 April 2022
86 Systematix Research is also available on Bloomberg SSSL <Go>, Thomson & Reuters Systematix Shares and Stocks (India) Limited
Crompton Greaves Consumer
Investment Analysis
Healthy growth despite low focus indicates brand strength
CROMPTON, with its strong brand and vast distribution network, registered ~10% CAGR in revenues over FY10-21, largely on par with peers. Notably, before the demerger of CROMPTON from Crompton Greaves (the parent company) in 2015, the division did not enjoy much focus vis-à-vis the industrial division (the latter currently facing financial stress). With a new management taking charge post the demerger, growth has accelerated at CROMPTON even in the face of increasing competition.
Exhibit 7: Revenue growth trend
0
10
20
30
40
50
60
FY10 FY11 FY12 FY13 FY14 FY15 FY16 FY17 FY18 FY19 FY20 FY21
(Rs bn)
Source: Company, Systematix Institutional Research
A leader in fans, domestic pumps and lighting
CROMPTON operates in two key segments: electric consumer durables (ECD) and lighting. The ECD business comprises ~75% of revenues and ~80% of EBIT with fans contributing ~45% to revenues, pumps ~20% and the remaining ~10% coming from other electrical appliances (mainly water heaters and air coolers). The company has manufacturing plants located in Goa, Vadodara, Ahmednagar and Baddi. It is the leader in the ~Rs 100bn fans segment with ~25% market share as of FY21 and also the residential pumps market (~25% share). It is among the top-5 in the lighting segment, which contributes the remaining 25% of its revenues.
Exhibit 8: ECD – revenue growth trend Exhibit 9: Lighting – revenue growth trend
0
10
20
30
40
50
60
FY18 FY19 FY20 FY21 FY22E FY23E FY24E
(Rs bn)
Revenue
0
2
4
6
8
10
12
14
16
FY18 FY19 FY20 FY21 FY22E FY23E FY24E
(Rs bn)
Revenue
Source: Company, Systematix Institutional Research Source: Company, Systematix Institutional Research

29 April 2022
87 Systematix Research is also available on Bloomberg SSSL <Go>, Thomson & Reuters Systematix Shares and Stocks (India) Limited
Crompton Greaves Consumer
Exhibit 10: A large addressable market
Product category Est. industry size (Rs bn)
Est. CAGR (FY21-26; %)
Key players
Existing
Lighting & fixtures 227 10 Philips, Surya, Crompton, Bajaj Electricals, Havells
Pumps 110 10 CRI, Crompton, Kirloskar, Texmo
Fans 99 6 Crompton, Usha, Havells, Orient, Bajaj Electricals, V-Guard
Air coolers 50 10 Symphony, Kenstar, Bajaj Electricals, Havells, Blue Star, Crompton, Voltas, Orient, Cello, V-Guard
Mixer grinders 35 10 TTK Prestige, Preethi, Bajaj Electricals, Morphy Richards, Butterfly, Usha, Kenstar, V-Guard, Havells
Water heaters 23 6 Racold, Havells, V-Guard, Bajaj Electricals, Venus, AO Smith, Crompton, Usha, Orient
Total 544 9
Future opportunities
UPS 60 5 Microtek, Luminous, V-Guard, Su-Kam, Exide
Modular switches 25 8 Anchor (Panasonic), Havells, Legrand, Schneider, ABB, Siemens
Chimneys 22 10 Faber, Elica, Sunflame
Stabilizers 14 5 Microtek, Liv-guard, Bluebird, V-Guard
Irons 9 10 Bajaj Electricals, Philips, Orient, Usha, Inalsa, Havells, V-Guard
Rice cookers 6 10 Philips, Panasonic, Prestige, Preethi
Total new opportunities 136 8
Total addressable market 680 9
Source: Company, Industry
Leader in fans: CROMPTON has recorded 10-12% CAGR in fans (in line with peers) over the last 10 years, its largest revenue category at ~45% share. The business has expanded on the back of new launches and strong brands in the economy and mass premium segments (SilentPro, Anti-dust, VSense, AirBuddy, etc) as also strong growth in the premium portfolio (revenue share up to ~20% from ~10% five years ago). Despite high competition from industry leaders (Orient, Usha, Havells, Bajaj, etc), we believe CROMPTON is well-positioned to maintain the growth momentum on the strength of its innovative offerings and wide distribution network.
Exhibit 11: CROMPTON has ~25% market share in fans category Exhibit 12: CROMPTON’s fans display in a retail shop
25%
14%
15%
14%
7%
3%
22%
Crompton
Usha
Havells
Orient
Bajaj
V-Guard
Others
Source: Company, Industry reports, Systematix Institutional Research Source: Company

29 April 2022
88 Systematix Research is also available on Bloomberg SSSL <Go>, Thomson & Reuters Systematix Shares and Stocks (India) Limited
Crompton Greaves Consumer
Dominant market share in residential pumps: CROMPTON is one of the fastest growing pump manufacturers in India, with a dominant ~25% share in the residential segment (~75% of its pump revenues). Including agricultural pumps, it commands ~15% market share, the second highest after CRI Pumps (~24%). The highly successful launch of Mini Crest in December 2017 for domestic use has strengthened CROMPTON’s position in the traditionally difficult western and southern markets otherwise dominated by local/ unorganized manufacturers. It is now developing 4- and 5-star rated energy-efficient pumps and also evaluating the manufacture of solar pumps. The company now plans to increase focus on tier-2 and -3 cities.
Exhibit 13: CROMPTON – a leading player in residential pumps Exhibit 14: Pump advertisement
24%
15%
5%
56%
CRI Pumps
Crompton
V-Guard
Others
Source: Company, Industry reports, Systematix Institutional Research Source: Company
Exhibit 15: A leader in residential pumps
Source: Company
Consumer appliances – a small base currently but huge growth potential: Within this segment, CROMPTON has offerings in the water heater, mixer grinder and air cooler categories. The company has fully revamped this business and introduced new products in the last few years. The estimated ~Rs 700bn electrical appliances segment is highly fragmented and non-regulated, implying that product differentiation and wide availability are key to success. While the category currently contributes ~10% to CROMPTON’s revenues, we believe it can become a sizeable business for the company given its strong brand, focus on innovation, vast distribution network and product portfolio expansion.

29 April 2022
89 Systematix Research is also available on Bloomberg SSSL <Go>, Thomson & Reuters Systematix Shares and Stocks (India) Limited
Crompton Greaves Consumer
Exhibit 16: Expanding the home appliances portfolio
Source: Company
Exhibit 17: ECD – revenue and EBIT margin trend
18.4
18.6
18.8
19
19.2
19.4
19.6
19.8
20
0
10
20
30
40
50
60
FY18 FY19 FY20 FY21 FY22E FY23E FY24E
(%)(Rs bn)
Revenue EBIT % (RHS)
Source: Company, Systematix Institutional Research
A leader in lighting: Last few years have been challenging for the industry, mainly in B2B/ B2G business where CROMPTON has been a leading player, due to rapid technology advances and significant price erosion. Besides extending its geographical reach to smaller cities and towns over the years, its focus on B2C LED through cost optimization and product differentiation has also yielded better growth and
profitability.
Exhibit 18: Lighting – revenue, EBIT margin trend
0
2
4
6
8
10
12
14
16
0
2
4
6
8
10
12
14
16
FY18 FY19 FY20 FY21 FY22E FY23E FY24E
(%)(Rs bn)
Revenue EBIT % (RHS)
Source: Company, Systematix Institutional Research

29 April 2022
90 Systematix Research is also available on Bloomberg SSSL <Go>, Thomson & Reuters Systematix Shares and Stocks (India) Limited
Crompton Greaves Consumer
Exhibit 19: Lighting – a wide range of products for B2B and B2C channels
Source: Company
Focus on product innovation, brand building and channel expansion
CROMPTON strives to improve its product mix by launching premium offerings in the market, based on consumer insights. It also aims to continuously add touchpoints (among the largest networks in the industry) to garner a higher consumer base. Emphasis on product innovation, brand building and channel expansion would help the company consolidate its position in the premium segment. The strategy has already been tested in fans, wherein the new management worked to change the brand’s positioning from being a ‘value for money’ mass brand to premium fans through innovation and higher A&P spends.
Exhibit 20: Higher A&P spends to enhance brand visibility Exhibit 21: A strong network of consumer touchpoints
0
0.5
1
1.5
2
2.5
3
0
200
400
600
800
1,000
1,200
FY16 FY17 FY18 FY19 FY20 FY21
(%)(Rs bn)
A&P spend % revenue (RHS)
0
50,000
1,00,000
1,50,000
2,00,000
2,50,000
BajajElectricals
Havells Orient Electric CromptonConsumer
V-Guard
(Number of retailers)
Source: Company, Systematix Institutional Research Source: Company, Systematix Institutional Research
Product launches: To effectively compete in the market and connect with more customers, CROMPTON has launched innovative products with better technology, and IoT and artificial intelligence-based products. Key launches include SilentPro (2020) and Anti-dust (2017) fans in the premium category and Mini-Crest pumps (2018) in the residential segment. In FY19, it launched VSense, a fan that can run at full speed and provide excellent air delivery even at 115 volts, targeted at markets characterized by voltage fluctuations (Uttar Pradesh, Bihar, Madhya Pradesh, Himachal Pradesh, Odisha and Rajasthan). Another product AirBuddy was introduced for installation in kitchens, aimed at comfort while cooking without affecting the gas flame. Similarly, Anti Bac, an LED bulb aimed at hygiene-conscious customers, was featured as killing germs and providing brightness. CROMPTON has also revamped its TPW range of fans (table, pedestal and wall) with new models and colours.
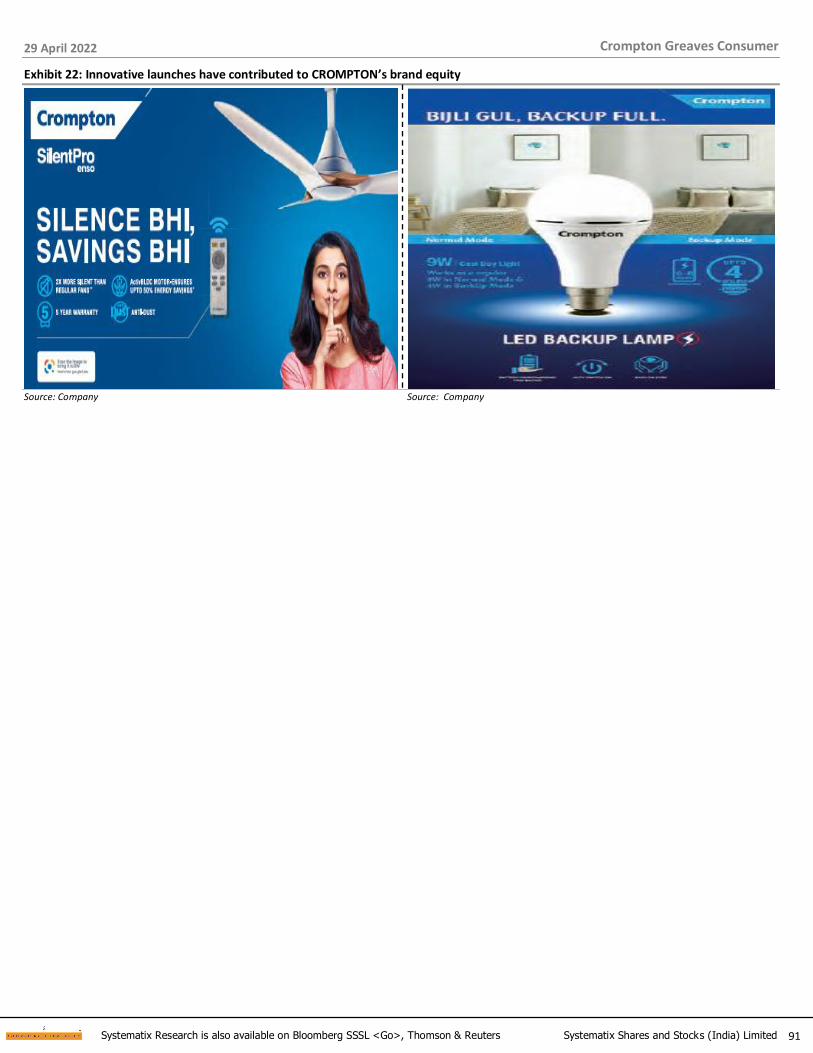
29 April 2022
91 Systematix Research is also available on Bloomberg SSSL <Go>, Thomson & Reuters Systematix Shares and Stocks (India) Limited
Crompton Greaves Consumer
Exhibit 22: Innovative launches have contributed to CROMPTON’s brand equity
Source: Company Source: Company

29 April 2022
92 Systematix Research is also available on Bloomberg SSSL <Go>, Thomson & Reuters Systematix Shares and Stocks (India) Limited
Crompton Greaves Consumer
The best operating metrics despite high level of outsourcing Within the ECD space, CROMPTON enjoys the best margins among peers, supported by its strong brand, scale benefits and efficient sourcing. A high degree of outsourcing (~45% of ECD revenues), industry-high margins, a lean working capital cycle and judicious capex policy have helped the company record the best return ratios in the industry as also healthy FCF.
Exhibit 23: CROMPTON has the highest EBIT margins among peers Exhibit 24: CROMPTON’s EBIT margin trend
20
.5
18
.8
10
.3
8.9
5.5
3.7
5.5
20
.0
18
.0
10
.5
8.0
7.0
6.0
5.0
0
5
10
15
20
25
CR
OM
PTO
N
HA
VL
BJE
OR
IEN
TEL
PO
LYC
AB
FNX
C
VG
RD
(%)
FY21 FY24E
12
13
13
14
14
15
15
16
FY18 FY19 FY20 FY21 FY22E FY23E FY24E
(%)
EBITDA margin
Source: Company, Systematix Institutional Research Source: Company, Systematix Institutional Research
Exhibit 25: Low net WC and judicious capex result in healthy FCF Exhibit 26: Most of CROMPTON’s profits convert into cash (FCF/ EBITDA)
0
1
2
3
4
5
6
7
8
9
OCF Capex FCF
(Rs bn)
FY19 FY20 FY21 FY22E FY23E FY24E
0
20
40
60
80
100
120
140
160
180
200
Orient Electric Crompton V-Guard Havells
(%)
FY19 FY20 FY21
Source: Company, Systematix Institutional Research Source: Company, Systematix Institutional Research
Exhibit 27: Lowest net WC cycle Exhibit 28: Highest RoE among peers
11 20
55 73
155
90 100
120
19 30
42 50 55
79 90 90
0
20
40
60
80
100
120
140
160
180
CR
OM
PTO
N
OR
IEN
TEL
HA
VL
VG
RD
BJE
PO
LYC
AB
FNX
C
KEI
I
(Days)
FY21 FY24E
32
26
20
12
1815 17
14
2625
2220 18 18 17
13
0
5
10
15
20
25
30
35
CR
OM
PTO
N
OR
IEN
TEL
HA
VL
BJE
PO
LYC
AB
KEI
I
VG
RD
FNX
C
(%)
FY21 FY24E
Source: Company, Systematix Institutional Research Source: Company, Systematix Institutional Research
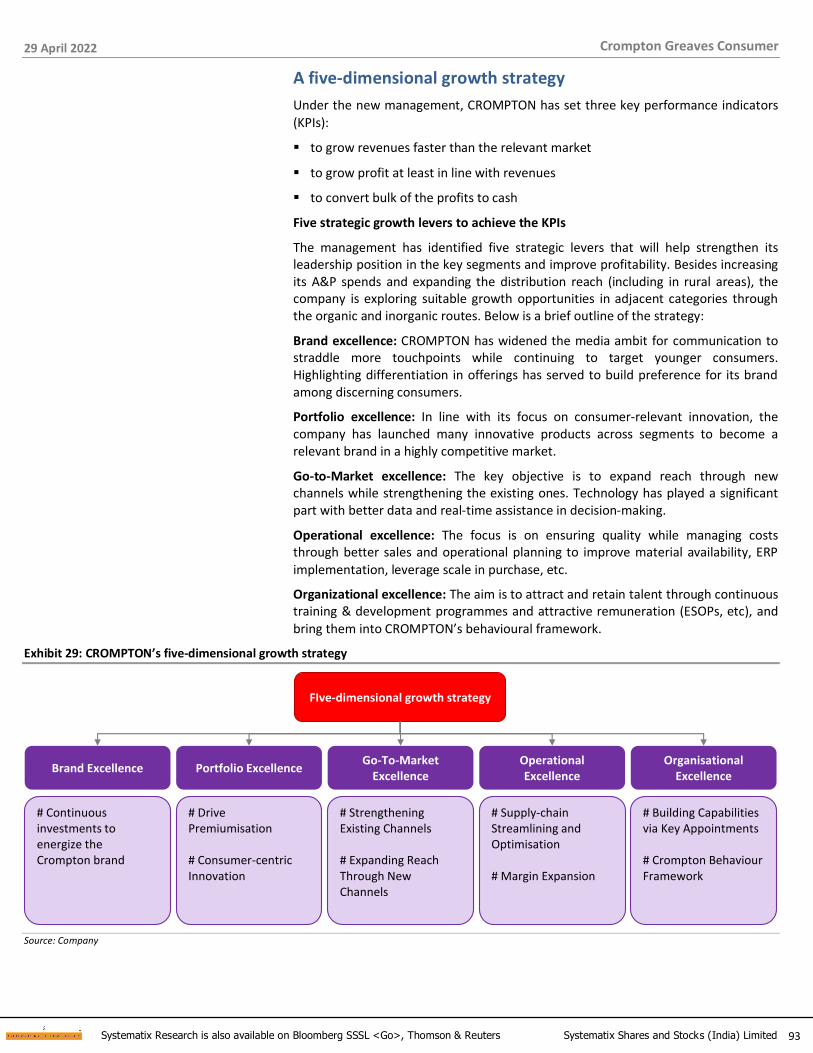
29 April 2022
93 Systematix Research is also available on Bloomberg SSSL <Go>, Thomson & Reuters Systematix Shares and Stocks (India) Limited
Crompton Greaves Consumer
A five-dimensional growth strategy
Under the new management, CROMPTON has set three key performance indicators
(KPIs):
▪ to grow revenues faster than the relevant market
▪ to grow profit at least in line with revenues
▪ to convert bulk of the profits to cash
Five strategic growth levers to achieve the KPIs
The management has identified five strategic levers that will help strengthen its leadership position in the key segments and improve profitability. Besides increasing its A&P spends and expanding the distribution reach (including in rural areas), the company is exploring suitable growth opportunities in adjacent categories through the organic and inorganic routes. Below is a brief outline of the strategy:
Brand excellence: CROMPTON has widened the media ambit for communication to straddle more touchpoints while continuing to target younger consumers. Highlighting differentiation in offerings has served to build preference for its brand among discerning consumers.
Portfolio excellence: In line with its focus on consumer-relevant innovation, the company has launched many innovative products across segments to become a relevant brand in a highly competitive market.
Go-to-Market excellence: The key objective is to expand reach through new channels while strengthening the existing ones. Technology has played a significant part with better data and real-time assistance in decision-making.
Operational excellence: The focus is on ensuring quality while managing costs through better sales and operational planning to improve material availability, ERP
implementation, leverage scale in purchase, etc.
Organizational excellence: The aim is to attract and retain talent through continuous training & development programmes and attractive remuneration (ESOPs, etc), and bring them into CROMPTON’s behavioural framework.
Exhibit 29: CROMPTON’s five-dimensional growth strategy
FIve-dimensional growth strategy
Brand Excellence Portfolio ExcellenceGo-To-Market
ExcellenceOperational Excellence
Organisational Excellence
# Continuous investments to energize the Crompton brand
# Drive Premiumisation
# Consumer-centricInnovation
# Strengthening Existing Channels
# Expanding Reach Through New Channels
# Supply-chain Streamlining and Optimisation
# Margin Expansion
# Building Capabilities via Key Appointments
# Crompton Behaviour Framework
Source: Company

29 April 2022
94 Systematix Research is also available on Bloomberg SSSL <Go>, Thomson & Reuters Systematix Shares and Stocks (India) Limited
Crompton Greaves Consumer
Contours of the Go-To-Market strategy for reach expansion
To ensure that the right products are available at right stores at right prices, CROMPTON adopted a Go-To-Market (GTM) strategy in 2015 focused on: a) uniform pricing across channels to remove channel conflict, and b) improving availability of products by increasing direct and indirect reach across the country. Channel partner engagement was at the core of this strategy.
One key channel identified was online sales, where CROMPTON was absent so far. The company has been gradually driving installation of digital technologies and databases with coverage of large distributors first and helping inventory management at the corporate and channel levels. The network database is helping track secondary sales, thereby improving wallet share of distributors at retail
counters.
The GTM strategy has picked up momentum in the last two years. According to the management, regions with GTM implementation (most of West and North) have witnessed higher growth than other markets. While the company is reducing its dependence on the wholesale channel through a distribution-channel expansion, wholesale will remain important – as is the industry practice.
Exhibit 30: Go-To-Market strategy
The GTM strategyFull control over the channel to improve efficiency
Strengthen existingchannel network with focus beyond Tier I &
Tier II cities
Focus on new channels of distribution (modern
retail, e-commerce)
Expand reach in rural areas for agriculture
pumps and other products
Have full control on retailers with the use of network databses
Source: Company
Exhibit 31: Display and product awareness activities
Source: Company
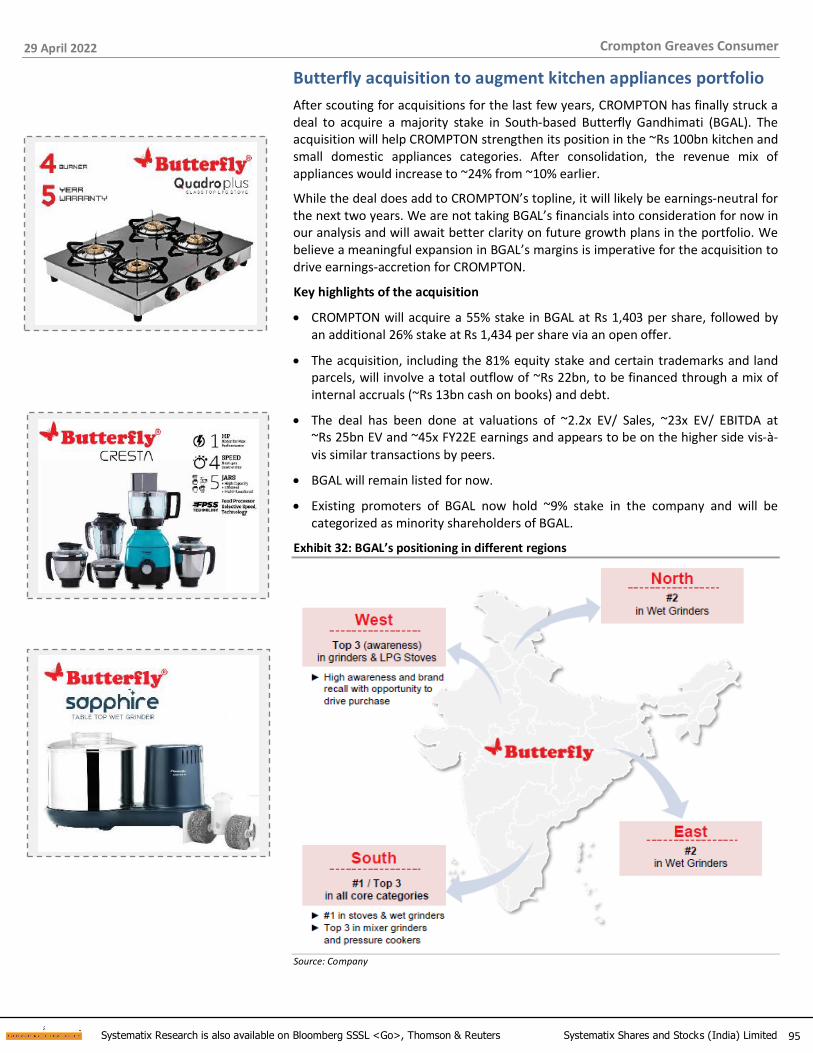
29 April 2022
95 Systematix Research is also available on Bloomberg SSSL <Go>, Thomson & Reuters Systematix Shares and Stocks (India) Limited
Crompton Greaves Consumer
Butterfly acquisition to augment kitchen appliances portfolio
After scouting for acquisitions for the last few years, CROMPTON has finally struck a deal to acquire a majority stake in South-based Butterfly Gandhimati (BGAL). The acquisition will help CROMPTON strengthen its position in the ~Rs 100bn kitchen and small domestic appliances categories. After consolidation, the revenue mix of appliances would increase to ~24% from ~10% earlier.
While the deal does add to CROMPTON’s topline, it will likely be earnings-neutral for the next two years. We are not taking BGAL’s financials into consideration for now in our analysis and will await better clarity on future growth plans in the portfolio. We believe a meaningful expansion in BGAL’s margins is imperative for the acquisition to drive earnings-accretion for CROMPTON.
Key highlights of the acquisition
• CROMPTON will acquire a 55% stake in BGAL at Rs 1,403 per share, followed by an additional 26% stake at Rs 1,434 per share via an open offer.
• The acquisition, including the 81% equity stake and certain trademarks and land parcels, will involve a total outflow of ~Rs 22bn, to be financed through a mix of internal accruals (~Rs 13bn cash on books) and debt.
• The deal has been done at valuations of ~2.2x EV/ Sales, ~23x EV/ EBITDA at ~Rs 25bn EV and ~45x FY22E earnings and appears to be on the higher side vis-à-vis similar transactions by peers.
• BGAL will remain listed for now.
• Existing promoters of BGAL now hold ~9% stake in the company and will be categorized as minority shareholders of BGAL.
Exhibit 32: BGAL’s positioning in different regions
Source: Company

29 April 2022
96 Systematix Research is also available on Bloomberg SSSL <Go>, Thomson & Reuters Systematix Shares and Stocks (India) Limited
Crompton Greaves Consumer
BGAL’s product profile and synergy benefits
• BGAL generates 80% of its revenues from mixer grinder, wet grinder, pressure cooker and LPG stove categories.
• With strong R&D capabilities, it manufactures 80% of products in-house.
• CROMPTON will retain the Butterfly brand.
• It has identified growth and cost optimization areas for BGAL and aims to achieve double-digit growth with margin expansion over the next few years.
• CROMPTON will help BGAL expand the business in non-South markets while maintaining leadership position in the South.
Exhibit 33: BGAL’s category-wise product portfolio
Product divisions Key product categories
Kitchen Appliances LPG Stoves, Mixer Grinder, Electric Rice Cooker, Juicer Mixer Grinder, Wet Grinder, Chimney, Induction Cooktop, Built-in Hobs
Cookers & Cookware Pressure Cookers, Non-stick cookware
Others Hand Blender, Hand Mixer, Pop-up Toaster, Sandwich Maker, Flasks, Electric Kettles, Tower Fan, Cooler, Manual Chopper
Source: Company
Exhibit 34: Proforma financials of the consolidated entity (CROMPTON + BGAL)
(Rs mn) CROMPTON Butterfly CROMPTON + Butterfly (proforma) FY21 FY22E FY23E FY24E FY21 FY22E FY23E FY24E FY21 FY22E FY23E FY24E
Net sales 48,035 54,584 61,120 68,442 8,696 10,435 12,000 13,801 48,035 54,584 73,121 82,242
YoY % 6.3 13.6 12.0 12.0 20.0 15.0 15.0 13.6 34.0 12.5 ECD 37,571 43,447 48,660 54,500 8,696 10,435 12,000 13,801 37,571 43,447 60,661 68,300
YoY % 11 16 12 12
Lighting 10,464 11,137 12,460 13,942 - - - - 10,464 11,137 12,460 13,942
YoY % (7) 6 12 12
RM costs 32,672 37,381 41,737 46,738 5,061 6,522 7,440 8,487 32,672 37,381 49,177 55,225
% net sales 68.0 68.5 68.3 68.3 58.2 62.5 62.0 61.5 68.0 68.5 67.3 67.1
Gross profit 15,363 17,202 19,383 21,704 3,635 3,913 4,560 5,313 15,363 17,202 23,944 27,017
Gross margin % 32.0 31.5 31.7 31.7 41.8 37.5 38.0 38.5 32.0 31.5 32.7 32.9 Employee 3,366 3,744 4,193 4,696 770 981 1,116 1,270 3,366 3,744 5,309 5,966
% net sales 7.0 6.9 6.9 6.9 8.9 9.4 9.3 9.2 7.0 6.9 7.3 7.3
Other expenses 4,792 5,731 6,449 7,017 2,068 2,160 2,424 2,719 4,792 5,731 8,873 9,736
% net sales 10.0 10.5 10.6 10.3 23.8 20.7 20.2 19.7 10.0 10.5 12.1 11.8
EBITDA 7,205 7,728 8,742 9,991 797 772 1,020 1,325 7,205 7,728 9,762 11,316
EBITDA margin % 15.0 14.2 14.3 14.6 9.2 7.4 8.5 9.6 15.0 14.2 13.4 13.8
Depreciation 297 381 349 422 156 167 180 193 297 381 529 615 % net sales 0.6 0.7 0.6 0.6 1.8 1.6 1.5 1.4 0.6 0.7 0.7 0.7
EBIT 6,908 7,347 8,393 9,569 641 605 840 1,132 6,908 7,347 9,233 10,700
% net sales 14.4 13.5 13.7 14.0 7.4 5.8 7.0 8.2 14.4 13.5 12.6 13.0
Other income 758 648 904 984 16 16 18 21 758 648 - 160
% net sales 1.6 1.2 1.5 1.4 0.2 0.2 0.2 0.2
Finance costs 429 318 296 251 174 136 108 97 429 318 420 70
% net sales 0.9 0.6 0.5 0.4 2.0 1.3 0.9 0.7
PBT 7,236 7,677 9,002 10,302 483 485 750 1,056 7,236 7,677 8,813 10,790
% net sales 15.1 14.1 14.7 15.1 5.6 4.7 6.3 7.7 15.1 14.1 12.1 13.1
Tax 1,070 1,952 2,289 2,619 122 170 225 317 1,070 1,952 2,247 2,752
% ETR 14.8 25.4 25.4 25.4 25.3 35.0 30.0 30.0 14.8 25.4 25.5 25.5
Reported PAT 6,167 5,725 6,713 7,682 361 315 525 739 6,167 5,725 6,566 8,039
% net sales 12.8 10.5 11.0 11.2 4.2 3.0 4.4 5.4 12.8 10.5 9.0 9.8
Minority interest - - - - - - - - - - 100 140 PAT after MI 6,167 5,725 6,713 7,682 361 315 525 739 6,167 5,725 6,466 7,898
Shares O/s (mn) 628 628 628 628 18 18 18 18 628 628 628 628
EPS (Rs) 9.8 9.1 10.7 12.2 20.2 17.6 29.3 41.3 9.8 9.1 10.3 12.6
Accretion/ (Dilution) - - (4) 3 Source: Company, Systematix Institutional Research
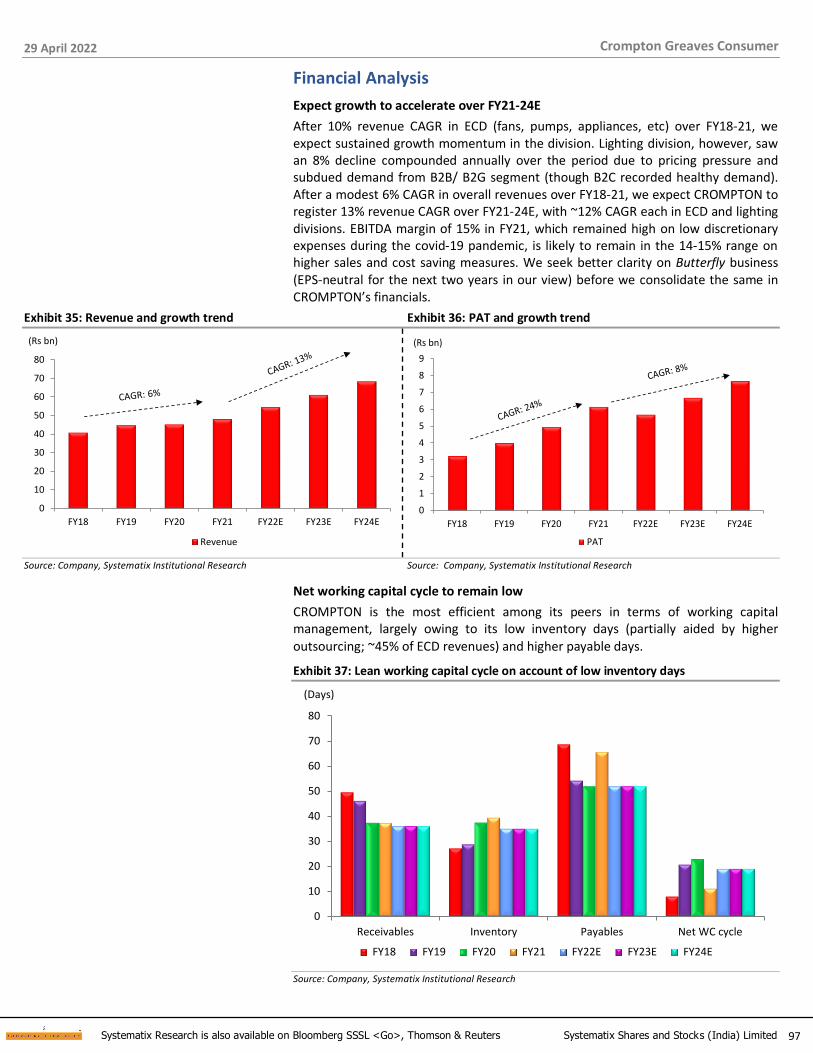
29 April 2022
97 Systematix Research is also available on Bloomberg SSSL <Go>, Thomson & Reuters Systematix Shares and Stocks (India) Limited
Crompton Greaves Consumer
Financial Analysis
Expect growth to accelerate over FY21-24E
After 10% revenue CAGR in ECD (fans, pumps, appliances, etc) over FY18-21, we expect sustained growth momentum in the division. Lighting division, however, saw an 8% decline compounded annually over the period due to pricing pressure and subdued demand from B2B/ B2G segment (though B2C recorded healthy demand). After a modest 6% CAGR in overall revenues over FY18-21, we expect CROMPTON to register 13% revenue CAGR over FY21-24E, with ~12% CAGR each in ECD and lighting divisions. EBITDA margin of 15% in FY21, which remained high on low discretionary expenses during the covid-19 pandemic, is likely to remain in the 14-15% range on higher sales and cost saving measures. We seek better clarity on Butterfly business (EPS-neutral for the next two years in our view) before we consolidate the same in CROMPTON’s financials.
Exhibit 35: Revenue and growth trend Exhibit 36: PAT and growth trend
0
10
20
30
40
50
60
70
80
FY18 FY19 FY20 FY21 FY22E FY23E FY24E
(Rs bn)
Revenue
0
1
2
3
4
5
6
7
8
9
FY18 FY19 FY20 FY21 FY22E FY23E FY24E
(Rs bn)
PAT
Source: Company, Systematix Institutional Research Source: Company, Systematix Institutional Research
Net working capital cycle to remain low
CROMPTON is the most efficient among its peers in terms of working capital management, largely owing to its low inventory days (partially aided by higher
outsourcing; ~45% of ECD revenues) and higher payable days.
Exhibit 37: Lean working capital cycle on account of low inventory days
0
10
20
30
40
50
60
70
80
Receivables Inventory Payables Net WC cycle
(Days)
FY18 FY19 FY20 FY21 FY22E FY23E FY24E
Source: Company, Systematix Institutional Research
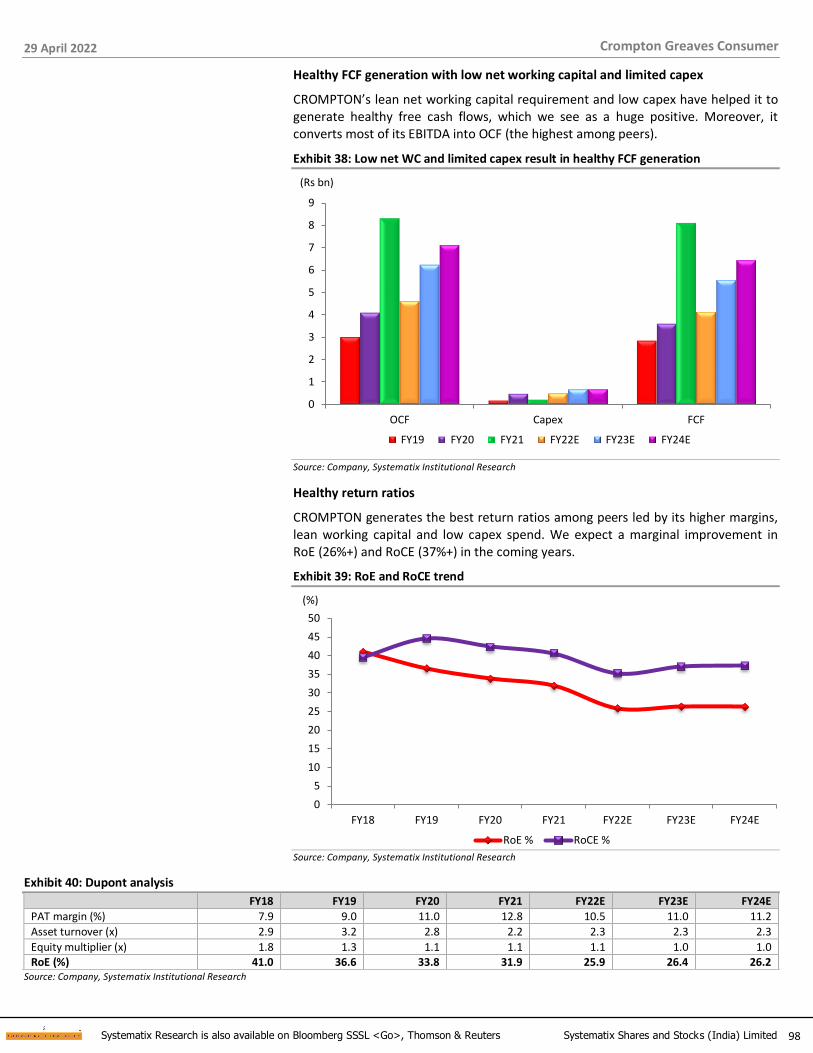
29 April 2022
98 Systematix Research is also available on Bloomberg SSSL <Go>, Thomson & Reuters Systematix Shares and Stocks (India) Limited
Crompton Greaves Consumer
Healthy FCF generation with low net working capital and limited capex
CROMPTON’s lean net working capital requirement and low capex have helped it to generate healthy free cash flows, which we see as a huge positive. Moreover, it converts most of its EBITDA into OCF (the highest among peers).
Exhibit 38: Low net WC and limited capex result in healthy FCF generation
0
1
2
3
4
5
6
7
8
9
OCF Capex FCF
(Rs bn)
FY19 FY20 FY21 FY22E FY23E FY24E
Source: Company, Systematix Institutional Research
Healthy return ratios
CROMPTON generates the best return ratios among peers led by its higher margins, lean working capital and low capex spend. We expect a marginal improvement in RoE (26%+) and RoCE (37%+) in the coming years.
Exhibit 39: RoE and RoCE trend
0
5
10
15
20
25
30
35
40
45
50
FY18 FY19 FY20 FY21 FY22E FY23E FY24E
(%)
RoE % RoCE %
Source: Company, Systematix Institutional Research
Exhibit 40: Dupont analysis FY18 FY19 FY20 FY21 FY22E FY23E FY24E
PAT margin (%) 7.9 9.0 11.0 12.8 10.5 11.0 11.2
Asset turnover (x) 2.9 3.2 2.8 2.2 2.3 2.3 2.3
Equity multiplier (x) 1.8 1.3 1.1 1.1 1.1 1.0 1.0 RoE (%) 41.0 36.6 33.8 31.9 25.9 26.4 26.2
Source: Company, Systematix Institutional Research
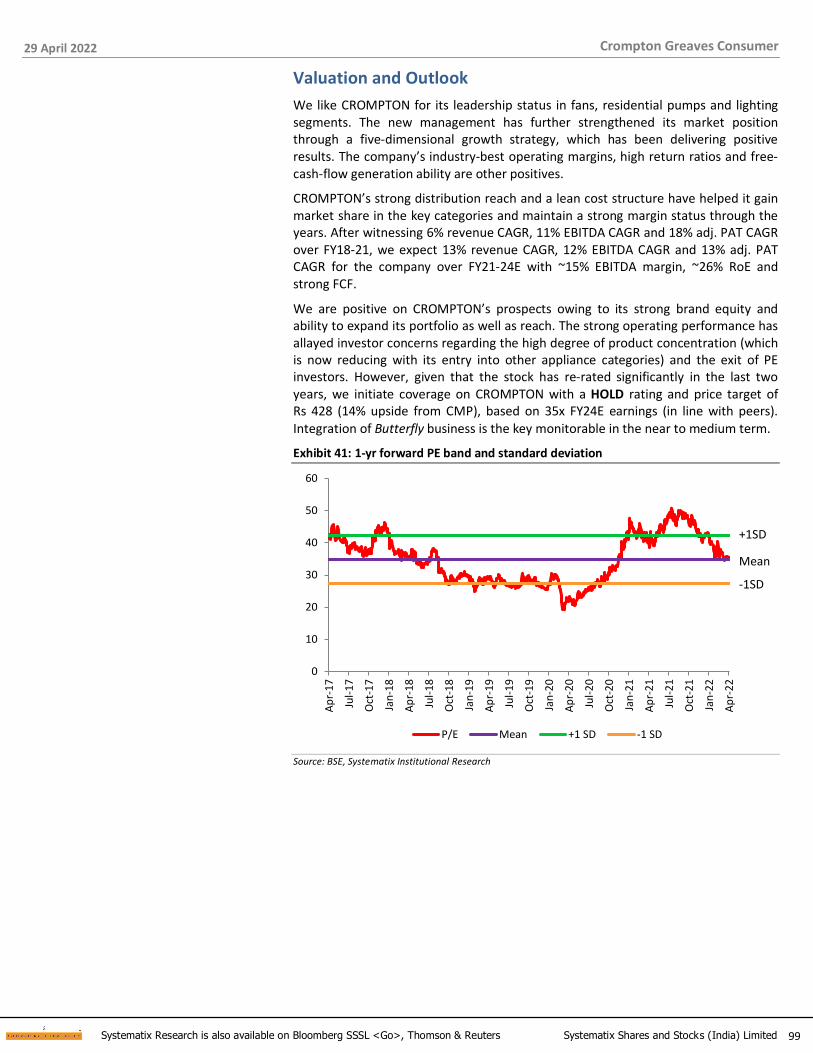
29 April 2022
99 Systematix Research is also available on Bloomberg SSSL <Go>, Thomson & Reuters Systematix Shares and Stocks (India) Limited
Crompton Greaves Consumer
Valuation and Outlook
We like CROMPTON for its leadership status in fans, residential pumps and lighting segments. The new management has further strengthened its market position through a five-dimensional growth strategy, which has been delivering positive results. The company’s industry-best operating margins, high return ratios and free-cash-flow generation ability are other positives.
CROMPTON’s strong distribution reach and a lean cost structure have helped it gain market share in the key categories and maintain a strong margin status through the years. After witnessing 6% revenue CAGR, 11% EBITDA CAGR and 18% adj. PAT CAGR over FY18-21, we expect 13% revenue CAGR, 12% EBITDA CAGR and 13% adj. PAT CAGR for the company over FY21-24E with ~15% EBITDA margin, ~26% RoE and strong FCF.
We are positive on CROMPTON’s prospects owing to its strong brand equity and ability to expand its portfolio as well as reach. The strong operating performance has allayed investor concerns regarding the high degree of product concentration (which is now reducing with its entry into other appliance categories) and the exit of PE investors. However, given that the stock has re-rated significantly in the last two years, we initiate coverage on CROMPTON with a HOLD rating and price target of Rs 428 (14% upside from CMP), based on 35x FY24E earnings (in line with peers).
Integration of Butterfly business is the key monitorable in the near to medium term.
Exhibit 41: 1-yr forward PE band and standard deviation
0
10
20
30
40
50
60
Ap
r-1
7
Jul-
17
Oct
-17
Jan
-18
Ap
r-1
8
Jul-
18
Oct
-18
Jan
-19
Ap
r-1
9
Jul-
19
Oct
-19
Jan
-20
Ap
r-2
0
Jul-
20
Oct
-20
Jan
-21
Ap
r-2
1
Jul-
21
Oct
-21
Jan
-22
Ap
r-2
2P/E Mean +1 SD -1 SD
-1SD
+1SD
Mean
Source: BSE, Systematix Institutional Research

29 April 2022
100 Systematix Research is also available on Bloomberg SSSL <Go>, Thomson & Reuters Systematix Shares and Stocks (India) Limited
Crompton Greaves Consumer
Key risks and risk mitigating measures
A concentrated product portfolio
CROMPTON derives bulk of its revenues from three key product lines – fans, lighting and pumps. Taking cognizance of the same, the company has expanded its appliances range in the last 2-3 years. The management is also open to considering acquisitions to expand and grow the portfolio.
Economic slowdown
A sluggish domestic economy due to global factors may have short-term negative impact on demand. For the past couple of years, the housing sector has also generated muted demand for electrical goods. However, there are signs of revival in the housing sector. Availability of uninterrupted power supply is key to demand of electrical products – hence, errant supply of electricity may hamper growth
prospects of the industry.
Commodity headwinds
With the economy opening up post lifting of the COVID-induced lockdowns, the pent-up demand for commodities has driven a sharp rise in RM prices. Industrial commodities, including key raw materials such as copper, steel and aluminium have seen significant and sustained price spikes. Going forward, inflationary trends like increasing input costs, higher commodity prices and better pricing power may
adversely impact consumer discretionary spends.
CG Power’s foray into Consumer Electricals industry
CG Power, a demerged entity of the erstwhile Crompton Greaves, has entered the consumer electricals industry starting with fans. Given a similar name and existing association with channel partners (both companies being part of the same group pre-
demerger), CROMPTON may face unhealthy competition from CG Power.
29 April 2022
101 Systematix Research is also available on Bloomberg SSSL <Go>, Thomson & Reuters Systematix Shares and Stocks (India) Limited
Crompton Greaves Consumer
Annexures

29 April 2022
102 Systematix Research is also available on Bloomberg SSSL <Go>, Thomson & Reuters Systematix Shares and Stocks (India) Limited
Crompton Greaves Consumer
Company Background
Incorporated in February 2015 after demerger of the consumer products business from the power and industrial systems businesses of Crompton Greaves (the parent company), CROMPTON was taken over by two private equity investors (Advent and Temasek) from the Thapar-owned Avantha Group. The PE investors hired a new management (the erstwhile MDs of P&G and Racold are currently
the MD and CEO of CROMPTON respectively) to run the business with a focused approach.
Exhibit 42: Journey and key milestones
Year Remarks
1878 Founded as “REB Crompton & Co” by Col. REB Crompton
1937 Merged with F&A Parkinson to from “Crompton Parkinson”
1947 Acquired by the Thapar group at the time of India’s Independence
1966 The group restructured to form “Crompton Greaves”
2005 One of the leading companies globally in all three segments (fans, lighting, pumps)
2015 The consumer business demerged into “Crompton Greaves Consumer”
Source: Company
CROMPTON operates in two business segments – electric consumer durables (ECD) and lighting. ECD forms ~75% of its revenues and ~80% of EBIT with ~45% contribution by fans, 20% by pumps the remaining from other electrical appliances including water heaters,
mixer grinders, air coolers, etc. It has manufacturing plants in Goa, Vadodara, Ahmednagar and Baddi.
The company leads the ~Rs 100bn Indian fans market with a ~25% market share. It is also the leader in residential pumps (~25% market share) and among the top-5 in the lighting segment.
Exhibit 43: Revenue mix (FY21)
79%
21%
ECD (fans, pumps, appliancesetc)
Lighting
Source: Company
CROMPTON relies heavily on outsourcing with ~45% of its ECD and lighting products manufactured at third-party facilities. Its lean cost structure yields industry-high margins and strong return ratios translate into a healthy balance sheet. The company has high brand equity and a vast distribution network of ~200,000 retail points pan-India.
CROMPTON has been proactive in launching premium offerings based on consumer insights and constantly increasing touchpoints to expand its customer base. The focus is on product innovation, brand-building and distribution channel expansion (currently one of the largest in India). Since the change in management, the company has strengthened its position in premium fans (earlier restricted to being a ‘value-for-money’ brand in the mass segment). The transformation has been achieved through product innovation and higher A&P spends.

29 April 2022
103 Systematix Research is also available on Bloomberg SSSL <Go>, Thomson & Reuters Systematix Shares and Stocks (India) Limited
Crompton Greaves Consumer
Exhibit 44: Comprehensive product range
FansCeiling, Table, Pedestal, Wall-mounted, Ventilating, Heavy-duty exhaust, and Industrial
Residential, Agricultural, Commercial, and Industrial
Water-heater, Air-cooler, Mixer-grinder, Iron, Room-heater, Power solutions
LED lamps, CFLs, Home and Infra lighting, Street lights, High intensity discharge lamps, incandesent lamps
Pumps
Appliances
Lighting
Source: Company
Promoters and key management personnel
Shantanu Khosla, Managing Director, is a B. Tech. in Mechanical Engineering from IIT, Mumbai, and an MBA from IIM, Calcutta. He joined CROMPTON in Jan-16 after
serving as MD & CEO of Procter & Gamble, India from Jul-02 to Jun-15.
Mathew Job, Chief Executive Officer, joined CROMPTON in Jan-16. An alumnus of IIM Calcutta, he has held several key positions in the past. He was with Philips Electronics, India, from Jun-94 to Oct-09, Grohe India as VP and MD from Nov-09 till Jan-12 and Racold (Ariston) Thermo as MD till Sep-15.
Sandeep Batra, Chief Financial Officer, is a Chartered Accountant and Company Secretary. Before joining CROMPTON, he was CFO of ICI India and Pidilite Industries.
He has more than 25 years of experience in the field.
Exhibit 45: Shareholding pattern and key shareholders
Equity stake (%) Key institutional holders % equity
Sep-21 Dec-21 Mar-22 Mar-22
Promoters 6.0 6.0 5.9 SBI MF 5.7
Free float 94.0 94.0 94.1 Birla MF 4.3
- Foreign Institutions 41.5 40.2 38.0 HDFC Life Insurance 4.0
- Domestic Institutions 42.3 43.2 44.4 Mirae MF 3.4
- Public 10.2 10.7 11.7 HDFC MF 3.3
Source: BSE, Bloomberg

29 April 2022
104 Systematix Research is also available on Bloomberg SSSL <Go>, Thomson & Reuters Systematix Shares and Stocks (India) Limited
Crompton Greaves Consumer
Annual Report Analysis (FY17 to FY21)
Exhibit 46: Annual Report Analysis
Year Demand Scenario Plans and Initiatives
FY17
• A stable economy, inflation within bounds, a good monsoon and rebound in consumer sentiment after the demonetization shock were key highlights of the year
• However, slowdown in construction sector a challenge to growth trajectory
• First full year of operations post the demerger
• Share of LED tech from Crompton on the rise
• Replacement of LED tech and solar power in place of existing CFL tech in certain plants driving demand
FY18
• Growth in 1Q hit by transition to GST
• Positive shift in consumer perception on Crompton brand
• A strong macroeconomic scenario
• Partial recovery in construction activity; government the key driver for housing growth, primarily through affordable housing schemes
• Pressure on commodity input costs and interest rates with strengthening of US Dollar
• Focus on improving efficiency and efficacy and adopting structural cost improvement measures
• New launches like anti-dust fans and LEDs elicited good response from customers
• Extensive training and awareness programmes conducted, especially with vendors, in the run-up to GST regime to effectively handle the transition
• Growth strategy chalked out based on five pillars
• Scope of GTM pilot widened basis initial success
FY19
• Robust growth was anticipated across key segments led by product innovation, more efficient go-to-market and geographic expansion
• Positive macro factors with rising GDP growth, increasing urbanization, consumerism among the affluent segment, rising disposable incomes and improving electrification across India to drive growth
• Working on products with improved technology, and also IoT and Artificial Intelligence-based products
• Expanding addressable market in pumps by leveraging the Mini Crest range of products
• Evaluating the Brushless DC (BLDC) Motor technology
• Incorporated two wholly owned subsidiaries – Pinnacles Lighting Project and Nexustar Lighting Project
FY20
• A sluggish global economy and cyclical issues in Indian economy
• 4Q disrupted by extensive pan-India lockdowns due to the coronavirus pandemic, with challenges on supply as well as demand side
• Government schemes under housing and lighting sector provided major impetus to industry growth
• Well positioned for transition of its existing portfolio smoothly under the new BEE norms
• Government’s pro-solar initiatives (e.g., the PM Kusum scheme) prompted foray into the solar pumps business
• Took various steps towards efficient utilization of energy resources, water conservation, waste management and adopting renewable energy sources
FY21
• Economy took a hard blow from the COVID-19 pandemic
• Commodity inflation in 2H another challenge
• Lighting industry expected to be the next digital disruptor, with increasing adoption of Internet of Things (IoT)
• Growth in Electrical Consumer Durables (ECD) segment in India expected to be led by a favourable demographic profile with higher disposable incomes, access to easy finance options, increasing electrification of rural areas, rapid urbanization and growth of nuclear families, and emerging consumer trends
• To adopt a three-pronged strategy (brand awareness, best customer and consumer service and most innovative products, especially around emerging or more accepted products) to achieve healthy growth in the B2C segment
• For B2B, plans to create efficient designs and foray into newer categories such as solar and decorative products
• Appliances business doubled in the last three years
Source: Company, Systematix Institutional Research

29 April 2022
105 Systematix Research is also available on Bloomberg SSSL <Go>, Thomson & Reuters Systematix Shares and Stocks (India) Limited
Crompton Greaves Consumer
FINANCIALS (CONSOLIDATED)
Profit & Loss Statement
YE: Mar (Rs mn) FY20 FY21 FY22E FY23E FY24E
Net revenues 45,203 48,035 54,584 61,120 68,442
Growth (%) 0.9 6.3 13.6 12.0 12.0
Raw material expenses 30,703 32,672 37,381 41,737 46,738
Gross Margin (%) 32.1 32.0 31.5 31.7 31.7
Employee & Other exp. 8,508 8,158 9,475 10,642 11,713
EBITDA 5,991 7,205 7,728 8,742 9,991
EBITDA margins (%) 13.3 15.0 14.2 14.3 14.6
Depreciation 268 297 381 349 422
Other income 591 758 648 904 984
Finance costs 407 429 318 296 251
PBT 5,907 7,236 7,677 9,002 10,302
Effective tax rate (%) 16.0 14.8 25.4 25.4 25.4
Associates/(Minorities) - - - - -
Net Income 4,964 6,167 5,725 6,713 7,682
Adjusted net income 4,964 5,346 5,725 6,713 7,682
Shares outstanding 627 628 628 628 628
FDEPS (Rs per share) 7.9 9.8 9.1 10.7 12.2
FDEPS growth (%) 23.7 24.2 (7.2) 17.3 14.4
Source: Company, Systematix Institutional Research
Balance Sheet
YE: Mar (Rs mn) FY20 FY21 FY22E FY23E FY24E
Share capital 1,255 1,255 1,255 1,255 1,255
Net worth 14,683 19,314 22,134 25,465 29,278
Total debt 1,797 2,988 1,988 1,488 988
Minority interest - - - - -
DT Liability/ (Asset) (507) (586) (486) (386) (286)
Capital Employed 15,974 21,717 23,636 26,567 29,981
Net tangible assets 1,251 1,328 1,447 1,798 2,076
Net Intangible assets 45 28 28 28 28
Goodwill 7,794 7,794 7,794 7,794 7,794
CWIP 199 109 89 69 49
Investments (Strategic) - - - - -
Investments (Financial) 5,408 7,697 11,697 13,697 16,697
Current Assets 11,833 12,592 13,342 14,843 16,497
Cash 481 6,040 2,576 2,854 2,662
Current Liabilities 11,038 13,871 13,337 14,517 15,822
Working capital 796 (1,279) 5 326 675
Capital Deployed 15,974 21,717 23,636 26,567 29,981
Contingent Liabilities 1,381 1,782 - - -
Source: Company, Systematix Institutional Research
Cash Flow
YE: Mar (Rs mn) FY20 FY21 FY22E FY23E FY24E
EBIT (incl. other income) 6,008 7,136 7,247 8,293 9,469
Non-cash items 268 297 381 349 422
OCF before WC changes 6,276 7,433 7,628 8,642 9,891
Incr./(decr.) in WC 721 (1,445) 1,084 121 148
Others including taxes 1,446 575 1,952 2,289 2,619
Operating cash-flow 4,109 8,303 4,592 6,231 7,123
Capex 494 202 480 680 680
Free cash-flow 3,615 8,101 4,112 5,551 6,443
Acquisitions - - - - -
Dividend 1,506 1,874 2,905 3,382 3,869
Equity raised 52 73 - - -
Debt raised (3,000) 1,300 (1,000) (500) (500)
Fin Investments (363) 5,027 4,000 2,000 3,000
Misc. Items (CFI + CFF) 454 189 (330) (609) (733)
Net cash-flow (929) 2,384 (3,463) 278 (193)
Source: Company, Systematix Institutional Research
Ratios
YE: Mar FY20 FY21 FY22E FY23E FY24E
P/E (x) 48.1 38.7 41.7 35.5 31.0
EV/EBITDA (x) 39.1 31.6 29.3 25.6 22.0
EV/sales (x) 5.2 4.7 4.1 3.7 3.2
P/B (x) 16.2 12.3 10.8 9.4 8.1
RoE (%) 33.8 31.9 25.9 26.4 26.2
RoCE (%) 42.3 40.7 35.3 37.0 37.3
ROIC (%) 58.0 68.3 66.0 69.3 74.5
DPS (Rs per share) - 5.5 4.6 5.4 6.2
Dividend yield (%) - 1.4 1.2 1.4 1.6
Dividend payout (%) - 56.0 50.7 50.4 50.4
Net debt/equity (x) (0.3) (0.6) (0.6) (0.6) (0.6)
Receivables (days) 37.4 37.3 36.0 36.0 36.0
Inventory (days) 37.4 39.4 35.0 35.0 35.0
Payables (days) 52.0 65.7 52.0 52.0 52.0
CFO:PAT% 82.8 155.3 80.2 92.8 92.7
Source: Company, Systematix Institutional Research

Systematix Research is also available on Bloomberg SSSL <Go>, Thomson & Reuters Systematix Shares and Stocks (India) Limited
Investors are advised to refer disclosures made at the end of the research report.
106
Havells
Straddling the entire consumer durables range
Havells (HAVL), one of India’s leading consumer durables companies, is among the top-3 in many of its product categories on the strength of its brand pull, vast distribution network and robust processes. The Lloyd acquisition gave it an entry into the large home appliances segment, wherein the long-term outlook is as strong as in FMEG. Several corrective measures (brand repositioning, sales channel re-structuring and in-house manufacturing) taken at Lloyd have placed the brand/ portfolio on the path of sustainable growth. Also, rising consumer preference for quality branded products augurs well for HAVL. We expect a 17% revenue CAGR and 18% PAT CAGR for the company over FY21-24E with RoE of ~22% by FY24E and healthy FCF. However, its rich valuations (47x FY24E earnings at CMP) compel us to initiate coverage on the stock with a HOLD rating and price target of Rs 1,383 (6% upside from here), based on 50x FY24E earnings. Strong growth/ FCF and a higher RoE are key to the company sustaining such high valuations.
A well-diversified and leading consumer durables company: HAVL is among the most diversified (present in 21 categories) consumer durable companies in India. The company has diversified its product portfolio from just FMEG to large appliances by acquiring Lloyd in 2017. It has 14 manufacturing units, 39 branch offices and an all-India distribution network of 14,270+ dealers catering to 180,000+ retail points.
Top-3 in many categories; a strong brand, vast distribution network: HAVL has captured a slot among the top-3 in many FMEG product categories by leveraging its brand pull, vast distribution network and robust processes. Its five brands (Havells, Crabtree, Standard, REO and Lloyd) cater to a diverse set of customers with a unique product portfolio for each. Innovation and product differentiation have been at the core of its strategy, reflected in rising R&D expenses (~1% of sales in FY21 vs 0.5% in FY15; target of ~2% over the next few years). After establishing a strong presence in urban markets, the focus now is on the fast-growing semi-urban/ rural markets.
Llyod on a strong footing after structural improvements: After undertaking brand repositioning initiatives like channel restructuring and in-house manufacturing over the last three years, Lloyd strives to be an aspirational consumer durables brand offering a comprehensive portfolio of room air conditioners (RACs), LEDs, washing machines and refrigerators. The segment presents a huge opportunity for HAVL’s ‘deeper into homes’ strategy and, with its own manufacturing facilities for RACs and washing machines, Lloyd is well placed to take advantage of this – especially after the ban on import of gas-filled ACs. It is also strengthening its network coverage by expanding into modern format retail stores, e-commerce and via own Lloyd Galaxy stores to increase brand visibility.
Initiating coverage with a HOLD rating: With improved growth prospects across FMEG segments as also in the Lloyd business, we expect 17% revenue CAGR and 18% PAT CAGR for HAVL over FY21-24E with RoE of ~22% and healthy FCF. While we like the company for its diversified portfolio, leadership position, strong brand and vast distribution network, we see limited upside potential at 47x FY24E earnings at CMP. Thus, we initiate coverage on the stock with a HOLD rating and price target of Rs 1,383 (50x FY24E earnings, near its 5-year mean). Strong growth/ FCF and RoE are
key to the company sustaining valuations at these levels.
Systematix Institutional Equities
29 April 2022
INITIATING COVERAGE
Sector: Consumer Electricals Rating: HOLD
CMP: Rs 1,300 Target Price: Rs 1,383
Stock Info
Sensex/Nifty 57,521/17,244
Bloomberg HAVL IN
Equity shares (mn) 626.0
52-wk High/Low 1,474/979
Face value Rs 1
M-Cap Rs 814 bn/ USD 10.9bn
3-m avg turnover USD 24mn
Financial Snapshot (Rs mn) Y/E Mar FY22E FY23E FY24E
Net sales 131,778 149,335 168,968
EBITDA 17,469 21,630 24,565
OPM % 13.3 14.5 14.5
PAT (adj.) 12,014 15,068 17,310
EPS (Rs) 19.2 24.1 27.7
PE (x) 67.7 54.0 47.0
P/B (x) 13.8 11.8 10.1
EV/EBITDA (x) 45.5 36.4 31.7
RoE (%) 20.3 21.9 21.6
RoCE (%) 26.4 29.1 29.1
Net-D/E (x) (0.3) (0.4) (0.4)
Shareholding Pattern (%) Mar’22 Dec'21 Sep'21
Promoter 59.5 59.5 59.5
- Pledged - - -
FII 24.4 26.5 26.8
DII 8.3 6.4 6.2
Others 7.8 7.7 7.5
Stock Performance (1-year)
800
900
1,000
1,100
1,200
1,300
1,400
1,500
1,600
Ap
r-2
1
May
-21
Jun
-21
Jul-
21
Au
g-2
1
Sep
-21
Oct
-21
No
v-2
1
Dec
-21
Jan
-22
Feb
-22
Mar
-22
Ap
r-2
2
HAVL Sensex
Ashish Poddar [email protected] +91 22 6704 8039
Pranay Shah [email protected] +91 22 6704 8017

29 April 2022
107 Systematix Research is also available on Bloomberg SSSL <Go>, Thomson & Reuters Systematix Shares and Stocks (India) Limited
Havells
Story in charts
Exhibit 1: HAVL is on a strong footing for long-term growth
Source: Company
Exhibit 2: Total revenue and growth trend Exhibit 3: Gross and EBITDA margin trend
0
20
40
60
80
100
120
140
160
180
FY18 FY19 FY20 FY21 FY22E FY23E FY24E
(Rs bn)
Revenue
0
5
10
15
20
25
30
35
40
45
FY18 FY19 FY20 FY21 FY22E FY23E FY24E
(%)
Gross margin EBITDA margin
Source: Company, Systematix Institutional Research Source: Company, Systematix Institutional Research
Exhibit 4: PAT and growth trend Exhibit 5: Wires & Cables – revenue and EBIT margin trend
0
2
4
6
8
10
12
14
16
18
20
FY18 FY19 FY20 FY21 FY22E FY23E FY24E
(Rs bn)
PAT
10
10.5
11
11.5
12
12.5
13
0
10
20
30
40
50
60
FY18 FY19 FY20 FY21 FY22E FY23E FY24E
(%)(Rs bn)
Revenue EBIT % (RHS)
Source: Company, Systematix Institutional Research Source: Company, Systematix Institutional Research
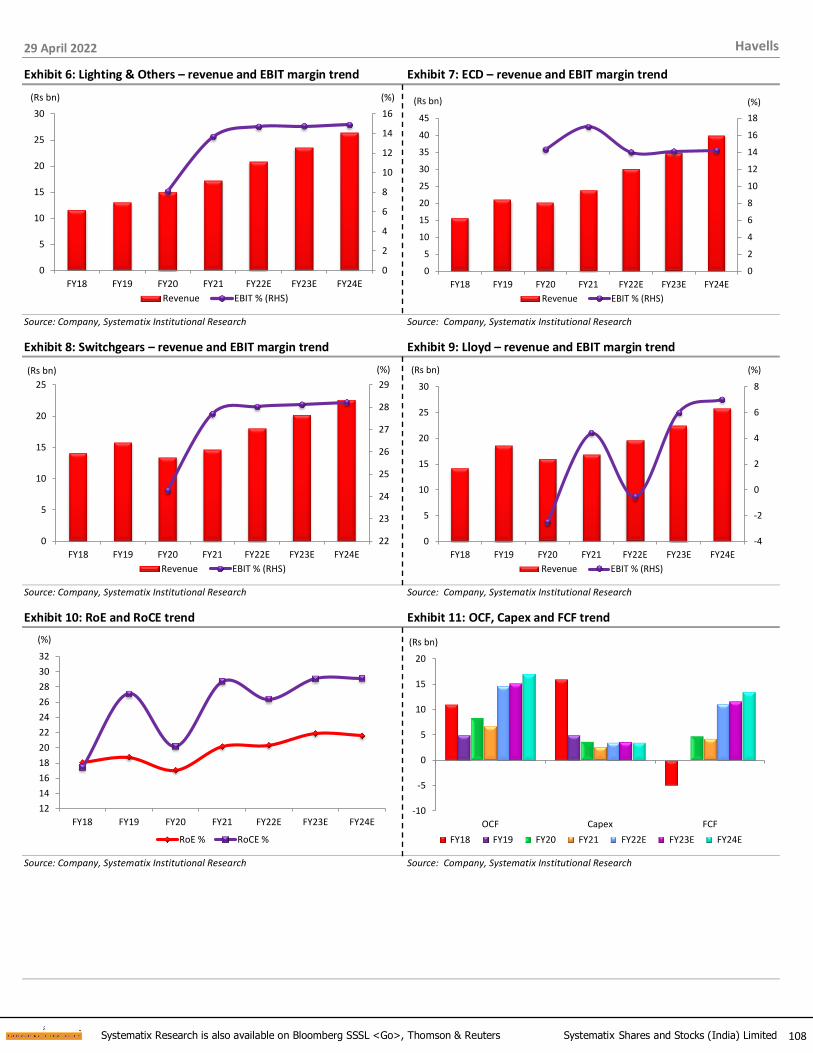
29 April 2022
108 Systematix Research is also available on Bloomberg SSSL <Go>, Thomson & Reuters Systematix Shares and Stocks (India) Limited
Havells
Exhibit 6: Lighting & Others – revenue and EBIT margin trend Exhibit 7: ECD – revenue and EBIT margin trend
0
2
4
6
8
10
12
14
16
0
5
10
15
20
25
30
FY18 FY19 FY20 FY21 FY22E FY23E FY24E
(%)(Rs bn)
Revenue EBIT % (RHS)
0
2
4
6
8
10
12
14
16
18
0
5
10
15
20
25
30
35
40
45
FY18 FY19 FY20 FY21 FY22E FY23E FY24E
(%)(Rs bn)
Revenue EBIT % (RHS)
Source: Company, Systematix Institutional Research Source: Company, Systematix Institutional Research
Exhibit 8: Switchgears – revenue and EBIT margin trend Exhibit 9: Lloyd – revenue and EBIT margin trend
22
23
24
25
26
27
28
29
0
5
10
15
20
25
FY18 FY19 FY20 FY21 FY22E FY23E FY24E
(%)(Rs bn)
Revenue EBIT % (RHS)
-4
-2
0
2
4
6
8
0
5
10
15
20
25
30
FY18 FY19 FY20 FY21 FY22E FY23E FY24E
(%)(Rs bn)
Revenue EBIT % (RHS)
Source: Company, Systematix Institutional Research Source: Company, Systematix Institutional Research
Exhibit 10: RoE and RoCE trend Exhibit 11: OCF, Capex and FCF trend
12
14
16
18
20
22
24
26
28
30
32
FY18 FY19 FY20 FY21 FY22E FY23E FY24E
(%)
RoE % RoCE %
-10
-5
0
5
10
15
20
OCF Capex FCF
(Rs bn)
FY18 FY19 FY20 FY21 FY22E FY23E FY24E
Source: Company, Systematix Institutional Research Source: Company, Systematix Institutional Research

29 April 2022
109 Systematix Research is also available on Bloomberg SSSL <Go>, Thomson & Reuters Systematix Shares and Stocks (India) Limited
Havells
HAVL: A leader with strong brands and vast distribution
With its all-India distribution network (39 branch offices, 14,270+ dealers and 180,000 retailers), HAVL is a leading FMEG company in India. By leveraging its strong brand pull, vast distribution network and robust processes, it is among the top-3
players in multiple product categories. The company has 14 manufacturing plants.
HAVL’s product range in FMEG covers household, commercial and industrial electrical needs: circuit-protection switchgears, cables & wires, motors, fans, power capacitors, luminaires, modular switches, water heaters, coolers, air purifiers, personal grooming & other appliances under the brands Havells, Crabtree, Standard and REO.
Exhibit 12: HAVL among the top-3 in key categories Indicative Organized
Product Market-size (Rs bn) Market-share HAVL rank penetration Peers
Switchgears
MCB 29 18% # 1-2 High Legrand, Schneider
Modular Switches 45 12-13% # 3 Medium Panasonic (Anchor), Legrand
Cable
Domestic 100 16% # 3 Low FNXC, POLYCAB
Industrial 150 10-11% # 3 Medium POLYCAB, KEII
LED Lighting & Fixtures 100 12-15% # 2-4 Medium Philips, Wipro, CROMPTON, BJE
ECD
Fans 75 19% # 2 High CROMPTON, Usha, ORIENTEL
Water Heaters 17 19% # 1 Medium Racold, AO Smith
Other Appliances 50 6% # 3-4 Medium BJE, Philips
Air Conditioner 180 11 # 4 High Voltas, Daikin, Blue Star, Hitachi Source: Company, Industry
Growth mantra – focus on brands, products and distribution
HAVL’s successful journey is attributable to its sharp focus on brands, products and distribution network. Its business strategy has been to nurture the core businesses while investing in new opportunities to continuously refresh its product range. Simultaneously, it looks to enter adjacent categories to expand the addressable market and sell through alternate channels (modern trade and online/ e-commerce) for a wider and deeper reach among consumers.
Exhibit 13: A&P spend as % of revenues
0
0.5
1
1.5
2
2.5
3
3.5
4
4.5
0.0
0.5
1.0
1.5
2.0
2.5
3.0
3.5
4.0
4.5
FY15 FY16 FY17 FY18 FY19 FY20 FY21
(%)(Rs bn)
A&P spend % revenue (RHS)
Source: Company, Systematix Institutional Research

29 April 2022
110 Systematix Research is also available on Bloomberg SSSL <Go>, Thomson & Reuters Systematix Shares and Stocks (India) Limited
Havells
Exhibit 14: A vast retail network
0
50,000
1,00,000
1,50,000
2,00,000
2,50,000
BJE
CR
OM
PTO
N
HA
VL
PO
LYC
AB
OR
IEN
TEL
FNX
C
VG
RD
(Number of retailers)
Source: Company, Systematix Institutional Research
Exhibit 15: HAVL’s advertisement (OOH)
Source: Company, Systematix Institutional Research
Innovation and product differentiation – the key focus areas
Havell is a well-known brand in the mass-premium category. At the core of HAVL’s business strategy lies its proclivity to introduce innovative and differentiated products. The company uses its capabilities in advanced data analytics and technology to identify and fill need gaps across categories (e.g., new product introductions in the fans, lights and personal grooming categories in the last few years). Notably, HAVL’s investment in research and development (R&D) increased from 0.5% of sales in FY15 to 1.1% in FY20. It has 10 R&D centres including an innovation hub in Bengaluru with ~400 engineers. HAVL intends to further intensify its efforts on R&D and grow the investment to ~2% of revenues (the highest allocation among peers) in the next few years.

29 April 2022
111 Systematix Research is also available on Bloomberg SSSL <Go>, Thomson & Reuters Systematix Shares and Stocks (India) Limited
Havells
Exhibit 16: A consistent track record of new product introductions Exhibit 17: Rising investment in R&D
0
0.2
0.4
0.6
0.8
1
1.2
0.0
0.2
0.4
0.6
0.8
1.0
1.2
FY15 FY16 FY17 FY18 FY19 FY20 FY21
(%)(Rs bn)
R&D spend % revenue (RHS)
Source: Company, Systematix Institutional Research Source: Company, Systematix Institutional Research
Brand positioning, channel expansion and process automation strategy
Besides its widespread retail and distribution network, HAVL showcases and sells its entire range of electrical products under one roof at its 566 Havells Galaxy stores. In terms of positioning, while Havells and Crabtree brands house high-quality, mass-premium products, the brand Standard caters to the mass segment and REO to the economy segment in tier-2 and -3 cities.
HAVL has created a separate team to focus on each distribution channel (modern format, rural market, CPC/ CSD, e-Commerce, etc) and adopted the DMDC model (different model for different channel) to avoid conflict with existing channels. It has invested considerably in improving the range and quality of its marketing (efficient services, innovative schemes and a wide product range) and distribution efforts.
The use of information technology (apps for dealers and retailers, a distribution management system as a mini-ERP, etc) has helped HAVL gain insights about the market and improve efficiency, profitability and market share.
Exhibit 18: Retail network – peer comparison
0
50,000
100,000
150,000
200,000
250,000
BJE
CR
OM
PTO
N
HA
VL
PO
LYC
AB
OR
IEN
TEL
FNX
C
VG
RD
(No.)
Source: Company, Systematix Institutional Research
Year Key product launches
1985 MCB
1996 MCCB, Wires & Cables
1997 Crabtree wiring accessories
2003 Fan, CFL, Lighting Fixtures
2004 Domestic switchgear
2005 Premium fan
2010 Electrical water heater
2012 TPW fan, Switch, Flexible Cable
2013 Domestic appliance, Pump
2015 LED Lighting
2016 Air Cooler, Solar Street Light
2017 Personal grooming, Water purifier, AC, LED TV, Washing Machine
2018 Room heater
2019 Air purifier
2020 Refrigerator
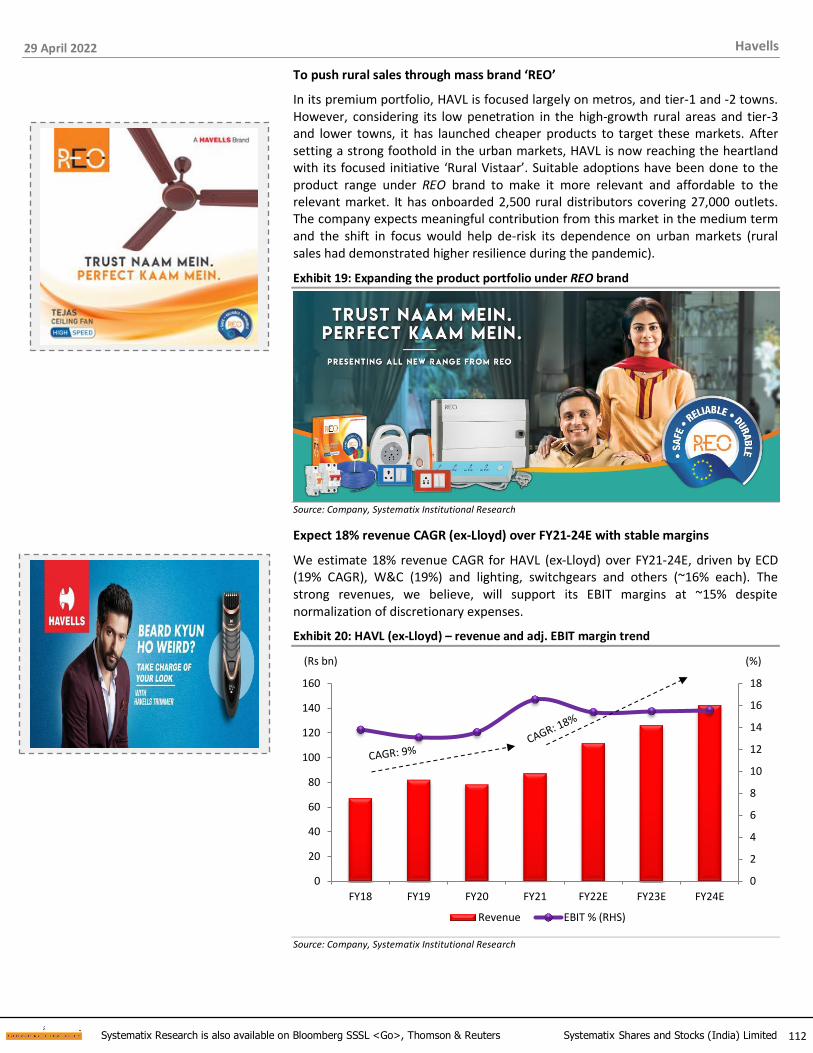
29 April 2022
112 Systematix Research is also available on Bloomberg SSSL <Go>, Thomson & Reuters Systematix Shares and Stocks (India) Limited
Havells
To push rural sales through mass brand ‘REO’
In its premium portfolio, HAVL is focused largely on metros, and tier-1 and -2 towns. However, considering its low penetration in the high-growth rural areas and tier-3 and lower towns, it has launched cheaper products to target these markets. After setting a strong foothold in the urban markets, HAVL is now reaching the heartland with its focused initiative ‘Rural Vistaar’. Suitable adoptions have been done to the product range under REO brand to make it more relevant and affordable to the relevant market. It has onboarded 2,500 rural distributors covering 27,000 outlets. The company expects meaningful contribution from this market in the medium term and the shift in focus would help de-risk its dependence on urban markets (rural sales had demonstrated higher resilience during the pandemic).
Exhibit 19: Expanding the product portfolio under REO brand
Source: Company, Systematix Institutional Research
Expect 18% revenue CAGR (ex-Lloyd) over FY21-24E with stable margins
We estimate 18% revenue CAGR for HAVL (ex-Lloyd) over FY21-24E, driven by ECD (19% CAGR), W&C (19%) and lighting, switchgears and others (~16% each). The strong revenues, we believe, will support its EBIT margins at ~15% despite normalization of discretionary expenses.
Exhibit 20: HAVL (ex-Lloyd) – revenue and adj. EBIT margin trend
0
2
4
6
8
10
12
14
16
18
0
20
40
60
80
100
120
140
160
FY18 FY19 FY20 FY21 FY22E FY23E FY24E
(%)(Rs bn)
Revenue EBIT % (RHS)
Source: Company, Systematix Institutional Research
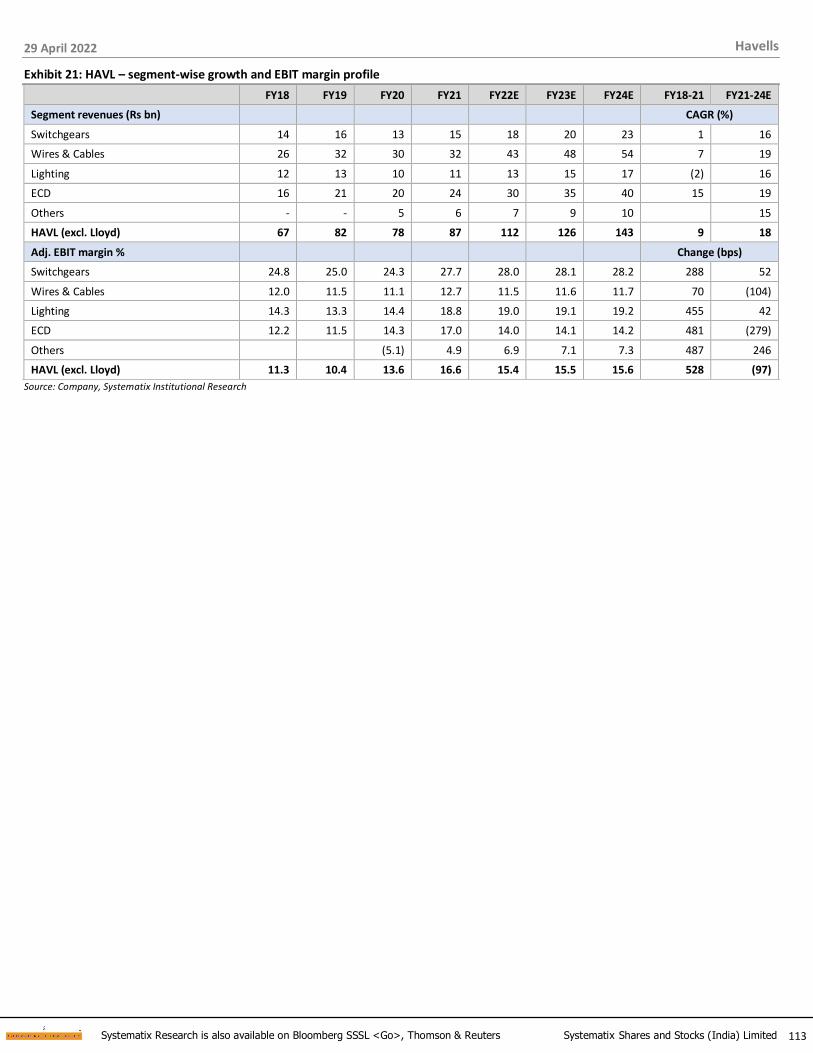
29 April 2022
113 Systematix Research is also available on Bloomberg SSSL <Go>, Thomson & Reuters Systematix Shares and Stocks (India) Limited
Havells
Exhibit 21: HAVL – segment-wise growth and EBIT margin profile FY18 FY19 FY20 FY21 FY22E FY23E FY24E FY18-21 FY21-24E
Segment revenues (Rs bn) CAGR (%)
Switchgears 14 16 13 15 18 20 23 1 16
Wires & Cables 26 32 30 32 43 48 54 7 19
Lighting 12 13 10 11 13 15 17 (2) 16
ECD 16 21 20 24 30 35 40 15 19
Others - - 5 6 7 9 10 15
HAVL (excl. Lloyd) 67 82 78 87 112 126 143 9 18
Adj. EBIT margin % Change (bps)
Switchgears 24.8 25.0 24.3 27.7 28.0 28.1 28.2 288 52
Wires & Cables 12.0 11.5 11.1 12.7 11.5 11.6 11.7 70 (104)
Lighting 14.3 13.3 14.4 18.8 19.0 19.1 19.2 455 42
ECD 12.2 11.5 14.3 17.0 14.0 14.1 14.2 481 (279)
Others (5.1) 4.9 6.9 7.1 7.3 487 246
HAVL (excl. Lloyd) 11.3 10.4 13.6 16.6 15.4 15.5 15.6 528 (97)
Source: Company, Systematix Institutional Research

29 April 2022
114 Systematix Research is also available on Bloomberg SSSL <Go>, Thomson & Reuters Systematix Shares and Stocks (India) Limited
Havells
Exhibit 22: A wide range of products in consumer electricals…
Source: Company, Systematix Institutional Research
Exhibit 23: …and expanding the portfolio in large appliances under Lloyd brand
Source: Company, Systematix Institutional Research

29 April 2022
115 Systematix Research is also available on Bloomberg SSSL <Go>, Thomson & Reuters Systematix Shares and Stocks (India) Limited
Havells
Exhibit 24: New launches and marketing activities
Source: Company, Systematix Institutional Research

29 April 2022
116 Systematix Research is also available on Bloomberg SSSL <Go>, Thomson & Reuters Systematix Shares and Stocks (India) Limited
Havells
Llyod: Well-placed to become a leader in white goods
HAVL entered the large home-appliances business in May-17 by acquiring Lloyd Electric’s consumer durables business (brand, distribution network and employees) for Rs 16bn. This gave HAVL access to the Rs 700bn white goods and electronics industry, which is expected to register a 12-15% CAGR over the medium term. From room air-conditioners (RAC) and LED TVs, Lloyd has also entered the washing machine and refrigerator segments in the last 1-2 years.
Since the acquisition, HAVL has undertaken several steps to grow the business:
1) imbuing HAVL culture into Lloyd
2) repositioning Lloyd as a mass-premium brand
3) overhauling the distribution channel
4) in-house manufacturing, and
5) expanding the product range
All these measures, as well as intense competition (from domestic and global giants), have impacted Lloyd’s sales and profitability in the interim. The performance is now well on track with industry leading growth in RAC, and we expect margins to follow suit in the coming years.
Exhibit 25: Large home-appliances – key categories to record a ~15% CAGR
Penetration: Washing Machine 12%, Refrigerator33%, Room AC~5%, Colour TV 65%
39 95 159
97 189 336
66 163 376
100 245 458
FY11 FY19 FY25E
Washing Machine Refrigerator Room AC Colour TV
CAGR 9%
CAGR 12%
CAGR 11%
CAGR 15%
CAGR 10%
CAGR 9%
Rs bn
CAGR 12%
CAGR 12%
Source: Company, Systematix Institutional Research
Imbuing HAVL core culture in Lloyd
HAVL’s continued success rests on its focus on brand, products and distribution, which it has replicated in Lloyd. Its business strategy has been to nurture core businesses, invest in new business opportunities (products, channels, etc) and
become a top-3 player with premium positioning.
Lloyd – repositioned as a mass-premium brand
In sharp contrast to HAVL’s positioning as a strong premium player across FMEG categories, Lloyd was positioned as a mass-economy brand targeting the price-sensitive consumers and competing with Videocon, Haier, Onida and Electrolux in RAC, and with Sansui, Onida and Intex in LED TVs.

29 April 2022
117 Systematix Research is also available on Bloomberg SSSL <Go>, Thomson & Reuters Systematix Shares and Stocks (India) Limited
Havells
Since acquiring Lloyd, HAVL has taken several steps to reposition it as a mass-premium brand on the back of brand building initiatives (inducted Deepika Padukone and Ranveer Singh as brand ambassadors to appeal to the young, versatile and modern couples), overhauling its distribution channel and improving quality through
in-house manufacturing.
Exhibit 26: Lloyd – moving to a mass-premium positioning
Source: Company
RAC prices now largely on par with Voltas and Blue Star’s: To improve its brand perception, Lloyd has largely aligned its prices to those of Voltas and Blue Star by narrowing the price differential to <5% currently. Lloyd is now focusing on providing
a technology-rich portfolio (like Grande ACs, U-LED TVs and IoT-ready products).
Complete overhaul of distribution channel
Before acquisition, Lloyd was more of an economy-mass brand with stronger operations in tier-2 and -3 towns, ~10,000 display-points and 600+ service centres across India. Most of its sales were handled by a few large dealers who sold products in volume at huge discounts. For this reason, Lloyd was perceived more as a discount player than a brand commanding any pricing power. It also had limited presence in modern retail stores and online formats.
Over the years, HAVL has undertaken several initiatives to increase Lloyd’s product visibility and distribution reach, including:
▪ Reduced dependence on dealers encouraging discounting without much attention to the brand and appointed new dealers/ distributors to fit the HAVL culture.
▪ Focused on building long-term relations with dealers via brand building initiatives
and helping them expand their business by selling HAVL’s other products.
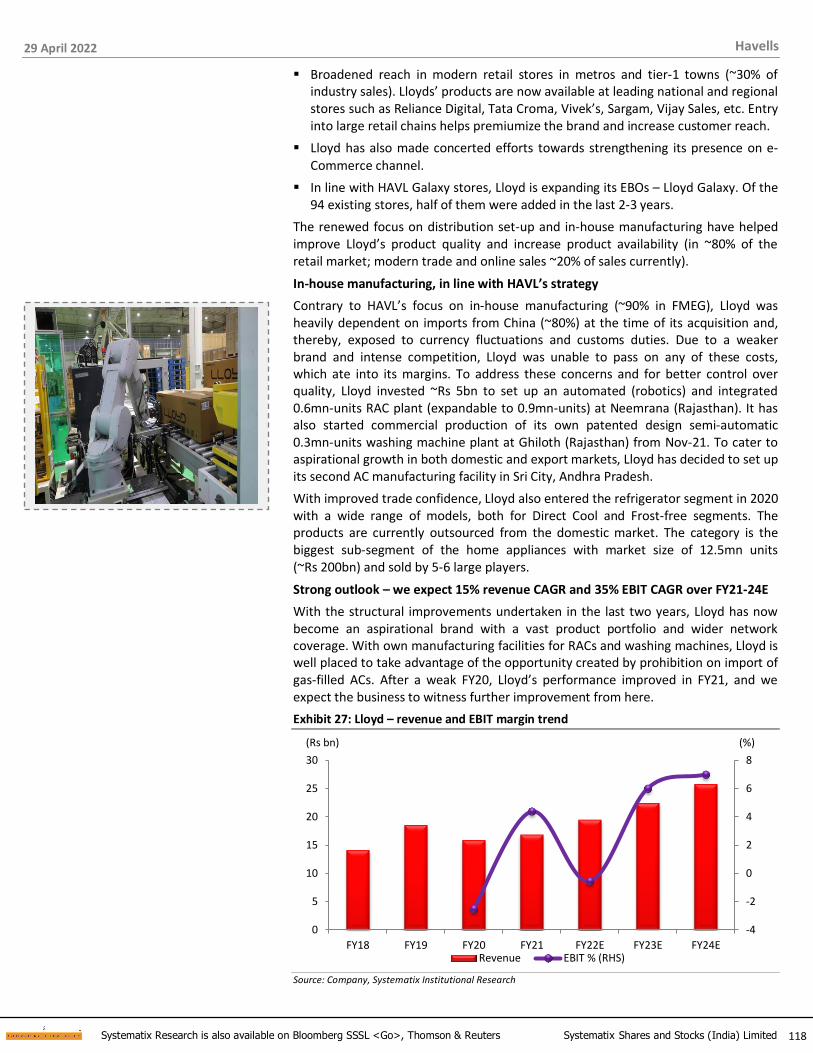
29 April 2022
118 Systematix Research is also available on Bloomberg SSSL <Go>, Thomson & Reuters Systematix Shares and Stocks (India) Limited
Havells
▪ Broadened reach in modern retail stores in metros and tier-1 towns (~30% of industry sales). Lloyds’ products are now available at leading national and regional stores such as Reliance Digital, Tata Croma, Vivek’s, Sargam, Vijay Sales, etc. Entry into large retail chains helps premiumize the brand and increase customer reach.
▪ Lloyd has also made concerted efforts towards strengthening its presence on e-
Commerce channel.
▪ In line with HAVL Galaxy stores, Lloyd is expanding its EBOs – Lloyd Galaxy. Of the 94 existing stores, half of them were added in the last 2-3 years.
The renewed focus on distribution set-up and in-house manufacturing have helped improve Lloyd’s product quality and increase product availability (in ~80% of the retail market; modern trade and online sales ~20% of sales currently).
In-house manufacturing, in line with HAVL’s strategy
Contrary to HAVL’s focus on in-house manufacturing (~90% in FMEG), Lloyd was heavily dependent on imports from China (~80%) at the time of its acquisition and, thereby, exposed to currency fluctuations and customs duties. Due to a weaker brand and intense competition, Lloyd was unable to pass on any of these costs, which ate into its margins. To address these concerns and for better control over quality, Lloyd invested ~Rs 5bn to set up an automated (robotics) and integrated 0.6mn-units RAC plant (expandable to 0.9mn-units) at Neemrana (Rajasthan). It has also started commercial production of its own patented design semi-automatic 0.3mn-units washing machine plant at Ghiloth (Rajasthan) from Nov-21. To cater to aspirational growth in both domestic and export markets, Lloyd has decided to set up its second AC manufacturing facility in Sri City, Andhra Pradesh.
With improved trade confidence, Lloyd also entered the refrigerator segment in 2020 with a wide range of models, both for Direct Cool and Frost-free segments. The products are currently outsourced from the domestic market. The category is the biggest sub-segment of the home appliances with market size of 12.5mn units (~Rs 200bn) and sold by 5-6 large players.
Strong outlook – we expect 15% revenue CAGR and 35% EBIT CAGR over FY21-24E
With the structural improvements undertaken in the last two years, Lloyd has now become an aspirational brand with a vast product portfolio and wider network coverage. With own manufacturing facilities for RACs and washing machines, Lloyd is well placed to take advantage of the opportunity created by prohibition on import of gas-filled ACs. After a weak FY20, Lloyd’s performance improved in FY21, and we expect the business to witness further improvement from here.
Exhibit 27: Lloyd – revenue and EBIT margin trend
-4
-2
0
2
4
6
8
0
5
10
15
20
25
30
FY18 FY19 FY20 FY21 FY22E FY23E FY24E
(%)(Rs bn)
Revenue EBIT % (RHS)
Source: Company, Systematix Institutional Research
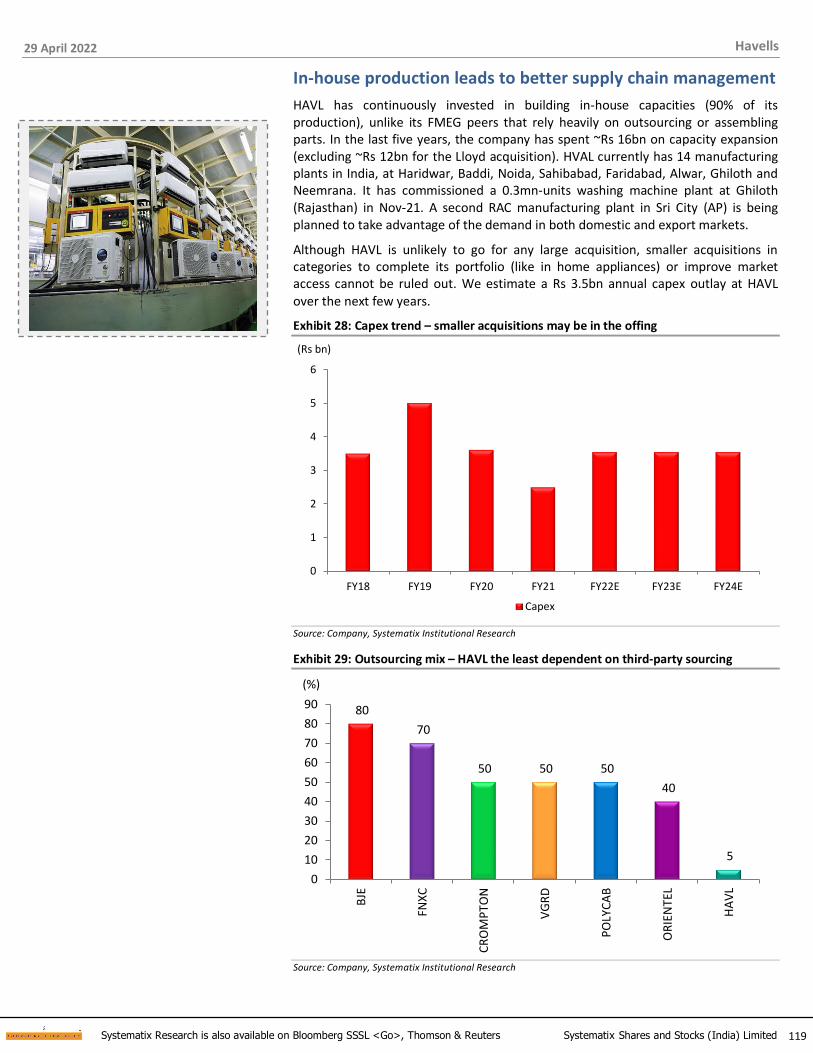
29 April 2022
119 Systematix Research is also available on Bloomberg SSSL <Go>, Thomson & Reuters Systematix Shares and Stocks (India) Limited
Havells
In-house production leads to better supply chain management
HAVL has continuously invested in building in-house capacities (90% of its production), unlike its FMEG peers that rely heavily on outsourcing or assembling parts. In the last five years, the company has spent ~Rs 16bn on capacity expansion (excluding ~Rs 12bn for the Lloyd acquisition). HVAL currently has 14 manufacturing plants in India, at Haridwar, Baddi, Noida, Sahibabad, Faridabad, Alwar, Ghiloth and Neemrana. It has commissioned a 0.3mn-units washing machine plant at Ghiloth (Rajasthan) in Nov-21. A second RAC manufacturing plant in Sri City (AP) is being planned to take advantage of the demand in both domestic and export markets.
Although HAVL is unlikely to go for any large acquisition, smaller acquisitions in categories to complete its portfolio (like in home appliances) or improve market access cannot be ruled out. We estimate a Rs 3.5bn annual capex outlay at HAVL
over the next few years.
Exhibit 28: Capex trend – smaller acquisitions may be in the offing
0
1
2
3
4
5
6
FY18 FY19 FY20 FY21 FY22E FY23E FY24E
(Rs bn)
Capex
Source: Company, Systematix Institutional Research
Exhibit 29: Outsourcing mix – HAVL the least dependent on third-party sourcing
80
70
50 50 50
40
5
0
10
20
30
40
50
60
70
80
90
BJE
FNX
C
CR
OM
PTO
N
VG
RD
PO
LYC
AB
OR
IEN
TEL
HA
VL
(%)
Source: Company, Systematix Institutional Research
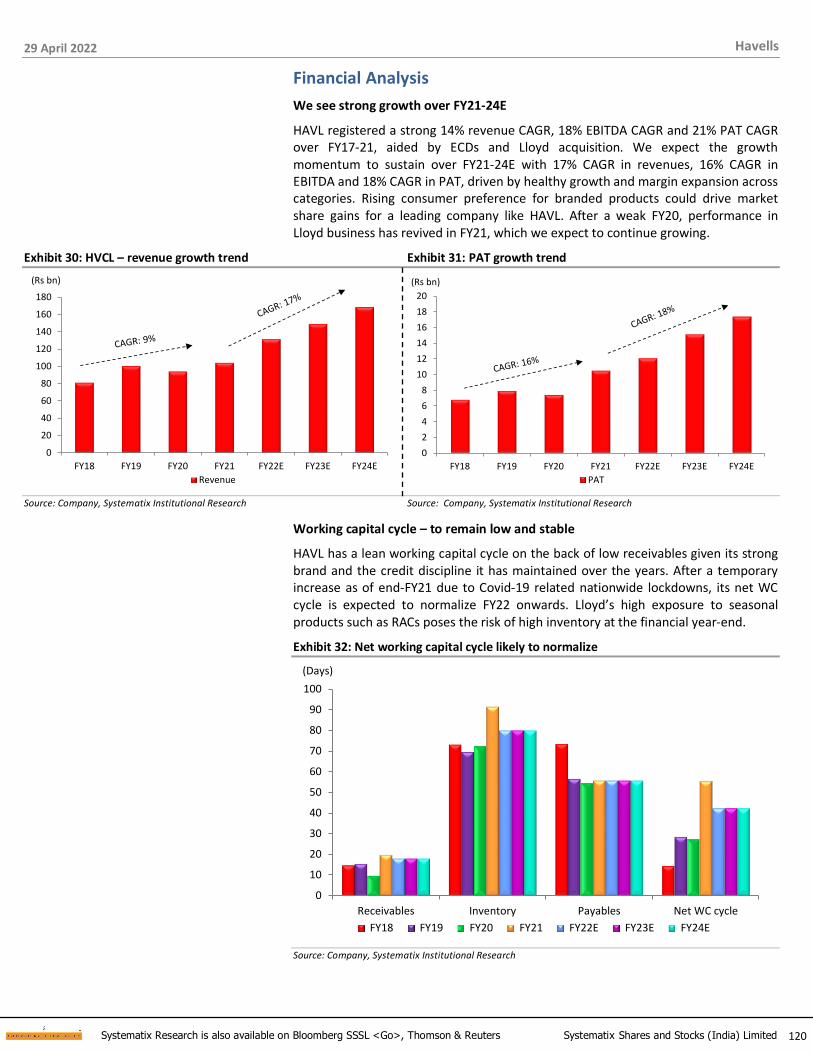
29 April 2022
120 Systematix Research is also available on Bloomberg SSSL <Go>, Thomson & Reuters Systematix Shares and Stocks (India) Limited
Havells
Financial Analysis
We see strong growth over FY21-24E
HAVL registered a strong 14% revenue CAGR, 18% EBITDA CAGR and 21% PAT CAGR over FY17-21, aided by ECDs and Lloyd acquisition. We expect the growth momentum to sustain over FY21-24E with 17% CAGR in revenues, 16% CAGR in EBITDA and 18% CAGR in PAT, driven by healthy growth and margin expansion across categories. Rising consumer preference for branded products could drive market share gains for a leading company like HAVL. After a weak FY20, performance in Lloyd business has revived in FY21, which we expect to continue growing.
Exhibit 30: HVCL – revenue growth trend Exhibit 31: PAT growth trend
0
20
40
60
80
100
120
140
160
180
FY18 FY19 FY20 FY21 FY22E FY23E FY24E
(Rs bn)
Revenue
0
2
4
6
8
10
12
14
16
18
20
FY18 FY19 FY20 FY21 FY22E FY23E FY24E
(Rs bn)
PAT
Source: Company, Systematix Institutional Research Source: Company, Systematix Institutional Research
Working capital cycle – to remain low and stable
HAVL has a lean working capital cycle on the back of low receivables given its strong brand and the credit discipline it has maintained over the years. After a temporary increase as of end-FY21 due to Covid-19 related nationwide lockdowns, its net WC cycle is expected to normalize FY22 onwards. Lloyd’s high exposure to seasonal products such as RACs poses the risk of high inventory at the financial year-end.
Exhibit 32: Net working capital cycle likely to normalize
0
10
20
30
40
50
60
70
80
90
100
Receivables Inventory Payables Net WC cycle
(Days)
FY18 FY19 FY20 FY21 FY22E FY23E FY24E
Source: Company, Systematix Institutional Research
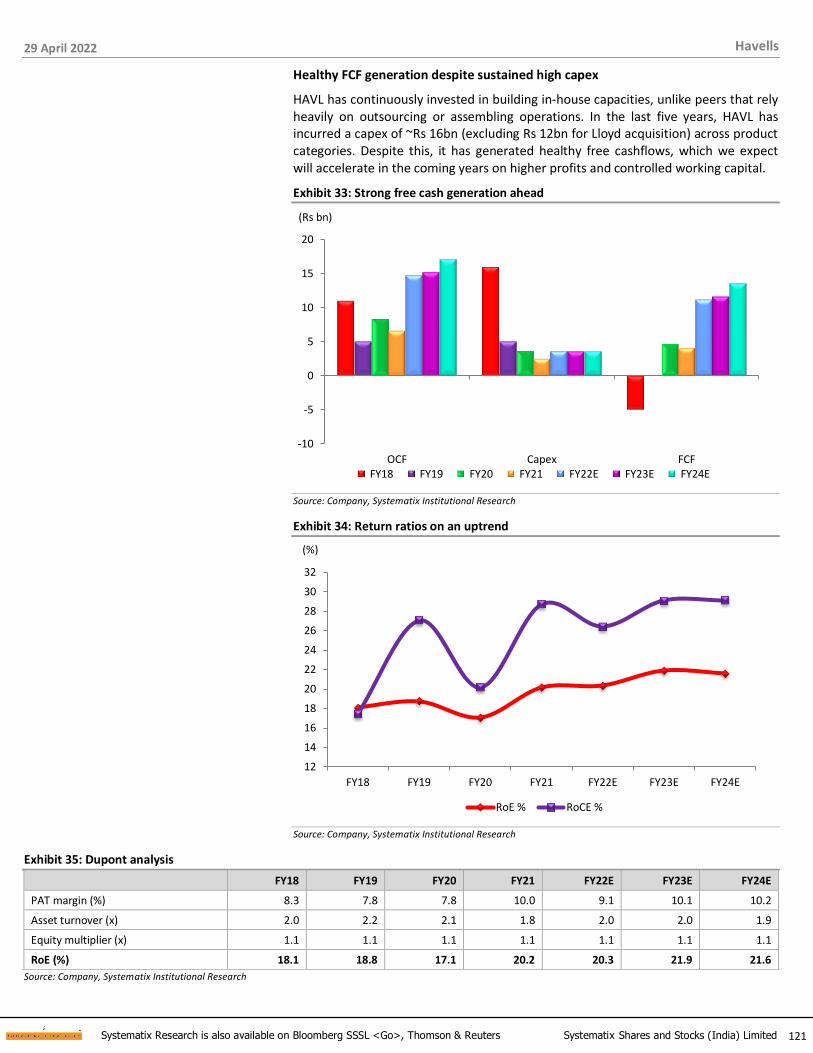
29 April 2022
121 Systematix Research is also available on Bloomberg SSSL <Go>, Thomson & Reuters Systematix Shares and Stocks (India) Limited
Havells
Healthy FCF generation despite sustained high capex
HAVL has continuously invested in building in-house capacities, unlike peers that rely heavily on outsourcing or assembling operations. In the last five years, HAVL has incurred a capex of ~Rs 16bn (excluding Rs 12bn for Lloyd acquisition) across product categories. Despite this, it has generated healthy free cashflows, which we expect will accelerate in the coming years on higher profits and controlled working capital.
Exhibit 33: Strong free cash generation ahead
-10
-5
0
5
10
15
20
OCF Capex FCF
(Rs bn)
FY18 FY19 FY20 FY21 FY22E FY23E FY24E
Source: Company, Systematix Institutional Research
Exhibit 34: Return ratios on an uptrend
12
14
16
18
20
22
24
26
28
30
32
FY18 FY19 FY20 FY21 FY22E FY23E FY24E
(%)
RoE % RoCE %
Source: Company, Systematix Institutional Research
Exhibit 35: Dupont analysis FY18 FY19 FY20 FY21 FY22E FY23E FY24E
PAT margin (%) 8.3 7.8 7.8 10.0 9.1 10.1 10.2
Asset turnover (x) 2.0 2.2 2.1 1.8 2.0 2.0 1.9
Equity multiplier (x) 1.1 1.1 1.1 1.1 1.1 1.1 1.1
RoE (%) 18.1 18.8 17.1 20.2 20.3 21.9 21.6
Source: Company, Systematix Institutional Research

29 April 2022
122 Systematix Research is also available on Bloomberg SSSL <Go>, Thomson & Reuters Systematix Shares and Stocks (India) Limited
Havells
Valuation and Outlook
We like HAVL for its leadership position in FMEG. By leveraging its strong brand pull, mass-premium product range, vast distribution network and robust processes, the company has emerged among the top-3 in many of the FMEG product categories. Among peers, HAVL enjoys the highest margins in many product categories and generates healthy FCF despite high capex (unlike most peers, the company has opted for in-house production).
HAVL witnessed strong growth over FY17-21 (14% revenue CAGR, 18% EBITDA CAGR and 21% PAT CAGR), led by ECDs and Lloyd acquisition. Over FY21-24E, we expect further recovery across business segments including Lloyd to drive a 17% revenue CAGR, 16% EBITDA CAGR and 18% PAT CAGR for the company with RoE of ~22% and healthy FCFs (key to sustaining a high valuation).
However, despite HAVL’s healthy long-term prospects, we initiate coverage on the stock with a HOLD rating due to its rich valuations. We assign a target price of Rs 1,383 (6% upside from CMP), based on 50x FY24E earnings (near its 5-year mean). Strong growth and FCF, and a higher RoE are key to the stock sustaining valuation at such high levels.
Exhibit 36: 1-year forward PE band and standard deviation
0
10
20
30
40
50
60
70
80
Ap
r-1
7
Jul-
17
Oct
-17
Jan
-18
Ap
r-1
8
Jul-
18
Oct
-18
Jan
-19
Ap
r-1
9
Jul-
19
Oct
-19
Jan
-20
Ap
r-2
0
Jul-
20
Oct
-20
Jan
-21
Ap
r-2
1
Jul-
21
Oct
-21
Jan
-22
Ap
r-2
2
P/E Mean +1 SD -1 SD
-1SD
+1SD
Mean
Source: BSE, Systematix Institutional Research

29 April 2022
123 Systematix Research is also available on Bloomberg SSSL <Go>, Thomson & Reuters Systematix Shares and Stocks (India) Limited
Havells
Key risks and risk mitigating measures
Volatility in raw material prices and foreign currency
Copper, aluminium and polymers are key raw materials for W&C and other electrical goods and comprise ~65% of revenues from these products for HAVL. Thus, any material volatility in raw material prices would lead to operating margin fluctuations for the company and pose a key risk to our estimates. HAVL, being the market leader, has always been proactive in taking price hikes as and when required to
maintain its margin profile.
Slowdown in government’s infra push, private capex
The government’s infra push has been a key growth driver for industrial products such as cables and switchgears. Hence, any slowdown in government spending on infra and private capex could significantly dampen HAVL’s growth prospects. However, a well-diversified portfolio with ~75% of revenues from B2C products acts as a cushion for the company.
Weak real estate activity
Demand for new housing has been subdued for the last couple of years, which has impacted demand for electric wires. While there are signs of revival in housing demand, a reversal can impact the growth outlook of wires. HAVL has a strong dealer network in W&C and, therefore, will continue to grow faster than the industry.
Hyper-competition in the marketplace
The presence of many large players as well as a host of fragmented regional players makes the consumer electricals industry highly competitive. With reduced barriers of entry from the increasing pervasiveness of digital commerce channels and emergence of large Original Equipment Manufacturers (OEMs) and Original Design Manufacturers (ODMs), many companies are venturing into the consumer electricals space. Increased competition could lead to irrational price behaviour by some market participants. While a price war could have a negative impact, we believe HAVL will be the least impacted given its leadership position, strong brand equity and a vast distribution network.

29 April 2022
124 Systematix Research is also available on Bloomberg SSSL <Go>, Thomson & Reuters Systematix Shares and Stocks (India) Limited
Havells
Annexures

29 April 2022
125 Systematix Research is also available on Bloomberg SSSL <Go>, Thomson & Reuters Systematix Shares and Stocks (India) Limited
Havells
Company Background
A well-diversified and leading consumer durables company, HAVL has 14 manufacturing units, 39 branch offices and an all-India network of 14,270+ dealers catering to 180,000+ retail points. The company has joined the ranks of top-3 in many of the product categories (21 currently) by leveraging its strong brand pull and vast distribution network.
Exhibit 37: HAVL – leader in the ECD segment Exhibit 38: Journey and key milestones
49 48
33
20
10 8
1
0
10
20
30
40
50
60
HA
VL
CR
OM
PTO
N
BJE
OR
IEN
TEL
PO
LYC
AB
VG
RD
FNX
C
(Rs bn)Revenue (FY21)
Source: Company, Systematix Institutional Research Source: Company
From being an FMEG company, HAVL has broadened its portfolio to large appliances by acquiring Lloyd: HAVL currently has a wide range of products including Industrial and Domestic Circuit Protection Switchgears, Cables, Motors, Pumps, Solar Products, Fans, Power Capacitors, LED Lamps and Luminaries for Domestic, Commercial and Industrial applications, Modular Switches, Water Heaters, Coolers and Domestic Appliances, Personal Grooming, Air Purifiers, Water Purifiers, Air Conditioners, Televisions, Washing Machines and Refrigerators covering the entire range of household, commercial and industrial electrical needs. Its prestigious brands include Havells, Crabtree, Standard and REO in FMEG and Lloyd in large home-appliances.
Exhibit 39: Revenue mix (FY21) Exhibit 40: HAVL offers a complete range of consumer durables
14%
31%
10%
23%
6%
16%
Switchgear
Cables & wires
Lighting
ECD
Others
Lloyd
Source: Company Source: Company
Manufacturing locations. HAVL’s manufacturing facilities are located at Faridabad in Haryana, Alwar, Ghiloth and Neemrana in Rajasthan, Haridwar in Uttarakhand, Sahibabad in Uttar Pradesh and Baddi in Himachal Pradesh. The R&D facilities are located at
Noida (Uttar Pradesh) and Bangalore (innovation hub).
Year Remarks
1958 Commenced business in Delhi
1971 Acquired ‘Havells’ brand
1983 Havells India Limited was incorporated
1993 Got listed on stock exchanges
2003 Launched fans & lighting; set up plants for switchgears, fans & CFLs
2007 Acquired the global business of ‘Sylvania’
2015 Divestment of Sylvania; focus on domestic expansion
2017 Acquisition of ‘Llyod’ consumer durables business
2019 Commissioned an in-house AC plant at Ghiloth (Rajasthan)
2021 Launched Refrigerators business; set up a Washing Machines capacity
Switchgears Domestic Switchgears, Industrial Switchgears, Switches, Automation
Cable Power Cables, Flexible Cables
Lighting & Fixtures
Lighting Strips, Street Light, Solar Light, LED
Electrical Consumer Durables
Fans, Water Heaters, Small Domestic Appliances (Mixer Grinders etc), Water Purifier, Personal Grooming
Lloyd Consumers
Air Conditioners, LED TVs, Washing Machine, Refrigerator

29 April 2022
126 Systematix Research is also available on Bloomberg SSSL <Go>, Thomson & Reuters Systematix Shares and Stocks (India) Limited
Havells
Exhibit 41: Manufacturing locations
Source: Company
Exhibit 42: Manufacturing plant in Ghiloth, Rajasthan
Source: Company

29 April 2022
127 Systematix Research is also available on Bloomberg SSSL <Go>, Thomson & Reuters Systematix Shares and Stocks (India) Limited
Havells
Promoters and key management personnel
Anil Rai Gupta, Promoter, CMD and CEO, has played a key role in transforming HAVL from a family-driven domestic brand to a
globally recognised consumer durables company. He is an MBA from Wake Forest University, North Carolina, USA.
Ameet Kumar Gupta, Whole-time director, has been with the QRG group for more than two decades and, along with being the CMD, handles business development at HAVL. He is also responsible for product introduction and development and setting up manufacturing plants for the group. He has a BE degree from DU and an MBA from Wake Forest University.
Rajesh Kumar Gupta, Group CFO, has been with the group for more than three decades and has played a key role in establishing the organizational culture, systems and processes at HAVL.
Exhibit 43: Shareholding pattern and key shareholders
Equity stake (%) Key institutional holders % equity
Sep-21 Dec-21 Mar-22 Mar-22
Promoters 59.5 59.5 59.5 Nalanda India 5.3
Free float 40.5 40.5 40.5 LIC 3.8
- Foreign Institutions 26.8 26.5 24.4 Government Pension Fund 2.0
- Domestic Institutions 6.2 6.4 8.3 Smallcap World Fund 1.8
- Public 7.5 7.7 7.8 Mirae MF 1.2
Source: BSE, Bloomberg

29 April 2022
128 Systematix Research is also available on Bloomberg SSSL <Go>, Thomson & Reuters Systematix Shares and Stocks (India) Limited
Havells
Annual Report Analysis (FY17 to FY21)
Exhibit 44: Annual Report Analysis
Year Demand Scenario, outlook and concerns Acquisitions and JVs Plans and initiatives
FY17
• Good growth expectations for the Indian Consumer Electricals industry owing to government's focus on electrification, infrastructure and housing and consumer aspirations for better standards of living
• Havells to immensely benefit from its wide distribution base
• However, growth overhang due to rising competitive intensity, slowdown in construction activity and unavailability of regular and quality power
• Acquisition of consumer durables business of Lloyd Electric marked entry into ACs, LED TVs and washing machines
• Divested its 50:50 JV in China, the remaining 20% stake in Feilo Exim, remainder 20% stake of FML Feilo Malta and 100% stake in Havells Sylvania Thailand
• Increased stake in Promptec Renewable Energy to 68.92%
• Entry into large appliances business through Lloyd's acquisition
• Launched personal-grooming products
• Entered solar products and projects segment
• Set up a new switchgear plant in Guwahati, Assam
• Enhanced lamps manufacturing capacity 3x to 1.5mn-units
FY18
• Revenues grew 33% YoY; PAT up 17%
• To develop online dealer portal "Havells mKonnect" and "eSampark" for better engagement with channel partners
• Completed acquisition of Lloyd business
• Divested many of its global subsidiaries as part of business consolidation
• Setting up of AC plants for Lloyd in Rajasthan; tied up with Hyundai Electric, South Korea for technology transfer for Magnetic Contactor
FY19
• Revenues up 24% YoY; PAT grew 11%
• A gradual improvement in the economic environment post the transitional impact of GST implementation
• Positive developments under rural housing likely to trigger the latent demand
• Increased stake in Promptec Renewable Energy to 100%
• Merged four wholly-owned subsidiaries (Havells Global, Standard Electrical, Lloyd Consumer and Promptec Renewable) with Havells India as part of group restructuring
• Commissioned its first AC plant
• Became the first FMEG company in India offering doorstep service via its initiative ‘Havells Connect’ across the country
• Expanded its brand shops and presence in newer channels like organized retail and e-Commerce
• Set target to expand footprint in semi-urban and rural markets
FY20
• The year started with weak demand due to a slowdown in real estate, and industrial and infrastructure segments along with liquidity squeeze, and ended with the COVID-19 outbreak
• Growth hit in Lloyd portfolio due to an industry-wide disruption in LED panels, increase in custom duty and a weak INR
• None
• Expansion of distribution network with sharper focus on semi-urban and rural markets
• Tie-ups with multi-brand outlets, regional retailers and modern formats
• Invested ~Rs 70mn in renewable energy
FY21
• Gained market share across categories along with increased distribution penetration and Rural Vistaar
• Target to strengthen credentials in product development, emerging consumer trends and serving through omni-channel network
• Upbeat on secular growth potential of India and Havells
• To expand direct to consumer (D2C) online business by incepting own O2O (online to offline) model
• Jiangsu Havells Sylvania, a 50:50 JV in China, undergoing liquidation process
• Lloyd entered refrigerators category – a Rs 200bn market with 12.5mn units
• Lloyd setting up facility to manufacture own patented design semi-automatic machines in Ghiloth, Rajasthan with a capacity of 0.3mn-units p.a.
Source: Company, Systematix Institutional Research
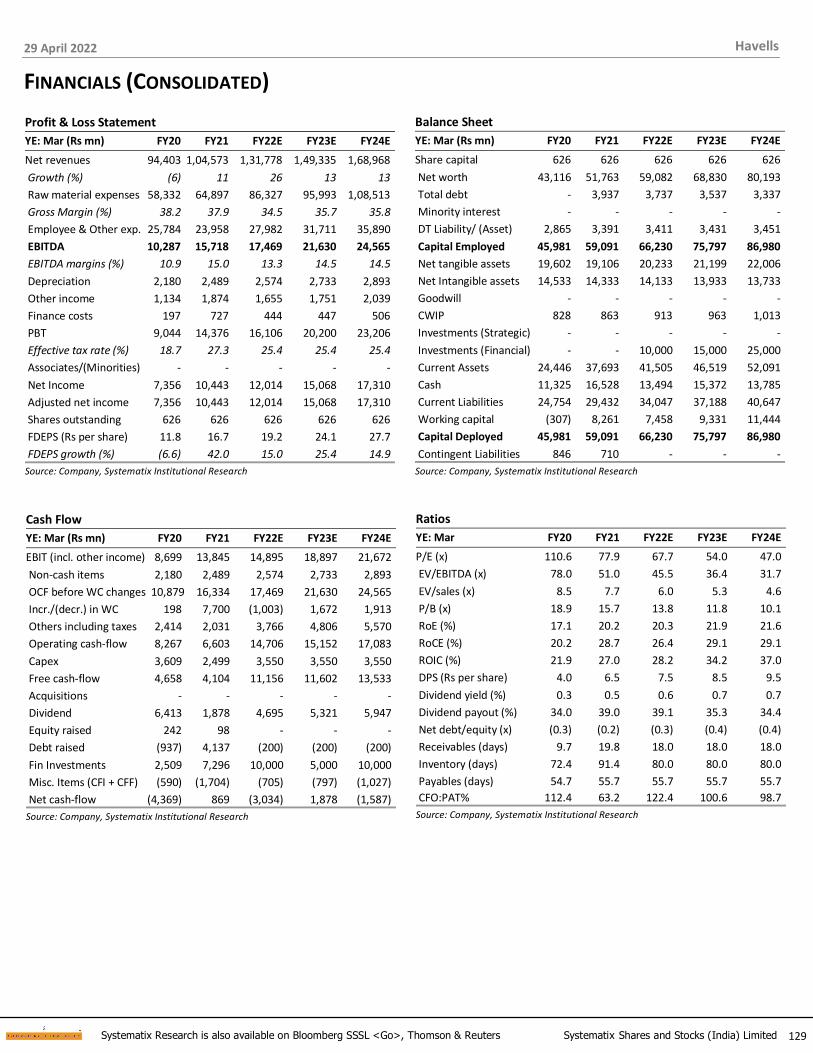
29 April 2022
129 Systematix Research is also available on Bloomberg SSSL <Go>, Thomson & Reuters Systematix Shares and Stocks (India) Limited
Havells
FINANCIALS (CONSOLIDATED)
Profit & Loss Statement
YE: Mar (Rs mn) FY20 FY21 FY22E FY23E FY24E
Net revenues 94,403 1,04,573 1,31,778 1,49,335 1,68,968
Growth (%) (6) 11 26 13 13
Raw material expenses 58,332 64,897 86,327 95,993 1,08,513
Gross Margin (%) 38.2 37.9 34.5 35.7 35.8
Employee & Other exp. 25,784 23,958 27,982 31,711 35,890
EBITDA 10,287 15,718 17,469 21,630 24,565
EBITDA margins (%) 10.9 15.0 13.3 14.5 14.5
Depreciation 2,180 2,489 2,574 2,733 2,893
Other income 1,134 1,874 1,655 1,751 2,039
Finance costs 197 727 444 447 506
PBT 9,044 14,376 16,106 20,200 23,206
Effective tax rate (%) 18.7 27.3 25.4 25.4 25.4
Associates/(Minorities) - - - - -
Net Income 7,356 10,443 12,014 15,068 17,310
Adjusted net income 7,356 10,443 12,014 15,068 17,310
Shares outstanding 626 626 626 626 626
FDEPS (Rs per share) 11.8 16.7 19.2 24.1 27.7
FDEPS growth (%) (6.6) 42.0 15.0 25.4 14.9
Source: Company, Systematix Institutional Research
Balance Sheet
YE: Mar (Rs mn) FY20 FY21 FY22E FY23E FY24E
Share capital 626 626 626 626 626
Net worth 43,116 51,763 59,082 68,830 80,193
Total debt - 3,937 3,737 3,537 3,337
Minority interest - - - - -
DT Liability/ (Asset) 2,865 3,391 3,411 3,431 3,451
Capital Employed 45,981 59,091 66,230 75,797 86,980
Net tangible assets 19,602 19,106 20,233 21,199 22,006
Net Intangible assets 14,533 14,333 14,133 13,933 13,733
Goodwill - - - - -
CWIP 828 863 913 963 1,013
Investments (Strategic) - - - - -
Investments (Financial) - - 10,000 15,000 25,000
Current Assets 24,446 37,693 41,505 46,519 52,091
Cash 11,325 16,528 13,494 15,372 13,785
Current Liabilities 24,754 29,432 34,047 37,188 40,647
Working capital (307) 8,261 7,458 9,331 11,444
Capital Deployed 45,981 59,091 66,230 75,797 86,980
Contingent Liabilities 846 710 - - -
Source: Company, Systematix Institutional Research
Cash Flow
YE: Mar (Rs mn) FY20 FY21 FY22E FY23E FY24E
EBIT (incl. other income) 8,699 13,845 14,895 18,897 21,672
Non-cash items 2,180 2,489 2,574 2,733 2,893
OCF before WC changes 10,879 16,334 17,469 21,630 24,565
Incr./(decr.) in WC 198 7,700 (1,003) 1,672 1,913
Others including taxes 2,414 2,031 3,766 4,806 5,570
Operating cash-flow 8,267 6,603 14,706 15,152 17,083
Capex 3,609 2,499 3,550 3,550 3,550
Free cash-flow 4,658 4,104 11,156 11,602 13,533
Acquisitions - - - - -
Dividend 6,413 1,878 4,695 5,321 5,947
Equity raised 242 98 - - -
Debt raised (937) 4,137 (200) (200) (200)
Fin Investments 2,509 7,296 10,000 5,000 10,000
Misc. Items (CFI + CFF) (590) (1,704) (705) (797) (1,027)
Net cash-flow (4,369) 869 (3,034) 1,878 (1,587)
Source: Company, Systematix Institutional Research
Ratios
YE: Mar FY20 FY21 FY22E FY23E FY24E
P/E (x) 110.6 77.9 67.7 54.0 47.0
EV/EBITDA (x) 78.0 51.0 45.5 36.4 31.7
EV/sales (x) 8.5 7.7 6.0 5.3 4.6
P/B (x) 18.9 15.7 13.8 11.8 10.1
RoE (%) 17.1 20.2 20.3 21.9 21.6
RoCE (%) 20.2 28.7 26.4 29.1 29.1
ROIC (%) 21.9 27.0 28.2 34.2 37.0
DPS (Rs per share) 4.0 6.5 7.5 8.5 9.5
Dividend yield (%) 0.3 0.5 0.6 0.7 0.7
Dividend payout (%) 34.0 39.0 39.1 35.3 34.4
Net debt/equity (x) (0.3) (0.2) (0.3) (0.4) (0.4)
Receivables (days) 9.7 19.8 18.0 18.0 18.0
Inventory (days) 72.4 91.4 80.0 80.0 80.0
Payables (days) 54.7 55.7 55.7 55.7 55.7
CFO:PAT% 112.4 63.2 122.4 100.6 98.7
Source: Company, Systematix Institutional Research
Systematix Research is also available on Bloomberg SSSL <Go>, Thomson & Reuters Systematix Shares and Stocks (India) Limited
Investors are advised to refer disclosures made at the end of the research report.
130
Polycab
On a long growth runway
The leader in the Indian wires and cables (W&C) industry, Polycab’s (POLYCAB) entry in FMEG has been successful with the company emerging as a prominent B2C brand. A vast and backward-integrated manufacturing base, wide distribution network and enthusiastic promoters supported by a professional management team have helped it grow faster than the industry. Going forward, rising infra spends, export opportunities and expansion to adjacent categories would drive its B2B portfolio. In FMEG, we estimate 25%+ revenue CAGR as also margin expansion for POLYCAB. Project Leap (to achieve Rs 200bn+ in revenues by FY26E), we believe, sets the stage for holistic growth for the company. However, the stock price has run up significantly (4x since its listing in 2019) and we see limited room for further re-rating in the near term. We initiate coverage on POLYCAB with a HOLD rating and an SOTP-based price target of Rs 2,649 (5% upside from CMP), based on 32x P/E for W&C (Rs 2,454) and 35x P/E for FMEG (Rs 195) on FY24E earnings.
Leader in wires & cables industry; strong positioning in FMEG: After a decade of strong 12-15% CAGR, POLYCAB’s W&C business is set to witness continued traction with: a) a step-up in infrastructure activity, b) policy reforms (Production Linked Incentives scheme, etc), and c) demand from fast-growing emerging sectors like renewable energy, electric mobility, etc. We expect 20% CAGR in its W&C business over FY21-24E, driven by higher exports and further market share gains (a leading 20-22% share within organized in FY21). Notably, organized W&C companies have been growing at the cost of unorganized players as the latter face operational challenges (high RM prices and supply chain-related issues). The company serves its pan-India network of 4,100+ distributors/ dealers and 165,000+ retail outlets through its 23 backward-integrated facilities at seven locations.
A highly successful foray into FMEG; POLYCAB growing faster than peers: Launched in FY14, POLYCAB’s FMEG business has seen ~37% revenue CAGR (albeit on a small base) for the last five years to cross Rs 10bn in FY21. With its diverse, innovative and growing product portfolio (fans, lighting, switches, switchgears, small appliances, etc), higher A&P expenditure to enhance brand visibility, engagement of influencers (electricians, small contractors, etc) and stewarded by an experienced management team, we estimate 25%+ revenue CAGR and margin expansion in the FMEG business.
Project Leap – a multiyear transformational journey: POLYCAB, under an initiative Project Leap, has charted the path to achieving all-round growth. The management aims to achieve Rs 200bn in revenues (18% CAGR over FY21-26E) and 12% EBITDA margin by FY26E. In the B2B portfolio, the focus will be to capitalize on the rising infra spends, export opportunities and expansion to adjacent/ emerging categories. Strong traction is also expected in the B2C portfolio in both wires and FMEG as also from new sales channels (online and e-commerce).
Healthy growth outlook but largely priced in: We like POLYCAB for its long-term prospects in W&C, strong growth in FMEG and healthy balance sheet. With continued traction across businesses and channels, we expect 20% revenue CAGR and 14% PAT CAGR over FY21-24E with healthy FCFs. However, after a sharp 3x returns in the stock price over the last three years since its listing, current valuations appear to be factoring in the positives in the near term. We initiate coverage on the stock with a HOLD rating and an SOTP-based target price of Rs 2,649. Volatile RM
prices and increasing competition are the key risks to our estimates.
Systematix Institutional Equities
29 April 2022
INITIATING COVERAGE
Sector: Consumer Electricals Rating: HOLD
CMP: Rs 2,520 Target Price: Rs 2,649
Stock Info
Sensex/Nifty 57,521/17,244
Bloomberg POLYCAB IN
Equity shares (mn) 149.1
52-wk High/Low 2,745/1,431
Face value Rs 10
M-Cap Rs 376 bn/ USD 5.0bn
3-m avg turnover USD 10.4mn
Financial Snapshot (Rs mn) Y/E Mar FY22E FY23E FY24E
Net sales 117,302 133,513 152,164
EBITDA 11,477 14,559 18,114
OPM % 9.8 10.9 11.9
PAT (adj.) 7,585 10,104 12,792
EPS (adj.) (Rs) 50.9 67.8 85.8
PE (x) 49.5 37.2 29.4
P/B (x) 7.1 6.3 5.4
EV/EBITDA (x) 32.0 24.9 19.7
RoE (%) 14.3 16.8 18.3
RoCE (%) 19.8 23.5 25.8
Net-D/E (x) (0.2) (0.2) (0.3)
Shareholding Pattern (%) Mar’22 Dec'21 Sep'21
Promoter 68.1 68.1 68.4
- Pledged - - -
FII 5.8 6.4 6.9
DII 9.2 8.7 8.8
Others 17.0 16.8 16.0
Stock Performance (1-year)
1,000
1,400
1,800
2,200
2,600
3,000
Ap
r-2
1
May
-21
Jun
-21
Jul-
21
Au
g-2
1
Sep
-21
Oct
-21
No
v-2
1
Dec
-21
Jan
-22
Feb
-22
Mar
-22
Ap
r-2
2
POLYCAB Sensex
Ashish Poddar [email protected] +91 22 6704 8039
Pranay Shah [email protected] +91 22 6704 8017
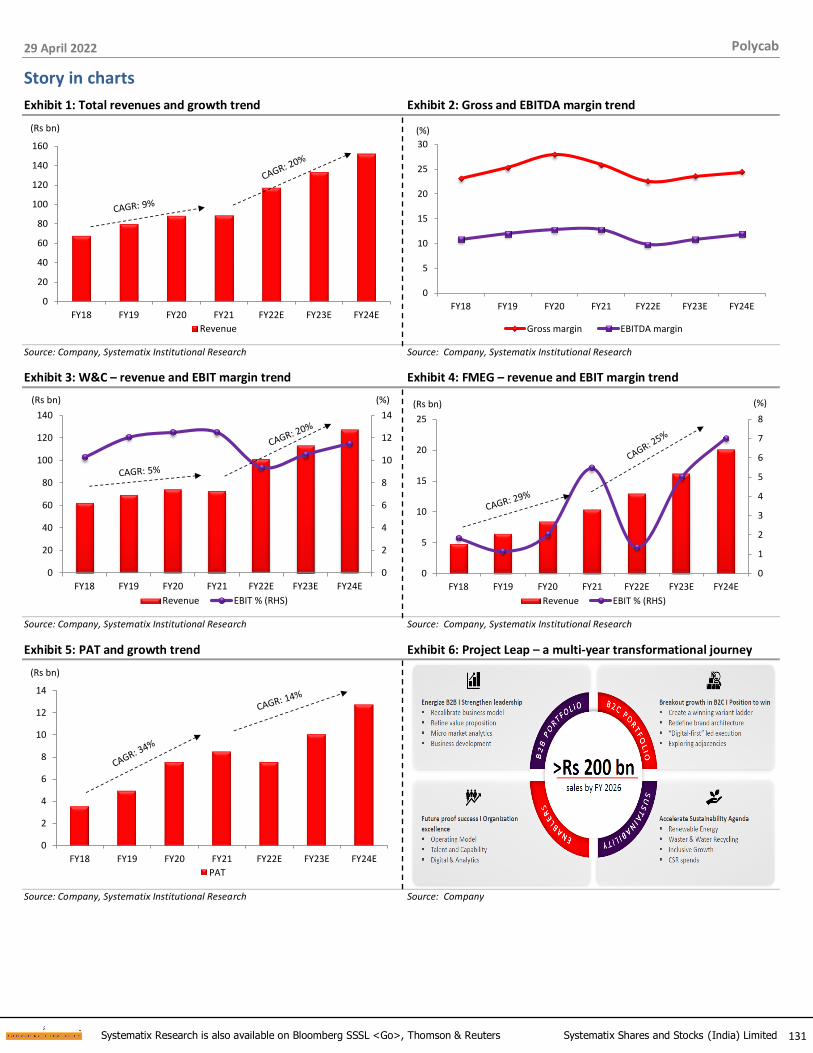
29 April 2022
131 Systematix Research is also available on Bloomberg SSSL <Go>, Thomson & Reuters Systematix Shares and Stocks (India) Limited
Polycab
Story in charts
Exhibit 1: Total revenues and growth trend Exhibit 2: Gross and EBITDA margin trend
0
20
40
60
80
100
120
140
160
FY18 FY19 FY20 FY21 FY22E FY23E FY24E
(Rs bn)
Revenue
0
5
10
15
20
25
30
FY18 FY19 FY20 FY21 FY22E FY23E FY24E
(%)
Gross margin EBITDA margin
Source: Company, Systematix Institutional Research Source: Company, Systematix Institutional Research
Exhibit 3: W&C – revenue and EBIT margin trend Exhibit 4: FMEG – revenue and EBIT margin trend
0
2
4
6
8
10
12
14
0
20
40
60
80
100
120
140
FY18 FY19 FY20 FY21 FY22E FY23E FY24E
(%)(Rs bn)
Revenue EBIT % (RHS)
0
1
2
3
4
5
6
7
8
0
5
10
15
20
25
FY18 FY19 FY20 FY21 FY22E FY23E FY24E
(%)(Rs bn)
Revenue EBIT % (RHS)
Source: Company, Systematix Institutional Research Source: Company, Systematix Institutional Research
Exhibit 5: PAT and growth trend Exhibit 6: Project Leap – a multi-year transformational journey
0
2
4
6
8
10
12
14
FY18 FY19 FY20 FY21 FY22E FY23E FY24E
(Rs bn)
PAT
Source: Company, Systematix Institutional Research Source: Company

29 April 2022
132 Systematix Research is also available on Bloomberg SSSL <Go>, Thomson & Reuters Systematix Shares and Stocks (India) Limited
Polycab
Exhibit 7: RoE and RoCE trend Exhibit 8: OCF, Capex and FCF trend
0
5
10
15
20
25
30
35
FY18 FY19 FY20 FY21 FY22E FY23E FY24E
(%)
RoE % RoCE %
-2
0
2
4
6
8
10
12
14
OCF Capex FCF
(Rs bn)
FY18 FY19 FY20 FY21 FY22E FY23E FY24E
Source: Company, Systematix Institutional Research Source: Company, Systematix Institutional Research
Exhibit 9: Polycab Galleria, Arena and Shoppee
Source: Company, Systematix Institutional Research

29 April 2022
133 Systematix Research is also available on Bloomberg SSSL <Go>, Thomson & Reuters Systematix Shares and Stocks (India) Limited
Polycab
Investment Analysis
Healthy market share gains in W&C over FY19-21
Wires & cables contribute 79% to POLYCAB’s (largest manufacturer of W&C in India) revenues. The company’s share stands at an estimated 20-22% within the organized space and 13-14% in the overall market with significant gains accruing in the last few years. POLYCAB is ~2x in size the second largest player (KEII) and manufactures various types of cables used across applications. The company serves its pan-India distribution network through 23 backward-integrated facilities at seven locations.
Exhibit 10: W&C revenues – POLYCAB ~2x the second largest peer Exhibit 11: Market share gains in W&C over FY19-21
76
36 32
23
8
0
10
20
30
40
50
60
70
80
POLYCAB KEII HAVL FNXC VGRD
(Rs bn) FY21
18
12
21
14
0
5
10
15
20
25
Organised Total
(%)
FY19 FY21
Source: Company, Systematix Institutional Research Source: Company, Systematix Institutional Research
A strong pan-India distribution network key growth enabler
POLYCAB’s pan-India distribution network comprises >4,100 authorized dealers and distributors (~50% for W&C products with long-standing relationships and huge turnover for a majority of them). The network is serviced through 52 warehouses & depots, and four regional and 16 local offices. Of late, the company has expanded aggressively in tier-2 and 3 cities. It has a wide network of 165,000+ retail outlets housing its B2C products while cables are supplied largely (80%+) through
distributors and directly to customers, including EPC and government companies.
Exhibit 12: A pan-India distribution network to support the diverse customer base and multiple product categories
4,100+ total authorized dealers &
distributers
~3,000 FMEG dealers and distributors
165,000+ retail outlets
Sales & marketing through 4 regional offices & 16 local offices pan-India
20% 28% 52%
Common Wires & Cables FMEG
By Product
22% 30% 27%
West South North
By Geography
21%
East
Source: Company

29 April 2022
134 Systematix Research is also available on Bloomberg SSSL <Go>, Thomson & Reuters Systematix Shares and Stocks (India) Limited
Polycab
Exports another focus area
After establishing strong presence in the domestic market, POLYCAB has set sights on the international markets for sustaining the growth momentum. It has export presence in 55+ countries and bagged many large orders in Africa and the Middle East in the last few years, leading to export revenues of Rs 11bn in FY20 (~12.4% of revenues) from Rs 3.4bn in FY16 (~6% of revenues). POLYCAB has set up subsidiaries in USA and Australia to grow faster in these markets. In future also, the company aims to maintain export contribution at above 10% of revenues.
Exhibit 13: Exports to be maintained at 10%+ of total revenues
5.9 6.3
5.1
3.1
12.4
8.4
0
2
4
6
8
10
12
14
0
2,000
4,000
6,000
8,000
10,000
12,000
FY16 FY17 FY18 FY19 FY20 FY21
(%)(Rs mn)
Exports % total revenue (RHS) Source: Company, Systematix Institutional Research
Regular capacity addition ahead of demand the mainstay of growth strategy
On the strength of its huge capacity, POLYCAB has been well positioned to win large orders and commit to lower turnaround times. In the last five years, the company has invested ~Rs 13bn to augment its W&C and FMEG capacities. For backward integration, it invested in a copper-rod plant in a joint venture which was recently sold off to Hindalco but with a tolling agreement. POLYCAB will continue with its
strategy of adding capacity regularly and ahead of demand for all its products.
Exhibit 14: Regular capex driving growth
0.0
0.5
1.0
1.5
2.0
2.5
3.0
3.5
FY18 FY19 FY20 FY21 FY22E FY23E FY24E
(Rs bn)
Capex
Source: Company, Systematix Institutional Research

29 April 2022
135 Systematix Research is also available on Bloomberg SSSL <Go>, Thomson & Reuters Systematix Shares and Stocks (India) Limited
Polycab
Government’s housing programme and infra-push to drive W&C sector
According to industry sources, the W&C segment in India is expected to clock ~15% CAGR over FY18-23 with rising construction activity in the residential segment and government measures in power and infrastructure as the key drivers. Rural electrification, investments in transmission & distribution for modernization and greater efficiency, increasing demand from renewable power sector (particularly solar and wind energy), infrastructure development (e.g., Smart Cities) and demand for cables from commercial establishments and public utilities (metro-rail, airports, hospitals, educational institutions, etc) are expected to continue driving growth in
the W&C segment in the medium to long term.
We expect 20% revenue CAGR in W&C over FY21-24E
After registering ~5% revenue CAGR in W&C over FY18-21, we estimate a strong 20% CAGR for POLYCAB over FY21-24E, driven by the domestic as well as export markets in both wires and cables. After a 220bps improvement over FY18-21, we see W&C EBIT margin shrinking YoY from 12.5% to ~9.5% in FY22 due to lower gross margins after the sharp rise in copper prices and given POLYCAB’s priority to gain market share. However, we estimate a gradual recovery in EBIT margins to 11.5% by FY24E.
Exhibit 15: W&C business – revenue and EBIT margin trend
0
2
4
6
8
10
12
14
0
20
40
60
80
100
120
140
FY18 FY19 FY20 FY21 FY22E FY23E FY24E
(%)(Rs bn)
Revenue EBIT % (RHS)
Source: Company, Systematix Institutional Research
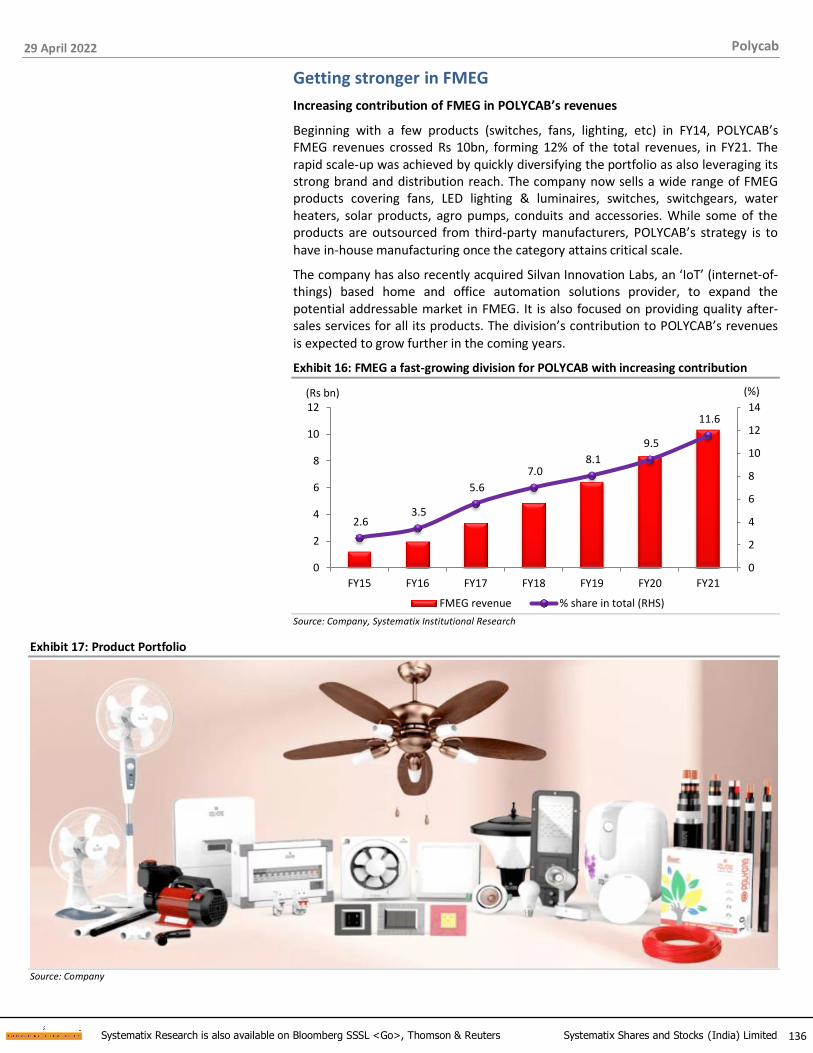
29 April 2022
136 Systematix Research is also available on Bloomberg SSSL <Go>, Thomson & Reuters Systematix Shares and Stocks (India) Limited
Polycab
Getting stronger in FMEG
Increasing contribution of FMEG in POLYCAB’s revenues
Beginning with a few products (switches, fans, lighting, etc) in FY14, POLYCAB’s FMEG revenues crossed Rs 10bn, forming 12% of the total revenues, in FY21. The rapid scale-up was achieved by quickly diversifying the portfolio as also leveraging its strong brand and distribution reach. The company now sells a wide range of FMEG products covering fans, LED lighting & luminaires, switches, switchgears, water heaters, solar products, agro pumps, conduits and accessories. While some of the products are outsourced from third-party manufacturers, POLYCAB’s strategy is to
have in-house manufacturing once the category attains critical scale.
The company has also recently acquired Silvan Innovation Labs, an ‘IoT’ (internet-of-things) based home and office automation solutions provider, to expand the potential addressable market in FMEG. It is also focused on providing quality after-sales services for all its products. The division’s contribution to POLYCAB’s revenues
is expected to grow further in the coming years.
Exhibit 16: FMEG a fast-growing division for POLYCAB with increasing contribution
2.6 3.5
5.6
7.0 8.1
9.5
11.6
0
2
4
6
8
10
12
14
0
2
4
6
8
10
12
FY15 FY16 FY17 FY18 FY19 FY20 FY21
(%)(Rs bn)
FMEG revenue % share in total (RHS)
Source: Company, Systematix Institutional Research
Exhibit 17: Product Portfolio
Source: Company
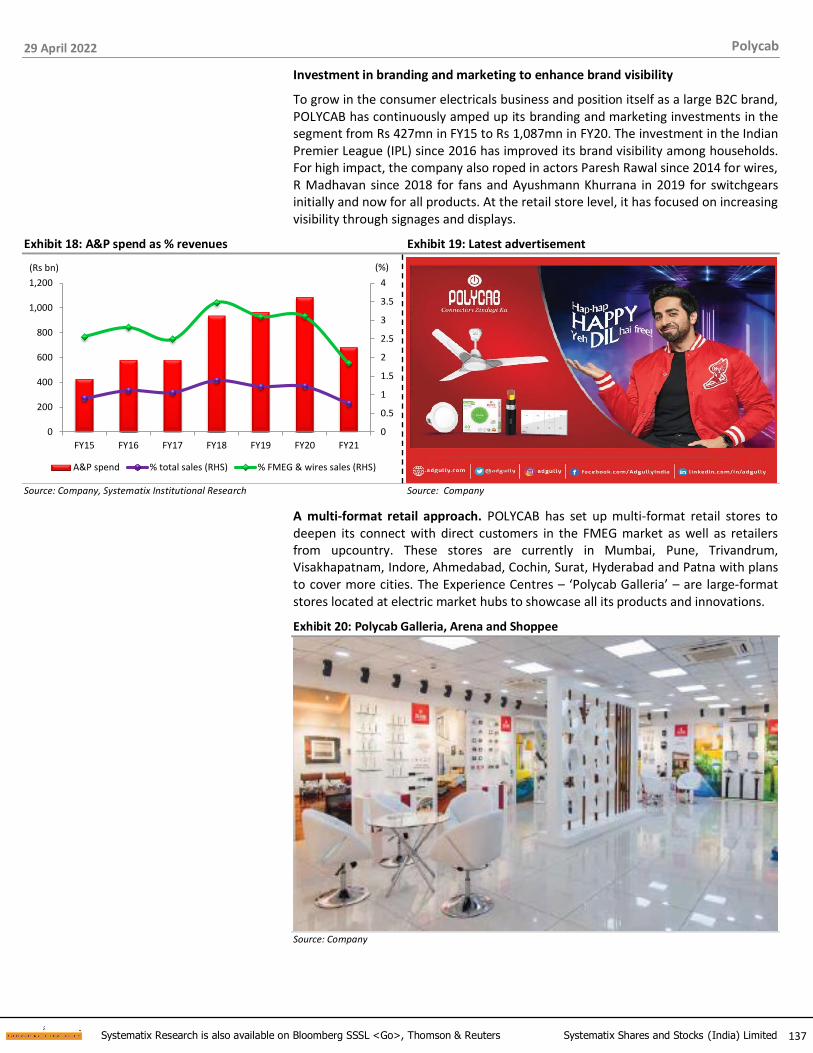
29 April 2022
137 Systematix Research is also available on Bloomberg SSSL <Go>, Thomson & Reuters Systematix Shares and Stocks (India) Limited
Polycab
Investment in branding and marketing to enhance brand visibility
To grow in the consumer electricals business and position itself as a large B2C brand, POLYCAB has continuously amped up its branding and marketing investments in the segment from Rs 427mn in FY15 to Rs 1,087mn in FY20. The investment in the Indian Premier League (IPL) since 2016 has improved its brand visibility among households. For high impact, the company also roped in actors Paresh Rawal since 2014 for wires, R Madhavan since 2018 for fans and Ayushmann Khurrana in 2019 for switchgears initially and now for all products. At the retail store level, it has focused on increasing visibility through signages and displays.
Exhibit 18: A&P spend as % revenues Exhibit 19: Latest advertisement
0
0.5
1
1.5
2
2.5
3
3.5
4
0
200
400
600
800
1,000
1,200
FY15 FY16 FY17 FY18 FY19 FY20 FY21
(%)(Rs bn)
A&P spend % total sales (RHS) % FMEG & wires sales (RHS)
Source: Company, Systematix Institutional Research Source: Company
A multi-format retail approach. POLYCAB has set up multi-format retail stores to deepen its connect with direct customers in the FMEG market as well as retailers from upcountry. These stores are currently in Mumbai, Pune, Trivandrum, Visakhapatnam, Indore, Ahmedabad, Cochin, Surat, Hyderabad and Patna with plans to cover more cities. The Experience Centres – ‘Polycab Galleria’ – are large-format stores located at electric market hubs to showcase all its products and innovations.
Exhibit 20: Polycab Galleria, Arena and Shoppee
Source: Company
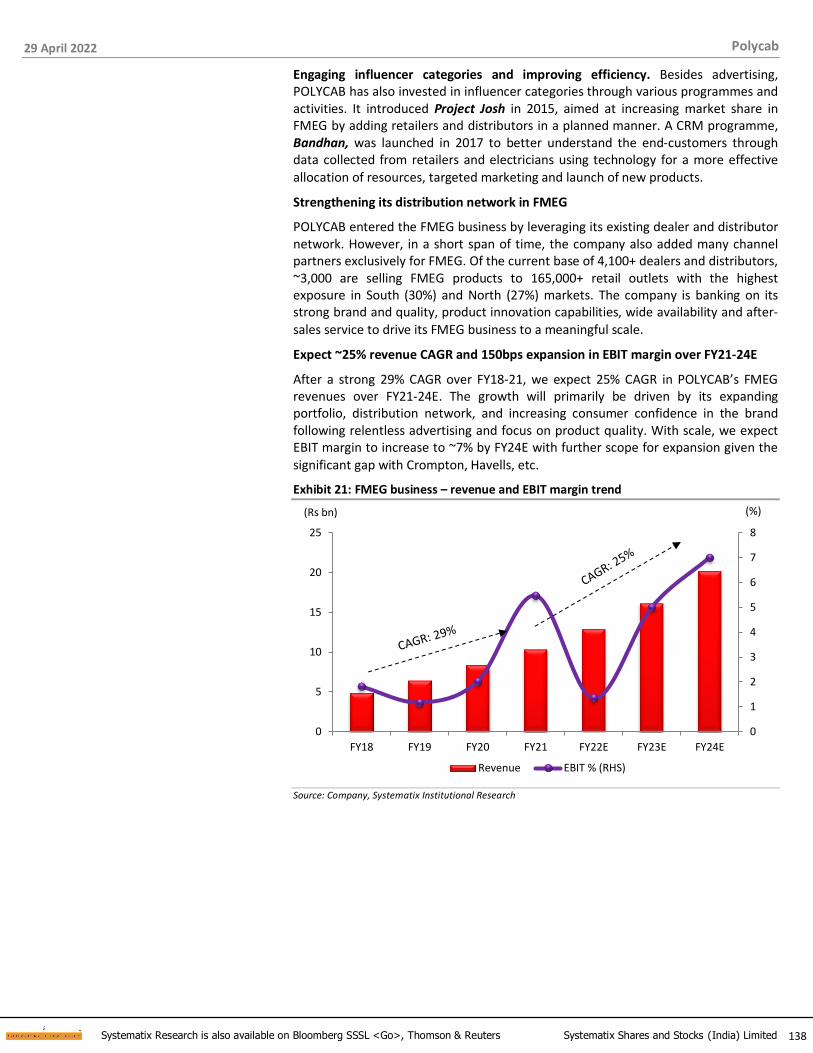
29 April 2022
138 Systematix Research is also available on Bloomberg SSSL <Go>, Thomson & Reuters Systematix Shares and Stocks (India) Limited
Polycab
Engaging influencer categories and improving efficiency. Besides advertising, POLYCAB has also invested in influencer categories through various programmes and activities. It introduced Project Josh in 2015, aimed at increasing market share in FMEG by adding retailers and distributors in a planned manner. A CRM programme, Bandhan, was launched in 2017 to better understand the end-customers through data collected from retailers and electricians using technology for a more effective allocation of resources, targeted marketing and launch of new products.
Strengthening its distribution network in FMEG
POLYCAB entered the FMEG business by leveraging its existing dealer and distributor network. However, in a short span of time, the company also added many channel partners exclusively for FMEG. Of the current base of 4,100+ dealers and distributors, ~3,000 are selling FMEG products to 165,000+ retail outlets with the highest exposure in South (30%) and North (27%) markets. The company is banking on its strong brand and quality, product innovation capabilities, wide availability and after-sales service to drive its FMEG business to a meaningful scale.
Expect ~25% revenue CAGR and 150bps expansion in EBIT margin over FY21-24E
After a strong 29% CAGR over FY18-21, we expect 25% CAGR in POLYCAB’s FMEG revenues over FY21-24E. The growth will primarily be driven by its expanding portfolio, distribution network, and increasing consumer confidence in the brand following relentless advertising and focus on product quality. With scale, we expect EBIT margin to increase to ~7% by FY24E with further scope for expansion given the
significant gap with Crompton, Havells, etc.
Exhibit 21: FMEG business – revenue and EBIT margin trend
0
1
2
3
4
5
6
7
8
0
5
10
15
20
25
FY18 FY19 FY20 FY21 FY22E FY23E FY24E
(%)(Rs bn)
Revenue EBIT % (RHS)
Source: Company, Systematix Institutional Research

29 April 2022
139 Systematix Research is also available on Bloomberg SSSL <Go>, Thomson & Reuters Systematix Shares and Stocks (India) Limited
Polycab
‘Project Leap’ a multi-year transformational journey
POLYCAB has created an efficiently functional platform over the past decade through diversification of portfolio, robust manufacturing capabilities, a strong IT backbone and strong brand positioning. Leveraging its competencies to the fullest, POLYCAB has emerged as a growth leader in the industry. To chart its growth path hereon, it has embarked on a multi-year transformational journey under ‘Project Leap’ with an aim to cross Rs 200bn in revenues by FY26. Under the programme, the company proposes to sustain its industry leading growth, cement its market leadership in W&C and build a robust new age consumer electricals business.
Exhibit 22: Project Leap – strategy to achieve Rs 200bn revenues by FY26
Source: Company
A stronger leadership team: From a promoter-driven family business, POLYCAB has strengthened its leadership team over the past few years. It has inducted a good blend of entrepreneurial and professional management personnel to take the company to the next level. These professionals have prior experience in leading companies such as Bajaj, Crompton, Havells, Orient, Panasonic, SRBC & Co, Tata Group, Unilever, Vedanta, etc and come with extensive relationships and deep
business understanding.
Exhibit 23: POLYCAB’s leadership team
(Left recently)
(Left recently)
Source: Company

29 April 2022
140 Systematix Research is also available on Bloomberg SSSL <Go>, Thomson & Reuters Systematix Shares and Stocks (India) Limited
Polycab
Healthy FCF with an improving operational performance
Along with profitable growth, POLYCAB continuously strives to shorten its working capital cycle through channel financing and better inventory management. The company generates healthy free cash flows, which has driven a significant re-rating in the stock since its listing in 2019. Despite strong growth on a high base, the company needs to commit to only a modest capex in the medium term given the low utilization at its plants as it regularly adds capacity ahead of demand. We estimate
FCF of >Rs 15bn for POLYCAB over FY22-24E.
For a better working capital cycle, the company aims to:
▪ reduce debtor days by increasing channel financing (60-70% currently in W&C and 30-40% in FMEG)
▪ keep sufficient inventories of raw material and finished goods to quickly supply
goods to customers while not carrying undue levels
▪ repay interest-bearing payables at the earliest to reduce finance costs, despite a
slight decrease in payable days
Exhibit 24: Healthy FCF on strong operating performance
-2
0
2
4
6
8
10
12
14
OCF Capex FCF
(Rs bn)
FY18 FY19 FY20 FY21 FY22E FY23E FY24E
Source: Company, Systematix Institutional Research
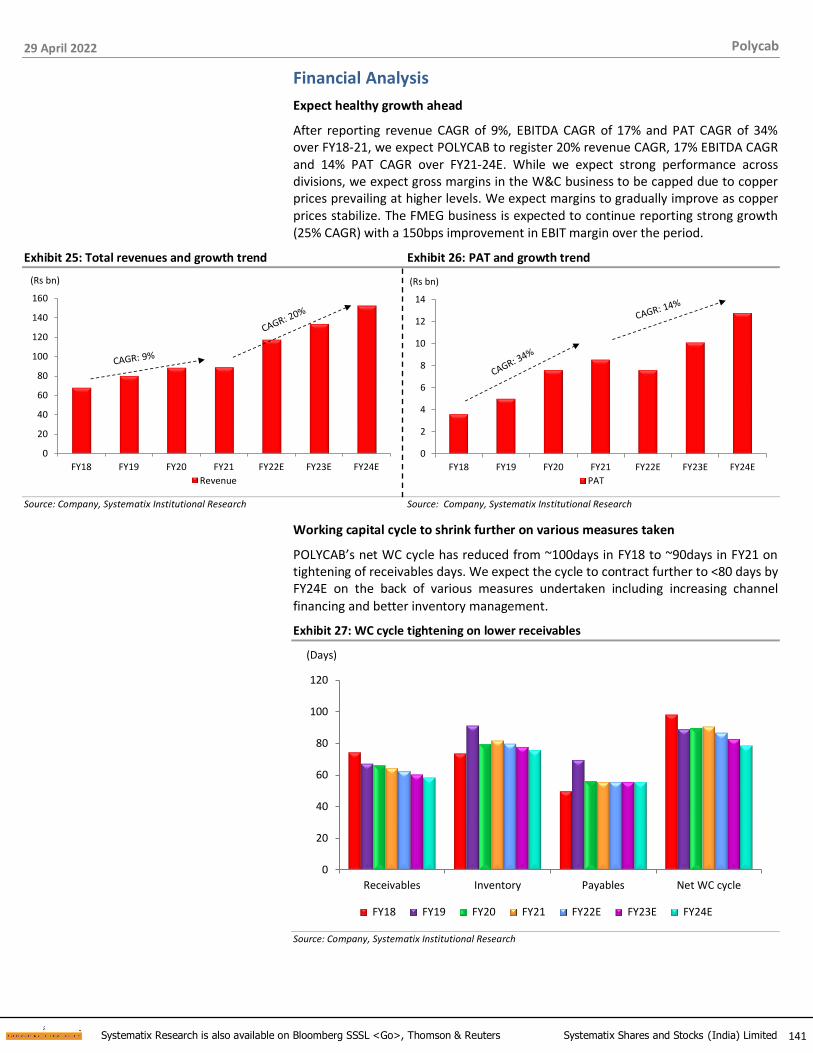
29 April 2022
141 Systematix Research is also available on Bloomberg SSSL <Go>, Thomson & Reuters Systematix Shares and Stocks (India) Limited
Polycab
Financial Analysis
Expect healthy growth ahead
After reporting revenue CAGR of 9%, EBITDA CAGR of 17% and PAT CAGR of 34% over FY18-21, we expect POLYCAB to register 20% revenue CAGR, 17% EBITDA CAGR and 14% PAT CAGR over FY21-24E. While we expect strong performance across divisions, we expect gross margins in the W&C business to be capped due to copper prices prevailing at higher levels. We expect margins to gradually improve as copper prices stabilize. The FMEG business is expected to continue reporting strong growth (25% CAGR) with a 150bps improvement in EBIT margin over the period.
Exhibit 25: Total revenues and growth trend Exhibit 26: PAT and growth trend
0
20
40
60
80
100
120
140
160
FY18 FY19 FY20 FY21 FY22E FY23E FY24E
(Rs bn)
Revenue
0
2
4
6
8
10
12
14
FY18 FY19 FY20 FY21 FY22E FY23E FY24E
(Rs bn)
PAT
Source: Company, Systematix Institutional Research Source: Company, Systematix Institutional Research
Working capital cycle to shrink further on various measures taken
POLYCAB’s net WC cycle has reduced from ~100days in FY18 to ~90days in FY21 on tightening of receivables days. We expect the cycle to contract further to <80 days by FY24E on the back of various measures undertaken including increasing channel
financing and better inventory management.
Exhibit 27: WC cycle tightening on lower receivables
0
20
40
60
80
100
120
Receivables Inventory Payables Net WC cycle
(Days)
FY18 FY19 FY20 FY21 FY22E FY23E FY24E
Source: Company, Systematix Institutional Research

29 April 2022
142 Systematix Research is also available on Bloomberg SSSL <Go>, Thomson & Reuters Systematix Shares and Stocks (India) Limited
Polycab
Healthy cash levels to restrict return ratios
POLYCAB has built capacities ahead of demand and invested heavily in capex over the last few years. It has been generating meaningful FCF since FY18, which we believe will only improve in the years to come on the back of strong growth, a shorter WC cycle and modest capex. While large cash accumulation is expected over the next few years, it will restrict the expansion in its return ratios unless paid back to investors through higher dividends/ buybacks or used for inorganic growth.
Exhibit 28: Net cash levels Exhibit 29: RoE and RoCE trend
-10
-5
0
5
10
15
20
25
FY18 FY19 FY20 FY21 FY22E FY23E FY24E
(Rs bn)
Net-cash
0
5
10
15
20
25
30
35
FY18 FY19 FY20 FY21 FY22E FY23E FY24E
(%)
RoE % RoCE %
Source: Company, Systematix Institutional Research Source: Company, Systematix Institutional Research
Exhibit 30: Dupont analysis FY18 FY19 FY20 FY21 FY22E FY23E FY24E
PAT margin (%) 5.3 6.3 8.8 9.7 6.5 7.6 8.4
Asset turnover (x) 2.2 2.6 2.2 1.8 2.1 2.1 2.1
Equity multiplier (x) 1.3 1.1 1.0 1.1 1.0 1.0 1.0
RoE (%) 15.3 17.6 19.8 18.0 14.3 16.8 18.3
Source: Company, Systematix Institutional Research
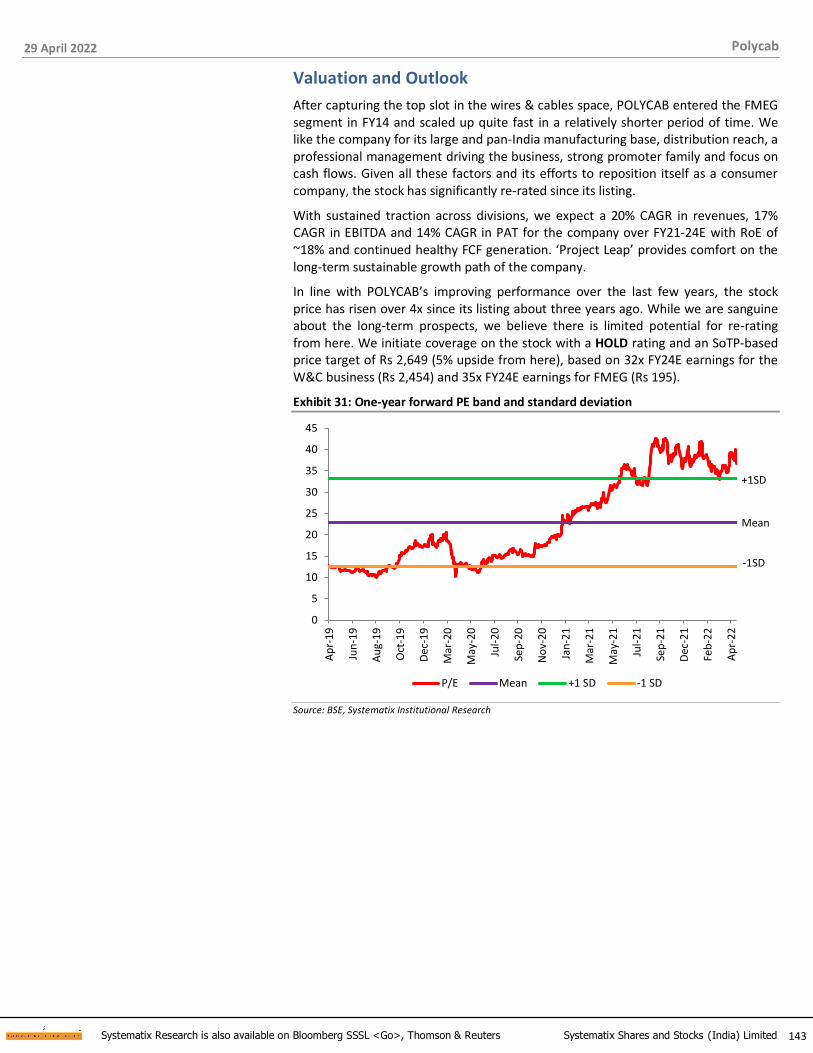
29 April 2022
143 Systematix Research is also available on Bloomberg SSSL <Go>, Thomson & Reuters Systematix Shares and Stocks (India) Limited
Polycab
Valuation and Outlook
After capturing the top slot in the wires & cables space, POLYCAB entered the FMEG segment in FY14 and scaled up quite fast in a relatively shorter period of time. We like the company for its large and pan-India manufacturing base, distribution reach, a professional management driving the business, strong promoter family and focus on cash flows. Given all these factors and its efforts to reposition itself as a consumer company, the stock has significantly re-rated since its listing.
With sustained traction across divisions, we expect a 20% CAGR in revenues, 17% CAGR in EBITDA and 14% CAGR in PAT for the company over FY21-24E with RoE of ~18% and continued healthy FCF generation. ‘Project Leap’ provides comfort on the long-term sustainable growth path of the company.
In line with POLYCAB’s improving performance over the last few years, the stock price has risen over 4x since its listing about three years ago. While we are sanguine about the long-term prospects, we believe there is limited potential for re-rating from here. We initiate coverage on the stock with a HOLD rating and an SoTP-based price target of Rs 2,649 (5% upside from here), based on 32x FY24E earnings for the W&C business (Rs 2,454) and 35x FY24E earnings for FMEG (Rs 195).
Exhibit 31: One-year forward PE band and standard deviation
0
5
10
15
20
25
30
35
40
45
Ap
r-1
9
Jun
-19
Au
g-1
9
Oct
-19
Dec
-19
Mar
-20
May
-20
Jul-
20
Sep
-20
No
v-2
0
Jan
-21
Mar
-21
May
-21
Jul-
21
Sep
-21
Dec
-21
Feb
-22
Ap
r-2
2
P/E Mean +1 SD -1 SD
-1SD
+1SD
Mean
Source: BSE, Systematix Institutional Research

29 April 2022
144 Systematix Research is also available on Bloomberg SSSL <Go>, Thomson & Reuters Systematix Shares and Stocks (India) Limited
Polycab
Key risks and risk mitigating measures
Volatility in raw material prices and foreign currency
Cost of key raw materials including copper, aluminium, PVC, galvanized iron wire, lead and XLPE form a significant ~70% of POLYCAB’s revenues. Therefore, any significant volatility in raw material prices would lead to operating margin fluctuations and pose a key risk to our estimates. The company’s metal procurement contracts come with embedded derivatives, which provides it an opportunity to finalize the purchase price at a future date, termed as provisional pricing. This helps in linking the costs to realizations through revisions in the price list and acts as a natural hedge against copper and foreign exchange volatility. POLYCAB also uses forward contracts or price escalation clauses as a hedge in large institutional orders.
A slowdown in government’s infra push
The Centre’s initiatives in the infrastructure sector have been a key growth driver for the W&C industry over the past few years. Hence, a slowdown in government spending on infra could significantly impact POLYCAB’s growth, especially given its huge front-ended investments in capacity and branding. The rising share of B2C sales though would support any slowdown in the industrial segment.
Weak real estate activity
Demand for new housing has been subdued for the past couple of years, translating into muted demand for electric wires. While there are signs of revival in the housing sector, any reversal can supress growth outlook of wires. POLYCAB has the strongest dealer network in W&C and should continue to grow faster than the industry.
Failure in new businesses
POLYCAB has always been active on exploring new products in the W&C segment for new applications. It also plans to expand its product portfolio in the FMEG segment. While the company has been known for its prudent decision making in terms of diversification, any failed new launches will impact its overall profitability.
29 April 2022
145 Systematix Research is also available on Bloomberg SSSL <Go>, Thomson & Reuters Systematix Shares and Stocks (India) Limited
Polycab
Annexures

29 April 2022
146 Systematix Research is also available on Bloomberg SSSL <Go>, Thomson & Reuters Systematix Shares and Stocks (India) Limited
Polycab
Company Background
POLYCAB is India’s largest manufacturer of wires & cables (W&C) with a 20-22% share in the organized market. It has 23 facilities with backward integration at seven locations to serve its pan-India distribution network of 4,100+ dealers and distributors and 165,000+ retail outlets. After claiming the leadership mantle in W&C, POLYCAB entered the FMEG segment in FY14 and scaled up rapidly (~37% CAGR over five years) to cross Rs 10bn in revenues in FY21. While it now offers a wide range of products in this portfolio including fans, LED lighting & luminaires, switches, switchgears, small appliances like geysers, solar products & conduits and accessories, there is ample scope to expand it further. The company has strengthened its leadership team over the last few
years to achieve its vision of Rs 200bn+ revenues by FY26 (implied CAGR of 18%).
Exhibit 32: Segment-wise revenue mix (FY21) Exhibit 33: Revenue mix – B2B/ B2C
79%
12%
9%
Cables & Wires
FMEG
EPC + Copper rods
60%
40%
B2B
B2C
Source: Company Source: Company
Exhibit 34: Journey and key milestones
Year Remarks
1964 - 96 Promoters established the business; set up a manufacturing plant at Halol
1996 Company incorporated on 10 Jan 1996
1998 Set up a facility for PVC insulated power cables, house wires, telephone cables, optical fibre cables, switch board cables and quad cables at Daman
2006 Crossed Rs 10bn in revenues
2009 Investment of Rs 4bn by IFC
2011 Crossed Rs 31bn in revenues
2013 Forayed into the switches segment
2014 Diversified into fans and LED lighting; set up manufacturing facility for MCBs at Nashik, Maharashtra
2016 Manufacturing of ceiling fans at Roorkee, Uttarakhand; JV with Trafigura for copper rod manufacturing (Ryker)
2017 JV with Techno Electromech for manufacturing of LED lighting products
2019 Listing on BSE and NSE on 16 April 2019; Commenced manufacturing of water heaters; set up Polycab Knowledge Centre
2020 Bought out the remaining 50% stake in Ryker; launched the new IOT-based brand Hohm and also Project Udaan. Rejuvenated focus on export markets
2021 Launched Project Shikhar and Polycab Expert Programme; Initiated a transformation initiative ‘Project Leap’
Source: Company
POLYCAB manufactures various types of cables to be used for different applications. Its diverse customer base includes retailers, distributors, dealers, government corporations as well as private companies in power, oil & gas, construction, IT parks, infrastructure, metal and non-metal, cement, agriculture and real estate sectors.

29 April 2022
147 Systematix Research is also available on Bloomberg SSSL <Go>, Thomson & Reuters Systematix Shares and Stocks (India) Limited
Polycab
Exhibit 35: Market leader in wires & cables with a diverse portfolio
Source: Company
Manufacturing facilities
POLYCAB has 23 backward-integrated manufacturing plants at seven locations in Gujarat, Maharashtra, Uttarakhand and Daman & Diu. The company follows a strategy of capacity addition ahead of demand, which helps it maintain market share.
Exhibit 36: Plant locations and capacities
Source: Company; Note: * annual capacities as at end-FY21

29 April 2022
148 Systematix Research is also available on Bloomberg SSSL <Go>, Thomson & Reuters Systematix Shares and Stocks (India) Limited
Polycab
Promoters and key management personnel
Inder T Jaisinghani, Promoter, Chairman and Managing Director since 2014, has been in sales, marketing, production and other
support services, and has played a major role in POLYCAB attaining the leadership slot.
Bharat A Jaisinghani, Whole-Time Director from the promoter group, is responsible for the FMEG business. He has a Master’s
degree in Operations Management from The University of Manchester.
Nikhil Jaisinghani, Whole-Time Director from the promoter group, is responsible for the LDC (cables) business. He has an MBA from The Kellogg School of Management, Northwestern University, Illinois, USA.
Gandharv Tongia, CFO, joined POLYCAB in July 2018 as Deputy CFO and was elevated to the CFO position w.e.f. 31 May 2020. A Chartered Accountant by profession, he has >16 years of work experience in auditing and consulting at S R B C and CO LLP, S.R.
Batliboi & Associates LLP and A.F. Ferguson & Co.
Exhibit 37: Shareholding pattern and key shareholders
Equity stake (%) Key institutional holders % equity
Sep-21 Dec-21 Mar-22 Mar-22
Promoters 68.4 68.1 68.1 DSP MF 1.5
Free float 31.6 31.9 31.9 Canara Robeco MF 1.2
- Foreign Institutions 6.9 6.4 5.8 T. Rowe Price 0.9
- Domestic Institutions 8.8 8.7 9.2 Tata MF 0.7
- Public 16.0 16.8 17.0 Birla MF 0.7
Source: BSE, Bloomberg

29 April 2022
149 Systematix Research is also available on Bloomberg SSSL <Go>, Thomson & Reuters Systematix Shares and Stocks (India) Limited
Polycab
Annual Report Analysis (FY19 to FY21)
Exhibit 38: Annual Report Analysis
Year Demand Scenario and outlook Plans and initiatives
FY19
• Revenue growth of 18% YoY
• Investment in IPL since 2016 provided a huge lift to brand’s visibility in households
• Achieved 12% share of wires & cables market
• Industry expected to witness ~15% CAGR for the next five years with an increase in share of organized players
• Rise in consumer spending, government initiatives in power and infrastructure, impetus from heavy industry and public enterprises and power transmission & distribution (T&D) seen as key demand drivers
• Listing on BSE and NSE
• Inaugurated its first Polycab Experience Centre
• FMEG growing rapidly, albeit on a low base
• Polycab to continue with the strategy of adding capacity ahead of demand
FY20
• Business hit due to a challenging operating environment marked by liquidity constraints, muted investments, weak consumption, volatile commodity prices and Covid-19 outbreak
• Continuous investments in various infrastructure segments and other end-user industries seen as demand drivers for a healthy double-digit growth rate in cables & wires for the next five years
• Polycab looks to replicate its project management skills across large digital infrastructure projects including Smart Cities, Surveillance, BharatNet and Digital Village
• Wire rods producing plant, Ryker, which started as a 50:50 JV with Trafigura in 2016, became a wholly owned subsidiary and commenced production in 1Q
• Incorporated a subsidiary in USA to expand business in the geography
• Incorporated Polycab Electricals and Electronics (PEEPL) to enhance manufacturing capabilities
FY21
• Consumer and market sentiment improved in the second half; Polycab's net sales grew 1% YoY, also supported by distribution expansion, portfolio augmentation and higher realizations
• Demand likely to recover gradually, driven by numerous government initiatives such as National Infrastructure Pipeline (NIP), Production Linked Incentives schemes, focus on indigenous manufacturing, higher budgetary allocation for capital expenditure, renewable energy push, digital infrastructure push, and liquidity infusion
• Project Leap – embarked on a 5-year transformational journey to cross Rs 200bn in sales with significant market share improvement across B2B and B2C categories
• Flagged off a strategic cost optimization initiative – Project Udaan; benefit to be visible in next two years
• Initiated Project Shikhar to strengthen engagement with pre-identified influencers, i.e., Retailers, Electricians and Small contractors; identified 300 high potential cities across India to expand retail reach
• Incorporated a subsidiary in Australia to expand business there
• Received certification for cables for electric vehicle (EV) applications
• Liquidated Polycab Wires Italy SRL
Source: Company, Systematix Institutional Research

29 April 2022
150 Systematix Research is also available on Bloomberg SSSL <Go>, Thomson & Reuters Systematix Shares and Stocks (India) Limited
Polycab
FINANCIALS (CONSOLIDATED)
Profit & Loss Statement
YE: Mar (Rs mn) FY20 FY21 FY22E FY23E FY24E
Net revenues 88,300 88,741 1,17,302 1,33,513 1,52,164
Growth (%) 10.6 0.5 32.2 13.8 14.0
Raw material expenses 63,686 65,749 90,903 1,02,104 1,14,998
Gross Margin (%) 27.9 25.9 22.5 23.5 24.4
Employee & Other exp. 13,263 11,580 14,922 16,850 19,052
EBITDA 11,350 11,411 11,477 14,559 18,114
EBITDA margins (%) 12.9 12.9 9.8 10.9 11.9
Depreciation 1,609 1,837 2,027 2,226 2,426
Other income 928 1,262 951 1,467 1,648
Finance costs 495 509 295 426 425
PBT 10,174 10,328 10,107 13,374 16,911
Effective tax rate (%) 24.0 16.9 24.1 24.0 24.0
Associates/(Minorities) (140) (40) (90) (60) (60)
Net Income 7,591 8,538 7,585 10,104 12,792
Adjusted net income 7,591 8,538 7,585 10,104 12,792
Shares outstanding 149 149 149 149 149
FDEPS (Rs) 51.0 57.3 50.9 67.8 85.8
FDEPS growth (%) 44.1 12.3 (11.2) 33.2 26.6
Source: Company, Systematix Institutional Research
Balance Sheet
YE: Mar (Rs mn) FY20 FY21 FY22E FY23E FY24E
Share capital 1,489 1,491 1,491 1,491 1,491
Net worth 38,364 47,539 52,888 60,009 69,819
Total debt 1,221 1,926 1,626 1,626 1,626
Minority interest 150 188 207 228 251
DT Liability/ (Asset) 175 418 408 398 388
Capital Employed 39,910 50,072 55,129 62,261 72,084
Net tangible assets 14,203 18,602 19,570 20,339 20,908
Net Intangible assets 17 94 99 104 109
Goodwill - - - - -
CWIP 2,412 991 791 591 391
Investments (Strategic) 255 118 118 118 118
Investments (Financial) 400 6,231 9,731 13,731 19,731
Current Assets 39,516 38,798 49,480 54,463 59,987
Cash 2,813 5,313 124 532 1,659
Current Liabilities 19,706 20,075 24,784 27,616 30,819
Working capital 19,810 18,723 24,696 26,847 29,168
Capital Deployed 39,910 50,072 55,129 62,261 72,084
Contingent Liabilities 3,477 1,457 - - -
Source: Company, Systematix Institutional Research
Cash Flow
YE: Mar (Rs mn) FY20 FY21 FY22E FY23E FY24E
EBIT (incl. other income) 10,071 10,467 8,950 12,232 15,588
Non-cash items 1,609 1,866 2,027 2,226 2,426
OCF before WC changes 11,680 12,333 10,977 14,459 18,014
Incr./(decr.) in WC 6,221 (2,457) 5,473 2,051 2,221
Others including taxes 3,015 2,408 2,434 3,212 4,061
Operating cash-flow 2,443 12,382 3,070 9,196 11,732
Capex 2,901 1,870 2,800 2,800 2,800
Free cash-flow (458) 10,512 270 6,396 8,932
Acquisitions - - - - -
Dividend 1,793 - 2,237 2,982 2,982
Equity raised 4,000 - - - -
Debt raised (1,194) (1,075) (300) - -
Fin Investments (33) 8,351 3,500 4,000 6,000
Misc. Items (CFI + CFF) 657 430 (577) (994) (1,178)
Net cash-flow (69) 656 (5,189) 408 1,128
Source: Company, Systematix Institutional Research
Ratios
YE: Mar FY20 FY21 FY22E FY23E FY24E
P/E (x) 49.4 44.0 49.5 37.2 29.4
EV/EBITDA (x) 32.9 32.1 32.0 24.9 19.7
EV/sales (x) 4.2 4.1 3.1 2.7 2.3
P/B (x) 9.8 7.9 7.1 6.3 5.4
RoE (%) 19.8 18.0 14.3 16.8 18.3
RoCE (%) 30.2 24.1 19.8 23.5 25.8
ROIC (%) 23.6 22.7 18.1 21.7 25.9
DPS (Rs per share) 7.0 10.0 15.0 20.0 20.0
Dividend yield (%) 0.3 0.4 0.6 0.8 0.8
Dividend payout (%) 13.7 17.5 29.5 29.5 23.3
Net debt/equity (x) (0.1) (0.2) (0.2) (0.2) (0.3)
Receivables (days) 66.1 64.3 62.3 60.3 58.3
Inventory (days) 79.6 81.8 79.8 77.8 75.8
Payables (days) 56.0 55.4 55.4 55.4 55.4
CFO:PAT% 32.2 145.0 40.5 91.0 91.7
Source: Company, Systematix Institutional Research
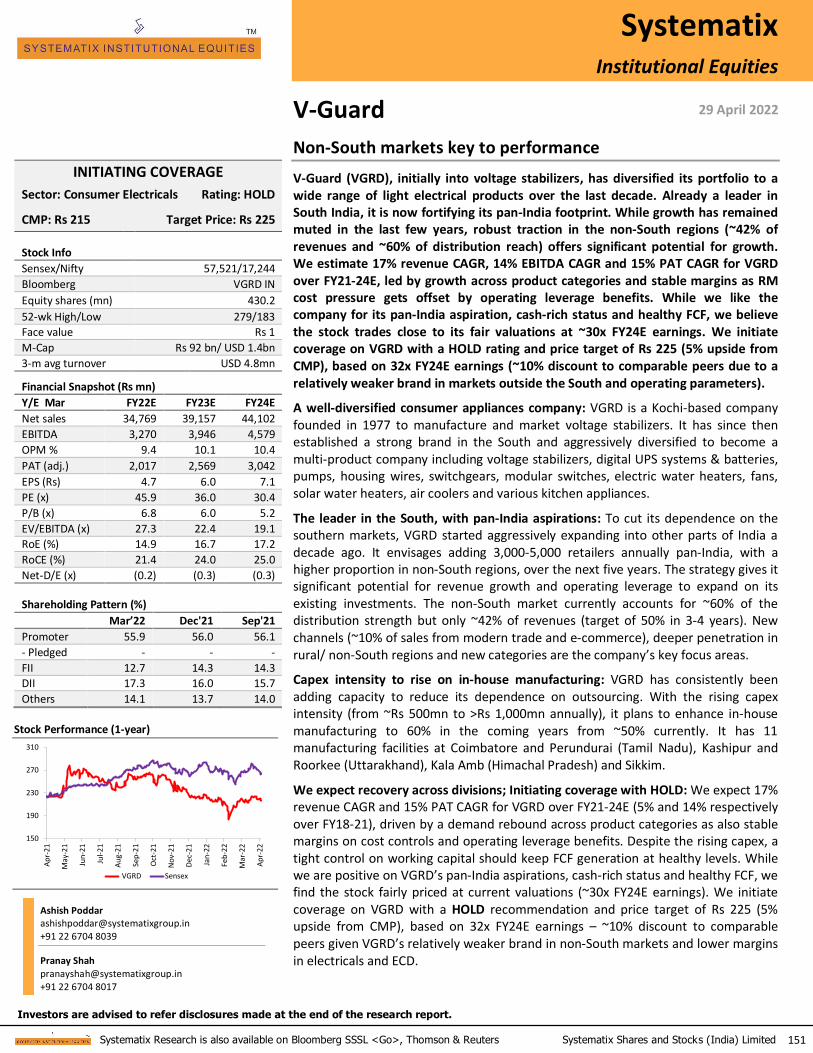
Systematix Research is also available on Bloomberg SSSL <Go>, Thomson & Reuters Systematix Shares and Stocks (India) Limited
Investors are advised to refer disclosures made at the end of the research report.
151
V-Guard
Non-South markets key to performance
V-Guard (VGRD), initially into voltage stabilizers, has diversified its portfolio to a wide range of light electrical products over the last decade. Already a leader in South India, it is now fortifying its pan-India footprint. While growth has remained muted in the last few years, robust traction in the non-South regions (~42% of revenues and ~60% of distribution reach) offers significant potential for growth. We estimate 17% revenue CAGR, 14% EBITDA CAGR and 15% PAT CAGR for VGRD over FY21-24E, led by growth across product categories and stable margins as RM cost pressure gets offset by operating leverage benefits. While we like the company for its pan-India aspiration, cash-rich status and healthy FCF, we believe the stock trades close to its fair valuations at ~30x FY24E earnings. We initiate coverage on VGRD with a HOLD rating and price target of Rs 225 (5% upside from CMP), based on 32x FY24E earnings (~10% discount to comparable peers due to a relatively weaker brand in markets outside the South and operating parameters).
A well-diversified consumer appliances company: VGRD is a Kochi-based company founded in 1977 to manufacture and market voltage stabilizers. It has since then established a strong brand in the South and aggressively diversified to become a multi-product company including voltage stabilizers, digital UPS systems & batteries, pumps, housing wires, switchgears, modular switches, electric water heaters, fans, solar water heaters, air coolers and various kitchen appliances.
The leader in the South, with pan-India aspirations: To cut its dependence on the southern markets, VGRD started aggressively expanding into other parts of India a decade ago. It envisages adding 3,000-5,000 retailers annually pan-India, with a higher proportion in non-South regions, over the next five years. The strategy gives it significant potential for revenue growth and operating leverage to expand on its existing investments. The non-South market currently accounts for ~60% of the distribution strength but only ~42% of revenues (target of 50% in 3-4 years). New channels (~10% of sales from modern trade and e-commerce), deeper penetration in rural/ non-South regions and new categories are the company’s key focus areas.
Capex intensity to rise on in-house manufacturing: VGRD has consistently been adding capacity to reduce its dependence on outsourcing. With the rising capex intensity (from ~Rs 500mn to >Rs 1,000mn annually), it plans to enhance in-house manufacturing to 60% in the coming years from ~50% currently. It has 11 manufacturing facilities at Coimbatore and Perundurai (Tamil Nadu), Kashipur and Roorkee (Uttarakhand), Kala Amb (Himachal Pradesh) and Sikkim.
We expect recovery across divisions; Initiating coverage with HOLD: We expect 17% revenue CAGR and 15% PAT CAGR for VGRD over FY21-24E (5% and 14% respectively over FY18-21), driven by a demand rebound across product categories as also stable margins on cost controls and operating leverage benefits. Despite the rising capex, a tight control on working capital should keep FCF generation at healthy levels. While we are positive on VGRD’s pan-India aspirations, cash-rich status and healthy FCF, we find the stock fairly priced at current valuations (~30x FY24E earnings). We initiate coverage on VGRD with a HOLD recommendation and price target of Rs 225 (5% upside from CMP), based on 32x FY24E earnings – ~10% discount to comparable peers given VGRD’s relatively weaker brand in non-South markets and lower margins in electricals and ECD.
Systematix Institutional Equities
29 April 2022
INITIATING COVERAGE
Sector: Consumer Electricals Rating: HOLD
CMP: Rs 215 Target Price: Rs 225
Stock Info
Sensex/Nifty 57,521/17,244
Bloomberg VGRD IN
Equity shares (mn) 430.2
52-wk High/Low 279/183
Face value Rs 1
M-Cap Rs 92 bn/ USD 1.4bn
3-m avg turnover USD 4.8mn
Financial Snapshot (Rs mn) Y/E Mar FY22E FY23E FY24E
Net sales 34,769 39,157 44,102
EBITDA 3,270 3,946 4,579
OPM % 9.4 10.1 10.4
PAT (adj.) 2,017 2,569 3,042
EPS (Rs) 4.7 6.0 7.1
PE (x) 45.9 36.0 30.4
P/B (x) 6.8 6.0 5.2
EV/EBITDA (x) 27.3 22.4 19.1
RoE (%) 14.9 16.7 17.2
RoCE (%) 21.4 24.0 25.0
Net-D/E (x) (0.2) (0.3) (0.3)
Shareholding Pattern (%) Mar’22 Dec'21 Sep'21
Promoter 55.9 56.0 56.1
- Pledged - - -
FII 12.7 14.3 14.3
DII 17.3 16.0 15.7
Others 14.1 13.7 14.0
Stock Performance (1-year)
150
190
230
270
310
Ap
r-2
1
May
-21
Jun
-21
Jul-
21
Au
g-2
1
Sep
-21
Oct
-21
No
v-2
1
Dec
-21
Jan
-22
Feb
-22
Mar
-22
Ap
r-2
2
VGRD Sensex
Ashish Poddar [email protected] +91 22 6704 8039
Pranay Shah [email protected] +91 22 6704 8017

29 April 2022
152 Systematix Research is also available on Bloomberg SSSL <Go>, Thomson & Reuters Systematix Shares and Stocks (India) Limited
V-Guard (VGRD)
Story in charts
Exhibit 1: Revenue mix (FY21) Exhibit 2: Revenue mix trend
28%
45%
27%
Electronics
Electricals
ECD
45 44 44 42 45
31 31 30 30 28
24 25 26 27 27
0
20
40
60
80
100
120
FY17 FY18 FY19 FY20 FY21
(%)
Electricals Electronics ECD
Source: Company, Systematix Institutional Research Source: Company, Systematix Institutional Research
Exhibit 3: Total revenues and growth trend Exhibit 4: Gross and EBITDA margin trend
0
5
10
15
20
25
30
35
40
45
50
FY18 FY19 FY20 FY21 FY22E FY23E FY24E
(Rs bn)
Revenue
0
5
10
15
20
25
30
35
40
FY18 FY19 FY20 FY21 FY22E FY23E FY24E
(%)
Gross margin EBITDA margin
Source: Company, Systematix Institutional Research Source: Company, Systematix Institutional Research
Exhibit 5: PAT and growth trend Exhibit 6: Electronics – revenue and EBIT trend
0
1
1
2
2
3
3
4
FY18 FY19 FY20 FY21 FY22E FY23E FY24E
(Rs bn)
PAT
0
2
4
6
8
10
12
14
16
18
20
0
2
4
6
8
10
12
FY18 FY19 FY20 FY21 FY22E FY23E FY24E
(%)(Rs bn)
Revenue EBIT % (RHS)
Source: Company, Systematix Institutional Research Source: Company, Systematix Institutional Research
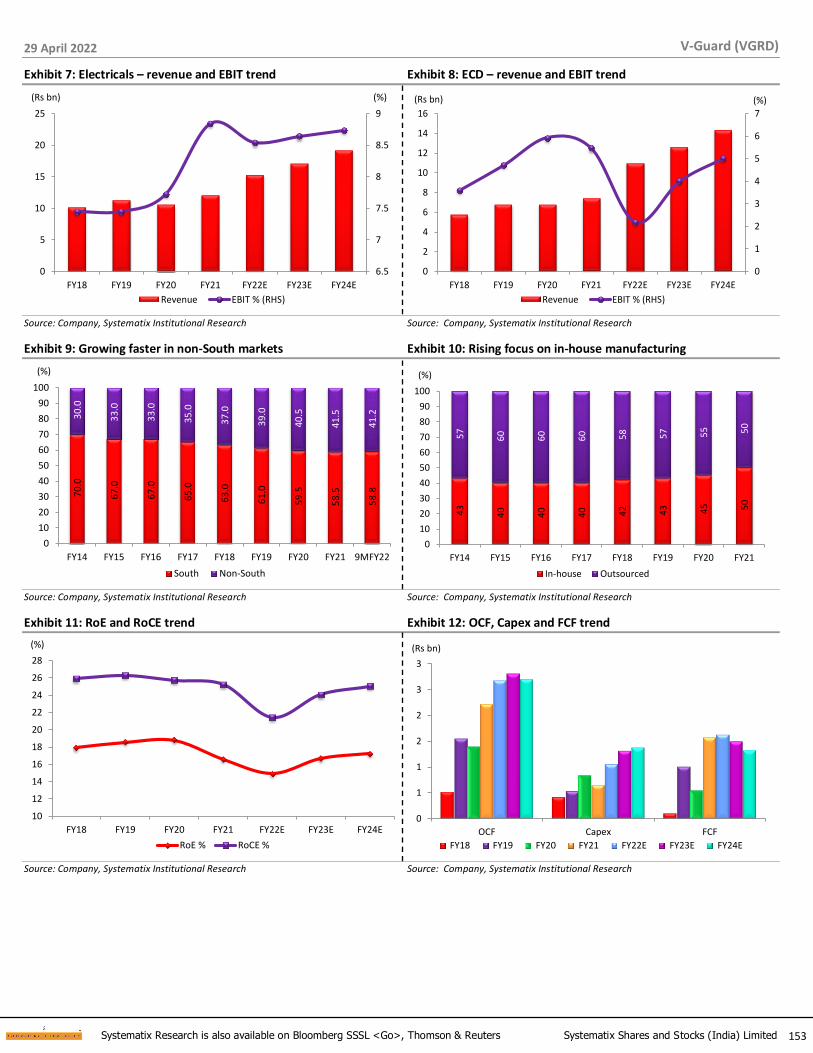
29 April 2022
153 Systematix Research is also available on Bloomberg SSSL <Go>, Thomson & Reuters Systematix Shares and Stocks (India) Limited
V-Guard (VGRD)
Exhibit 7: Electricals – revenue and EBIT trend Exhibit 8: ECD – revenue and EBIT trend
6.5
7
7.5
8
8.5
9
0
5
10
15
20
25
FY18 FY19 FY20 FY21 FY22E FY23E FY24E
(%)(Rs bn)
Revenue EBIT % (RHS)
0
1
2
3
4
5
6
7
0
2
4
6
8
10
12
14
16
FY18 FY19 FY20 FY21 FY22E FY23E FY24E
(%)(Rs bn)
Revenue EBIT % (RHS)
Source: Company, Systematix Institutional Research Source: Company, Systematix Institutional Research
Exhibit 9: Growing faster in non-South markets Exhibit 10: Rising focus on in-house manufacturing
70
.0
67
.0
67
.0
65
.0
63
.0
61
.0
59
.5
58
.5
58
.8
30
.0
33
.0
33
.0
35
.0
37
.0
39
.0
40
.5
41
.5
41
.2
0
10
20
30
40
50
60
70
80
90
100
FY14 FY15 FY16 FY17 FY18 FY19 FY20 FY21 9MFY22
(%)
South Non-South
43
40
40
40
42
43
45
50
57
60
60
60
58
57
55
50
0
10
20
30
40
50
60
70
80
90
100
FY14 FY15 FY16 FY17 FY18 FY19 FY20 FY21
(%)
In-house Outsourced
Source: Company, Systematix Institutional Research Source: Company, Systematix Institutional Research
Exhibit 11: RoE and RoCE trend Exhibit 12: OCF, Capex and FCF trend
10
12
14
16
18
20
22
24
26
28
FY18 FY19 FY20 FY21 FY22E FY23E FY24E
(%)
RoE % RoCE %
0
1
1
2
2
3
3
OCF Capex FCF
(Rs bn)
FY18 FY19 FY20 FY21 FY22E FY23E FY24E
Source: Company, Systematix Institutional Research Source: Company, Systematix Institutional Research

29 April 2022
154 Systematix Research is also available on Bloomberg SSSL <Go>, Thomson & Reuters Systematix Shares and Stocks (India) Limited
V-Guard (VGRD)
Investment Analysis
Reliance on summer products, South markets limiting growth
Starting with voltage stabilizers, VGRD has over the years grown its product portfolio to cover three business segments – electricals, electronics and appliances. The portfolio now comprises a wide range of products including digital UPS systems & batteries, pumps, housing wires, switchgears, modular switches, electric water heaters, fans, solar water heaters, air coolers and various kitchen appliances).
However, the portfolio is tilted towards summer products and dominated by South India markets so far (~58% of revenues in FY21). Despite an aggressive branding campaign launched in FY18, VGRD has lagged peers in terms of performance, more so as the southern markets have not grown so well in the recent past. Notably, the company’s EBIT margins in electronics division are at healthy levels of ~18% while margins in the electricals (~9%) and ECD (~6%) divisions are lower than of peers given its frontloaded investments in distribution and marketing and a relatively weaker brand image in non-South markets.
Exhibit 13: Revenue growth (FY16-21) Exhibit 14: EBITDA margin (FY21)
-2
0
2
4
6
8
10
12
PO
LYC
AB
HA
VL
OR
IEN
TEL
KEI
I
CR
OM
PTO
N
VG
RD
BJE
FNX
C(%)
0
2
4
6
8
10
12
14
16
HA
VL
CR
OM
PTO
N
FNX
C
PO
LYC
AB
VG
RD
KEI
I
OR
IEN
TEL
BJE
(%)
Source: Company, Systematix Institutional Research Source: Company, Systematix Institutional Research
Exhibit 15: VGRD’s addressable market size, market share and growth outlook
Product category Est. industry size (Rs bn)
Industry growth rate
(%)
Est. share of organized (%)
VGRD’s share in organized
(%) Key players
Electronics
Stabilizers 18 7-8% 55-60% 42-45% Microtek, Livguard, Bluebird
DUPS & Battery 120 8-10% 65-70% 4-6% Luminous, Microtek, Exide
Electricals
Housewires 170 8-10% 62-65% 6-8% Polycab, Finolex, Havells
Switchgears * 35 8-10% 75-80% 3-5% Havells, Legrand, Schneider
Modular Switches 65 8-10% 70-75% ** Anchor, Legrand, Havells
Pumps * 35 5-8% 60-65% 8-10% Crompton, Kirloskar, CRI
Appliances
Water Heaters 26 10-12% 65-70% 14-16% Havells, Bajaj, Crompton, Racold
Electric Fans 95 8-10% 75-80% 3-5% Crompton, Usha, Havells, Orient, Bajaj
Solar Water Heaters 6 6-8% 60-65% 14-16% Sudarshan Saur, Supreme Solar
Air Coolers 50 15-20% 30-35% ** Symphony, Bajaj, Voltas
Kitchen Appliances (Mixer Grinders, Gas Stoves, Water Purifiers, Other small kitchen appliances)
140 8-10% 65-75% **
Mixer Grinders - Bajaj, Preethi, Prestige Gas Stoves - Stovekraft, Sunflame, Butterfly Water Purifiers - Eureka Forbes, Kent RO, HUL Pureit
Total addressable market 760 8-10% Source: Company; Note: * Market estimate of VGRD’s active product segment only, ** Recent entry/ growth plan under activation
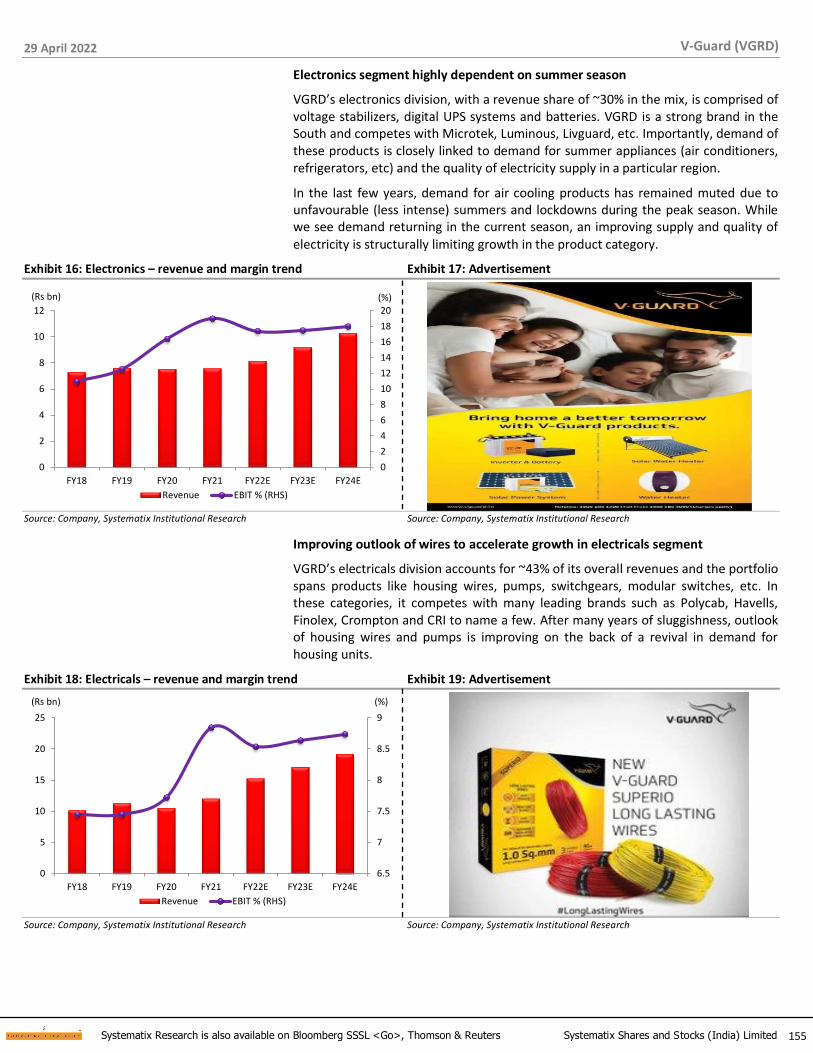
29 April 2022
155 Systematix Research is also available on Bloomberg SSSL <Go>, Thomson & Reuters Systematix Shares and Stocks (India) Limited
V-Guard (VGRD)
Electronics segment highly dependent on summer season
VGRD’s electronics division, with a revenue share of ~30% in the mix, is comprised of voltage stabilizers, digital UPS systems and batteries. VGRD is a strong brand in the South and competes with Microtek, Luminous, Livguard, etc. Importantly, demand of these products is closely linked to demand for summer appliances (air conditioners, refrigerators, etc) and the quality of electricity supply in a particular region.
In the last few years, demand for air cooling products has remained muted due to unfavourable (less intense) summers and lockdowns during the peak season. While we see demand returning in the current season, an improving supply and quality of
electricity is structurally limiting growth in the product category.
Exhibit 16: Electronics – revenue and margin trend Exhibit 17: Advertisement
0
2
4
6
8
10
12
14
16
18
20
0
2
4
6
8
10
12
FY18 FY19 FY20 FY21 FY22E FY23E FY24E
(%)(Rs bn)
Revenue EBIT % (RHS)
Source: Company, Systematix Institutional Research Source: Company, Systematix Institutional Research
Improving outlook of wires to accelerate growth in electricals segment
VGRD’s electricals division accounts for ~43% of its overall revenues and the portfolio spans products like housing wires, pumps, switchgears, modular switches, etc. In these categories, it competes with many leading brands such as Polycab, Havells, Finolex, Crompton and CRI to name a few. After many years of sluggishness, outlook of housing wires and pumps is improving on the back of a revival in demand for housing units.
Exhibit 18: Electricals – revenue and margin trend Exhibit 19: Advertisement
6.5
7
7.5
8
8.5
9
0
5
10
15
20
25
FY18 FY19 FY20 FY21 FY22E FY23E FY24E
(%)(Rs bn)
Revenue EBIT % (RHS)
Source: Company, Systematix Institutional Research Source: Company, Systematix Institutional Research

29 April 2022
156 Systematix Research is also available on Bloomberg SSSL <Go>, Thomson & Reuters Systematix Shares and Stocks (India) Limited
V-Guard (VGRD)
ECD expected to sustain the growth momentum
VGRD’s ECD division contributes ~27% to its revenues with offerings including electric water heaters, fans, solar water heaters, air coolers and various kitchen appliances. Here, the company competes with leading brands such as Havells, Crompton, Bajaj, Orient and Racold among others. Despite tough competition, the space offers a healthy growth opportunity for industry participants due to low penetration levels and a shift happening in consumer preference towards branded products. We expect the growth momentum to be sustained in view of favourable macro factors.
Exhibit 20: ECD – revenue and margin trend
0
1
2
3
4
5
6
7
0
2
4
6
8
10
12
14
16
FY18 FY19 FY20 FY21 FY22E FY23E FY24E
(%)(Rs bn)
Revenue EBIT % (RHS) Source: Company, Systematix Institutional Research
Exhibit 21: New launches and advertisements
Source: Company

29 April 2022
157 Systematix Research is also available on Bloomberg SSSL <Go>, Thomson & Reuters Systematix Shares and Stocks (India) Limited
V-Guard (VGRD)
Expansion in non-South markets to drive growth and margins
VGRD, traditionally a dominant player with a strong brand in the South, has been working to expand its footprint pan-India in the last 10 years. The share of non-South markets in its revenues has increased significantly from 5% in FY08 to ~42% in FY21, attributable in some measure to muted growth in southern markets over the last few years. The company continues to invest heavily into its target of expanding outlet coverage in the non-South geographies and becoming a dominant pan-India player.
Exhibit 22: Revenue growth trend in southern markets Exhibit 23: Revenue growth trend in non-South markets
0
5
10
15
20
25
30
FY18 FY19 FY20 FY21 FY22E FY23E FY24E
(Rs bn)
Revenue
0
2
4
6
8
10
12
14
16
18
20
FY18 FY19 FY20 FY21 FY22E FY23E FY24E
(Rs bn)
Revenue
Source: Company, Systematix Institutional Research Source: Company, Systematix Institutional Research
Over the last decade, VGRD has added a higher number of retail touchpoints in non-South regions (~60% of distribution strength and ~42% of sales) than in its stronghold southern markets. With expanding operations in the faster growing non-South regions, we see significant potential for growth/ margin expansion for the company
over the next 3-5 years.
Exhibit 24: Non-South markets growing faster and offer growth potential
70
.0
67
.0
67
.0
65
.0
63
.0
61
.0
59
.5
58
.5
58
.8
30
.0
33
.0
33
.0
35
.0
37
.0
39
.0
40
.5
41
.5
41
.2
0
10
20
30
40
50
60
70
80
90
100
FY14 FY15 FY16 FY17 FY18 FY19 FY20 FY21 9MFY22
(%)
South Non-South
Source: Company
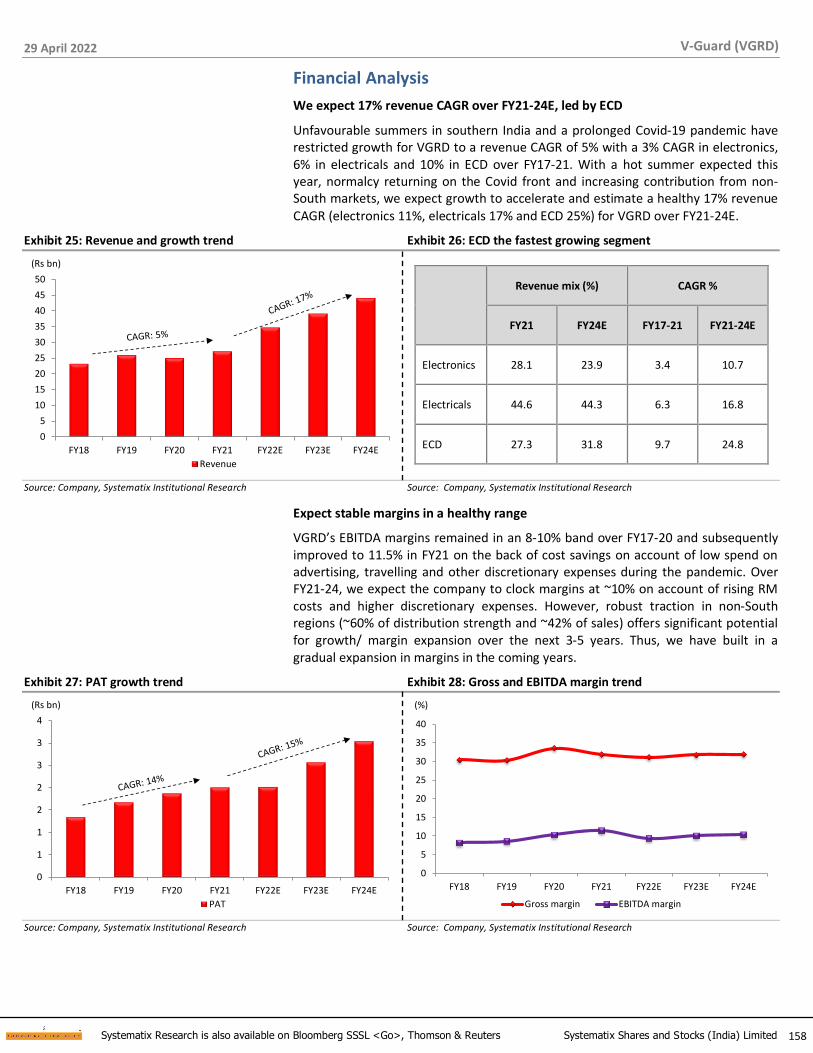
29 April 2022
158 Systematix Research is also available on Bloomberg SSSL <Go>, Thomson & Reuters Systematix Shares and Stocks (India) Limited
V-Guard (VGRD)
Financial Analysis
We expect 17% revenue CAGR over FY21-24E, led by ECD
Unfavourable summers in southern India and a prolonged Covid-19 pandemic have restricted growth for VGRD to a revenue CAGR of 5% with a 3% CAGR in electronics, 6% in electricals and 10% in ECD over FY17-21. With a hot summer expected this year, normalcy returning on the Covid front and increasing contribution from non-South markets, we expect growth to accelerate and estimate a healthy 17% revenue
CAGR (electronics 11%, electricals 17% and ECD 25%) for VGRD over FY21-24E.
Exhibit 25: Revenue and growth trend Exhibit 26: ECD the fastest growing segment
0
5
10
15
20
25
30
35
40
45
50
FY18 FY19 FY20 FY21 FY22E FY23E FY24E
(Rs bn)
Revenue
Source: Company, Systematix Institutional Research Source: Company, Systematix Institutional Research
Expect stable margins in a healthy range
VGRD’s EBITDA margins remained in an 8-10% band over FY17-20 and subsequently improved to 11.5% in FY21 on the back of cost savings on account of low spend on advertising, travelling and other discretionary expenses during the pandemic. Over FY21-24, we expect the company to clock margins at ~10% on account of rising RM costs and higher discretionary expenses. However, robust traction in non-South regions (~60% of distribution strength and ~42% of sales) offers significant potential for growth/ margin expansion over the next 3-5 years. Thus, we have built in a gradual expansion in margins in the coming years.
Exhibit 27: PAT growth trend Exhibit 28: Gross and EBITDA margin trend
0
1
1
2
2
3
3
4
FY18 FY19 FY20 FY21 FY22E FY23E FY24E
(Rs bn)
PAT
0
5
10
15
20
25
30
35
40
FY18 FY19 FY20 FY21 FY22E FY23E FY24E
(%)
Gross margin EBITDA margin
Source: Company, Systematix Institutional Research Source: Company, Systematix Institutional Research
Revenue mix (%) CAGR %
FY21 FY24E FY17-21 FY21-24E
Electronics 28.1 23.9 3.4 10.7
Electricals 44.6 44.3 6.3 16.8
ECD 27.3 31.8 9.7 24.8
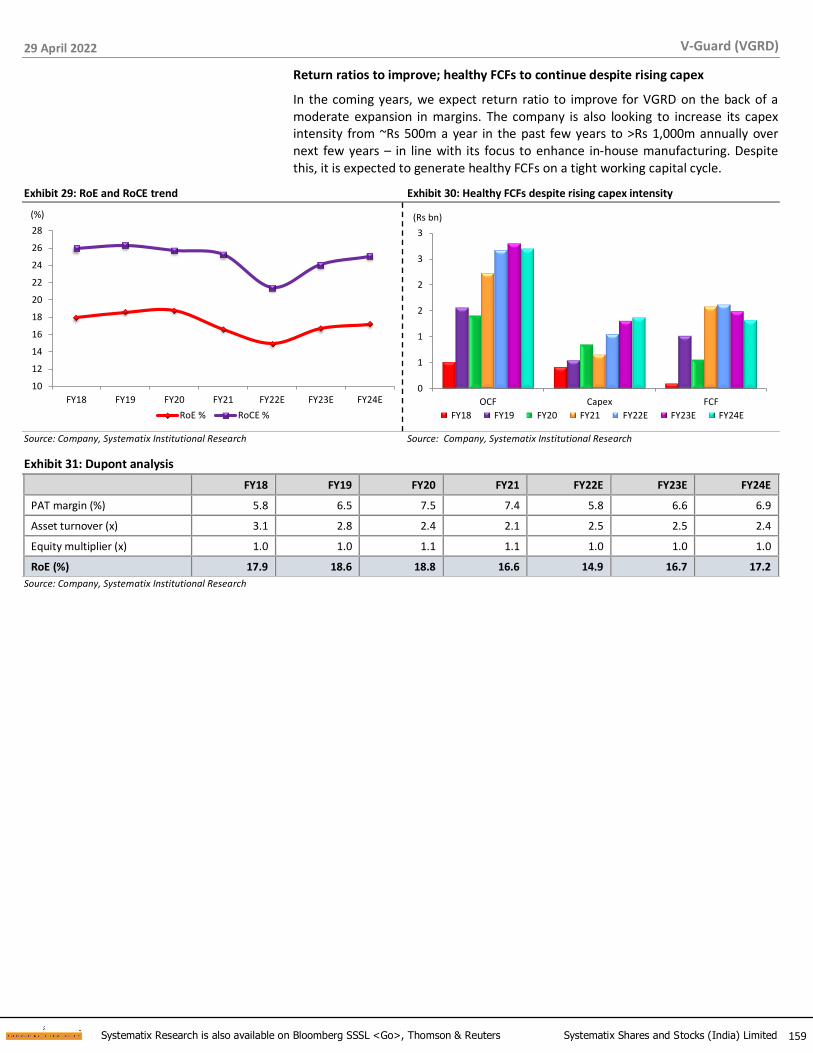
29 April 2022
159 Systematix Research is also available on Bloomberg SSSL <Go>, Thomson & Reuters Systematix Shares and Stocks (India) Limited
V-Guard (VGRD)
Return ratios to improve; healthy FCFs to continue despite rising capex
In the coming years, we expect return ratio to improve for VGRD on the back of a moderate expansion in margins. The company is also looking to increase its capex intensity from ~Rs 500m a year in the past few years to >Rs 1,000m annually over next few years – in line with its focus to enhance in-house manufacturing. Despite this, it is expected to generate healthy FCFs on a tight working capital cycle.
Exhibit 29: RoE and RoCE trend Exhibit 30: Healthy FCFs despite rising capex intensity
10
12
14
16
18
20
22
24
26
28
FY18 FY19 FY20 FY21 FY22E FY23E FY24E
(%)
RoE % RoCE %
0
1
1
2
2
3
3
OCF Capex FCF
(Rs bn)
FY18 FY19 FY20 FY21 FY22E FY23E FY24E
Source: Company, Systematix Institutional Research Source: Company, Systematix Institutional Research
Exhibit 31: Dupont analysis FY18 FY19 FY20 FY21 FY22E FY23E FY24E
PAT margin (%) 5.8 6.5 7.5 7.4 5.8 6.6 6.9
Asset turnover (x) 3.1 2.8 2.4 2.1 2.5 2.5 2.4
Equity multiplier (x) 1.0 1.0 1.1 1.1 1.0 1.0 1.0
RoE (%) 17.9 18.6 18.8 16.6 14.9 16.7 17.2
Source: Company, Systematix Institutional Research

29 April 2022
160 Systematix Research is also available on Bloomberg SSSL <Go>, Thomson & Reuters Systematix Shares and Stocks (India) Limited
V-Guard (VGRD)
Valuation and Outlook
VGRD, a Kochi-based company founded in 1977, started its journey with voltage stabilizers and is now a well-diversified consumer appliances company offering a wide range of light electrical products such as digital UPS systems & batteries, pumps, housing wires, switchgears, modular switches, electric water heaters, fans, solar water heaters, air coolers and various kitchen appliances. The leader in the South, VGRD is widening its footprint in non-South as well. New channels (modern trade, e-commerce, ~10% of sales), deeper penetration in rural/ non-South regions, in-house manufacturing and new categories are VGRD’s key focus areas.
We expect 17% revenue CAGR, 14% EBITDA CAGR and 15% PAT CAGR for the company over FY21-24E (5%, 18% and 14% respectively over FY18-21), led by strong growth across categories and stable margins amid pressure from higher RM costs. Despite rising capex, we expect VGRD to maintain high FCF through tight working capital management.
While we like VGRD for its strong position in southern India, its strategy to expand pan-India, cash-rich status and healthy FCF generation, we believe the stock is fairly valued at current valuations of ~30x FY24E earnings. We initiate coverage on VGRD with a HOLD rating and target price of Rs 225 (5% upside from CMP), based on 32x FY24E earnings. We have assigned ~10% lower target valuation to VGRD than larger
peers due to its weak performance historically and downside risk to margins.
Exhibit 32: PE band and standard-deviation (1-year forward)
20
25
30
35
40
45
50
55
60
65
70
Ap
r-1
7
Jul-
17
Oct
-17
Jan
-18
Ap
r-1
8
Jul-
18
Oct
-18
Jan
-19
Ap
r-1
9
Jul-
19
Oct
-19
Jan
-20
Ap
r-2
0
Jul-
20
Oct
-20
Jan
-21
Ap
r-2
1
Jul-
21
Oct
-21
Jan
-22
Ap
r-2
2P/E Mean +1 SD -1 SD
-1SD
+1SD
Mean
Source: BSE, Systematix Institutional Research
29 April 2022
161 Systematix Research is also available on Bloomberg SSSL <Go>, Thomson & Reuters Systematix Shares and Stocks (India) Limited
V-Guard (VGRD)
Key risks and risk mitigating measures
Economic slowdown
A sluggish domestic economy due to global factors may have short-term negative impact on demand. For the past couple of years, the housing sector has also generated muted demand for electrical goods. However, there are signs of revival in the housing sector. Availability of uninterrupted power supply is key to demand of electrical products – hence, errant supply of electricity may hamper growth
prospects for the industry.
Commodity headwinds
With the economy opening up post lifting of the COVID-induced lockdowns, the pent-up demand for commodities has driven a sharp rise in their prices. Industrial commodities, including key raw materials such as copper, steel and aluminium have seen significant and sustained price spikes. Going forward, inflationary trends like increasing input costs, higher commodity prices and better pricing power may
adversely impact demand in the consumer discretionary spends.
Hyper-competition in the marketplace
The consumer electricals industry has traditionally been competitive due to the presence of many large players as well as fragmented regional players. In times of a slowdown, the market becomes hyper-competitive with new entrants eating into the share of incumbents through aggressive pricing and other trade practices. VGRD claims to have a strong innovation pipeline of differentiated products, which will help it protect its market share. Also, it continuously strives to enhance its distribution
reach and focus on emerging channels as well.

29 April 2022
162 Systematix Research is also available on Bloomberg SSSL <Go>, Thomson & Reuters Systematix Shares and Stocks (India) Limited
V-Guard (VGRD)
Annexures

29 April 2022
163 Systematix Research is also available on Bloomberg SSSL <Go>, Thomson & Reuters Systematix Shares and Stocks (India) Limited
V-Guard (VGRD)
Company Background
A well-diversified light electricals company
VGRD is a Kochi-based company founded in 1977 to manufacture and market voltage stabilizers. It has since then established a strong brand name and aggressively diversified to become a multi-product company catering to the light electricals sector including voltage stabilizers, digital UPS systems & batteries, pumps, housing wires, switchgears, modular switches, electric water heaters, fans, solar water heaters, air coolers and various kitchen appliances.
Exhibit 33: Revenue mix trend Exhibit 34: A wide product portfolio
45 44 44 42 45
31 31 30 30 28
24 25 26 27 27
0
10
20
30
40
50
60
70
80
90
100
FY17 FY18 FY19 FY20 FY21
(%)
Electricals Electronics ECD
Source: Company Source: Company
Focus on in-house manufacturing
VGRD outsources ~50% of its product portfolio while keeping a strict control on design and quality aspects. For the remaining 50%, it has manufacturing facilities in Coimbatore in Tamil Nadu, Kashipur and Roorkee in Uttarakhand, Kala Amb in Himachal Pradesh and Sikkim. The share of in-house manufacturing has been gradually rising as it achieves the requisite scale in specific product categories. From 43% in FY14, in-house manufacturing has increased to 50% and is likely to go up to 60% with planned capex.
Exhibit 35: Manufacturing and sourcing capability Exhibit 36: Rising focus on in-house manufacturing
43
40
40
40
42
43
45
50
57
60
60
60
58
57
55
50
0
10
20
30
40
50
60
70
80
90
100
FY14 FY15 FY16 FY17 FY18 FY19 FY20 FY21
(%)
In-house Outsourced
Source: Company Source: Company
Product No. of Units Location
Own mfg facilities
Wires & Cables 2 Coimbatore, Kashipur
Pumps & Motors 1 Coimbatore
Fans 2 Kala Amb (HP), Haridwar
Water Heater 2 Kala Amb (HP), Sikkim
Solar Water Heater 1 Coimbatore
Solar Inverter 1 Coimbatore
Stabilizers 2 Sikkim
Outsourced facilities
Stabilizers 57 Across India
Pumps 18 Across India
Fans 11 Across India
UPS 9 Across India
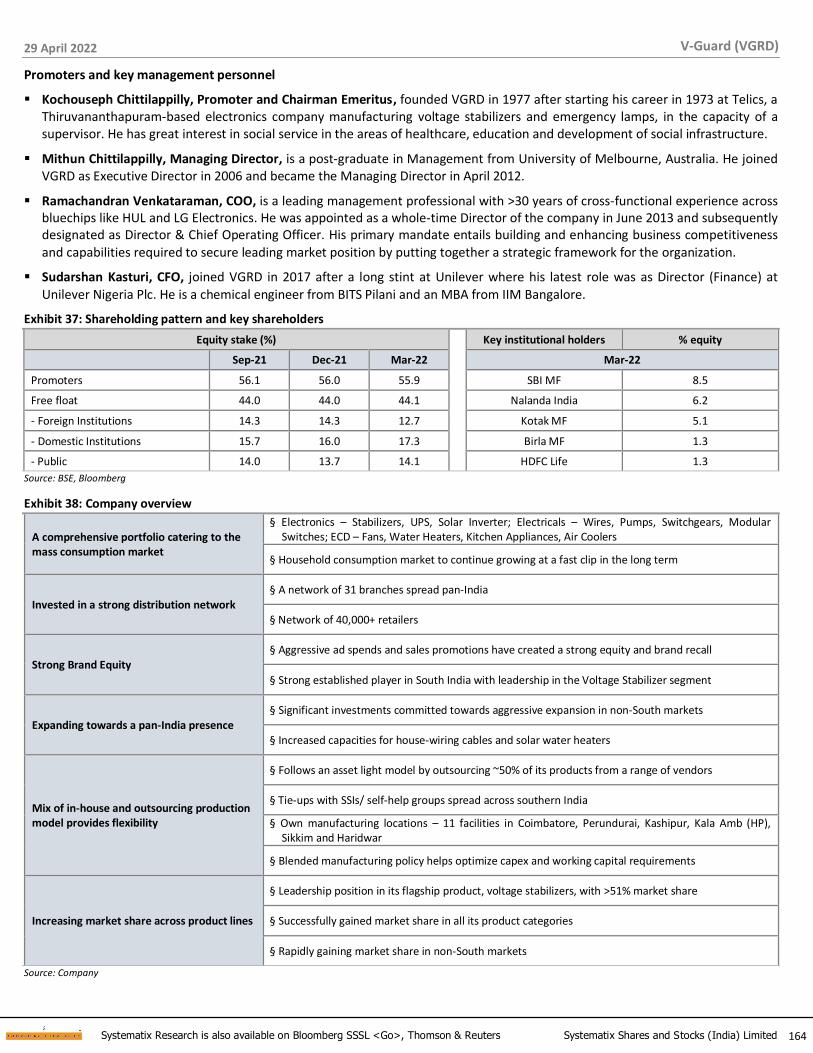
29 April 2022
164 Systematix Research is also available on Bloomberg SSSL <Go>, Thomson & Reuters Systematix Shares and Stocks (India) Limited
V-Guard (VGRD)
Promoters and key management personnel
▪ Kochouseph Chittilappilly, Promoter and Chairman Emeritus, founded VGRD in 1977 after starting his career in 1973 at Telics, a Thiruvananthapuram-based electronics company manufacturing voltage stabilizers and emergency lamps, in the capacity of a supervisor. He has great interest in social service in the areas of healthcare, education and development of social infrastructure.
▪ Mithun Chittilappilly, Managing Director, is a post-graduate in Management from University of Melbourne, Australia. He joined VGRD as Executive Director in 2006 and became the Managing Director in April 2012.
▪ Ramachandran Venkataraman, COO, is a leading management professional with >30 years of cross-functional experience across bluechips like HUL and LG Electronics. He was appointed as a whole-time Director of the company in June 2013 and subsequently designated as Director & Chief Operating Officer. His primary mandate entails building and enhancing business competitiveness
and capabilities required to secure leading market position by putting together a strategic framework for the organization.
▪ Sudarshan Kasturi, CFO, joined VGRD in 2017 after a long stint at Unilever where his latest role was as Director (Finance) at
Unilever Nigeria Plc. He is a chemical engineer from BITS Pilani and an MBA from IIM Bangalore.
Exhibit 37: Shareholding pattern and key shareholders
Equity stake (%) Key institutional holders % equity
Sep-21 Dec-21 Mar-22 Mar-22
Promoters 56.1 56.0 55.9 SBI MF 8.5
Free float 44.0 44.0 44.1 Nalanda India 6.2
- Foreign Institutions 14.3 14.3 12.7 Kotak MF 5.1
- Domestic Institutions 15.7 16.0 17.3 Birla MF 1.3
- Public 14.0 13.7 14.1 HDFC Life 1.3
Source: BSE, Bloomberg
Exhibit 38: Company overview
A comprehensive portfolio catering to the mass consumption market
§ Electronics – Stabilizers, UPS, Solar Inverter; Electricals – Wires, Pumps, Switchgears, Modular Switches; ECD – Fans, Water Heaters, Kitchen Appliances, Air Coolers
§ Household consumption market to continue growing at a fast clip in the long term
Invested in a strong distribution network § A network of 31 branches spread pan-India
§ Network of 40,000+ retailers
Strong Brand Equity § Aggressive ad spends and sales promotions have created a strong equity and brand recall
§ Strong established player in South India with leadership in the Voltage Stabilizer segment
Expanding towards a pan-India presence § Significant investments committed towards aggressive expansion in non-South markets
§ Increased capacities for house-wiring cables and solar water heaters
Mix of in-house and outsourcing production model provides flexibility
§ Follows an asset light model by outsourcing ~50% of its products from a range of vendors
§ Tie-ups with SSIs/ self-help groups spread across southern India
§ Own manufacturing locations – 11 facilities in Coimbatore, Perundurai, Kashipur, Kala Amb (HP), Sikkim and Haridwar
§ Blended manufacturing policy helps optimize capex and working capital requirements
Increasing market share across product lines
§ Leadership position in its flagship product, voltage stabilizers, with >51% market share
§ Successfully gained market share in all its product categories
§ Rapidly gaining market share in non-South markets
Source: Company

29 April 2022
165 Systematix Research is also available on Bloomberg SSSL <Go>, Thomson & Reuters Systematix Shares and Stocks (India) Limited
V-Guard (VGRD)
Annual report analysis (FY17-21)
Exhibit 39: Company overview
Year Demand Scenario and outlook Plans and initiatives
FY17
• Relatively weaker consumer discretionary spends due to slow construction activity (especially in 2H after demonetization), political uncertainty and a Cyclone
• Expansion into non-South markets, shift of demand to the organized sector, hotter weather conditions, deeper penetration into tier-2 & -3 cities that still have less reliable power availability and growing demand for LED tech providing impetus to demand
• Target of 15% revenue CAGR over the next few years
• Acquisition of a 74% stake in Guts Electromech, a Hyderabad-based company engaged in the manufacture and marketing of various kinds of domestic switchgears and circuit breakers
• Launched India's first IoT-enabled premium water heater 'Verano'
• Invested Rs 125mn in a new manufacturing unit for stabilizers at Sikkim facility
• Coimbatore plant commenced production in May-17
• A 1:10 stock-split and 2:5 bonus issue announced
FY18
• Government thrust on housing and rural electrification, ample headroom for growth available in terms of geographical reach and product portfolio, increasing disposable incomes, GST and shortening replacement cycles key demand drivers
• Increasing number of households, higher rural penetration, increasing electrification, technological innovations such as IoT-enabled appliances, higher disposable incomes, etc major drivers of volume growth
• Acquired 74% equity shares of Guts Electro-Mech, engaged in manufacturing and selling of switchgears, circuit breakers, relays, current transformers and similar electromechanical products
• Plans to add 3,000-5,000 retailers pan-India every year over the next five years with higher addition in non-South markets
• New categories – kitchen appliances, switches & switchgears and air coolers to provide significant growth opportunities
FY19
• Water heaters, fans and wires businesses recorded 12% growth
• Rising income levels, growing aspirations of the middle class, rapid urbanization, better outlook for housing sector, electrification and improving affordability expected to drive better penetration and product premiumization
• With rising volumes and attaining of requisite scale, the company sees merit in increasing inhouse manufacture to 60% in the next few years
• Focus on premiumization of product portfolio
• Envisages adding 4,000-5,000 retail points with majority of the addition in non-South markets
FY20
• Impacted by the lockdowns, revenue down 3.3% YoY with muted growth in fans category; higher penetration in non-South markets a key positive
• Weak consumer demand for a major part of the year, tight liquidity conditions and reduced discretionary spending
• The South region saw another year of seasonal weakness on account of floods
• National Electronics Policy 2019 approval presents the opportunity of several incentives like interest subvention and credit guarantee, 100% foreign direct investment in electronics hardware manufacturing and various other incentive packages
• India’s transition towards a formal economic structure expected to benefit organized players and lead to demand recovery
FY21
• Tight liquidity conditions and low discretionary spending by consumers leading to cyclical weakness affecting demand
• Sharply lower demand during 1H due to nationwide lockdowns; however, a strong rebound in 2H drove 8.7% YoY revenue growth
• Gross margins under pressure due to higher input prices
• Acquired an 18.8% stake in Gegadyne Energy Lab, a start-up developing fast-charging battery technology
• Retailer addition plan on track (3,000-5,000 every year in the medium term with more additions in non-South regions)
• Opened a new unit for production of premium ceiling fans, in line with focus on expanding inhouse manufacturing capabilities
Source: Company, Systematix Institutional Research

29 April 2022
166 Systematix Research is also available on Bloomberg SSSL <Go>, Thomson & Reuters Systematix Shares and Stocks (India) Limited
V-Guard (VGRD)
FINANCIALS (CONSOLIDATED)
Profit & Loss Statement
YE: Mar (Rs mn) FY20 FY21 FY22E FY23E FY24E
Net revenues 25,029 27,212 34,769 39,157 44,102
Growth (%) (3.5) 8.7 27.8 12.6 12.6
Raw material expenses 16,618 18,525 23,925 26,722 30,008
Gross Margin (%) 33.6 31.9 31.2 31.8 32.0
Employee & Other exp. 5,832 5,566 7,574 8,489 9,515
EBITDA 2,580 3,121 3,270 3,946 4,579
EBITDA margins (%) 10.3 11.5 9.4 10.1 10.4
Depreciation 294 386 502 561 629
Other income 251 207 122 236 319
Finance costs 42 61 80 45 37
PBT 2,496 2,881 2,810 3,576 4,231
Effective tax rate (%) 24.6 29.9 27.9 27.9 27.9
Associates/(Minorities) - - - - -
Net Income 1,871 2,008 2,017 2,569 3,042
Adjusted net income 1,871 2,008 2,017 2,569 3,042
Shares outstanding 428 430 430 430 430
FDEPS (Rs) 4.3 4.7 4.7 6.0 7.1
FDEPS growth (%) 11.9 7.3 0.4 27.4 18.4
Source: Company, Systematix Institutional Research
Balance Sheet
YE: Mar (Rs mn) FY20 FY21 FY22E FY23E FY24E
Share capital 428 430 430 430 430
Net worth 9,955 12,113 13,528 15,408 17,676
Total debt 500 676 576 476 376
Minority interest 36 47 57 67 77
DT Liability/ (Asset) - - - - -
Capital Employed 10,490 12,836 14,160 15,951 18,129
Net tangible assets 2,746 3,576 4,176 4,976 5,776
Net Intangible assets 96 118 118 118 118
Goodwill - - - - -
CWIP 669 196 146 96 46
Investments (Strategic) 3 3 3 3 3
Investments (Financial) 360 - 3,000 4,000 5,000
Current Assets 9,560 12,045 11,525 12,341 13,778
Cash 1,116 2,812 776 672 402
Current Liabilities 4,059 5,914 5,584 6,254 6,994
Working capital 5,502 6,131 5,942 6,086 6,784
Capital Deployed 10,490 12,836 14,160 15,951 18,129
Contingent Liabilities 2,242 2,996 - - -
Source: Company, Systematix Institutional Research
Cash Flow
YE: Mar (Rs mn) FY20 FY21 FY22E FY23E FY24E
EBIT (incl. other income) 2,423 2,985 2,733 3,349 3,914
Non-cash items 294 386 502 561 629
OCF before WC changes 2,717 3,372 3,235 3,910 4,543
Incr./(decr.) in WC 522 413 (239) 95 647
Others including taxes 788 737 798 1,011 1,194
Operating cash-flow 1,407 2,222 2,676 2,804 2,702
Capex 850 648 1,052 1,311 1,379
Free cash-flow 557 1,574 1,624 1,493 1,323
Acquisitions - - - - -
Dividend 875 1 602 688 774
Equity raised 22 46 - - -
Debt raised (30) (52) (100) (100) (100)
Fin Investments 393 (919) 3,000 1,000 1,000
Misc. Items (CFI + CFF) (100) (88) (42) (191) (282)
Net cash-flow (619) 2,573 (2,036) (104) (270)
Source: Company, Systematix Institutional Research
Ratios
YE: Mar FY20 FY21 FY22E FY23E FY24E
P/E (x) 49.4 46.1 45.9 36.0 30.4
EV/EBITDA (x) 35.5 29.0 27.3 22.4 19.1
EV/sales (x) 3.7 3.3 2.6 2.3 2.0
P/B (x) 9.3 7.6 6.8 6.0 5.2
RoE (%) 18.8 16.6 14.9 16.7 17.2
RoCE (%) 25.7 25.2 21.4 24.0 25.0
ROIC (%) 22.6 21.1 19.8 23.7 25.3
DPS (Rs per share) 0.9 1.2 1.4 1.6 1.8
Dividend yield (%) 0.4 0.6 0.7 0.7 0.8
Dividend payout (%) 20.7 25.7 29.9 26.8 25.5
Net debt/equity (x) (0.1) (0.2) (0.2) (0.3) (0.3)
Receivables (days) 47.3 52.1 45.0 45.0 45.0
Inventory (days) 69.8 84.7 55.0 50.0 50.0
Payables (days) 44.5 63.7 45.0 45.0 45.0
CFO:PAT% 75.2 110.6 132.7 109.2 88.8
Source: Company, Systematix Institutional Research

Systematix Research is also available on Bloomberg SSSL <Go>, Thomson & Reuters Systematix Shares and Stocks (India) Limited
Investors are advised to refer disclosures made at the end of the research report.
167
Orient Electric
Premiumization driving growth
Orient Electric (ORIENTEL), the leader in fans, is growing rapidly in new categories (lighting, appliances and switchgears) as well. A renewed focus on innovative new launches and portfolio premiumization have helped the company reposition itself as a vibrant and new-age brand. Higher A&P spends at ~4% of sales have enhanced brand visibility while its wide distribution network has supported entry in new categories. The company aspires to expand margins despite the RM cost headwind, aided by operating leverage and premiumization. We expect 17% revenue CAGR, 14% EBITDA CAGR and 14% PAT CAGR for ORIENTEL over FY21-24E with growth across categories and stable margins. We expect RoE to sustain at ~25% and healthy FCF generation to continue. While we like ORIENTEL’s business, current valuations at 38x FY24E earnings adequately capture the growth prospects. We initiate coverage on the stock with a HOLD rating and price target of Rs 302 (6% downside from CMP), based on 36x FY24E earnings (in line with peers vs its 42x 5-year mean). Increasing competitive intensity is a key risk to our earnings estimates.
New entity, new identity…: Since its incorporation in 2017, ORIENTEL has managed to capture leading market share (~15% in fans) in its core category and make significant inroads in new product categories (geysers, air coolers, kitchen appliances, etc). The future growth runway also appears long with many untapped categories and the company’s ability to make its mark through relevant offerings.
…premiumization and innovation the key growth pillars: Emphasis on premiumization, innovation, brand visibility through A&P spends and channel augmentation have served ORIENTEL well. From being an economy/ mass-market brand for many decades, it is now repositioned as a leader in premium fans with a technology-driven portfolio. A&P spends (~4% of sales) have been scaled up to increase brand visibility and awareness around the innovative launches. The company aims to further raise the contribution from premium/ decorative fans from ~25% currently (vs 10-15% for industry). A similar strategy is being
adopted in other product categories.
Higher capex/ investment in R&D to support growth: ORIENTEL has manufacturing facilities in Kolkata, Faridabad and Noida. It now plans to invest Rs 1.7bn for a new facility in Hyderabad, which will be ready by end-FY23. Starting with fans, other products will also be manufactured at this location. Also, a planned new R&D centre at Faridabad will
consolidate operations, improve efficiency and help in faster decision-making.
Initiating coverage on ORIENTEL with HOLD rating: With headroom to grow further via innovative launches in existing categories and entry in new businesses, we expect 17% revenue CAGR for ORIENTEL over FY21-24E. Also, we expect EBITDA margins to remain stable at ~10% (with 14% CAGR in EBITDA and PAT each) as cost headwinds get offset by operational efficiencies. Despite the rising capex, we expect RoE at a healthy ~25% and strong FCF. While we like ORIENTEL for premiumization of its portfolio, strong network, margin expansion, tight WC and FCF, we find the current stock valuations of 38x FY24E earnings reasonably building in the potential growth. We initiate coverage on the stock with a HOLD rating and target price of Rs 302, based on 36x FY24E earnings (the 5-year
mean at 42x). Increasing competition is a key risk to our growth/ margin estimates.
Systematix Institutional Equities
29 April 2022
INITIATING COVERAGE
Sector: Consumer Electricals Rating: HOLD
CMP: Rs 320 Target Price: Rs 302
Stock Info
Sensex/Nifty 57,521/17,244
Bloomberg ORIENTEL IN
Equity shares (mn) 212.2
52-wk High/Low 392/268
Face value Rs 1
M-Cap Rs 68 bn/ USD 0.9bn
3-m avg turnover USD 2.4mn
Financial Snapshot (Rs mn) Y/E Mar FY22E FY23E FY24E
Net sales 25,681 28,762 32,214
EBITDA 2,291 2,738 3,228
OPM % 8.9 9.5 10.0
PAT (adj.) 1,244 1,511 1,781
EPS (adj.) (Rs) 5.9 7.1 8.4
PE (x) 54.6 44.9 38.1
P/B (x) 12.9 11.1 9.5
EV/EBITDA (x) 28.9 24.2 20.4
RoE (%) 23.6 24.6 24.8
RoCE (%) 35.0 33.4 32.3
Net-D/E (x) (0.3) (0.3) (0.3)
Shareholding Pattern (%) Mar’22 Dec'21 Sep'21
Promoter 38.5 38.5 38.5
- Pledged - - -
FII 8.3 9.0 8.7
DII 26.3 24.9 23.8
Others 26.9 27.6 29.0
Stock Performance (1-year)
230
270
310
350
390
430
Ap
r-2
1
May
-21
Jun
-21
Jul-
21
Au
g-2
1
Sep
-21
Oct
-21
No
v-2
1
Dec
-21
Jan
-22
Feb
-22
Mar
-22
Ap
r-2
2
ORIENTEL Sensex
Ashish Poddar [email protected] +91 22 6704 8039
Pranay Shah [email protected] +91 22 6704 8017

29 April 2022
168 Systematix Research is also available on Bloomberg SSSL <Go>, Thomson & Reuters Systematix Shares and Stocks (India) Limited
Orient Electric
Story in charts
Exhibit 1: Total revenues and growth trend Exhibit 2: Gross and EBITDA margin trend
0
5
10
15
20
25
30
FY18 FY19 FY20 FY21 FY22E FY23E FY24E
(Rs bn)
Revenue
0
5
10
15
20
25
30
35
40
FY18 FY19 FY20 FY21 FY22E FY23E FY24E
(%)
Gross margin EBITDA margin
Source: Company, Systematix Institutional Research Source: Company, Systematix Institutional Research
Exhibit 3: Electric Consumer Durables (ECD) – revenue and EBIT trend Exhibit 4: Lighting and switchgears (L&S) – revenue and EBIT trend
0
2
4
6
8
10
12
14
16
0
5
10
15
20
25
30
FY18 FY19 FY20 FY21 FY22E FY23E FY24E
(%)(Rs bn)
Revenue EBIT % (RHS)
0
2
4
6
8
10
12
14
16
0
1
2
3
4
5
6
7
8
9
FY18 FY19 FY20 FY21 FY22E FY23E FY24E
(%)(Rs bn)
Revenue EBIT % (RHS)
Source: Company, Systematix Institutional Research Source: Company, Systematix Institutional Research
Exhibit 5: RoE and RoCE trend Exhibit 6: OCF, Capex and FCF trend
14
19
24
29
34
39
44
FY18 FY19 FY20 FY21 FY22E FY23E FY24E
(%)
RoE % RoCE %
-1
0
1
1
2
2
3
3
4
4
5
OCF Capex FCF
(Rs bn)
FY18 FY19 FY20 FY21 FY22E FY23E FY24E
Source: Company, Systematix Institutional Research Source: Company, Systematix Institutional Research

29 April 2022
169 Systematix Research is also available on Bloomberg SSSL <Go>, Thomson & Reuters Systematix Shares and Stocks (India) Limited
Orient Electric
Investment Analysis
Renewed focus on business with an able management team
ORIENTEL has undertaken several measures to strengthen the business and achieve its objective of becoming a one-stop-shop for lifestyle electrical solutions and an innovative manufacturer of premium products.
The hiving off has helped re-align its focus
In view of the unrelated nature of businesses under Orient Paper, the promoters decided to demerge the consumer business into a separate entity – Orient Electric –in 2017. The main objective was to make ORIENTEL a one-stop-shop for lifestyle electrical solutions by launching disruptive products in existing and new categories. Even prior to that, ORIENTEL had started strengthening its leadership team. Hiring started with the current MD, Rakesh Khanna, who subsequently hired SBU heads with established credentials and relevant industry experience across verticals.
Since the hiving off, ORIENTEL has achieved many milestones, captured leading market share in its core product categories (fans and lighting) and successfully broken into new categories (geysers, air coolers, kitchen appliances, etc) with focus on product innovation, A&P spends and channel expansion.
Exhibit 7: An experienced team at the helm
Name Designation Educational qualification
Age (years)
Experience (years)
With Orient since
Previous employment
Rakesh Khanna MD & CEO BE - Mechanical, MBA 58 35 01-Dec-14 Jumbo Electronic-Head, Sony & IT Products, UAE
Saibal Sengupta CFO B. Com., CA 58 24 02-Apr-18 Usha International - CFO
Atul Jain SBU Head (Fans &
International Business) BE - Mechanical, MBA 54 31 04-Jul-17
LeEco Technology - COO & Head of India Operations
Puneet Dhawan SBU Head (Lighting, Switchgear & Wiring
Accessories) B. Tech. (Agri), MBA 53 30 09-Sep-13
Crompton Greaves - GM Sales (Consumer Business)
Srihari Madhava Rao
SVP - Innovation B. Tech. (ECE) 49 27 19-Mar-18 Phillips Lighting
Salil Kapoor Business Head - Appliances B. Tech. (Mechanical),
MBA (Sales & Marketing) 52 31 10-Dec-19 Voltas (COO)
Arvind Kumar Singh VP & Head - Manufacturing -
Fans B. Tech. (Mechanical) 55 32 02-May-16 Hero Cycles
Source: Company
Exhibit 8: Revenues and growth trend
8.5 7.6
8.6
10.8
8.9
0
2
4
6
8
10
12
0
5
10
15
20
25
30
FY18 FY19 FY20 FY21 FY22E
(%)(Rs bn)
Revenue EBITDA margin %
Source: Company, Systematix Institutional Research

29 April 2022
170 Systematix Research is also available on Bloomberg SSSL <Go>, Thomson & Reuters Systematix Shares and Stocks (India) Limited
Orient Electric
A leader in fans, expanding into newer categories
Since it was taken over by the CK Birla group in 1954, ORIENTEL has maintained its leading position in fans in India. It is also India’s largest manufacturer and exporter of fans to more than 40 countries. In the last 10 years, it has expanded the range of product offerings by entering lighting (2008), home appliances (2011; geysers, air coolers, kitchen appliances, etc) and switchgears (2015). In 2018, it tied up with the De’Longhi Group, Italy, to market appliances (mostly premium) under three brands –
De’Longhi, Kenwood, Braun – by utilising its vast and expanding distribution network.
ORIENTEL’s high reliance on assembling most of its products has helped it break into new categories without committing much capex. We believe the company has the ability to become a leader in the new categories as well.
Exhibit 9: Products, market share and key competitors
Product category
Revenue mix (FY21; %)
Category launch (year)
Market size (Rs bn)
Orient's market share (%)
Key competitors
Fans 68 1954 100 14 Crompton, Havells, Usha, Bajaj Electricals
Lighting 19 2008 220 2 Philips, Havells, Surya, Bajaj Elec, Wipro,
Crompton, Syska
Appliances 9 2011 120 2 Philips, Havells, Preethi, Racold
Switchgears 4 2015 23 3 Havells, Legrand, Schneider, GM
Source: Company, Industry sources
Growth in fans driven by a richer mix: Despite single-digit volume growth in the industry (which is nearly saturated) in the last few years, premiumization has driven value growth in fans for some of the leaders (Havells, Crompton and ORIENTEL). We expect the trend to sustain and ORIENTEL to grow ahead of the industry.
Lighting – luminaires and fixtures to support growth: ORIENTEL has grown well over FY14-20 (~16% CAGR), mainly driven by lamps – a low-price and low-margin category. The company is also a preferred LED lighting supplier to Energy Efficient Services Ltd (EESL). However, it bids only for select tenders given the cut-throat price competition. Going forward, we believe growth for ORIENTEL will be driven by luminaires and fixtures where it has low presence (~50% of lighting revenues vs 70%+ for peers). It has already launched many new products such as LED battens/ tubes in
this segment and strengthened its team for B2B sales.
Appliances/ Switchgears – strong growth ahead: Appliances and switchgears account for ~12% of consolidated revenues. Given the huge industry size and the management’s target of gaining market share, we believe growth in these two verticals will be strong over the next few years. ORIENTEL is now a meaningful player in air cooler and water heater categories and has also expanded its switchgears portfolio. To expand its range of offerings, it will keep adding products.
Premiumization and innovation, the core thrust areas
The new management has identified premiumization and innovation as the core factors in meeting its goals. From being an economy/ mass-market brand, ORIENTEL has repositioned itself as a leader in premium fans by launching many technology-driven products. Though the market for premium fans (Rs 4,000+ per unit) is currently small (~5% of the industry), it is expected to grow at a fast clip over the next few years. The management intends to increase the combined revenue share from premium and decorative fans (~25% currently) in the next few years.

29 April 2022
171 Systematix Research is also available on Bloomberg SSSL <Go>, Thomson & Reuters Systematix Shares and Stocks (India) Limited
Orient Electric
Exhibit 10: Key launches in the last few years – portfolio undergoing premiumization
Product category Category-wise launches
Fans i-Series and Aeroslim (an IoT-enabled fan), Aerostorm (low sound) Aerolite (power saving), etc under Aero series; Orient Bladeless (fan with no blades); Orient Monroe (compact fan for smaller spaces); Wind Pro (5-blade fan for higher air delivery)
Lighting Emergency LED lights, 5-star BEE rating 9W LED bulb; EyeLuv, India’s First LED lights with Flicker Control technology; a new range of LED battens (18W tricolor Moodlight, 24W Sunlight for high brightness and 20W Pearl LED for low glare)
Air Cooler India’s first IoT and voice-enabled air cooler; a new range of coolers with DenseNest technology in cooling pads, anti-mosquito breeding and anti-bacteria feature; outdoor metal coolers in modular and assembled versions to cater to tier-2 and -3 cities
Water Heater 18 new models including Glassline (features whirlflow technology providing 20% more hot water supply), Enamour (a distinctive design, corrosion free titanium enamel tank and digital temperature display) and Aura Plus (powerful heating element to instantly provide hot water on demand)
Switchgear India’s first Triple Layer Safety in switches
Source: Company
Exhibit 11: Advertisements of smart products – M S Dhoni as the brand icon
Source: Company

29 April 2022
172 Systematix Research is also available on Bloomberg SSSL <Go>, Thomson & Reuters Systematix Shares and Stocks (India) Limited
Orient Electric
Focus on distribution network and branding to drive growth
ORIENTEL has a wide network of >5,000 dealers/ distributors catering to 125,000+ retail outlets in India. In the last few years, the company has focused more on the western region where it is in a relatively weaker position. For higher transparency,
ORIENTEL has worked on uniform pricing for its master distributors across states.
The distribution channel is serviced by four manufacturing plants in the central and eastern regions, 44 branch offices and warehouses and >450 service centres across India. It has consolidated its regional warehouses into a mother depot for more efficient deliveries and to save on logistics costs.
ORIENTEL is now a leading brand in e-commerce and is further strengthening its B2B team in lighting and switchgears verticals. Also, it is the largest exporter of fans to >40 countries (though facing political uncertainty in West Asia and Africa).
Exhibit 12: Retail touchpoints – a wide distribution footprint
0
50,000
1,00,000
1,50,000
2,00,000
2,50,000
BJE
CR
OM
PTO
N
HA
VL
PO
LYC
AB
OR
IEN
TEL
FNX
C
VG
RD
(Nos.)
Source: Company, Systematix Institutional Research
Setting up a greenfield plant
ORIENTEL is setting up a manufacturing plant in South India to strengthen its position in the southern and western markets. The company will invest Rs 1.7bn in its Hyderabad plant, which will be ready for commissioning by end-FY23. Starting with fans, the plant will also be used for manufacturing other product lines. The new R&D centre at Faridabad will help consolidate operations, improve efficiency and faster
decision-making.
Building financial efficiency
Along with high growth, the management has set a target of achieving financial efficiency through better working capital management, implementation of IT infrastructure and an efficient supply chain as a priority. It aims to manage working capital efficiently by reducing receivables and inventories while increasing the quantum of channel and vendor financing. The rollout of Sales Force Automation, and business intelligence and DMS software would help in product traceability and demand forecasting. This, along with warehouse consolidation, has resulted in better inventory management for the company. While considerable progress has been seen
in these areas, we see enough headroom for further improvement.
M S Dhoni is the brand ambassador

29 April 2022
173 Systematix Research is also available on Bloomberg SSSL <Go>, Thomson & Reuters Systematix Shares and Stocks (India) Limited
Orient Electric
High investment in advertising & promotion (A&P) spends
ORIENTEL spends ~4% of its revenues on A&P, among the highest in the industry. It has inducted MS Dhoni as the brand ambassador. The huge investments have helped the company increase its brand visibility and reposition itself as a serious, young and energetic company with a portfolio of innovative products. After the hefty A&P commitment of the last few years, we see ORIENTEL maintaining the annual spend in absolute terms but curtailing it as a proportion of revenues. This, we believe, will lead to a margin expansion for the company.
Exhibit 13: A&P spend to be rationalized in the coming years
0
0.5
1
1.5
2
2.5
3
3.5
4
4.5
5
0
100
200
300
400
500
600
700
800
900
FY18 FY19 FY20 FY21
(%)(Rs mn)
A&P spend % revenue (RHS)
Source: Company, Systematix Institutional Research
Our estimates build in 17% revenue CAGR and 14% PAT CAGR over FY21-24E
Premiumization and innovation have been the key themes for ORIENTEL after its demerger from the parent – already reflected in its recent financial performance. Over FY21-24E, we expect 17% CAGR in the company’s revenues (8% over FY18-21) with 16% and 17% CAGR in ECD (fans and appliances) and lighting & switchgears respectively. The growth is attributable to a stronger brand equity in its core operations (fans and lights) and entry into new businesses. While EBIDTA margins stood at 10.8% in FY21 on lower discretionary expenses, we expect margins to sustain in the 9-10% range over the next two years (despite the RM cost pressure and heightened competition) with scope for further expansion on the back of operating leverage and higher efficiency.
Exhibit 14: ECD – revenues and growth trend Exhibit 15: Lighting & Switchgears – revenues and growth trend
0
5
10
15
20
25
30
FY18 FY19 FY20 FY21 FY22E FY23E FY24E
(Rs bn)
Revenue
0
1
2
3
4
5
6
7
8
9
FY18 FY19 FY20 FY21 FY22E FY23E FY24E
(Rs bn)
Revenue
Source: Company, Systematix Institutional Research Source: Company, Systematix Institutional Research

29 April 2022
174 Systematix Research is also available on Bloomberg SSSL <Go>, Thomson & Reuters Systematix Shares and Stocks (India) Limited
Orient Electric
Financial Analysis
Multiple levers for all-round growth
After an 8% CAGR in ORIENTEL’s revenues over FY18-21, we expect the growth rate to be sustained with 16% CAGR over FY21-24E, driven by both ECD and L&S segments. However, we see its gross margins (~28% currently) and EBITDA margins (~10%) lagging the 30-35% and 12-15% range respectively for peers.
To re-establish its position as the leader in fans, gain further ground in premium fans, diversify into related categories and make itself future ready, ORIENTEL has made hefty investments in brand building, channel expansion, and systems and processes. We expect the full benefits of these efforts to start accruing in the coming period. After committing significantly higher spends on A&P (~4% of revenues) over the last few years, we expect the spend to taper in terms of percent of revenues even as it remains high in absolute terms. Also, we believe cost-savings from Sanchay and other programmes will be reinvested into the business to improve systems and
processes as also dealer reach.
Exhibit 16: Revenues and growth trend Exhibit 17: PAT and growth trend
0
5
10
15
20
25
30
FY18 FY19 FY20 FY21 FY22E FY23E FY24E
(Rs bn)
Revenue
0
0
0
1
1
1
1
1
2
2
2
FY18 FY19 FY20 FY21 FY22E FY23E FY24E
(Rs bn)
PAT
Source: Company, Systematix Institutional Research Source: Company, Systematix Institutional Research
Exhibit 18: Gross and EBITDA margin trend Exhibit 19: ECD and L&S – EBIT margin trend
0
5
10
15
20
25
30
35
40
FY18 FY19 FY20 FY21 FY22E FY23E FY24E
(%)
Gross margin EBITDA margin
0
2
4
6
8
10
12
14
16
FY18 FY19 FY20 FY21 FY22E FY23E FY24E
(%)
ECD L&S
Source: Company, Systematix Institutional Research Source: Company, Systematix Institutional Research

29 April 2022
175 Systematix Research is also available on Bloomberg SSSL <Go>, Thomson & Reuters Systematix Shares and Stocks (India) Limited
Orient Electric
RoE to remain healthy on margin expansion and tight WC management
Despite its low margins, ORIENTEL enjoys a healthy RoE (~26% in FY21) on account of its high turnover ratio with higher reliance on outsourcing. While capex intensity is set to increase in the coming years in line with the company’s increasing focus on in-house manufacturing, we expect RoE to remain healthy at ~25%, supported by an expected margin expansion.
Also, ORIENTEL aims to reduce its working capital cycle by lowering debtors (via channel financing) and fewer inventory days (warehouse consolidation, etc). This will keep the balance sheet lean, aid return ratios and will drive healthy FCFs.
Exhibit 20: RoE and RoCE trend Exhibit 21: Net working capital cycle trend
14
19
24
29
34
39
44
FY18 FY19 FY20 FY21 FY22E FY23E FY24E
(%)
RoE % RoCE %
0
10
20
30
40
50
60
70
80
90
100
Receivables Inventory Payables Net WC cycle
(Days)
FY18 FY19 FY20 FY21 FY22E FY23E FY24E
Source: Company, Systematix Institutional Research Source: Company, Systematix Institutional Research
Exhibit 22: OCF, Capex and FCF trend
-1
0
1
1
2
2
3
3
4
4
5
OCF Capex FCF
(Rs bn)
FY18 FY19 FY20 FY21 FY22E FY23E FY24E
Source: Company, Systematix Institutional Research
Exhibit 23: Dupont analysis
FY18 FY19 FY20 FY21 FY22E FY23E FY24E
PAT margin (%) 4.0 3.7 3.8 5.9 4.8 5.3 5.5
Asset turnover (x) 3.7 4.3 4.5 4.3 4.3 3.9 3.6
Equity multiplier (x) 1.6 1.4 1.3 1.0 1.1 1.2 1.2
RoE (%) 24.3 22.6 21.9 26.3 23.6 24.6 24.8
Source: Company, Systematix Institutional Research

29 April 2022
176 Systematix Research is also available on Bloomberg SSSL <Go>, Thomson & Reuters Systematix Shares and Stocks (India) Limited
Orient Electric
Valuation and Outlook
ORIENTEL is the leader in the fans and lighting segment while clocking strong growth in newer categories (appliances, switchgears, etc) as well. The new management’s renewed focus since 2015 has helped the company reposition itself as a serious, young and energetic brand offering premium and innovative products. With higher brand visibility on high A&P spends and a wide distribution network, it would look to enter new categories as part of its growth strategy.
Having registered an 8% revenue CAGR, 17% EBITDA CAGR and 23% PAT CAGR over FY18-21, we estimate 17% revenue CAGR, 14% EBITDA CAGR and 14% PAT CAGR for ORIENTEL over FY21-24E on the back of growth across product categories and stable margins. We also expect it to maintain RoE at a healthy ~25% and strong FCF.
While ORIENTEL promises a strong growth profile, an efficient WC cycle and healthy free cash flows, we find the stock fairly valued at current valuations of 38x FY24E earnings. Thus, we initiate coverage on ORIENTEL with a HOLD rating and price target of Rs 302 (6% downside from CMP), based on 36x FY24E earnings (vs 42x its 5-year mean). Increasing competition is a key risk to our growth and margin estimates.
Exhibit 24: 1-year forward PE band and standard deviation
20
25
30
35
40
45
50
55
60
65
May
-18
Au
g-1
8
No
v-1
8
Feb
-19
May
-19
Au
g-1
9
Oct
-19
Jan
-20
Ap
r-2
0
Jul-
20
Oct
-20
Jan
-21
Ap
r-2
1
Jul-
21
Oct
-21
Jan
-22
Ap
r-2
2
P/E Mean +1 SD -1 SD
-1SD
+1SD
Mean
Source: BSE, Systematix Institutional Research
29 April 2022
177 Systematix Research is also available on Bloomberg SSSL <Go>, Thomson & Reuters Systematix Shares and Stocks (India) Limited
Orient Electric
Key risks and risk mitigating measures
Raw material price volatility
With the economy opening up post lifting of the COVID-induced lockdowns, the pent-up demand for commodities has driven a sharp rise in RM prices. Industrial commodities, including key raw materials such as copper, steel and aluminium, have seen significant and sustained price spikes. Any marked volatility in raw material prices may eat into the company’s profitability and earnings if it is unable to take adequate price hikes.
Raw material costs comprise ~70% of ORIENTEL’s revenues.
High dependence on summer-relevant products
ORIENTEL’s ECD division largely comprises summer-relevant products – fans and coolers. Therefore, a cooler summer may affect performance of the company.
Economic slowdown
A sluggish domestic economy due to global factors may have a short-term negative impact on demand. For the past couple of years, the housing sector has also generated muted demand for electrical goods. While there are signs of revival in the housing sector, errant supply of electricity may hamper growth prospects of the industry. Availability of uninterrupted power supply is key to demand of electrical products.
Hyper-competition in the market
The consumer electricals industry has traditionally been competitive due to the
presence of many large players as well as fragmented regional players.
With reduced entry barriers on increasing pervasiveness of digital commerce channels and the emergence of large Original Equipment Manufacturers (OEMs) and Original Design Manufacturers (ODMs), many companies are venturing into the consumer electricals space. Increased competition may result in irrational price
behaviour from some market participants and may hamper growth in the industry.

29 April 2022
178 Systematix Research is also available on Bloomberg SSSL <Go>, Thomson & Reuters Systematix Shares and Stocks (India) Limited
Orient Electric
Annexures

29 April 2022
179 Systematix Research is also available on Bloomberg SSSL <Go>, Thomson & Reuters Systematix Shares and Stocks (India) Limited
Orient Electric
Company Background
Orient Electric (ORIENTEL) was established in 2017 after demerger of the consumer electricals business of Orient Paper considering the different nature of businesses under one company. The main objective was to make ORIENTEL a one-stop-shop for lifestyle electrical solutions by introducing disruptive products in existing and new categories. The company was listed on the stock
exchanges on 14 May 2018.
Since being taken over by the CK Birla group in 1954, ORIENTEL has maintained its leading position in fans in India. It is also the largest exporter of fans to more than 40 countries. In the last 10 years, it has entered the lighting (in 2008), home appliances (2011;
geysers, air coolers, kitchen appliances, etc) and switchgears (2015) segments.
In 2018, the company tied up with the De’Longhi Group of Italy to market appliances (mostly premium) under three brands – De’Longhi, Kenwood and Braun – through its extensive and growing distribution network. A high reliance on procuring components for most of its products from third-party and assembling them in-house has helped it enter new categories without much capex. We believe ORIENTEL has capabilities to become a leader in the new categories as well.
Exhibit 25: The journey so far
Year Remarks
1940 Established in Kolkata
1954 Inducted into the CK Birla Group; renamed as Orient Fans
1990 Developed and patented the revolutionary PSPO technology
2008 Entered lighting business with CFL, FTL and GLS
2011 Entered home appliances business with coolers, water heaters and kitchen appliances
2014 Started manufacturing LED Lighting with complete backward integration
2015 Entered switchgears business
2017 Orient Electric demerges from Orient Paper Ltd; Aero series fan launched
2018 Orient Electric listed on Stock Exchanges
2019 Certified as ‘Great Place to Work’
2020 Entered the coveted Fortune India 500 list for the first time
Source: Company
Exhibit 26: Revenue mix (FY21)
74%
26%
ECD (fans, appliances)
Lighting & switchgear
Source: Company
Manufacturing footprint: ORIENTEL has manufacturing facilities in Kolkata, Faridabad and Noida, and is India’s largest manufacturer and exporter of fans.

29 April 2022
180 Systematix Research is also available on Bloomberg SSSL <Go>, Thomson & Reuters Systematix Shares and Stocks (India) Limited
Orient Electric
Exhibit 27: Manufacturing capacity – a balanced portfolio
~55% of ORIENTEL’s production is in-house. It outsources the remaining
Five manufacturing plants in Kolkata, Faridabad, Noida and Guwahati
Largest manufacturer of fans in India: installed capacity of 12.5mn units
Second-largest manufacturer of LED lamps in India; installed capacity of 40mn units
One of the largest LED bulb manufacturers with streetlight manufacturing capacity of 3.3mn units
Manufacturing capacity of 6.5mn switchgear poles
Has a DSRI-approved R&D lab
Source: Company
Promoters, key management personnel
Chandra Kant Birla, Chairman and Non-Executive Director, is also the chairman of several companies of the CK Birla Group, which
has interests in automobiles, technology, infrastructure, building products, healthcare and education.
Rakesh Khanna, Managing Director and CEO, has a B.E. (Mechanical) degree from Thapar Institute and is an MBA in marketing from the University of Mumbai. He has more than 30 years’ work experience in India and abroad in consumer durables, consumer electronics, electricals and lighting industries. He was formerly with Jumbo Electronics and Sony.
Saibal Sengupta, Chief Financial Officer, is a chartered accountant with 24 years of experience. He was formerly with Usha
International and Dabur.
Exhibit 28: Shareholding pattern and key shareholders
Equity stake (%) Key institutional holders % equity
Sep-21 Dec-21 Mar-22 Mar-22
Promoters 38.5 38.5 38.5 Nippon MF 6.4
Free float 61.5 61.5 61.5 Mirae MF 5.5
- Foreign Institutions 8.7 9.0 8.3 Kotak MF 3.2
- Domestic Institutions 23.8 24.9 26.3 ICICI Pru MF 2.6
- Public 29.0 27.6 26.9 Axis MF 2.4
Source: BSE, Bloomberg
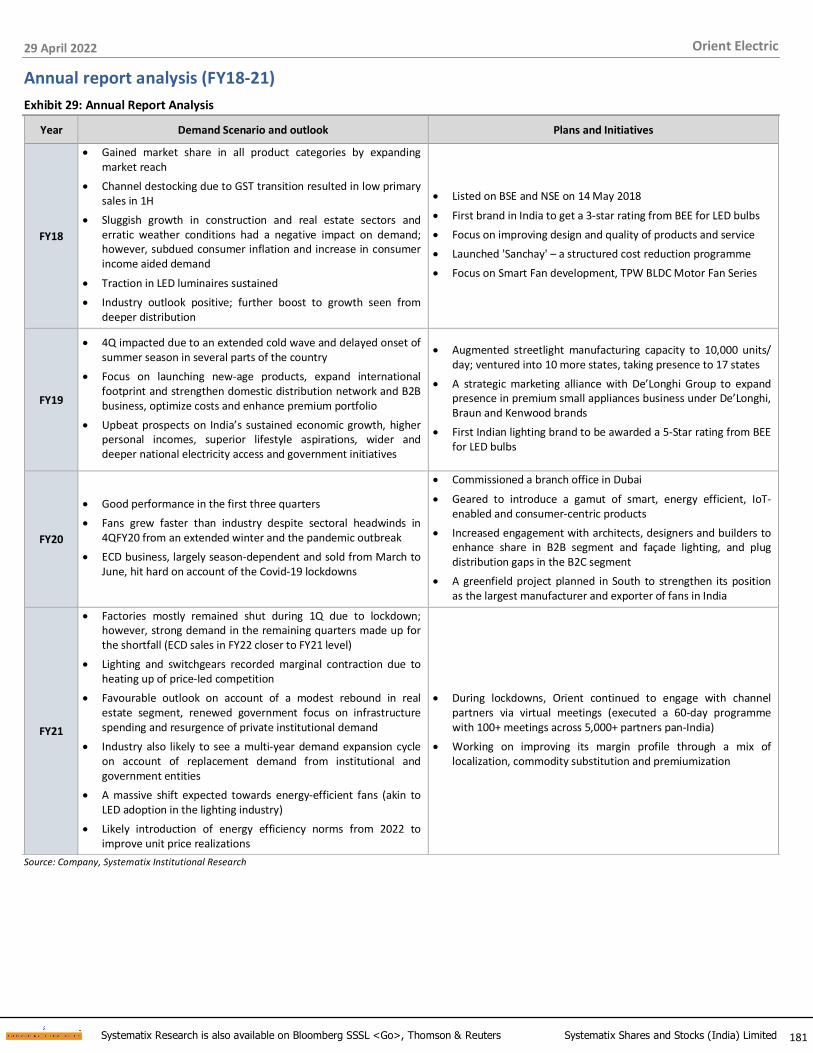
29 April 2022
181 Systematix Research is also available on Bloomberg SSSL <Go>, Thomson & Reuters Systematix Shares and Stocks (India) Limited
Orient Electric
Annual report analysis (FY18-21)
Exhibit 29: Annual Report Analysis
Year Demand Scenario and outlook Plans and Initiatives
FY18
• Gained market share in all product categories by expanding market reach
• Channel destocking due to GST transition resulted in low primary sales in 1H
• Sluggish growth in construction and real estate sectors and erratic weather conditions had a negative impact on demand; however, subdued consumer inflation and increase in consumer income aided demand
• Traction in LED luminaires sustained
• Industry outlook positive; further boost to growth seen from deeper distribution
• Listed on BSE and NSE on 14 May 2018
• First brand in India to get a 3-star rating from BEE for LED bulbs
• Focus on improving design and quality of products and service
• Launched 'Sanchay' – a structured cost reduction programme
• Focus on Smart Fan development, TPW BLDC Motor Fan Series
FY19
• 4Q impacted due to an extended cold wave and delayed onset of summer season in several parts of the country
• Focus on launching new-age products, expand international footprint and strengthen domestic distribution network and B2B business, optimize costs and enhance premium portfolio
• Upbeat prospects on India’s sustained economic growth, higher personal incomes, superior lifestyle aspirations, wider and deeper national electricity access and government initiatives
• Augmented streetlight manufacturing capacity to 10,000 units/ day; ventured into 10 more states, taking presence to 17 states
• A strategic marketing alliance with De’Longhi Group to expand presence in premium small appliances business under De’Longhi, Braun and Kenwood brands
• First Indian lighting brand to be awarded a 5-Star rating from BEE for LED bulbs
FY20
• Good performance in the first three quarters
• Fans grew faster than industry despite sectoral headwinds in 4QFY20 from an extended winter and the pandemic outbreak
• ECD business, largely season-dependent and sold from March to June, hit hard on account of the Covid-19 lockdowns
• Commissioned a branch office in Dubai
• Geared to introduce a gamut of smart, energy efficient, IoT-enabled and consumer-centric products
• Increased engagement with architects, designers and builders to enhance share in B2B segment and façade lighting, and plug distribution gaps in the B2C segment
• A greenfield project planned in South to strengthen its position as the largest manufacturer and exporter of fans in India
FY21
• Factories mostly remained shut during 1Q due to lockdown; however, strong demand in the remaining quarters made up for the shortfall (ECD sales in FY22 closer to FY21 level)
• Lighting and switchgears recorded marginal contraction due to heating up of price-led competition
• Favourable outlook on account of a modest rebound in real estate segment, renewed government focus on infrastructure spending and resurgence of private institutional demand
• Industry also likely to see a multi-year demand expansion cycle on account of replacement demand from institutional and government entities
• A massive shift expected towards energy-efficient fans (akin to LED adoption in the lighting industry)
• Likely introduction of energy efficiency norms from 2022 to improve unit price realizations
• During lockdowns, Orient continued to engage with channel partners via virtual meetings (executed a 60-day programme with 100+ meetings across 5,000+ partners pan-India)
• Working on improving its margin profile through a mix of localization, commodity substitution and premiumization
Source: Company, Systematix Institutional Research

29 April 2022
182 Systematix Research is also available on Bloomberg SSSL <Go>, Thomson & Reuters Systematix Shares and Stocks (India) Limited
Orient Electric
FINANCIALS (STANDALONE)
Profit & Loss Statement
YE: Mar (Rs mn) FY20 FY21 FY22E FY23E FY24E
Net revenues 20,618 20,326 25,681 28,762 32,214
Growth (%) 10.6 -1.4 26.3 12.0 12.0
Raw material expenses 14,094 14,209 18,803 20,945 23,362
Gross Margin (%) 31.6 30.1 26.8 27.2 27.5
Employee & Other exp. 4,761 3,921 4,587 5,080 5,625
EBITDA 1,764 2,195 2,291 2,738 3,228
EBITDA margins (%) 8.6 10.8 8.9 9.5 10.0
Depreciation 401 432 471 584 707
Other income 41 63 41 56 81
Finance costs 261 207 193 185 215
PBT 1,143 1,619 1,667 2,026 2,388
Effective tax rate (%) 31.2 26.0 25.4 25.4 25.4
Associates/(Minorities) - - - - -
Net Income 786 1,198 1,244 1,511 1,781
Adjusted net income 786 1,198 1,244 1,511 1,781
Shares outstanding 212 212 212 212 212
FDEPS (Rs) 3.7 5.6 5.9 7.1 8.4
FDEPS growth (%) 13.4 52.3 3.9 21.5 17.9
Source: Company, Systematix Institutional Research
Balance Sheet
YE: Mar (Rs mn) FY20 FY21 FY22E FY23E FY24E
Share capital 212 212 212 212 212
Net worth 3,594 4,557 5,270 6,145 7,183
Total debt 947 153 653 1,153 1,653
Minority interest - - - - -
DT Liability/ (Asset) - - - - -
Capital Employed 4,541 4,709 5,923 7,297 8,836
Net tangible assets 1,838 1,716 2,235 2,841 3,324
Net Intangible assets 131 230 240 250 260
Goodwill - - - - -
CWIP 35 26 28 30 32
Investments (Strategic) - - - - -
Investments (Financial) - - 2,000 2,500 3,000
Current Assets 7,527 7,076 7,109 7,899 8,780
Cash 75 2,576 305 329 608
Current Liabilities 5,064 6,914 5,994 6,551 7,168
Working capital 2,463 162 1,114 1,348 1,611
Capital Deployed 4,541 4,709 5,923 7,297 8,836
Contingent Liabilities 165 178 - - -
Source: Company, Systematix Institutional Research
Cash Flow
YE: Mar (Rs mn) FY20 FY21 FY22E FY23E FY24E
EBIT (incl. other income) 1,796 2,044 1,819 2,154 2,521
Non-cash items 401 432 471 584 707
OCF before WC changes 2,197 2,475 2,291 2,738 3,228
Incr./(decr.) in WC 577 (2,172) 943 223 254
Others including taxes 328 375 451 542 634
Operating cash-flow 1,292 4,273 897 1,973 2,340
Capex 526 359 1,002 1,202 1,202
Free cash-flow 766 3,914 (105) 771 1,138
Acquisitions - - - - -
Dividend 294 265 530 637 743
Equity raised - - - - -
Debt raised (476) (961) 500 500 500
Fin Investments (5) (1) 2,000 500 500
Misc. Items (CFI + CFF) 245 1,358 135 111 116
Net cash-flow (245) 1,330 (2,270) 23 279
Source: Company, Systematix Institutional Research
Ratios @ Rs2,368
YE: Mar FY20 FY21 FY22E FY23E FY24E
P/E (x) 86.4 56.7 54.6 44.9 38.1
EV/EBITDA (x) 39.0 29.8 28.9 24.2 20.4
EV/sales (x) 3.3 3.2 2.6 2.3 2.0
P/B (x) 18.9 14.9 12.9 11.1 9.5
RoE (%) 21.9 26.3 23.6 24.6 24.8
RoCE (%) 31.7 39.5 35.0 33.4 32.3
ROIC (%) 18.6 36.3 43.3 37.4 36.7
DPS (Rs per share) 1.2 2.0 2.5 3.0 3.5
Dividend yield (%) 0.4 0.6 0.8 0.9 1.1
Dividend payout (%) 31 35 43 42 42
Net debt/equity (x) 0.2 (0.5) (0.3) (0.3) (0.3)
Receivables (days) 69 69 45 45 45
Inventory (days) 51 45 45 45 45
Payables (days) 59 93 60 60 60
CFO:PAT% 164 357 72 131 131
Source: Company, Systematix Institutional Research
29 April 2022
183 Systematix Research is also available on Bloomberg SSSL <Go>, Thomson & Reuters Systematix Shares and Stocks (India) Limited
India Consumer Electricals
Nikhil Khandelwal Managing Director +91-22-6704 8001 [email protected]
Navin Roy Vallabhaneni President & Head – IE +91-22-6704 8065 [email protected]
Equity Research
Analysts Industry Sectors Desk-Phone E-mail
Ashish Poddar Consumer Durables, Building Materials, Small & Midcaps +91-22-6704 8039 [email protected]
Ashutosh Joytiraditya Consumer, Retail +91-22-6704 8068 [email protected]
Pratik Tholiya Specialty & Agro Chem, Fertilisers, Sugar, Textiles and Select Midcaps +91-22-6704 8028 [email protected]
Rahul Jain Metals & Mining, Cement +91-22-6704 8066 [email protected]
Rakesh Kumar Banking, Insurance +91-22-6704 8041 [email protected]
Ronak Sarda Auto, Auto Ancillaries +91-22-6704 8059 [email protected]
Shubhranshu Mishra NBFCs & Diversified Financials +91-22-6704 8024 [email protected]
Girija Shankar Ray Cement, Building Materials, Paints +91-22-6704 8098 [email protected]
Hena Vora NBFCs & Diversified Financials +91-22-6704 8045 [email protected]
Nikhil Shah Banking, Insurance +91-22-6704 8091 [email protected]
Poorvi Banka Auto, Auto Ancillaries +91-22-6704 8063 [email protected]
Pranay Shah Consumer Durables, Building Materials, Small & Midcaps +91-22-6704 8017 [email protected]
Shweta Dikshit Metals & Mining +91-22-6704 8042 [email protected]
Varun Gajaria Midcaps +91-22-6704 8081 [email protected]
Equity Sales & Trading
Name Desk-Phone E-mail
Vipul Sanghvi Director and Head - Sales +91-22-6704 8062 [email protected]
Ashok Kumar Agarwal Sales +91-22-6704 8058 [email protected]
Jigar Kamdar Sales +91-22-6704 8060 [email protected]
Nirbhay Kumar Singh Sales +91-22-6704 8061 [email protected]
Sidharth Agrawal Sales +91-22-6704 8090 [email protected]
Rahul Khandelwal Sales +91-22-6704 8003 [email protected]
Pawan Sharma Director and Head - Sales Trading +91-22-6704 8067 [email protected]
Mukesh Chaturvedi Vice President and Co Head - Sales Trading +91-22-6704 8074 [email protected]
Vinod Bhuwad Sales Trading +91-22-6704 8051 [email protected]
Rashmi Solanki Sales Trading +91-22-6704 8097 [email protected]
Karan Damani Sales Trading +91-22-6704 8053 [email protected]
Vipul Chheda Dealer +91-22-6704 8087 [email protected]
Paras Shah Dealer +91-22-6704 8047 [email protected]
Suketu Vyas Dealer +91-22-6704 8050 [email protected]
Rahul Singh Dealer +91-22-6704 8054 [email protected]
Corporate Access
Audrey Leolyn Mendonca Assistant Vice President +91-22-6704 8088 [email protected]
Production
Mrunali Pagdhare Production +91-22-6704 8057 [email protected]
Vijayendra Achrekar Production +91-22-6704 8089 [email protected]
Operations
Sachin Malusare Vice President +91-22-6704 8055 [email protected]
Jignesh Mistry Manager +91-22-6704 8049 [email protected]
Ravikiran Dasaka Manager +91-22-6704 8019 [email protected]
Institutional Equities Team

29 April 2022
184 Systematix Research is also available on Bloomberg SSSL <Go>, Thomson & Reuters Systematix Shares and Stocks (India) Limited
India Consumer Electricals
DISCLOSURES/APPENDIX
I. ANALYST CERTIFICATION
I, Ashish Poddar, Pranay Shah; hereby certify that (1) views expressed in this research report accurately reflect my/our personal views about any or all of the subject securities or issuers referred to in this research report, (2) no part of my/our compensation was, is, or will be directly or indirectly related to the specific recommendations or views expressed in this research report by Systematix Shares and Stocks (India) Limited (SSSIL) or its group/associate companies, (3) reasonable care is taken to achieve and maintain independence and objectivity in making any recommendations.
Disclosure of Interest Statement Update
Analyst holding in the stock No
Served as an officer, director or employee No
II. ISSUER SPECIFIC REGULATORY DISCLOSURES, unless specifically mentioned in point no. 9 below:
1. The research analyst(s), SSSIL, associates or relatives do not have any financial interest in the company(ies) covered in this report.
2. The research analyst(s), SSSIL, associates or relatives collectively do not hold more than 1% of the securities of the company(ies) covered in this report as of the end of the month immediately preceding the distribution of the research report.
3. The research analyst(s), SSSIL, associates or relatives did not have any other material conflict of interest at the time of publication of this research report.
4. The research analyst, SSSIL and its associates have not received compensation for investment banking or merchant banking or brokerage services or any other products or services from the company(ies) covered in this report in the past twelve months.
5. The research analyst, SSSIL or its associates have not managed or co-managed a private or public offering of securities for the company(ies) covered in this report in the previous
twelve months.
6. SSSIL or its associates have not received compensation or other benefits from the company(ies) covered in this report or from any third party in connection with this research report.
7. The research analyst has not served as an officer, director or employee of the company(ies) covered in this research report.
8. The research analyst and SSSIL have not been engaged in market making activity for the company(ies) covered in this research report.
9. Details of SSSIL, research analyst and its associates pertaining to the companies covered in this research report:
Sr. No.
Particulars Yes / No.
1 Whether compensation was received from the company(ies) covered in the research report in the past 12 months for investment banking transaction by SSSIL. No 2 Whether research analyst, SSSIL or its associates and relatives collectively hold more than 1% of the company(ies) covered in the research report. No 3
Whether compensation has been received by SSSIL or its associates from the company(ies) covered in the research report. No
4 Whether SSSIL or its affiliates have managed or co-managed a private or public offering of securities for the company(ies) covered in the research report in the previous twelve months.
No
5 Whether research analyst, SSSIL or associates have received compensation for investment banking or merchant banking or brokerage services or any other products or services from the company(ies) covered in the research report in the last twelve months.
No
10. There is no material disciplinary action taken by any regulatory authority that impacts the equity research analysis activities.
STOCK RATINGS
BUY (B): The stock's total return is expected to exceed 15% over the next 12 months. HOLD (H): The stock's total return is expected to be within -15% to +15% over the next 12 months. SELL (S): The stock's total return is expected to give negative returns of more than 15% over the next 12 months. NOT RATED (NR): The analyst has no recommendation on the stock under review.
INDUSTRY VIEWS
ATTRACTIVE (AT): Fundamentals/valuations of the sector are expected to be attractive over the next 12-18 months. NEUTRAL (NL): Fundamentals/valuations of the sector are expected to neither improve nor deteriorate over the next 12-18 months. CAUTIOUS (CS): Fundamentals/valuations of the sector are expected to deteriorate over the next 12-18 months.
III. DISCLAIMER
The information and opinions contained herein have been compiled or arrived at based on the information obtained in good faith from sources believed to be reliable. Such information has not been independently verified and no guaranty, representation of warranty, express or implied, is made as to its accuracy completeness or correctness.
This document is for information purposes only. This report is based on information that we consider reliable; we do not represent that it is accurate or complete and one should exercise due caution while acting on it. Description of any company(ies) or its/their securities mentioned herein are not complete and this document is not and should not be construed as an offer or solicitation of an offer to buy or sell any securities or other financial instruments. Past performance is not a guide for future performance, future returns are not guaranteed and a loss of original capital may occur. All opinions, projections and estimates constitute the judgment of the author as on the date of the report and these, plus any other information contained in the report, are subject to change without notice. Prices and availability of financial instruments are also subject to change without notice. This report is intended for
distribution to institutional investors.
This report is not directed to or intended for display, downloading, printing, reproducing or for distribution to or use by, any person or entity that is a citizen or resident or located in any locality, state, country or other jurisdiction where such distribution, publication, reproduction, availability or use would be contrary to law or regulation or what would subject to SSSIL or its affiliates to any registration or licensing requirement within such jurisdiction. If this report is inadvertently sent or has reached any individual in such country, especially USA, the same may be ignored and brought to the attention of the sender. Neither this document nor any copy of it may be taken or transmitted into the United States (to U.S. persons), Canada, or Japan or distributed, directly or indirectly, in the United States or Canada or distributed or redistributed in Japan or to any resident thereof. Any unauthorized use, duplication,

29 April 2022
185 Systematix Research is also available on Bloomberg SSSL <Go>, Thomson & Reuters Systematix Shares and Stocks (India) Limited
India Consumer Electricals
redistribution or disclosure of this report including, but not limited to, redistribution by electronic mail, posting of the report on a website or page, and/or providing to a third party a link, is prohibited by law and will result in prosecution. The information contained in the report is intended solely for the recipient and may not be further distributed by the recipient to any third party.
SSSIL generally prohibits its analysts, persons reporting to analysts, and members of their households from maintaining a financial interest in the securities or derivatives of any companies that the analysts cover. Additionally, SSSIL generally prohibits its analysts and persons reporting to analysts from serving as an officer, director, or advisory board member of any companies that they cover. Our salespeople, traders, and other professionals or affiliates may provide oral or written market commentary or trading strategies to our clients that reflect opinions that are contrary to the opinions expressed herein. Our proprietary trading and investing businesses may make investment decisions that are inconsistent with the recommendations expressed herein. The views expressed in this research report reflect the personal views of the analyst(s) about the subject securities or issues and no part of the compensation of the research analyst(s) was, is, or will be directly or indirectly related to the specific recommendations and views expressed by research analyst(s) in this report. The compensation of the analyst who prepared this document is determined exclusively by SSSIL; however, compensation may relate to the revenues of the Systematix Group as a whole, of
which investment banking, sales and trading are a part. Research analysts and sales persons of SSSIL may provide important inputs to its affiliated company(ies).
Foreign currencies denominated securities, wherever mentioned, are subject to exchange rate fluctuations which could have an adverse effect on their value or price or the income derived from them. In addition, investors in securities such as ADRs, the values of which are influenced by foreign currencies, effectively assume currency risk. SSSIL, its directors, analysts or employees do not take any responsibility, financial or otherwise, of the losses or the damages sustained due to the investments made or any action taken on the basis of this report including but not restricted to fluctuation in the prices of shares and bonds, changes in the currency rates, diminution in the NAVs, reduction in the dividend or income, etc.
SSSIL and its affiliates, officers, directors, and employees subject to the information given in the disclosures may: (a) from time to time, have long or short positions in, and buy or sell, the securities thereof, of company (ies) mentioned herein or (b) be engaged in any other transaction involving such securities and earn brokerage or other compensation (financial interest)
or act as a market maker in the financial instruments of the company (ies) discussed herein or act as advisor or lender / borrower to such company (ies) or have other potential material conflict of interest with respect to any recommendation and related information and opinions. The views expressed are those of the analyst and the company may or may not subscribe to the views expressed therein.
SSSIL, its affiliates and any third party involved in, or related to, computing or compiling the information hereby expressly disclaim all warranties of originality, accuracy, completeness, merchantability or fitness for a particular purpose with respect to any of this information. Without limiting any of the foregoing, in no event shall SSSIL, any of its affiliates or any third party involved in, or related to, computing or compiling the information have any liability for any damages of any kind. The company accepts no liability whatsoever for the actions of third parties. The report may provide the addresses of, or contain hyperlinks to, websites. Except to the extent to which the report refers to website material of the company, the
company has not reviewed the linked site. Accessing such website or following such link through the report or the website of the company shall be at your own risk and the company shall have no liability arising out of, or in connection with, any such referenced website.
SSSIL will not be liable for any delay or any other interruption which may occur in presenting the data due to any technical glitch to present the data. In no event shall SSSIL be liable for any damages, including without limitation, direct or indirect, special, incidental, or consequential damages, losses or expenses arising in connection with the data presented by SSSIL through this presentation.
SSSIL or any of its other group companies or associates will not be responsible for any decisions taken on the basis of this report. Investors are advised to consult their investment and tax consultants before taking any investment decisions based on this report.
Systematix Shares and Stocks (India) Limited: Registered and Corporate address: The Capital, A-wing, No. 603 – 606, 6th Floor, Plot No. C-70, G Block, Bandra Kurla Complex, Bandra (East), Mumbai – 400 051
CIN - U65993MH1995PLC268414 | BSE SEBI Reg. No.: INZ000171134 (Member Code: 182) | NSE SEBI Reg. No.: INZ000171134 (Member Code: 11327) | MCX SEBI Reg. No.: INZ000171134 (Member Code: 56625) | NCDEX SEBI Reg. No.: INZ000171134 (Member Code: 1281) | Depository Participant SEBI Reg. No.: IN-DP-480-2020 (DP Id: 34600) | PMS SEBI Reg. No.: INP000002692 | Research Analyst SEBI Reg. No.: INH200000840 | Investment Advisor SEBI Reg. No. INA000010414 | AMFI : ARN - 64917