INCRI~E OF SOIL STRENGTH OVER TIME IN A US SOL'THEASTERN COAST At PLAIN LOAMY SAND
8
July 2()()6 Vol. 171,No.7 Printed in U.S.A 0038-075X/O6/17107-519-526 Soil Science Copyright ~ 2(x)6by Lippincott Williams & Wilkins, Inc. INCRI~E OF SOIL STRENGTH OVER TIME IN A US SOL'THEASTERN COASTAt PLAIN LOAMY SAND Warren J. Busscher, Jeff M. Novak, PatrickG. Hunt, and Philip J. Bauer With rising energy costs, fuel-consumptive soil management practi- ces, such as deep tillage, need to be reassessedto detern1ine whether they need to be perforn1ed every year or not. Between 1978 and 1996, conservation (nondisked) and conventional (disked) tillage treatments had been annually deep-tilled with noninversion subsoiling to break up a subsurface layer that had high soil strength, associated with the E horizon of a coastal loam sand. Mter 1996, treatments were split with half being deep-tilled until 2001, after which no treatments were deep-tilled, although surface tillage continued. By 1999, soybean (Glycine max L. Merr.) treatments in which deep tillage ceased in 1996 were significantly higher in cone index (as measured by a penetrometer) than were treatments that had been deep-tilled, suggesting that the effects of deep tillage lasted three years. By 2004, conventional treatments in which tillage ceased in 2001 had reconsolidated to the point that they were not different from conventional treatments where tillage had ceased in 1996. However, conservation tillage treatments were still significantly differ- ent, suggesting that conservation tillage can help buffer the effects of reconsolidation. Two competing trends could be observed. On the one hand, although reconsolidation might not be complete, soils with incomplete reconsolidation could be hard enough to reduce production. On the other hand, soils in which tillage ceased still showed the effects of deep tillage even after they reconsolidated to the point that they were statistically different from deep-tilled treatments. (Soil Science 2006;171:519-526) Key words: Soil strength, cone index, conservation tillage, hardpan. I N the southeastern US coastal plains and similar areas, several factors can combine to limit productivity; they include sandy soils with low water holding capacity, short periods of drought, and shallow high-strength root- restricting subsurface layers. High strength in many coastal plain soils of the southeastern United States, especially in the E horizon, impedes plant growth; it degrades soil physical properties, reducing the yield of row crops (Arvidsson et al., 2001; Lapen et al., 2001; Radford et al., 2001) like com (Zea mays L.), wheat (Triticum aestivum L.), and soybean (Gly- Coost.1PI.ins Soil, W.t.r, .nd Pi.nt Res..rch C.nt.r, 2611 W Luc.s 51, Ror.nc., SC 29501.1242. W.rren J B.ssch.r iscorrespondin! .uthor E-m.il [email protected]..!OV Rec.~.d Oct. 12,2005; accept.d Feb. 8, 2006. DOIIO.I097/01.ss.0000228033.26905.eO 519 cine max L. Ment.). High strengths can be reduced and yield ~proved through deep till- age (Reeves and Mullins, 1995; Busscher et al., 2000; Raper et al.,. 2000). Deep tillage of these coastal soils is reco~ended annually (Threadgill, 1982; Busscher et al., 1986; Porter and Khalilian, 1995) or seasonally for double crops (Frederick et al., 1998) becajJse reconsolidation between growing seasons can increase soil strengths enough to reduce produc~vity. In some studies, the residual effectsof ~ep tillage were shown to be effective for years (Munkholm et al., 2001; Baumhardt and ]oqes, 2002), especiallyif traffic is limited to speciftc rnidrows (Frederick et al., 1998),whereas the effects aregone after3 yearsor lessin other studies (Busscher et al., 1995; Shukla et al., 2003}. Producers typically till these sandy coastal soils with subsoilers,a noninversion method of
Transcript of INCRI~E OF SOIL STRENGTH OVER TIME IN A US SOL'THEASTERN COAST At PLAIN LOAMY SAND
July 2()()6
Vol. 171,No.7
Printed in U.S.A
0038-075X/O6/17107-519-526
Soil ScienceCopyright ~ 2(x)6 by Lippincott Williams & Wilkins, Inc.
INCRI~E OF SOIL STRENGTH OVER TIME IN A USSOL'THEASTERN COAST At PLAIN LOAMY SAND
Warren J. Busscher, Jeff M. Novak, Patrick G. Hunt, and Philip J. Bauer
With rising energy costs, fuel-consumptive soil management practi-ces, such as deep tillage, need to be reassessed to detern1ine whether theyneed to be perforn1ed every year or not. Between 1978 and 1996,conservation (nondisked) and conventional (disked) tillage treatmentshad been annually deep-tilled with noninversion subsoiling to break up asubsurface layer that had high soil strength, associated with the E horizonof a coastal loam sand. Mter 1996, treatments were split with half beingdeep-tilled until 2001, after which no treatments were deep-tilled,although surface tillage continued. By 1999, soybean (Glycine max L.Merr.) treatments in which deep tillage ceased in 1996 were significantlyhigher in cone index (as measured by a penetrometer) than weretreatments that had been deep-tilled, suggesting that the effects of deeptillage lasted three years. By 2004, conventional treatments in whichtillage ceased in 2001 had reconsolidated to the point that they were notdifferent from conventional treatments where tillage had ceased in 1996.However, conservation tillage treatments were still significantly differ-ent, suggesting that conservation tillage can help buffer the effects ofreconsolidation. Two competing trends could be observed. On the onehand, although reconsolidation might not be complete, soils withincomplete reconsolidation could be hard enough to reduce production.On the other hand, soils in which tillage ceased still showed the effects ofdeep tillage even after they reconsolidated to the point that they werestatistically different from deep-tilled treatments. (Soil Science2006;171:519-526)
Key words: Soil strength, cone index, conservation tillage, hardpan.
I N the southeastern US coastal plains andsimilar areas, several factors can combine to
limit productivity; they include sandy soils withlow water holding capacity, short periods ofdrought, and shallow high-strength root-restricting subsurface layers. High strength inmany coastal plain soils of the southeasternUnited States, especially in the E horizon,impedes plant growth; it degrades soil physicalproperties, reducing the yield of row crops(Arvidsson et al., 2001; Lapen et al., 2001;Radford et al., 2001) like com (Zea mays L.),wheat (Triticum aestivum L.), and soybean (Gly-
Coost.1 PI.ins Soil, W.t.r, .nd Pi.nt Res..rch C.nt.r, 2611 W Luc.s 51,
Ror.nc., SC 29501.1242. W.rren J B.ssch.r is correspondin! .uthor E-m.il
[email protected]..!OV
Rec.~.d Oct. 12, 2005; accept.d Feb. 8, 2006.
DOIIO.I097/01.ss.0000228033.26905.eO
519
cine max L. Ment.). High strengths can bereduced and yield ~proved through deep till-age (Reeves and Mullins, 1995; Busscher et al.,2000; Raper et al.,. 2000). Deep tillage of thesecoastal soils is reco~ended annually (Threadgill,1982; Busscher et al., 1986; Porter and Khalilian,1995) or seasonally for double crops (Fredericket al., 1998) becajJse reconsolidation betweengrowing seasons can increase soil strengths enoughto reduce produc~vity. In some studies, theresidual effects of ~ep tillage were shown to beeffective for years (Munkholm et al., 2001;Baumhardt and ]oqes, 2002), especially if trafficis limited to speciftc rnidrows (Frederick et al.,1998), whereas the effects are gone after 3 years orless in other studies (Busscher et al., 1995; Shuklaet al., 2003}.
Producers typically till these sandy coastalsoils with subsoilers, a noninversion method of
SOil SCIENCE520 BUSSCHER. ET AL.
deep tillage that breaks up hard subsurface layers.Deep tillage loosens the soil to allow rootgrowth into deeper horizons that have a higherdegree of structural development and greaterwater holding capacities than do shallow hori-zons; this can encourage root growth andimprove yield (Adeoye and Mohamed-Saleem,1990; Akinci et al., 2004). However, as fuelprices increase, deep tillage may become pro-hibitively expensive because it requires 14 to 20k W of power per subsoil shank and uses 20 to25 L of fuel per hectare (Karlen et al., 1991).High fuel prices and significant energy require-ments make deep tillage a significant part ofplant production management costs despite thefact that the effect on the soil is temporary(Carter et al., 1996; Busscher et al., 2000). Moreresearch needs to be performed to detertnine soilreconsolidation and frequency of deep tillage.
The objective of this study is to measurethe differences between deep-tilled and non-deep-tilled treatments after tillage ceased inconventional (disked) and conservation (non-disked) tillage plots. We hypothesized that plotswould recompact to values equivalent to non-deep-tilled plots within three years. We testedthe hypothesis by measuring the differences insoil strength either among treatments or betweenthe in-row position, where tillage effect wouldbe maximized, and the midrow position, wheretillage effects would be minimized, as theychanged over the years after tillage.
2- to 5-cmol kg-J cation exchange capacity,and 200- to 400-g kg-J clay content (SoilSurvey Staa: 2005).
During the first 18-year period of theexperiment (Karlen et al., 1996; Hunt et al.,1997), crops grown on the plots included cornand winter wheat double cropped with soybeanor cotton (Gossypium hirsutum L.). During thattime, organic matter increased to about 14 gkg-J in the top 100 mm of the profile of theconservation tillage plots, whereas it rose to 8 gkg-J at the same depth interval for the conven-tional tillage plots (Hunt et al., 1996). Subsoilsof these treatments were similar, having beenuniformly managed with in-row deep tillagethroughout the 18-year period (Karlen et aI.,1996; Hunt et al., 1997).
Tillage ManagementFor this study, corn and wheat with
double-cropped soybean were grown in atWo-year rotation; both phases of the rotationwere planted in duplicate sets of plots to allowfor investigation of each crop in every year.The study was initiated in No-vember 1997when wheat was planted in halt of the plots.The next spring, com was planted in the otherplots; after wheat harvest, soybean was plantedin the wheat plots. Main plot treatmentsincluded surface tillage (conventional vs. con-servation tillage). Conventional tillage consistedof multiple diskings of the surface at the depthof 0.10 to 0.15 m; conservation tillage consis-ted of no surface tillage. Subplot treatmentsincluded no deep tillage versus noninversiondeep tillage of the E horizon with either aPara Till (AGCO Corporation, Duluth, GA) ora subsoiler (Kelly Manufacturing Co, Tifton,GA). The ParaTill was configured with foursubsoiling-legs (0.66 m apart and 25 mm wide);each leg was preceded by a serrated coulter.The legs were 0.94 m long (top to ground)with a 45-degree angle bend (left rows to theright and right rows to the left) at 0.69 m fromthe top. Each leg had a 64-mm-wide point,which was set to a soil depth of 0.42 m. Eachleg had a shatter plate above and behind thepoint to provide lifting and fracturing of soilwith minimal disturbance of the soil surface.The Para Till was used to provide broadcastdeep tillage before drilling soybeans or wheat.The subsoiler was configured with four legsspaced (0.72 m apart and 25 mm wide); eachleg was preceded by a serrated coulter. The legswere 45-degree forward-angled straight shanks.
MATERIALS AND METHODS
Site and Management Description
This study was conducted on a long-termresearch site that had conventional (disked) andconservation (nondisked) tillage plots establishedin 1978 on a Norfolk loamy sand (fine-loamy,siliceous, thennic Typic Kandiudult) near Flor-ence, South Carolina. The Norfolk soil formedin coastal marine sediments. It had an Aphorizon that had been tilled over the years to adepth of about 0.20 m. Below the tilled layer, ithad an eluviated E horizon that typically variesin depth from 0.30 to 1.0 m and, whenrecompacted, developed penetration resistancethat restricts root growth. Both the Ap and Ehorizons had less than 5- to 6-g kg-I organicmatter, 1- to 4-cmol kg-I cation exchangecapacity, and 20- to 80-g kg-I clay content.They overlaid a sandy clay loam Bt horizon thatextended beyond O.6-m depth. The Bt horizontypically had less than 5-g kg-I organic matter,
l71
-No.7 INCREASE OF SOIL STRENGTH 521VOL.
The shanks were attached to a tool barimmediately in front of each planter; thus, in-row subsoiling and planting were perfonned inone operation. The combination of subsoilingand paratilling resulted in three deep tillageevents in each tWo-year rotation.
Every year, plots continued to be surtace-tilled (or not). All plots were deep-tilled untilthe fall of 1995. Starting in the spring of1996, surface tillage plots were split into tWo60-m-long and 11.4-m-wide deep tillage sub-plots. The plot and subplot treatments were asfollows: (i) no surface and no deep tillage, (ii) nosurface tillage with deep tillage, (iii) surfacetillage and no deep tillage, and (iv) surface anddeep tillage. After 2001, no plots were deep-tilled, whereas surface tillage continued. Subplotsconsisted off our treatments for each crop in eachyear. The experimental design was a split plotwith four replications. Because of the variety ofmachinery used in the plots over the years, trafficwas not limited to any specific midrows.
Strength Measurements
Soil strength was measured as cone index ofa penetrometer in soybean plots on July 29 toAugust 3, 1998; May 11, 1999; July 31, 2000;August 2, 2001; June 28, 2002; June 25 and 27,2003; and June 30, 2004. The dates of measure-ment varied because many of these years weredry; rain was often required to soften the soil andallow measurements to be within the range of thepenetrometer. Cone indices were the forcerequired to push the penetrometer into the soildivided by the cross-sectional area of the cone.They were measured up to 9 megapascals (MPa)before going off-scale; cone indices at or above9 MPa would be well above those consideredacceptable for plant root growth in these soils(Busscher et al., 1986). Soil cone index data wereobtained with a 12.5-mm diameter, 30-degreesolid angle cone tip attached to a hand-operated,recording penetrometer (Carter, 1967). Coneindices were measured near the middle of eachtillage subplot to a depth of 0.55 m at nine equallyspaced positions along a 0.76-m transect per-pendicular to the rows (spacing, 95 mm); thesemeasurements spanned approximately from aposition betWeen the shanks that was a non-wheel track across a region that was deep-tilled toa position betWeen shanks that was a wheel track.At each position, the measurements were themeans of three probings that were about 4 cmapart and parallel to the row. Until 2002, cone~
Crop Management
Corn
Each year in March, growing season weedsin conventional tillage plots were controlled by
applying cyanazine (2-[ {4-chloro-6-(ethylamino)-1,3 ,5-triazin- 2-yl } amino)-2-methylpropanenitrile)and metolachlor (2-chloro-N-[2-ethyl-6-methyl-phenyl)-N-[2-methoxy-l-methylethyl) acet-amide). Weeds in the conservation till plotswere controlled with an initial burndown of
giyphosate (N-[phosphonomethyl)giycine), cyan-azine, and metolachlor; in May, giufosinate (2-arnin 0-4- [hydroxymeth y lp hosp hinyl) butanoicacid) was used. Granular fertilizer was applied atthe rate of 15, 10, and 90 kg ha-t for N, P, andK, respectively. Com (cv. Pioneer 34SA55Liberty Linked) was planted in late March orearly April at a rate of59,300 seeds per hectare on0.76-m row spacing. Liquid N (urea ammoniumnitrate) was surface-applied in May of each yearat the rate of 110 kg ofN per hectare. Com washarvested in August or September with a Case IHModel 2366 combine.
J.Vhcat
Glyphosate was applied at the rate of 0.94 kga.e. ha-1 in October. The conventional tillageplots received multiple diskings. The plots then
indices in the form of analog data were recordedon index cards and subsequently digitized atSO-rnrn depth intervals. After 2002, cone indiceswere measured with a strain gauge; depth wasmeasured with a potentiometer; and data weredownloaded to a CR21x or CR23x data logger(Campbell Scientific, Inc, Logan, UT) and trans-ferred to a computer. Automated data werecollected at a rate of 100 Hz. Automated datacollection produced more data with depth thandid the digitized data, and because the data wereobtained on the basis of time of probing and notof depth, they were not necessarily at the samedepths. To standardize the readings, the auto-mated data for all depths and all positions werecalculated for SO-rnrn depth intervals and 9S-rnrnwidth positions using bivariate interpolation inthe G3GRID procedure ofSAS (1999), resultingin less than the original amount of data for theautomated sampling but uniform data for all datesof measurement. Soil samples were obtainedalong with cone indices to measure gravimetricwater contents. Soil samples were obtained atO.l-m intervals to 0.6-m depths.
522 BUSSCHER, ET Ai. SOil SCIENCE
received N, P, K, and lime fertilizers at 50, 14,15, and 1120 kg ha-1, respectively. In Novem-ber, wheat (cv. Coker 9835) was planted with ano-till grain drill Uohn Deere Model 750) at aseeding rate of 100 kg of seed per hectare on0.19-m row spacings. Bromoxynil (oclanoic acidester of bromoxynil (3,5-dibromo-4-hydroxy-benzonitrile]) and ammonium nitrate werebroadcast in February. Wheat was harvested inJune with a Case IH Model 2366 combine.
Soybean
After wheat harvest, the conservation tillageplots were sprayed with 0.41 kg a.e. ha-1 ofglyphosate; the conventional tillage plots weresprayed with 0.45 kg a.i. ha-1 ofpendimethalin(n-(1-ethylpropyl]-3-4-dimethyl-2,6-dinitro-benzenamine). Conventional tillage plots receivedmultiple diskings and all plots received fertilizer(10-kg P ha-1 and 56-kg K ha-1 beforeplanting. Soybean (cv. Northrup King 573Z6)was planted as soon as practical in June after
-twheat harvest at the rate of 112 kg ha with theno-till grain drill in 0.19-m rows. In July,glyphosate (0.41 kg a.e. ha-1) was appliedover-the-top. Soybean was harvested in Octoberor November with a Case IH Model 2366combine. 7;--- --~ --, ~~fj)~~, ---
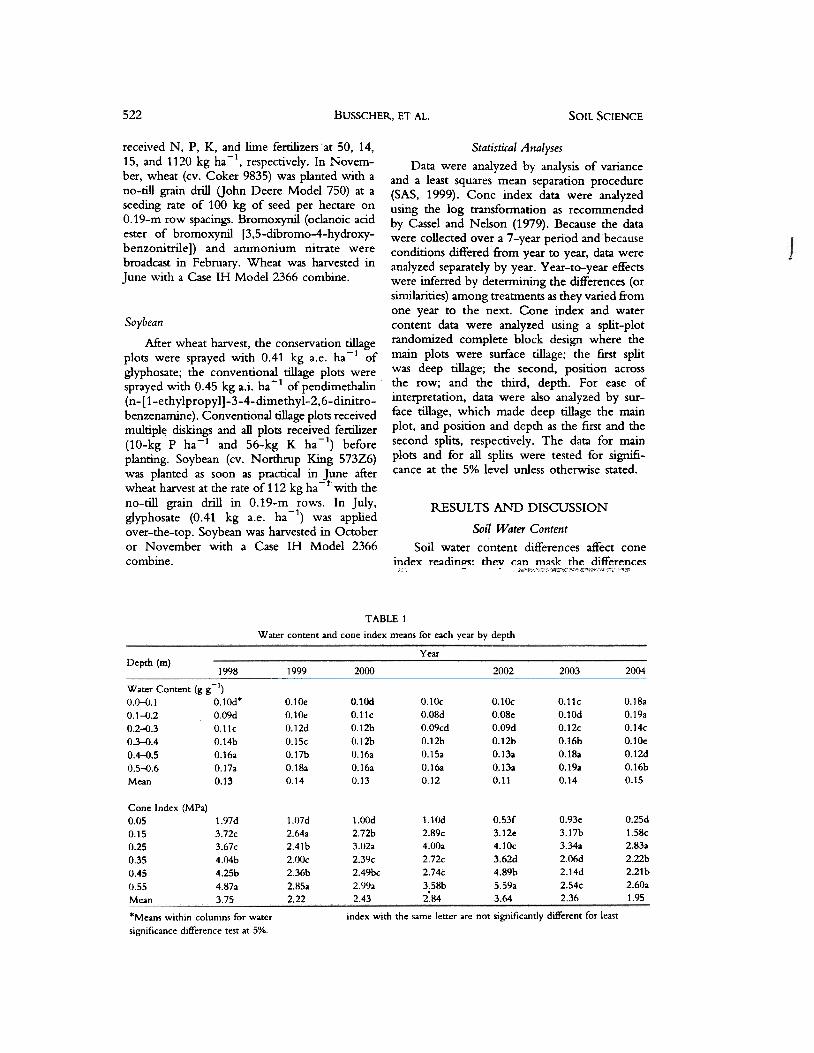
TABLE 1
Water content and cone index means for each year by depth
YearDepth (m)
2002 20041998 1999 2000 2003-1Water Content (g g )
0.0-0.1 0.10d.0.1"'().2 0.09d0.2-{).3 0.11c0.3-0.4 0.14b0.4-0.5 0.16a0.5,..().6 0.17aMean 0.13
0.1OdO.l1c0.12b0.12b0.16a0.16a0.13
O.IOc0.08d0.09cd0.12b0.15a0.16a0.12
O.IOc
0.08e
0.09d
0.12b
0.13a
0.13a
0.11
0.11c0.10d0.12c0.16b0.18a0.19a0.14
0.18a0.19a0.14c0.10e0.12d0.16b0.15
0.10e0.10e0.12d0.15c0.17b0.18a0.14
Cone Index (MPa)
0.050.150.250.350.450.55Mean
1.07d2.64a2.41b2.(JOc2.36b2.85a2.22
1.()(Jd2.72b3.02.2.39c2.49bc2.99.2.43
1.10d2.89c4.00a2.72c2.74c
3.58b2:84
O.53f3.12e4.10c3.62d4.89b5.59a3.64
O.93e3.17b3.34a2.06d2.14d2.54c2.36
0.25d1.58c2.83a2.22b2.21b2.60a1.95
1.97d3.72c3.67c4.04b4.25b4.87a3.75
index with the same letter are not significantly different for least*Means within columns for watersignificance difference test at 5%.
Statistical Analyses
Data were analyzed by analysis of varianceand a least squares mean separation procedure(SAS, 1999). Cone index data were analyzedusing the log transformation as recommendedby Cassel and Nelson (1979). Because the datawere collected over a 7 -y~ar period and becauseconditions differed from year to year, data wereanalyzed separately by year. Year-to-year effectswere inferred by determining the differences (orsimilarities) among treatments as they varied fromone year to the next. Cone index and watercontent data were analyted using a split-plotrandomized complete block design where themain plots were surface tillage; the first splitwas deep tillage; the second, position acrossthe row; and the third, depth. For ease ofinterpretation, data were also analyzed by sur-face tillage, which made deep tillage the mainplot, and position and depth as the first and thesecond splits, respectively. The data for mainplots and for all splits were tested for signifi-cance at the 5% level unless otherwise stated.
RESULTS AND DISCUSSION
Soil Water Content
Soil water content differences affect coneindex readinl?S: thev can mask the differences
VOL. 171-No.7 INCREASE OF SOIL STRENGTH 523
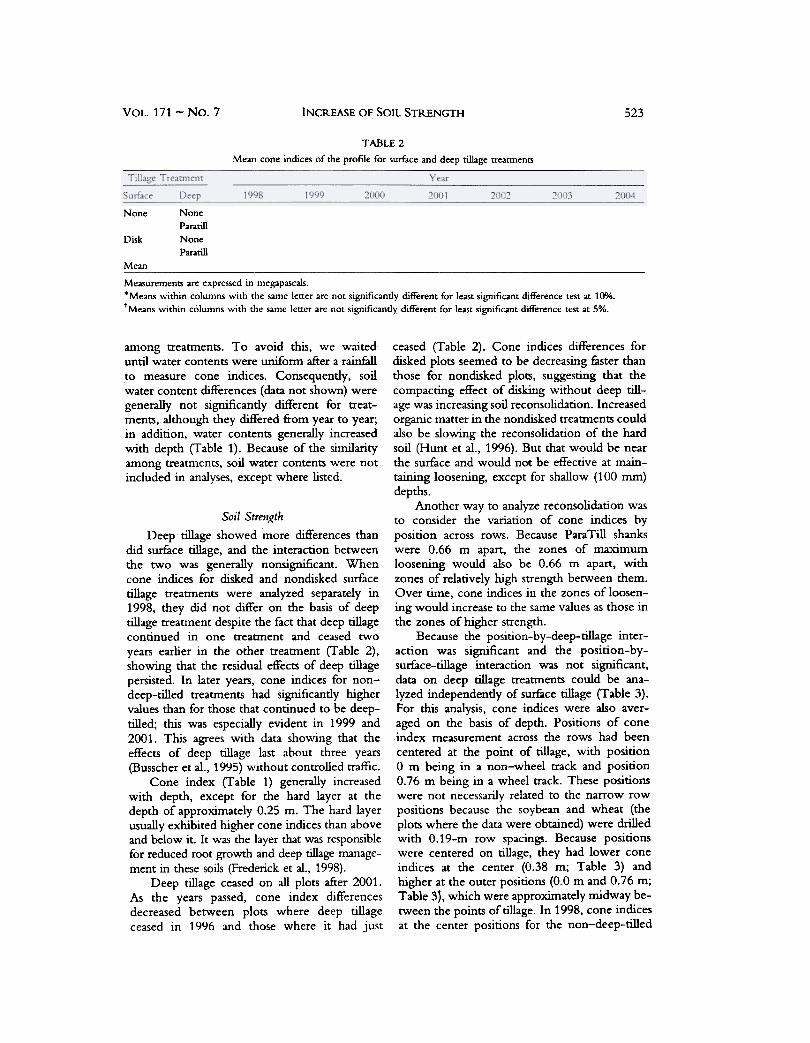
TABLE 2
Mean cone indices of the profile for surface and deep tillage treatments
None NoneParatill
NoneParatill
Disk
Mean
Measurements are expressed in megapasca1s.*Means within columns with the same letter are not significantly different for least significant difference test at 10"/0.tMeans within columns with the same letter are not significantly different for least significant difference test at 5%.
among treatments. To avoid this, we waiteduntil water contents were unifonn after a rainfallto measure cone indices. Consequently, soilwater content differences (data not shown) weregenerally not significantly different for treat-ments, although they differed from year to year;in addition, water contents generally increasedwith depth (Table 1). Because of the similarityamong treatments, soil water contents were notincluded in analyses, except where listed.
Soil Strength
Deep tillage showed more differences thandid surface tillage, and the interaction betweenthe two was generally nonsignificant. Whencone indices for disked and nondisked surfacetillage treatments were analyzed separately in1998, they did not differ on the basis of deeptillage treatment despite the fact that deep tillagecontinued in one treatment and ceased twoyears earlier in the other treatment (Table 2),showing that the residual effects of deep tillagepersisted. In later years, cone indices for non-deep-tilled treatments had significantly highervalues than for those that continued to be deep-tilled; this was especially evident in 1999 and2001. This agrees with data showing that theeffects of deep tillage last about three years(Busscher et al., 1995) without controlled traffic.
Cone index (Table 1) generally increasedwith depth, except for the hard layer at thedepth of approximately 0.25 m. The hard layerusually exhibited higher cone indices than aboveand below it. It was the layer that was responsiblefor reduced root growth and deep tillage manage-ment in these soils (Frederick et al., 1998).
Deep tillage ceased on all plots after 2001.As the years passed, cone index differencesdecreased between plots where deep tillageceased in 1996 and those where it had just
ceased (Table 2). Cone indices differences fordisked plots seemed to be decreasing faster thanthose for nondisked plo~, suggesting that thecompacting effect of disking without deep till-age was increasing soil reconsolidation. Increasedorganic matter in the nondisked treatments couldalso be slowing the reconsolidation of the hardsoil (Hunt et al., 1996). But that would be nearthe surface and would not be effective at main-taining loosening, except for shallow (100 rom)
depths.Another way to analyze reconsolidation was
to consider the variation of cone indices byposition across rows. Because Para Till shankswere 0.66 m apart, the zones of maximumloosening would also be 0.66 m apart, withzones of relatively high strength between them.Over time, cone indices in the zones of loosen-ing would increase to the same values as those inthe zones of higher strength.
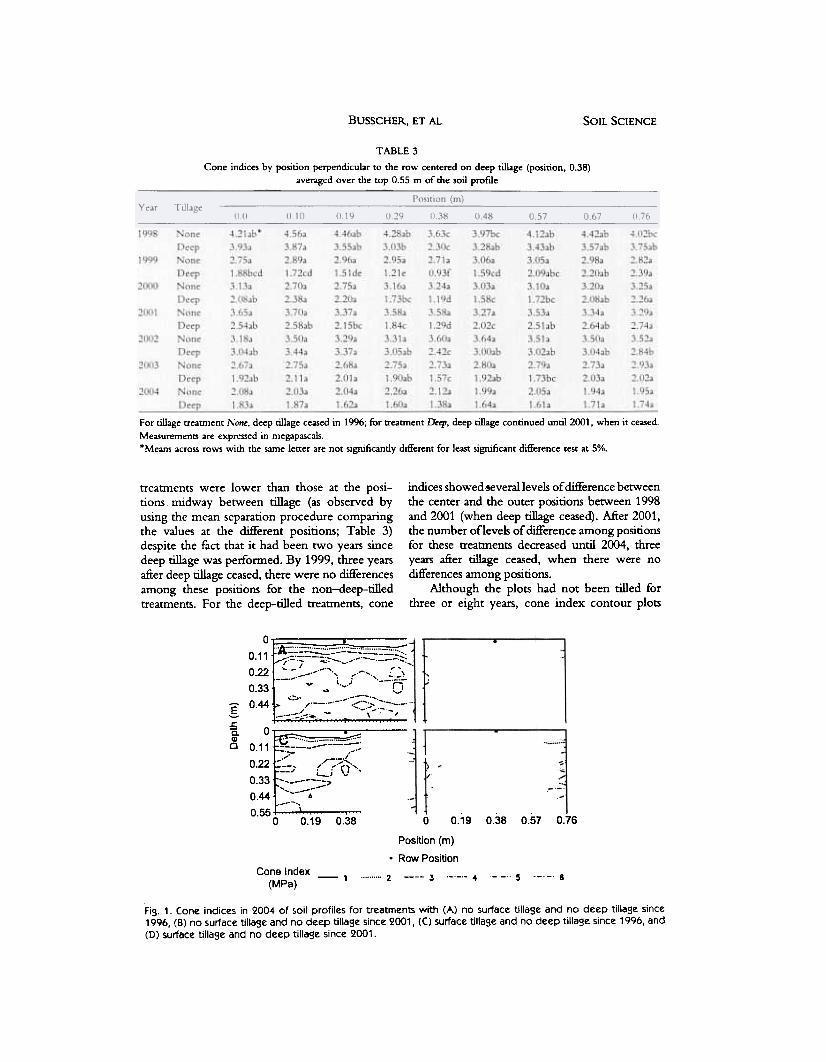
Because the position-by-deep-tillage inter-action was significant and the position-by-surface-tillage interaction was not significant,data on deep tillage treatments could be ana-lyzed independently of slllrface tillage (Table 3).For this analysis, cone indices were also aver-aged on the basis of depth. Positions of coneindex measurement across the rows had beencentered at the point of tillage, with position0 m being in a non-wheel track and position0.76 m being in a wheel track. These positionswere not necessarily related to the narrow rowpositions because the soybean and wheat (theplots where the data were obtained) were drilledwith 0.19-m row spacings. Because positionswere centered on tillage, they had lower coneindices at the center (0.38 m; Table 3) andhigher at the outer positions (0.0 m and 0.76 m;Table 3), which were approximately midway be-tween the points of tillage. In 1998, cone indicesat the center positions for the non-deep-tilled
BUSSCHER, ET AL SOIL SCIENCE
TABLE 3
Cone indices by position perpendicular to the row centered on deep tillage (position, 0.38)averaged over the top 0.55 m of the soil profile
For tillage treatment None, deep tillage ceased in 1996; for a-eatment Deep, deep tillage continued until 2001, when it ceased.Measurements are expressed in megapascals.*Means across rows with the same letter are not significantly different for least significant difference test at 5%.
treatments were lower than those at the posi-tions midway betWeen tillage (as observed byusing the mean separation procedure comparingthe values at the different positions; Table 3)despite the fact that it had been tWo years sincedeep tillage was performed. By 1999, three yearsafter deep tillage ceased, there were no differencesamong these positions for the non-deep-tilledtreatments. For the deep-tilled treatments, cone
indices showed-severallevels of difference betweendle center and dle outer positions between 1998and 2001 (when deep tillage ceased). After 2001,dle number of levels of difference among positionsfor dlese treatments decreased until 2004, threeyears after tillage ceased, when dlere were nodifferences among positions.
Although dle plots had not been tilled forthree or eight years, cone index contour plots
00.11 ~~::~-='~-:~~:~7:::-~:::~-:::.-::::~r::
I0.22 -.::: '.t "'.-".'. --~;:::..-0.33 ..-~ .~..I -0
:§: 0.44 ~_.~:~::--: :C~~-::::: .c
15. 0Q) ""' ;:::::::.::::::.=::."' " c 0 11 ~:0.
22 ~:;"'" ;,(-. ::.;~.". ) "
i.-; \~ .' -:.0.33 ~~ =~ ",,-- .0 44 ,~--- '-~.~
.6 0.55 .
0 0.19 0-38 0.57
", ::::: ;~ ",-~J ~I ( ""~ " ---! ( , --,., '_of
l,'::::::::) 1)---,'.., ,'" ," ~ " ,<-'" --~ ) ,~'-!.~'.'.~~
Cone Index
(MPa)
~~~~~~.:._~.. ( t. ,~~- ,..\ \. ", .,'.1
:;:.:~':~;~:;:;;'.,~:?"f. .I:::~:.0 0.19 0.38 0.57 0.76
Position (m)
.Row Position
2 :5 4 --.5 6-1
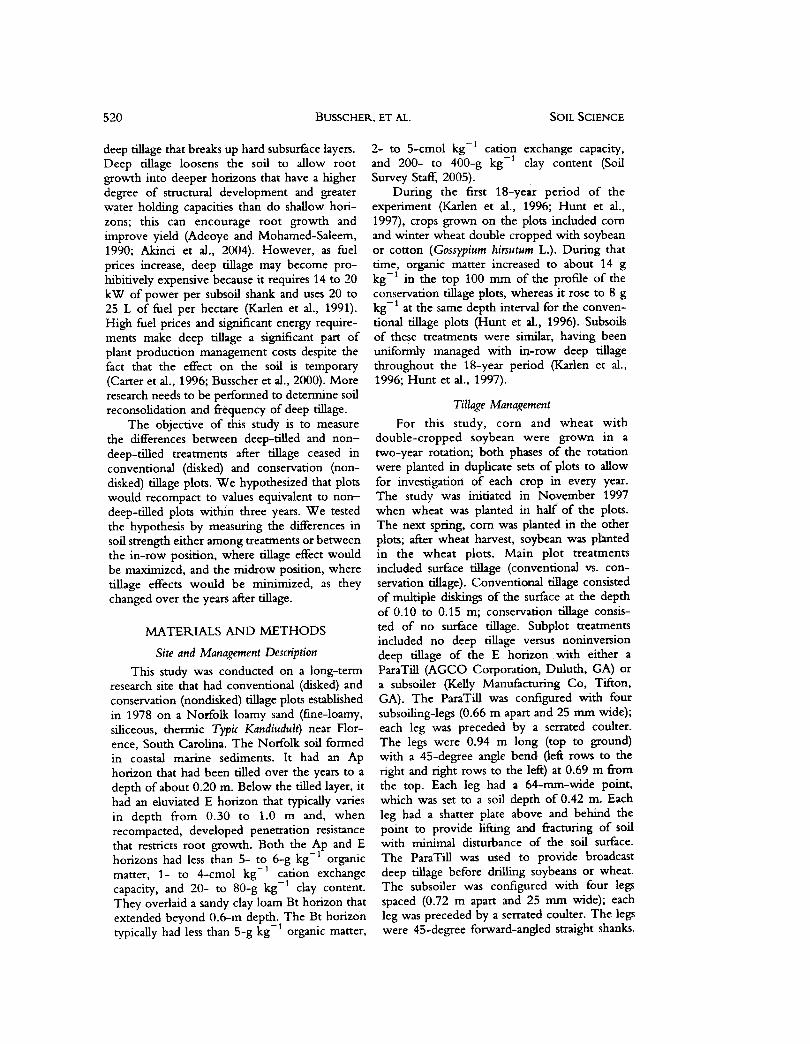
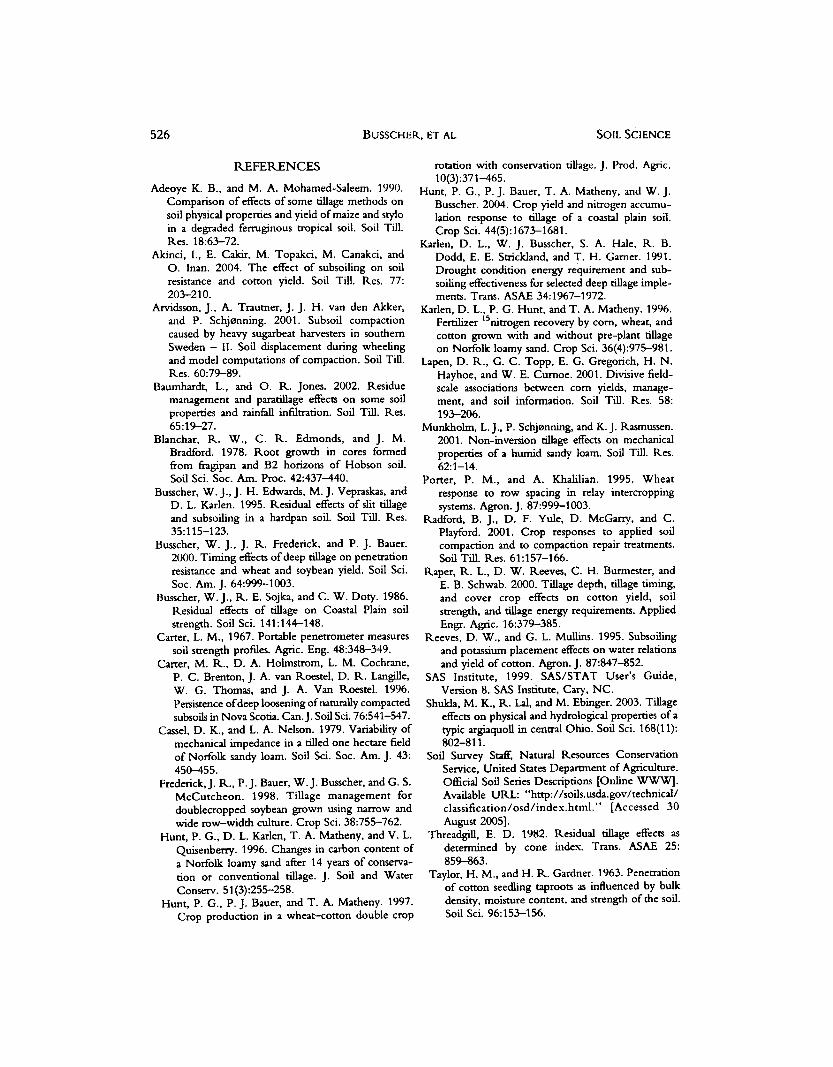
Fig. 1. Cone indices in 2004 of soil profiles for treatments with (A) no surface tillage and no deep tillage since1996/ (8) no surface tillage and no deep tillage since 2001/ (C) surface tillage and no deep tillage since 1996/ and(D) surface tillage and no deep tillage since 2001.

VOL. 171 -No.7 INCREASE OF SOIL STRENGTH 525
show that the positions of deep tillage couldstill be detected near the center of the graphs(Fig. 1). Evidence of deep tillage was moreobvious in treatments that were deep-tilledmore recently (Fig. lb, d). Evidence of deeptillage was also more obvious in treatments thathad not been disked. The fact that reducedcone indices continued to be detected forseveral years after tillage supports the work ofMunkholm et al. (2001) and Baumhardt andJones (2002). In a similar coastal soil, evidenceof tillage could be seen for 6 years despite thefact that cone indices had built up to yieldlimiting values every season (Busscher et al.,2000); although cone index and yield differ-ences from year to year may not have beensignificant, the regression demonstrated a sig-nificant change with time.
-
---"
.~--
1000.-800 -'~.-E 6 ,J.! E 00 ..,.,:,c.,."'- .-:.=:::' = 400 ,"-';':'-' r-
~ f=-.ni-' --,-~ 200. J.-,.tU ..A.--""II: 0 ,,-- -.., ..Q)
.~
~ 1000.~E 800~U 600
400200
0 61 122 183 244 305 366
Day of Year
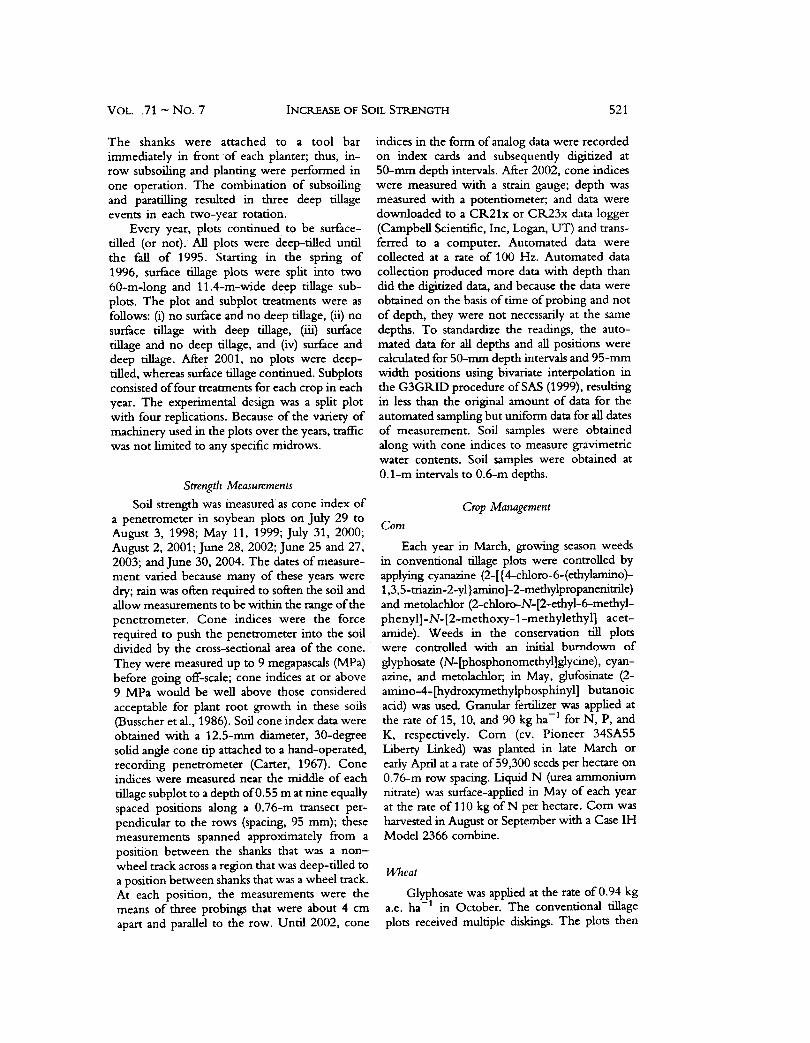
Fig. 2. Cumulative rainfall during the experiment. TheMean is the average for the 120-year period from 1882to 2001. Total annual values include 1111 mm for 1998,1051 mm for 1999, 951 mm for 2000, 521 mm for2001, 828 mm for 2002, 843 mm for 2003, 958 mm for2004, and 1139 mm for the mean.
found that with deep tillage, corn and wheatyields did not differ with disked or nondiskedtreatments. Yet, when deep tillage ceased, yieldswere greater for the nondisked treatments. Theyconcluded that the inclteased organic matteraccumulation in the sumce layer of. the non-disked treatments partially compensated for theneed to deep-till; yet, deep tillage was beneficialfor corn and wheat yields.
CONCLUSIONS
In 1999, split-plot treatments where deeptillage ceased three years earlier had significandyhigher cone indices than treatments where deeptillage was continuous. Additionally. plots thatwere not being tilled had no differences in coneindices for the positions across the rows.
In 2004, three years ~fter deep tillage ceasedon all plots, conventionally tilled plots did nothave significandy lower cone indices than plotsthat had not been tilled for eight years. Plotswith conservation tillage still showed reducedcone indices for the plots not tilled since 2001.Additionally, no plots had differences in coneindices for the positions across the rows,suggesting significant soil recompaction.
During most years, cone indices were above2 MPa, which was considered a root-limitingvalue. This was attributed to both soil recom-paction and rainfall deficits.
Soil Moisture and Rainfall
Soil water contents seem high because wewaited for rain to have relatively uniform soilwater contents when taking cone index read-ings. Generally, years with higher water con-tents (Table 1) had lower cone indices (Table 2)when compared with years with lower watercontents, which had higher cone indices. Whenaveraged over years, cone indices averaged overall treatments increased (r2 = 0.59) as watercontents decreased.
For this study, most years were considereddroughty, partly because of rainfall deficits ofapproximately 180 mm or more when com-pared with the 120-year mean of 1139 mmand partly because of poor rainfall distributionduring the growing seasons; for example, seethe flat sections of the cumulative rainfall in2001 (Fig. 2). In 2002, the rainfall deficit wassevere during the soybean season (approxi-mately Days 170 to 300 of the year; Fig. 2),with that year receiving only half of the normalannual rainfall; that year, the soybean crop wasnot harvested. Rainfall deficits were severeenough to cause mean cone indices at thetimes of measurement to exceed 2 MPa everyyear except 2004; 2-MPa cone indices wereconsidered root limiting (Taylor and Gardner,1963; Blanchar et al., 1978). High cone indices(Table 2) were likely related to both therainfall deficits (especially in 2001 and 2002)and. the high-strength nature of the soil profile(B'usscher et al., 2000).
For information on cone indices and yieldin this experiment, see Hunt et al. (2004). They
199819992000
BUSSCHER. ET AL SOIL SCIENCE526
rotation with conservation tiIJage. J. Prod. Agric.10(3):371-465.
Hunt, P. G., P. J. Bauer, T. A. Matheny, and W. J.Busscher. 2004. Crop yield and nitrogen accumu-lation response to tiIJage of a coastal plain soil.Crop Sci. 44(5):1673-1681.
Karlen, D. L., W. J. Busscher, S. A. Hale, R. B.Dodd, E. E. Strickland, and T. H. Gamer. 1991.Drought condition energy requirement and sub-soiling effectiveness for selected deep tiIJage imple-ments. Trans. ASAE 34:1967-1972.
Karlen, D. L., P. G. Hunt, and T. A. Matheny. 1996.Ferti1izer 15nitrogen recovery by com, wheat, andcotton grown with and without pre-plant tiIJageon Norfolk loamy sand. Crop Sci. 36(4):975-981.
Lapen, D. R., G. C. Topp, E. G. Gregorich, H. N.Hayhoe, and W. E. Cumoe. 2001. Divisive field-scale associations betWeen com yields, manage-ment, and soil infonnation. Soil TiIJ. Res. 58:193-206.
Munkholm, L. J., P. Schj0nning, and K. J. Rasmussen.2001. Non-inversion tilJage effects on mechanicalproperties of a humid sandy loam. Soil Till. Res.62:1-14.
Porter, P. M., and A. Khalilian. 1995. Wheatresponse to row spacing in relay intercroppingsystems. Agron. J. 87:999-1003.
Radford, B. J., D. F. Yule, D. McGarry, and C.Playford. 2001. Crop responses to applied soilcompaction and to compaction repair treatments.Soil Till. Res. 61:157-166.
Raper, R. L., D. W. Reeves, C. H. Burmester, andE. B. Schwab. 2000. Tillage depth, tilJage timing,and cover crop effects on cotton yield, soilstrength, and tilJage energy requirements. AppliedEngr. Agric. 16:379-385.
Reeves, D. W., and G. L. MulJins. 1995. Subsoilingand potassium placement effects on water relationsand yield of cotton. Agron. J. 87:847-852.
SAS Institute, 1999. SAS/STAT User's Guide,Version 8. SAS InstitUte, Cary, NC.
Shukla, M. K., R. LaJ, and M. Ebinger. 2003. Tillageeffects on physical and hydrological properties of atypic argiaquolJ in central Ohio. Soil Sci. 168(11):802-811.
Soil Survey Staff, Natural Resources ConservationService, United States Department of AgricultUre.Official Soil Series Descriptions [Online WWW].Available URL: "http:/ /soils.usda.gov/technical/classification/osd/index.html." [Accessed 30
August 2005].ThreadgiIJ, E. D. 1982. Residual tilJage effects as
determined by cone index. Trans. ASAE 25:859-863.
Taylor, H. M., and H. R. Gardner. 1963. Penerrationof cotton seedling taproots as influenced by bulkdensity, moistUre content, and strength of the soil.Soil Sci. 96:153-156.
REFERENCES
Adeoye K. B., and M. A. Mohamed-Saleem. 1990.Comparison of effects of some cillage methods onsoil physical properties and yield of maize and styloin a degraded fernlginous tropical soil. Soil Till.Res. 18:63-72.
Akinci, I., E. Cakir, M. Topakci, M. Canakci, ando. Inan. 2004. The effect of subsoiling on soilresistance and cotton yield. Soil Till. Res. 77:203-210.
Arvidsson, J., A. Trautner, J. J. H. van den Akker,and P. Schj0nning. 2001. Subsoil compactioncaused by heavy sugarbeat harvesters in southernSweden -II. Soil displacement during wheelingand model computations of compaction. Soil Till.Res. 60:79-89.
Baumhardt, L., and O. R. Jones. 2002. Residuemanagement and paratillage effects on some soilproperties and rainfall infiltracion. Soil Till. Res.65:19-27.
Blanchar, R. W., C. R. Edmonds, and J. M.Bradford. 1978. Root growth in cores formedfrom fragipan and B2 horizons of Hobson soil.Soil Sci. Soc. Am. Proc. 42:437-440.
Busscher, W. J., J. H. Edwards, M. J. Vepraskas, andD. L. Karlen. 1995. Residual effects of slit tillageand subsoiling in a hardpan soil. Soil Till. Res.35:115-123.
Busscher, W. J., J. R. Frederick, and P. J. Bauer.2000. Timing effects of deep tillage on penetracionresistance and wheat and soybean yield. Soil Sci.Soc. Am. J. 64:999-1003.
Busscher, W.J., R. E. Sojka, and C. W. Doty. 1986.Residual effects of tillage on Coastal Plain soilstrength. Soil Sci. 141:144-148.
Carter, L. M., 1967. Portable penetrometer measuressoil strength profiles. Agric. Eng. 48:348-349.
Carter, M. R., D. A. Holmstrom, L. M. Cochrane,P. C. Brenton, J. A. van Roestel, D. R. Langille,W. G. Thomas, and J. A. Van Roestel. 1996.Persistence of deep loosening of naturally compactedsubsoils in Nova Scotia. Can.J. Soil Sci. 76:541-547.
Cassel, D. K., and L. A. Nelson. 1979. Variability ofmechanical impedance in a tilled one hectare fieldof Norfolk sandy loam. Soil Sci. Soc. Am. J. 43:450-455.
Frederick,J. R., P.J. Bauer, W.J. Busscher, and G. S.McCutcheon. 1998. Tillage management fordoublecropped soybean grown using narrow andwide row-width culture. Crop Sci. 38:755-762.
Hunt, P. G., D. L. Karlen, T. A. Matheny, and V. L.Quisenberry. 1996. Changes in carbon content ofa Norfolk loamy sand after 14 years of conserva-cion or conventional tillage. J. Soil and Water
Conserv.51(3):255-258.Hunt, P. G., P. J. Bauer, and T. A. Matheny. 1997.
Crop produccion in a wheat-cotton double crop