Aspiring to Excellence Annual Report 2005 - Kerry Properties ...
Upload
independentCategory
view
1download
0
1
Incorporating molecular data in fungal systematics: a guide for aspiring researchers 1
2
Kevin D. Hyde1,2, Dhanushka Udayanga1,2, Dimuthu S. Manamgoda1,2, Leho Tedersoo3,4, 3
Ellen Larsson5, Kessy Abarenkov3, Yann J.K. Bertrand5, Bengt Oxelman5, Martin 4
Hartmann6,7, Håvard Kauserud8, Martin Ryberg9, Erik Kristiansson10, R. Henrik Nilsson5,* 5
6 1 Institute of Excellence in Fungal Research 7 2 School of Science, Mae Fah Luang University, Chiang Rai, 57100, Thailand 8 3 Institute of Ecology and Earth Sciences, University of Tartu, Tartu, Estonia 9 4 Natural History Museum, University of Tartu, Tartu, Estonia 10 5 Department of Biological and Environmental Sciences, University of Gothenburg, Box 461, 11
405 30 Göteborg, Sweden 12 6 Forest Soils and Biogeochemistry, Swiss Federal Research Institute WSL, Birmensdorf, 13
Switzerland 14 7 Molecular Ecology, Agroscope Reckenholz-Tänikon Research Station ART, Zurich, 15
Switzerland 16 8 Department of Biology, University of Oslo, PO Box 1066 Blindern, N-0316 Oslo, Norway 17 9 Department of Organismal Biology, Uppsala University, Norbyvägen 18D, 75236 Uppsala, 18
Sweden 19 10 Department of Mathematical Statistics, Chalmers University of Technology, 412 96 20
Göteborg, Sweden 21 * Corresponding author: R. Henrik Nilsson – email – [email protected] 22
23
Abstract 24
The last twenty years have witnessed molecular data emerge as a primary research instrument 25
in most branches of mycology. Fungal systematics, taxonomy, and ecology have all seen 26
tremendous progress and have undergone rapid, far-reaching changes as disciplines in the 27
wake of continual improvement in DNA sequencing technology. A taxonomic study that 28
draws from molecular data involves a long series of steps, ranging from taxon sampling 29
through the various laboratory procedures and data analysis to the publication process. All 30
steps are important and influence the results and the way they are perceived by the scientific 31
community. The present paper provides a reflective overview of all major steps in such a 32
project with the purpose to assist research students about to begin their first study using DNA-33
based methods. We also take the opportunity to discuss the role of taxonomy in biology and 34

2
the life sciences in general in the light of molecular data. While the best way to learn 35
molecular methods is to work side by side with someone experienced, we hope that the 36
present paper will serve to lower the learning threshold for the reader. 37
38
Key words: biodiversity, molecular marker, phylogeny, publication, species, Sanger 39
sequencing, taxonomy 40

3
Introduction 41
Morphology has been the basis of nearly all taxonomic studies of fungi. Most species were 42
previously introduced because their morphology differed from that of other taxa, although in 43
many plant pathogenic genera the host was given a major consideration (Rossman and Palm-44
Hernández 2008; Hyde et al. 2010; Cai et al. 2011). Genera were introduced because they 45
were deemed sufficiently distinct from other groups of species, and the differences typically 46
amounted to one to several characters. Groups of genera were combined into families and 47
families into orders and classes; the underlying reasoning for grouping lineages was based on 48
single to several characters deemed to be of particular discriminatory value. However, the 49
whole system hinged to no small degree on what characters were chosen as arbiters of 50
inclusiveness. These characters often varied among mycologists and resulted in disagreement 51
and constant taxonomic rearrangements in many groups of fungi (Hibbett 2007; Shenoy et al. 52
2007; Yang 2011). 53
The limitations of morphology-based taxonomy were recognized early on, and 54
numerous mycologists tried to incorporate other sources of data into the classification 55
process, such as information on biochemistry, enzyme production, metabolite profiles, 56
physiological factors, growth rate, pathogenicity, and mating tests (Guarro et al. 1999, Taylor 57
et al. 2000; Abang et al. 2009). Some of these attempts proved successful. For instance, the 58
economically important plant pathogen Colletotrichum kahawae was distinguished from C. 59
gloeosporioides based on physiological and biochemical characters (Correll et al. 2000; Hyde 60
et al. 2009). Similarly, relative growth rates and the production of secondary metabolites on 61
defined media under controlled conditions are valuable in studies of complex genera such as 62
Aspergillus, Penicillium, and Colletotrichum (Frisvad et al. 2007; Samson and Varga 2007; 63
Cai et al. 2009). In many other situations, however, these data sources proved inconclusive or 64
included a signal that varied over time or with environmental and experimental conditions. In 65
addition, the detection methods often did not meet the requirement as an effective tool in 66
terms of time and resource consumption (Horn et al. 1996; Frisvad et al. 2008). 67
Molecular data was first used in taxonomic studies of fungi in the 1970's (cf. 68
DeBertoldi et al. 1973), which marked the beginning of a new era in fungal research. The last 69
twenty years have seen an explosion in the use of molecular data in systematics and 70
taxonomy, to the extent where many journals will no longer accept papers for publication 71
unless the taxonomic decisions are backed by molecular data. DNA sequences are now used 72
on a routine basis in fungal taxonomy at all levels. Molecular data in taxonomy and 73
systematics are not devoid of problems, however, and there are many concerns that are not 74

4
always given the attention they deserve (Taylor et al. 2000; Groenwald et al. 2011; Hibbett et 75
al. 2011). We regularly meet research students who are unsure about one or more steps in 76
their nascent molecular projects. Much has been written about each step in the molecular 77
pipeline, and there are several good publications that should be consulted regardless of the 78
questions arising. What is missing, perhaps, is a wrapper for these papers: a freely available, 79
easy-to-read yet not overly long document that summarizes all major steps and provides 80
references for additional reading for each of them. This is an attempt at such an overview. We 81
have divided it into six sections that span the width of a typical molecular study of fungi: 1) 82
taxon sampling, 2) laboratory procedures, 3) sequence quality control, 4) data analysis, 5) the 83
publication process, and 6) other observations. The target audience is research students ("the 84
users") about to undertake a (Sanger sequencing-based) molecular mycological study with a 85
systematic or taxonomic focus. 86
87
1. Sampling and compiling a dataset 88
The dataset determines the results. If there is anything that the user should spend valued time 89
completing, it is to compile a rich, meaningful dataset of specimens/sequences (Zwickl and 90
Hillis 2002). Right from the onset, it is important to consider what hypotheses will be tested 91
with the resulting phylogeny. If the hypothesis is that one taxon is separate from one or 92
several other taxa, then all those taxa should be sampled along with appropriate outgroups; 93
consultation of taxonomic expertise (if available) is advisable. It is paramount to consider 94
previous studies of both the taxa under scrutiny and closely related taxa to achieve effective 95
sampling. It is usually a mistake to think that one knows about the relevant literature already, 96
and the users are advised to familiarize themselves with how to search the literature 97
efficiently (cf. Conn et al. 2003 and Miller et al. 2009). In particular, it often pays off to 98
establish a set of core publications and then look for other papers that cite these core papers 99
(through, e.g., “Cited by” in Google Scholar). If there is an opportunity to sequence more than 100
one specimen per taxon of interest, this is highly preferable and particularly important when it 101
comes to poorly defined taxa and/or at low taxonomic levels. In most cases it will not be 102
enough to use whatever specimens the local herbarium or culture collection has to offer; 103
rather the user should consider the resources available at the national and international levels. 104
Ordering specimens or cultures may prove expensive, and the user may want to consider 105
inviting researchers with easy access to such specimens as co-authors of the study. The 106
invited co-authors may even oversee the local sequencing of those specimens, to the point 107
where more specimens does not have to mean more costs for the researcher. When 108

5
considering specimens for sequencing, it should be kept in mind that it may be difficult to 109
obtain long, high-quality DNA sequences from older specimens (cf. Larsson and Jacobsson 110
2004). However, there are other factors than age, such as how the specimen was dried and 111
how it has been stored, that also influence the quality of the DNA. There also seem to be 112
systematic differences across taxa in how well their DNA is preserved over time; as an 113
example, species adapted to tolerate desiccation are often found to have better-preserved 114
DNA than have short-lived mushrooms (personal observation). There are different methods 115
that increase the chances of getting satisfactory sequences even from single cells or otherwise 116
problematic material (see Möhlenhoff et al. 2001, Maetka et al. 2008, and Bärlocher et al. 117
2010). 118
119
Sampling through herbaria, culture collections, and the literature. Mining world herbaria for 120
species and specimens of any given genus is not as straightforward as one might think. Many 121
herbaria (even in the Western countries) are not digitized, and no centralized resource exists 122
where all digitized herbaria can be queried jointly. GBIF (http://www.gbif.org/) nevertheless 123
represents a first step in such a direction, and the user is advised to start there. Larger herbaria 124
not covered by GBIF may have their own databases searchable through web interfaces but 125
otherwise are best queried through an email to the curator. Type specimens have a special 126
standing in systematics (Hyde and Zhang 2008; Ko Ko et al. 2011; MacNeill et al. 2012), and 127
the inclusion of type specimens in a study lends extra weight and credibility to the results and 128
to unambiguous naming of generated sequences. Herbaria may be unwilling to loan type 129
specimens (particularly for sequencing or any other activity that involves destroying a part of 130
the specimen, i.e., destructive sampling) and may offer to sequence them locally instead – or 131
may in fact already have done so. Specimens collected by particularly professional 132
taxonomists or that are covered in reference works should similarly be prioritized. For 133
cultures, we recommend the user to start at the CBS culture collection 134
(http://www.cbs.knaw.nl/collection/AboutCollections.aspx) and the StrainInfo web portal 135
(http://www.straininfo.net/). Not all relevant specimens are however deposited in public 136
collections; many taxonomists keep personal herbaria or cultures. Scanning the literature for 137
relevant papers to locate those specimens is rewarding. It may be particularly worthwhile to 138
try to include specimens reported from outlying localities, in unusual ecological 139
configurations, or together with previously unreported interacting taxa with respect to those 140
specimens already included. Such exotic specimens are likely to increase both the genetic 141
depth and the discovery potential of the study. Collections from distant locations and 142

6
substrates other than that of the type material may represent different biological species. 143
Although they cannot always be readily distinguished based on morphology (i.e., they are 144
cryptic species) including these taxa will allow for a better understanding of the targeted 145
species. 146
Incorrectly labelled specimens will be found even in the most renowned herbaria 147
and culture collections. The fact that a leading expert in the field collected a specimen is only 148
a partial safeguard against incorrect annotations, because processes other than taxonomic 149
competence – such as unintentional label switching and culture contamination - contribute to 150
misannotation. However most herbaria and culture collections welcome suggestions and 151
accurate annotations (with reasonable verifications) for specimens that are not identified 152
correctly or are ambiguous. It is a good idea to double check all specimens retrieved and to 153
seek to verify the taxonomic affiliation of the specimens in the sequence analysis steps 154
(sections 3 and 4). Keeping an image of the sequenced specimen is valuable. 155
156
Sampling through electronic resources. As more and more researchers in mycology and the 157
scientific community sequence fungi and environmental samples as part of their work, the 158
sequence databases accumulate significant fungal diversity. Even if the users know for certain 159
that they are the only active researchers working on some given taxon, they can no longer rest 160
assured that the databases do not contain sequences relevant to the interpretation of that taxon. 161
On the contrary, chances are high that they do. As an example, Ryberg et al. (2008) and 162
Bonito et al. (2010) both used insufficiently identified fungal ITS sequences in the public 163
sequence databases to make significant new taxonomic and geo/ecological discoveries for 164
their target lineages. Therefore, it is recommended that sequences similar to the newly 165
generated sequences should be retrieved in order to establish phylogenetic relationships and 166
verify the accuracy of the sequence data through comparison. 167
This process is simple and amounts to regular sequence similarity searches using 168
BLAST (Altschul et al. 1997) in the International Nucleotide Sequence Databases (INSD: 169
GenBank, EMBL, and DDBJ; Karsch-Mizrachi et al. 2012) or emerencia 170
(http://www.emerencia.org) – details on how to do these searches and what to keep in mind 171
when interpreting BLAST results are given in Kang et al. (2010) and Nilsson et al. (2011, 172
2012). In short, the user must not be tempted to include too many sequences from the BLAST 173
searches. We advise the user to focus on sequences that are very similar to, and that cover the 174
full length of, the query sequences. If the user follows this approach for all of their newly 175
generated sequences, then they should not have to worry about picking up too distant 176

7
sequences that would cause problems in the alignment and analysis steps. Whether the 177
sequences obtained through the data mining step are annotated with Latin names or not – after 178
all, about 50% of the 300,000 public fungal ITS sequences are not identified to the species 179
level (cf. Abarenkov et al. 2010) – does not really matter in our opinion. They represent 180
samples of extant fungal biodiversity, and they carry information that may prove essential to 181
disentangle the genus in question. The user should keep an eye on the geo/ecological/other 182
metadata reported for the new entries to see if they expand on what was known before. 183
A word of warning is needed on the reliability of public DNA sequences. As 184
with herbaria and culture collections, many of these sequences carry incorrect species names 185
(Bidartondo et al. 2008) or may be the subject of technical problems or anomalies. Sequences 186
stemming from cloning-based studies of environmental samples are, in our experience, more 187
likely to contain read errors, or to be associated with other quality issues, than sequences 188
obtained through direct sequencing of cultures and fruiting bodies. The process of 189
establishing basic quality and reliability of fungal DNA sequences, including cloned ones, is 190
discussed further in section 3. 191
192
Field sampling and collecting. Many fungi cannot be kept in culture and so can never be 193
purchased from culture collections. Most herbaria are biased towards fungal groups studied at 194
the local university or groups that are noteworthy in other regards, such as economically 195
important plant pathogens. The public sequence databases are perhaps less skewed in that 196
respect, but instead they manifest a striking geographical bias towards Europe and North 197
America (Ryberg et al. 2009). There are, in other words, limits to the fungal diversity one can 198
obtain from resources already available, such that collecting fungi in the field often proves 199
necessary. Indeed, collecting and recording metadata are cornerstones of mycology, and it is 200
essential, amidst all digital resources and emerging sequencing technologies, that we keep on 201
recording and characterizing the mycobiota around us in this way (Korf 2005). Such voucher 202
specimens and cultures form the basis of validation and re-determination for present and 203
future research efforts regardless of the approach adopted. In addition, some morphological 204
characters can only be observed or quantified properly in fresh specimens, alluding further to 205
the importance of field sampling. (Descriptions of such ephemeral characters should ideally 206
be noted on the collection.) 207
Fruiting bodies should be dried through airflow of ≤40 degrees centigrade or 208
through silica gel for tiny specimens. The dried material should be stored in an airtight zip-209
lock (mini-grip) plastic bag to prevent re-wetting and access by insect pests. (Insufficiently 210
8
dried material may be degraded by bacteria and moulds, leaving the DNA fragmented and 211
contaminated by secondary colonizers.) It is recommended to place a piece of the (fresh) 212
fruiting body in a DNA preservation buffer such a CTAB (hexadecyl-trimethyl-ammonium 213
bromide; PubChem ID 5974) solution; ethanol and particularly formalin-based solutions 214
perform poorly when it comes to DNA preservation and subsequent extraction (cf. Muñoz-215
Cadavid et al. 2010). In addition to fruiting bodies, it is recommended to store any vegetative 216
or asexual propagules such as mycelial mats, mycorrhizae, rhizomorphs, and sclerotia that the 217
user intends to employ for molecular identification. CTAB buffer works fine for these too. If 218
DNA extraction is planned in the immediate future, samples of collections can be placed into 219
DNA extraction buffer already in the field. For fresh samples that have no soil particles, a 220
modified Gitchier buffer (0.8M Tris-HCl, 0.2 M (NH4)2SO4, 0.2% w/v Tween-20) can be 221
used for cell lysis and rapid DNA extraction (Rademaker et al. 1998). 222
With respect to plant-associated microfungi, plant specimens should be used for 223
fungal isolation as soon as possible after they are collected from the field, otherwise they can 224
be used for direct DNA extraction when still fresh. In the case of leaf-inhabiting fungi, the 225
plant material should be dried and compressed using standard methods, without any 226
toxicogenic preservatives or treatments. For plant-pathogenic fungi and culturable 227
microfungi, the practice of single-spore isolation is desirable (Choi et al. 1999; Chomnunit et 228
al. 2011). Indeed, monosporic/haploid cultures/material are recommended whenever possible 229
in molecular taxonomic studies and several other contexts, such as genome sequencing. 230
Heterokaryotic mycelia or other structures may manifest heterozygosity (i.e., co-occurring, 231
divergent allelic variants) for the targeted marker(s), which would add an unwanted layer of 232
complexity in many situations. Methods for single spore isolation, desirable media for initial 233
culturing, and preservation of cultures are equally important factors to consider with respect 234
to improvements of the quality in molecular experiments (see Voyron et al. 2009 and Abd-235
Elsalam et al. 2010). 236
Hibbett et al. (2011) made a puzzling observation on the limits of known fungal 237
diversity: when fungi from herbaria are sequenced and compared to fungi recovered from 238
environmental samples (e.g., soil), these groups form two more or less disjoint entities. By 239
sequencing one of them, we would still not know much about the other. Porter et al. (2008) 240
similarly portrayed different scenarios for the fungal community at a site in Ontario 241
depending on whether aboveground fruiting bodies or belowground soil samples were 242
sequenced. The fact that a non-trivial number of fungi do not seem to form (tangible) fruiting 243
bodies has been known for a long time, but it is essential that field sampling protocols 244
9
consider this. One idea could be to increase the proportion of somatic (non-sexual) fungal 245
structures sampled during field trips (cf. Healy et al. in press). Right now that proportion may 246
be close to zero, based on the last few organized field trips we have attended. Such collecting 247
should be seen as a long-term project unlikely to yield results immediately, but we suggest it 248
would be a good idea if the users, when out collecting for some project, would try to collect, 249
voucher, and sequence at least one fungal structure they would normally have ignored. 250
251
2. Selection of gene/marker, primers, and laboratory protocols 252
The protocols pertaining to the laboratory work come with numerous decisions, many of 253
which will fundamentally affect the end results. The best way to learn laboratory work is 254
through someone experienced, such that the users do not have to make all those decisions on 255
their own. Many pitfalls and mistakes can be avoided in this way. A sound step towards 256
making informed choices also involves looking into the literature: what genes/markers, 257
primers, and laboratory protocols were used by researchers who studied the same or closely 258
related taxa (with roughly similar research questions in mind)? That said, many scientific 259
studies come heavily underspecified in the Materials & Methods section, and the user should 260
look to it for inspiration rather than for full recipes. After selecting target marker(s) and 261
appropriate primers, the user should be prepared to spend time in the molecular laboratory for 262
one to several weeks. The laboratory processes involved in a typical molecular phylogenetics 263
study is DNA extraction, a PCR reaction to amplify the gene(s)/marker(s), examination and 264
purification of the PCR products, the sequencing reactions, and the screening of the resulting 265
fragments. 266
267
Choice of gene/marker. It is primarily the research questions that dictate what genes or 268
markers to target. For resolution at and below the generic level (including species 269
descriptions), the nuclear ribosomal ITS region is a strong first candidate. The ITS region is 270
typically variable enough to distinguish among species, and its multicopy nature in genomes 271
makes it easy to amplify even from older herbarium specimens or in other situations of low 272
concentrations of DNA. The ITS region is the formal fungal barcode and the most sequenced 273
fungal marker (Begerow et al. 2010; Schoch et al. 2012). For some groups of fungi, other 274
genes or markers give better resolution at the species level (see Kauserud et al. 2007 and 275
Gazis et al. 2011). As single molecular markers, GPDH and Apn2/MAT work well for the 276
Colletotrichum gloeosporioides complex (Silva et al. 2012, Weir et al. 2012); GPDH for the 277
genera Bipolaris and Curvularia (Berbee et al. 1999, Manamgoda et al. 2012); MS204 and 278

10
FG1093 for Ophiognomonia (Walker et al. 2012); and tef-1α for Diaporthe (Castlebury et al. 279
2007; Santos et al. 2010, Udayanga et al. 2012). For research questions above the genus level, 280
the user should normally turn to other genes than the ITS region. The nuclear ribosomal large 281
subunit (nLSU) has been a mainstay in fungal phylogenetic inference for more than twenty 282
years – such that a large selection of reference nLSU sequences are available – and largely 283
shares the ease of amplification with the ITS region. It is challenged, and often surpassed, in 284
information content by genes such as β-tubulin (Thon and Royse 1999), tef-1α (O'Donnell et 285
al. 2001), MCM7 (Raja et al. 2011), RPB1 (Hirt et al. 1999), and RPB2 (Liu et al. 1999). As a 286
general observation, single-copy genes are typically more difficult to amplify from small 287
amounts of material and from moderate-quality DNA than are multi-copy genes/markers such 288
as nLSU and ITS (Robert et al. 2011; Schoch et al. 2012). Genes known to occur as multiple 289
copies (e.g., β-tubulin) in certain fungal genomes may produce misleading systematic 290
conclusions based on single-gene analysis (Hubka and Kolarik 2012). 291
For larger phylogenetic pursuits it is common, even standard, to include more 292
than one unlinked gene/marker in phylogenetic endeavours (James et al. 2006). Phylogenetic 293
species recognition by genealogical concordance, typically relying on more than one gene 294
genealogy, has become a tool of modern day systematics of species complexes of fungi and 295
other organisms (Taylor et al. 2000; Monaghan et al. 2009; Leavitt et al. 2011). Indeed, many 296
journals have come to expect that two or more genes be used in a phylogenetic analysis, and it 297
may be a good idea to use, e.g., a ribosomal gene such as nLSU and a non-ribosomal gene in 298
molecular studies. It should be kept in mind that all genes cannot be expected to work equally 299
well in all fungal lineages, both in terms of amplification success and information content. For 300
species descriptions and phylogenetic inferences of lesser scope it is typically still deemed 301
acceptable – although perhaps not recommendable – to use a single gene, and for these 302
purposes we advocate the ITS region as the primary marker due to its high information 303
content, ease of amplification, role as the fungal barcode, and the large corpus of ITS 304
sequences already available for comparison. However, if the new species falls outside any 305
known genus, we recommend to also sequence the nLSU to provide an approximate 306
phylogenetic position for the new species (lineage). Knowledge of the rough phylogenetic 307
position of the new sequence, coupled with literature searches, may give clues to what genes 308
that are likely to perform the best for species identification and subgeneric phylogenetic 309
inference of the new lineage. 310
311
Choice of primers. When amplifying DNA from single specimens, one typically does not 312

11
have to worry about whether or not the primer will match perfectly to the template. Even in 313
case of imperfect match, the PCR surprisingly often still comes out successful. This makes it 314
is a good idea to try standard fungal or universal primers first – such as ITS1F (forward) and 315
ITS4 (reverse) (White et al. 1990; Gardes et al. 1993) in the case of the ITS region – because 316
chances are high that they will work. It is however advisable to use at least one fungus-317
specific primer (ITS1F in the above) to reduce the chances of amplifying DNA of any co-318
occurring eukaryotes. The literature is likely to hold clues to what lineages require more 319
specialized primers. For example, highly tailored primers are needed for the ribosomal genes 320
of the agaricomycete genera Cantharellus and Tulasnella (Feibelman et al. 1994; Taylor and 321
McCormick 2008). In the unlucky event that the standard primers do not work for the lineage 322
targeted by the user – and nobody has developed specialized primers for that gene/marker and 323
lineage combination already – the user may have to design new primers based on sequences 324
in, e.g., INSD. Good software tools are available for this (e.g., PRIMER3 at 325
http://frodo.wi.mit.edu/; Rozen and Skaletsky 1999 and Primer-BLAST at 326
http://www.ncbi.nlm.nih.gov/tools/primer-blast/) but as indata they require some 100+ base-327
pairs of the regions immediately upstream and downstream of the target region. If these 328
upstream and downstream regions are not available in the sequence databases, the user has to 329
generate them themselves. Primers can also be designed manually based on a multiple 330
sequence alignment (cf. Singh and Kumar 2001). Upon completing the in silico primer design 331
step, the user can turn to software tools such as ecoPCR (www.grenoble.prabi.fr/trac/ecoPCR; 332
Ficetola et al. 2010) to simulate the performance of the new primers on the target region 333
under fairly realistic conditions. Chances are nevertheless high that the user does not need to 334
design any new primers, particularly not if targeting any of the more commonly used genes 335
and markers in mycology. A very rich primer array is available for the ribosomal genes (e.g., 336
Gargas and DePriest 1996; Ihrmark et al. 2012; Porter and Golding 2012; Toju et al. 2012), 337
and most research groups have detailed primer sections for both ribosomal and other genes 338
and markers on their home pages (e.g., http://www.clarku.edu/faculty/dhibbett/protocols.html, 339
http://www.lutzonilab.net/primers/index.shtml, and http://unite.ut.ee/primers.php). Several 340
publications are available with suggestions for selecting primers for widely used molecular 341
markers as well as recently available new markers for specific groups of fungi which are 342
commonly researched by mycologists (Glass and Donaldson 1995, Carbone & Kohn 1999, 343
Schmitt et al. 2009, Santos et al. 2010, Walker et al. 2012). 344
345
Laboratory steps. The laboratory process to obtain DNA sequences can roughly be divided 346

12
into five steps: DNA extraction from the specimen, PCR, examination and purification of the 347
PCR products, sequencing reactions, and fragment analysis/visualisation. In vitro cloning may 348
sometimes be needed to pick out the correct PCR fragment for sequencing, thus forming an 349
additional step. The last few years have seen an increasing trend of sending the purified PCR 350
products to a commercial or institutional sequencing facility for sequencing, leaving the user 351
to oversee only the three first of the above five steps. The present authors, too, employ such 352
external sequencing services, and our conclusion is that it is cost- and time efficient and that 353
the technical quality of the sequences produced is generally very high. 354
Some researchers prefer the traditional CTAB-based way of DNA extraction. In 355
terms of quality of results it is a good and cheap choice (Schickmann et al. 2011). However, 356
others find it more convenient to use one of the many commercially available kits for DNA 357
extraction. Under the assumption that the starting material is relatively fresh and that the taxa 358
under scrutiny do not contain unusually high amounts of compounds that affect the DNA 359
extraction/PCR steps adversely, most extraction kits are likely to perform satisfactory at 360
recovering enough DNA to support a PCR run (comparisons of extraction methods are 361
available in Fredricks et al. 2005, Karakousis et al. 2006, and Rittenour et al. 2012). 362
Substrates with high concentrations of humic acids, notably soil and wood, are known to be 363
problematic in terms of extraction and amplification (Sagova-Mareckova et al. 2008). 364
Similarly, high concentrations of polysaccharides, nucleases, and pigments can cause 365
interference in extraction of DNA (and the subsequent PCR) from some genera of microfungi 366
(Specht et al. 1982). For culturable fungi, a minimal amount (10-20 mg) of actively growing 367
edges of cultures should be used. Rapid and efficient DNA extraction kits tend to work the 368
best when minimal amounts of tissue are used; the use of low amounts of starting material 369
serves to reduce the amount of potential extraction/PCR inhibitors, such that decreasing – 370
rather than increasing – the amount of starting material is often the first thing one should try 371
in light of a failed DNA extraction/PCR run (cf. Wilson 1997). When slow-growing 372
culturable fungi (e.g., some bitunicate ascomycetes and marine fungi) are used in DNA 373
extraction, the user should be mindful of the substantial time needed for the growth of the 374
fungus in order to get a sufficient amount of tissue material for DNA extraction. One should 375
also be aware of the risk of contamination in the extraction (as well as subsequent) steps, 376
particularly when working with older herbarium specimens. A good rule is to never mix fresh 377
and older fungal collections when extracting DNA and always to clean the working area and 378
the picking tools, such as the stereomicroscope and the forceps, thoroughly before and in 379
between each round of fungal material. The application of bleach is more efficient than, e.g., 380

13
UV light and ethanol. It is important that PCR products never be allowed to enter the area 381
where DNA extractions and PCR setup is performed. Avoidance of contamination is 382
particularly important when working with closely related species, as is often done in 383
taxonomic studies, since such contaminations are easily overlooked and may be tricky to 384
identify afterwards. 385
For the PCR step, many commercial PCR kits are available on the market. One 386
can expect a standardized, consistent performance from such kits; moreover they come with 387
suggested PCR cycling programs under which most target DNA will amplify in a satisfactory 388
way. However, tweaking the PCR protocol may increase the yield significantly, and it is well 389
worth consulting with more experienced colleagues and/or any relevant publication. One 390
particularly influential factor is the annealing temperature of the primer, which is often 391
provided with the primer sequence or may otherwise be estimated (in, e.g., PRIMER3). It is 392
also possible and often beneficial to perform a gradient PCR to determine the optimal 393
annealing temperature. Various modifications and optimizations of the PCR process are 394
discussed in Hills et al. (1996), Cooper and Poinar (2000), Qiu et al. (2001), and Kanagawa 395
(2003). PCR runs are normally verified for success through running the products on an 396
agarose gel stained with ethidium bromide, where any DNA sequences obtained will shine in 397
UV light. Recently, alternative staining agents that are less toxic than ethidium bromide have 398
been marketed as alternatives in safe handling (e.g., Goldview (Geneshun Biotech.) and Safe 399
DNA Dye/ SYBR® Safe DNA Gel). These markers use UV light or other wavelengths for 400
visualisation, and any new laboratory should carefully consider which system to use for 401
detection of successful PCR products. It should be remembered that these methods may detect 402
levels of DNA that, however low, may still suffice for successful sequencing, but it is usually 403
a money and time saving effort to only proceed with PCR products that produce a single, 404
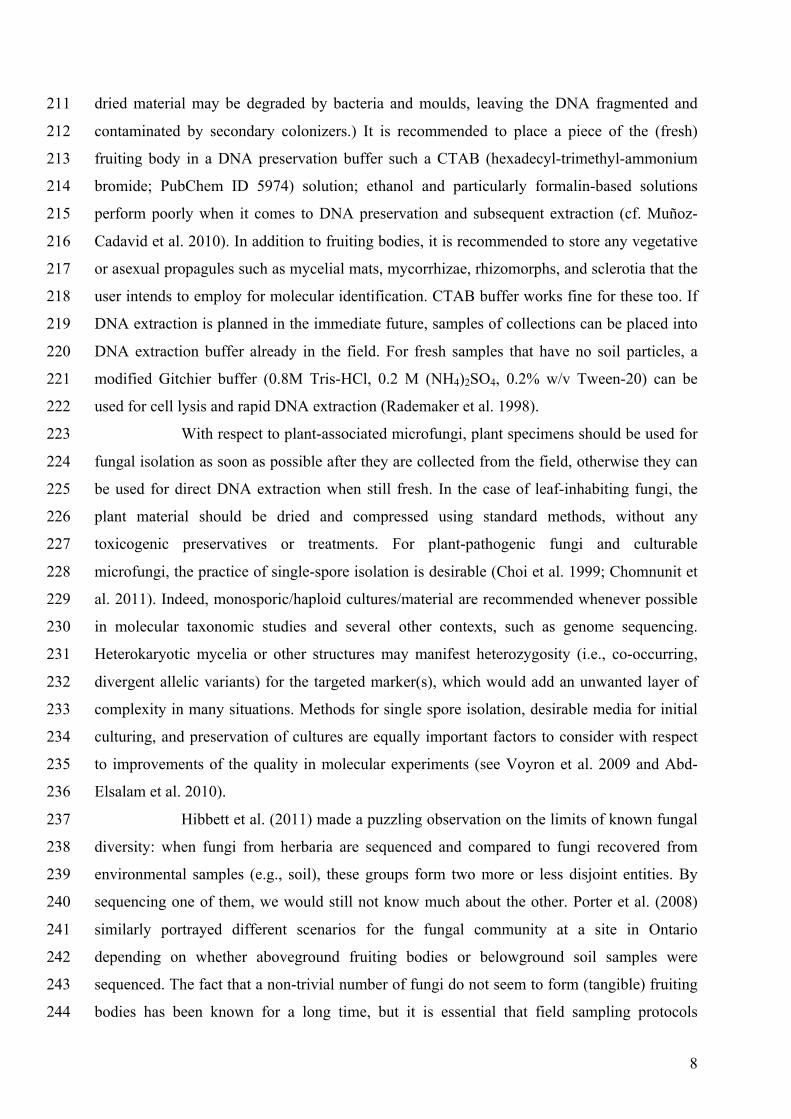
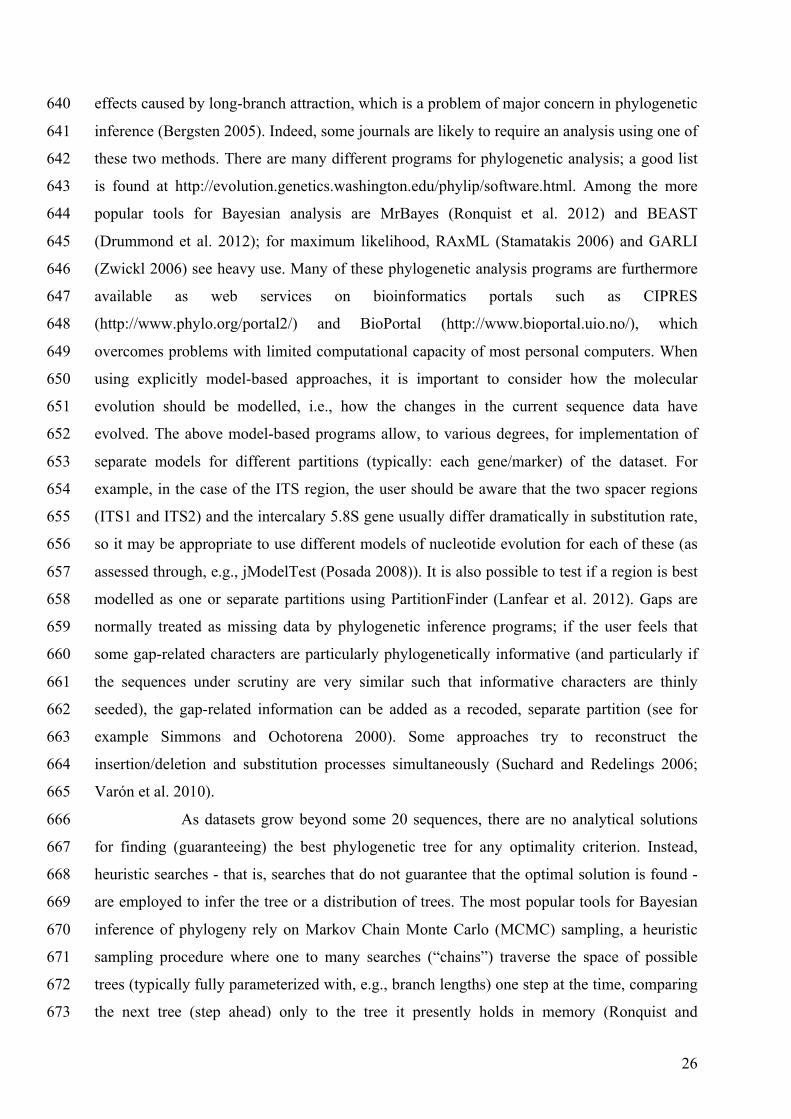
clearly visible band (Figure 1). Positive and negative PCR controls should always be 405
employed. 406

14
407 Figure 1. A) Safe-dye stained (SYBR® Safe DNA; 1% agarose gel, 80 V, 20 min) gel profiles showing a 408 successful genomic DNA extraction of fungi. M) Ladders indicating the relative sizes of the DNA (100 bp 409 marker). a) Low quality/minimum amount of DNA for a PCR b) Optimum high quality amount of DNA c) 410 Excess DNA for PCR (quantification and dilution needed prior to the standard PCR reaction.) 411 B) A successful amplification of a PCR product stained with Safe dye (1% agarose gel, 80 V, 20 min) a, b, c) a 412 probable case of multiple copies in amplification due to non-specific binding of primers d, e, f) successful 413 amplicons with high concentrations of PCR products g) negative control 414 Courtesy: USDA-ARS Systematic Mycology and Microbiology Laboratory. 415 416
The (successful) PCR products should then be purified to remove, e.g., residual 417
primers and unpaired nucleotides; many commercial kits are available for this purpose. These 418
can range from single-step reactions to multiple-step, highly effective procedures. One of the 419
simplest, cheapest, and most widely used approaches is a combination of exonuclease and 420
Shrimp alkaline phosphatase enzymatic treatment (Hanke and Wink 1994). Before sending 421
the purified PCR products for sequencing, they may need to be quantified for DNA content 422
(depending on the sequencing facility). A rough quantification can be made from the strength 423
of the band during PCR visualisation, possibly by comparing to samples of standard 424
concentrations. Special DNA quantifiers, usually relying on (fluoro-)spectrophotometry, can 425
be used for more exact quantification. The sequencing facilities will usually perform the 426
sequencing reactions themselves to get optimal, tailored performance on their sequencing 427
machine. 428
429
3. Sequence quality control 430

15
The responsibility to ensure that the newly generated sequences are of high authenticity and 431
reliability lies with the user. There are many examples in the literature where compromised 432
sequence data have lead to poor results and unjustified conclusions (cf. Nilsson et al. 2006), 433
suggesting that the quality control step should not be taken lightly. Two points at which to 434
exercise quality control is during sequence assembly and once the consensus sequence that 435
has been produced from the sequence assembly is ready. 436
437
Sequence assembly. Many sequences in systematics and taxonomy are generated with two 438
primers - one forward and one reverse - such that the target sequence is effectively read twice. 439
This dual coverage brings about a mechanism for basic quality control of the read quality of 440
the consensus sequences. The primer reads returned from the sequencing machine should be 441
assembled in a sequence assembly program into a contig, from which the final sequence is 442
derived (Miller and Powell 1994). Although sequence assembly is a semi-to-fully automated 443
step in programs such as Sequencher (http://genecodes.com/), Geneious 444
(http://www.geneious.com/), and Staden (http://staden.sourceforge.net/), the results must be 445
viewed as tentative and need verification. The user should inspect each contig for positions 446
(bases) of substandard appearance. During the sequencing process, the sequencing machine 447
quantifies the light intensity of the four terminal (dyed) nucleotides at each position, and the 448
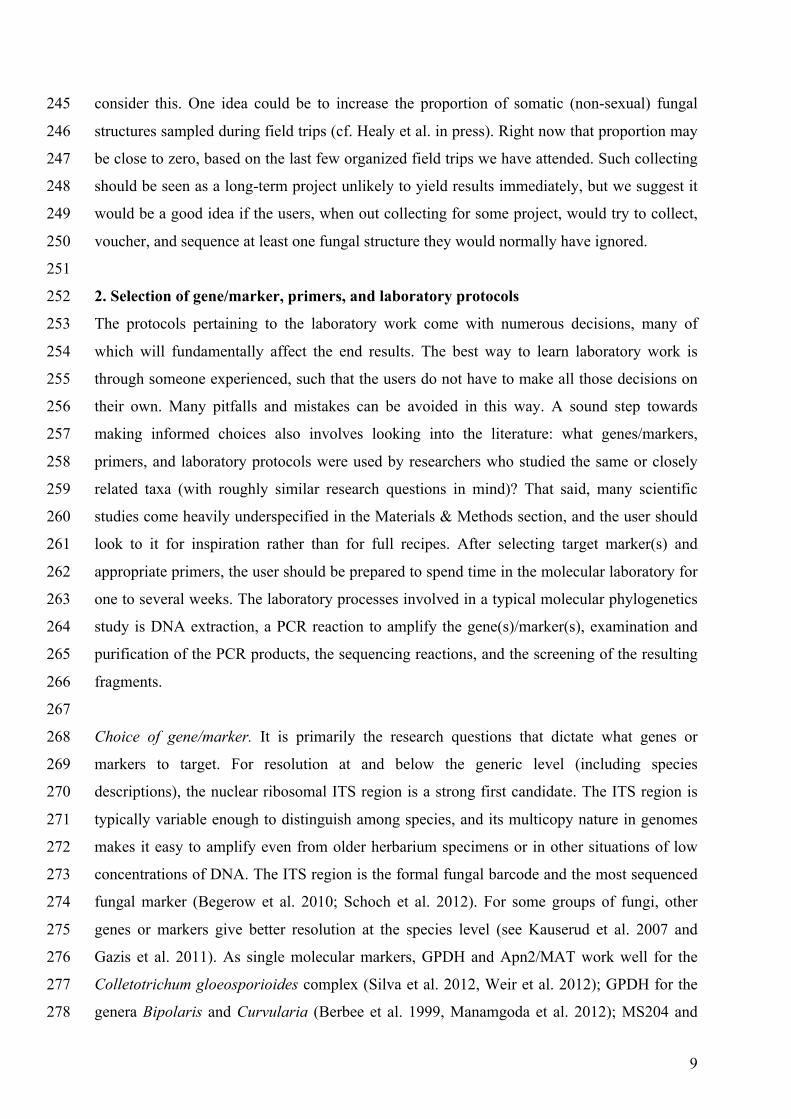
relative intensity is represented as chromatogram curves in each primer read (Figure 2a). 449
Occasionally the assembly software struggles to reconcile the chromatograms from the two 450
reads, leaving the bases incorrectly determined, undecided (as IUPAC DNA ambiguity 451
symbols such as “N” and “S”, see Cornish-Bowden 1985), or in the wrong order. The user 452
should scan the contig and unpaired sequences along their full length for such anomalies, 453
most of which can be identified through the odd appearance of the chromatogram curves in 454
those positions (Figure 2b). The distal (5’ and 3’) ends of contigs are nearly always of poor 455
quality, and the user should expect to have to trim these in all contigs. There may also be 456
ambiguities in the chromatogram if there are different copies of the DNA region in the 457
sequenced material. This may show as twin curves for different bases at the same site (Figure 458
2c). In most cases such twin curves represent heterozygous sites that should be coded using 459
the corresponding IUPAC codes (e.g., C/T = Y). In the case of multiple heterozygous sites, it 460
may be necessary with an extra cloning step in the lab protocol to separate the different 461
copies. When sequencing PCR amplicons derived from dikaryotic or heterokaryotic 462
tissue/mycelia, some sequences contigs may shift from high quality to nonsense due to the 463
presence of an indel (insertion or deletion) in one of the alleles. In the case of only one indel 464

16
present, one may obtain a usable contig sequence by sequencing the fragment in both 465
directions. 466
467

17
a 468 469
b 470 471
c 472 473
d 474 Figure 2. a) Clear, high-quality chromatogram curves. The software interprets curves like these with ease. b) 475 Correct base-calling is hard, both for the software and for the user, when the chromatogram curves look like this. 476 In most cases it is better to re-sequence the specimen than to try to salvage data from such chromatograms. c) If 477 there is more than one (non-identical) copy of the marker amplified, the chromatogram curves tend to look like 478 this. In the middle of the image, the uppermost primer read has produced a “TCAA” whereas the second primer 479 produced “TTGA”. The reads appear clear and unequivocal, such that poor read quality is not a likely 480 explanation for the discrepancy. d) Base-calling tends to be hard in homopolymer-rich regions, and one often 481 finds that regions after the homopolymer-rich segments are less well read. All screenshots generated from 482 Sequencher® version 4 sequence analysis software, Gene Codes Corporation, Ann Arbor, MI USA 483 (http://www.genecodes.com). 484

18
485
A note on cloned sequences. When performing Sanger sequencing of PCR amplicons derived 486
directly from fruiting body tissue or mycelia, most PCR errors will normally not surface 487
because the resulting chromatograms represent the averaged signal from numerous original 488
templates. However, when cloning, a single PCR fragment is picked, multiplied, and 489
sequenced. This means that any polymerase-generated errors will become visible and have to 490
be controlled for. The only reasonable guard against such PCR generated errors is cloning and 491
sequencing replicate fragments from the same PCR reaction. A unique mutation appearing in 492
only one of the sequences most likely represents a PCR-generated error and should be omitted 493
from the resulting consensus sequence. If some mutations approach a 50/50 ratio in the 494
replicate sequences, they most likely represent allelic variants and should be analyzed 495
separately in the further phylogenetic analyses. Although more expensive, the implementation 496
of high-fidelity polymerase enzymes with high accuracy is especially important when 497
sequencing cloned fragments. 498
499
Quality control of DNA sequences. To exercise quality control through the sequence assembly 500
step, while very important, is only a part of the quality management process. There are many 501
kinds of sequence errors and pitfalls that cannot be addressed during sequence assembly. 502
Nilsson et al. (2012) listed a set of guidelines on how to establish basic authenticity and 503
reliability for newly generated (or, for that matter, downloaded) fungal ITS sequences. Five 504
relatively common sequence problems were addressed: whether the sequence represents the 505
intended gene/marker, whether the sequence is given in the correct orientation, whether the 506
sequence is chimeric, whether the sequence manifests tell-tale signs of other technical 507
anomalies, and whether the sequence represents the intended taxon. In short, the user should 508
never assume any newly generated sequences to be of satisfactory quality; rather, the user 509
should take measures to ensure the basic reliability of the sequences. Such measures do not 510
have to be complex, time-consuming, or computationally expensive. Nilsson et al. (2012) 511
computed a joint multiple sequence alignment of their entire query ITS sequence dataset and 512
located the conserved 5.8S gene of the ITS region in all sequences of the alignment. That 513
approach verified that all sequences were ITS sequences and that they were given in the 514
correct orientation. Each query sequence was then subjected to a BLAST search in INSD, and 515
by examining the graphical BLAST summary as well as the full BLAST output, the authors 516
were able to rule out the presence of bad chimeras and sequences with severe technical 517
problems. Finally, for all query sequences with some sort of taxonomic annotation (e.g., 518

19
“Penicillium sp.”), the authors examined the most significant BLAST results for clues that the 519
name was at least approximately right; if a sequence annotated as Penicillium would not 520
produce hits to other sequences annotated as Penicillium (accounting for synonyms and 521
anamorph-teleomorph relationships), then something would almost certainly be wrong. It 522
should be kept in mind that the public sequence databases contain a non-trivial number of 523
compromised sequences, suggesting that the guidelines – or other means of quality control – 524
should be applied also to all sequences downloaded from such resources. The guidelines 525
suggested do not form a 100% guarantee for high-quality DNA sequences, but they are likely 526
to result in a more robust and reliable dataset. 527
528
4. Alignment and phylogenetic analysis 529
Systematics and tree-based thinking go hand in hand, and we urge the reader to employ a 530
phylogenetic approach even when describing a single new species. It should be stressed, 531
though, that phylogenetic inference is something of a research field in its own right. A 532
phylogenetic analysis should not involve a few clicks on the mouse to produce a tree; rather it 533
is a process that involves many decisions and that should be given significant thought. Many 534
software packages in the field of phylogenetic inference are complex and command-line 535
driven – intimidating, perhaps, to some biologists. But instead of resorting to simpler click-to-536
run programs, the user should carefully read the respective documentation and query the 537
literature for the difference between the approaches and options. It is also worth asking for 538
expert help or even inviting pertinent researchers as co-authors to the project. That is how 539
important it is to get the analysis part right! Suboptimal methodological choices beget less – 540
or incorrectly - resolved phylogenies and in the end may lead to erroneous conclusions. This 541
is in nobody’s interest. 542
In some cases – particularly near the species level - a phylogenetic tree may not 543
be the most suitable model for representing the relations among the taxa in the query dataset 544
(due to, e.g., intralocus recombination, hybridization, and introgression). In these cases, a 545
network (Kloepper and Huson 2008) may be a better analytical solution. Networks can be 546
used to visualize data conflicts in tree reconstruction (split networks, e.g., Bryant and 547
Moulton 2004; Huson and Bryant 2006; Huson et al. 2011) or explicitly represent 548
phylogenetic relationships (reticulate networks, e.g., Huber et al. 2006; Kubatko 2009; Jones 549
et al. 2012). The user should also be aware of an ongoing paradigm shift in evolutionary 550
biology, where single-gene trees and concatenation approaches are replaced by species tree 551
thinking (Edwards 2009). Although the distinction between gene and species trees is not new 552

20
(Pamilo and Nei 1988; Doyle 1992), most species phylogenies published to date are based on 553
single gene trees or trees based on concatenation of two or more alignments from different 554
linkage groups. Recently, however, models and methods have been developed to account for 555
the fact that gene trees can differ in topology and branch lengths due to population genetics 556
processes that are best modelled with the multispecies coalescent (Rannala and Yang 2003). 557
In such a framework, gene trees representing unlinked parts of the cellular genomes 558
themselves represent data for the species trees (Liu and Pearl 2007). Recent advances in 559
sequencing technologies and whole-genome sequence information has greatly improved the 560
ease by which multiple genes can be sampled. Interestingly, species trees also enable 561
objective species delimitations based on molecular data (O’Meara 2010; Fujita et al. 2012). 562
Species trees can be inferred directly from sequence data using, e.g., *BEAST (Heled and 563
Drummond 2010). 564
At this stage, the user should facilitate downstream analyses by giving all of the 565
new sequences short, unique names that feature only letters, digits, and underscore. It is good 566
practice to start the name with a unique identifier of the sequence/specimen (since some 567
programs truncate the names of the sequences down to some pre-defined length); this may 568
then be followed by a more descriptive name, such as a Latin binomial. A good sequence 569
name is SM11c_Amanita_gemmata ; in contrast, the default names of sequences downloaded 570
from INSD (and that feature, e.g., pipe characters and whitespace) may cause problems in 571
many software tools relevant to alignment and phylogenetic inference. 572
573
Multiple sequence alignment. Upon completing the quality management of the newly 574
generated sequences, the user hopefully has a well-founded idea of what taxa to use as 575
outgroups. The choice of outgroup is of substantial importance and should be done as 576
thoroughly as possible (cf. de la Torre-Bárcena et al. 2009). Ideally, and based on the 577
literature, at least three progressively more distantly related taxa (with respect to the ingroup) 578
should be chosen as tentative outgroups, although it is the alignment step that decides what 579
sequences appear suitable as outgroups and what sequences appear too distant. One regularly 580
sees scientific publications that employ too distant outgroups; this translates into alignment 581
problems and potentially compromised inferences of phylogeny. 582
There are many software tools available for multiple sequence alignment, but 583
we urge the user to go for a recent (and readily updated) one rather than relying on old 584
programs, well-known as they may be. We recommend any of MAFFT (Katoh and Toh 585
2010), Muscle (Edgar 2004), and PRANK (Löytynoja and Goldman 2005) for large or 586

21
otherwise non-trivial sequence datasets. Unless the number of sequences reaches several 587
hundreds, these programs can all be run in their most advanced mode (e.g., “linsi” in the case 588
of MAFFT) on a regular desktop computer. The product is a multiple sequence alignment file, 589
usually in the FASTA format (Pearson and Lipman 1988). It is however important to 590
recognize that manual inspection of alignment files is always needed and manual adjustment 591
is often warranted (Figure 3a). This involves loading the alignment in an alignment viewer 592
such as SeaView (Gouy et al. 2010) and trying to find and correct for instances where the 593
multiple sequence alignment program seems to have performed suboptimally (Figure 3b,c). 594
Exact guidelines on how to do this are hard to give (cf. Gonnet et al. 2000, Lassmann and 595
Sonnhammer 2005), and the user is advised to sit down with someone experienced with this 596
process to have it demonstrated. Alternatively, the user could send the alignment for 597
improvement to someone experienced and then contrast the two versions. Occasionally, 598
alignments feature sections that defy all attempts at reconstruction of a meaningful alignment 599
(Figure 3d). Such sections should be kept in the alignment and may be excluded from the 600
subsequent phylogenetic analysis. There are several software solutions that attempt to 601
formalize this procedure (e.g., Talavera and Castresana 2007; Liu et al. 2009; Capella-602
Gutierrez et al. 2009). It should be noted, though, that there may be unambiguously aligned 603
subsets of sequences (taxa) in such globally unalignable regions, and these sub-alignments 604
may contain useful information. 605
606 Figure 3. a) A satisfactory multiple sequence alignment run through MAFFT and then edited manually. The 607

22
alignment is a subset of the 55-taxon alignment of Ghobad-Nejhad et al. (2010). 608 609

23
610 Figure 3b) Manual editing of a multiple sequence alignment in SeaView. The original alignment is given to the 611 left, with the modified version to the right. 612 613

24
614 Figure 3c) Manual editing of a multiple sequence alignment in SeaView. The original alignment is given on top, 615 with the modified version at the bottom with minimal gaps and ambiguities. 616
617

25
618 d) A portion of a multiple sequence alignment that defies scientifically meaningful global alignment. The first 619 half of the alignment looks satisfactory, but the quality rapidly deteriorates midway through the alignment. 620 Trying to shoehorn these sequence data into some sort of joint aligned form is sure to produce artificial, non-621 biological results. Such highly variable regions should be kept in the alignment for reference but excluded from 622 the subsequent phylogenetic analysis. If and when the sequences are exported from the alignment, the user 623 should make sure to employ the “Include all characters” option before exporting to avoid exporting only the 624 parts used in the phylogenetic analysis. While the right half of the alignment is not fit for joint alignment 625 covering all of the query sequences, it is clearly not without signal at a lower level, i.e., for subsets of the 626 sequences. 627 628
Phylogenetic analysis. There are many different approaches to phylogenetic analysis, ranging 629
from distance-based through parsimony to maximum likelihood and Bayesian inference (cf. 630
Hillis et al. 1996, Felsenstein 2004, and Yang and Rannala 2012). For highly coherent, low-631
homoplasy datasets, most approaches are likely to produce similar results. That said, there is 632
no single, optimal choice of analysis approach for all datasets, and it is a good idea for the 633
user to start exploring their data using different methods. A fast, up-to-date program for 634
parsimony analysis is TNT (Goloboff et al. 2008). If the users were to browse through various 635
recent phylogeny-oriented publications in high-profile journals, they would probably come to 636
the conclusion that Bayesian inference and (particularly for large datasets) maximum 637
likelihood, both of which are explicitly model-based (parametric), have a lot of momentum at 638
present. For one thing, it is widely accepted that they are better able to correct for spurious 639
26
effects caused by long-branch attraction, which is a problem of major concern in phylogenetic 640
inference (Bergsten 2005). Indeed, some journals are likely to require an analysis using one of 641
these two methods. There are many different programs for phylogenetic analysis; a good list 642
is found at http://evolution.genetics.washington.edu/phylip/software.html. Among the more 643
popular tools for Bayesian analysis are MrBayes (Ronquist et al. 2012) and BEAST 644
(Drummond et al. 2012); for maximum likelihood, RAxML (Stamatakis 2006) and GARLI 645
(Zwickl 2006) see heavy use. Many of these phylogenetic analysis programs are furthermore 646
available as web services on bioinformatics portals such as CIPRES 647
(http://www.phylo.org/portal2/) and BioPortal (http://www.bioportal.uio.no/), which 648
overcomes problems with limited computational capacity of most personal computers. When 649
using explicitly model-based approaches, it is important to consider how the molecular 650
evolution should be modelled, i.e., how the changes in the current sequence data have 651
evolved. The above model-based programs allow, to various degrees, for implementation of 652
separate models for different partitions (typically: each gene/marker) of the dataset. For 653
example, in the case of the ITS region, the user should be aware that the two spacer regions 654
(ITS1 and ITS2) and the intercalary 5.8S gene usually differ dramatically in substitution rate, 655
so it may be appropriate to use different models of nucleotide evolution for each of these (as 656
assessed through, e.g., jModelTest (Posada 2008)). It is also possible to test if a region is best 657
modelled as one or separate partitions using PartitionFinder (Lanfear et al. 2012). Gaps are 658
normally treated as missing data by phylogenetic inference programs; if the user feels that 659
some gap-related characters are particularly phylogenetically informative (and particularly if 660
the sequences under scrutiny are very similar such that informative characters are thinly 661
seeded), the gap-related information can be added as a recoded, separate partition (see for 662
example Simmons and Ochotorena 2000). Some approaches try to reconstruct the 663
insertion/deletion and substitution processes simultaneously (Suchard and Redelings 2006; 664
Varón et al. 2010). 665
As datasets grow beyond some 20 sequences, there are no analytical solutions 666
for finding (guaranteeing) the best phylogenetic tree for any optimality criterion. Instead, 667
heuristic searches - that is, searches that do not guarantee that the optimal solution is found - 668
are employed to infer the tree or a distribution of trees. The most popular tools for Bayesian 669
inference of phylogeny rely on Markov Chain Monte Carlo (MCMC) sampling, a heuristic 670
sampling procedure where one to many searches (“chains”) traverse the space of possible 671
trees (typically fully parameterized with, e.g., branch lengths) one step at the time, comparing 672
the next tree (step ahead) only to the tree it presently holds in memory (Ronquist and 673

27
Huelsenbeck 2003). There are several statistics that can be calculated to test if the chain has 674
reached a steady state, i.e., if the chain has converged to a set of stable results for which 675
significant improvements do not seem possible (Rambaut and Drummond 2007; Nylander et 676
al. 2008). The set of trees (and parameters) inferred is then used to compute (e.g.) a majority-677
rule consensus tree with branch lengths and support values. At a more general level, there are 678
methods to evaluate the reliability of tree topology and individual branches for all major 679
approaches to phylogenetic inference. Branch support should routinely be estimated – 680
regardless of approach – and reported on in the subsequent publication. The most common 681
measures of branch support are Bayesian posterior probabilities (BPP; applicable in Bayesian 682
inference) and, in distance/parsimony/likelihood-based inferences, non-parametric resampling 683
methods such as traditional bootstrap (Felsenstein 1985) and jackknife (Farris et al. 1996). 684
Bayesian posterior probabilities are estimated from the proportion of trees exhibiting the clade 685
in question from the posterior distributions generated by the MCMC simulation and represent 686
the probability that the corresponding clades are true conditional on the model and the data. 687
Bootstrap/jackknife values are obtained from iterated resampling/dropping of characters from 688
the multiple sequence alignment and re-running the phylogenetic analysis for each new 689
alignment; the bootstrap/jackknife values then represent the proportion of times the 690
corresponding clades were recovered from these perturbed alignments. 691
We argue that branch lengths should always be indicated in phylogenetic trees. 692
In the context of parsimony, branch lengths represent the minimum number of mutations 693
(steps) separating two nodes, whereas in maximum likelihood/Bayesian inference branch 694
lengths are normally given in the unit of expected changes per site. Any extreme branch 695
lengths observed for any of the taxa should be explored for mistakes in the alignment, 696
sequences of poor quality, inclusion of taxa that are not closely related to the other taxa, and 697
increased evolutionary rate along that branch. Such long-branched taxa call for a re-evaluation 698
of the alignment and possibly also the taxon sampling; long branches represent one of the 699
most difficult problems in phylogenetic inference (Bergsten 2005). If the user combines two 700
or more genes from the same linkage group (e.g., the mitochondrial genome) in the alignment, 701
it is customary to test the dataset for conflicts prior to undertaking the phylogenetic analysis 702
(Hipp et al. 2004). 703
Interpretation of phylogenetic results and trees can be surprisingly tricky (Hillis 704
et al. 1996; Felsenstein 2004). The first thing the user should check is that the sequence used 705
as an outgroup really is an appropriate outgroup with respect to the ingroup sequences. The 706
answer tends to come naturally when several progressively more distant sequences with 707

28
respect to the ingroup are included in the alignment. Sequences of low read quality or of a 708
chimeric nature tend to be found on unusually long branches or as isolated sister taxa to larger 709
clades, and a second look at such sequences is always warranted (cf. Berney et al. 2004). 710
Branches that do not receive significant, but rather modest, support can usually be thought of 711
as non-existent such that what they really depict is the state of “no resolution available”; to 712
draw far-reaching conclusions for such modestly supported clades is wishful thinking, that is, 713
something the user should stay clear of. What constitutes “significant” branch support is a 714
non-trivial question, though, and the user is advised to focus on clades that appear strongly 715
supported (e.g., more than 90% bootstrap/jackknife or more than 0.95 BPP). In the context of 716
clades and branches, it is tempting to identify some taxa as “basal” to others, but nearly all 717
phylogenetic uses of the word “basal” are conceptually flawed (Krell and Cranston 2004), and 718
the user is best off avoiding it altogether. The “sister clade/taxon” construct is the most 719
straightforward alternative. 720
721
Presenting phylogenetic results. The end product of a phylogenetic analysis is typically a tree 722
in the (text-based) Newick (http://en.wikipedia.org/wiki/Newick_format) or Nexus (Maddison 723
et al. 1997) formats. This file can be loaded into tree viewing programs such as FigTree 724
(http://tree.bio.ed.ac.uk/software/figtree/), manipulated, and saved in a graphics format 725
(preferably a vector-based format such as .svg, .emf, or .eps). This file, in turn, can be loaded 726
into, e.g., Corel Draw or Adobe Illustrator (GIMP and InkScape are free alternatives) for 727
further processing, e.g., cleaning up the taxon names and highlighting focal clades (Figure 4). 728
There is nothing wrong with presenting a phylogenetic tree in a straightforward, non-729
embellished style, particularly not for trees with a limited number of sequences. Many 730
researchers nevertheless prefer to take their trees to the next level by, e.g., mapping 731
morphological characters onto clades, indicating generic boundaries with colours, and 732
collapsing large clades into symbolic units. iTOL (Letunic and Bork 2011), Mesquite 733
(Maddison and Maddison 2011), and OneZoom (Rosindell and Harmon 2012) are powerful 734
tools for such purposes. The Deep Hypha issue of Mycologia (December 2006) or the iTOL 735
site (http://itol.embl.de/) may serve as sources of inspiration on how trees could be 736
manipulated and processed to facilitate interpretation and highlight take-home messages. 737
738
739
740
741

29
742
743
744
745
746
747
748
749
750
751
752
753
754
755
756
757
758
759
760
761
762 763 764 765 Figure 4. An example of identification of species of plant pathogenic fungi of the genus Diaporthe (Phomopsis) 766 based on ex-type ITS sequences (Udayanga et al. 2012). Phylogram inferred from the parsimony analysis. One 767 of the most parsimonious trees generated based on ex-type sequences and some unidentified strains for quick 768 identification of species. Ex-type sequences are bold and green, and a random selection of isolates from various 769 studies is included with original strain codes. Bootstrap support values exceeding 50% are shown above the 770 branches. The tree is rooted with Diaporthe phaseolorum. 771 772
Most studies employing phylogenetic analysis are heavily underspecified in the 773
Materials & Methods section and, worse, do not provide neither the multiple sequence 774
alignment nor the phylogenetic trees derived as files (cf. Leebens-Mack et al. 2006). In our 775
opinion, a good study specifies details on the multiple sequence alignment (e.g., number of 776

30
sites in total, constant sites, and parsimony informative sites); on all relevant/non-default 777
settings of the phylogeny program employed; and on the phylogenetic trees produced. All 778
software packages should be cited with version number. The user should always bundle the 779
multiple sequence alignment and the tree(s) with the article through TreeBase (http:// 780
www.treebase.org ; Sanderson et al. 1994), DRYAD (http://datadryad.org/ ; Greenberg 2009), 781
or even as online supplementary items to the article (as applicable). This makes subsequent 782
data access easy for the scientific community (cf. Mesirov 2010) and helps dispel the old 783
assertion of taxonomy as a secretive, esoteric discipline. 784
785
5. The publication process 786
The scientific publication is something of the common unit of qualification in the natural 787
sciences and the end product of many scientific projects. Having spent considerable time with 788
the data collection and analysis, the user may be tempted to rush through the writing phase 789
just to get the paper out. This is usually a mistake, because publishing tends to be more 790
difficult, and to require more of the authors, than one perhaps would think. Indeed, it is not 791
uncommon for a project to take two or more years from conception to its final, published 792
state. Even very experienced researchers struggle with the writing phase, and we advise the 793
user to start writing as early as possible. Three good ways to increase the chances of having 794
the manuscript accepted in the end is to have at least two (external if possible) colleagues read 795
through it well ahead of submission; to make sure that the language used is impeccable; and 796
to follow the instructions of the target journal down to the very pixel. Many journals are 797
flooded with submissions and are only too happy to reject manuscripts if they deviate ever so 798
slightly from the formally correct configuration. A few general considerations follow below. 799
800
Choice of target journal. The user should decide upon the primary target journal before 801
writing the first word of the manuscript. The second- and third-choice journals should ideally 802
be chosen to be close in scope and style with respect to the primary one, so that the user 803
would not have to spend significant time restructuring or refocusing the manuscript if the 804
primary journal rejects it. The scope of the journal dictates how the manuscript should be 805
written: if it is a more general (even non-mycological) journal, the user should probably focus 806
on the more general, widely relevant aspects of the results. General journals have the 807
advantage of reaching a broader audience than taxonomy-oriented journals, and if the user 808
feels she has the data to potentially merit such a choice then she should certainly try. 809
However, trying to shoehorn smaller taxonomic papers into more general journals is likely to 810

31
prove a futile exercise. There is nothing wrong with publishing in more restricted journals, 811
and to be able to tell the difference between a manuscript with the potential for a more general 812
journal and a manuscript that probably should be sent to a more restricted journal is a skill 813
that is likely to save the user considerable time and energy. The user should also be prepared 814
to be rejected: this is a part of being in science and not something that should be taken too 815
personally. That said, the user should scrutinize the rejection letter for clues to how the 816
manuscript could be improved. The user should make it a habit to try to implement at least the 817
easiest, and preferably several more, of those suggested changes in the manuscript before 818
submitting it to the next journal in line. 819
Many funding agencies and institutional rankings ascribe extra weight to 820
publications in journals that are indexed in the ISI Thompson Web of Science 821
(http://thomsonreuters.com/), i.e., publications in journals that have, or are about to get, a 822
formal impact factor (http://en.wikipedia.org/wiki/Impact_factor). Citations are often 823
quantified in an analogous manner. This makes it a good idea to seek to target journals with a 824
formal impact factor (or at least journals with an explicit ambition to obtain one), more or less 825
irrespectively of what that impact factor is. We are under the impression that impact factors 826
are falling out of favour as a bibliometric measurement unit of scientific quality – which 827
would perhaps reduce the incentive for seeking to maximize the impact factor in all situations 828
– but if the user has a choice, it may make sense to strive for journals that have an impact 829
factor of 1 or higher. If given the choice between a journal run by a society and a journal run 830
by a commercial publishing company – with otherwise approximately equal scope and impact 831
– we would go for the one maintained by the society. A recent overview of journals with a 832
full or partial focus on mycology is provided by Hyde and KoKo (2011). 833
834
Open access. An increasing number of funding agencies require that projects that receive 835
funding publish all their papers (or otherwise make them available) through an open access 836
model, i.e., freely downloadable (cf. http://www.doaj.org/). As a consequence, the number of 837
open access journals has exploded during the last few years. Similarly, most non-open access 838
journals with subscription fees now offer an “open choice” alternative where individual 839
articles are made open access online. In both cases, there is normally a fee involved, and the 840
fee tends to be sizable (e.g., US$1350 for PLoS ONE, US$1990 for the BMC series, and 841
US$3000 for many Elsevier articles as of October 2012). Less well known is perhaps that 842
most major publishing companies allow the authors to make pre- or post-prints (the first and 843
the last version of the manuscript submitted to the journal, i.e., “pre” and “post” review) 844

32
available as a Word or PDF file on their personal homepages or certain public repositories 845
such as arXiv (http://arxiv.org/). The SHERPA/RoMEO database at 846
http://www.sherpa.ac.uk/romeo/ has the full details on what the major publishing 847
companies/journals allow the authors to do with their pre- and post-print manuscripts. To 848
make a manuscript publicly available in pre- or postprint form, in turn, qualifies as “open 849
access” as far as many funding agencies are concerned. Thus, if the user needs to publish 850
open access but cannot afford it, this may be the way to go. 851
There are some data to suggest that open access papers are cited more often than 852
non-open access ones (MacCallum and Parthasarathy 2006), although the first integrative 853
comparison based on mycological papers has yet to be undertaken. Most scientists, we 854
imagine, are attracted to the ideas of openness, distributed web archiving, and of the 855
dissemination of their results also to those who do not have access to subscription-based 856
journals. Not all is gold that glitters, however. An increasing number of open access 857
publishers may not have the authors’ best interest in mind but are rather run as strictly 858
commercial enterprises, often without direct participation of scientists. A Google search on 859
“grey zone open access publishers” will produce lists of journals (and publishers) that the user 860
may want to stay clear of. The papers are open access, but the peer review procedure tends to 861
be less than stringent, and the journals seem to take little, if any, action to promote the results 862
of the authors. Many of the journals are very poorly covered in literature databases and are 863
unlikely to ever qualify for formal impact factors. It would seem probable that such 864
publications would detract from, rather than add to, ones CV. 865
866
6. Other observations 867
Taxonomy is sometimes referred to as a discipline in crisis (Agnarsson and Kuntner 2007; 868
Drew 2011). There is some truth to such claims, because the number of active taxonomists is 869
in constant decline. Taxonomy furthermore struggles to obtain funding in competition with 870
disciplines deemed more cutting-edge. However, genome-scale sequence data is already 871
accessible for non-model organisms at a modest cost, and it can be anticipated that the 872
standard procedures to obtain the molecular data described in this paper will in part be 873
complemented and even replaced by NGS techniques at similar costs or less at some point in 874
the not-too-distant future. This will require substantial bioinformatics efforts and data storage 875
capabilities, but it also opens enormous possibilities for new scientific discoveries as well as 876
more advanced and formalized models to trace phylogenies and the speciation process. Here 877
we discuss some of the challenges faced by taxonomy in light of the project pursued by our 878

33
imaginary user. 879
880
Sanger versus next-generation sequencing. The last seven years have seen dramatic 881
improvements of, and additions to, the assortment of DNA sequencing technologies. 882
Collectively referred to as next-generation sequencing (NGS), these new methods can 883
produce millions – even billions – of sequences in a few days. At the time of writing this 884
article, most NGS technologies on the market produce sequences of shorter length than those 885
obtained through traditional Sanger sequencing, but this too is likely to change in the near 886
future. The user should keep in mind, though, that the NGS techniques and Sanger sequencing 887
are used for different purposes. NGS methods are primarily used to sequence genomes/RNA 888
transcripts and to explore environmental substrates such as soil and the human gut for 889
diversity and functional processes. To date there is no NGS technique to fully replace Sanger 890
sequencing for regular research questions in systematics and taxonomy (neither in terms of 891
read quality nor focus on single specimens), so it cannot be claimed that the present user 892
employs “obsolete” sequencing technology. On the contrary, we feel the user should be 893
congratulated for doing phylogenetic taxonomy, for even the most cutting-edge NGS efforts 894
require names and a classification system from systematic and taxonomic studies in the form 895
of, e.g., lists of species and higher groups recovered in their samples. Underlying those lists 896
are reliable reference sequences and phylogenies produced by taxonomic researchers. 897
There is nevertheless a disconnect between NGS-powered environmental 898
sequencing and taxonomy. Most environmental sequencing efforts recover a substantial 899
number of operational taxonomic units (Blaxter et al. 2005) that cannot be identified to the 900
level of species, genus, or even order (cf. Hibbett et al. 2011). However, since NGS sequences 901
are not readily archived in INSD (but rather stored in a form not open to direct query in the 902
European Nucleotide Archive; Amid et al. 2012), these new (or at least previously 903
unsequenced) lineages are not available for BLAST searches and thus generally ignored. 904
Similarly there is no device or centralized resource to database the fungal communities 905
recovered in the many NGS-powered published studies, and most opportunities to compare 906
and correlate taxa and communities across time and space are simply missed. Partial software 907
solutions are being worked upon in the UNITE database (Abarenkov et al. 2010, 2011) and 908
elsewhere, but we have no solution at present. It would be beneficial if all studies of 909
eukaryote/fungal communities were to involve at least one fungal systematician/taxonomist. 910
Conversely, fungal systematicians/taxonomists should seek training in bioinformatics and 911
biodiversity informatics to become prepared to deal with the research questions involving 912

34
taxonomy, systematics, ecology, and evolution in an increasingly connected, molecular world. 913
914
How can we do systematics and taxonomy in a better way? An important part of 915
environmental sequencing studies is to give accurate names to the sequences. By recollecting 916
species, designating epitypes, depositing type sequences in GenBank, and publishing 917
phylogenetic studies/classifications of fungi, taxonomists provide a valuable service for 918
present and future scientific studies. For example, it was previously impossible to accurately 919
name common endophytic isolates of Colletotrichum, Phyllosticta, Diaporthe or 920
Pestalotiopsis through BLAST searches, as the chances were very high that the names tagged 921
to sequences in INSD for these genera were highly problematic (see KoKo et al. 2011). 922
However, now that inclusive phylogenetic trees have been published for these genera 923
(Glienke et al. 2011, Cannon et al. 2012, Udayanga et al. 2012, Maharachchikumbura et al. 924
2012) using types and epitypes, it is possible to name some of the endophytic isolates in these 925
genera with reasonable accuracy. Some of the modern monographs with molecular data and 926
compilations of different genera (e.g., Lombard et al. 2010, Bensch et al. 2010, Liu et al. 927
2012, and Hirooka et al. 2012) have become excellent guides for aspiring researchers with the 928
knowledge on multiple taxonomic disciplines. The relevance of taxonomy will therefore be 929
upgraded as long as care is taken to provide the sequence databases with accurately named, 930
and richly annotated, sequences. 931
Taxonomists should also include aspects of, e.g., ecology and geography in 932
taxonomic papers and seek to publish them where they are seen by others. We feel that a good 933
taxonomic study should draw from molecular data (as applicable) and that it should seek to 934
relate the newly generated sequence data to the data already available in the public sequence 935
databases and in the literature. When interesting patterns and connections are found, the 936
modern taxonomist should pursue them, including writing to the authors of those sequences to 937
see if there is in fact an extra dimension to their data. As fellow taxonomists, we should all 938
strive to help each other in maximizing the output of any given dataset. Taxonomists have a 939
reputation of working alone - or at best in small, closed groups - and judging by the last few 940
years’ worth of taxonomic publications, that reputation is at least partially true. It would do 941
taxonomy well if this practise were to stop. We envisage even arch-taxonomical papers such 942
as descriptions of new species as opportunities to involve and integrate, e.g., ecologists and/or 943
bioinformaticians into taxonomic projects. There are only benefits to inviting (motivated) 944
researchers to ones studies: their focal aspects (such as ecology) will be better handled in the 945
manuscript compared to if the author had handled them on their own, and the new co-authors 946

35
are furthermore likely to improve the general quality of the manuscript by bringing an outside 947
perspective and experience. We feel that perhaps 1-2 days of work is sufficient to warrant co-948
authorship. 949
On a related note, taxonomists should take the time to revisit their sequences in 950
INSD to make sure their annotations and metadata are up-to-date and as complete as possible. 951
At present this does not seem to be the case; Tedersoo et al. (2011) showed, for instance, that 952
a modest 43% of the public fungal ITS sequences were annotated with the country of origin. 953
We believe most researchers would agree that the purpose of sequence databases is to be a 954
meaningful resource to science. The databases will however never be a truly meaningful 955
resource to science if all data contributors keep postponing the updates of their entries to a 956
day when free time to do those updates, magically, becomes available. Keeping ones public 957
sequences up-to-date must be made a prioritized undertaking; taxonomy should be a 958
discipline that shares its progress with the rest of the world in a timely fashion. If and when 959
generating ITS sequences, fungal taxonomists should try to meet the formal barcoding criteria 960
(http://barcoding.si.edu/pdf/dwg_data_standards-final.pdf; Schoch et al. 2012). This lends 961
extra credibility to their work and is, in turn, likely to lead to a wider dissemination of their 962
results. Taxonomists should similarly take the opportunity to add further value to their studies 963
by including additional illustrations and other data in their publications. Space normally 964
comes at a premium in scientific publications, but most journals would be glad to bundle 965
highlights of additional interesting biological properties and additional figures of, e.g., 966
fruiting bodies, habitats, and collection sites as supplementary, online-only items (cf. Seifert 967
and Rossman 2010). 968
969
Promoting ones results and career advancement. Even if the authors’ new scientific paper is 970
excellent, the chances are that it will not stand out above the background noise to get the 971
attention it deserves – at least not at a speed the author deems rapid enough. The author may 972
therefore want to do some PR for their article. One step in that direction is to cite their paper 973
whenever appropriate. Another step is to send polite, non-invasive emails to researchers that 974
the author feels should know about the article – as long as the author provides a URL to the 975
article rather than attaching a sizable PDF file, nobody is likely to take significant offence 976
from such emails if sent in moderation. A third step would be to present the results at the next 977
relevant conference. In fact, the authors could send a poster and article reprints to conferences 978
they are not able to attend through helpful co-authors or colleagues. On a more general level, 979
conferences form the perfect arena where to meet people and forge connections. We sincerely 980

36
hope that all Ph.D. students in mycology will have the opportunity to attend at least 2-3 981
conferences (international ones if at all possible). Poster sessions and “Ph.D. mixers” are 982
particularly relaxed events where friends and future collaborators can be established. Even 983
highly distinguished, prominent mycologists tend to be open to questions and discussion, and 984
many of them take particular care to talk to Ph.D. students and other emerging talents. We 985
acknowledge, however, that not everyone is in a position to go to conferences. Fortunately we 986
live in a digital world where friendly, polite emails can get you a long way. Indeed, several of 987
the present authors have made their most valuable scientific connections through email only. 988
Similarly, to sign up in, e.g., Google Scholar to receive email alerts when ones papers are 989
cited is a good way to scout for researchers with similar research interests. We believe that the 990
user should make an effort to connect to others, because it is though others that opportunities 991
present themselves. Furthermore, if one chooses those “others” with some care, the ride will 992
be a whole lot more enjoyable. 993
994
Concluding remarks 995
The present publication seeks to lower the learning threshold for using molecular methods in 996
fungal systematics. Each header deserves its own review paper, but we have instead provided 997
an topic overview and the references needed to commence molecular studies. We do not wish 998
to oversimplify molecular mycology; at the same time, we do not wish to depict it as an 999
overly complex undertaking, because in most cases it is not. Our take-home message is that 1000
the best way to learn molecular methods and know-how is through someone who already 1001
knows them well. To attempt to get everything working on one’s own, using nothing but the 1002
literature as guidance, is a recipe for failure. To find people to commit to helping you may be 1003
difficult, however, and we advocate that anyone who contributes 1-2 days or more of their 1004
time towards your goals should be invited to collaborate in the study. Newcomers to the 1005
molecular field have the opportunity to learn from the experience – and past mistakes – of 1006
others. In this way they will get most things correct right from the start, and in this paper we 1007
have highlighted what we feel are best practises in the field. We believe that taxonomists 1008
should adhere to best practises and to maximise the scientific potential and general usefulness 1009
of their data, because taxonomy is a discipline that is central to biology and that faces 1010
multiple far-reaching, but also promising, challenges. It is however impossible to give advice 1011
that would hold true in all situations and throughout time, and we hope that the reader will use 1012
our material as a realization rather than as a binding recipe. 1013
1014

37
Acknowledgements 1015
RHN acknowledges financial support from Swedish Research Council of Environment, 1016
Agricultural Sciences, and Spatial Planning (FORMAS, 215-2011-498) and from the Carl 1017
Stenholm Foundation. Bengt Oxelman is supported by a grant (2012-3719) from the Swedish 1018
Research Council. Manfred Binder is acknowledged for valuable discussions. Support from 1019
the Gothenburg Bioinformatics Network is gratefully acknowledged. 1020
1021
References 1022
Abang MM, Abraham WR, Asiedu R, Hoffmann P, Wolf G and Winter S. 2009 – Secondary 1023
metabolite profile and phytotoxic activity of genetically distinct forms of Colletotrichum 1024
gloeosporioides from yam (Dioscorea spp.). Mycological Research 113:130–140. 1025
1026
Abarenkov K, Nilsson RH, Larsson KH et al. 2010 – The UNITE database for molecular 1027
identification of fungi - recent updates and future perspectives. New Phytologist 186:281–1028
285. 1029
1030
Abarenkov K, Tedersoo L, Nilsson RH et al. 2010– PlutoF - a web-based workbench for 1031
ecological and taxonomical research, with an online implementation for fungal ITS 1032
sequences. Evolutionary Bioinformatics 6:189–196. 1033
1034
Abd-Elsalam KA, Yassin MA, Moslem MA, Bahkali AH, de Wit PJGM, McKenzie EHC, 1035
Stephenson SL, Cai L, Hyde KD. 2010 – Culture collections, the new herbaria for fungal 1036
pathogens. Fungal Diversity 45:21–32. 1037
1038
Agnarsson I, Kuntner M. 2007 – Taxonomy in a changing world: seeking solutions for a 1039
science in crisis. Systematic Biology 56:531–539. 1040
1041
Altschul SF, Madden TL, Schäffer AA, Zhang J, Zhang Z, Miller W, Lipman DJ. 1997 – 1042
Gapped BLAST and PSI-BLAST: a new generation of protein database search programs. 1043
Nucleic Acids Research 25:3389–3402. 1044
1045
Amid C, Birney E, Bower L et al. 2012 – Major submissions tool developments at the 1046
European nucleotide archive. Nucleic Acids Research 40(D1):D43–D47. 1047
1048

38
Begerow D, Nilsson RH, Unterseher M, Maier W. 2010 – Current state and perspectives of 1049
fungal DNA barcoding and rapid identification procedures. Applied Microbiology and 1050
Biotechnology 87:99–108. 1051
1052
Bensch K, Groenewald JZ, Dijksterhuis J et al. 2010 – Species and ecological diversity within 1053
the Cladosporium cladosporioides complex (Davidiellaceae, Capnodiales). Studies in 1054
Mycology 67:1–96. 1055
1056
Berbee ML, Pirseyedi M, Hubbard S. 1999 – Cochliobolus phylogenetics and the origin of 1057
known, highly virulent pathogens, inferred from ITS and glyceraldehyde-3-phosphate 1058
dehydrogenase gene sequences. Mycologia 91:964–977. 1059
1060
Bergsten J. 2005 – A review of long-branch attraction. Cladistics 21:163–193. 1061
1062
Berney C, Fahrni J, Pawlowski J. 2004 – How many novel eukaryotic 'kingdoms'? Pitfalls and 1063
limitations of environmental DNA surveys. BMC Biology 2:13. 1064
1065
Bidartondo M, Bruns TD, Blackwell M et al. 2008 – Preserving accuracy in GenBank. 1066
Science 319:1616. 1067
1068
Blaxter M, Mann J, Chapman T, Thomas F, Whitton C, Floyd R, Abebe E. 2005 – Defining 1069
operational taxonomic units using DNA barcode data. Philosophical Transactions of the 1070
Royal Society of London Series B – Biological Sciences 360:1935–1943. 1071
1072
Bonito GM, Gryganskyi AP, Trappe JM, Vilgalys R. 2010. A global meta-analysis of Tuber 1073
ITS rDNA sequences: species diversity, host associations and long-distance dispersal. 1074
Molecular Ecology 19:4994–5008. 1075
1076
Bryant D, Moulton V. 2004 – NeighborNet: an agglomerative algorithm for the construction 1077
of planar phylogenetic networks. Molecular Biology and Evolution 21:255–265. 1078
1079
Bärlocher F, Charette N, Letourneau A, Nikolcheva LG, Sridhar KR. 2010 – Sequencing 1080
DNA extracted from single conidia of aquatic hyphomycetes. Fungal Ecology 3:115–121. 1081
1082

39
Cai L, Hyde KD, Taylor PWJ et al. 2009 – A polyphasic approach for studying 1083
Colletotrichum. Fungal Diversity 39:183–204. 1084
1085
Cai L, Udayanga D, Manamgoda DS, Maharachchikumbura SSN, Liu XZ, Hyde KD. 2011 – 1086
The need to carry out re-inventory of tropical plant pathogens. Tropical Plant Pathology 1087
36:205–213. 1088
1089
Cannon PF, Damm U, Johnston PR, Weir BS. 2012 – Colletotrichum – current status and 1090
future directions. Studies in Mycology 73:181–213. 1091
1092
Capella-Gutierrez S, Silla-Martinez JM, Gabaldon T. 2009 – trimAl: a tool for automated 1093
alignment trimming in large-scale phylogenetic analyses. Bioinformatics 25:1972–1973. 1094
1095
Carbone I, Kohn L. 1999 – A method for designing primer sets for speciation studies in 1096
filamentous ascomycetes. Mycologia 91:553–556. 1097
1098
Choi YW, Hyde KD, Ho WH. 1999 – Single spore isolation of fungi. Fungal Diversity 3:29–1099
38. 1100
1101
Conn VS, Isaramalai S, Rath S, Jantarakupt P, Wadhawan R, Dash Y. 2003 – Beyond 1102
MEDLINE for literature searches. Journal of Nursing Scholarship 35:177–182. 1103
1104
Cooper A, Poinar HN. 2000 – Ancient DNA: do it right or not at all. Science 289:1139. 1105
1106
Correll JC, Guerber JC, Wasilwa LA, Sherrill JF and Morelock TE. 2000 – Inter- and 1107
Intraspecific variation in Colletotrichum and mechanisms which affect population structure 1108
In: Colletotrichum: host specificity, pathology, and host pathogen interaction (eds. D. Prusky, 1109
S.Fungal Diversity 201 Freeman and M.B. Dickman). APS Press, St. Paul, Minnesota, USA: 1110
145–170. 1111
1112
Cornish-Bowden A. 1985 – Nomenclature for incompletely specified bases in nucleic acid 1113
sequences: recommendations 1984. Nucleic Acids Research 13:3021–3030. 1114
1115
DeBertoldi M, Lepidi AA, Nuti MP. 1973 – Significance of DNA base composition in 1116

40
classification of Humicola and related genera. Transactions of the British Mycological 1117
Society 60:77–85. 1118
1119
Doyle JJ. 1992 – Gene trees and species trees: molecular systematics as one-character 1120
taxonomy. Systematic Botany 17:144–163. 1121
1122
Drew LW. 2011 – Are we losing the science of taxonomy? BioScience 61:942-946. 1123
1124
Drummond AJ, Suchard MA, Xie D, Rambaut A. 2012 – Bayesian phylogenetics with 1125
BEAUti and the BEAST 1.7. Molecular Biology and Evolution 29:1969–1973. 1126
1127
Edgar RC. 2004 – MUSCLE: multiple sequence alignment with high accuracy and high 1128
throughput. Nucleic Acids Research 32:1792–1797. 1129
1130
Edwards SV. 2009 – Is a new and general theory of molecular systematics emerging? 1131
Evolution 63:1–19. 1132
1133
Farris JS, Albert VA, Källersjö M, Lipscomb D, Kluge AG. 1996 – Parsimony jackknifing 1134
outperforms neighbor-joining. Cladistics 12:99–124. 1135
1136
Feibelman T, Bayman P, Cibula WG. 1994 – Length variation in the internal transcribed 1137
spacer of ribosomal DNA in chanterelles. Mycological Research 98:614–618. 1138
1139
Felsenstein J. 1985 – Confidence limits on phylogenies – an approach using the bootstrap. 1140
Evolution 39:783–791. 1141
1142
Felsenstein J. 2004 – Inferring phylogenies. Sinauer Press. Sunderland, Mass. 1143
1144
Ficetola GF, Coissac E, Zundel S, Riaz T, Shehzad W, Bessière J, Taberlet P, Pompanon F. 1145
2010 – An in silico approach for the evaluation of DNA barcodes. BMC Genomics 11:434. 1146
1147
Fredricks DN, Smith C, Meier A. 2005– Comparison of six DNA extraction methods for 1148
recovery of fungal DNA as assessed by quantitative PCR. Journal of Clinical Microbiology 1149
43: 5122–5128. 1150

41
1151
Fujita MK, Leaché AD, Burbrink FT, McGuire JA, Moritz C. 2012 – Coalescent-based 1152
species delimitation in an integrative taxonomy. Trends in Ecology & Evolution 27:480–488. 1153
1154
Gardes M, Bruns TD. 1993. ITS primers with enhanced specificity for basidiomycetes – 1155
application to the identification of mycorrhizas and rusts. Molecular Ecology 2:113–118. 1156
1157
Gargas A, DePriest PT. 1996 – A nomenclature for fungal PCR primers with examples from 1158
intron-containing SSU rDNA. Mycologia 88:745–748. 1159
1160
Gazis R, Rhener S, Chaverri P. 2011 – Species delimitation in fungal endophyte diversity 1161
studies and its implications in ecological and biogeographic inferences. Molecular Ecology 1162
30:3001–3013. 1163
1164
Ghobad-Nejhad M, Nilsson RH, Hallenberg N. 2010 – Phylogeny and taxonomy of the genus 1165
Vuilleminia (Basidiomycota) based on molecular and morphological evidence, with new 1166
insights into the Corticiales. TAXON 59:1519–1534. 1167
1168
Glass NL, Donaldson GC. 1995– Development of primer sets designed for use with the PCR 1169
to amplify conserved genes from filamentous ascomycetes. Applied and Environmental 1170
Microbiology 61:1323–1330. 1171
1172
Glienke C, Pereira OL, Stringari D et al. 2011– Endophytic and pathogenic Phyllosticta 1173
species, with reference to those associated with Citrus Black Spot. Persoonia 26:47–56 1174 1175 Goloboff PA, Farris JS, Nixon KC. 2008 – TNT, a free program for phylogenetic analysis. 1176
Cladistics 24:774–786. 1177
1178
Gonnet GH, Korostensky C, Benner S. – 2000. Evaluation measures of multiple sequence 1179
alignments. Journal of Computational Biology 7:261–276. 1180
1181
Gouy M, Guindon S, Gascuel O. – 2010. SeaView Version 4: A multiplatform graphical user 1182
interface for sequence alignment and phylogenetic tree building. Molecular Biology and 1183
Evolution 27:221–224. 1184

42
1185
Groenewald JZ, Groenewald M, Crous PW. 2011 – Impact of DNA data on fungal and yeast 1186
taxonomy. Microbiology Australia May 2011:100–104. 1187
1188
Greenberg J. – 2009. Theoretical considerations of lifecycle modeling: an analysis of the 1189
Dryad repository demonstrating automatic metadata propagation, inheritance, and value 1190
system adoption. Cataloging and Classification Quarterly 47:380–402. 1191
1192
Guarro J, Gene J, Stchigel AM. 1999 – Developments in fungal taxonomy. Clinical 1193
Microbiology Reviews 12:454–500. 1194
1195
Hanke M, Wink M. 1994 – Direct DNA sequencing of PCR-amplified vector inserts 1196
following enzymatic degradation of primer and dNTPs. Biotechniques 17:858–860. 1197
1198
Healy RA, Smith ME, Bonito GM et al. 2012. High diversity and widespread occurrence of 1199
mitotic spore mats in ectomycorrhizal Pezizales. Molecular Ecology, in press. 1200
1201
Heled J, Drummond AJ. 2010 – Bayesian inference of species trees from multilocus data. 1202
Molecular Biology and Evolution 27:570–580. 1203
1204
Hibbett DS. 2007 – After the gold rush, or before the flood? Evolutionary morphology of 1205
mushroom-forming fungi (Agaricomycetes) in the early 21st century. Mycological Research 1206
111:1001–1018. 1207
1208
Hibbett DS, Ohman A, Glotzer D, Nuhn M, Kirk P, Nilsson RH. 2011 – Progress in 1209
molecular and morphological taxon discovery in Fungi and options for formal classification 1210
of environmental sequences. Fungal Biology Reviews 25:38–47. 1211
1212
Hillis DM, Moritz C, Mable BK. 1996 – Molecular Systematics, 2nd Ed., Sinauer Associates, 1213
Sunderland, MA. 1214
1215
Hipp LA, Hall JC, Sytsma KJ. 2004 – Congruence versus phylogenetic accuracy: revisiting 1216
the incongruence length difference test. Systematic Biology 53:81–89. 1217
1218

43
Hirooka Y, Rossman AY, Samuels GJ, Lechat C, Chaverri P. 2012 – A monograph of 1219
Allantonectria, Nectria, and Pleonectria (Nectriaceae, Hypocreales, Ascomycota) and their 1220
pycnidial, sporodochial, and synnematous anamorphs. Studies in Mycology 71:1–210. 1221
1222
Hirt RP Logsdon JM, Healy Jr. B, Dorey MW, Doolittle WF, Embley TM. 1999 – 1223
Microsporidia are related to fungi: evidence from the largest subunit of RNA polymerase II 1224
and other proteins. Proceedings of the National Academy of Sciences, USA 96:580–585. 1225
1226
Huber KT, Oxelman B, Lott M, Moulton V. 2006 – Reconstructing the evolutionary history 1227
of polyploids from multi-labeled trees. Molecular Biology and Evolution, 23:1784–1791. 1228
1229
Hubka V, Kolarik M. 2012 – β-tubulin paralogue tubC is frequently misidentified as the 1230
benA gene in Aspergillus section Nigri taxonomy: primer specificity testing and taxonomic 1231
consequences. Persoonia 29:1–10. 1232
1233
Huson DH, Bryant D. 2006 – Application of phylogenetic networks in evolutionary studies. 1234
Molecular Biology and Evolution 23:254–267. 1235
1236
Huson DH, Rupp R, Scornavacca C. 2011 – Phylogenetic networks: concepts, algorithms and 1237
applications. Cambridge University Press, UK. 1238
1239
Hyde KD, Zhang Y. 2008 – Epitypification: should we epitypify? Journal of Zhejiang 1240
University 9:842–846. 1241
1242
Hyde KD, Cai L, McKenzie EHC, Yang YL, Zhang JZ, Prihastuti H. 2009 – Colletotrichum: 1243
a catalogue of confusion. Fungal Diversity 39:1–17. 1244
1245
Hyde KD, McKenzie EHC, KoKo TW. 2010 – Anamorphic fungi in a natural classification – 1246
checklist and notes for 2010. Mycosphere 2:1–88. 1247
1248
Hyde KD, KoKo TW. 2011 – Where to publish in mycology? Current Research in 1249
Environmental and Applied Mycology 1:27–52. 1250
1251
Ihrmark K, Bödeker ITM, Cruz-Martinez K et al. 2012 – New primers to amplify the fungal 1252

44
ITS2 region – evaluation by 454-sequencing of artificial and natural communities. FEMS 1253
Microbiology Ecology 82:666–677. 1254
1255
James TY, Kauff F, Schoch CL et al. 2006 – Reconstructing the early evolution of Fungi 1256
using a six-gene phylogeny. Nature 443:818–822. 1257
1258
Jones G, Sagitov S, Oxelman B. 2012 – Statistical inference of allopolyploid species networks 1259
in the presence of incomplete lineage sorting. arXiv:1208.3606. 1260
1261
Kanagawa T. 2003 – Bias and artifacts in multitemplate polymerase chain reactions (PCR). 1262
Journal of Bioscience and Bioengineering 96:317–323. 1263
1264
Kang S, Mansfield MAM, Park B et al. 2010 – The promise and pitfalls of sequence-based 1265
identification of plant pathogenic fungi and oomycetes. Phytopathology 100:732–737. 1266
1267
Karakousis A, Tan L, Ellis D, Alexiou H, Wormald PJ. 2006 – An assessment of the 1268
efficiency of fungal DNA extraction methods for maximizing the detection of medically 1269
important fungi using PCR. Journal of Microbiological Methods 65:38–48. 1270
1271
Karsch-Mizrachi I, Nakamura Y, Cochrane G. 2012 – The International Nucleotide Sequence 1272
Database Collaboration. Nucleic Acids Research 40(D1):D33–D37. 1273
1274
Katoh K, Toh H. 2010 – Parallelization of the MAFFT multiple sequence alignment program. 1275
Bioinformatics 26:1899–1900. 1276
1277
Kauserud H, Shalchian-Tabrizi K, Decock C. 2007 – Multi-locus sequencing reveals multiple 1278
geographically structured lineages of Coniophora arida and C. olivacea (Boletales) in North 1279
America. Mycologia 99:705–713. 1280
1281
Kloepper TH, Huson DH. 2008 – Drawing explicit phylogenetic networks and their 1282
integration into SplitsTree. BMC Evolutionary Biology 8:22. 1283
1284
Ko Ko T, Stephenson SL, Bahkali AH, Hyde KD. 2011 – From morphology to molecular 1285
biology: can we use sequence data to identify fungal endophytes? Fungal Diversity 50:113–1286

45
120 1287
1288
Korf RP. 2005 – Reinventing taxonomy: a curmudgeon's view of 250 years of fungal 1289
taxonomy, the crisis in biodiversity, and the pitfalls of the phylogenetic age. Mycotaxon 93: 1290
407–415. 1291
1292
Krell F-T, Cranston PS. 2004 – Which side of the tree is more basal? Systematic Entomology 1293
29:279–281. 1294
1295
Kubatko LS. 2009 – Identifying hybridization events in the presence of coalescence via model 1296
selection. Systematic Biology 58:478–488. 1297
1298
Lanfear R, Calcott B, Ho SYW, Guindon S. 2012 – PartitionFinder: combined selection of 1299
partitioning schemes and substitution models for phylogenetic analyses. Molecular Biology 1300
and Evolution 29:1695–1701. 1301
1302
Larsson E, Jacobsson S. 2004 – Controversy over Hygrophorus cossus settled using ITS 1303
sequence data from 200 year-old type material. Mycological Research 108:781–786. 1304
1305
Lassmann T, Sonnhammer ELL. 2005 – Automatic assessment of alignment quality. Nucleic 1306
Acids Research 33:7120-7128. 1307
1308
Leavitt SD, Johnson LA, Goward T, St Clair LL. 2011 – Species delimitation in 1309
taxonomically difficult lichen-forming fungi: an example from morphologically and 1310
chemically diverse Xanthoparmelia (Parmeliaceae) in North America. Molecular 1311
Phylogenetics and Evolution 60:317–332. 1312
1313
Leebens-Mack J, Vision T, Brenner E et al. 2006 – Taking the first steps towards a standard 1314
for reporting on phylogenies: Minimum Information about a Phylogenetic Analysis (MIAPA). 1315
The OMICS Journal 10:231–237. 1316
1317
Letunic I, Bork P. 2011 – Interactive Tree Of Life v2: online annotation and display of 1318
phylogenetic trees made easy. Nucleic Acids Research 39(S2):W475-W478. 1319
1320

46
Liu L, Pearl D. 2007 – Species trees from gene trees: reconstructing Bayesian posterior 1321
distributions of a species phylogeny using estimated gene tree distributions. Systematic 1322
Biology 56:504–514. 1323
1324
Liu K, Raghavan S, Nelesen S, Linder CR, Warnow T. 2009 – Rapid and accurate large-scale 1325
coestimation of sequence alignments and phylogenetic trees. Science 324:1561–1564. 1326
1327
Liu Y, Whelen JS, Hall BD. 1999 – Phylogenetic relationships among ascomycetes: evidence 1328
from an RNA polymerase II subunit. Molecular Biology and Evolution 16:1799–1808. 1329
1330
Lombard L, Crous PW, Wingfield BD, Wingfield MJ. 2010 – Systematics of Calonectria: a 1331
genus of root, shoot and foliar pathogens. Studies in Mycology 66:1–71. 1332
1333
Löytynoja A, Goldman N. 2005 – An algorithm for progressive multiple alignment of 1334
sequences with insertions. Proceeedings of the National Academy of Sciences USA 1335
102:10557–10562. 1336
1337
MacCallum CJ, Parthasarathy H. 2006 – Open access increases citation rate. PLoS Biology 1338
4:e176. 1339
1340
McNeill J, Barrie FR, Buck WR et al., eds. 2012 – International Code of Nomenclature for 1341
algae, fungi, and plants (Melbourne Code), Adopted by the Eighteenth International Botanical 1342
Congress Melbourne, Australia, July 2011 (electronic ed.), Bratislava: International 1343
Association for Plant Taxonomy. 1344
1345
Maddison WP, Maddison DR. 2011 – Mesquite: a modular system for evolutionary analysis. 1346
Version 2.75. http://mesquiteproject.org 1347
1348
Maddison DR, Swofford DL, Maddison WP. 1997 – NEXUS: an extensible file format for 1349
systematic information. Systematic Biology 46:590–621. 1350
1351
Maeta K, Ochi T, Tokimoto K et al. 2008 – Rapid species identification of cooked poisonous 1352
mushrooms by using Real-Time PCR. Applied and Environmental Microbiology 74:3306–1353
3309. 1354

47
1355
Maharachchikumbura SSN, Guo LD, Chukeatirote E, Bhhkali AH, Hyde KD. 2011 – 1356
Pestalotiopsis - morphology, phylogeny, biochemistry and diversity. Fungal 1357
Diversity 50:167–187. 1358
1359
Manamgoda DS, Cai L, McKenzie EHC, Crous PW, Madrid H, et al. 2012 – A phylogenetic 1360
and taxonomic re-evaluation of the Bipolaris – Cochliobolus– Curvularia complex. Fungal 1361
Diversity 56:131–144. 1362 . 1363 Mesirov JP. 2010 – Accessible reproducible research. Science 327:415– 416. 1364
1365
Miller CW, Chabot MD, Messina TC. 2009 – A student’s guide to searching the literature 1366
using online databases. American Journal of Physics 77:1112–1117. 1367
1368
Miller MJ, Powell JI. 1994 – A quantitative comparison of DNA sequence assembly 1369
programs. Journal of Computational Biology 1:257–269. 1370
1371
Monaghan MT, Wild R, Elliot M et al. 2009 – Accelerated species inventory on Madagascar 1372
using coalescent-based models of species delineation. Systematic Biology 58:298–311. 1373
1374
Muñoz-Cadavid C, Rudd S, Zaki SR, Patel M, Moser SA, Brandt ME, Gómez BL. 2010 – 1375
Improving molecular detection of fungal DNA in formalin-fixed paraffin-embedded tissues: 1376
comparison of five tissue DNA extraction methods using panfungal PCR. Journal of Clinical 1377
Microbiology 48:2471–2153. 1378
1379
Möhlenhoff P, Müller L, Gorbushina AA, Petersen K. 2001 – Molecular approach to the 1380
characterisation of fungal communities: methods for DNA extraction, PCR amplification and 1381
DGGE analysis of painted art objects. FEMS Microbiology Letters 195:169–173. 1382
1383
Nilsson RH, Ryberg M, Kristiansson E, Abarenkov K, Larsson K-H, Kõljalg U. 2006 – 1384
Taxonomic reliability of DNA sequences in public sequence databases: a fungal perspective. 1385
PLoS ONE 1:e59. 1386
1387
Nilsson RH, Ryberg M, Sjökvist E, Abarenkov K. 2011 – Rethinking taxon sampling in the 1388

48
light of environmental sequencing. Cladistics 27:197–203. 1389
1390
Nilsson RH, Tedersoo L, Abarenkov K et al. 2012 – Five simple guidelines for establishing 1391
basic authenticity and reliability of newly generated fungal ITS sequences. MycoKeys 4:37–1392
63. 1393
1394
Nylander JAA, Wilgenbusch JC, Warren DL, Swofford DL. 2008 – AWTY (are we there 1395
yet?): a system for graphical exploration of MCMC convergence in Bayesian phylogenetics. 1396
Bioinformatics 24:581–583. 1397
1398
O'Donnell K, Lutzoni FM, Ward TJ, Benny GL. 2001 – Evolutionary relationships among 1399
mucoralean fungi (Zygomycota): evidence for family polyphyly on a large scale. Mycologia 1400
93:286–296. 1401
1402
O'Meara BC. 2010 – New heuristic methods for joint species delimitation and species tree 1403
inference. Systematic Biology 59:59–73. 1404
1405
Pamilo P, Nei M. 1988 – Relationships between gene trees and species trees. Molecular 1406
Biology and Evolution 5:568–583. 1407
1408
Pearson WR, Lipman DJ. 1988 – Improved tools for biological sequence comparison. 1409
Proceedings of the National Academy of Sciences USA 85:2444–2448. 1410
1411
Porter TM, Skillman JE, Moncalvo J-M. 2008 – Fruiting body and soil rDNA sampling 1412
detects complementary assemblage of Agaricomycotina (Basidiomycota, Fungi) in a 1413
hemlock-dominated forest plot in southern Ontario. Molecular Ecology 17:3037–3050. 1414
1415
Porter TM, Golding GB. 2012 – Factors that affect large subunit ribosomal DNA amplicon 1416
sequencing studies of fungal communities: classification method, primer choice, and error. 1417
PLoS ONE 7:e35749. 1418
1419
Posada D. 2008 – jModelTest: phylogenetic model averaging. Molecular Biology and 1420
Evolution 25:1253–1256. 1421
1422

49
Qiu X, Wu L, Huang H, McDonel PE, Palumbo AV, Tiedje JM, Zhou J. 2001 – Evaluation of 1423
PCR-generated chimeras, mutations, and heteroduplexes with 16S rRNA gene-based cloning. 1424
Applied and Environmental Microbiology 67:880–887. 1425
1426
Rademaker JLW, Louws FJ, de Bruijn FJ. 1998 – Characterization of the diversity of 1427
ecologically important microbes by rep-PCR genomic fingerprinting, p. 1-27. In Akkermans 1428
ADL, van Elsas JD, and de Bruijn FJ (ed.), Molecular microbial ecology manual, v3.4.3. 1429
Kluwer Academic Publishers, Dordrecht, The Netherlands. 1430
1431
Raja H, Schoch CL, Hustad V, Shearer C, Miller A. 2011 – Testing the phylogenetic utility of 1432
MCM7 in the Ascomycota. MycoKeys 1:63–94. 1433
1434
Rambaut A, Drummond AJ. 2007 – Tracer v1.4, Available from 1435
http://beast.bio.ed.ac.uk/Tracer 1436
1437
Rannala B, Yang Z. 2003 – Bayes estimation of species divergence times and ancestral 1438
population sizes using DNA sequences from multiple loci. Genetics 164:1645–1656. 1439
1440
Rittenour WR, Park J-H, Cox-Ganser JM, Beezhold DH, Green BJ. 2012 – Comparison of 1441
DNA extraction methodologies used for assessing fungal diversity via ITS sequencing. 1442
Journal of Environmental Monitoring 14:766–774. 1443
1444
Robert V, Szöke S, Eberhardt U, Cardinali G, Meyer W, Seifert KA, Levesque CA, Lewis 1445
CT. 2011 – The quest for a general and reliable fungal DNA barcode. The Open Applied 1446
Informatics Journal 5:45–61. 1447
1448
Ronquist F, Huelsenbeck JP. 2003 – MrBayes 3: Bayesian phylogenetic inference under 1449
mixed models. Bioinformatics 19:1572–1574. 1450
1451
Ronquist F, Teslenko M, van der Mark P et al. 2012 – MrBayes 3.2: Efficient Bayesian 1452
phylogenetic inference and model choice across a large model space. Systematic Biology 1453
61:539–542. 1454
1455
Rosindell J, Harmon LJ. 2012 – OneZoom: A fractal explorer for the Tree of Life. PLoS 1456

50
Biology 10:e1001406. 1457
1458
Rossman AY, Palm-Hernández ME. 2008 – Systematics of plant pathogenic fungi: why it 1459
matters. Plant Disease 92:1376–1386. 1460
1461
Rozen S, Skaletsky H. 1999 – Primer3 on the WWW for general users and for biologist 1462
programmers. Methods in Molecular Biology 132:365–386. 1463
1464
Ryberg M, Nilsson RH, Kristiansson E, Topel M, Jacobsson S, Larsson E. 2008 – Mining 1465
metadata from unidentified ITS sequences in GenBank: a case study in Inocybe 1466
(Basidiomycota). BMC Evolutionary Biology 8:50. 1467
1468
Ryberg M, Kristiansson E, Sjökvist E, Nilsson RH. 2009 – An outlook on the fungal internal 1469
transcribed spacer sequences in GenBank and the introduction of a web-based tool for the 1470
exploration of fungal diversity. New Phytologist 181:471–477. 1471
1472
Sagova-Mareckova M, Cermak L, Novotna J, Plhackova K, Forstova J, Kopecky J. 2008 – 1473
Innovative methods for soil DNA purification tested in soils with widely differing 1474
characteristics. Applied and Environmental Microbiology 74:2902–2907. 1475
1476
Samson RA, Varga J. 2007 – Aspergillus systematics in the genomic era. Studies in 1477
Mycology 59:1–206. 1478
1479
Sanderson MJ, Donoghue MJ, Piel W, Eriksson T. 1994 – TreeBASE: a prototype database of 1480
phylogenetic analyses and an interactive tool for browsing the phylogeny of life. American 1481
Journal of Botany 81:183. 1482
1483
Santos JM, Correia VG, Phillips AJL. 2010 – Primers for mating-type diagnosis in Diaporthe 1484
and Phomopsis: their use in teleomorph induction in vitro and biological species definition. 1485
Fungal Biology 114:255–270 1486
1487
Schickmann S, Kräutler K, Kohl G, Nopp-Mayr U, Krisai-Greilhuber I, Hackländer K, Urban 1488
A. 2011 – Comparison of extraction methods applicable to fungal spores in faecal samples 1489
from small mammals. Sydowia 63:237–247. 1490

51
1491
Schmitt I, Crespo A, Divakar PK et al. 2009 – New primers for promising single copy genes 1492
in fungal phylogenetics and systematic. Persoonia 23:35–40. 1493
1494
Schoch CL, Seifert KA, Huhndorf A et al. 2012 – Nuclear ribosomal internal transcribed 1495
spacer (ITS) region as a universal DNA barcode marker for Fungi. Proceedings of the 1496
National Academy of Sciences USA 109:6241–6246. 1497
1498
Seifert K, Rossman AY. 2010 – How to describe a new fungal species. IMA Fungus 1:109–1499
116. 1500
1501
Shenoy BD, Jeewon R, Hyde KD. 2007 – Impact of DNA sequence-data on the taxonomy of 1502
anamorphic fungi. Fungal Diversity 26:1–54. 1503
1504
Silva DN, Talhinas P, Várzea V, Cai L, Paulo OS, Batista D. 2012 – Application of 1505
theApn2/MAT locus to improve the systematics of the Colletotrichum gloeosporioides 1506
complex: an example from coffee (Coffea spp.) hosts. Mycologia 104:396–409. 1507
1508
Simmons MP, Ochoterena H. 2000 – Gaps as characters in sequence-based phylogenetic 1509
analyses. Systematic Biology 49:369–381. 1510
1511
Singh VK, Kuamar A. 2001 – PCR primer design. Molecular Biology Today 2:27–32. 1512
1513
Specht CA, Dirusso CC, Novotny CP, Ullrich RC. 1982 – A method for extracting high-1514
molecular-weight deoxyribonucleic acid from fungi. Analytical Biochemistry 119:158–163 1515
1516
Stamatakis A. 2006 – RAxML-VI-HPC: Maximum likelihood-based phylogenetic analyses 1517
with thousands of taxa and mixed models. Bioinformatics 22:2688–2690. 1518
1519
Suchard MA, Redelings BD. 2006 – BAli-Phy: simultaneous Bayesian inference of alignment 1520
and phylogeny. Bioinformatics 22:2047–2048. 1521

52
Talavera G, Castresana J. 2007 – Improvement of phylogenies after removing divergent and 1522
ambiguously aligned blocks from protein sequence alignments. Systematic Biology 56:564–1523
577. 1524
1525
Taylor DL, McCormick MK. 2008 – Internal transcribed spacer primers and sequences for 1526
improved characterization of basidiomycetous orchid mycorrhizas. New Phytologist 177: 1527
1020–1033. 1528
1529
Taylor JW, Jacobson DJ, Kroken S, Kasuga T, Geiser DM, Hibbett DS, Fisher MC. 2000 – 1530
Phylogenetic species recognition and species concepts in fungi. Fungal Genetics and Biology 1531
31:21–32. 1532
1533
Tedersoo L, Abarenkov K, Nilsson RH et al. 2011 – Tidying up International Nucleotide 1534
Sequence Databases: ecological, geographical, and sequence quality annotation of ITS 1535
sequences of mycorrhizal fungi. PLoS ONE 6:e24940. 1536
1537
Thon MR, Royse DJ. 1999 – Partial ß-tubulin gene sequences for evolutionary studies in the 1538
Basidiomycotina. Mycologia 91:468–474. 1539
1540
Toju H, Tanabe AS, Yamamoto S, Sato H. 2012 – High-coverage ITS primers for the DNA-1541
based identification of ascomycetes and basidiomycetes in environmental samples. PLoS 1542
ONE 7:e40863. 1543
1544
de la Torre-Bárcena JE, Kolokotronis S-O, Lee EK et al. 2009 – The impact of outgroup 1545
choice and missing data on major seed plant phylogenetics using genome-wide EST data. 1546
PLoS ONE 4:e5764. 1547
1548
Udayanga D, Liu X, Crous PW, McKenzie EHC, Chukeatirote E, Hyde KD. 2012 – A multi-1549
locus phylogenetic evaluation of Diaporthe (Phomopsis). Fungal Diversity 56:157–171. 1550
1551
Varón A, Vinh LS, Wheeler WC. 2009 – POY version 4: phylogenetic analysis using 1552
dynamic homologies. Cladistics 26:72–85. 1553
1554
Voyron S, Roussel S, Munaut F, Varese GC, Ginepro M, Declerck S, Filipello Marchisio V. 1555

53
2009 – Vitality and genetic fidelity of white-rot fungi mycelia following different methods of 1556
preservation. Mycological Research 113:1027–1038. 1557
1558
Walker DM, Castlebury LA, Rossman AY,White JF. 2012 – New molecular markers for 1559
fungal phylogenetics: two genes for species level systematics in the Sordariomycetes 1560
(Ascomycota). Molecular Phylogenetics and Evolution 64:500–512. 1561
1562
Weir BS, Johnston PR, Damm U. 2012 – The Colletotrichum gloeosporioides species 1563
complex. Studies in Mycology 73:115–180 1564
1565
White TJ, Bruns T, Lee S, Taylor JW. 1990 – Amplification and direct sequencing of fungal 1566
ribosomal RNA genes for phylogenetics. Pp. 315-322 In: PCR Protocols: A Guide to Methods 1567
and Applications, eds. Innis MA, Gelfand DH, Sninsky JJ, and White TJ. Academic Press, 1568
Inc., New York. 1569
1570
Wilson IG. 1997 – Inhibition and facilitation of nucleic acid amplification. Applied and 1571
Environmental Microbiology 63:3741–3751. 1572
1573
Yang ZL. 2011 – Molecular techniques revolutionize knowledge of basidiomycete evolution. 1574
Fungal Diversity 50:47–58. 1575
1576
Yang Z, Rannala B. 2012 – Molecular phylogenetics: principles and practice. Nature Reviews 1577
Genetics 13:303–314. 1578
1579
Zwickl DJ. 2006 – Genetic algorithm approaches for the phylogenetic analysis of large 1580
biological sequence datasets under the maximum likelihood criterion. Ph.D. Dissertation, The 1581
University of Texas at Austin. 1582
1583
Zwickl DJ, Hillis DM. 2002 – Increased taxon sampling greatly reduces phylogenetic error. 1584
Systematic Biology 51:588–598. 1585
1586 1587 1588
Copyright © 2022 FDOKUMEN