
Aspiring to Excellence Annual Report 2005 - Kerry Properties ...
191
Aspiring to Excellence Annual Report 2005 (Incorporated in Bermuda with limited liability) Stock Code : 683
-
Upload
khangminh22 -
Category
Documents
-
view
1 -
download
0
Transcript of Aspiring to Excellence Annual Report 2005 - Kerry Properties ...
13/F - 14/F, Cityplaza 314 Taikoo Wan RoadTaikoo Shing, Hong Kong
Telephone: (852) 2967 2200Facsimile: (852) 2967 9480
www.kerryprops.com
An
nu
al R
eport 2005
Aspiring to Excellence
Annual Report 2005(Incorporated in Bermuda with limited liability)
Stock Code : 683
Cover_eng.indd 1Cover_eng.indd 1 2006/4/7 2:59:19 PM2006/4/7 2:59:19 PM

3
The Group’s dedication towards quality and
service to customers across a fast expanding
network and the constant desire of our people
to progress and to innovate is the key to
creating value for our shareholders

1
PROPERTYThe property division of Kerry Properties Limited is engaged in the creation and management of distinguished residential neighbourhoods as well as prime-quality, strategically-located mixed-use developments. These are being presented as part of a real estate network offering innovative value-added features and services throughout the Asia-Pacifi c region.
LOGISTICS NETWORKKerry Logistics Network Limited (Kerry Logistics) has established a leading position as Asia’s premier supply chain management expert and third-party logistics service provider, both in terms of customer satisfaction and shareholder value. With a China focus and being an Asia specialist, Kerry Logistics has progressively built up world-class capabilities to access and empower the supply chains of niche customer sectors across the globe.
INFRASTRUCTUREThe infrastructure division’s strategy is to work side-by-side with strategic public or private-sector partners in infrastructure developments, committing itself to those projects that improve the quality of life and that contribute towards the conservation of our environment for future generations.

BOARD OF DIRECTORS
Executive DirectorsMr ANG Keng Lam
Chairman
Mr WONG Siu KongDeputy Chairman andManaging Director
Mr HO Shut Kan
Mr MA Wing Kai, William
Independent Non-executive DirectorsMr William Winship FLANZ
Mr LAU Ling Fai, Herald
Mr Christopher Roger MOSS, O.B.E.
Non-executive DirectorMr TSE Kai Chi
AUDIT COMMITTEEMr Christopher Roger MOSS, O.B.E.
Chairman
Mr LAU Ling Fai, Herald
Mr TSE Kai Chi
FINANCE COMMITTEEMr ANG Keng Lam
Mr WONG Siu Kong
Mr HO Shut Kan
REMUNERATION COMMITTEEMr ANG Keng Lam Chairman
Mr WONG Siu Kong
Mr William Winship FLANZ
Mr LAU Ling Fai, Herald
Mr Christopher Roger MOSS, O.B.E.
QUALIFIED ACCOUNTANTMs CHANG Yin Wa
COMPANY SECRETARYMs LI Siu Ching, Liz
PRINCIPAL BANKERSBank of China (Hong Kong) Limited
Bank of Communications Co., Ltd.
The Bank of East Asia, Limited
BNP Paribas
Calyon
China Construction Bank Corporation
Citigroup
DBS Bank Ltd
Hang Seng Bank Limited
The Hongkong and Shanghai Banking Corporation Limited
Industrial and Commercial Bank of China (Asia) Limited
Standard Chartered Bank (Hong Kong) Limited
AUDITORSPricewaterhouseCoopers
Certifi ed Public Accountants
PROPERTY VALUERSSavills (Hong Kong) Limited
DTZ Debenham Tie Leung Limited
LEGAL ADVISERS
Hong Kong LawDeacons
Stephenson Harwood & Lo
Bermudian LawAppleby Spurling Hunter
PRC LawFangda Partners
STOCK CODESStock Exchange of Hong Kong: 683
Bloomberg: 683 HK
Reuters: 683.HK
REGISTERED OFFICECanon’s Court22 Victoria StreetHamilton HM12Bermuda
HEAD OFFICE AND PRINCIPAL PLACE OF BUSINESS13/F & 14/F, Cityplaza 314 Taikoo Wan RoadTaikoo Shing, Hong Kong
BRANCH OFFICE21/F, CITIC TowerNo 1 Tim Mei AvenueCentral, Hong Kong
WEBSITEwww.kerryprops.com
PRINCIPAL SHARE REGISTRAR AND TRANSFER OFFICEButterfi eld Fund Services (Bermuda) LimitedRosebank Centre11 Bermudiana RoadPembroke, Bermuda
HONG KONG BRANCH REGISTRAR AND TRANSFER OFFICEAbacus Share Registrars Limited26/F, Tesbury Centre28 Queen’s Road EastWanchai, Hong Kong
CONTACTCorporate Communications DepartmentKerry Properties Limited13/F & 14/F, Cityplaza 314 Taikoo Wan RoadTaikoo Shing, Hong KongTelephone: (852) 2967 2200Facsimile: (852) 2967 9480
KEY DATES
Closure of Registers of Members28 April 2006 to 3 May 2006
Annual General Meeting3 May 2006
Proposed Payment of Final Dividend/ Despatch of Share Certifi cates in respect of Scrip Dividend9 June 2006
Corporate Information & Key Dates

4 Financial Highlights
8 2005 Business Highlights
10 Chairman’s Statement
Management Discussion & Analysis
13 Overall Results
14 Review of Property Business
26 Review of Logistics Business
32 Review of Infrastructure Business
34 Financial Review
36 Particulars of Properties Held
49 Corporate Social Responsibility Report
51 2005 Awards
52 Corporate Governance Report
67 Audit Committee Report
68 Remuneration Committee Report
69 Internal Controls
70 Directors and Senior Management
73 Report of the Directors
91 Auditors’ Report
92 Consolidated Income Statement
93 Consolidated Balance Sheet
94 Balance Sheet
95 Consolidated Cash Flow Statement
97 Consolidated Statement of Changes in Equity
99 Notes to the Consolidated Financial Statements
187 Ten-Year Financial Summary
Contents

4
TWO-YEAR OVERVIEWFY 2005 FY 2004 % Change
Turnover (HK$M) 8,009 5,102 +57%Gross profi t (HK$M) 2,273 1,840 +24%Gross profi t margin (%) 28.4 36.1Operating profi t (HK$M) 3,246 1,733 +87%Operating profi t margin (%) 40.5 34.0Profi t attributable to shareholders (HK$M) - before fair value change of properties 1,759 1,580 +11% - after fair value change of properties 3,067 2,271 +35%Net profi t margin (%) - before fair value change of properties 22.0 31.0
- after fair value change of properties 38.3 44.5Earnings per share (HK$) - before fair value change of properties 1.45 1.32 +10% - after fair value change of properties 2.53 1.90 +33%Shareholders’ equity (HK$M) 25,221 22,329 +13%Net borrowings (HK$M) 9,184 3,923 +134%Net asset value per share (HK$) 20.73 18.44 +12%Share price as at 31 December (HK$) 20.55 16.60 +24%Price earnings ratio# (times) - before fair value change of properties 14.2 12.6 - after fair value change of properties 8.1 8.7Market capitalization as at 31 December# (HK$M) 25,001 20,105 +24%Dividend per share (HK$) 0.7 0.6 +17%Dividend payout ratio (%) - before fair value change of properties 48.3 45.5 - after fair value change of properties 27.7 31.7Dividend cover (times) - before fair value change of properties 2.1 2.2 - after fair value change of properties 3.6 3.2Dividend yield# (%) 3.4 3.6Return on shareholders’ equity (%) - before fair value change of properties 7.0 7.1 - after fair value change of properties 12.2 10.2Gearing (%) 36 18Interest cover (times) - before fair value change of properties 9.9 12.2 - after fair value change of properties 16.1 14.0Current ratio (times) 1.7 1.6Liquidity ratio (times) 1.5 1.3Discount to net asset value# (%) 0.9 10.0
# Based on share price as at 31 December 2005 and 31 December 2004, respectively.
Financial Highlights
5
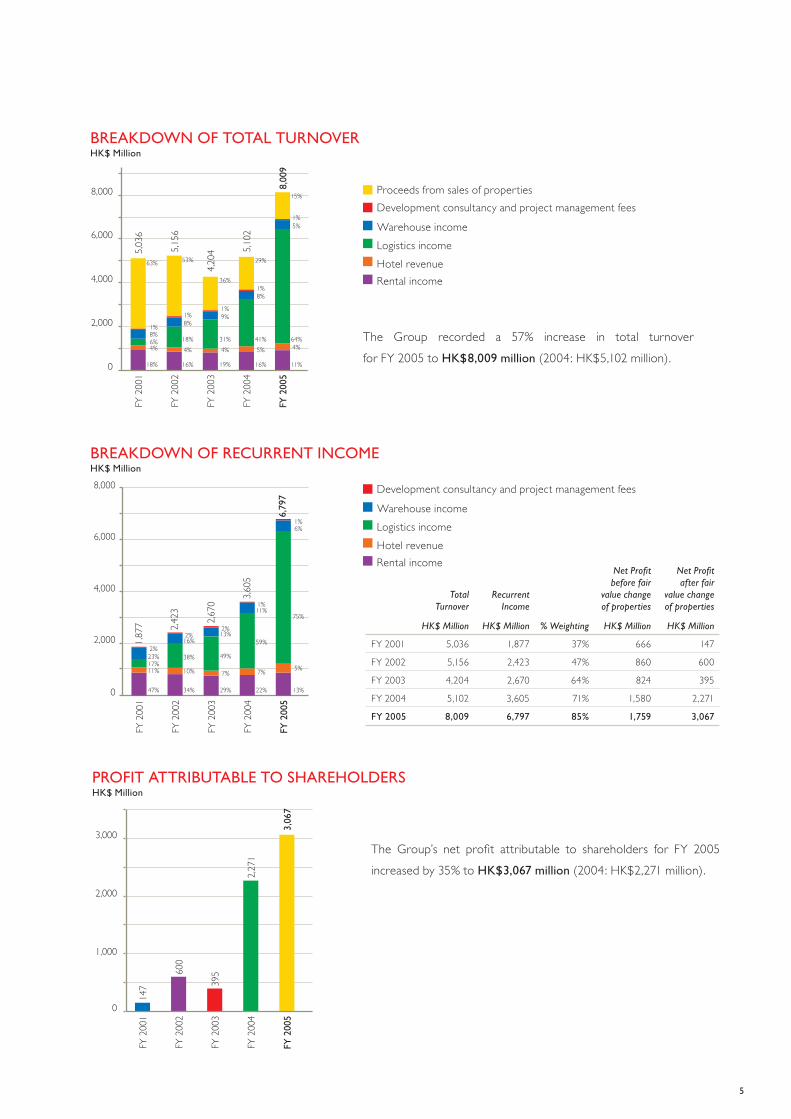
The Group’s net profi t attributable to shareholders for FY 2005 increased by 35% to HK$3,067 million (2004: HK$2,271 million).
The Group recorded a 57% increase in total turnoverfor FY 2005 to HK$8,009 million (2004: HK$5,102 million).
BREAKDOWN OF TOTAL TURNOVERHK$ Million
Hotel revenue
Warehouse income
Development consultancy and project management fees
Logistics income
Rental income
BREAKDOWN OF RECURRENT INCOMEHK$ Million
Total Turnover
HK$ Million
Recurrent Income
HK$ Million % Weighting
Net Profi t before fair
value change of properties
HK$ Million
Net Profi t after fair
value change of properties
HK$ Million
FY 2001 5,036 1,877 37% 666 147
FY 2002 5,156 2,423 47% 860 600
FY 2003 4,204 2,670 64% 824 395
FY 2004 5,102 3,605 71% 1,580 2,271
FY 2005 8,009 6,797 85% 1,759 3,067
PROFIT ATTRIBUTABLE TO SHAREHOLDERSHK$ Million
Hotel revenue
Warehouse income
Development consultancy and project management fees
Logistics income
Rental income
Proceeds from sales of properties

6
PROFIT ATTRIBUTABLE TO SHAREHOLDERS BY DIVISION (before fair value change of properties) HK$ Million
FY 2005
FY 2004
PROFIT ATTRIBUTABLE TO SHAREHOLDERS BY DIVISION (after fair value change of properties)HK$ Million
EARNINGS PER SHARE (before exceptional items)HK$
Profi t attributable to shareholders
(by division)
2005
HK$ Million
2004
HK$ Million % Change
PRC Property 295 441 -33%
Hong Kong Property 780 603 29%
Overseas Property 65 27 141%
Logistics Network 507 438 16%
Infrastructure 38 31 23%
Project, Property Management and Others 74 40 85%
1,759 1,580 11%
Profi t attributable to shareholders
(by division)
2005
HK$ Million
2004
HK$ Million % Change
PRC Property 372 548 -32%
Hong Kong Property 1,429 1,187 20%
Overseas Property 69 27 156%
Logistics Network 1,085 438 148%
Infrastructure 38 31 23%
Project, Property Management and Others
74 40 85%
3,067 2,271 35%
EARNINGS PER SHARE (after exceptional items)HK$
FY 2005
FY 2004
Financial Highlights (Continued)
7
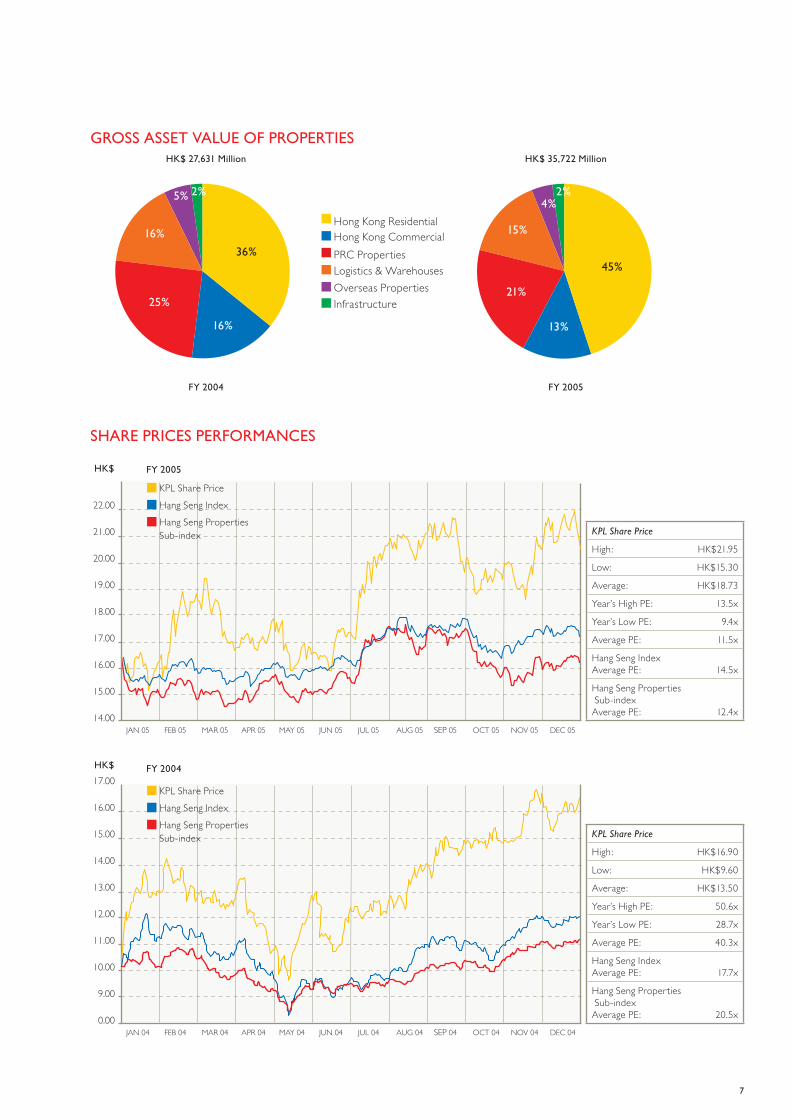
GROSS ASSET VALUE OF PROPERTIESHK$ 27,631 Million
36%
16%
25%
2%
16%
5%
45%
13%
21%
2%
15%
4%
FY 2005FY 2004
HK$ 35,722 Million
Hong Kong Residential
PRC Properties
Infrastructure
Logistics & WarehousesOverseas Properties
Hong Kong Commercial
HK$ FY 2005
KPL Share PriceHang Seng IndexHang Seng Properties Sub-index
FY 2004
KPL Share PriceHang Seng IndexHang Seng Properties Sub-index
KPL Share Price
High: HK$21.95
Low: HK$15.30
Average: HK$18.73
Year’s High PE: 13.5x
Year’s Low PE: 9.4x
Average PE: 11.5x
Hang Seng Index Average PE: 14.5x
Hang Seng Properties Sub-indexAverage PE: 12.4x
KPL Share Price
High: HK$16.90
Low: HK$9.60
Average: HK$13.50
Year’s High PE: 50.6x
Year’s Low PE: 28.7x
Average PE: 40.3x
Hang Seng Index Average PE: 17.7x
Hang Seng Properties Sub-indexAverage PE: 20.5x
SHARE PRICES PERFORMANCES
HK$

8
2005
BUSINESS HIGHLIGHTS
JANUARY
LOGISTICSThe acquisition of a 70% equity stake in EAS International Transportation Ltd., now renamed as Kerry EAS Logistics Limited, was completed, offering the Group a nationwide capability in Mainland China.
JULY
PROPERTYThe Group acquired a site at 38 Shelley Street*, Central, Hong Kong, which is earmarked for residential property development with an estimated developable GFA of 45,000 square feet.
* Artist’s impression
OCTOBER
LOGISTICSThe 173,000 square-feet bonded logistics centre in Tianjin’s Free Trade Zone commenced operation.
OCTOBER
INFRASTRUCTUREThe water treatment project in Hohhot Municipality, Inner Mongolia Autonomous Region, Mainland China, commenced commercial operation.
OCTOBER
PROPERTYThe Group won an open bid to acquire a 710,000 square-feet site in Hangzhou, Zhejiang Province, Mainland China, for development into a mixed-use property comprising a hotel, apartments and commercial shopping complex.
JULY
LOGISTICSThe 800,000 square-feet Inland Container Depot in Siam Seaport, Thailand, commenced operation.
8

9
JULY
PROPERTYA joint development project at First Street/Second Street*, Mid-Levels West, Hong Kong, was awarded by the Urban Renewal Authority for the development of residential and commercial properties measuring a GFA of 394,000 square feet.
* Artist’s impression
AUGUST
INFRASTRUCTUREInvested 25% interest in REDtone Telecommunications (China) Limited.
AUGUST
LOGISTICSThe acquisition of Orion Shipping and Forwarding Limited was completed, giving the Group freight forwarding coverage in the United Kingdom.
NOVEMBER
PROPERTYThe Group’s retail development at Enterprise Square Five in Kowloon Bay, Hong Kong, was offi cially named “MegaBox”*. With a GFA of 1.1 million square feet, MegaBox will be the largest and ultimate lifestyle destination and commercial mall in East Kowloon.* Artist’s impression
DECEMBER
PROPERTYParticipation in a joint venture development of a mixed-use property was announced following the acquisition of a 634,000 square-feet site in Pudong, Shanghai, Mainland China.
NOVEMBER
PROPERTYThe Group acquired a 469,000 square-feet site in Yangzhou, Jiangsu Province, Mainland China, for hotel and apartments developments.
9

10
It gives me great pleasure to report to shareholders the annual results of Kerry Properties Limited (the “Company”), its subsidiaries and associated companies (collectively, the “Group”) for the year ended 31 December 2005.
RESULTSThe Group’s profi t attributable to shareholders for the year ended 31 December 2005 was HK$3,067 million, representing an increase of 35% compared with HK$2,271 million reported for 2004. The increase in the Group’s earnings is attributable to the 29% increase in earnings contribution from the Hong Kong property business, the 16% increase from the logistics business and the increase in fair values of investment properties which were recognized in the Group’s income statement during the year.
Earnings per share for the year were HK$2.53, representing an increase of 33% compared with HK$1.90 per sharein 2004.
Shareholders should note that these are the fi rst annual results published by the Company following the adoption of a number of new or revised Hong Kong accounting standards which took effect from 1 January 2005. The most signifi cant of these is the adoption of the fair value model in the accounting treatment of investment properties. Set out below are the effects of adopting this accounting policy on the Group’s profi t attributable to shareholders.
The Board has recommended the payment of a fi nal dividend of HK$0.50 per share for the year, with a scrip dividend alternative. Together with the interim dividend of HK$0.20 per share, the total dividend for the year ended 31 December 2005 will be HK$0.70 per share, representing an increase of 17% compared with HK$0.60 per sharein 2004.
HIGHLIGHTS OF THE GROUP’S OPERATIONS IN 2005
I. Property investment and developmentMainland China
Our Mainland China Property Division recorded a net profi t attributable to shareholders of HK$372 million during the year, representing a decrease from HK$548 millionin 2004.
As a result of the Central Government’s policy to relieve pricing pressures, the past year was characterized by a slowdown in residential property sales in Mainland China. However, our investment property portfolio, including Beijing Kerry Centre, Shanghai Kerry Centre and Shenzhen Kerry Centre, continued to enjoy high occupancy rates and generated strong recurrent earnings for the Group. During the year, we also took the opportunity to add quality sites measuring a total developable GFA of 4.6 million square feet to our development land bank.
In October 2005, we entered a joint venture agreement with Shangri-La Asia Limited, Allgreen Properties Limited and Shanghai Lujiazui Finance & Trade Zone Development Co. Ltd. to develop a mixed-use project in Shanghai’s prestigious Pudong District, located near the Shanghai New International Expo Centre. We have a 40.8% interest in this prime development which measures a total of 2.48 million square feet in GFA. This project will complement the
Chairman’s
STATEMENT
Year ended 31 December
2005HK$ million
2004HK$ million Increase
Profi t attributable to shareholders before taking into account the net change in fair values/revaluation surplus of investment properties and related tax effects 1,759 1,580 11%
Add:Net change in fair values/
revaluation surplus of investment properties and related tax effects 1,308 691
Profi t attributable to shareholders 3,067 2,271 35%
Mr Ang Keng LamChairman of the Board of Directors

11
development of Shanghai’s Pudong District in the lead-up to the 2010 Shanghai Expo event.
The Group is also investing in and capitalizing on the growth of major secondary cities which are undergoing economic expansion. We have acquired prime sites in Hangzhou with a buildable GFA of 1.8 million square feet, and in Yangzhou with a buildable GFA of 1 million square feet.
These investments are in line with the Group’s core business strategy of developing large scale mixed-use properties, catering to the needs of the increasingly affl uent consumers in Mainland China.
Hong Kong
Our Hong Kong Property Division recorded a net profi t attributable to shareholders of HK$1,429 million during the year, representing an increase from HK$1,187 millionin 2004.
In 2005, Hong Kong’s strong economy led to a signifi cant upward movement in both residential and offi ce rental rates. The Group capitalized on the high demand for quality offi ce space and luxury residential properties, by selling certain properties at attractive profi t margins during the year.
Before the year end, we have settled the land premiums for the property developments in Ap Lei Chau and Tsuen Wan. Furthermore, the Group acquired a number of prime sites on Hong Kong Island this year; these include one located at Shelley Street in the popular “SOHO” District, and another located at First Street/Second Street in Mid-Levels West. These sites offer excellent development potential for the Group.
During the year, the Group made strong progress with the Enterprise Square Five development in Kowloon Bay. It is a large retail entertainment complex (known as “MegaBox”) with twin tower grade-A offi ces, and is a major component of our property portfolio in Hong Kong. Upon its completion in mid-2007, Enterprise Square Five will become a leading landmark within the district, and will further enhancethe value of the Group’s adjacent existing offi ce and commercial properties.
As at 31 December 2005, properties under development in Hong Kong measured an aggregate GFA of 3.1 million square feet, which provides a strong land bank for our development programme in Hong Kong up to 2009.
Macau
Macau witnessed a thriving economy in 2005. We remain optimistic on the future of Macau and its potential economic growth, and the Group is committed to developing a luxury residential project in the city.
II. Logistics NetworkKerry Logistics Network Limited, the Group’s Logistics Division, recorded net profi t attributable to shareholders of HK$1,085 million during the year, representing an increase from HK$438 million in 2004.
The Logistics Division carried out extensive expansion plans in 2005. In Thailand, we completed the construction of an 800,000 square-feet Inland Container Depot in Siam Seaport, located near Laem Chabang, South of Bangkok. In Europe, we expanded our operations to Spain and also acquired two local companies in the United Kingdom engaged in various logistics services. We entered an agency agreement with Lynden International, a US-based company with offi ces in the United States, Canada, Mexico and Puerto Rico, to develop trans-Pacifi c freight forwarding businesses.
In Mainland China, a major milestone was marked for the division after our acquisition of a 70% equity interest in EAS International Transportation Ltd., now renamed Kerry EAS Logistics Limited (“KEAS”). Established for over 20 years with over 120 offi ces serving over 1,100 cities throughout Mainland China, KEAS is now one of the leading logistics operators in Mainland China. Furthermore, with the completion of a 173,000 square-feet bonded logistics centre in Tianjin’s Free Trade Zone in 2005 along with others strategically located in the Free Trade Zones of Yantian, Beijing and Shanghai’s Waigaoqiao, we now have a bonded logistics centre portfolio of over 1 million square feet in total.

12
Through strategic alliances and acquisitions, our network now covers Mainland China, various parts of Asia, Europe, Australia and North America. We have business operations in 13 countries, and have grown to become a major Asian-based international logistics operator.
In recognition of our outstanding achievements, Kerry Logistics was the winner of the Local (Hong Kong) Logistics Award and the Mainland Logistics (non-SME) Award at the Logistics Awards Hong Kong 2005, organized by the Hong Kong Trade Development Council and four other renowned local trade associations.
III. InfrastructureThe Division recorded net profi t attributable to shareholders of HK$38 million in 2005 (2004: HK$31 million), which is mainly attributable to its investment in the Western Harbour Crossing in Hong Kong. We will continue to focus on investment opportunities in the utilities, energy recycling and environmental protection-related sectors in Mainland China to generate recurrent income for the Group.
PROSPECTS
Mainland China’s economy demonstrated a robust performance in 2005, with GDP growth of 9.9%, a strong export sector and low domestic infl ation. We believe this strong performance will continue in 2006. The introduction of the State Council’s land tender policies has meant increased transparency and better accessibility for foreign investors to acquire land in Mainland China. We believe that the Central and Provincial Governments will continue to invest in more quality infrastructure and allocate more resources to the rural areas, as 2006 marks the fi rst year of the Central Government’s eleventh Five-Year Plan. Under such an economic environment, we expect strong liquidity and increased affordability, fuelling the local demand for quality properties.
Similarly, Hong Kong experienced a year of strong growth. With GDP growth of 7.6%, infl ation maintained at 1% and an overall increase in wage levels, Hong Kong’s property market experienced a rise in demand. Our outlook for 2006 remains positive; this is primarily due to the aforementioned
sustainable economic growth of Mainland China, Hong Kong’s niche in the trade and fi nancial services sectors and its booming tourism industry. The market’s expectation of an end to the interest rate hikes will also have a positive effect on the property sector.
On the logistics front, we aim to widen our global client base and to enhance our international profi le. We will continue to venture into new markets such as India, the Middle East and other parts of Europe, in search of strategic alliances and investments to expand our business network. We will continue to invest in advanced technology for our logistics operations as we believe that technological innovation is paramount in maintaining our competitive advantage inthe industry.
In line with our mission statement of “Aspiring to Excellence”, we will continue to develop a portfolio of premium assets in the property, logistics and infrastructure sectors. With a positive economic outlook for 2006, the Group will participate in development opportunities which we believe not only benefi t the communities we invest in, but also offer optimal fi nancial returns to the Group and to our shareholders.
APPRECIATION
On behalf of the Board, I would like to express my sincere appreciation to the Group’s management and staff for their diligence, loyalty and dedication. I am grateful to the members of the Board for their valuable counsel and guidance, as well as to our investors and strategic partners for their unfailing support and confi dence which has ultimately contributed towards the Group’s success.
Ang Keng Lam
Chairman
Hong Kong, 24 March 2006
CHAIRMAN’S STATEMENT (Continued)

Management Discussion & Analysis
OVERALL RESULTSThe Group continued to demonstrate a strong fi nancial performance during the year ended 31 December 2005. Turnover of the Group for the year was HK$8,009 million, which registered an increase of 57% when compared with the turnover of HK$5,102 million for 2004. The Group’s turnover mainly comprises proceeds from the continuing sales of properties, rental income as well as revenue from hotel operations, warehouse operations and logistics services. The increase in turnover during the year was attributable to the growth in rental income, the improved performance of Beijing Kerry Centre Hotel and the revenue contribution from logistics services.
In accordance with the new Hong Kong accounting standard on accounting for investment properties, the change in fair values of investment properties is recorded in the income statement. During the year ended 31 December 2005, the net change in fair values of the Group’s investment properties and related tax effects in the aggregate amount of HK$1,308 million was recognized in the Group’s consolidated income statement.
The effect on the Group’s profi t attributable to shareholders due to the net change in fair values/revaluation surplus of the Group’s investment properties and related tax effects is as follows:
Excluding the effect of the net change in fair values/revaluation surplus of the Group’s investment properties and related tax effects, the 11% year-on-year increase in the profi t attributable to shareholders is mainly attributable to the Hong Kong Property Division and the Logistics Network Division, which demonstrated a year-on-year increase of 29% and 16%, respectively.
13
Year ended 31 December
2005HK$ million
2004HK$ million Increase
Profi t attributable to shareholders before taking into account the net change in fair values/revaluation surplus of investment properties and related tax effects 1,759 1,580 11%
Add:Net change in fair values/
revaluation surplus of investment properties and related tax effects 1,308 691
Profi t attributable to shareholders 3,067 2,271 35%

14
OVERVIEW
During the year ended 31 December 2005, the Group acquired a number of new property sites in Hong Kong and Mainland China. These acquisitions effectively increased the Group’s land bank, and enabled the Group to reap the benefi ts of the positive outlook of the property sectors in these territories.
As at 31 December 2005, the Group maintained a portfolio (measured in gross fl oor area (“GFA”)) comprising 16.17 million square feet (2004: 11.03 million square feet) of properties under development, 7.47 million square feet (2004: 7.48 million square feet) of completed investment properties and 0.22 million square feet (2004: 0.56 million square feet) of properties held for sale. Such a portfolio provides the Group with an opportunity to enjoy the attractive fi nancial returns arising from the sales of properties, as well as from leased properties. This portfolio will generate a strong sales and recurrent income maintaining the Group’s positive growth momentum going forward.
PROPERTY PORTFOLIO COMPOSITION24.37 million square feet of GFA
Investment Properties/Hotel Property
7.98 million square feet
33%
67%
29%
23%
48%
11%20%
17%
52%Hong Kong
OverseasMainland ChinaMacau
By Location
Review of
PROPERTY BUSINESSBalanced Portfolio, Premium Brand, Delivering Quality,Regional Focus.
Management Discussion & Analysis
Properties Under Development/Held for Sale
16.39 million square feet

15
MAINLAND CHINA PROPERTY DIVISION
During the year ended 31 December 2005, the Mainland China Property Division reported turnover of HK$1,012 million (2004: HK$1,351 million) and a net profi t attributable to the Group of HK$372 million (2004: HK$548 million), after taking into account the increase in fair values of investment properties (after deferred taxation) of HK$77 million (2004: HK$107 million). Excluding the effect of the increase in fair value of investment properties (after deferred taxation), net profi t attributable to the Group amounted to HK$295 million (2004: HK$441 million). The decrease in turnover and net profi t in 2005 is mainly due to the decrease in the sales of properties in Mainland China compared with 2004.
The Division remains extremely selective in its choice of new investments. In terms of new property developments, prime locations are preferred where land supply is relatively restricted, in order to ensure sustainable asset value and strong resilience during periods of market uncertainties. Behind this strategy also lies a long-standing mission for the Group to build on its expertise and reputation in Mainland China’s property market in creating a profi le of strategically-located, high-end properties in élite neighbourhoods.
The Group continues to focus on the development of large-scale, mixed-use property projects in key locations. The cross-marketing effect between the various categories of a mixed-use property development project will inevitably enhance property values and rental rates.
Investment PropertiesDuring the year ended 31 December 2005, the Group’s portfolio of investment properties in Mainland China generated rental turnover and operating profi t from rental activities of HK$542 million and HK$428 million, respectively (2004: HK$493 million and HK$363 million, respectively).
The Group’s investment property portfolio in Mainland China as at 31 December 2005 comprised an aggregate GFA of 3.33 million square feet (2004: 3.37 million square feet). The geographical distribution of the Group’s investment properties in Mainland China is set out in the table below.
PROPERTY PORTFOLIO COMPOSITION
Mainland China (sq.ft.) Hong Kong (sq.ft.) Macau (sq.ft.) Overseas (sq.ft.) Total GFA (sq.ft.)
Investment Properties 3,334,070 1,803,751 - 2,336,897 7,474,718
Properties Under Development 8,446,719 3,146,151 2,800,000 1,780,695 16,173,565
Properties Held for Sale 27,714 179,068 - 13,304 220,086
Hotel Property 499,642 - - - 499,642
Total GFA 12,308,145 5,128,970 2,800,000 4,130,896 24,368,011
INVESTMENT PROPERTIES IN MAINLAND CHINA
Beijing (sq.ft.) Shanghai (sq.ft.) Shenzhen (sq.ft.) Fuzhou (sq.ft.) Total GFA (sq.ft.)
Offi ce 814,665 632,259 132,204 - 1,579,128
Commercial 184,998 400,707 107,256 63,986 756,947
Residential 277,330 148,688 - - 426,018
Carparks & Others 194,698 235,075 142,204 - 571,977
Total GFA 1,471,691 1,416,729 381,664 63,986 3,334,070

16
As at 31 December 2005, the Group’s investment property portfolio of offi ce, commercial and residential properties achieved occupancy rates of 95%, 92% and 72%, respectively (2004: 97%, 97% and 72%, respectively). Highlights of the occupancy rates of the Group’s major investment properties in Mainland China as at 31 December 2005 were as follows:
OCCUPANCY RATES OF MAJOR INVESTMENT PROPERTIES IN MAINLAND CHINA
Property
Occupancy rateas at
31 December 2005
Occupancy rateas at
31 December 2004
Beijing Kerry Centre 89% 89%
Shanghai Kerry Centre 91% 89%
Shenzhen Kerry Centre 96% 96%
Kerry Everbright City Phase I 95% 98%
Sales of Completed PropertiesSales of completed properties during the year ended 31 December 2005 contributed turnover and operating profi t of HK$149 million and HK$37 million, respectively (2004: HK$595 million and HK$196 million, respectively).
Turnover and profi t contributions from property sales in Mainland China recorded during 2005 were generated mainly from the sales of units of Arcadia Court and Regency Park Phase IIIB in Shenzhen and Central Residences in Fuzhou.
Properties under DevelopmentThe Group made key investments in Mainland China during the year ended 31 December 2005, with a view to develop a balanced portfolio of properties for sale, development and investment. The Group continues to build on its strong presence in Shanghai, Beijing and Shenzhen, and has begun to explore property development opportunities in major secondary cities which are experiencing economic growth in order to tap into their market potential and increasingly affl uent consumer sectors.
In relation to the mixed-use property development project in Jingan District, Shanghai, the Company and Shangri-La Asia Limited (“SA”) jointly announced in December 2005 that all the underlying contract approvals had been obtained
REVIEW OF PROPERTY BUSINESS (Continued)
Futian Offi ce,*Shenzhen, Mainland China (right)
Kerry Everbright City Phase II,* Shanghai, Mainland China (far right)
* Artist’s impression
PROPERTIES UNDER DEVELOPMENT IN MAINLAND CHINA
Shanghai (sq.ft.)
Shenzhen (sq.ft.)
Beihai (sq.ft.)
Hangzhou (sq.ft.)
Yangzhou (sq.ft.)
Manzhouli (sq.ft.)
Total GFA upon completion
(sq.ft.)
Residential 1,367,638 - - - - - 1,367,638
Apartments 328,747 - - 376,740 494,283 627,444 1,827,214
Offi ce 1,076,372 807,300 - - - - 1,883,672
Commercial 384,737 - 77,350 861,120 - 88,868 1,412,075
Hotel 825,900 - - 592,020 538,200 - 1,956,120
Total GFA upon completion 3,983,394 807,300 77,350 1,829,880 1,032,483 716,312 8,446,719
Management Discussion & Analysis

17
from the PRC Government, apart from one supplemental contract relating to one of the sites within the project. Accordingly, the deadline for the execution of all the underlying contracts for the project was extended to 30 June 2006 (or such other date as the Company and SA may agree). Development and construction works of the project are expected to commence in the fourth quarter of 2006.
Completion of Central Residences Phase II, a luxury residential development in Changning District, Shanghai, is scheduled for the second quarter of 2006. Structural, mechanical and electrical works have been completed and interior fi nishes are in progress. The project will have a total developable GFA of 641,000 square feet.
Upon completion, the mixed-use Kerry Everbright City Phase II development in Shanghai will deliver a total GFA of 1,576,000 square feet, and is designated for offi ce, residential and retail purposes. With the Phase IIa foundation works completed and basement works in progress, the residential towers are expected to be completed in the second quarter of 2007. Phase IIb foundation works are currently in progress.
In Shenzhen, development of the 807,000 square-feet grade-A offi ce complex in Futian Central District is scheduled for completion in the third quarter of 2007. Meanwhile, development of a 323,000 square-feet site in Manzhouli, Inner Mongolia, is expected to be completed by 2009.
MAINLAND CHINA
PROPERTY PORTFOLIO12.31 million square feet of GFA
Investment Properties/Hotel Property
3.84 million square feet
Properties under Development/Held for Sale
8.47 million square feet
1%
47%
10%
22%
12%8%
Shenzhen
ShanghaiBeijingHangzhou
Fuzhou/Beihai
YangzhouManzhouli
By location
Hotel
CommercialOffi ceResidential
ApartmentsCarparks & others
By type
13%20%
41%
11%
15%
37%
51%
10%
2%
17%
23%
22%
22%
16%
31%
69%

18
In November 2005, the Group announced its successful acquisition from the Hangzhou Bureau of Land Resources of a site in Xia Cheng District, Hangzhou, Zhejiang Province. The total developable site area is 710,000 square feet, offering a total buildable GFA of 1,830,000 square feet and will be earmarked for a mixed-use development comprising a hotel, apartments and a commercial shopping complex. It is scheduled for completion in 2009. The site is strategically located close to the famous Xihu (West Lake) tourist attraction and the major commercial district along Yan An Road. The rapid economic growth of the Yangtze River Delta Region is expected to generate a strong demand for high-end residential and commercial properties in the area including Hangzhou, giving the Group a competitive advantage with long-term growth prospects.
In November 2005, the Group also acquired a land site in Yangzhou, Jiangsu Province. The site has an area of 469,000 square feet and offers a total buildable GFA of 1,032,000square feet for hotel and apartment developments, which are scheduled for completion in 2009.
In December 2005, the Group jointly announced with SA the acquisition of a 634,000 square-feet site in Pudong, Shanghai, to be developed into a mixed-use property comprising hotel, offi ces, serviced suites/serviced apartments, commercial properties and related ancillary facilities. The site is located adjacent to the Shanghai New International Expo Centre. The site is expected to offer an above-ground buildable GFA of 2,476,000 square feet, and is scheduled for completion in 2009. The Group has a 40.8% interest in this joint venture project, for which the Group’s maximum commitment is US$240,720,000 (approximately HK$1,877,616,000).
Based on the new projects mentioned above, the Group acquired four land sites with a total buildable GFA measuring 4.6 million square feet during the year which comprisethe following:
REVIEW OF PROPERTY BUSINESS (Continued)
TOTAL BUILDABLE GFA OF LAND SITES ACQUIRED DURING THE YEAR
Project Location Usage Group’s Interest
Group’s attributable buildable GFAas at 31 December 2005
(sq.ft.)
Manzhouli Apartments/ Commercial
Manzhouli, Inner Mongolia Apartments/Commercial 100% 716,312
Hangzhou Complex Development Hangzhou Apartments/Commercial/ Hotel
100% 1,829,880
Yangzhou Complex Development Yangzhou Apartments/Hotel 100% 1,032,483
Shanghai New International Expo Complex Development
Pudong, Shanghai Offi ce/Apartments/ Commercial/Hotel
40.8% 1,010,094
Total buildable GFA 4,588,769
Management Discussion & Analysis
19
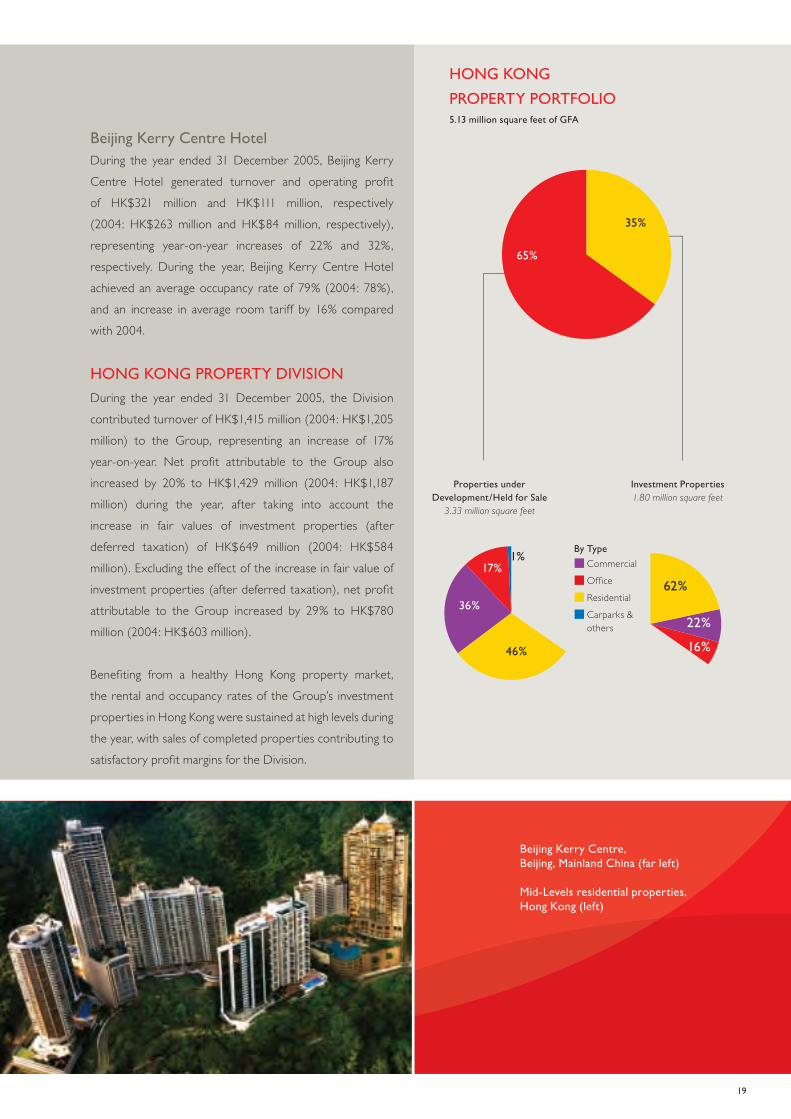
Beijing Kerry Centre,Beijing, Mainland China (far left)
Mid-Levels residential properties, Hong Kong (left)
Beijing Kerry Centre HotelDuring the year ended 31 December 2005, Beijing Kerry Centre Hotel generated turnover and operating profi t of HK$321 million and HK$111 million, respectively (2004: HK$263 million and HK$84 million, respectively), representing year-on-year increases of 22% and 32%, respectively. During the year, Beijing Kerry Centre Hotel achieved an average occupancy rate of 79% (2004: 78%), and an increase in average room tariff by 16% compared with 2004.
HONG KONG PROPERTY DIVISION
During the year ended 31 December 2005, the Division contributed turnover of HK$1,415 million (2004: HK$1,205 million) to the Group, representing an increase of 17% year-on-year. Net profi t attributable to the Group alsoincreased by 20% to HK$1,429 million (2004: HK$1,187 million) during the year, after taking into account the increase in fair values of investment properties (after deferred taxation) of HK$649 million (2004: HK$584 million). Excluding the effect of the increase in fair value of investment properties (after deferred taxation), net profi t attributable to the Group increased by 29% to HK$780 million (2004: HK$603 million).
Benefi ting from a healthy Hong Kong property market, the rental and occupancy rates of the Group’s investment properties in Hong Kong were sustained at high levels during the year, with sales of completed properties contributing to satisfactory profi t margins for the Division.
HONG KONG
PROPERTY PORTFOLIO5.13 million square feet of GFA
Investment Properties1.80 million square feet
Properties under Development/Held for Sale
3.33 million square feet
1%
36%
46%
17%
Carparks & others
CommercialOffi ceResidential
By Type
22%
16%
62%
35%
65%

20
Investment PropertiesThe Group’s premium portfolio of investment properties continue to provide steady income and earnings contributions to the Group. During the year ended 31 December 2005, the Group’s portfolio of investment properties in Hong Kong generated rental turnover of HK$352 million (2004: HK$303 million) and operating profi t of HK$135 million (2004 : HK$111 million).
As at 31 December 2005, the Group held an investment property portfolio in Hong Kong measuring an aggregate GFA of 1.8 million square feet which comprisesthe following:
INVESTMENT PROPERTIES IN HONG KONG
Total GFA (sq.ft.)
Residential 1,117,697
Commercial 391,594
Offi ce 294,460
Total GFA 1,803,751
As at 31 December 2005, the Group’s investment property portfolio of offi ce, commercial and residential properties achieved occupancy rates of 96%, 94% and 93%, respectively (2004 : 93%, 89% and 97%, respectively).
The brand was created to address the Group’s value-added services for tenants of its prestigious residential investment properties. This initiative is currently being replicated throughout the Group’s fast-growing networks in Hong Kong and Mainland China.To extend its service pledge, the Group has introducednew cross-boundary tenant benefi ts and other exclusive lifestyle services.
Sales of Completed PropertiesSales of completed properties during the year ended 31 December 2005 were HK$1,063 million (2004: HK$902 million), representing an increase of 18% year-on-year. The turnover in 2005 was mainly generated from the sales of (i) the remaining residential units at Constellation Cove; (ii) certain units at Tregunter Towers on a strata-title basis; (iii) one luxury residential unit at Branksome Crest, Mid-Levels; (iv) offi ce units at Enterprise Square Three, Kowloon Bay; and (v) the Group’s entire property interests in AXA Centre, an offi ce property in Wanchai. The Division generated operating profi t of HK$516 million from property sales during the year (2004: HK$312 million), which represents an increase of 65% year-on-year.
REVIEW OF PROPERTY BUSINESS (Continued)
15 Homantin Hill Road,Ho Man Tin, Kowloon, Hong Kong (right)
The Ball Atrium of MegaBox*,Kowloon Bay, Hong Kong (far right)
* Artist’s impression
Management Discussion & Analysis

21
Properties under ConstructionEnterprise Square Five is another major grade-A retail, entertainment and offi ce project in the Group’s development blueprint. The development has a planned GFA of 1.6 million square feet, of which 1.1 million square feet have been assigned to accommodate MegaBox, a proprietary family destination and the largest commercial mall in East Kowloon. Pre-leasing activities of MegaBox
commenced in the fourth quarter of 2005, whilst the pre-leasing activities of the offi ce properties of Enterprise Square Five is expected to commence in the third quarter of 2006. With a scheduled completion date of mid-2007, Enterprise Square Five is expected to add further value to the Group’s existing portfolio of quality properties in Kowloon Bay, and will certainly enhance the Group’s presence and profi le in the Kowloon Bay area.
The Group’s high-end residential property project at 15 Homantin Hill Road, Kowloon, is scheduled for completion in the second quarter of 2006. This project will add a further 155,000 square feet of GFA to the Group’s prominent residential portfolio in Hong Kong.
In July 2005, the Group acquired a site in Central Mid-Levels at No. 38 Shelley Street. A residential tower with commercial facilities, measuring an estimated developable GFA of 45,000 square feet, is scheduled for completion at the end of 2007.
Properties under PlanningHong Kong
The redevelopment of No. 5 and No. 9 Yuk Yat Street in To Kwa Wan, Kowloon, progressed further. With thedemolition plan approved by Buildings Department, the demolition work has commenced in March 2006. Construction works are expected to commence in the fourth quarter of 2006, with completion scheduled for the fourth quarter of 2009. The site has a developable GFA of 163,000 square feet and has been earmarked for residential and commercial purposes.

22
The Group has completed its site investigation work in respect of a site located at First Street/Second Street Mid-Levels West, Hong Kong. This 394,000 square-feet residential and commercial development, which is a joint development with the Urban Renewal Authority, is scheduled for completion in the fourth quarter of 2008. This development will become a landmark in the Mid-Levels West which has a well-established neighbourhood of commercial activities as well as élite secondary and tertiary education.
Furthermore, in December 2005, the Group acquired a property with GFA measuring 37,000 square feet, located at 26-30 Des Voeux Road West, Hong Kong for redevelopment purposes.
During the year, the Group paid the land premium for the 398,000 square-feet residential property development project in Kwok Shui Road, Tsuen Wan. Project planning has progressed according to schedule and with commencement of construction in the third quarter of 2006, the project is scheduled for completion by the second quarter of 2009. Furthermore, the Group also paid the land premium for the residential property development project in Ap Lei Chau, in which the Group has a 35% interest. The Group has an attributable share of GFA measuring 320,000 square feet in this development project, which is scheduled for completion by the second quarter of 2009.
MacauNegotiations with the Macau SAR Government on the Group’s land acquisition made further progress during the year. The Group commenced discussions with the Macau SAR Government on the conceptual design for the planned residential development for a maximum GFA of 2,800,000 square feet, and approval is expected to be granted in the coming months.
The residential property development project in Macau has been conceived in line with the Macau SAR Government’s objective of providing a low to medium-density, high-quality living environment in Macau. With Macau’s growing economy and its progressive integration with the Pearl River Delta Region driven by infrastructure investments and positive economic performances, the Group remains optimistic about the future prospects of the property market in Macau.
REVIEW OF PROPERTY BUSINESS (Continued)
First Street/Second Street Project*,Mid-Levels West, Hong Kong (left)
Jacksons Landing, Sydney, Australia (right)
* Artist’s impression
Management Discussion & Analysis

23
OVERSEAS PROPERTY DIVISION
During the year ended 31 December 2005, the Overseas Property Division generated a net profi t to the Group of HK$68 million (2004: HK$27 million). The signifi cant increase in the Group’s share of profi t from this Division is mainly attributable to a reduction in the deferred taxation rate in respect of revaluation gain on investment properties, and the change in fair value of investment properties during the year.
As at 31 December 2005, the Group had an investment property portfolio of 2.34 million square feet (2004: 2.23 million square feet) in the Philippines, and a portfolio of
properties held for development and for sale of 1.8 million square feet (2004: 1.8 million square feet) in Australia and the Philippines.
AustraliaAs at 31 December 2005, sales of 868 units (2004: 837 units) of the Group’s 25%-owned Jacksons Landing project were completed, representing 85% of a total of 1,024 units available for sale. This project, located at the Pyrmont Peninsula in Sydney, covers a site of 12 hectares and is designated for residential and commercial property development.
OVERSEAS PROPERTY PORTFOLIO
Australia (sq.ft.) The Philippines (sq.ft.) Total GFA (sq.ft.)
Investment Properties
Hotel lease - 191,832 191,832
Shopping centre lease - 240,697 240,697
Carpark lease - 211,203 211,203
Shopping centre - 1,191,763 1,191,763
Commercial - 11,316 11,316
Offi ce - 174,522 174,522
Carpark and others - 315,564 315,564
Sub-total - 2,336,897 2,336,897
Properties under Development/Held for Sale
Residential 151,851 1,606,288 1,758,139
Offi ce 35,860 - 35,860
Sub-total 187,711 1,606,288 1,793,999
Total GFA 187,711 3,943,185 4,130,896

24
Shangri-La Plaza Mall,Manila, The Philippines (left)
Lobby of Kerry Residence,Beijing, Mainland China (centre)
Swimming Pool of Branksome Crest,Mid-Levels, Hong Kong (far right)
The PhilippinesThe Group’s investments in property interests in the Philippines continue to be held through its 73.88% aggregate direct and indirect interests in EDSA Properties Holdings Inc. (“EPHI”). EPHI is listed on the Philippines Stock Exchange and holds a 78.72% interest in the Shangri-La Plaza Mall, Manila, and indirect interests in The Enterprise Centre, an offi ce and commercial property in Makati, Manila’s fi nancial district.
As at 31 December 2005, the Shangri-La Plaza Mall reported an occupancy rate of 96% (2004: 98%), whilst the occupancy rate at The Enterprise Centre was 96% (2004: 87%).
The Shang Grand Tower in Manila, in which EPHI holds a 67% benefi cial interest, was completed in the fi rst quarter of 2006. As at 31 December 2005, 84% (2004: 53%) of the units of The Shang Grand Tower was sold. Development of The St. Francis Towers project, which is designed to deliver approximately 1,200 residential units from the project’s two 60-storey towers, is scheduled for completion at the end of 2008.
OUTLOOKMainland ChinaThe year 2005 witnessed a continuation of the Group’s expansion policy into Mainland China’s property market. Despite the State Council’s policies to control overheating in property markets in the metropolitan cities, the Group remains optimistic about Mainland China’s property market in the long term. This is primarily due to the continuing economic growth of Mainland China and the constantly improving living standards of the urban community.
Land reform policies launched by the State Council at the end of 2004 and higher resettlement costs have raised public awareness of the increased protection being afforded by civil rights, which make land clearance more diffi cult and hence result in a more restricted land supply. This will, in turn, lead to greater stability in property prices in the future.
Moreover, the property market in Mainland China will continue to be supported by the increasing level of foreign investments, which generate a continuous demand for quality residential, offi ce and commercial properties. To this end, the Group will maintain its strategy in the development of high-end mixed-use properties in the primary and major secondary cities in order to accommodate the demand from both domestic and foreign users.
REVIEW OF PROPERTY BUSINESS (Continued)
Management Discussion & Analysis

25
Looking ahead, the Group will continue to explore development opportunities in the primary and major secondary cities in Mainland China, which are enjoying economic growth and hence an increasingly affl uent consumer sector. The Group plans to apply its successful business model and established track record which have worked in property developments in Beijing, Shanghai and Shenzhen, so as to take advantage of the new opportunities offered by the major secondary cities.
Hong KongThe Group holds a positive future outlook of the Hong Kong property market, which is reinforced by the growing Hong Kong economy, the stabilized unemployment rate, improved household wealth and affordability, and the expectation of an end to the interest rate hikes in 2006. On the other hand, land supply through the application system with the Hong Kong Government, or by way of private tenders or public auctions, have proceeded in an orderly manner creating a favourable demand and supply dynamics for Hong Kong’s property market.
Despite the recent softening in property sales, the long term prospects for luxury and high-end properties are expected to remain positive. The Directors maintain the view that rental rates and property prices for luxury residences and grade-A offi ces will maintain an upward trend.
Capitalizing on the positive outlook for the property market, the Group will continue to explore development opportunities of high-end properties to uphold the Group’s status as a leading developer of premium properties. Furthermore, as part of the Group’s ongoing marketing strategy, the Group will continue to leverage off its
brand to cover both its existing and future luxury property portfolio.
26
Review of
LOGISTICS BUSINESSAsia Based, China Focus, Global Network.
OVERVIEW
During the year ended 31 December 2005, the Division recorded a turnover of HK$5,541 million which represents a strong growth of 121% when compared with HK$2,502 million in 2004. Profi t attributable to shareholders for the year amounted to HK$1,085 million (2004: HK$438 million). Excluding the effects of the increase in fair values of the warehouse properties, logistics centres and buildings (after deferred taxation) of HK$578 million (2004: nil), profi t for the year attributable to operations amounted to HK$507 million which represents a growth of 16% when compared with 2004 and of which (i) HK$163 million (2004: HK$176 million) was contributed by warehousing operations; (ii) HK$129 million (2004: HK$74 million) was contributed by logistics operations; and (iii) HK$215 million (2004: HK$188 million) was contributed by the Division’s investments in associated companies.
Under the name of Kerry Logistics Network Limited (“Kerry Logistics”), the Division operates a portfolio of warehouses, logistics centres and port facilities of over 16 million square feet and a truck fl eet of over 2,000 vehicles, with operations in more than 150 cities in 13 countries worldwide.
LOGISTICS AND DISTRIBUTIONBeing recognized as a key logistics player in the Asia region, Kerry Logistics strives to strengthen and expand its logistics presence across the world. During the year, the volumes of both air and sea cargoes handled by Kerry Logistics have more than doubled in growth when compared with 2004.
In addition to the ISO9001 quality accreditation which the Division has secured since 1998, during the year, Kerry Logistics’ Hong Kong logistics operation was also proud to be awarded the Technology Asset Protection Association Asia Certifi cation in recognition of its high-value electronic and technology products logistics solutions.
Management Discussion & Analysis

27
In Hong Kong, the Division continued to secure large logistics contracts during the year, including an integrated logistics contract with one of the largest wine distributors in Hong Kong. Meanwhile, the Division also assists some high-end fashion brands and chemical clients in establishing their regional logistics hubs in Hong Kong to support their Asian and Mainland China markets.
The trading arm of the Division, KerryFlex Supply Chain Solutions Limited (“KerryFlex”), demonstrated signifi cant growth in its businesses during the year. Supported by the Division’s infrastructure, KerryFlex has a diverse and sizable customer base ranging from healthcare to catering, and lately to fast-moving grocery establishment. In March 2006, KerryFlex completed the acquisition of a 100% interest in a Hong Kong local company which is engaged in the business of import and distribution of non-perishable products for over 50 years. The acquisition enables KerryFlex to establish its foothold in the food service sector, and paves the way for the Division to participate in procurement projects for hotel chains.
China FocusDuring the year, Kerry Logistics further strengthened its logistics foothold in Mainland China by the acquisition of a 70% equity stake in EAS International Transportation Ltd. (now renamed Kerry EAS Logistics Limited (“KEAS”)), which was completed in January 2005. The acquisition marks an important development in the continuing expansion of Kerry Logistics’ network and creates a strong and valuable platform for growth. The acquisition provides Kerry Logistics with a leading nationwide logistics operation network in Mainland China, serving over 1,100 cities in over 32 provinces with over 120 offi ces, 4,000 staff, 1,500 vehicles and over two million square feet of warehouse and logistics facilities.
The fi rst year of operation following the establishment of KEAS has been a success, where the synergies between Kerry Logistics and KEAS begin to materialize. With the integration of KEAS’s business with Kerry Logistics’ existing operations in Mainland China, the KEAS-Kerry Logistics business combination provides the Division with a pan-China coverage of extensive facility infrastructure. With more than 700 operating licenses in Mainland China, the strengthened China network of Kerry Logistics offers a comprehensive range of high-quality logistics solutions to its existing clients. The new KEAS implements a modern management approach to strengthen its existing operational platform, and to support modern logistics demand of its customers. KEAS also intends to expand to overseas markets and reinforce its business growth by tapping into Kerry Logistics’ global network. Other internal re-engineering programme within the combined operations of KEAS and Kerry Logistics, including the restructuring of management systems, agency network and other overseas businesses, are now underway and are scheduled to be completed by the end of 2006.
During the year, construction of the 173,000 square-feet bonded logistics centre in Tianjin’s Free Trade Zone was completed in October 2005. This facility, located near the biggest container hub in Northern China – Tianjin Xingang, incorporates multi-functional warehouses for general cargoes as well as temperature-controlled cargoes and is the Division’s biggest bonded facility in the Northern China region. Commencement of operation is scheduled in the second quarter of 2006.
The construction of the 269,000 square-feet bonded logistics centre in Shenzhen’s Futian Free Trade Zone is also in progress and is scheduled to be completed by the fi rst half of 2006. Meanwhile, the Division is also exploring the possibility to construct its own logistics facilities in other coastal cities in Mainland China, such as Shanghai and Xiamen.

28
Asia BasedDuring the year, Kerry Siam Seaport Limited (“KSSP”) completed the construction of a 800,000 square-feet Inland Container Depot (“ICD”) in Siam Seaport and obtained the offi cial operating license in July 2005. The ICD, together with the container berth expansion which is under construction and is scheduled for completion by late 2006, will spearhead the Division’s efforts in entering the container cargo handling business, and thereby adding value to its existing conventional and bulk cargo services. The extended facility will enable KSSP to handle a maximum of seven ocean vessels at any point in time. Meanwhile, Kerry Logistics is also exploring the possibility of further expanding its warehousing and logistics operations in Thailand through construction of depots and a nationwide distribution network.
2005 also saw a signifi cant growth of Kerry Logistics’ freight forwarding and logistics operations in Singapore, Malaysia and Indonesia in which Kerry Logistics has a 66.67% interest. These business operations commenced in early 2004, and have since developed into sizable operations in their respective regions.
Global NetworkLeveraged off its growing international network, Kerry Logistics is steadily increasing its geographical presence in the European and the United States markets through acquisitions and strategic alliances with key local players.
During the year, Orion Shipping and Forwarding Limited (“Orion”), one of the leading export freight forwarders in the United Kingdom, joined Kerry Logistics’ growing network of freight operation. Founded and based in the United Kingdom with offi ces in Manchester and Birmingham, Orion provides clients with sea, air and long-haul services together with specialist handling of large-scale project cargoes. The acquisition was completed in August 2005 when Kerry Logistics (UK) Limited (“KLUK”), a 91% subsidiary of Kerry Logistics, acquired a 63.5% interest in Orion. Orion and KLUK will be strategically placed to handle the logistics requirements of Kerry Logistics’ clients in the rapidly expanding Asian markets, particularly Mainland China.
In June 2005, Kerry Logistics entered an exclusive contractual agreement with Lynden International (“Lynden”), a leading freight forwarding company in the United States, to combine the sales and operating resources in North America with those in Asia. Such a partnership offers Kerry Logistics’ customers a comprehensive trans-Pacifi c network of services covering Mainland China and various Asian countries.
REVIEW OF LOGISTICS BUSINESS (Continued)
Management Discussion & Analysis
29
Other infrastructure and logistics centres under construction outside Asia includes the construction of a 88,000 square-feet logistics centre in Australia. The facility is scheduled for completion in early 2007.
WAREHOUSING AND DISTRIBUTION CENTRES — HONG KONGThe Division continues to be the single largest warehouse owner and operator in Hong Kong, with a portfolio of13 warehouses occupying an aggregate GFA of 6.74 million square feet. Through continuous service innovation and quality maintenance, the Division’s warehouse portfolio in Hong Kong achieved an occupancy of 97% as at31 December 2005 (2004: 96%).
The increase in market interest rates during 2005 has led to a drop in the overall demand for warehouse space during the year due to the tighter business control of the customers including a reduction in the levels of inventories, particularly with regard to dangerous goods, bonded cargoes and frozen products. Nevertheless, the Division expects a moderate growth in its warehousing operation in Hong Kong, as the continuous re-development of industrial buildings has reduced the supply of general cargo space in the market.
LOGISTICS INFRASTRUCTURE AND ASSOCIATED COMPANIES The Division’s logistics infrastructure investments continue to enjoy satisfactory growth. During the year, Chiwan Container Terminal (“CCT”) and Asia Airfreight Terminal (“AAT”) made very good progress and contributed a steady source of recurrent earnings to the Division.
AAT, being one of the two air cargo terminals located at the Hong Kong International Airport and in which Kerry Logistics has a 15% interest, handled an increased cargo volume throughput of 579,000 tons during the year (2004: 551,000 tons).
2005 was also a record year for CCT, in which Kerry Logistics has a 25% interest. With the construction of new berths and continuous improvement in its operational effi ciency, CCT’s volume throughput reached 3.6 million TEUs (Twenty-Foot Equivalent Units) in 2005. CCT, which is located on the eastern side of the Pearl River Delta in Shekou, Shenzhen, is considered to be one of the most cost-competitive terminals in the Pearl River Delta region.
During the year, the Division’s equity share of profi ts after tax from CCT and AAT and other associated companies amounted to HK$215 million (2004: HK$188 million).
30
INFORMATION TECHNOLOGY
To facilitate the Division’s growth in the higher-end supply chain solutions market, a new initiative “KerrierVISION” was introduced in the second half of 2005 to address the gap between the outsourcing of supply chain management services and the provision of third party logistics services.
“KerrierVISION” is an application platform on top of the existing “Kerrier” family of operational systems. It provides comprehensive visibility throughout the pipeline from both goods and costs perspectives. In addition, the events management engine can orchestrate proactive supply chain management in terms of monitoring control and execution. It enables an accurate and timely decision-makingprocess through the use of business intelligence information facilities. “KerrierVISION” will continue to be the top priority for the Division’s information technology initiatives in the coming year to ensure the Division’s leading position in the logistics market.
In terms of emerging technology, the Division has been working closely with the “Hong Kong R&D Center for Logistics & Supply Chain Management Enabling Technology” on the latest technological developments such as Radio Frequency Identifi cation (RFID), supply chain modelling and industry-specifi c solutions. We are confi dent that Kerry Logistics will continue to maintain its leading position in applying technology in the logistics industry.
In Mainland China, the fi rst phase of the Kerrier Freight Management System (“KerrierFMS”) Enhancement Project was completed during the year. Further enhancement will continue to be made to fi t the business requirements of KEAS. In addition, a reorganization of KEAS’s Beijing Headquarters’ information technology initiatives was also carried out, which will help KEAS’s Beijing Headquarters to demonstrate a more dominant role in the management and development of information technology for application to the logistics industry in Mainland China.
AWARDS AND ACHIEVEMENTS In November 2005, Kerry Logistics was the winner of two major awards in the fi rst Logistics Awards Hong Kong 2005 – namely, the Local (Hong Kong) Logistics Award and the Mainland Logistics (non-SME) Award. Organized by the Hong Kong Trade Development Council and four other renowned local trade associations, the awards recognized and rewarded Kerry Logistics’ outstanding services in the logistics industry in Hong Kong and Mainland China.
REVIEW OF LOGISTICS BUSINESS (Continued)
Management Discussion & Analysis
31
In Mainland China, KEAS was also the winner of several awards in 2005 in recognition of its outstanding performance in air freight, express and logistics services. KEAS was also certifi ed as a “5A” Integrated Logistics Services Company by China Federation of Logistics & Purchasing. KEAS now ranks 7th amongst the top 100 international freight forwarding companies in Mainland China, and ranks 9th amongst the top 50 logistics companies in Mainland China (in terms of turnover in 2004).
OUTLOOK
Leveraging off the strengthened capabilities of the new KEAS, going forward, the Division aims to further reinforce its logistics competitiveness in Mainland China by extending its supply chain management services, further exploring the import and export markets, strengthening its infrastructure, developing its information system and operational expertise, as well as consolidating the Mainland China operations with its overseas agency network. Meanwhile, the Division will also continue to enhance the communication and coordination between its operations in Hong Kong and in Mainland China, in order to provide quality and ‘one-stop-shop’ services to customers on a pan-China scale. On the other hand, the Division will continue to capitalize on the fast-expanding trade between Mainland China and the rest of the world, following the opening up of Mainland China’s logistics market to foreign ownership since late 2005.
Besides the Mainland China market, in view of the continuing consolidation with key players in the global logistics industry, the international logistics and freight forwarding market is expected to undergo rapid changes and increasing competition in the years to come. To cope with these changes, the Division will speed up its globalization process by strengthening its overseas sales network, particularly in the United States, Europe and Australia, in order to maintain Kerry Logistics’ competitiveness with the major global logistics operators worldwide.

32
Review of
INFRASTRUCTUREBUSINESSViable Projects, Environmental Focus,Community Contribution.
OVERVIEW
The Infrastructure Division invests in a range of infrastructure, environmental protection, utilities and energy-related projects in Hong Kong and Mainland China. Through such investments, the Division aims to contribute towards the improvement of the living environment and living standards of the community, as well as the delivery of a steady stream of recurrent income to the Group. During the year ended 31 December 2005, the Division generated net profi t attributable to the Group of HK$38 million(2004: HK$31 million).
HONG KONG
In Hong Kong, the Group has a 15% interest in theWestern Harbour Crossing and a 15% interest in the Cross Harbour Tunnel management contract. The Group’s share of net profi ts from these investments amounted to HK$41 million for the year ended 31 December 2005 (2004: HK$31 million).
MAINLAND CHINADue to the increasing awareness and concerns of the community towards health standards and the quality of life and the increasing demand for energy resources by the community, the Group focuses its investments on environmental protection, utilities and energy-related projects.
Management Discussion & Analysis

33
On 28 February 2005, the Standing Committee of the National People’s Congress endorsed the Renewable Energy Law. The new law, which became effective on 1 January 2006, establishes a platform for the extensive development of renewable energy projects, particularly for commercial uses. Taking into account the market environment and capitalizing on the benefi ts of new policy incentives, the Division continues to focus on projects in three infrastructure areas: water treatment, sewage treatment and municipal solid-waste treatment (including waste-to-energy facilities).
In December 2004, the Group announced its investment in a water treatment project in Hohhot Municipality, Inner Mongolia Autonomous Region. Together with Chemquest (Overseas) Limited (“Chemquest”), a Kuok Group company with a strong and proven background in operating environmental engineering projects across Asia, the Group entered into a 50/50 joint venture known as Kerry CQ JV Environmental Engineering Limited, which has a 26.01% effective interest in a project company engaged in the ownership, operation and maintenance of certain water treatment facilities in Hohhot Municipality. Accordingly, the Group has an effective 13% interest in this project. The maximum total investment amount by Kerry CQ JV Environmental Engineering Limited in this project is RMB143 million (equivalent to approximately HK$138 million), of which the Group’s share is RMB71.5 million (equivalent to approximately HK$69 million). The project commenced commercial operation on 19 October 2005.
In February 2005, the Group tendered for a greenfi eld project to build and operate the fi rst solid waste management facilities in Changzhou, Jiangsu Province. Again, together with Chemquest, the Group entered into a 51/49 joint venture in the establishment of Kerry CQ Waste Incineration Limited which in turn has a 45% interest in a project company, with the remaining 55% interest being held by Golden State Holding Group Corporation and Beijing Golden State Engineering Co., Ltd.. Subsequent to the tender, the project company was chosen by the Changzhou Municipal Government for exclusive negotiation of a concession
agreement. If the terms of the investment are acceptable to the project company as a result of the ongoing negotiations, the project will be undertaken on a build-operate-transfer (BOT) basis, which comprises the building and operation of one of the most advanced incinerator systems in Mainland China.
In August 2005, the Group invested a 25% interest in REDtone Telecommunications (China) Limited (“REDtone China”), which carries out the business operations in Mainland China of REDtone International Bhd., a leading discount telecommunication calls provider in Malaysia. REDtone China plans to invest HK$58.5 million in developing and expanding its operations in the Mainland China market by collaborating with China TieTong Telecommunications Corporation Shanghai Branch Company, in the provision of long-distance, domestic and international discount call packages to mobile phone and fi xed-line subscribers. The Group’s share of investment amount in REDtone China is HK$14.625 million. Capitalizing on the proven success of the business model, experience and expertise of REDtone International Bhd. in Malaysia and the Group’s working knowledge of the Mainland China market, excellent synergies are being offered by the REDtone China joint venture in strengthening the Group’s presence in Mainland China’s telecommunications market.
OUTLOOK
Going forward, the Division will continue to identify and evaluate investment opportunities in commercially viable projects in the utilities, energy recycling and environmental protection-related sectors in Mainland China which will generate strong recurrent income for the Group. In doing so, the Group will leverage off its working knowledge of the Mainland China market and capitalize on the skills and expertise of technical project partners, thereby optimizing fi nancial returns to the Group.

Management Discussion & Analysis
FINANCIAL REVIEW
The Group has centralized funding for all its operationsat the Group level where foreign exchange exposure isalso reviewed and monitored. This policy also achieves better control of treasury operations and lower average cost of funds.
Foreign exchange exposure for the Group is small relative to its total asset base. As at 31 December 2005, total foreign currency borrowings (excluding Renminbi (RMB) borrowings) amounted to the equivalence of HK$652 million and RMB loans amounted to the equivalence of HK$202 million. Therefore, non-RMB total foreign currency borrowings and RMB loans represented approximately 6% and 2%, respectively, of the Group’s total borrowings of HK$11,748 million as at 31 December 2005.
Out of the Group’s total borrowings as at 31 December 2005, HK$1,017 million (representing approximately 9%) was repayable within one year, HK$4,214 million (representing approximately 36%) was repayable within two years, HK$6,514 million (representing approximately 55%) was repayable between three to fi ve years and HK$3 million (representing less than 1%) was repayable over fi ve years. The Group continued to maintain most of its borrowings on an unsecured basis, with unsecured debt accounting for approximately 98% of total borrowings as at 31 December 2005. The Group will continue to obtain fi nancing on an unsecured basis whenever possible, and supplement such borrowings with secured project fi nancing as and when the need arises.
As at 31 December 2005, the gearing ratio for the Group was 36%, based on net debt of HK$9,184 million and shareholder’s equity of HK$25,221 million.
The majority of the Group’s borrowings bear interest costs which are based on fl oating interest rates. As at 31 December 2005, the Group had outstanding interest rate swap contracts which amounted to HK$5.8 billion in total, enabling the Group to hedge its interest rate exposure and to have a more stable interest rate profi le over the next few years.
On 8 April 2005, Wise Insight Finance Limited, a wholly-owned subsidiary of the Company, issued convertible bonds in the aggregate principal amount of HK$2,500,000,000 (the “Convertible Bonds”). The Convertible Bonds are zero coupon-based, have a maturity term of 5 years and are convertible into the Company’s ordinary shares at a conversion price of HK$25.955 per share (subject to adjustments). The issue of the Convertible Bonds provides a fl exible and cost-effi cient funding opportunity which is in the best interest of the Group. Upon conversion of the Convertible Bonds, the capital base of the Company will be enlarged and strengthened which will benefi t the Group’s future growth and developments. On 8 April 2005, Standard & Poor’s awarded the Convertible Bonds with a “BBB-” credit rating.
In terms of the Group’s available fi nancial resources as at 31 December 2005, the Group had total undrawn bank loan and overdraft facilities of HK$3,750 million and net cash on hand of HK$2,564 million. In addition, the generation of strong recurrent cashfl ows from the Group’s investment property portfolio, hotel operation, and logistics, freight forwarding and warehousing businesses provides the Group with a strong fi nancial position, and enables the Group to reap the benefi ts of investment opportunities as and when they arise.
34

The Directors consider that the Group’s property investments in Mainland China benefi t from the upward revaluation of the RMB by 2%, which was announced by the People’s Bank of China in July 2005. Furthermore, the upward revaluation of the RMB has a negligible impact on the Group’s RMB loans, which only represent a very small proportion relative to the Group’s total borrowings.
On 27 June 2005, Standard & Poor’s reaffi rmed a“BBB-” credit rating for Kerry Properties Limited with a stable outlook.
The Group signed a syndicated loan agreement on 27 February 2006 for an unsecured HK$6 billion revolving loan facility. The interest rate for this facility is HIBOR (Hong Kong Interbank Offered Rate) plus 29 basis points. This facility is for general corporate funding requirements of the Group including refi nancing of a previous HK$4.5 billion syndicated loan facility obtained in January 2002. The facility was launched on 27 February 2006, with participations received from 18 reputable international and local banks and fi nancial institutions.
35
36
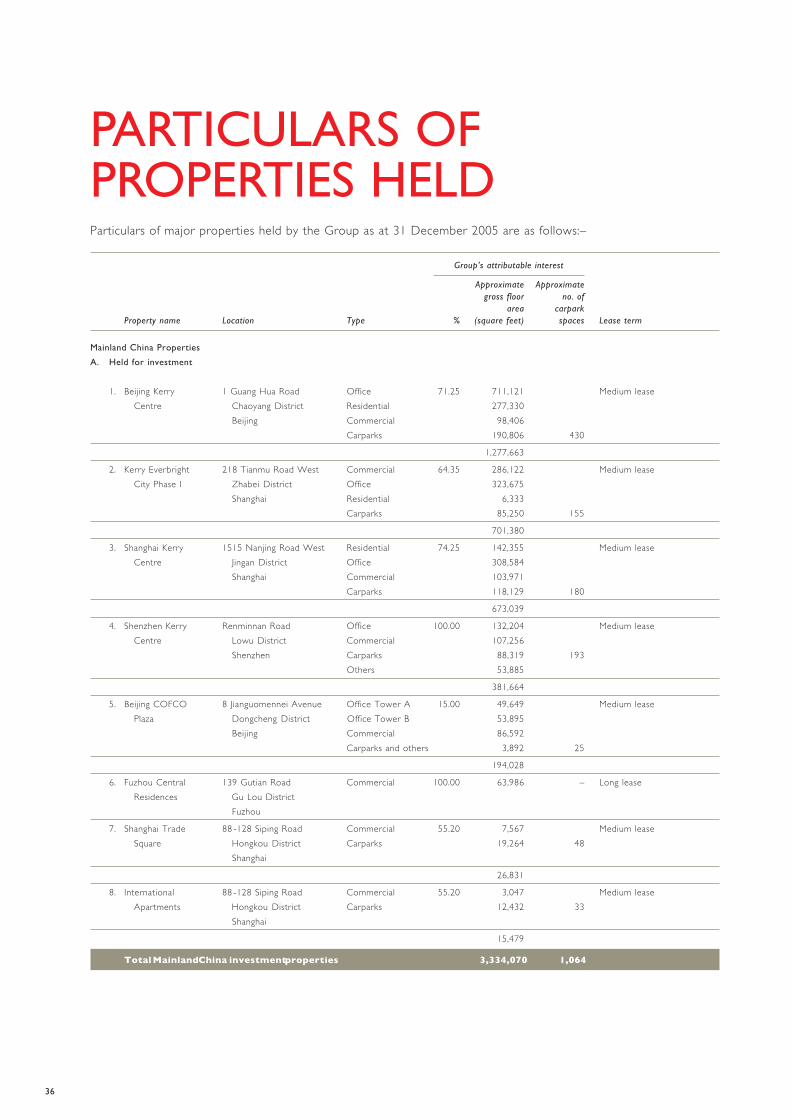
PARTICULARS OFPROPERTIES HELDParticulars of major properties held by the Group as at 31 December 2005 are as follows:–
Group’s attributable interest
Approximate Approximategross floor no. of
area carparkProperty name Location Type % (square feet) spaces Lease term
Mainland China Properties
A. Held for investment
1. Beijing Kerry 1 Guang Hua Road Office 71.25 711,121 Medium leaseCentre Chaoyang District Residential 277,330
Beijing Commercial 98,406Carparks 190,806 430
1,277,663
2. Kerry Everbright 218 Tianmu Road West Commercial 64.35 286,122 Medium leaseCity Phase I Zhabei District Office 323,675
Shanghai Residential 6,333Carparks 85,250 155
701,380
3. Shanghai Kerry 1515 Nanjing Road West Residential 74.25 142,355 Medium leaseCentre Jingan District Office 308,584
Shanghai Commercial 103,971Carparks 118,129 180
673,039
4. Shenzhen Kerry Renminnan Road Office 100.00 132,204 Medium leaseCentre Lowu District Commercial 107,256
Shenzhen Carparks 88,319 193Others 53,885
381,664
5. Beijing COFCO 8 Jianguomennei Avenue Office Tower A 15.00 49,649 Medium leasePlaza Dongcheng District Office Tower B 53,895
Beijing Commercial 86,592Carparks and others 3,892 25
194,028
6. Fuzhou Central 139 Gutian Road Commercial 100.00 63,986 – Long leaseResidences Gu Lou District
Fuzhou
7. Shanghai Trade 88 -128 Siping Road Commercial 55.20 7,567 Medium leaseSquare Hongkou District Carparks 19,264 48
Shanghai
26,831
8. International 88 -128 Siping Road Commercial 55.20 3,047 Medium leaseApartments Hongkou District Carparks 12,432 33
Shanghai
15,479
Total Mainland China investment properties 3,334,070 1,064
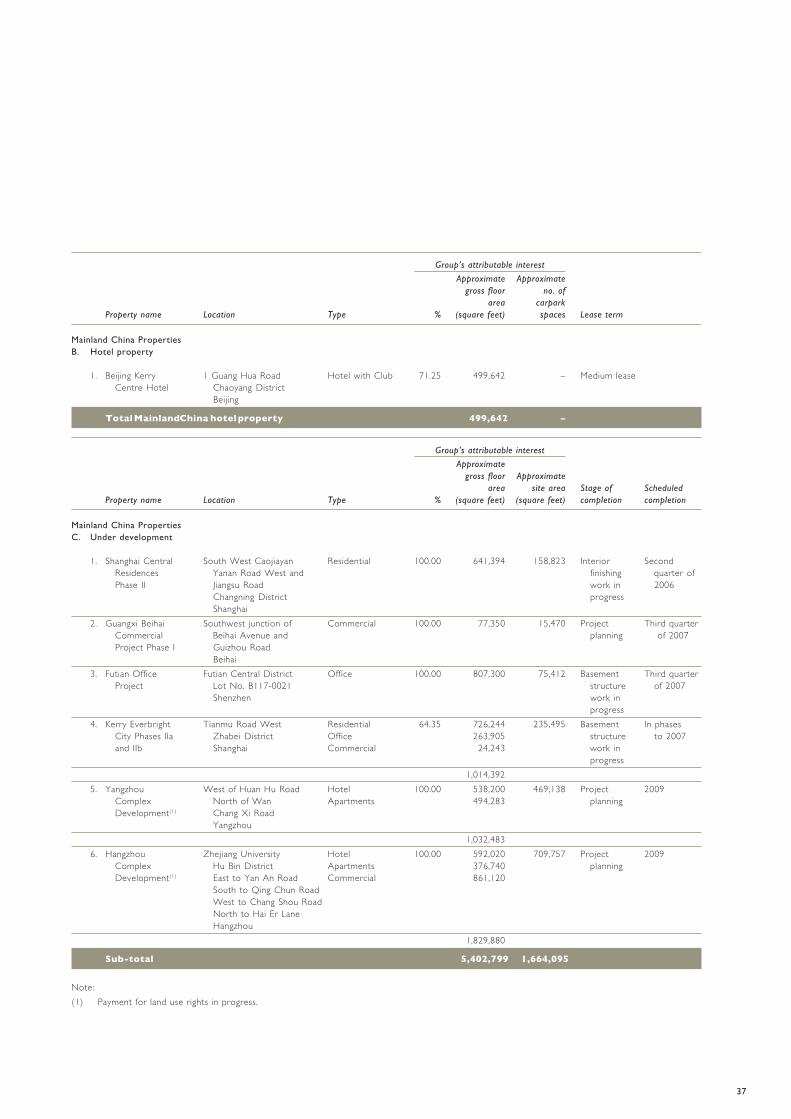
37
Group’s attributable interest
Approximate Approximategross floor no. of
area carparkProperty name Location Type % (square feet) spaces Lease term
Mainland China PropertiesB. Hotel property
1. Beijing Kerry 1 Guang Hua Road Hotel with Club 71.25 499,642 – Medium leaseCentre Hotel Chaoyang District
Beijing
Total Mainland China hotel property 499,642 –
Group’s attributable interest
Approximategross floor Approximate
area site area Stage of ScheduledProperty name Location Type % (square feet) (square feet) completion completion
Mainland China PropertiesC. Under development
1. Shanghai Central South West Caojiayan Residential 100.00 641,394 158,823 Interior SecondResidences Yanan Road West and finishing quarter ofPhase II Jiangsu Road work in 2006
Changning District progressShanghai
2. Guangxi Beihai Southwest junction of Commercial 100.00 77,350 15,470 Project Third quarterCommercial Beihai Avenue and planning of 2007Project Phase I Guizhou Road
Beihai3. Futian Office Futian Central District Office 100.00 807,300 75,412 Basement Third quarter
Project Lot No. B117-0021 structure of 2007Shenzhen work in
progress4. Kerry Everbright Tianmu Road West Residential 64.35 726,244 235,495 Basement In phases
City Phases IIa Zhabei District Office 263,905 structure to 2007and IIb Shanghai Commercial 24,243 work in
progress1,014,392
5. Yangzhou West of Huan Hu Road Hotel 100.00 538,200 469,138 Project 2009Complex North of Wan Apartments 494,283 planningDevelopment(1) Chang Xi Road
Yangzhou1,032,483
6. Hangzhou Zhejiang University Hotel 100.00 592,020 709,757 Project 2009Complex Hu Bin District Apartments 376,740 planningDevelopment(1) East to Yan An Road Commercial 861,120
South to Qing Chun RoadWest to Chang Shou RoadNorth to Hai Er LaneHangzhou
1,829,880
Sub-total 5,402,799 1,664,095
Note:(1) Payment for land use rights in progress.

38
PARTICULARS OF PROPERTIES HELD (Continued)
Group’s attributable interestApproximate
gross floor Approximatearea site area Stage of Scheduled
Property name Location Type % (square feet) (square feet) completion completion
Mainland China PropertiesC. Under development (continued)
7. Shanghai New Adjacent to the Hotel 40.80 412,821 258,672 Project 2009International Shanghai New Apartments 65,876 planningExpo Complex International Expo Centre Commercial 136,143Development(2) West to Fangdian Road Office 395,254
North to Huamu RoadPudong New AreaShanghai
1,010,0948. Manzhouli Liu Dao Street Apartments 100.00 627,444 322,920 Project In phases
Apartments/ Manzhouli City Commercial 88,868 planning to 2009Commercial Inner Mongolia
716,3129. Jingan Complex 1238 Yanan Zhong Road Hotel 51.00 413,079 252,501 Project In phases
Development(3) 1288 Yanan Zhong Road Office 417,213 planning to 20101537 Nanjing Xi Road Apartments 262,8711565 Nanjing Xi Road Commercial 224,351
Jingan DistrictShanghai
1,317,514
Sub-total 3,043,920 834,093
Total Mainland China properties under development 8,446,719 2,498,188
Group’s attributable interestApproximate Approximate
gross floor no. ofarea carpark
Property name Location Type % (square feet) spaces Lease term
Mainland China PropertiesD. Completed and held for sale
1. Arcadia Court 1008 Haitian Road Residential 100.00 15,540 551 Long leaseFutian District Commercial 4,608Shenzhen
20,1482. Fuzhou Central 139 Gutian Road Residential 100.00 5,989 122 Long lease
Residences Gu Lou DistrictFuzhou
3. Shanghai Central 1038 Hua Shan Road Residential 100.00 1,577 65 Long leaseResidences Changning DistrictTower 5 Shanghai
Total Mainland China properties completed and held for sale 27,714 738
Notes:(2) Approval from independent shareholders for the project was obtained on 16 February 2006. Payment for land use rights in progress.(3) Application of land use certificate in progress.

39
Group’s attributable interestApproximate
site areaProperty name Location Type % (square feet)
Mainland China PropertiesE. Held for future development
1. Changchun Industrial Site Southeast junction of Pudong Road Industrial 65.00 699,660 (4)
and Dongsheng AvenueChangchun
2. Kerry Everbright City Tianmu Road West Residential/ 64.35 115,384Phase III Zhabei District Commercial
Shanghai3. Guangxi Beihai Site Southwest junction of Beihai Avenue Office/ 100.00 102,934
Phase II and Guizhou Road CommercialBeihai
Total Mainland China properties held for future development 917,978
TOTAL MAINLAND CHINA PROPERTY PORTFOLIO 13,226,123
Note:(4) Agreement was signed on 23 July 2003 for the disposal of the site. Sale is pending completion.

40
PARTICULARS OF PROPERTIES HELD (Continued)
Group’s attributable interest
Approximate Approximategross floor no. of
area carparkProperty name Location Type % (square feet) spaces Lease term
Hong Kong PropertiesA. Held for investment
I. Residential
1. Branksome Grande 3 Tregunter Path Residential 100.00 257,372 73 Long leaseMid-LevelsHong Kong
2. Tregunter Towers 14 Tregunter Path Residential 100.00 245,539 76 Medium to long lease1 & 2 Mid-Levels
Hong Kong3. Aigburth 12 Tregunter Path Residential 100.00 204,940 63 Long lease
Mid-LevelsHong Kong
4. Branksome Crest 3A Tregunter Path Residential 100.00 160,463 129 Long leaseMid-LevelsHong Kong
5. Belgravia 57 South Bay Road Residential 100.00 122,353 75 Medium leaseRepulse BayHong Kong
6. Tavistock 10 Tregunter Path Residential 100.00 104,460 24 Long leaseMid-LevelsHong Kong
7. 111 High Street 111 High Street Residential 100.00 20,270 – Long leaseSai Ying PunHong Kong
8. Gladdon 3 May Road Residential 100.00 2,300 14 Long leaseMid-LevelsHong Kong
9. Central Park and MTR Olympic Station Carparks 32.50 – 238 Medium leasePark Avenue at 18 Hoi Ting RoadOlympian City Kowloon
10. Island MTR Olympic Station Carparks 20.00 – 116 Medium leaseHarbourview at 11 Hoi Fai RoadOlympian City Kowloon
Sub-total 1,117,697 808

41
Group’s attributable interest
Approximate Approximategross floor no. of
area carparkProperty name Location Type % (square feet) spaces Lease term
Hong Kong PropertiesA. Held for investment (continued)
II. Commercial
1. Olympian City 2 MTR Olympic Station Commercial 32.50 170,016 64 Medium leaseat Olympian City 18 Hoi Ting Road
Kowloon2. Citibank Plaza 3 Garden Road Commercial 10.16 4,289 (5) 55 Medium lease
Citibank Central Office 10.16 86,109 (5) –Tower – 34/F, Hong Kong Office 100.00 52,656 (5) 336/F & 37/F
143,0543. Enterprise Square 9 Sheung Yuet Road Commercial 100.00 41,242 26 Medium lease
Kowloon Bay Office 81,919Kowloon
123,1614. Auto Plaza 65 Mody Road Commercial 100.00 95,847 980 Long lease
Tsimshatsui Office 10,350Kowloon
106,1975. Hollywood Centre 233 Hollywood Road Commercial 45.00 10,008 – Long lease
Sheung Wan Office 30,482Hong Kong
40,4906. Harbour Centre 25 Harbour Road Commercial 15.00 6,135 (6) 43 Long lease
Wanchai Office 32,944 (5)
Hong Kong39,079
7. Olympian City 1 MTR Olympic Station Commercial 20.00 27,986 89 Medium leaseat Olympian City 11 Hoi Fai Road
Kowloon8. Enterprise 39 Wang Chiu Road Commercial 100.00 19,800 – Medium lease
Square Three Kowloon BayKowloon
9. South Seas Centre 75 Mody Road Commercial 100.00 9,555 – Long lease– Various portions Tsimshatsui
Kowloon10. Belair Monte 3 Ma Sik Road Commercial 8.00 3,820 – Medium lease
Area 19Luen Wo HuiFanlingNew Territories
11. Wing On Plaza 62 Mody Road Commercial 10.00 2,896 – Long leaseTsimshatsuiKowloon
Sub-total 686,054 1,260
Total Hong Kong investment properties 1,803,751 2,068
Notes:(5) Being lettable floor area.(6) Being net floor area.

42
PARTICULARS OF PROPERTIES HELD (Continued)
Group’s attributable interest
Approximategross floor Approximate
area (7) site area Stage of ScheduledProperty name Location Type % (square feet) (square feet) completion completion
Hong Kong Properties
B. Under development
1. Ho Man Tin 15 Homantin Hill Road Residential 100.00 155,000 26,078 Finishing SecondResidential Project Ho Man Tin work in quarter of
Kowloon progress 2006
2. Enterprise Wang Chiu Road Commercial 100.00 1,188,575 135,562 Superstructure SecondSquare Five Kowloon Bay Office 407,956 work in quarter of
Kowloon Carparks 37,187 progress 2007
1,633,718
3. Shelley Street 38 Shelley Street Residential/ 100.00 45,404 4,419 Foundation FourthProject Mid-Levels Commercial work quarter of
Hong Kong in progress 2007
4. Urban Renewal First Street/Second Street Residential/ 100.00 393,880 38,062 Conceptual FourthAuthority Project Sai Ying Pun Commercial design stage quarter ofH20 Hong Kong 2008
5. Des Voeux Road 26 -30 Des Voeux Road West Residential/ 100.00 37,165 4,663 Conceptual FourthWest Project Sheung Wan Commercial design stage quarter of
Hong Kong 2008
6. Tsuen Wan 152-160 Residential/ 100.00 397,988 78,577 Conceptual SecondResidential Kwok Shui Road Commercial design stage quarter ofProject New Territories 2009
7. Ap Lei Chau Praya Road Residential/ 35.00 319,663 63,179 Conceptual SecondResidential Ap Lei Chau Commercial design stage quarter ofProject Hong Kong 2009
8. To Kwa Wan 5 and 9 Yuk Yat Street Residential/ 100.00 163,333 19,358 Conceptual FourthResidential To Kwa Wan Commercial design stage quarter ofProject Kowloon 2009
Total Hong Kong properties under development 3,146,151 369,898
Note:(7) Subject to final Hong Kong SAR Government approval plans and documentations.

43
Group’s attributable interest
Approximate Approximategross floor no. of
area carparkProperty name Location Type % (square feet) spaces Lease term
Hong Kong PropertiesC. Completed and held for sale
1. Enterprise 39 Wang Chiu Road Office 100.00 144,900 144 Medium leaseSquare Three Kowloon Bay
Kowloon2. Constellation 1 Hung Lam Drive Residential 75.00 8,033 9 Medium lease
Cove Tai Po Commercial 5,550New Territories
13,5833. Richwood Park 33 Lo Fai Road Commercial 50.00 7,893 – Medium lease
Tai PoNew Territories
4. Central Park at MTR Olympic Station Residential 32.50 4,595 – Medium leaseOlympian City 18 Hoi Ting Road
Kowloon5. Park Avenue at MTR Olympic Station Residential 32.50 3,802 – Medium lease
Olympian City 18 Hoi Ting RoadKowloon
6. Residence Oasis MTR Hang Hau Station Residential 40.00 1,916 85 Medium leaseTseung Kwan OKowloon
7. The Cliveden 98 Route Twisk Residential 50.00 1,368 76 Medium leaseTsuen WanNew Territories
8. Island Harbourview MTR Olympic Station Residential 20.00 1,011 – Medium leaseat Olympian City 11 Hoi Fai Road
Kowloon9. Valverde 11 May Road Carparks 100.00 – 24 Long lease
Mid-LevelsHong Kong
10. Tavistock II 10A Tregunter Path Carparks 100.00 – 15 Long leaseMid-LevelsHong Kong
11. Enterprise 3 Sheung Yuet Road Carparks 100.00 – 6 Medium leaseSquare Two Kowloon Bay
Kowloon12. Camellia Court 3 Yu Tai Road Carparks 100.00 – 2 Medium lease
FanlingNew Territories
Total Hong Kong properties completed and held for sale 179,068 361
TOTAL HONG KONG PROPERTY PORTFOLIO 5,128,970
Macau Properties
The ownership of the Macau property has not been stated in detail, pending the finalization of land exchange for an alternative residential plot of land,accommodating a total gross floor area of a maximum of approximately 2,800,000 square feet.

44
PARTICULARS OF PROPERTIES HELD (Continued)
Group’s attributable interest
Approximate Approximategross floor no. of
area carparkProperty name Location Type % (square feet) spaces Lease term
Overseas Properties
A. Held for investment
1. Land leased to EDSA corner Shaw Blvd. Hotel lease 73.88 (8) 191,832 (9) – FreeholdEDSA Shangri-La Mandaluyong CityHotel Philippines
2. Land leased to EDSA corner Shaw Blvd. Shopping centre 73.88 (8) 240,697 (9) – FreeholdShangri-La Mandaluyong City leasePlaza Mall Philippines
3. Land for open EDSA corner Shaw Blvd. Carparks and 73.88 (8) 211,203 (9) 160 Freeholdcarparks Mandaluyong City others
Philippines
643,732 (9)
4. Shangri-La EDSA corner Shaw Blvd. Shopping centre 58.15 (10) 1,191,763 350 FreeholdPlaza Mall Mandaluyong City
Philippines
5. The Enterprise Ayala Avenue Office 17.38 (11) 174,522 FreeholdCentre cor Paseo de Roxa Commercial 11,316
Makati City Carparks and 88,894 193Philippines others
274,732
6. Carpark Building EDSA corner Shaw Blvd. Carparks 73.88 (8) 226,670 525 FreeholdMandaluyong CityPhilippines
Total overseas investment properties 2,336,897 1,228
Notes:(8) Including attributable interest of 34.76% held through Philippine Deposit Receipts.(9) Being site area.(10) Including attributable interest of 27.36% held through Philippine Deposit Receipts.(11) Including attributable interest of 8.18% held through Philippine Deposit Receipts.

45
Group’s attributable interest
Approximate
gross floor Approximate
area site area Stage of Scheduled
Property name Location Type % (square feet) (square feet) completion completion
Overseas Properties
B. Under development
1. Distillery Stage 2a Bowman Street Residential 25.00 8,130 3,229 Finishing First quarterJacksons Landing Pyrmont work in of 2006
Sydney progressAustralia
2. The Shang Grand DelaRosa corner Residential 49.61 (12) 380,693 15,246 Finishing First quarterTower Nieva and Perea St. work in of 2006
Legaspi Village progressMakati CityPhilippines
3. The St. Francis St. Francis St. corner Residential 73.88 (8) 1,225,595 49,079 Substructure Fourth quarterTowers Internal Road work in of 2008
Shangri-La Complex progressMandaluyong CityPhilippines
4. Various precincts, Lot 94, DP 868828 Residential 25.00 131,294 43,118 Design and In phasesJacksons Landing Pyrmont Office 34,983 concept to 2009
Sydney planningAustralia stage
166,277
Total overseas properties under development 1,780,695 110,672
Note:(12) Including attributable interest of 23.39% held through Philippine Deposit Receipts.
Group’s attributable interest
Approximate Approximategross floor no. of
area carparkProperty name Location Type % (square feet) spaces Lease term
Overseas Properties
C. Completed and held for sale
1. Distillery Stage 1 Bowman & Jones Streets Residential 25.00 12,427 FreeholdJacksons Landing Pyrmont Office 877 4
SydneyAustralia
Total overseas properties completed and held for sale 13,304 4
TOTAL OVERSEAS PROPERTY PORTFOLIO 4,130,896
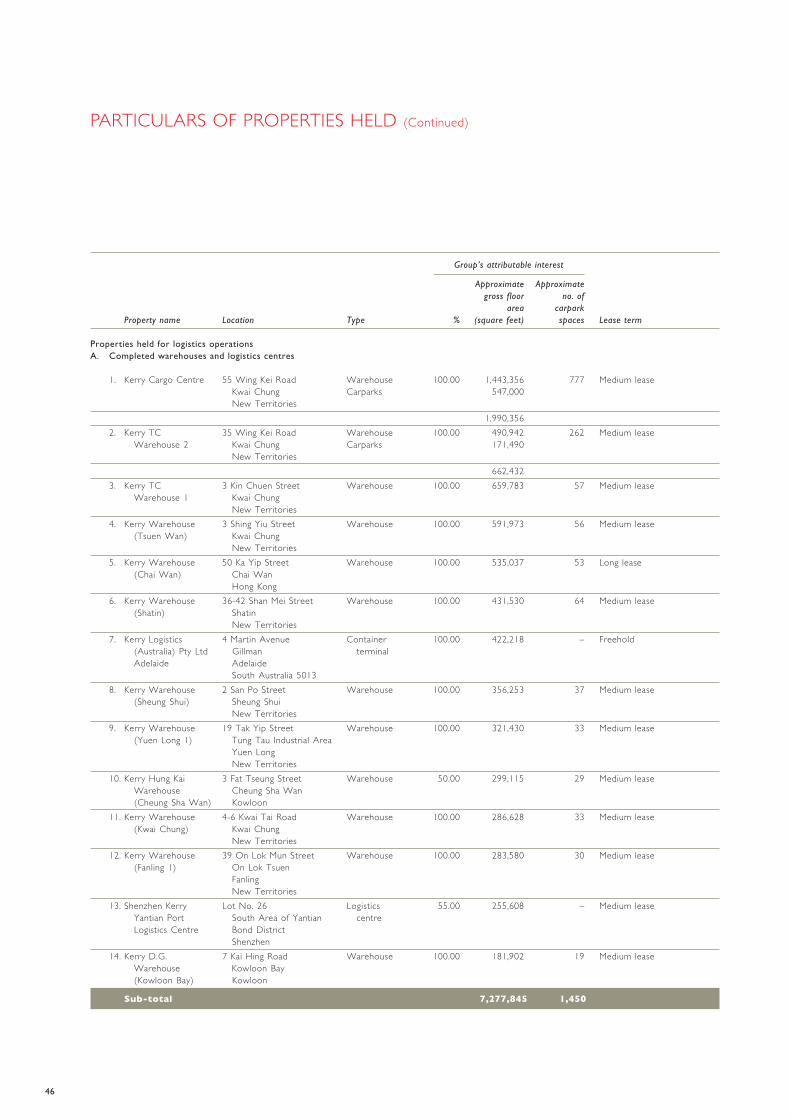
46
PARTICULARS OF PROPERTIES HELD (Continued)
Group’s attributable interest
Approximate Approximategross floor no. of
area carparkProperty name Location Type % (square feet) spaces Lease term
Properties held for logistics operationsA. Completed warehouses and logistics centres
1. Kerry Cargo Centre 55 Wing Kei Road Warehouse 100.00 1,443,356 777 Medium leaseKwai Chung Carparks 547,000New Territories
1,990,3562. Kerry TC 35 Wing Kei Road Warehouse 100.00 490,942 262 Medium lease
Warehouse 2 Kwai Chung Carparks 171,490New Territories
662,4323. Kerry TC 3 Kin Chuen Street Warehouse 100.00 659,783 57 Medium lease
Warehouse 1 Kwai ChungNew Territories
4. Kerry Warehouse 3 Shing Yiu Street Warehouse 100.00 591,973 56 Medium lease(Tsuen Wan) Kwai Chung
New Territories5. Kerry Warehouse 50 Ka Yip Street Warehouse 100.00 535,037 53 Long lease
(Chai Wan) Chai WanHong Kong
6. Kerry Warehouse 36-42 Shan Mei Street Warehouse 100.00 431,530 64 Medium lease(Shatin) Shatin
New Territories7. Kerry Logistics 4 Martin Avenue Container 100.00 422,218 – Freehold
(Australia) Pty Ltd Gillman terminalAdelaide Adelaide
South Australia 50138. Kerry Warehouse 2 San Po Street Warehouse 100.00 356,253 37 Medium lease
(Sheung Shui) Sheung ShuiNew Territories
9. Kerry Warehouse 19 Tak Yip Street Warehouse 100.00 321,430 33 Medium lease(Yuen Long 1) Tung Tau Industrial Area
Yuen LongNew Territories
10. Kerry Hung Kai 3 Fat Tseung Street Warehouse 50.00 299,115 29 Medium leaseWarehouse Cheung Sha Wan(Cheung Sha Wan) Kowloon
11. Kerry Warehouse 4-6 Kwai Tai Road Warehouse 100.00 286,628 33 Medium lease(Kwai Chung) Kwai Chung
New Territories12. Kerry Warehouse 39 On Lok Mun Street Warehouse 100.00 283,580 30 Medium lease
(Fanling 1) On Lok TsuenFanlingNew Territories
13. Shenzhen Kerry Lot No. 26 Logistics 55.00 255,608 – Medium leaseYantian Port South Area of Yantian centreLogistics Centre Bond District
Shenzhen14. Kerry D.G. 7 Kai Hing Road Warehouse 100.00 181,902 19 Medium lease
Warehouse Kowloon Bay(Kowloon Bay) Kowloon
Sub-total 7,277,845 1,450

47
Group’s attributable interest
Approximate Approximategross floor no. of
area carparkProperty name Location Type % (square feet) spaces Lease term
Properties held for logistics operations
A. Completed warehouses and logistics centres (continued)
15. Kerry Tianjin 168 Jinbinda Road Logistics 100.00 172,885 – Medium leaseLogistics Centre Baoshui District centre
Tianjin PortTianjin
16. Kerry Waigaoqiao Lot No. F20-3 Logistics 100.00 152,698 – Medium leaseLogistics Centre Waigaoqiao Free Trade Zone centre
PudongShanghai
17. Kerry Warehouse 23 Yip Cheong Street Warehouse 100.00 137,738 10 Medium lease(Fanling 2) On Lok Tsuen
FanlingNew Territories
18. Laem Chabang Highway No. 7 Logistics 71.00 128,484 – FreeholdLogistics Centre (Bypass Laem Chabang) centre
Nong-kham Sub-DistrictSriracha DistrictChonburi ProvinceThailand
19. Beijing Tianzhu 18 Tianzhu Road Logistics 70.00 136,221 – Medium leaseLogistics Centre Area A centre
Beijing Tianzhu AirportIndustrial ZoneShunyi DistrictBeijing
20. Kerry BHL Logistics 1 South Road Jia Logistics 50.00 64,584 – Medium leaseFourth Ring Road East centreBeijing
21. Beijing Shunyi Block 1 to 24 Logistics 70.00 33,174 – Medium leaseDistrict Logistics Jinmi Road East centreCentre (formerly known as
Tianzhu Village)Shunyi DistrictBeijing
Sub-total 825,784 10
Total completed warehouses and logistics centres 8,103,629 1,460

48
PARTICULARS OF PROPERTIES HELD (Continued)
Group’sattributable interest
Approximategross floor
areaProperty name Location Type % (square feet) Lease term
Properties held for logistics operations
B. Port facility
1. Kerry Siam Seaport 113/1 Moo Port 54.98 1,940,125 Freehold1 Silo RoadTungsukhaSriracha DistrictChonburi ProvinceThailand
Total port facility 1,940,125
Group’s attributable interest
Approximate Approximategross floor no. of
area carparkProperty name Location Type % (square feet) spaces Lease term
Properties held for logistics operations
C. Office property
1. EAS Building 21 Xiao Yun Road Office 70.00 104,727 – Medium leaseChaoyang DistrictBeijing
Total office property 104,727 –
Group’s attributable interest
Approximategross floor Approximate
area site area Stage of ScheduledProperty name Location Type % (square feet) (square feet) completion completion
Properties held for logistics operations
D. Logistics centres under development
1. Futian Logistics Lot No. B105-77-1 Logistics centre 51.00 137,190 54,876 Renovation Mid 2006Centre Futian Free Trade Zone work in
Shenzhen progress
2. Australia Logistics 4 Martin Avenue Logistics centre 100.00 88,232 202,288 Construction Early 2007Centre Gillman in progress
AdelaideSouth Australia 5013
Total logistics centres under development 225,422 257,164
TOTAL PORTFOLIO OF PROPERTIES HELD FOR LOGISTICSOPERATIONS 10,373,903

49
CORPORATE SOCIALRESPONSIBILITY REPORTCORPORATE RESPONSIBILITY
The Group strongly believes that it has a responsibility to bequeath a better environment to future generations. The Group formulates such policies and adopts such initiatives to ensure that its operations are as environmentally friendly as possible.
To steer the Group’s green policies and activities, an Environmental Committee was established by the Company during the year. All the Group’s employees are involved in environmental initiatives as far as practicable. The Group was also appointed as the Eco-Action Champion of Eco-Pages 2005 for its commitment to balance the need for operating as a profi table business and meeting environmental concerns.
During 2005, the Group supported a number of charitable community initiatives. In particular, the Group made corporate donations and encouraged employees contributions to several programmes organized by the Red Cross, Community Chest, Habitat for Humanity, the Children’s Heart Foundation and various green groups.
PROPERTY DEVELOPMENT AND MANAGEMENT
Working together with its contractors, the Group incorporates strict environmental criteria in the planning, design, construction and commissioning of its property developments.
As part of its effort to develop environmentally-responsible projects, the Group takes into account such design considerations for the purpose of ensuring proper building orientation, enabling the infl ow of natural daylight without
excessive solar gain, and utilizing natural ventilation with optimum air fl ow and weather protection. Other aspects affecting a building’s micro-climate, such as pollution dispersal, are also key parameters in the Group’s approach to building designs.
To be in harmony with the environment, the Group strives to minimize resource depletion and the use of construction processes that have an adverse environmental impact. Care has also been taken in the selection of materials, based on a balance between construction time frame, cost and re-use or suitability for re-cycling.
Furthermore, the Group manages its properties with care and with the goal of providing highly liveable green environments. The Group pursues this objective by creating space for attractive and desirable landscapes, as well as involving residents in a range of re-cycling, planting and outdoor activities and charity sales.
The abovementioned green initiatives are extended to the community at large through the reduction of the impact of the Group’s properties on the environment. As a result of these ongoing activities, the Group have won numerous Quality Building Management Awards for its property portfolio.
49
50
LOGISTICS OPERATIONS
To fulfi l its responsibilities as a corporate citizen, Kerry Logistics has been sponsoring the Hong Kong Invention Association and its activities since April 2005 in terms of facilities and logistics support.
In November 2005, Kerry Logistics participated in Operation Santa Claus in Hong Kong to help build a giant Christmas tree made of canned food in Central, Hong Kong, as emergency food assistance for those in need. Kerry Logistics offered free logistics services in collecting some 20,000 cans of food from local corporations and schools for the construction of the Christmas tree.
In December 2005, Kerry Logistics also sponsored the Action Asia Challenge Hong Kong, which was an event to raise funds for the mentally handicapped and under-privileged children. Kerry Logistics offered free logistics support for the entire event, including the delivery of water, ropes, life jackets and tire tubes.
Environmental protection was one of the major initiatives under Kerry Logistics’ corporate social responsibility programme in 2005. As part of this initiative, Kerry Logistics aims to promote awareness of environmental protection and energy conservation for its staff members, and to support protection of the world’s scarce resources and the building of a greener supply chain service for its customers.
INFRASTRUCTURE INVESTMENTS
The Group’s concern for sustainability was further pursued through selective investments in waste management and water treatment facilities in Mainland China. The Group believes that such investments will help balance the growing need for economic development with the environmental interests of both present and future generations.
STAFF PARTICIPATION
The Group sponsors and encourages all staff members to participate in community programmes and environmental initiatives, whilst actively promoting greater environmental awareness among them. Internally, the Group has implemented a number of measures to encourage re-cycling, which thereby reduces the consumption of resources and saves energy.
50

51
2005
AWARDS
2005 HKMA BEST ANNUAL REPORTS AWARDS
We were delighted to be selected as one of the winners, and was awarded the Citation for Achievement in Corporate Governance and Honourable Mention by The Hong Kong Management Association (HKMA) in the 2005 HKMA Best Annual Reports Awards. This annual competition is organised to encourage the publication of accurate, informative, well-presented and timely annual reports.
Our 2004 Annual Report was commended for its General Presentation, which refl ected the Company’s vision and mission. The design and presentation of our annual report was noted for its achievements in ‘engaging, inspiring and attracting investors and shareholders as well as addressing other interested parties’.
This prestigious industry event was organized by the Hong Kong Trade Development Council and four other renowned local trade associations. The awards acknowledged Kerry Logistics’ outstanding services in the logistics industry in Hong Kong and Mainland China.
ECO-ACTION CHAMPION
The Group was named an Eco-Action Champion for 2005 by the Hong Kong Sustainable Communications Association in recognition of our environmental commitment. As an Eco-Action Champion, we contribute to the building of a sustainable future by taking an active role in environmental protection and organising green programmes.
During the year, we had the honour of receiving a number of awards in recognition of our services and contributions to the community.
The management discussion and analysis section in our report also won a special mention for excellence for the “General Description of Business” category. According to the panel of judges, the winning reports ‘provided operational and fi nancial reviews of very high standard’ and ‘highlighted and gave good attention to relevant information regarding key businesses, including their activities, objectives, performance, management and work practice.’
LOGISTICS AWARDS
HONG KONG 2005
Kerry Logistics continues to gain recognition for its superb services and innovation, as evidenced in two major awards — the Local (Hong Kong) Logistics Award and the Mainland Logistics (non-SME) Award — in the fi rst Logistics Awards Hong Kong 2005.
52
CORPORATEGOVERNANCE REPORT
Focus and Principles Corporate Governance Practices
1. Directors1.1 The Board
Corporate Governance StatementThe Company has always recognized the importance of shareholders’ transparency and accountability. It is the beliefof the Board that shareholders can maximize their benefits from good corporate governance. Long before theissuance of Code on Corporate Governance Practices (the “Code”) by The Stock Exchange of Hong Kong Limited,the Company has taken the initiative to disclose its corporate governance practices in the annual reports andaccounts commencing from the financial year ended 31 December 2000. Essentially, the Code adopts a two-tierapproach: (a) code provisions; and (b) recommended best practices, and requires the inclusion of a corporategovernance report in a listed issuers’ annual report. As far as the Code is concerned, the Company complies with allaspects of the code provisions except for the one regarding the separation of roles of chairman and chief executiveofficer which, in the Company’s opinion, would not be appropriate for adoption by the Company with furtherexplanations as set out below.
The following sections set out how the principles under the Code have been complied with by the Company duringthe financial year ended 31 December 2005.
1. The Board is responsible for the leadership and control of the Companyand oversees the Group’s businesses, strategic directions and financialperformance. It sets the Company’s values and standards and ensures thatits obligations to the Company’s shareholders are understood and met. Tothis end, it assumes responsibility for strategy formulation, corporategovernance and performance monitoring. The management was delegatedauthority and responsibility by the Board for the management of the Groupwithin the control and authority framework set by the Board. In addition,the Board has also delegated various responsibilities to the RemunerationCommittee, the Audit Committee and the Finance Committee. Furtherdetails of these committees are set out in this annual report.
2. The Board has four scheduled meetings a year and meets more frequentlyas and when required. During the financial year ended 31 December 2005,the Board held five meetings and the attendance record, on a named basis,is set out in the table on page 64 of this annual report. Proposed Boardmeeting dates for a financial year are agreed in the preceding year’s Boardmeeting.
3. Board minutes kept by the Company Secretary are sent to the Directorsfor records and are open for inspection by the Directors.
4. The Company has arranged appropriate insurance cover for the Directors.

53
1. The Board has appointed a Chairman who has executive responsibilitiesand who provides leadership to the Board in terms of establishing policiesand business directions. The Chairman ensures that the Board workseffectively and discharges its responsibilities, and that all key and appropriateissues are discussed by the Board in a timely manner. The Board alsocomprises Independent Non-executive Directors who bring strongindependent judgement, knowledge and experience to the Board’sdeliberations. Apart from their appointments as Independent Non-executiveDirectors, none of them has any form of service contract with the Companyor any of its subsidiaries. The Board also comprises a Non-executive Directorwho brings financial and accounting knowledge and experience to the Board.In addition, each Executive Director is delegated individual responsibility tooversee and monitor the operations of a specific business unit, and toimplement the strategies and policies set by the Board. As noted below,the majority of the Audit Committee members and the RemunerationCommittee members are Independent Non-executive Directors. Thisstructure ensures that the independence of views and opinions expressedby the Directors at the Audit Committee and Remuneration Committeemeetings.
2. Acting as the Chairman of the Board, Mr Ang Keng Lam leads the Boardand ensures all Directors are properly briefed on issues to be discussed atBoard meetings.
3. After due consideration, the Board proposed not to comply with the codeprovision requiring the separation of the role of Chairman and ChiefExecutive Officer for reason that each Executive Director of the Companyis delegated individual responsibility to oversee and monitor the operationsof a specific business unit, and to implement the strategies and policies setby the Board. The Company’s Chairman also ensures that the Board workseffectively and discharges its responsibilities, and that all key and appropriateissues are discussed by the Board in a timely manner. In addition, theCompany’s Independent Non-executive Directors bring along strongindependence element to the Board’s deliberation.
4. Accordingly, the Board operates in a functional manner with clearly definedobjectives, strategies and responsibilities. Therefore, the Board considersthat the separate appointment of Chairman and Chief Executive Officer isnot necessary.
Focus and Principles Corporate Governance Practices
1.2 Division of Responsibilities

54
CORPORATE GOVERNANCE REPORT (Continued)
1. The Board currently comprises four Executive Directors, three IndependentNon-executive Directors and one Non-executive Director.
2. The Executive Directors are Messrs Ang Keng Lam (Chairman), Wong SiuKong (Deputy Chairman and Managing Director), Ho Shut Kan and MaWing Kai, William and the Independent Non-executive Directors are MessrsWilliam Winship Flanz, Lau Ling Fai, Herald and Christopher Roger Moss,O.B.E.. Mr Tse Kai Chi is the Non-executive Director. The Board membershave no financial, business, family or other material/relevant relationshipswith each other. Such balanced board composition, coupled with the strongindependent element, is over and above the recommended practice underthe Code for the Board to have at least one-third in number of its Boardmembers comprising Independent Non-executive Directors. The biographiesof the Directors are set out on pages 70 to 71 of this annual report, whichdemonstrate a diversity of skills, expertise, experience and qualifications.
3. Mr Lau L i n g F a i , He ra l d , who was fo rmer l y a pa r tne r o fPricewaterhouseCoopers (the external auditors of the Company) until hisretirement on 30 June 2001, became an Independent Non-executive Directorof the Company on 1 December 2003 which was a date falling on twoyears after his retirement from PricewaterhouseCoopers.
4. The Company has received annual confirmation of independence from thethree Independent Non-executive Directors in accordance with Rule 3.13of the Listing Rules. The Board has assessed their independence andconcluded that all the Independent Non-executive Directors are independentwithin the definition of the Listing Rules.
1. During the year, formal appointment letters have been signed with eachNon-executive Director of the Company. Under the appointment letters,the Non-executive Directors will be appointed for a period of three yearsfrom the date of his appointment/last re-election.
2. At the Annual General Meeting of the Company held on 26 April 2005,amendments to the Company’s Bye-laws were approved by the Company’sshareholders pursuant to which each Director shall retire from office nolater than the third annual general meeting of the Company after he waslast elected or re-elected (i.e. the term of appointment of each Director iseffectively three years).
3. Pursuant to Bye-laws 102(A) and (B), each Director appointed to fill acasual vacancy or as an additional Director is subject to re-election at thenext annual general meeting following his appointment.
Focus and Principles Corporate Governance Practices
1.3 Board Composition
1.4 Directors’ Appointment,Re-election andRemoval

55
Focus and Principles Corporate Governance Practices
4. The Company has not established a nomination committee. New Directorsare sought mainly through referrals or internal promotion. In evaluatingwhether an appointee is suitable to act as a Director of the Company, theBoard of Directors will review the independence, experience and skills ofthe appointee as well as personal ethics, integrity and time commitment ofthe appointee. Appointment of a new Director requires the unanimousapproval of the Board members.
5. During the year, Mr Tse Kai Chi was appointed as the Non-executiveDirector of the Company.
1. The Directors are continual ly updated with legal and regulatorydevelopments, business and market changes and development of theCompany to facilitate them in discharging their responsibilities.
2. The Independent Non-executive Directors take an active role in Boardmeetings, contribute to the development of strategies and policies andmake sound judgement in various aspects. They will take lead when potentialconflicts of interest arise. They are also members of various Boardcommittees and devote sufficient amount of time and attention to theaffairs of the Company. Their attendance record, on a named basis, duringthe financial year ended 31 December 2005 is set out in the table on page64 of this annual report.
3. The Board has adopted the Model Code for Securities Transactions byDirectors of Listed Issuers as set out in Appendix 10 of the Listing Rules asthe code for securities transactions by Directors of the Company (the“Securities Dealing Code”). The Directors have confirmed compliance withthe required standards set out in the Securities Dealing Code throughoutthe financial year ended 31 December 2005 and for the period up to thelatest practicable date prior to the publication of this annual report.
1. All Directors receive a regular supply of information about the businessactivities, financial highlights and operations review of the Group so thatthey are up-to-date and are well-informed prior to participation in Boardmeetings.
2. The Board members are supplied with comprehensive board papers andrelevant materials within a reasonable period of time in advance of theintended meeting date (in any event no less than 3 days before the date ofthe meeting), including business and financial reports covering the Group’sprincipal business activities.
3. To facilitate the decision-making process, the Directors are free to haveaccess to the management for enquiries and to obtain further information,when required.
4. All Directors have unrestricted access to the advice and services of theCompany Secretary, who ensures that the Board receives appropriate andtimely information for its decision-making and that Board procedures arebeing followed. The Directors can obtain independent professional adviceat the Company’s expense.
1.5 Responsibilities of Directors
1.6 Supply of and Access to
Information

56
CORPORATE GOVERNANCE REPORT (Continued)
Remuneration Committee1. The Company established the Remuneration Committee in February 1997
with the Independent Non-executive Directors constituting the majority ofthe committee. The chairman of the Remuneration Committee is theChairman of the Board and the other members comprise the DeputyChairman of the Board and all the three Independent Non-executiveDirectors of the Company. The list of members of the RemunerationCommittee can be found in the section headed “Corporate Information &Key Dates” of this annual report.
2. During the year, the Board reviewed the terms of reference of theRemuneration Committee and has made relevant amendments toaccommodate the requirements of the Code, where appropriate. The termsof reference of the Remuneration Committee are published in the Company’swebsite www.kerryprops.com.
3. The Remuneration Committee has primary responsibility for makingrecommendations for approval by the Board with respect to matters relatingto the remuneration of the Executive Directors of the Company. Themajor responsibilities of the Remuneration Committee are:–i) to make recommendations on the Company’s policies and structure
for all the remuneration of the Executive Directors;ii) to propose the specific remuneration packages of the Executive
Directors, and to make recommendations on the remuneration of theNon-executive Directors for the Board’s approval;
iii) to review and propose performance-based remuneration for ExecutiveDirectors by reference to corporate goals and objectives resolved bythe Board from time to time; and
iv) to administer and make determinations with regard to the Company’sshare option scheme.
4. The Remuneration Committee met twice during the financial year ended31 December 2005 and the attendance record, on a named basis, is set outin the table on page 66 of this annual report. Details of the work performedby the Remuneration Committee during the year are set out in the“Remuneration Committee Report” on page 68 of this annual report.
5. When the remuneration package of an individual Director is under review,such Director will abstain from voting.
6. During the year, the Board approved all the recommendations of theRemuneration Committee.
Focus and Principles Corporate Governance Practices
2. Remuneration of Directors

57
Remuneration package for Executive Directors1. The remuneration for the Executive Directors comprises basic salary,
discretionary bonus, pensions and share options.2. Salaries are reviewed annually. Salary increases are made where the
Remuneration Committee believes that adjustments are appropriate to reflectthe performance, contribution and increased responsibilities of each ExecutiveDirector and/or by reference to market/sector trends.
3. In addition to basic salary, Executive Directors and employees of theCompany and its subsidiaries are eligible to receive a discretionary bonustaking into consideration factors such as market conditions as well ascorporate and individual performances.
4. As part of the compensation of the Executive Directors and in order toattract, retain and motivate executives and key employees serving anymembers of the Group or other persons contributing to the Group, theCompany has adopted the 1997 Share Option Scheme (which was terminatedon 17 April 2002 in respect of grant of further options) and the 2002 ShareOption Scheme. Such incentive schemes enable the eligible persons toobtain an ownership interest in the Company and thus will motivate themto optimize their contributions to the Group.
5. Details of the amount of Directors’ emoluments during the financial yearended 31 December 2005 are set out in note 12(b) to the financialstatements of this annual report. Details of the 1997 Share Option Schemeand the 2002 Share Option Scheme by the Company are set out in theDirectors’ Report and note 34 to the financial statements of this annualreport.
Focus and Principles Corporate Governance Practices
3. Accountability and Audit3.1 Financial Reporting 1. The Board is responsible for the preparation of the financial statements. In
preparing the financial statements, the generally accepted accounting standardsin Hong Kong have been adopted, appropriate accounting policies havebeen used and applied consistently, and reasonable and prudent judgementsand estimates have been made. The external auditors have a primaryresponsibility for auditing and reporting on the financial statements and theAuditors’ Report to the shareholders is included in this annual report.
2. Towards the end of 2005, the Board has reviewed the financial projectionsof the Group in respect of the five financial years ending 31 December2010. On the basis of this review, the Board is not aware of any materialuncertainties relating to events or conditions which may cast significantdoubt over the Group’s ability to continue as a going concern. Accordingly,the Board has continued to adopt the going concern basis in preparing thefinancial statements.

58
CORPORATE GOVERNANCE REPORT (Continued)
1. The Board is responsible for maintaining an adequate system of internalcontrols within the Group and for reviewing their effectiveness. The systemof internal control is designed to facilitate effective and efficient operations,to safeguard assets and to ensure the quality of internal and external reportingand compliance with applicable laws and regulations. In devising internalcontrols, the Group has given regard to the nature and extent of theGroup’s business, operational and financial risks, the likelihood of crystallizationof such risks and the costs of implementing the relevant internal controls.The internal controls are designed to manage, but not eliminate, the risk offailure to achieve business objective and can only provide reasonable, andnot absolute, assurance against the risks of material misstatement, fraud orlosses.
2. During the year ended 31 December 2005, the Board, through the AuditCommittee, has reviewed the risks and evaluated the internal controlframework that operates within the Group and considered that the systemof internal controls in operation in the Group is effective.
3. More details on the Group’s internal control framework and the Board’sprocess to evaluate the Group’s system of internal controls is set out in thesection headed “Internal Controls” on page 69 of this annual report.
Focus and Principles Corporate Governance Practices
3.2 Internal Controls
3.3 Audit Committee 1. The Audit Committee of the Board was established in December 1998 andcurrently comprises two Independent Non-executive Directors and the Non-executive Director of the Company, who among themselves possess awealth of financial and accounting experience in the accounting profession,finance and commercial sectors. The list of members of the Audit Committeecan be found in the section headed “Corporate Information & Key Dates”of this annual report.
2. During the year, the Board reviewed the terms of reference of the AuditCommittee and has made relevant amendments to accommodate therequirements of the Code, where appropriate. The terms of reference ofthe Audit Committee are publ ished in the Company’s websi tewww.kerryprops.com.

59
4. Delegation by the Board4.1 Management Functions
4.2 Board Committees
3 The major responsibilities of the Audit Committee are:–i) to make recommendations with respect to the appointment,
reappointment and removal of the Company’s external auditors, andto evaluate their independence and objectivity and the effectiveness ofthe audit process;
ii) to review and monitor the interim and annual consolidated financialstatements, reports and accounts of the Company, and to reviewsignificant and judgemental financial reporting issues contained therein;
iii) to review the Company’s financial controls, internal controls and riskmanagement systems; and
iv) to discuss with the management the system of internal controls, andto ensure that the management has discharged its duties andresponsibilities in implementing an effective internal control system.
4. The Audit Committee met four times during the financial year ended 31December 2005 and the attendance record, on a named basis, is set out inthe table on page 65 of this annual report. Details of the work performedby the Audit Committee during the year are set out in the “Audit CommitteeReport” on page 67 of this annual report.
Focus and Principles Corporate Governance Practices
During the financial year ended 31 December 2005, the fees paid/payable to theauditors in respect of audit and non-audit services provided by the auditors tothe Group were as follows:–
Nature of services AmountHK$
Audit services 6,168,912Non-audit services(i) Tax services 1,901,830(ii) Due Diligence 1,247,301(iii) Other services 519,333
3.4 Auditors’ Remuneration
The day-to-day running of the Company is delegated to the management, withdivisional heads responsible for different aspects of the Group’s businesses.In addition to delegating specific responsibilities to the Audit Committee (seeparagraph 3.3 above) and the Remuneration Committee (see paragraph 2 above),the Board established the Finance Committee in August 1996 with delegatedauthority for reviewing and approving certain financial matters of the Group.Currently, the Finance Committee comprises the Chairman, the Deputy Chairmanand an Executive Director of the Company, and it deals with matters such asthe investment of surplus funds, undertakings, determination and approval ofinvestment acquisitions and disposals, arrangement of banking facilities andapproval of guarantees and indemnities within designated limits.

60
CORPORATE GOVERNANCE REPORT (Continued)
Communication channelsIn order to develop and maintain a continuing investors’ relationship programmewith the Company’s shareholders, the Company has established various channelsof communication with its shareholders:–i) Shareholders can raise any comments on the performance and future
directions of the Company with the Directors at the annual general meeting.ii) Press and analysts’ conferences are held at least twice a year subsequent to
the interim and final results announcements, at which the Executive Directorsare available to answer questions regarding the Group’s operational andfinancial performances.
iii) The Company also avails itself of opportunities to communicate and explainits strategies to shareholders and the investor community, through activeparticipation at investors’ conferences and regular meetings with financialanalysts, fund managers and potential investors. In particular, the Companyparticipated in a number of roadshows and investors’ conferences organizedby various investment banks during 2005, as a move to enhance the Group’srelationship with the investor community and its understanding of the Group’soperations and developments.Set out below are the roadshows and investors’ conferences in which theGroup participated during 2005:–
Date Event Organiser Venue
January 2005 Asian Company ABN AMRO London/Boston/Conference New York
March 2005 Asian Investment Credit Suisse Hong KongConference First Boston
July 2005 JP Morgan JP Morgan New York/Non-Deal Boston/London/Roadshow Edinburgh
November 2005 Morgan Stanley Morgan Stanley SingaporeAsia PacificSummit
The Group plans to continue to deepen its investors’ relationship byparticipating in future roadshows and conferences.
iv) The Company’s website at www.kerryprops.com contains importantcorporate information, biographical details of the Directors and seniormanagement, organization structure, annual and interim reports, majorhistorical developments with comprehensive and user-friendly informationabout the Group, as well as announcements and circulars issued by theCompany in order to enable the Company’s shareholders and the investorcommunity to have timely access to updated information about the Group.
v) Shareholders and members of the investor community are welcome to raiseenquiries through our Corporate Communications Department, whosecontact details are available in the Company’s website www.kerryprops.comand as stated in the section headed “Corporate Information & Key Dates”of this annual report.
Focus and Principles Corporate Governance Practices
5. Communication with Shareholders5.1 Investor Relations
61
General meetings1. The general meeting provides a forum for the Board to communicate with
the shareholders of the Company. Shareholders holding not less than one-tenth of the paid-up capital of the Company may deposit a requisition toconvene a special general meeting and state the purpose therefor at theCompany’s registered office in Bermuda at Canon’s Court, 22 Victoria Street,Hamilton HM12, Bermuda.
2. To facilitate enforcement of shareholders’ rights, significant issues are dealtwith under separate resolutions at general meetings.
3. The Chairman of the Board is available at annual general meetings to answerquestions raised by shareholders or other parties. The chairman of theCompany’s independent board committee (if any) is also present to answerquestions at any general meeting which is convened to approve a connectedtransaction or any other transaction that is subject to independentshareholders’ approval.
4. The 2005 annual general meeting of the Company was held on 26 April2005 at Atrium Room, Level 39, Island Shangri-La Hotel, Pacific Place II,Supreme Court Road, Central, Hong Kong. The following resolutions werepassed at the meeting:–(a) To adopt the audited accounts and the reports of the Directors and
the auditors for the financial year ended 31 December 2004;(b) To declare a final dividend for the financial year ended 31 December
2004;(c) To re-elect Mr William Winship Flanz , the retiring Director;(d) To fix Directors’ fees;(e) To re-appoint PricewaterhouseCoopers as auditors and to authorise
the Directors of the Company to fix their remuneration;(f) (i) To grant a general mandate to the Directors of the Company to
allot, issue and deal with additional shares not exceeding 20% ofthe issued share capital of the Company as at the date of passingthe resolution;
(ii) To grant a general mandate to the Directors of the Company torepurchase shares in the share capital of the Company notexceeding 10% of the issued share capital of the Company as atthe date of passing the resolution; and
(iii) To extend, conditional upon the above resolution No. (f)(ii) beingduly passed, the general mandate to allot shares by adding aggregatenominal amount of the repurchased shares to the 20% generalmandate; and
(g) To approve the amendments to the Bye-laws of the Company.
Focus and Principles Corporate Governance Practices

62
CORPORATE GOVERNANCE REPORT (Continued)
Focus and Principles Corporate Governance Practices
5. Voting by poll - Procedures and requirementsThe Company follows the requirements under the new Listing Rules (whichbecame effective on 31 March 2004) in its circulars convening a generalmeeting to contain the procedures for and the rights of shareholders todemand a poll in compliance with Rule 13.39(4). The relevant resolutionregarding the procedures on voting by poll has been passed at the Company’sannual general meeting held on 26 April 2005.In accordance with Bye-law 70 of the Company’s Bye-laws, a resolution putto the vote of a general meeting shall be decided on a show of hands, but apoll may be demanded (before or on the declaration of the result of theshow of hands or on the withdrawal of any other demand for a poll):–(i) by the Chairman of the meeting; or(ii) by at least three shareholders present in person or by duly authorised
corporate representative or by proxy for the time being entitled tovote at the meeting; or
(iii) by any shareholder or shareholders present in person or by dulyauthorised corporate representative or by proxy and representing notless than one-tenth of the total voting rights of all the shareholdershaving the right to vote at the meeting; or
(iv) by any shareholder or shareholders present in person or by dulyauthorised corporate representative or by proxy and holding shares inthe Company conferring a right to vote at the meeting being shares onwhich an aggregate sum has been paid up equal to not less than one-tenth of the total sum paid up on all the shares conferring that right.
In addition, according to Bye-law 70A of the Company’s Bye-laws,notwithstanding any other provisions of the Company’s Bye-laws:-(a) if the aggregate proxies held by (i) the Chairman of a particular meeting,
and (ii) the Directors, account for 5% or more of the total votingrights at that meeting, and
(b) if on a show of hands in respect of any resolution, the shareholders atthe meeting vote in the opposite manner to that instructed in theproxies referred to in (a) above,
the Chairman of the meeting and/or any Director holding the proxiesreferred to above shall demand a poll. However, if it is apparent from thetotal proxies held by the persons referred to in (a) above that a vote takenon a poll will not reverse the vote taken on a show of hands, then no pollshall be required.

63
Focus and Principles Corporate Governance Practices
5.2 Shareholder Information An analysis of the shareholders of the Company as at 31 December 2005 basedon the registers of members of the Company is as follows:–
(Bermuda principal and Hong Kong branch registers)
As at 31 December 2005 Shareholders Shares of HK$1 each
Number of Shares Held Number % of total Number % of total
1-500 56 14.66% 14,318 0.00%501-2,000 119 31.16% 150,639 0.01%2,001-5,000 72 18.85% 259,616 0.02%5,001-20,000 61 15.97% 642,536 0.05%20,001-50,000 24 6.28% 820,842 0.07%50,001-100,000 6 1.57% 390,577 0.03%100,001-200,000 7 1.83% 950,544 0.09%200,001-500,000 8 2.09% 2,515,890 0.21%500,001-1,000,000 6 1.57% 4,400,616 0.36%1,000,001-2,000,000 6 1.57% 8,028,594 0.66%2,000,001-5,000,000 6 1.57% 20,354,069 1.67%Over 5,000,000 11 2.88% 1,178,050,681 96.83%
382 100% 1,216,578,922 100%Geographical Distribution
(a) AsiaHong Kong 333 87.172% 536,104,471 44.067%Malaysia 18 4.711% 37,547,694 3.086%Singapore 15 3.927% 2,711,059 0.223%Thailand 5 1.309% 640,082,726 52.614%PRC 2 0.524% 6,674 0.001%Indonesia 1 0.262% 63,539 0.005%United Arab Emirates 1 0.262% 14,279 0.001%
(b) AustralasiaAustralia 3 0.785% 18,128 0.001%
(c) EuropeIsle of Man, British Isles 1 0.262% 14,279 0.001%United Kingdom 1 0.262% 107 0.000%
(d) AmericaCanada 1 0.262% 14,966 0.001%United States of America 1 0.262% 1,000 0.000%
382 100% 1,216,578,922 100%
5.3 Other Relevant Information Key corporate dates for the financial year ending 31 December 2006 and theCompany’s market capitalization as at 31 December 2005 are set out in thesections headed “Corporate Information & Key Dates” and “Financial Highlights”of this annual report, respectively.

64
CORPORATE GOVERNANCE REPORT (Continued)
ATTENDANCE RECORD AT BOARD MEETINGSduring the financial year ended 31 December 2005
Date of Board MeetingName of Director 8 March 10 March 31 May 23 September 6 December
EXECUTIVE
Ang Keng Lam Y Y Y Y Y
Wong Siu Kong Y N Y N Y
Ho Shut Kan Y Y Y Y Y
Ma Wing Kai, William Y Y Y Y Y
TOTAL 4 3 4 3 4
PRESENT 4 (100%) 3 (75%) 4 (100%) 3 (75%) 4 (100%)
AVERAGE FOR THE YEAR 90%
INDEPENDENT NON-EXECUTIVE
William Winship Flanz Y Y Y Y Y
Lau Ling Fai, Herald Y Y Y Y Y
Christopher Roger Moss, O.B.E. Y Y Y Y Y
TOTAL 3 3 3 3 3
PRESENT 3 (100%) 3 (100%) 3 (100%) 3 (100%) 3 (100%)
AVERAGE FOR THE YEAR 100%
NON-EXECUTIVE
Tse Kai Chi(appointed on 1 September 2005) N/A N/A N/A Y Y
TOTAL N/A N/A N/A 1 1
PRESENT N/A N/A N/A 1 (100%) 1 (100%)
AVERAGE FOR THE YEAR 100%
OVERALL
TOTAL 7 7 7 8 8
PRESENT 7 (100%) 6 (86%) 7 (100%) 7 (88%) 8 (100%)
AVERAGE FOR THE YEAR 95%
Y = AttendanceN = No attendanceN/A = Not applicable
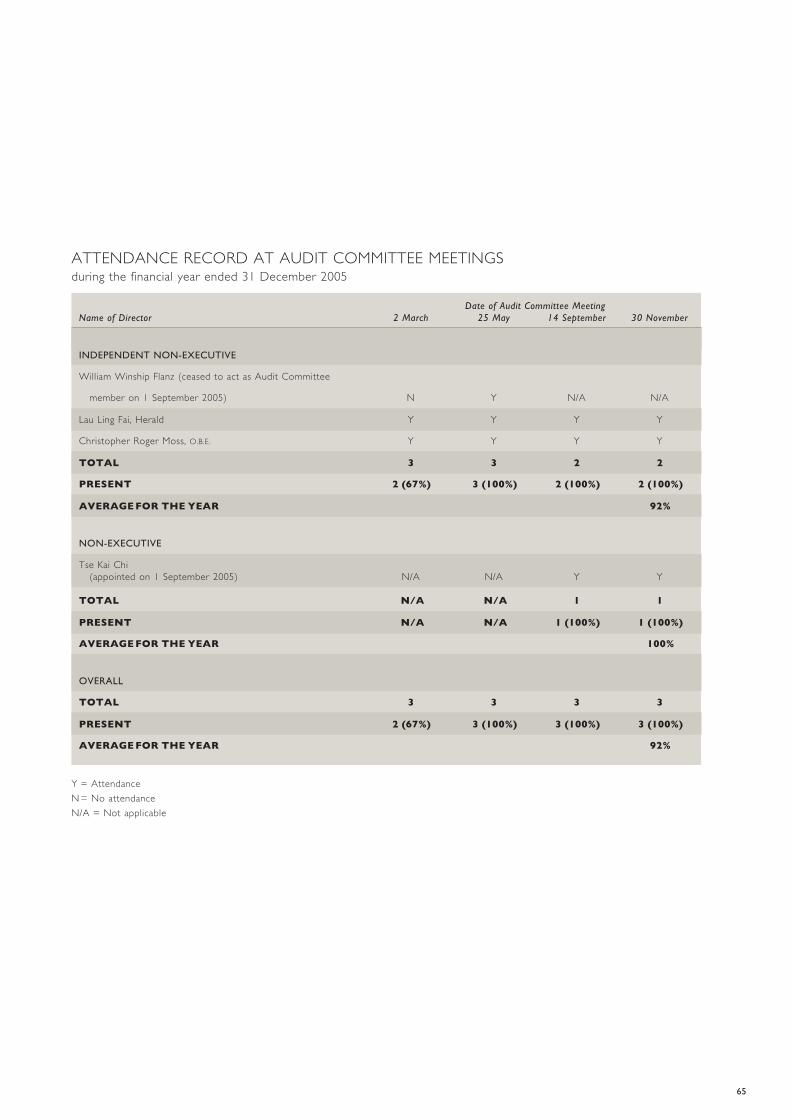
65
ATTENDANCE RECORD AT AUDIT COMMITTEE MEETINGSduring the financial year ended 31 December 2005
Date of Audit Committee MeetingName of Director 2 March 25 May 14 September 30 November
INDEPENDENT NON-EXECUTIVE
William Winship Flanz (ceased to act as Audit Committee
member on 1 September 2005) N Y N/A N/A
Lau Ling Fai, Herald Y Y Y Y
Christopher Roger Moss, O.B.E. Y Y Y Y
TOTAL 3 3 2 2
PRESENT 2 (67%) 3 (100%) 2 (100%) 2 (100%)
AVERAGE FOR THE YEAR 92%
NON-EXECUTIVE
Tse Kai Chi(appointed on 1 September 2005) N/A N/A Y Y
TOTAL N/A N/A 1 1
PRESENT N/A N/A 1 (100%) 1 (100%)
AVERAGE FOR THE YEAR 100%
OVERALL
TOTAL 3 3 3 3
PRESENT 2 (67%) 3 (100%) 3 (100%) 3 (100%)
AVERAGE FOR THE YEAR 92%
Y = AttendanceN = No attendanceN/A = Not applicable

66
CORPORATE GOVERNANCE REPORT (Continued)
ATTENDANCE RECORD AT REMUNERATION COMMITTEE MEETINGSduring the financial year ended 31 December 2005
Date of Remuneration Committee MeetingName of Director 25 January 17 March
EXECUTIVE
Ang Keng Lam Y Y
Wong Siu Kong N Y
TOTAL 2 2
PRESENT 1 (50%) 2 (100%)
AVERAGE FOR THE YEAR 75%
INDEPENDENT NON-EXECUTIVE
William Winship Flanz N Y
Lau Ling Fai, Herald Y Y
Christopher Roger Moss, O.B.E. Y Y
TOTAL 3 3
PRESENT 2 (67%) 3 (100%)
AVERAGE FOR THE YEAR 84%
OVERALL
TOTAL 5 5
PRESENT 3 (60%) 5 (100%)
AVERAGE FOR THE YEAR 80%
Y = AttendanceN = No attendance

67
AUDIT COMMITTEE REPORTThe Audit Committee of the Board has been established since December 1998 and comprises three Non-executive Directors, two of whom are independent.
The Audit Committee operates pursuant to written terms of reference that is available on the Company’s website at www.kerryprops.com. In general, the Audit Committee is responsible for assisting the Board in discharging its responsibilities in monitoring the integrity of the Group’s fi nancial reporting process, the fi nancial statements and reports of the Company, the effectiveness of the Group’s system of internal controls, the performance of the Group’s internal audit function, as well as arrangements with external auditors.
In discharging its responsibilities, set out below is a summary of the work performed by the Audit Committee during the fi nancial year ended 31 December 2005:–
(i) The Audit Committee reviewed the draft annual and interim fi nancial statements and the draft results announcements of the Company, focusing on main areas of judgement, consistency of and changes in accounting policies and adequacy of information disclosure prior to recommending them to the Board for approval.
(ii) The Audit Committee reviewed, in conjunction with the external auditors, the developments of accounting standards and assessed their potential impacts on the Group’s fi nancial statements.
(iii) The Audit Committee assessed the independence of the Company’s external auditors, prior to formally engaging the external auditors to carry out the audit for the Company’s fi nancial statements for the year ended 31 December 2005.
(iv) Prior to the actual commencement of the audit, the Audit Committee discussed the proposed scope of work and approach of the audit with the external auditors. Upon completion of the audit, the Audit Committee reviewed the results of the external audit, and discussed with the external auditors on any signifi cant fi ndings and audit issues.
(v) The Audit Committee recommended to the Board regarding the appointment and remuneration of the external auditors.
(vi) The Audit Committee reviewed and approved the internal audit programme, reviewed the internal audit reports and discussed any signifi cant issues with the internal audit team and the Group’s senior management.
(vii) The Audit Committee reviewed the independence of the internal audit function and the level of support and co-operation given by the Group’s management to the internal audit team, as well as the resources of the internal audit team when undertaking its duties and responsibilities.
(viii) The Audit Committee reviewed the adequacy and effectiveness of the Group’s system of internal controls, through a review of the work undertaken by the Group’s internal and external auditors, written representations by the senior management of each of the Group’s business divisions and discussions with the Board.
During the fi nancial year ended 31 December 2005, the Audit Committee met four times and the Audit Committee also conducted meetings with the Group’s senior management, the external auditors and the internal audit team from time to time. Minutes of the Audit Committee Meetings are documented and circulated to the Board for information. The Audit Committee also reports and presents its fi ndings and makes recommendations for consideration and discussion at Board meetings.
On 17 March 2006, the Audit Committee also reviewed the fi nancial statements of the Group for the year ended 31 December 2005 prior to recommending them to the Board for approval.
MEMBERS OF THE AUDIT COMMITTEEChristopher Roger MOSS, O.B.E. (Chairman)William Winship FLANZ (ceased to act as Audit Committee member on 1 September 2005)LAU Ling Fai, HeraldTSE Kai Chi (appointed on 1 September 2005)
Hong Kong, 24 March 2006
67

REMUNERATION COMMITTEE REPORTThe Remuneration Committee of the Board was established in February 1997 and comprises the Chairman, the Deputy Chairman, and all three Independent Non-executive Directors of the Board.
The Remuneration Committee operates pursuant to written terms of reference that is published at the Company’s website www.kerryprops.com. The primary responsibilities of the Remuneration Committee are, inter alia, the recommendations on the Company’s policies and structure for all the remuneration of the Executive Directors, the proposal of the specifi c remuneration packages of the Executive Directors and the recommendation on the remuneration of the Non-executive Directors for the Board’s approval. The Remuneration Committee also administers and makes determinations with respect to the Company’s share option scheme.
During the fi nancial year ended 31 December 2005, the Remuneration Committee met twice with all its recommendations approved by the Board. The Remuneration Committee performed the following work: -
(i) The Remuneration Committee reviewed the salaries, housing allowances and pension contributions of the Executive Directors for the fi nancial year ended 31 December 2005, prior to recommending them to the Board for approval.
(ii) The Remuneration Committee reviewed and recommended to the Board for approval the payment of bonuses to Executive Directors of the Company, which amounted to HK$25,815,000 in respect of the fi nancial year ended 31 December 2004.
(iii) The Remuneration Committee also reviewed and recommended to the Board for approval the grant of 4,600,000 share options to the Executive Directors of the Company under the Company’s 2002 share option scheme, in respect of their services for the fi nancial year ended 31 December 2004.
MEMBERS OF THE REMUNERATION COMMITTEEANG Keng Lam (Chairman)WONG Siu KongWilliam Winship FLANZLAU Ling Fai, HeraldChristopher Roger MOSS, O.B.E.
Hong Kong, 24 March 2006
68
6969
INTERNAL CONTROLSThe Board is responsible for maintaining and reviewing the effectiveness of the Group’s system of internal controls. The internal controls are designed to meet the Group’s particular needs and to minimize the risks to which the Group is exposed, and are designed to manage rather than eliminate the risks to achieve business objective and can only provide reasonable and not absolute assurance against misstatements or losses. The Group’s internal control framework covers (i) the setting of objectives, budgets and targets; (ii) the establishment of regular reporting of fi nancial information, in particular, the tracking of deviations between actual performances and budgets/targets; (iii) the delegation of authority; and (iv) the establishment of clear lines of accountability.
Strategies and objectives of the Group as a whole are determined by the Board. Budgets are prepared annually and fi nancial projections of the Group over a period of the next fi ve years are also prepared and reviewed by the Board. In implementing these strategies and achieving these objectives, each Executive Director has specifi c responsibilities for monitoring the conduct and operations of individual business units within the Group. This includes the review and approval of business strategies and plans, the setting of business-related performance targets as well as the design and implementation of internal controls.
Monthly fi nancial information is provided to the Executive Directors. Variance analysis between actual performances and targets are prepared and documented in the Board paper, for discussions at Board Meetings with explanations noted for any material variances and deviations between actual performances and budgets/targets. This helps the Board and the Group’s management to monitor the Group’s business operations and to plan on a prudent and timely basis. Other regular and ad hoc reports will also be prepared for the Board and its various committees, to ensure that the Directors are supplied with all the requested information in a timely and appropriate manner.
To allow for delegation of authority as well as to enhance segregation of duties and accountability, a clear organization structure exists which details different levels of authority and control responsibilities within each business unit of
the Group. Certain specifi c matters are reserved for the Board’s decision and are not delegated. These include, amongst others, the approval of annual and interim results, annual budgets, capital structure, declaration of dividends, material acquisitions, disposals and capital expenditure, Board structure and its composition and succession.
In order to better review and evaluate the adequacy and effectiveness of the Group’s existing system of internal controls, an internal self-assessment and certifi cation process was formulated during the fi nancial year ended 31 December 2005. Under this process, each division of the Group was requested to assess the effectiveness of their fundamental operating controls over all aspects of their operations, fi nancial controls, risk management controls and contingency measures. Each division of the Group then submitted to the Audit Committee a written report on the adequacy and effectiveness of its internal controls, which were discussed at an Audit Committee Meeting on 14 September 2005.
In addition to the above, the Board also monitors its internal controls through a programme of internal audits. The internal audit team reviews the major operational, fi nancial and risk management controls of the Group on a continuing basis, and aims to cover all major operations of the Group on a rotational basis. The scope of review and the audit programme of the internal audit team, which are formulated based on a risk assessment approach and focuses on areas with relatively higher perceived risks, are approved by the Audit Committee at the beginning of each fi nancial year in conjunction with the Company’s senior management. During its visits, the internal audit team will also verify the responses as noted in the self-assessment exercise and ensure that appropriate controls are in place and any defi ciencies or irregularities (if any) are rectifi ed.
The internal audit function reports directly to the Chairman of the Board and the Chairman of the Audit Committee. Regular internal audit reports are circulated to the Chairman of the Board, the Audit Committee members, the Chief Financial Offi cer and the external auditors for their review in accordance with the approved internal audit programme.
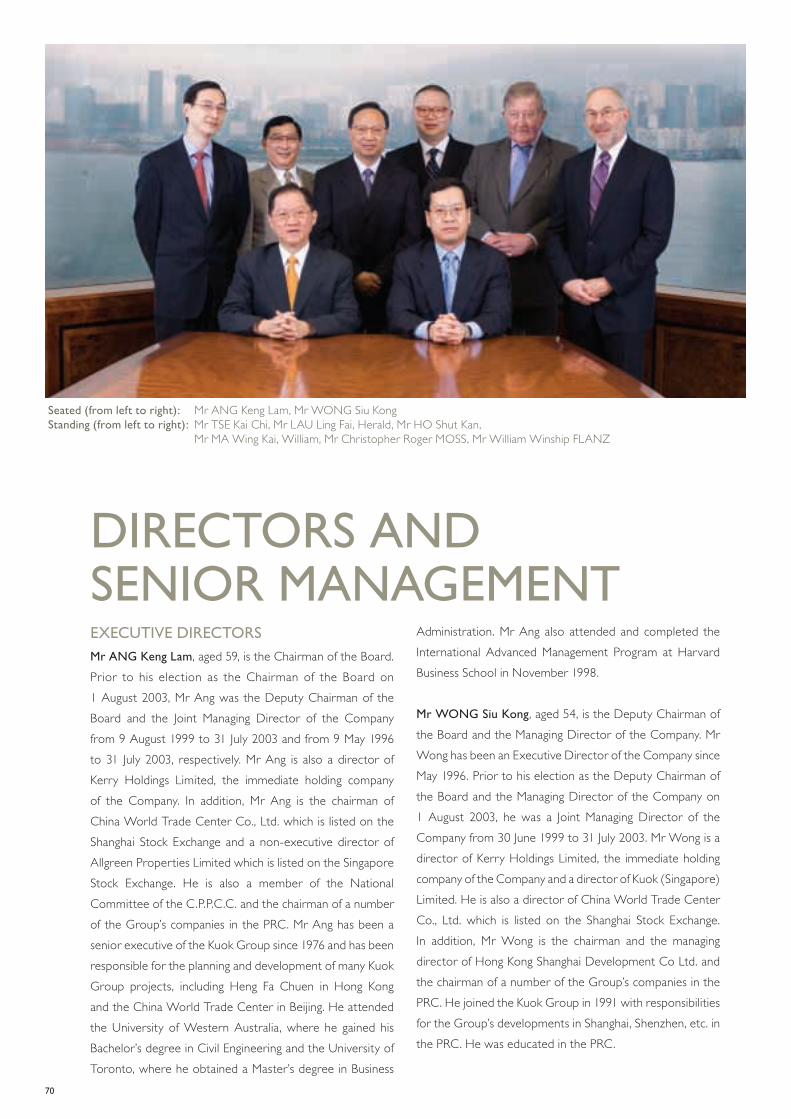
70
EXECUTIVE DIRECTORSMr ANG Keng Lam, aged 59, is the Chairman of the Board. Prior to his election as the Chairman of the Board on 1 August 2003, Mr Ang was the Deputy Chairman of the Board and the Joint Managing Director of the Company from 9 August 1999 to 31 July 2003 and from 9 May 1996 to 31 July 2003, respectively. Mr Ang is also a director of Kerry Holdings Limited, the immediate holding company of the Company. In addition, Mr Ang is the chairman of China World Trade Center Co., Ltd. which is listed on the Shanghai Stock Exchange and a non-executive director of Allgreen Properties Limited which is listed on the Singapore Stock Exchange. He is also a member of the National Committee of the C.P.P.C.C. and the chairman of a number of the Group’s companies in the PRC. Mr Ang has been a senior executive of the Kuok Group since 1976 and has been responsible for the planning and development of many Kuok Group projects, including Heng Fa Chuen in Hong Kong and the China World Trade Center in Beijing. He attended the University of Western Australia, where he gained his Bachelor’s degree in Civil Engineering and the University of Toronto, where he obtained a Master’s degree in Business
Administration. Mr Ang also attended and completed the International Advanced Management Program at Harvard Business School in November 1998.
Mr WONG Siu Kong, aged 54, is the Deputy Chairman of the Board and the Managing Director of the Company. Mr Wong has been an Executive Director of the Company since May 1996. Prior to his election as the Deputy Chairman of the Board and the Managing Director of the Company on 1 August 2003, he was a Joint Managing Director of the Company from 30 June 1999 to 31 July 2003. Mr Wong is a director of Kerry Holdings Limited, the immediate holding company of the Company and a director of Kuok (Singapore) Limited. He is also a director of China World Trade Center Co., Ltd. which is listed on the Shanghai Stock Exchange. In addition, Mr Wong is the chairman and the managing director of Hong Kong Shanghai Development Co Ltd. and the chairman of a number of the Group’s companies in the PRC. He joined the Kuok Group in 1991 with responsibilities for the Group’s developments in Shanghai, Shenzhen, etc. in the PRC. He was educated in the PRC.
DIRECTORS ANDSENIOR MANAGEMENT
Seated (from left to right): Mr ANG Keng Lam, Mr WONG Siu Kong Standing (from left to right): Mr TSE Kai Chi, Mr LAU Ling Fai, Herald, Mr HO Shut Kan,
Mr MA Wing Kai, William, Mr Christopher Roger MOSS, Mr William Winship FLANZ
71
Mr HO Shut Kan, aged 57, has been an Executive Director of the Company since May 1998. Mr Ho is an executive director of Kerry Properties (H.K.) Limited, the principal Hong Kong property company of the Group. He is also a director of EDSA Properties Holdings Inc. which is listed on the Philippines Stock Exchange. He is responsible for the Group’s property developments and infrastructure investments.
Mr MA Wing Kai, William, aged 44, has been an Executive Director of the Company since 1 March 2004. Mr Ma is the deputy chairman and a joint managing director of Kerry Logistics Network Limited, the divisional holding company of the logistics, freight and warehouse businesses of the Group. He joined Kerry Properties (H.K.) Limited, the principal Hong Kong property company of the Group, in September 1990 and was transferred to the logistics, freight and warehouse division of the Group in June 1999. Mr Ma holds a Bachelor of Science (Management Sciences) degree from the University of Lancaster in the United Kingdom. In September 2000, Mr Ma also completed an executive education program – Managing the Supply Chain, at Harvard Business School.
INDEPENDENT NON-EXECUTIVE DIRECTORSMr William Winship FLANZ , aged 61, has been an Independent Non-executive Director of the Company since September 2004. Mr Flanz is a private investor, and serves as advisor to Sterling Enterprises Limited, and as senior advisor to Baring Private Equity Asia, Limited, and senior advisor to JW Childs, LLC. Mr Flanz also serves as an independent non-executive director of Integrated Distribution Services Group Limited. Mr Flanz began his career with Chase Manhattan Bank N.A., where he served as country manager for Japan, area director for the Middle East and North Africa, and later was appointed area director, responsible for all of Chase’s activities in Asia Pacifi c. He was a founding partner of Prudential Asia Investments Limited, and subsequently a member of the Management Committee of Investcorp International Limited, and then chairman and chief executive offi cer of Gucci Group, N.V, before returning to Hong Kong, becoming chief executive offi cer of Sterling Enterprises Limited, a Hong Kong based investment company. He
graduated from New York University with a Bachelor of Arts Degree in Economics. He also holds an MBA from the University of Michigan.
Mr LAU Ling Fai, Herald, aged 65, has been an Independent Non-executive Director of the Company since December 2003. Mr Lau has been practising as a certifi ed public accountant in Hong Kong for over 30 years and has extensive experience in auditing, fi nance, taxation and management. He was a partner in PricewaterhouseCoopers, Hong Kong until his retirement on 30 June 2001. He is an independent non-executive director of each of Fairwood Holdings Limited and Wheelock Properties Limited, and an independent director of China World Trade Centre Co., Ltd. which is listed on the Shanghai Stock Exchange. Mr Lau is a Fellow of each of The Institute of Chartered Accountants in England and Wales and the Hong Kong Institute of Certifi ed Public Accountants.
Mr Christopher Roger MOSS, O.B.E., aged 69, has been an Independent Non-executive Director of the Company since May 1996. Mr Moss is also an independent non-executive director of Fittec International Group Limited which is listed on main board of the Hong Kong Stock Exchange. Mr Moss retired as the fi nance director of Mass Transit Railway Corporation, which position he held from 1984 until his retirement in 1996. Then, he was an international advisor to Goldman Sachs (Asia) L.L.C. until November 2002. He was previously the fi nance director of British Airways. Mr Moss is a Chartered Accountant and a graduate of Cambridge University in the United Kingdom.
NON-EXECUTIVE DIRECTORMr TSE Kai Chi, aged 42, has been a Non-executive Director of the Company since 1 September 2005. Mr Tse is a senior fi nance executive and currently heading the accounting function of Kerry Holdings Limited. Mr Tse is a graduate of the London School of Economics & Political Science and he qualifi ed as Chartered Accountant and Associate of Corporate Treasurer in England. He has 20 years’ experience in accounting and fi nance area and worked in audit and banking industry before he joined the Kerry group in 1994. During 2001 to 2004, he was the group fi nancial controller of SCMP Group Limited.

72
SENIOR MANAGEMENT
Mr CHAU Sung Lim, Sunny, aged 40, has been a director and the general manager of Kerry Properties Development Management (Shanghai) Co., Ltd., the management company of the Group in Shanghai, since June 1996 and November 1998, respectively. He is responsible for the operation of the Group’s property development projects in Shanghai. Mr Chau holds a Bachelor of Arts (Honours) degree in Economics and Administrative Studies from the University of Winnipeg in Canada.
Mr CHU Ip Pui, aged 57, is an executive director of Kerry Real Estate Agency Limited, and Kerry Property Management Services Limited, the subsidiaries providing marketing and building management services to the Group. Mr Chu has over 30 years of experience in various aspects of the property business. Since joining the Group in January 2000, Mr Chu’s principal responsibility is the marketing and management of the Group’s property portfolio in Hong Kong. Mr Chu holds a Master degree in Business Administration from the University of Macau.
Ms FENG Ying, aged 48, joined the Kuok Group in February 1997. She is currently an executive director of Kerry Development (China) Limited. Ms Feng is responsible for the investment and operation of the Group’s property development projects in Shenzhen, Fuzhou, etc. Ms Feng holds a Bachelor of Science Degree in Mechanical Engineering from Shanghai Jiao Tong University. Ms Feng has over 20 years of experience in business development and project management.
Mr TAM Sing Ki, aged 51, has been a director of Kerry Properties (H.K.) Limited since January 1998. Mr Tam is also a director of Kerry Real Estate Agency Limited, Kerry Property Management Services Limited and Kerry Project Management (H.K.) Limited. His principal responsibility is land acquisitions and project management for the Group. Mr Tam holds a Degree of Bachelor of Science and a Degree of Master of Business Administration from the University of Hong Kong. He is a Fellow Member of both The Royal Institution of Chartered Surveyors and the Hong Kong Institute of Chartered Surveyors.
Mr WONG Wai Shing, Vincent, aged 58, has joined Kerry Logistics Network Limited as a director since June 2001 and has taken up the post of joint managing director since April 2004. He has over 30 years’ experience in the transport industry. Prior to joining Kerry Logistics Network Limited, he was the chief executive of a multinational transportation company involving in shipping agency, ship management, feeder services, cargo terminals, freight forwarding and contract logistics. Mr Wong received his bachelor degree with honour from the University of Hong Kong and is a member of the Institute of Chartered Shipbroker as well as a fellow of the Chartered Institute of Logistics and Transport. He is also a member of the Logistics Development Council of the HKSAR.
Mr WONG Wing Kee, Christopher, aged 43, is the Chief Financial Offi cer of the Company. Mr Wong trained and qualifi ed as a Chartered Accountant with Price Waterhouse, London, England. Mr Wong has altogether about 6 years’ experience in accounting and audit in the United Kingdom and Hong Kong, and about 11 years’ experience in investment banking and corporate fi nance in Hong Kong before he joined the Company in December 2004. Mr Wong is a graduate of the London School of Economics and Political Science, University of London, England, and holds a Bachelor of Science (Economics) degree in Accounting and Finance.
Mr WOO Shan-chen, Wilfred, aged 48, joined the Kuok Group in 1990. Mr Woo is an executive director of Kerry Properties (China) Limited, the divisional holding company of the PRC property portfolio of the Group. He is also a director of Beijing Jia Ao Real Estate Development Co., Ltd. and an executive director of Beijing Kerry Centre Hotel Co., Ltd., which are the Company’s subsidiaries with major investments in Beijing. Mr Woo is also a director and the general manager of another Kuok Group company, China World Trade Center Ltd., Beijing. Before joining the Kuok Group, he had 8 years of audit and fi nancial planning experience in both Canada and Hong Kong with a leading international accounting fi rm. He is a Chartered Accountant (Canada) and holds a Bachelor of Commerce degree in Accounting and Management Information Systems from the University of British Columbia, Vancouver, Canada.

73
REPORT OF THE DIRECTORS
The Directors submit their report together with the audited financial statements for the year ended 31 December2005.
PRINCIPAL ACTIVITIES AND SEGMENTAL ANALYSIS OF OPERATIONSThe principal activity of the Company is investment holding.
The principal activities of the Company’s subsidiaries comprise the following:
(i) property development and investment in Hong Kong, the People’s Republic of China (the “PRC”) and the AsiaPacific region;
(ii) logistics, freight and warehouse ownership and operations;
(iii) infrastructure-related investments in Hong Kong and the PRC; and
(iv) hotel ownership and operations in the PRC.
The Group is also involved in project and property management, mainly of its own development projects andproperties, in Hong Kong, the PRC and the Asia Pacific region.
An analysis of the Group’s turnover and contribution to operating profit for the year by principal activities andmarkets is set out in note 5 to the financial statements.
RESULTS AND APPROPRIATIONSThe results of the Group for the year are set out in the consolidated income statement on page 92.
Particulars of dividends proposed and paid during the year are set out in note 10 to the financial statements.
RESERVESThe movements in reserves of the Group and the Company during the year are set out in notes 35 and 36 to thefinancial statements.
DONATIONSCharitable donations made by the Group during the year amounted to HK$5,880,000.
PROPERTY, PLANT AND EQUIPMENTParticulars of the movements in property, plant and equipment of the Group and the Company during the year areset out in note 13 to the financial statements.
INVESTMENT, HOTEL AND DEVELOPMENT PROPERTIESParticulars of investment, hotel and development properties of the Group are set out on pages 36 to 48.
SHARE CAPITALThe movements in the share capital of the Company during the year are set out in note 33 to the financialstatements.

74
REPORT OF THE DIRECTORS (Continued)
CONVERTIBLE BONDSDetails of the convertible bonds of the Company are set out in note 30 to the financial statements.
CAPITALISED INTERESTThe amounts of interest capitalised by the Group during the year are set out in notes 6 and 7 to the financialstatements.
SUBSIDIARIESParticulars of the Company’s subsidiaries as at 31 December 2005 are set out in note 43 to the financial statements.
ASSOCIATED COMPANIESParticulars of the Group’s associated companies as at 31 December 2005 are set out in note 44 to the financialstatements.
PARTICULARS OF BANK LOANS AND OTHER BORROWINGSParticulars of bank loans and other borrowings of the Group and the Company as at 31 December 2005 are set outin notes 29 and 41 to the financial statements.
TEN-YEAR FINANCIAL SUMMARYThe results, assets and liabilities of the Group for the last ten financial years are summarized on pages 187 and 188.
DIRECTORSThe Directors who held office during the year and up to the date of this report were:
Mr ANG Keng Lam (Chairman)@
Mr WONG Siu Kong (Deputy Chairman and Managing Director)@
Mr HO Shut Kan@
Mr MA Wing Kai, William@
Mr William Winship FLANZ*Mr LAU Ling Fai, Herald*Mr Christopher Roger MOSS, O.B.E.*Mr TSE Kai Chi# (appointed on 1 September 2005)
@ Executive Directors* Independent Non-executive Directors# Non-executive Director
Mr Tse Kai Chi, being appointed as Director of the Company after the last Annual General Meeting, is due to retirefrom the Board in accordance with Bye-law 102(B) of the Company’s Bye-laws and Messrs Ang Keng Lam, Wong SiuKong and Ho Shut Kan are also due to retire from the Board by rotation in accordance with Bye-law 99(A) of theCompany’s Bye-laws, at the forthcoming Annual General Meeting. The retiring Directors, being eligible, all offerthemselves for re-election.
BIOGRAPHY OF DIRECTORS AND SENIOR MANAGEMENTBiography of Directors and senior management are set out on pages 70 to 72.

75
DIRECTORS’ INTERESTS IN SHARES, UNDERLYING SHARES AND DEBENTURESAs at 31 December 2005, the interests of the Directors in the shares, underlying shares and debentures of theCompany or any of its associated corporations (within the meaning of Part XV of the Securities and FuturesOrdinance (the “SFO”)) (the “Associated Corporations”) as recorded in the register required to be kept by theCompany under Section 352 of the SFO or as otherwise notified to the Company and The Stock Exchange of HongKong Limited (the “Stock Exchange”) pursuant to the Model Code for Securities Transactions by Directors of ListedIssuers (the “Model Code”) were as follows:
(i) The CompanyPercentage
of aggregateNumber of interests tounderlying total number
ordinary of ordinaryNumber of ordinary sharesshares held shares
Personal Family Corporate Other under equity in issue*Name of Director interests interests interests interests derivatives Total %
Mr ANG Keng Lam 2,621 1 – – 466,3862 6,201,877 3 6,670,884 0.55
Mr WONG Siu Kong – – – – 3,319,794 3 3,319,794 0.27
Mr HO Shut Kan – – – – 1,121,044 3 1,121,044 0.09
Mr MA Wing Kai, William 7,384 1 – – – 1,532,371 3 1,539,755 0.13
Mr William Winship FLANZ – – – – – – –
Mr LAU Ling Fai, Herald – – – – – – –
Mr Christopher Roger MOSS, O.B.E. – – – – – – –
Mr TSE Kai Chi – – – – – – –
(ii) Associated CorporationsPercentage
of aggregateNumber of interests tounderlying total number
ordinary of ordinaryNumber of ordinary sharesshares held shares
Name of Associated Name of Personal Family Corporate Other under equity in issueCorporation Director interests interests interests interests derivatives Total %
EDSA Properties Holding Inc. Mr HO Shut Kan 1,570 1 – – – – 1,570 # 0.00
Kerry Group Limited Mr ANG Keng Lam – 7,050,000 4 – 8,000,000 2 5,566,221 5 20,616,221 1.45 @
Mr WONG Siu Kong – – 6,254,300 6 – 4,638,517 5 10,892,817 0.77 @
Mr HO Shut Kan 765,000 1 – – – 927,703 5 1,692,703 0.12 @
Mr MA Wing Kai, William 1,010,620 1 – – – – 1,010,620 0.07 @
Mr TSE Kai Chi 400,000 1 – – – 1,855,407 5 2,255,407 0.16 @
Kerry Siam Seaport Limited Mr ANG Keng Lam 1 1 – – – – 1 0.00
Mr MA Wing Kai, William 1 1 – – – – 1 0.00
76
REPORT OF THE DIRECTORS (Continued)
DIRECTORS’ INTERESTS IN SHARES, UNDERLYING SHARES AND DEBENTURES (Continued)
(ii) Associated Corporations (Continued)Notes:
1. This represents interests held by the relevant Director as beneficial owner.
2. This represents interests held by the relevant Director through a discretionary trust of which the relevant Director is a contingentbeneficiary.
3. This represents interests in options held by the relevant Director as a beneficial owner to subscribe for the relevant underlyingordinary shares in respect of the option shares granted by the Company under the 1997 and 2002 share option schemes, details ofwhich are set out in the section headed “Share Options” of this report.
4. This represents interests held by the relevant Director and his spouse through a discretionary trust of which the relevant Director andhis spouse are contingent beneficiaries.
5. This represents interests in options held by the relevant Director as a beneficial owner to subscribe for the relevant underlyingordinary shares in respect of the option shares granted by Kerry Group Limited, details of which are set out in the section headed“Directors’ Rights to Acquire Shares or Debentures” below.
6. This represents interests held by the relevant Director through his controlled corporation(s).
* The percentage has been adjusted based on the total number of ordinary shares of the Company in issue as at 31 December 2005(i.e. 1,216,578,922 ordinary shares).
# The relevant notification was filed under the repealed Securities (Disclosure of Interests) Ordinance.
@ The percentage has been adjusted based on the total number of ordinary shares of Kerry Group Limited in issue as at 31 December2005 (i.e. 1,423,527,311 ordinary shares).
All the interests disclosed in sections (i) and (ii) above represent long positions in the shares of the Companyor the Associated Corporations.
Save as aforesaid, as at 31 December 2005, none of the Directors had any other interests or short positions inthe shares, underlying shares or debentures of the Company or any of its Associated Corporations which hadbeen entered in the register kept by the Company pursuant to Section 352 of the SFO or as otherwise notifiedto the Company and the Stock Exchange pursuant to the Model Code.
DIRECTORS’ INTERESTS IN CONTRACTSNo contracts of significance in relation to the Group’s business to which the Company, its subsidiaries, its fellowsubsidiaries or its holding companies was a party and in which a Director of the Company had a material interest,whether directly or indirectly, subsisted at the end of the year or at any time during the year.
DIRECTORS’ RIGHTS TO ACQUIRE SHARES OR DEBENTURES(i) The Company
As at 31 December 2005, the number of outstanding option shares granted by the Company under the 1997and 2002 Share Option Schemes to the Directors to subscribe for shares of the Company, as recorded in theregister required to be kept under Section 352 of the SFO or as otherwise notified to the Company and theStock Exchange pursuant to the Model Code is set out in the section headed “Share Options” of this report.

77
DIRECTORS’ RIGHTS TO ACQUIRE SHARES OR DEBENTURES (Continued)
(ii) Associated CorporationPursuant to a share option scheme adopted by Kerry Group Limited (“KGL”), the ultimate holding company ofthe Company, on 17 November 1999, the directors of KGL granted option shares in favour of the followingDirectors to subscribe for shares in KGL, with respective exercise price per option share of the unexercisedoptions and the respective number of option shares exercisable adjusted with effect from 26 May 2005, asfollows:
Reducednumber
of optionshares of
Exercise Number KGL granted Numberprice Exercise of option to the of option
before price after shares of Directors shares ofadjustment adjustment KGL before for the KGL after
Name of Director Date of grant Exercise period HK$ HK$ adjustment adjustment adjustment
Mr ANG Keng Lam 04/05/2000 04/11/2000-03/05/2007 4.20 4.52 6,000,000 433,779 5,566,221
Mr WONG Siu Kong 04/05/2000 04/11/2000-03/05/2007 4.20 4.52 5,000,000 361,483 4,638,517
Mr HO Shut Kan 04/05/2000 04/11/2000-03/05/2007 4.20 4.52 1,000,000 72,297 927,703
Mr TSE Kai Chi 04/05/2000 04/11/2000-03/05/2007 4.20 4.52 2,000,000 144,593 1,855,407
Apart from the aforesaid, at no time during the year ended 31 December 2005 was the Company, itssubsidiaries, its fellow subsidiaries or its holding companies a party to any arrangement to enable the Directorsto acquire benefits by means of the acquisition of shares in, or debentures of, the Company or any other bodycorporate.
SUBSTANTIAL INTERESTS IN THE SHARE CAPITAL OF THE COMPANYAs at 31 December 2005, the interests of those persons (other than the Directors) in the shares of the Company asrecorded in the register required to be kept by the Company under Section 336 of the SFO were as follows:
Percentage of ordinaryshares to total
number of ordinaryCapacity in which Number of shares in issue *
Name ordinary shares were held ordinary shares %
Kerry Group Limited Interest of controlled corporations 752,972,645 (Notes 1, 2, 3 & 4) 61.89
Kerry Holdings Limited Interest of controlled corporations 752,972,645 (Notes 1, 2, 3 & 4) 61.89
Caninco Investments Limited Beneficial owner 303,891,879 (Note 2) 24.98
Darmex Holdings Limited Beneficial owner 250,024,187 (Note 2) 20.55
Moslane Limited Beneficial owner 86,150,350 (Note 2) 7.08
Kerry 1989 (C.I.) Limited Interest of controlled corporations 81,708,438 (Notes 2 & 3) 6.72
Desert Grove Limited Beneficial owner 80,877,390 (Note 3) 6.65

78
REPORT OF THE DIRECTORS (Continued)
SUBSTANTIAL INTERESTS IN THE SHARE CAPITAL OF THE COMPANY (Continued)
Notes:
1. Kerry Properties Limited is a subsidiary of Kerry Holdings Limited (“KHL”). KHL itself is a wholly-owned subsidiary of KGL and, accordingly,the shares in which KHL is shown to be interested are also included in the shares in which KGL is shown to be interested.
2. Caninco Investments Limited (“Caninco”), Darmex Holdings Limited (“Darmex”), Moslane Limited (“Moslane”) and Kerry 1989 (C.I.)Limited (“Kerry 1989 CI”) are wholly-owned subsidiaries of KHL. KHL itself is a wholly-owned subsidiary of KGL and, accordingly, the sharesin which Caninco, Darmex, Moslane and Kerry 1989 CI are shown to be interested are also included in the shares in which KHL and KGLare shown to be interested.
3. Desert Grove Limited (“Desert”) is a wholly-owned subsidiary of Kerry 1989 CI which in turn is a wholly-owned subsidiary of KHL. KHLitself is a wholly-owned subsidiary of KGL and, accordingly, the shares in which Desert are shown to be interested are also included in theshares in which Kerry 1989 CI, KHL and KGL are shown to be interested.
4. The Company has been notified that, as at 31 December 2005, each of KGL and KHL was interested in 754,796,879 ordinary shares of theCompany (representing approximately 62.04% of the Company’s issued share capital) and this increase in shareholding was not required tobe disclosed under Part XV of the SFO.
* The percentage has been adjusted based on the total number of ordinary shares of the Company in issue as at 31 December 2005 (i.e.1,216,578,922 ordinary shares).
All the interests disclosed under this section represent long positions in the shares of the Company.
Apart from the aforesaid, as at 31 December 2005, the Company had not been notified of any interests and shortpositions in the shares and underlying shares of the Company which had been recorded in the register required tobe kept under Section 336 of the SFO.
PUBLIC FLOATBased on the information that is publicly available to the Company as at the date of this report and within theknowledge of the Directors, there was a sufficiency of public float of the Company’s securities as required under therules governing the listing of securities on the Stock Exchange (the “Listing Rules”).
PRE-EMPTIVE RIGHTSThere is no provision for pre-emptive rights under the Company’s Bye-laws or the laws in Bermuda.
STAFFAs at 31 December 2005, the Company and its subsidiaries had 7,572 employees. Salaries of employees aremaintained at competitive levels while bonuses are granted on a discretionary basis. Other employee benefits includeprovident fund, insurance, medical cover, subsidized educational and training programs as well as a share optionscheme.
79
SHARE OPTIONSOn 17 April 2002, the shareholders of the Company approved the termination (to the effect that no further optionsshall be offered) of the executive share option scheme adopted by the Company on 27 March 1997 (the “1997Share Option Scheme”) and the adoption of a new share option scheme (the “2002 Share Option Scheme”). On 17March 2005, a total of 8,540,000 option shares were granted under the 2002 Share Option Scheme.
As at 31 December 2005, a total of 25,426,091 option shares were outstanding which comprised 16,886,091 optionshares and 8,540,000 option shares granted under the 1997 Share Option Scheme and the 2002 Share OptionScheme, respectively.
The following is a summary of the principal terms of these two share option schemes (for the 1997 Share OptionScheme, only those terms applying to the outstanding option shares are set out).
(i) 1997 Share Option SchemeThe 1997 Share Option Scheme was designed to give Executive Directors, managers or other employeesholding an executive, managerial, supervisory or similar position in the Company or any of its subsidiaries aninterest in preserving and maximising shareholder value in the longer term, to enable the Company to attractand retain individuals with experience and ability and to reward individuals for expected future performance.
The period within which an option may be exercised was determined by the Board of Directors of theCompany in its absolute discretion, save that no option might be exercised later than 10 years from the date onwhich the option was granted. Subject to the provisions of the 1997 Share Option Scheme, the Board might atits discretion when offering the grant of an option impose any conditions, restrictions or limitations in relationthereto in addition to those set forth in the 1997 Share Option Scheme as it thought fit (as stated in the lettercontaining the offer of the grant of the option) including (without prejudice to the generality of the foregoing)conditions, restrictions or limitations relating to the achievement of operating or financial targets, the satisfactoryperformance by the grantee or the time or period when the right to exercise the option in respect of all orsome of the option shares would vest.
The amount paid on acceptance of an option was HK$1. The full amount of the subscription price for shares ofthe Company (the “Shares”) must be paid upon exercise of an option.
The subscription price for any particular outstanding option was determined by the Board of Directors of theCompany in its absolute discretion subject to the compliance with the requirements for share option schemesunder the Listing Rules.
The 1997 Share Option Scheme was terminated on 17 April 2002 such that thereafter no further optionsshould be offered but the options which had been granted during its life should continue to be valid andexercisable in accordance with their terms of issue and in all other respects its provisions should remain in fullforce and effect.
80
REPORT OF THE DIRECTORS (Continued)
SHARE OPTIONS (Continued)
(ii) 2002 Share Option SchemeThe 2002 Share Option Scheme is designed to motivate executives and key employees in the service of anymember of the Group and other persons who may make a contribution to the Group to optimise their futurecontributions to the Group and enable the Group to attract and retain individuals with experience and abilityand to reward them for their past contributions.
Under the 2002 Share Option Scheme, the Board of Directors of the Company may, at its discretion, grantoptions to the eligible persons as defined in the 2002 Share Option Scheme (the “Eligible Person”) to subscribefor Shares at HK$1 per option. The basis of eligibility of any of the Eligible Persons to the grant of any optionsshall be determined by the Board of Directors of the Company from time to time on the basis of theircontribution to the development and the growth of the Group.
The maximum number of Shares which may be issued upon exercise of all options to be granted under the2002 Share Option Scheme (and under any other scheme of the Company) shall not in aggregate exceed 10per cent. of the Shares in issue as at the date of the adoption of the 2002 Share Option Scheme (the “SchemeMandate Limit”) provided that the Company may at any time as the Board of Directors of the Company maythink fit seek approval from its shareholders to refresh the Scheme Mandate Limit, save that the maximumnumber of Shares which may be issued upon exercise of all options to be granted under the 2002 Share OptionScheme (and under any other scheme of the Company) shall not exceed 10 per cent. of the Shares in issue asat the date of approval by the shareholders of the Company in general meeting where such limit is refreshed.Options previously granted under the 2002 Share Option Scheme and any other scheme of the Company(including those outstanding, cancelled, and lapsed in accordance with the terms of the 2002 Share OptionScheme or any other scheme of the Company or exercised options under the said schemes) shall not becounted for the purpose of calculating the limit as refreshed. Notwithstanding aforesaid in this paragraph, themaximum number of Shares which may be issued upon exercise of all outstanding options granted and yet tobe exercised under the 2002 Share Option Scheme (and under any other scheme of the Company) shall notexceed 30 per cent. of the Shares in issue from time to time. As at 31 December 2005, a total of 64,994,403Shares (representing approximately 5.34% of the existing issued share capital of the Company) are available forissue under the 2002 Share Option Scheme. The maximum entitlement of each participant under the 2002Share Option Scheme is 1 per cent. of the Shares in issue from time to time.

81
SHARE OPTIONS (Continued)
(ii) 2002 Share Option Scheme (Continued)
The period within which an option may be exercised will be determined by the Board of Directors of theCompany in its absolute discretion, save that no option may be exercised later than 10 years from the date onwhich the option is granted. Subject to the provisions of the 2002 Share Option Scheme, the Board may in itsabsolute discretion when offering the grant of an option impose any conditions, restrictions or limitations inrelation thereto in addition to those set forth in the 2002 Share Option Scheme as it may think fit (to be statedin the letter containing the offer of the grant of the option) including (without prejudice to the generality of theforegoing) continuing eligibility criteria, conditions, restrictions or limitations relating to the achievement ofperformance, operating or financial targets by the Company and/or the grantee, the satisfactory performance ormaintenance by the grantee of certain conditions or obligations or the time or period when the right toexercise the option in respect of all or some of the option shares shall vest. The amount payable on acceptanceof an option is HK$1. The period within which the amount of the subscription price for the Shares to be paidupon exercise of an option shall be determined by the Board of Directors of the Company.
The subscription price in respect of any particular option under the 2002 Share Option Scheme shall be suchprice as the Board may in its absolute discretion determine at the time of grant of the relevant option (and shallbe stated in the letter containing the offer of the grant of the option) but the subscription price shall not be lessthan whichever is the highest of (a) the nominal value of a Share; (b) the closing price of the Shares as stated inthe Stock Exchange’s daily quotations sheet on the date of the Board resolution approving the grant of options;and (c) the average of the closing prices of the Shares as stated in the Stock Exchange’s daily quotations sheetfor the five business days immediately preceding the date of the Board resolution approving the grant ofoptions.
The 2002 Share Option Scheme will expire on 16 April 2012.

82
REPORT OF THE DIRECTORS (Continued)
SHARE OPTIONS (Continued)
Movements of the option shares, which were granted under the 1997 Share Option Scheme, during the year ended31 December 2005 are listed below in accordance with rule 17.07 of the Listing Rules:
Number Number NumberNumber Transfer Transfer of option Number of option of option Number
of option from other to other shares of option shares shares of optionshares category category granted shares exercised lapsed shares Exercise
Date of held as at during the during the during the granted for during the during the held as at price ExerciseCategory grant Tranche 01/01/2005 year year year adjustment year (Note 1) year 31/12/2005 HK$ period
1. Directors
Mr ANG Keng Lam 11/04/1997 N/A 1,759,380 – – – – – – 1,759,380 14.92 11/04/1999–26/03/2007
27/11/1999 I 428,630 – – – – – – 428,630 9.64 27/05/2000–26/03/2007
27/11/1999 II 428,629 – – – – – – 428,629 9.64 27/05/2001–26/03/2007
857,259
01/06/2000 I 350,000 – – – – – – 350,000 6.70 01/06/2001–31/05/2010
01/06/2000 II 350,000 – – – – – – 350,000 6.70 01/06/2002–31/05/2010
01/06/2000 III 348,743 – – – – – – 348,743 6.70 01/06/2003–31/05/2010
1,048,743
16/04/2002 I 518,248 – – – – – – 518,248 6.85 16/04/2003–15/04/2012
16/04/2002 II 518,247 – – – – – – 518,247 6.85 16/04/2004–15/04/2012
1,036,495
4,701,877
Mr WONG Siu 11/04/1997 N/A 1,172,919 – – – – – – 1,172,919 14.92 11/04/1999–Kong 26/03/2007
27/11/1999 I 214,314 – – – – – – 214,314 9.64 27/05/2000–26/03/2007
27/11/1999 II 214,314 – – – – – – 214,314 9.64 27/05/2001–26/03/2007
428,628
16/04/2002 I – – – – – – – – 6.85 16/04/2003–15/04/2012
16/04/2002 II 518,247 – – – – (300,000) – 218,247 6.85 16/04/2004–15/04/2012
218,247
1,819,794

83
SHARE OPTIONS (Continued)
Number Number NumberNumber Transfer Transfer of option Number of option of option Number
of option from other to other shares of option shares shares of optionshares category category granted shares exercised lapsed shares Exercise
Date of held as at during the during the during the granted for during the during the held as at price ExerciseCategory grant Tranche 01/01/2005 year year year adjustment year (Note 1) year 31/12/2005 HK$ period
1. Directors (continued)
Mr HO Shut Kan 11/04/1997 N/A 821,044 – – – – (500,000) – 321,044 14.92 11/04/1999–26/03/2007
02/03/2001 I 36,000 – – – – (36,000) – – 11.59 02/03/2002–01/03/2011
02/03/2001 II 36,000 – – – – (36,000) – – 11.59 02/03/2003–01/03/2011
02/03/2001 III 33,520 – – – – (33,520) – – 11.59 02/03/2004–01/03/2011
–
16/04/2002 I – – – – – – – – 6.85 16/04/2003–15/04/2012
16/04/2002 II 77,736 – – – – (77,736) – – 6.85 16/04/2004–15/04/2012
–321,044
Mr MA Wing 11/04/1997 N/A 234,582 – – – – – – 234,582 14.92 11/04/1999–Kai, William 26/03/2007
27/11/1999 I 133,946 – – – – – – 133,946 9.64 27/05/2000–26/03/2007
27/11/1999 II 133,945 – – – – – – 133,945 9.64 27/05/2001–26/03/2007
267,891
01/06/2000 I – – – – – – – – 6.70 01/06/2001–31/05/2010
01/06/2000 II 119,585 – – – – (119,585) – – 6.70 01/06/2002–31/05/2010
01/06/2000 III 135,055 – – – – (135,055) – – 6.70 01/06/2003–31/05/2010
–
02/03/2001 I 36,000 – – – – – – 36,000 11.59 02/03/2002–01/03/2011
02/03/2001 II 36,000 – – – – – – 36,000 11.59 02/03/2003–01/03/2011
02/03/2001 III 33,520 – – – – – – 33,520 11.59 02/03/2004–01/03/2011
105,520
16/04/2002 I 62,189 – – – – – – 62,189 6.85 16/04/2003–15/04/2012
16/04/2002 II 62,189 – – – – – – 62,189 6.85 16/04/2004–15/04/2012
124,378732,371

84
REPORT OF THE DIRECTORS (Continued)
SHARE OPTIONS (Continued)
Number Number NumberNumber Transfer Transfer of option Number of option of option Number
of option from other to other shares of option shares shares of optionshares category category granted shares exercised lapsed shares Exercise
Date of held as at during the during the during the granted for during the during the held as at price ExerciseCategory grant Tranche 01/01/2005 year year year adjustment year (Note 1) year 31/12/2005 HK$ period
2. Continuous 11/04/1997 N/A 2,963,696 – – – – (973,336) – 1,990,360 14.92 11/04/1999–Contract 26/03/2007Employees
27/11/1999 I 604,194 – – – – (167,339) – 436,855 9.64 27/05/2000–26/03/2007
27/11/1999 II 652,854 – – – – (144,181) – 508,673 9.64 27/05/2001–26/03/2007
945,528
01/06/2000 I 133,000 – – – – (29,000) – 104,000 6.70 01/06/2001–31/05/2010
01/06/2000 II 175,564 – – – – (29,000) – 146,564 6.70 01/06/2002–31/05/2010
01/06/2000 III 196,248 – – – – (27,939) – 168,309 6.70 01/06/2003–31/05/2010
418,873
02/03/2001 I 234,000 – – – – (86,000) – 148,000 11.59 02/03/2002–01/03/2011
02/03/2001 II 234,000 – – – – (86,000) – 148,000 11.59 02/03/2003–01/03/2011
02/03/2001 III 198,884 – – – – (72,808) – 126,076 11.59 02/03/2004–01/03/2011
422,076
16/04/2002 I 332,125 – – – – (44,048) – 288,077 6.85 16/04/2003–15/04/2012
16/04/2002 II 332,124 – – – – (44,048) – 288,076 6.85 16/04/2004–15/04/2012
576,153
4,352,990
3. Others 11/04/1997 N/A 3,753,341 – – – – – – 3,753,341 14.92 11/04/1999–26/03/2007
27/11/1999 I 589,363 – – – – (85,725) – 503,638 9.64 27/05/2000–26/03/2007
27/11/1999 II 589,362 – – – – (85,725) – 503,637 9.64 27/05/2001–26/03/2007
1,007,275
01/06/2000 I 45,000 – – – – – – 45,000 6.70 01/06/2001–31/05/2010
01/06/2000 II 45,000 – – – – – – 45,000 6.70 01/06/2002–31/05/2010
01/06/2000 III 44,088 – – – – – – 44,088 6.70 01/06/2003–31/05/2010
134,088
02/03/2001 I 22,000 – – – – – – 22,000 11.59 02/03/2002–01/03/2011
02/03/2001 II 22,000 – – – – – – 22,000 11.59 02/03/2003–01/03/2011
02/03/2001 III 19,311 – – – – – – 19,311 11.59 02/03/2004–01/03/2011
63,311
16/04/2002 I 518,248 – – – – (518,248) – – 6.85 16/04/2003–15/04/2012
16/04/2002 II 518,247 – – – – (518,247) – – 6.85 16/04/2004–15/04/2012
–4,958,015
Total 21,035,631 – – – – (4,149,540) – 16,886,091

85
SHARE OPTIONS (Continued)
Movements of the option shares, which were granted under the 2002 Share Option Scheme, during the year ended31 December 2005 are listed below in accordance with rule 17.07 of the Listing Rules:
Number Number NumberNumber Transfer Transfer of option Number of option of option Number
of option from other to other shares of option shares shares of optionshares category category granted shares exercised lapsed shares Exercise
Date of held as at during the during the during the granted for during the during the held as at price ExerciseCategory grant Tranche 01/01/2005 year year year adjustment year (Note 1) year 31/12/2005 HK$ period
1. Directors
Mr ANG Keng Lam 17/03/2005 I – – – 750,000 – – – 750,000 18.74 17/03/2006–16/03/2015
17/03/2005 II – – – 750,000 – – – 750,000 18.74 17/03/2007–16/03/2015
1,500,000
Mr WONG Siu 17/03/2005 I – – – 750,000 – – – 750,000 18.74 17/03/2006–Kong 16/03/2015
17/03/2005 II – – – 750,000 – – – 750,000 18.74 17/03/2007–16/03/2015
1,500,000
Mr HO Shut Kan 17/03/2005 I – – – 400,000 – – – 400,000 18.74 17/03/2006–16/03/2015
17/03/2005 II – – – 400,000 – – – 400,000 18.74 17/03/2007–16/03/2015
800,000
Mr MA Wing 17/03/2005 I – – – 400,000 – – – 400,000 18.74 17/03/2006–Kai, William 16/03/2015
17/03/2005 II – – – 400,000 – – – 400,000 18.74 17/03/2007–16/03/2015
800,000
2. Continuous 17/03/2005 I – – – 1,970,000 – – – 1,970,000 18.74 17/03/2006–Contract 16/03/2015Employees 17/03/2005 II – – – 1,970,000 – – – 1,970,000 18.74 17/03/2007–
16/03/20153,940,000
Total – – – 8,540,000 – – – 8,540,000
Notes:
1. The weighted average closing price of the Shares immediately before the dates on which the options were exercised was HK$19.28.
2. No option was cancelled during the year.

86
REPORT OF THE DIRECTORS (Continued)
SERVICE CONTRACTSThere is no service contract, which is not determinable by the Company within one year without payment ofcompensation (other than statutory compensation), in respect of any Director proposed for re-election at theforthcoming Annual General Meeting of the Company.
MANAGEMENT CONTRACTSNo contracts concerning the management and administration of the whole or any substantial part of the business ofthe Company were entered into or existed during the year.
MAJOR CUSTOMERS AND SUPPLIERSThe percentages of the five largest customers combined and the five largest suppliers combined are less than 30% ofthe Group’s total turnover and purchases, respectively.
DIRECTOR’S INTERESTS IN COMPETING BUSINESSPursuant to Rule 8.10 of the Listing Rules, the Company disclosed below that during the year and up to the date ofthis report, the following Directors were considered to have interests in the following businesses (“ExcludedBusinesses”), being businesses which competed or were likely to compete, either directly or indirectly, with thebusinesses of the Group, other than those businesses in which (a) the Group was interested and (b) the Directors’only interests were as directors appointed to represent the interests of the Group.
Mr Ang Keng Lam was a director of and had interests in shares in Allgreen Properties Limited (“Allgreen”), thebusinesses of which consisted of property investment and development, project management and operation of officepremises, retail space and serviced apartments in Singapore. The Directors believe that as the size of these ExcludedBusinesses is not insignificant when compared with the property businesses of the Group, it is likely that theseExcluded Businesses may compete with the property businesses of the Group in the Asia Pacific region. Allgreen waslisted on the Singapore Exchange Securities Trading Limited as at the date of this report.
Messrs Ang Keng Lam and Wong Siu Kong were directors of and had interests in shares in the Shangri-La AsiaLimited (“SA”) group of companies, the businesses of which consisted of hotel ownership and operation. TheDirectors believe that as the size of that part of these Excluded Businesses in Beijing, where the Group has hotelbusinesses, is not insignificant when compared with the hotel business of the Group in Beijing, it is likely that theseExcluded Businesses may compete with the hotel business of the Group in Beijing. SA was listed on the StockExchange as at the date of this report.
Messrs Ang Keng Lam and Wong Siu Kong were directors of (but did not have any interests in shares in) the ChinaWorld Trade Center Ltd. group of companies, the businesses of which consisted of property investment anddevelopment and hotel ownership and operation in the PRC. The Directors believe that as the size of theseExcluded Businesses is not insignificant when compared with the property and hotel businesses of the Group in thePRC, it is likely that these Excluded Businesses may compete with the property and hotel businesses of the Group inthe PRC.
87
DIRECTOR’S INTERESTS IN COMPETING BUSINESS (Continued)
Mr Wong Siu Kong was a director of and had interests in shares in Kuok (Singapore) Limited, one of the principalactivities of the Kuok (Singapore) Limited group of companies consisted of owners and operators of warehouses inSingapore and Malaysia. The Directors believe that as the size of these Excluded Businesses is not insignificant whencompared with the warehouse businesses of the Group in the South East Asian market, it is likely that theseExcluded Businesses may compete with the warehouse businesses of the Group in the South East Asian market.
The Executive Directors were directors of and/or had interests in shares in the Kerry Group Limited group ofcompanies, the businesses of which consisted of property investment and development, hotel ownership andoperation, warehouse ownership and operation, port terminal ownership and operation and freight operations. Thesize of these Excluded Businesses is considered to be insignificant when compared with similar businesses of theGroup. On this basis, the Directors do not consider any competition between these Excluded Businesses as specifiedunder this paragraph and similar businesses of the Group to be significant.
The Excluded Businesses are operated and managed by companies (and in the case of Allgreen, and SA, by publiclylisted companies) with independent management and administration. On this basis, the Directors believe that theGroup is capable of carrying on its businesses independently of the Excluded Businesses and at arm’s length from theExcluded Businesses.
The Directors, including those interested in the Excluded Businesses, will, as and when required under the Bye-lawsof the Company, abstain from voting on any resolution of the Board in respect of any contract, arrangement orproposal in which he or any of his associates has a material interest.
CONNECTED TRANSACTIONS(I) On 12 August 2005, the Company announced that Clever Wise Management Limited (“Clever Wise”), an
indirect non-wholly owned subsidiary of the Company, entered into several agreements dated 5 August 2005(collectively, the “Eas Agreements”) with Mr Tay Poh Cheok (a shareholder of Eas International Transportation(S’pore) Pte Ltd (“EIT”) and Eas International Shipping Pte Ltd (“EIS”) holding 39% and 35% of the issued sharecapital of EIT and EIS respectively prior to the transfer of shares under the Eas Agreements) and Ms Lim BengLay (a shareholder of EIT and EIS holding 6% and 5% of the issued share capital of EIT and EIS respectively priorto the transfer of the shares under the Eas Agreements). Under the Eas Agreements, Clever Wise has agreed tosell its entire shareholdings in EIT and EIS, representing 55% and 60% of the respective issued share capital ofEIT and EIS, to Mr Tay and Ms Lim at an aggregate sum of S$1,005,602 (approximately HK$4,746,440) subjectto the terms and conditions of the Eas Agreements. The transaction will enable the Group to better coordinateand utilise its resources and capital deployed and maximise the synergy with other offices within the Group’sglobal freight forwarding network.
Before the entering into of the Eas Agreements, EIT and EIS were indirect non-wholly owned subsidiaries of theCompany. Mr Tay was a substantial shareholder and a director of each of EIT and EIS and the spouse of Ms Lim,and hence a connected person of the Company. Ms Lim was a director of each of EIT and EIS and the spouseof Mr Tay, and hence also a connected person of the Company. The entering into of the Eas Agreements weretherefore connected transactions of the Company under the Listing Rules.
88
REPORT OF THE DIRECTORS (Continued)
CONNECTED TRANSACTIONS (Continued)
(II) On 2 December 2005, the Company and SA jointly announced that 上海陸家嘴金融貿易區開發股份有限公司 (Shanghai Lujiazui Finance & Trade Zone Development Co., Ltd.) (“Party A”), Kerry Shanghai (Pudong)Ltd. (“Party B”), Kerry Shanghai Pudong Investments Ltd. (“Party C”) and Allgreen Properties (Shanghai) Pte.Ltd. (“Party D”) (collectively, the “JV Parties”) entered into a joint venture contract (the “JV Contract”) dated 9October 2005 for the establishment of a joint venture company (“JVCO”) to undertake a property developmentproject in Pudong, Shanghai, PRC. Upon its establishment, JVCO will be owned by Party A, Party B (a wholly-owned subsidiary of SA), Party C (a wholly-owned subsidiary of the Company) and Party D in the proportionsof 20%, 23.20%, 40.80% and 16%, respectively.
The scope of business of the JVCO is to acquire a plot of land adjacent to the Shanghai New International ExpoCentre, Pudong, Shanghai, PRC with an area of approximately 58,900 sq.m. (the “Project Site”) currently ownedby a state-owned enterprise, namely, 上海市浦東土地發展(控股)公司 (Shanghai Pudong Land Development(Holding) Corporation) and to develop the Project Site into a mixed-use development which is currentlyintended to comprise (subject to market conditions) hotel (with meeting facilities), offices, serviced suites/serviced apartments, commercial and related ancillary facilities.
To cater for any possible increase in the total investment amount of JVCO due to unforeseen factors beyondthe current expectations of the JV Parties, on 30 November 2005, Party B, Party C and Party D also enteredinto a funding agreement (the “Funding Agreement”) pursuant to which Party B, Party C and Party D agree thatif a funding request in excess of the total investment amount under the JV Contract of US$489,604,000(approximately HK$3,818,911,200) is made by JVCO in accordance with the terms of the JV Contract, they will,as between themselves, contribute to such funding request in proportion to their then respective capitalcontributions in JVCO and upon the same terms and conditions. The purpose of the Funding Agreement is torecord the agreement amongst Party B, Party C and Party D that none of them shall be obliged to commitfurther funding contribution to, or for the benefit of, JVCO if the total investment amount of JVCO exceedsUS$590,000,000 (approximately HK$4,602,000,000).
Party B, Party C and Party D are wholly-owned subsidiaries of SA, the Company and Allgreen PropertiesLimited (“AG”), respectively. Kerry Holdings Limited (“KHL”) is the controlling shareholder of the Companyunder the Listing Rules. SA is an associate of KHL under the Listing Rules and is therefore a connected personof the Company. The controlling shareholder of AG, Kuok (Singapore) Limited, owns 100% of a substantialshareholder of a non-wholly owned subsidiary of the Company. Therefore, AG is a connected person of theCompany at the subsidiaries’ level.
Accordingly, the entering into of the JV Contract and the Funding Agreement constitute connected transactionsfor the Company under the Listing Rules. The JV Contract and the Funding Agreement were approved by theindependent shareholders of the Company at a special general meeting held on 16 February 2006.
(III) On 10 February 2006, the Company announced that Kerry Environmental Limited (“KEL”), Chemquest (Overseas)Limited (“CQOL”) and Kerry CQ Environmental Engineering Limited (“KCQE”) (owned by KEL and CQOL inthe proportions of 51% and 49%, respectively) entered into a joint venture agreement on 26 September 2005(the “KCQE Agreement”) in respect of KCQE.

89
CONNECTED TRANSACTIONS (Continued)
The scope of business of KCQE is to invest in a project relating to the building, operation and maintenance of aplant for the purpose of waste incineration and generating electricity in Changzhou City, Jiangsu Province, thePRC (the “Changzhou Project”).
The total maximum contribution to be made by KEL and CQOL shall be RMB164 million (approximatelyHK$157.7 million). KEL and CQOL are required to provide their proportionate share of such commitment inthe sum of RMB83.64 million (approximately HK$80.4 million) and RMB80.36 million (approximately HK$77.3million), respectively.
The Changzhou Project represents a good opportunity for the Group to strengthen its business in theinfrastructure-related investment in the PRC.
KEL is an indirect wholly-owned subsidiary of the Company. CQOL is a substantial shareholder of KCQE and itis therefore a connected person of the Company under the Listing Rules. Accordingly, the transaction contemplatedunder the KCQE Agreement constitutes a connected transaction of the Company under the Listing Rules.
CONTINUING CONNECTED TRANSACTIONSDuring the financial year ended 31 December 2005, the Company has in effect the continuing connected transactionsset out below which are potentially non-exempt continuing connected transactions under the revised Listing Ruleswhich came into effect on 31 March 2004.
Shangri-La International Hotel Management Limited (“SLIM”) has been providing hotel management, marketing,communication and reservation services (“Hotel Management Services”) to The Kerry Centre Hotel in Beijing, Chinapursuant to hotel management, marketing and related agreements (“Hotel Management Agreements”) entered intobetween Beijing Kerry Centre Hotel Co., Ltd. (“BKCH”) and SLIM on 30 June 1998. BKCH is the owner of The KerryCentre Hotel, Beijing. BKCH is owned as to 95% by Kerry Beijing (Guang Hua) Ltd which is owned as to 75% by theGroup and 25% by the SA Group. SLIM is indirectly owned by SA, an associate of KHL (which is a substantialshareholder of the Company). Accordingly, the provision of the Hotel Management Services by SLIM to BKCH arecontinuing connected transactions of the Company under the Listing Rules.
During the year ended 31 December 2005, an aggregate amount of HK$18,423,000 have been paid to SLIM and itsrelated entities by BKCH.
The Hotel Management Agreements, which were entered into prior to the revised Listing Rules coming into effecton 31 March 2004, are for a period longer than 3 years and are not subject to annual caps. The Company isconsulting the Stock Exchange whether it is necessary for the Company to conform to the requirements forcontinuing connected transactions under the revised Listing Rules in respect of these transactions in view of the factthat it may not be feasible to terminate these transactions and enter into new arrangements with SLIM.
For the year ended 31 December 2005, the aggregate amount paid to SLIM is more than 0.1% but less than 2.5% ofthe applicable percentage ratios (as defined under the Listing Rules).
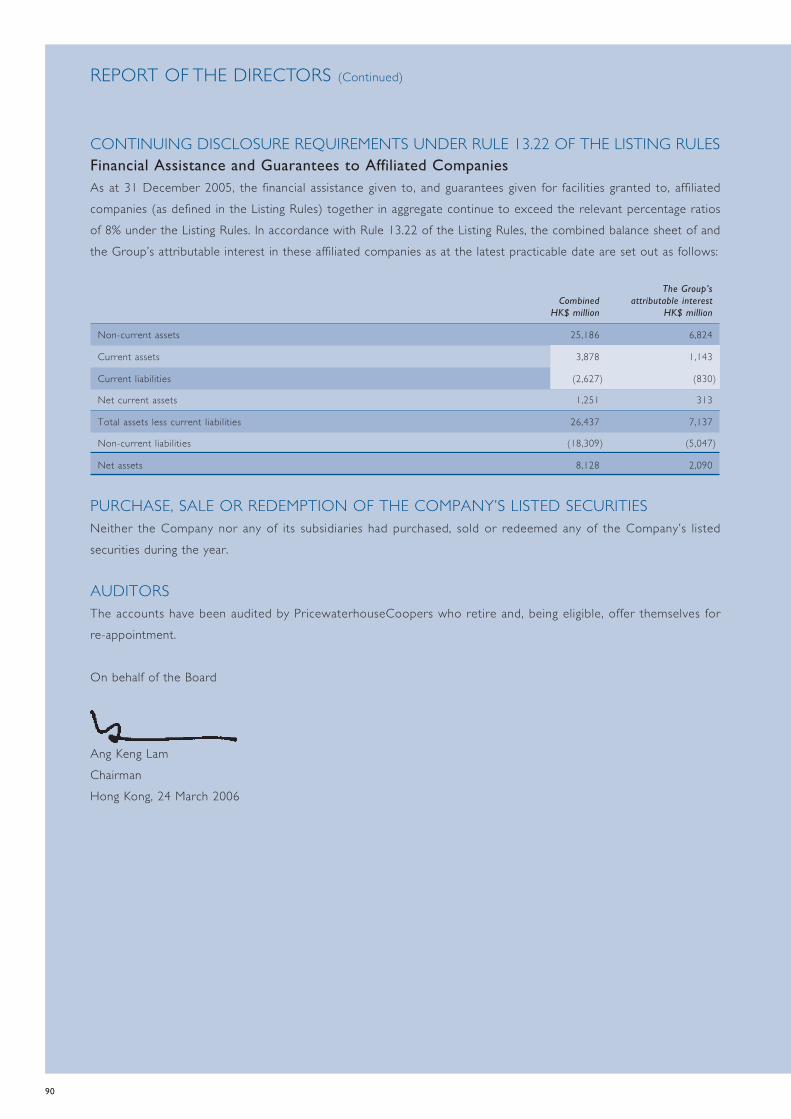
90
REPORT OF THE DIRECTORS (Continued)
CONTINUING DISCLOSURE REQUIREMENTS UNDER RULE 13.22 OF THE LISTING RULESFinancial Assistance and Guarantees to Affiliated CompaniesAs at 31 December 2005, the financial assistance given to, and guarantees given for facilities granted to, affiliatedcompanies (as defined in the Listing Rules) together in aggregate continue to exceed the relevant percentage ratiosof 8% under the Listing Rules. In accordance with Rule 13.22 of the Listing Rules, the combined balance sheet of andthe Group’s attributable interest in these affiliated companies as at the latest practicable date are set out as follows:
The Group’sCombined attributable interest
HK$ million HK$ million
Non-current assets 25,186 6,824
Current assets 3,878 1,143
Current liabilities (2,627) (830)
Net current assets 1,251 313
Total assets less current liabilities 26,437 7,137
Non-current liabilities (18,309) (5,047)
Net assets 8,128 2,090
PURCHASE, SALE OR REDEMPTION OF THE COMPANY’S LISTED SECURITIESNeither the Company nor any of its subsidiaries had purchased, sold or redeemed any of the Company’s listedsecurities during the year.
AUDITORSThe accounts have been audited by PricewaterhouseCoopers who retire and, being eligible, offer themselves forre-appointment.
On behalf of the Board
Ang Keng LamChairmanHong Kong, 24 March 2006

91
AUDITORS’ REPORT
AUDITORS’ REPORT TO THE SHAREHOLDERS OF
KERRY PROPERTIES LIMITED
(incorporated in Bermuda with limited liability)
We have audited the accounts on pages 92 to 186 which have been prepared in accordance with accountingprinciples generally accepted in Hong Kong.
RESPECTIVE RESPONSIBILITIES OF DIRECTORS AND AUDITORSThe Company’s directors are responsible for the preparation of accounts which give a true and fair view. Inpreparing accounts which give a true and fair view it is fundamental that appropriate accounting policies are selectedand applied consistently.
It is our responsibility to form an independent opinion, based on our audit, on those accounts and to report ouropinion solely to you, as a body, in accordance with section 90 of the Companies Act 1981 of Bermuda, and for noother purpose. We do not assume responsibility towards or accept liability to any other person for the contents ofthis report.
BASIS OF OPINIONWe conducted our audit in accordance with Hong Kong Standards on Auditing issued by the Hong Kong Institute ofCertified Public Accountants. An audit includes examination, on a test basis, of evidence relevant to the amounts anddisclosures in the accounts. It also includes an assessment of the significant estimates and judgements made by thedirectors in the preparation of the accounts, and of whether the accounting policies are appropriate to thecircumstances of the Company and the Group, consistently applied and adequately disclosed.
We planned and performed our audit so as to obtain all the information and explanations which we considerednecessary in order to provide us with sufficient evidence to give reasonable assurance as to whether the accountsare free from material misstatement. In forming our opinion we also evaluated the overall adequacy of the presentationof information in the accounts. We believe that our audit provides a reasonable basis for our opinion.
OPINIONIn our opinion, the accounts give a true and fair view of the state of affairs of the Company and of the Group as at31 December 2005 and of the Group’s profit and cash flows for the year then ended and have been properlyprepared in accordance with the disclosure requirements of the Hong Kong Companies Ordinance.
PricewaterhouseCoopers
Certified Public Accountants
Hong Kong, 24 March 2006

92
CONSOLIDATED INCOME STATEMENTFor the year ended 31 December 2005
2005 2004Note HK$’000 HK$’000
(Restated)
Turnover 5 8,008,824 5,102,442
Cost of sales (555,226) (907,233)
Direct operating expenses (5,180,624) (2,355,476)
Gross profit 2,272,974 1,839,733
Other revenues 5 115,572 45,692
Other income 42,856 26,891
Administrative expenses (525,720) (333,186)
1,905,682 1,579,130
Change in fair value of investment properties 1,546,669 –
Revaluation (deficit)/surplus on investment propertiesand other leasehold land and buildings (4,499) 298,601
Operating profit before finance costs 6 3,447,852 1,877,731
Finance costs 7 (201,679) (145,119)
Operating profit 3,246,173 1,732,612
Share of results of associated companies 510,105 555,503
Profit before taxation 3,756,278 2,288,115
Taxation 8 (494,199) 139,910
Profit for the year 3,262,079 2,428,025
Profit attributable to:
Company’s shareholders 3,066,863 2,271,133
Minority interests 195,216 156,892
3,262,079 2,428,025
Dividends 10 851,753 723,948
Earnings per share
– Basic 11 HK$2.53 HK$1.90
– Diluted 11 HK$2.43 HK$1.89

93
CONSOLIDATED BALANCE SHEETAs at 31 December 2005
2005 2004Note HK$’000 HK$’000
(Restated)
ASSETS AND LIABILITIES
Non-current assets
Property, plant and equipment 13 2,127,365 2,074,901Investment properties 14 20,510,591 19,105,540Leasehold land and land use rights 15 325,326 392,215Properties under development 16 7,855,171 2,804,657Associated companies 18 6,331,909 4,521,287Derivative financial instruments 19 11,663 –Available-for-sale investments 20 1,431,639 –Long-term investments 21 – 1,249,480Long-term receivables 22 102,503 167,098Goodwill 23 244,061 99,242
38,940,228 30,414,420Current assets
Stock of completed properties held for sale 24 248,557 518,225Properties under development for sale 608,878 297,553Accounts receivable, prepayments and deposits 22 2,796,880 1,668,775Tax recoverable 33,840 47,461Tax reserve certificates 12,188 19,926Listed securities at fair value through profit or loss 25 25,868 –Trading securities 26 – 3,679Pledged bank deposits 27,41 32,514 73,636Cash and bank balances 27 2,531,746 2,161,234
6,290,471 4,790,489Current liabilities
Accounts payable, deposits received and accrued charges 28 2,502,615 2,147,976Taxation 109,860 150,372Short-term bank loans and current portion of long-term bank loans 29 1,016,983 680,428Unsecured bank overdrafts 27 318 1,113
3,629,776 2,979,889Net current assets 2,660,695 1,810,600Total assets less current liabilities 41,600,923 32,225,020Non-current liabilities
Long-term bank loans 29 8,317,403 5,476,382Convertible bonds 30 2,413,095 –Amounts due to minority shareholders 31 1,835,789 1,727,537Derivative financial instruments 19 39,678 –Deferred taxation 32 2,097,083 1,746,997
14,703,048 8,950,916ASSETS LESS LIABILITIES 26,897,875 23,274,104Equity
Capital and reserves attributable to the Company’s shareholdersShare capital 33 1,216,579 1,211,116Share premium 35 3,918,838 3,857,220Other reserves 36 9,699,847 9,961,089Retained profits 9,777,277 6,815,112Proposed final dividend 10 608,289 484,447
25,220,830 22,328,984Minority interests 1,677,045 945,120TOTAL EQUITY 26,897,875 23,274,104
On behalf of the Board
Ang Keng Lam Wong Siu KongDirector Director

94
BALANCE SHEETAs at 31 December 2005
2005 2004Note HK$’000 HK$’000
ASSETS AND LIABILITIES
Non-current assets
Property, plant and equipment 13 2,267 1,326
Subsidiaries 17 31,263,289 27,294,088
Derivative financial instruments 19 11,663 –
31,277,219 27,295,414
Current assets
Dividends receivable 700,000 730,000
Accounts receivable, prepayments and deposits 7,627 8,156
Tax recoverable – 368
Cash and bank balances 8,266 130,946
715,893 869,470
Current liabilities
Accounts payable and accrued charges 53,249 31,902
Short-term bank loans and current portion of long-term bank loans 29 450,000 150,000
503,249 181,902
Net current assets 212,644 687,568
Total assets less current liabilities 31,489,863 27,982,982
Non-current liabilities
Long-term bank loans 29 7,380,000 4,130,000
Derivative financial instruments 19 39,678 –
7,419,678 4,130,000
ASSETS LESS LIABILITIES 24,070,185 23,852,982
Equity
Capital and reserves attributable to the Company’s shareholders
Share capital 33 1,216,579 1,211,116
Share premium 35 3,918,838 3,857,220
Other reserves 36 17,973,304 17,801,176
Retained profits 353,175 499,023
Proposed final dividend 10 608,289 484,447
TOTAL EQUITY 24,070,185 23,852,982
On behalf of the Board
Ang Keng Lam Wong Siu KongDirector Director

95
CONSOLIDATED CASH FLOW STATEMENTFor the year ended 31 December 2005
2005 2004Note HK$’000 HK$’000
Operating activities
Net cash generated from operations 37(a) 712,532 2,168,493
Interest paid (267,193) (218,529)
Hong Kong profits tax paid (112,249) (33,297)
PRC and overseas tax paid (127,778) (82,200)
Net cash from operating activities 205,312 1,834,467
Investing activities
Additions of property, plant and equipment (119,605) (76,660)
Additions of investment properties (14,421) (22,353)
Additions of properties under development (4,249,585) (558,236)
Purchase of leasehold land and land use rights (1,583) –
Purchase of subsidiaries 37(c) (182,770) (436,856)
Purchase of additional interest in subsidiaries (89,403) (190,000)
Additional investments in associated companies – (39,750)
(Additional loans to)/repayment of loans from associated companies (1,518,485) 636,229
Decrease in available-for-sale investments 2,951 –
Purchase of long-term investments – (574)
Purchase of business – (1,000)
Decrease in long-term receivables 78,086 99,146
Interest received 101,758 34,165
Dividends received from associated companies 283,321 109,191
Dividends received from listed and unlisted investments 13,936 11,569
(Additional loans to)/repayment of loans from investee companies (93) 978
Proceeds from sale of property, plant and equipment 15,187 3,979
Proceeds from sale of investment properties 464,502 65,383
Proceeds from sale of an associated company – 4,336
Proceeds from sale of long-term investments – 775
Net cash used in investing activities (5,216,204) (359,678)
Net cash (outflow)/inflow before financing (5,010,892) 1,474,789

96
CONSOLIDATED CASH FLOW STATEMENT (Continued)For the year ended 31 December 2005
2005 2004Note HK$’000 HK$’000
Financing activities
Proceeds from issue of shares 43,272 46,094
Proceeds from issue of convertible bonds, net of direct issue costs 2,469,895 –
Repayment of bank loans (682,826) (9,513,944)
Drawdown of bank loans 3,869,306 9,013,574
Dividends paid (704,102) (216,106)
Capital injection from minority shareholders 320,684 18,862
Dividends paid to minority shareholders in subsidiaries (20,409) (4,419)
Increase/(decrease) in loans from minority shareholders 45,257 (177,234)
Net cash generated from/(used in) financing 5,341,077 (833,173)
Increase in cash and cash equivalents 330,185 641,616
Cash and cash equivalents at 1 January 2,233,757 1,592,141
Cash and cash equivalents at 31 December 27 2,563,942 2,233,757

97
CONSOLIDATED STATEMENT OF CHANGES IN EQUITYFor the year ended 31 December 2005
Attributable to shareholders of the Company
Share Share Other Retained Proposed Minority Totalcapital premium reserves profits dividend Total interests equity
HK$’000 HK$’000 HK$’000 HK$’000 HK$’000 HK$’000 HK$’000 HK$’000
Balance as at 1 January 2004,as previously reported as equity 1,191,527 3,628,591 9,209,944 5,673,768 178,729 19,882,559 – 19,882,559
Balance as at 1 January 2004,as previously separately reportedas minority interests – – – – – – 419,609 419,609
Deferred tax arising fromthe revaluation of investmentproperties – – (60,165) (342,958) – (403,123) – (403,123)
Depreciation adjustmentfor land and buildings – – (57,868) (19,515) – (77,383) – (77,383)
Hotel adjustment resultingfrom adoption of HK-Int 2 – – 29,464 (42,628) – (13,164) (5,312) (18,476)
Balance as at 1 January 2004,as restated 1,191,527 3,628,591 9,121,375 5,268,667 178,729 19,388,889 414,297 19,803,186
Revaluation surplus on propertiescredited to revaluation reserves – – 1,469,769 – – 1,469,769 – 1,469,769
Deferred tax chargedto revaluation reserves – – (751,056) – – (751,056) – (751,056)
Fair value gain on non-tradingsecurities – – 101,151 – – 101,151 – 101,151
Exchange differences arisingon translation of the accountsof the PRC and overseassubsidiaries and associatedcompanies – – 19,110 – – 19,110 – 19,110
Net gain recognised directly in equity – – 838,974 – – 838,974 – 838,974Profit for the year – – – 2,271,133 – 2,271,133 156,892 2,428,025Total recognised gain for
the year ended 31 December 2004 – – 838,974 2,271,133 – 3,110,107 156,892 3,266,999Issue of share capital 19,589 228,629 – – – 248,218 – 248,218Dividends paid – – – (239,501) (178,729) (418,230) (4,419) (422,649)2004 proposed final dividend – – – (484,447) 484,447 – – –Transfer – – 740 (740) – – – –Share of deferred tax – – – – – – (69,192) (69,192)Share of revaluation reserves – – – – – – 116,529 116,529Purchase of subsidiaries – – – – – – 308,742 308,742Purchase of additional interest
in subsidiaries – – – – – – 1,469 1,469Capital injection from minority
shareholders – – – – – – 18,862 18,862Exchange adjustments – – – – – – 1,940 1,940
19,589 228,629 740 (724,688) 305,718 (170,012) 373,931 203,919Balance as at 31 December 2004 1,211,116 3,857,220 9,961,089 6,815,112 484,447 22,328,984 945,120 23,274,104

98
CONSOLIDATED STATEMENT OF CHANGES IN EQUITY (Continued)For the year ended 31 December 2005
Attributable to shareholders of the Company
Share Share Other Retained Proposed Minority Totalcapital premium reserves profits dividend Total interests equity
HK$’000 HK$’000 HK$’000 HK$’000 HK$’000 HK$’000 HK$’000 HK$’000
Balance as at 1 January 2005 1,211,116 3,857,220 9,961,089 6,815,112 484,447 22,328,984 945,120 23,274,104Opening adjustment
for the adoption of HKAS 39 – – (11,244) (81,881) – (93,125) – (93,125)Opening adjustment
for the adoption of HKAS 40 – – (721,804) 721,804 – – – –Opening adjustment
for the adoption of HKFRS 3 – – – 107,954 – 107,954 – 107,954Balance as at 1 January 2005,
as restated 1,211,116 3,857,220 9,228,041 7,562,989 484,447 22,343,813 945,120 23,288,933Fair value gain on leasehold
buildings, port facilitiesand freehold land and buildings – – 108,741 – – 108,741 – 108,741
Deferred tax chargedto revaluation reserves – – (46,452) – – (46,452) – (46,452)
Fair value gain on available-for-saleinvestments – – 207,337 – – 207,337 – 207,337
Fair value gain on derivativefinancial instruments – – 13,189 – – 13,189 – 13,189
Exchange differences arisingon translation of the accountsof the PRC and overseassubsidiaries and associatedcompanies – – 16,041 – – 16,041 – 16,041
Net gain recognised directly in equity – – 298,856 – – 298,856 – 298,856Profit for the year – – – 3,066,863 – 3,066,863 195,216 3,262,079Total recognised gain for
the year ended 31 December 2005 – – 298,856 3,066,863 – 3,365,719 195,216 3,560,935Issue of share capital 5,463 61,618 – – – 67,081 – 67,081Issue of convertible bonds – – 143,501 – – 143,501 – 143,501Issue of share options – – 28,627 – – 28,627 – 28,627Dividends paid – – – (243,464) (484,447) (727,911) (83,404) (811,315)2005 proposed final dividend – – – (608,289) 608,289 – – –Transfer – – 822 (822) – – – –Share of deferred tax – – – – – – (14,520) (14,520)Share of revaluation reserves – – – – – – 38,412 38,412Purchase of subsidiaries – – – – – – 328,202 328,202Purchase of additional interest
in subsidiaries – – – – – – (67,217) (67,217)Capital injection from minority
shareholders – – – – – – 320,684 320,684Exchange adjustments – – – – – – 14,552 14,552
5,463 61,618 172,950 (852,575) 123,842 (488,702) 536,709 48,007Balance as at
31 December 2005 1,216,579 3,918,838 9,699,847 9,777,277 608,289 25,220,830 1,677,045 26,897,875

99
NOTES TO THE CONSOLIDATED FINANCIAL STATEMENTS
1 GENERAL INFORMATIONThe Company is a limited liability company incorporated in Bermuda. The address of its registered office isCanon’s Court, 22 Victoria Street, Hamilton HM12, Bermuda.
The Company has its primary listing on The Stock Exchange of Hong Kong Limited.
The principal activities of the Company’s subsidiaries comprise the following:
(i) property development and investment in Hong Kong, the People’s Republic of China (“PRC”) and the AsiaPacific region;
(ii) logistics, freight and warehouse ownership and operations;
(iii) infrastructure-related investment in Hong Kong and the PRC;
(iv) hotel ownership and operations in the PRC; and
(v) project and property management in Hong Kong, the PRC and the Asia Pacific region.
These consolidated financial statements are presented in thousands of Hong Kong dollars (HK$’000), unlessotherwise stated. These consolidated financial staements have been approved for issue by the Board of Directorson 24 March 2006.
2 PRINCIPAL ACCOUNTING POLICIESThe principal accounting policies applied in the preparation of these consolidated financial statements are setout below. These policies have been consistently applied to all the years presented, unless otherwise stated.
(a) Basis of preparationThe consolidated financial statements of Kerry Properties Limited have been prepared in accordance withHong Kong Financial Reporting Standards (“HKFRS”). The consolidated financial statements have beenprepared under the historical cost convention, as modified by the revaluation of buildings, available-for-salefinancial assets, financial assets and financial liabilities (including derivative instruments) at fair value throughprofit or loss and investment properties, which are carried at fair value.
The preparation of financial statements in conformity with HKFRS requires the use of certain criticalaccounting estimates. It also requires management to exercise its judgement in the process of applying theCompany’s accounting policies. The areas involving a higher degree of judgement or complexity, or areaswhere assumptions and estimates are significant to the consolidated financial statements, are disclosed innote 4.

100
NOTES TO THE CONSOLIDATED FINANCIAL STATEMENTS (Continued)
2 PRINCIPAL ACCOUNTING POLICIES (Continued)(a) Basis of preparation (Continued)
The adoption of new/revised HKFRSIn 2005, the Group adopted the new/revised standards and interpretations of HKFRS below, which arerelevant to its operations. The 2004 comparatives have been amended as required, in accordance with therelevant requirements.
HKAS 1 Presentation of Financial StatementsHKAS 2 InventoriesHKAS 7 Cash Flow StatementsHKAS 8 Accounting Policies, Changes in Accounting Estimates and ErrorsHKAS 10 Events after the Balance Sheet DateHKAS 16 Property, Plant and EquipmentHKAS 17 LeasesHKAS 21 The Effects of Changes in Foreign Exchange RatesHKAS 23 Borrowing CostsHKAS 24 Related Party DisclosuresHKAS 27 Consolidated and Separate Financial StatementsHKAS 28 Investments in AssociatesHKAS 32 Financial Instruments: Disclosure and PresentationHKAS 33 Earnings per ShareHKAS 36 Impairment of AssetsHKAS 38 Intangible AssetsHKAS 39 Financial Instruments: Recognition and MeasurementHKAS 39 Amendment Transitional and Initial Recognition of Financial Assets and Financial LiabilitiesHKAS 40 Investment PropertyHK-Int 2 The Appropriate Accounting Policies for Hotel PropertiesHKAS-Int 12 Amendment Scope of HKAS-Int 12 Consolidation – Special Purpose EntitiesHKAS Int 15 Operating Leases – IncentivesHKAS-Int 21 Income Taxes – Recovery of Revalued Non-Depreciable AssetsHKFRS 2 Share-based PaymentHKFRS 3 Business Combinations

101
2 PRINCIPAL ACCOUNTING POLICIES (Continued)(a) Basis of preparation (Continued)
The adoption of new/revised HKASs 1, 2, 7, 8, 10, 16, 21, 23, 24, 27, 28, 33 and HKAS-Ints 12 and 15 didnot result in substantial changes to the Group’s accounting policies. In summary:
– HKAS 1 has affected the presentation of minority interests, share of net after-tax results of associatesand other disclosures.
– HKASs 2, 7, 8, 10, 16, 23, 27, 28, 33 and HKAS-Ints 12 and 15 had no material effect on the Group’spolicies.
– HKAS 21 had no material effect on the Group’s policy. The functional currency of each of theconsolidated entities has been re-evaluated based on the guidance to the revised standard. All themajor Group entities have the same functional currency as the presentation currency for respectiveentity financial statements.
– HKAS 24 has affected the identification of related parties and some other related-party disclosures.
The adoption of revised HKAS 17 has resulted in a change in the accounting policy relating to thereclassification of leasehold land and land use rights from property, plant and equipment to operatingleases. The up-front prepayments made for the leasehold land and land use rights are expensed in theincome statement on a straight-line basis over the period of the lease or when there is impairment, theimpairment is expensed in the income statement. In prior years, the leasehold land was accounted for atfair value or cost less aggregate depreciation and accumulated impairment.
The adoption of HKASs 32 and 39 has resulted in a change in the accounting policy relating to theclassification of financial assets at fair value through profit or loss and available-for-sale financial assets. Ithas also resulted in the recognition of derivative financial instruments at fair value and the change in therecognition and measurement of hedging activities.
The adoption of revised HKAS 40 has resulted in a change in the accounting policy under which all thechanges in fair values of investment properties are recorded in the income statement. In prior years, theincreases in fair value were credited to the investment properties revaluation reserve. Decreases in fairvalue were first set off against increases on earlier valuations on a portfolio basis and thereafter expensedin the income statement.
The adoption of HK-Int 2 has resulted in a change in the accounting policy under which an owner-operated hotel property would be accounted for as property, plant and equipment. The depreciableamount of the hotel building would be depreciated over its remaining useful economic life and the carryingamount of the leasehold land would be included in leasehold land and land use rights and amortised overthe remaining term of the lease. In prior years, the Group’s hotel property was accounted for as aninvestment property and no depreciation or amortisation was required.

102
NOTES TO THE CONSOLIDATED FINANCIAL STATEMENTS (Continued)
2 PRINCIPAL ACCOUNTING POLICIES (Continued)(a) Basis of preparation (Continued)
The adoption of revised HKAS-Int 21 has resulted in a change in the accounting policy relating to themeasurement of deferred tax liabilities arising from the revaluation of investment properties. Such deferredtax liabilities are measured on the basis of tax consequences that would follow from recovery of thecarrying amount of that asset through use. In prior years, the carrying amount of that asset was assumed tobe recovered through sale for deferred taxation purposes.
The adoption of HKFRS 2 has resulted in a change in the accounting policy for share-based payments. Until31 December 2004, the provision of share options to employees did not result in an expense in theincome statements. Effective on 1 January 2005, the Group expenses the fair value of share options in theincome statement. Under the transitional provision, retrospective treatment is required only in respect ofshare options granted after 7 November 2002 and had not yet vested on 1 January 2005. The Group hadno such options.
The adoption of HKFRS 3, HKAS 36 and HKAS 38 has resulted in a change in the accounting policy forgoodwill. Until 31 December 2004, goodwill was:
– Amortised on a straight line basis over its estimated useful life of not more than twenty years; and
– Assessed for an indication of impairment at each balance sheet date.
In accordance with the provisions of HKFRS 3 (note 2(i)):
– The Group ceased amortisation of goodwill from 1 January 2005;
– Accumulated amortisation as at 31 December 2004 has been eliminated with a corresponding decreasein the cost of goodwill;
– Unamortised negative goodwill was transferred to retained profits as at 1 January 2005;
– From the year ended 31 December 2005 onwards, goodwill is tested annually for impairment, as wellas when there is indication of impairment.
All changes in the accounting policies have been made in accordance with the transitional provisions in therespective standards, wherever applicable. All standards adopted by the Group require retrospectiveapplication other than:
– HKAS 21 – prospective accounting for goodwill and fair value adjustments as part of foreign operations;

103
2 PRINCIPAL ACCOUNTING POLICIES (Continued)(a) Basis of preparation (Continued)
– HKAS 39 – does not permit to recognise, derecognise and measure financial assets and liabilities inaccordance with this standard on a retrospective basis. The Group applied the previous Statement ofStandard Accounting Practice (“SSAP”) 24 “Accounting for investments in securities” to investmentsin securities and also to hedge relationships for the 2004 comparative information. The adjustmentsrequired for the accounting differences between SSAP 24 and HKAS 39 are determined and recognisedat 1 January 2005.
– HKAS 40 – since the Group has adopted the fair value model, there is no requirement for the Groupto restate the comparative information. Any adjustment was made to the retained profits as at 1January 2005, including the reclassification of any amount held in revaluation surplus for investmentproperty.
– HKAS-Int 15 – does not require the recognition of incentives for leases beginning before 1 January2005.
– HKFRS 2 – retrospective application only required for all equity instruments granted after 7 November2002 and not vested at 1 January 2005; and
– HKFRS 3 – this standard is required to be applied prospectively after 1 January 2005.

104
NOTES TO THE CONSOLIDATED FINANCIAL STATEMENTS (Continued)
2 PRINCIPAL ACCOUNTING POLICIES (Continued)(a) Basis of preparation (Continued)
The effect of the changes in the accounting policies on the profit for the year ended 31 December isestimated as follows:
2005 2004HK$’000 HK$’000
Gain arising from fair value change of investment properties held by:
– subsidiaries 1,546,669 –
– associated companies 16,650 –
1,563,319 –
Increase in deferred tax liabilities in relation to fair value gainof investment properties held by:
– subsidiaries (218,170) –
– associated companies (3,072) –
(221,242) –
Gain arising from fair value change of interest rate swap contracts 53,866 –Increase in amortisation and depreciation arising from reclassification of hotel properties
from investment properties to leasehold land and property, plant and equipment (21,881) (21,318)Decrease in deferred tax charged to the income statement
as a result of adoption of HKAS-Int 21 – 332,675
Increase in amortisation and depreciation arising from splitting of leasehold land and buildings (4,472) (1,913)
Decrease in amortisation of goodwill 6,025 –
Increase in expenses in relation to share options scheme (28,627) –
Increase in finance costs of convertible bonds (9,108) –
Increase in profit for the year 1,337,880 309,444
Attributable to:
Company’s shareholders 1,313,896 315,573
Minority interests 23,984 (6,129)
1,337,880 309,444
Analysis of the increase/(decrease) in profit for the year by line items:
Change in fair value of investment properties 1,546,669 –
Increase/(decrease) in share of results of associated companies 13,578 (991)
(Increase)/decrease in taxation (218,170) 333,666
Decrease in finance costs 44,758 –
Increase in direct operating expenses (26,353) (23,231)
Increase in administrative expenses (22,602) –
1,337,880 309,444
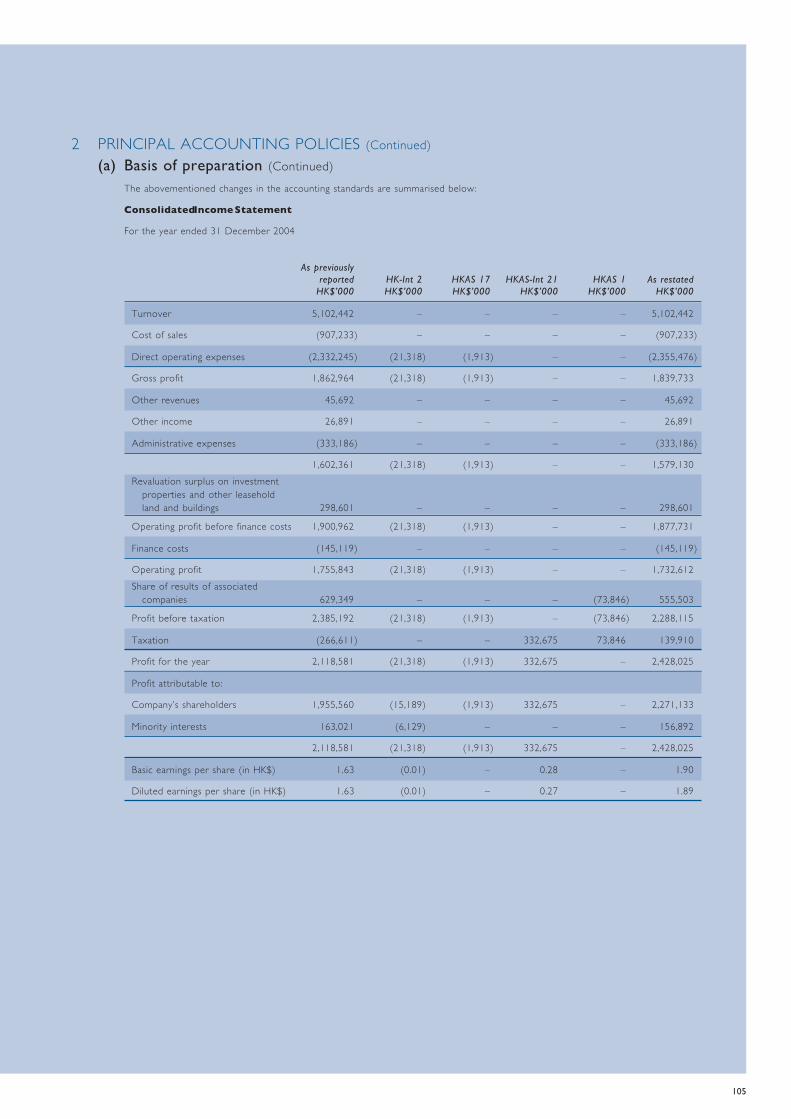
105
2 PRINCIPAL ACCOUNTING POLICIES (Continued)(a) Basis of preparation (Continued)
The abovementioned changes in the accounting standards are summarised below:
Consolidated Income Statement
For the year ended 31 December 2004
As previouslyreported HK-Int 2 HKAS 17 HKAS-Int 21 HKAS 1 As restated
HK$’000 HK$’000 HK$’000 HK$’000 HK$’000 HK$’000
Turnover 5,102,442 – – – – 5,102,442
Cost of sales (907,233) – – – – (907,233)
Direct operating expenses (2,332,245) (21,318) (1,913) – – (2,355,476)
Gross profit 1,862,964 (21,318) (1,913) – – 1,839,733
Other revenues 45,692 – – – – 45,692
Other income 26,891 – – – – 26,891
Administrative expenses (333,186) – – – – (333,186)
1,602,361 (21,318) (1,913) – – 1,579,130Revaluation surplus on investment
properties and other leaseholdland and buildings 298,601 – – – – 298,601
Operating profit before finance costs 1,900,962 (21,318) (1,913) – – 1,877,731
Finance costs (145,119) – – – – (145,119)
Operating profit 1,755,843 (21,318) (1,913) – – 1,732,612Share of results of associated
companies 629,349 – – – (73,846) 555,503
Profit before taxation 2,385,192 (21,318) (1,913) – (73,846) 2,288,115
Taxation (266,611) – – 332,675 73,846 139,910
Profit for the year 2,118,581 (21,318) (1,913) 332,675 – 2,428,025
Profit attributable to:
Company’s shareholders 1,955,560 (15,189) (1,913) 332,675 – 2,271,133
Minority interests 163,021 (6,129) – – – 156,892
2,118,581 (21,318) (1,913) 332,675 – 2,428,025
Basic earnings per share (in HK$) 1.63 (0.01) – 0.28 – 1.90
Diluted earnings per share (in HK$) 1.63 (0.01) – 0.27 – 1.89

106
NOTES TO THE CONSOLIDATED FINANCIAL STATEMENTS (Continued)
2 PRINCIPAL ACCOUNTING POLICIES (Continued)(a) Basis of preparation (Continued)
Consolidated Balance SheetAs at
1 JanuaryAs at 31 December 2004 Opening adjustments 2005
As previously HKASs 32reported HK-Int 2 HKAS 17 HKAS-Int 21 Reclassification As restated and 39 HKAS 40 HKFRS 3
HK$’000 HK$’000 HK$’000 HK$’000 HK$’000 HK$’000 HK$’000 HK$’000 HK$’000 HK$’000
Non-current assetsFixed assets 24,511,383 (24,511,383) – –Property, plant and equipment – (30,638) (495,647) 2,601,186 2,074,901 2,074,901Investment properties – 19,105,540 19,105,540 19,105,540Leasehold land and land use rights – 392,215 392,215 392,215Properties under development – 2,804,657 2,804,657 2,804,657Associated companies 4,531,570 (10,283) 4,521,287 (11,244) 4,510,043Available-for-sale investments – – 1,249,480 1,249,480Long-term investments 1,328,103 (78,623) 1,249,480 (1,249,480) –Long-term receivables 167,098 167,098 167,098Goodwill/(negative goodwill) 99,242 99,242 107,954 207,196
30,637,396 (30,638) (103,432) (88,906) – 30,414,420 (11,244) – 107,954 30,511,130Current assets
Stock of completed propertiesheld for sale 518,225 518,225 518,225
Properties under development for sale 297,553 297,553 297,553Accounts receivable, prepayments
and deposits 1,668,775 1,668,775 1,668,775Tax recoverable 47,461 47,461 47,461Tax reserve certificates 19,926 19,926 19,926Trading securities 3,679 3,679 (3,679) –Listed securities at fair value through
profit or loss – – 3,679 3,679Pledged bank deposits 73,636 73,636 73,636Cash and bank balances 2,161,234 2,161,234 2,161,234
4,790,489 – – – – 4,790,489 – – – 4,790,489Current liabilities
Accounts payable, deposits receivedand accrued charges 2,147,976 2,147,976 2,147,976
Taxation 150,372 150,372 150,372Short-term bank loans and current
portion of long-term bank loans 680,428 680,428 680,428Derivative financial instruments – – 51,065 51,065Unsecured bank overdrafts 1,113 1,113 1,113
2,979,889 – – – – 2,979,889 51,065 – – 3,030,954Net current assets 1,810,600 – – – – 1,810,600 (51,065) – – 1,759,535Total assets less current liabilities 32,447,996 (30,638) (103,432) (88,906) – 32,225,020 (62,309) – 107,954 32,270,665Non-current liabilities
Long-term bank loans 5,476,382 5,476,382 5,476,382Amounts due to minority shareholders 1,727,537 1,727,537 1,727,537Derivative financial instruments – – 30,816 30,816Deferred taxation 1,267,740 (10,110) (24,136) 513,503 1,746,997 1,746,997
8,471,659 (10,110) (24,136) 513,503 – 8,950,916 30,816 – – 8,981,732ASSETS LESS LIABILITIES 23,976,337 (20,528) (79,296) (602,409) – 23,274,104 (93,125) – 107,954 23,288,933EquityCapital and reserves attributable to the
Company’s shareholdersShare capital 1,211,116 1,211,116 1,211,116Share premium 3,857,220 3,857,220 3,857,220Other reserves 10,567,892 43,191 (57,868) (592,126) 9,961,089 (11,244) (721,804) 9,228,041Retained profits 6,904,640 (57,817) (21,428) (10,283) 6,815,112 (81,881) 721,804 107,954 7,562,989Proposed final dividend 484,447 484,447 484,447
23,025,315 (14,626) (79,296) (602,409) – 22,328,984 (93,125) – 107,954 22,343,813Minority interests 951,022 (5,902) 945,120 945,120TOTAL EQUITY 23,976,337 (20,528) (79,296) (602,409) – 23,274,104 (93,125) – 107,954 23,288,933NAV per share (in HK$) 19.01 (0.01) (0.06) (0.50) – 18.44 (0.08) – 0.09 18.45

107
2 PRINCIPAL ACCOUNTING POLICIES (Continued)(a) Basis of preparation (Continued)
Certain new standards, amendments and interpretations to existing standards which have been publishedand are mandatory for the Group’s accounting periods beginning on or after 1 January 2006 or laterperiods but which the Group has not early adopted, are as follows:
– HKAS 19 (Amendment), Actuarial Gains and Losses, Group Plans and Disclosures (effective from 1January 2006).
– HKAS 39 (Amendment), Cash Flow Hedge Accounting of Forecast Intragroup Transactions (effectivefrom 1 January 2006).
– HKAS 39 (Amendment), The Fair Value Option (effective from 1 January 2006).
– HKAS 39 and HKFRS 4 (Amendment), Financial Guarantee Contracts (effective from 1 January 2006).
– HKFRS 7, Financial Instruments: Disclosures, and a complementary amendment to HKAS 1, Presentationof Financial Statements – Capital Disclosures (effective from 1 January 2007).
– HKFRS-Int 4, Determining whether an Arrangement contains a Lease (effective from 1 January 2006).
The Group has already commenced an assessment of the impact of these new standards, amendments andinterpretations but is not yet in a position to quantify the impact of these new standards, amendments andinterpretations on its results of operations and financial position.

108
NOTES TO THE CONSOLIDATED FINANCIAL STATEMENTS (Continued)
2 PRINCIPAL ACCOUNTING POLICIES (Continued)(b) Consolidation
The consolidated financial statements include the financial statements of the Company and all its subsidiariesmade up to 31 December.
(i) SubsidiariesSubsidiaries are all entities (including special purpose entities) over which the Group has the power togovern the financial and operating policies, generally accompanying a shareholding of more than onehalf of the voting rights. The existence and effect of potential voting rights that are currently exercisableor convertible are considered when assessing whether the Group controls another equity.
Subsidiaries are fully consolidated from the date on which control is transferred to the Group. Theyare de-consolidated from the date that control ceases.
The purchase method of accounting is used to account for the acquisition of subsidiaries by theGroup during the year. The cost of an acquisition is measured as the fair value of the assets given,equity instruments issued and liabilities incurred or assumed at the date of exchange, plus costsdirectly attributable to the acquisition. Identifiable assets acquired and liabilities and contingent liabilitiesassumed in a business combination are measured initially at their fair values at the acquisition date,irrespective of the extent of any minority interest. The excess of the cost of acquisition over the fairvalue of the Group’s share of the identifiable net assets acquired is recorded as goodwill. If the cost ofacquisition is less than the fair value of the net assets of the subsidiary acquired, the difference isrecognised directly in the income statement (see note 2(i)).
Intercompany transactions, balances and unrealised gains on transactions between group companiesare eliminated. Unrealised losses are also eliminated but considered an impairment indicator of animpairment of the asset transferred. Accounting policies of subsidiaries have been changed wherenecessary to ensure consistency with the policies adopted by the Group.
In the Company’s balance sheet, the investments in subsidiaries are stated at cost less provision forimpairment losses. The results of subsidiaries are accounted for by the Company on the basis ofdividends received and receivable.
(ii) Transactions with minority interestsThe Group applies a policy of treating transactions with minority interests as transactions with partiesexternal to the Group. Disposals to minority interests result in gains and losses for the Group that arerecorded in the income statement. Purchases from minority interests result in goodwill, being thedifference between any consideration paid and the relevant share acquired of the carrying value of netassets of the subsidiary.

109
2 PRINCIPAL ACCOUNTING POLICIES (Continued)(b) Consolidation (Continued)
(iii) Associated companiesAssociated companies are all entities over which the Group has significant influence but not control,generally accompanying a shareholding of between 20% and 50% of the voting rights. Investments inassociated companies are accounted for using the equity method of accounting and are initiallyrecognised at cost. The Group’s investment in associated companies includes goodwill (net of anyaccumulated impairment loss) identified on acquisition (see note 2(i)).
The Group’s share of its associated companies post-acquisition profits or losses is recognised in theincome statement, and its share of post-acquisition movements in reserves is recognised in reserves.The cumulative post-acquisition movements are adjusted against the carrying amount of the investment.When the Group’s share of losses in an associated companies equals or exceeds its interest in theassociated companies, including any other unsecured receivables, the Group does not recognisefurther losses, unless it has incurred obligations or made payments on behalf of the associatedcompanies.
Unrealised gains on transactions between the Group and its associated companies are eliminated tothe extent of the Group’s interest in the associates. Unrealised losses are also eliminated unless thetransaction provides evidence of an impairment of the asset transferred. Accounting policies ofassociated companies have been changed where necessary to ensure consistency with the policiesadopted by the Group.
In the Company’s balance sheet, the investments in associated companies are stated at cost lessprovision for impairment losses. The results of associated companies are accounted for by the Companyon the basis of dividends received and receivable.
(c) Segment reportingA business segment is a group of assets and operations engaged in providing products or services that aresubject to risks and returns that are different from those of other business segments. A geographicalsegment is engaged in providing products or services within a particular economic environment that aresubject to risks and returns that are different from those of segments operating in other economicenvironments.

110
NOTES TO THE CONSOLIDATED FINANCIAL STATEMENTS (Continued)
2 PRINCIPAL ACCOUNTING POLICIES (Continued)(d) Foreign currency translation
(i) Functional and presentation currencyItems included in the financial statements of each of the Group’s entities are measured using thecurrency of the primary economic environment in which the entity operates (the “functional currency”).The consolidated financial statements are presented in Hong Kong dollars, which is the Company’sfunctional and presentation currency.
(ii) Transactions and balancesForeign currency transactions are translated into the functional currency using the exchange ratesprevailing at the dates of the transactions. Foreign exchange gains and losses resulting from thesettlement of such transactions and from the translation at year-end exchange rates of monetaryassets and liabilities denominated in foreign currencies are recognised in the income statement.
Changes in the fair value of monetary securities denominated in foreign currency classified as available-for-sale are analysed between translation differences resulting from changes in the amortised cost ofthe security, and other changes in the carrying amount of the security. Translation differences arerecognised in the income statement, and other changes in carrying amount are recognised in equity.
Translation differences on non-monetary financial assets and liabilities are reported as part of the fairvalue gain or loss. Translation differences on non-monetary financial assets and liabilities such asequities held at fair value through profit or loss are recognised in the income statement as part of thefair value gain or loss. Translation differences on non-monetary financial assets such as equitiesclassified as available-for-sale are included in the fair value reserve in equity.
(iii) Group companiesThe results and financial position of all the Group entities (none of which has the currency of ahyperinflationary economy) that have a functional currency different from the presentation currencyare translated into the presentation currency as follows:
– assets and liabilities for each balance sheet presented are translated at the closing rate at thedate of that balance sheet;
– income and expenses for each income statement are translated at average exchange rates (unlessthis average is not a reasonable approximation of the cumulative effect of the rates prevailing onthe transaction dates, in which case income and expenses are translated at the dates of thetransactions); and
– all resulting exchange differences are recognised as a separate component of equity.

111
2 PRINCIPAL ACCOUNTING POLICIES (Continued)(d) Foreign currency translation (Continued)
On consolidation, exchange differences arising from the translation of the net investment in foreignoperations, and of borrowings and other currency instruments designated as hedges of such investments,are taken to shareholders’ equity. When a foreign operation is sold, exchange differences that wererecorded in equity are recognised in the income statement as part of the gain or loss on sale.
Goodwill and fair value adjustments arising on the acquisition of a foreign entity are treated as assets andliabilities of the foreign entity and translated at the closing rate.
(e) Property, plant and equipmentProperties comprise mainly hotel properties, warehouses and logistics centres, staff quarters, freehold landand buildings and port facilities. Properties, except for staff quarters, are shown at fair value, based onperiodic, but at least annual, valuations by external independent valuers, less subsequent depreciation. Anyaccumulated depreciation at the date of revaluation is eliminated against the gross carrying amount of theasset and the net amount is restated to the revalued amount of the asset. Staff quarters are stated at costless aggregate depreciation and accumulated impairment losses. Cost represents the purchase price of thestaff quarters and other costs incurred to bring them into existing use. All other property, plant andequipment are stated at historical cost less aggregate depreciation and accumulated impairment losses.Historical cost includes expenditure that is directly attributable to the acquisition of the items. Cost mayalso include transfers from equity of any gains/losses on qualifying cash flow hedges of foreign currencypurchases of property, plant and equipment.
Subsequent costs are included in the asset’s carrying amount or recognised as a separate asset, as appropriate,only when it is probable that future economic benefits associated with the item will flow to the Group andthe cost of the item can be measured reliably. All other repairs and maintenance are expensed in theincome statement during the financial period in which they are incurred.
Increases in the carrying amount arising on revaluation of properties are credited to other reserves inshareholders’ equity. Decreases that offset previous increases of the same asset are charged against otherreserves directly in equity; all other decreases are expensed in the income statement. Each year thedifference between depreciation based on the revalued carrying amount of the asset expensed in theincome statement and depreciation based on the asset’s original cost is transferred from other reserves toretained profits.

112
NOTES TO THE CONSOLIDATED FINANCIAL STATEMENTS (Continued)
2 PRINCIPAL ACCOUNTING POLICIES (Continued)(e) Property, plant and equipment (Continued)
Depreciation of property, plant and equipment is calculated using the straight-line method to allocate costor revalued amounts less their residual values over their estimated useful lives. The principal annual ratesused for this purpose are:
Properties other than freehold land and port facilities over their expected remaining useful lives ranging from 8 to 48 years
Port facilities 2.5%
Leasehold improvements 7% to 33%
Warehouse operating equipment 7% to 33%
Motor vehicles, furniture, fixtures and office equipment 7% to 33%
The assets’ residual values and useful lives are reviewed, and adjusted if appropriate, at each balance sheetdate.
An asset’s carrying amount is written down immediately to its recoverable amount if the asset’s carryingamount is greater than its estimated recoverable amount (see note 2(j)).
The gain or loss on disposal of properties is the difference between the net sales proceeds and thecarrying amount of the relevant asset, and is recognised in the income statement. Any revaluation reservebalance remaining attributable to the relevant asset is transferred to retained profits and is shown as amovement in reserves.
The gain or loss on all other property, plant and equipment is the difference between the net salesproceeds and the carrying amount of the relevant assets and is recognised in the income statement.
(f) Investment propertiesProperty that is held for long term rental yields or for capital appreciation or both, and that is notoccupied by the companies in the consolidated Group, is classified as investment property.
Investment property comprises land held under operating leases and buildings held under finance leases.
Land held under operating leases are classified and accounted for as investment property when the rest ofthe definition of investment property is met. The operating lease is accounted for as if it were a financelease.
Investment property is measured initially at its cost, including related transaction costs.

113
2 PRINCIPAL ACCOUNTING POLICIES (Continued)(f) Investment properties (Continued)
After initial recognition, investment property is carried at fair value. Fair value is based on active marketprices, adjusted, if necessary, for any difference in the nature, location or condition of the specific asset. Ifthis information is not available, the Group uses alternative valuation methods such as recent prices on lessactive markets or discounted cash flow projections. These valuations are reviewed annually by externalvaluers. Investment property that is being redeveloped for continuing use as investment property, or forwhich the market has become less active continues to be measured at fair value.
The fair value of investment property reflects, among other things, rental income from current leases andassumptions about rental income from future leases in the light of current market conditions.
The fair value also reflects, on a similar basis, any cash outflows that could be expected in respect of theproperty. Some of those outflows are recognised as a liability, including finance lease liabilities in respect ofland classified as investment property; others, including contingent rent payments, are not recognised in thefinancial statements.
Subsequent expenditure is charged to the asset’s carrying amount only when it is probable that futureeconomic benefits associated with the item will flow to the Group and the cost of the item can bemeasured reliably. All other repairs and maintenance costs are expensed in the income statement duringthe financial period in which they are incurred.
Changes in fair values are recognised in the income statement.
If an investment property becomes owner-occupied, it is reclassified as property, plant and equipment, andits fair value at the date of reclassification becomes its cost for accounting purposes. Property that is beingconstructed or developed for future use as investment property is classified as property under developmentand stated at cost until construction or development is complete, at which time it is reclassified andsubsequently accounted for as investment property.
If an item of property, plant and equipment becomes an investment property because its use has changed,any difference resulting between the carrying amount and the fair value of this item at the date of transferis recognised in equity as a revaluation of property, plant and equipment under HKAS 16. However, if a fairvalue gain reverses a previous impairment loss, the gain is recognised in the income statement.

114
NOTES TO THE CONSOLIDATED FINANCIAL STATEMENTS (Continued)
2 PRINCIPAL ACCOUNTING POLICIES (Continued)(g) Properties under development
Properties under development are investments in leasehold land and buildings on which construction workand development have not been completed. Properties under development comprise prepayments forleasehold land and land use rights that are measured at amortised cost less accumulated impairment losses,and a component in respect of the building that is stated at cost less accumulated impairment losses. Costcomprises construction costs and amounts capitalised in respect of amortisation of leasehold land prepaymentsand borrowing costs incurred in the acquisition of qualifying assets during the construction period and upto the date of completion of construction. On completion, the properties are reclassified to investmentproperties, property, plant and equipment or completed properties held for sale at the then carryingamount. Any difference between the fair value of the investment property and its carrying amount at thedate of reclassification is recognised in the income statement. Properties under development for salerepresent properties under development which are due to be completed within one year and are intendedfor sale.
(h) Completed properties held for saleCompleted properties held for sale are initially measured at the carrying amount of the property at thedate of reclassification from properties under development. Subsequently, the prepaid leasehold landcomponent is measured at amortised cost less accumulated impairment losses; the building component iscarried at the lower of cost and net realisable value. Net realisable value is the estimated selling price inthe ordinary course of business less selling expenses.
(i) GoodwillGoodwill represents the excess of the cost of an acquisition over the fair value of the Group’s share of thenet identifiable assets of the acquired subsidiary or associated company at the date of acquisition. Goodwillon acquisitions of associated companies is included in investments in associated companies. Separatelyrecognised goodwill is tested annually for impairment and carried at cost less accumulated impairmentlosses. Impairment losses on goodwill are not reversed. Gains and losses on the disposal of an entityinclude the carrying amount of goodwill relating to the entity sold.
Goodwill is allocated to cash-generating units for the purpose of impairment testing. The allocation is madeto those cash-generating units or groups of cash-generating units that are expected to benefit from thebusiness combination in which the goodwill arose.
(j) Impairment of non-financial assetsAssets that have an indefinite useful life are not subject to amortisation, which are at least tested annuallyfor impairment and are reviewed for impairment whenever events or changes in circumstances indicatethat the carrying amount may not be recoverable.

115
2 PRINCIPAL ACCOUNTING POLICIES (Continued)(j) Impairment of non-financial assets (Continued)
Assets that are subject to depreciation and amortisation are reviewed for impairment whenever events orchanges in circumstances indicate that the carrying amount may not be recoverable. An impairment loss isrecognised for the amount by which the asset’s carrying amount exceeds its recoverable amount. Therecoverable amount is the higher of an asset’s fair value less costs to sell and value in use. Such impairmentloss is recognised in the income statement except where the asset is carried at valuation and the impairmentloss does not exceed the revaluation surplus for that asset, in which case it is treated as a decrease inrevaluation reserve. For the purposes of assessing impairment, assets are grouped at the lowest levels forwhich there are separately identifiable cash flows (cash-operating units). Non-financial assets other thangoodwill that suffered an impairment are reviewed for possible reversal of the impairment at each reportingdate.
(k) InvestmentsFrom 1 January 2004 to 31 December 2004:
The Group classified its investments in securities, other than subsidiaries and associated companies, as non-trading securities and trading securities.
(i) Non-trading securitiesInvestments which were held for non-trading purpose were stated at fair value at the balance sheetdate. Changes in the fair value of individual securities were credited or debited to the non-tradingsecurities revaluation reserve until the security was sold, or was determined to be impaired. Upondisposal, the cumulative gain or loss representing the difference between the net sales proceeds andthe carrying amount of the relevant security, together with any surplus/deficit transferred from thenon-trading securities revaluation reserve, was dealt with in the income statement.
Where there was objective evidence that individual investments were impaired, the cumulative lossrecorded in the revaluation reserve was taken to the income statement.
(ii) Trading securitiesTrading securities were carried at fair value. At each balance sheet date, the net unrealised gains orlosses arising from the changes in fair value of trading securities were recognised in the incomestatement. Profits or losses on disposal of trading securities, representing the difference between thenet sales proceeds and the carrying amounts, were recognised in the income statement as they arose.
116
NOTES TO THE CONSOLIDATED FINANCIAL STATEMENTS (Continued)
2 PRINCIPAL ACCOUNTING POLICIES (Continued)(k) Investments (Continued)
From 1 January 2005 onwards:
The Group classifies its financial assets in the following categories: at fair value through profit or loss, loansand receivables, and available-for-sale. The classification depends on the purpose for which the financialassets were acquired. Management determines the classification of its financial assets at initial recognitionand re-evaluates this designation at every reporting date.
(i) Financial assets at fair value through profit or lossThis category has two sub-categories: financial assets held for trading, and those designated at fairvalue through profit or loss at inception. A financial asset is classified in this category if acquiredprincipally for the purpose of selling in the short term or if so designated by management. Derivativesare also categorised as held for trading unless they are designated as hedges. Assets in this categoryare classified as current assets if they are either held for trading or are expected to be realised within12 months of the balance sheet date.
(ii) Loans and receivablesLoans and receivables are non-derivative financial assets with fixed or determinable payments that arenot quoted in an active market. They are included in current assets, except for maturities greater than12 months after the balance sheet date. These are classified as non-current assets. Loans and receivablesare classified as long term receivables and account receivables in the balance sheet.
(iii) Available-for-sale financial assetsAvailable-for-sale financial assets are non-derivatives that are either designated in this category or notclassified in any of the other categories. They are included in non-current assets unless managementintends to dispose of the investment within 12 months of the balance sheet date.
Regular purchases and sales of investments are recognised on trade-date – the date on which the Groupcommits to purchase or sell the asset. Investments are initially recognised at fair value plus transactioncosts for all financial assets not carried at fair value through profit or loss. Financial assets carried at fairvalue through profit or loss are initially recognised at fair value and transaction costs are expensed in theincome statement. Investments are derecognised when the rights to receive cash flows from the investmentshave expired or have been transferred and the Group has transferred substantially all risks and rewards ofownership. Available-for-sale financial assets and financial assets at fair value through profit or loss aresubsequently carried at fair value. Loans and receivables are carried at amortised cost using the effectiveinterest method.
Gains and losses arising from changes in the fair value of the ‘financial assets at fair value through profit orloss’ category, including interest and dividend income, are presented in the income statement in the periodin which they arise.
117
2 PRINCIPAL ACCOUNTING POLICIES (Continued)(k) Investments (Continued)
Changes in the fair value of available-for-sale investments are recognised in equity.
When securities classified as available-for-sale are sold or impaired, the accumulated fair value adjustmentsrecognised in equity are included in the income statement. Dividends on available-for-sale equity instrumentsare recognised in the income statement when the Group’s right to receive payments is established.
The fair values of quoted investments are based on current bid prices. If the market for a financial asset isnot active (and for unlisted securities), the Group establishes fair value by using valuation techniques.These include the use of recent arm’s length transactions, reference to other instruments that are substantiallythe same, and discounted cash flow analysis, making maximum use of market inputs and relying as little aspossible on entity-specific inputs.
The Group assesses at each balance sheet date whether there is objective evidence that a financial asset ora group of financial assets is impaired. In the case of equity securities classified as available-for-sale, asignificant or prolonged decline in the fair value of the security below its cost is considered an indicationthat the securities are impaired. If any such evidence exists for available-for-sale financial assets, thecumulative loss – measured as the difference between the acquisition cost and the current fair value, lessany impairment loss on that financial asset previously recognised in the income statement – is removedfrom equity and recognised in the income statement. Impairment losses recognised in the income statementon equity instruments are not reversed through the income statement. Impairment testing of receivables isdescribed in note 2(l).
(l) Long-term receivables and accounts receivablesLong-term receivables and accounts receivables are recognised initially at fair value and subsequentlymeasured at amortised cost using the effective interest method, less provision for impairment. A provisionfor impairment of receivables is established when there is objective evidence that the Group will not beable to collect all amounts due according to the original terms of receivables. Significant financial difficultiesof the debtor, probability that the debtor will enter bankruptcy or financial reorganisation, and default ordelinquency in payments are considered indicators that the receivable is impaired. The amount of theprovision is the difference between the asset’s carrying amount and the present value of estimated futurecash flows, discounted at the effective interest rate. The amount of the provision is recognised in theincome statement.

118
NOTES TO THE CONSOLIDATED FINANCIAL STATEMENTS (Continued)
2 PRINCIPAL ACCOUNTING POLICIES (Continued)(m) Derivative financial instruments and hedging activities
From 1 January 2004 to 31 December 2004:
Derivative financial instruments are designated ‘hedging’ or ‘non-hedging instruments’. The transactionsthat, according to the Group’s policy for risk management, are able to meet the conditions for hedgeaccounting are classified as hedging transactions; the others, although set up for the purpose of managingrisk (since the Group’s policy does not permit speculative transactions), have been designated as ‘trading’.The Group records derivative financial instruments at cost. The gains and losses on derivative financialinstruments are included in the income statement on maturity to match the underlying hedged transactionswhere relevant.
For interest rate instruments designated as hedges, the interest rate differential is included in the incomestatement, in financial income and expenses, in accordance with the accrual method, offsetting the effectsof the hedged transaction. Derivative financial instruments designated as trading instruments are valued atyear-end market value, and the difference between the nominal contract value and fair value is recorded inthe income statement under financial income and expenses. During 2004, the Group did not hold anyderivative financial instruments designated as trading instruments.
From 1 January 2005 onwards:
Derivatives are initially recognised at fair value on the date a derivative contract is entered into and aresubsequently remeasured at their fair value. The method of recognising the resulting gain or loss dependson whether the derivative is designated as a hedging instrument, and if so, the nature of the item beinghedged. The Group designates certain derivatives as either: (1) hedges of the fair value of recognisedassets or liabilities or a firm commitment (fair value hedge); (2) hedges of a particular risk associated with arecognised asset or liability or highly probable forecast transactions (cash flow hedges); or (3) hedges ofnet investments in foreign operations.
119
2 PRINCIPAL ACCOUNTING POLICIES (Continued)(m) Derivative financial instruments and hedging activities (Continued)
(i) Fair value hedgeChanges in the fair value of derivatives that are designated and qualify as fair value hedges arerecorded in the income statement, together with any changes in the fair value of the hedged asset orliability that are attributable to the hedged risk.
If the hedge no longer meets the criteria for hedge accounting, the adjustment to the carrying amountof a hedge item for which the effective interest method is used is amortised to profit or loss over theperiod to maturity.
(ii) Cash flow hedgeThe effective portion of changes in the fair value of derivatives that are designated and qualify as cashflow hedges are recognised in equity. The gain or loss relating to the ineffective portion is recognisedimmediately in the income statement.
Amounts accumulated in equity are recycled in the income statement in the periods when the hedgeditem affects profit or loss (for instance when the forecast sale that is hedged takes place). The gain orloss relating to the effective portion of interest rate swaps hedging variable rate borrowings isrecognised in the income statement within ‘finance costs’.
When a hedging instrument expires or is sold, or when a hedge no longer meets the criteria forhedge accounting, any cumulative gain or loss existing in equity at that time remains in equity and isrecognised when the forecast transaction is ultimately recognised in the income statement. When aforecast transaction is no longer expected to occur, the cumulative gain or loss that was reported inequity is immediately transferred to the income statement.
(iii) Net investment hedgeHedges of net investments in foreign operations are accounted for similarly to cash flow hedges. Anygain or loss on the hedging instrument relating to the effective portion of the hedge is recognised inequity; the gain or loss relating to the ineffective portion is recognised immediately in the incomestatement.
Gains and losses accumulated in equity are included in the income statement when the foreignoperation is disposed of.
(iv) Derivatives that do not qualify for hedge accountingCertain derivative instruments do not qualify for hedge accounting. Changes in the fair value of anyderivative instruments that do not qualify for hedge accounting are recognised immediately in theincome statement.
120
NOTES TO THE CONSOLIDATED FINANCIAL STATEMENTS (Continued)
2 PRINCIPAL ACCOUNTING POLICIES (Continued)(n) Cash and cash equivalents
Cash and cash equivalents includes cash in hand, deposits held at call with banks, other short-term highlyliquid investments with original maturities of three months or less, and bank overdrafts. Bank overdrafts areshown as a separate current liability in the balance sheet.
(o) Share capitalOrdinary shares are classified as equity.
Incremental costs directly attributable to the issue of new shares or options are shown in equity as adeduction, net of tax, from the proceeds.
(p) BorrowingsBorrowings are recognised initially at fair value, net of transaction costs incurred. Transaction costs areincremental costs that are directly attributable to the acquisition, issue or disposal of a financial asset orfinancial liability, including fees and commissions paid to agents, advisers, brokers and dealers, levies byregulatory agencies and securities exchanges, and transfer taxes and duties. Borrowings are subsequentlystated at amortised cost; any difference between the proceeds (net of transaction costs) and the redemptionvalue is recognised in the income statement over the period of the borrowings using the effective interestmethod.
The fair value of the liability portion of a convertible bond is determined using a market interest rate for anequivalent non-convertible bond. This amount is recorded as a liability on an amortised cost basis untilextinguished on conversion or maturity of the bond. The remainder of the proceeds is allocated to theconversion option and is recognised and included in shareholders’ equity under other reserves.
Borrowings are classified as current liabilities unless the Group has an unconditional right to defer settlementof the liability for at least 12 months after the balance sheet date.

121
2 PRINCIPAL ACCOUNTING POLICIES (Continued)(q) Deferred income tax
Deferred income tax is provided in full, using the liability method, on temporary differences arisingbetween the tax bases of assets and liabilities and their carrying amounts in the consolidated financialstatements. However, the deferred income tax is not accounted for if it arises from initial recognition of anasset or liability in a transaction, other than a business combination, that at the time of the transactionaffects neither accounting nor taxable profit or loss. Deferred income tax is determined using tax rates(and laws) that have been enacted or substantially enacted by the balance sheet date and are expected toapply when the related deferred income tax asset is realised or the deferred income tax liability is settled.
Deferred income tax assets are recognised to the extent that it is probable that future taxable profit willbe available against which the temporary differences can be utilised.
Deferred income tax is provided on temporary difference arising on investments in subsidiaries andassociated companies, except where the timing of the reversal of the temporary difference is controlled bythe Group and it is probable that the temporary difference will not reverse in the foreseeable future.
(r) Employee benefits(i) Retirement benefit cost
The Group operates defined contribution plans and pays contributions to publicly or privatelyadministered pension insurance plans on a mandatory, contractual or voluntary basis. The Group hasno further payment obligations once the contributions have been paid. The contributions are recognisedas employee benefit expense when they are due and are reduced at the employer’s discretion bycontributions forfeited by those employees who leave the scheme prior to vesting fully in thecontributions.
(ii) Share-based compensationThe Group has granted options under two share option schemes. The fair value of the employeeservices received in exchange for the grant of the options is recognised as an expense. The totalamount to be expensed over the vesting period is determined by reference to the fair value of theoptions granted, excluding the impact of any non-market vesting conditions (for example, profitabilityand sales growth targets). Non-market vesting conditions are included in assumptions about thenumber of options that are expected to become exercisable. At each balance sheet date, the Grouprevises its estimates of the number of options that are expected to become exercisable. It recognisesthe impact of the revision of original estimates, if any, in the income statement with a correspondingadjustment to equity over the remaining vesting period.
The proceeds received net of any directly attributable transaction costs are credited to share capital(nominal value) and share premium when the options are exercised.
122
NOTES TO THE CONSOLIDATED FINANCIAL STATEMENTS (Continued)
2 PRINCIPAL ACCOUNTING POLICIES (Continued)(r) Employee benefits (Continued)
(iii) Termination benefitsTermination benefits are payable where employment is terminated before the normal retirement date,or whenever an employee accepts voluntary redundancy in exchange for these benefits. The Grouprecognise termination benefits when it is demonstrably committed to either: terminating the employmentof current employees according to a detailed formal plan without possibility of withdrawal; or providingtermination benefits as a result of an offer made to encourage voluntary redundancy. Benefits fallingdue more than 12 months after balance sheet date are discounted to present value.
(iv) Bonus plansThe Group recognises a liability and an expense for bonuses when the Group has a present legal orconstructive obligation as a result of services rendered by employees and a reliable estimate of suchobligation can be made.
(s) ProvisionsProvisions are recognised when the Group has a present legal or constructive obligation as a result of pastevents; it is more likely than not that an outflow of resources will be required to settle the obligation; andthe amount has been reliably estimated.
Where there are a number of similar obligations, the likelihood that an outflow will be required insettlement is determined by considering the class of obligations as a whole. A provision is recognised evenif the likelihood of an outflow with respect to any one item included in the same class of obligations maybe small.
Provisions are measured at the present value of the expenditures expected to be required to settle theobligation using a pre-tax rate that reflects current market assessments of the time value of money and therisks specific to the obligation. The increase in the provision due to passage of time is recognised asinterest expense.
(t) Revenue and profit recognition(i) Revenue from sales of properties is recognised upon execution of binding sales agreement or completion
of development, whichever is the later.
(ii) Rental revenue and other revenues incidental to the letting of properties are recognised on a straight-line basis over the periods of the respective leases.
(iii) Revenue from general storage and other ancillary services is recognised when the services are rendered.Revenue from leased storage is recognised on a straight-line basis over the periods of the respectiveleases.
123
2 PRINCIPAL ACCOUNTING POLICIES (Continued)(t) Revenue and profit recognition (Continued)
(iv) Income on development consultancy and project management is recognised on a pro-rata basisaccording to the progress of the projects.
(v) Income from property management is recognised when services are rendered.
(vi) Hotel revenue from rooms rental, food and beverage sales and other ancillary services is recognisedwhen the services are rendered.
(vii) Dividend income is recognised when the right to receive payment is established.
(viii) Interest income is recognised on a time proportion basis, using the effective interest method.
(u) Operating leasesLease in which a significant portion of the risks and rewards of ownership are retained by the lessor areclassified as operating leases. Payments made under operating leases (net of any incentive received fromthe lessor) are charged to the income statement on a straight-line basis over the period of the lease.
(v) Borrowing costsBorrowing costs are accounted for on the accrual basis and charged to the income statement in the year inwhich they are incurred, except for costs related to funding of the construction and acquisition of propertiesunder development which are capitalised as part of the cost of that asset during the construction periodand up to the date of completion of construction.
(w) Dividend distributionDividend distribution to the Company’s shareholders is recognised as a liability in the Group’s financialstatements in the period in which the dividends are approved by the Company’s shareholders.
(x) Contingent liabilities and contingent assetsA contingent liability is possible obligation that arises from past events and whose existence will only beconfirmed by the occurrence or non-occurrence of one or more uncertain future events not wholly withinthe control of the Group. It can also be a present obligation arising from past events that is not recognisedbecause it is not probable that outflow of economic resource will be required or the amount of obligationcannot be measured reliably.
A contingent liability is not recognised but is disclosed in the notes to the financial statements. When achange in the probability of an outflow occurs so that outflow is probable, they will then be recognised asa provision.
124
NOTES TO THE CONSOLIDATED FINANCIAL STATEMENTS (Continued)
2 PRINCIPAL ACCOUNTING POLICIES (Continued)(x) Contingent liabilities and contingent assets (Continued)
A contingent asset is a possible asset that arises from past events and whose existence will be confirmedonly by the occurrence or non-occurrence of one or more uncertain events not wholly within the controlof the Group.
Contingent assets are not recognised but are disclosed in the notes to the accounts when an inflow ofeconomic benefits is probable. When inflow is virtually certain, an asset is recognised.
3 FINANCIAL RISK MANAGEMENT(a) Financial risk factors
The Group’s activities expose it to a variety of financial risks: market risk (including currency risk and fairvalue interest rate risk), liquidity risk and cash flow interest-rate risk. The Group’s overall risk managementprogramme focuses on the unpredictability of financial markets and seeks to minimise potential adverseeffects on the Group’s financial performance. The Group uses derivative financial instruments to managecertain risk exposures.
Risk management is carried out by the Group’s management under the supervision of the Finance Committee.The Group’s management identifies, evaluates and hedges significant financial risks in the Group’s individualoperating units. The Board provides guidance for overall financial risk management.
(i) Market risk – Foreign exchange riskThe Group operates internationally and is exposed to foreign exchange risk arising from variouscurrency exposures. Foreign exchange risk arises from future commercial transactions, recognisedassets and liabilities and net investments in foreign operations.
Foreign exchange risk arises when future commercial transactions or recognised assets or liabilities aredenominated in a currency that is not the entity’s functional currency. The Group has not entered intoany forward contracts as the exposure to foreign exchange risk from commercial transactions, recognisedassets and liabilities is not significant.
The Group has certain investments in foreign operations, whose net assets are exposed to foreigncurrency translation risk. Currency exposure arising from the net assets of the Group’s foreignoperations in the other countries is managed primarily through borrowings denominated in therelevant foreign currencies.
125
3 FINANCIAL RISK MANAGEMENT (Continued)(a) Financial risk factors (Continued)
(ii) Liquidity riskPrudent liquidity risk management implies maintaining sufficient cash, the availability of funding throughan adequate amount of committed credit facilities and the ability to close out market positions. TheGroup aims to maintain flexibility in funding by keeping committed credit lines available.
(iii) Cash flow and fair value interest rate riskAs the Group has no significant interest-bearing assets, the Group’s income and operating cash flowsare substantially independent of changes in market interest rates.
The Group’s interest-rate risk arises from long-term borrowings. Borrowings issued at variable ratesexpose the Group to cash flow interest-rate risk. Borrowings issued at fixed rates expose the Groupto fair value interest-rate risk.
The Group manages its cash flow interest-rate risk by using floating-to-fixed interest-rate swaps. Suchinterest-rate swaps have the economic effect of converting borrowings from floating rates to fixedrates. Under the interest-rate swaps, the Group agrees with other parties to exchange, at specifiedintervals (mainly monthly), the difference between fixed contract rates and floating-rate interestamounts calculated by reference to the agreed notional principal amounts.
(b) Fair value estimationThe fair value of financial instruments traded in active markets (such as trading and available-for-salesecurities) is based on quoted market prices at the balance sheet date. The quoted market price used forfinancial assets held by the Group is the current bid price; the appropriate quoted market price for financialliabilities is the current ask price.
The fair value of financial instruments that are not traded in an active market (for example, over-the-counter derivatives) is determined by using valuation techniques. The Group uses a variety of methods andmakes assumptions that are based on market conditions existing at each balance sheet date. Quotedmarket prices or dealer quotes for similar instruments are used for long-term debt. Other techniques, suchas estimated discounted cash flows, are used to determine fair value for the remaining financial instruments.The fair value of interest-rate swaps is calculated as the present value of the estimated future cash flows.
The nominal value less impairment provision of accounts receivables and payables are assumed toapproximate their fair values. The fair value of financial liabilities for disclosure purposes is estimated bydiscounting the future contractual cash flows at the current market interest rate that is available to theGroup for similar financial instruments.
126
NOTES TO THE CONSOLIDATED FINANCIAL STATEMENTS (Continued)
4 CRITICAL ACCOUNTING ESTIMATES AND JUDGEMENTSEstimates and judgements are continually evaluated and are based on historical experience and other factors,including expectations of future events that are believed to be reasonable under the circumstances.
(a) Critical accounting estimates and assumptionsThe Group makes estimates and assumptions concerning the future. The resulting accounting estimateswill, by definition, seldom equal the related actual results. The estimates and assumptions that have asignificant risk of causing a material adjustment to the carrying amounts of assets and liabilities within thenext financial year are discussed below.
Estimated impairment of goodwillThe Group tests annually whether goodwill has suffered any impairment, in accordance with the accountingpolicy stated in note 2(i). The recoverable amounts of cash-generating units have been determined basedon value-in-use calculations. These calculations require the use of estimates (see note (2(i)).
Useful lives of property, plant & equipmentThe Group’s management determines the estimated useful lives and related depreciation charges for itsproperty, plant and equipment. This estimate is based on the historical experience of the actual useful livesof the property, plant and equipment of similar nature and functions. It could change significantly as a resultof technical innovation. Management will change the depreciation charge where useful lives are differentfrom the previously estimated lives. It will also write-off or write down technically obsolete or non-strategic assets that have been abandoned or sold.
Income taxesThe Group is subject to income taxes in numerous jurisdictions. Significant judgement is required indetermining the worldwide provision for income taxes. There are many transactions and calculations forwhich the ultimate tax determination is uncertain during the ordinary course of business. The Grouprecognises liabilities for anticipated tax audit issues based on estimates of whether additional taxes will bedue. Where the final tax outcome of these matters is different from the amounts that were initiallyrecorded, such differences will impact the income tax and deferred tax provisions in the period in whichsuch determination is made.
127
4 CRITICAL ACCOUNTING ESTIMATES AND JUDGEMENTS (Continued)(a) Critical accounting estimates and assumptions (Continued)
Estimate of fair value of investment propertiesThe valuation of investment properties is performed in accordance with the ‘Valuation Standards onValuation of Properties’ published by the Hong Kong Institute of Surveyors and the ‘International ValuationStandards’ published by the International Valuation Standards Committee. The valuation is reviewed annuallyby qualified valuers by considering the information from a variety of sources including i) current prices inan active market for properties of different nature, condition or location, adjusted to reflect those differences;and ii) recent prices of similar properties in less active markets, with adjustments to reflect any changes ineconomic conditions since the date of the transactions that occurred at those prices and iii) discountedcash flow projections based on reliable estimates of future cash flows, derived from the terms of anyexisting lease and other contracts, and (where possible) from external evidence such as current marketrents for similar properties in the same location and condition, and using discount rates that reflect currentmarket assessments of the uncertainty in the amount and timing of the cash flows.
If information on current or recent prices of investment properties is not available, the fair values ofinvestment properties are determined using discounted cash flow valuation techniques. The Group usesassumptions that are mainly based on market conditions existing at each balance sheet date.
The principal assumptions underlying management’s estimation of fair value are those related to: thereceipt of contractual rentals; expected future market rentals; void periods; maintenance requirements; andappropriate discount rates. These valuations are regularly compared to actual market yield data, and actualtransactions by the Group and those reported by the market.
The expected future market rentals are determined on the basis of current market rentals for similarproperties in the same location and condition.
(b) Critical judgements in applying the Group’s accounting policiesDistinction between investment properties and owner-occupied propertiesThe Group determines whether a property qualifies as investment property. In making its judgement, theGroup considers whether the property generates cash flows largely independently of the other assets.Owner-occupied properties generate cash flows that are attributable not only to property but also toother assets used in the production or supply process.
Some properties comprise a portion that is held to earn rentals or for capital appreciation and anotherportion that is held for use in the production or supply of goods or services or for administrative purposes.If these portions can be sold separately (or leased out separately under a finance lease), the Groupaccounts for the portions separately. If the portions cannot be sold separately, the property is accountedfor as investment property only if an insignificant portion is held for use in the production or supply ofgoods or services or for administrative purposes. Judgement is applied in determining whether ancillaryservices are so significant that a property does not qualify as investment property. The Group considerseach property separately in making its judgement.
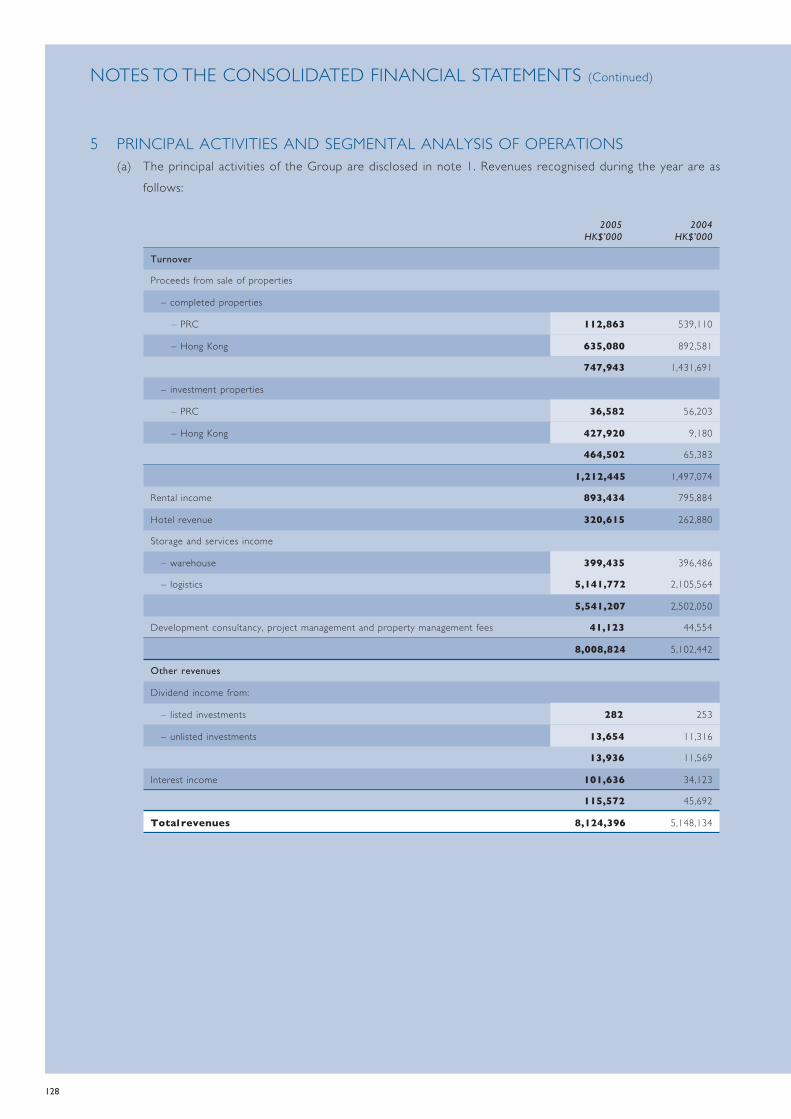
128
NOTES TO THE CONSOLIDATED FINANCIAL STATEMENTS (Continued)
5 PRINCIPAL ACTIVITIES AND SEGMENTAL ANALYSIS OF OPERATIONS(a) The principal activities of the Group are disclosed in note 1. Revenues recognised during the year are as
follows:
2005 2004HK$’000 HK$’000
Turnover
Proceeds from sale of properties
– completed properties
– PRC 112,863 539,110
– Hong Kong 635,080 892,581
747,943 1,431,691
– investment properties
– PRC 36,582 56,203
– Hong Kong 427,920 9,180
464,502 65,383
1,212,445 1,497,074
Rental income 893,434 795,884
Hotel revenue 320,615 262,880
Storage and services income
– warehouse 399,435 396,486
– logistics 5,141,772 2,105,564
5,541,207 2,502,050
Development consultancy, project management and property management fees 41,123 44,554
8,008,824 5,102,442
Other revenues
Dividend income from:
– listed investments 282 253
– unlisted investments 13,654 11,316
13,936 11,569
Interest income 101,636 34,123
115,572 45,692
Total revenues 8,124,396 5,148,134
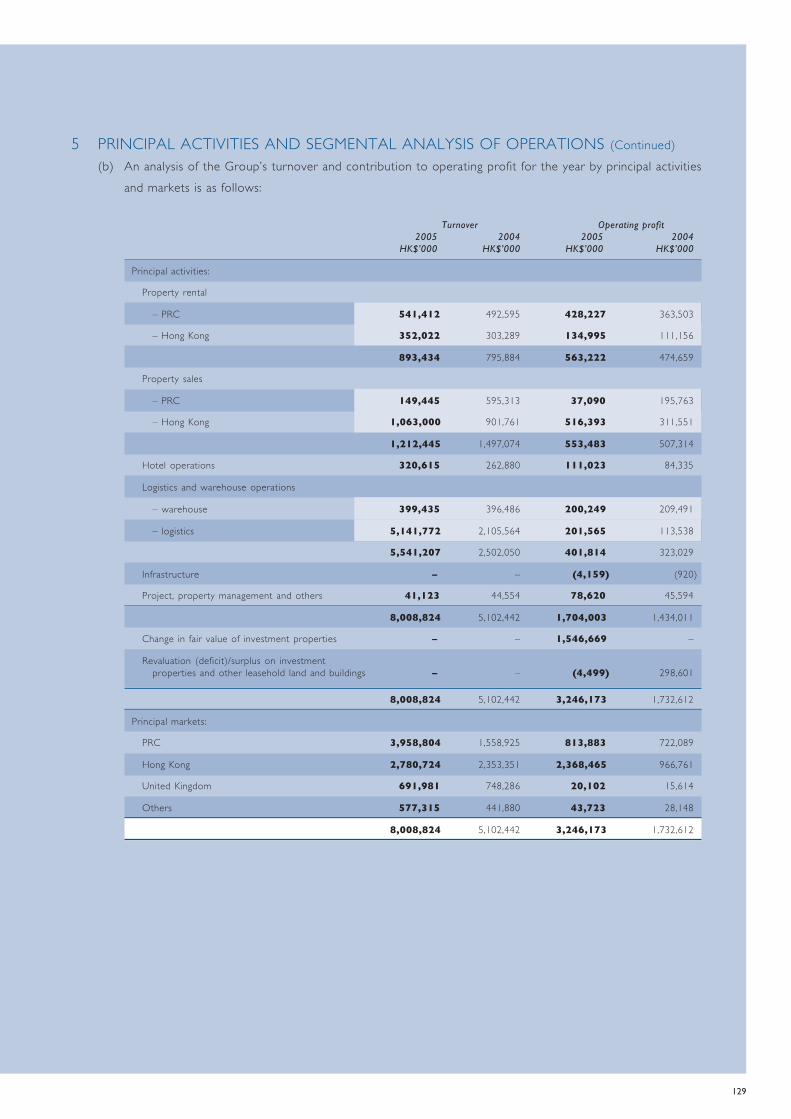
129
5 PRINCIPAL ACTIVITIES AND SEGMENTAL ANALYSIS OF OPERATIONS (Continued)(b) An analysis of the Group’s turnover and contribution to operating profit for the year by principal activities
and markets is as follows:
Turnover Operating profit2005 2004 2005 2004
HK$’000 HK$’000 HK$’000 HK$’000
Principal activities:
Property rental
– PRC 541,412 492,595 428,227 363,503
– Hong Kong 352,022 303,289 134,995 111,156
893,434 795,884 563,222 474,659
Property sales
– PRC 149,445 595,313 37,090 195,763
– Hong Kong 1,063,000 901,761 516,393 311,551
1,212,445 1,497,074 553,483 507,314
Hotel operations 320,615 262,880 111,023 84,335
Logistics and warehouse operations
– warehouse 399,435 396,486 200,249 209,491
– logistics 5,141,772 2,105,564 201,565 113,538
5,541,207 2,502,050 401,814 323,029
Infrastructure – – (4,159) (920)
Project, property management and others 41,123 44,554 78,620 45,594
8,008,824 5,102,442 1,704,003 1,434,011
Change in fair value of investment properties – – 1,546,669 –
Revaluation (deficit)/surplus on investmentproperties and other leasehold land and buildings – – (4,499) 298,601
8,008,824 5,102,442 3,246,173 1,732,612
Principal markets:
PRC 3,958,804 1,558,925 813,883 722,089
Hong Kong 2,780,724 2,353,351 2,368,465 966,761
United Kingdom 691,981 748,286 20,102 15,614
Others 577,315 441,880 43,723 28,148
8,008,824 5,102,442 3,246,173 1,732,612

130
NOTES TO THE CONSOLIDATED FINANCIAL STATEMENTS (Continued)
5 PRINCIPAL ACTIVITIES AND SEGMENTAL ANALYSIS OF OPERATIONS (Continued)(c) Primary reporting format – business segments
2005
Hong LogisticsPRC Kong Overseas and
Property Property Property Warehouse Infrastructure Others Eliminations ConsolidatedHK$’000 HK$’000 HK$’000 HK$’000 HK$’000 HK$’000 HK$’000 HK$’000
Revenue
Turnover 1,011,472 1,415,022 – 5,541,207 – 41,123 – 8,008,824
Inter-segment revenue 450 – – – – 32,504 (32,954) –
Inter-segment interest income – – – – – 285,758 (285,758) –
1,011,922 1,415,022 – 5,541,207 – 359,385 (318,712) 8,008,824
Results
Segment results before changein fair value of properties 594,251 773,359 (3,627) 459,002 (3,998) 256,881 (285,758) 1,790,110
Change in fair value of properties 161,885 716,293 – 663,992 – – – 1,542,170
Segment results 756,136 1,489,652 (3,627) 1,122,994 (3,998) 256,881 (285,758) 3,332,280
Dividend income – 6,922 7,014 – – – – 13,936
Interest income 23,347 17,230 28 4,644 5,607 50,780 – 101,636
Interest expenses (41,258) (146,123) – (61,832) (5,768) (232,456) 285,758 (201,679)
Operating profit/(loss) 738,225 1,367,681 3,415 1,065,806 (4,159) 75,205 – 3,246,173
Share of results of associatedcompanies 10,942 176,839 64,676 215,336 42,312 – – 510,105
Profit before taxation 749,167 1,544,520 68,091 1,281,142 38,153 75,205 – 3,756,278
Taxation (227,258) (102,898) – (162,864) – (1,179) – (494,199)
Profit for the year 521,909 1,441,622 68,091 1,118,278 38,153 74,026 – 3,262,079
Profit attributable to:
Company’s shareholders 372,020 1,429,102 68,091 1,085,152 38,473 74,025 – 3,066,863
Minority interests 149,889 12,520 – 33,126 (320) 1 – 195,216
521,909 1,441,622 68,091 1,118,278 38,153 74,026 – 3,262,079
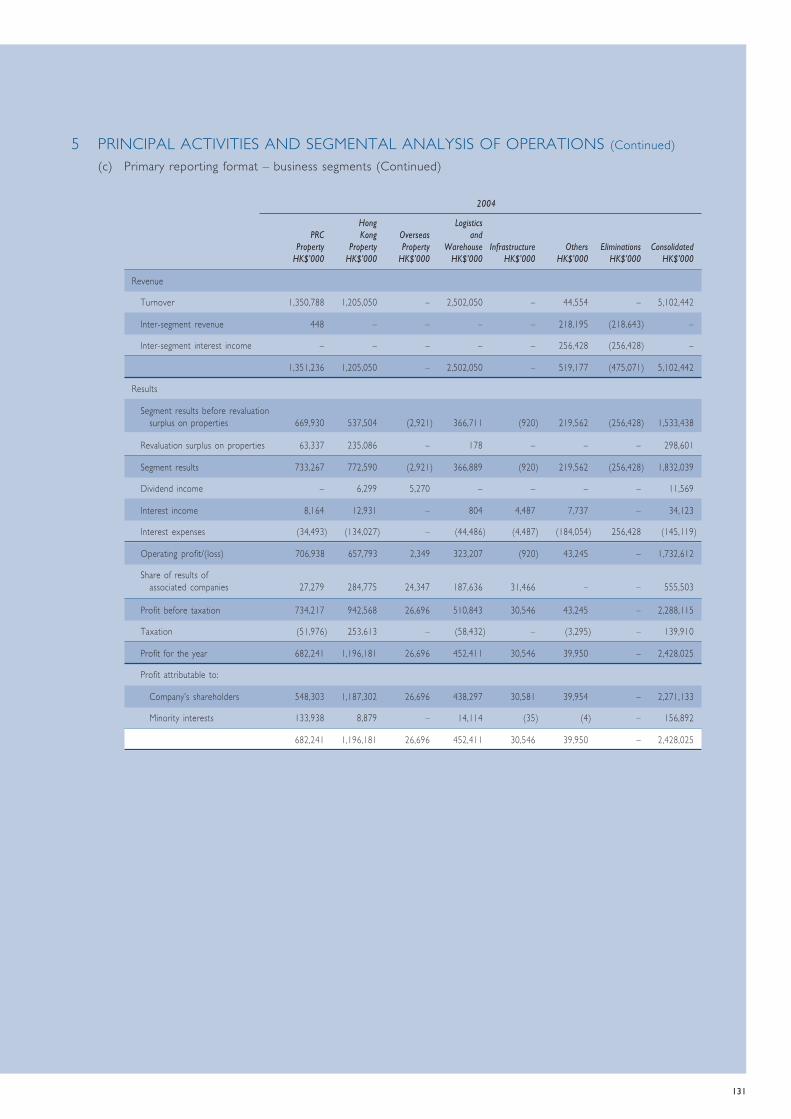
131
5 PRINCIPAL ACTIVITIES AND SEGMENTAL ANALYSIS OF OPERATIONS (Continued)(c) Primary reporting format – business segments (Continued)
2004
Hong LogisticsPRC Kong Overseas and
Property Property Property Warehouse Infrastructure Others Eliminations ConsolidatedHK$’000 HK$’000 HK$’000 HK$’000 HK$’000 HK$’000 HK$’000 HK$’000
Revenue
Turnover 1,350,788 1,205,050 – 2,502,050 – 44,554 – 5,102,442
Inter-segment revenue 448 – – – – 218,195 (218,643) –
Inter-segment interest income – – – – – 256,428 (256,428) –
1,351,236 1,205,050 – 2,502,050 – 519,177 (475,071) 5,102,442
Results
Segment results before revaluationsurplus on properties 669,930 537,504 (2,921) 366,711 (920) 219,562 (256,428) 1,533,438
Revaluation surplus on properties 63,337 235,086 – 178 – – – 298,601
Segment results 733,267 772,590 (2,921) 366,889 (920) 219,562 (256,428) 1,832,039
Dividend income – 6,299 5,270 – – – – 11,569
Interest income 8,164 12,931 – 804 4,487 7,737 – 34,123
Interest expenses (34,493) (134,027) – (44,486) (4,487) (184,054) 256,428 (145,119)
Operating profit/(loss) 706,938 657,793 2,349 323,207 (920) 43,245 – 1,732,612
Share of results ofassociated companies 27,279 284,775 24,347 187,636 31,466 – – 555,503
Profit before taxation 734,217 942,568 26,696 510,843 30,546 43,245 – 2,288,115
Taxation (51,976) 253,613 – (58,432) – (3,295) – 139,910
Profit for the year 682,241 1,196,181 26,696 452,411 30,546 39,950 – 2,428,025
Profit attributable to:
Company’s shareholders 548,303 1,187,302 26,696 438,297 30,581 39,954 – 2,271,133
Minority interests 133,938 8,879 – 14,114 (35) (4) – 156,892
682,241 1,196,181 26,696 452,411 30,546 39,950 – 2,428,025
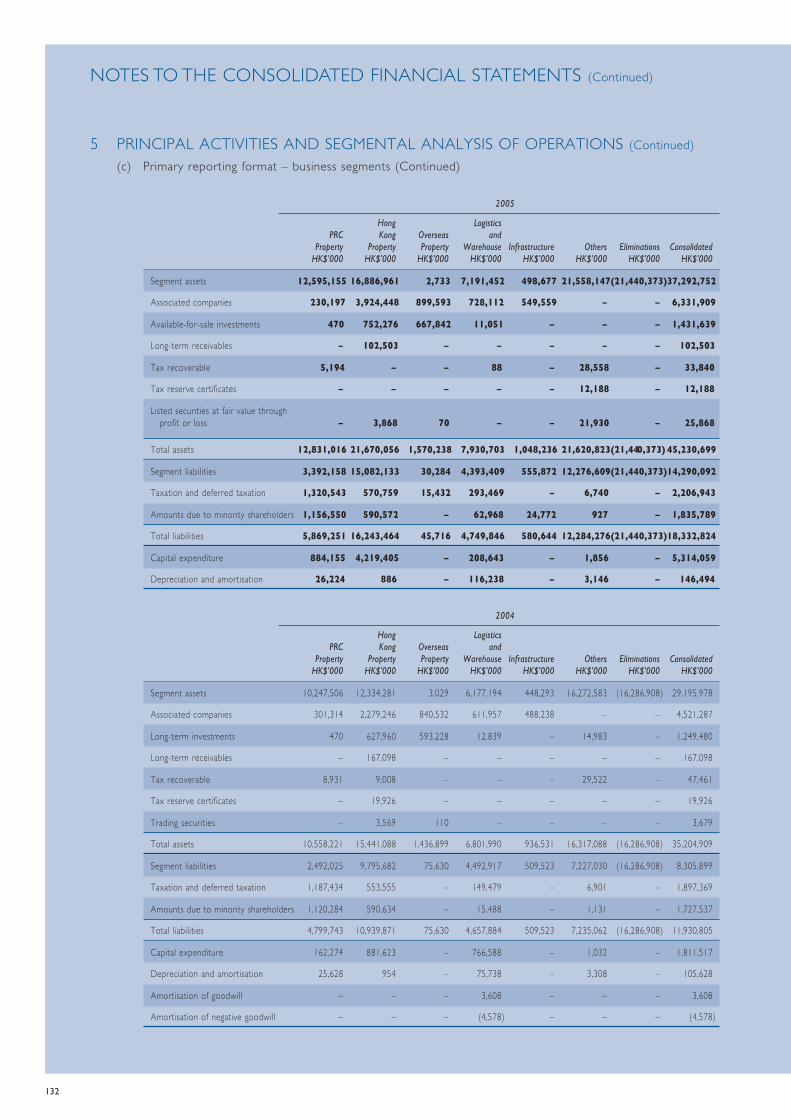
132
NOTES TO THE CONSOLIDATED FINANCIAL STATEMENTS (Continued)
5 PRINCIPAL ACTIVITIES AND SEGMENTAL ANALYSIS OF OPERATIONS (Continued)(c) Primary reporting format – business segments (Continued)
2005
Hong LogisticsPRC Kong Overseas and
Property Property Property Warehouse Infrastructure Others Eliminations ConsolidatedHK$’000 HK$’000 HK$’000 HK$’000 HK$’000 HK$’000 HK$’000 HK$’000
Segment assets 12,595,155 16,886,961 2,733 7,191,452 498,677 21,558,147(21,440,373)37,292,752
Associated companies 230,197 3,924,448 899,593 728,112 549,559 – – 6,331,909
Available-for-sale investments 470 752,276 667,842 11,051 – – – 1,431,639
Long-term receivables – 102,503 – – – – – 102,503
Tax recoverable 5,194 – – 88 – 28,558 – 33,840
Tax reserve certificates – – – – – 12,188 – 12,188
Listed securities at fair value throughprofit or loss – 3,868 70 – – 21,930 – 25,868
Total assets 12,831,016 21,670,056 1,570,238 7,930,703 1,048,236 21,620,823(21,440,373) 45,230,699
Segment liabilities 3,392,158 15,082,133 30,284 4,393,409 555,872 12,276,609(21,440,373)14,290,092
Taxation and deferred taxation 1,320,543 570,759 15,432 293,469 – 6,740 – 2,206,943
Amounts due to minority shareholders 1,156,550 590,572 – 62,968 24,772 927 – 1,835,789
Total liabilities 5,869,251 16,243,464 45,716 4,749,846 580,644 12,284,276(21,440,373)18,332,824
Capital expenditure 884,155 4,219,405 – 208,643 – 1,856 – 5,314,059
Depreciation and amortisation 26,224 886 – 116,238 – 3,146 – 146,494
2004
Hong LogisticsPRC Kong Overseas and
Property Property Property Warehouse Infrastructure Others Eliminations ConsolidatedHK$’000 HK$’000 HK$’000 HK$’000 HK$’000 HK$’000 HK$’000 HK$’000
Segment assets 10,247,506 12,334,281 3,029 6,177,194 448,293 16,272,583 (16,286,908) 29,195,978
Associated companies 301,314 2,279,246 840,532 611,957 488,238 – – 4,521,287
Long-term investments 470 627,960 593,228 12,839 – 14,983 – 1,249,480
Long-term receivables – 167,098 – – – – – 167,098
Tax recoverable 8,931 9,008 – – – 29,522 – 47,461
Tax reserve certificates – 19,926 – – – – – 19,926
Trading securities – 3,569 110 – – – – 3,679
Total assets 10,558,221 15,441,088 1,436,899 6,801,990 936,531 16,317,088 (16,286,908) 35,204,909
Segment liabilities 2,492,025 9,795,682 75,630 4,492,917 509,523 7,227,030 (16,286,908) 8,305,899
Taxation and deferred taxation 1,187,434 553,555 – 149,479 – 6,901 – 1,897,369
Amounts due to minority shareholders 1,120,284 590,634 – 15,488 – 1,131 – 1,727,537
Total liabilities 4,799,743 10,939,871 75,630 4,657,884 509,523 7,235,062 (16,286,908) 11,930,805
Capital expenditure 162,274 881,623 – 766,588 – 1,032 – 1,811,517
Depreciation and amortisation 25,628 954 – 75,738 – 3,308 – 105,628
Amortisation of goodwill – – – 3,608 – – – 3,608
Amortisation of negative goodwill – – – (4,578) – – – (4,578)

133
5 PRINCIPAL ACTIVITIES AND SEGMENTAL ANALYSIS OF OPERATIONS (Continued)(d) Secondary reporting format – geographical segments
2005
Segment Segment Segment Capitalrevenue results assets expenditure
HK$’000 HK$’000 HK$’000 HK$’000
PRC 3,958,804 845,929 14,903,510 1,002,307
Hong Kong 2,780,724 2,422,332 21,457,059 4,234,144
United Kingdom 691,981 19,791 266,049 14,131
Others 577,315 44,228 666,134 63,477
8,008,824 3,332,280 37,292,752 5,314,059
2004
Segment Segment Segment Capitalrevenue results assets expenditure
HK$’000 HK$’000 HK$’000 HK$’000
PRC 1,558,925 751,055 12,418,791 1,084,995
Hong Kong 2,353,351 1,035,133 15,967,645 410,329
United Kingdom 748,286 15,029 252,622 7,295
Others 441,880 30,822 556,920 308,898
5,102,442 1,832,039 29,195,978 1,811,517

134
NOTES TO THE CONSOLIDATED FINANCIAL STATEMENTS (Continued)
6 OPERATING PROFIT BEFORE FINANCE COSTS
Group2005 2004
HK$’000 HK$’000
Operating profit before finance costs is stated after crediting and charging the following:
Crediting
Gross rental income from investment properties
– PRC 541,412 492,595
– Hong Kong 352,022 303,289
893,434 795,884
Less: outgoings in respect of investment properties
– PRC (58,574) (53,334)
– Hong Kong (26,928) (20,346)
(85,502) (73,680)
Net rental income from investment properties
– PRC 482,838 439,261
– Hong Kong 325,094 282,943
807,932 722,204
Interest income 101,758 34,165
Less: amount capitalised in properties under development (122) (42)
101,636 34,123
Gain on sale of investment properties 180,257 910
Unrealised gain on trading securities – 427
Unrealised gain on listed securities at fair value through profit or loss 1,657 –
Amortisation of negative goodwill – 4,578
Exchange gains, net 45,891 4,259
Charging
Cost of sale of completed properties 270,981 842,760
Auditors’ remuneration 6,169 4,622
Non-audit service fees paid and payable to auditors 3,379 4,058
Depreciation of property, plant and equipment and land amortisation 146,570 106,005
Less: amount capitalised in properties under development (76) (377)
146,494 105,628
Amortisation of goodwill – 3,608
Operating lease charges – land and buildings 36,854 41,588
– vessels 87,043 –
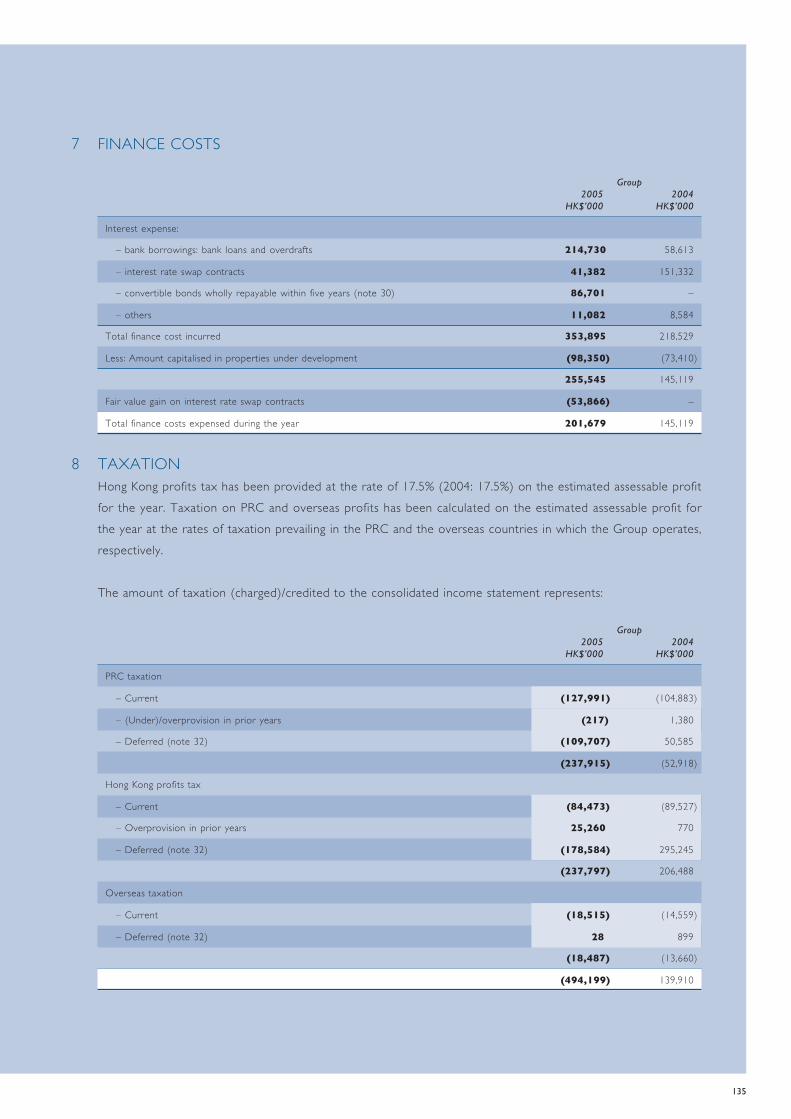
135
7 FINANCE COSTS
Group2005 2004
HK$’000 HK$’000
Interest expense:
– bank borrowings: bank loans and overdrafts 214,730 58,613
– interest rate swap contracts 41,382 151,332
– convertible bonds wholly repayable within five years (note 30) 86,701 –
– others 11,082 8,584
Total finance cost incurred 353,895 218,529
Less: Amount capitalised in properties under development (98,350) (73,410)
255,545 145,119
Fair value gain on interest rate swap contracts (53,866) –
Total finance costs expensed during the year 201,679 145,119
8 TAXATIONHong Kong profits tax has been provided at the rate of 17.5% (2004: 17.5%) on the estimated assessable profitfor the year. Taxation on PRC and overseas profits has been calculated on the estimated assessable profit forthe year at the rates of taxation prevailing in the PRC and the overseas countries in which the Group operates,respectively.
The amount of taxation (charged)/credited to the consolidated income statement represents:
Group2005 2004
HK$’000 HK$’000
PRC taxation
– Current (127,991) (104,883)
– (Under)/overprovision in prior years (217) 1,380
– Deferred (note 32) (109,707) 50,585
(237,915) (52,918)
Hong Kong profits tax
– Current (84,473) (89,527)
– Overprovision in prior years 25,260 770
– Deferred (note 32) (178,584) 295,245
(237,797) 206,488
Overseas taxation
– Current (18,515) (14,559)
– Deferred (note 32) 28 899
(18,487) (13,660)
(494,199) 139,910

136
NOTES TO THE CONSOLIDATED FINANCIAL STATEMENTS (Continued)
8 TAXATION (Continued)As referred to in note 2(a), the Group’s share of taxation attributable to associated companies for the year ofHK$45,419,000 (2004: HK$73,846,000) is reclassified in the income statement and included as share of resultsof associated companies.
The taxation on the Group’s profit before taxation differs from the theoretical amount that would arise usingthe taxation rate of Hong Kong as follows:
2005 2004HK$’000 HK$’000
Profit before taxation 3,756,278 2,288,115
Calculated at Hong Kong profits tax rate of 17.5% (2004: 17.5%) 657,349 400,420
Tax effect of different taxation rates in other countries 114,748 75,967
Utilisation of previously unrecognised tax losses (30,354) (9,690)
Tax effect of net income/expenses that are not taxable/deductible in determining taxable profit (135,792) (177,075)
Adjustment to deferred tax resulting from the reversal of prior yearrevaluation deficit on investment properties – (333,666)
Tax loss not provided for 2,560 3,497
Overprovision of taxation in prior years (25,044) (2,150)
Share of results of associated companies (89,268) (97,213)
Taxation charge/(credit) 494,199 (139,910)
9 PROFIT ATTRIBUTABLE TO SHAREHOLDERSThe profit attributable to shareholders dealt with in the financial statements of the Company is HK$705,904,000(2004: HK$732,948,000).
10 DIVIDENDS
Company2005 2004
HK$’000 HK$’000
Interim, paid, of HK$0.20 (2004: HK$0.20) per ordinary share (note (a)) 243,464 239,501
Final, proposed, of HK$0.50 (2004: HK$0.40) per ordinary share (note (b)) 608,289 484,447
851,753 723,948
(a) Amounts shown in respect of the interim dividend for the year ended 31 December 2005 reflect the cash dividend of HK$0.20 (2004:HK$0.20) per ordinary share. A scrip dividend alternative to the interim dividend was also offered, with the result that onlyapproximately HK$233,716,000 (2004: HK$40,687,000) of the interim dividend was paid in cash.
(b) At a meeting held on 24 March 2006, the directors proposed a final dividend of HK$0.50 per ordinary share. This proposed dividendis not reflected as a dividend payable in these financial statements, but will be reflected as an appropriation of retained profits for theyear ending 31 December 2006.

137
11 EARNINGS PER SHAREBasicBasic earnings per share is calculated by dividing the profit attributable to shareholders of the Company by theweighted average number of ordinary shares in issue during the year.
2005 2004
Weighted average number of shares in issue 1,213,558,181 1,198,224,808
Including the effect of the change in fair value of investment properties and buildings and the related deferred taxation:
2005 2004HK$’000 HK$’000
Profit attributable to shareholders 3,066,863 2,271,133
Basic earnings per share HK$2.53 HK$1.90
Excluding the effect of the change in fair value of investment properties and buildings and the related deferred taxation:
2005 2004HK$’000 HK$’000
Profit attributable to shareholders 1,759,560 1,579,969
Basic earnings per share HK$1.45 HK$1.32
DilutedDiluted earnings per share is calculated by adjusting the weighted average number of ordinary shares outstandingto assume conversion of all dilutive potential ordinary shares. The Company has two categories of dilutivepotential ordinary shares: convertible bonds and share options. The convertible bonds are assumed to havebeen converted into ordinary shares and the net profit is adjusted to eliminate the interest expense less the taxeffect. For the share options, a calculation is done to determine the number of shares that could have beenacquired at fair value (determined as the average annual market share price of the Company’s shares) based onthe monetary value of the subscription rights attached to outstanding share options. The number of sharescalculated as above is compared with the number of shares that would have been issued assuming the exerciseof the share options.
2005 2004
Weighted average number of shares in issue 1,213,558,181 1,198,224,808
Adjustment for convertible bonds 70,723,038 –
Adjustment for share options 7,060,260 4,382,608
Weighted average number of shares for the purpose of calculating diluted earnings per share 1,291,341,479 1,202,607,416

138
NOTES TO THE CONSOLIDATED FINANCIAL STATEMENTS (Continued)
11 EARNINGS PER SHARE (Continued)Including the effect of the change in fair value of investment properties and buildings and the related deferred taxation:
2005 2004HK$’000 HK$’000
Profit attributable to shareholders 3,066,863 2,271,133
Adjustment for finance cost on convertible bonds 65,435 –
Profit used to determine diluted earnings per share 3,132,298 2,271,133
Diluted earnings per share HK$2.43 HK$1.89
Excluding the effect of the change in fair value of investment properties and buildings and the related deferred taxation:
2005 2004HK$’000 HK$’000
Profit attributable to shareholders 1,759,560 1,579,969
Adjustment for finance cost on convertible bonds 65,435 –
Profit used to determine diluted earnings per share 1,824,995 1,579,969
Diluted earnings per share HK$1.41 HK$1.31
Basic and diluted earnings per share would have been HK$1.44 (2004: HK$1.63) and HK$1.40 (2004: HK$1.63)respectively, had the effect of all the changes in the accounting policies as referred to in note 2(a) beenexcluded from the calculation.
12 EMPLOYEE BENEFIT EXPENSE
2005 2004HK$’000 HK$’000
Staff costs, including directors’ emoluments 753,102 496,872
Share options granted to directors and employees (note 34) 28,627 –
Pension costs – defined contribution plans (note a) 56,503 20,259
838,232 517,131
(a) Pensions – defined contribution plansPursuant to the Mandatory Provident Fund Schemes Ordinance (Chapter 485 of the Laws of Hong Kong) (the“MPF Ordinance”), companies within the Group in Hong Kong have enrolled all employees in Hong Kong agedbetween 18 and 65 into a mandatory provident fund scheme (the “MPF Scheme”) from 1 December 2000.
139
12 EMPLOYEE BENEFIT EXPENSE (Continued)(a) Pensions – defined contribution plans (Continued)
The MPF Scheme is a master trust scheme established under a trust arrangement and governed by laws inHong Kong. The assets of the MPF Scheme are held separately from the assets of the employer, thetrustees and other service providers. Contributions are made to the MPF Scheme by the employers at 5%of the employees’ relevant income as defined in the MPF Ordinance up to a maximum of HK$1,000 peremployee per month (the “MPF Contribution”). The employees also contribute a corresponding amount tothe MPF Scheme if their relevant income is HK$5,000 per month or more. The MPF Contributions are fullyand immediately vested in the employees as accrued benefits once they are paid to the approved trusteesof the MPF Scheme. Investment income or profit derived from the investment of accrued benefits (aftertaking into account any loss arising from such investment) is also immediately vested in the employees.
Certain companies within the Group are also participants of the Kerry Trading Co. Limited – ProvidentFund Scheme (the “Fund”) which is a defined contribution scheme as defined in the Occupational RetirementSchemes Ordinance (Chapter 426 of the Laws of Hong Kong). The Fund is for certain salaried persons (the“Fund Members”) under the employment of the companies participating in the Fund. The assets of theFund are managed by the trustees of the Fund. Contributions are made to the Fund by companiesparticipating in the Fund at 10% of the Fund Members’ monthly basic salaries up to a maximum ofHK$5,000 per Fund Member per month (the “Basic Contribution”) less the MPF Contribution if the BasicContribution is higher than the MPF Contribution. Fund Members are entitled to 100% of the employers’contributions to the Fund plus investment earnings upon leaving employment after completing ten years ofservice or more, or upon retirement after attaining the retirement age after any number of years of service,or upon retirement due to ill health. Fund Members are also entitled to the employers’ contributions tothe Fund plus investment earnings calculated at a reduced scale of between 20% and 90% after completinga period of service of at least two but less than ten years. The unvested benefits of employees terminatingemployment forfeited in accordance with the terms of the Fund can be utilised by the companies participatingin the Fund to reduce future contributions. During the year, forfeited contributions totaling HK$890,000(2004: HK$1,221,000) were utilised during the year leaving HK$309,000 (2004: HK$484,000) available atthe year end to reduce future contributions.
The Group also made defined contributions to pension plans as required by the relevant municipality orprovincial governments in the PRC. The rates of contributions for the relevant periods ranged from 8% to23% of the staff’s salary. For overseas subsidiaries, the Group made contributions to defined contributionpension schemes in accordance with the schemes set up by the overseas subsidiaries and/or understatutory requirements.
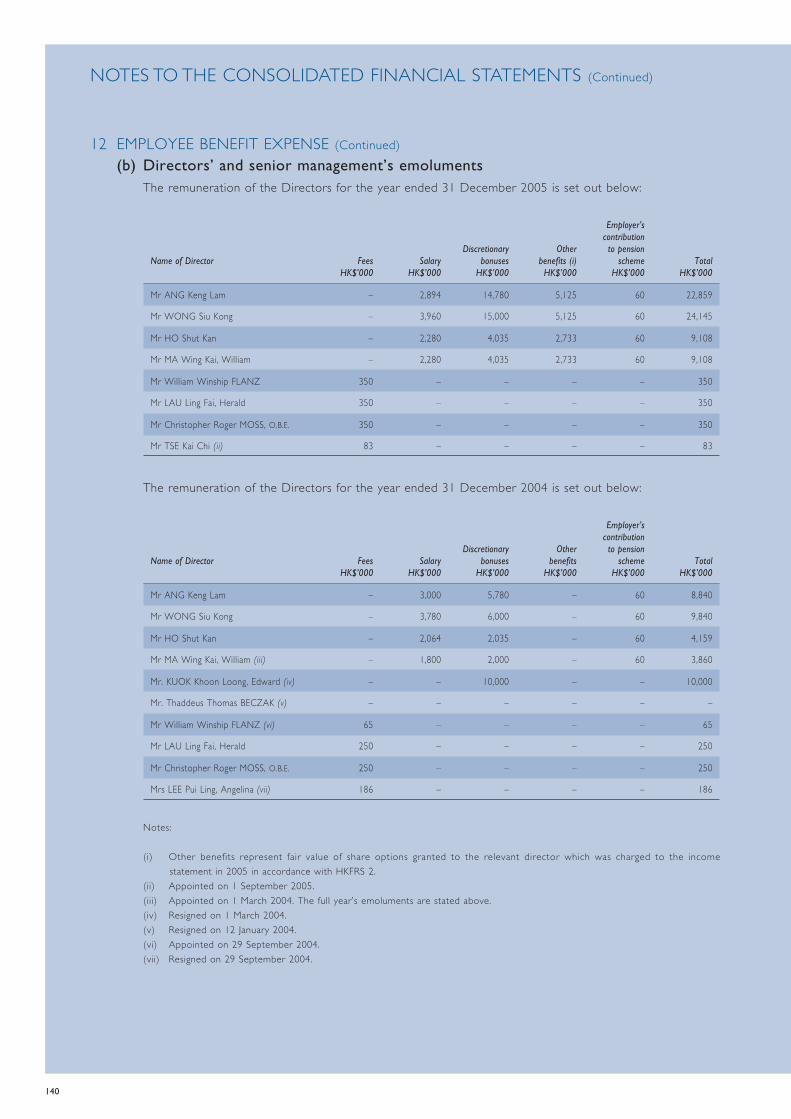
140
NOTES TO THE CONSOLIDATED FINANCIAL STATEMENTS (Continued)
12 EMPLOYEE BENEFIT EXPENSE (Continued)(b) Directors’ and senior management’s emoluments
The remuneration of the Directors for the year ended 31 December 2005 is set out below:
Employer’scontribution
Discretionary Other to pensionName of Director Fees Salary bonuses benefits (i) scheme Total
HK$’000 HK$’000 HK$’000 HK$’000 HK$’000 HK$’000
Mr ANG Keng Lam – 2,894 14,780 5,125 60 22,859
Mr WONG Siu Kong – 3,960 15,000 5,125 60 24,145
Mr HO Shut Kan – 2,280 4,035 2,733 60 9,108
Mr MA Wing Kai, William – 2,280 4,035 2,733 60 9,108
Mr William Winship FLANZ 350 – – – – 350
Mr LAU Ling Fai, Herald 350 – – – – 350
Mr Christopher Roger MOSS, O.B.E. 350 – – – – 350
Mr TSE Kai Chi (ii) 83 – – – – 83
The remuneration of the Directors for the year ended 31 December 2004 is set out below:
Employer’scontribution
Discretionary Other to pensionName of Director Fees Salary bonuses benefits scheme Total
HK$’000 HK$’000 HK$’000 HK$’000 HK$’000 HK$’000
Mr ANG Keng Lam – 3,000 5,780 – 60 8,840
Mr WONG Siu Kong – 3,780 6,000 – 60 9,840
Mr HO Shut Kan – 2,064 2,035 – 60 4,159
Mr MA Wing Kai, William (iii) – 1,800 2,000 – 60 3,860
Mr. KUOK Khoon Loong, Edward (iv) – – 10,000 – – 10,000
Mr. Thaddeus Thomas BECZAK (v) – – – – – –
Mr William Winship FLANZ (vi) 65 – – – – 65
Mr LAU Ling Fai, Herald 250 – – – – 250
Mr Christopher Roger MOSS, O.B.E. 250 – – – – 250
Mrs LEE Pui Ling, Angelina (vii) 186 – – – – 186
Notes:
(i) Other benefits represent fair value of share options granted to the relevant director which was charged to the incomestatement in 2005 in accordance with HKFRS 2.
(ii) Appointed on 1 September 2005.(iii) Appointed on 1 March 2004. The full year’s emoluments are stated above.(iv) Resigned on 1 March 2004.(v) Resigned on 12 January 2004.(vi) Appointed on 29 September 2004.(vii) Resigned on 29 September 2004.
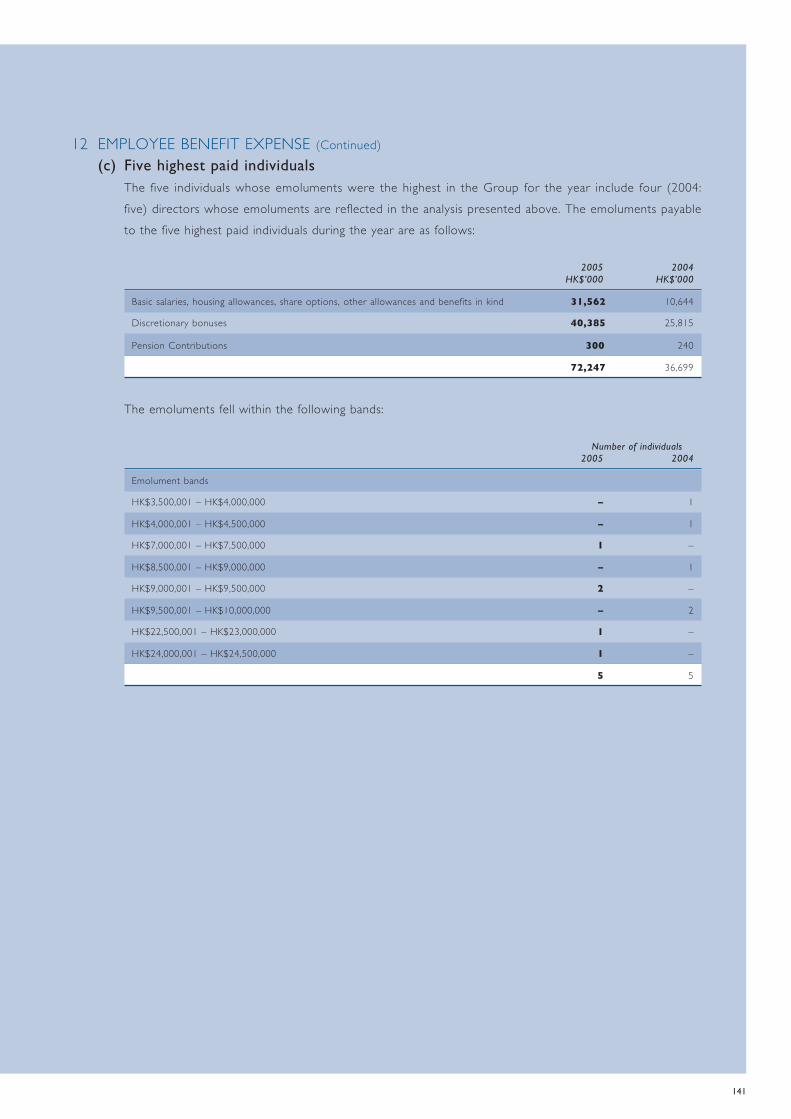
141
12 EMPLOYEE BENEFIT EXPENSE (Continued)(c) Five highest paid individuals
The five individuals whose emoluments were the highest in the Group for the year include four (2004:five) directors whose emoluments are reflected in the analysis presented above. The emoluments payableto the five highest paid individuals during the year are as follows:
2005 2004HK$’000 HK$’000
Basic salaries, housing allowances, share options, other allowances and benefits in kind 31,562 10,644
Discretionary bonuses 40,385 25,815
Pension Contributions 300 240
72,247 36,699
The emoluments fell within the following bands:
Number of individuals2005 2004
Emolument bands
HK$3,500,001 – HK$4,000,000 – 1
HK$4,000,001 – HK$4,500,000 – 1
HK$7,000,001 – HK$7,500,000 1 –
HK$8,500,001 – HK$9,000,000 – 1
HK$9,000,001 – HK$9,500,000 2 –
HK$9,500,001 – HK$10,000,000 – 2
HK$22,500,001 – HK$23,000,000 1 –
HK$24,000,001 – HK$24,500,000 1 –
5 5
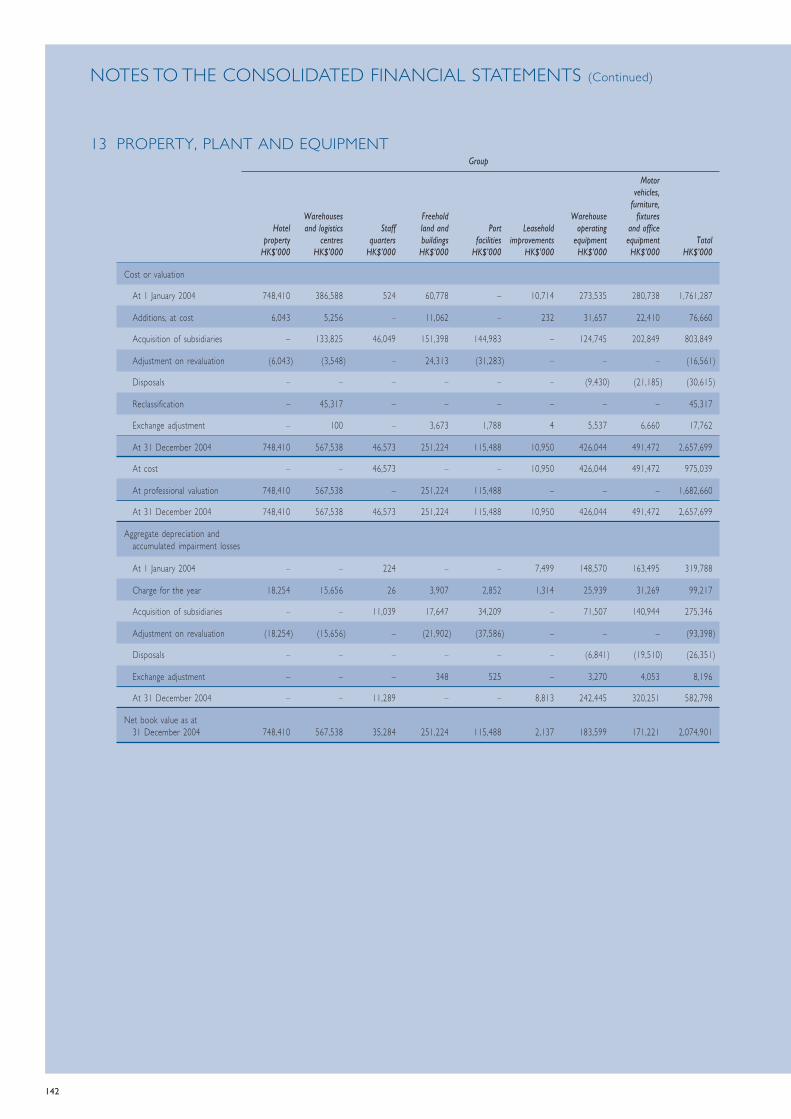
142
NOTES TO THE CONSOLIDATED FINANCIAL STATEMENTS (Continued)
13 PROPERTY, PLANT AND EQUIPMENTGroup
Motorvehicles,
furniture,Warehouses Freehold Warehouse fixtures
Hotel and logistics Staff land and Port Leasehold operating and officeproperty centres quarters buildings facilities improvements equipment equipment Total
HK$’000 HK$’000 HK$’000 HK$’000 HK$’000 HK$’000 HK$’000 HK$’000 HK$’000
Cost or valuation
At 1 January 2004 748,410 386,588 524 60,778 – 10,714 273,535 280,738 1,761,287
Additions, at cost 6,043 5,256 – 11,062 – 232 31,657 22,410 76,660
Acquisition of subsidiaries – 133,825 46,049 151,398 144,983 – 124,745 202,849 803,849
Adjustment on revaluation (6,043) (3,548) – 24,313 (31,283) – – – (16,561)
Disposals – – – – – – (9,430) (21,185) (30,615)
Reclassification – 45,317 – – – – – – 45,317
Exchange adjustment – 100 – 3,673 1,788 4 5,537 6,660 17,762
At 31 December 2004 748,410 567,538 46,573 251,224 115,488 10,950 426,044 491,472 2,657,699
At cost – – 46,573 – – 10,950 426,044 491,472 975,039
At professional valuation 748,410 567,538 – 251,224 115,488 – – – 1,682,660
At 31 December 2004 748,410 567,538 46,573 251,224 115,488 10,950 426,044 491,472 2,657,699
Aggregate depreciation andaccumulated impairment losses
At 1 January 2004 – – 224 – – 7,499 148,570 163,495 319,788
Charge for the year 18,254 15,656 26 3,907 2,852 1,314 25,939 31,269 99,217
Acquisition of subsidiaries – – 11,039 17,647 34,209 – 71,507 140,944 275,346
Adjustment on revaluation (18,254) (15,656) – (21,902) (37,586) – – – (93,398)
Disposals – – – – – – (6,841) (19,510) (26,351)
Exchange adjustment – – – 348 525 – 3,270 4,053 8,196
At 31 December 2004 – – 11,289 – – 8,813 242,445 320,251 582,798
Net book value as at31 December 2004 748,410 567,538 35,284 251,224 115,488 2,137 183,599 171,221 2,074,901

143
13 PROPERTY, PLANT AND EQUIPMENT (Continued)Group
Motorvehicles,
furniture,Warehouses Freehold Warehouse fixtures
Hotel and logistics Staff land and Port Leasehold operating and officeproperty centres quarters buildings facilities improvements equipment equipment Total
HK$’000 HK$’000 HK$’000 HK$’000 HK$’000 HK$’000 HK$’000 HK$’000 HK$’000
Cost or valuation
At 1 January 2005 748,410 567,538 46,573 251,224 115,488 10,950 426,044 491,472 2,657,699
Additions, at cost 4,292 13,932 508 948 – 229 29,347 70,349 119,605
Acquisition of subsidiaries – – – 2,004 – – 74 3,432 5,510
Adjustment on revaluation 64,409 9,439 – 18,749 1,702 – – – 94,299
Disposals – – (12,286) – – – (37,993) (84,831) (135,110)
Reclassification – (25,456) – (90) – – (75,174) 75,263 (25,457)
Exchange adjustment – 5,190 1,061 (14,454) (6,566) 96 (7,685) (4,098) (26,456)
At 31 December 2005 817,111 570,643 35,856 258,381 110,624 11,275 334,613 551,587 2,690,090
At cost – – 35,856 – – 11,275 334,613 551,587 933,331
At professional valuation 817,111 570,643 – 258,381 110,624 – – – 1,756,759
At 31 December 2005 817,111 570,643 35,856 258,381 110,624 11,275 334,613 551,587 2,690,090
Aggregate depreciation andaccumulated impairment losses
At 1 January 2005 – – 11,289 – – 8,813 242,445 320,251 582,798
Charge for the year 18,818 21,377 1,355 4,716 3,533 1,214 29,688 58,334 139,035
Acquisition of subsidiaries – – – – – – 50 2,476 2,526
Adjustment on revaluation (18,818) (21,453) – (4,622) (3,461) – – – (48,354)
Disposals – – (6,445) – – – (34,176) (67,892) (108,513)
Reclassification – – – – – – (42,194) 42,194 –
Exchange adjustment – 76 275 (94) (72) 74 (3,675) (1,351) (4,767)
At 31 December 2005 – – 6,474 – – 10,101 192,138 354,012 562,725
Net book value as at31 December 2005 817,111 570,643 29,382 258,381 110,624 1,174 142,475 197,575 2,127,365
(a) As at 31 December 2005, property, plant and equipment with an aggregate net book value ofHK$233,421,000 (2004: HK$244,612,000) and port facilities of HK$110,624,000 (2004: HK$115,488,000)were pledged as security for bank loan facilities granted to the Group (note 41).
(b) Hotel property, warehouses and logistics centres in the PRC and Hong Kong were valued by DTZDebenham Tie Leung Limited and Savills Valuation and Professional Services Limited. Freehold land andbuildings and port facilities in Thailand were valued by DTZ Debenham Tie Leung Limited while freeholdland and buildings in Australia were valued by Rushton Group. They are independent professional valuersand the valuation was on an open market value basis as at 31 December 2005.
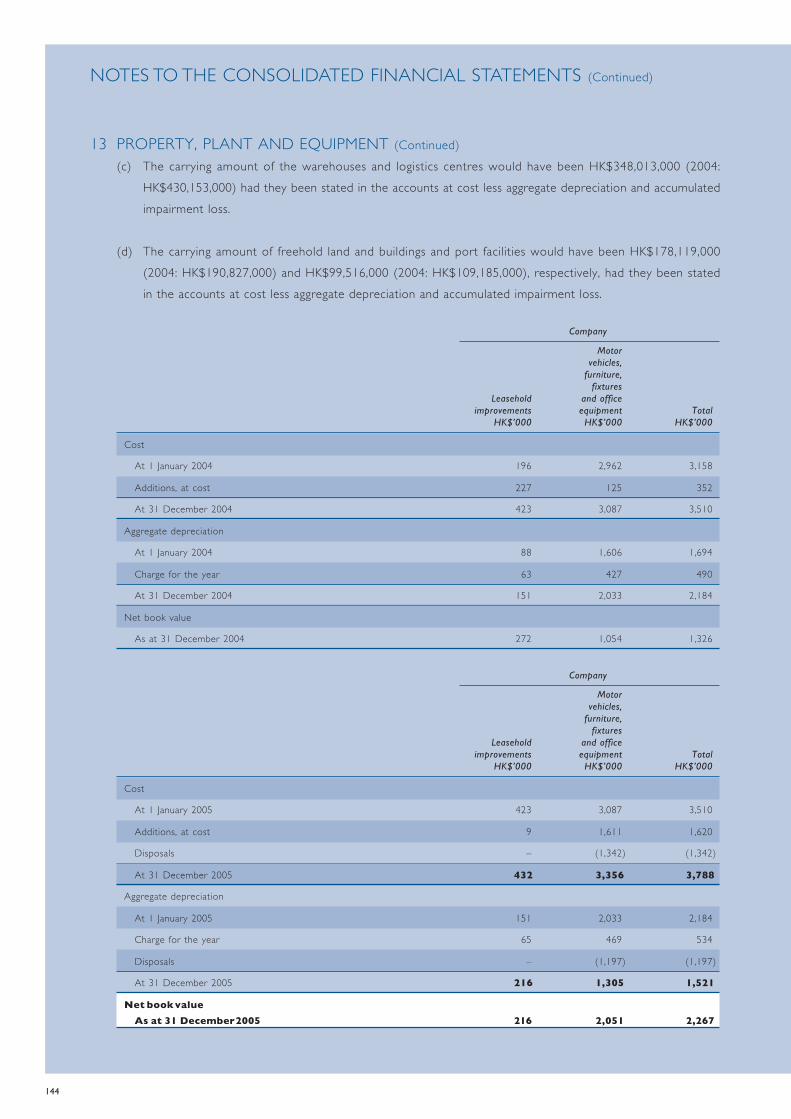
144
NOTES TO THE CONSOLIDATED FINANCIAL STATEMENTS (Continued)
13 PROPERTY, PLANT AND EQUIPMENT (Continued)(c) The carrying amount of the warehouses and logistics centres would have been HK$348,013,000 (2004:
HK$430,153,000) had they been stated in the accounts at cost less aggregate depreciation and accumulatedimpairment loss.
(d) The carrying amount of freehold land and buildings and port facilities would have been HK$178,119,000(2004: HK$190,827,000) and HK$99,516,000 (2004: HK$109,185,000), respectively, had they been statedin the accounts at cost less aggregate depreciation and accumulated impairment loss.
Company
Motorvehicles,
furniture,fixtures
Leasehold and officeimprovements equipment Total
HK$’000 HK$’000 HK$’000
Cost
At 1 January 2004 196 2,962 3,158
Additions, at cost 227 125 352
At 31 December 2004 423 3,087 3,510
Aggregate depreciation
At 1 January 2004 88 1,606 1,694
Charge for the year 63 427 490
At 31 December 2004 151 2,033 2,184
Net book value
As at 31 December 2004 272 1,054 1,326
Company
Motorvehicles,
furniture,fixtures
Leasehold and officeimprovements equipment Total
HK$’000 HK$’000 HK$’000
Cost
At 1 January 2005 423 3,087 3,510
Additions, at cost 9 1,611 1,620
Disposals – (1,342) (1,342)
At 31 December 2005 432 3,356 3,788
Aggregate depreciation
At 1 January 2005 151 2,033 2,184
Charge for the year 65 469 534
Disposals – (1,197) (1,197)
At 31 December 2005 216 1,305 1,521
Net book valueAs at 31 December 2005 216 2,051 2,267

145
14 INVESTMENT PROPERTIESGroup
2005 2004HK$’000 HK$’000
At 1 January 19,105,540 16,163,490
Additions 14,421 22,353
Increase in fair value 1,546,669 1,808,062
Disposals (284,245) (63,881)
Reclassification 125,256 1,174,539
Exchange adjustment 2,950 977
At 31 December 20,510,591 19,105,540
(a) As at 31 December 2005, investment properties amounting to HK$96,722,000 (2004: HK$1,404,267,000)were pledged as security for bank loan facilities granted to the Group (note 41).
(b) All investment properties were valued by DTZ Debenham Tie Leung Limited and Savills Valuation andProfessional Services Limited. They are independent professional valuers and the valuation was on an openmarket value basis as at 31 December 2005.
(c) The Group’s interest in investment properties at their net book values are analysed as follows:
2005 2004HK$’000 HK$’000
In Hong Kong, held on:
Leases of over 50 years 8,539,432 8,143,471
Leases of between 10 to 50 years 5,154,168 4,399,169
Outside Hong Kong, held on:
Leases of over 50 years 68,500 68,500
Leases of between 10 to 50 years 6,748,491 6,494,400
20,510,591 19,105,540

146
NOTES TO THE CONSOLIDATED FINANCIAL STATEMENTS (Continued)
15 LEASEHOLD LAND AND LAND USE RIGHTSThe Group’s interests in leasehold land and land use rights represent prepaid operating lease payments andtheir net book values are analysed as follows:
2005 2004HK$’000 HK$’000
In Hong Kong, held on:
Leases of between 10 to 50 years 80,335 82,248
Outside Hong Kong, held on:
Leases of between 10 to 50 years 244,991 309,967
325,326 392,215
2005 2004HK$’000 HK$’000
At 1 January 392,215 291,769
Additions 1,583 –
Acquisition of subsidiary – 90,248
Amortisation of prepaid operating lease payment (7,535) (6,788)
Reclassification (63,710) 16,986
Exchange adjustment 2,773 –
At 31 December 325,326 392,215
(a) As at 31 December 2005, leasehold land and land use rights amounting to HK$6,373,000 (2004: 6,354,000)was pledged as security for bank loan facilities granted to the Group (note 41).
16 PROPERTIES UNDER DEVELOPMENTThe Group’s interests in properties under development at their net book values are analysed as follows:
2005 2004HK$’000 HK$’000
In Hong Kong, held on:
Leases of over 50 years 595,192 584,254
Leases of between 10 to 50 years 4,236,675 661,901
Outside Hong Kong, held on:
Leases of over 50 years 691,755 178,421
Leases of between 10 to 50 years 2,281,000 1,369,629
Freehold land and buildings 50,549 10,452
7,855,171 2,804,657

147
16 PROPERTIES UNDER DEVELOPMENT (Continued)2005 2004
HK$’000 HK$’000
At 1 January 2,804,657 2,934,642
Additions during the year 4,312,434 595,732
Acquisition of subsidiaries 863,032 498,021
Reclassification (177,569) (1,224,570)
Exchange adjustment 52,617 832
At 31 December 7,855,171 2,804,657
(a) As at 31 December 2005, properties under development amounting to HK$47,162,000 (2004: Nil) waspledged as security for bank loan facilities granted to the Group (note 41).
17 SUBSIDIARIESCompany
2005 2004HK$’000 HK$’000
Unlisted shares, at cost (Note (a)) 18,643,700 18,643,700
Amounts due from subsidiaries (Note (b)) 12,619,589 8,650,388
31,263,289 27,294,088
(a) Details of subsidiaries are set out in note 43 to the financial statements.
(b) The amounts due from subsidiaries are unsecured, not repayable within twelve months from the balancesheet date and interest-free except for an amount of HK$9,852,528,000 (2004: HK$5,960,158,000) whichbears interest at prevailing market rates.
18 ASSOCIATED COMPANIESGroup
2005 2004HK$’000 HK$’000
Share of net assets other than negative goodwill (note a) 1,369,155 1,228,009
Negative goodwill (note b) – (21,459)
Amounts due from associated companies (note c) 5,012,888 3,350,349
Amounts due to associated companies (note d) (50,134) (35,612)
6,331,909 4,521,287
(a) Details of associated companies are set out in note 44 to the financial statements.
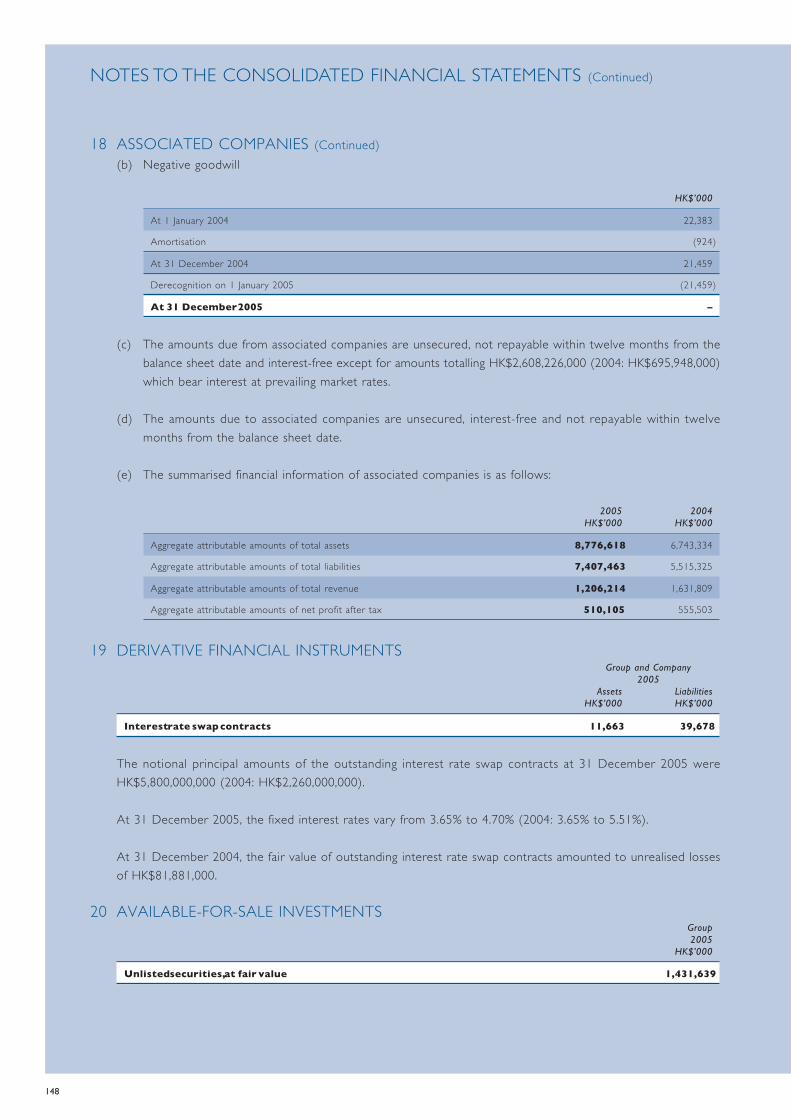
148
NOTES TO THE CONSOLIDATED FINANCIAL STATEMENTS (Continued)
18 ASSOCIATED COMPANIES (Continued)(b) Negative goodwill
HK$’000
At 1 January 2004 22,383
Amortisation (924)
At 31 December 2004 21,459
Derecognition on 1 January 2005 (21,459)
At 31 December 2005 –
(c) The amounts due from associated companies are unsecured, not repayable within twelve months from thebalance sheet date and interest-free except for amounts totalling HK$2,608,226,000 (2004: HK$695,948,000)which bear interest at prevailing market rates.
(d) The amounts due to associated companies are unsecured, interest-free and not repayable within twelvemonths from the balance sheet date.
(e) The summarised financial information of associated companies is as follows:
2005 2004HK$’000 HK$’000
Aggregate attributable amounts of total assets 8,776,618 6,743,334
Aggregate attributable amounts of total liabilities 7,407,463 5,515,325
Aggregate attributable amounts of total revenue 1,206,214 1,631,809
Aggregate attributable amounts of net profit after tax 510,105 555,503
19 DERIVATIVE FINANCIAL INSTRUMENTSGroup and Company
2005Assets Liabilities
HK$’000 HK$’000
Interest rate swap contracts 11,663 39,678
The notional principal amounts of the outstanding interest rate swap contracts at 31 December 2005 wereHK$5,800,000,000 (2004: HK$2,260,000,000).
At 31 December 2005, the fixed interest rates vary from 3.65% to 4.70% (2004: 3.65% to 5.51%).
At 31 December 2004, the fair value of outstanding interest rate swap contracts amounted to unrealised lossesof HK$81,881,000.
20 AVAILABLE-FOR-SALE INVESTMENTSGroup2005
HK$’000
Unlisted securities, at fair value 1,431,639

149
21 LONG-TERM INVESTMENTSGroup2004
HK$’000
Long-term investments
Non-trading securities:
Unlisted investments, at fair value 1,237,605
Amounts due from investee companies (note (a)) 1,908
1,239,513
Club debentures, at cost 9,967
1,249,480
(a) The amounts due from investee companies are unsecured, interest-free and not repayable within twelvemonths from the balance sheet date.
22 LONG-TERM RECEIVABLES AND ACCOUNTS RECEIVABLE, PREPAYMENTS ANDDEPOSITS
Group2005 2004
HK$’000 HK$’000
Trade receivables (note (a)) 918,080 972,808
Land deposits and deferred project development costs 1,390,255 224,560
Second mortgage loans receivables 106,339 184,425
Others 484,709 454,080
2,899,383 1,835,873
Less: long-term receivables (note (b)) (102,503) (167,098)
Current portion 2,796,880 1,668,775
The carrying amounts of long-term receivables and accounts receivable, prepayments and deposits approximatethe fair value of these balances.
(a) The Group maintains defined credit policies and applies credit policies appropriate to the particularbusiness circumstances of the Group. At 31 December 2005 and 2004, the ageing analysis of the tradereceivables of the Group were as follows:
2005 2004HK$’000 HK$’000
Below 1 month 459,297 579,505
Between 1 month and 3 months 361,819 317,642
Over 3 months 96,964 75,661
918,080 972,808
There is no concentration of credit risk with respect to trade receivables, as the Group has a large numberof customers.
(b) Amount represents non-current portion of second mortgage loans to buyers of certain properties developedby the Group.
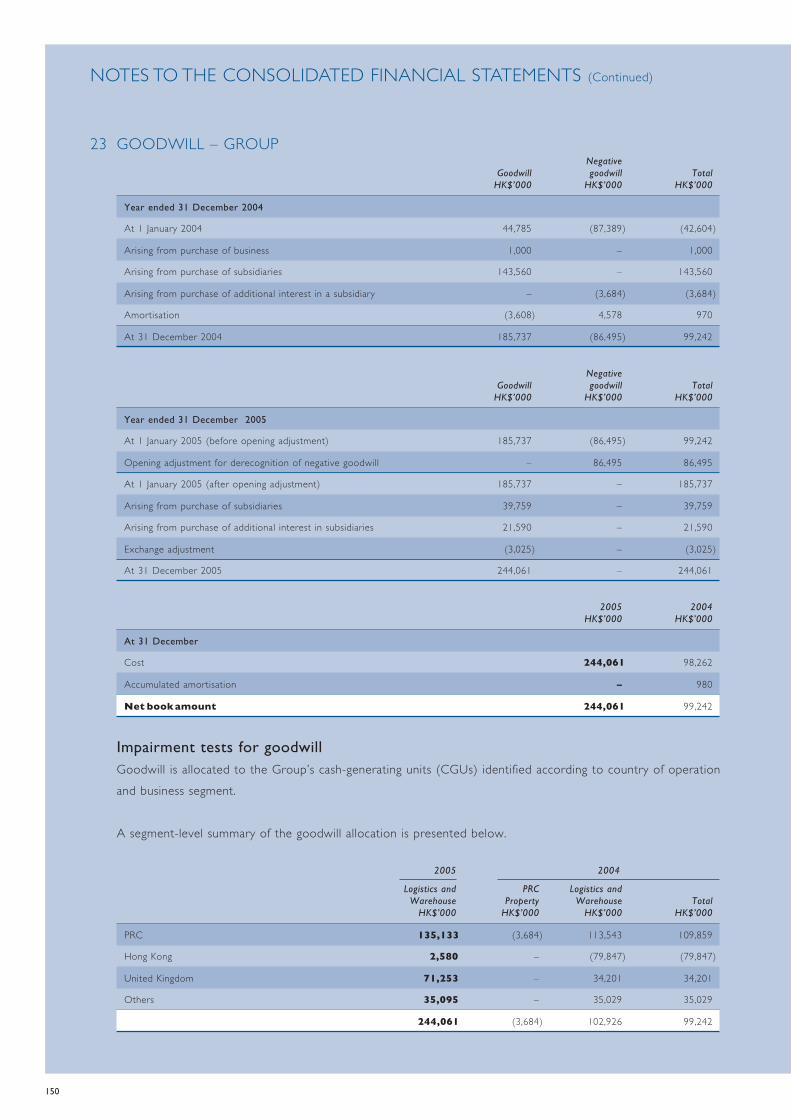
150
NOTES TO THE CONSOLIDATED FINANCIAL STATEMENTS (Continued)
23 GOODWILL – GROUPNegative
Goodwill goodwill TotalHK$’000 HK$’000 HK$’000
Year ended 31 December 2004
At 1 January 2004 44,785 (87,389) (42,604)
Arising from purchase of business 1,000 – 1,000
Arising from purchase of subsidiaries 143,560 – 143,560
Arising from purchase of additional interest in a subsidiary – (3,684) (3,684)
Amortisation (3,608) 4,578 970
At 31 December 2004 185,737 (86,495) 99,242
NegativeGoodwill goodwill Total
HK$’000 HK$’000 HK$’000
Year ended 31 December 2005
At 1 January 2005 (before opening adjustment) 185,737 (86,495) 99,242
Opening adjustment for derecognition of negative goodwill – 86,495 86,495
At 1 January 2005 (after opening adjustment) 185,737 – 185,737
Arising from purchase of subsidiaries 39,759 – 39,759
Arising from purchase of additional interest in subsidiaries 21,590 – 21,590
Exchange adjustment (3,025) – (3,025)
At 31 December 2005 244,061 – 244,061
2005 2004HK$’000 HK$’000
At 31 December
Cost 244,061 98,262
Accumulated amortisation – 980
Net book amount 244,061 99,242
Impairment tests for goodwillGoodwill is allocated to the Group’s cash-generating units (CGUs) identified according to country of operationand business segment.
A segment-level summary of the goodwill allocation is presented below.
2005 2004
Logistics and PRC Logistics andWarehouse Property Warehouse Total
HK$’000 HK$’000 HK$’000 HK$’000
PRC 135,133 (3,684) 113,543 109,859
Hong Kong 2,580 – (79,847) (79,847)
United Kingdom 71,253 – 34,201 34,201
Others 35,095 – 35,029 35,029
244,061 (3,684) 102,926 99,242

151
23 GOODWILL – GROUP (Continued)The recoverable amount of a CGU is determined based on value-in-use calculations. These calculations use cashflow projections based on financial budgets approved by management covering a five-year period. Cash flowsbeyond the five-year period are extrapolated using the estimated growth rates stated below.
Key assumptions used for value-in-use calculationsLogistics and Warehouse
PRC Hong Kong United Kingdom Others
Gross Margin 3% 2% 8% 1%-46%
Growth rate 2% 2% 5% 2%
Discount rate 10% 10% 10% 10%
These assumptions have been used for the analysis of each CGU within the business segment.
Management determined budgeted gross margin and growth rates based on past performance and its expectationsof the market development. The discount rates used are pre-tax and reflect specific risks relating to the relevantsegments.
24 STOCK OF COMPLETED PROPERTIES HELD FOR SALEGroup
2005 2004HK$’000 HK$’000
Leasehold land and land use rights 51,582 149,749
Other development costs 196,975 368,476
248,557 518,225
25 LISTED SECURITIES AT FAIR VALUE THROUGH PROFIT OR LOSSGroup2005
HK$’000
Listed securities:
– Equity securities – Hong Kong 25,798
– Equity securities – Malaysia 70
Market value of listed securities 25,868
All the above securities were designated at fair value through profit or loss at inception.
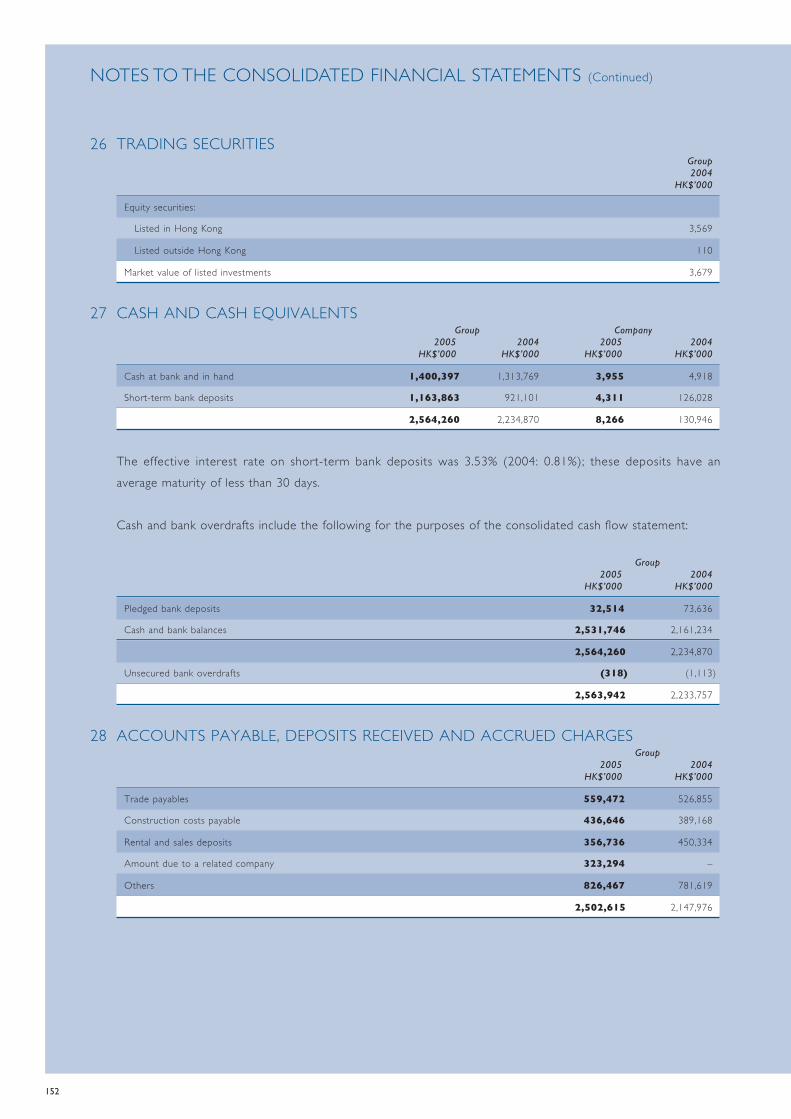
152
NOTES TO THE CONSOLIDATED FINANCIAL STATEMENTS (Continued)
26 TRADING SECURITIESGroup2004
HK$’000
Equity securities:
Listed in Hong Kong 3,569
Listed outside Hong Kong 110
Market value of listed investments 3,679
27 CASH AND CASH EQUIVALENTSGroup Company
2005 2004 2005 2004HK$’000 HK$’000 HK$’000 HK$’000
Cash at bank and in hand 1,400,397 1,313,769 3,955 4,918
Short-term bank deposits 1,163,863 921,101 4,311 126,028
2,564,260 2,234,870 8,266 130,946
The effective interest rate on short-term bank deposits was 3.53% (2004: 0.81%); these deposits have anaverage maturity of less than 30 days.
Cash and bank overdrafts include the following for the purposes of the consolidated cash flow statement:
Group2005 2004
HK$’000 HK$’000
Pledged bank deposits 32,514 73,636
Cash and bank balances 2,531,746 2,161,234
2,564,260 2,234,870
Unsecured bank overdrafts (318) (1,113)
2,563,942 2,233,757
28 ACCOUNTS PAYABLE, DEPOSITS RECEIVED AND ACCRUED CHARGESGroup
2005 2004HK$’000 HK$’000
Trade payables 559,472 526,855
Construction costs payable 436,646 389,168
Rental and sales deposits 356,736 450,334
Amount due to a related company 323,294 –
Others 826,467 781,619
2,502,615 2,147,976

153
28 ACCOUNTS PAYABLE, DEPOSITS RECEIVED AND ACCRUED CHARGES (Continued)The ageing analysis of trade payables as at 31 December 2005 was as follows:
Group2005 2004
HK$’000 HK$’000
Below 1 month 326,336 304,995
Between 1 month and 3 months 117,952 114,710
Over 3 months 115,184 107,150
559,472 526,855
29 BANK LOANSGroup Company
2005 2004 2005 2004HK$’000 HK$’000 HK$’000 HK$’000
Non-current
Bank loans
– unsecured 8,194,489 5,210,093 7,380,000 4,130,000
– secured (note 41) 122,914 266,289 – –
8,317,403 5,476,382 7,380,000 4,130,000
Current
Bank loans
– unsecured 892,492 537,039 450,000 150,000
– secured (note 41) 124,491 143,389 – –
1,016,983 680,428 450,000 150,000
Total bank loans 9,334,386 6,156,810 7,830,000 4,280,000
The maturity of bank loans is as follows:
Group Company2005 2004 2005 2004
HK$’000 HK$’000 HK$’000 HK$’000
Within 1 year 1,016,983 680,428 450,000 150,000
Between 1 and 2 years 4,213,695 764,259 3,830,000 300,000
Between 2 and 5 years 4,100,871 4,712,123 3,550,000 3,830,000
Wholly repayable within 5 years 9,331,549 6,156,810 7,830,000 4,280,000
Over 5 years 2,837 – – –
9,334,386 6,156,810 7,830,000 4,280,000
The effective interest rates of the major bank borrowings at the balance sheet date were as follows:
2005 2004
HK$ US$ RMB HK$ US$ RMB
Bank loans 4.40% 4.74% 5.41% 0.72% 2.99% 5.47%

154
NOTES TO THE CONSOLIDATED FINANCIAL STATEMENTS (Continued)
29 BANK LOANS (Continued)The carrying amounts of all bank loans approximate their fair value.
The carrying amounts of the bank loans are denominated in the following currencies:
Group Company
2005 2004 2005 2004HK$’000 HK$’000 HK$’000 HK$’000
Hong Kong dollar 8,480,000 5,223,175 7,830,000 4,280,000
US dollar 469,443 486,944 – –
Renminbi 201,865 243,891 – –
Other currencies 183,078 202,800 – –
9,334,386 6,156,810 7,830,000 4,280,000
At 31 December 2005, the Group has the following undrawn borrowing facilities:
2005 2004HK$’000 HK$’000
Floating rate
– expiring within one year 136,170 688,772
– expiring beyond one year 3,613,614 7,165,812
3,749,784 7,854,584
30 CONVERTIBLE BONDSOn 8 April 2005, Wise Insight Finance Limited, a wholly-owned subsidiary of the Company, issued an aggregateprincipal amount of HK$2,500,000,000 zero-coupon guaranteed convertible bonds which are due in April 2010at a redemption price of 119.354% of the principal amount. The bonds are convertible into ordinary shares ofHK$1 each in the Company.
The fair values of the liability component and the equity component were determined upon the issuance of theconvertible bonds.
The fair value of the liability component was calculated using a market interest rate for a bond with the sametenure but with no conversion features. The residual amount, representing the value of the equity component,is credited to a convertible bonds reserve under equity attributable to the Company’s shareholders.
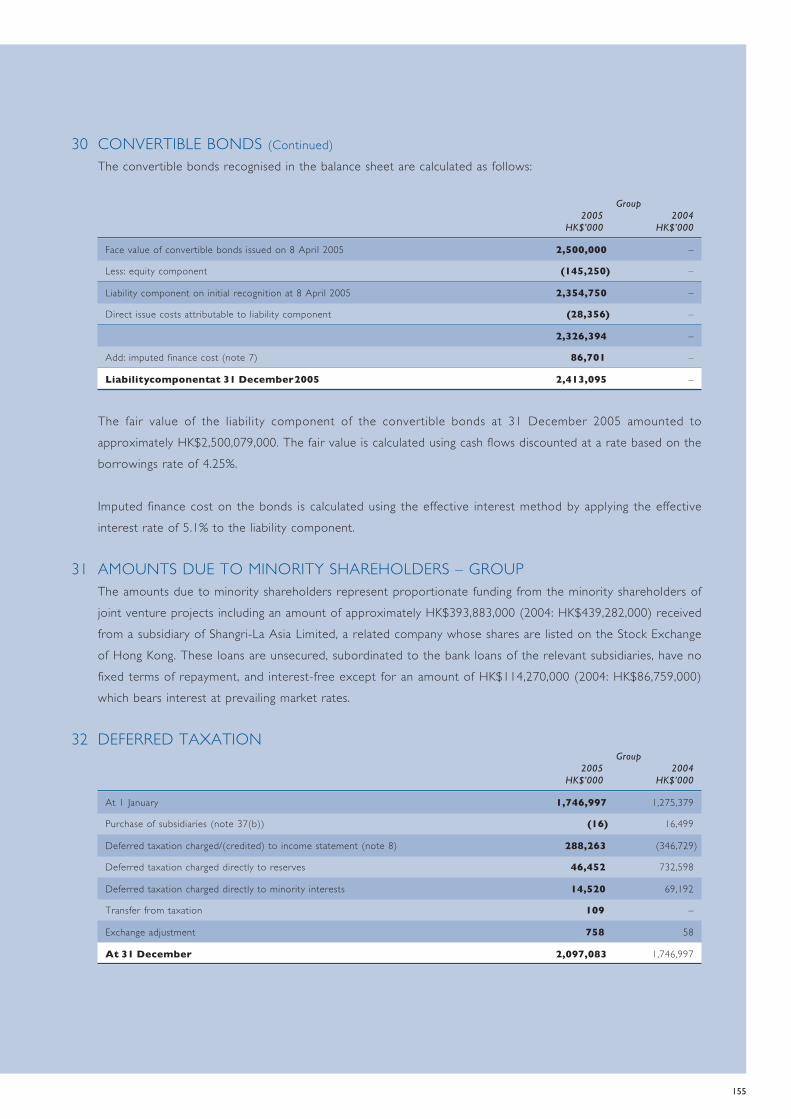
155
30 CONVERTIBLE BONDS (Continued)The convertible bonds recognised in the balance sheet are calculated as follows:
Group2005 2004
HK$’000 HK$’000
Face value of convertible bonds issued on 8 April 2005 2,500,000 –
Less: equity component (145,250) –
Liability component on initial recognition at 8 April 2005 2,354,750 –
Direct issue costs attributable to liability component (28,356) –
2,326,394 –
Add: imputed finance cost (note 7) 86,701 –
Liability component at 31 December 2005 2,413,095 –
The fair value of the liability component of the convertible bonds at 31 December 2005 amounted toapproximately HK$2,500,079,000. The fair value is calculated using cash flows discounted at a rate based on theborrowings rate of 4.25%.
Imputed finance cost on the bonds is calculated using the effective interest method by applying the effectiveinterest rate of 5.1% to the liability component.
31 AMOUNTS DUE TO MINORITY SHAREHOLDERS – GROUPThe amounts due to minority shareholders represent proportionate funding from the minority shareholders ofjoint venture projects including an amount of approximately HK$393,883,000 (2004: HK$439,282,000) receivedfrom a subsidiary of Shangri-La Asia Limited, a related company whose shares are listed on the Stock Exchangeof Hong Kong. These loans are unsecured, subordinated to the bank loans of the relevant subsidiaries, have nofixed terms of repayment, and interest-free except for an amount of HK$114,270,000 (2004: HK$86,759,000)which bears interest at prevailing market rates.
32 DEFERRED TAXATIONGroup
2005 2004HK$’000 HK$’000
At 1 January 1,746,997 1,275,379
Purchase of subsidiaries (note 37(b)) (16) 16,499
Deferred taxation charged/(credited) to income statement (note 8) 288,263 (346,729)
Deferred taxation charged directly to reserves 46,452 732,598
Deferred taxation charged directly to minority interests 14,520 69,192
Transfer from taxation 109 –
Exchange adjustment 758 58
At 31 December 2,097,083 1,746,997

156
NOTES TO THE CONSOLIDATED FINANCIAL STATEMENTS (Continued)
32 DEFERRED TAXATION (Continued)Deferred income tax assets are recognised for tax losses carried forward to the extent that the realisation ofthe related tax benefit through the future taxable profits is probable. The Group has unrecognised tax losses ofHK$1,475,545,000 (2004: HK$1,481,789,000) to be carried forward for offset against future taxable income.
The movement in deferred tax assets and liabilities during the year was as follows:
GroupAccelerated
depreciationRevaluation allowances Tax losses Total
HK$’000 HK$’000 HK$’000 HK$’000
At 1 January 2004 1,313,696 133,605 (171,922) 1,275,379
Purchase of subsidiaries 16,499 – – 16,499
Deferred taxation (credited)/charged toincome statement (390,753) 41,615 2,409 (346,729)
Deferred taxation charged directly to reserves 729,171 – 3,427 732,598
Deferred taxation charged directly to minority interests 69,192 – – 69,192
Exchange adjustment – 58 – 58
At 31 December 2004 1,737,805 175,278 (166,086) 1,746,997
GroupAccelerated
depreciationRevaluation allowances Tax losses Total
HK$’000 HK$’000 HK$’000 HK$’000
At 1 January 2005 1,737,805 175,278 (166,086) 1,746,997
Purchase of subsidiaries – (16) – (16)
Deferred taxation charged/(credited) toincome statement 237,939 56,081 (5,757) 288,263
Deferred taxation charged directly to reserves 46,452 – – 46,452
Deferred taxation charged directly to minority interests 14,520 – – 14,520
Transfer from taxation – 109 – 109
Exchange adjustments – 758 – 758
At 31 December 2005 2,036,716 232,210 (171,843) 2,097,083
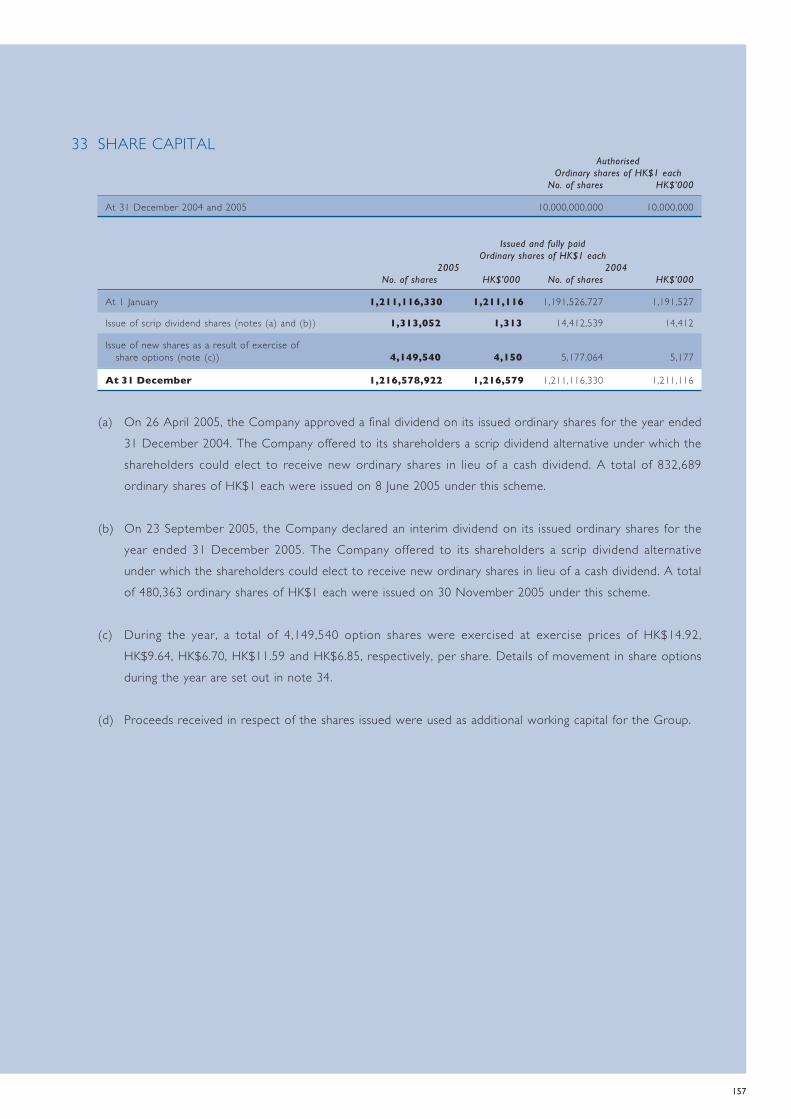
157
33 SHARE CAPITALAuthorised
Ordinary shares of HK$1 eachNo. of shares HK$’000
At 31 December 2004 and 2005 10,000,000,000 10,000,000
Issued and fully paidOrdinary shares of HK$1 each
2005 2004No. of shares HK$’000 No. of shares HK$’000
At 1 January 1,211,116,330 1,211,116 1,191,526,727 1,191,527
Issue of scrip dividend shares (notes (a) and (b)) 1,313,052 1,313 14,412,539 14,412
Issue of new shares as a result of exercise ofshare options (note (c)) 4,149,540 4,150 5,177,064 5,177
At 31 December 1,216,578,922 1,216,579 1,211,116,330 1,211,116
(a) On 26 April 2005, the Company approved a final dividend on its issued ordinary shares for the year ended31 December 2004. The Company offered to its shareholders a scrip dividend alternative under which theshareholders could elect to receive new ordinary shares in lieu of a cash dividend. A total of 832,689ordinary shares of HK$1 each were issued on 8 June 2005 under this scheme.
(b) On 23 September 2005, the Company declared an interim dividend on its issued ordinary shares for theyear ended 31 December 2005. The Company offered to its shareholders a scrip dividend alternativeunder which the shareholders could elect to receive new ordinary shares in lieu of a cash dividend. A totalof 480,363 ordinary shares of HK$1 each were issued on 30 November 2005 under this scheme.
(c) During the year, a total of 4,149,540 option shares were exercised at exercise prices of HK$14.92,HK$9.64, HK$6.70, HK$11.59 and HK$6.85, respectively, per share. Details of movement in share optionsduring the year are set out in note 34.
(d) Proceeds received in respect of the shares issued were used as additional working capital for the Group.

158
NOTES TO THE CONSOLIDATED FINANCIAL STATEMENTS (Continued)
34 SHARE OPTIONS(a) 1997 Share Option Scheme
Under the 1997 Share Option Scheme, the directors of the Company were authorised, at their discretion,to invite executive directors and key employees of the Company or its subsidiaries to subscribe for sharesin the Company subject to terms and conditions stipulated therein. The exercise price for any particularoption was determined by the Board of Directors of the Company in its absolute discretion subject to thecompliance with the requirements for share option schemes under the Listing Rules.
The 1997 Share Option Scheme was terminated on 17 April 2002 such that no further options shall beoffered but the options which had been granted during its life shall continue to be valid and exercisable inaccordance with their terms of issue and in all other respects its provisions shall remain in full force andeffect.
Details of the movement of the share options under the 1997 Share Option Scheme during the year are asfollows:
2005 2004Weighted Weighted
average exercise average exerciseprice in HK$ price in HK$
per share Number per share Number
At 1 January 11.68 21,035,631 11.16 26,303,507
Granted during the year – – – –
Additional number of option shares granted forthe adjustment during the year – – 11.70 277,240
Exercised during the year (note i) 10.43 (4,149,540) 8.79 (5,177,064)
Lapsed during the year – – 14.92 (368,052)
At 31 December (note ii) 16,886,091 21,035,631
As at 31 December 2005, all the outstanding share options granted under the 1997 Share Option Schemewere exercisable. There were a total of 4,149,540 shares exercised during the year (2004: 5,177,064shares) and that the weighted average exercise price was HK$10.43 each (2004: HK$8.79 each). Therelated weighted average share price at the time of exercise was HK$19.21 (2004: HK$14.13).

159
34 SHARE OPTIONS (Continued)(a) 1997 Share Option Scheme (Continued)
(i) Details of share options exercised during the year were as follows:
2005
Market valueper share
on the day ProceedsNumber of share options exercised at the following price per share of exercise received
Exercise period HK$14.92 HK$9.64 HK$6.70 HK$11.59 HK$6.85 Total HK$ HK$
January 2005 301,202 – – – 77,736 378,938 16.00 to 16.55 5,026,425
February 2005 – 23,618 32,101 97,081 – 152,800 16.20 to 18.25 1,567,923
March 2005 – 35,050 – 42,208 346,640 423,898 17.10 to 18.25 3,201,557
April 2005 – 10,000 – – 10,364 20,364 16.80 to 17.10 167,393
May 2005 – 40,000 254,640 – – 294,640 16.05 to 17.50 2,091,688
June 2005 – 24,292 – 42,208 – 66,500 16.45 to 16.55 723,366
July 2005 – 50,000 – 105,520 438,000 593,520 19.00 to 20.30 4,705,277
August 2005 443,571 118,268 – – 310,364 872,203 20.50 to 21.05 9,884,176
September 2005 43,983 – 53,838 – 10,364 108,185 20.05 to 21.70 1,087,934
October 2005 167,290 171,450 – 63,311 298,495 700,546 18.95 to 20.20 6,927,210
November 2005 417,290 – – – – 417,290 19.95 to 20.95 6,225,967
December 2005 100,000 10,292 – – 10,364 120,656 21.40 to 21.70 1,662,208
1,473,336 482,970 340,579 350,328 1,502,327 4,149,540 43,271,124
2004
Market valueper share
on the day ProceedsNumber of share options exercised at the following price per share of exercise received
Exercise period HK$15.12 HK$9.77 HK$6.79 HK$11.74 HK$6.94 Total HK$ HK$
January 2004 – 969,987 1,090,156 28,000 594,291 2,682,434 12.05 to 13.95 21,332,032
February 2004 – 30,437 – – – 30,437 13.55 297,369
March 2004 – 183,312 42,236 – 50,000 275,548 12.70 to 13.25 2,424,741
April 2004 – 437 31,676 13,669 61,612 107,394 11.95 to 12.85 807,411
May 2004 – – 220,000 – – 220,000 9.60 1,493,800
June 2004 – – – – – – – –
July 2004 – 63,437 – – – 63,437 12.15 619,779
August 2004 – 63,437 – – 30,690 94,127 13.05 to 14.10 832,768
September 2004 – – 16,676 – 10,230 26,906 14.60 to 15.05 184,226
October 2004 500,000 295,608 340,438 154,172 102,304 1,392,522 15.00 to 15.45 15,279,633
November 2004 50,000 155,728 – – 26,227 231,955 15.05 to 16.70 2,459,478
December 2004 – – – – 52,304 52,304 16.40 362,990
550,000 1,762,383 1,741,182 195,841 927,658 5,177,064 46,094,227
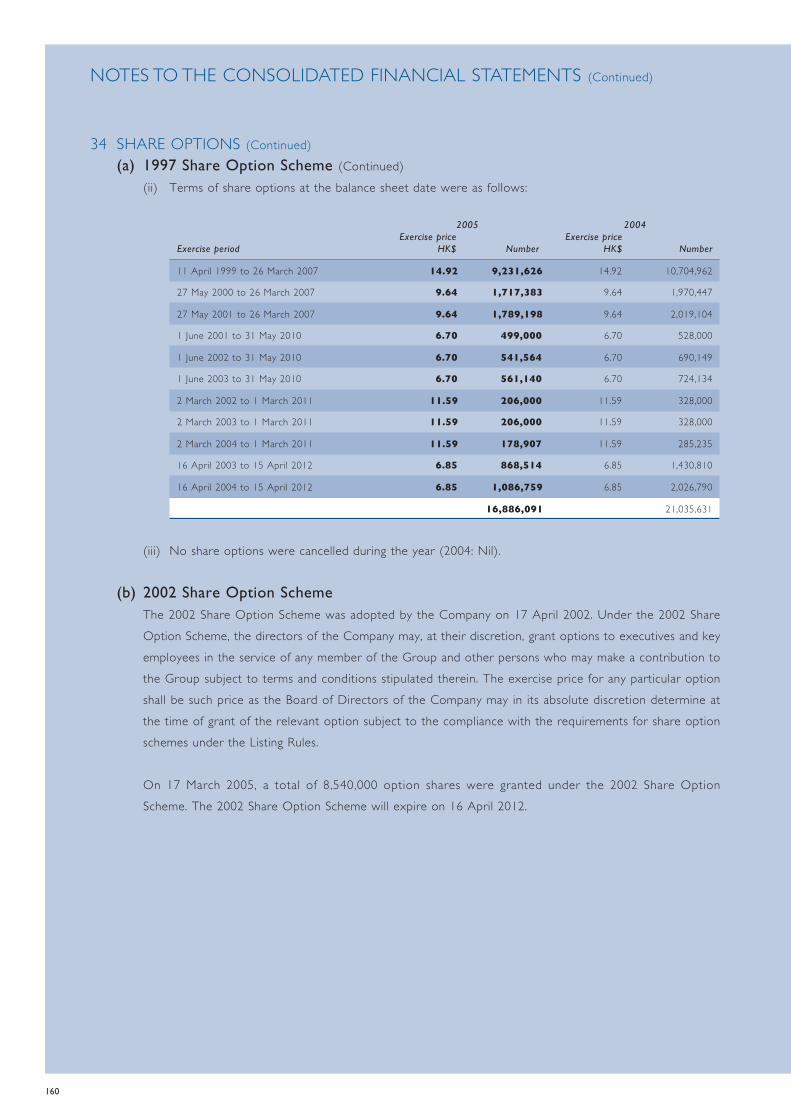
160
NOTES TO THE CONSOLIDATED FINANCIAL STATEMENTS (Continued)
34 SHARE OPTIONS (Continued)(a) 1997 Share Option Scheme (Continued)
(ii) Terms of share options at the balance sheet date were as follows:
2005 2004Exercise price Exercise price
Exercise period HK$ Number HK$ Number
11 April 1999 to 26 March 2007 14.92 9,231,626 14.92 10,704,962
27 May 2000 to 26 March 2007 9.64 1,717,383 9.64 1,970,447
27 May 2001 to 26 March 2007 9.64 1,789,198 9.64 2,019,104
1 June 2001 to 31 May 2010 6.70 499,000 6.70 528,000
1 June 2002 to 31 May 2010 6.70 541,564 6.70 690,149
1 June 2003 to 31 May 2010 6.70 561,140 6.70 724,134
2 March 2002 to 1 March 2011 11.59 206,000 11.59 328,000
2 March 2003 to 1 March 2011 11.59 206,000 11.59 328,000
2 March 2004 to 1 March 2011 11.59 178,907 11.59 285,235
16 April 2003 to 15 April 2012 6.85 868,514 6.85 1,430,810
16 April 2004 to 15 April 2012 6.85 1,086,759 6.85 2,026,790
16,886,091 21,035,631
(iii) No share options were cancelled during the year (2004: Nil).
(b) 2002 Share Option SchemeThe 2002 Share Option Scheme was adopted by the Company on 17 April 2002. Under the 2002 ShareOption Scheme, the directors of the Company may, at their discretion, grant options to executives and keyemployees in the service of any member of the Group and other persons who may make a contribution tothe Group subject to terms and conditions stipulated therein. The exercise price for any particular optionshall be such price as the Board of Directors of the Company may in its absolute discretion determine atthe time of grant of the relevant option subject to the compliance with the requirements for share optionschemes under the Listing Rules.
On 17 March 2005, a total of 8,540,000 option shares were granted under the 2002 Share OptionScheme. The 2002 Share Option Scheme will expire on 16 April 2012.

161
34 SHARE OPTIONS (Continued)(b) 2002 Share Option Scheme (Continued)
Details of the movement of the share options under the 2002 Share Option Scheme during the year are asfollows:
2005 2004Average exercise Average exercise
price in HK$ price in HK$per share Number per share Number
At 1 January – – – –
Granted during the year 18.74 8,540,000 – –
Exercised during the year – – – –
Lapsed during the year – – – –
At 31 December (note v) 8,540,000 –
All the outstanding share options granted under the 2002 Share Option Scheme remain unvested as at 31December 2005.
(i) The average fair value of options granted at 17 March 2005 is HK$5.81 per option.
(ii) The valuation was based on a Binomial Model with the following data and assumptions:
Share price at the grant date: HK$18.45Exercise price: HK$18.74Expected volatility: 40% p.a.Option life: 10 yearsExpected dividend: 3.00% p.a.Average risk-free interest rate: 3.87% p.a.Rate of leaving service: 5.00% p.a.Early exercise assumption: Option holders will exercise the option when the share price
is at least 160% of the exercise price
(iii) The volatility rate of the share price of the Company was determined with reference to the movementof the Company’s share prices during the period from August 1996 to August 2005.
(iv) Taking into account the probability of leaving employment and early exercise behavior stated above,the average expected life of the grant was estimated to be 5.80 years. The risk-free interest rate istaken to be the linearly interpolated yields of Hong Kong Exchange Fund Notes as at the grant date.
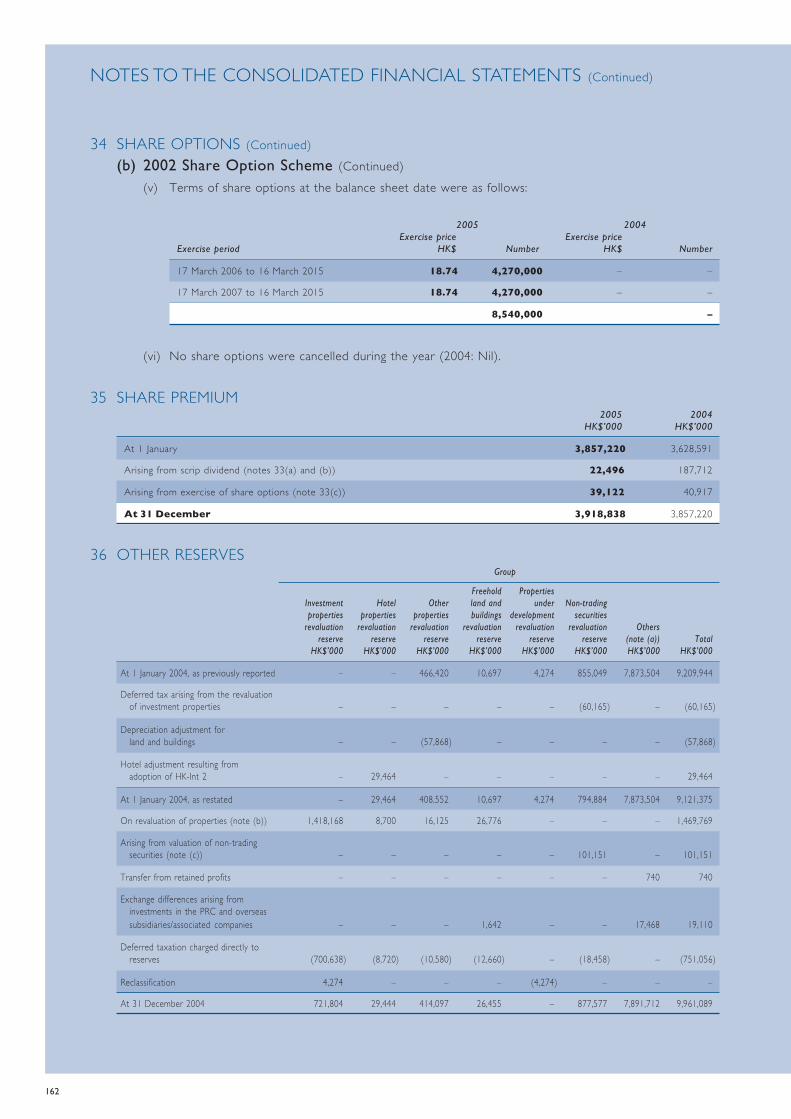
162
NOTES TO THE CONSOLIDATED FINANCIAL STATEMENTS (Continued)
34 SHARE OPTIONS (Continued)(b) 2002 Share Option Scheme (Continued)
(v) Terms of share options at the balance sheet date were as follows:
2005 2004Exercise price Exercise price
Exercise period HK$ Number HK$ Number
17 March 2006 to 16 March 2015 18.74 4,270,000 – –
17 March 2007 to 16 March 2015 18.74 4,270,000 – –
8,540,000 –
(vi) No share options were cancelled during the year (2004: Nil).
35 SHARE PREMIUM2005 2004
HK$’000 HK$’000
At 1 January 3,857,220 3,628,591
Arising from scrip dividend (notes 33(a) and (b)) 22,496 187,712
Arising from exercise of share options (note 33(c)) 39,122 40,917
At 31 December 3,918,838 3,857,220
36 OTHER RESERVESGroup
Freehold PropertiesInvestment Hotel Other land and under Non-tradingproperties properties properties buildings development securities
revaluation revaluation revaluation revaluation revaluation revaluation Othersreserve reserve reserve reserve reserve reserve (note (a)) Total
HK$’000 HK$’000 HK$’000 HK$’000 HK$’000 HK$’000 HK$’000 HK$’000
At 1 January 2004, as previously reported – – 466,420 10,697 4,274 855,049 7,873,504 9,209,944
Deferred tax arising from the revaluationof investment properties – – – – – (60,165) – (60,165)
Depreciation adjustment forland and buildings – – (57,868) – – – – (57,868)
Hotel adjustment resulting fromadoption of HK-Int 2 – 29,464 – – – – – 29,464
At 1 January 2004, as restated – 29,464 408,552 10,697 4,274 794,884 7,873,504 9,121,375
On revaluation of properties (note (b)) 1,418,168 8,700 16,125 26,776 – – – 1,469,769
Arising from valuation of non-tradingsecurities (note (c)) – – – – – 101,151 – 101,151
Transfer from retained profits – – – – – – 740 740
Exchange differences arising frominvestments in the PRC and overseassubsidiaries/associated companies – – – 1,642 – – 17,468 19,110
Deferred taxation charged directly toreserves (700,638) (8,720) (10,580) (12,660) – (18,458) – (751,056)
Reclassification 4,274 – – – (4,274) – – –
At 31 December 2004 721,804 29,444 414,097 26,455 – 877,577 7,891,712 9,961,089

163
36 OTHER RESERVES (Continued)Group
Available-for-sale
Freehold investments/Investment Hotel Other land and non-tradingproperties properties properties buildings securities Convertible
revaluation revaluation revaluation revaluation revaluation bonds Hedging Othersreserve reserve reserve reserve reserve reserve reserve (note (a)) Total
HK$’000 HK$’000 HK$’000 HK$’000 HK$’000 HK$’000 HK$’000 HK$’000 HK$’000
At 31 December 2004 721,804 29,444 414,097 26,455 877,577 – – 7,891,712 9,961,089
Opening adjustment for the adoption ofHKAS 39 – – – – – – (11,244) – (11,244)
Opening adjustment for the adoption ofHKAS 40 (721,804) – – – – – – – (721,804)
At 1 January 2005 – 29,444 414,097 26,455 877,577 – (11,244) 7,891,712 9,228,041
On revaluation of properties (note (b)) – 59,300 34,398 15,043 – – – – 108,741
Arising from valuation of available-for-saleinvestments (note (c)) – – – – 207,337 – – – 207,337
Provision of share options expense – – – – – – – 28,627 28,627
Transfer from retained profits – – – – – – – 822 822
Exchange differences arising frominvestments in the PRC and overseassubsidiaries/associated companies – – – (1,641) – – – 17,682 16,041
Deferred taxation chargeddirectly to reserves – (25,711) (15,870) (4,871) – – – – (46,452)
Convertible bonds – equity component – – – – – 143,501 – – 143,501
Cash flow hedge – – – – – – 13,189 – 13,189
At 31 December 2005 – 63,033 432,625 34,986 1,084,914 143,501 1,945 7,938,843 9,699,847
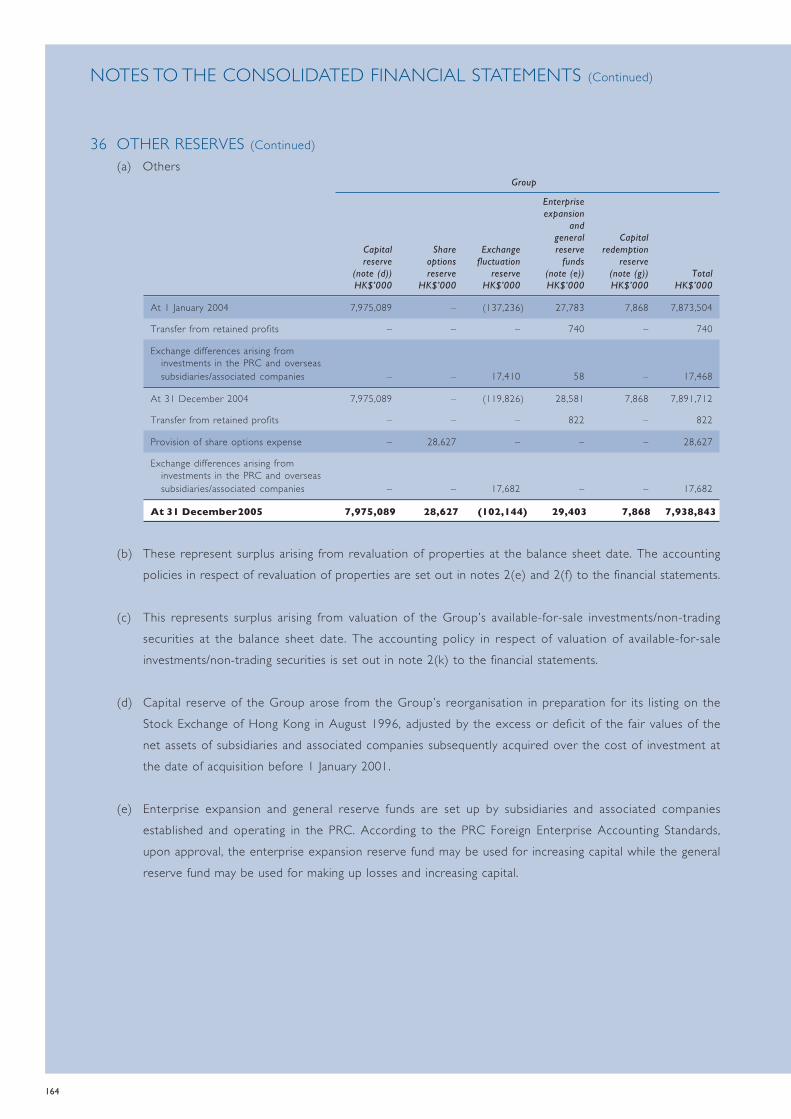
164
NOTES TO THE CONSOLIDATED FINANCIAL STATEMENTS (Continued)
36 OTHER RESERVES (Continued)(a) Others
Group
Enterpriseexpansion
andgeneral Capital
Capital Share Exchange reserve redemptionreserve options fluctuation funds reserve
(note (d)) reserve reserve (note (e)) (note (g)) TotalHK$’000 HK$’000 HK$’000 HK$’000 HK$’000 HK$’000
At 1 January 2004 7,975,089 – (137,236) 27,783 7,868 7,873,504
Transfer from retained profits – – – 740 – 740
Exchange differences arising frominvestments in the PRC and overseassubsidiaries/associated companies – – 17,410 58 – 17,468
At 31 December 2004 7,975,089 – (119,826) 28,581 7,868 7,891,712
Transfer from retained profits – – – 822 – 822
Provision of share options expense – 28,627 – – – 28,627
Exchange differences arising frominvestments in the PRC and overseassubsidiaries/associated companies – – 17,682 – – 17,682
At 31 December 2005 7,975,089 28,627 (102,144) 29,403 7,868 7,938,843
(b) These represent surplus arising from revaluation of properties at the balance sheet date. The accountingpolicies in respect of revaluation of properties are set out in notes 2(e) and 2(f) to the financial statements.
(c) This represents surplus arising from valuation of the Group’s available-for-sale investments/non-tradingsecurities at the balance sheet date. The accounting policy in respect of valuation of available-for-saleinvestments/non-trading securities is set out in note 2(k) to the financial statements.
(d) Capital reserve of the Group arose from the Group’s reorganisation in preparation for its listing on theStock Exchange of Hong Kong in August 1996, adjusted by the excess or deficit of the fair values of thenet assets of subsidiaries and associated companies subsequently acquired over the cost of investment atthe date of acquisition before 1 January 2001.
(e) Enterprise expansion and general reserve funds are set up by subsidiaries and associated companiesestablished and operating in the PRC. According to the PRC Foreign Enterprise Accounting Standards,upon approval, the enterprise expansion reserve fund may be used for increasing capital while the generalreserve fund may be used for making up losses and increasing capital.

165
36 OTHER RESERVES (Continued)(f) Other reserves
Company
CapitalConvertible Share redemption
Contributed bonds option reservessurplus reserve reserve (note (g)) Total
HK$’000 HK$’000 HK$’000 HK$’000 HK$’000
At 1 January 2004 and31 December 2004 17,793,308 – – 7,868 17,801,176
Convertible bonds – equity component – 143,501 – – 143,501
Provision of share option expense – – 28,627 – 28,627
At 31 December 2005 17,793,308 143,501 28,627 7,868 17,973,304
(i) The contributed surplus of the Company arose when the Company issued shares in exchange for theshares of companies being acquired, and represents the difference between the nominal value of theCompany’s shares issued and the value of net assets of the companies acquired. Under the CompaniesAct 1981 of Bermuda (as amended), the contributed surplus is distributable to the shareholders. AtGroup level, the contributed surplus is reclassified into its components of reserves of the underlyingsubsidiaries.
(ii) As at 31 December 2005, the reserves of the Company available for distribution amounted toapproximately HK$18,762,640,000 (2004: HK$18,784,646,000).
(g) The capital redemption reserve arose from the purchase of the Company’s shares for cancellation during1998 and 2002 and represents a transfer from the Company’s retained profits equivalent to the nominalvalue of the shares purchased for cancellation.

166
NOTES TO THE CONSOLIDATED FINANCIAL STATEMENTS (Continued)
37 NOTES TO THE CONSOLIDATED CASH FLOW STATEMENT(a) Reconciliation of profit before taxation to net cash generated from operations
Group2005 2004
HK$’000 HK$’000
Profit before taxation 3,756,278 2,288,115
Amortisation of goodwill – 3,608
Amortisation of negative goodwill – (4,578)
Depreciation and amortisation 146,494 105,628
Dividend income from listed and unlisted investments (13,936) (11,569)
Finance costs 201,679 145,119
Interest income (101,636) (34,123)
Loss on sale of property, plant and equipment 11,410 285
Gain on sale of investment properties (180,257) (910)
Loss on sale of an associated company – 9,208
Unrealised gain on valuation of listed securitiesat fair value through profit or loss/trading securities (1,657) (427)
Revaluation surplus on investment properties and other leasehold land and buildings (1,542,170) (298,601)
Share of results of associated companies (510,105) (555,503)
Operating profit before working capital changes 1,766,100 1,646,252
(Increase)/decrease in stock of completed properties held for sale, propertiesunder development for sale and accounts receivable, prepayments and deposits (407,924) 269,025
(Decrease)/increase in accounts payable, deposits received and accrued charges (645,644) 253,216
Net cash generated from operations 712,532 2,168,493
167
37 NOTES TO THE CONSOLIDATED CASH FLOW STATEMENT (Continued)(b) Purchase of subsidiaries
(i) PRC Property
On 24 October 2005, the Group acquired 51% of the share capital of Shanghai Ming Cheng RealEstate Development Co Ltd which holds a plot of land in Nanjing Xi Lu, Jingan District; on 15November 2005, the Group acquired 51% of the share capital of Shanghai Jin Ci Hou Properties CoLtd which holds two plots of land in Changde Lu and Nanjing Xi Lu, Jingan District and on 30December 2005, the Group acquired 50.5% of the share capital of Shanghai Ji Xiang Properties CoLtd, formerly a subsidiary of Shangri-La Asia Limited which holds a plot of land in Yanan Zhong Lu,Jingan District. The acquisitions enable the Group to develop the plots of land into a mixed-usedevelopment, consisting of a hotel, offices, retail podiums and serviced apartments, which will be alandmark in one of the prime business areas of Shanghai in association with Shangri-La Asia Limited.
(ii) Hong Kong Property
On 1 December 2005, the Group acquired the entire share capital of Fair Town Limited, a registeredowner of the property located at 26-30 Des Voeux Road West, Hong Kong. The property wasacquired for redevelopment purposes.
(iii) Logistics Network
On 28 April 2005, a 91% subsidiary of the Group acquired 100% of Marsvale Ltd (subsequentlyrenamed as Kerry Records Management Ltd), a documents storage company operating in the UnitedKingdom. The acquired business contributed revenues of HK$8,166,000 and net profit of HK$1,419,000to the Group for the period from the date of acquisition to 31 December 2005. If the acquisition hadoccurred on 1 January 2005, the revenues and profit before allocation attributable to the Groupwould have been HK$9,752,000 and HK$905,000, respectively.
On 13 August 2005, a 91% subsidiary of the Group acquired 63.5% of Orion Shipping & ForwardingLtd, a freight forwarding company operating in the United Kingdom. The acquired business contributedrevenues of HK$23,791,000 and net profit of HK$1,447,000 to the Group for the period from thedate of acquisition to 31 December 2005. If the acquisition had occurred on 1 January 2005, therevenues and profit before allocation attributable to the Group would have been HK$50,287,000 andHK$2,147,000, respectively.

168
NOTES TO THE CONSOLIDATED FINANCIAL STATEMENTS (Continued)
37 NOTES TO THE CONSOLIDATED CASH FLOW STATEMENT (Continued)(b) Purchase of subsidiaries (Continued)
(iv) Details of net assets acquired and goodwill are as follows:2005 2004
PRCProperty Others Total
HK$’000 HK$’000 HK$’000 HK$’000
Net assets acquired:
Property, plant and equipment/leaseholdland and land use rights 2 2,982 2,984 618,751
Property under development 740,578 122,454 863,032 498,021
Associated companies – – – 43,305
Other investments – – – 9,585
Accounts and other receivables 602,787 12,115 614,902 609,615
Cash and bank balances 24 18,991 19,015 298,178
Accounts and other payables (695,935) (13,892) (709,827) (571,439)
Tax recoverable – 385 385 –
Bank loans – – – (445,267)
Deferred taxation – 16 16 (16,499)
647,456 143,051 790,507 1,044,250
Less: minority interests (320,200) (8,002) (328,202) (452,776)
327,256 135,049 462,305 591,474
Goodwill 2,707 37,052 39,759 143,560
329,963 172,101 502,064 735,034
Settled by:
Cash 29,684 172,101 201,785 735,034
Accounts payable 300,279 – 300,279 –
329,963 172,101 502,064 735,034
(c) Analysis of the net cash outflow in respect of the purchase of subsidiaries2005 2004
HK$’000 HK$’000
Cash consideration 201,785 735,034
Cash and bank balances acquired (19,015) (298,178)
Net cash outflow in respect of the purchase of subsidiaries 182,770 436,856
169
38 RELATED PARTY TRANSACTIONSThe following transactions were carried out with related parties:
(a) Purchases of services2005 2004
HK$’000 HK$’000
Marketing, consultancy and administrative management fees expense (note) 18,423 16,733
Note: This represents payment of services fee to Shangri-La International Hotel Management Limited, a subsidiary of Shangri-La AsiaLimited (“SA”), a related Company of the Group, which provided marketing, consultancy and administrative managementservices to a member of the Group. The service fees payable during the year were determined at either a fixed amount or acertain percentage of the gross operating revenue of the relevant company in accordance with the agreement for theprovision of the above services.
(b) Key management compensation2005 2004
HK$’000 HK$’000
Salaries and other short-term benefits 49,264 36,459
Share-based payments 15,716 –
Post-employment benefits 240 240
65,220 36,699
(c) Year-end balances2005 2004
HK$’000 HK$’000
Receivables from related parties:
Associated companies (note 18) 5,012,888 3,350,349
Payables to related parties:
Subsidiaries of SA
– included under accounts payable, deposits received and accrued charges (note 28) 323,294 –
– included under amounts due to minority shareholders (note 31) 393,883 439,282
Associated companies (note 18) 50,134 35,612
(d) Guarantees for banking and other facilities of certain associated companiesThe Group has executed guarantees for banking and other facilities granted to certain associated companies.The utilised amount of such facilities covered by the Group’s guarantees which also represented thefinancial exposure of the Group as at 31 December 2005 amounted to approximately HK$102,473,000(2004: HK$52,909,000). The total amount of such facilities covered by the Group’s guarantees amountedto approximately HK$112,573,000 (2004: HK$235,463,000). The above-mentioned amounts are also reflectedin the guarantees given by the Group for banking and other facilities disclosed in note 40(a).
170
NOTES TO THE CONSOLIDATED FINANCIAL STATEMENTS (Continued)
38 RELATED PARTY TRANSACTIONS (Continued)(e) Other related party transactions
On 9 October 2005, the Company and SA, together with various other parties, entered into a jointventure contract for the establishment of a joint venture company to undertake a property developmentproject in Pudong, Shanghai, PRC. On 30 November 2005, the Company and SA, together with variousother parties, entered into a funding agreement in relation to the above-mentioned development. Detailsare set out in item (II) in the section headed “Connected Transactions” in the Report of the Directors.
As disclosed in last year’s annual report, the Company and SA entered into a master agreement on 13April 2004 relating to the joint acquisition, ownership and development of five sites in Jingan District,Shanghai, PRC. On 30 December 2005, as part of the transactions under the above-mentioned agreement,the Group acquired from a wholly owned subsidiary of SA a 50.5% interest in Shanghai Ji Xiang PropertiesCo. Ltd. at a consideration of US$38,729,000 (approximately HK$300,279,000).
39 COMMITMENTS(a) At 31 December 2005, the Group had capital commitments in respect of properties under development
and property, plant and equipment not provided for in these accounts as follows:
Group2005 2004
HK$’000 HK$’000
Contracted but not provided for 4,586,977 2,113,807
Authorised but not contracted for 137,667 286,114
4,724,644 2,399,921
(b) At 31 December 2005, the Group had future aggregate minimum lease payments under non-cancellableoperating leases as follows:
Group2005 2004
HK$’000 HK$’000
Land and buildings:
Within one year 61,844 66,031
In the second to fifth year, inclusive 101,437 119,873
Over five years 88,836 108,688
252,117 294,592
Vessels:
Within one year 46,338 63,248
In the second to fifth year, inclusive 110,340 89,152
156,678 152,400
408,795 446,992
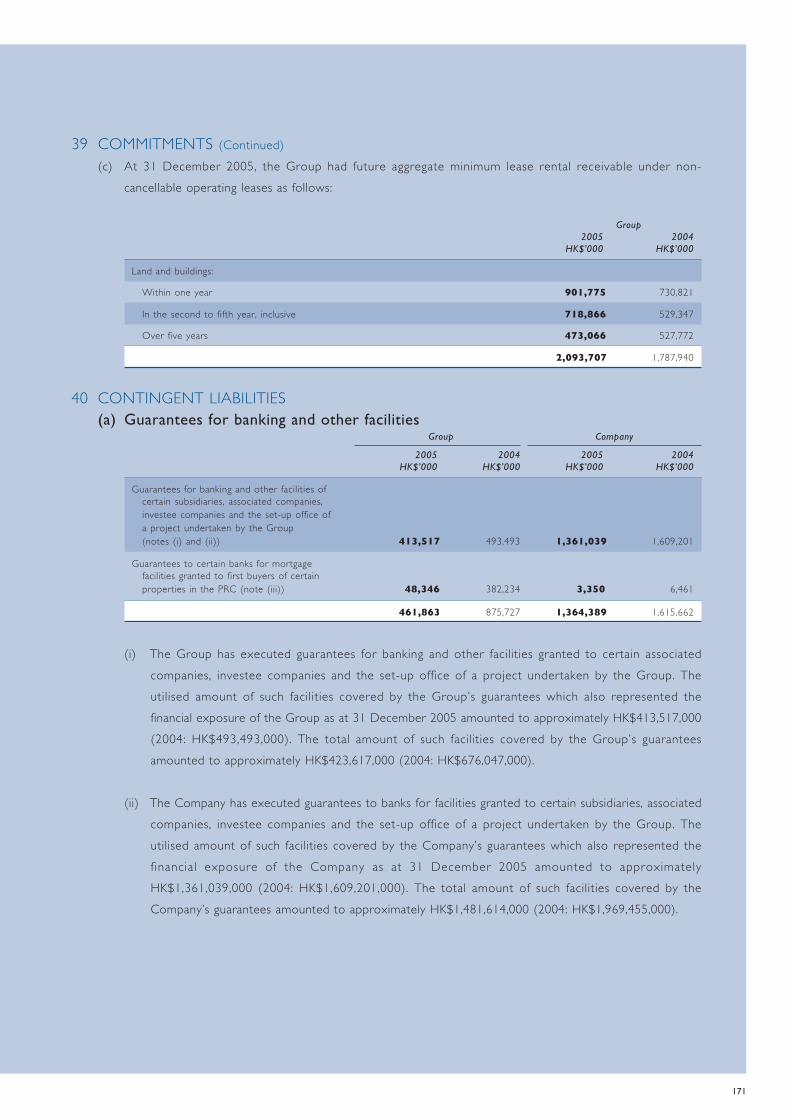
171
39 COMMITMENTS (Continued)(c) At 31 December 2005, the Group had future aggregate minimum lease rental receivable under non-
cancellable operating leases as follows:
Group2005 2004
HK$’000 HK$’000
Land and buildings:
Within one year 901,775 730,821
In the second to fifth year, inclusive 718,866 529,347
Over five years 473,066 527,772
2,093,707 1,787,940
40 CONTINGENT LIABILITIES(a) Guarantees for banking and other facilities
Group Company
2005 2004 2005 2004HK$’000 HK$’000 HK$’000 HK$’000
Guarantees for banking and other facilities ofcertain subsidiaries, associated companies,investee companies and the set-up office ofa project undertaken by the Group(notes (i) and (ii)) 413,517 493,493 1,361,039 1,609,201
Guarantees to certain banks for mortgagefacilities granted to first buyers of certainproperties in the PRC (note (iii)) 48,346 382,234 3,350 6,461
461,863 875,727 1,364,389 1,615,662
(i) The Group has executed guarantees for banking and other facilities granted to certain associatedcompanies, investee companies and the set-up office of a project undertaken by the Group. Theutilised amount of such facilities covered by the Group’s guarantees which also represented thefinancial exposure of the Group as at 31 December 2005 amounted to approximately HK$413,517,000(2004: HK$493,493,000). The total amount of such facilities covered by the Group’s guaranteesamounted to approximately HK$423,617,000 (2004: HK$676,047,000).
(ii) The Company has executed guarantees to banks for facilities granted to certain subsidiaries, associatedcompanies, investee companies and the set-up office of a project undertaken by the Group. Theutilised amount of such facilities covered by the Company’s guarantees which also represented thefinancial exposure of the Company as at 31 December 2005 amounted to approximatelyHK$1,361,039,000 (2004: HK$1,609,201,000). The total amount of such facilities covered by theCompany’s guarantees amounted to approximately HK$1,481,614,000 (2004: HK$1,969,455,000).

172
NOTES TO THE CONSOLIDATED FINANCIAL STATEMENTS (Continued)
40 CONTINGENT LIABILITIES (Continued)(a) Guarantees for banking and other facilities (Continued)
(iii) The Group and the Company have executed guarantees to certain banks for mortgage facilitiesgranted to first buyers of certain properties developed by the Group in the PRC. The utilised amountof such facilities covered by the Group’s and the Company’s guarantees which also represented thefinancial exposure of the Group and the Company as at 31 December 2005 amounted to approximatelyHK$48,346,000 (2004: HK$382,234,000) and HK$3,350,000 (2004: HK$6,461,000), respectively. Thetotal amount of such facilities covered by the Group’s and the Company’s guarantees amounted toapproximately HK$148,922,000 (2004: HK$903,110,000) and HK$3,350,000 (2004: HK$6,461,000),respectively.
(b) Other guarantees and undertakings(i) A wholly owned subsidiary of the Company, through its associated company, has a 20% interest in a
company which is engaged in the development of a site in the Olympic Mass Transit Railway StationDevelopment. Another wholly owned subsidiary of the Company, through its associated company, hasa 32.5% interest in another company which is engaged in the development of an adjacent site. Thecompanies developing the sites (the “Developers”) were each granted exclusive rights to develop therelevant sites pursuant to separate development agreements (the “Development Agreements”) enteredinto by each of the Developers and MTR Corporation Limited (“MTRC”).
Pursuant to two deeds of guarantee in relation to each of the above developments, the Company hasprovided several guarantees in favour of the MTRC for the due and punctual performance andobservance by each of the Developers of 20% and 32.5%, respectively, of the Developer’s obligations,liabilities, stipulations, acts and duties under or in connection with the respective DevelopmentAgreements and the due and punctual payment of 20% and 32.5%, respectively, of all monies andliabilities due, owing or payable to the MTRC from or by each of the Developers under or inconnection with the respective Development Agreements.
In consideration of the MTRC entering into and agreeing to the terms of the sale and purchaseagreement (the “S & P Agreement”) and certain trust arrangements (the “Trust Arrangements”) inrelation to the sale of an office development developed by the Developer in which the Group has a20% interest, the Company has agreed to provide several guarantees and indemnities to indemnifyMTRC against 20% of all claims, demands, cost, damages, losses, expenses and/or liabilities whichMTRC may incur or suffer and which are in any way connected with or resulting from the enteringinto and/or the observance and/or performance of the S & P Agreement and/or the carrying out byMTRC of the Trust Arrangements. The Company has also guaranteed the payment on demand of 20%of the full amount of such costs, losses, expenses or liabilities.

173
40 CONTINGENT LIABILITIES (Continued)(b) Other guarantees and undertakings (Continued)
(ii) The Group has a 15% effective interest in Western Harbour Tunnel Company Limited (“WHTCL”)which acquired a 30-year franchise from the Government of the Hong Kong Special AdministrativeRegion (the “Government”) to build and operate the Western Harbour Crossing (the “Crossing”).Pursuant to a deed of guarantee dated 2 September 1993 as amended by a deed of novation dated27 June 1995, a second deed of novation dated 12 October 1998 and a third deed of novation dated30 May 2000 (the “Guarantee”), the Company together with the other beneficial shareholders ofWHTCL have jointly and severally undertaken to the Government that if the aggregate of all costsincurred by WHTCL up to the operating date of the Crossing and all maintenance and repair costsincurred by WHTCL after the operating date of the Crossing but before the issuance of the maintenancecertificate exceeds HK$7,534,000,000 then they will pay to WHTCL such excess amount.
Pursuant to a shareholders agreement dated 30 December 1992 as amended by a cross-indemnitydeed dated 20 December 1993, a supplemental deed dated 8 September 1994, a second supplementaldeed dated 12 October 1998 and a third supplemental deed dated 23 May 2000 in respect ofWHTCL, the Company together with the other beneficial shareholders have agreed that in relation toany claim made or asserted under the Guarantee, as between themselves, the total of all liabilities inrespect of such claim and of all costs, charges and expenses suffered or incurred by any of themresulting therefrom or attributable thereto shall be shared by them in proportion to their respectiveultimate ownership of the issued capital of WHTCL.
(iii) A wholly owned subsidiary of the Company, through its associated company, has a 40% interest in acompany which is engaged in the development of a site at the Hang Hau Mass Transit Railway StationDevelopment (the “Hang Hau Developer”). The Hang Hau Developer was granted exclusive rights todevelop the site pursuant to a development agreement (the “Hang Hau Development Agreement”)entered into by the Hang Hau Developer with, amongst others, MTRC.
Pursuant to a deed of guarantee in relation to the above development, the Company has providedseveral guarantees in favour of MTRC for the due and punctual performance and observance by theHang Hau Developer of 40% of its obligations, liabilities, stipulations, acts and duties under or inconnection with the Hang Hau Development Agreement and the due and punctual payment of 40%of all monies and liabilities due, owing or payable to MTRC from the Hang Hau Developer under or inconnection with the Hang Hau Development Agreement.
174
NOTES TO THE CONSOLIDATED FINANCIAL STATEMENTS (Continued)
40 CONTINGENT LIABILITIES (Continued)(b) Other guarantees and undertakings (Continued)
(iv) The Group has 38.2% interest in a company (the “Seller”) which, pursuant to a sale and purchaseagreement (the “Mortgage S&P Agreement”), has sold certain loans (the “Loans”) to The Hong KongMortgage Corporation Limited (the “HKMC”). Pursuant to a support agreement (the “SupportAgreement”) entered into by the Company with, amongst others, the HKMC, the Company hasseverally undertaken that (i) if the Seller fails to repurchase any Loans in accordance with theMortgage S&P Agreement, to, or to procure a third party approved by the HKMC to, completerepurchase of such Loans; and (ii) if the Seller fails to pay when due any amount in full in respect ofthe Loans required to be paid by it to the HKMC, to pay on behalf of the Seller on a several basis anamount equal to 38.2% of the amount that the Seller has failed to pay to the HKMC.
The Company has also severally undertaken with the HKMC that it shall indemnify and keep indemnifiedthe HKMC, its directors, officers and employees and its successors and assignees from and against38.2% of all liabilities, losses, damages, actions, proceedings, demands, claims, costs and expenseswhich may be brought against, suffered or incurred by such indemnified person by reason of anybreach of the Seller’s undertakings, representations and warranties in the Mortgage S&P Agreementand the Support Agreement or of any breach of the Company’s representations, warranties andundertakings in the Support Agreement.
(v) The Group has a 50% interest in a company (“Party 1”) which owns a piece of land in Cheung ShaWan while another company (“Party 2”) owns an adjacent piece of land. Party 1 and Party 2 arenegotiating the joint redevelopment of the two pieces of land. Prior to the joint redevelopment, theparties need to surrender the existing two pieces of land to the Government in exchange for thegrant of a new lot for commercial/residential development with public car park facilities (the “ProposedLand Exchange”). The Proposed Land Exchange involves the grant of a street and its associatedfootpaths as part of the new lot and requires the permanent closure of the abovementioned streetand its associated footpaths.
Pursuant to an undertaking (the “Undertaking”) dated 24 May 2002, in consideration of the Governmententering into and continuing the negotiations with Party 1 and Party 2 on the Proposed LandExchange, the Company and other parties, including the holding companies of the shareholders ofParty 1 and Party 2, have jointly and severally undertaken, covenanted and agreed that they shallindemnify and keep indemnified the Government and any of its officers from and against all and anyactions (including judicial reviews), liabilities, demands, claims, expenses, costs and losses arising directlyor indirectly out of or in connection with the gazetting of the permanent closure of the abovementionedstreet and its associated footpaths under the Roads (Works, Use and Compensation) Ordinance andthe authorisation of such closure.
Pursuant to a deed of cross indemnity and a collateral deed of cross indemnity, both dated 24 May2002, the Group’s liabilities under the Undertaking shall be several and shall be determined based onits share of interest in the joint redevelopment.

175
40 CONTINGENT LIABILITIES (Continued)(b) Other guarantees and undertakings (Continued)
(vi) A wholly owned subsidiary of the Company, Wealthy State Investments Limited (“Wealthy State”),has been granted the right to jointly develop a site in Sai Ying Pun, Hong Kong pursuant to adevelopment agreement (the “SYP Development Agreement”) entered into between Wealthy Stateand Urban Renewal Authority (“URA”).
Pursuant to a guarantee in relation to the above development, the Company has provided guaranteesin favour of URA for the due and punctual performance and fulfilment of all Wealth State’s obligationsunder the SYP Development Agreement or arising out of or in connection with the SYP DevelopmentAgreement (including Wealth State’s obligations to make payments under the terms of the SYPDevelopment Agreement).
(c) LitigationKerry EAS Logistics Limited (“KEAS”), formerly known as EAS International Transportation Limited, isinvolved in a legal case in which an airline operator, together with five other plaintiffs, including the insurersof the aircraft, are claiming for damages, costs and interest, against six defendants, including KEAS, on ajoint and several basis in relation to the alleged damages amounting to approximately US$65.6 million(equivalent to approximately HK$511.7 million, based on the exchange rate of US$1 = HK$7.8) caused toan aircraft in 2000 in respect of the transportation of certain chemical substance.
The damages sought by the plaintiffs of approximately US$65.6 million represent the market value of theaircraft at the time when the damage occurred less the resale value of the aircraft after repairs. Accordingto the pleadings and the affidavits of the five other plaintiffs, the actual compensation made by them to theairline operator amounted to 15% of the total loss. The remaining 85% of the total loss was compensatedby other reinsurers. These reinsurers have not brought any legal action against the six defendants as at thedate of this report. Under the PRC laws, the maximum liability of the six defendants under the currentlegal case is only 15% of the total loss.
Based on the opinion of the legal advisers of the Group, it is unlikely that KEAS will be found liable for theclaimed damages and losses. Accordingly, no provision has been made in the financial statements.
Pursuant to the sale and purchase agreement, the vendor of KEAS has undertaken to indemnify the Groupin full in respect of all losses, costs, expenses and other responsibilities and liabilities arising in respect ofvarious litigations against KEAS including the abovementioned legal case.

176
NOTES TO THE CONSOLIDATED FINANCIAL STATEMENTS (Continued)
41 PLEDGE OF ASSETS – GROUPAt 31 December 2005, the Group’s total bank loans of HK$9,334,386,000 (2004: HK$6,156,810,000) includedan aggregate amount of HK$9,086,981,000 (2004: HK$5,747,132,000) which is unsecured and an aggregateamount of HK$247,405,000 (2004: HK$409,678,000) which is secured. The securities provided for the securedbanking facilities available to the Group are as follows:
(i) legal charges over certain properties and port facilities (notes 13 to 16);
(ii) charges on all assets, including bank balances amounting to HK$32,514,000 (2004: HK$73,636,000), ofcertain subsidiaries; and
(iii) assignments of insurance proceeds of certain properties.
42 ULTIMATE HOLDING COMPANYThe directors regard Kerry Group Limited, a company incorporated in the Cook Islands, as being the ultimateholding company.

177
43. GROUP STRUCTURE – SUBSIDIARIESAs at 31 December 2005, the Company held interests in the following subsidiaries which are categorizedaccording to the business divisions of the Group, namely, Property Division, Infrastructure Division, LogisticsNetwork Division and Other Divisions as listed below:
Place of Principal activities (and place of Particulars of Indirect interestincorporation/ operation if different from place of issued capital/ held unless
Name establishment incorporation/establishment) registered capital denoted with ∆
Under Property Division
Aberporth Resources Limited BVI Investment holding US$1 100%Able Time Group Limited BVI Investment holding US$1 100%
* Amble Aim Sdn. Bhd. MAL Investment holding RM2 100%Ansellman Limited BVI Investment holding US$1 100%Auto Plaza Limited HK Investment holding, Ordinary HK$4,998 100%
property investment and Non-voting deferredcarpark operation HK$2
Baron Development Limited BVI Investment holding US$1 100%Barriedale Limited BVI Investment holding US$10,000 100%
λ ^* Beihai Kerry Property Development Ltd. PRC Property development RMB5,931,363 100%µ ^ Beijing Jia Ao Real Estate Development Co., Ltd. PRC Property investment US$77,967,600 71.25%µ ^ Beijing Kerry Centre Hotel Co., Ltd. PRC Hotel ownership and operation US$33,000,000 71.25%
Bethan Company Limited HK Dormant HK$2 100%Big Sky Resources Limited BVI Investment holding US$100 100%Burgo Inc BVI Dormant US$1,000 100%Calistock Limited BVI Investment holding in Hong Kong US$1 100%Cashel Assets Limited BVI Investment holding in Hong Kong US$1 100%Clavering Services Limited BVI Investment holding US$1,000 100%Comphor Company Limited BVI Investment holding US$10 100%Darcey Investments Limited BVI Investment holding US$100 100%Denver Rose Investments Limited BVI Investment holding in Hong Kong US$1 100%Dragon Wisdom Limited BVI Dormant US$1 100%Errol Company Ltd. BVI Investment holding US$1 100%Even Wise Limited HK Dormant HK$1 100%Fair Page Limited HK Property investment HK$2 100%Fair Town Limited HK Property investment HK$1 100%Garden Streams Limited BVI Investment holding US$1 100%Giant Noble Investments Limited BVI Investment holding US$1 100%Goldash Holdings Limited BVI Investment holding US$1 100%Golden Concord Properties Limited HK Property investment HK$1 100%Golden Explorer Group Limited BVI Investment holding US$1 100%Grandgain Holdings Limited BVI Investment holding US$10,000 100%Harvard Developments Limited BVI Dormant US$12 75%Hong Kong Shanghai Development Co Ltd. SMA Investment holding HK$8,000,000 65%Interseed Company Limited HK Property trading HK$2 100%Irrewarra Holdings Limited BVI Investment holding US$1 100%Julian Holdings Limited BVI Investment holding US$1 100%Kanya Corp. BVI Investment holding US$1,000 100%Kerry Beijing (Guang Hua) Ltd SMA Investment holding HK$1,000,000 75%Kerry Beijing (Shibalidian) Commercial Ltd. SMA Dormant HK$1 100%Kerry Beijing (Shibalidian) Development Ltd. SMA Investment holding HK$1 100%Kerry Beijing (Shibalidian) Exhibition Centre Ltd. SMA Dormant HK$1 100%Kerry Beijing (Shibalidian) Housing Ltd. SMA Investment holding US$1 100%Kerry Beijing (Shibalidian) Recreation Club Ltd. SMA Dormant HK$1 100%
λ ^ Kerry Cao Jia Yan Properties (Shanghai) Co., Ltd. PRC Property development US$13,400,000 100%λ ^* Kerry Centre Real Estate (Shenzhen) Co. Ltd. PRC Property investment HK$142,000,000 100%
Kerry Development (China) Limited HK Provision of management services HK$1 100%* Kerry Development (Manzhouli) Co., Ltd. PRC Property development US$1,950,000 100%

178
NOTES TO THE CONSOLIDATED FINANCIAL STATEMENTS (Continued)
43. GROUP STRUCTURE – SUBSIDIARIES (Continued)
Place of Principal activities (and place of Particulars of Indirect interestincorporation/ operation if different from place of issued capital/ held unless
Name establishment incorporation/establishment) registered capital denoted with ∆
Under Property Division (Continued)
λ ^ Kerry Development (Shanghai) Co., Ltd. PRC Property development US$40,000,000 100%λ ^* Kerry Development (Shenzhen) Co., Ltd. PRC Property development HK$233,350,000 100%
Kerry Fuzhou (Gutian) Ltd. SMA Investment holding HK$6,000,000 100%Kerry Guangxi (Beihai) Ltd SMA Investment holding HK$1,500,000 100%Kerry Properties (Australia) Limited BVI Investment holding HK$1 100%Kerry Properties (China) Limited BVI Investment holding HK$4,554,642,958 100% ∆
Kerry Properties (Chongqing) Ltd. SMA Investment holding HK$1 100%Kerry Properties (H.K.) Limited HK Investment holding Ordinary HK$1,000 100%
Non-voting deferredHK$200,000,000
Kerry Properties (Hangzhou) Ltd. SMA Investment holding HK$85,000,000 100%(formerly known as Kerry Shanghai(Zhu Yuan) Ltd.)
Kerry Properties (Hohhot) Ltd. SMA Dormant HK$1 100%Kerry Properties (Hong Kong) Limited BVI Investment holding HK$413,179 100% ∆
Kerry Properties (Macau) Limited Macau Construction and property development MOP1,000,000 71%(formerly known as Centro deConvenções e Exposições Macau, Limitada)
Kerry Properties (Manzhouli) Ltd. SMA Investment holding HK$1 100%Kerry Properties (Ningbo) Ltd. SMA Dormant HK$1 100%Kerry Properties (Philippines) Limited BVI Investment holding US$1 100%Kerry Properties (Shenzhen Central District) Ltd. SMA Dormant HK$1 100%
λ ^* Kerry Properties (Shenzhen) Co., Ltd. PRC Property development HK$112,082,975 100%Kerry Properties (Sydney) Pty Ltd Australia Investment holding A$1 100%Kerry Properties (Tianjin) Ltd. SMA Dormant HK$1 100%
(formerly known as Kerry Properties(Lujiazui) Ltd. and before that asKerry Electricity (Ningxia) Ltd.)
Kerry Properties (Yangzhou) Ltd. SMA Investment holding HK$1,000,000 100%(formerly known as Kerry Suzhou (Gucheng) Ltd.)
* Kerry Properties Beijing (Shibalidian) BVI Investment holding US$1 100%Holdings Company Limited
Kerry Properties Beijing Kerry Centre Ltd. SMA Dormant HK$1 100%Kerry Properties International Limited BVI Investment holding HK$1 100% ∆
Kerry Properties Shenzhen Kerry Centre Limited HK Investment holding HK$5,000,000 100%^* Kerry Real Estate (Hangzhou) Co. Ltd. PRC Property development US$62,000,000 100%^* Kerry Real Estate (Yangzhou) Co., Ltd. PRC Property development US$3,352,350 100%
Kerry Residences Limited HK Dormant HK$2 100%Kerry Shanghai (Cao Jia Yan) Ltd. SMA Investment holding US$2 100%Kerry Shanghai (Hongkou) Ltd. SMA Investment holding HK$6,000,000 60%Kerry Shanghai (Jingan Beili) Ltd SMA Investment holding HK$1,000,000 75%Kerry Shanghai Development Ltd SMA Investment holding HK$1,000,000 100%Kerry Shanghai Pudong Investments Ltd. SMA Dormant HK$1 100%
(formerly known as Kerry Properties(Shanghai Pudong Expo Centre) Ltd.)
Kildare Limited HK Property trading HK$2 100%Kingsfield Development Limited HK Dormant HK$1 100%Mable Road Company Limited HK Property investment Ordinary HK$10 100%
Non-voting deferred HK$10,000Madigan Company Limited HK Property trading HK$2 100%Magnifair Company Limited HK Property development HK$10,000 100%Maple Crest Development Limited BVI Investment holding and US$120 75%
property trading in Hong KongMarrakesh Limited BVI Investment holding US$1 100%Mazlo Holdings Limited BVI Investment holding US$1 100%Mega Box Retail Management Limited HK Dormant HK$2 100%MegaBox Development Company Limited HK Property development HK$2 100%
(formerly known as Princeton InvestmentCompany Limited)
Merlin Limited SMA Investment holding in the HK$1,000,000 100%People’s Republic of China
Mid-Levels Portfolio (Aigburth) Holdings Limited BVI Investment holding US$1 100%Mid-Levels Portfolio (Aigburth) Limited Cook Islands Property investment in Hong Kong US$9 100%Mid-Levels Portfolio (Branksome) Holdings Limited BVI Investment holding US$1 100%Mid-Levels Portfolio (Branksome) Limited HK Property investment HK$1,000 100%Mid-Levels Portfolio (Century Tower II) BVI Investment holding US$1 100%
Holdings Limited

179
43. GROUP STRUCTURE – SUBSIDIARIES (Continued)
Place of Principal activities (and place of Particulars of Indirect interestincorporation/ operation if different from place of issued capital/ held unless
Name establishment incorporation/establishment) registered capital denoted with ∆
Under Property Division (Continued)
Mid-Levels Portfolio (Gladdon) Holdings Limited BVI Investment holding US$1 100%Mid-Levels Portfolio (Gladdon) Limited HK Property investment HK$1,000 100%Mid-Levels Portfolio (May Tower I) BVI Investment holding US$1 100%
Holdings LimitedMid-Levels Portfolio (May Tower I) Limited HK Dormant HK$100 100%Mid-Levels Portfolio (Tavistock) Holdings Limited BVI Investment holding US$1 100%Mid-Levels Portfolio (Tavistock) Limited HK Property investment HK$1,000 100%Mid-Levels Portfolio (Tregunter Towers 1 & 2) BVI Investment holding US$100 100%
Holdings LimitedMid-Levels Portfolio (Tregunter Towers 1 & 2) BVI Property investment in Hong Kong US$1 100%
LimitedMid-Levels Portfolio (Valverde) Holdings Limited BVI Investment holding US$1 100%Mid-Levels Portfolio (Valverde) Limited HK Property investment and trading HK$1,000 100%Mid-Levels Portfolio Holdings Limited BVI Investment holding US$1 100%Nite Lites Limited BVI Investment holding HK$10,000 100%NMC 6 Limited BVI Property investment in Hong Kong Ordinary US$1 100%NMC 7 Limited BVI Property investment in Hong Kong Ordinary US$1 100%NMC 8 Limited BVI Property investment in Hong Kong Ordinary US$1 100%NMC 9 Limited BVI Property investment in Hong Kong Ordinary US$1 100%Norbiton Group Limited BVI Investment holding HK$10,000 100%Norminster Limited HK Investment holding HK$1,000 100%Ocean City Investments Limited BVI Investment holding US$1 75%Olsen Holdings Limited BVI Investment holding US$1 100%Pembrooke Development Investments Limited BVI Investment holding in Hong Kong HK$10,000 100%Pettico Limited HK Provision of finance services HK$20 100%Pirton Resources Limited BVI Investment holding US$1 100%Port Destiny Limited HK Dormant HK$2 100%Prismatic Limited HK Property development and trading HK$20 100%Purview Assets Limited BVI Investment holding US$1 100%Rayhay Company Limited HK Provision of finance services HK$2 100%
λ ^* Risenland Development (Fuzhou) Co., Ltd. PRC Property development HK$44,000,000 100%Rodder Holdings Limited BVI Investment holding in Hong Kong US$1 100%Roving Spirit Limited BVI Investment holding HK$10,000 100%Sageman Limited BVI Investment holding US$1 100%Scene View Limited BVI Investment holding US$1 100%Senworld Investment Limited HK Property investment HK$2 100%Shanghai Ji Xiang Properties Co., Ltd PRC Property development US$76,000,000 50.50%
^* Shanghai Jin Ci Hou Properties Company Limited PRC Property development US$77,500,000 51%µ ^ Shanghai Gang Hu Properties Co., Ltd. PRC Property investment and development US$155,300,000 64.35%µ ^ Shanghai Kerry Real Estate Development Co., Ltd. PRC Property investment US$12,000,000 55.20%^* Shanghai Ming Cheng Real Estate Development PRC Property development US$9,000,000 51%
Co., Ltd.µ ^ Shanghai Xin Ci Hou Properties Co., Ltd. PRC Property investment US$60,000,000 74.25%
Smart State Holdings Limited BVI Investment holding US$1 100%Spring Capital Holdings Limited BVI Dormant US$1 100%Taskan Limited HK Property development HK$2 100%Tellson International Limited BVI Investment holding US$1 100%Templepatrick Limited HK Provision of finance service HK$100 100%Travel Aim Investment B.V. Netherlands Investment holding EUR18,151 100%Trebanos Investment Company Limited HK Dormant HK$2 100%Ubagan Limited HK Dormant HK$10,000 100%Viola Developments Limited BVI Investment holding US$1 100%Washers Limited BVI Investment holding HK$10,000 100%Wealthy State Investments Limited HK Property development HK$1 100%Wing Tak Cheung Limited HK Property development HK$10,000 100%Wirabay Limited BVI Provision of trustee services US$1 100%Wiseside Investment Company Limited HK Property investment HK$2 75%Woody Company Limited HK Property investment HK$2 100%Wymer Limited BVI Investment holding US$5,000 100%Ying He Company Limited HK Investment holding Ordinary HK$10 100%
Non-voting deferredHK$21,000,000
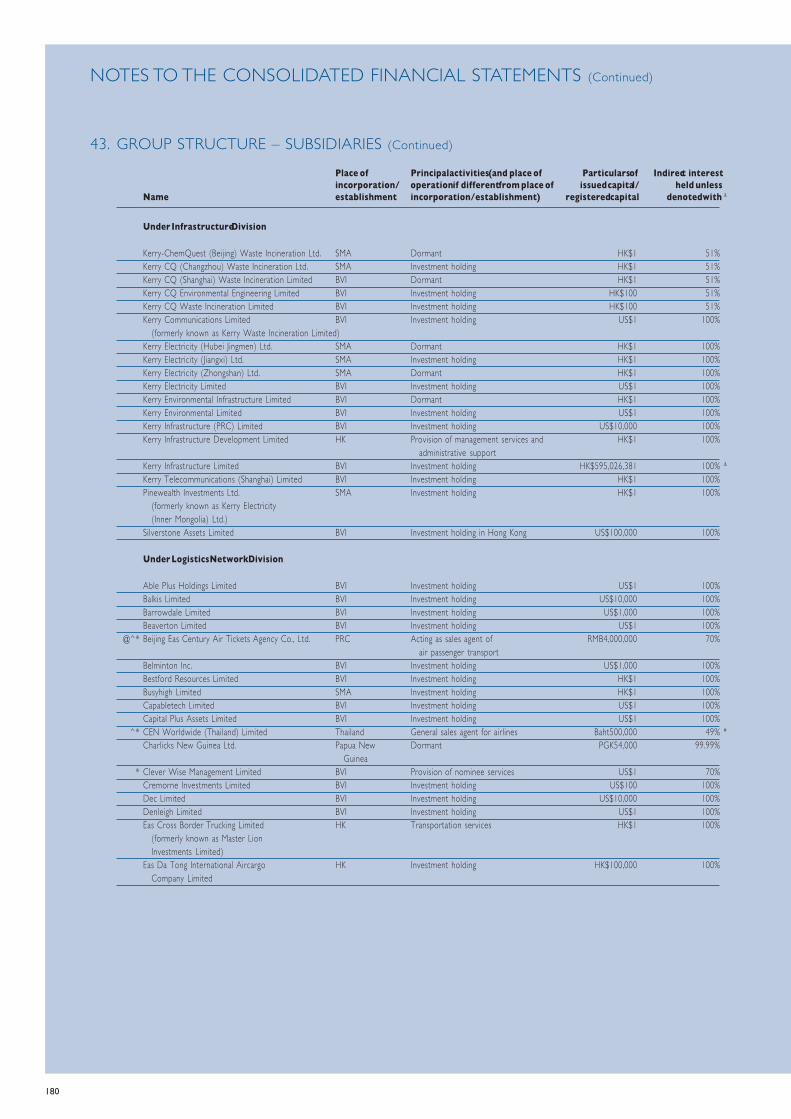
180
NOTES TO THE CONSOLIDATED FINANCIAL STATEMENTS (Continued)
43. GROUP STRUCTURE – SUBSIDIARIES (Continued)
Place of Principal activities (and place of Particulars of Indirect interestincorporation/ operation if different from place of issued capital/ held unless
Name establishment incorporation/establishment) registered capital denoted with ∆
Under Infrastructure Division
Kerry-ChemQuest (Beijing) Waste Incineration Ltd. SMA Dormant HK$1 51%Kerry CQ (Changzhou) Waste Incineration Ltd. SMA Investment holding HK$1 51%Kerry CQ (Shanghai) Waste Incineration Limited BVI Dormant HK$1 51%Kerry CQ Environmental Engineering Limited BVI Investment holding HK$100 51%Kerry CQ Waste Incineration Limited BVI Investment holding HK$100 51%Kerry Communications Limited BVI Investment holding US$1 100%
(formerly known as Kerry Waste Incineration Limited)Kerry Electricity (Hubei Jingmen) Ltd. SMA Dormant HK$1 100%Kerry Electricity (Jiangxi) Ltd. SMA Investment holding HK$1 100%Kerry Electricity (Zhongshan) Ltd. SMA Dormant HK$1 100%Kerry Electricity Limited BVI Investment holding US$1 100%Kerry Environmental Infrastructure Limited BVI Dormant HK$1 100%Kerry Environmental Limited BVI Investment holding US$1 100%Kerry Infrastructure (PRC) Limited BVI Investment holding US$10,000 100%Kerry Infrastructure Development Limited HK Provision of management services and HK$1 100%
administrative supportKerry Infrastructure Limited BVI Investment holding HK$595,026,381 100% ∆
Kerry Telecommunications (Shanghai) Limited BVI Investment holding HK$1 100%Pinewealth Investments Ltd. SMA Investment holding HK$1 100%
(formerly known as Kerry Electricity(Inner Mongolia) Ltd.)
Silverstone Assets Limited BVI Investment holding in Hong Kong US$100,000 100%
Under Logistics Network Division
Able Plus Holdings Limited BVI Investment holding US$1 100%Balkis Limited BVI Investment holding US$10,000 100%Barrowdale Limited BVI Investment holding US$1,000 100%Beaverton Limited BVI Investment holding US$1 100%
@^* Beijing Eas Century Air Tickets Agency Co., Ltd. PRC Acting as sales agent of RMB4,000,000 70%air passenger transport
Belminton Inc. BVI Investment holding US$1,000 100%Bestford Resources Limited BVI Investment holding HK$1 100%Busyhigh Limited SMA Investment holding HK$1 100%Capabletech Limited BVI Investment holding US$1 100%Capital Plus Assets Limited BVI Investment holding US$1 100%
^* CEN Worldwide (Thailand) Limited Thailand General sales agent for airlines Baht500,000 49% #
Charlicks New Guinea Ltd. Papua New Dormant PGK54,000 99.99%Guinea
* Clever Wise Management Limited BVI Provision of nominee services US$1 70%Cremorne Investments Limited BVI Investment holding US$100 100%Dec Limited BVI Investment holding US$10,000 100%Denleigh Limited BVI Investment holding US$1 100%Eas Cross Border Trucking Limited HK Transportation services HK$1 100%
(formerly known as Master LionInvestments Limited)
Eas Da Tong International Aircargo HK Investment holding HK$100,000 100%Company Limited
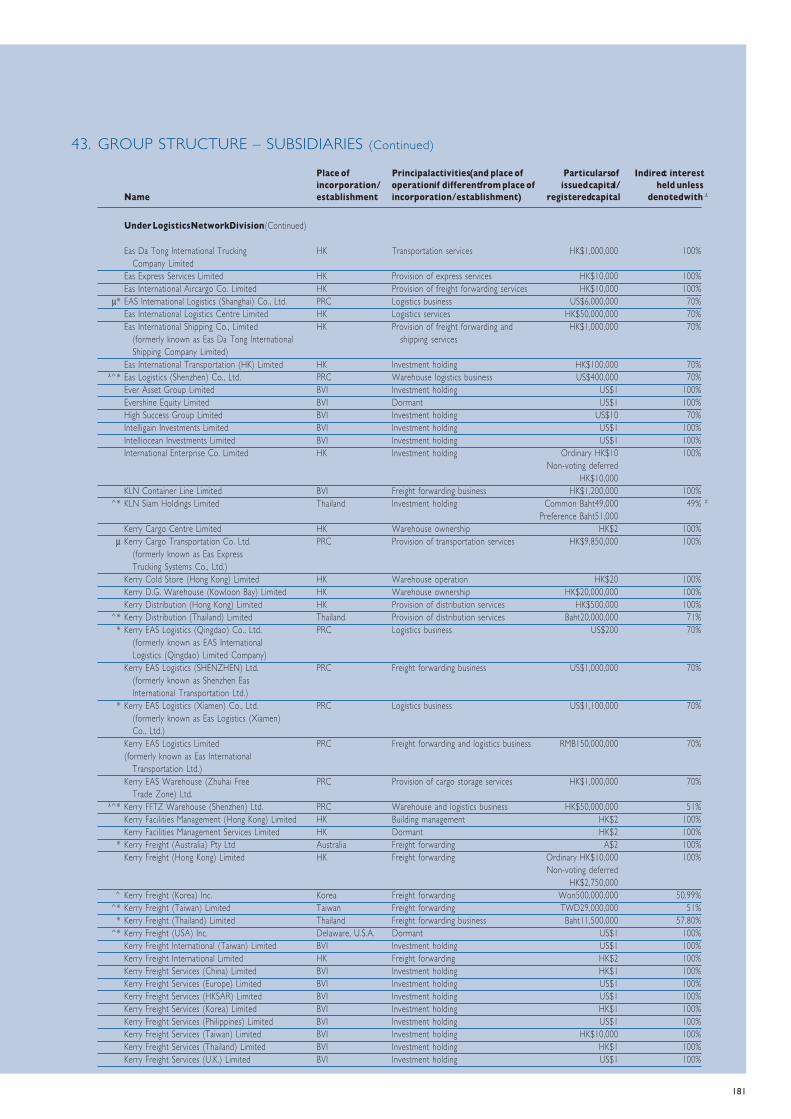
181
43. GROUP STRUCTURE – SUBSIDIARIES (Continued)
Place of Principal activities (and place of Particulars of Indirect interestincorporation/ operation if different from place of issued capital/ held unless
Name establishment incorporation/establishment) registered capital denoted with ∆
Under Logistics Network Division (Continued)
Eas Da Tong International Trucking HK Transportation services HK$1,000,000 100%Company Limited
Eas Express Services Limited HK Provision of express services HK$10,000 100%Eas International Aircargo Co. Limited HK Provision of freight forwarding services HK$10,000 100%
µ * EAS International Logistics (Shanghai) Co., Ltd. PRC Logistics business US$6,000,000 70%Eas International Logistics Centre Limited HK Logistics services HK$50,000,000 70%Eas International Shipping Co., Limited HK Provision of freight forwarding and HK$1,000,000 70%
(formerly known as Eas Da Tong International shipping servicesShipping Company Limited)
Eas International Transportation (HK) Limited HK Investment holding HK$100,000 70%λ ^* Eas Logistics (Shenzhen) Co., Ltd. PRC Warehouse logistics business US$400,000 70%
Ever Asset Group Limited BVI Investment holding US$1 100%Evershine Equity Limited BVI Dormant US$1 100%High Success Group Limited BVI Investment holding US$10 70%Intelligain Investments Limited BVI Investment holding US$1 100%Intelliocean Investments Limited BVI Investment holding US$1 100%International Enterprise Co. Limited HK Investment holding Ordinary HK$10 100%
Non-voting deferredHK$10,000
KLN Container Line Limited BVI Freight forwarding business HK$1,200,000 100%^* KLN Siam Holdings Limited Thailand Investment holding Common Baht49,000 49% #
Preference Baht51,000Kerry Cargo Centre Limited HK Warehouse ownership HK$2 100%
µ Kerry Cargo Transportation Co. Ltd. PRC Provision of transportation services HK$9,850,000 100%(formerly known as Eas ExpressTrucking Systems Co., Ltd.)
Kerry Cold Store (Hong Kong) Limited HK Warehouse operation HK$20 100%Kerry D.G. Warehouse (Kowloon Bay) Limited HK Warehouse ownership HK$20,000,000 100%Kerry Distribution (Hong Kong) Limited HK Provision of distribution services HK$500,000 100%
^* Kerry Distribution (Thailand) Limited Thailand Provision of distribution services Baht20,000,000 71%* Kerry EAS Logistics (Qingdao) Co., Ltd. PRC Logistics business US$200 70%
(formerly known as EAS InternationalLogistics (Qingdao) Limited Company)
Kerry EAS Logistics (SHENZHEN) Ltd. PRC Freight forwarding business US$1,000,000 70%(formerly known as Shenzhen EasInternational Transportation Ltd.)
* Kerry EAS Logistics (Xiamen) Co., Ltd. PRC Logistics business US$1,100,000 70%(formerly known as Eas Logistics (Xiamen)Co., Ltd.)
Kerry EAS Logistics Limited PRC Freight forwarding and logistics business RMB150,000,000 70%(formerly known as Eas International
Transportation Ltd.)Kerry EAS Warehouse (Zhuhai Free PRC Provision of cargo storage services HK$1,000,000 70%
Trade Zone) Ltd.λ ^* Kerry FFTZ Warehouse (Shenzhen) Ltd. PRC Warehouse and logistics business HK$50,000,000 51%
Kerry Facilities Management (Hong Kong) Limited HK Building management HK$2 100%Kerry Facilities Management Services Limited HK Dormant HK$2 100%
* Kerry Freight (Australia) Pty Ltd Australia Freight forwarding A$2 100%Kerry Freight (Hong Kong) Limited HK Freight forwarding Ordinary HK$10,000 100%
Non-voting deferredHK$2,750,000
^ Kerry Freight (Korea) Inc. Korea Freight forwarding Won500,000,000 50.99%^* Kerry Freight (Taiwan) Limited Taiwan Freight forwarding TWD29,000,000 51%
* Kerry Freight (Thailand) Limited Thailand Freight forwarding business Baht11,500,000 57.80%^* Kerry Freight (USA) Inc. Delaware, U.S.A. Dormant US$1 100%
Kerry Freight International (Taiwan) Limited BVI Investment holding US$1 100%Kerry Freight International Limited HK Freight forwarding HK$2 100%Kerry Freight Services (China) Limited BVI Investment holding HK$1 100%Kerry Freight Services (Europe) Limited BVI Investment holding US$1 100%Kerry Freight Services (HKSAR) Limited BVI Investment holding US$1 100%Kerry Freight Services (Korea) Limited BVI Investment holding HK$1 100%Kerry Freight Services (Philippines) Limited BVI Investment holding US$1 100%Kerry Freight Services (Taiwan) Limited BVI Investment holding HK$10,000 100%Kerry Freight Services (Thailand) Limited BVI Investment holding HK$1 100%Kerry Freight Services (U.K.) Limited BVI Investment holding US$1 100%
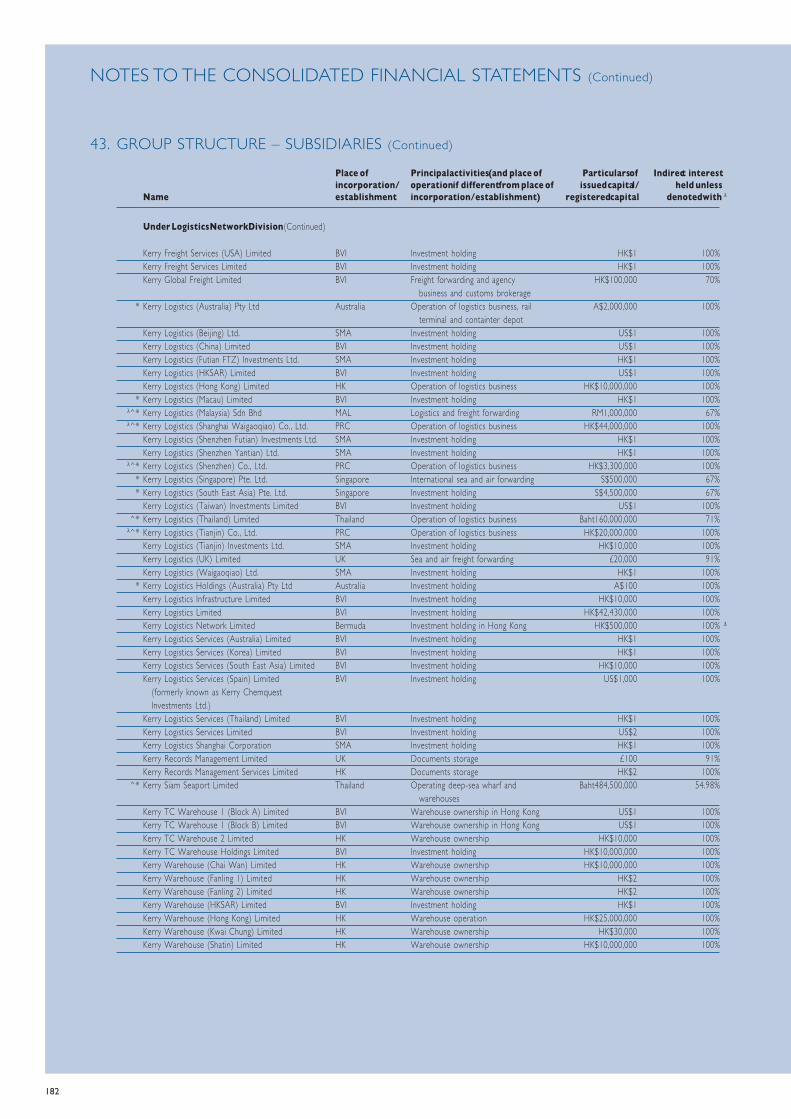
182
NOTES TO THE CONSOLIDATED FINANCIAL STATEMENTS (Continued)
43. GROUP STRUCTURE – SUBSIDIARIES (Continued)
Place of Principal activities (and place of Particulars of Indirect interestincorporation/ operation if different from place of issued capital/ held unless
Name establishment incorporation/establishment) registered capital denoted with ∆
Under Logistics Network Division (Continued)
Kerry Freight Services (USA) Limited BVI Investment holding HK$1 100%Kerry Freight Services Limited BVI Investment holding HK$1 100%Kerry Global Freight Limited BVI Freight forwarding and agency HK$100,000 70%
business and customs brokerage* Kerry Logistics (Australia) Pty Ltd Australia Operation of logistics business, rail A$2,000,000 100%
terminal and containter depotKerry Logistics (Beijing) Ltd. SMA Investment holding US$1 100%Kerry Logistics (China) Limited BVI Investment holding US$1 100%Kerry Logistics (Futian FTZ) Investments Ltd. SMA Investment holding HK$1 100%Kerry Logistics (HKSAR) Limited BVI Investment holding US$1 100%Kerry Logistics (Hong Kong) Limited HK Operation of logistics business HK$10,000,000 100%
* Kerry Logistics (Macau) Limited BVI Investment holding HK$1 100%λ ^* Kerry Logistics (Malaysia) Sdn Bhd MAL Logistics and freight forwarding RM1,000,000 67%λ ^* Kerry Logistics (Shanghai Waigaoqiao) Co., Ltd. PRC Operation of logistics business HK$44,000,000 100%
Kerry Logistics (Shenzhen Futian) Investments Ltd. SMA Investment holding HK$1 100%Kerry Logistics (Shenzhen Yantian) Ltd. SMA Investment holding HK$1 100%
λ ^* Kerry Logistics (Shenzhen) Co., Ltd. PRC Operation of logistics business HK$3,300,000 100%* Kerry Logistics (Singapore) Pte. Ltd. Singapore International sea and air forwarding S$500,000 67%* Kerry Logistics (South East Asia) Pte. Ltd. Singapore Investment holding S$4,500,000 67%
Kerry Logistics (Taiwan) Investments Limited BVI Investment holding US$1 100%^* Kerry Logistics (Thailand) Limited Thailand Operation of logistics business Baht160,000,000 71%
λ ^* Kerry Logistics (Tianjin) Co., Ltd. PRC Operation of logistics business HK$20,000,000 100%Kerry Logistics (Tianjin) Investments Ltd. SMA Investment holding HK$10,000 100%Kerry Logistics (UK) Limited UK Sea and air freight forwarding £20,000 91%Kerry Logistics (Waigaoqiao) Ltd. SMA Investment holding HK$1 100%
* Kerry Logistics Holdings (Australia) Pty Ltd Australia Investment holding A$100 100%Kerry Logistics Infrastructure Limited BVI Investment holding HK$10,000 100%Kerry Logistics Limited BVI Investment holding HK$42,430,000 100%Kerry Logistics Network Limited Bermuda Investment holding in Hong Kong HK$500,000 100% ∆
Kerry Logistics Services (Australia) Limited BVI Investment holding HK$1 100%Kerry Logistics Services (Korea) Limited BVI Investment holding HK$1 100%Kerry Logistics Services (South East Asia) Limited BVI Investment holding HK$10,000 100%Kerry Logistics Services (Spain) Limited BVI Investment holding US$1,000 100%
(formerly known as Kerry ChemquestInvestments Ltd.)
Kerry Logistics Services (Thailand) Limited BVI Investment holding HK$1 100%Kerry Logistics Services Limited BVI Investment holding US$2 100%Kerry Logistics Shanghai Corporation SMA Investment holding HK$1 100%Kerry Records Management Limited UK Documents storage £100 91%Kerry Records Management Services Limited HK Documents storage HK$2 100%
^* Kerry Siam Seaport Limited Thailand Operating deep-sea wharf and Baht484,500,000 54.98%warehouses
Kerry TC Warehouse 1 (Block A) Limited BVI Warehouse ownership in Hong Kong US$1 100%Kerry TC Warehouse 1 (Block B) Limited BVI Warehouse ownership in Hong Kong US$1 100%Kerry TC Warehouse 2 Limited HK Warehouse ownership HK$10,000 100%Kerry TC Warehouse Holdings Limited BVI Investment holding HK$10,000,000 100%Kerry Warehouse (Chai Wan) Limited HK Warehouse ownership HK$10,000,000 100%Kerry Warehouse (Fanling 1) Limited HK Warehouse ownership HK$2 100%Kerry Warehouse (Fanling 2) Limited HK Warehouse ownership HK$2 100%Kerry Warehouse (HKSAR) Limited BVI Investment holding HK$1 100%Kerry Warehouse (Hong Kong) Limited HK Warehouse operation HK$25,000,000 100%Kerry Warehouse (Kwai Chung) Limited HK Warehouse ownership HK$30,000 100%Kerry Warehouse (Shatin) Limited HK Warehouse ownership HK$10,000,000 100%
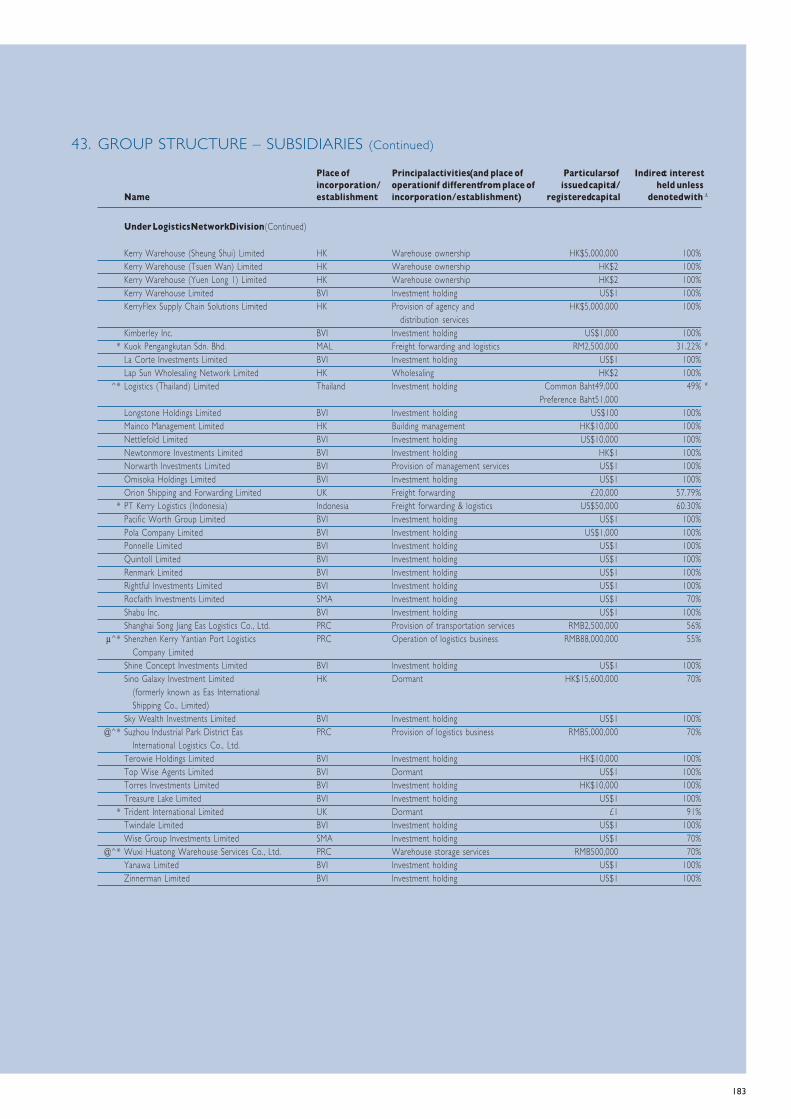
183
43. GROUP STRUCTURE – SUBSIDIARIES (Continued)
Place of Principal activities (and place of Particulars of Indirect interestincorporation/ operation if different from place of issued capital/ held unless
Name establishment incorporation/establishment) registered capital denoted with ∆
Under Logistics Network Division (Continued)
Kerry Warehouse (Sheung Shui) Limited HK Warehouse ownership HK$5,000,000 100%Kerry Warehouse (Tsuen Wan) Limited HK Warehouse ownership HK$2 100%Kerry Warehouse (Yuen Long 1) Limited HK Warehouse ownership HK$2 100%Kerry Warehouse Limited BVI Investment holding US$1 100%KerryFlex Supply Chain Solutions Limited HK Provision of agency and HK$5,000,000 100%
distribution servicesKimberley Inc. BVI Investment holding US$1,000 100%
* Kuok Pengangkutan Sdn. Bhd. MAL Freight forwarding and logistics RM2,500,000 31.22% #
La Corte Investments Limited BVI Investment holding US$1 100%Lap Sun Wholesaling Network Limited HK Wholesaling HK$2 100%
^* Logistics (Thailand) Limited Thailand Investment holding Common Baht49,000 49% #
Preference Baht51,000Longstone Holdings Limited BVI Investment holding US$100 100%Mainco Management Limited HK Building management HK$10,000 100%Nettlefold Limited BVI Investment holding US$10,000 100%Newtonmore Investments Limited BVI Investment holding HK$1 100%Norwarth Investments Limited BVI Provision of management services US$1 100%Omisoka Holdings Limited BVI Investment holding US$1 100%Orion Shipping and Forwarding Limited UK Freight forwarding £20,000 57.79%
* PT Kerry Logistics (Indonesia) Indonesia Freight forwarding & logistics US$50,000 60.30%Pacific Worth Group Limited BVI Investment holding US$1 100%Pola Company Limited BVI Investment holding US$1,000 100%Ponnelle Limited BVI Investment holding US$1 100%Quintoll Limited BVI Investment holding US$1 100%Renmark Limited BVI Investment holding US$1 100%Rightful Investments Limited BVI Investment holding US$1 100%Rocfaith Investments Limited SMA Investment holding US$1 70%Shabu Inc. BVI Investment holding US$1 100%Shanghai Song Jiang Eas Logistics Co., Ltd. PRC Provision of transportation services RMB2,500,000 56%
µ ^* Shenzhen Kerry Yantian Port Logistics PRC Operation of logistics business RMB88,000,000 55%Company Limited
Shine Concept Investments Limited BVI Investment holding US$1 100%Sino Galaxy Investment Limited HK Dormant HK$15,600,000 70%
(formerly known as Eas InternationalShipping Co., Limited)
Sky Wealth Investments Limited BVI Investment holding US$1 100%@^* Suzhou Industrial Park District Eas PRC Provision of logistics business RMB5,000,000 70%
International Logistics Co., Ltd.Terowie Holdings Limited BVI Investment holding HK$10,000 100%Top Wise Agents Limited BVI Dormant US$1 100%Torres Investments Limited BVI Investment holding HK$10,000 100%Treasure Lake Limited BVI Investment holding US$1 100%
* Trident International Limited UK Dormant £1 91%Twindale Limited BVI Investment holding US$1 100%Wise Group Investments Limited SMA Investment holding US$1 70%
@^* Wuxi Huatong Warehouse Services Co., Ltd. PRC Warehouse storage services RMB500,000 70%Yanawa Limited BVI Investment holding US$1 100%Zinnerman Limited BVI Investment holding US$1 100%

184
NOTES TO THE CONSOLIDATED FINANCIAL STATEMENTS (Continued)
43. GROUP STRUCTURE – SUBSIDIARIES (Continued)
Place of Principal activities (and place of Particulars of Indirect interestincorporation/ operation if different from place of issued capital/ held unless
Name establishment incorporation/establishment) registered capital denoted with ∆
Under Other Divisions
Alpine Project Management Ltd. SMA Project Management in Asia US$1 100%Architectural Design and Management HK Provision of architectural services HK$2 100%
Services Limitedλ ^* Beijing Kerry Datalinks Limited PRC Operation of internet data centre US$2,100,000 100%
Close Encounters Limited BVI Investment holding HK$10,000 100%ibe-Datalinks (Beijing) Limited SMA Investment holding HK$1 100%ibe-Tech Investments Limited BVI Investment holding US$1 100% ∆
ISA Investments Limited BVI Investment holding US$1 100%Kerry Corporate Services Limited HK Provision of corporate services HK$1 100%
(formerly known as Fame LeadInvestments Limited)
Kerry Estate Management Limited BVI Investment holding HK$10,000 100% ∆
Kerry Overseas Project Management Limited Liberia Project management in Asia US$100 100%(Jia Li Hai Wai Xiang Mu Guan Li Limited)
Kerry Project Management (H.K.) Limited HK Project management HK$300,000 100%Kerry Project Services Limited HK Provision of management services HK$2 100%Kerry Properties Capital Limited BVI Dormant US$10,000 100%
λ ^ Kerry Properties Development Management PRC Real estate management US$350,000 100%(Shanghai) Co., Ltd.
Kerry Properties Nominees Limited BVI Provision of nominee services HK$1,000 100%Kerry Properties Treasury Limited BVI Investment holding and HK$4,670,665,187 100% ∆
group financingKerry Property Management Services Limited HK Property management HK$20 100%Kerry Real Estate Agency Limited HK Estate agency HK$2 100%
λ ^* Kerry Real Estate Management (Shenzhen) Ltd. PRC Real estate management HK$3,000,000 100%Kerry Real Estate Services (Beijing) Ltd. SMA Dormant HK$1 100%Kerry Real Estate Services (Fuzhou) Ltd. SMA Investment holding HK$1 100%Kerry Real Estate Services (Shanghai) Ltd. SMA Investment holding HK$1 100%Kerry Real Estate Services (Shenzhen) Ltd. SMA Investment holding HK$1 100%Southwark Profits Limited BVI Investment holding US$100 100%Tellico Investment Limited Liberia Investment holding US$1 100%Toccate Company Limited HK Financing Ordinary HK$10 100%
Non-voting deferredHK$1,000,000
Upsmart Investments Limited HK Dormant HK$2 100%Win House/Kai Tai (Joint Venture) HK Provision of construction work HK$100 75%
Company LimitedWin House Industries Limited HK Investment holding and provision of HK$1,000,000 100%
construction workWing Tsing Financial Services Limited BVI Group financing in Hong Kong US$1 100%Wise Insight Finance Limited BVI Group financing in Hong Kong US$1 100%
λ ^* Yu Quan Property Management (Fuzhou) Ltd. PRC Real estate management HK$500,000 100%
* companies not audited by PricewaterhouseCoopers^ English translation of name only# deemed subsidiaryλ wholly foreign-owned enterpriseµ sino-foreign equity joint venture enterprise@ domestic joint venture enterprise
HK Hong KongBVI British Virgin IslandsMAL MalaysiaSMA SamoaPRC The People’s Republic of ChinaUK United Kingdom

185
44. GROUP STRUCTURE – ASSOCIATED COMPANIESAs at 31 December 2005, the Company held interests in the following associated companies which arecategorized according to the business divisions of the Group, namely, Property Division, Infrastructure Divisionand Logistics Network Division as listed below:
Place of Principal activities (and place of Particulars of class ofincorporation/ operation if different from place issued shares/ Interest held
Name establishment of incorporation/establishment) registered capital indirectly
Under Property Division
* ± Ariel Investments Limited HK Investment holding 1,000,000 shares of 45%HK$1 each
Bay Tower Properties Limited BVI Investment holding 1,000 shares of US$1 each 33.33%µ ^* Beijing BHL Logistics Limited PRC Land resettlement US$20,000,000 20%
* Benefit Bright (B.V.I.) Limited BVI Investment holding in Hong Kong 1,000 shares of US$1 each 32.50%* Benefit Bright Limited HK Property investment and trading 2 shares of HK$1 each 32.50%
Brisbane Trading Company Limited HK Investment holding, property 100,000 ordinary shares of 50%development and trading HK$10 each
108,376,196 non-votingdeferred shares of HK$1 each
* Capital Fun Limited HK Provision of nominee services 2 shares of HK$1 each 20%* Cardiff Investments Limited HK Investment holding 100,000 shares of HK$1 each 30%* Cavalcade Holdings Limited BVI Investment holding 100 shares of US$1 each 45%
Cheerjoy Development Limited HK Property development 2 shares of HK$1 each 35%Cushion Company Limited HK Dormant 10,000 shares of HK$1 each 33.33%EDSA Parking Services, Inc. PHI Carpark operations 2,500 shares of 39.12%
Pesos 100 eachEDSA Properties Holdings Inc. PHI Property development, 4,215,222,612 shares 39.12%
investment holding and of Peso 1 eachreal estate management
* Enterprico Investment Limited HK Loan financing 100,000 ordinary shares of 45%HK$1 each
* ± Grand Creator Investment (BVI) Limited BVI Investment holding 10 shares of US$1 each 40%* ± Grand Creator Investment Limited HK Property development 2 shares of HK$1 each 40%* ± Hang Hau Station (Project Management) Limited HK Project management 2 shares of HK$1 each 40%* ± Hang Hau Station Construction Limited HK Dormant 2 shares of HK$1 each 40%
* Harvest Sun (B.V.I.) Limited BVI Investment holding in Hong Kong 100 shares of US$1 each 20%* Harvest Sun Limited HK Property investment and trading 2 shares of HK$1 each 20%
Hilaire Inc. BVI Investment holding 900 shares of US$1 each 33.33%* ± Jacksons Landing Development Pty. Limited Australia Property development 400 ordinary shares of 25%
A$1 each* ± Jacksons Landing Estate Management Australia Property management 10 ordinary shares of 25%
Pty Limited A$1 each* Kerry Hung Kai Warehouse HK Warehouse operation 5,000,000 shares of 50%
(Cheung Sha Wan) Limited HK$1 each* Kosco Limited BVI Provision of nominee services 1 share of US$1 32.50%* Olympian City 1 (Project Management) Limited HK Project management 2 shares of HK$1 each 20%* Olympian City 1 Management Company Limited HK Leasing and estate management 2 shares of HK$1 each 20%* Olympian City 2 (Project Management) Limited HK Project management 2 shares of HK$1 each 32.50%* Olympian City 2 Finance Company Limited HK Provision of finance services 1,000 shares of HK$1 each 38.20%* Olympian City 2 Management Company Limited HK Leasing and estate management 1,000 shares of HK$1 each 32.50%
Point Perfect Investments Limited BVI Investment holding 10 shares of US$1 each 35%Portstewart Limited HK Provision of finance services 2 shares of HK$1 each 50%
* ± Reca Limited BVI Provision of nominee services 1 share of US$1 40%* ± Residence Oasis Finance Company Limited HK Provision of finance services 2 shares of HK$1 each 40%
The Shang Grand Tower Corporation PHI Property development 2,293,148 preferred shares 39.12%of Peso 100 each
1,427,721 common sharesof Peso 100 each
Shangri-La Plaza Corporation PHI Operation of shopping mall 834,576,512 preferred shares 30.80%and other related activities of Peso 1 each
235,000,000 common sharesof Peso 1 each
± Time Rank Limited HK Property trading 2 shares of HK$1 each 50%

186
NOTES TO THE CONSOLIDATED FINANCIAL STATEMENTS (Continued)
44. GROUP STRUCTURE – ASSOCIATED COMPANIES (Continued)
Place of Principal activities (and place of Particulars of class ofincorporation/ operation if different from place issued shares/ Interest held
Name establishment of incorporation/establishment) registered capital indirectly
Under Property Division (Continued)
* Top Spring Development (Beijing) Limited HK Investment holding 22,000,000 shares of 25%HK$1 each
* Twin Luck Worldwide Ltd. BVI Investment holding 2 shares of US$1 each 50%* Win Chanford Enterprises Limited HK Property investment 1,000,000 ordinary shares of 45%
HK$1 each* Wolver Hollow Company Limited HK Warehouse ownership 10,000 shares of HK$1 each 50%
* ± Wu Wing International Company, Limited HK Property trading and investment 30,000,000 shares of 45%HK$1 each
Under Infrastructure Division
Adwood Company Limited HK Investment holding 10 shares of HK$10 each 30%± Hong Kong Tunnels and Highways HK Tunnel management 1,000,000 shares of 15% β
Management Company Limited HK$1 eachKerry CQ JV Environmental Engineering Limited BVI Investment holding 2 shares of HK$1 each 50%Kerry CQ Water (Hohhot) Limited BVI Investment holding 1 share of HK$1 50%
± Western Harbour Tunnel Company Limited HK Tunnel operation and management 40,000,000 shares of 15% β
HK$10 each
Under Logistics Network Division
± Asia Airfreight Services Limited HK Provision of air cargo services 10,000 shares of 15% β
HK$1 each± Asia Airfreight Terminal Company Limited HK Air cargo handling terminal operation 360,000,000 shares of 15% β
HK$1 eachµ ^ Chiwan Container Terminal Co., Ltd PRC Port terminal operation US$63,500,000 25%
α ^* CV Global Logistics (Beijing) Limited PRC Logistics business RMB50,000,000 50%µ * Dalian Hantong Logistics Co., Ltd. PRC Warehousing and US$2,720,000 35%
container maintenance* Eas System (M) Sdn. Bhd. MAL Dormant 50,000 shares of RM1 each 34.27%* Eas Transportation (M) Sdn. Bhd. MAL Dormant 1,500,000 shares 48.30%
of RM1 eachEPHI Logistics Holdings, Inc. PHI Investment holding 15,000 shares of 40% ∆
Pesos 100 eachµ ^* Kerry BHL Logistics Limited PRC Provision of logistics services US$12,000,000 50%
Kerry Freight Philippines, Inc. PHI Freight and logistics business 20,000 shares of 20.40%Pesos 100 each
* Kerry Salvat Logistics, S.A. Spain Transportation forwarding and 20,000 shares of 6.01 Euro 50%(formerly known as East Asia Shipping materials handlingInternational Espana Sociedad Anonima)
^* Kerry Samyoung Logistics (Korea) Ltd. Korea Provision of logistics services, 10,000 shares of 30.6%packing, loading and Won5,000 eachunloading services
µ ^* Shanghai Kerry CHJ Logistics Limited PRC Operation of logistics business HK$14,040,000 50%α ^* Shanghai Song Jiang Eas Logistics Co. Ltd. PRC Trucking RMB2,500,000 40%
* companies not audited by PricewaterhouseCoopers^ English translation of name onlyβ deemed associated companyµ sino-foreign equity joint venture enterpriseα domestic joint venture enterprise± companies having a financial accounting period which is not coterminous with the Group∆ being the interest fully controlled by the Group
HK Hong KongBVI British Virgin IslandsMAL MalaysiaPHI PhilippinesPRC The People’s Republic of China

187
TEN-YEAR FINANCIAL SUMMARY
The results of the Group for the last ten financial years are as follows:
2005 2004 2003 2002 2001 2000 1999 1998 1997 1996HK$’000 HK$’000 HK$’000 HK$’000 HK$’000 HK$’000 HK$’000 HK$’000 HK$’000 HK$’000
Profit and loss account
Turnover 8,008,824 5,102,442 4,204,466 5,156,162 5,036,408 3,195,757 2,342,175 2,907,080 3,053,570 3,005,949
Operating profit 3,246,173 1,732,612 436,564 678,896 527,285 790,939 1,046,524 1,210,941 1,702,969 1,324,756
Share of results ofassociated companies 510,105 555,503 135,758 108,838 (272,780) 140,917 271,059 113,292 24,920 110,212
Profit before taxation 3,756,278 2,288,115 572,322 787,734 254,505 931,856 1,317,583 1,324,233 1,727,889 1,434,968
Taxation (494,199) 139,910 (111,192) (175,988) (83,165) (118,840) (66,466) (118,471) (113,021) (194,815)
Profit after taxation 3,262,079 2,428,025 461,130 611,746 171,340 813,016 1,251,117 1,205,762 1,614,868 1,240,153
Minority interests (195,216) (156,892) (66,389) (12,075) (23,910) (82,383) (18,515) (2,363) (39,645) (57,846)
Profit attributable toshareholders 3,066,863 2,271,133 394,741 599,671 147,430 730,633 1,232,602 1,203,399 1,575,223 1,182,307
Breakdown of the profit/(loss) attributable to shareholders by division:
2005 2004 2003 2002 2001 2000 1999 1998 1997 1996HK$’000 HK$’000 HK$’000 HK$’000 HK$’000 HK$’000 HK$’000 HK$’000 HK$’000 HK$’000
PRC Property Division 372,020 548,303 299,661 237,508 292,647 252,382 36,399 10,999 41,852 64,425
Hong Kong Property Division 1,429,102 1,187,302 (212,738) 550 (471,996) 195,977 1,012,553 974,625 1,385,348 943,266
Overseas Property Division 68,091 26,696 26,203 31,940 32,074 23,461 23,381 – – –
Logistics Network Division 1,085,152 438,297 92,253 158,739 57,037 64,845 89,607 108,006 121,614 145,209
Infrastructure Division 38,473 30,581 149,169 101,484 217,006 86,168 68,380 15,953 7,252 (1,051)
Project, property managementand others 74,025 39,954 40,193 69,450 20,662 107,800 2,282 93,816 19,157 30,458
Profit attributable to shareholders 3,066,863 2,271,133 394,741 599,671 147,430 730,633 1,232,602 1,203,399 1,575,223 1,182,307
The results for the year ended 31 December 1996 have been prepared as if the group structure at the time when the Company’s shares were
listed on the Stock Exchange of Hong Kong had been in existence throughout the year concerned.
Note: The above figures are based on the latest published accounts.
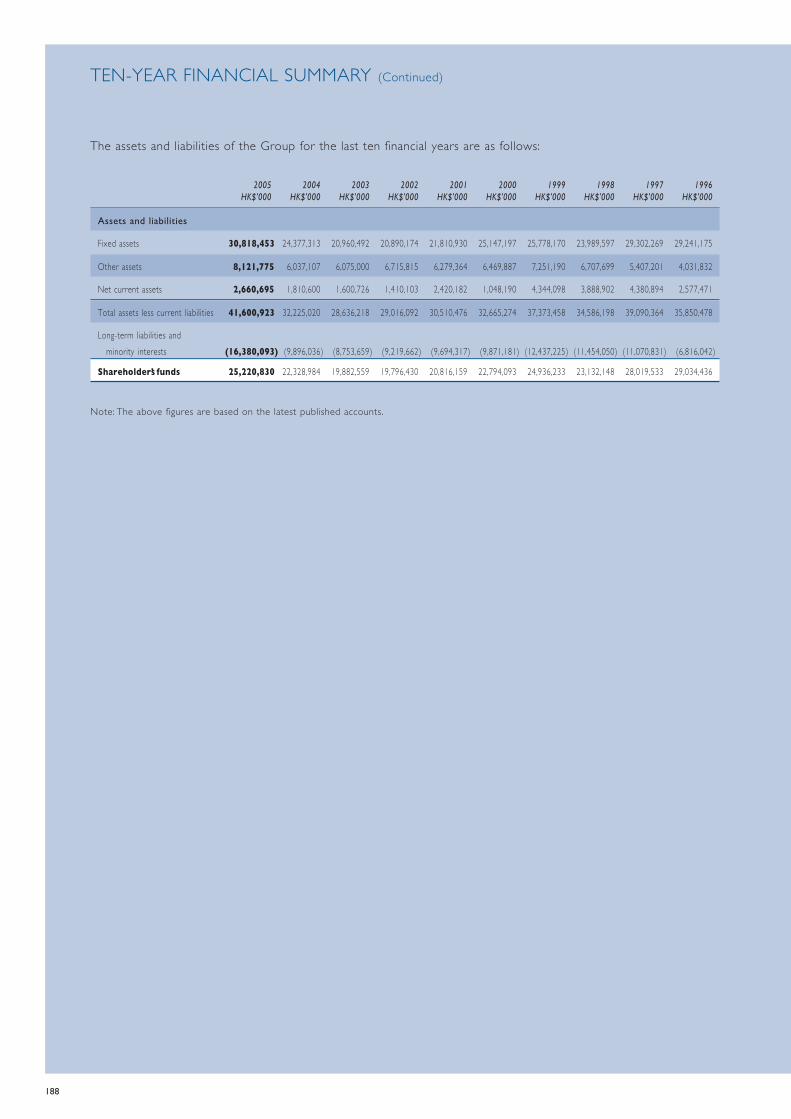
188
TEN-YEAR FINANCIAL SUMMARY (Continued)
The assets and liabilities of the Group for the last ten financial years are as follows:
2005 2004 2003 2002 2001 2000 1999 1998 1997 1996HK$’000 HK$’000 HK$’000 HK$’000 HK$’000 HK$’000 HK$’000 HK$’000 HK$’000 HK$’000
Assets and liabilities
Fixed assets 30,818,453 24,377,313 20,960,492 20,890,174 21,810,930 25,147,197 25,778,170 23,989,597 29,302,269 29,241,175
Other assets 8,121,775 6,037,107 6,075,000 6,715,815 6,279,364 6,469,887 7,251,190 6,707,699 5,407,201 4,031,832
Net current assets 2,660,695 1,810,600 1,600,726 1,410,103 2,420,182 1,048,190 4,344,098 3,888,902 4,380,894 2,577,471
Total assets less current liabilities 41,600,923 32,225,020 28,636,218 29,016,092 30,510,476 32,665,274 37,373,458 34,586,198 39,090,364 35,850,478
Long-term liabilities andminority interests (16,380,093) (9,896,036) (8,753,659) (9,219,662) (9,694,317) (9,871,181) (12,437,225) (11,454,050) (11,070,831) (6,816,042)
Shareholders’ funds 25,220,830 22,328,984 19,882,559 19,796,430 20,816,159 22,794,093 24,936,233 23,132,148 28,019,533 29,034,436
Note: The above figures are based on the latest published accounts.

13/F - 14/F, Cityplaza 314 Taikoo Wan RoadTaikoo Shing, Hong Kong
Telephone: (852) 2967 2200Facsimile: (852) 2967 9480
www.kerryprops.com
An
nu
al R
eport 2005
Aspiring to Excellence
Annual Report 2005(Incorporated in Bermuda with limited liability)
Stock Code : 683
Cover_eng.indd 1Cover_eng.indd 1 2006/4/7 2:59:19 PM2006/4/7 2:59:19 PM