
Incorporating learner experience into the design of multimedia instruction
11
Journal of Educational Psychology Copyright 2000 by the American PsychologicalAssociation,Inc. 2000, Vol. 92, No. 1,126-136 0022-0663100155.00 DOI: 10.1037//0022-0663.92.1.126 Incorporating Learner Experience Into the Design of Multimedia Instruction Slava Kalyuga, Paul Chandler, and John Sweller University of New South Wales In Experiment 1, inexperienced trade apprentices were presented with one of four alternative instructional designs: a diagram with visual text, a diagram with auditory text, a diagram with both visual and auditory text, or the diagram only. An auditory presentation of text proved superior to a visual-only presentation but not when the text was presented in both auditory and visual forms. The diagram-only format was the least intelligible to inexperienced learners. When participants became more experienced in the domain after two specifically designed training sessions, the advantage of a visual diagram-auditory text format disappeared. In Experiment 2, the diagram-only group was compared with the audio-text group after an additional training session. The results were the reverse of those of Experiment 1: The diagram-only group outperformed the audio-text group. Suggestions are made for multimedia instruction that takes learner experience into consideration. The experiments reported in this article were designed to test some hypotheses generated on the basis of cognitive load theory (see Sweller, 1999, and Sweller, van Merrien- boer, & Paas, 1998, for a recent review of the theoretical model). Central to the theory is the notion that working memory limitations should be a major consideration when designing instruction. Although working memory consider- ations are often overlooked, storage and processing limita- tions have been well known for some time (e.g., Miller, 1956), and these affect one's capability to learn from instruction. Only a few elements of information can be processed in working memory at any time. Too many elements may overburden working memory, decreasing the effectiveness of processing. On the other hand, an unlimited number of elements can be held in long-term memory in the form of hierarchically organized schemas--domain-specific knowledge structures that allow people to categorize mul- tiple elements of information as a single element. Thus, because schemas allow one to treat multiple subelements of information as a single element in working memory, they reduce the burden on working memory. Cognitive load theory has been used to generate and explain the split-attention effect: If learners are required to split their attention between, and mentally integrate, two or more related sources of information (e.g., text and dia- grams), this process may place an unnecessary strain on Slava Kalyuga, Paul Chandler, and John Sweller, School of Education, University of New South Wales, Sydney, New South Wales, Australia. The research reported in this article was supported by grants from the Australian Research Council. We thank our collaborating partners, Emall Ltd. and The Broken Hill Proprietary Company Limited (BHP), for their ongoing support and, in particular, Bryan Jones and Richard Winter of Email Ltd. and Eddy Gosek of BHP. Correspondence concerning this article should be addressed to Slava Kalyuga, School of Education, University of New South Wales, Sydney, New South Wales, 2052, Australia. Electronic mall may be sent to [email protected]. limited working memory and hinder learning (Chandler & Sweller, 1991). Physically integrated formats are an alternative to these conventional "split-source" instructions. With an integrated format, sections of text are directly embedded onto the diagram in close proximity to corresponding components of the diagram. Physical integration of related elements of diagrams and text reduces the search-and-match process required of conventional instructions, thus lessening the burden on working memory. The superiority of physically integrated instructions over conventional formats has been labeled the split-attention effect and has been demonstrated in many diverse studies that have examined a range of learning areas (Chandler & Sweller, 1991, 1992, 1996; Mayer & Gallini, 1990; Sweller, Chandler, Tierney, & Cooper, 1990; Tannizi & Sweller, 1988; Ward & Sweller, 1990). What Mayer and colleagues call the contiguity effect (e.g., Mayer & Anderson, 1991, 1992) is a form of temporal split attention. There may be alternative ways of dealing with split attention. Current theories of working memory consider capacities to be distributed over several partly independent subsystems. For example, dual-processing models of memory suggest that there are separate auditory and visual channels (Baddeley, 1992; Paivio, 1990; Penney, 1989; Schneider & Detweiler, 1987). Thus, the use of some combinations of both auditory and visual instruction may act as a substitute for physical integration when dealing with split attention. If one source of information is presented in auditory form and the other in visual form, mental integration of the audio and visual information is still required, but it may not overload working memory capacity if working memory is enhanced by a dual-mode presentation. The amount of information that can be processed using both auditory and visual channels may be considerably larger than that using only a single channel. Thus, limited working memory may be effectively expanded by using more than one sensory modality, and instructional materials with dual-mode presen- 126
Transcript of Incorporating learner experience into the design of multimedia instruction

Journal of Educational Psychology Copyright 2000 by the American Psychological Association, Inc. 2000, Vol. 92, No. 1,126-136 0022-0663100155.00 DOI: 10.1037//0022-0663.92.1.126
Incorporating Learner Experience Into the Design of Multimedia Instruction
Slava Kalyuga, Paul Chandler, and John Sweller University of New South Wales
In Experiment 1, inexperienced trade apprentices were presented with one of four alternative instructional designs: a diagram with visual text, a diagram with auditory text, a diagram with both visual and auditory text, or the diagram only. An auditory presentation of text proved superior to a visual-only presentation but not when the text was presented in both auditory and visual forms. The diagram-only format was the least intelligible to inexperienced learners. When participants became more experienced in the domain after two specifically designed training sessions, the advantage of a visual diagram-auditory text format disappeared. In Experiment 2, the diagram-only group was compared with the audio-text group after an additional training session. The results were the reverse of those of Experiment 1: The diagram-only group outperformed the audio-text group. Suggestions are made for multimedia instruction that takes learner experience into consideration.
The experiments reported in this article were designed to test some hypotheses generated on the basis of cognitive load theory (see Sweller, 1999, and Sweller, van Merrien- boer, & Paas, 1998, for a recent review of the theoretical model). Central to the theory is the notion that working memory limitations should be a major consideration when designing instruction. Although working memory consider- ations are often overlooked, storage and processing limita- tions have been well known for some time (e.g., Miller, 1956), and these affect one's capability to learn from instruction. Only a few elements of information can be processed in working memory at any time. Too many elements may overburden working memory, decreasing the effectiveness of processing. On the other hand, an unlimited number of elements can be held in long-term memory in the form of hierarchically organized schemas--domain-specific knowledge structures that allow people to categorize mul- tiple elements of information as a single element. Thus, because schemas allow one to treat multiple subelements of information as a single element in working memory, they reduce the burden on working memory.
Cognitive load theory has been used to generate and explain the split-attention effect: If learners are required to split their attention between, and mentally integrate, two or more related sources of information (e.g., text and dia- grams), this process may place an unnecessary strain on
Slava Kalyuga, Paul Chandler, and John Sweller, School of Education, University of New South Wales, Sydney, New South Wales, Australia.
The research reported in this article was supported by grants from the Australian Research Council. We thank our collaborating partners, Emall Ltd. and The Broken Hill Proprietary Company Limited (BHP), for their ongoing support and, in particular, Bryan Jones and Richard Winter of Email Ltd. and Eddy Gosek of BHP.
Correspondence concerning this article should be addressed to Slava Kalyuga, School of Education, University of New South Wales, Sydney, New South Wales, 2052, Australia. Electronic mall may be sent to [email protected].
limited working memory and hinder learning (Chandler & Sweller, 1991).
Physically integrated formats are an alternative to these conventional "split-source" instructions. With an integrated format, sections of text are directly embedded onto the diagram in close proximity to corresponding components of the diagram. Physical integration of related elements of diagrams and text reduces the search-and-match process required of conventional instructions, thus lessening the burden on working memory. The superiority of physically integrated instructions over conventional formats has been labeled the split-attention effect and has been demonstrated in many diverse studies that have examined a range of learning areas (Chandler & Sweller, 1991, 1992, 1996; Mayer & Gallini, 1990; Sweller, Chandler, Tierney, & Cooper, 1990; Tannizi & Sweller, 1988; Ward & Sweller, 1990). What Mayer and colleagues call the contiguity effect (e.g., Mayer & Anderson, 1991, 1992) is a form of temporal split attention.
There may be alternative ways of dealing with split attention. Current theories of working memory consider capacities to be distributed over several partly independent subsystems. For example, dual-processing models of memory suggest that there are separate auditory and visual channels (Baddeley, 1992; Paivio, 1990; Penney, 1989; Schneider & Detweiler, 1987). Thus, the use of some combinations of both auditory and visual instruction may act as a substitute for physical integration when dealing with split attention. If one source of information is presented in auditory form and the other in visual form, mental integration of the audio and visual information is still required, but it may not overload working memory capacity if working memory is enhanced by a dual-mode presentation. The amount of information that can be processed using both auditory and visual channels may be considerably larger than that using only a single channel. Thus, limited working memory may be effectively expanded by using more than one sensory modality, and instructional materials with dual-mode presen-
126

LEARNER EXPERIENCE AND MULTIMEDIA INSTRUCTION 127
tation (e.g., a visual diagram accompanied by an auditory text) may be more efficient than equivalent single-modality formats.
Mayer and his associates (e.g., Mayer, 1997) have con- ducted a number of experiments demonstrating the superior- ity of combined audio and visual instructions. Mayer and Moreno (1998) observed that students who received audi- tory explanations simultaneously with a computer-generated animation outperformed students who instead received con- current on-screen visual text involving the same words and presentation timing. Multimedia learners can integrate words and pictures more easily when the words are presented auditorily rather than visually.
In a series of experiments using geometry instructional material, Mousavi, Low, and Sweller (1995) found that a visually presented geometry diagram, combined with audito- rily presented statements, enhanced learning compared to conventional, visual-only presentations (the instructional modality effect). Tindall-Ford, Chandler, and Sweller (1997) also investigated this effect using elementary electrical engineering instructions and demonstrated that an audio text and visual diagram format was superior to purely visually based instructions. Jeung, Chandler, and Sweller (1997) demonstrated that dual-mode presentations enhanced learn- ing only by eliminating an extensive visual search when coordinating auditory and visual information.
Combined audio and visual presentation may provide an alternative way of dealing with split-attention instructional formats. Although learners are still required to coordinate information from disparate audio and visual sources, they have more effective working memory available to deal with information integration than they would when dealing with an equivalent visual-only format, thus demonstrating a modality effect. However, presenting several sources of information simultaneously, even in an integrated format (e.g., physically integrated diagrams and text), may not be always effective, particularly if some of the information to be processed is unnecessary or redundant. Chandler and Sweller (1991); Bobis, Sweller, and Cooper (1993); and Sweller and Chandler (1994) demonstrated that the elimina- tion rather than integration of redundant sources of informa- tion might be beneficial for learning. If the redundant information is integrated with essential information, there is no choice but to process it (e.g., an unnecessary text accompanying a fully self-contained and intelligible dia- gram). Redundancy imposes an additional cognitive load that interferes with the learning process and has been labeled the redundancy effect.
The redundancy effect generally occurs under conditions in which different sources of information are intelligible in isolation and in which each source provides similar informa- tion but in a different form. Attending to unnecessary information requires cognitive resources that consequently are unavailable for the construction and refinement of schemas. Reducing cognitive load can be accomplished by eliminating redundant information and thus freeing re- sources for learning. If, for example, a diagram is suffi- ciently self-contained and intelligible in isolation, then any accompanying text explaining the diagram that provides no
additional information may be redundant and should be omitted.
It does not follow that the elimination of a diagram in a redundant diagram-and-text combination will improve learn- ing. Depending on the context, diagrams may be much easier to learn from than text. A distinction also needs to be made between redundancy and revision of previously learned material. Revision is not a "redundant" activity that will interfere with learning, because revision will not increase working-memory load. Redundancy occurs when learners must unnecessarily translate and coordinate multiple sources of information (such as a diagram and text that redescribes the information in the diagram). That activity is mentally demanding and, for learners who can fully understand one source of information, presenting them with other sources generates an extraneous cognitive load.
We (Kalyuga, Chandler, & Sweller, 1999) provided another example of the redundancy effect. We compared three instructional formats using instructional materials about soldering in a training environment. Three groups of participants were visually presented with diagrammatic information. The first group also received the accompanying text visually (visual-text group), a second group received the text auditorily (auditory-text group), and a final group received the text auditorily and visually (visual-and-auditory- text group). Combined audio and visual presentations over- came split-attention problems (i.e., the auditory-text group outperformed the visual-text group), confirming a modality effect. There also was a redundancy effect, with the auditory- text group clearly outperforming the auditory-and-visual- text group. Simultaneous inclusion of visually presented text with identical auditory text, which is common in many standard multimedia packages, imposed an additional unnec- essary cognitive load that interfered with learning. Elimi- nation of redundant visual textual explanations proved beneficial.
Whether a source of information is intelligible in isola- tion, and additional information therefore redundant, in many cases depends on the level of experience of the learner. For example, regarding the information in Figure 1, if learners have sufficient knowledge to understand the dia- gram, then the text (in a visual form, auditory form, or both) might be redundant for these learners. They may prefer to ignore the text but may have difficulty doing so, resulting in a higher cognitive load. In this situation, the best instruc- tional format with the lowest unnecessary cognitive load for these learners may be a diagram-only format. On the other hand, if the diagram is not intelligible in isolation because of a lower level of learner experience, then additional text would be essential and therefore should be presented in an auditory rather than a visual format.
We (Kalyuga, Chandler, & Sweller, 1998) also found that low-knowledge electrical trainees benefited from additional text-based information with diagrams of electrical circuits (especially when textual explanations were integrated into the diagrams, thus reducing split attention). High-knowl- edge electrical trainees showed a preference for an instruc- tional package that consisted of the electrical circuit diagram only. The split-attention effect was replaced by the
128 KALYUGA, CHANDLER, AND SWELLER
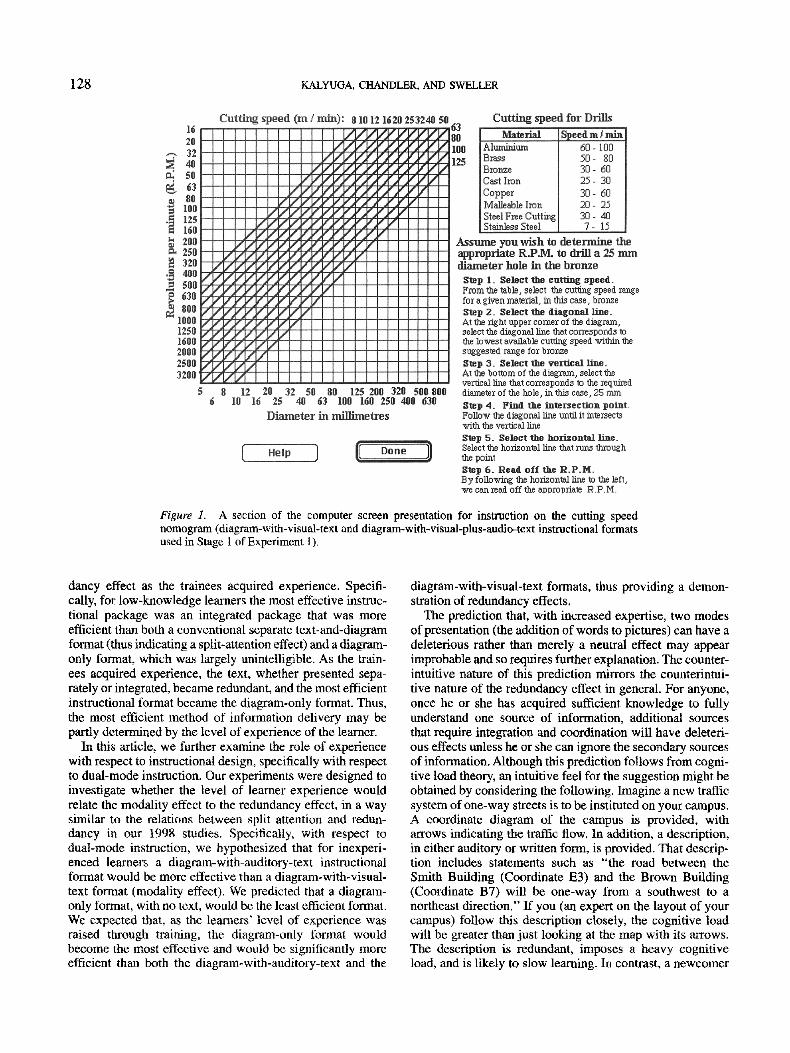
Figure 1. A section of the computer screen presentation for instruction on the cutting speed nomogram (diagram-with-visual-text and diagram-with-visual-plus-audio-text instructional formats used in Stage 1 of Experiment 1).
dancy effect as the trainees acquired experience. Specifi- cally, for low-knowledge learners the most effective instruc- tional package was an integrated package that was more efficient than both a conventional separate text-and-diagram format (thus indicating a split-attention effect) and a diagram- only format, which was largely unintelligible. As the train- ees acquired experience, the text, whether presented sepa- rately or integrated, became redundant, and the most efficient instructional format became the diagram-only format. Thus, the most efficient method of information delivery may be partly determined by the level of experience of the learner.
In this article, we further examine the role of experience with respect to instructional design, specifically with respect to dual-mode instruction. Our experiments were designed to investigate whether the level of learner experience would relate the modality effect to the redundancy effect, in a way similar to the relations between split attention and redun- dancy in our 1998 studies. Specifically, with respect to dual-mode instruction, we hypothesized that for inexperi- enced learners a diagram-with-auditory-text instructional format would be more effective than a diagram-with-visual- text format (modality effect). We predicted that a diagram- only format, with no text, would be the least efficient format. We expected that, as the learners' level of experience was raised through training, the diagram-only format would become the most effective and would be significantly more efficient than both the diagram-with-auditory-text and the
diagram-with-visual-text formats, thus providing a demon- stration of redundancy effects.
The prediction that, with increased expertise, two modes of presentation (the addition of words to pictures) can have a deleterious rather than merely a neutral effect may appear improbable and so requires further explanation. The counter- intuitive nature of this prediction mirrors the counterintui- tive nature of the redundancy effect in general. For anyone, once he or she has acquired sufficient knowledge to fully understand one source of information, additional sources that require integration and coordination will have deleteri- ous effects unless he or she can ignore the secondary sources of information. Although this prediction follows from cogni- tive load theory, an intuitive feel for the suggestion might be obtained by considering the following. Imagine a new traffic system of one-way streets is to be instituted on your campus. A coordinate diagram of the campus is provided, with arrows indicating the traffic flow. In addition, a description, in either auditory or written form, is provided. That descrip- tion includes statements such as "the road between the Smith Building (Coordinate E3) and the Brown Building (Coordinate B7) will be one-way from a southwest to a northeast direction." If you (an expert on the layout of your campus) follow this description closely, the cognitive load will be greater than just looking at the map with its arrows. The description is redundant, imposes a heavy cognitive load, and is likely to slow learning. In contrast, a newcomer

LEARNER EXPERIENCE AND MULTIMEDIA INSTRUCTION 129
to the campus, who may have no idea where the Smith or Brown Buildings are located, may need the verbal descrip- tion and may understand more quickly if it is given in auditory rather than written form.
Experiment 1
A section of a computer screen presentation for instruc- tion on the cutting speed nomogram is presented in Figure 1. Before machine drilling can commence, an appropriate number of rpm must be established on the cutting machine's speed control. The rpm depends on the diameter of the drill and the recommended cutting speed (which is the surface speed of the work as it passes the cutting tool). The cutting speed is usually measured in meters per minute. The recommended cutting speed varies with the type of material being cut.
The conversion from cutting speed to rpm may be done using formulas, reference tables, or charts. A cutting speed nomogram is a quick and reliable method of determining the rpm to run a drill of a given diameter (in mm) at a given cutting speed (in meters per minute).
Assume the material of Figure 1 (an explanation of how to use the nomogram to determine the appropriate rpm to drill a 25-mm hole in a bronze workpiece) is presented to learners who have just assimilated the basic concepts required to understand the information (cutting speed, rpm, etc.) but do not know how to apply this nomogram in specific circum- stances. For these relatively inexperienced learners, neither the diagram with the table nor the text are understandable in isolation. To understand the information, the diagram, the table, and the text must be mentally integrated. Elements of information included in the text must be matched with corresponding related elements in the diagram and table, and interactions between them traced. Because many interacting elements of information are involved in such search and tracing (e.g., material and diameter value in the text, material and corresponding cutting speed range in the table, vertical and diagonal lines corresponding to diameter and cutting speed values in the diagram, etc.), a heavy cognitive load due to split attention was expected. This combination of learners and instructional materials represents an example of split attention.
Learning may be facilitated in this situation by increasing effective working memory capacity using dual-mode presen- tation techniques, thus reducing the cognitive load associ- ated with mental integration. For example, visual textual explanations can be replaced with equivalent auditory explanations. The diagram, table, and the auditory explana- tion still must be mentally integrated, with many interacting audio and visual elements of information involved in the integration. Nevertheless, because of the effective expansion of working memory, due to the combined use of visual and auditory processors, the material may be more readily handled than when presented solely in a visual form.
Now, assume that the instructional presentation in Figure 1, including the visually based text, is used simultaneously with an auditory narration of the text. In this situation, either the auditory text or visual text is redundant. All the
interacting elements of the diagram and visual and auditory explanations must be mentally integrated. Working memory capacity, even if expanded because of the use of both audio and visual processors, should be more readily able to handle the material without the visual text, which is essentially redundant. Establishing connections between corresponding elements of visual and auditory components of working memory may unnecessarily consume additional cognitive resources to those used in a diagram-plus-auditory-text- alone format. To read and listen to verbal material, learners must precisely coordinate the two sensory modes. The slightest loss of coordination will result in chaotic input. Working memory resources required for coordination will be unavailable for learning. Thus, from the point of view of cognitive load theory, a duplication of information using different modes of presentation increases the risk of overload- ing working memory capacity and may have negative learning consequences. One of the duplicated sources of information (visual or auditory explanations) is clearly redundant. It does not provide any new information for the learners in addition to that already provided. In this situa- tion, elimination of the redundant visual text-based informa- tion might be beneficial for learning.
Finally, assume that the instructional presentation in Figure 1 contains only the diagram with table and that all the textual explanations, both in auditory and visual forms, are excluded. In this situation many inexperienced learners may not be able to understand the diagram and related table. Textual explanations may be essential simply to understand the diagrammatic and table-based information, but the same diagram-only instruction, presented to more experienced learners, may be both intelligible in isolation and also informative in that learners can acquire knowledge from it. Additional information is not needed because learners may have acquired knowledge that easily allows inferences to be made. If such additional information is still provided for more experienced learners, it is redundant and might be ignored by trainees. If it is not possible to ignore textual explanations, processing them may unnecessarily increase cognitive load. These learners may be assisted by the elimination of the additional material.
Thus, Experiment 1 was designed first to compare four different instructional formats (diagram with visual text, diagram with audio text, diagram with visual plus audio text, and diagram only) with relatively inexperienced trainees. The trainees were provided direct training in the domain, and we compared the same four instructional formats after the training. In accord with cognitive load theory, we predicted that the inexperienced trainees would benefit relatively more from a diagram-with-audio-text format than a diagram-plus-visual-text format, replicating the modality effect of previous studies (Kalyuga et al., 1999; Mousavi et al., 1995; Tindall-Ford et al., 1997). For the diagram-with- visual-plus-audio-text format, we expected that inclusion of the visual text simultaneously with identical auditory text would impose an additional cognitive load on inexperienced learners who process it, resulting in a negative effect (additional cognitive resources are needed for mental integra- tion of the visual text with the diagram and audio text). Thus,

130 KALYUGA, CHANDLER, AND SWELLER
a diagram-with-audio-text format should be superior to the diagram-with-visual-plus-audio-text format, demonstrating a redundancy effect (Kalyuga et al., 1999). A diagram-only format should be the worst presentation format for the inexperienced learners, as text-based information may be essential to understand the diagram.
For more experienced trainees the advantage of a diagram- with-audio text format should disappear, and a self- contained diagram-only format may be more advantageous. The relative standing of the diagram-with-visual-text format and the diagram-with-visual-plus-audio text format depends on whether (a) processing the textual explanations imposes an additional cognitive load heavy enough to overload learners ' working memory capacity or (b) these explanations are mostly ignored by learners.
Method
Participants
Sixty trade apprentices from two major Australian manufactur- ing companies participated in this experiment. All participants had completed at least Year 10 of high school and had completed about 3 months of their first-year trade course. According to the technical training supervisors from the companies, none of the participants had problems with general reading ability. From their regular training courses and practical work during the first 3 months of their apprenticeship, all participants had gained sufficient knowl- edge of technical terminology and concepts (cutting speed, rpm, etc.), cutting principles, and equipment to understand the instruc- tional materials. Because they had not been specifically taught cutting speed nomograms as a way of calculating appropriate rpm (formulas or tables had been used for this purpose during practical work), none of the participants had previous exposure to the instructional materials used in the study.
Materials and Procedure
Participants were randomly allocated to four groups (diagram with visual text, diagram with visual plus audio text, diagram with audio text, and diagram only) of 15 learners each corresponding to the four instructional formats. One participant from the diagram- with-andio-text group dropped out after the first stage, so that group included only 14 learners who completed all the stages of the experiment. All instructions and training for the study were delivered through an Apple Power Macintosh computer; Slava Kalyuga designed all the computer-based training packages with Authorware Professional (1993).
The diagram-with-visual-phis-audio-text format contained a cutting speed nomogram and written explanations of sequential steps in how to use the nomogram to determine a particular rpm. A textual problem statement (e.g., "Assume you wish to determine the appropriate R.P.M. to drill a 25 mm hole in a bronze workpiece") was presented visually next to the nomogram. The cutting speed nomogram and explanatory notes for this nomogram were presented on the same screen (see Figure 1). Participants could not conclude the learning session before they attended to all the paragraphs at least once. All the paragraphs that were still to be read were indicated by grey rectangular shapes enclosing those paragraphs. Before reading a paragraph, a trainee had to click on the paragraph. Then, screen-based highlights of the appropriate elements of the nomogram (the material name, cutting speed range, lines, intersection points, etc.) appeared on the screen. Some simple
animations also were used in the presentation. For example, if the learner clicked on the sentence "By following the horizontal line to the left, we can read off the appropriate R.P.M.," an arrow would move along a highlighted horizontal line to the left toward the corresponding rpm. It is important to note that animation was common to all instructional groups (except the diagram-only group). Auditory-based text was identical to the visual-text informa- tion and was delivered simultaneously with visual text through headphones while learners studied the corresponding visual screen animations of the diagrammatic information. A "help" button was provided for learners who still were not sure what to do.
The diagram-with-visual-text format was visually identical to the diagram-with-visual-plus-audio-text format with all the audi- tory explanations eliminated (the headphones were removed). The diagram-with-audio-text format differed from the diagram-with- visual-plus-audio-text format in that the former did not include visual explanations of the diagram (the headphones were provided for the audio statements). For the diagram-with-audio-text format, only the headings of the sequential steps (e.g., Step 1: Select the cutting speed, Step 2: Select the diagonal line) were displayed to be clicked on by the learners, with all the visual text-based explana- tions replaced by equivalent auditory commentaries. The auditory information was coordinated with screen-based animations and highlights of the appropriate elements of the nomogram. The diagram-only format contained the nomogram without textual explanations and statements. No highlights of elements of the nomogram or animations were used in this format.
The study was conducted in two stages.
Stage 1
Experimental training. Trainees studied the cutting speed nomogram instruction (see Figure 1) in their respective experimen- tal groups (all four computer-based presentations were self-paced, and there was no time limit for this instruction phase).
Subjective ratings. After participants studied the instructions, they completed subjective ratings of task difficulty. Self-ratings of task difficulty represent one viable method of measuring cognitive load and have been used previously for this purpose (see Paas & van Merrienboer, 1993, 1994). We chose to use subjective ratings of task difficulty because they are easy to implement and do not intrude on primary task performance as do other methods, such as secondary tasks. Subjective measures of mental load are reliable and correlate highly (.8-.99) with objective measures (Moray, 1982; O'Donnell & Eggemeier, 1986). These ratings of mental effort were collected electronically on the computer. A 7-point scale was used; participants were asked "How easy or difficult was this nomogram to understand? Click your answer." The participants selected one of the seven options: "extremely easy, . . . . very easy," "easy," "neither easy nor difficult," "difficult," "very difficult," and "extremely difficult." A mental load rating ranging from 1 to 7 was therefore collected from each participant.
Performance test. Participants then completed a series of 10 multiple-choice questions. The questions asked participants to solve for an unknown variable from given variables using the cutting speed nomogram. Four numerical or verbal alternatives were provided for each multiple-choice question. The first question was "What R.EM. should be used to drill a 40 mm diameter hole in the aluminium workpiece?" The alternative responses were "1000," "500," "300," and "100," with the correct answer in italics. This question was similar to the problem statement presented during the experimental training phase. The remaining 9 questions involved sets and sequences of procedural steps that were different from those presented during the experimental training phase. The changes were affected by altering the problem's knowns

LEARNER EXPERIENCE AND MULTIMEDIA INSTRUCTION 131
and unknowns. For example, the question "What material from those listed below can be drilled with R.P.M. of 200, if the required work diameter is 50 mm? (cast iron, aluminium, brass, copper)" involved first selecting a horizontal line (200 rpm) and a vertical line (50 ram), locating their intersection point, selecting a diagonal line running through the intersection point, determining a numeri- cal value of cutting speed corresponding to that line (32 rn/min) and, finally, selecting materials from the table that included that value in the cutting speed range. Some questions, such as "Assume you have a drilling machine with a range of R.P.M. from 16 to 500. Which work diameters from those listed below cannot be drilled in an aluminium workpiece? (500, 100, 50, 30)," included given parameters determined as a whole range rather than a specific value (e.g., 16-500 rpm). These questions required participants to consider several lines for each parameter. Up to 1.5 min were allowed for each of the 10 questions. The responses to each multiple-choice item were electronically recorded and judged as either correct or incorrect, resulting in a score out of 10 for each participant.
First training session. After the test, all participants were provided with training in using the cutting speed nomogram. The training session began with a worked example that contained visual textual explanations of the nomogram indicating how to determine the appropriate rpm to drill a 25-mm diameter hole in a bronze workpiece. The participants were allowed to study these instruc- tions as long as they needed. Next, all participants were presented with a series of 50 multiple-choice questions similar to those used during the testing phase. These questions were self-paced and included automatic feedback (correct or incorrect) immediately
after each response (trainees reattempted questions until they generated correct answers). This training period lasted 1-1.5 hr.
Stage 2
Stage 2 took place 1 week after the first stage. Second training session. This stage started with another train-
ing session that consisted of more exercises (multiple-choice questions) similar to those used during the first training session. The training session (which lasted about an hour) was followed by the experimental training and testing.
Experimental training. This time, a substantially different representation of the cutting speed nomogram was used during the instructional phase (the nomogram used for calculating rpm for turning operations). The materials used a completely different layout and were more complicated than those used during the first stage test and training sessions (see Figure 2). The new nomogram used a more complicated table (with separate columns for rough turning, finish turning, and drilling operations), which was inte- grated with the diagram. These materials were new to the students, and the subsequent test problems could not be solved by a direct application of previously acquired procedures. For example, search- ing for given material in the table now required taking into account what kind of operation was involved (rough turning, finish turning, or drilling). On the other hand, if the required materials were located, the corresponding diagonal lines could be selected directly without remembering the cutting speed range values. The instruc- tional materials were presented in the same four formats, and participants remained in the same groups as in the first stage.
Figure 2. A section of the computer screen presentation for instruction on the cutting speed nomogram (diagram-with-visual-text and diagram-with-visual-plus-audio-text instructional formats used in Stage 2 of Experiment 1).

132 KALYUGA, CHANDLER, AND SWELLER
Subjective ratings. After participants studied the instructions, they made subjective ratings of mental load using the same 7-point scale used in Stage 1.
Performance test. The performance test included a series of 10 multiple-choice questions that required participants to use the cutting speed nomogram version presented during experimental training to solve for an unknown variable from given variables. Similar to Stage 1, all questions except the first involved sets and sequences of procedural steps that were different from those presented during the experimental training phase because different knowns and unknowns were used (e.g., "Assume you have a lathe with a range of R.P.M. from 40 to 500. Which work diameters from those listed below cannot be finished with [an] alloy steel workpiece? 6, 20, 50, 100"). The questions dealt with materials, operations, and sets of parameter values that were represented in the new version of the nomogram.
All computer-based training programs were designed to display instructional materials as well as automatically record all experimen- tal data, including learners' responses to different test items, response times, and subjective ratings of mental load. We calcu- lated instructional efficiency measures using Paas and van Merrien- boer's (1993, 1994) procedure. This approach combines measures of cognitive load with measures of test perfoianance to derive information on the relative efficiency of instruction. It assumes that instructional presentations are efficient if they produce better performance results with less cognitive load required. We calcu- lated efficiency values by converting cognitive load and perfor- mance measures into z scores (standardizing those measures across conditions) and combining z scores using the formula E = (P - R) / V'2, where E = efficiency, P = performance z score, and R = rating scale z score (the S/2 in the denominator is used to make the graphical interpretation of the formula more straightforward-- see Paas and van Merrienboer [1993] for details). Using this formula, if performance and rating z scores are equal (P = R), efficiency is zero (E = 0). If the performance z score is higher than the rating z score (P > R), instructional efficiency is positive (E > 0). On the other hand, if the performance z score is lower than the rating z score (P < R), instructional efficiency is negative
(E < 0). Using the efficiency measure serves as a safeguard against the possibility that subjective ratings measure some other subjec- tive characteristics unrelated to instructional outcomes (e.g., self- confidence) rather than cognitive load. If learners find something easy to learn but perform better on tests (high efficiency), the likelihood that they are rating cognitive load rather than some other factor is increased.
Results and Discussion
We conducted a series of 4 (instructional format) × 2 (Stage 1 or 2) analyses of variance (ANOVAs) with repeated measures on the second factor, using the data from Experi- ment 1. The dependent variables were instruction time (time each learner spent studying instructions during experimental training), subjective ratings of mental effort, test perfor- mance scores on the multiple-choice items, and instructional efficiency measures. Means and standard deviations are displayed in Table 1.
The analysis of overall group main effects revealed significant differences between instructional formats, F(3, 55) = 12.27, MSE = 4458.15,p < .0001, for the instruction time (overall instruction time for the diagram-only group was lower than for other groups); F(3, 55) = 5.51, MSE = 1.69, p < .005, for the subjective rating data (overall difficulty rating for the diagram-with-audio-text group was lower than for other groups); and F(3, 55) = 3.87, MSE = 1.82, p < .05, for instructional efficiency (overall instruc- tional efficiency for the diagram-with-audio-text group was higher than for other groups). No significant overall main effect o f the multiple-choice items was found, F(3, 55) = 1.85, MSE = 6.55 (but note that because we predicted that the relative effectiveness of the instructional procedures would alter with experience, a nonsignificant main effect is to be expected). The analysis of Stage 1-Stage 2 main
Table 1 Mean Instruction Times, Ratings, Scores, and Levels of Instructional Efficiency by Experimental Condition and Stage of Testing, Experiment I
Experimental condition and stage of testing
Diagram with visual text
Diagram with audio plus Diagram with visual text audio text Diagram only
Variable 1 2 1 2 1 2 1 2
Instruction time(s) M 163 75 155 100 SD 94 48 64 66
Rating scale a M 3.0 3.8 2.9 3.3 SD 1.1 0.9 1.1 1.2
Question score b M 5.8 5.5 5.6 5.0 SD 1.9 2.4 2.1 2.4
Instructional efficiency c M 0.03 -0.17 -0 .04 -0.03 SD 1.12 0.94 1.16 1.30
128 69 44 22 37 20 21 16
2.1 2.5 3.7 3.5 1.0 1.2 1.0 0.8
7.1 6.4 5.1 6.2 1.4 2.0 1.7 2.3
0.91 0.88 -0.59 0.23 0.73 1.04 0.95 1.05
aRatings were made on 7-point scales (1 = extremely easy, 7 = extremely difficult), bMaximum question score = 10. CActual range for instructional efficiency was from -2 .34 to 2.20 (possible range is -oo, +oo).

LEARNER EXPERIENCE AND MULTIMEDIA INSTRUCTION 133
effects revealed significant differences for instruction time, F(1, 55) = 79.98, MSE = 1,154.58, p < .0001, and subjective mental ratings, F(1, 55) = 7.93, MSE = 0.47, p < .01. No significant effect was found of the multiple-choice items and instructional efficiency on Stage 1-Stage 2. Thus, with training, participants spent significantly less time studying instructions. Nevertheless, they rated the instruc- tional materials used in the Stage 2 test significantly higher in difficulty. These materials were more complicated than and different from those used during the Stage 1 test and training sessions.
Because one of the main purposes of this experiment was to study the dynamics of change with experience, we were primarily interested in the interaction effect between groups and stages. We expected that direct training with cutting speed nomograms would contribute to the development of relative experience in this specific domain and produce a switch of the most effective method of instruction. We predicted that the diagram-and-text groups (diagram-with- visual-text, diagram-with-visual-plus-audio-text, and dia- gram-with-audio-text groups) would perform relatively bet- ter on the Stage 1 test than the diagram-only group would. We expected that, because of a modality effect, the diagram- with-audio-text group would perform better than the diagram- with-visual-text group. In contrast, on the Stage 2 test, the increase in experience due to training should render the textual based material redundant, resulting in a relatively improved performance by the diagram-only group. Interac- tion effects should be a consequence of this pattern of results.
In accordance with this prediction, the interaction data of all the 4 × 2 ANOVAs were of major interest in this study. There were significant interactions for the instruction time, F(3, 55) = 4.71, MSE = 1,154.58, p < .01; for the mul- tiple-choice items, F(3, 55) = 2.83, MSE = 1.92, p < .05; and for the instructional efficiency measures, F(3, 55) = 4.03, MSE = 0.38, p < .05. A marginally significant interaction was observed for the subjective ratings of mental load, F(3, 55) = 2.72, MSE = 0.47, p = .053. The significant interactions suggest that the most efficient mode of instruction depends on the level of experience of learners.
There were significant differences between groups in the time they took to process the instructions, F(3, 56) = 12.05, MSE = 3,677.94, p < .0001, for Stage 1, and F(3, 55) = 8.48, MSE = 1,878.05, p = .0001, for Stage 2. The instruc- tion time for the diagram-only group was significantly lower than that of any of the three other groups with no other significant differences (Newman-Keuls test; see Winer, 1971). For subjective ratings of mental load, there were significant simple effects: F(3, 56) = 6.67, MSE = 1.06, p < .001, for Stage 1 and F(3, 55) = 3.96, MSE = 1.10,p < .05, for Stage 2. In Stage 1 the diagram-with-audio-text format was perceived to be significantly lower in mental load than any of the three other formats, with no other significant differences (Newman-Keuls). For Stage 2, the diagram-with- audio-text format was perceived to be significantly lower in mental load than the diagram-with-visual-text and diagram- only formats, with no other significant differences. For the multiple-choice items, there was a significant simple effect
for Stage 1 only, F(3, 56) = 3.92, MSE = 3.17,p < .05. The diagram-with-audio-text group performed significantly bet- ter than any of the three other groups with no other significant differences (Newman-Keuls). For instructional efficiency, there was a significant simple effect of Stage 1 only, F(3, 56) = 6.21, MSE = 1.01, p = .001. The diagram-with-audio-text group was significantly more effi- cient than any of the three other groups, with no other significant differences (Newman-Keuls).
The inexperienced trainees clearly benefited most from the diagram-with-audio-text format. They performed signifi- cantly better, with significantly lower mental load, than trainees who studied the diagram-with-visual-text format. This result is consistent with the modality effect of previous studies (Kalyuga et al., 1999; Mayer, 1997; Mayer & Mo- reno, 1998; Mousavi et al., 1995; Tmdall-Ford et al., 1997). The diagram-with-audio-text group also performed significantly better, with significantly lower mental load, than the diagram- with-visual-plus-audio-text group. Mental integration of the visual text with the diagram and audio text required addi- tional cognitive resources and overloaded participants' work- ing memory capacity. There was a redundancy effect similar to that in our 1999 study (Kalyuga et al., 1999).
After participants were exposed to training materials long enough to become more experienced in the domain, the distinct advantage of the diagram-with-audio-text format over the other formats disappeared. The contrast between the pre- and posttraining stages is especially distinctive when comparing the diagram-only and the diagram-with-audio- text formats. These two formats represented, correspond- ingly, the least and most effective formats initially, with statistically significant differences on all the parameters, but the differences reduced substantially--and, in the case of the test results, essentially disappeared--in Stage 2. As the participants' level of experience was raised, the performance of the diagram-only group improved more than the perfor- mance of any other group. Initially most disadvantaged, this group improved more rapidly than any other group. Thus, in accordance with our predictions, as experience increased, the relative improvement in performance of the diagram- only group was superior to the other three diagram-with-text groups. Nevertheless, a redundancy effect with a statistically significant superior performance by the diagram-only group was not obtained. Interaction effects observed in this experi- ment may have occurred not because of cognitive load factors but simply because the diagram-only group had more room for improvement. Obtaining a redundancy effect was essential for testing cognitive load predictions. We expected that a redundancy effect might occur with more training provided to participants.
Before moving on with additional training, we re- examined additional experimental conditions under which a redundancy effect might occur. In Experiment 1, all three diagram-and-text instructional formats (diagram with visual text, diagram with audio text, and diagram with audio plus visual texts) allowed learners to ignore visual and auditory textual explanations if they wished. Visual explanations were separated from the diagram and could be easily skipped by clicking on them without reading. Similarly, the

134 KALYUGA, CHANDLER, AND SWELLER
auditory explanations could be ignored or the diagrams inspected at leisure before and after the auditory explanation had been heard. Thus, all the diagram-and-text formats in Experiment 1 al lowed uninterrupted inspection of the dia- gram without increased cognitive load for long intervals of time. During that time the diagram-and-text formats were effectively equivalent to the diagram-only format for learn- ers who ignored the textual explanations. We can hypoth- esize that the redundancy effect might be obtainable with the diagram-and-text instructional formats using experienced learners if experimental conditions reduce the possibil i ty of uninterrupted free inspection of the diagram alone. We tested this assumption in Experiment 2.
E x p e r i m e n t 2
This experiment was designed to explore whether a redundancy effect would be obtainable with experienced learners under conditions in which learners in the diagram- and-text groups cannot inspect a diagram without simulta- neously attending to the auditory explanations. By the time this experiment took place (2½ months after Experiment 1), only 38 apprentices and trainees from those who participated in Experiment 1 were available for testing. We compared only two instructional formats: the diagram-only format and the diagram-with-audio-text format. This time, the diagram- with-andio-text group had to continuously attend to the auditory explanations without the possibil i ty of free inspec- tion of the diagram alone.
In accord with cognitive load theory, we expected that the trainees, who now were considerably more experienced than when they participated in Experiment 1, would benefit more from a self-contained, diagram-only format than from a diagram-with-audio-text format. Attending to the redundant auditory explanations simultaneously with inspection of the diagram should impose an additional cognitive load and thus decrease the performance and efficiency of the instructional presentation.
M e ~ o d
Participants
Thirty-eight apprentices and trainees who had participated in Experiment 1 took part in this study. During the 2~/2 months that had passed since Experiment 1, all the participants had continued their normal, scheduled, full-time training at their company's training center. That training included practice in performing the drilling-and-turning operations used in this experiment, although the procedures used when selecting appropriate rpm differed from the cutting speed nomogram methods.
Materials and Procedure
Participants were randomly allocated to two groups (19 learners in each group, regardless of their grouping in Experiment 1) corresponding to the diagram-only and diagram-with-audio-text formats of instructional materials. All the instructional and test materials were computer based and again constructed with Author- ware Professional for Macintosh. The computer-based training pro- gram was designed to display instructional materials as well as
automatically record all experimental data, including learners' re- sponses to different test items and subjective ratings of mental load.
A brief (about 20-25 min) training session preceded the experi- mental instruction and testing to remind learners about materials they had studied previously and to provide some additional training to allow sufficient experience to render the auditory textual material redundant. The training materials included six worked examples (with textual explanations integrated directly into the diagram). Three worked examples were based on the nomogram representation used during the Stage 1 test in Experiment 1, and the other three worked examples were based on the nomogram representation used during the Stage 2 test. Each worked example was followed by a multiple-choice item with a similar problem and with immediate feedback ("correct" or "incorrect"). Before reading a paragraph, a trainee had to click on it (learners were instructed to do this at the beginning of the training session and were continuously reminded during the training). Then, screen- based highlights of the appropriate elements of the nomogram (the material name, cutting speed range, lines, intersection points, etc.) appeared on the screen.
The experimental instructions were based on a version of the nomogram that was different from those used in Experiment 1, though it included elements of the versions used during both previous stages. Similar to Stage 1, Experiment 1, linear scales were used for both horizontal and vertical axes, with numbers of rpm increasing in the top-to-bottom direction. Numerical values of parameters were similar to those represented in the Stage 1, Experiment 1, version of the nomogram (although the range of diameters was shorter, extending from 5 mm to only 125 mm). A list of materials was taken from the table used in the instructions of Stage 1, Experiment 1, but the table was integrated with the nomogram in a way used in the instructions of Stage 2, Experiment 1. These materials were relatively new to students, and the subsequent test problems could not be solved by a direct applica- tion of routines identical to those used during either Stage 1 or Stage 2 of Experiment 1. By the time participants encountered these materials, they should have possessed knowledge about using nomograms in various types of tasks. They were expected to be experienced in using nomograms, but not this particular version of the nomogram. As a consequence, they still required additional learning to become familiar with this novel version of the nomogram (e.g., to find out where and how different parameters are represented in the new outline, etc.).
The diagram-with-audio-text format included a written textual problem statement next to the nomogram: "Figure out the steps to determine the appropriate R.P.M. to drill a 25 mm hole in a bronze workpiece." Auditory explanations of procedural steps in using the nomogram to solve the stated problem started immediately after the instruction was displayed. Consecutive steps followed each other without interruptions. The diagram-with-audio-text format was displayed for the 45 s that were necessary to articulate aloud all the textual explanations and terminated after the last explanation had been verbalized. The diagram-only format was also displayed for 45 s and included the same textual problem statement next to the nomogram. No elements of the nomogram were highlighted in either format. Thus, the presence of auditory explanations repre- sented the only difference between the two experimental formats.
After 45 s of studying the instructions, subjective measures of mental load were collected from all participants. Responses were made on a 7-point scale and were collected electronically on the computer. A series of 10 multiple-choice questions followed. Participants were allowed up to 60 s to answer each question. The responses to each multiple-choice item were electronically re- corded and judged as either correct or incorrect, providing a score of up to 10 for each participant.

LEARNER EXPERIENCE AND MULTIMEDIA INSTRUCTION 135
Results and Discussion
We conducted a series of simple factorial ANOVAs using the data from Experiment 2. The dependent variables were subjective ratings of mental effort and test performance scores on multiple-choice items. The independent variable was the instructional format (diagram-only format vs. dia- gram-with-audio-text format). Means and standard devia- tions are displayed in Table 2.
There were significant differences between groups in regard to multiple-choice items, F(1, 36) = 4.19, MSE = 6.04, p < .05, and instructional efficiency, F(1, 36) = 6.29, MSE = 1.14, p < .05. For subjective ratings of mental load, there was a marginally significant difference, F(1, 36) = 3.52, MSE = 1.91,p = .069.
Thus, the diagram-with-audio text group performed sig- nificantly worse than the diagram-only group on the multiple- choice test. At the same time, the diagram-with-audio-text format was rated more difficult than the diagram-only format; that is, a redundancy effect was obtained under conditions that required learners in the diagram-with-audio- text group to inspect the diagram and simultaneously listen to auditory explanations of how to use this diagram to solve a specific problem. Attending to redundant auditory explana- tions imposed an additional cognitive load, thus decreasing participants' performance and the efficiency of the diagram- with-audio-text instructional presentation.
General Discussion
According to cognitive load theory, under split-attention conditions limited working memory may be effectively expanded by using more than one sensory modality, and instructional formats in which separate sources of informa- tion are presented in alternate, auditory or visual, forms might be more efficient than equivalent single-modality formats. Such dual-modality presentation techniques are sometimes used in traditional instructional practice. For example, students may prefer listening to oral explanations
Table 2 Mean Ratings, Scores, and Levels of lnstructional Efficiency by Experimental Condition, Experiment 2
Experimental condition
Diagram Variable with audio text Diagram only
Rating scale a M 3.5 2.7 SD 1.5 1.2
Question scores b M 5.3 6.9 SD 2.6 2.4
Instructional efficiency ~ M -0.43 0.43 SD 1.10 1.00
aRatings were made on 7-point scales (1 = extremely easy, 7 = ex- tremely difficult), bMaximum question score = 10. CActual range for instructional efficiency was from -2.62 to 2.16 (possible range is -oo, +~).
of new, complex, diagram-based materials (e.g., when studying geometry or engineering) rather than reading such explanations in textbooks. In practice, however, many standard multimedia instructional presentations use auditory explanations simultaneously with the same visually pre- sented text. In other words, dual-mode presentations are used under redundancy rather than split-attention conditions. From the point of view of cognitive load theory, such duplication of the same information using different modes of presentation increases the risk of overloading working memory capacity and might have a negative effect on learning. Unnecessarily relating corresponding elements of visual and auditory content of working memory consumes additional cognitive resources. In such a situation, elimina- tion of a redundant visual source of information might be beneficial to learning. Moreover, the auditory explanations may also become redundant when presented to more experi- enced learners. If an instructional presentation forces learn- ers to attend to the auditory explanations continuously without the possibility of skipping or ignoring them, learn- ing might be inhibited.
The experiments reported in this article confirmed these assertions. In Experiment 1, the most advantageous format when instructing inexperienced learners in a domain was a visually presented diagram combined with simultaneously presented auditory explanations. The inclusion of visually presented text concurrently with the same text in an auditory form, however, inhibited learning. An additional cognitive load was imposed on learners who processed identical visual and auditory material. With additional training (the second stage of Experiment 1), the relative advantage of the audio text disappeared, and the effectiveness of the diagram-alone condition increased. In Experiment 2, after additional train- ing and under strictly controlled learning conditions, a substantial advantage of a diagram-alone condition over a diagram-with-audio-text condition was obtained, providing evidence of a redundancy effect and reversing the results of the first stage of Experiment 1. The reversal in results was obtained using the same students after they had gained additional experience.
In conclusion, multimedia, dual-modality instructions are beneficial only under some, well-defined, circumstances and have negative consequences under other circumstances. Differing levels of learner experience should be taken into account when selecting a proper user-adapted instructional design. When dealing with split-source diagrams and text, (a) textual materials should be presented in auditory rather than written form; (b) the same textual materials should not be presented in both auditory and written form; and (c) when presented in auditory form, textual materials should be able to be easily turned off or otherwise ignored. These prin- ciples, based on cognitive load theory, can provide some guidance in the design of multimedia instruction.
References
The Authorware Professional 2.0 [Computer software]. (1993). San Francisco, CA: Macromedia, Inc.

136 KALYUGA, CHANDLER, ANDSWELLER
Baddeley, A. (1992, January 31). Working memory. Science, 255, 556-559.
Bobis, J., Sweller, J., & Cooper, M. (1993). Cognitive load effects in a primary school geometry task. Learning and Instruction, 3, 1-21.
Chandler, P., & Sweller, J. (1991). Cognitive load theory and the format of instruction. Cognition and Instruction, 8, 293-332.
Chandler, P., & Sweller, J. (1992). The split-attention effect as a factor in the design of instruction. British Journal of Educational Psychology, 62, 233-246.
Chandler, P., & Sweller, J. (1996). Cognitive load while learning to use a computer program. Applied Cognitive Psychology, 10, 1-20.
Jeung, H., Chandler, P., & Sweller, J. (1997). The role of visual indicators in dual sensory mode instruction. Educational Psychol- ogy, 17, 329-343.
Kalyuga, S., Chandler, P., & Sweller, J. (1998). Levels of expertise and instructional design. Human Factors, 40, 1-17.
Kalyuga, S., Chandler, P., & Sweller, J. (1999). Managing split- attention and redundancy in multimedia instruction. Applied Cognitive Psychology, 13, 351-371.
Mayer, R. E. (1997). Multimedia learning: Are we asking the right questions? Educational Psychologist, 32, 1-19.
Mayer, R., & Anderson, R. (1991). Animations need narrations: An experimental test of a dual-coding hypothesis. Journal of Educational Psychology, 83, 484--490.
Mayer, R., & Anderson, R. (1992). The instructive animation: Helping students build connections between words and pictures in multimedia learning. Journal of Educational Psychology, 84, 444--452.
Mayer, R., & GaUini, J. (1990). When is an illustration worth ten thousand words? Journal of Educational Psychology, 82, 715- 726.
Mayer, R., & Moreno, R. (1998). A split-attention effect in multimedia learning: Evidence for dual-processing systems in working memory. Journal of Educational Psychology, 90, 312-320.
Miller, G. A. (1956). The magical number seven, plus or minus two: Some limits on our capacity for processing information. Psychological Review, 63, 81-97.
Moray, N. (1982). Subjective mental workload. Human Factors, 24, 25-40.
Mousavi, S. Y., Low, R., & Sweller, J. (1995). Reducing cognitive load by mixing auditory and visual presentation modes. Journal of Educational Psychology, 87, 319-334.
O' Donnell, R. D., & Eggemeier, E T. (1986). Workload assessment methodology. In K. R. Boff, L. Kaufman, & J. P. Thomas (Eds.), Handbook of perception and human performance (Vol. 2, pp. 1--49). New York: Wiley.
Paas, E, & van Merrienboer, J. (1993). The efficiency of instruc- tional conditions: An approach to combine mental-effort and performance measures. Human Factors, 35, 737-743.
Paas, E, & van Merrienboer, J. (1994). Variability of worked examples and transfer of geometrical problem-solving skills: A cognitive-load approach. Journal of Educational Psychology, 86, 122-133.
Paivio, A. (1990). Mental representations: A dual-coding ap- proach. New York: Oxford University Press.
Penney, C. G. (1989). Modality effects and the structure of short term verbal memory. Memory & Cognition, 17, 398--422.
Schneider, W., & Detweiler, M. (1987). A connectionist/control architecture for working memory. In G. H. Bower (Ed.), The psychology of learning and motivation (Vol. 21, pp. 53-119). New York: Academic Press.
Sweller, J. (1999). Instructional design. Melbourne, Australia: ACER Press.
Sweller, J., & Chandler, P. (1994). Why some material is difficult to learn. Cognition and Instruction, 12, 185-233.
Sweller, J., Chandler, P., Tierney, P., & Cooper, M. (1990). Cognitive load as a factor in the structuring of technical material. Journal of Experimental Psychology: General, 119, 176-192.
Sweller, J., van Merrienboer, J., & Paas, E (1998). Cognitive architecture and instructional design. Educational Psychology Review, 10, 251-296.
Tarmizi, R., & Sweller, J. (1988). Guidance during mathematical problem solving. Journal of Educational Psychology, 80, 424- 436.
Tindall-Ford, S., Chandler, E, & Sweller, J. (1997). When two sensory modes are better than one. Journal of Experimental Psychology: Applied, 3, 257-287.
Ward, M., & Sweller, J. (1990). Structuring effective worked examples. Cognition and Instruction, 7, 1-39.
Winer, B. J. (1971). Statistical principles in experimental design (2nd ed.). New York: McGraw-Hill.
Received November 25, 1998 Revision received August 9, 1999
Accepted August 9, 1999 •