In Vivo Lamina Cribrosa Micro-Architecture in Healthy and Glaucomatous Eyes as Assessed by Optical...
26
1 In-Vivo Lamina Cribrosa Microarchitecture in Healthy and Glaucomatous Eyes as Assessed by Optical Coherence Tomography Authors: Bo Wang, 1,2 Jessica E. Nevins, 1 Zach Nadler, 1 Gadi Wollstein, 1 Hiroshi Ishikawa, 1,2 Richard A. Bilonick, 1,3 Larry Kagemann, 1,2 Ian A. Sigal, 1,2 Ireneusz Grulkowski, 4 Jonathan J. Liu, 4 Martin Kraus, 4,5 Chen D. Lu, 4 Joachim Hornegger, 5 James G. Fujimoto, 4 Joel S. Schuman 1,2 Affiliations: 1 Department of Ophthalmology, UPMC Eye Center, Eye and Ear Institute, Ophthalmology and Visual Science Research Center, University of Pittsburgh School of Medicine, Pittsburgh, PA; 2 Department of Bioengineering, Swanson School of Engineering, University of Pittsburgh, Pittsburgh, Pennsylvania; 3 Department of Biostatistics, Graduate School of Public Health, University of Pittsburgh, Pittsburgh, PA; 4 Department of Electrical Engineering and Computer Science, Massachusetts Institute of Technology, Cambridge, MA; 5 Department of Computer Science, University of Erlangen-Nuremberg, Nuremberg, Germany. Corresponding Author: Gadi Wollstein, MD, UPMC Eye Center, 203 Lothrop Street, Suite 834, Pittsburgh, PA 15213; [email protected] Supported in part by National Institutes of Health contracts R01-EY013178, R01- EY011289, P30-EY008098 (Bethesda, MD); Eye and Ear Foundation (Pittsburgh, PA); Research to Prevent Blindness (New York, NY). IOVS Papers in Press. Published on December 3, 2013 as Manuscript iovs.13-13109 Copyright 2013 by The Association for Research in Vision and Ophthalmology, Inc.
-
Upload
independent -
Category
Documents
-
view
3 -
download
0
Transcript of In Vivo Lamina Cribrosa Micro-Architecture in Healthy and Glaucomatous Eyes as Assessed by Optical...
1
In-Vivo Lamina Cribrosa Microarchitecture in Healthy and Glaucomatous Eyes as
Assessed by Optical Coherence Tomography
Authors: Bo Wang,1,2 Jessica E. Nevins,1 Zach Nadler,1 Gadi Wollstein,1 Hiroshi
Ishikawa,1,2 Richard A. Bilonick,1,3 Larry Kagemann,1,2 Ian A. Sigal,1,2 Ireneusz
Grulkowski,4 Jonathan J. Liu,4 Martin Kraus,4,5 Chen D. Lu,4 Joachim Hornegger,5
James G. Fujimoto,4 Joel S. Schuman1,2
Affiliations: 1Department of Ophthalmology, UPMC Eye Center, Eye and Ear Institute,
Ophthalmology and Visual Science Research Center, University of Pittsburgh School of
Medicine, Pittsburgh, PA; 2Department of Bioengineering, Swanson School of
Engineering, University of Pittsburgh, Pittsburgh, Pennsylvania; 3Department of
Biostatistics, Graduate School of Public Health, University of Pittsburgh, Pittsburgh, PA;
4Department of Electrical Engineering and Computer Science, Massachusetts Institute
of Technology, Cambridge, MA; 5Department of Computer Science, University of
Erlangen-Nuremberg, Nuremberg, Germany.
Corresponding Author: Gadi Wollstein, MD, UPMC Eye Center, 203 Lothrop Street,
Suite 834, Pittsburgh, PA 15213; [email protected]
Supported in part by National Institutes of Health contracts R01-EY013178, R01-
EY011289, P30-EY008098 (Bethesda, MD); Eye and Ear Foundation (Pittsburgh, PA);
Research to Prevent Blindness (New York, NY).
IOVS Papers in Press. Published on December 3, 2013 as Manuscript iovs.13-13109
Copyright 2013 by The Association for Research in Vision and Ophthalmology, Inc.
2
Financial Disclosure: Dr. Wollstein is a consultant for Allergan. Drs. Kraus and
Hornegger receive royalties for intellectual property licensed by Massachusetts Institute
of Technology to Optovue. Dr. Fujimoto hold stock options in Optovue. Drs. Fujimoto
and Schuman receive royalties for intellectual property licensed by Massachusetts
Institute of Technology to Zeiss.
Word Count: 2252
Running Head: In-vivo assessment of 3D lamina cribrosa microarchitecture
3
Précis:
Using swept-source OCT we demonstrated in-vivo significant differences in the lamina
cribrosa microarchitecture between healthy and glaucomatous eyes. These changes
reflect beams remodeling and axonal loss leading to reduction in pore size and
increased pore size variability.
4
Abstract
Purpose: The lamina cribrosa (LC) is a prime location of glaucomatous damage. The
purpose of this study is to compare LC 3-dimensional microarchitecture between
healthy and glaucomatous eyes in-vivo using optical coherence tomography (OCT).
Methods: Sixty-eight eyes (19 healthy and 49 glaucomatous) from 47 subjects were
scanned in a 3.5x3.5x3.64mm volume (400x400x896 pixels) at the optic nerve head
using swept-source OCT. The LC microarchitecture parameters were measured on the
visible LC by an automated segmentation algorithm. The LC parameters were
compared to diagnosis and visual field mean deviation (MD) using a linear mixed effects
model accounting for age.
Results: The average VF MD for the healthy and glaucomatous eyes was -0.50±0.80
dB and -7.84±8.75 dB, respectively. Beam thickness to pore diameter ratio (p= 0.04)
and pore diameter standard deviation (p<0.01) were increased in glaucomatous eyes.
With worse MD, beam thickness-pore diameter ratio (p< 0.01), pore diameter standard
deviation (p=0.05) and beam thickness (p< 0.01) showed a statistically significant
increase while pore diameter (p=0.02) showed a significant decrease. There were no
significant interactions between any of the parameters and age (all p > 0.05).
Conclusion: Glaucomatous microarchitecture changes in the LC, detected by OCT
analysis, reflect beams remodeling and axonal loss leading to reduction in pore size and
increased pore size variability.
5
Introduction
Glaucoma is an optic neuropathy that is the second leading cause of blindness
worldwide.1 A leading target for glaucomatous damage is the lamina cribrosa (LC), a
meshwork of collagen fibers through which all retinal axons pass. Previous ex-vivo
histological studies on the LC reported regional differences in areas associated with
glaucomatous damage.2–4 The authors noted compression of the LC,2 decreased pore
size3 and elongation of pores4 in glaucomatous eyes.
Recently, optical coherence tomography (OCT) has been used for in-vivo imaging of the
LC.5 Advances in OCT technology, including deeper signal penetration and increased
scanning speeds,6 allow in-vivo 3-dimensional (3D) imaging of LC at an unprecedented
level of detail; the technology enables visualization of LC microarchitecture such as
individual beams and pores.
However, current studies looking at in-vivo LC changes in glaucoma using OCT have
been primarily limited to analyzing macroarchitecture features. Researchers
investigated features such as insertion points,7 anterior surface defects,8,9 and lamina
thickness.10 However, the 3D microarchitecture of the lamina, the collagenous support
structure and the axons passing through them have not been analyzed in-vivo. Because
the ganglion cell axons are passing through the entire thickness of the LC on their way
to the brain, a thorough assessment of the LC for glaucoma evaluation should consider
the LC in its entirety. Therefore, the purpose of this study was to examine in-vivo the 3D
microarchitecture features of the LC in healthy and glaucoma eyes using OCT.
6
Methods
The study was conducted in accordance with the tenets of the Declaration of Helsinki
and the Health Insurance Portability and Accountability Act. The institutional review
board of the University of Pittsburgh approved the study. Written informed consent was
given by all subjects before participation.
Subjects
Sixty-eight eyes (19 healthy and 49 glaucomatous) of 47 subjects underwent a
comprehensive ophthalmic examination of the anterior and posterior segments,
intraocular pressure measurement, Swedish interactive thresholding algorithm 24-2
standard perimetry (Humphrey Field Analyzer, Zeiss, Dublin, CA) and scanning by a
swept-source (SS-) OCT device, all performed in the same visit. Exclusion criteria for
the study were subjects with non-glaucomatous ocular diseases, neurological and non-
glaucomatous causes for visual field damage, and intraocular surgery other than non-
complicated cataract or glaucoma surgery. Healthy eyes were characterized as having
normal appearance of the ONH and RNFL, full visual fields without any previous history
of retinal diseases or glaucoma. Glaucomatous eyes were classified based on clinical
examination findings characteristics for glaucoma (ONH abnormality - global rim
thinning, rim notch, or disc hemorrhage; RNFL defect) accompanied with typical visual
field loss (reproducible glaucoma hemifield test outside normal limits). If both eyes were
eligible, they were included in the appropriate category.
Image Acquisition

7
The SS-OCT device used in this study has a 100,000 A-scan/sec scanning rate, a light
source centered at 1050nm and a 5μm axial resolution. This system was previously
described in details.11 All eyes were scanned in a 3.5x3.5x3.64 mm volume
(400x400x896 pixels) centered on the optic nerve head. Two pairs of orthogonally
oriented scan volume (horizontal and vertical orientation raster scans) were obtained for
each eye at a rapid succession; each pair’s acquisition lasted approximately 2 seconds.
Image Processing
The two orthogonal scan volumes were registered to eliminate motion artifacts.12 The
LC was automatically segmented using a previously described custom built software13
using the open-source image processing FIJI software (http://fiji.sc/Fiji).14 A number of
LC parameters were automatically measured within the entire visible LC (Table 1). The
maximum LC volume over which beams and pores could be clearly seen was
delineated and was subject to automatic segmentation using adaptive local thresholding.
Pore count, pore area, pore aspect ratio (ratio of the major and minor axis) were
computed using FIJI and averaged across all C-mode slices in the 3D volume. Lamina
volume was computed as the entire volume of the visible lamina and lamina area
represents the maximum intensity projection of the volume in the A-scan direction.
Lamina volume fraction was computed by finding the ratio of lamina beam volume to
total lamina volume. Pore area and aspect ratio were computed as their average from
all C-mode scans of the LC. Pore diameter and beam thickness measurements were
computed as the diameter of the largest sphere that fits within the desired structure at a
given point, serving as true 3D parameters.15
8
Statistical Analysis
For a subset of eyes (n = 39) with repeated scans, a repeatability study was performed.
Each scan was automatically segmented and analyzed using the method previously
described. Repeatability determined by computing the imprecision standard deviation
between the measurements from the two different scans. The adjusted imprecision
standard deviation was determined by normalizing the imprecision to the measurement
average.
Linear mixed effects models were constructed to assess the effect of age, clinical
diagnostic group and disease severity, using visual field mean deviation (VF MD) as a
surrogate indicator, with the LC parameters. Statistical analysis was performed using R
Language and Environment for Statistical Computing program (version 2.15.1;
http://www.R-project.org).16 P-values < 0.05 were considered statistically significant.
9
Results
The average age of healthy and glaucoma subjects were 40.9±11.3 and 70.9±9.4 years,
respectively. Average VF MD was -0.50±0.80dB for healthy eyes and -7.84±8.75dB for
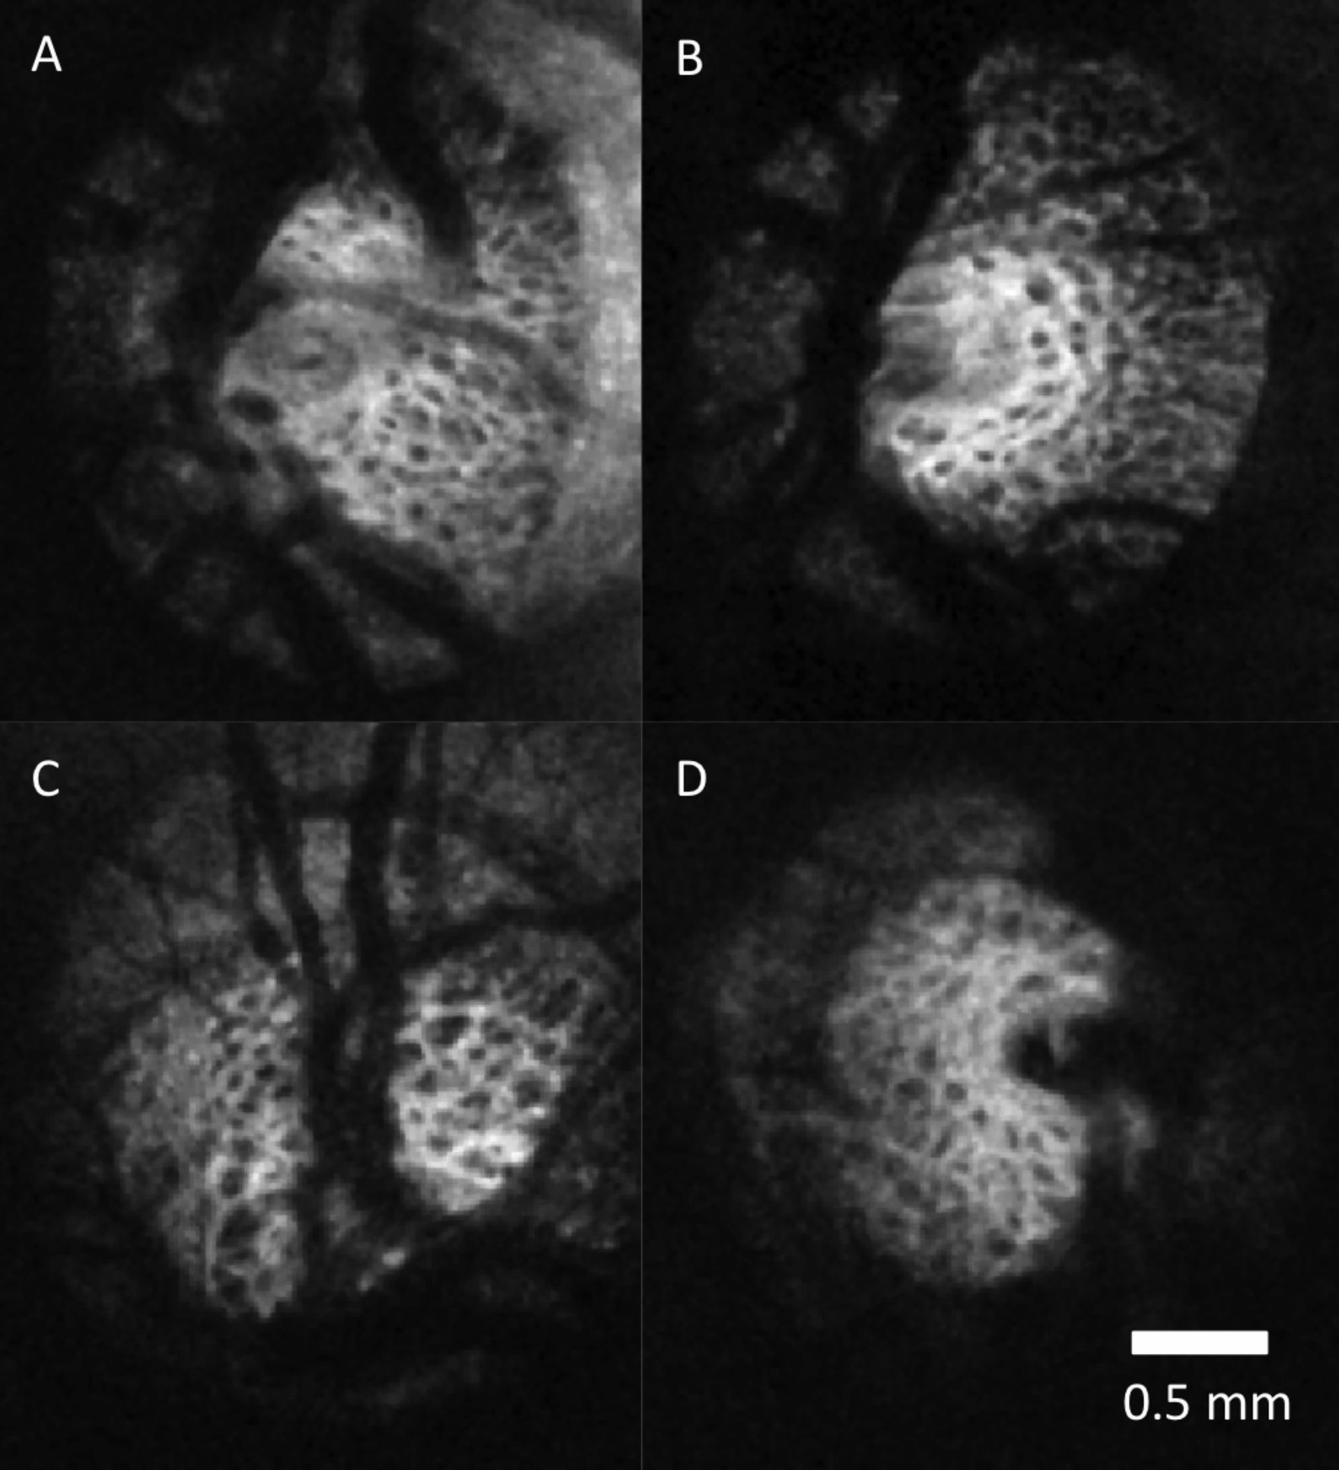
glaucomatous eyes. A sample of C-mode slices through the LC of healthy and
glaucomatous eyes are shown in Figure 1. Differences in LC microarchitecture between
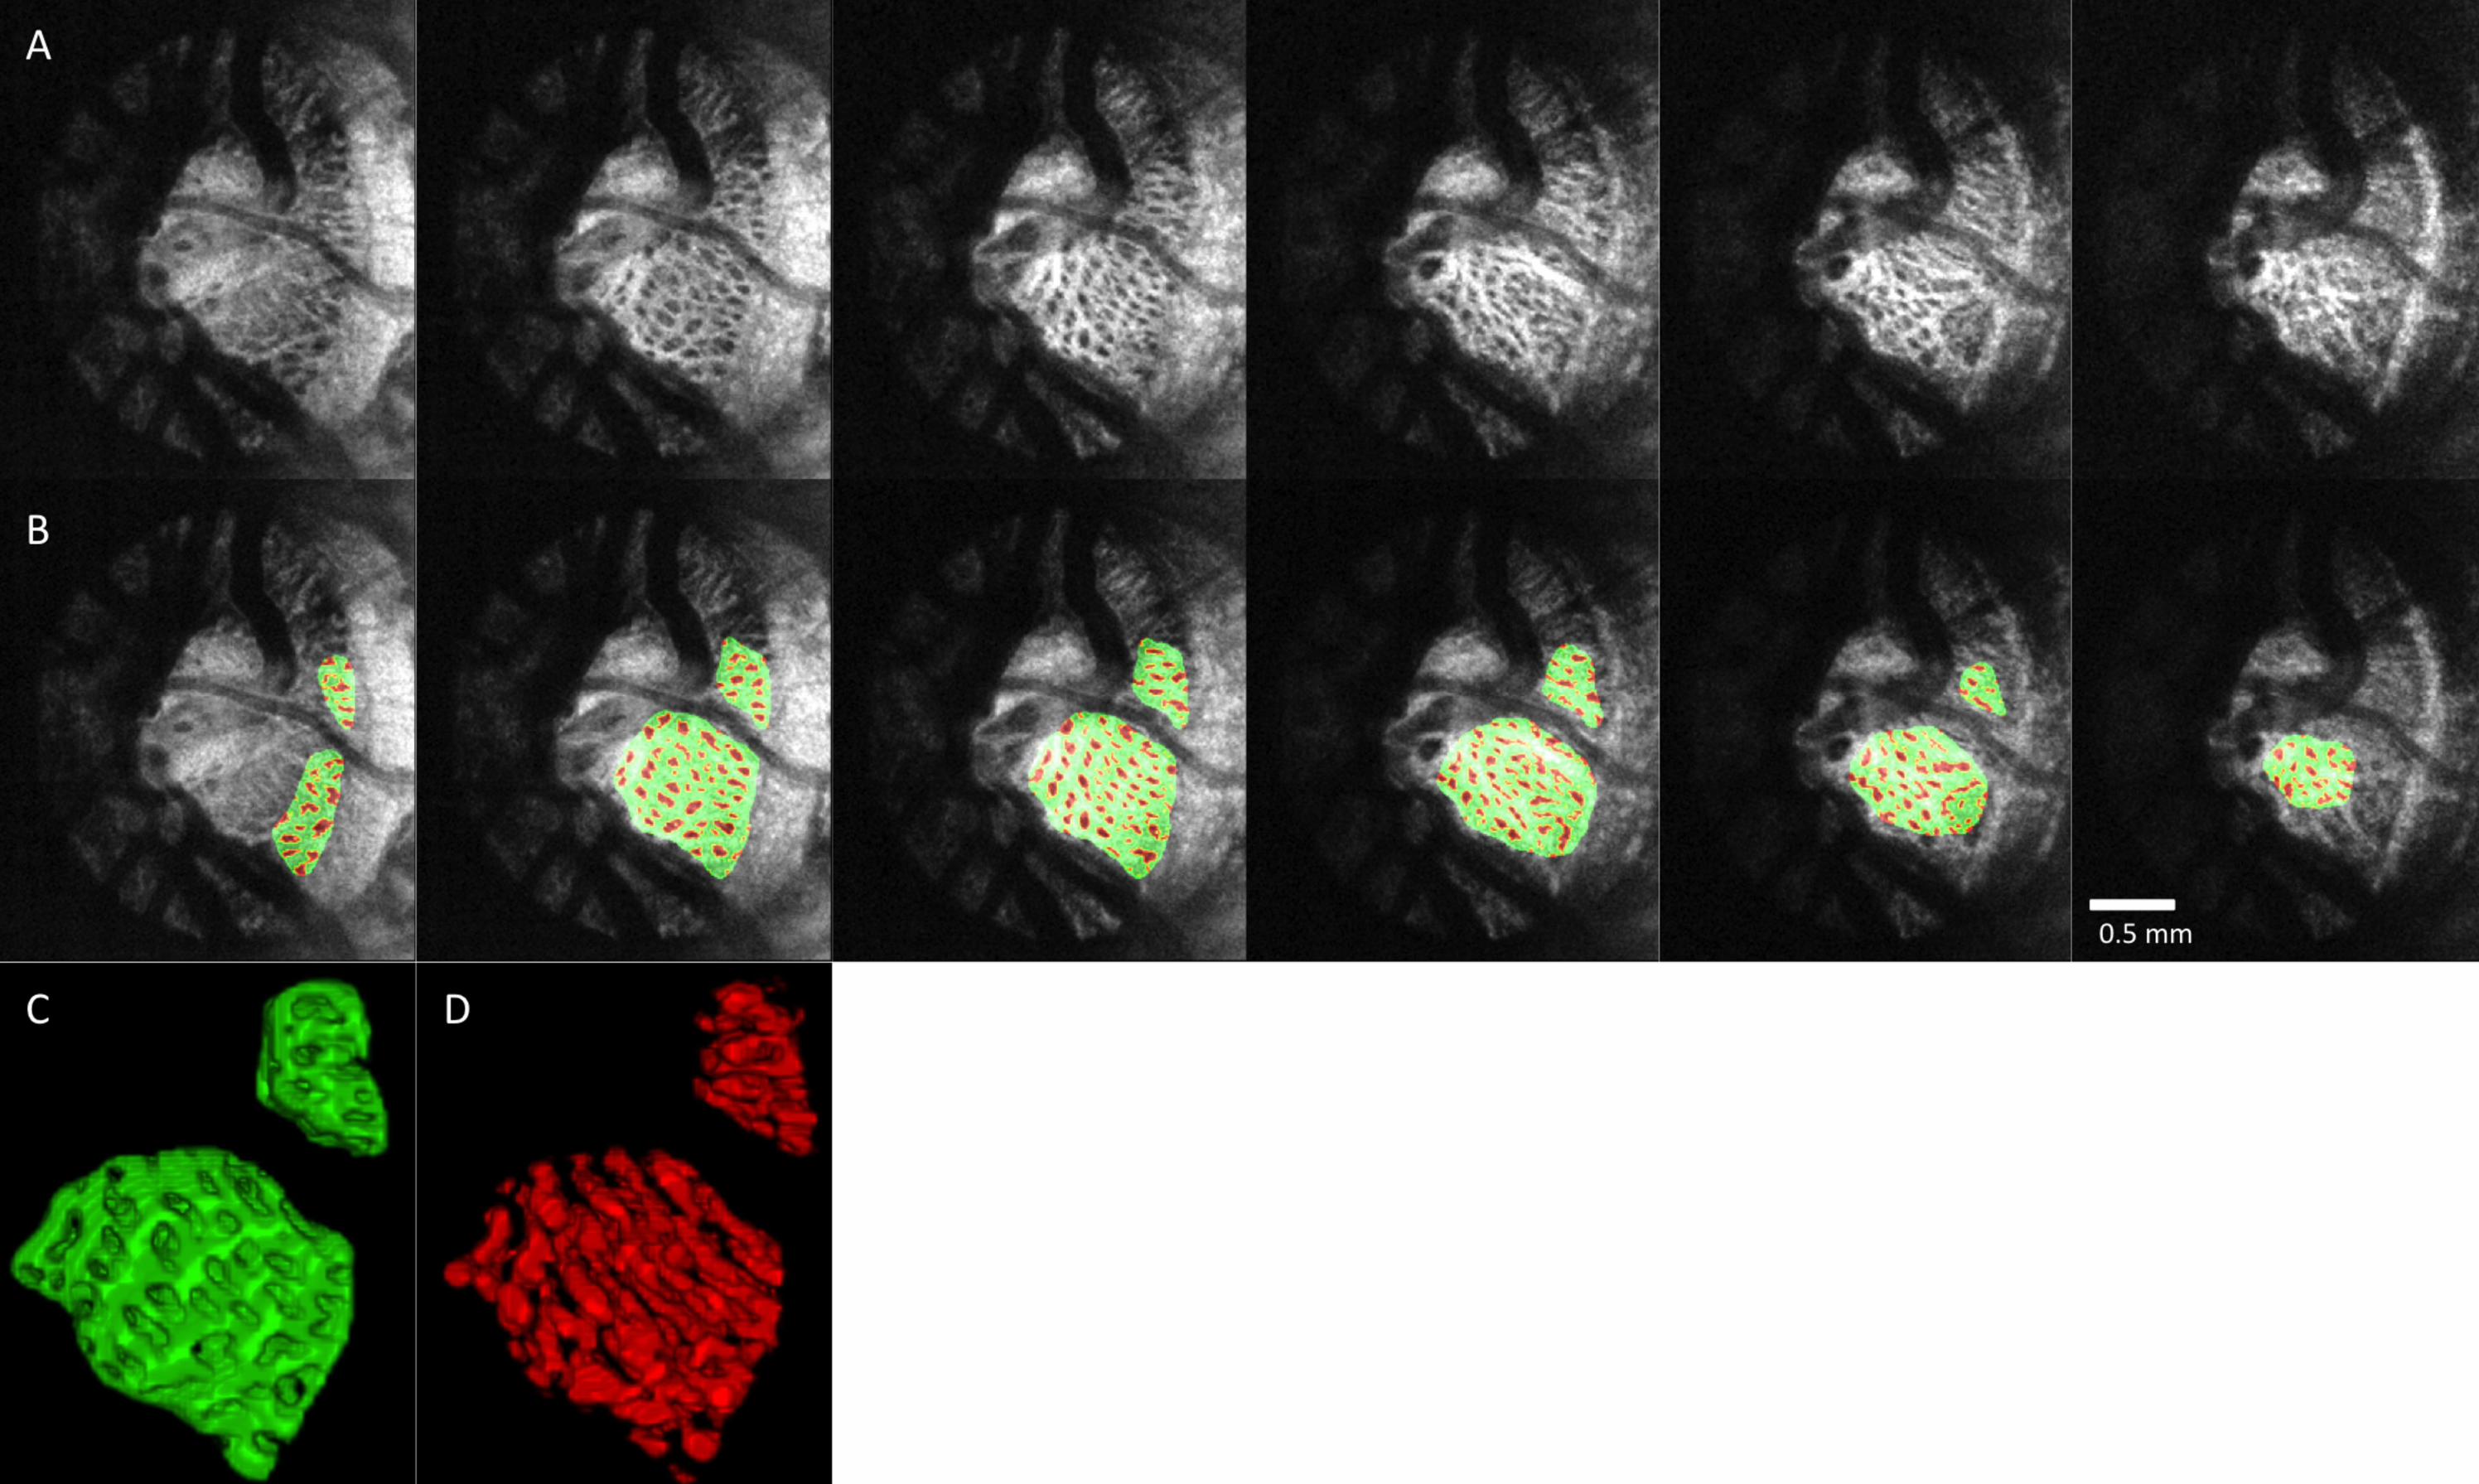
glaucomatous and healthy eyes are not subjectively obvious. An example of a
processed image of the LC in multiple levels of C-modes is shown in Figure 2 to
illustrate the performance of the segmentation analysis.
The automated segmentation demonstrated high reproducibility. The relative
imprecision varied from 1.8% (pore diameter, pore aspect ratio, beam thickness to pore
diameter ratio) to 4.17% (beam thickness SD). The only exception was pore count,
which had a relative imprecision of 11.4%.
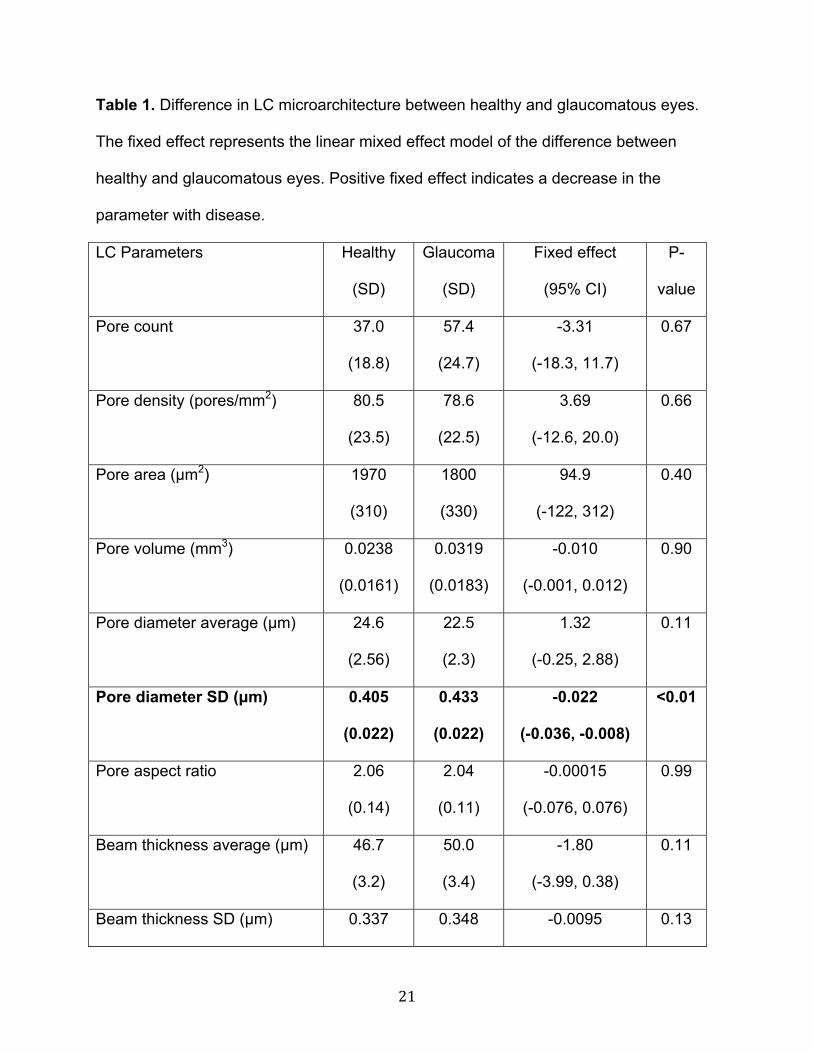
None of the LC microarchitecture parameters showed statistically significant association
with age. Comparing the LC microarchitecture parameters between healthy and
glaucomatous eyes, only beam thickness to pore diameter ratio and pore diameter
standard deviation were statistically significantly higher in glaucomatous eyes (Table 1).
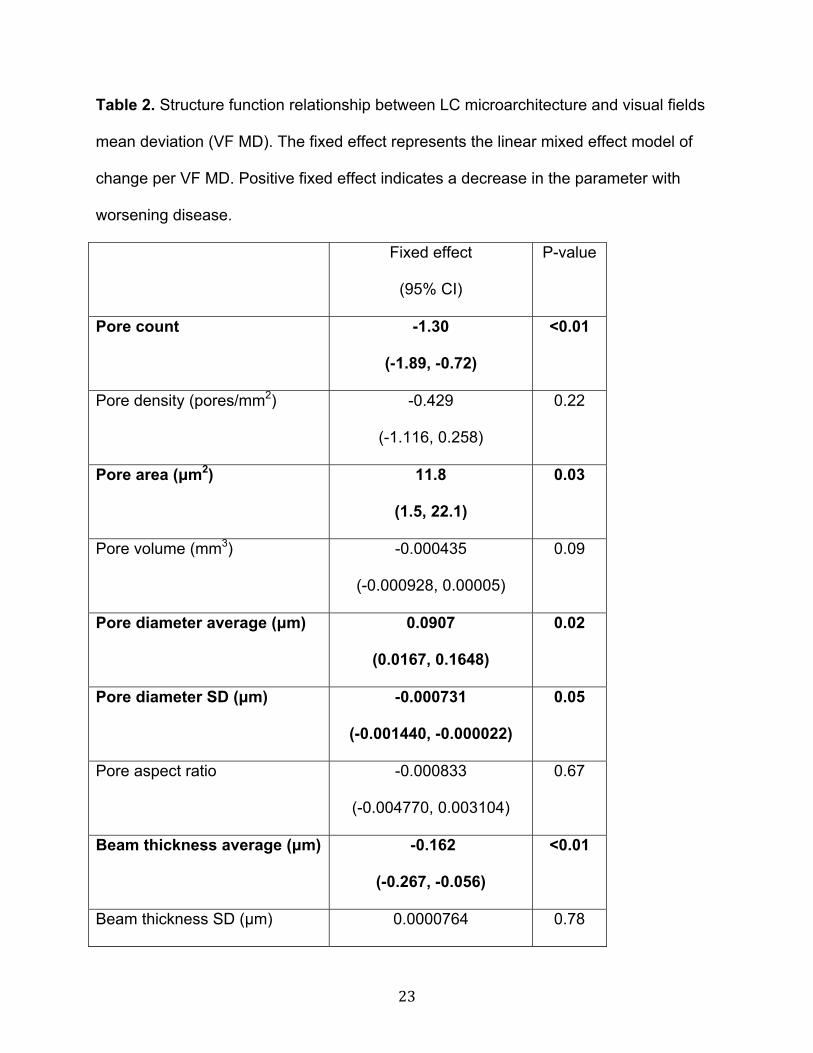
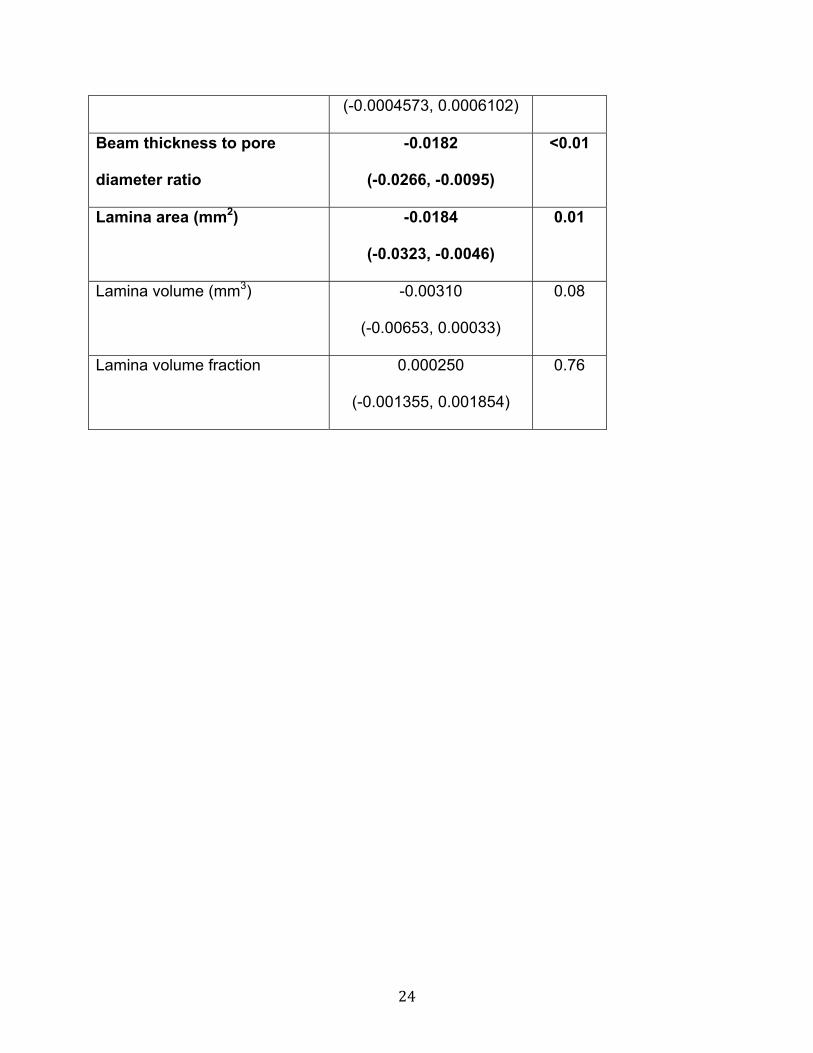
However, examining the LC microarchitecture as a function of VF MD demonstrated
significant relationship for several parameters (Table 2). Average beam thickness, pore
diameter SD and beam thickness to pore diameter ratio increased with worsening VF
MD. Average pore diameter decreased with worsening VF MD.
10
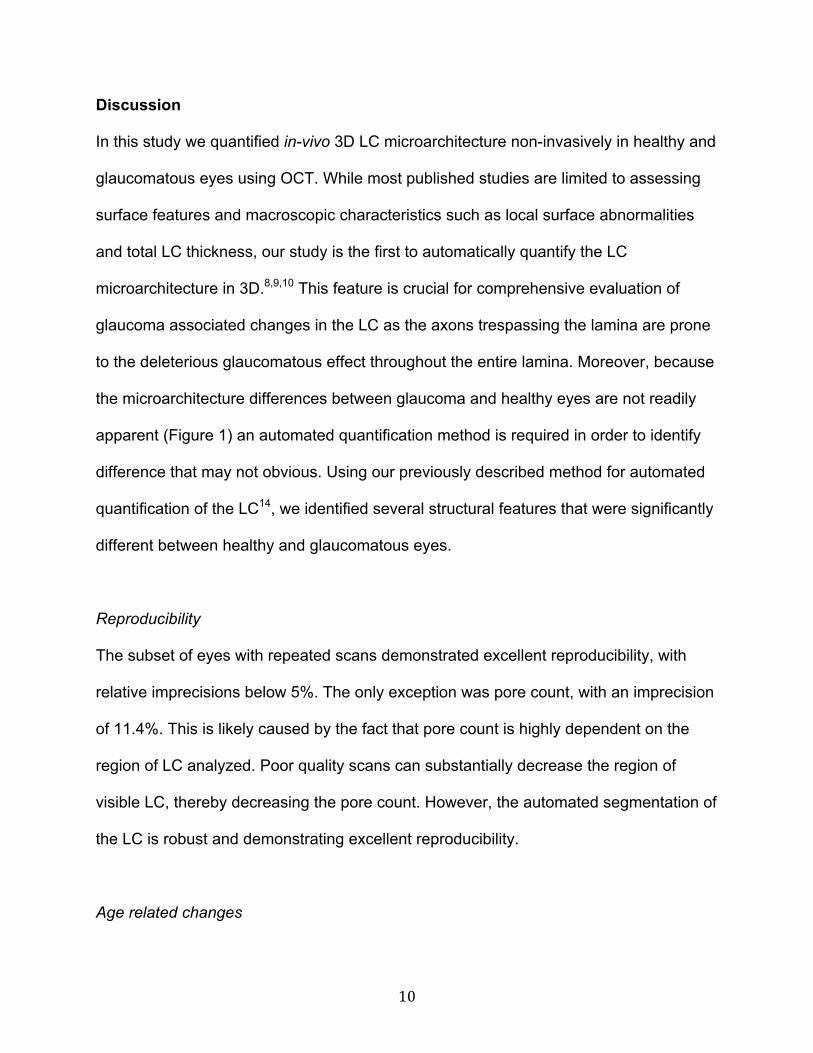
Discussion
In this study we quantified in-vivo 3D LC microarchitecture non-invasively in healthy and
glaucomatous eyes using OCT. While most published studies are limited to assessing
surface features and macroscopic characteristics such as local surface abnormalities
and total LC thickness, our study is the first to automatically quantify the LC
microarchitecture in 3D.8,9,10 This feature is crucial for comprehensive evaluation of
glaucoma associated changes in the LC as the axons trespassing the lamina are prone
to the deleterious glaucomatous effect throughout the entire lamina. Moreover, because
the microarchitecture differences between glaucoma and healthy eyes are not readily
apparent (Figure 1) an automated quantification method is required in order to identify
difference that may not obvious. Using our previously described method for automated
quantification of the LC14, we identified several structural features that were significantly
different between healthy and glaucomatous eyes.
Reproducibility
The subset of eyes with repeated scans demonstrated excellent reproducibility, with
relative imprecisions below 5%. The only exception was pore count, with an imprecision
of 11.4%. This is likely caused by the fact that pore count is highly dependent on the
region of LC analyzed. Poor quality scans can substantially decrease the region of
visible LC, thereby decreasing the pore count. However, the automated segmentation of
the LC is robust and demonstrating excellent reproducibility.
Age related changes

11
No LC microarchitecture parameters reached significance with respect to age. This is in
agreement from prior histology and imaging work showing that although the LC stiffens
with age17 and increases in total thickness,18 the microarchitecture are not significantly
altered.19 Detecting age related changes may require a larger cohort of healthy eyes.
Comparing Healthy and Glaucomatous Eyes
Our data showed an association between certain LC microarchitecture and glaucoma
diagnosis (Table 1). We demonstrated a significant increase in beam thickness to pore
diameter ratio in glaucoma compared to healthy eyes. While these results do not show
causation, the results may represent LC remodeling due to the elevated intraocular
pressure, creating thicker laminar beams to distribute the increased stress. Axonal loss
as well as remodeling would contribute to smaller LC pores, creating a change in beam
thickness to pore diameter ratio with disease. We also observed a significant increase in
pore diameter standard deviation in glaucomatous eyes. This may represent focal
damage in glaucoma causing some pores to drastically lose diameter, thus increasing
the variability in pore diameter.
In our study, we did not detect a difference in pore aspect ratio between healthy and
glaucoma subjects. Previous studies reported slanted pores with increased pore aspect
ratio in glaucomatous eyes as assessed by fundus photography.3 However, fundus
photography only represents a projection image; photographs are generated as the sum
of all reflections along the axis of the detector. Therefore, fundus photography is not
taking into account the 3D nature of the lamina. Pores traveling in a diverging or
12
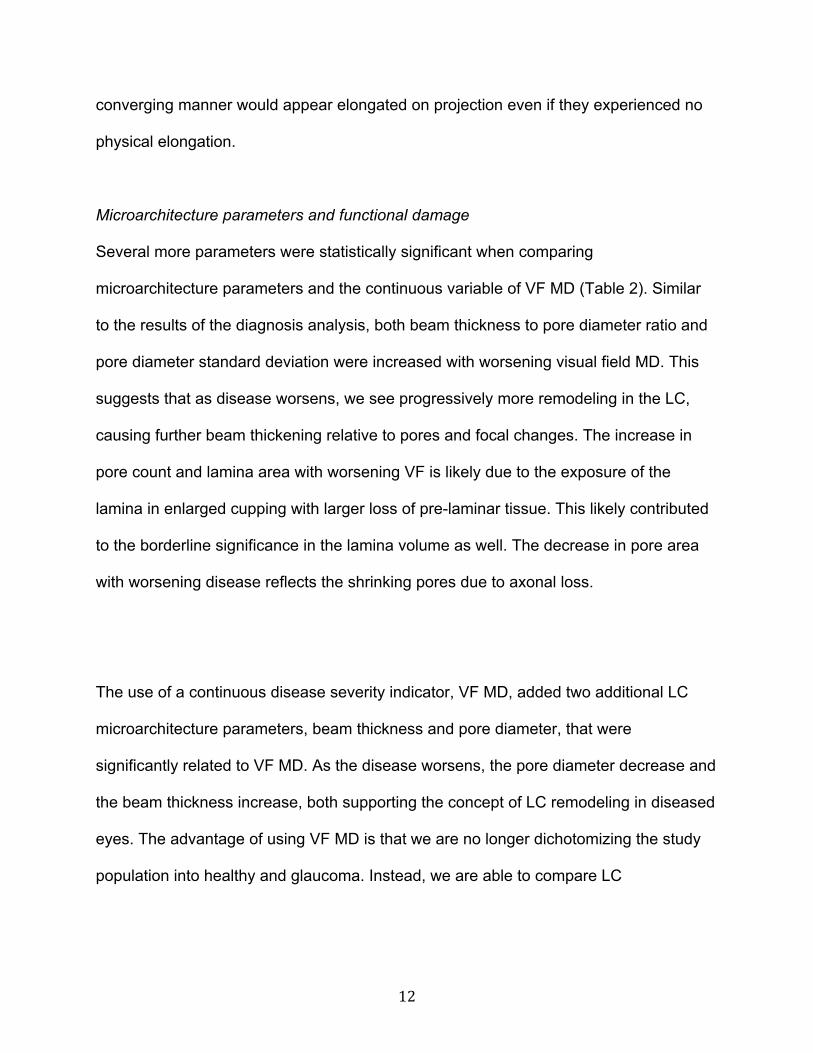
converging manner would appear elongated on projection even if they experienced no
physical elongation.
Microarchitecture parameters and functional damage
Several more parameters were statistically significant when comparing
microarchitecture parameters and the continuous variable of VF MD (Table 2). Similar
to the results of the diagnosis analysis, both beam thickness to pore diameter ratio and
pore diameter standard deviation were increased with worsening visual field MD. This
suggests that as disease worsens, we see progressively more remodeling in the LC,
causing further beam thickening relative to pores and focal changes. The increase in
pore count and lamina area with worsening VF is likely due to the exposure of the
lamina in enlarged cupping with larger loss of pre-laminar tissue. This likely contributed
to the borderline significance in the lamina volume as well. The decrease in pore area
with worsening disease reflects the shrinking pores due to axonal loss.
The use of a continuous disease severity indicator, VF MD, added two additional LC
microarchitecture parameters, beam thickness and pore diameter, that were
significantly related to VF MD. As the disease worsens, the pore diameter decrease and
the beam thickness increase, both supporting the concept of LC remodeling in diseased
eyes. The advantage of using VF MD is that we are no longer dichotomizing the study
population into healthy and glaucoma. Instead, we are able to compare LC
13
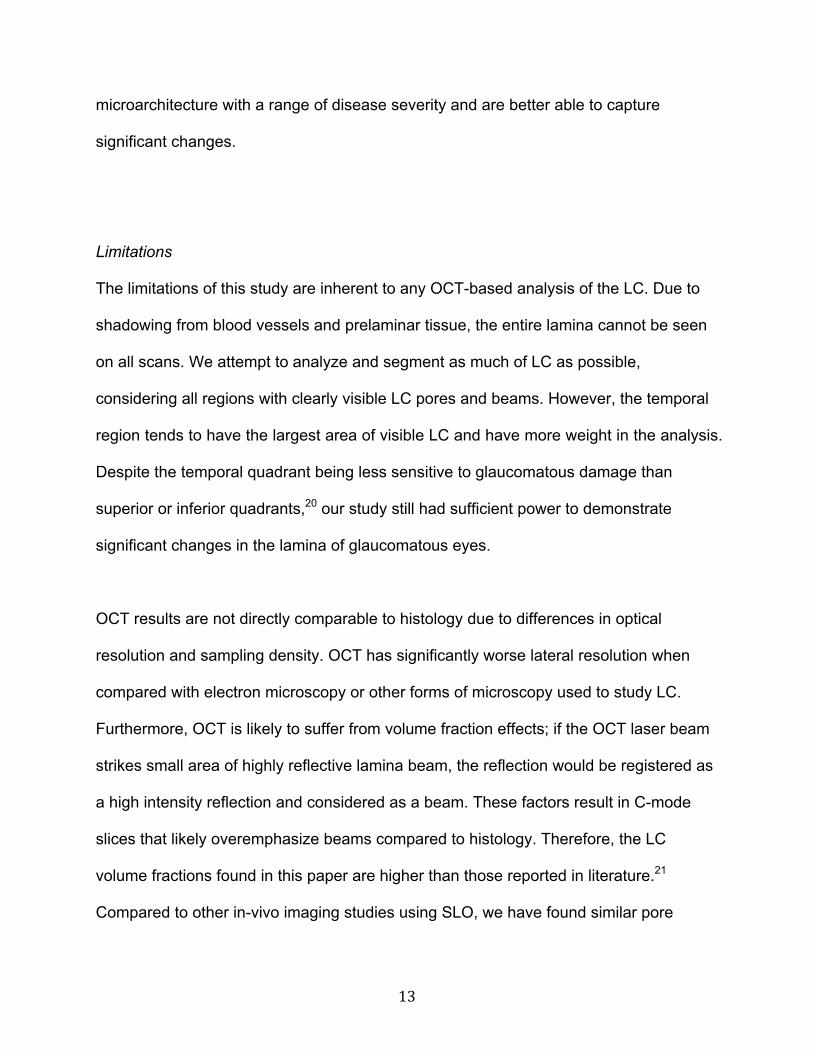
microarchitecture with a range of disease severity and are better able to capture
significant changes.
Limitations
The limitations of this study are inherent to any OCT-based analysis of the LC. Due to
shadowing from blood vessels and prelaminar tissue, the entire lamina cannot be seen
on all scans. We attempt to analyze and segment as much of LC as possible,
considering all regions with clearly visible LC pores and beams. However, the temporal
region tends to have the largest area of visible LC and have more weight in the analysis.
Despite the temporal quadrant being less sensitive to glaucomatous damage than
superior or inferior quadrants,20 our study still had sufficient power to demonstrate
significant changes in the lamina of glaucomatous eyes.
OCT results are not directly comparable to histology due to differences in optical
resolution and sampling density. OCT has significantly worse lateral resolution when
compared with electron microscopy or other forms of microscopy used to study LC.
Furthermore, OCT is likely to suffer from volume fraction effects; if the OCT laser beam
strikes small area of highly reflective lamina beam, the reflection would be registered as
a high intensity reflection and considered as a beam. These factors result in C-mode
slices that likely overemphasize beams compared to histology. Therefore, the LC
volume fractions found in this paper are higher than those reported in literature.21
Compared to other in-vivo imaging studies using SLO, we have found similar pore
14
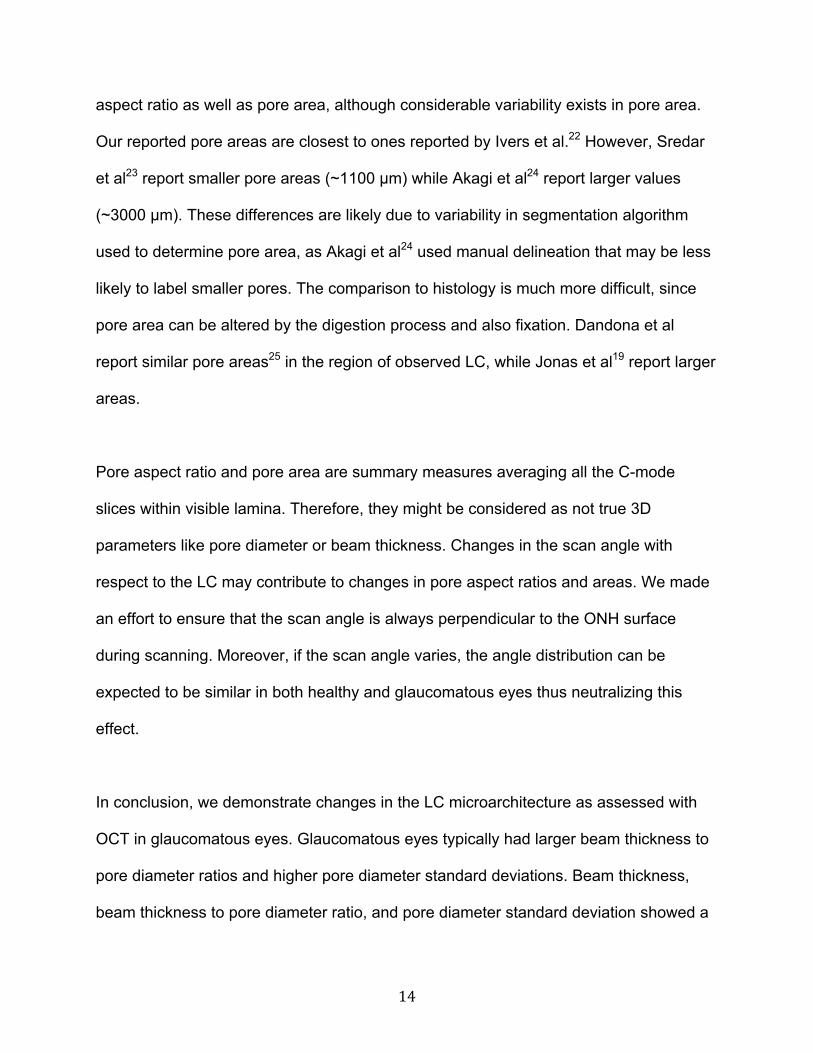
aspect ratio as well as pore area, although considerable variability exists in pore area.
Our reported pore areas are closest to ones reported by Ivers et al.22 However, Sredar
et al23 report smaller pore areas (~1100 μm) while Akagi et al24 report larger values
(~3000 μm). These differences are likely due to variability in segmentation algorithm
used to determine pore area, as Akagi et al24 used manual delineation that may be less
likely to label smaller pores. The comparison to histology is much more difficult, since
pore area can be altered by the digestion process and also fixation. Dandona et al
report similar pore areas25 in the region of observed LC, while Jonas et al19 report larger
areas.
Pore aspect ratio and pore area are summary measures averaging all the C-mode
slices within visible lamina. Therefore, they might be considered as not true 3D
parameters like pore diameter or beam thickness. Changes in the scan angle with
respect to the LC may contribute to changes in pore aspect ratios and areas. We made
an effort to ensure that the scan angle is always perpendicular to the ONH surface
during scanning. Moreover, if the scan angle varies, the angle distribution can be
expected to be similar in both healthy and glaucomatous eyes thus neutralizing this
effect.
In conclusion, we demonstrate changes in the LC microarchitecture as assessed with
OCT in glaucomatous eyes. Glaucomatous eyes typically had larger beam thickness to
pore diameter ratios and higher pore diameter standard deviations. Beam thickness,
beam thickness to pore diameter ratio, and pore diameter standard deviation showed a
15
statistically significant increase with worsening VF MD. Meanwhile, pore diameter
decreased with worsening VF MD. These changes may represent LC remodeling and
axonal loss due to glaucomatous damage.
16
References
1. Quigley HA, Broman AT. The number of people with glaucoma worldwide in 2010
and 2020. Br J Ophthalmol. 2006;90:262–267.
2. Quigley HA, Hohman RM, Addicks EM, Massof RW, Green WR. Morphologic
changes in the lamina cribrosa correlated with neural loss in open-angle glaucoma.
Am J Ophthalmol. 1983;95:673.
3. Tezel G, Trinkaus K, Wax MB. Alterations in the morphology of lamina cribrosa
pores in glaucomatous eyes. Br J Ophthalmol. 2004;88:251–256.
4. Fontana L, Bhandari A, Fitzke FW, Hitchings RA. In vivo morphometry of the
lamina cribrosa and its relation to visual field loss in glaucoma. Curr Eye Res.
1998;17:363–369.
5. Kagemann L, Ishikawa H, Wollstein G, et al. Ultrahigh-resolution Spectral Domain
Optical Coherence Tomography Imaging of the Lamina Cribrosa. Ophthalmic Surg
Lasers Imaging Off J Int Soc Imaging Eye. 2008;39:S126–S131.
6. Choma MA, Sarunic MV, Yang C, Izatt JA. Sensitivity advantage of swept source
and Fourier domain optical coherence tomography. Opt Express. 2003.
7. Crawford Downs J, Roberts MD, Sigal IA. Glaucomatous cupping of the lamina
cribrosa: A review of the evidence for active progressive remodeling as a
mechanism. Exp Eye Res. 2011;93:133–140.
17
8. Inoue R, Hangai M, Kotera Y, et al. Three-dimensional High-speed Optical
Coherence Tomography Imaging of Lamina Cribrosa in Glaucoma. Ophthalmology.
2009;116:214–222.
9. Lee EJ, Kim T-W, Weinreb RN, et al. Three-Dimensional Evaluation of the Lamina
Cribrosa Using Spectral-Domain Optical Coherence Tomography in Glaucoma.
Invest Ophthalmol Vis Sci. 2012;53:198–204.
10. Park H-YL, Jeon SH, Park CK. Enhanced Depth Imaging Detects Lamina Cribrosa
Thickness Differences in Normal Tension Glaucoma and Primary Open-Angle
Glaucoma. Ophthalmology. 2012;119:10–20.
11. Potsaid B, Baumann B, Huang D, et al. Ultrahigh speed 1050nm swept
source/Fourier domain OCT retinal and anterior segment imaging at 100,000 to
400,000 axial scans per second. Opt Express. 2010;18:20029–20048.
12. Kraus MF, Potsaid B, Mayer MA, et al. Motion correction in optical coherence
tomography volumes on a per A-scan basis using orthogonal scan patterns.
Biomed Opt Express. 2012;3:1182.
13. Nadler Z, Wang B, Wollstein G, et al. Automated lamina cribrosa microstructural
segmentation in optical coherence tomography scans of healthy and glaucomatous
eyes. Biomed Opt Express. 2013. (In Press)
14. Schindelin J, Arganda-Carreras I, Frise E, et al. Fiji: an open-source platform for
biological-image analysis. Nat Methods. 2012;9:676–682.

18
15. Hildebrand T, Rüegsegger P. A new method for the model-independent
assessment of thickness in three-dimensional images. J Microsc. 1997;185:67–75.
16. Team RdC. R: A language and environment for statistical computing. R Found Stat
Comput. 2008.
17. Albon J, Purslow PP, Karwatowski WSS, Easty DL. Age Related Compliance of the
Lamina Cribrosa in Human Eyes. Br J Ophthalmol. 2000;84:318–323.
18. Kotecha A, Izadi S, Jeffery G. Age-related changes in the thickness of the human
lamina cribrosa. Br J Ophthalmol. 2006;90:1531–1534.
19. Jonas JB, Mardin CY, Schlötzer-Schrehardt U, Naumann GO. Morphometry of the
human lamina cribrosa surface. Invest Ophthalmol Vis Sci. 1991;32:401–405.
20. Bowd C, Zangwill LM, Berry CC, et al. Detecting Early Glaucoma by Assessment of
Retinal Nerve Fiber Layer Thickness and Visual Function. Invest Ophthalmol Vis
Sci. 2001;42:1993–2003.
21. Roberts MD, Grau V, Grimm J, et al. Remodeling of the Connective Tissue
Microarchitecture of the Lamina Cribrosa in Early Experimental Glaucoma. Invest
Ophthalmol Vis Sci. 2009;50:681–690.
22. Ivers KM, Li C, Patel N, et al. Reproducibility of Measuring Lamina Cribrosa Pore
Geometry in Human and Nonhuman Primates with In Vivo Adaptive Optics Imaging.
Invest Ophthalmol Vis Sci. 2011;52:5473–5480.
19
23. Sredar N, Ivers KM, Queener HM, Zouridakis G, Porter J. 3D modeling to
characterize lamina cribrosa surface and pore geometries using in vivo images
from normal and glaucomatous eyes. Biomed Opt Express. 2013;4:1153–1165.
24. Akagi T, Hangai M, Takayama K, Nonaka A, Ooto S, Yoshimura N. In Vivo Imaging
of Lamina Cribrosa Pores by Adaptive Optics Scanning Laser Ophthalmoscopy.
Invest Ophthalmol Vis Sci. 2012;53:4111–4119.
25. Dandona L, Quigley HA, Brown AE, Enger C. Quantitative regional structure of the
normal human lamina cribrosa: A racial comparison. Arch Ophthalmol.
1990;108:393–398.
20
Figure Legends
Figure 1. Lamina cribrosa C-mode of healthy (A-B) and glaucomatous (C-D) eyes. No
systematic differences are subjectively apparent between healthy and glaucomatous
eyes.
Figure 2. Segmentation examples. (A) C-mode stacks of the LC of a glaucoma subject
stepping down 50 μm slices. (B) The same slices after segmentation with laminar
beams in green and laminar pores in red. 3D reconstruction of the LC (C) beams and
(D) pores.
21
Table 1. Difference in LC microarchitecture between healthy and glaucomatous eyes.
The fixed effect represents the linear mixed effect model of the difference between
healthy and glaucomatous eyes. Positive fixed effect indicates a decrease in the
parameter with disease. LC Parameters Healthy
(SD)
Glaucoma
(SD)
Fixed effect
(95% CI)
P-
value
Pore count 37.0
(18.8)
57.4
(24.7)
-3.31
(-18.3, 11.7)
0.67
Pore density (pores/mm2) 80.5
(23.5)
78.6
(22.5)
3.69
(-12.6, 20.0)
0.66
Pore area (μm2) 1970
(310)
1800
(330)
94.9
(-122, 312)
0.40
Pore volume (mm3) 0.0238
(0.0161)
0.0319
(0.0183)
-0.010
(-0.001, 0.012)
0.90
Pore diameter average (μm) 24.6
(2.56)
22.5
(2.3)
1.32
(-0.25, 2.88)
0.11
Pore diameter SD (μm) 0.405
(0.022)
0.433
(0.022)
-0.022
(-0.036, -0.008)
<0.01
Pore aspect ratio 2.06
(0.14)
2.04
(0.11)
-0.00015
(-0.076, 0.076)
0.99
Beam thickness average (μm) 46.7
(3.2)
50.0
(3.4)
-1.80
(-3.99, 0.38)
0.11
Beam thickness SD (μm) 0.337 0.348 -0.0095 0.13

22
(0.013) (0.017) (-0.022, 0.0025)
Beam thickness to pore
diameter ratio
1.91
(0.21)
2.25
(0.31)
-0.20
(-0.38, -0.019)
0.04
Lamina area (mm2) 0.684
(0.284)
1.220
(0.54)
-0.53
(-0.20, 0.13)
0.24
Lamina volume (mm3) 0.147
(0.071)
0.235
(0.124)
-0.098
(-0.023, 0.051)
0.54
Lamina volume fraction 0.159
(0.055)
0.143
(0.050)
0.0109
(-0.0256, 0.0474)
0.56
23
Table 2. Structure function relationship between LC microarchitecture and visual fields
mean deviation (VF MD). The fixed effect represents the linear mixed effect model of
change per VF MD. Positive fixed effect indicates a decrease in the parameter with
worsening disease.
Fixed effect
(95% CI)
P-value
Pore count -1.30
(-1.89, -0.72)
<0.01
Pore density (pores/mm2) -0.429
(-1.116, 0.258)
0.22
Pore area (μm2) 11.8
(1.5, 22.1)
0.03
Pore volume (mm3) -0.000435
(-0.000928, 0.00005)
0.09
Pore diameter average (μm) 0.0907
(0.0167, 0.1648)
0.02
Pore diameter SD (μm) -0.000731
(-0.001440, -0.000022)
0.05
Pore aspect ratio -0.000833
(-0.004770, 0.003104)
0.67
Beam thickness average (μm) -0.162
(-0.267, -0.056)
<0.01
Beam thickness SD (μm) 0.0000764 0.78
24
(-0.0004573, 0.0006102)
Beam thickness to pore
diameter ratio
-0.0182
(-0.0266, -0.0095)
<0.01
Lamina area (mm2) -0.0184
(-0.0323, -0.0046)
0.01
Lamina volume (mm3) -0.00310
(-0.00653, 0.00033)
0.08
Lamina volume fraction 0.000250
(-0.001355, 0.001854)
0.76