In-vivo investigation of the human cingulum bundle using the optimization of MR diffusion spectrum...
8
European Journal of Radiology 75 (2010) e29–e36 Contents lists available at ScienceDirect European Journal of Radiology journal homepage: www.elsevier.com/locate/ejrad In-vivo investigation of the human cingulum bundle using the optimization of MR diffusion spectrum imaging Marzieh Nezamzadeh a,b,∗ , Van J. Wedeen c , Ruopeng Wang c , Yu Zhang a,b , Wang Zhan a,b , Karl Young a,b , Dieter J. Meyerhoff a,b , Michael W. Weiner a,b , Norbert Schuff a,b a Center for Imaging of Neurodegenerative Diseases, CIND, Veterans Affairs Medical Center, San Francisco, CA, United States b Radiology, University of California San Francisco, San Francisco, United States c Radiology, Massachusetts Harvard General Hospital, Boston, United States article info Article history: Received 22 March 2009 Accepted 16 June 2009 Keywords: MR diffusion Diffusion spectrum imaging Optimization Cingulum bundle Alzheimer abstract Diffusion spectrum imaging (DSI) is a generalization of diffusion tensor imaging to map fibrous struc- ture of white matter and potentially very sensitive to alterations of the cingulum bundles in dementia. In this in-vivo 4T study, DSI parameters especially spatial resolution and diffusion encoding bandwidth were optimized on humans to segment the cingulum bundles for tract level measurements of diffusion. The careful tailoring of the DSI acquisitions in conjunction with fiber tracking provided an optimal DSI setting for a reliable quantification of the cingulum bundle tracts. The optimization of tracking the cin- gulum bundle was verified using fiber tract quantifications, including coefficients of variability of DSI measurements along the fibers between and within healthy subjects in back-to-back studies and vari- ogram analysis of spatial correlations between diffusion orientation distribution functions (ODF) along the cingulum bundle tracts. The results demonstrate that the identification of the cingulum bundle in human brain is reproducible using an optimized DSI parameter for maximum b-value and high spatial resolution of the DSI acquisition with a feasible acquisition time of whole brain in clinical practice. This optimized DSI setting should be useful for detecting alterations along the cingulum bundle in Alzheimer disease and related neurodegenerative disorders. Published by Elsevier Ireland Ltd 1. Introduction The cingulum bundle is the most prominent white matter (WM) fiber tract in the limbic system, a set of brain structures that include the hippocampus, amygdala, and thalamus that support a variety of cognitive functions [1]. It consists of three major fiber components, originating from thalamus, cingulate gyrus, and cortical associa- tion areas [1,2]. Since integrity of the cingulum bundle is central to memory, executive and emotional processing, it plays a crucial role in several neurologic conditions, including Alzheimer’s disease (AD) [3], schizophrenia [4,5], depression [6,7] and posttraumatic stress disorder (PTSD) [8–10]. Diffusion tensor imaging (DTI) is a MRI technique that measures the directional variability of random water motion. DTI can delin- eate WM structures based on the orientation information of axons [11–15] and there is considerable evidence that DTI also reflects the ultrastructural integrity of WM [13,14]. DTI studies reported ∗ Corresponding author at: Center for Imaging of Neurodegenerative Diseases, CIND, VA Medical Center, 4150 Clement Street, San Francisco, CA 94121, United States. Tel.: +1 415 221 4810/3811; fax: +1 415 668 2864. E-mail address: [email protected] (M. Nezamzadeh). abnormalities of the cingulum bundle in a variety of neurological conditions, most prominently in AD and mild cognitive impair- ment, a potentially pre-clinical condition of AD [16]. More recently, DTI studies reported alterations along the cingulum bundle also in psychiatric conditions, including schizophrenia [17–21] and PTSD. Together, these findings raise the possibility that diffusion mea- surements in the cingulum bundle could be useful for improved diagnosis, prognosis and assessment of treatment responses for these conditions. However, a fundamental limitation is that DTI is based on Gaussian parameterization of diffusion, which ignores diffusion heterogeneity within an image voxel. This limitation can lead to ambiguous results, especially in the presence of crossing and touching fiber bundles in a voxel, consequently diminishing the diagnostic value of DTI. Several methods have been developed to overcome the limita- tions of DTI. High angular resolution diffusion imaging (HARDI) [22] and q-ball imaging [23], for example, gain information by sampling the directional spread of the signal more densely in the reciprocal diffusion space (i.e. q-space). However, HARDI and q-ball imag- ing still require the parameterization of the diffusion probability [24,25]. Diffusion spectrum imaging (DSI) provides a further gener- alization by also sampling the probability distribution of the signal in reciprocal diffusion space, thus avoiding the need to parameter- 0720-048X/$ – see front matter. Published by Elsevier Ireland Ltd doi:10.1016/j.ejrad.2009.06.019
-
Upload
independent -
Category
Documents
-
view
5 -
download
0
Transcript of In-vivo investigation of the human cingulum bundle using the optimization of MR diffusion spectrum...
Io
MKa
b
c
a
ARA
KMDOCA
1
fitcotmi[d
te[t
CT
0d
European Journal of Radiology 75 (2010) e29–e36
Contents lists available at ScienceDirect
European Journal of Radiology
journa l homepage: www.e lsev ier .com/ locate /e j rad
n-vivo investigation of the human cingulum bundle using the optimizationf MR diffusion spectrum imaging
arzieh Nezamzadeha,b,∗, Van J. Wedeenc, Ruopeng Wangc, Yu Zhanga,b, Wang Zhana,b,arl Younga,b, Dieter J. Meyerhoffa,b, Michael W. Weinera,b, Norbert Schuffa,b
Center for Imaging of Neurodegenerative Diseases, CIND, Veterans Affairs Medical Center, San Francisco, CA, United StatesRadiology, University of California San Francisco, San Francisco, United StatesRadiology, Massachusetts Harvard General Hospital, Boston, United States
r t i c l e i n f o
rticle history:eceived 22 March 2009ccepted 16 June 2009
eywords:R diffusioniffusion spectrum imagingptimization
a b s t r a c t
Diffusion spectrum imaging (DSI) is a generalization of diffusion tensor imaging to map fibrous struc-ture of white matter and potentially very sensitive to alterations of the cingulum bundles in dementia.In this in-vivo 4T study, DSI parameters especially spatial resolution and diffusion encoding bandwidthwere optimized on humans to segment the cingulum bundles for tract level measurements of diffusion.The careful tailoring of the DSI acquisitions in conjunction with fiber tracking provided an optimal DSIsetting for a reliable quantification of the cingulum bundle tracts. The optimization of tracking the cin-gulum bundle was verified using fiber tract quantifications, including coefficients of variability of DSI
ingulum bundlelzheimer
measurements along the fibers between and within healthy subjects in back-to-back studies and vari-ogram analysis of spatial correlations between diffusion orientation distribution functions (ODF) alongthe cingulum bundle tracts. The results demonstrate that the identification of the cingulum bundle inhuman brain is reproducible using an optimized DSI parameter for maximum b-value and high spatialresolution of the DSI acquisition with a feasible acquisition time of whole brain in clinical practice. Thisoptimized DSI setting should be useful for detecting alterations along the cingulum bundle in Alzheimer
dege
disease and related neuro. Introduction
The cingulum bundle is the most prominent white matter (WM)ber tract in the limbic system, a set of brain structures that includehe hippocampus, amygdala, and thalamus that support a variety ofognitive functions [1]. It consists of three major fiber components,riginating from thalamus, cingulate gyrus, and cortical associa-ion areas [1,2]. Since integrity of the cingulum bundle is central to
emory, executive and emotional processing, it plays a crucial rolen several neurologic conditions, including Alzheimer’s disease (AD)3], schizophrenia [4,5], depression [6,7] and posttraumatic stressisorder (PTSD) [8–10].
Diffusion tensor imaging (DTI) is a MRI technique that measures
he directional variability of random water motion. DTI can delin-ate WM structures based on the orientation information of axons11–15] and there is considerable evidence that DTI also reflectshe ultrastructural integrity of WM [13,14]. DTI studies reported∗ Corresponding author at: Center for Imaging of Neurodegenerative Diseases,IND, VA Medical Center, 4150 Clement Street, San Francisco, CA 94121, United States.el.: +1 415 221 4810/3811; fax: +1 415 668 2864.
E-mail address: [email protected] (M. Nezamzadeh).
720-048X/$ – see front matter. Published by Elsevier Ireland Ltdoi:10.1016/j.ejrad.2009.06.019
nerative disorders.Published by Elsevier Ireland Ltd
abnormalities of the cingulum bundle in a variety of neurologicalconditions, most prominently in AD and mild cognitive impair-ment, a potentially pre-clinical condition of AD [16]. More recently,DTI studies reported alterations along the cingulum bundle also inpsychiatric conditions, including schizophrenia [17–21] and PTSD.Together, these findings raise the possibility that diffusion mea-surements in the cingulum bundle could be useful for improveddiagnosis, prognosis and assessment of treatment responses forthese conditions. However, a fundamental limitation is that DTIis based on Gaussian parameterization of diffusion, which ignoresdiffusion heterogeneity within an image voxel. This limitation canlead to ambiguous results, especially in the presence of crossingand touching fiber bundles in a voxel, consequently diminishingthe diagnostic value of DTI.
Several methods have been developed to overcome the limita-tions of DTI. High angular resolution diffusion imaging (HARDI) [22]and q-ball imaging [23], for example, gain information by samplingthe directional spread of the signal more densely in the reciprocal
diffusion space (i.e. q-space). However, HARDI and q-ball imag-ing still require the parameterization of the diffusion probability[24,25]. Diffusion spectrum imaging (DSI) provides a further gener-alization by also sampling the probability distribution of the signalin reciprocal diffusion space, thus avoiding the need to parameter-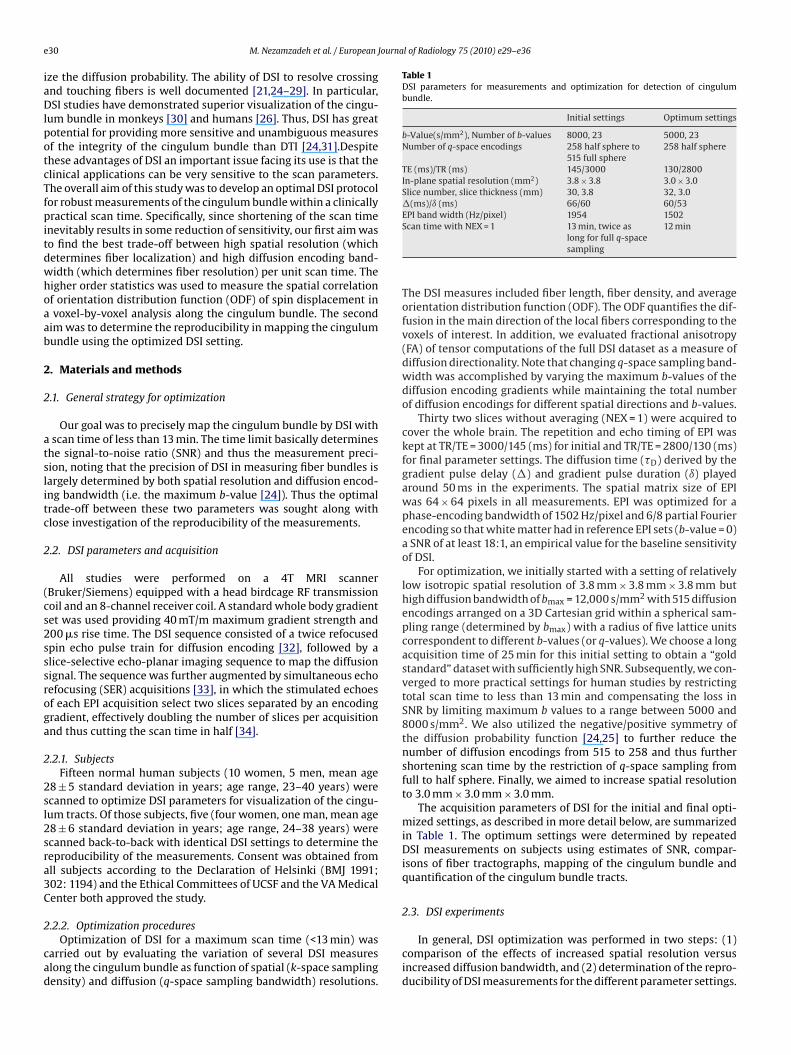
e Journal of Radiology 75 (2010) e29–e36
iaDlpotcTfpitdwhoaab
2
2
atslitc
2
(cs2sssroga
2
2sl2sra3C
2
cad
Table 1DSI parameters for measurements and optimization for detection of cingulumbundle.
Initial settings Optimum settings
b-Value(s/mm2), Number of b-values 8000, 23 5000, 23Number of q-space encodings 258 half sphere to
515 full sphere258 half sphere
TE (ms)/TR (ms) 145/3000 130/2800In-plane spatial resolution (mm2) 3.8 × 3.8 3.0 × 3.0Slice number, slice thickness (mm) 30, 3.8 32, 3.0�(ms)/ı (ms) 66/60 60/53EPI band width (Hz/pixel) 1954 1502
30 M. Nezamzadeh et al. / European
ze the diffusion probability. The ability of DSI to resolve crossingnd touching fibers is well documented [21,24–29]. In particular,SI studies have demonstrated superior visualization of the cingu-
um bundle in monkeys [30] and humans [26]. Thus, DSI has greatotential for providing more sensitive and unambiguous measuresf the integrity of the cingulum bundle than DTI [24,31].Despitehese advantages of DSI an important issue facing its use is that thelinical applications can be very sensitive to the scan parameters.he overall aim of this study was to develop an optimal DSI protocolor robust measurements of the cingulum bundle within a clinicallyractical scan time. Specifically, since shortening of the scan time
nevitably results in some reduction of sensitivity, our first aim waso find the best trade-off between high spatial resolution (whichetermines fiber localization) and high diffusion encoding band-idth (which determines fiber resolution) per unit scan time. Theigher order statistics was used to measure the spatial correlationf orientation distribution function (ODF) of spin displacement invoxel-by-voxel analysis along the cingulum bundle. The second
im was to determine the reproducibility in mapping the cingulumundle using the optimized DSI setting.
. Materials and methods
.1. General strategy for optimization
Our goal was to precisely map the cingulum bundle by DSI withscan time of less than 13 min. The time limit basically determines
he signal-to-noise ratio (SNR) and thus the measurement preci-ion, noting that the precision of DSI in measuring fiber bundles isargely determined by both spatial resolution and diffusion encod-ng bandwidth (i.e. the maximum b-value [24]). Thus the optimalrade-off between these two parameters was sought along withlose investigation of the reproducibility of the measurements.
.2. DSI parameters and acquisition
All studies were performed on a 4T MRI scannerBruker/Siemens) equipped with a head birdcage RF transmissionoil and an 8-channel receiver coil. A standard whole body gradientet was used providing 40 mT/m maximum gradient strength and00 �s rise time. The DSI sequence consisted of a twice refocusedpin echo pulse train for diffusion encoding [32], followed by alice-selective echo-planar imaging sequence to map the diffusionignal. The sequence was further augmented by simultaneous echoefocusing (SER) acquisitions [33], in which the stimulated echoesf each EPI acquisition select two slices separated by an encodingradient, effectively doubling the number of slices per acquisitionnd thus cutting the scan time in half [34].
.2.1. SubjectsFifteen normal human subjects (10 women, 5 men, mean age
8 ± 5 standard deviation in years; age range, 23–40 years) werecanned to optimize DSI parameters for visualization of the cingu-um tracts. Of those subjects, five (four women, one man, mean age8 ± 6 standard deviation in years; age range, 24–38 years) werecanned back-to-back with identical DSI settings to determine theeproducibility of the measurements. Consent was obtained fromll subjects according to the Declaration of Helsinki (BMJ 1991;02: 1194) and the Ethical Committees of UCSF and the VA Medicalenter both approved the study.
.2.2. Optimization proceduresOptimization of DSI for a maximum scan time (<13 min) was
arried out by evaluating the variation of several DSI measureslong the cingulum bundle as function of spatial (k-space samplingensity) and diffusion (q-space sampling bandwidth) resolutions.
Scan time with NEX = 1 13 min, twice aslong for full q-spacesampling
12 min
The DSI measures included fiber length, fiber density, and averageorientation distribution function (ODF). The ODF quantifies the dif-fusion in the main direction of the local fibers corresponding to thevoxels of interest. In addition, we evaluated fractional anisotropy(FA) of tensor computations of the full DSI dataset as a measure ofdiffusion directionality. Note that changing q-space sampling band-width was accomplished by varying the maximum b-values of thediffusion encoding gradients while maintaining the total numberof diffusion encodings for different spatial directions and b-values.
Thirty two slices without averaging (NEX = 1) were acquired tocover the whole brain. The repetition and echo timing of EPI waskept at TR/TE = 3000/145 (ms) for initial and TR/TE = 2800/130 (ms)for final parameter settings. The diffusion time (�D) derived by thegradient pulse delay (�) and gradient pulse duration (ı) playedaround 50 ms in the experiments. The spatial matrix size of EPIwas 64 × 64 pixels in all measurements. EPI was optimized for aphase-encoding bandwidth of 1502 Hz/pixel and 6/8 partial Fourierencoding so that white matter had in reference EPI sets (b-value = 0)a SNR of at least 18:1, an empirical value for the baseline sensitivityof DSI.
For optimization, we initially started with a setting of relativelylow isotropic spatial resolution of 3.8 mm × 3.8 mm × 3.8 mm buthigh diffusion bandwidth of bmax = 12,000 s/mm2 with 515 diffusionencodings arranged on a 3D Cartesian grid within a spherical sam-pling range (determined by bmax) with a radius of five lattice unitscorrespondent to different b-values (or q-values). We choose a longacquisition time of 25 min for this initial setting to obtain a “goldstandard” dataset with sufficiently high SNR. Subsequently, we con-verged to more practical settings for human studies by restrictingtotal scan time to less than 13 min and compensating the loss inSNR by limiting maximum b values to a range between 5000 and8000 s/mm2. We also utilized the negative/positive symmetry ofthe diffusion probability function [24,25] to further reduce thenumber of diffusion encodings from 515 to 258 and thus furthershortening scan time by the restriction of q-space sampling fromfull to half sphere. Finally, we aimed to increase spatial resolutionto 3.0 mm × 3.0 mm × 3.0 mm.
The acquisition parameters of DSI for the initial and final opti-mized settings, as described in more detail below, are summarizedin Table 1. The optimum settings were determined by repeatedDSI measurements on subjects using estimates of SNR, compar-isons of fiber tractographs, mapping of the cingulum bundle andquantification of the cingulum bundle tracts.
2.3. DSI experiments
In general, DSI optimization was performed in two steps: (1)comparison of the effects of increased spatial resolution versusincreased diffusion bandwidth, and (2) determination of the repro-ducibility of DSI measurements for the different parameter settings.

Journa
2
fsEmftl2b33g
2
tsrft
2
3saIfirav
Fa
M. Nezamzadeh et al. / European
.3.1. Spatial resolution versus diffusion bandwidthComparisons between spatial resolution and maximum dif-
usion bandwidth were performed using DSI with a q-spaceampling of 258. However, some acquisition parameters, such asPI bandwidth, echo time and total slice number had to be slightlyodified to accommodate changes in spatial resolution and dif-
usion bandwidth, as appropriate. In total, four DSI settings wereested including high and low bandwidth at low spatial reso-ution, i.e. dsi 1; bmax = 8000 s/mm2, res. = 3.8 mm × 3.8 mm, dsi; bmax = 5000 s/mm2, res. = 3.8 mm × 3.8 mm; and high and lowandwidth at high resolution, i.e. dsi 3; bmax = 8000 s/mm2, res. =.0 mm × 3.0 mm and dsi 4; bmax = 5000 s/mm2, res. = 3.0 mm ×.0 mm. These measurements were performed on five subjects androup-averaged measures were compared.
.3.2. Measurement reproducibilityFive healthy subjects were scanned back-to-back to determine
he reproducibility of DSI measurements for each of the four DSIettings. We hypothesized that the tract based measures wouldeflect the reliability of mapping the cingulum as explained in theollowing sections describing DSI quantitative analysis and statis-ics.
.4. DSI fiber tracking and quantitative analysis
The diffusion spectrum was reconstructed by taking the discreteD Fourier transformation of the signals acquired in q-space. Tomooth the DSI data at high q-values, the signals were filtered byHanning window before the data is Fourier transformed [22,28].
n order to get the angular structures of the diffusion spectrum inber tracking, the ODF was computed basically by taking a weightedadial summation of the probability of spin displacement for a givenngle. The data was reduced from the ODF to a set of directionalectors pointing toward local maxima [24,29]. These vectors were
ig. 1. Comparison of cingulum tracts in human brain using DSI experiments with differend resolution are printed in the images from a to d.
l of Radiology 75 (2010) e29–e36 e31
used as starting points and then expanded by propagating voxel-by-voxel to grow the fiber line until a stopping point, defined bythe given angle threshold or the mask, is reached. Tractrographreconstruction based on a streamline algorithm adapted for DSIdata was performed with selection of 42◦ angle threshold and anappropriate mask threshold to remove the background noise fromthe whole brain tracts using the Diffusion Toolkit (V.0.2) software(see trackvis.org).
We also reconstructed a diffusion tensor from the whole DSI set[24,31] to express diffusion directionally along the cingulum bundlein terms of FA. In brief, a low-pass filter was used to eliminate highb-values images of the DSI set and linear least-squares fits wereused to compute the tensor eigenvectors and eigenvalues from theremaining DSI data. The standard definition was applied to computeFA from the tensor.
The reconstructed whole brain tracts were visualized and ana-lyzed using TrackVis (V.0.4) (see trackvis.org). To map the cingulumbundle tracts, we used a localized disk with radius = 2 mm as aregion of interest (ROI) such that at a particular white matter posi-tion, a specified number of tracts normal to and passing throughthe disk were estimated. To be consistent in comparing the DSIanalysis, the ROI was always selected on the same location of thecingulum bundle on white matter. Visual inspections of the cingu-lum bundle tract were augmented by quantitative analyses basedon tract counts, mean tract length, variations of ODF, and FA alongthe cingulum bundle.
2.5. Statistics
The following tract based measures were examined to quan-tify the fiber mapping of the cingulum bundle: tract density (tractcounts divided by the volume of the voxels), mean tract length ofthe fibers, FA and ODF values corresponding to the voxels includedin the ROI.
nt maximal b-values and spatial resolutions. The four different settings of b-values
e32 M. Nezamzadeh et al. / European Journal of Radiology 75 (2010) e29–e36
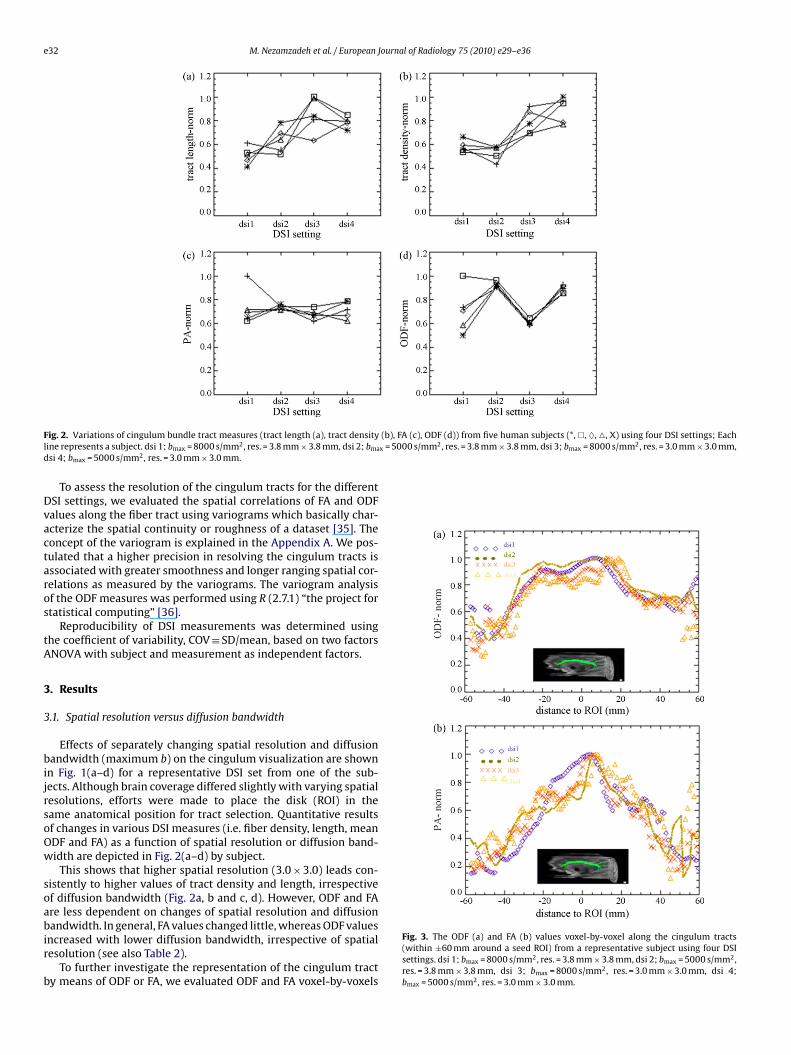
F (b), FA (c), ODF (d)) from five human subjects (*, �, ♦, �, X) using four DSI settings; Eachl x = 5000 s/mm2, res. = 3.8 mm × 3.8 mm, dsi 3; bmax = 8000 s/mm2, res. = 3.0 mm × 3.0 mm,d
Dvactaros
tA
3
3
bijrsoOw
soabir
b
ig. 2. Variations of cingulum bundle tract measures (tract length (a), tract densityine represents a subject. dsi 1; bmax = 8000 s/mm2, res. = 3.8 mm × 3.8 mm, dsi 2; bma
si 4; bmax = 5000 s/mm2, res. = 3.0 mm × 3.0 mm.
To assess the resolution of the cingulum tracts for the differentSI settings, we evaluated the spatial correlations of FA and ODFalues along the fiber tract using variograms which basically char-cterize the spatial continuity or roughness of a dataset [35]. Theoncept of the variogram is explained in the Appendix A. We pos-ulated that a higher precision in resolving the cingulum tracts isssociated with greater smoothness and longer ranging spatial cor-elations as measured by the variograms. The variogram analysisf the ODF measures was performed using R (2.7.1) “the project fortatistical computing” [36].
Reproducibility of DSI measurements was determined usinghe coefficient of variability, COV ≡ SD/mean, based on two factorsNOVA with subject and measurement as independent factors.
. Results
.1. Spatial resolution versus diffusion bandwidth
Effects of separately changing spatial resolution and diffusionandwidth (maximum b) on the cingulum visualization are shown
n Fig. 1(a–d) for a representative DSI set from one of the sub-ects. Although brain coverage differed slightly with varying spatialesolutions, efforts were made to place the disk (ROI) in theame anatomical position for tract selection. Quantitative resultsf changes in various DSI measures (i.e. fiber density, length, meanDF and FA) as a function of spatial resolution or diffusion band-idth are depicted in Fig. 2(a–d) by subject.
This shows that higher spatial resolution (3.0 × 3.0) leads con-istently to higher values of tract density and length, irrespectivef diffusion bandwidth (Fig. 2a, b and c, d). However, ODF and FAre less dependent on changes of spatial resolution and diffusion
andwidth. In general, FA values changed little, whereas ODF valuesncreased with lower diffusion bandwidth, irrespective of spatialesolution (see also Table 2).
To further investigate the representation of the cingulum tracty means of ODF or FA, we evaluated ODF and FA voxel-by-voxels
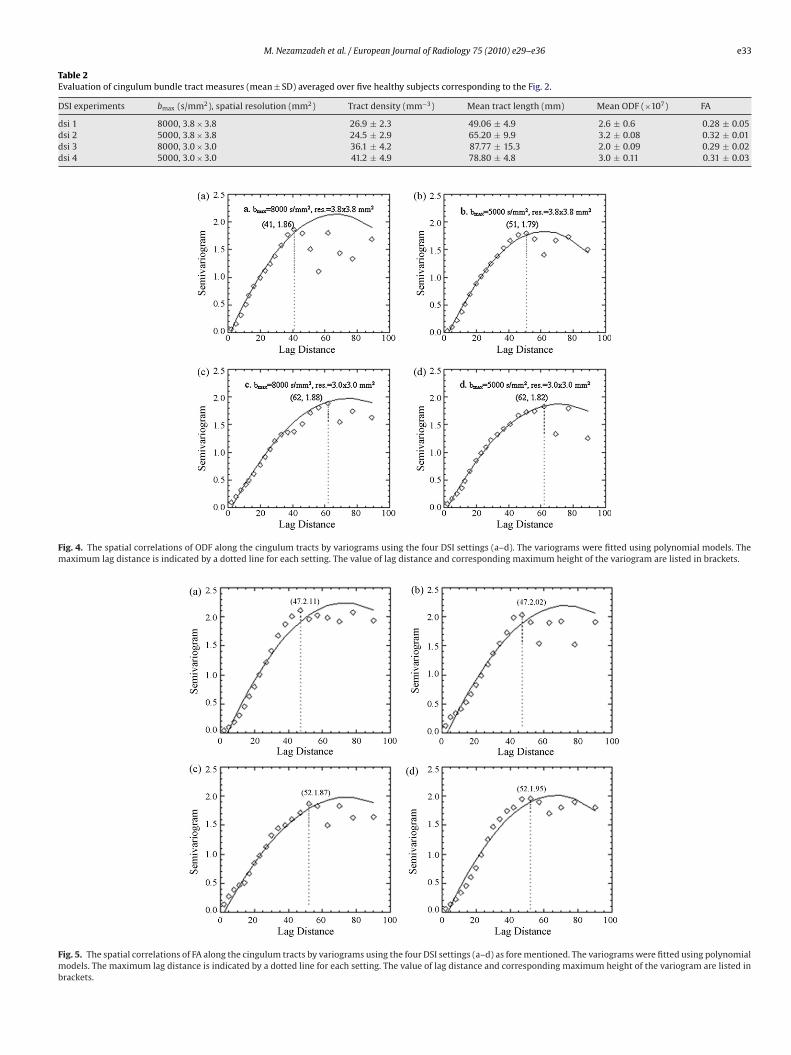
Fig. 3. The ODF (a) and FA (b) values voxel-by-voxel along the cingulum tracts(within ±60 mm around a seed ROI) from a representative subject using four DSIsettings. dsi 1; bmax = 8000 s/mm2, res. = 3.8 mm × 3.8 mm, dsi 2; bmax = 5000 s/mm2,res. = 3.8 mm × 3.8 mm, dsi 3; bmax = 8000 s/mm2, res. = 3.0 mm × 3.0 mm, dsi 4;bmax = 5000 s/mm2, res. = 3.0 mm × 3.0 mm.
M. Nezamzadeh et al. / European Journal of Radiology 75 (2010) e29–e36 e33
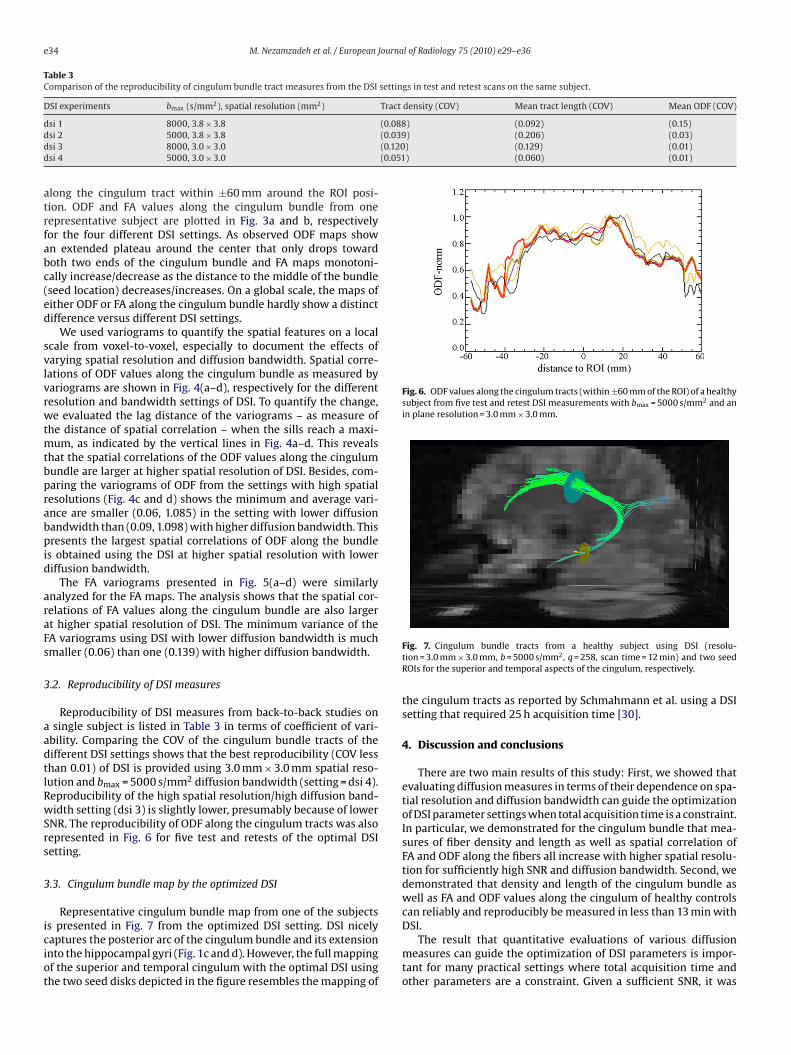
Table 2Evaluation of cingulum bundle tract measures (mean ± SD) averaged over five healthy subjects corresponding to the Fig. 2.
DSI experiments bmax (s/mm2), spatial resolution (mm2) Tract density (mm−3) Mean tract length (mm) Mean ODF (×107) FA
dsi 1 8000, 3.8 × 3.8 26.9 ± 2.3 49.06 ± 4.9 2.6 ± 0.6 0.28 ± 0.05dsi 2 5000, 3.8 × 3.8 24.5 ± 2.9 65.20 ± 9.9 3.2 ± 0.08 0.32 ± 0.01dsi 3 8000, 3.0 × 3.0 36.1 ± 4.2 87.77 ± 15.3 2.0 ± 0.09 0.29 ± 0.02dsi 4 5000, 3.0 × 3.0 41.2 ± 4.9 78.80 ± 4.8 3.0 ± 0.11 0.31 ± 0.03
Fig. 4. The spatial correlations of ODF along the cingulum tracts by variograms using the four DSI settings (a–d). The variograms were fitted using polynomial models. Themaximum lag distance is indicated by a dotted line for each setting. The value of lag distance and corresponding maximum height of the variogram are listed in brackets.
Fig. 5. The spatial correlations of FA along the cingulum tracts by variograms using the four DSI settings (a–d) as fore mentioned. The variograms were fitted using polynomialmodels. The maximum lag distance is indicated by a dotted line for each setting. The value of lag distance and corresponding maximum height of the variogram are listed inbrackets.
e34 M. Nezamzadeh et al. / European Journal of Radiology 75 (2010) e29–e36
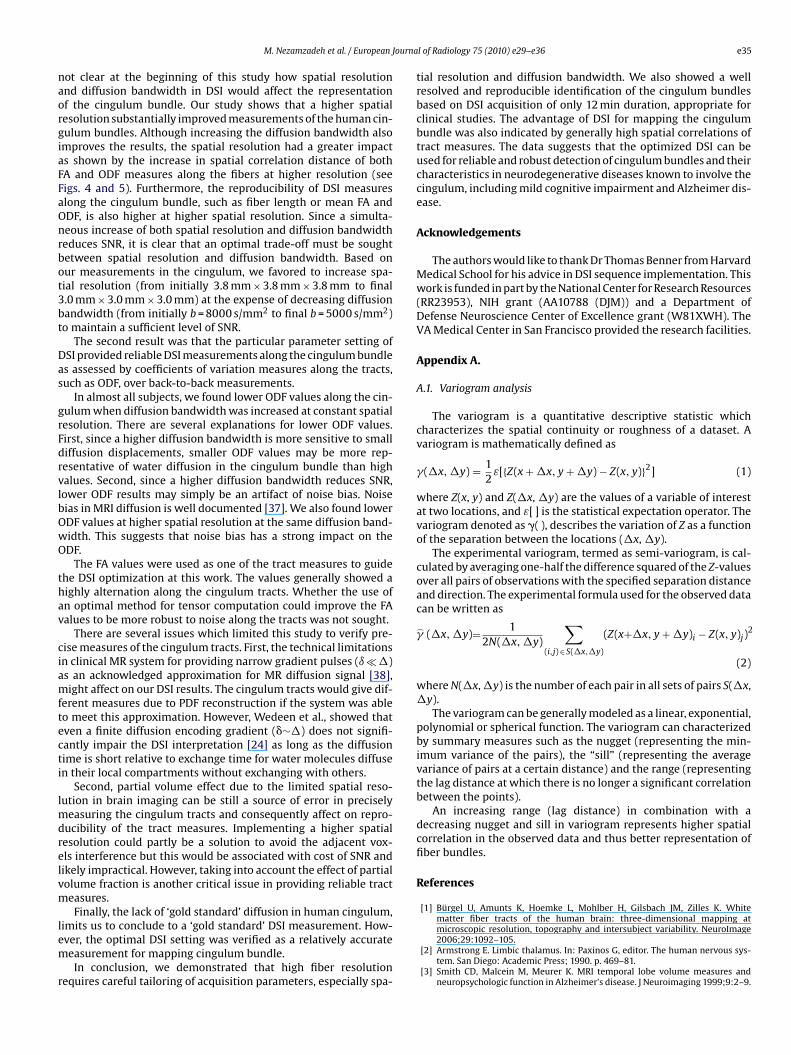
Table 3Comparison of the reproducibility of cingulum bundle tract measures from the DSI settings in test and retest scans on the same subject.
DSI experiments bmax (s/mm2), spatial resolution (mm2) Tract density (COV) Mean tract length (COV) Mean ODF (COV)
d (0.088) (0.092) (0.15)d (0.039) (0.206) (0.03)d (0.120) (0.129) (0.01)d (0.051) (0.060) (0.01)
atrfabc(ed
svlvrwtmtbprabpid
araFs
3
aadtlRwSrs
3
iciot
Fig. 6. ODF values along the cingulum tracts (within ±60 mm of the ROI) of a healthysubject from five test and retest DSI measurements with bmax = 5000 s/mm2 and anin plane resolution = 3.0 mm × 3.0 mm.
si 1 8000, 3.8 × 3.8si 2 5000, 3.8 × 3.8si 3 8000, 3.0 × 3.0si 4 5000, 3.0 × 3.0
long the cingulum tract within ±60 mm around the ROI posi-ion. ODF and FA values along the cingulum bundle from oneepresentative subject are plotted in Fig. 3a and b, respectivelyor the four different DSI settings. As observed ODF maps shown extended plateau around the center that only drops towardoth two ends of the cingulum bundle and FA maps monotoni-ally increase/decrease as the distance to the middle of the bundleseed location) decreases/increases. On a global scale, the maps ofither ODF or FA along the cingulum bundle hardly show a distinctifference versus different DSI settings.
We used variograms to quantify the spatial features on a localcale from voxel-to-voxel, especially to document the effects ofarying spatial resolution and diffusion bandwidth. Spatial corre-ations of ODF values along the cingulum bundle as measured byariograms are shown in Fig. 4(a–d), respectively for the differentesolution and bandwidth settings of DSI. To quantify the change,e evaluated the lag distance of the variograms – as measure of
he distance of spatial correlation – when the sills reach a maxi-um, as indicated by the vertical lines in Fig. 4a–d. This reveals
hat the spatial correlations of the ODF values along the cingulumundle are larger at higher spatial resolution of DSI. Besides, com-aring the variograms of ODF from the settings with high spatialesolutions (Fig. 4c and d) shows the minimum and average vari-nce are smaller (0.06, 1.085) in the setting with lower diffusionandwidth than (0.09, 1.098) with higher diffusion bandwidth. Thisresents the largest spatial correlations of ODF along the bundle
s obtained using the DSI at higher spatial resolution with loweriffusion bandwidth.
The FA variograms presented in Fig. 5(a–d) were similarlynalyzed for the FA maps. The analysis shows that the spatial cor-elations of FA values along the cingulum bundle are also largert higher spatial resolution of DSI. The minimum variance of theA variograms using DSI with lower diffusion bandwidth is muchmaller (0.06) than one (0.139) with higher diffusion bandwidth.
.2. Reproducibility of DSI measures
Reproducibility of DSI measures from back-to-back studies onsingle subject is listed in Table 3 in terms of coefficient of vari-
bility. Comparing the COV of the cingulum bundle tracts of theifferent DSI settings shows that the best reproducibility (COV lesshan 0.01) of DSI is provided using 3.0 mm × 3.0 mm spatial reso-ution and bmax = 5000 s/mm2 diffusion bandwidth (setting = dsi 4).eproducibility of the high spatial resolution/high diffusion band-idth setting (dsi 3) is slightly lower, presumably because of lower
NR. The reproducibility of ODF along the cingulum tracts was alsoepresented in Fig. 6 for five test and retests of the optimal DSIetting.
.3. Cingulum bundle map by the optimized DSI
Representative cingulum bundle map from one of the subjects
s presented in Fig. 7 from the optimized DSI setting. DSI nicelyaptures the posterior arc of the cingulum bundle and its extensionnto the hippocampal gyri (Fig. 1c and d). However, the full mappingf the superior and temporal cingulum with the optimal DSI usinghe two seed disks depicted in the figure resembles the mapping ofFig. 7. Cingulum bundle tracts from a healthy subject using DSI (resolu-tion = 3.0 mm × 3.0 mm, b = 5000 s/mm2, q = 258, scan time = 12 min) and two seedROIs for the superior and temporal aspects of the cingulum, respectively.
the cingulum tracts as reported by Schmahmann et al. using a DSIsetting that required 25 h acquisition time [30].
4. Discussion and conclusions
There are two main results of this study: First, we showed thatevaluating diffusion measures in terms of their dependence on spa-tial resolution and diffusion bandwidth can guide the optimizationof DSI parameter settings when total acquisition time is a constraint.In particular, we demonstrated for the cingulum bundle that mea-sures of fiber density and length as well as spatial correlation ofFA and ODF along the fibers all increase with higher spatial resolu-tion for sufficiently high SNR and diffusion bandwidth. Second, wedemonstrated that density and length of the cingulum bundle aswell as FA and ODF values along the cingulum of healthy controlscan reliably and reproducibly be measured in less than 13 min with
DSI.The result that quantitative evaluations of various diffusionmeasures can guide the optimization of DSI parameters is impor-tant for many practical settings where total acquisition time andother parameters are a constraint. Given a sufficient SNR, it was
Journa
naorgiaFFaOnrbot3bt
Das
grFdrvlbOwO
thav
ciamftecti
lmdrelvm
lem
r
M. Nezamzadeh et al. / European
ot clear at the beginning of this study how spatial resolutionnd diffusion bandwidth in DSI would affect the representationf the cingulum bundle. Our study shows that a higher spatialesolution substantially improved measurements of the human cin-ulum bundles. Although increasing the diffusion bandwidth alsomproves the results, the spatial resolution had a greater impacts shown by the increase in spatial correlation distance of bothA and ODF measures along the fibers at higher resolution (seeigs. 4 and 5). Furthermore, the reproducibility of DSI measureslong the cingulum bundle, such as fiber length or mean FA andDF, is also higher at higher spatial resolution. Since a simulta-eous increase of both spatial resolution and diffusion bandwidtheduces SNR, it is clear that an optimal trade-off must be soughtetween spatial resolution and diffusion bandwidth. Based onur measurements in the cingulum, we favored to increase spa-ial resolution (from initially 3.8 mm × 3.8 mm × 3.8 mm to final.0 mm × 3.0 mm × 3.0 mm) at the expense of decreasing diffusionandwidth (from initially b = 8000 s/mm2 to final b = 5000 s/mm2)o maintain a sufficient level of SNR.
The second result was that the particular parameter setting ofSI provided reliable DSI measurements along the cingulum bundles assessed by coefficients of variation measures along the tracts,uch as ODF, over back-to-back measurements.
In almost all subjects, we found lower ODF values along the cin-ulum when diffusion bandwidth was increased at constant spatialesolution. There are several explanations for lower ODF values.irst, since a higher diffusion bandwidth is more sensitive to smalliffusion displacements, smaller ODF values may be more rep-esentative of water diffusion in the cingulum bundle than highalues. Second, since a higher diffusion bandwidth reduces SNR,ower ODF results may simply be an artifact of noise bias. Noiseias in MRI diffusion is well documented [37]. We also found lowerDF values at higher spatial resolution at the same diffusion band-idth. This suggests that noise bias has a strong impact on theDF.
The FA values were used as one of the tract measures to guidehe DSI optimization at this work. The values generally showed aighly alternation along the cingulum tracts. Whether the use ofn optimal method for tensor computation could improve the FAalues to be more robust to noise along the tracts was not sought.
There are several issues which limited this study to verify pre-ise measures of the cingulum tracts. First, the technical limitationsn clinical MR system for providing narrow gradient pulses (ı � �)s an acknowledged approximation for MR diffusion signal [38],ight affect on our DSI results. The cingulum tracts would give dif-
erent measures due to PDF reconstruction if the system was ableo meet this approximation. However, Wedeen et al., showed thatven a finite diffusion encoding gradient (�∼�) does not signifi-antly impair the DSI interpretation [24] as long as the diffusionime is short relative to exchange time for water molecules diffusen their local compartments without exchanging with others.
Second, partial volume effect due to the limited spatial reso-ution in brain imaging can be still a source of error in precisely
easuring the cingulum tracts and consequently affect on repro-ucibility of the tract measures. Implementing a higher spatialesolution could partly be a solution to avoid the adjacent vox-ls interference but this would be associated with cost of SNR andikely impractical. However, taking into account the effect of partialolume fraction is another critical issue in providing reliable tracteasures.Finally, the lack of ‘gold standard’ diffusion in human cingulum,
imits us to conclude to a ‘gold standard’ DSI measurement. How-ver, the optimal DSI setting was verified as a relatively accurateeasurement for mapping cingulum bundle.In conclusion, we demonstrated that high fiber resolution
equires careful tailoring of acquisition parameters, especially spa-
l of Radiology 75 (2010) e29–e36 e35
tial resolution and diffusion bandwidth. We also showed a wellresolved and reproducible identification of the cingulum bundlesbased on DSI acquisition of only 12 min duration, appropriate forclinical studies. The advantage of DSI for mapping the cingulumbundle was also indicated by generally high spatial correlations oftract measures. The data suggests that the optimized DSI can beused for reliable and robust detection of cingulum bundles and theircharacteristics in neurodegenerative diseases known to involve thecingulum, including mild cognitive impairment and Alzheimer dis-ease.
Acknowledgements
The authors would like to thank Dr Thomas Benner from HarvardMedical School for his advice in DSI sequence implementation. Thiswork is funded in part by the National Center for Research Resources(RR23953), NIH grant (AA10788 (DJM)) and a Department ofDefense Neuroscience Center of Excellence grant (W81XWH). TheVA Medical Center in San Francisco provided the research facilities.
Appendix A.
A.1. Variogram analysis
The variogram is a quantitative descriptive statistic whichcharacterizes the spatial continuity or roughness of a dataset. Avariogram is mathematically defined as
�(�x, �y) = 12
ε[{Z(x + �x, y + �y) − Z(x, y)}2] (1)
where Z(x, y) and Z(�x, �y) are the values of a variable of interestat two locations, and ε[ ] is the statistical expectation operator. Thevariogram denoted as �( ), describes the variation of Z as a functionof the separation between the locations (�x, �y).
The experimental variogram, termed as semi-variogram, is cal-culated by averaging one-half the difference squared of the Z-valuesover all pairs of observations with the specified separation distanceand direction. The experimental formula used for the observed datacan be written as
�� (�x, �y)= 12N(�x, �y)
∑
(i,j) ∈ S(�x,�y)
(Z(x+�x, y + �y)i − Z(x, y)j)2
(2)
where N(�x, �y) is the number of each pair in all sets of pairs S(�x,�y).
The variogram can be generally modeled as a linear, exponential,polynomial or spherical function. The variogram can characterizedby summary measures such as the nugget (representing the min-imum variance of the pairs), the “sill” (representing the averagevariance of pairs at a certain distance) and the range (representingthe lag distance at which there is no longer a significant correlationbetween the points).
An increasing range (lag distance) in combination with adecreasing nugget and sill in variogram represents higher spatialcorrelation in the observed data and thus better representation offiber bundles.
References
[1] Bürgel U, Amunts K, Hoemke L, Mohlber H, Gilsbach JM, Zilles K. Whitematter fiber tracts of the human brain: three-dimensional mapping at
microscopic resolution, topography and intersubject variability. NeuroImage2006;29:1092–105.[2] Armstrong E. Limbic thalamus. In: Paxinos G, editor. The human nervous sys-tem. San Diego: Academic Press; 1990. p. 469–81.
[3] Smith CD, Malcein M, Meurer K. MRI temporal lobe volume measures andneuropsychologic function in Alzheimer’s disease. J Neuroimaging 1999;9:2–9.
e Journa
[
[
[
[
[
[
[
[
[
[
[
[
[
[
[
[
[
[
[
[
[
[
[
[
[
[
36 M. Nezamzadeh et al. / European
[4] Ardekani BA, Nierenberg J, Hoptman NJ, Javitt DC, Lim KO. MRI study of whitematter diffusion anisotropy in schizophrenia. NeuroReport 2003;14:2025–9.
[5] Zahajszky J, Dickey CC, McCarley RW. A quantitative MR measure of the fornixin schizophrenia. Schizophr Res 2001;47:87–97.
[6] Drevets WC, Price JL, Furey ML. Brain structural and functional abnormalitiesin mood disorders: implications for neurocircuitry models of depression. BrainStruct Funct 2008;213:93–118.
[7] Matthews SC, Strigo IA, Simmons AN, Yang TT, Paulus MP. Decreased functionalcoupling of the amygdala and supragenual cingulate is related to increaseddepression in unmedicated individuals with current major depressive disorder.J Affect Disord 2008;111:13–20.
[8] Geuze E, Vermetten E, Ruf M, de Kloet CS, Westenberg HG. Neural correlates ofassociative learning and memory in veterans with posttraumatic stress disor-der. J Psychiatr Res 2008;42:659–69.
[9] Smith SD, Abou-Khalil B, Zald DH. Posttraumatic stress disorder in a patientwith no left amygdale. J Abnorm Psychol 2008;117:479–84.
10] Catani M, Howard RJ, Pajevic S, Jones DK. Virtual in vivo interactive dissectionof white matter fasciculi in the human brain. Neuroimage 2002;17:77–94.
11] Basser PJ, Pierpaoli C. Estimation of the effective self-diffusion tensor from theNMR spin echo. J Magn Reson 1994;B111:209–19.
12] Makris N, Worth AJ, Sorensen AG, et al. Morphometry of in vivo human whitematter association pathways with diffusion-weighted magnetic resonanceimaging. Ann Neurol 1997;42:951–62.
13] Mori S, Kaufmann WE, Davatzikos C. Imaging cortical association tracts in thehuman brain using diffusion-tensor-based axonal tracking. Magn Reson Med2002;47:215–23.
14] Pierpaoli C, Jezzard P, Basser PJ. Diffusion tensor MR imaging of the humanbrain. Radiology 1996;201:637–48.
15] Wakana S, Jiang H, Nagae-Poetscher LM. Fiber tract-based atlas of human whitematter anatomy. Radiology 2004;230:77–87.
16] Zhang Y, Schuff N, Jahng GH, et al. Diffusion tensor imaging of cingulum fibersin mild cognitive impairment and Alzheimer disease. Neurology 2007;68:13–9.
17] Basser PJ, Pajevic S, Pierpaoli C, Duda J, Aldroubi A. In vivo fiber tractographyusing DT-MRI data. Magn Reson Med 2000;44:625–32.
18] Concha L, Gross DW, Beaulieu Ch. Diffusion tensor tractography of the limbicsystem. AJNR Am J Neuroradiol 2005;26:2267–74.
19] Rose SE, Chen F, Chalk JB. Loss of connectivity in Alzheimer’s disease: an eval-uation of white matter tract integrity with color-coded MR diffusion tensorimaging. J Neurol Neurosurg Psychiatry 2000;69:528–30.
20] Park HJ, Westin CF, Kubicki M. White matter hemisphere asymmetries inhealthy subjects and in schizophrenia: a diffusion tensor MRI study. Neuroim-age 2004;23:213–23.
21] Wang F, Sun Z, Cui L. Anterior cingulum abnormalities in male patients withschizophrenia determined through diffusion tensor imaging. Am J Psychiatry2004;161:573–5.
[
[
[
l of Radiology 75 (2010) e29–e36
22] Frank LR. Anisotropy in high angular resolution diffusion-weighted MRI. MagnReson Med 2001;45:935–9.
23] Tuch DS, Reese TG, Wiegell MR, Wedeen VJ. Diffusion MRI of complex neuralarchitecture. Neuron 2003;40:885–95.
24] Wedeen VJ, Hagmann P, Tseng WI, Reese TG, Weisskoff RM. Mapping complextissue architecture with diffusion spectrum magnetic resonance imaging. MagnReson Med 2005;54:1377–86.
25] Hagmann P, Jonasson L, Maeder P, Thiran JP, Wedeen VJ, Meuli R. Understandingdiffusion MR Imaging techniques: from scalar diffusion weighted imaging todiffusion tensor imaging and beyond. RadioGraphics 2006;16:S205–23.
26] Hagmann P, Jonasson L, Deffieux T, Meuli R, Thiran JP, Wedeen VJ. Fibertract seg-mentation in position orientation space from high angular resolution diffusionMRI. NeuroImage 2006;32:665–75.
27] Gilbert RJ, Magnusson LH, Napadow VJ, Benner T, Wang R, Wedeen VJ. Map-ping complex myoarchitecture in the bovine tongue with diffusion-spectrummagnetic resonance imaging. Biophys J 2006;91:1014–22.
28] Gilbert RJ, Wedeen VJ, Magnusson LH, et al. Three-dimensional myoarchitectureof the bovine tongue demonstrated by diffusion spectrum magnetic resonanceimaging with tractography. Anatom Rec Part A 2006;288A:1173–82.
29] Hagmann P, Reese TG, Tseng WYI, Meuli R, Thiran JP, Wedeen VJ. Diffusion spec-trum imaging tractography in complex cerebral white matter: an investigationof the centrum semiovale. In: Proceedings of 12th annual meeting of ISMRM,Kyoto, Japan. 2004. p. 623.
30] Schmahmann JD, Pandya DN, Wang R, et al. Association fiber pathways of thebrain: parallel observations from diffusion spectrum imaging and autoradiog-raphy. Brain 2007;130:630–53.
31] Wedeen VJ, Wang R, Schmahmann JD, et al. Diffusion spectrum mag-netic resonance imaging (DSI) tractography of crossing fibers. NeuroImage2008;41:1267–77.
32] Reese TG, Heid O, Weisskoff RM, Wedeen VJ. Reduction of eddy-current-induced distortion in diffusion MRI using a twice refocused spin echo. MagnReson Med 2003;49:177–82.
33] Feinberg DA, Reese TG, Wedeen VJ. Simultaneous echo refocusing in EPI. MagnReson Med 2002;48:1–5.
34] Reese TG, Benner T, Wang R, Feinberg DA, Wedeen VJ. Halving imaging time ofwhole brain diffusion spectrum imaging (DSI) using simultaneous echo refo-cusing (SER) EPI. In: Proceedings of 14th annual meeting of ISMRM, Seattle,USA. 2006. 2006.
35] Cressie N. Statistics for spatial data. New York: John Wiley and Sons; 1991. p.900.
36] Venables WN, Smith DM. An introduction to R(2.7.1): a programming environ-ment for data analysis and graphics; 2008.
37] Sijbers J, den Dekker AJ, Van Audekerke J, Verhoye M, Van Dyck D. Estimationof the noise in magnitude MR images. Magn Reson Imaging 1998;16:87–90.
38] Stejskal EO, Tanner JE. Spin diffusion measurements: spin echoes in the pres-ence of a time-dependent field gradient. J Chem Phys 1965;42:288–92.