Aflatoxin B1 and Deoxynivalenol contamination of dairy feeds ...

Original Contribution
IN VIVO IDENTIFICATION OF AFLATOXIN-INDUCED FREE RADICALS INRAT BILE
RHEAL A. TOWNER,* STEVEN Y. QIAN,† MARIA B. KADIISKA ,† and RONALD P. MASON†
*Free Radical Biology and Aging Research Program, Oklahoma Medical Research Foundation, Oklahoma City, OK, USA; and†Laboratory of Pharmacology and Chemistry, National Institute of Environmental Health Sciences, National Institutes of Health,
Research Triangle Park, NC, USA
(Received 30 April 2003;Revised 14 August 2003;Accepted 14 August 2003)
Abstract—Aflatoxin B1 (AFB1) is a potent hepatocarcinogen. We have recently detected [via electron spin resonance(ESR) spectroscopy] free radicals in vivo in rat bile following AFB1 metabolism using the spin trapping [�-(4-pyridyl-1-oxide)-N-tert-butyl nitrone (4-POBN)] technique. The aim of the present study was to identify the trapped free radicalintermediates from the in vivo hepatic metabolism of AFB1. Rats were treated simultaneously with AFB1 (3 mg/kg i.p.)and the spin trapping agent 4-POBN (1 g/kg i.p.), and bile was collected over a period of 1 h at 20 minintervals. On-linehigh performance liquid chromatography (HPLC) coupled to ESR was used to identify an arachidonic acid-derivedradical adduct of 4-POBN in rat bile, and a methyl adduct of 4-POBN from the reaction of hydroxyl radicals withcarbon-13–labeled dimethyl sulfoxide (13C-DMSO). The effect of metabolic inhibitors, such as desferoxamine mesylate(DFO), an iron chelator, 2-dimethylaminoethyl-2,2-diphenylvalerate hydrochloride (SKF) 525A, a cytochrome P-450inhibitor, and gadolinium chloride (GdCl3), a Kupffer cell inactivator, on in vivo aflatoxin-induced free radicalformation were also studied. It was found that there was a significant decrease in radical formation as a result of DFO,SKF525A and GdCl3 inhibition. Trapped 4-POBN radical adducts were also detected in rat bile following the in vivometabolism of aflatoxin-M1, one of the hydroxylated metabolites of AFB1. © 2003 Elsevier Inc.
Keywords—Aflatoxin-B1, Aflatoxin-M1, Spin trapping, Hydroxyl radicals, Lipid radicals, Desferoxamine mesylate,SKF525A, Gadolinium chloride, HPLC-ESR, Free radicals
INTRODUCTION
Aflatoxin B1 (AFB1) is both a mutagenic and carcino-genic mycotoxin that has been postulated to play a majorrole in the etiology of primary human liver cancer [1,2].An increase in hepatocellular carcinoma has been asso-ciated with dietary exposure to AFB1, particularly inpopulations that are commonly exposed to hepatitis Bvirus [2,3]. The current most threatening route of AFB1contamination is from aflatoxin-M1(AFM1), a hydroxy-lated metabolite, found in bovine milk. AFM1 is metab-olized from AFB1 commonly found in animal feed suchas peanut and cottonseed meal [4]. The biologic effectsof AFB1 are mainly induced by the formation of the
cytochrome P-450 (CYP)-initiated aflatoxin B1 epoxidemetabolite that has been found to produce deoxyribonu-cleic acid and protein adducts in vivo [5].
In the last decade there has been accumulating evi-dence that has proposed the involvement of oxidativedamage associated with aflatoxin B1-induced cytotoxic-ity and carcinogenicity. A study by Kodama and cowork-ers in 1990 detected single electron spin resonance(ESR) spectral lines and fluorescent spots in thin-layerchromatograms following solvent (benzene) extractionof rat microsomal preparations exposed to either AFB1or the major metabolite AFM1 and reduced nicotinamideadenine dinucleotide phosphate (NADPH) [6]. Shen andco-investigators in 1996 demonstrated with the use of afluorescence probe, 2�,7�-dichlorofluorescin diacetate, anincrease in the formation of reactive oxygen species(ROS) in cultured rat hepatocytes following AFB1 ex-posure [7]. In addition, indirectly, numerous investiga-tors have implicated that oxidative stress occurs follow-
Address correspondence to: Dr. Rheal A. Towner, Director, Mag-netic Resonance Imaging Facility, Free Radical Biology and AgingResearch Program, Oklahoma Medical Research Foundation, Okla-homa City, OK 73104-5046, USA; Tel: (405) 271-7383; Fax: (405)271-1795; E-Mail: [email protected].
Free Radical Biology & Medicine, Vol. 35, No. 10, pp. 1330–1340, 2003Copyright © 2003 Elsevier Inc.
Printed in the USA. All rights reserved0891-5849/03/$–see front matter
doi:10.1016/j.freeradbiomed.2003.08.002
1330

ing aflatoxin metabolism by inhibiting eitherhepatotoxicity or hepatocarcinogenesis with the use ofantioxidants and/or free radical scavengers, such as sily-marin [8,9], crocetin (a natural carotenoid) [10], greentea [11,12], and butylated hydroxyanisole [13]. A recentstudy by Lee et al. demonstrated that some dietary com-ponents present in fruits and vegetables, such as fla-vones, coumarins, and anthraquinones, significantly in-hibit AFB1 biotransformation to the AFB1-8,9-epoxideby CYP enzymes in mouse liver [14].
Recently, we were able to detect biological free radicalsin vivo generated from aflatoxin metabolism in rat bileusing the ESR spectroscopy spin trapping method [15]. Thepurpose of this article is to identify the trapped in vivo freeradical metabolites resulting from aflatoxin B1 hepatic me-tabolism in rat bile using C-13 isotope labeling and high-performance liquid chromatography (HPLC)-ESR detec-tion/separation, and to propose possible mechanisms ofradical formation with the use of some metabolic inhibitors,such as deferoxamine mesylate, an iron chelator; 2-dimeth-ylaminoethyl-2,2-diphenylvalerate hydrochloride(SKF525A), a CYP inhibitor; and gadolinium chloride(GdCl3), a Kupffer cell inactivator.
MATERIALS AND METHODS
Animals
For AFB1 studies, male Sprague Dawley rats (275 �50 g; n � 39), obtained from Charles River (Wilmington,MA, USA), were used. For the AFM1 study, maleSprague Dawley rats (180 � 20 g; n � 2) were used.Rats were fed with commercial rat chow and water adlibitum, kept on a 12:12 h light/dark cycle, and housed atthe National Institute of Environmental Health Sciences(NIEHS) animal facility. Animals were fasted 18 h priorto all experiments. The animal protocol used in this studywas approved by the NIEHS Animal Care and UseCommittee, and all animals received humane care incompliance with the National Research Council’s criteriafor humane care as outlined in the Guide for the Care andUse of Laboratory Animals prepared by the NationalAcademy of Sciences and published by the NationalInstitutes of Health.
Toxins
Aflatoxin B1 from A. flavus (crystalline form; Sigma-Aldrich, St. Louis, MO, USA) was dissolved in 12C-DMSO (dimethyl sulfoxide) or 13C-DMSO (Isotech, Mi-amisburg, OH, USA) and made to a final concentrationof 10 mg/ml. All solutions were frozen at �4°C forstorage until use. AFM1 (Sigma-Aldrich) was dissolvedin 13C-DMSO and made to a final concentration of 20�g/100 �l.
ESR spectroscopy studies
Rats were anesthetized with Nembutal (180 mg/kg ratweight of sodium pentobarbital) over a total period of2 h. Bile ducts were cannulated using 10 cm segments ofPE 10 tubing before treatment. For the AFB1-treatedrats, AFB1 (3 mg/kg i.p.) was administered in 3 ml salinecontaining 0.3 ml DMSO/kg. Control rats were admin-istered saline (i.p.) and 0.03 ml DMSO/kg. For AFM1-treated rats, �-(4-pyridyl-1-oxide)-N-tert-butyl nitrone(4-POBN) was administered i.p. 30 min prior to intrahe-patic portal vein injection of AFM1 (20 �g in 200 �l13C-DMSO � 100 �l saline). For inhibition studies,deferoxamine mesylate or Desferal (DFO; 100 mg/kgi.p.) was administered i.p. One hour before AFB1 and4-POBN administration [15], SKF525A (60 mg/kg i.p.)was administered i.p. 30 min prior to AFB1 and 4-POBNadministration [15], and GdCl3 was administered i.v. (viatail vein; 7 mg/kg) 24 h prior to AFB1 and the spin trap[16]. Each rat was given 4-POBN i.p. injection; 1 g/kgrat in 1 ml saline; Alexis Biochemicals (San Diego, CA,USA), immediately after toxin or saline treatment, orfollowing inhibitor pretreatment. Accumulated bile wascollected every 20 min in an Eppendorf tube containinga 50 �l solution of 2,2�-dipyridyl (DP; 30 mM) andbathocuproine-disulfonic acid, disodium salt hydrate(BC; 30 mM) to prevent in situ free radical formationfrom trace metal ions [17], and frozen immediately ondry ice and stored at �70°C until ESR analysis. After aperiod of 2 h the anesthetized rats were euthanized viacervical dislocation.
The bile samples were analyzed on a Bruker EXMspectrometer equipped with a super high Q cavity, usingthe following ESR parameters: microwave power of 20mW, microwave frequency of 9.746 GHz, modulationfrequency of 100 kHz, modulation amplitude of 1.0 G,time constant of 1.3 s, sweep time of 11.2 ms, receivergain of 1 � 105, sweep width of 70 G, and a singlespectral accumulation. Hyperfine splitting constants weredetermined from an ESR spectral simulation program,SIMEPR [18], which sequentially varies every parameterfor each spin adduct species until a minimum in the errorsurface is located. The best fit was judged by both aminimum in the sum of the squared residuals and visualcomparisons. Student’s t-test was used for statisticalanalysis of 4-POBN spin adduct spectral peak areas. Ap-value of � .05 was taken to indicate a significantdifference between treatment groups.
On-line HPLC-ESR spectroscopy
Ethyl alcohol, glacial acetic acid (HOAc), hydrochlo-ric acid, and soybean lipoxygenase (Type VI) were pur-chased from Sigma Chemical Co. (St. Louis, MO, USA).4-POBN was purchased from Alexis Biochemicals. Ar-
1331Identification of aflatoxin radicals

achidonic acid was obtained from Nu-Chek-Prep Inc.(Elysian, MN, USA). Acetonitrile (AN), tetrahydrofuran(THF), and H2O, all HPLC grade, were purchased fromFisher Scientific (St. Louis, MO, USA), Aldrich Chem-ical Co. (Milwaukee, WI, USA), and Anachemia Chem-icals (Rouses Point, NY, USA), respectively. An acro-disc syringe filter with a 0.2 �m nylon membrane (HPLCcertified) was obtained from the Pall Gelman Laboratory(Ann Arbor, MI, USA).
Peroxidation experiments were performed in 50 mM(pH 8.7) borate buffer aqueous solution. The reactionmixture containing 1 mM arachidonic acid (in 1% etha-nol), 50 mM 4-POBN, and 104 units/ml soybean lipoxy-genase was incubated at room temperature in the absenceof light [19,20,21]. After 30 min, the reaction mixturewas filtered, and then injected onto the HPLC column.
An on-line liquid chromatography/electron spin reso-nance (LC/ESR) system was used to detect and separate4-POBN adducts of carbon-centered radicals [20,21].The 4-POBN radical adducts were monitored with bothUV absorption at 265 nm and ESR spectroscopy with themagnetic field fixed on the maximum of the first line ofthe ESR six-line spectrum. The equipment consisted of aHewlett-Packard 1100 series HPLC system and a BrukerElexSys spectrometer. The outlet of the Waters UVdetector was connected to a highly sensitive AquaX ESRcell with Red Peek HPLC tubing (0.005 in. i.d.).
LC separations were performed on C-18 columns(ZORBAX Eclipse-XDB, 4.6 � 75 mm, 3.5 �m) equil-ibrated with solvent A (H2O/0.1% HOAc). The reactionmixture (100 �l) was typically injected onto the HPLCcolumn and eluted at a 1.5 ml/min flow rate with gradientelutions of (i) 0–50 min: 100% to 30% of A, 0% to 30%of B (CAN/0.1% HOAc), 0% to 40% of C (ACN:THF(1:1)/0.1% HOAc); (ii) 50–55 min: 30% to 10% of A,30% to 0% of B, 40% to 90% of C; and followed by a 5min isocratic elution (55–60 min): 10% of A, 0% of B,90% of C.
RESULTS
Figure 1A is a representative spectrum 60 min fol-lowing AFB1 (in 12C-DMSO) and 4-POBN treatment,depicting a six line spectrum characteristic of many4-POBN adducts, and which is unable to differentiatebetween various carbon-centered radical species (includ-ing methyl radicals resulting from the reaction of hy-droxyl radicals and DMSO; and lipid-derived radicalsfrom lipid peroxidation). Figure 1B is the 4-POBN and12C-DMSO-treated control for Fig. 1A.
Figure 1C shows a representative twelve-line spec-trum of a radical adduct from the bile of a rat treated withAFB1 (in 13C-DMSO) and 4-POBN (both via intraperi-toneal injection) simultaneously, 60 min following ad-
ministration. The 12 line spectrum is due to the addi-tional coupling from the 13C-labeled methyl group fromDMSO, which was trapped by 4-POBN and generated asa result of the reaction of hydroxyl radicals with DMSO[16,17,22–25]. Figure 1D is a radical adduct spectrum ofa control (saline � 0.3 ml 13C-DMSO/kg and 4-POBN)rat 60 min after spin trap administration, demonstratingan ambient level of radicals present, including the hy-droxyl radical-derived methyl radical adduct.
Figure 2 shows the simulated composite 4-POBNradical adducts spectrum of the experimental spectrum(also shown in Fig. 1C; correlation coefficient � 0.958)60 min after AFB1 (in 13C-DMSO) and 4-POBN treat-ment, made up of a mixture containing hyperfine cou-pling constants from a 4-POBN/•13CH3 adduct [42.5%(spectral peak component contribution); aN � 16.06 G,a13C � 4.98 G, and a�
H � 2.70 G], a 4-POBN/lipid-derived radical adduct (53.5%; aN � 15.61 G, a�
H �2.67 G) and the ascorbyl radical (4.5%; aH � 1.83 G),which compared with previously published literature val-ues [15,22,26,27].
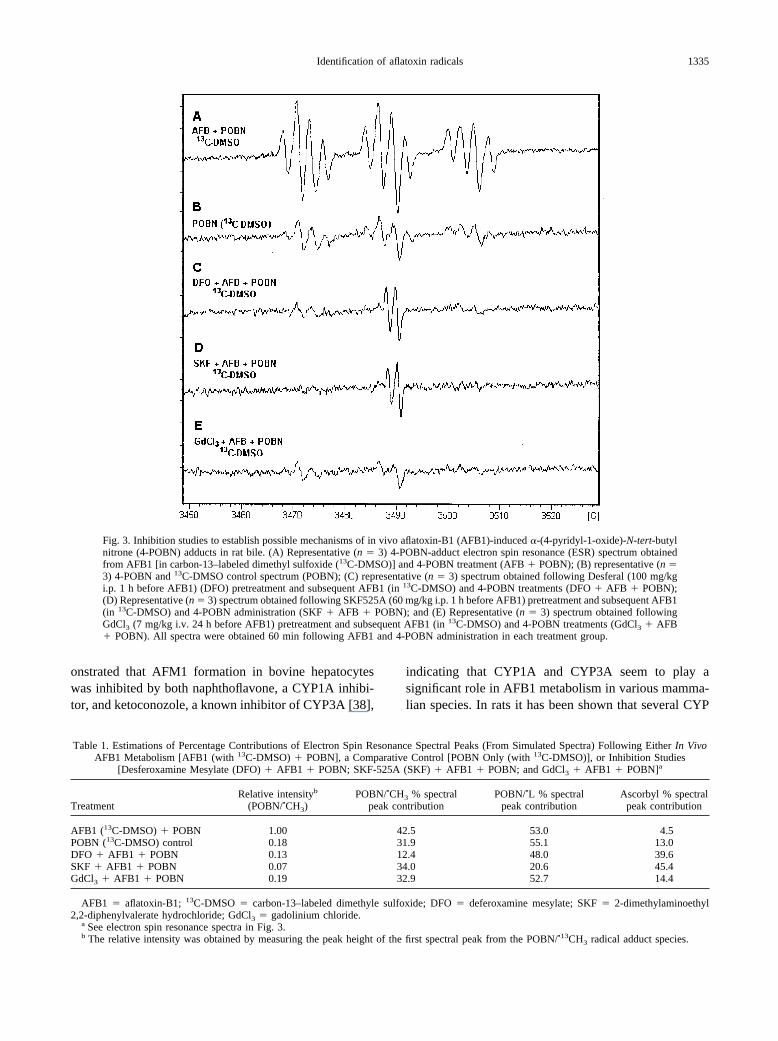
Figure 3 demonstrates that Desferral (DFO), an ironchelator, and SKF525A, a mixed-function oxidase inhib-itor, both dramatically decrease the levels of all4-POBN-adducts detected in rat bile 60 min after AFB1treatment. Figure 3E demonstrates a decrease in 4-POBNradical adduct signal if GdCl3, a Kupffer cell inactivator,is preadministered before AFB1. The level of the4-POBN/methyl radical adduct was substantially de-creased by all of the studied inhibitors (DFO, SKF525A,and GdCl3), whereas residual levels of other 4-POBNadducts (primarily the lipid-derived species) were stillpresent following either DFO inhibition or GdCl3 inac-tivation of Kupffer cells. Comparative percentage con-tributions of simulated ESR spectral peak areas from invivo AFB1 metabolism, a control, and following inhibi-tion studies (from spectra shown in Fig. 3) are summa-rized in Table 1.
Figure 4A was obtained following administration ofthe hydroxylated AFB1 metabolite, AFM1, in the pres-ence of 4-POBN and 13C-DMSO in vivo in rat bile,depicting the characteristic 12 line 4-POBN/•13CH3 ad-duct signal in combination with other radical adductsignals. Hyperfine coupling constants of the spectrumshown in Fig. 4A were obtained by simulation (notshown; correlation coefficient � 0.90) of a mixture of thefollowing components: 4-POBN/•13CH3 adduct (23.5%;aN � 16.04 G, a13C � 5.02 G, and a�
H � 2.48 G), a4-POBN/lipid-derived radical adduct (65.3%; aN �15.53 G, a�
H � 2.61 G) and the ascorbyl radical (11.2%;aH � 2.24 G), which closely compared to the hyperfinecoupling constants for the spectrum in Fig. 1C (simula-tion in Fig. 2) 60 min. after AFB1 (in 13C-DMSO) and4-POBN exposure.
1332 R. A. TOWNER et al.

Due to the high cost and low availability of AFM1,this compound was administered to the liver directly viathe hepatic portal vein. A control administered onlyDMSO was also assessed (see Fig. 4B). To ensure that4-POBN would be present in the liver prior to AFM1administration, 4-POBN was injected i.p. 30 min beforeAFM1 exposure. The bile samples for both the AFM1and DMSO control treated rats were obtained 50 minfollowing 4-POBN i.p. injection, or 20 min followingAFM1 or DMSO alone intrahepatic portal vein injection.The concentration of the AFM1 for intrahepatic portalvein injection was based on approximately 10% of theAFB1 being metabolized to AFM1, and the 3 mg/kg i.p.dose used for the AFB1 studies.
Figure 5A is a HPLC-ESR chromatogram of an invivo rat bile sample obtained 60 min following AFB1 (in12C-DMSO) and 4-POBN administration, which depictstwo prominent peaks at 4.54 min (peak 1) and 14.84 min(peak 5) retention times. Figure 5B is a HPLC-ESR
chromatogram obtained from an in vitro mixture of ara-chidonic acid (20:4), lipoxygenase, and 4-POBN. Notethe retention times of the peaks at 14.44 and 15.14 min(labeled peaks 5a and 5b, respectively) in Fig. 5B, whichelute at a similar retention time in the rat bile sample inFig. 5A (peak 5). Figure 5C is a HPLC-ESR chromato-gram obtained from an in vitro mixture of DMSO,4-POBN and iron sulfate, which gave two prominentpeaks at 4.56 and 6.10 min retention times (peaks 1 and4, respectively). The retention times of peaks 1 in Fig.5A and Fig. 5C are similar.
DISCUSSION
As depicted in the proposed mechanisms of radicalformation from AFB1 in Fig. 6, AFB1 is mainly metab-olized to the AFB1-8,9-epoxide via cyt. P-450 mono-oxygenases (CYP), but has also been proposed by otherinvestigators to form the epoxide via lipoxygenase (LO)
Fig. 1. Electron spin resonance (ESR) spectra of �-(4-pyridyl-1-oxide)-N-tert-butyl nitrone (4-POBN) radical adducts from rat bilefollowing in vivo aflatoxin-B1 (AFB1) exposure, and comparative controls. (A) Representative (n � 7) 4-POBN adduct ESR spectrumobtained 60 min following AFB1 exposure [3 mg/kg i.p. in carbon-12–labeled dimethyl sulfoxide (12C-DMSO; 0.03 ml/kg rat)] andsimultaneous administration of 4-POBN (1 g/kg i.p.). (B) Representative (n � 7) 4-POBN adduct ESR spectrum obtained 60 minfollowing treatment with saline and 0.03 ml/kg 12C-DMSO (i.p.) (control) and simultaneous administration of 4-POBN (1 g/kg i.p.).(C) Representative (n � 3) 4-POBN adduct ESR spectrum obtained 60 min following AFB1 exposure [3 mg/kg i.p. in 13C-DMSO (0.03ml/kg rat)] and simultaneous administration of 4-POBN (1 g/kg i.p.). (D) Representative (n � 3) 4-POBN adduct ESR spectrumobtained 60 min following treatment with saline and 0.03 ml/kg 13C-DMSO (i.p.) (control) and simultaneous administration of 4-POBN(1 g/kg i.p.).
1333Identification of aflatoxin radicals

[28]. A general CYP inhibitor can inhibit the formationof both hydroxyl radical (detected as methyl radical inthe presence of DMSO) and lipid-derived radicals (asshown if Fig. 3D). Desferal (DFO) can also inhibit theformation of hydroxyl and lipid-derived radicals (seeFig. 3C). Postulated Kupffer cell-generated formation of
reactive oxygen species can be inhibited by the Kupffercell inactivator, GdCl3 (see Fig. 3E).
The in vivo detection and identification of trappedbiological radicals resulting from AFB1 metabolism sup-ports evidence by other investigators that oxidative stressmay be one of the underlying mechanisms for the cyto-toxicity associated with aflatoxin B1 exposure. A previ-ous study by Shen and co-investigators demonstratedwith the use of a fluorescent probe, 2�,7�-dichlorofluo-rescin diacetate, that AFB1 increases ROS formation invitro in cultured rat hepatocytes [7]. They also showedwith the use of DFO (which binds Fe3�) or the hydroxylradical scavenger DMSO, that these compounds inhib-ited dichlorofluorescin (DCF) fluorescence formation[7]. Our in vivo results seem to concur with those fromthe Shen study [7], where we demonstrated that pread-ministration of DFO prior to AFB1 exposure resulted ina substantial decrease in the level of AFB1-inducedradicals detected with the spin trap 4-POBN. The resultsobtained in this study seem to suggest that iron-depen-dent hydroxyl radical formation may play a role in ini-tiating AFB1-induced cytotoxicity or carcinogenesis.
DFO readily chelates iron to form a redox-inert iron(III) complex, which removes Fe3� from the redox cycle,and prevents hydroxyl (•OH) radical formation via theFenton reaction [29]. The liver is particularly vulnerableto free radical-induced damage involving iron, becauseiron is stored in large amounts as ferritin andhemosiderin.
Most stored iron is in the ferric state (Fe3�), therelease of which can create a pool of iron which canparticipate in the Fenton reaction (H2O2 � Fe2�3 Fe3�
� •OH � OH�), in the presence of a reductant, such assuperoxide, where the reduction of Fe3� to Fe2� isenhanced. Both ferric and ferrous ions and their chelatesare involved in the formation of oxygen radicals and mayinitiate or participate in lipid peroxidation [30]. A studyby Sreejayan et al. on curcumin showed that ferric ionsstimulate more lipid peroxidation than ferrous ions [31].
A study by Awney and co-investigators demonstratedthat there is a substantial increase in H2O2 formationduring AFB1 metabolism by rat liver microsomes [32].Hydrogen peroxide is a precursor of the hydroxyl radical(•OH) via the Fenton reaction. H2O2 has been shown tobe formed by microsomes from the dismutation of O2
•�
and from the breakdown of the peroxygenated p-450complex [33,34].
We were also able to prevent radical formation withSKF525A, a widely studied general CYP inhibitor. Thedamage to rat hepatocytes by AFB1 was also preventedby pretreatment with SKF525A in a previous study re-ported by Nakea et al. [35]. AFB1 metabolism is thoughtto be mainly initiated by isoenzymes CYP1A and 3A inhumans [36,37]. A recent study by Kuilman et al. dem-
Fig. 2. Computer simulation of �-(4-pyridyl-1-oxide)-N-tert-butyl ni-trone (4-POBN) radical adducts in rat bile detected following in vivoaflatoxin-b1 (AFB1) exposure (experimental and simulation spectra ofthe spectrum in Fig. 1C). The experimental spectrum was simulated(95.8% correlation coefficient) as a composite of (1) a 4-POBN spinadduct (42.5%) with hyperfine couplings of aN � 16.06 G, a13C � 4.98G and a�H � 2.70 G, similar to those reported for the 4-POBN methyladduct (POBN/•13CH3), (2) a 4-POBN spin adduct (53%) with hyper-fine couplings of aN � 15.61 G and a�H � 2.67 G, similar to thosereported for the 4-POBN lipid-derived radical adduct, and (3) theascorbyl radical (aH � 1.83 G) (4.5%).
1334 R. A. TOWNER et al.
onstrated that AFM1 formation in bovine hepatocyteswas inhibited by both naphthoflavone, a CYP1A inhibi-tor, and ketoconozole, a known inhibitor of CYP3A [38],
indicating that CYP1A and CYP3A seem to play asignificant role in AFB1 metabolism in various mamma-lian species. In rats it has been shown that several CYP
Fig. 3. Inhibition studies to establish possible mechanisms of in vivo aflatoxin-B1 (AFB1)-induced �-(4-pyridyl-1-oxide)-N-tert-butylnitrone (4-POBN) adducts in rat bile. (A) Representative (n � 3) 4-POBN-adduct electron spin resonance (ESR) spectrum obtainedfrom AFB1 [in carbon-13–labeled dimethyl sulfoxide (13C-DMSO)] and 4-POBN treatment (AFB � POBN); (B) representative (n �3) 4-POBN and 13C-DMSO control spectrum (POBN); (C) representative (n � 3) spectrum obtained following Desferal (100 mg/kgi.p. 1 h before AFB1) (DFO) pretreatment and subsequent AFB1 (in 13C-DMSO) and 4-POBN treatments (DFO � AFB � POBN);(D) Representative (n � 3) spectrum obtained following SKF525A (60 mg/kg i.p. 1 h before AFB1) pretreatment and subsequent AFB1(in 13C-DMSO) and 4-POBN administration (SKF � AFB � POBN); and (E) Representative (n � 3) spectrum obtained followingGdCl3 (7 mg/kg i.v. 24 h before AFB1) pretreatment and subsequent AFB1 (in 13C-DMSO) and 4-POBN treatments (GdCl3 � AFB� POBN). All spectra were obtained 60 min following AFB1 and 4-POBN administration in each treatment group.
Table 1. Estimations of Percentage Contributions of Electron Spin Resonance Spectral Peaks (From Simulated Spectra) Following Either In VivoAFB1 Metabolism [AFB1 (with 13C-DMSO) � POBN], a Comparative Control [POBN Only (with 13C-DMSO)], or Inhibition Studies
[Desferoxamine Mesylate (DFO) � AFB1 � POBN; SKF-525A (SKF) � AFB1 � POBN; and GdCl3 � AFB1 � POBN]a
TreatmentRelative intensityb
(POBN/•CH3)POBN/•CH3 % spectral
peak contributionPOBN/•L % spectral
peak contributionAscorbyl % spectral
peak contribution
AFB1 (13C-DMSO) � POBN 1.00 42.5 53.0 4.5POBN (13C-DMSO) control 0.18 31.9 55.1 13.0DFO � AFB1 � POBN 0.13 12.4 48.0 39.6SKF � AFB1 � POBN 0.07 34.0 20.6 45.4GdCl3 � AFB1 � POBN 0.19 32.9 52.7 14.4
AFB1 � aflatoxin-B1; 13C-DMSO � carbon-13–labeled dimethyle sulfoxide; DFO � deferoxamine mesylate; SKF � 2-dimethylaminoethyl2,2-diphenylvalerate hydrochloride; GdCl3 � gadolinium chloride.
a See electron spin resonance spectra in Fig. 3.b The relative intensity was obtained by measuring the peak height of the first spectral peak from the POBN/•13CH3 radical adduct species.
1335Identification of aflatoxin radicals

monoxygenases are able to activate AFB1, includingseveral isoforms of CYP1A, CYP2B1, CYP2C11, andCYP3A2 [39–42].
It has been shown by Roy and Kulkarni that AFB1epoxidation can also be catalyzed by human-derivedliver lipoxygenases [28], suggesting other possiblemechanisms of free radical generation from AFB1 me-tabolism. In addition, it was shown by Donnelly et al.that the biotransformation of AFB1 in human lung seemsto mainly involve lipoxygenase and prostaglandin Hsynthase mediation, rather than CYP intervention [43].In our study, however, the level of free radicals (includ-ing hydroxyl radicals) were substantially decreased withthe use of the CYP inhibitor, SKF525A, suggesting thatlipoxygenase may play a minor role in vivo in liver.
Direct ESR spectra of single peaks from rat microso-mal benzene extracts treated with either AFB1 or AFM1,a major hydroxylated metabolite of AFB1, were previ-ously detected by Kodama et al., suggesting in vitrogenerated free radical formation from AFB1 microsomalmetabolism [6]. The AFM1-derived free radical in theKodama study was proposed to be formed as a result ofthe auto-oxidation of AFM1 [6]. In our study, we wereable to demonstrate that AFM1 can also form free radi-cals in vivo, indicating that the detected free radicals are
generated after AFM1 formation. It is estimated thatabout 6% of AFB1 is thought to be metabolized toAFM1 [4].
With the use of GdCl3, a Kupffer cell inactivator[44–46], we also demonstrated that Kupffer cells mayplay a role in the generation of AFB1 metabolism-de-rived free radicals. It was found by Roland et al. thatgadolinium blocks rat Kupffer cell calcium channels,therefore transiently inactivating them [44]. Kupffercells, resident hepatic macrophages, can generate reac-tive oxygen species through NADPH oxidase [47]. It hasbeen demonstrated by some investigators that Kupffercells may be involved in the metabolism of AFB1 inisolated reticuloendothelial nonparenchymal cells(Kupffer and endothelial cells) [48,49]. It was estimatedby Jennings et al. that isolated reticuloendothelial non-parenchymal cells metabolized a total of 28% of theAFB1 [49].
The identity of the 4-POBN-adducts generated fromAFB1 metabolism in vivo seem to result from a combi-nation of: (i) a lipid-derived radical adduct as a result oflipid peroxidation, the major trapped species; and (ii) amethyl radical adduct resulting from the reaction of13C-DMSO with hydroxyl radical. The lipid-derived rad-ical adduct seems to be an arachidonate-derived metab-
Fig. 4. Electron spin resonance (ESR) spectra of �-(4-pyridyl-1-oxide)-N-tert-butyl nitrone (4-POBN) radical adducts in rat bilefollowing in vivo aflatoxin-M1 (AFM1) exposure, and a comparative control. (A) ESR spectrum obtained following 4-POBN (1 g/kgi.p. 30 min prior to AFM1 treatment) and AFM1 administration (20 �g in 200 �l 13C-DMSO and 100 �l saline; via intraportal veininjection). The spectrum was obtained 20 min after AFM1 intraportal vein injection. The hyperfine coupling constants (obtained fromsimulation) are: 4-POBN/•13CH3 adduct (23.5%; aN � 16.04 G, a13C � 5.02 G, and a�
H � 2.48 G), a 4-POBN/lipid-derived radicaladduct (65.3%; aN � 15.53 G, a�
H � 2.61 G) and the ascorbyl radical (11.2%; aH � 2.24 G). (B) ESR spectrum obtained following4-POBN (1 g/kg i.p.) administration prior to AFM1 treatment. (C) ESR spectrum obtained following 4-POBN (1 g/kg i.p. 30 min priorto 13C-DMSO treatment) and 13C-DMSO (200 �l in 100 �l saline; via intraportal vein injection). The spectrum was obtained 20 minafter 13C-DMSO intraportal vein injection.
1336 R. A. TOWNER et al.

olite, as determined from the HPLC retention time of the4-POBN adduct, which is similar to that of two closelyeluting peaks obtained from an in vitro mixture of ara-chidonate and 4-POBN in the presence of lipoxygenase[21]. More specifically, the HPLC-ESR chromatogramobtained from an in vivo rat bile sample following AFB1and 4-POBN administration in Fig. 5A depicts twoprominent peaks, peak 1, which is thought to be predom-inantly 4-POBN/•CH3 with possible contributions from4-POBN/arachidonic dihydroxyl radical adducts[4-POBN/•L20:4(OH)2] (peaks 2 and 3 in Fig. 5B), andpeak 5 which is a combination of 4-POBN/arachidonicacid-derived radical adducts [21]. The ESR-HPLC chro-matogram of a mixture containing arachidonic acid, li-poxygenase and 4-POBN in Fig. 5B, depicts a series ofpeaks, where peaks 2 and 3 are 4-POBN/arachidonicdihydroxyl radical adducts, peaks 5a and 5b are a com-bination of arachidonic acid-derived 4-POBN/•C7H11O2
and 4-POBN/•C11H19 radical adducts, and peak 6 is the4-POBN/•C5H11 (pentyl) radical adduct [21]. Finally, theESR-HPLC chromatogram of a mixture containingDMSO, 4-POBN and iron sulfate [Fe(II)] in Fig. 5C,depicts two peaks labeled 1 and 4, which are thought tobe either two diastereomeric isomers of 4-POBN/•CH3,or 4-POBN/•CH3 (peak 1) and 4-POBN/CH3S(O)CH2
•
(peak 4). In the study by Qian et al. improved on-lineHPLC/ESR spectroscopy methods (optimized resolutionand sensitivity) and mass spectrometric analysis (elec-trospray mass and tandem mass spectrometry-mass spec-trometry (MS/MS) of high purity analytes) were used toidentify a number of lipid-derived radicals formed fromin vitro and in vivo lipid peroxidation [21]. It was deter-mined from that study that identification of a lipid-derived radical adduct is only possible with the use ofon-line HPLC separation coupled with ESR detectionand subsequent MS structure elucidation [21]. Sole ESR
Fig. 5. High-performance liquid chromatography-electron spin resonance (HPLC-ESR) chromatograms of �-(4-pyridyl-1-oxide)-N-tert-butyl nitrone (4-POBN) radical adducts from rat bile following in vivo aflatoxin-B1 (AFB1) metabolism. (A) HPLC-ESRchromatogram (0–35 min) obtained of an in vivo rat bile sample 60 min following AFB1 and 4-POBN administration (see Fig. 1C forESR spectrum), depicting two prominent peaks labeled 1 (predominantly 4-POBN/•CH3) and 5 (4-POBN/arachidonic radical adducts);(B) HPLC-ESR chromatogram (0–35 min) of a mixture containing arachidonic acid, lipoxygenase and 4-POBN, depicting a series ofpeaks {peaks 2 and 3 [4-POBN/arachidonic dihydroxyl radical adducts (4-POBN/•L20:4(OH)2]}, peaks 5a and 5b (combination ofarachidonic acid-derived 4-POBN/•C7H11O2 and 4-POBN/•C11H19 radical adducts), and peak 6 (4-POBN/•C5H11 (pentyl)) ([21] forcomplete assignments); and (C) HPLC-ESR chromatogram (0–35 min) of a mixture containing DMSO, 4-POBN, and iron sulfate[Fe(II)], depicting 2 peaks labeled 1 and 4 (possibly two diastereomeric isomers of 4-POBN/•CH3 (peak 1:aN 15.5 G and aH2.8 G; peak4: aN 16.0 G and aH2.6 G), or peak 4 may be 4-POBN/•CH3S(O)CH2
•; aN 14.5 G and aH 2.2 G).
1337Identification of aflatoxin radicals

detection of spin adducts often results in the detection ofa composite of overlapping multiple radical adducts ofunknown or speculated identity.
The method of using DMSO with 4-POBN to traphydroxyl radicals has been used by numerous investiga-tors [16,17,22–25]. The use of spin trapping compoundsfor the direct detection of hydroxyl radicals in biologicalsystems is severely limited by the low stability of theformed hydroxyl radical-nitroxide spin adduct. DMSOhas been shown to be quite efficient in trapping hydroxylradicals [50,51]. The subsequent formation of the methylradical can be trapped by 4-POBN subsequently forminga highly stable spin adduct that can readily be detectedby ESR spectroscopy. With the use of 13C-labeledDMSO, it is possible to distinguish hydroxyl radical(detected as the 4-POBN/•13C-methyl adduct) from other
radicals, such as lipid-derived radicals. 13C-DMSO hasalso been recently used to investigate biological hy-droxyl radical formation in other models, such as lipopo-lysaccharide-induced sepsis [22], and formate intoxica-tion [16].
Based on our in vivo results and the in vitro studies ofnumerous other investigators, it seems that free radicalformation from AFB1 metabolism requires initial in-volvement of CYP, and subsequent involvement of bothiron-mediation and Kupffer cells. Although we haveproposed a number of mechanisms (some compiled assuggestions from previous investigators) that could leadto the formation of free radical metabolites from AFB1metabolism, many of the steps linking the formation offree radical metabolites from either AFB1-8,9-epoxida-tion and/or AFM1 formation, and/or the involvement ofiron-catalyzed reactions, and/or the involvement ofKupffer cells, remain unknown at this stage and requirefurther study.
Acknowledgements — The authors would like to thank Dr. Henry D.Connor for his discussions on the use of metabolic inhibitors, and Ms.Jean Corbett for her help with animal care and general assistance at theNIEHS facility.
REFERENCES
[1] Denissenko, M. F.; Cahill, J.; Koudriakova, T. B.; Gerber, N.;Pfeifer, G. P. Quantitation and mapping of aflatoxin B1-inducedDNA damage in genomic DNA using aflatoxin B1-8,9-epoxideand microsomal activation systems. Mutat. Res. 425:205–211;1999.
[2] Smela, M. E.; Currier, S. S.; Bailey, E. A.; Essigmann, J. M. Thechemistry and biology of aflatoxin B (1): from mutational spec-trometry to carcinogenesis. Carcinogenesis 22:535–545; 2001.
[3] Smela, M. E.; Hamm, M. L.; Henderson, P. T.; Harris, C. M.;Harris, T. M.; Essigmann, J. M. The aflatoxin B1 formamidopy-rimidine adduct plays a major role in causing the types of muta-tions observed in human hepatocellular carcinoma. PNAS 99:6655–6660; 2002.
[4] Creppy, E. E. Update of survey, regulation and toxic effects ofmycotoxins in Europe. Toxicol. Lett. 127:19–28; 2002.
[5] Scholl, P. F.; Musser, S. M.; Groopman, J. D. Synthesis andcharacterization of aflatoxin B1 mercapturic acids and their iden-tification in rat urine. Chem. Res. Toxicol. 10:1144–1151; 1997.
[6] Kodama, M.; Inoue, F.; Akao, M. Enzymatic and non-enzymaticformation of free radicals from aflatoxin B1. Free Radic. Res.Commun. 10:137–142; 1990.
[7] Shen, H. M.; Shi, C. Y.; Shen, Y.; Ong, C. N. Detection ofelevated reactive oxygen species level in cultured rat hepatocytestreated with aflatoxin B1. Free Radic. Biol. Med. 21:139–146;1996.
[8] Rastogi, R.; Srivastava, A. K.; Srivastava, M.; Rastogi, A. K.Hepatocurative effect of picroliv and silymarin against aflatoxinB1 induced hepatotoxicity in rat. Planta Med. 66:709–713; 2000.
[9] Rastogi, R.; Srivastava, A. K.; Rastogi, K. Long term effect ofvaflatoxin B1 on lipid peroxidation in rat liver and kidney: effectof picroliv and silymarin. Phytotherapy Res. 15:307–310; 2001.
[10] Wang, C. J.; Hsu, J. D.; Lin, J. K. Suppression of aflatoxinB1-induced hepatotoxic lesions by crocetin (a natural carotenoid).Carcinogenesis 12:1807–1810; 1991.
[11] Qin, G.; Gopalan-Kriczy, P.; Su, J.; Ning, Y.; Lotlikar, P. D.Inhibition of aflatoxin B1-induced initiation of hepatocarcinogen-esis in the rat by green tea. Cancer Lett. 112:149–154; 1997.
Fig. 6. Proposed mechanisms for the formation of reactive oxygenspecies and secondary free radicals from the in vivo metabolism ofaflatoxin-B1 (AFB1). AFM1 � aflatoxin-M1; 13C-DMSO � carbon-13–labeled dimethyl sulfate; CYP � cytochrome P-450; DFO � de-feroxamine mesylate; GdCl3 � gadolinium chloride; L � lipid-derivedradical; LH � polyunsaturated fatty acid; LOx � lipoxygenase; SKF �2-dimethylaminoethyl-2,2-diphenylvalerate hydrochloride.
1338 R. A. TOWNER et al.

[12] Muto, S.; Fujita, K.-I.; Yamazaki, Y.; Kamataki, T. Inhibition bygreen tea catechins of metabolic activation of procarcinogens byhuman cytochrome P450. Mutation Res. 479:197–206; 2001.
[13] Choi, C. Y.; Park, S. H.; Park, E. H.; Cha, Y. N. Alteration ofaflatoxin B1 metabolic profiles and reduction of aflatoxin B1mutagenicity by hepatic microsomes of rats fed butylated hy-droxyanisole. J. Toxicol. Sci. 16(Suppl. 1):119–132; 1991.
[14] Lee, S.-E.; Campbell, B. C.; Molyneux, R. J.; Haseyawa, S.; Lee,H.-S. Inhibitory effects of naturally occurring compounds onaflatoxin B1 biotransformation. J. Agric. Food Chem. 49:5171–5177; 2001.
[15] Towner, R. A.; Mason, R. P.; Reinke, L. A. In vivo detection ofaflatoxin-induced lipid free radicals in rat bile. Biochim. Biophys.Acta 1573:55–62; 2002.
[16] Dikalova, A. E.; Kadiiska, M. B.; Mason, R. P. An in vivo ESRspin-trapping study: free radical generation in rats from formateintoxication—role of the Fenton reaction. PNAS98:13549–13553; 2001.
[17] Nakao, L. S.; Kadiiska, M. B.; Mason, R. P.; Grijalba, M. T.;Augusto, O. Metabolism of acetaldehyde to methyl and acetylradicals: in vitro and in vivo electron paramagnetic resonancespin-trapping studies. Free Radic. Biol. Med. 29:721–729; 2000.
[18] Duling, D. R. Simulation of multiple isotropic spin trap EPRspectra. J. Magn. Reson. 104:105–110; 1994.
[19] Iwashi, H.; Albro, P. W.; McGown, S. R.; Tomer, K. B.; Mason,R. P. Isolation and identification of 4-POBN radical adductsformed by the decomposition of the hydroperoxides of linoleicacid, linolenic acid, and arachidonic acid by soybean lipoxygen-ase. Arch. Biochem. Biophys. 285:172–180; 1991.
[20] Qian, S. Y.; Tomer, K. B.; Yue, G.-H.; Guo, Q.; Kadiiska, M. B.;Mason, R. P. Characterization of the initial carbon-centered pen-tadienyl radical and subsequent radicals in lipid peroxidation:identification via on-line high performance liquid chromatogra-phy/electron spin resonance and mass spectrometry. Free Radic.Biol. Med. 33:998–1009; 2002.
[21] Qian, S. Y.; Yue, G.-H.; Tomer, K. B.; Mason, R. P. Identificationof all classes of spin-trapped carbon-centered radicals in soybeanlipoxygenase-dependent lipid peroxidations of �-6 polyunsatu-rated fatty acids via LC/ESR, LC/MS and tandem MS. FreeRadic. Biol. Med. 34:1017–1028; 2003.
[22] Linares, E.; Nakao, L. S.; Augusto, O.; Kadiiska, M. B. EPRstudies of in vivo radical production by lipopolysaccharide: po-tential role of iron mobilized from iron-nitrosyl complexes. FreeRadic. Biol Med. 34:766–773; 2003.
[23] Rusyn, I.; Kadiiska, M. B.; Dikalova, A.; Kano, H.; Yin, M.;Tsuchiya, K.; Mason, R. P.; Peters, J. M.; Gonzales, F. J.; Segal,B. H.; Holland, S. M.; Thurman, R. G. Phthalates rapidly increaseproduction of reactive oxygen species in vivo: role of Kupffercells. Mol. Pharmacol. 59:744–750; 2001.
[24] Zhong, Z.; Connor, H. D.; Yin, M.; Wheeler, M. D.; Mason, R. P.;Thurman, R. G. Viral delivery of superoxide dismutase genereduces cyclosporine A-induced nephrotoxicity. Kidney Int. 59:1397–1404; 2001.
[25] Pou, S.; Ramos, C. L.; Gladwell, T.; Renks, E.; Centra, M.;Young, D.; Cohen, M. S. A kinetic approach to the selection of asensitive spin trapping system for the detection of hydroxyl rad-ical. Anal. Biochem. 217:76–83; 1994.
[26] Chamulitrat, W.; Jordan, S. J.; Mason, R. P. Fatty acid radicalformation in rats administered oxidized fatty acids: in vivo spintrapping investigation. Arch. Biochem. Biophys. 299:361–367;1992.
[27] Kadiiska, M. B.; Morrow, J. D.; Awad, J. A.; Roberts, L. J.;Mason, R. P. Identification of free radical formation and F2-isoprostanes in vivo by acute Cr(VI) poisoning. Chem. Res. Toxi-col. 11:1516–1520; 1998.
[28] Roy, S. K.; Kulkarni, A. P. Aflatoxin B1 epoxidation catalyzed bypartially purified human liver lipoxygenase. Xenobiotica 27:231–241; 1997.
[29] Burkitt, M. J.; Kadiiska, M.B.; Hanna, P. M.; Jordan, S. J.;Mason, R. P. Electron spin resonance spin-trapping investigationinto the effects of paraquat and desferrioxamine on hydroxyl
radical generation during acute iron poisoning. Mol. Pharmacol.43:257–263; 1992.
[30] Gutteridge, J. M. C.; Richmond, R.; Halliwell, B. Inhibition of theiron catalysed formation of hydroxyl radicals from superoxideand lipid peroxidation by desferrioxamine. Biochem. J. 184:469–472; 1979.
[31] Sreejayan, N.; Rao, M. N. A. Curcumin inhibits iron-dependentlipid peroxidation. Int. J. Pharm. 100:93–97; 1993.
[32] Awney, H. A.; Attih, A. M.; Habib, S. L.; Mostafa, M. H. Effectof melatonin on the production of microsomal hydrogen peroxideand cytochrome P-450 content in rat treated with aflatoxin B1.Toxicology 172:143–148; 2002.
[33] White, R. E.; Coon, M. J. Oxygen activation by cytochromeP-450. Annu. Rev. Biochem. 49:315–356; 1980.
[34] White, R. E. The involvement of free radicals in the mechanismsof monooxygenases. Pharmacol. Ther. 49:21–42; 1991.
[35] Nakae, D.; Konishi, Y.; Farber, J. L. A role for oxygen radicals inthe hepatotoxicity of aflatoxin B1 and dimethylnitosoamine. Proc.Jap. Cancer Assoc. p. 38; 1987.
[36] Aoyama, T.; Yamano, S.; Guzelian, P. S.; Gelboin, H. V.; Gonza-lez, F. J. Five of 12 forms of vaccinia virus-expressed humanhepatic cytochrome P450 metabolically activate aflatoxin B1.PNAS 87:4790–4793; 1990.
[37] Forrester, L. M.; Neal, G. E.; Judah, D. J.; Glancey, M. J.; Wolf,C. R. Evidence for involvement of multiple forms of cytochromeP-450 in aflatoxin B1 metabolism in human liver. PNAS 87:8306–8310; 1990.
[38] Kuilman, M. E. M.; Maas, R. F. M.; Fink-Gremmels, J. Cyto-chrome P450-mediated metabolism and cytotoxicity of aflatoxinB1 in bovine hepatocytes. Toxicol. In Vitro 14:321–327; 2000.
[39] Koser, P. L.; Faletto, M. B.; Maccubbin, A. E.; Gurtoo, H. L. Thegenetics of aflatoxin B1 metabolism. J. Biol. Chem. 263:12584–12595; 1988.
[40] Buetler, T. M.; Bammler, T. K.; Hayes, J. D.; Eaton, D. L.Oltopraz mediated changes in aflatoxin B1 biotransformation inrat liver: implications for human chemointervention. Cancer Res.56:2306–2313; 1996.
[41] Doehmer, J.; Dogra, S.; Friedberg, T.; Monier, S.; Adesnik, M.;Glatt, H.; Oesch, F. Stable expression of rat cytochrome P450IIB1cDNA in Chinese hamster cells (V79) and metabolic activation ofaflatoxin B1. PNAS 85:5769–5773; 1988.
[42] Imaoka, S.; Ikemoto, S.; Shimada, T.; Funea, Y. Mutagenicactivation of aflatoxin B1 by pulmonary, renal and hepatic cyto-chrome P450s from rats. Mutat. Res. 269:231–236; 1992.
[43] Donnelly, P. J.; Stewart, R. K.; Ali, S. L.; Conlan, A. A.; Reid,K. R.; Petsikas, D.; Massey, T. E. Biotransformation of aflatoxinB1 in human lung. Carcinogenesis 17:2487–2494; 1996.
[44] Roland, C. R.; Naziruddin, B.; Mohanakumar, T.; Flye, M. W.Gadolinium blocks rat Kupffer cell calcium channels: relevanceto calcium-dependent prostaglandin E2 synthesis and septic mor-tality. Hepatology 29:756–765; 1999.
[45] Sakurai, F.; Terada, T.; Yasuda, K.; Yamashita, F.; Takakura, Y.;Hashida, M. The role of tissue macrophages in the induction ofproinflammatory cytokine production following intravenous in-jection of lipoplexes. Gene Ther. 9:1120–1126; 2002.
[46] Towner, R. A.; Reinke, L. A.; Janzen, E. G.; Yamashiro, S. Invivo magnetic resonance imaging study of Kupffer cell involve-ment in CCl4-induced hepatotoxicity in rats. Can. J. Physiol.Pharmacol. 72:441–446; 1994.
[47] Decker, K. Biologically active products of stimulated liver mac-rophages (Kupffer cells). Eur. J. Biochem. 192:245–261; 1990.
[48] Gemechu-Hatewu, M.; Platt, K. L.; Oesch, F.; Steinberg, P.Distribution and induction of aflatoxin B1-9a-hydroxylase activ-ity in rat liver parenchymal and non-parenchymal cells. Arch.Toxicol. 70:553–558; 1996.
[49] Jennings, G. S.; Heck, R.; Oesch, F.; Steinberg, P. Metabolismand cytotoxicity of aflatoxin B1 in cultured rat hepatocytes andnon-parenchymal cells: implications for tumorigenesis. Toxicol.Appl. Pharmacol. 129:86–94; 1994.
[50] Novakov, C. P.; Stoyanovsky, D. A. Comparative metabolism ofN-tert-Butyl-N-[1-(1-oxy-pyridin-4-yl)-ethyl]- and N-tert-Butyl-
1339Identification of aflatoxin radicals

N-(1-phenyl-ethyl)-nitroxide by the cytochrome P450 monoxyge-nase system. Chem. Res. Toxicol. 15:749–753; 2002.
[51] Stoyanovsky, D. A.; Melnikov, Z.; Cederbaum, A. I. ESR andHPLC-EC analysis of the interaction of hydroxyl radical withDMSO: rapid reduction and quantification of POBN and PBNnitroxides. Anal. Chem. 71:715–721; 1999.
ABBREVIATIONS
AFB1—aflatoxin-B1AFM1—aflatoxin-M1AN—acetonitrileBC—bathocuproine disulfonic acid, disodium salt hy-
drate13C-DMSO—carbon-13–labeled DMSOCYP—cytochrome P-450DCF—dichlorofluorescinDFO—deferoxamine mesylateDMSO—dimethyl sulfoxideDP—2,2�-dipyridyl
ESR—electron spin resonanceGdCl3—gadolinium chlorideH2O2—hydrogen peroxideHOAc—glacial acetic acidHPLC—high-performance liquid chromatography•OH—hydroxyl radicali.p.—intraperitoneali.v.—intravenousLC/ESR—liquid chromatorgraphy/electron spin reso-
nanceNADPH—nicotinamide adenine dinucleotide phosphate
(reduced)4-POBN—�-(4-pyridyl-1-oxide)-N-tert-butyl nitrone4-POBN/•13CH3—carbon-13–labeled methyl adduct of
4-POBNROS—reactive oxygen speciesSKF525A—2-dimethylaminoethyl-2,2-diphenylvalerate
hydrochlorideTHF—tetrahydrofuran
1340 R. A. TOWNER et al.
Copyright © 2022 FDOKUMEN