
Generation and effect of photo-induced radicals on cross ...
216
Generation and effect of photo-induced radicals on cross-linking, color change, and isomerization in formulations of peptides and proteins By Indira Prajapati Copyright 2020 Submitted to the graduate degree program in Pharmaceutical Chemistry and the Graduate Faculty of the University of Kansas in partial fulfillment of the requirements for the degree of Doctor of Philosophy. Chair: Dr. Christian Schöneich Dr. John F. Stobaugh Dr. Teruna Siahaan Dr. Thomas Tolbert Dr. Prajna Dhar Date Approved: July 02, 2020
-
Upload
khangminh22 -
Category
Documents
-
view
0 -
download
0
Transcript of Generation and effect of photo-induced radicals on cross ...

Generation and effect of photo-induced radicals on cross-linking, color
change, and isomerization in formulations of peptides and proteins
By
Indira Prajapati
Copyright 2020
Submitted to the graduate degree program in Pharmaceutical Chemistry and the Graduate
Faculty of the University of Kansas in partial fulfillment of the requirements for the degree of Doctor of Philosophy.
Chair: Dr. Christian Schöneich
Dr. John F. Stobaugh
Dr. Teruna Siahaan
Dr. Thomas Tolbert
Dr. Prajna Dhar
Date Approved: July 02, 2020
ii
The Dissertation Committee for Indira Prajapati
certifies that this is the approved version of the following dissertation:
Generation and effect of photo-induced radicals on cross-linking, color
change, and isomerization in formulations of peptides and proteins
Chair: Dr. Christian Schöneich
Date Approved: July 02, 2020
iii
Abstract
Protein biotherapeutics, especially monoclonal antibodies (mAbs), have been on the rise due to
their high efficacy, potency, and low toxicity. They are mainly used for the treatment of cancer,
autoimmune diseases, infectious diseases, and organ transplantation. While mAbs are well-
tolerated by patients and have fewer adverse effects, their stability can be challenged by physical
and chemical degradation. Hence, they are formulated with buffers and other excipients such as
polysorbate 80 (PS80), which help to maintain the pH of the formulation and prevent aggregation,
respectively. However, when the drug product is exposed to light, heat, or contains metal
impurities, they are likely to undergo degradation. Some of the reactive amino acids of the proteins
such as Trp, Tyr, His, Met, and Cys residues are more prone to photooxidation. Thus, we have
investigated the effect of both UV and visible light on peptides, and proteins and further looked
into the role of protein- and buffer-derived radicals on degradation of PS80.
We explored the role of methionine sulfur cation, generated by photosensitization of 4-
carboxybenzophenone in the Met-Xn-His-containing peptides (n = 0 - 2), a common sequence
present in the biotherapeutics such as mAb and human parathyroid hormone. Here, we report on
the formation of novel photo-oxidation products and cross-links between Met oxidation product(s)
and a neighboring histidine residue. Mechanisms for the formation of these products will be
proposed. Specifically, the formation of cross-links is hypothesized to involve photo-oxidation of
Met to an aspartate semialdehyde, followed by reaction with the imidazole side chain of His, and
elimination of water.
When a full mAbZ (mAb obtained from AstraZeneca) was exposed to visible light, discoloration
of the solution was observed. The chromophoric product responsible for the color change was
identified using a model Trp-containing compound, N-acetyl-L-tryptophan amide (NATA). The
iv
product was identified as NATA-33, a conjugated product formed after loss of 33 Da from NATA,
by mass spectrometry and NMR. The mAbZ formulation contains polysorbate 80 (PS80) that has
unsaturated fatty acids such as oleic acid and linoleic acid. Hence, we address the question of how
protein-derived radicals may affect the composition of PS80. Isobaric products of PS80 were
identified by means of mass spectrometry, suggesting cis/trans isomerization of unsaturated fatty
acids of PS80. This mechanism was confirmed by the analysis of isolated fatty acids,
demonstrating, e.g., the conversion of oleic acid to elaidic acid. Another commonly used excipient
in mAb biotherapeutics is citrate buffer. In the presence of metal impurities such as iron, citrate
buffer and iron can generate citrate-derived degradants such as carbon dioxide radical anion after
exposure to UV-A light. Such radical anion can donate an electron to a disulfide bond and form a
thiyl radical, which can also induce cis/trans isomerization of unsaturated fatty acids of PS80.
Therefore, photo-induced radicals and radical ions may lead to cross-linking of amino acids, color
change in concentrated mAbs, and cis/trans isomerization of PS80.

v
To my late uncle, Ram Krishna Prajapati, for instilling in me the value of education and teaching
me to dream big
vi
Acknowledgments
I am grateful to my family, mentors, and friends for always supporting, guiding, and encouraging
me prior to and during my PhD journey. Here, I attempt to thank everyone in this brief
acknowledgment section.
First of all, I want to acknowledge my PhD advisor, Dr. Christian Schöneich, for nourishing my
scientific queries and guiding me throughout my graduate work. I greatly appreciate his time and
advice in advancing my scientific career. I thank him for polishing my scientific writing and
presentation skills and encouraging me to present my research in both national and international
conferences. He has supported me in obtaining an internship in Genentech during my PhD, which
has been a critical point for me to advance my career in the pharmaceutical industry. After years
of rigorous trainings, I find myself thinking critically before approaching a problem. I have grown
to be a confident scientist and I am better at communicating my ideas because of the discussions
we have during our 1:1 interaction, group meetings, and during our meetings with internal and
external collaborators.
I would also want to thank my dissertation committee members: Dr. John F. Stobaugh, Dr. Teruna
Siahaan, Dr. Thomas Tolbert, and Dr. Prajna Dhar for their constructive feedbacks and scientific
discussions. I would especially like to thank Dr. John F. Stobaugh and Dr. Teruna Siahaan for
reviewing my dissertation chapters and providing comments and suggestions.
My PhD work would not be possible without the funding source from Wanda Waugh Fellowship,
Goetsch scholarship, funding from AstraZeneca, and department of Pharmaceutical Chemistry at
the University of Kansas. I want to thank all of the Pharmaceutical Chemistry department staff:

vii
Nancy Helm, Michelle Huslig, Ann Heptig, Karen Hall, Nicole Brooks, and André Faucher,
without whom our research work would not be possible.
I am extremely thankful to the previous and present members of Schöneich’s lab in creating a good
work environment where we could bounce ideas, discuss data, and collaborate on projects. I want
to start off by thanking Olivier Mozziconacci in helping me to kick-start my first project. I have
always learned from his passion for science, work ethics, enthusiasm, and plethora of knowledge.
I also want to thank Asha Hewarathna, Christopher Asmus, and Lin Zhang for their help in getting
me started in the lab. I want to specially thank Jessica Bane and Rupesh Bommana for always
encouraging me, helping me with my work, and for their friendship. Their positive attitudes and
high spirit have always made work fun. I also want to thank Hasitha Rathnayaka and Natalia
Subelzu for their friendship, scientific discussion, and always having my back. I will definitely
miss our coffee breaks. I want to also thank rest of the Schoneich’s group members for their help
and support: Bjorn Peters, Huan Kang, Yaqi Wu, and Yilue Zhang.
My graduate work was in collaboration with internal and external scientists. I also want to thank
Bryan Kopec, Mario Moral, and Kavisha Ulapane from Dr. Siahaan’s lab for teaching me to
synthesize the model peptides discussed in chapter 1 of my dissertation. I want to thank Dr. Russ
Middaugh, Nick Larson, Yangjie Wei, Reza Esfandiary, Sueshkumar Chaudhary, Cavan Kalonia,
and Suzanne Hudak for their scientific contributions on chapters 3 and 4 of my dissertation. I
would also like to thank Solomon Okbazghi and Derek White for providing me with IgG1-Fc, a
project which is not addressed in my dissertation. Likewise, I want to thank our collaborators in
Genentech, Inc.: Sandeep Yadav and Anthony Timlinson for their scientific input.
viii
I had a great opportunity to work with John Wang during my internship in Genentech, Inc. I got a
chance to learn about surfactants and their degradation pathways, which helped me in exploring
other aspects of surfactant degradation during my PhD work.
My research on polysorbates and proteins would be difficult without help from the mass
spectrometry and NMR core labs. I would like to thank Todd Williams, Larry Seib, Sarah
Neuenswander, Minli Xing, and Justin Douglas for their help in setting up the instruments and
scientific discussions.
I also learned from my fellow graduate students especially during our first two years of course
work. I always enjoyed our group studies and discussions. I want to thank my classmates: Sanjeev
Agarwal, Ninad Varkhede, Yangjie Wei, Martin Hu, Mei Feng, Melissa Presnall, Laura Drbohlav,
and Matthew Christopher. Getting to experience skydiving and getting drinks together are always
the highlight of graduate life. Many thanks to Laura Drbohlav and Jake Doyle for being wonderful
roommates and cooking together was always relaxing. It was always fun watching movies and
chit-chatting.
My stay in Lawrence was enhanced by the Nepalese community members. After four years I was
able to celebrate Nepalese festivals and eat proper Nepali food. I want to thank Prem Thapa and
Jhunu Thapa for their hospitality, love and support. I always enjoyed great company of Bibek
Gautam, Smriti Gautam, Abhigna and Saleen. Thank you for making me feel at home. I also want
to thank Isha, Dipin, Soham, Anmesh, Anjana, Manjish, Ashwin, Apurba, Poonam, Biswas, Pratik,
and Alok for great times, laughter, good food, and overall, their friendship. I also want to thank all
the members of Nepalese Student Association for inviting me during festivals and also for
organizing fun events.

ix
This list would not be complete without thanking my best friends Bivek Adhikari, Vivek Raj Karki,
and Aakriti Gautam. I want to thank them for being there when I needed them the most. I have
always looked forward to our road trips, camping, adventures, or simply staying home and
relaxing. I want to thank them for giving me best advice, encouragement, and sometimes
pampering me. I also want to thank my best friends from high school: Prerana and Pradip for
always checking on me and for lots of cute and funny videos and pictures.
I want to thank Christopher family for embracing me as a part of their family. I have always
enjoyed our holidays together. Thank you, Mary, for spoiling me with gifts. I want to thank Lauren
and Alex for great company, laughter, and game times. I want to thank Michael, Holly, and baby
Grant (whose cute videos have always uplifted me) for your company.
I want to thank each and every member of my family. First, I want to thank my late grandfather
and late grandmother for sponsoring my education, and for their love and support. I want to thank
my parents, Nazar and Karna Prajapati, for always believing in me and letting me come to the
United States to pursue my education. I want to thank my siblings (best friends) Ishwori, Kavita,
Indra Kumari, and Arij Prajapati for always checking on me and for daily dose of laughter. I also
want to thank my aunt, Suprava, for supporting me. I want to thank all of my uncles, aunties, and
cousins for always supporting me and for great times whenever we get to meet.
Last but not the least, I want to thank Matthew Christopher for his love, support, and
encouragement. Thank you for always giving me positive suggestions when I was frustrated and
pushing me to finish my dissertation on time. His delicious food, jokes, and light-heartedness
always kept my morale high. Thank you very much for taking time to edit my dissertation, helping
me to improve my writing skills, and moving to Maryland with me to begin the next chapter of
our life.
x
Contents
Chapter 1: Introduction ................................................................................................................... 1
1.1. Monoclonal Antibody as Therapeutics ............................................................................ 2
1.2. Structure of mAbs ............................................................................................................ 3
1.3. Routes of administration of mAbs ................................................................................... 4
1.4. Degradation of antibodies ................................................................................................ 5
1.5. ICH Q1B guideline and photostability testing of biotherapeutics ................................... 7
1.6. Case studies of highly concentrated mAbs degraded by UV-A and visible light ............ 8
1.7. Use of excipients for stabilizing mAbs .......................................................................... 10
1.8. Overview of this dissertation ......................................................................................... 12
1.9. References ...................................................................................................................... 14
1.10. Figures ........................................................................................................................ 20
Chapter 2: One-electron photo-oxidation of Met-Xn-His-containing peptides: Formation of novel cross-links ..................................................................................................................................... 22
2.1. Introduction .................................................................................................................... 23
2.2. Materials and Methods ................................................................................................... 25
2.2.1. Materials ................................................................................................................. 25
2.2.2. Synthesis of model peptides and purification ......................................................... 26
2.2.3. Photo-irradiation ..................................................................................................... 26
2.2.4. Reversed Phase-High Performance Liquid Chromatography (RP-HPLC) analysis 27
2.2.5. NanoAcquity LC Electrospray Ionization Q-tof MS and LC-MS/MS analysis ..... 28
2.3. Results ............................................................................................................................ 29
2.3.1. Identification of photoproducts ............................................................................... 29
2.3.2. Comparison of photoproducts at pH 3.30, 7.23, and 9.88 by LC-MS .................... 30
2.3.3. The photoproducts M1P1a and M1P1b .................................................................. 31
2.3.4. Generation of M1P1a/M1P1b from peptide M1 containing 13C-Met ..................... 33
2.3.5. Generation of M1P1a/M1P1b-(15N3) from peptide M3 containing 15N-labeled His 33
2.3.6. Effect of spacing on cross-link formation ............................................................... 34
2.3.7. Formation of aspartic acid (M1P2) ......................................................................... 35
2.3.8. Formation of homocysteine (M1P3) and homocysteine sulfonic acid (M1P3-SO3H) 36
2.3.9. Formation of thioesters (M1P4a and M1P4b) ........................................................ 37

xi
2.3.10. 4-CB adducts on Met (M1P5a-d) ............................................................................ 38
2.3.11. Formation of Met sulfoxide (M1P6a/M1P6b) and sulfone (M1P7) ....................... 38
2.3.12. Formation of His oxidation products (M1P8 and M1P9) ....................................... 39
2.4. Discussion ...................................................................................................................... 40
2.4.1. Formation of M1P1a/M1P1b .................................................................................. 41
2.5. Conclusions .................................................................................................................... 43
2.6. References ...................................................................................................................... 44
2.7. Charts and Figures .......................................................................................................... 49
2.8. Schemes .......................................................................................................................... 66
2.9. Supplementary Information............................................................................................ 69
Chapter 3: Visible light degradation of a monoclonal antibody in a high concentration formulation: characterization of a tryptophan-derived chromophoric photoproduct by comparison to photodegradation of N-acetyl-L-tryptophan amide .................................................................. 81
3.1. Introduction .................................................................................................................... 82
3.2. Materials and Methods ................................................................................................... 84
3.2.1. Sample preparation ................................................................................................. 85
3.2.2. Photo-irradiation ..................................................................................................... 85
3.2.3. Photo-irradiation of mAbZ and NATA................................................................... 86
3.2.4. Reducing and Non-reducing SDS-PAGE ............................................................... 86
3.2.5. Size Exclusion Chromatography (SEC).................................................................. 87
3.2.6. Differential Scanning Calorimetry (DSC) .............................................................. 87
3.2.7. Proteolytic Digestion .............................................................................................. 88
3.2.8. UV-Visible Absorption Spectroscopy .................................................................... 88
3.2.9. Reverse Phase-High-Performance Liquid Chromatography .................................. 88
3.2.10. NanoAcquity HPLC Electrospray ionization Q-tof MS and HPLC-MS/MS analysis 89
3.2.11. Nuclear Magnetic Resonance ................................................................................. 90
3.3. Results ............................................................................................................................ 90
3.3.1. Physical stability: studies on conformation and aggregation of mAbZ .................. 91
3.3.2. Oxidation of Met and Trp ....................................................................................... 92
3.3.3. Formation of chromophoric photoproducts in mAbZ and NATA .......................... 93
3.4. Discussion ...................................................................................................................... 95
3.4.1. Aggregation, conformational changes, and oxidation of mAbZ ............................. 95
xii
3.4.2. Formation of chromophoric photoproducts from mAbZ and NATA ..................... 95
3.5. References ...................................................................................................................... 98
3.6. Chart and Figures ......................................................................................................... 101
3.7. Table and Scheme ........................................................................................................ 114
3.8. Supplementary Information.......................................................................................... 116
Chapter 4: Cis/trans isomerization of unsaturated fatty acids in polysorbate 80 during light exposure of a monoclonal antibody-containing formulation ...................................................... 123
4.1. Introduction .................................................................................................................. 124
4.2. Materials and Methods ................................................................................................. 127
4.2.1. Materials ............................................................................................................... 127
4.2.2. Photo-irradiation ................................................................................................... 127
4.2.3. Photo-irradiation of mAbZ formulations containing 0.01% PS80 ....................... 128
4.2.4. Photo-irradiation of spiked mAbZ formulations containing 0.2% PS80 .............. 129
4.2.5. Photo-irradiation of model peptide formulations containing 0.01% and 0.2% PS80 129
4.2.6. Photo-irradiation of PS80 in the absence of mAbZ and model peptides .............. 130
4.2.7. Generation of FFAs from 0.01% and 0.2% PS80 with porcine esterase .............. 130
4.2.8. HPLC-MS analysis of PS80 ................................................................................. 131
4.2.9. HPLC-MS analysis of FFAs ................................................................................. 132
4.2.10. Sample preparation for Raman Fourier transform infrared (FTIR) spectroscopy 133
4.2.11. Raman and FTIR Spectroscopy ............................................................................ 134
4.3. Results .......................................................................................................................... 134
4.3.1. Oleic acid .............................................................................................................. 134
4.3.2. Linoleic acid.......................................................................................................... 137
4.3.3. Oxidation products ................................................................................................ 139
4.3.4. The model system containing PS80, GSSG, and NATA ...................................... 140
4.3.5. Raman and FTIR Spectroscopy ............................................................................ 140
4.4. Discussion .................................................................................................................... 142
4.5. Footnotes ...................................................................................................................... 147
4.6. References .................................................................................................................... 148
4.7. Figures .......................................................................................................................... 152
4.8. Supplementary Figures ................................................................................................. 162
xiii
Chapter 5: Oxidation and Cis/trans Isomerization of Unsaturated Fatty Acids in Polysorbate 80 via photo-induced degradation of citrate buffer .......................................................................... 167
5.1. Introduction .................................................................................................................. 168
5.2. Materials and Methods ................................................................................................. 170
5.2.1. Photo-irradiation ................................................................................................... 170
5.2.2. Sample preparation ............................................................................................... 170
5.2.3. Mass spectrometry ................................................................................................ 171
5.3. Results .......................................................................................................................... 172
5.3.1. Oxidation products ................................................................................................ 172
5.3.2. Cis/trans isomerization.......................................................................................... 174
5.4. Discussion .................................................................................................................... 177
5.4.1. Oxidation products ................................................................................................ 178
5.4.2. Cis/trans isomerization.......................................................................................... 179
5.5. References .................................................................................................................... 182
5.6. Charts and Figures ........................................................................................................ 187
5.7. Schemes ........................................................................................................................ 198
Chapter 6: Conclusions and Future Directions ........................................................................... 200
6.1. Summary and conclusions ............................................................................................ 201
6.2. Future works ................................................................................................................. 203

1
Chapter 1: Introduction

2
1.1. Monoclonal Antibody as Therapeutics
Murine monoclonal antibody (mAb) was first produced in 1975 by César Milstein and Georges
Köhler by using groundbreaking hybridoma technology, which opened a door for antibodies to be
used as therapeutics.1-2 After a decade, in 1986 the first murine mAb, Orthoclone OKT3, was
approved by the US Food and Drug Administration (FDA).3 In the early development of murine
mAbs, immunogenicity and short half-lives of these mAbs were of concern due to the presence of
anti-murine antibody in patients.4 This response was significantly reduced through the
implementation of technologies such as chimeric, humanized, and full human mAbs. Since then,
mAbs have emerged as an important class of drugs because of their potency, low toxicity, and high
efficacy. Furthermore, mAbs are well-tolerated by patients, have fewer adverse effects, and are
highly specific in comparison to small molecules.5 Thus, 79 FDA approved mAbs are in the market
for the treatment of cancers, autoimmune diseases, infectious diseases, and organ
transplantations.4, 6 Whilst mAbs have become less immunogenic with the transition away from
mouse mAb sequences, degradation due to intrinsic and extrinsic factors remains.
Various factors such as protein formulations, container closure, manufacturing processes, and
environmental factors (light and temperature) need to be considered to improve the stability of
mAbs.7 Moreover, factors such as metal contaminants, pH, and ionic strength can also influence
the stability of drugs.7-10 As a result of temperature and light stress and/or the presence of metal
contaminants, mAbs can experience oxidation,11-14 aggregation,15-16 fragmentation,17-18 cross-link
formation,19-20 and color change.16, 21-22 These degradation products may induce product
immunogenicity risking patient’s health. To mitigate the degradation of mAbs during long-term
storage conditions, a robust formulation should be implemented that can be corroborated with
3
forced-stability studies. Formulation for each mAb should be addressed as a “case by case” basis
because of the structural differences in the complementary determining regions (CDRs) and
glycosylation.23
1.2. Structure of mAbs
Most of the marketed mAbs are γ-immunoglobins (IgG) isotypes and are mainly comprised of
IgG1, IgG2, and IgG4. These mAbs are tetrameric glycoproteins with molecular weights (MW) of
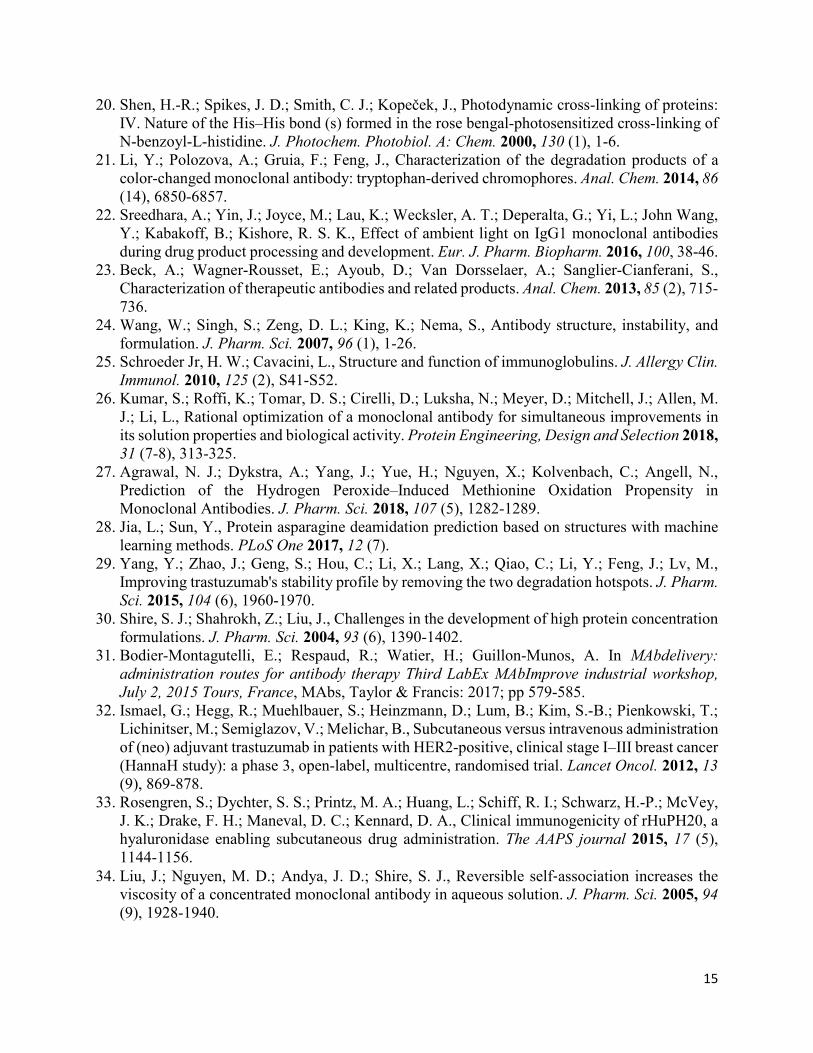
approximately 150 kDa.24-25 As shown in Fig. 1, they consist of two identical heavy chains (HC),
each with a MW of about 50 kDa, and two identical light chains (LC), each with a MW of about
25 kDa. These roughly Y-shaped proteins consist of three HC constant domains (CH1, CH2, and
CH3), one HC variable domain (VH), one LC constant domain (CL), and one LC variable domain
(VL). The CH2 and CH3 domains are part of the fragment crystallizable (Fc), which binds to cell
surface receptors including the Fcγ receptors and the neonatal Fc receptor (FcRn). The VL-VH and
CL-CH1 domains make up the antigen binding fragment (Fab) region containing the highly variable
complimentary determining region (CDR) responsible for binding to target antigen. Due to these
complexities in antibody structure, identification of degradation hotspots has become a key area
of research.
Certain structural motifs have been identified that are susceptible to degradation throughout the
stages of mAb production.26-28 For instance, the sequences Gly-Asn or Asn-Gly are more prone to
deamidation. Yang et al. changed two degradation hotspots, LC-Asn30 and HC-Asp102 into LC-
Gln30 and HC-Glu102, which decreased the rate of deamidation and isomerization, and retained
the biological activity.29 Kumar et al. has carried out single point (V44K, E59S, E59T and E59Y)
and double mutations (V44KE59S, V44KE59T and V44KE59Y) in the light chain of mAb1 that
4
improved the biological activity, protein solubility, and viscosity of the protein.26 Such mutations
can also disrupt aggregation and oxidation prone hotspots.
1.3. Routes of administration of mAbs
Traditionally, mAbs are administered via the intravenous route in the hospital settings. mAbs are
infused based on the patient’s weight, so the diluted mAbs, though more stable, take several hours
of infusion time.30 This requires trained personnel to prepare, administer, and monitor the drug
product (DP) and the lengthy process also compromises patient’s compliance. As such, other
routes of administration such as intramuscular (IM) and subcutaneous (SC) injections are being
explored. SC injection requires administration of highly concentrated mAb solutions (≥100
mg/ml) in small volumes. For SC injections, pre-filled syringes, pens and auto-injectors are used,
enabling patients to use them at home and reducing injection time to minutes. Thus, SC
administration is becoming increasingly popular due to its user convenience, better therapy
compliance, and economic impacts.31 Whilst SC injections have many advantages over IV
injections, concerns of reduced volume, back-pressure, and pain at the site of injection remain.
To overcome such concerns, mAbs such as rituximab and trastuzumab took advantage of an
excipient such as recombinant hyaluronidase (rHuPH20)5, 32-33 and were approved for tumor
therapy. rHuPH20 is an enzyme that temporarily degrades hyaluronan at the injection site,
facilitating delivery of ~5-10 ml via SC injection.
The stability of a highly concentrated DP in an SC formulation is crucial for its success; however,
the highly concentrated mAb makes it challenging because of protein-protein interactions, which
lead to high viscosity and aggregation. Self-association of the protein may be mainly attributed to
electrostatic interactions,34 in particular Fab-Fab interactions.35 By changing the charged residues
in the CDR of a mAb, Yadav et al. were able to reduce its viscosity.36 Additionally, when exposed

5
to UV and visible light, heat, and/or metal contaminants, highly concentrated mAbs are reported
to aggregate or undergo color change due to greater protein-protein interactions and reduced
volume.16, 21-22
1.4. Degradation of antibodies
The stability of mAbs can be compromised during manufacturing and administration, mainly via
interfacial stress, mechanical stress, light exposure, and metal-catalyzed oxidation (MCO). These
stresses and reactions may degrade mAbs, causing physical and chemical instability.8-9, 37 Physical
instability is defined as structural changes of proteins without formation or breakage of the
chemical bonds. For example, physical instability of the protein may be caused by hydrophobic
interactions between two or more molecules, leading to protein aggregation because of shear forces
and cavitation-induced spikes in pressure and temperature.8, 38 Alternatively, chemical instability
is defined by change in covalent bonds, i.e. hydrolysis of the existing bonds or the formation of
new bonds. Thus, deamidation, β-elimination, fragmentation, aggregation, oxidation, and cross-
link formation fall under chemical instability. Physical and chemical instabilities are interrelated
as one can influence the other. For instance, aggregation in proteins can also occur via chemical
instability by disulfide scrambling and cross-links between various amino acids.
Oxidation occurs mainly via (i) peroxides, (ii) metal-catalyzed oxidation (MCO), and (iii) light
exposure. Peroxides may be introduced into the drug substance (DS) as contaminants from
excipients. Iron can be present in the solution as contaminant from manufacturing and storage
containers, and excipients, which promotes MCO and can generates ROS such as the hydroxyl
radical (•OH) by Fenton reaction.39 Peroxides and other oxidants generated by MCO and light
exposure may react with numerous amino acids including: methionine (Met), cysteine (Cys),
tryptophan (Trp), histidine (His), tyrosine (Tyr), and phenylalanine (Phe).13, 40-41 These ROS can

6
result in the generation of oxidation products such as methionine sulfoxide (MetO) that can, for
example, modify the biological activity of a protein and alter the binding affinity of IgGs.42-43
MCO has also been reported to play a role in the hydrolysis between Met and His residues in
human parathyroid hormone and IgG1.17-18 Therefore, it is important to carefully monitor
contaminants that may be introduced into the formulation to avoid degradation of the proteins.
The exposure of the DP to light during manufacturing, storage, or administration can result in
degradation, altering the protein irreversibly. The aromatic residues of proteins can undergo
photoexcitation that may result in either type I or type II photooxidation (Scheme 1).44 In the type
I mechanism, light is directly absorbed by chromophores such as aromatic amino acids (e.g. Trp,
Tyr), giving an excited triplet state.45-47 This is followed by the transfer of an electron to a suitable
acceptor, such as molecular oxygen (O2) or disulfide bonds, leading to the formation of radical
cations (e.g. Trp radical cation) and radical anions; O2 will form superoxide48 or disulfide will
form a disulfide radical anion, which exists in equilibrium with thiolate and thiyl radical.14, 49-50
Thiyl radicals can undergo a cascade of reactions such as disulfide scrambling,51-52 thioether
formation,53 abstraction of either an electron, hydrogen, or both from other amino acids,50, 54 and
involvement in cis/trans isomerization.55-56 The latter topic is discussed in detail in Chapters 4 and
5. On the other hand, the formation of a Trp radical cation can lead to the loss of the side chain of
Trp57-58 and Tyr59 after UV light exposure. For instance, a Trp radical cation can abstract an
electron from Tyr, forming a Tyr radical cation, which can then eliminate a protonated quinone
methide. Other amino acids may also undergo light-induced oxidation, including Met, which
primarily degrades into MetO. Photosensitizers such as 4-caboxybenzophenone (4-CB) have
widely been used to study the oxidation of Met via the type I mechanism, which gives a sulfur
radical cation (Met>S•+).60 We have employed this technique to generate Met>S•+, which led to
7
the identification of novel cross-links between Met oxidation product(s) and a His residue,
discussed in Chapter 2.
In the type II mechanism, energy is transferred from an excited triplet state to O2, generating singlet
oxygen (1O2). This reactive oxygen species can react with Met and His, forming MetO11-12 and
peroxide derivatives of His, respectively.61 In addition, 1O2 may react with Trp, generating
photoproducts such as N-formyl kynurenine (NFK) and kynurenine (Kyn). These photoproducts
can further act as photosensitizers, resulting in the degradation of proteins upon exposure to UV-
A and visible light.62-66 Therefore, the International Conference on Harmonization (ICH) has
provided guidelines for drug product exposure to UV-A and visible light stresses, which are
outlined in section 1.5 and 1.6.
1.5. ICH Q1B guideline and photostability testing of biotherapeutics
According to the ICH guidelines for photostability testing of DS(s) and DP(s) (Q1B), “light testing
should be an integral part of stress testing”.67 For forced degradation and confirmatory testing,
ICH requires the DS and DP to be tested using light sources with output similar to D65/ID65. The
ICH guideline defines D65 and ID65 as follows: “D65 is the internationally recognized standard
for outdoor daylight as defined in The International Standards Organization (ISO) 10977 (1993).
ID65 is the equivalent indoor indirect daylight standard.” D65 and ID65 can be accomplished by
using artificial daylight fluorescent lamps, xenon lamps, or metal halide lamps. However, if cool
white fluorescent lamps are used, it has to be accompanied by near UV lamps. All of these light
source options should emit no less than 1.2 million lux hours of visible light and no less than 200
Watt hour per square meters (W.h/m2) of integrated near UV light. In addition, a dark control
wrapped in aluminum should be tested alongside the authentic sample in the same environment.
Dark control samples can also indicate the effect of heat generated on DP during light exposure.
8
1.6. Case studies of highly concentrated mAbs degraded by UV-A and visible light
When Qi et al. exposed a mAb (100 mg/ml formulated in histidine buffer, sorbitol and PS80 at pH
5.5) to the light intensity recommended by ICH Q1B guideline, it underwent significant physical
and chemical changes depicted by covalent aggregates, fragmentation, oxidation of Met, His, and
Trp, and deamidation of Asn.16 After light exposure, the colorless mAb solution turned yellow, a
result which was also observed in our study (discussed in Chapter 3) on highly concentrated mAb
after exposure to visible light. Additionally, in the same study by Qi et al., a significant loss in
biological activity of the mAb was observed due to Trp94 oxidation and Asn93 deamidation in the
CDR region. Another study on 100 mg/ml mAb (MEDI-493) (in 10 mM His and 1.6 mM Gly
buffer, pH 6.0) by Wei et al. also showed oxidation of Met and Trp after exposure to light emitting
wavelengths between 300-700 nm for up to 7 days.68 However, one single Trp 105 residing in the
CDR of the heavy chain was responsible for the loss of binding and biological activity. These two
Trp residues are solvent-exposed, which explains their readily oxidizable nature. Apart from Trp,
Met and His residues also undergo oxidation and may negatively impact the efficacy of the drug.42
Commonly, the light exposure experienced by DS and DP is far less harsh than those outlined in
the ICH Q1B guideline.22, 69-70 Sreedhara et al.22 have done an extensive internal survey in normal
laboratories and GMP processing areas and found a small UV-A light source emitting from 350 to
400 nm with an irradiance ranging from 0.05 to 0.3 W/m2. Areas that used fluorescent lamps with
plastic canopies, however, emitted wavelengths above 400 nm (commonly termed as ambient and
mild light conditions). This indicates DS and DP may not see such extreme conditions mentioned
in the ICH Q1B guideline.22 In the same study, under ambient light, mAb1 showed a site-specific
oxidation of Trp resulting in potency loss and mAb2 (at 100 mg/ml) showed higher aggregation
9
and a color change of the solution; however, mAb3-5 were not impacted by ambient and mild light
exposure.
Similarly, the study by Qi et al. 16 concluded that the mAb underwent oxidation (of Trp and Met),
deamidation, fragmentation, and aggregation formation during light exposure according to the ICH
Q1B guideline, but was stable under ambient light conditions. Because ambient light may still
contain a UV quotient, it is ambiguous which wavelengths cause the degradation of mAbs. Du et
al.71 gave some insights into which part of the visible light is responsible for the color change of a
mAb formulation and degradation of the mAb. The visible light was divided into multiple color
spectra by using either colored filters or by using blue and red LED lamps. The mAbs exposed to
blue light, filtered from visible light, and emitted from blue LED lamps displayed a brown color
with maximum absorbance at 450 nm. Additionally, these mAb solutions displayed an increase
in high molecular weight species and charge variant species. If possible, while handling highly
photosensitive mAbs, such filters should be used to protect the proteins from degrading. It has also
been suggested to fill the head space of the vials with N2 to protect the DS and DP from rapid
degradation.72
The ICH Q1B guideline does not specify the light exposed during drug preparation and patient
administration; however, some DP requires pharmacy preparation and long hours of administration
time, where the DP is further exposed to light. As shown by Du et al. certain wavelengths of visible
light can degrade the DP and impose concerns for the drug’s efficacy and safety.71, 73 Therefore,
the effect of light on mAbs highly depends on the photosensitivity of mAbs under study and light
exposure time. The exposure to light during drug preparation and administration should also be
considered when labelling the DP with “protect from light”. Moreover, providing detailed

10
instructions on protecting the DP from light and including protective sleeves as part of the product
kit will ensure the protection of the drug.73
Apart from the Active Pharmaceutical Ingredient (API), excipients added to the final formulations
can also undergo physical and chemical changes when exposed to light. For example, polysorbate,
a commonly used surfactant to protect biotherapeutics, is susceptible to degradation forming
peroxides, formic acid, formaldehyde, hydrogen peroxide, etc. when exposed to light.74 Likewise,
His buffer, a commonly used buffer, is also photosensitive. His degradation can form products that
are photosensitizers, which can further oxidize other amino acid residues such as Met and Trp.
Monoclonal antibodies formulated in His buffer are shown to suffer Trp oxidation in the CDR
region, leading to reduced binding affinity for target proteins.75-76 Other excipients, such as Met
and the Trp-derivative N-acetyl tryptophan (NAT), are used as antioxidants in the final DP
formulation to reduce or prevent oxidation of proteins.77 However, the oxidation products of NAT
are also photosensitizers and should be carefully monitored as they can further oxidize proteins.78
Our study on another Trp-containing compound, N-acetyl-L-tryptophan amide (NATA), also
revealed oxidation upon exposure to visible light giving products such as NFK, Kyn, OH-Trp and
other chromophoric products, which is discussed in Chapter 3.
1.7. Use of excipients for stabilizing mAbs
Since the production and administration of mAbs requires many steps, keeping them stable is
important not just to meet the critical quality attributes but also for the safety and efficacy of the
drug.8 Thus, formulation conditions should be optimized to achieve a longer shelf life by
minimizing both physical and chemical instabilities. Excipients such as buffers, surfactants, salts,
antioxidants, and chelators are chosen for an ideal formulation condition to lower viscosity,

11
aggregation rate, oxidation, and other unwanted reactions. A library of generally regarded as safe
(GRAS) excipients can be used for initial screening to avoid extra regulatory requirements.79
Buffers are used to maintain the pH and stability of the drug solution. Detailed reviews regarding
the role of buffers on protein stability are provided by Zbacnik et al.80 and Ugwu et al.81 The
commonly used buffers for mAbs include His, phosphate, acetate, and citrate,82-85 where most of
the concentrated mAbs are formulated in His buffer. Because most antibodies are formulated
between pH 5.0 to 7.0, the use of His buffer is logical as its pKa is at 6.0. His buffer is also shown
to decrease the viscosity of the high-concentration mAbs86 and inhibit aggregation of a mAb.75
Despite its advantages, His can be affected by heat87 and light,88-89 so the DP has to be monitored
carefully.
Another commonly used buffer, citrate buffer has four distinct pKas at 3.13, 4.76, 5.80, and 6.40,90
making it suitable for protein formulation across a large range of pHs.80 Some mAbs are shown to
be more stable in citrate buffer via ligand binding. For example, Harinarayan et al. have shown
binding of citrate buffer to the Fab region resulted in greater stability.91 Citrate, on the other hand,
is also known to degrade or form adducts, resulting in acetonation of proteins92 or citrate can add
to serine and threonine residues as adducts.93 The citrate-phosphate formulation of Humira® was
changed in pre-filled syringes and pen injectors due to pain at injection site associated with
citrate.94 In addition, our study discussed in Chapter 5 and a study by Subelzu et al.95 indicated a
role of citrate in generating ROS via the photo-Fenton reaction, which can degrade amino acids
and surfactants
Excipients such as Met and Trp are used as sacrificial antioxidants, which maintain the stability of
the protein by reacting with ROS instead of the amino acids in the protein. Other amino acids such
12
as His, Arg, and Lys are also added especially to highly concentrated mAb formulations to reduce
viscosity and aggregation. These amino acids work either by interaction with aromatic acids or by
electrostatic interaction.96 Likewise, salts are added to the formulation to maintain the ionic
strength and surfactants such as polysorbates and poloxamers are added to reduce the aggregation
of protein via surface interfaces. However, one has to monitor the quality of a neat surfactant as it
may contain peroxides, which can degrade proteins. Furthermore, surfactants can undergo
oxidation in presence of heat, light, and metal contaminants.74 They can also undergo hydrolysis
in presence of host cell proteins, which are co-purified with desired proteins,97-100 forming
unwanted particles in the DP formulations.
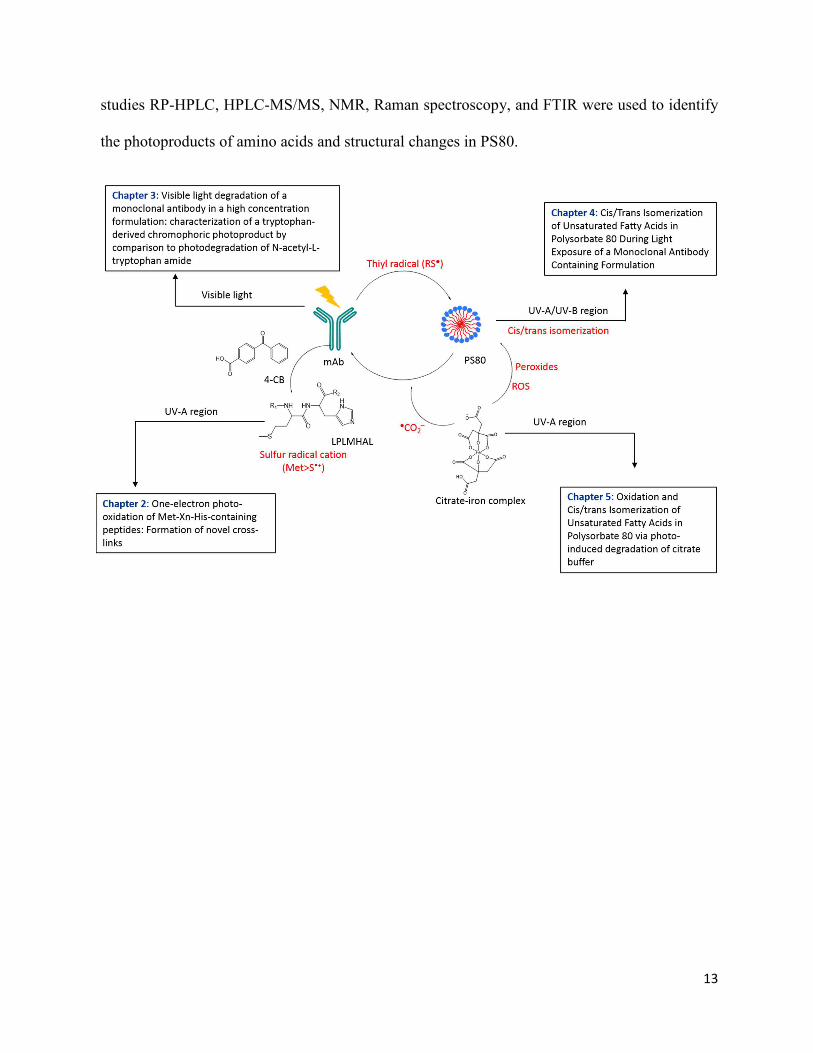
1.8. Overview of this dissertation
In this dissertation, the photo-degradation of model peptides, mAb, and surfactants are explored
upon exposure to either UV or visible light. Both amino acid residues and surfactants, which are
used to protect biotherapeutic proteins, are susceptible to degradation. The ingredients in the final
formulation, such as mAb and surfactants, can have negative effect on each other. For example,
the degradants of surfactants such as peroxides and aldehydes can oxidize reactive amino acids
(Met and His) and react with Lys and Arg to form a Schiff base, respectively. In addition, free
fatty acids generated from hydrolysis of ester bonds of polysorbate can form particles in the
formulation raising concerns for patient safety. On the other hand, protein- (and citrate-) derived
radical ions can generate ROS or thiyl radicals. These radicals can degrade surfactants or convert
cis isomer of unsaturated fatty acids of PS80 to trans isomer,56 as presented in Chapters 4 and 5.
The role of sulfur radical cations, specifically, on cross-link formation in the Met-Xn-His (n = 0-
2) sequence of model peptides is presented in Chapter 2. Finally, the formation of a chromophoric
product in mAbZ formulations after exposure to visible light is discussed in Chapter 3. For these
13
studies RP-HPLC, HPLC-MS/MS, NMR, Raman spectroscopy, and FTIR were used to identify
the photoproducts of amino acids and structural changes in PS80.
14
1.9. References
1. Reichert, J. M.; Rosensweig, C. J.; Faden, L. B.; Dewitz, M. C., Monoclonal antibody successes in the clinic. Nat. Biotechnol. 2005, 23 (9), 1073-8.
2. Buss, N. A. P. S.; Henderson, S. J.; McFarlane, M.; Shenton, J. M.; de Haan, L., Monoclonal antibody therapeutics: history and future. Curr. Opin. Pharmacol. 2012, 12 (5), 615-622.
3. Kroon, D. J.; Baldwin-Ferro, A.; Lalan, P., Identification of sites of degradation in a therapeutic monoclonal antibody by peptide mapping. Pharm. Res. 1992, 9 (11), 1386-1393.
4. Carter, P. J., Potent antibody therapeutics by design. Nat. Rev. Immunol. 2006, 6 (5), 343-357. 5. Cui, Y.; Cui, P.; Chen, B.; Li, S.; Guan, H., Monoclonal antibodies: formulations of marketed
products and recent advances in novel delivery system. Drug Dev. Ind. Pharm. 2017, 43 (4), 519-530.
6. Lu, R.-M.; Hwang, Y.-C.; Liu, I.-J.; Lee, C.-C.; Tsai, H.-Z.; Li, H.-J.; Wu, H.-C., Development of therapeutic antibodies for the treatment of diseases. J. Biomed. Sci. 2020, 27 (1), 1-30.
7. Wang, W.; Ohtake, S., Science and art of protein formulation development. Int. J. Pharm.
2019, 118505. 8. Krause, M. E.; Sahin, E., Chemical and physical instabilities in manufacturing and storage of
therapeutic proteins. Curr. Opin. Biotechnol. 2019, 60, 159-167. 9. Manning, M. C.; Chou, D. K.; Murphy, B. M.; Payne, R. W.; Katayama, D. S., Stability of
protein pharmaceuticals: an update. Pharm. Res. 2010, 27 (4), 544-575. 10. Van Buren, N.; Rehder, D.; Gadgil, H.; Matsumura, M.; Jacob, J., Elucidation of Two Major
Aggregation Pathways in an IgG2 Antibody. J. Pharm. Sci. 2009, 98 (9), 3013-3030. 11. Davies, M. J., Singlet oxygen-mediated damage to proteins and its consequences. Biochem.
Biophys. Res. Commun. 2003, 305 (3), 761-770. 12. Davies, M. J., Reactive species formed on proteins exposed to singlet oxygen. Photochemical
& Photobiological Sciences 2004, 3 (1), 17-25. 13. Davies, M. J., The oxidative environment and protein damage. Biochim. Biophys. Acta 2005,
1703 (2), 93-109. 14. Grassi, L.; Cabrele, C., Susceptibility of protein therapeutics to spontaneous chemical
modifications by oxidation, cyclization, and elimination reactions. Amino Acids 2019, 1-23. 15. Zheng, J. Y.; Janis, L. J., Influence of pH, buffer species, and storage temperature on
physicochemical stability of a humanized monoclonal antibody LA298. Int. J. Pharm. 2006, 308 (1), 46-51.
16. Qi, P.; Volkin, D. B.; Zhao, H.; Nedved, M. L.; Hughes, R.; Bass, R.; Yi, S. C.; Panek, M. E.; Wang, D.; DalMonte, P., Characterization of the photodegradation of a human IgG1 monoclonal antibody formulated as a high‐concentration liquid dosage form. J. Pharm. Sci.
2009, 98 (9), 3117-3130. 17. Mozziconacci, O.; Arora, J.; Toth, R. T. t.; Joshi, S. B.; Zhou, S.; Volkin, D. B.; Schoneich,
C., Site-Specific Hydrolysis Reaction C-Terminal of Methionine in Met-His during Metal-Catalyzed Oxidation of IgG-1. Mol. Pharm. 2016, 13 (4), 1317-28.
18. Mozziconacci, O.; Ji, J. A.; Wang, Y. J.; Schoneich, C., Metal-catalyzed oxidation of protein methionine residues in human parathyroid hormone (1-34): formation of homocysteine and a novel methionine-dependent hydrolysis reaction. Mol. Pharm. 2013, 10 (2), 739-55.
19. Liu, M.; Zhang, Z.; Cheetham, J.; Ren, D.; Zhou, Z. S., Discovery and Characterization of a Photo-Oxidative Histidine-Histidine Cross-Link in IgG1 Antibody Utilizing 18O-Labeling and Mass Spectrometry. Anal. Chem. 2014, 86 (10), 4940-4948.
15
20. Shen, H.-R.; Spikes, J. D.; Smith, C. J.; Kopeček, J., Photodynamic cross-linking of proteins: IV. Nature of the His–His bond (s) formed in the rose bengal-photosensitized cross-linking of N-benzoyl-L-histidine. J. Photochem. Photobiol. A: Chem. 2000, 130 (1), 1-6.
21. Li, Y.; Polozova, A.; Gruia, F.; Feng, J., Characterization of the degradation products of a color-changed monoclonal antibody: tryptophan-derived chromophores. Anal. Chem. 2014, 86 (14), 6850-6857.
22. Sreedhara, A.; Yin, J.; Joyce, M.; Lau, K.; Wecksler, A. T.; Deperalta, G.; Yi, L.; John Wang, Y.; Kabakoff, B.; Kishore, R. S. K., Effect of ambient light on IgG1 monoclonal antibodies during drug product processing and development. Eur. J. Pharm. Biopharm. 2016, 100, 38-46.
23. Beck, A.; Wagner-Rousset, E.; Ayoub, D.; Van Dorsselaer, A.; Sanglier-Cianferani, S., Characterization of therapeutic antibodies and related products. Anal. Chem. 2013, 85 (2), 715-736.
24. Wang, W.; Singh, S.; Zeng, D. L.; King, K.; Nema, S., Antibody structure, instability, and formulation. J. Pharm. Sci. 2007, 96 (1), 1-26.
25. Schroeder Jr, H. W.; Cavacini, L., Structure and function of immunoglobulins. J. Allergy Clin.
Immunol. 2010, 125 (2), S41-S52. 26. Kumar, S.; Roffi, K.; Tomar, D. S.; Cirelli, D.; Luksha, N.; Meyer, D.; Mitchell, J.; Allen, M.
J.; Li, L., Rational optimization of a monoclonal antibody for simultaneous improvements in its solution properties and biological activity. Protein Engineering, Design and Selection 2018, 31 (7-8), 313-325.
27. Agrawal, N. J.; Dykstra, A.; Yang, J.; Yue, H.; Nguyen, X.; Kolvenbach, C.; Angell, N., Prediction of the Hydrogen Peroxide–Induced Methionine Oxidation Propensity in Monoclonal Antibodies. J. Pharm. Sci. 2018, 107 (5), 1282-1289.
28. Jia, L.; Sun, Y., Protein asparagine deamidation prediction based on structures with machine learning methods. PLoS One 2017, 12 (7).
29. Yang, Y.; Zhao, J.; Geng, S.; Hou, C.; Li, X.; Lang, X.; Qiao, C.; Li, Y.; Feng, J.; Lv, M., Improving trastuzumab's stability profile by removing the two degradation hotspots. J. Pharm.
Sci. 2015, 104 (6), 1960-1970. 30. Shire, S. J.; Shahrokh, Z.; Liu, J., Challenges in the development of high protein concentration
formulations. J. Pharm. Sci. 2004, 93 (6), 1390-1402. 31. Bodier-Montagutelli, E.; Respaud, R.; Watier, H.; Guillon-Munos, A. In MAbdelivery:
administration routes for antibody therapy Third LabEx MAbImprove industrial workshop,
July 2, 2015 Tours, France, MAbs, Taylor & Francis: 2017; pp 579-585. 32. Ismael, G.; Hegg, R.; Muehlbauer, S.; Heinzmann, D.; Lum, B.; Kim, S.-B.; Pienkowski, T.;
Lichinitser, M.; Semiglazov, V.; Melichar, B., Subcutaneous versus intravenous administration of (neo) adjuvant trastuzumab in patients with HER2-positive, clinical stage I–III breast cancer (HannaH study): a phase 3, open-label, multicentre, randomised trial. Lancet Oncol. 2012, 13 (9), 869-878.
33. Rosengren, S.; Dychter, S. S.; Printz, M. A.; Huang, L.; Schiff, R. I.; Schwarz, H.-P.; McVey, J. K.; Drake, F. H.; Maneval, D. C.; Kennard, D. A., Clinical immunogenicity of rHuPH20, a hyaluronidase enabling subcutaneous drug administration. The AAPS journal 2015, 17 (5), 1144-1156.
34. Liu, J.; Nguyen, M. D.; Andya, J. D.; Shire, S. J., Reversible self‐association increases the viscosity of a concentrated monoclonal antibody in aqueous solution. J. Pharm. Sci. 2005, 94 (9), 1928-1940.
16
35. Kanai, S.; Liu, J.; Patapoff, T. W.; Shire, S. J., Reversible self‐association of a concentrated monoclonal antibody solution mediated by Fab–Fab interaction that impacts solution viscosity. J. Pharm. Sci. 2008, 97 (10), 4219-4227.
36. Yadav, S.; Sreedhara, A.; Kanai, S.; Liu, J.; Lien, S.; Lowman, H.; Kalonia, D. S.; Shire, S. J., Establishing a link between amino acid sequences and self-associating and viscoelastic behavior of two closely related monoclonal antibodies. Pharm. Res. 2011, 28 (7), 1750-1764.
37. Manning, M. C.; Patel, K.; Borchardt, R. T., Stability of protein pharmaceuticals. Pharm. Res.
1989, 6 (11), 903-918. 38. Luo, Q.; Joubert, M. K.; Stevenson, R.; Ketchem, R. R.; Narhi, L. O.; Wypych, J., Chemical
modifications in therapeutic protein aggregates generated under different stress conditions. J.
Biol. Chem. 2011, 286 (28), 25134-44. 39. Stadtman, E. R., Metal ion-catalyzed oxidation of proteins: Biochemical mechanism and
biological consequences. Free Radic. Biol. Med. 1990, 9 (4), 315-325. 40. Li, S.; Schoneich, C.; Borchardt, R. T., Chemical instability of protein pharmaceuticals:
Mechanisms of oxidation and strategies for stabilization. Biotechnol. Bioeng. 1995, 48 (5), 490-500.
41. Torosantucci, R.; Schöneich, C.; Jiskoot, W., Oxidation of Therapeutic Proteins and Peptides: Structural and Biological Consequences. Pharm. Res. 2014, 31 (3), 541-553.
42. Gao, X.; Ji, J. A.; Veeravalli, K.; Wang, Y. J.; Zhang, T.; McGreevy, W.; Zheng, K.; Kelley, R. F.; Laird, M. W.; Liu, J.; Cromwell, M., Effect of individual Fc methionine oxidation on FcRn binding: Met252 oxidation impairs FcRn binding more profoundly than Met428 oxidation. J. Pharm. Sci. 2015, 104 (2), 368-77.
43. Bertolotti-Ciarlet, A.; Wang, W.; Lownes, R.; Pristatsky, P.; Fang, Y.; McKelvey, T.; Li, Y.; Li, Y.; Drummond, J.; Prueksaritanont, T.; Vlasak, J., Impact of methionine oxidation on the binding of human IgG1 to Fc Rn and Fc gamma receptors. Mol. Immunol. 2009, 46 (8-9), 1878-82.
44. Baptista, M. S.; Cadet, J.; Di Mascio, P.; Ghogare, A. A.; Greer, A.; Hamblin, M. R.; Lorente, C.; Nunez, S. C.; Ribeiro, M. S.; Thomas, A. H.; Vignoni, M.; Yoshimura, T. M., Type I and Type II Photosensitized Oxidation Reactions: Guidelines and Mechanistic Pathways. Photochem. Photobiol. 2017, 93 (4), 912-919.
45. Bent, D.; Hayon, E., Excited state chemistry of aromatic amino acids and related peptides. III. Tryptophan. JACS 1975, 97 (10), 2612-2619.
46. Bent, D.; Hayon, E., Excited state chemistry of aromatic amino acids and related peptides. I. Tyrosine. JACS 1975, 97 (10), 2599-2606.
47. Creed, D., The photophysics and photochemistry of the near‐UV absorbing amino acids–II. Tyrosine and its simple derivatives. Photochem. Photobiol. 1984, 39 (4), 563-575.
48. Bensasson, R. V.; Land, E. J.; Truscott, T. G., Flash photolysis and pulse radiolysis:
contributions to the chemistry of biology and medicine. Elsevier: 2013. 49. Schöneich, C., Radical‐Based Damage of Sulfur‐Containing Amino Acid Residues.
Encyclopedia of Radicals in Chemistry, Biology and Materials 2012. 50. Schöneich, C., Thiyl radicals and induction of protein degradation. Free Radical Res. 2016, 50
(2), 143-149. 51. Wang, Y.; Lu, Q.; Wu, S.-L.; Karger, B. L.; Hancock, W. S., Characterization and comparison
of disulfide linkages and scrambling patterns in therapeutic monoclonal antibodies: using LC-MS with electron transfer dissociation. Anal. Chem. 2011, 83 (8), 3133-3140.
17
52. Wecksler, A. T.; Yin, J.; Lee Tao, P.; Kabakoff, B.; Sreedhara, A.; Deperalta, G., Photodisruption of the Structurally Conserved Cys-Cys-Trp Triads Leads to Reduction-Resistant Scrambled Intrachain Disulfides in an IgG1 Monoclonal Antibody. Mol. Pharm.
2018, 15 (4), 1598-1606. 53. Steinmann, D.; Mozziconacci, O.; Bommana, R.; Stobaugh, J. F.; Wang, Y. J.; Schöneich, C.,
Photodegradation pathways of protein disulfides: human growth hormone. Pharm. Res. 2017, 34 (12), 2756-2778.
54. Zhao, R.; Lind, J.; Merenyi, G.; Eriksen, T. E., Kinetics of one-electron oxidation of thiols and hydrogen abstraction by thiyl radicals from. alpha.-amino CH bonds. JACS 1994, 116 (26), 12010-12015.
55. Chatgilialoglu, C.; Ferreri, C.; Ballestri, M.; Mulazzani, Q. G.; Landi, L., Cis− trans isomerization of monounsaturated fatty acid residues in phospholipids by thiyl radicals. JACS
2000, 122 (19), 4593-4601. 56. Prajapati, I.; Peters, B.-H.; Larson, N. R.; Wei, Y.; Choudhary, S.; Kalonia, C.; Hudak, S.;
Esfandiary, R.; Middaugh, C. R.; Schöneich, C., Cis/Trans Isomerization of Unsaturated Fatty Acids in Polysorbate 80 During Light Exposure of a Monoclonal Antibody–Containing Formulation. J. Pharm. Sci. 2020, 109 (1), 603-613.
57. Haywood, J.; Mozziconacci, O.; Allegre, K. M.; Kerwin, B. A.; Schöneich, C., Light-induced conversion of Trp to Gly and Gly hydroperoxide in IgG1. Mol. Pharm. 2013, 10 (3), 1146-1150.
58. Mozziconacci, O.; Schöneich, C., Effect of conformation on the photodegradation of Trp-and cystine-containing cyclic peptides: octreotide and somatostatin. Mol. Pharm. 2014, 11 (10), 3537-3546.
59. Kang, H.; Tolbert, T. J.; Schöneich, C., Photoinduced Tyrosine Side Chain Fragmentation in IgG4-Fc: Mechanisms and Solvent Isotope Effects. Mol. Pharm. 2019, 16 (1), 258-272.
60. Dormán, G.; Nakamura, H.; Pulsipher, A.; Prestwich, G. D., The Life of Pi Star: Exploring the Exciting and Forbidden Worlds of the Benzophenone Photophore. Chem. Rev. 2016, 116 (24), 15284-15398.
61. Lei, M.; Carcelen, T.; Walters, B. T.; Zamiri, C.; Quan, C.; Hu, Y.; Nishihara, J.; Yip, H.; Woon, N.; Zhang, T., Structure-based correlation of light-induced histidine reactivity in a model protein. Anal. Chem. 2017, 89 (13), 7225-7231.
62. Schöneich, C., Photo-Degradation of Therapeutic Proteins: Mechanistic Aspects. Pharm. Res.
2020, 37 (3), 45. 63. Parker, N. R.; Jamie, J. F.; Davies, M. J.; Truscott, R. J. W., Protein-bound kynurenine is a
photosensitizer of oxidative damage. Free Radic. Biol. Med. 2004, 37 (9), 1479-1489. 64. Mizdrak, J.; Hains, P. G.; Truscott, R. J.; Jamie, J. F.; Davies, M. J., Tryptophan-derived
ultraviolet filter compounds covalently bound to lens proteins are photosensitizers of oxidative damage. Free Radic. Biol. Med. 2008, 44 (6), 1108-1119.
65. Dreaden, T. M.; Chen, J.; Rexroth, S.; Barry, B. A., N-formylkynurenine as a marker of high light stress in photosynthesis. J. Biol. Chem. 2011, 286 (25), 22632-22641.
66. Creed, D., The photophysics and photochemistry of the near‐UV absorbing amino acids–i. Tryptophan and its simple derivatives. Photochem. Photobiol. 1984, 39 (4), 537-562.
67. Guideline, I. H. T., Photostability testing of new drug substance and products. Fed. Register
1996, 62, 27115-27122. 68. Wei, Z.; Feng, J.; Lin, H. Y.; Mullapudi, S.; Bishop, E.; Tous, G. I.; Casas-Finet, J.; Hakki, F.;
Strouse, R.; Schenerman, M. A., Identification of a single tryptophan residue as critical for

18
binding activity in a humanized monoclonal antibody against respiratory syncytial virus. Anal.
Chem. 2007, 79 (7), 2797-805. 69. Baertschi, S. W.; Alsante, K. M.; Tønnesen, H. H., A critical assessment of the ICH guideline
on photostability testing of new drug substances and products (Q1B): Recommendation for revision. J. Pharm. Sci. 2010, 99 (7), 2934-2940.
70. Mallaney, M.; Wang, S. h.; Sreedhara, A., Effect of ambient light on monoclonal antibody product quality during small‐scale mammalian cell culture process in clear glass bioreactors. Biotechnol. Progr. 2014, 30 (3), 562-570.
71. Du, C.; Barnett, G.; Borwankar, A.; Lewandowski, A.; Singh, N.; Ghose, S.; Borys, M.; Li, Z. J., Protection of therapeutic antibodies from visible light induced degradation: Use safe light in manufacturing and storage. Eur. J. Pharm. Biopharm. 2018, 127, 37-43.
72. Kerwin, B. A.; Remmele, R. L., Jr., Protect from light: photodegradation and protein biologics. J. Pharm. Sci. 2007, 96 (6), 1468-79.
73. Baertschi, S. W.; Clapham, D.; Foti, C.; Jansen, P. J.; Kristensen, S.; Reed, R.; Templeton, A. C.; Tonnesen, H. H., Implications of In-Use Photostability: Proposed Guidance for Photostability Testing and Labeling to Support the Administration of Photosensitive Pharmaceutical Products, Part 1: Drug Products Administered by Injection. J. Pharm. Sci.
2013, 102 (11), 3888-3899. 74. Kerwin, B. A., Polysorbates 20 and 80 used in the formulation of protein biotherapeutics:
structure and degradation pathways. J. Pharm. Sci. 2008, 97 (8), 2924-35. 75. Chen, B.; Bautista, R.; Yu, K.; Zapata, G. A.; Mulkerrin, M. G.; Chamow, S. M., Influence of
histidine on the stability and physical properties of a fully human antibody in aqueous and solid forms. Pharm. Res. 2003, 20 (12), 1952-1960.
76. Stroop, S. D.; Conca, D. M.; Lundgard, R. P.; Renz, M. E.; Peabody, L. M.; Leigh, S. D., Photosensitizers form in histidine buffer and mediate the photodegradation of a monoclonal antibody. J. Pharm. Sci. 2011, 100 (12), 5142-5155.
77. Dion, M. Z.; Leiske, D.; Sharma, V. K.; de Zafra, C. L. Z.; Salisbury, C. M., Mitigation of oxidation in therapeutic antibody formulations: a biochemical efficacy and safety evaluation of N-acetyl-tryptophan and L-methionine. Pharm. Res. 2018, 35 (11), 222.
78. Hogan, K. L.; Leiske, D.; Salisbury, C. M., Characterization of N-acetyl-tryptophan degradation in protein therapeutic formulations. J. Pharm. Sci. 2017, 106 (12), 3499-3506.
79. Bhambhani, A.; Kissmann, J. M.; Joshi, S. B.; Volkin, D. B.; Kashi, R. S.; Middaugh, C. R., Formulation design and high-throughput excipient selection based on structural integrity and conformational stability of dilute and highly concentrated IgG1 monoclonal antibody solutions. J. Pharm. Sci. 2012, 101 (3), 1120-1135.
80. Zbacnik, T. J.; Holcomb, R. E.; Katayama, D. S.; Murphy, B. M.; Payne, R. W.; Coccaro, R. C.; Evans, G. J.; Matsuura, J. E.; Henry, C. S.; Manning, M. C., Role of Buffers in Protein Formulations. J. Pharm. Sci. 2017, 106 (3), 713-733.
81. Ugwu, S. O.; Apte, S. P., The effect of buffers on protein conformational stability. Pharm.
Technol. 2004, 28 (3), 86-109. 82. Nema, S.; Washkuhn, R.; Brendel, R., Excipients and their use in injectable products. PDA J.
Pharm. Sci. Technol. 1997, 51 (4), 166-171. 83. Jeong, S. H., Analytical methods and formulation factors to enhance protein stability in
solution. Arch. Pharmacal Res. 2012, 35 (11), 1871-1886. 84. Uchiyama, S., Liquid formulation for antibody drugs. Biochimica et Biophysica Acta (BBA)-
Proteins and Proteomics 2014, 1844 (11), 2041-2052.

19
85. Kang, J.; Lin, X.; Penera, J., Rapid formulation development for monoclonal antibodies. BioProcess Int 2016, 14 (4), 40.
86. Liu, J.; Shire, S. J., Reduced-viscosity concentrated protein formulations. Google Patents: 2014.
87. Fraenkel-Conrat, H.; Olcott, H. S., Reaction of formaldehyde with proteins VI. cross-linking of amino groups with phenol, imidazole, or indole groups. J. Biol. Chem. 1948, 174 (3), 827-843.
88. Tomita, M.; Irie, M.; Ukita, T., Sensitized photooxidation of histidine and its derivatives. Products and mechanism of the reaction. Biochemistry 1969, 8 (12), 5149-5160.
89. Bane, J.; Mozziconacci, O.; Yi, L.; Wang, Y. J.; Sreedhara, A.; Schoneich, C., Photo-oxidation of IgG1 and Model Peptides: Detection and Analysis of Triply Oxidized His and Trp Side Chain Cleavage Products. Pharm. Res. 2017, 34 (1), 229-242.
90. Falconer, R. J., Advances in liquid formulations of parenteral therapeutic proteins. Biotechnol.
Adv. 2019. 91. Harinarayan, C.; Skidmore, K.; Kao, Y.; Zydney, A.; Van Reis, R., Small molecule clearance
in ultrafiltration/diafiltration in relation to protein interactions: Study of citrate binding to a Fab. Biotechnol. Bioeng. 2009, 102 (6), 1718-1722.
92. Valliere-Douglass, J. F.; Connell-Crowley, L.; Jensen, R.; Schnier, P. D.; Trilisky, E.; Leith, M.; Follstad, B. D.; Kerr, J.; Lewis, N.; Vunnum, S.; Treuheit, M. J.; Balland, A.; Wallace, A., Photochemical degradation of citrate buffers leads to covalent acetonation of recombinant protein therapeutics. Protein Sci. 2010, 19 (11), 2152-63.
93. Valliere-Douglass, J. F.; Lewis, P.; Salas-Solano, O.; Jiang, S., Solid-state mAbs and ADCs subjected to heat-stress stability conditions can be covalently modified with buffer and excipient molecules. J. Pharm. Sci. 2015, 104 (2), 652-665.
94. Houlton, S., Benefits and drawbacks of moving to biosimilar medicines. Prescriber 2019, 30 (7), 13-15.
95. Subelzu, N.; Schoneich, C., Near UV and visible light induce iron-dependent photo-degradation reactions in pharmaceutical buffers: mechanistic and product studies
96. Dear, B. J.; Hung, J. J.; Truskett, T. M.; Johnston, K. P., Contrasting the influence of cationic amino acids on the viscosity and stability of a highly concentrated monoclonal antibody. Pharm. Res. 2017, 34 (1), 193-207.
97. Labrenz, S. R., Ester hydrolysis of polysorbate 80 in mAb drug product: evidence in support of the hypothesized risk after the observation of visible particulate in mAb formulations. J.
Pharm. Sci. 2014, 103 (8), 2268-77. 98. Park, J. H.; Jin, J. H.; Lim, M. S.; An, H. J.; Kim, J. W.; Lee, G. M., Proteomic Analysis of
Host Cell Protein Dynamics in the Culture Supernatants of Antibody-Producing CHO Cells. Sci. Rep. 2017, 7, 44246.
99. Kranz, W.; Wuchner, K.; Corradini, E.; Berger, M.; Hawe, A., Factors Influencing Polysorbate's Sensitivity Against Enzymatic Hydrolysis and Oxidative Degradation. J. Pharm.
Sci. 2019, 108 (6), 2022-2032. 100. Hall, T.; Sandefur, S. L.; Frye, C. C.; Tuley, T. L.; Huang, L., Polysorbates 20 and 80
Degradation by Group XV Lysosomal Phospholipase A2 Isomer X1 in Monoclonal Antibody Formulations. J. Pharm. Sci. 2016, 105 (5), 1633-1642.
20
1.10. Figures
Figure 1: Structure of an antibody

21
Scheme 1: Jablonski’s diagram showing Type I and Type II photosensitization.

22
Chapter 2: One-electron photo-oxidation of Met-Xn-
His-containing peptides: Formation of novel cross-
links
23
2.1. Introduction
Protein oxidation can target any amino acid depending on the oxidant; however, the aromatic
(tryptophan, tyrosine, phenylalanine, and histidine) and sulfur-containing amino acids (cysteine
(Cys), and methionine (Met)) are generally more susceptible to oxidation.1-3 In particular, the
oxidation of Met to Met sulfoxide (MetO) can have consequences for protein stability, structure
and biological activity.4 For example, upon Met oxidation to MetO calmodulin undergoes
structural changes, which destabilize the protein.5-6 In another case, the oxidation of Met in actin
reduced actin polymerization.4, 7-13 Met oxidation also affects the interactions of Met with
tryptophan (Trp),14-15 lysine (Lys),16 and histidine (His).17 In biological systems, methionine
sulfoxide reductase (Msr) isoforms are present to reduce MetO back to Met.18-19 However, the
enzymatic reduction of MetO to Met is not possible in biotherapeutics, which are usually
formulated for long time storage. Therefore, Met oxidation in biotherapeutics is carefully
monitored. One issue of concern is the oxidation of Met residues in monoclonal antibodies , which
can affect binding to the neonatal fragment crystallizable receptor (FcRn), leading to a decrease in
receptor binding and potentially affecting the pharmacokinetics of the antibodies. 17, 20-21
Met oxidation can occur through one or two-electron processes. The one-electron oxidation usually
involves a strong one-electron oxidant such as a hydroxyl radical (HO•),22-26 or an alkoxyl radical
(RO•),27 even to a certain extent peroxynitrite, ONOO-.28-30 One-electron transfer from Met yields
a Met sulfur radical cation (Met>S•+), which can form a 2 centers – 3 electrons (2c-3e) bond with
a nearby heteroatom (oxygen, nitrogen, sulfur); such 2c-3e bonds were identified by their
absorption spectra during time-resolved pulse radiolysis or flash photolysis experiments.31-32 On
the other hand, the two-electron oxidation of Met can be achieved with hydrogen peroxide
(H2O2),20, 27 organic peroxides (ROOH),33 ONOO-,28-29 and singlet oxygen (1O2)27. Recent studies
24
on the Fenton oxidation via [FeII(EDTA)]2-/H2O2 of parathyroid hormone 1-34 (PTH (1-34)) and
a monoclonal antibody suggest that the intermediary generation of peptide and protein Met>S•+
can lead to the hydrolysis of the peptide bond C-terminal of Met>S•+ specifically in the
subsequence -Met-His-.24-25 In the proposed mechanism,24-25 the His residue served to bind an
[FeII(EDTA)]2- complex to promote generation of an oxidant in the immediate vicinity of Met.
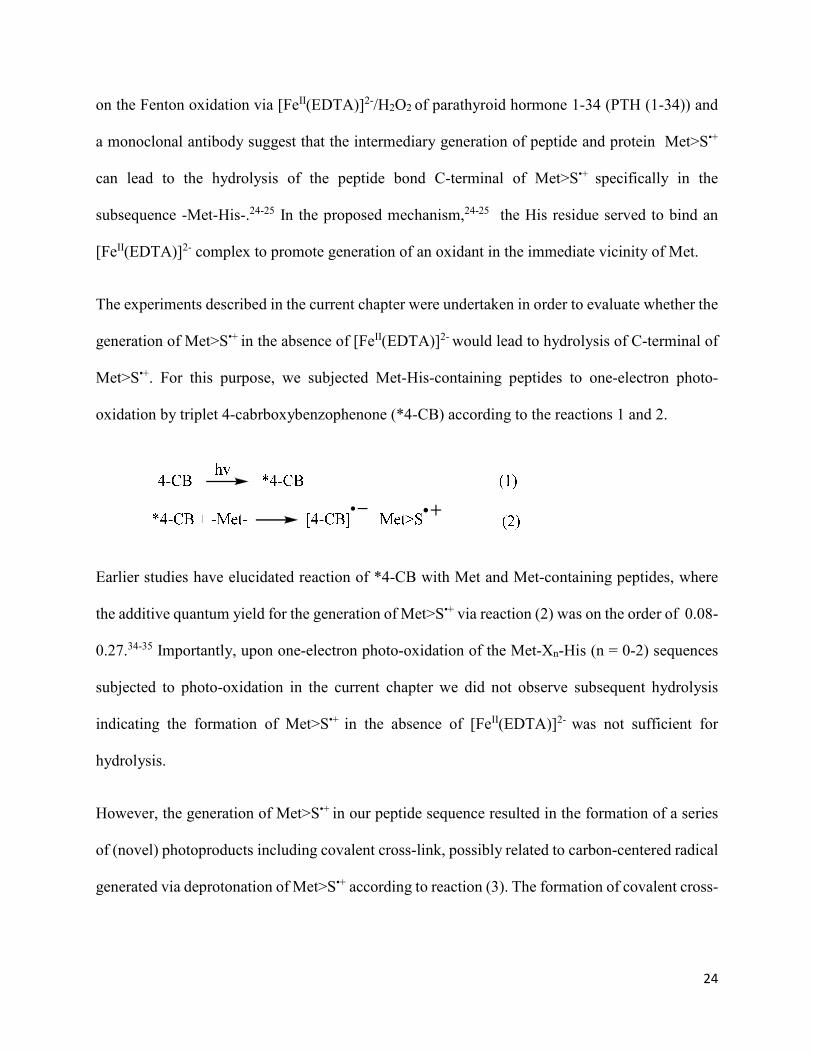
The experiments described in the current chapter were undertaken in order to evaluate whether the
generation of Met>S•+ in the absence of [FeII(EDTA)]2- would lead to hydrolysis of C-terminal of
Met>S•+. For this purpose, we subjected Met-His-containing peptides to one-electron photo-
oxidation by triplet 4-cabrboxybenzophenone (*4-CB) according to the reactions 1 and 2.
Earlier studies have elucidated reaction of *4-CB with Met and Met-containing peptides, where
the additive quantum yield for the generation of Met>S•+ via reaction (2) was on the order of 0.08-
0.27.34-35 Importantly, upon one-electron photo-oxidation of the Met-Xn-His (n = 0-2) sequences
subjected to photo-oxidation in the current chapter we did not observe subsequent hydrolysis
indicating the formation of Met>S•+ in the absence of [FeII(EDTA)]2- was not sufficient for
hydrolysis.
However, the generation of Met>S•+ in our peptide sequence resulted in the formation of a series
of (novel) photoproducts including covalent cross-link, possibly related to carbon-centered radical
generated via deprotonation of Met>S•+ according to reaction (3). The formation of covalent cross-

25
links is of great significance for protein oxidation during conditions of oxidative stress and
aging.36-42 In addition cross-link formation is stability concern for the formulation and
administration of protein biotherapeutics, where cross-links correlate with the loss of biological
activity and the formation of aggregates and particles, which may be immunogenic.43-46
Frequently, the mechanisms and structures of cross-links in protein biotherapeutics are unknown,
and the current chapter adds some mechanistic insight into cross-link formation relevant for the
semaphorin-6A and monoclonal antibodies and , which contain at least one, and some cases more
than one Met-His subsequence in their structure.47-49
2.2. Materials and Methods
2.2.1. Materials
The model peptide M1 and LPLAHAL (A1) were purchased either from GenScript (Piscataway,
NJ), or was synthesized in-house. All other model peptides, LPLM(13C5)HAL (M2),
LPLMH(15N3)AL (M3), LPLMGHAL (M4), and LPLMGGHAL (M5) were synthesized in-house.
All amino acids for peptide synthesis were from Gyros Protein Technologies AB (Tucson, AZ).
The Fmoc stable isotope-labeled Met and His residues were purchased from Cambridge Isotope
laboratories Inc (Tewksbury, MA). Triisopropylsilane (TIPS), trifluoroacetic acid (TFA), 4-CB,
Girard’s reagent T (GRT), N-ethylmaleimide (NEM), and sodium borohydride (NaBH4) were from
Sigma-Aldrich (St. Louis, MO) at the highest commercially available grade. Acetonitrile (ACN),
Optima® water with FA, and Optima® ACN with FA were purchased from Fisher Scientific
C3 C5

26
(Hampton, NH). The ultra-pure quality water (dH2O) (18.2 MΩ) was produced fresh daily by a
WaterPro PS Polishing System (Labconco, Kansas City, MO).
2.2.2. Synthesis of model peptides and purification
Model peptides (Chart 1) were synthesized using Fmoc-chemistry on a Tribute® solid-phase
peptide synthesizer (Gyros Protein Technologies AB, Tucson, AZ). After synthesis, the protection
groups and resin in the peptidyl-resin were deprotected using an Fmoc-cleavage mixture
containing 94% TFA, 3% TIPS and 3% water by stirring for 2 h at room temperature.50 The cleaved
peptide and resin were separated using a filter with 70-170 µm pore size, and the filtrate containing
the cleaved peptide was evaporated using a rotary evaporator. The dried peptide was reconstituted
in 10 ml of 1:1 of acetonitrile: mobile phase A (95%water, 5%ACN and 0.1% TFA) and filtered
using a 0.2 μm filter before injecting onto a semi preparative HPLC column (Waters XBridge C18
column, 19 mm × 250 mm, 5 μm particle size; Waters Corporation, Milford, MA). The peptide
was eluted at a flow rate of 15 ml/min and dried by lyophilization. The purified peptides were
analysed for purity in a Waters Micromass LCT Premier Mass Spectrometer (Micromass Ltd.,
Manchester, U.K.).
2.2.3. Photo-irradiation
Solutions of 1 mM peptide and 100 µM 4-CB were prepared in 10 mM phosphate buffer and the
pH adjusted to 3.30, 7.23, or 9.88 using HCl and/or NaOH. These solutions were saturated with
either air or Ar, and photo-irradiated for 0-90 min at room temperature in borosilicate test tubes.
The photo-irradiation was performed in a Rayonet photoreactor (RPR200, The Southern New
England Ultraviolet Company, Branford, CT) equipped with four lamps (Southern New England,
Branford, CT, RMA-500) that emit UV-A light between 310 nm and 410 nm, with λmax = 350 nm.
27
Actinometry was done with the ferrioxalate actinometer51-53, which gave a flux of ~3x10⁻⁸
Einstein.s-1 and an irradiance of ~6.3 W.h/m2. The solutions in our experimental conditions was
exposed to irradiances of 0-9.45 W.h/m2. The latter value is significantly below 200 W.h/m2 for
photostability testing with UV light, recommended by the ICH Q1B guideline of the International
Conference of Harmonization (ICH).54 Control solutions were placed in the dark at room
temperature for 1 h or wrapped with aluminum foil and placed in the Rayonet photoreactor for 1
h during photo-irradiation. All solutions were analyzed by HPLC and mass spectrometry.
2.2.4. Reversed Phase-High Performance Liquid Chromatography (RP-HPLC) analysis
Control and photo-irradiated solutions were analyzed in a RP-HPLC equipped with a PDA detector
(Shimadzu Corporation, Kyoto, Japan). The unmodified peptides, photoproducts, and 4-CB were
monitored at 214 nm. The separation was achieved at a flow rate of 1ml/min on a Vydac®
218TP54 protein and peptide C18 column (4.6 mm i.d. x 250 mm, 5 µm particle size, and 300 Å
pore size) (Alltech Associates Inc, Deerfield, IL), maintained at 35 °C in a column heater. Mobile
phase A and B consisted of water with 0.1% TFA and ACN with 0.1% TFA, respectively.
Resolution of unmodified peptides, photoproducts, and 4-CB was achieved with the following
gradient program: 97% A and 3% B was held for 7 min, changed to 85% A and 15% B at 7.1 min,
and linearly changed to 45% A and 55 % B within 14 min. Then, the composition of solvents was
changed to 30% A and 70% B over 6 min and maintained for 1 min before re-equilibration to 3%
A and 97% B for 7 min. The data were collected and analyzed with the Shimadzu LabSolutions
software, and plotted with the GraphPad Prism 7 software.
28
2.2.5. NanoAcquity LC Electrospray Ionization Q-tof MS and LC-MS/MS analysis
The photo-irradiated solutions were analyzed on a nanoAcquity Ultra Performance Liquid
Chromatography system connected to a Xevo-G2 Qtof tandem mass spectrometer (LC-MS)
(Waters Corporation, Milford, MA). The instrument was operated in the positive and data-
dependent mode at a mass range of 150-2000 Da. The capillary voltage and sampling cone voltage
were set to 2.7 kV and 45 V, respectively. The electrospray ionization (ESI) source temperature
was maintained at 100 °C. Four microliters of 20 μM control or photo-irradiated solutions were
injected onto a Symmetry® C18 Waters trap column (2G-V/M Trap) with a dimension of 180 μm
x 200 mm, 5 μm particle size, and 100 Å pore size, connected to an analytical nanoAcquity ultra
performance Waters peptide CSH ™ C18 column with a dimension of 75 μm x 250 mm, 1.7 μm
particle size, and 130 Å pore size. The analytical column temperature was maintained at 40 °C.
Mobile phase A consisted of Optima® water with 0.1% formic acid (FA) and mobile phase B
consisted of acetonitrile containing 0.1% FA. The solutions were injected onto the trapping column
for 2 min at a flow rate of 4 μl/min. After 2 min, the solutions were directed to the analytical
column with a flow rate of 0.3 μl/min. The peptide and the photoproducts were separated using
the following gradient: the initial composition was 97% A and 3% B mobile phases, which was
changed linearly to 65% A and 35% B within 50 min, held for 20 min, changed to 5% A and 95%
B at 70 min and held for another 3 min. Subsequently, the composition was reverted to 97% A and
3% B to re-equilibrate the column and held for 10 min. The mass spectrometer was operated and
the obtained data analyzed with the Masslynx v.4.1 software. The data were plotted with the
GraphPad Prism 7 software.
29
2.3. Results
2.3.1. Identification of photoproducts
The solutions containing peptide M1 and 4-CB in 10 mM phosphate buffer were exposed to UV-
A light for 0-90 min; representative data for 60 min will be discussed in detail. When the solution
at pH 7.23 was photo-irradiated under air or Ar with λmax = 350 nm for 60 min, several
photoproducts were resolved and characterized by LC-MS analysis (Fig. 1, red trace). The
photoproducts with their names, abbreviations, m/z value, and charge state are provided in Table
S1. The control solution only showed the unmodified peptide M1 (tR = 21.20 min) displaying a
molecular ion with m/z 397.73 (z = 2), and a small amount of oxidation products M1P6a and
M1P6b with m/z 405.70 (z = 2), eluting at 20.96 min and 21.23 min, respectively (Fig. 1, black
trace).
When M1 was photo-irradiated at pH 7.23 under air (red trace), ~30% of the unmodified M1 were
lost (Table S2), leading to the formation of several photoproducts that eluted before and after the
peak of unmodified M1. LC-MS analysis revealed that the photoproducts M1P6a and M1P6b,
eluting at tR = 20.96 and 21.23 min display a molecular ion with m/z 405.70 (z = 2), an increase
of 16 Da relative to M1. At tR = 21.84 and 22.04 min, isobaric photoproducts (M1P1a and M1P1b)
nearly co-eluted, displaying molecular ions with m/z 381.70 (z = 2), representing a loss of 32 Da
from M1 (more details in section 3.3). At tR = 22.84 min, a photoproduct (M1P2) displaying a
molecular ion with m/z 389.70 (z = 2) was observed and characterized by the loss of 16 Da from
unmodified M1 (more detail in section 3.7). Another photoproduct that elutes before unmodified
M1, at tR = 23.82 min, is M1P3, displaying a molecular ion with m/z 390.70 (z = 2), which is more
prominent at pH 3.30 shown in Fig. 2 (green trace). The photoproducts that elute at tR = 26.80 and
27.17 min showed increase by 34 Da (M1P3-SO3H) and 32 Da (M1P7) relative to M1, respectively
30
(more detail in sections 3.8 and 3.11). Photoproducts M1P5a-d, eluting at tR = 28.55, 29.05, 30.01,
and 30.75 min, all display a molecular ion m/z 510.72 (z = 2). These isobaric products reveal an
increase by 226 Da relative to M1, corresponding to the molecular weight of 4-CB. Therefore,
products M1P5a-d are likely generated by reaction between peptide-derived radicals and a ketyl
radical derived from 4-CB (more detail in section 3.10). The extracted ion chromatogram (XIC)
of a photo-irradiated solution also revealed His oxidation products (more detail in section 3.12).
All observed products are discussed in detail below. In contrast to air-saturated solutions, the
photo-irradiation of Ar saturated solutions M1 and 4-CB (Fig. 1, blue trace) showed a significant
lower conversion of M1 (7%), generating small yields of M1P1a/M1P1b, and products M1P5a-d.
The structures of photoproducts from peptide M1 is shown in Chart 2. As a control, the solution
containing peptide A1 with 4-CB was photo-irradiated in the similar conditions as M1 and 4-CB.
As expected, the products generated from the original Met were not observed, including M1P1a
and M1P1b (Fig. S1).
2.3.2. Comparison of photoproducts at pH 3.30, 7.23, and 9.88 by LC-MS
Control and photo-irradiated solutions of M1 and 4-CB in 10 mM phosphate buffer, at pH 3.30,
7.23, or 9.88 (under air) were analyzed by LC-MS (Fig. 2). The control solutions were wrapped in
aluminum foil and placed in Rayonet reactor during photo-irradiation. The control solutions
contained <3% of oxidation products M1P6a and M1P6b, characterized by an increase of 16 Da
on the Met residue. In general, photo-irradiation at pH 3.30 generated higher yield of
photoproducts as compared to pH 7.23 and 9.88 (Table S2). At pH 3.30, M1 was converted into
M1P6a/ M1P6b (tR = 20.96 and 21.23 min), M1P1a/M1P1b (tR = 21.81 and 22.04 min), M1P2 (tR
= 22.84 min), M1P3 (tR = 23.82 min), M1P4 (tR = 23.91 min), M1P3+SO3H (tR = 26.80 min),
M1P7 (tR = 27.17 min), and M1P5a-d (tR = 28.55, 29.05, 30.01, and 30.75 min). At pH 7.23
31
M1P4a/M1P4b was not observed and at pH 9.88, only 0.11% of M1P4a/M1P4b was formed,
which is ~4% less in comparison to pH 3.30 (Table S2). The percentages of M1P3 formed at pH
7.23 and at pH 9.88 were 0.03 and 0.05, respectively, whereas at pH 3.30, 0.48% of M1P3 was
formed. Similar observations were made when photoproducts at pH 3.30, 7.23, and 9.88 were
analyzed by HPLC coupled to UV-detection (Fig. S2).
2.3.3. The photoproducts M1P1a and M1P1b
At tR = 21.84 and 22.04 min (Fig. 1, red trace), two isobaric photoproducts (M1P1a and M1P1b)
were identified by LC-MS analysis, displaying molecular ion with m/z 381.72 (z = 2). These ions
indicate a loss of 32 Da from M1. The LC-MS/MS spectrum of M1P1a/M1P1b was compared
with that of unmodified M1 (Fig. 3) to elucidate structural changes leading to M1P1a/M1P1b. The
LC-MS/MS spectrum of unmodified M1 revealed all the y-ions (y1-y6), a b2 ion, and several
internal fragments such as HA, MH, LMH, LMHA, PLMH, and PLMHA, confirming that the
amino acids in M1 were not modified (Fig. 3A). In contrast, the LC-MS/MS spectrum of
M1P1a/M1P1b showed the y1 ion, and multiple y ions undergoing loss of water such as y4-H2O,
y5-H2O, y5-H2O, and y6-H2O. Additionally, it displays internal fragments characterized by neutral
water loss or neutral CO loss. All internal fragments are present with cross-link between oxidized
Met and His. Importantly, prominent ions such as y3 and the internal fragment HA, which are
present in LC-MS/MS spectrum of unmodified M1, are absent in the LC-MS/MS spectrum of
M1P1a/M1P1b. Moreover, the intensity of immonium ion of His is decreased significantly in the
LC-MS/MS spectrum of M1P1a/M1P1b. These data suggest a cross-link formation between the
original residues Met and His after the loss of 32 Da. Another important observation is that
M1P1a/M1P1b loses a water molecule during LC-MS/MS analysis, resulting in a product
M1P1a/M1P1b-H2O, displaying a molecular ion with 372.72 (z = 2). M1P1a/M1P1b and
32
M1P1a/M1P1b-H2O have identical fragmentation patterns (Fig. S3) indicating that they are related
to each other. Based on the LC-MS/MS spectrum of M1P1a/M1P1b, we propose a mechanism in
Scheme 1, according to which M1P1a/M1P1b is derived from aspartate semialdehyde M1P1
(reaction 8). M1P1 is also isobaric to M1P1a/M1P1b; however, the LC-MS/MS spectrum of m/z
381.72 (z = 2) did not show fragmentation pattern for open chain aldehyde. M1P1a/M1P1b must
be in equilibrium with M1P1 as shown in reaction 8 Scheme 1. In order to prove the existence of
the aspartate semialdehyde M1P1, the photo-irradiation samples were subjected to reduction by
NaBH4 and derivatization with GRT, as described below.
2.3.3.1. Reduction by NaBH4
When a photo-irradiated solution was incubated with 20 mM NaBH4 at 37 °C for 15 min at pH
12.00 and analysed by LC-MS (Fig. 4), the peaks with m/z 381.72 (z =2), representing
M1P1a/M1P1b disappeared and a new peak at tR = 21.23 min appeared. This new peak contained
a product with a molecular ion with m/z 382.70 (z =2), indicating an increase of 2 Da relative to
M1P1a/M1P1b. As M1P1a/M1P1b are connected to M1P1 via equilibrium 8 Scheme 1, reduction
process converts aspartate semialdehyde M1P1 into an alcohol as shown in Scheme 3.
2.3.3.2. Derivatization by GRT
The photo-irradiated solution was subjected to derivatization with GRT, which forms a hydrazone
derivative of aldehydes. A photo-irradiated solution was incubated with 20 mM GRT at 37 °C and
pH 3.30 for 19 h and analysed by LC-MS. This reaction resulted in the reduction of peak area of
the signal representing M1P1a/M1P1b and the formation of a new peak at tR = 17.52 min
containing a product with a molecular ion with m/z 438.23 (z = 2) (Fig. 5, insert). This peak
contains the hydrazone derived from M1P1 (M1P1-GRT) shown in Scheme 4. The LC-MS/MS
spectrum of M1P1-GRT contained the ions y3-y6 and an internal fragment u1H, where u1 =
33
hydrazone, depicting a chemical modification of the original Met residue (Fig. S4), further
indicating that M1P1a/M1P1b are in equilibrium with M1P1.
2.3.4. Generation of M1P1a/M1P1b from peptide M1 containing 13C-Met
The LC-MS/MS spectrum of M1P1a/M1P1b suggests a cross-link between the original residues
Met and His after the loss of 32 Da. In order to evaluate whether the loss of 32 Da originates from
Met and His, peptide M1 was synthesized with stable isotope-labeled Met (ε-13C) (M2) or His
(15N3; section 3.5) (M3). One pathway to the loss of 32 Da would be oxidation of Met to aspartate
semialdehyde (M1P1), accounting for a net loss of 32 Da. A solution containing 1 mM peptide M2
and 100 µM 4-CB was photo-irradiated at pH 7.20 under the same conditions as outlined in section
2.3. The LC-MS chromatogram of the photo-irradiated solution shows that unmodified M2 and
several photoproducts are higher in mass by 1 Da; however, the cross-link M1P1a/M1P1b derived
from peptide M2 shows an identical molecular ion (m/z 381.70, z = 2) as M1P1a/M1P1b derived
from peptide M1, indicating that the original Met residue had lost the ε-CH3 group, consistent with
a loss of 13CH3SH to form aspartate semialdehyde, M1P1.
2.3.5. Generation of M1P1a/M1P1b-(15N3) from peptide M3 containing 15N-labeled His
Theoretically, a loss of 32 Da from M1 would also be consistent with a loss of hydrazine (H2N-
NH2), which could originate from His. Therefore, peptide M3 (Chart 1) was synthesized and
subjected to photo-oxidation and LC-MS/MS analysis. The LC-MS chromatogram showed
formation of M1P1a/M1P1b-(15N3) with an increase of 3 Da in comparison to M1P1a/M1P1b
derived from peptide M1. The LC-MS/MS spectrum of M1P1a/M1P1b-(15N3) (Fig. 6) revealed
the presence of y4-y6 including their neutral loss of H2O and absence of y2 and y3. The internal
fragment H(15N3)A is not observed, and all other internal fragments display cross-link between
34
oxidized Met and His(15N3) characterized by neutral water loss or neutral CO loss. The LC-
MS/MS spectrum indicates the side chain of the His residue is intact, and Met and His(15N3) are
cross-linked after the loss of 32 Da and a water molecule, like M1P1a/M1P1b. Hence, the
experiments with M2 and M3 are consistent with the structural assignment of product
M1P1a/M1P1b derived from peptide M1.
2.3.6. Effect of spacing on cross-link formation
Two model peptides M4 and M5 containing one Gly and two Gly, respectively, between Met and
His were synthesized to observe the effect of spacing between Met and His in cross-link formation.
Solutions containing either M4 or M5 and 4-CB were photo-irradiated under the conditions
outlined in section 2.3 and the products were analysed by LC-MS/MS. The cross-link product
formed from M4 (M4P1a/M4P1b) displays a molecular ion with m/z 410.27 (z = 2) corresponding
to the loss of 32 Da from M4. The LC-MS/MS spectrum of M4P1a/M4P1b (Fig. 7) displays the
characteristic ions y2, y5-H2O, y6-H2O, and y7-H2O. All internal fragments contained cross-linked
oxidized Met, Gly, and His, characterized by loss of neutral H2O loss or neutral loss of CO.
Together with the absence of y3 and y4 ions and of the internal fragments that would contain either
Met or His, these data are consistent with cross-link formation between Met and His across a
bridging Gly residue. It is interesting that the LC-MS/MS spectrum in Fig. 7 shows a small signal
for the His immonium ion, suggesting that the cross-link may be sensitive to dissociation during
electrospray LC-MS analysis, consistent with equilibrium 8 (Scheme 1).
The cross-link product M5P1a/M5P1b formed from peptide M5 was analyzed by LC-MS/MS. The
LC-MS/MS spectrum of M5P1a/M5P1b (Fig. 8) displayed the ions y2, y3, y6-H2O, y7-H2O, and
y8-H2O. However, the ions y4 and y5 are not present in the LC-MS/MS spectrum. Importantly, an
35
ion y3 and the internal fragment HA are observed at low intensity, which indicates that the cross-
link with a Gly-Gly bridge may not be stable during electrospray LC-MS analysis. However, like
M1P1a/M1P1b and M1P1a/M1P1b-(15N3), we observed loss of water from the molecular ion
during gas-phase fragmentation from M4P1a/M4P1b and M5P1a/M5P1b, analogous to the
formation of M1P1a/M1P1b-H2O from M1 according to reaction 9.
2.3.7. Formation of aspartic acid (M1P2)
The photoproduct M1P2 is characterized by the loss of 16 Da from M1, with m/z 389.72 (z = 2).
In Fig. 1, M1P2 eluted at tR = 22.84 min and the y ion series (y1-y6) in the LC-MS/MS analysis
(Fig. 9) indicated that the loss of 16 Da is derived from the Met residue of M1. This is confirmed
by the fragments such as HA, MH-16, LMH-16, PLMHA-16, and the immonium ions of His, Pro
and Leu. A net loss of 16 Da from Met would be consistent with the formation of thioaldehyde,
vinyl homocysteine, or aspartic acid; all these proposed structures are isobaric. In order to test
whether M1P2 was a thioaldehyde, the photo-irradiated solution was incubated with GRT, which
would convert the thioaldehyde in a hydrazone, analogous to the derivatization of aspartic
semialdehyde (section 3.3.2). However, the incubation with GRT did not change the peak intensity
of M1P2, suggesting that this product is not a thioaldehyde. This was confirmed by reaction with
NaBH4, which did not result in any reduction product.
The second possible structure is vinyl homocysteine that contains a free thiol group. When photo-
irradiated sample was incubated with the alkylating agent NEM at 37 °C for 1 h at pH 9.20, the
peak intensity of M1P2 did not change, indicating that M1P2 does not contain a free thiol.
Therefore, we propose that the structure of M1P2 contain aspartic acid, generated via reaction 10
36
(Scheme 1). M1P2 can also form after oxidation of aspartate semialdehyde (M1P1) via reaction
11 Scheme 1.
2.3.8. Formation of homocysteine (M1P3) and homocysteine sulfonic acid (M1P3-SO3H)
The photoproduct M1P3 eluting at tR = 23.82 min (Fig. 1), displays a molecular ion with m/z
390.70 (z = 2), corresponding to the loss of 14 Da from M1. The LC-MS/MS spectrum of M1P3
(Fig. 10) showed the presence of ion series y1-y6, indicating the loss of 14 Da from the Met
residue. Moreover, the LC-MS/MS spectrum also displayed the immonium ions of Pro, Leu, and
His, and internal fragments such as HA, MH-14, LMH-14, and PLMHA-14, indicating that
modification of the Met residue is responsible for the formation of M1P3. A loss of 14 Da from
Met would be consistent with the formation of homocysteine, which has been observed before as
a product of Met>S•+.25 Since homocysteine contains a free thiol group, the photo-irradiated
solution was incubated with NEM at 37 °C for 1 h at pH 9.20. This incubation led to a new product
with m/z 453.26 (z = 2), indicating the alkylation of M1P3 with NEM (Scheme 5). LC-MS/MS
analysis of this NEM alkylated product (Fig. S5) displayed the expected ion series y2-y6, showing
the addition of NEM to homocysteine (M1P3-NEM). In addition, the presence of internal
fragments such as HA and u2H (where u2 = homocysteine + NEM) indicate the formation of
homocysteine.
The photo-oxidation of M1 in the presence of 4-CB led to a peak eluting at tR = 26.80 min (Fig. 1,
red trace), which displays a molecular ion with 414.72 (z = 2), corresponding to an addition of
either 34 Da to M1 or 48 Da to M1P3. LC-MS/MS analysis (Fig. S6) of this peak reveals the ion
series y1-y6, consistent with the oxidation of M1P3 to homocysteine sulfonic acid (product M1P3-
SO3H). This is further corroborated by the presence of immonium ions of Pro, Leu, and His, and

37
internal fragments such as HA and u3H (where u3 = homocysteine + 48). Interestingly, based on
the relative signal intensities the yield of M1P3-SO3H is four-fold and ~seven-fold higher at pH
3.30, compared to oxidation at pH 7.23 and 9.88, respectively (Fig. 2 and Table S2).
2.3.9. Formation of thioesters (M1P4a and M1P4b)
A photoproduct of M1 eluting at tR = 23.91 min (Fig. 2, green trace) displays a molecular ion with
m/z 404.72 (z = 2). This m/z may correspond to either M1P4a or M1P4b isomers. This
photoproduct was only observed at pH 3.30, but not at pH 7.23 and 9.88. The molecular ion
indicates an increase of 14 Da relative to M1. The LC-MS/MS spectrum of M1P4a/M1P4b (Fig.
11) displays immonium ions of Pro, Leu, and His, several internal fragments such as HA and
LPLMH+14 and all the y-ions except for y4, which indicates that the chemical transformation
targeted the Met residue. The molecular weight of M1P4a/M1P4b is consistent with the formation
of a thioester, likely via reactions 6 (Scheme 1) and 14 (Scheme 2), respectively.
In order to confirm the formation of thioester from peptide M1, the photo-irradiated solution was
incubated with NaBH4 (Fig. 4), where the C=O of thioester may be reduced to an alcohol, similar
to mechanism shown in Scheme 3. The reduced product will increase by 2 Da compared to M1P4
and give a molecular ion of 405.72 (z = 2), which is isobaric to MetO. After incubation, the peak
corresponding to M1P4a/M1P4b disappeared. Since the reduced product is isobaric to MetO, it
was difficult to identify it. Therefore, a separate derivatization experiment was carried out with
GRT for 19 h at 37 °C in acidic pH, where C=O may form a hydrazone with GRT. However, we
did not observe the derivatized product, instead higher yield of M1P3 was observed (Fig. 5).
Because GRT derivatization was carried in acidic pH, M1P4b can undergo acid hydrolysis to give
38
M1P3 (reaction 16 Scheme 2). Similarly, M1P4a can also undergo acid hydrolysis to give M1P2
but our data did not indicate increase in M1P2.
2.3.10. 4-CB adducts on Met (M1P5a-d)
The photoproducts displaying molecular ions with m/z 510.72 (z = 2) (Fig. 1) are present in at
least four distinct peaks referred to as (M1P5a-d) and correspond to an increase of 226 Da (mass
of 4-CB) relative to M1. They elute at tR = 28.55, 29.05, 30.01, and 30.75 min. These peaks
collectively represent 4-CB adducts either on the C3 or the C5 carbon of Met, which can be
generated as various epimers. Such 4-CB adduct on Met have been reported previously.55
Theoretically, we expected to observe four on the C3 carbon and two on the C5 carbon; as we can
resolve only four distinct epimers, two of these epimer either do not form or co-elute with other
epimers. Representative LC-MS/MS spectrum of M1P5b (Fig. 12) eluting at tR = 30.01 min reveals
the ions y1, y2, y3, y4-H2O, y5-H2O, y6-H2O, immonium ions of Pro, Leu, and His, and internal
fragments such as HA, MH+226-H2O; all of these ions indicate that the addition of 226 Da
occurred on the Met residue of M1.
2.3.11. Formation of Met sulfoxide (M1P6a/M1P6b) and sulfone (M1P7)
The LC-MS chromatograms (Fig. 1) of control and photo-irradiated solutions of M1 and 4-CB
displayed two peaks eluting at tR = 20.96 and 21.23 min containing molecular ions with m/z 405.72
(z = 2), corresponding to an increase of 16 Da on M1. However, the photo-irradiated sample
contained a higher intensity of these isobaric products. The LC-MS/MS spectra of these isobaric
products (Fig. S7) were identical and revealed the ion series y1-y6, immonium ions of Pro, Leu,
and His, and the internal fragments such as HA and MH+16, indicating an increase of 16 Da on
the Met residue of M1. These isobaric products likely represent two MetO diastereomers.
39
In addition, the photo-irradiated solution also revealed a peak eluting at tR = 27.17 min displaying
a molecular ion with m/z 413.72 (z = 2), which corresponds to addition of 32 Da relative to peptide
M1. The LC-MS/MS spectrum (Fig. S8) of this peak displays the ion series y1-y6, indicating that
the increase of 32 Da occurred on the Met residue of M1. In addition, the presence of immonium
ions of Pro, Leu, and His residue indicates that these residues are not modified, and the presence
of internal fragments such as HA and MH+32 further solidifies our observation that the Met
residue is modified. The increase in 32 Da is consistent with the formation of M1P7.
2.3.12. Formation of His oxidation products (M1P8 and M1P9)
The photo-irradiation of M1 and 4-CB leads to two peaks eluting at tR = 28.04 and 29.27 min,
displaying isobaric molecular ions with m/z 826.37 (z = 1), corresponding to an increase of 32 Da
relative to M1. The LC-MS/MS spectra of these peaks (Fig. S9) are identical and display the ion
series b2-b6 and the b5-H2O, indicating an addition of 32 Da to the His residue. This is
corroborated by the absence of a His immonium ion, and the presence of immonium ions of Pro,
Leu and Met. The two isobaric products (M1P18a and M1P8b) likely represent a 2,4-dihydroxy
derivative of His and/or an endoperoxide, likely generated through the addition of singlet oxygen
to His.56 Singlet oxygen can be generated under our experimental condition through reaction of
*4-CB with O2.57-58
Additional photoproduct (M1P7), eluting at tR = 45.85 min, displays a molecular ion with m/z
808.4 (z = 1), corresponding to an increase of 14 Da relative to peptide M1. The LC-MS/MS
spectrum (Fig. S10) of this peak displays the ion series b2-b5, which indicate that the increase of
14 Da occurred on the His residue. This is corroborated by absence of a His immonium ion and of
40
the internal fragment HA. The mass increase of 14 on M1P9 is consistent with the formation of 4-
alkyl-2H-imidazol-2-one (see Chart 2), a commonly observed His oxidation product.
2.4. Discussion
The photo-irradiation of M1 and 4-CB formed a series of photoproducts that were identified by
LC-MS/MS analysis. Peptide M1 contains two reactive amino acids (Met and His) in its sequence
and we detected the photoproducts of Met were in higher yield compared to photoproducts of His.
While generation of most of the Met photoproducts were proposed via Met>S•+, photoproducts in
His may be generated via singlet oxygen. This is explained by the two types of photo-oxidation of
4-CB, where type I generates Met>S•+ after abstraction of an electron by 4-CB and in type II
photo-oxidation triplet state 4-CB transfers energy to a molecular oxygen generating singlet
oxygen.59 The formation of Met>S•+, a key intermediate in our study, can be stabilized by nearby
heteroatoms (N, O or S) forming 2c-3e bond, identified by pulse radiolysis.31-32
The hydrogen on C3 or C5 carbons of Met>S•+ is deprotonated forming a carbon-centered radical,
which can react readily with oxygen under air. These stable intermediates are important for the
transformation of Met to photoproducts. However, under Ar these carbon-centered radicals do not
react with oxygen to give oxidation products. As such, these carbon-centered radicals react more
readily with 4-CB to give M1P5(a-d) photoproducts (Fig. 12). We have observed that the
intensities of 4-CB adduct on Met residues are higher under Ar than under air. Apart from the role
of oxygen to form these photoproducts of Met and His, we also looked into the effect of pH on the
products formation at pH 3.30, 7.23, and 9.88. We detected a higher yield of photoproducts and
new peaks at pH 3.30 compared to pH 7.23 and 9.88 (Table S2). This is likely because of the initial
formation of 4-CB radical anion is protonated and back electron transfer is prohibited, therefore
41
generating more Met>S•+ and subsequently more photoproducts. One of the photoproducts
detected was a cross-link product, M1P1a/M1P1b, which has not been reported previously.
2.4.1. Formation of M1P1a/M1P1b
Among many Met photoproducts observed, formation of the cross-link product M1P1a/M1P1b
was the most notable product detected after photo-irradiation. M1P1a/M1P1b is characterized by
the loss of CH3SH from Met residue, formation of aldehyde on C3 carbon of oxidized Met, and
attack by nitrogen of imidazole on aldehyde forming a cross-link. While there are studies on
hydrolysis between Met and His in hGH and IgG1 as well as the effects of Met oxidation in IgG1
on binding ability of His with FcRn, no direct cross-link formation between Met and His side
chains was reported previously. Considering the frequency of Met-His sequence in proteins, a
mechanistic study for M1P1a/M1P1b formation is thoroughly studied.
The LC-MS/MS spectrum of M1P1a/M1P1b (Fig. 3B) indicates the formation of a cross-link
product (section. 3.3). M1P1a/M1P1b formation involves multistep pathways and is initiated after
the diffusion-controlled reaction between carbon-centered radical at C3 position of Met residue
and a molecular oxygen forming a peroxyl radical (reaction 4, Scheme 1). Two of these peroxyl
radicals combine and undergo Russell mechanism to give M1P4, a molecular oxygen, and an
alcohol product, one of the intermediates of M1P1a/M1P1b (reactions 5 and 6, Scheme 1). We
detected M1P4 in the LC-MS chromatogram at pH 3.30. At higher pHs, M1P4 may have
hydrolyzed faster to give aspartic acid (M1P2), which was observed in all pHs. The detection of
these two products in LC-MS chromatogram solidifies our proposed mechanism. Further, to form
M1P1a/M1P1b, the alcohol intermediate forms an aspartate semialdehyde (M1P1) after loss of
CH3SH (reaction 7, Scheme 1). The emission of CH3SH from Met has been studied earlier.60 A
42
nucleophilic reaction occurs when nitrogen of imidazole attacks M1P1 forming a cross-link
product, M1P1a/M1P1b (reaction 8, Scheme 1). The formation of M1P1a/M1P1b is also
corroborated by our studies on isotopically labelled peptides M2 and M3. When C5 on Met was
labelled with 13C in M2, a cross-link product was observed with no change in m/z in comparison
to M1P1a/M1P1b depicting loss of this carbon during the formation of the product as we have
proposed in our mechanism. In addition, three nitrogen on His were isotopically labelled in M3,
and after photo-irradiation a cross-link product with increase in 3 Da was observed (Fig. 6)
indicating no loss of mass from His. Notably, M1P1a/M1P1b also undergoes loss of a water
molecule in LC-MS (reaction 9, Scheme 1), which seems to be a common phenomenon on our MS
settings as we also observed loss of water in the LC-MS/MS spectrum of 4-CB adducts on Met
(Fig. 12) when an alcohol group was formed.
Few cross-links in proteins have been reported in the literature, mainly due to difficulty in
identifying them without prior knowledge of mechanisms of formation, sites of cross-linking, and
lack of MS data search engines.46 Covalent chemical cross-linking is of major concern in
biotherapeutics as it can lead to non-reducible aggregates and result in loss of biological activity
and increase immunogenicity.43-45 This can affect the product quality, safety, and clinical efficacy.
For example, previous studies reported on cross-linking formation of His-His cross-link, which
may have resulted in a non-reducible aggregate.46 His is also known to cross-link with other amino
acids, such as Lys and Cys.61 Identification of cross-links may provide insight into the
pathogenesis of conditions such as Alzheimer62-63 and cataract63-64 as protein aggregation is known
to be a key factor in their development. Therefore, it is crucial to identify these non-reducible
cross-links and understand their underlying mechanism; also, development of the cross-link
identifying software from MS data can ease the process of identifying novel cross-links.
43
2.5. Conclusions
This chapter reports on the formation of a novel cross-link product between modified Met and His
in a model peptide along with other Met and His oxidation products after photo-irradiation with 4-
CB. The mechanism and supporting experiments for the cross-link formation are provided in
detail. The mechanism primarily involves the formation of sulfur radical cation on Met residue
leading to a radical on C3 carbon, loss of methanethiol (CH3SH), and formation of an aldehyde,
which is attacked by nitrogen on imidazole to form the cross-link product. Such modification on
Met is irreversible and can change the structure and functionality of proteins. The prevalence of
Met and His sequence in therapeutic proteins and their importance in protein efficacy make this
sequence interesting and important.

44
2.6. References
1. Davies, M. J., The oxidative environment and protein damage. Biochim. Biophys. Acta 2005,
1703 (2), 93-109.
2. Li, S.; Schoneich, C.; Borchardt, R. T., Chemical instability of protein pharmaceuticals:
Mechanisms of oxidation and strategies for stabilization. Biotechnol. Bioeng. 1995, 48 (5),
490-500.
3. Torosantucci, R.; Schöneich, C.; Jiskoot, W., Oxidation of Therapeutic Proteins and Peptides:
Structural and Biological Consequences. Pharm. Res. 2014, 31 (3), 541-553.
4. Chumsae, C.; Gaza-Bulseco, G.; Sun, J.; Liu, H., Comparison of methionine oxidation in
thermal stability and chemically stressed samples of a fully human monoclonal antibody. J.
Chromatogr. B 2007, 850 (1-2), 285-294.
5. Anbanandam, A.; Bieber Urbauer, R. J.; Bartlett, R. K.; Smallwood, H. S.; Squier, T. C.;
Urbauer, J. L., Mediating molecular recognition by methionine oxidation: conformational
switching by oxidation of methionine in the carboxyl-terminal domain of calmodulin.
Biochemistry 2005, 44 (27), 9486-96.
6. Gao, J.; Yin, D. H.; Yao, Y.; Sun, H.; Qin, Z.; Schöneich, C.; Williams, T. D.; Squier, T. C.,
Loss of conformational stability in calmodulin upon methionine oxidation. Biophys. J. 1998,
74 (3), 1115-1134.
7. Dalle-Donne, I.; Rossi, R.; Giustarini, D.; Gagliano, N.; Di Simplicio, P.; Colombo, R.;
Milzani, A., Methionine oxidation as a major cause of the functional impairment of oxidized
actin. Free Radic. Biol. Med. 2002, 32 (9), 927-37.
8. Dow, L. K.; Changela, A.; Hefner, H. E.; Churchill, M. E., Oxidation of a critical methionine
modulates DNA binding of the Drosophila melanogaster high mobility group protein, HMG-
D. FEBS Lett. 1997, 414 (3), 514-20.
9. Glaser, C. B.; Morser, J.; Clarke, J. H.; Blasko, E.; McLean, K.; Kuhn, I.; Chang, R. J.; Lin, J.
H.; Vilander, L.; Andrews, W. H.; Light, D. R., Oxidation of a specific methionine in
thrombomodulin by activated neutrophil products blocks cofactor activity. A potential rapid
mechanism for modulation of coagulation. J. Clin. Invest. 1992, 90 (6), 2565-73.
10. Lu, H. S.; Fausset, P. R.; Narhi, L. O.; Horan, T.; Shinagawa, K.; Shimamoto, G.; Boone, T.
C., Chemical modification and site-directed mutagenesis of methionine residues in
recombinant human granulocyte colony-stimulating factor: effect on stability and biological
activity. Arch. Biochem. Biophys. 1999, 362 (1), 1-11.
11. Teh, L. C.; Murphy, L. J.; Huq, N. L.; Surus, A. S.; Friesen, H. G.; Lazarus, L.; Chapman, G.
E., Methionine oxidation in human growth hormone and human chorionic
somatomammotropin. Effects on receptor binding and biological activities. J. Biol. Chem.
1987, 262 (14), 6472-7.
12. Uversky, V. N.; Yamin, G.; Souillac, P. O.; Goers, J.; Glaser, C. B.; Fink, A. L., Methionine
oxidation inhibits fibrillation of human alpha-synuclein in vitro. FEBS Lett. 2002, 517 (1-3),
239-44.
45
13. Wood, M. J.; Becvar, L. A.; Prieto, J. H.; Melacini, G.; Komives, E. A., NMR structures reveal
how oxidation inactivates thrombomodulin. Biochemistry 2003, 42 (41), 11932-42.
14. Valley, C. C.; Cembran, A.; Perlmutter, J. D.; Lewis, A. K.; Labello, N. P.; Gao, J.; Sachs, J.
N., The methionine-aromatic motif plays a unique role in stabilizing protein structure. J. Biol.
Chem. 2012, 287 (42), 34979-91.
15. Reid, K. S. C.; Lindley, P. F.; Thornton, J. M., Sulphur-aromatic interactions in proteins. FEBS
Lett. 1985, 190 (2), 209-213.
16. Vanacore, R.; Ham, A. J.; Voehler, M.; Sanders, C. R.; Conrads, T. P.; Veenstra, T. D.;
Sharpless, K. B.; Dawson, P. E.; Hudson, B. G., A sulfilimine bond identified in collagen IV.
Science 2009, 325 (5945), 1230-4.
17. Bertolotti-Ciarlet, A.; Wang, W.; Lownes, R.; Pristatsky, P.; Fang, Y.; McKelvey, T.; Li, Y.;
Li, Y.; Drummond, J.; Prueksaritanont, T.; Vlasak, J., Impact of methionine oxidation on the
binding of human IgG1 to Fc Rn and Fc gamma receptors. Mol. Immunol. 2009, 46 (8-9),
1878-82.
18. Brot, N.; Weissbach, H., Biochemistry and physiological role of methionine sulfoxide residues
in proteins. Arch Biochem Biophys 1983, 223 (1), 271-81.
19. Zhang, X. H.; Weissbach, H., Origin and evolution of the protein-repairing enzymes
methionine sulphoxide reductases. Biol. Rev. Camb. Philos. Soc. 2008, 83 (3), 249-57.
20. Gao, X.; Ji, J. A.; Veeravalli, K.; Wang, Y. J.; Zhang, T.; McGreevy, W.; Zheng, K.; Kelley,
R. F.; Laird, M. W.; Liu, J.; Cromwell, M., Effect of individual Fc methionine oxidation on
FcRn binding: Met252 oxidation impairs FcRn binding more profoundly than Met428
oxidation. J. Pharm. Sci. 2015, 104 (2), 368-77.
21. Pan, H.; Chen, K.; Chu, L.; Kinderman, F.; Apostol, I.; Huang, G., Methionine oxidation in
human IgG2 Fc decreases binding affinities to protein A and FcRn. Protein Sci. 2009, 18 (2),
424-33.
22. Bobrowski, K.; Holcman, J., Formation and stability of intramolecular three-electron SN, SS,
and SO bonds in one-electron-oxidized simple methionine peptides. Pulse radiolysis. J. Phys.
Chem. 1989, 93 (17), 6381-6387.
23. Hiller, K.; Masloch, B.; Goebl, M.; Asmus, K., Mechanism of the hydroxyl radical induced
oxidation of methionine in aqueous solution. J. Am. Chem. Soc. 1981, 103 (10), 2734-2743.
24. Mozziconacci, O.; Arora, J.; Toth, R. T. t.; Joshi, S. B.; Zhou, S.; Volkin, D. B.; Schoneich,
C., Site-Specific Hydrolysis Reaction C-Terminal of Methionine in Met-His during Metal-
Catalyzed Oxidation of IgG-1. Mol. Pharm. 2016, 13 (4), 1317-28.
25. Mozziconacci, O.; Ji, J. A.; Wang, Y. J.; Schoneich, C., Metal-catalyzed oxidation of protein
methionine residues in human parathyroid hormone (1-34): formation of homocysteine and a
novel methionine-dependent hydrolysis reaction. Mol. Pharm. 2013, 10 (2), 739-55.
26. Schoeneich, C.; Aced, A.; Asmus, K. D., Mechanism of oxidation of aliphatic thioethers to
sulfoxides by hydroxyl radicals. The importance of molecular oxygen. J. Am. Chem. Soc. 1993,
115 (24), 11376-11383.
27. Davies, M. J., Protein oxidation and peroxidation. Biochem. J. 2016, 473 (7), 805-825.
46
28. Jensen, J. L.; Miller, B. L.; Zhang, X.; Hug, G. L.; Schöneich, C., Oxidation of
Threonylmethionine by Peroxynitrite. Quantification of the One-Electron Transfer Pathway by
Comparison to One-Electron Photooxidation. J. Am. Chem. Soc. 1997, 119 (20), 4749-4757.
29. Lobachev, V. L.; Rudakov, E. S., The chemistry of peroxynitrite. Reaction mechanisms and
kinetics. Russ. Chem.l Rev. 2006, 75 (5), 375.
30. Pryor, W. A.; Jin, X.; Squadrito, G. L., One-and two-electron oxidations of methionine by
peroxynitrite. Proceedings of the National Academy of Sciences 1994, 91 (23), 11173-11177.
31. Asmus, K.-D., Heteroatom-centered free radicals some selected contributions by radiation
chemistry. In StPTC, Jonah, C. D.; Rao, B. S. M., Eds. Elsevier: 2001; Vol. 87, pp 341-393.
32. Asmus, K. D., Stabilization of oxidized sulfur centers in organic sulfides. Radical cations and
odd-electron sulfur-sulfur bonds. Acc. Chem. Res. 1979, 12 (12), 436-442.
33. Keck, R. G., The use of t-butyl hydroperoxide as a probe for methionine oxidation in proteins.
Anal. Biochem. 1996, 236 (1), 56-62.
34. Hug, G. L.; Bobrowski, K.; Kozubek, H.; Marciniak, B., Photo-oxidation of methionine-
containing peptides by the 4-carboxybenzophenone triplet state in aqueous solution.
Competition between intramolecular two-centered three-electron bonded (S...S)+ and (S...N)+
formation. Photochem. Photobiol. 2000, 72 (1), 1-9.
35. Marciniak, B.; Hug, G. L.; Bobrowski, K.; Kozubek, H., Mechanism of 4-
carboxybenzophenone-sensitized photooxidation of methionine-containing dipeptides and
tripeptides in aqueous solution. J. Phys. Chem. 1995, 99 (36), 13560-13568.
36. Wells-Knecht, M. C.; Lyons, T. J.; McCance, D. R.; Thorpe, S. R.; Baynes, J. W., Age-
dependent increase in ortho-tyrosine and methionine sulfoxide in human skin collagen is not
accelerated in diabetes. Evidence against a generalized increase in oxidative stress in diabetes.
J. Clin. Invest. 1997, 100 (4), 839-846.
37. Schey, K.; Patat, S.; Chignell, C.; Datillo, M.; Wang, R.; Roberts, J., Photooxidation of Lens
α‐Crystallin by Hypericin (Active Ingredient in St. John's Wort)¶. Photochem. Photobiol.
2000, 72 (2), 200-203.
38. Smith, J. B.; Jiang, X.; Abraham, E., Identification of hydrogen peroxide oxidation sites of αA-
and αB-crystallins. Free Radical Res. 1997, 26 (2), 103-111.
39. Finley, E. L.; Dillon, J.; Crouch, R. K.; Schey, K. L., Radiolysis‐Induced Oxidation of Bovine
α‐Crystallin. Photochem. Photobiol. 1998, 68 (1), 9-15.
40. Seppi, C.; Castellana, M. A.; Minetti, G.; Piccinini, G.; Balduini, C.; Brovelli, A., Evidence
for membrane protein oxidation during in vivo aging of human erythrocytes. Mech. Ageing
Dev. 1991, 57 (3), 247-258.
41. Schöneich, C., Redox Processes of Methionine Relevant to β-Amyloid Oxidation and
Alzheimer's Disease. Arch. Biochem. Biophys. 2002, 397 (2), 370-376.
42. Vogt, W., Oxidation of methionyl residues in proteins: Tools, targets, and reversal. Free
Radical Biol. Med. 1995, 18 (1), 93-105.
43. Liu, H.; Gaza-Bulseco, G.; Faldu, D.; Chumsae, C.; Sun, J., Heterogeneity of monoclonal
antibodies. J. Pharm. Sci. 2008, 97 (7), 2426-2447.

47
44. Beck, A.; Wagner-Rousset, E.; Ayoub, D.; Van Dorsselaer, A.; Sanglier-Cianferani, S.,
Characterization of therapeutic antibodies and related products. Anal. Chem. 2013, 85 (2), 715-
736.
45. Lispi, M.; Datola, A.; Bierau, H.; Ceccarelli, D.; Crisci, C.; Minari, K.; Mendola, D.; Regine,
A.; Ciampolillo, C.; Rossi, M., Heterogeneity of commercial recombinant human growth
hormone (r-hGH) preparations containing a thioether variant. J. Pharm. Sci. 2009, 98 (12),
4511-4524.
46. Liu, M.; Zhang, Z.; Cheetham, J.; Ren, D.; Zhou, Z. S., Discovery and Characterization of a
Photo-Oxidative Histidine-Histidine Cross-Link in IgG1 Antibody Utilizing 18O-Labeling and
Mass Spectrometry. Anal. Chem. 2014, 86 (10), 4940-4948.
47. Uniprot UniProtKB - Q9H2E6 (SEM6A_HUMAN).
https://www.uniprot.org/uniprot/Q9H2E6.
48. UniProt UniProtKB - A0A097PUH2 (A0A097PUH2_MOUSE).
https://www.uniprot.org/uniprot/A0A097PUH2.
49. UniProt UniProtKB - Q7Z351 (Q7Z351_HUMAN).
https://www.uniprot.org/uniprot/Q7Z351.
50. His, T., Cleavage, Deprotection, and Isolation of Peptides after Fmoc Synthesis.
51. Hatchard, C.; Parker, C. A., A new sensitive chemical actinometer-II. Potassium ferrioxalate
as a standard chemical actinometer. Proc. R. Soc. London, Ser. A 1956, 235 (1203), 518-536.
52. Lee, J.; Seliger, H., Quantum yield of the ferrioxalate actinometer. J. Chem. Phys. 1964, 40
(2), 519-523.
53. Pozdnyakov, I. P.; Kel, O. V.; Plyusnin, V. F.; Grivin, V. P.; Bazhin, N. M., New insight into
photochemistry of ferrioxalate. J. Phys. Chem. A 2008, 112 (36), 8316-8322.
54. Guideline, I. H. T., Photostability testing of new drug substance and products. Fed. Register
1996, 62, 27115-27122.
55. Ignasiak, M. T.; Pedzinski, T.; Rusconi, F.; Filipiak, P.; Bobrowski, K.; Houée-Levin, C.;
Marciniak, B., Photosensitized Oxidation of Methionine-Containing Dipeptides. From the
Transients to the Final Products. J. Phys. Chem. B 2014, 118 (29), 8549-8558.
56. Agon, V. V.; Bubb, W. A.; Wright, A.; Hawkins, C. L.; Davies, M. J., Sensitizer-mediated
photooxidation of histidine residues: evidence for the formation of reactive side-chain
peroxides. Free Radic. Biol. Med. 2006, 40 (4), 698-710.
57. Miller, B. L.; Kuczera, K.; Schöneich, C., One-electron photooxidation of N-methionyl
peptides. Mechanism of sulfoxide and azasulfonium diastereomer formation through reaction
of sulfide radical cation complexes with oxygen or superoxide. J. Am. Chem. Soc. 1998, 120
(14), 3345-3356.
58. Miller, B. L.; Williams, T. D.; Schöneich, C., Mechanism of sulfoxide formation through
reaction of sulfur radical cation complexes with superoxide or hydroxide ion in oxygenated
aqueous solution. J. Am. Chem. Soc. 1996, 118 (45), 11014-11025.
59. Baptista, M. S.; Cadet, J.; Di Mascio, P.; Ghogare, A. A.; Greer, A.; Hamblin, M. R.; Lorente,
C.; Nunez, S. C.; Ribeiro, M. S.; Thomas, A. H.; Vignoni, M.; Yoshimura, T. M., Type I and
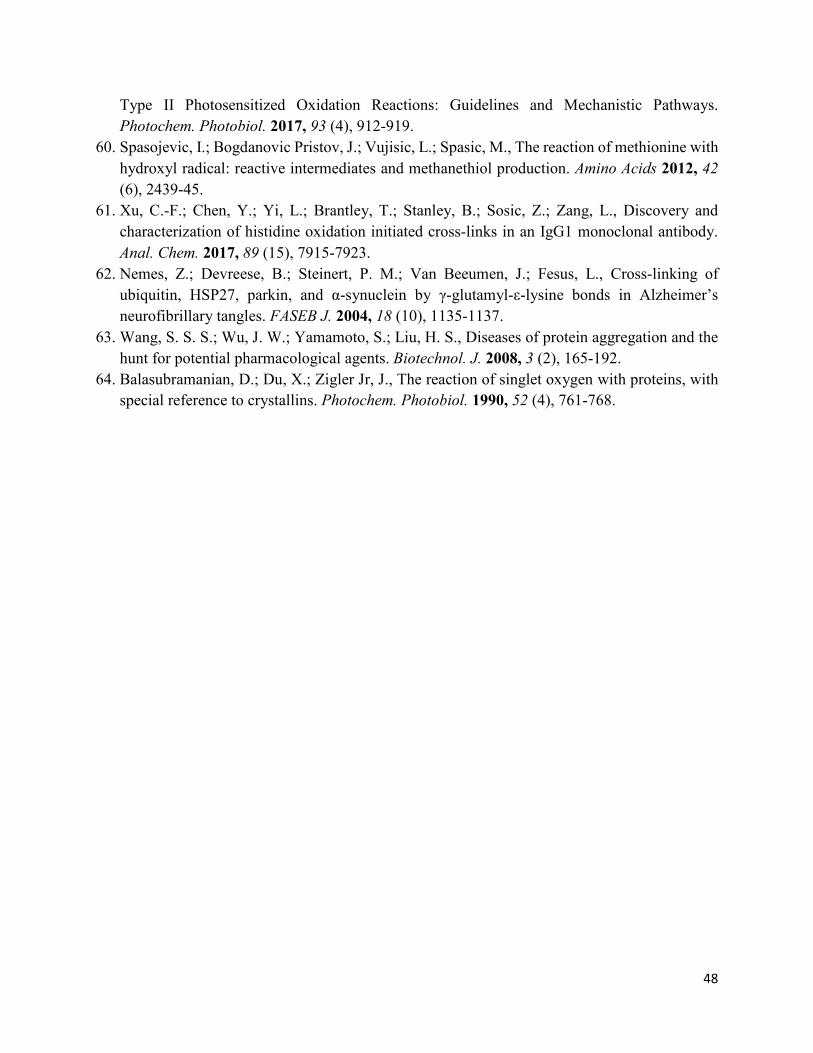
48
Type II Photosensitized Oxidation Reactions: Guidelines and Mechanistic Pathways.
Photochem. Photobiol. 2017, 93 (4), 912-919.
60. Spasojevic, I.; Bogdanovic Pristov, J.; Vujisic, L.; Spasic, M., The reaction of methionine with
hydroxyl radical: reactive intermediates and methanethiol production. Amino Acids 2012, 42
(6), 2439-45.
61. Xu, C.-F.; Chen, Y.; Yi, L.; Brantley, T.; Stanley, B.; Sosic, Z.; Zang, L., Discovery and
characterization of histidine oxidation initiated cross-links in an IgG1 monoclonal antibody.
Anal. Chem. 2017, 89 (15), 7915-7923.
62. Nemes, Z.; Devreese, B.; Steinert, P. M.; Van Beeumen, J.; Fesus, L., Cross-linking of
ubiquitin, HSP27, parkin, and α-synuclein by γ-glutamyl-ε-lysine bonds in Alzheimer’s
neurofibrillary tangles. FASEB J. 2004, 18 (10), 1135-1137.
63. Wang, S. S. S.; Wu, J. W.; Yamamoto, S.; Liu, H. S., Diseases of protein aggregation and the
hunt for potential pharmacological agents. Biotechnol. J. 2008, 3 (2), 165-192.
64. Balasubramanian, D.; Du, X.; Zigler Jr, J., The reaction of singlet oxygen with proteins, with
special reference to crystallins. Photochem. Photobiol. 1990, 52 (4), 761-768.

49
2.7. Charts and Figures
Chart 1: The structures and abbreviations of the model peptides synthesized to study the effect of photosensitization of 4-CB on Met and His containing peptides. R1=LPL and R2=AL
Peptides
Sequence
Abbreviation Structure
LPLMHAL M1
LPLM(13C5)HAL M2
LPLMH(15N3)AL M3
R1R2
HN
O
S
15N
O
15N
15N
H
H
LPLMGHAL M4
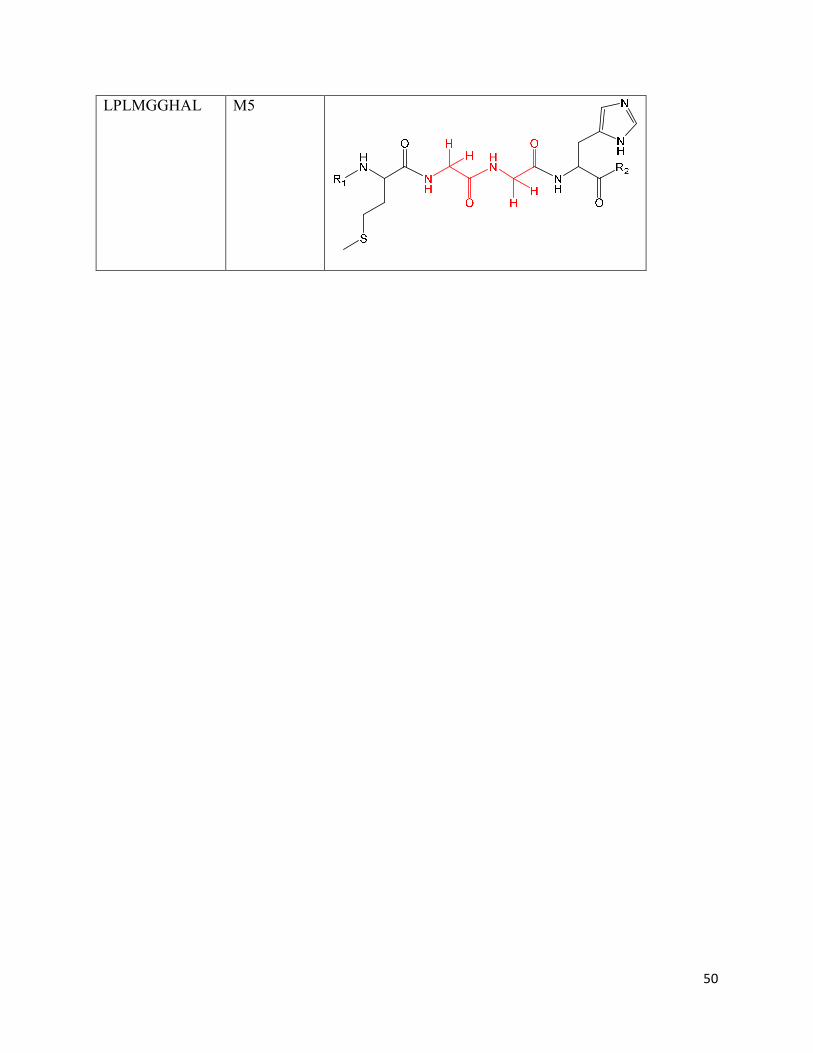
50
LPLMGGHAL M5
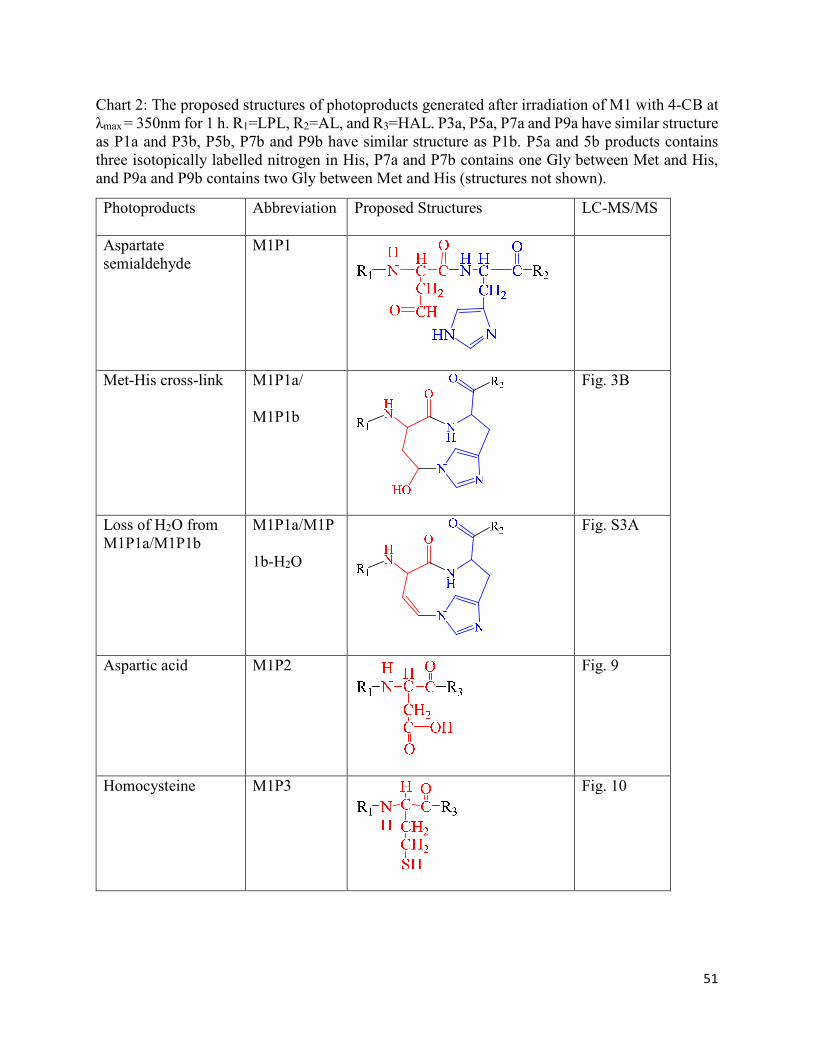
51
Chart 2: The proposed structures of photoproducts generated after irradiation of M1 with 4-CB at λmax = 350nm for 1 h. R1=LPL, R2=AL, and R3=HAL. P3a, P5a, P7a and P9a have similar structure as P1a and P3b, P5b, P7b and P9b have similar structure as P1b. P5a and 5b products contains three isotopically labelled nitrogen in His, P7a and P7b contains one Gly between Met and His, and P9a and P9b contains two Gly between Met and His (structures not shown).
Photoproducts Abbreviation Proposed Structures LC-MS/MS
Aspartate semialdehyde
M1P1
Met-His cross-link M1P1a/
M1P1b
Fig. 3B
Loss of H2O from M1P1a/M1P1b
M1P1a/M1P
1b-H2O
Fig. S3A
Aspartic acid M1P2
Fig. 9
Homocysteine M1P3
Fig. 10

52
Thioester M1P4a/
M1P4b
Fig. 11
4-CB adduct on Met M1P5(a-d)
Fig. 12
Homocysteine sulfonic acid
M1P3-SO3H
Fig. S6
Methionine sulfoxide
M1P6a/
M1P6b
Fig. S7

53
Methionine sulfone M1P7
Fig. S8
Histidine +32 M1P8
Fig. S9
4-alkyl-2H-imidazol-2-one (Histidine+14)
M1P9
Fig. S10
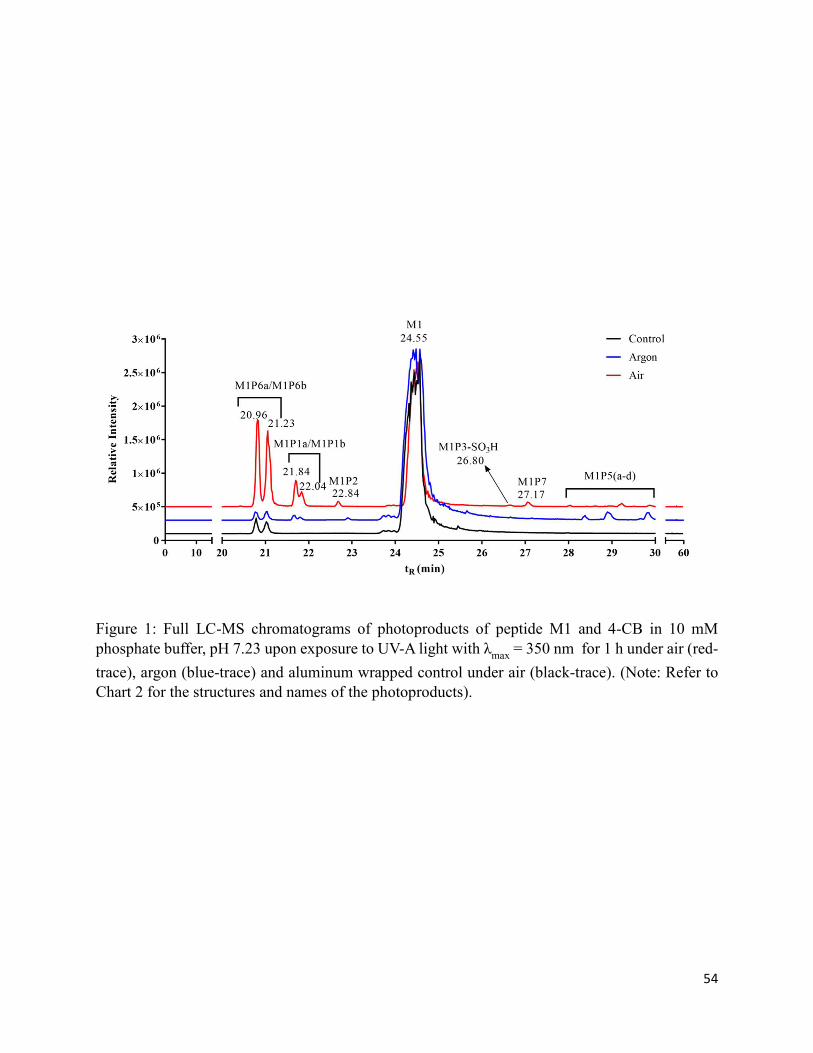
54
Figure 1: Full LC-MS chromatograms of photoproducts of peptide M1 and 4-CB in 10 mM phosphate buffer, pH 7.23 upon exposure to UV-A light with λmax = 350 nm for 1 h under air (red-
trace), argon (blue-trace) and aluminum wrapped control under air (black-trace). (Note: Refer to Chart 2 for the structures and names of the photoproducts).
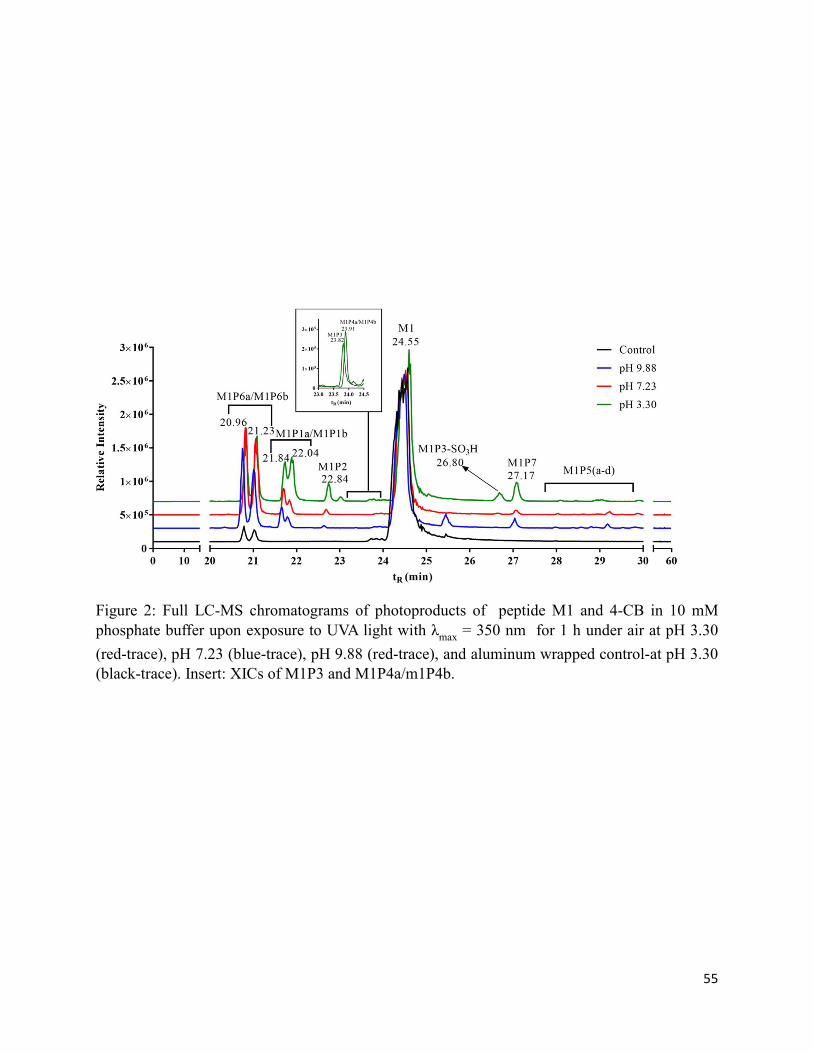
55
Figure 2: Full LC-MS chromatograms of photoproducts of peptide M1 and 4-CB in 10 mM phosphate buffer upon exposure to UVA light with λmax = 350 nm for 1 h under air at pH 3.30
(red-trace), pH 7.23 (blue-trace), pH 9.88 (red-trace), and aluminum wrapped control-at pH 3.30 (black-trace). Insert: XICs of M1P3 and M1P4a/m1P4b.
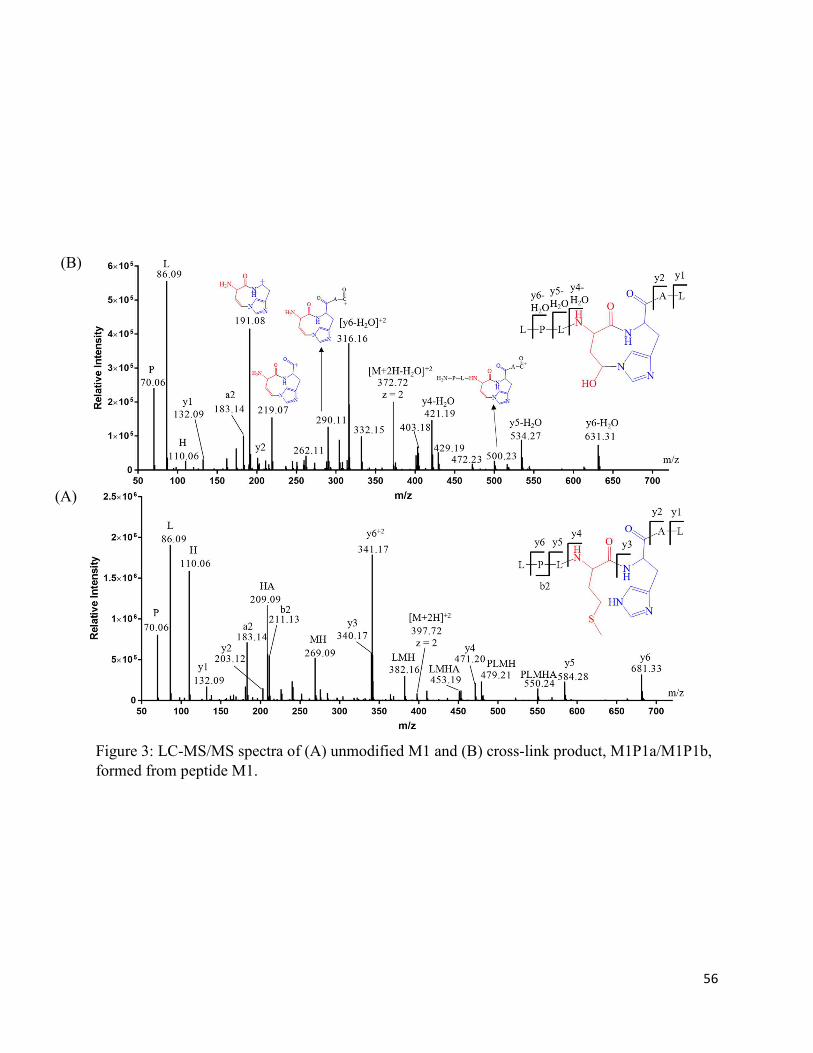
56
Figure 3: LC-MS/MS spectra of (A) unmodified M1 and (B) cross-link product, M1P1a/M1P1b, formed from peptide M1.
(A)
(B)
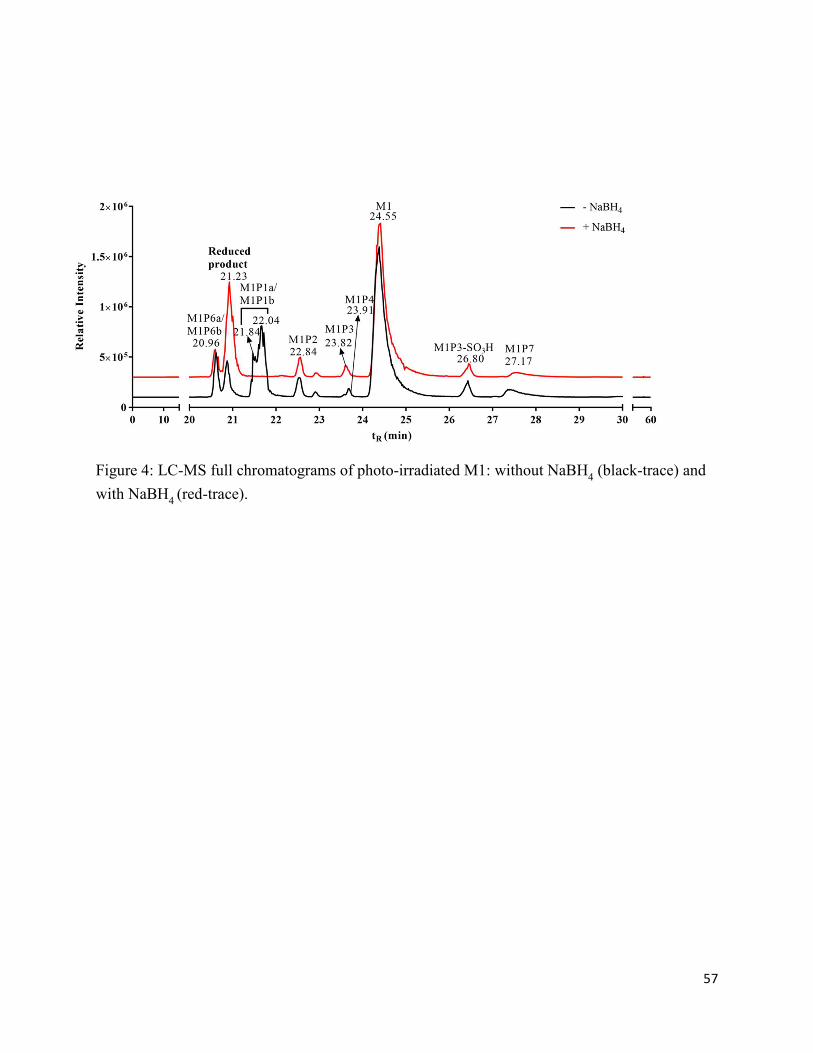
57
Figure 4: LC-MS full chromatograms of photo-irradiated M1: without NaBH4 (black-trace) and
with NaBH4 (red-trace).

58
Figure 5: LC-MS full chromatograms of photo-irradiated M1: without GRT (black-trace) and with GRT (red-trace). Insert: XIC of a hydrazone formation between M1P1 and GRT.
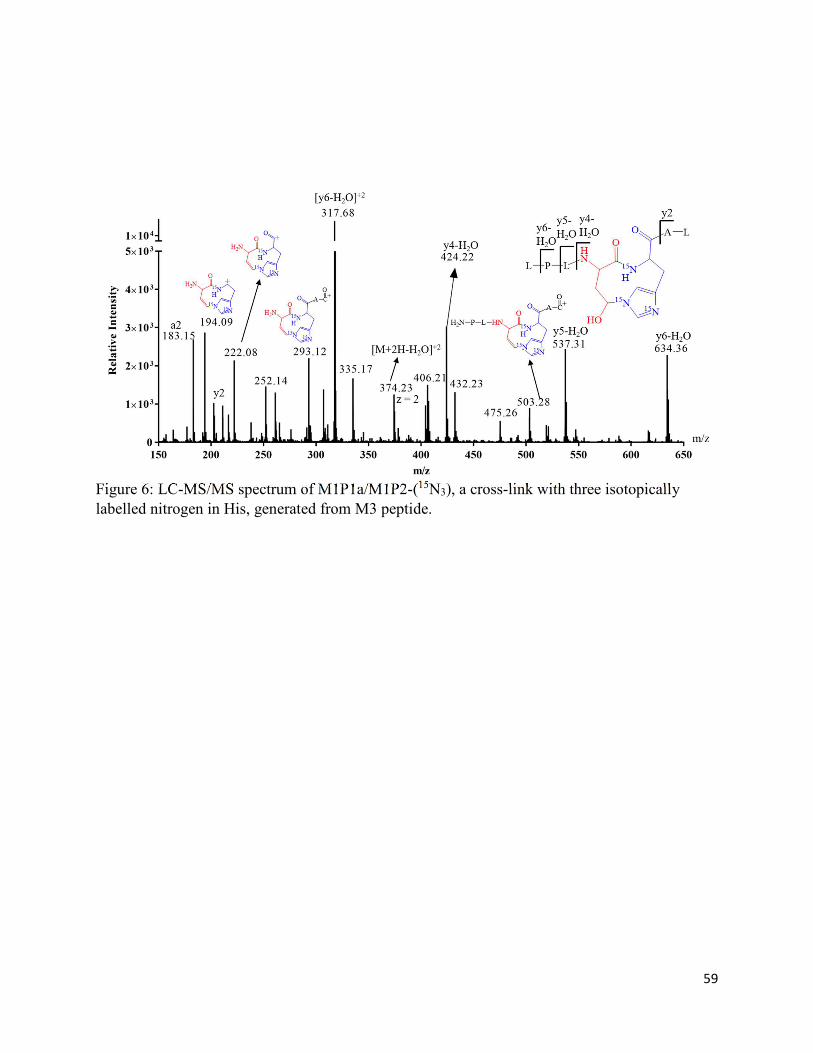
59
Figure 6: LC-MS/MS spectrum of M1P1a/M1P2-(15N3), a cross-link with three isotopically labelled nitrogen in His, generated from M3 peptide.
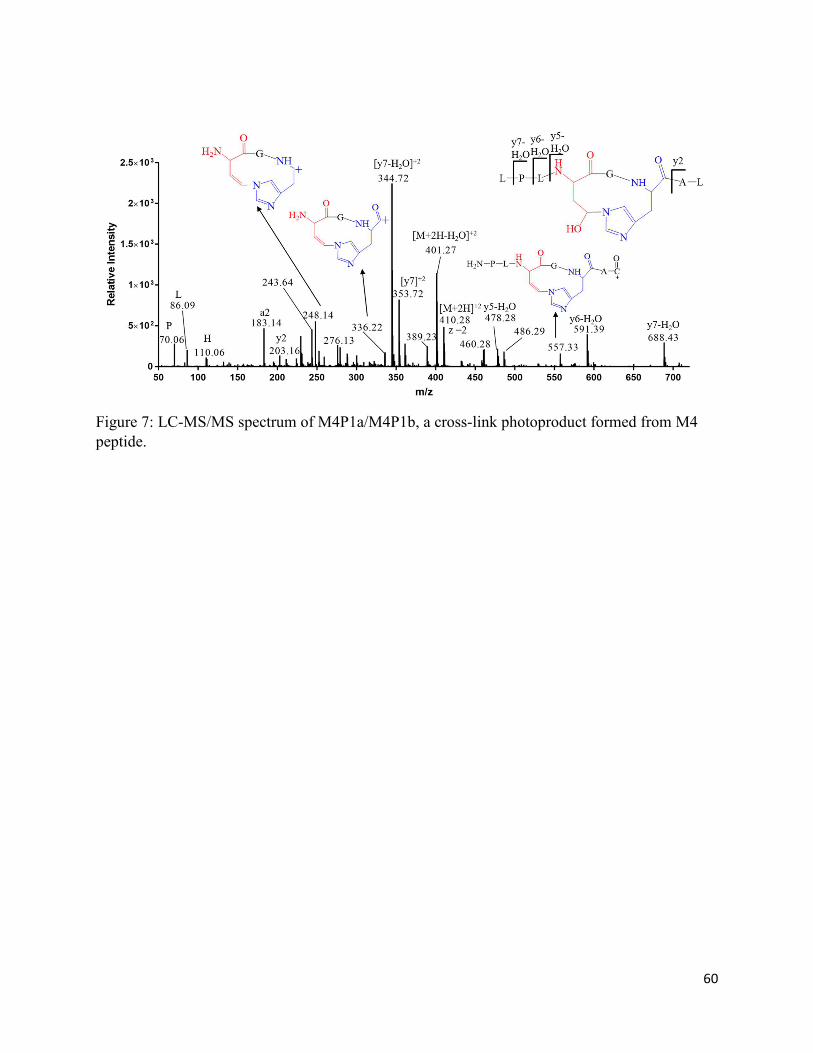
60
Figure 7: LC-MS/MS spectrum of M4P1a/M4P1b, a cross-link photoproduct formed from M4 peptide.
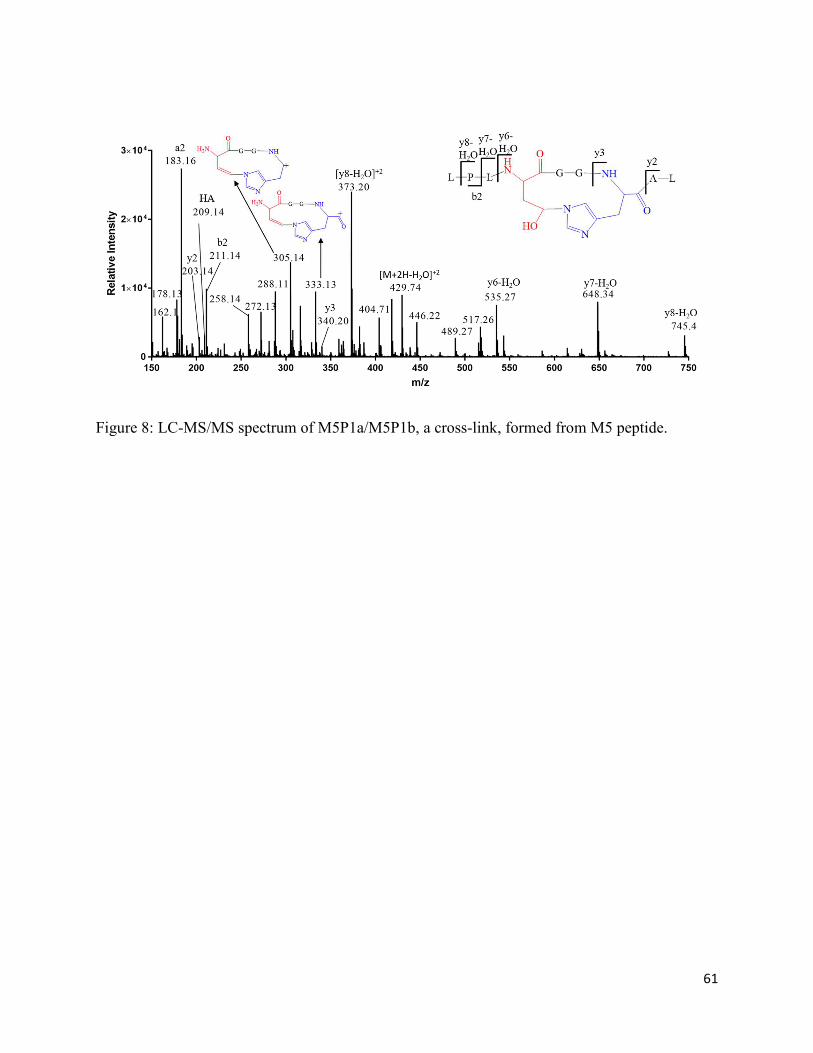
61
Figure 8: LC-MS/MS spectrum of M5P1a/M5P1b, a cross-link, formed from M5 peptide.
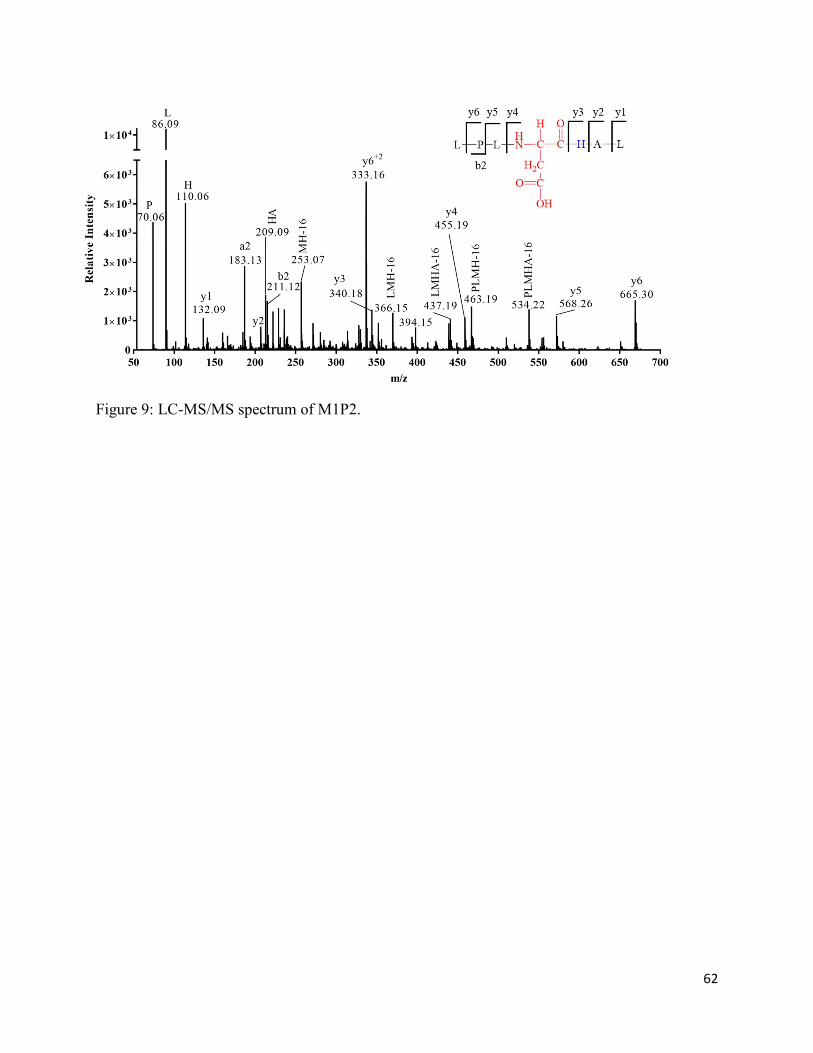
62
Figure 9: LC-MS/MS spectrum of M1P2.
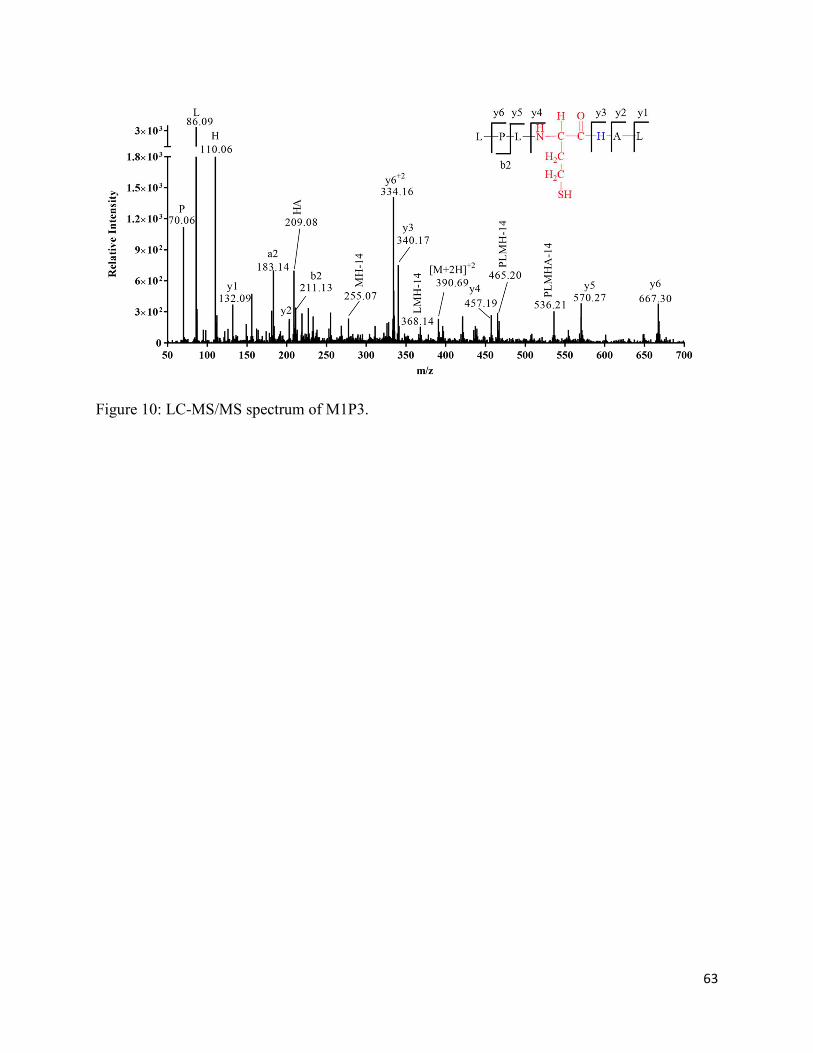
63
Figure 10: LC-MS/MS spectrum of M1P3.
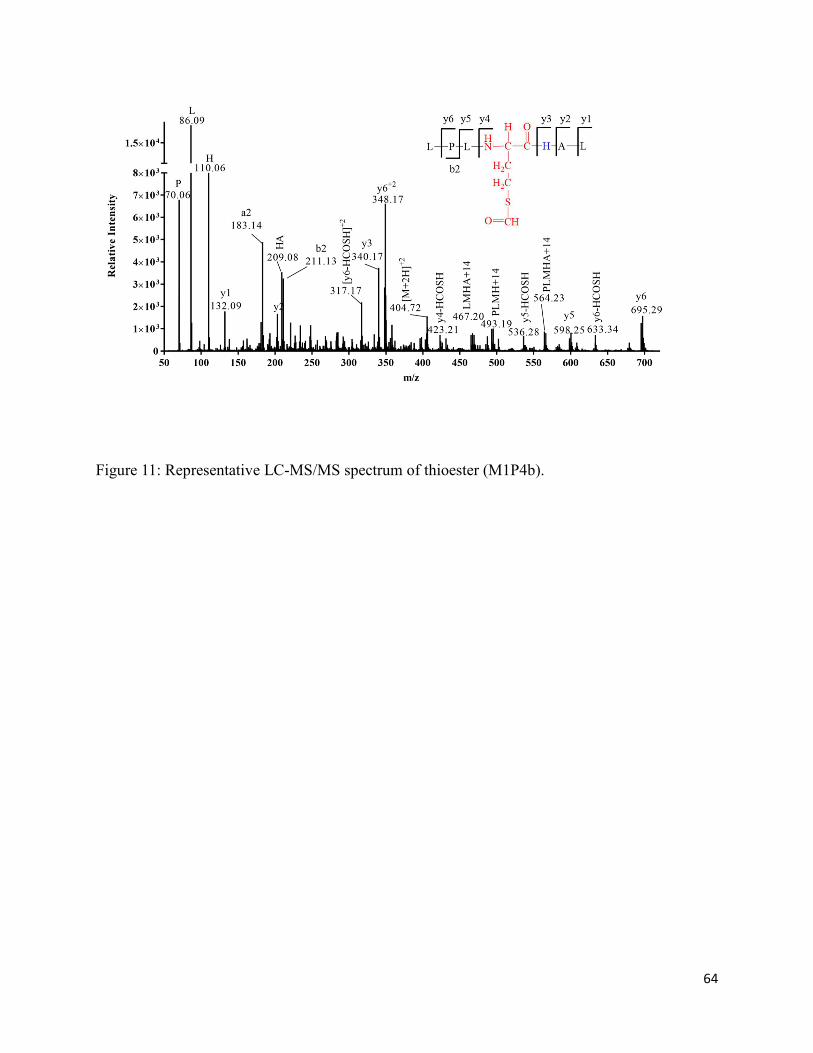
64
Figure 11: Representative LC-MS/MS spectrum of thioester (M1P4b).

65
Figure 12: Representative LC-MS/MS spectrum of M1P5 at C3 position. This LC-MS/MS may also correspond to M1P5 at C3 position with other 3 different isomers and at C5 position.

66
2.8. Schemes
Scheme 1: Proposed mechanism of product formation: M1P1a, M1P1b, and M1P2. R1 = LPL and R2 = AL amino acids. Asterisk (*) represents chiral center.
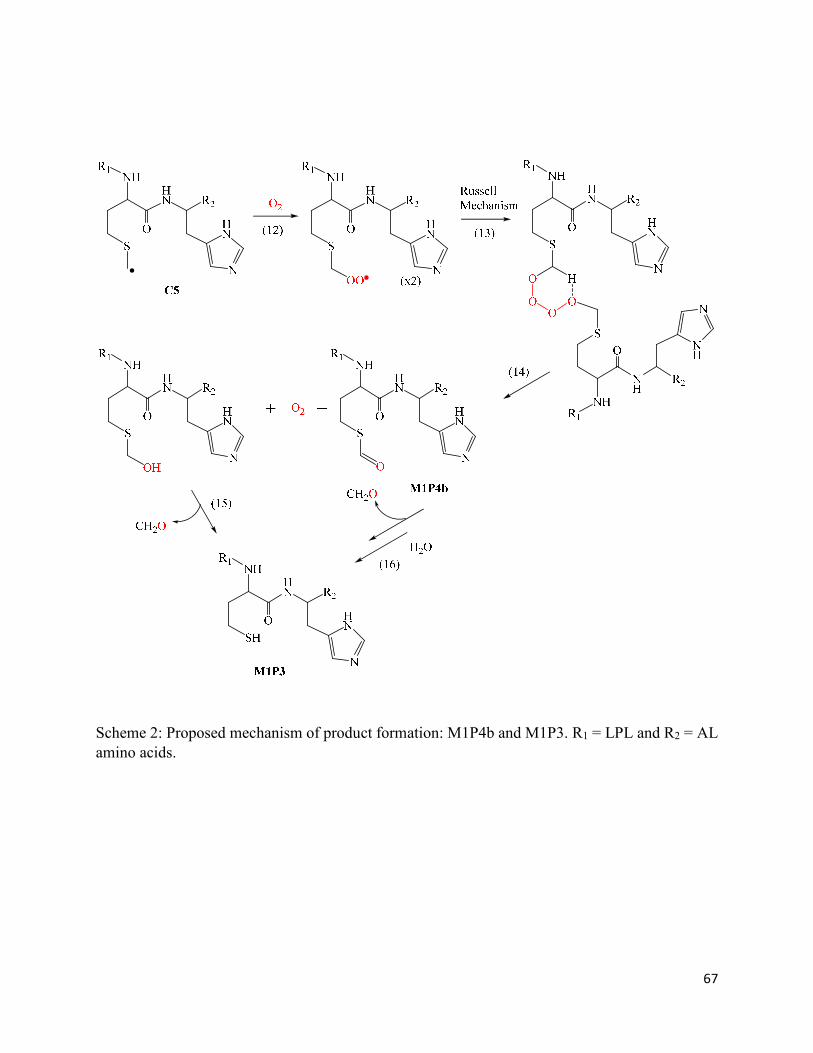
67
Scheme 2: Proposed mechanism of product formation: M1P4b and M1P3. R1 = LPL and R2 = AL amino acids.

68
Scheme 3: Proposed mechanism for the reduction of M1P1 with NaBH4. R1 = LPL and R2 = AL amino acids.
Scheme 4: Proposed mechanism of derivatization of M1P1 with GRT. R1 = LPL and R2 = AL amino acids.
HN R2
S
O
NH
N
HN
R1
O
O
N
H+
(20)
HN R2
S
O
NH
N
HN
R1
O
O
N
H
Scheme 5: Proposed mechanism of M1P3 derivatized with NEM. R1 = LPL and R2 = AL amino acids.
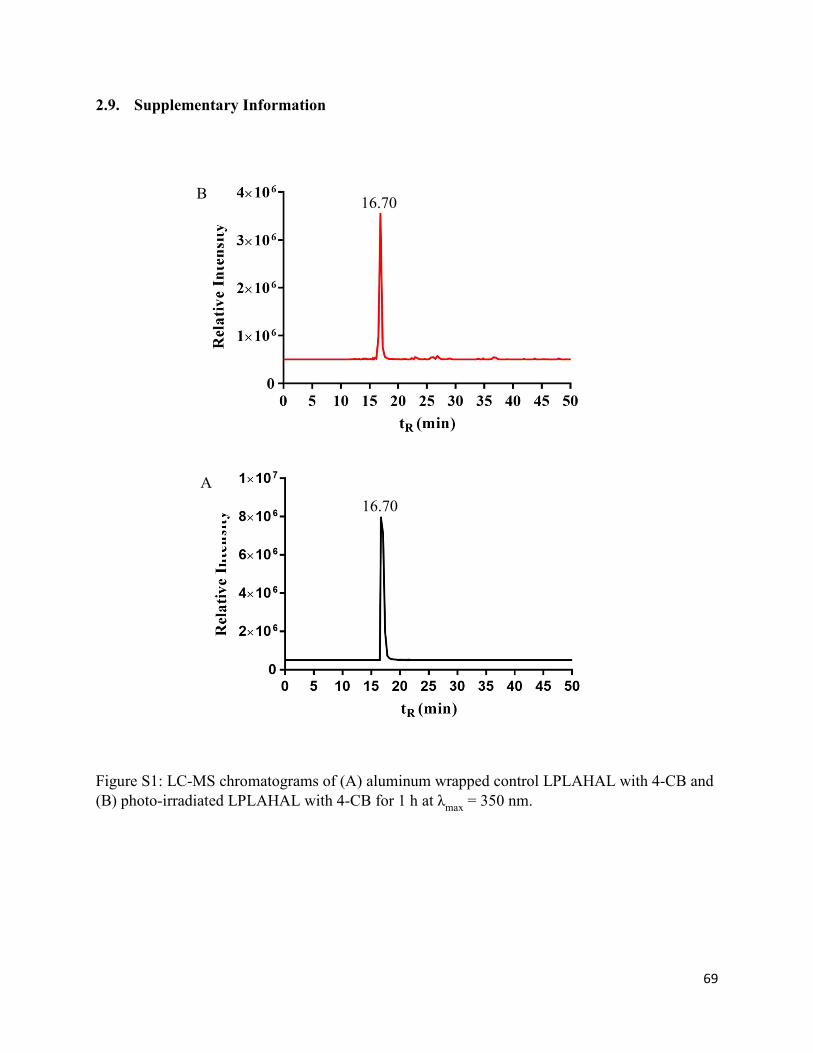
69
2.9. Supplementary Information
Figure S1: LC-MS chromatograms of (A) aluminum wrapped control LPLAHAL with 4-CB and (B) photo-irradiated LPLAHAL with 4-CB for 1 h at λmax = 350 nm.
A
B 16.70
16.70
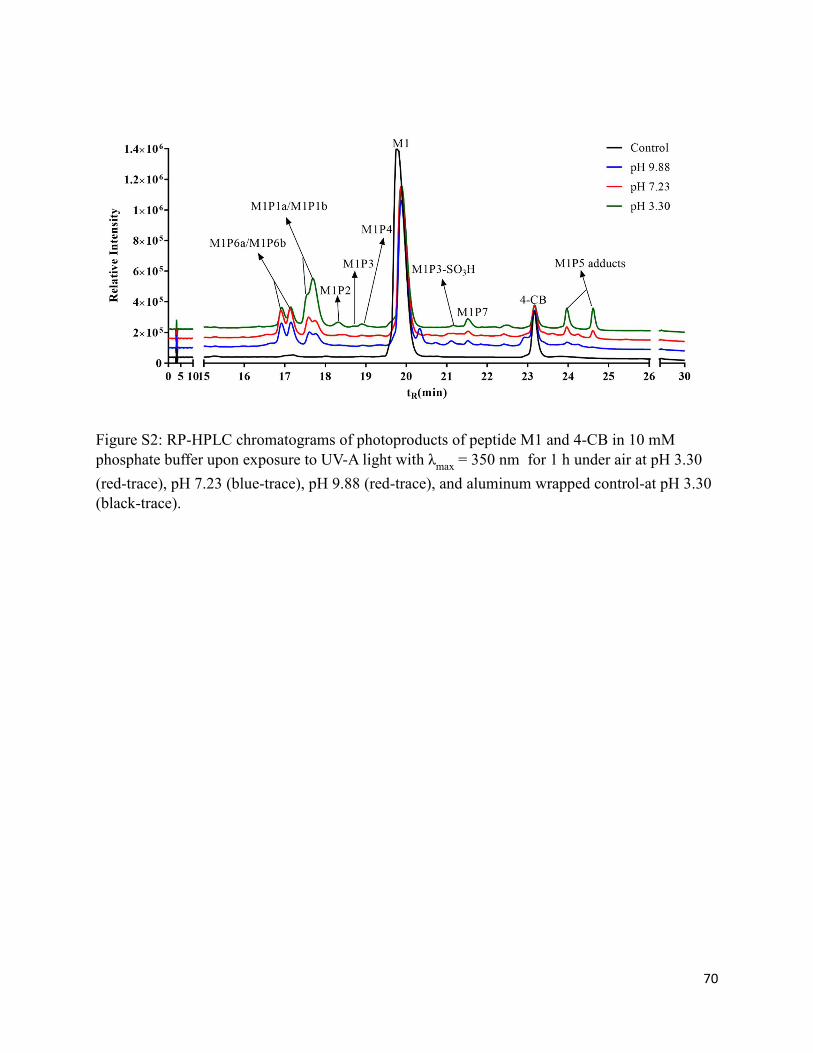
70
Figure S2: RP-HPLC chromatograms of photoproducts of peptide M1 and 4-CB in 10 mM phosphate buffer upon exposure to UV-A light with λmax = 350 nm for 1 h under air at pH 3.30
(red-trace), pH 7.23 (blue-trace), pH 9.88 (red-trace), and aluminum wrapped control-at pH 3.30 (black-trace).
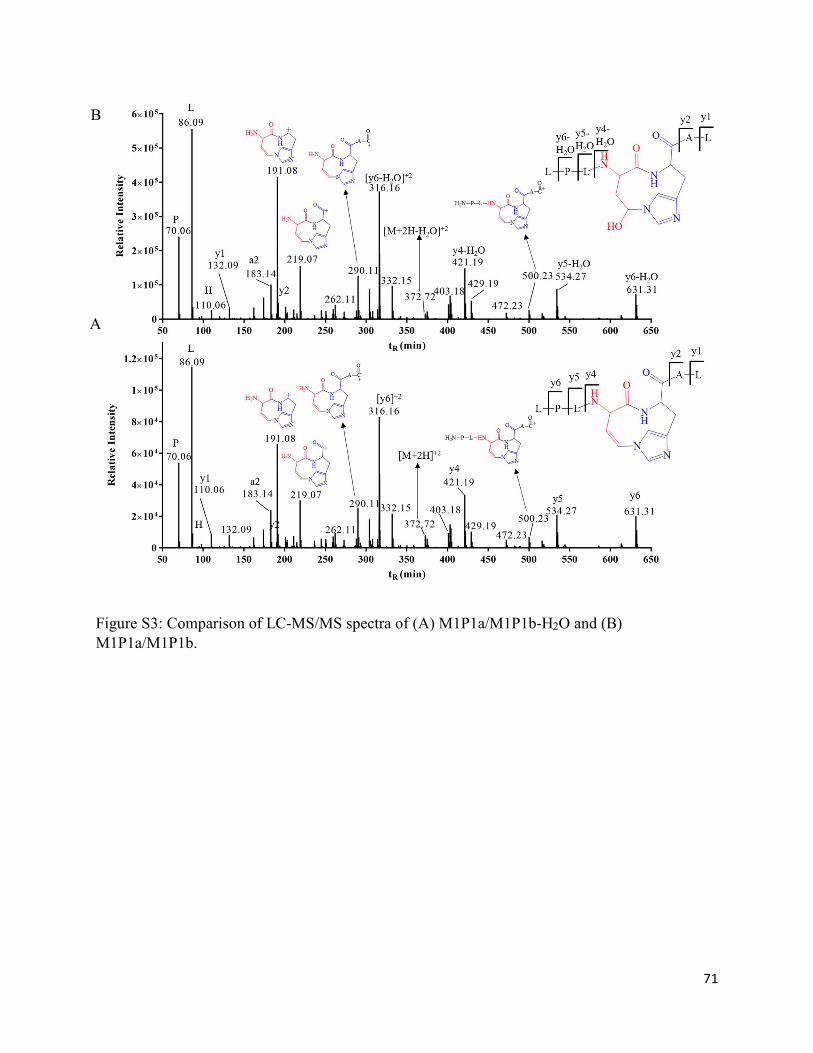
71
Figure S3: Comparison of LC-MS/MS spectra of (A) M1P1a/M1P1b-H2O and (B) M1P1a/M1P1b.
A
B
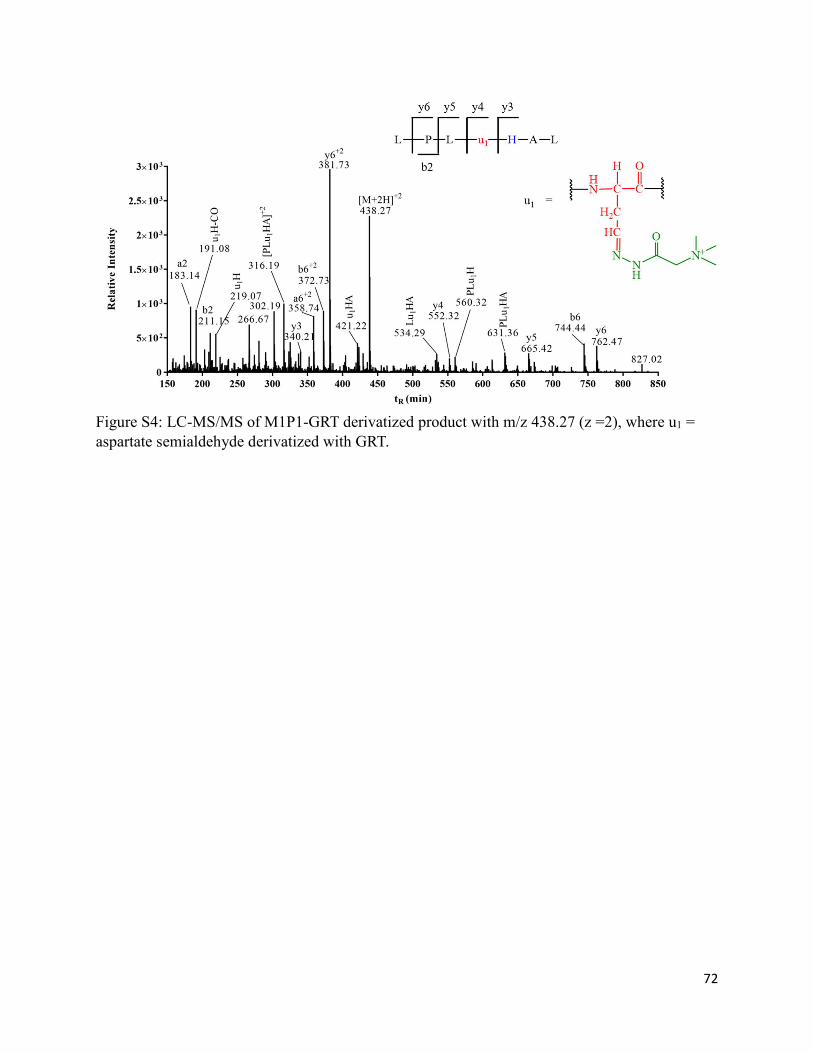
72
Figure S4: LC-MS/MS of M1P1-GRT derivatized product with m/z 438.27 (z =2), where u1 = aspartate semialdehyde derivatized with GRT.
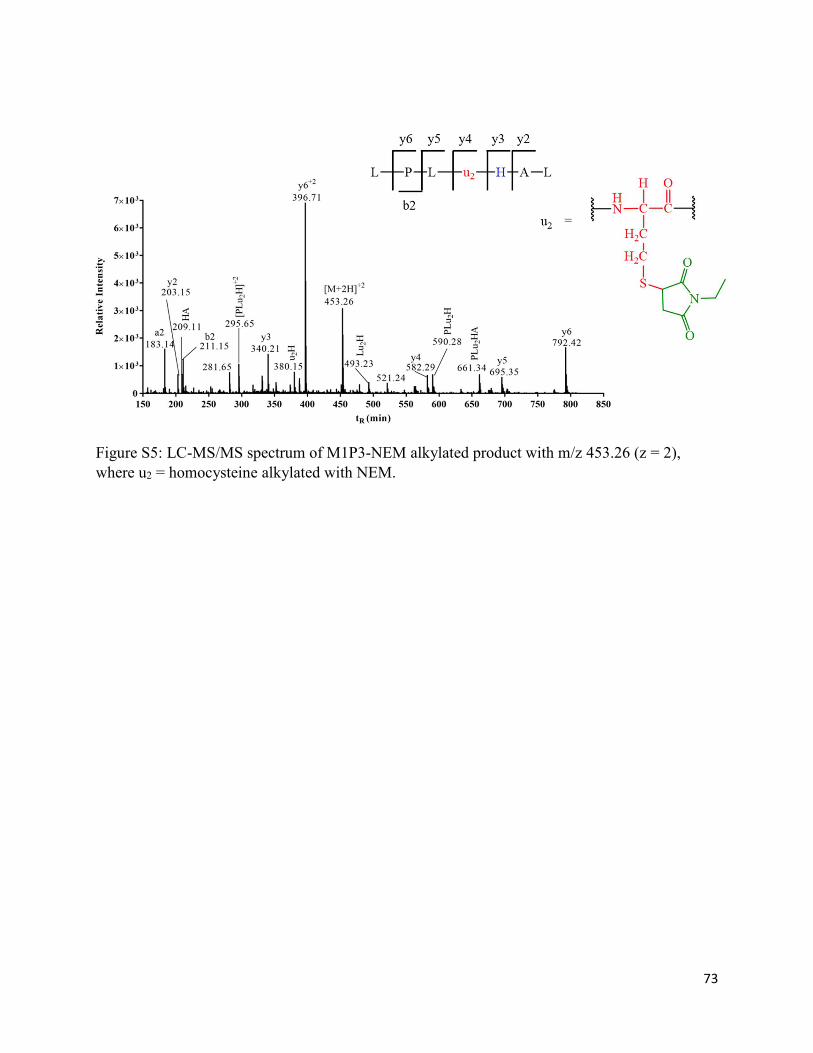
73
Figure S5: LC-MS/MS spectrum of M1P3-NEM alkylated product with m/z 453.26 (z = 2), where u2 = homocysteine alkylated with NEM.

74
Figure S6: LC-MS/MS spectrum of M1P3-SO3H with m/z 414.69 (z = 2), where u3 =
homocysteine sulfonic acid.

75
Figure S7: LC-MS/MS spectra of M1P6a/M1P6b diastereomers with m/z 405.72 (z = 2).
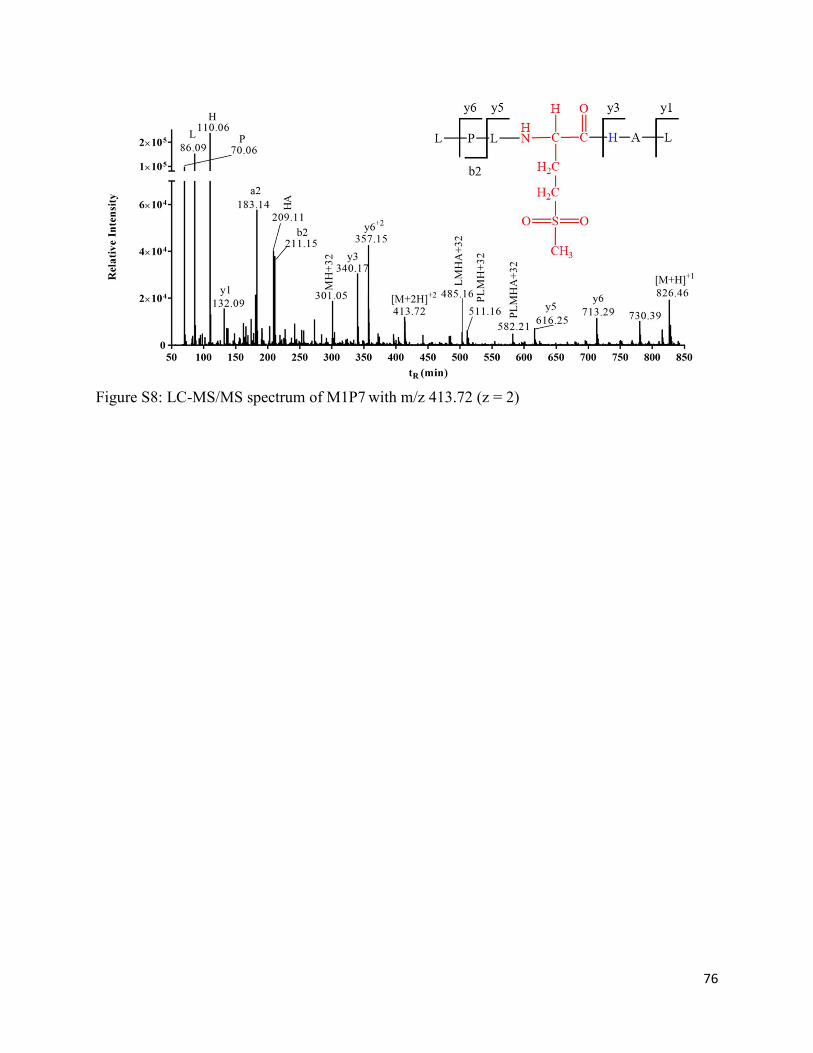
76
Figure S8: LC-MS/MS spectrum of M1P7 with m/z 413.72 (z = 2)
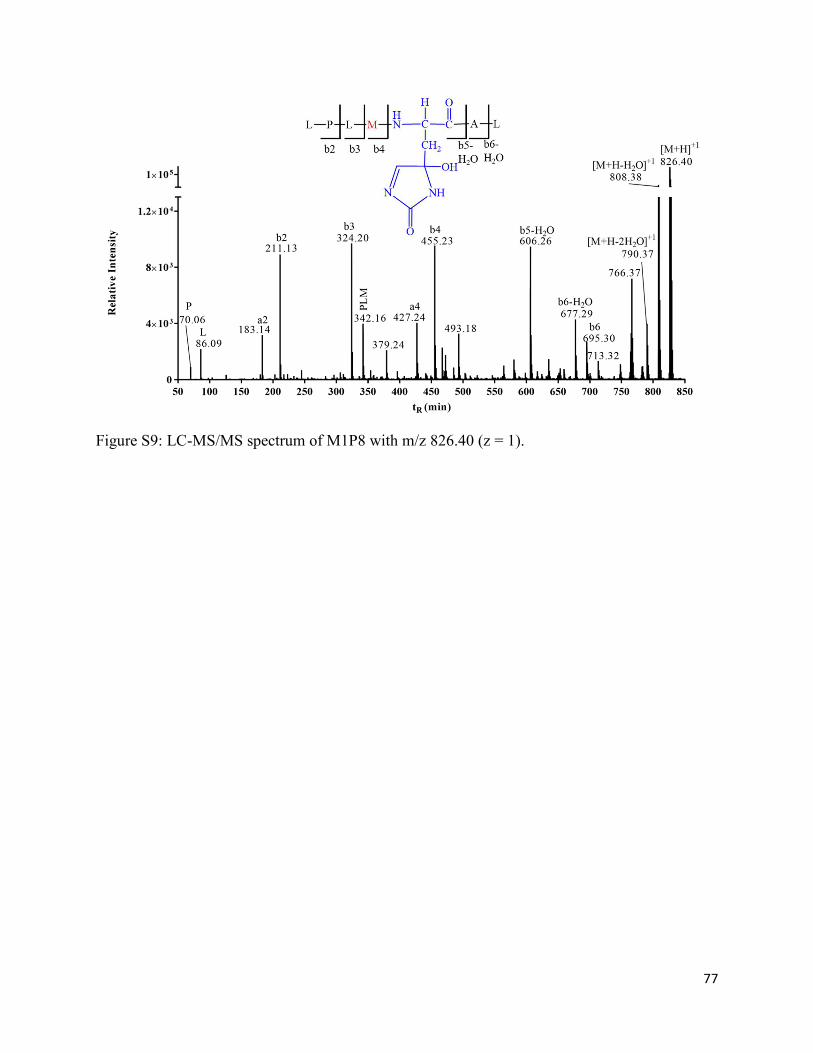
77
Figure S9: LC-MS/MS spectrum of M1P8 with m/z 826.40 (z = 1).
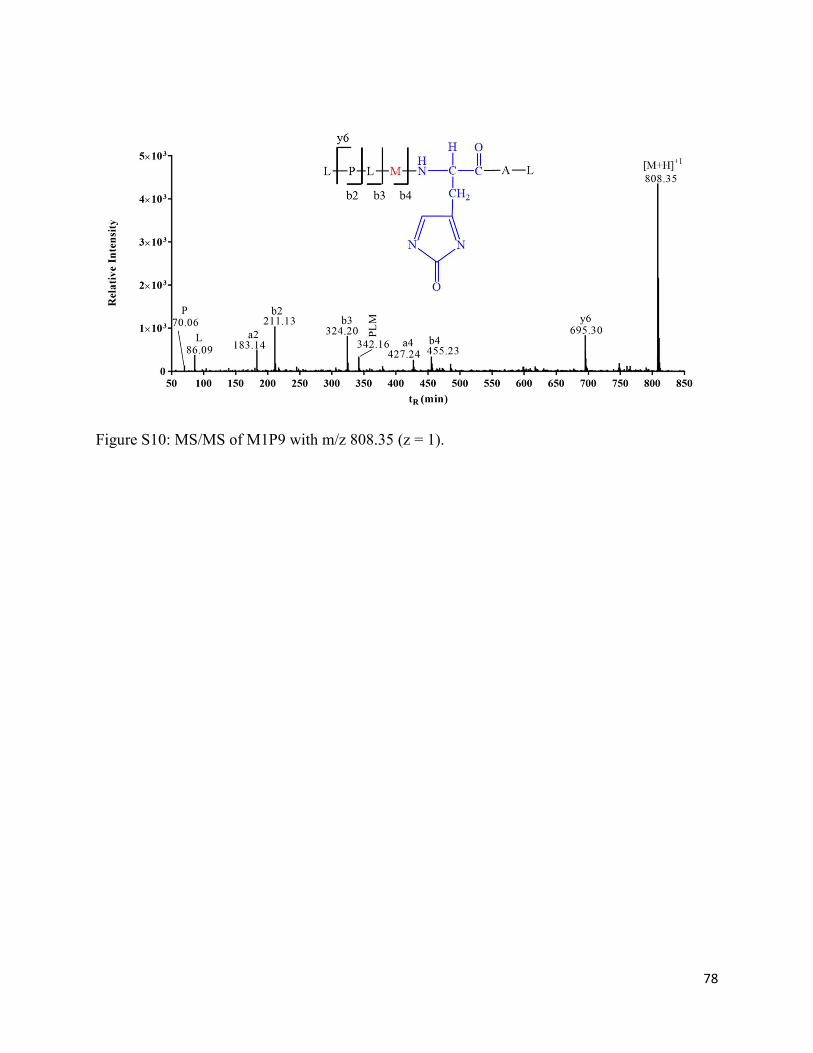
78
Figure S10: MS/MS of M1P9 with m/z 808.35 (z = 1).
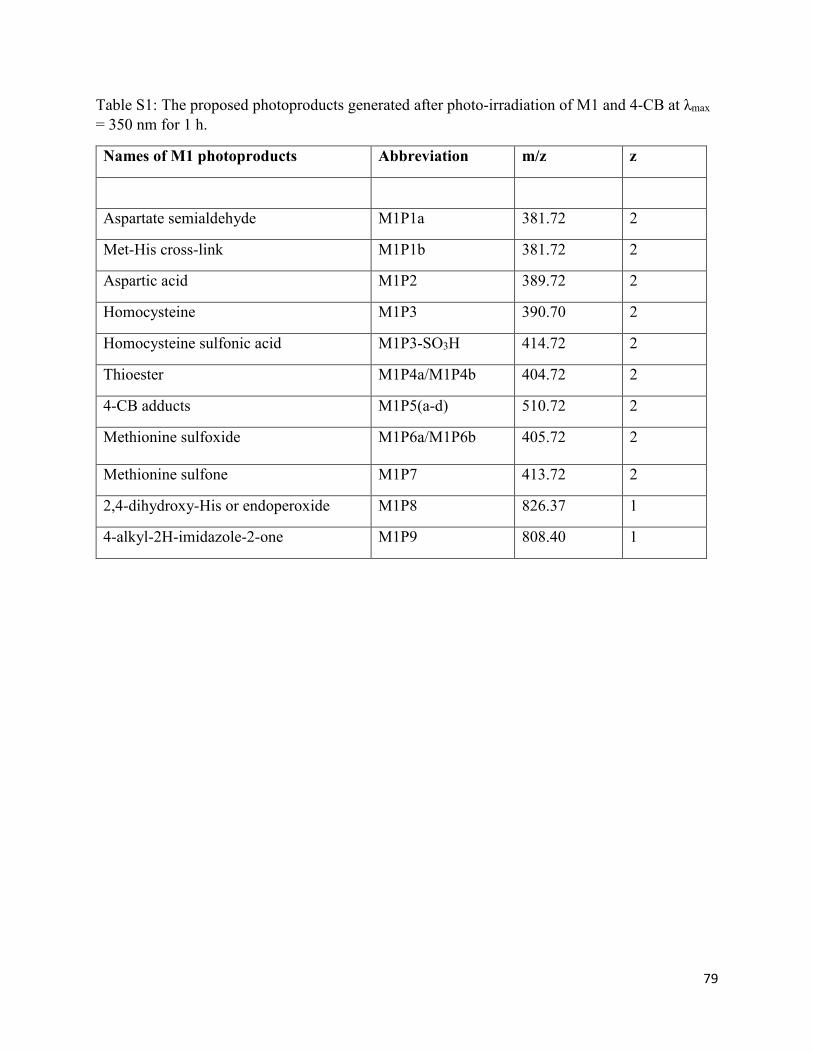
79
Table S1: The proposed photoproducts generated after photo-irradiation of M1 and 4-CB at λmax
= 350 nm for 1 h.
Names of M1 photoproducts Abbreviation m/z z
Aspartate semialdehyde M1P1a 381.72 2
Met-His cross-link M1P1b 381.72 2
Aspartic acid M1P2 389.72 2
Homocysteine M1P3 390.70 2
Homocysteine sulfonic acid M1P3-SO3H 414.72 2
Thioester M1P4a/M1P4b 404.72 2
4-CB adducts M1P5(a-d) 510.72 2
Methionine sulfoxide M1P6a/M1P6b 405.72 2
Methionine sulfone M1P7 413.72 2
2,4-dihydroxy-His or endoperoxide M1P8 826.37 1
4-alkyl-2H-imidazole-2-one M1P9 808.40 1
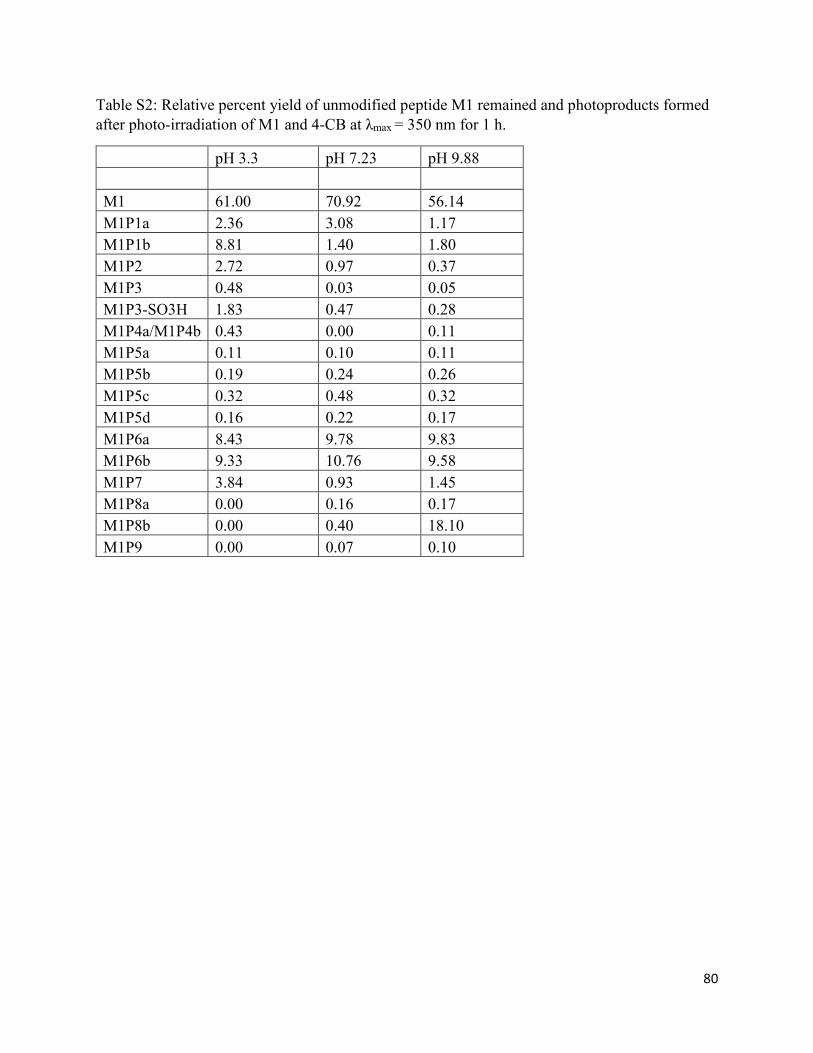
80
Table S2: Relative percent yield of unmodified peptide M1 remained and photoproducts formed after photo-irradiation of M1 and 4-CB at λmax = 350 nm for 1 h.
pH 3.3 pH 7.23 pH 9.88
M1 61.00 70.92 56.14
M1P1a 2.36 3.08 1.17
M1P1b 8.81 1.40 1.80
M1P2 2.72 0.97 0.37
M1P3 0.48 0.03 0.05
M1P3-SO3H 1.83 0.47 0.28
M1P4a/M1P4b 0.43 0.00 0.11
M1P5a 0.11 0.10 0.11
M1P5b 0.19 0.24 0.26
M1P5c 0.32 0.48 0.32
M1P5d 0.16 0.22 0.17
M1P6a 8.43 9.78 9.83
M1P6b 9.33 10.76 9.58
M1P7 3.84 0.93 1.45
M1P8a 0.00 0.16 0.17
M1P8b 0.00 0.40 18.10
M1P9 0.00 0.07 0.10

81
Chapter 3: Visible light degradation of a monoclonal
antibody in a high concentration formulation:
characterization of a tryptophan-derived
chromophoric photoproduct by comparison to
photodegradation of N-acetyl-L-tryptophan amide
82
3.1. Introduction
The development and approval of biotherapeutics, especially monoclonal antibodies (mAbs), has
been on the rise because of the high specificity and efficacy leading to enhanced patient safety.1
Most commonly, mAbs are used for the treatment of cancer, autoimmune diseases, allergic
diseases, asthma, and for organ transplants.2-4 mAbs have been formulated at low concentrations
for intravenous infusion. Since this is time-consuming and requires the patient to be in a hospital
setting, biopharmaceutical companies have been exploring other routes of administration such as
subcutaneous (SC) injections, which can be administered by patients at home and require only a
few minutes of injection time; as mAbs are formulated based on mg/kg and SC injections
necessitate a small volume (<1.5 ml), mAbs for this route have to be formulated at concentrations
above 100 mg/ml.5 At such high concentrations, viscosity problems are prominent and can
complicate the injection process due to greater syringe back pressure and pain at the injection site.6-
7 The viscosity of mAbs can be overcome by the addition of salts (such as NaCl) and amino acids
such as lysine (Lys), arginine (Arg), and histidine (His).8 This is accomplished either by
electrostatic interactions or by interaction with aromatic amino acids. In particular, His has been
used in marketed formulation of mAbs, as this can act as a buffer and simultaneously reduce
viscosity.9 Other potential problems associated with high mAb concentrations are aggregation,
oxidation, and color change.10 According to the International Conference on Harmonization (ICH)
Q6B, color change is a critical quality attribute for drug release11 and the protein formulation is
expected to be clear to slightly yellow.12 This is because an atypical color may indicate the
presence of impurities, contaminants, degradation of the protein, and/or excipients, which may
negatively impact patient health. Therefore, it is important to investigate the root cause of such
atypical solution color and the mechanisms of color formation. Some of the color changes observed
83
so far are associated either with the components added to the culture media during manufacturing,
or with degradation products generated after exposure to light or elevated temperature during
storage.
During manufacturing, color changes in the culture fluid have been attributed mainly to three
sources: (i) glucose (ii) B vitamins, and (iii) iron.13 When a high concentration of glucose is present
in the culture media, glycation can occur, which may proceed to generate advanced glycation end
products (AGEs).14 These can give rise to a yellow color to the solution.15 In addition, such AGEs
may reduce the efficacy of a mAb or activate proinflammatory responses.16 The cell culture media
also contains B vitamins, such as B12 (cobalamine) and B6 to increase antibody production. These
vitamins can directly react with proteins or act as photosensitizers when exposed to light, leading
to pink colored products.13, 17 The combination of iron with B vitamins can give a brown or brown-
yellow color under aerobic cell culture conditions. This is likely due to reactive oxygen species
(ROS), generated via Fenton reaction17-19 or photo-Fenton reaction,20 which can oxidize proteins
to chromophoric products. Specially the hydroxyl radical (HO•), a powerful oxidant, can convert
tryptophan (Trp) to colored products such as N-formyl kynurenine (NFK) and kynurenine (Kyn).17-
18 More importantly, NFK and protein-bound Kyn are photosensitizers which can lead to
secondary photooxidation.21-25
During storage, previously colorless protein solutions may develop a yellow to brown-yellow
color; such coloration is also observed after photostability testing to the recommendation of the
ICH Q1B guideline (1.2 million lux hours of visible light and ≥200 Wh/m2 of UV light).4, 10
Interestingly, such color change was also observed in highly concentrated mAb formulation during
exposure to ambient light , at doses far below of that recommended by the ICH guideline.26 This
is an important observation as the essential aromatic acids or cystine will not absorb UV-A and

84
visible light; however, photoproducts such as Kyn can absorb light along with the B vitamins such
as vitamins B2 (riboflavin), B6, B9 (folic acid) and B12 (cobalamine).21 The latter can act as
photosensitizers via type I and type II reactions.27 Apart from commonly known photoproducts of
His and Trp, other products with chromophoric properties may be responsible for color in the
formulation exposed to heat or light. One such product generated by the loss of 2 Da from Trp
during storage at 25 °C for 12 months, displaying an absorption maximum at 335 nm.4 In addition,
tyrosine derived photoproducts such as dihydroxyphenylalanine (DOPA)28 may lead to the
coloration of light exposed formulation. Studies on the yellowing of sheep wool28 and lens
proteins29-31 have led to the identification of several Trp and Tyr-derived oxidation products such
as carbolines, hydroxykynurenine, and DOPA.
In this chapter, we describe the formation of a chromophoric photoproduct of Trp during visible
light exposure of a mAb in formulation containing sodium acetate (NaAc) or His/Lys buffer, and
physical and chemical modifications accompanying yellow color formation. For structural
characterization of the chromophoric photoproduct, we exposed a model compound, N-acetyl-L-
tryptophan amide (NATA), to visible light photo-irradiation in sodium acetate buffer, followed by
HPLC-mass spectrometry (MS) and nuclear magnetic resonance (NMR) analysis.
3.2. Materials and Methods
The mAb (mAbZ) for this study was obtained from AstraZenaca. NaAc, L-His
monohydrochloride, L-Lys monohydrochloride, NATA, formic acid (FA), bis(2-
mercaptoethyl)sulfone (BMS), iodoacetamide (IAA), and β-mercaptoethanol (β-ME) were
purchased from Millipore Sigma (Burlington, MA). Borosilicate glass tubes, acetonitrile (ACN),
Optima® water with FA, Optima® ACN with FA, acetic acid, and methanol were purchased
from Fisher Scientific (Hampton, NH). All solutions were prepared using ultra-pure quality (18.2

85
MΩ) water, which was prepared freshly with a WaterPro PS Polishing System (Labconco, Kansas
City, MO).
3.2.1. Sample preparation
The mAbZ formulation contained 0.01% PS80, 85 mM NaCl and was buffered in 50 mM NaAc
at pH 5.5 (NaAc buffer). In order to prepare a formulation of mAbZ in His/Lys buffer, buffer
exchange was performed with D-Tube™ Dialyzer Maxi (MWCO 3.5 kDa) in a container
containing 2 L of 20 mM HisCl and 75 mM Lys at pH 5.50 (His/Lys buffer) for 2 h at 4 °C. Then,
the dialyzer containing mAbZ was transferred into a 5 L container of His/Lys buffer, pH 5.5, and
was dialyzed overnight at 4 °C. The samples were frozen at -80 °C until further experiments were
performed. Solutions of 10 mM NATA either in NaAc, pH 5.5, or in His/Lys buffer, pH 5.5, were
freshly prepared before the experiments.
3.2.2. Photo-irradiation
Solutions of mAbZ or NATA were photo-irradiated using eight RPR-4190A visible lamps (The
Southern New England Ultraviolet Company, Branford, CT; λmax = 419 nm, emission spectrum
between 390 and 475 nm), which were placed in a Rayonet Photoreactor (RPR200, The Southern
New England Ultraviolet Company, Branford, CT). Photo-irradiation of the solutions were
performed under air in borosilicate tubes. The lamps provided a flux of 6.44 x 10⁻⁸ Einstein/sec
and an irradiance of <25 W.h/m2 for a 1 h photo-irradiation, based on ferrioxalate actinometry.32-
35
86
3.2.3. Photo-irradiation of mAbZ and NATA
Solutions containing 500 µl of 150 mg/ml mAbZ formulated either in NaAc or His/Lys buffer
were photo-irradiated for 0-8 h under air. The control and photo-irradiated samples were either
diluted as needed for further analysis or were digested for mass spectrometry analysis. Control
samples were wrapped in aluminum foil and exposed to light for 8 h.
NATA is a suitable model to study the degradation pathways of Trp under the same experimental
conditions as mAbZ. Solutions of NATA formulated either in NaAc or in His/Lys buffer were
exposed to visible light for 0-24 h. The samples were analyzed by reverse phase-high-performance
liquid chromatography (RP-HPLC), HPLC-MS, and NMR to identify photoproducts. Specially a
photoproduct with the same UV/Vis spectroscopic properties as observed for mAbZ was fraction
collected, lyophilized, and re-concentrated in DMSO. The concentrated sample was analyzed by
HPLC-MS and 1H- and 13C-NMR.
3.2.4. Reducing and Non-reducing SDS-PAGE
Control and photo-irradiated mAbZ solutions were diluted to 1 mg/ml and combined with Laemmli
buffer in a 1:1 ratio. Forty µl of the mixture was loaded onto each polyacrylamide gel well (4-20%
Mini-Protean® TGX™ Precast Gels, Bio-Rad, Hercules, CA), and molecular weight markers were
used for molecular weight calibration. For reducing gels, 50 µl of 13 M β-ME was added to the
Laemmli buffer with the protein and incubated for 1 h at 50 °C before running the gels at 200 V.
Both gels were stained with Coomassie Brilliant Blue R-250 (Amersham Pharmacia Biotech AB,
Uppsala, Sweden) and destained using 50% MeOH and 10% acetic acid in water for visualization
of the protein bands.

87
3.2.5. Size Exclusion Chromatography (SEC)
Control and photo-irradiated mAbZ were diluted from 150 mg/ml to 1 mg/ml either in NaAc or
His/Lys buffer. SEC chromatography was run on a HPLC instrument (Shimadzu, Kyoto, Japan).
Fifty μg of mAbZ were injected onto a TSK-Gel SWXL guard column (6.0 mm x 40 mm) and
directed to a TSK-Gel G3000SWXL SEC column (7.8 mm x 300 mm) at a flow rate of 0.7 ml/min.
The column temperature was maintained at 30 °C in a column heater, and monomer and higher
molecular weight species (HMWS) eluted with 200 mM phosphate buffer, pH 6.8. Detection was
achieved at 220 nm with a diode array detector (Shimadzu, Kyoto, Japan). The percentage of
monomers and HMWS were calculated relative to the total peak areas detected in the SEC
chromatograms.
3.2.6. Differential Scanning Calorimetry (DSC)
Differential scanning calorimetry (DSC) was performed on a MicroCal VP-Capillary calorimeter
(Malvern Instruments, Malvern, UK) equipped with an autosampler. Samples of 300 μl volume
containing 1 mg/ml mAbZ were stored in a sealed 96-well plate in an autosampler, kept at 4 °C.
Temperature ramps were from 10 to 90 °C at a scan rate of 2 °C/min. A 15 min equilibration period
at 10 °C was performed prior to each run. All thermograms were buffer subtracted, baseline
corrected, and normalized for protein concentration. Apparent melting temperatures were
calculated by fitting thermograms to a non-two-state equilibrium model in Origin 7.0 (OriginLab).
Onset melting temperatures, Tonset, were designated as the temperature at which the heat capacity
first reaches five percent of its maximum value.
88
3.2.7. Proteolytic Digestion
Control and photo-irradiated mAbZ were diluted to 10 mg/ml in 50 mM NH4+CO3
-, pH 8.2. The
diluted protein solutions were denatured with 3 M guanidine hydrochloride (in 50 mM NH4+CO3),
and disulfide bonds were reduced with 5 mM BMS (in ACN) at 37 °C for 1 h. The reduced samples
were then alkylated with 25 mM IAA and further incubated at 37 °C for 1 h, diluted with 100 µl
of 50 mM NH4+CO3
-, and dialyzed in 50 mM NH4+CO3
- for 1 h in a D-Tube™ Dialyzer Maxi
(MWCO 3.5 kDa) at room temperature. The reduced and alkylated protein solutions were digested
with 9 µl of 0.1 mg/ml trypsin/LysC overnight at 37 °C. The digestion of protein was stopped by
addition of 10 µl of FA:H2O (0.1:0.9, v:v). The solution of the tryptic peptides was stored at -80
°C until further HPLC-MS analysis.
3.2.8. UV-Visible Absorption Spectroscopy
The absorbance spectra of control and photo-irradiated samples were collected on an Agilent 8453
UV−visible spectrophotometer (Agilent Technologies, Santa Clara, CA) equipped with a
photodiode array detector. The initial concentrated samples of 150 mg/ml mAbZ were diluted to
10 mg/ml in either NaAc or His/Lys buffer. The samples were placed in 1 cm path length quartz
cuvettes. UV-visible absorbance spectra of the samples were collected from 200 nm to 800 nm
and the corresponding buffers were used as blanks. Second derivative spectra were obtained using
a second order Savitizky-Golay smoothing filter.
3.2.9. Reverse Phase-High-Performance Liquid Chromatography
In order to fraction collect a specific photoproduct of NATA (i.e., NATA-33), we employed RP-
HPLC (Shimadzu Corporation, Kyoto, Japan) equipped with a PDA detector. NATA and its
89
photoproduct were separated using a Vydac® 218TP54 protein and peptide C18 column (4.6 mm
i.d. x 250 mm, 5 µm particle size, and 300 Å pore size) (Alltech Associates Inc, Deerfield, IL),
which was maintained at 35 °C in a column heater. Aliquots of 10 µl of photo-irradiated NATA
samples were injected onto the column and eluted with the following gradient of mobile phase A,
(water with 0.1% TFA) and B (acetonitrile with 0.1% TFA) at a flow rate of 1 ml/min: composition
of 97% A and 3% B was held for 5 min; the composition ranged linearly to 70% A and 30% B
within 2 min, and subsequently changed linearly to 50% A and 50 % B within 3 min. To wash the
column, 5% A and 95% B were employed for 2 min before the column was re-equilibrated to 97%
A and 3% B for 6 min. The total run time was 20 min.
3.2.10. NanoAcquity HPLC Electrospray ionization Q-tof MS and HPLC-MS/MS analysis
The proteolytic peptides of mAbZ and NATA and its photoproducts were analyzed on a Xevo-G2
Qtof tandem mass spectrometer (Waters Corporation, Milford, MA), equipped with nanoAcquity
Ultra Performance Liquid Chromatography system (Waters Corporation, Milford, MA). The
proteolytic peptides (2.5 μl) were injected onto a Symmetry® C18 Waters trap column (2G-V/M
Trap; 180 μm x 200 mm, 5 μm particle size, and 100 Å pore size) at a flow rate of 4 µl/min for 3
min with the mobile phase composed of 97% A and 3% B. Mobile phase A and mobile phase B
containing Optima® water with 0.1% FA and Optima® ACN with 0.1% FA, respectively. After 3
min, the samples were directed to an analytical nanoAcquity ultra performance Waters peptide
CSH ™ C18 column, (75 μm x 250 mm, 1.7 μm particle size, and 130 Å pore size) at a flow rate
of 0.3 µl/min, maintained at 40 °C in a column heater. The initial gradient started with 97% mobile
phase A and 3% mobile phase B, and the composition to 65% A and 35% B within 50 min.
Subsequently, the solvent composition was changed to 5% A and 95% B within 20 min and kept
90
at this composition for an additional 10 min to wash the column. The solvent composition was
reverted to the initial composition of 97% A and 3% B, and re-equilibrated for 32 min.
For electrospray MS the source temperature was set at 100 °C. The instrument was operated in a
positive mode and the mass analyzer allowed the mass range from 150-2000 Da. The capillary
voltage was set at 2.7 kV. The non-fragmented peptides were passed through a collision cell at 5
eV, and the peptides were fragmented by ramping the collision cell energies between 18 eV and
45 eV. The data were collected in the MSE mode. The HPLC-MS was operated, and data analyses
were done with the Masslynx v.4.1 software. The data were plotted with the GraphPad Prism 7
software.
3.2.11. Nuclear Magnetic Resonance
NATA and NATA-33 were dissolved in DMSO-d6 and transferred to a 5 mm Shigemi® tube
(Wilmad Lab Glass, Vineland, NJ). NMR spectra were collected on a Bruker AVIII 500 MHz
instrument, equipped with a dual carbon/proton (CPBBFO) cryoprobe, at a sample temperature of
25° C. All data were recorded with DMSO as the reference standard. The 1H-NMR spectrum was
acquired with 256 scans at a spectrometer frequency of 500.19 MHz. The 13C-NMR spectrum was
acquired with 66k scans at a spectrometer frequency of 125.79 MHz. The HSQC experiment was
acquired with 32 scans, with 1024 points in the 1H dimension and 256 increments in the 13C
dimension. The spectral width was 14 and 180 for the 1H and 13C dimensions, respectively. The
relaxation delay was 2 seconds.
3.3. Results
Following exposure to visible light up to 8 h (1.44 W.h/m2) in NaAc or His/Lys buffer, mAbZ was
analyzed for physical and chemical degradation.
91
3.3.1. Physical stability: studies on conformation and aggregation of mAbZ
The aggregation propensity of control and photo-irradiated mAbZ was monitored by SDS-PAGE
and SEC. Non-reducing SDS-PAGE shows a major band at around 150 kDa for mAbZ in both
NaAc and His/Lys buffer (Fig. 1A). A low intensity band around 75 kDa suggests some half
antibody formation, likely via cleavage of interchain disulfide bridges. Photo-irradiation with
visible light for up to 8 h results in the formation of a higher molecular band in NaAc buffer, but
to a significantly lower extent in His/Lys buffer (e.g., lanes 5 and 10, Fig. 1A). A higher molecular
weight band (between 100 and 150 kDa) is also visible after 8 h photo-irradiation with visible light
in NaAc when analyzed with reducing SDS-PAGE (Fig. 1B, lane 5). This suggests that some
higher molecular weight species are generated via covalent bond formation, but not disulfides.
These observations were corroborated by SEC (Fig. 2). Photo-irradiation with visible light induced
the formation of dimers and HMWS in both buffers, where the yields of dimers and HMWS was
two-fold higher in NaAc as compared to His/Lys buffer, ~7% of monomer was lost and ~3.5%
dimer and ~3.5% HMWS were formed after 8 h light exposure (Fig. 2B). In comparison, in NaAc
buffer, 15% of monomer was lost after 8 h of light exposure, which was accompanied by 6% dimer
and 9% HMWS (Fig. 2B).
In order to evaluate whether transition of metals played a role in the aggregation of mAbZ, a mAbZ
formulation in NaAc buffer was spiked with 5 mM EDTA and photo-irradiated for 4 h. The yields
of monomer loss and aggregates (dimers and HMWS) were similar for mAbZ formulated in NaAc
buffer in the absence and presence of EDTA (Fig. S1). This indicates metals do not play a role in
aggregation formation. On the other hand, when 10 mM His were added to mAbZ formulated in
NaAc buffer, a lower yield of aggregates was detected after 4 h visible light exposure (Fig. S1B).
92
Because of the significant aggregation of mAbZ especially in NaAc buffer, we monitored the
conformation stability of control and photo-irradiated mAbZ in both NaAc and His/Lys buffer by
differential scanning calorimetry (DSC) (Fig. 3). The thermograms (Fig. 3A) of all samples were
deconvoluted to provide Tm1, Tm2, and Tonset. Control mAbZ in both buffers displayed similar
Tm1, whereas the Tm1 of mAbZ photo-irradiated in NaAc buffer decreased by about 0.5 °C after
8 h exposure to visible light (Fig. 3BI). Instead, the Tm1 of mAbZ photo-irradiated in His/Lys
buffer did not change upon light exposure (Fig. 3BI). For control, the Tm2 of mAbZ was higher
in His/Lys buffer as compared to NaAc buffer (Fig. 3BII). We observed no significant change of
Tm2 after light exposure for 8 h. However, Tonset decreased by 1 °C in NaAc buffer, whereas it
decreased by 2 °C after 8 h visible light exposure in His/Lys buffer (Fig. 3BIII). However, as we
did not observe large changes of the Tm1 and Tm2 values as a result of photo-irradiation, these
data indicate that the tertiary structure of mAbZ did not undergo major changes.
3.3.2. Oxidation of Met and Trp
The proteolytic digests of control and photo-irradiated mAbZ were analyzed by HPLC-MS. The
peak areas containing oxidized Met and Trp residues were calculated, and normalized by use of
the proteolytic peptide, SLSLSLGK, which remained stable under our experimental conditions.
There are six Met residues present in the heavy chain and none in the light chain of mAbZ. We
observed the light-induced oxidation of Met to methionine sulfoxide (MetO) at positions 254, 360,
and 430, where the yield of MetO increased with the duration of light exposure in both buffers,
NaAc and His/Lys (Fig. 4A and 4C); however, higher yields of MetO were observed in NaAc
buffer. The light chain of mAbZ contains four Trp residues, out of which only the Trp at position
90 (W90) was oxidized forming hydroxy tryptophan (OH-Trp) (Fig. 4B and 4D). The yields of
OH-Trp were higher in NaAc as compared to His/Lys buffer, except for the longest photo-

93
irradiation time of 8 h. We also observed NFK formation at position 90, but only by MS analysis;
the yields were too low for MS/MS identification.
3.3.3. Formation of chromophoric photoproducts in mAbZ and NATA
After light exposure of up to 8 h, mAbZ formulated in NaAc buffer exhibited a color change from
clear to yellow (Fig. 5A). In contrast, mAbZ formulated in His/Lys buffer did not display a
significant color change after visible light exposure (Fig. 5B). By comparison of the UV-visible
absorption spectra of control and photo-irradiated mAbZ in NaAc buffer, we observed an increase
of the absorbance in the visible region with a λmax = ~450 nm (Fig. 6A). Importantly, visible light
photo-irradiation of NATA in NaAc buffer (50 mM, pH 5.50) for 6 h resulted in a similar
absorbance around λmax = ~450 nm (Fig. 6B). Second derivative UV/Vis spectroscopy of mAbZ
and NATA confirmed that indeed identical product was generated in both experiments (Fig. 6C).
When we expanded the light exposure of NATA in NaAc buffer to 24 h, a yellow color was
observed (Fig. 7). Instead, when NATA was photo-irradiated in His/Lys buffer, a light brown color
was observed, which could originate from degradation product of either His36 or Trp17, or both.
Control and NATA photo-irradiated in both NaAc and His/Lys buffers were analyzed by RP-
HPLC and monitored at 300 or 400 nm. When exposed to visible light for up to 24 h, NATA
converted into a number of products, monitored at 300 nm (Fig. 8AI and 8BI), where the individual
yields increased with the duration of photo-irradiation; in general higher yields of photoproduct
were observed in NaAc as compared to His/Lys buffer. We detected the formation of OH-Trp,
NATA+14, Kyn, and NFK, eluting at tR = 6.95, 7.35, 7.70, and 7.85 min, respectively, before the
unmodified NATA (tR = 8.75 min) (Fig. 8A-I and 8B-I). In addition, when the photoproducts were
monitored at 400 nm, two major peaks appeared for NATA photo-irradiated in NaAc buffer (Fig.
94
8A-II), and one peak for NATA photo-irradiated in His/Lys buffer (Fig. 8B-II). At tR = 7.85 min,
we detected the formation of Kyn; however, a peak at tR = 11.7 min, containing NATA-33 was
only observed in NaAc buffer. This peak was fraction-collected and analyzed by HPLC-MS. The
HPLC-MS analysis revealed a molecular ion with m/z 213.09 (z = 1) (Fig. S2), corresponding to
a loss of 33 Da from NATA (m/z 246.15, z = 1).
The 13C-NMR spectrum of NATA-33 in DMSO-d6 (Fig. 9A) displayed 15 peaks with chemical
shift at 1.25, 29.11, 40.00, 98.49, 103.57, 116.10, 125.48, 128.08, 129.03, 133.80, 142.06, 147.5,
148.36, 149.06, and 180.39 ppm. The peaks at 1.25 and 116.10 ppm may correspond to the residual
ACN left after drying, and the peak at 40.00 ppm corresponds to the carbons on DMSO-d6. The
remainder of the signal were utilized for structural elucidation of NATA-33. A proposed structure,
P1, is shown in Chart 1. The 1H-NMR of NATA-33 is shown in Fig. 9B. Predictions for chemical
shifts were made with MesoNova, nmrdb.org, and ChemDraw software for structure P1, shown in
Table 1, 1H-13C Heteronuclear Single Quantum Correlation (HSQC) correlations are shown in
Fig. S3, carbons at 98.49, 103.57, 116.1, 125.48, 128.08, and 129.03 correlate to 6.37, 6.38, 7.50,
7.40, 7.47, and 7.71, respectively.
HPLC-MS/MS analysis of NATA-33 was performed in the data dependent acquisition (DDA)
mode (Fig. 10). The proposed structure P1 would be consistent with the fragmentation pattern as
in Fig. 10, displaying a molecular ion with m/z 213.09 (z =1), which corresponds to the parent ion
of P1. The loss of -CO gives the fragment with m/z 185.09 (z = 1). Either the ion with m/z 185.09
can lose -27 Da (H3NO), or the molecular ion of P1 can lose 55 Da (C2HNO) to give a fragment
with m/z 158.08 (z = 1). The loss of H2O and CO from m/z 158.08 give an ion with m/z 144.06
and 130.08, respectively. A fragment containing an indole ring is observed with m/z 118.08 (z =
1), which indicates that the indole ring is intact in the structure of P1. By comparison to the HPLC-
95
MS/MS analysis of unmodified NATA, NATA-33 does not contain m/z 201.12 (z = 1), which
corresponds to an intact N-terminus of NATA (Fig. S4), suggesting that NATA-33 may be
generated through loss of the N-terminus of NATA. The combination of NMR and HPLC-NMR
data fits structure P1. However, we also considered other possible structures of NATA-33 (P2
and P3a or its isomers) shown in Chart 1, which will be discussed below.
3.4. Discussion
3.4.1. Aggregation, conformational changes, and oxidation of mAbZ
Highly concentrated mAbZ was formulated either in NaAc and His/Lys buffer at pH 5.50. For
photostability testing, mAbZ formulated in either buffer was exposed to visible light up to 8 h,
resulting in the formation of dimers and HMWS (Fig. 1). Notably, mAbZ in NaAc buffer
(containing NaCl) generated more aggregates as compared to His/Lys buffer. The addition of
EDTA had no effect on aggregation. On the other hand, the addition of His reduced HMWS
formation. His residue can interact with aromatic residues8 and minimize self-association. The
mAbZ formulation in His/Lys buffer contains additional Lys, which also reduces viscosity or self-
association of mAbs via electrostatic interactions.8, 37-38 The overall extent of light-induced
oxidation rate of Met (254), Met (360), and Met (430) in the heavy chain and W(90) in the light
chain of mAbZ was higher in NaAc buffer as compared to His/Lys buffer. While degradation
products of His can act as photosensitizer,36 His also acts as a scavenger for reactive oxygen
species such as singlet oxygen or hydroxyl radical.39
3.4.2. Formation of chromophoric photoproducts from mAbZ and NATA
Interestingly, when the colorless mAbZ in either NaAc or His/Lys formulation was exposed to
visible light, only the mAbZ in NaAc buffer turned yellow (Fig. 5), characterized by an absorption
96
spectrum with λmax = ~450 nm (Fig. 6). Li et al. reported that photoproducts of Trp residues such
as OH-Trp, NFK, and Kyn, in the variable domain of mAbZ are sources of color change.4
However, these photoproducts have absorbance maxima at 300 nm, 318 nm, and 360 nm,
respectively,23, 40-41 and cannot rationalize the absorption maximum around 450 nm. Therefore, we
hypothesized that the absorption around 450 nm originated from a different tryptophan-derived
oxidation product, and selected a Trp-containing model compound (NATA) for further
characterization of this product.
When NATA was exposed to visible light in NaAc buffer, a comparable chromophoric
photoproduct was detected, and RP-HPLC analysis revealed a new product, NATA-33. After
fraction collection and concentration of NATA-33, a brown color was observed (Fig. 8), similar
to the color of a mAb exposed for 14 days to UV-visible light.4 Therefore, NATA and mAbZ may
form similar chromophoric photoproduct even in the absence of PS80. The concentrated atypical
peak generated from NATA was analyzed by HPLC-MS/MS and contained a product generated
by loss of 33 Da from unmodified NATA. 1H- and 13C-NMR spectra were collected to elucidate
the structure. Previous study by Dyer et al. on the photo-irradiation of wool proteins showed the
formation of yellow β-carbolines (1,5-dihydro-β-carboline) from Trp after through reaction with
formaldehyde or α-keto acids.28 An analogous 1, 5-dihydro-β-carboline derivative derived from
NATA is shown in the structure of product P2 (Chart 1). This proposed structure has chemical
formula C13H13N2O+, displaying a molecular ion with m/z 213.09 (z = 1); however, the predictions
of 1H- and 13C-NMR analysis of P2 do not correlate well with the actual 1H- and 13C-NMR spectra
obtained for the chemical shift of NATA-33. Therefore, we evaluated alternative structures. The
third proposed structure P3a may form via the mechanism shown in Scheme 1. Along with P3a,
isomers such as P3b, P3c, and P3d may also be present (Chart 1). It is possible that 1H- and 13C-
97
NMR spectra show a combination of these structures. The 1H- and 13C-NMR predictions for all
isobaric species (Table S1 and S2) were calculated with the MesoNova, nmrdb.org, and
ChemDraw software, and were correlated to the NMR spectra obtained from NATA-33 (Fig. 9).
In the 13C-NMR predictions (Table S1), carbon at the position 5, 6, 7, and 8 may belong to the
benzene ring and also correlate well with the observed peaks at 116.10, 125.48, 128.08, and 129.03
ppm (Fig. 9A). Likewise, the carbons at position 14 and 15 may correspond to the carbonyl (180.39
ppm) and methyl group (29.11 ppm), respectively. When predictor peaks of all the isobaric species
are combined, further peaks in the obtained NMR can be assigned, such as the carbon at the
position 9, which can be assigned to 133.80 ppm and carbons at positions 1, 2, 4, and 11, which
can be assigned to 142.06, 147.5, 148.36, and 149.06 ppm. Similarly, carbons at positions 10 and
12 can be also be assigned to observed peaks at 98.49 and 103.57 ppm. In addition, the predictor
peaks of isobaric species (Table S2), can be assigned to the measured 1H-NMR spectrum (Fig.
9B). Importantly, the proposed structures maintain at least one of the amides, suggesting that
similar structures of mAbZ would remain bound to part of the protein framework. However, after
8 h photo-irradiated ion with visible light the proteolytic digestion of mAbZ revealed no peptide
peak with absorbance around 450 nm (Fig. S5). This may indicate that either the product is not
peptide bound, or that a peptide-bound product was not recovered. In Fig. 9, we show a tentative
product, P1, which is not peptide- or protein-bound. The predicted 13C resonances fit better with
the observed 13C-NMR spectrum. However, the 1H-NMR spectrum does not correlate well with
the predicted resonances.
Here, we have reported a chromophoric product of a mAb after exposure to visible light. Using
NATA as a model compound for Trp, the structure of the photoproduct was characterized by
HPLC-MS/MS spectrum and 1H- and 13C-NMR. And based on these data we proposed the

98
structures shown in Chart 1. Among the proposed structures, P3a and its isomers fit the NMR
spectra best and is likely the prime candidate. Since the UV-Vis spectra of photo-irradiated mAb
and NATA have similar absorbance, it is likely the degradation products in mAbZ attributed to
modifications to Trp residues resulting in a product similar to P3a and its isomers. Such products
are formed after cleavage of an amide bond, which can result in loss of biological activity of the
protein as a whole. Since, photo-irradiated NATA in our experimental conditions and the mAb
exposed to UV-visible light for 14 days shown by Li et al. have exhibited similar brown color, our
results may explain one of the factors responsible for the color change of the mAb formulation.
Here, the chromophoric product after exposure to visible light was observed from far below the
ICH Q1B guideline. The observation of these products indicates that the photosensitive proteins
must be protected not only from the UV light, but also from longer exposure to visible light.
3.5. References
1. Reichert, J. M.; Rosensweig, C. J.; Faden, L. B.; Dewitz, M. C., Monoclonal antibody
successes in the clinic. Nat. Biotechnol. 2005, 23 (9), 1073-8.
2. Buss, N. A. P. S.; Henderson, S. J.; McFarlane, M.; Shenton, J. M.; de Haan, L., Monoclonal
antibody therapeutics: history and future. Curr. Opin. Pharm. 2012, 12 (5), 615-622.
3. Carter, P. J., Potent antibody therapeutics by design. Nat. Rev. Immunol. 2006, 6 (5), 343-357.
4. Li, Y.; Polozova, A.; Gruia, F.; Feng, J., Characterization of the degradation products of a
color-changed monoclonal antibody: tryptophan-derived chromophores. Anal. Chem. 2014, 86
(14), 6850-6857.
5. Shire, S. J.; Shahrokh, Z.; Liu, J., Challenges in the development of high protein concentration
formulations. J. Pharm. Sci. 2004, 93 (6), 1390-1402.
6. Kanai, S.; Liu, J.; Patapoff, T. W.; Shire, S. J., Reversible self‐association of a concentrated
monoclonal antibody solution mediated by Fab–Fab interaction that impacts solution viscosity.
J. Pharm. Sci. 2008, 97 (10), 4219-4227.
7. Harn, N.; Allan, C.; Oliver, C.; Middaugh, C., Highly concentrated monoclonal antibody
solutions: direct analysis of physical structure and thermal stability. J. Pharm. Sci. 2007, 96
(3), 532-546.
8. Dear, B. J.; Hung, J. J.; Truskett, T. M.; Johnston, K. P., Contrasting the influence of cationic
amino acids on the viscosity and stability of a highly concentrated monoclonal antibody.
Pharm. Res. 2017, 34 (1), 193-207.

99
9. Chen, B.; Bautista, R.; Yu, K.; Zapata, G. A.; Mulkerrin, M. G.; Chamow, S. M., Influence of
histidine on the stability and physical properties of a fully human antibody in aqueous and solid
forms. Pharm. Res. 2003, 20 (12), 1952-1960.
10. Qi, P.; Volkin, D. B.; Zhao, H.; Nedved, M. L.; Hughes, R.; Bass, R.; Yi, S. C.; Panek, M. E.;
Wang, D.; DalMonte, P., Characterization of the photodegradation of a human IgG1
monoclonal antibody formulated as a high‐concentration liquid dosage form. J. Pharm. Sci.
2009, 98 (9), 3117-3130.
11. Guideline, I. H. T., Photostability testing of new drug substance and products. Fed. Register
1996, 62, 27115-27122.
12. Commission, E. P., European Pharmacopoeia (Ph. Eur). Council of Europe: Strasbourg,
France: 2015.
13. Du, C.; Xu, J.; Song, H.; Tao, L.; Lewandowski, A.; Ghose, S.; Borys, M. C.; Li, Z. J.,
Mechanisms of color formation in drug substance and mitigation strategies for the manufacture
and storage of therapeutic proteins produced using mammalian cell culture. Process Biochem.
2019.
14. Quan, C.; Alcala, E.; Petkovska, I.; Matthews, D.; Canova-Davis, E.; Taticek, R.; Ma, S., A
study in glycation of a therapeutic recombinant humanized monoclonal antibody: where it is,
how it got there, and how it affects charge-based behavior. Anal. Biochem. 2008, 373 (2), 179-
191.
15. Butko, M.; Pallat, H.; Cordoba, A.; Yu, X. C., Recombinant Antibody Color Resulting from
Advanced Glycation End Product Modifications. Anal. Chem. 2014, 86 (19), 9816-9823.
16. Ahmed, N., Advanced glycation endproducts—role in pathology of diabetic complications.
Diabetes Res. Clin. Pract. 2005, 67 (1), 3-21.
17. Xu, J.; Jin, M.; Song, H.; Huang, C.; Xu, X.; Tian, J.; Qian, N.-X.; Steger, K.; Lewen, N. S.;
Tao, L., Brown drug substance color investigation in cell culture manufacturing using
chemically defined media: A case study. Process Biochem. 2014, 49 (1), 130-139.
18. Song, H.; Xu, J.; Jin, M.; Huang, C.; Bongers, J.; Bai, H.; Wu, W.; Ludwig, R.; Li, Z.; Tao, L.,
Investigation of color in a fusion protein using advanced analytical techniques: delineating
contributions from oxidation products and process related impurities. Pharm. Res. 2016, 33
(4), 932-941.
19. Vijayasankaran, N.; Varma, S.; Yang, Y.; Mun, M.; Arevalo, S.; Gawlitzek, M.; Swartz, T.;
Lim, A.; Li, F.; Zhang, B., Effect of cell culture medium components on color of formulated
monoclonal antibody drug substance. Biotechnol. Prog. 2013, 29 (5), 1270-1277.
20. Clarizia, L.; Russo, D.; Di Somma, I.; Marotta, R.; Andreozzi, R., Homogeneous photo-Fenton
processes at near neutral pH: a review. Appl. Catal. B 2017, 209, 358-371.
21. Schöneich, C., Photo-Degradation of Therapeutic Proteins: Mechanistic Aspects. Pharm. Res.
2020, 37 (3), 45.
22. Creed, D., The photophysics and photochemistry of the near‐UV absorbing amino acids–i.
Tryptophan and its simple derivatives. Photochem. Photobiol. 1984, 39 (4), 537-562.

100
23. Dreaden, T. M.; Chen, J.; Rexroth, S.; Barry, B. A., N-formylkynurenine as a marker of high
light stress in photosynthesis. J. Biol. Chem. 2011, 286 (25), 22632-22641.
24. Mizdrak, J.; Hains, P. G.; Truscott, R. J.; Jamie, J. F.; Davies, M. J., Tryptophan-derived
ultraviolet filter compounds covalently bound to lens proteins are photosensitizers of oxidative
damage. Free Radic. Biol. Med. 2008, 44 (6), 1108-1119.
25. Parker, N. R.; Jamie, J. F.; Davies, M. J.; Truscott, R. J. W., Protein-bound kynurenine is a
photosensitizer of oxidative damage. Free Radic. Biol. Med. 2004, 37 (9), 1479-1489.
26. Sreedhara, A.; Yin, J.; Joyce, M.; Lau, K.; Wecksler, A. T.; Deperalta, G.; Yi, L.; John Wang,
Y.; Kabakoff, B.; Kishore, R. S. K., Effect of ambient light on IgG1 monoclonal antibodies
during drug product processing and development. Eur. J. Pharm. Biopharm. 2016, 100, 38-46.
27. Baptista, M. S.; Cadet, J.; Di Mascio, P.; Ghogare, A. A.; Greer, A.; Hamblin, M. R.; Lorente,
C.; Nunez, S. C.; Ribeiro, M. S.; Thomas, A. H.; Vignoni, M.; Yoshimura, T. M., Type I and
Type II Photosensitized Oxidation Reactions: Guidelines and Mechanistic Pathways.
Photochem. Photobiol. 2017, 93 (4), 912-919.
28. Dyer, J. M.; Bringans, S. D.; Bryson, W. G., Determination of photo‐oxidation products
within photoyellowed bleached wool proteins. Photochem. Photobiol. 2006, 82 (2), 551-557.
29. Hood, B. D.; Garner, B.; Truscott, R. J., Human Lens Coloration and Aging EVIDENCE FOR
CRYSTALLIN MODIFICATION BY THE MAJOR ULTRAVIOLET FILTER, 3-
HYDROXY-KYNURENINEO-β-d-GLUCOSIDE. J. Biol. Chem. 1999, 274 (46), 32547-
32550.
30. Pirie, A., Formation of N′-formylkynurenine in proteins from lens and other sources by
exposure to sunlight. Biochem. J. 1971, 125 (1), 203.
31. Pirie, A., Reaction of tyrosine oxidation products with proteins of the lens. Biochem. J. 1968,
109 (2), 301-305.
32. Hatchard, C.; Parker, C. A., A new sensitive chemical actinometer-II. Potassium ferrioxalate
as a standard chemical actinometer. Proc. R. Soc. London, Ser. A 1956, 235 (1203), 518-536.
33. Lee, J.; Seliger, H., Quantum yield of the ferrioxalate actinometer. J. Chem. Phys. 1964, 40
(2), 519-523.
34. Pozdnyakov, I. P.; Kel, O. V.; Plyusnin, V. F.; Grivin, V. P.; Bazhin, N. M., New insight into
photochemistry of ferrioxalate. J. Phys. Chem. A. 2008, 112 (36), 8316-8322.
35. Prajapati, I.; Peters, B.-H.; Larson, N. R.; Wei, Y.; Choudhary, S.; Kalonia, C.; Hudak, S.;
Esfandiary, R.; Middaugh, C. R.; Schöneich, C., Cis/Trans Isomerization of Unsaturated Fatty
Acids in Polysorbate 80 During Light Exposure of a Monoclonal Antibody–Containing
Formulation. J. Pharm. Sci. 2020, 109 (1), 603-613.
36. Stroop, S. D.; Conca, D. M.; Lundgard, R. P.; Renz, M. E.; Peabody, L. M.; Leigh, S. D.,
Photosensitizers form in histidine buffer and mediate the photodegradation of a monoclonal
antibody. J. Pharm. Sci. 2011, 100 (12), 5142-5155.
37. Inoue, N.; Takai, E.; Arakawa, T.; Shiraki, K., Arginine and lysine reduce the high viscosity
of serum albumin solutions for pharmaceutical injection. J. Biosci. Bioeng. 2014, 117 (5), 539-
543.
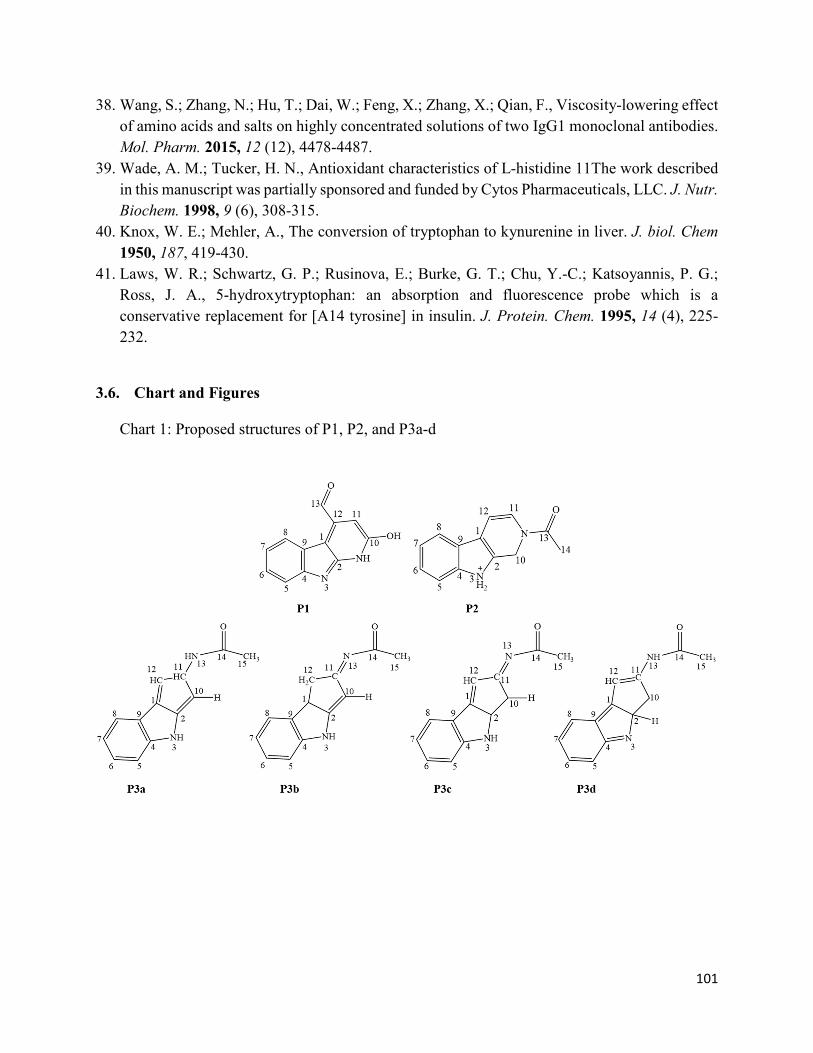
101
38. Wang, S.; Zhang, N.; Hu, T.; Dai, W.; Feng, X.; Zhang, X.; Qian, F., Viscosity-lowering effect
of amino acids and salts on highly concentrated solutions of two IgG1 monoclonal antibodies.
Mol. Pharm. 2015, 12 (12), 4478-4487.
39. Wade, A. M.; Tucker, H. N., Antioxidant characteristics of L-histidine 11The work described
in this manuscript was partially sponsored and funded by Cytos Pharmaceuticals, LLC. J. Nutr.
Biochem. 1998, 9 (6), 308-315.
40. Knox, W. E.; Mehler, A., The conversion of tryptophan to kynurenine in liver. J. biol. Chem
1950, 187, 419-430.
41. Laws, W. R.; Schwartz, G. P.; Rusinova, E.; Burke, G. T.; Chu, Y.-C.; Katsoyannis, P. G.;
Ross, J. A., 5-hydroxytryptophan: an absorption and fluorescence probe which is a
conservative replacement for [A14 tyrosine] in insulin. J. Protein. Chem. 1995, 14 (4), 225-
232.
3.6. Chart and Figures
Chart 1: Proposed structures of P1, P2, and P3a-d

102
Figure 1: SDS-Page analysis of mAbZ exposed to visible light for 0-8 h in NaAc buffer (lanes 2-5) and in His/Lys buffer (lanes 7-10) Lane 1 and 6 show molecular makers (A) non-reducing gel, (B) reducing gel
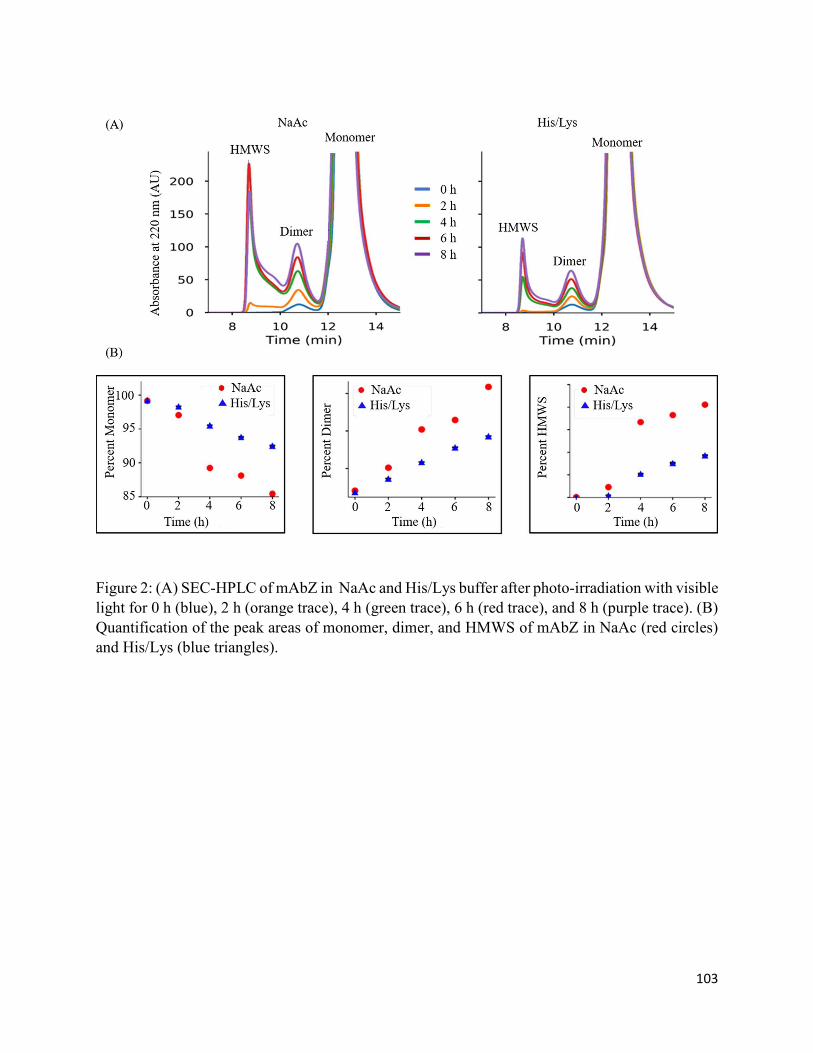
103
Figure 2: (A) SEC-HPLC of mAbZ in NaAc and His/Lys buffer after photo-irradiation with visible light for 0 h (blue), 2 h (orange trace), 4 h (green trace), 6 h (red trace), and 8 h (purple trace). (B) Quantification of the peak areas of monomer, dimer, and HMWS of mAbZ in NaAc (red circles) and His/Lys (blue triangles).

104
Figure 3: (A)Thermograms measured by DSC of mAbZ in NaAc and His/Lys buffer after photo-irradiation with visible light between 0 and 8 h. (B) Tm1(B-I), Tm2 (B-II), and Tonset (B-III) of mAbZ after photo-irradiation with visible light between 0 and 8 h in NaAc (red-circles) and His/Lys buffer (blue-triangles). Samples were run in triplicate and error bars represent the standard deviation of three replicates.
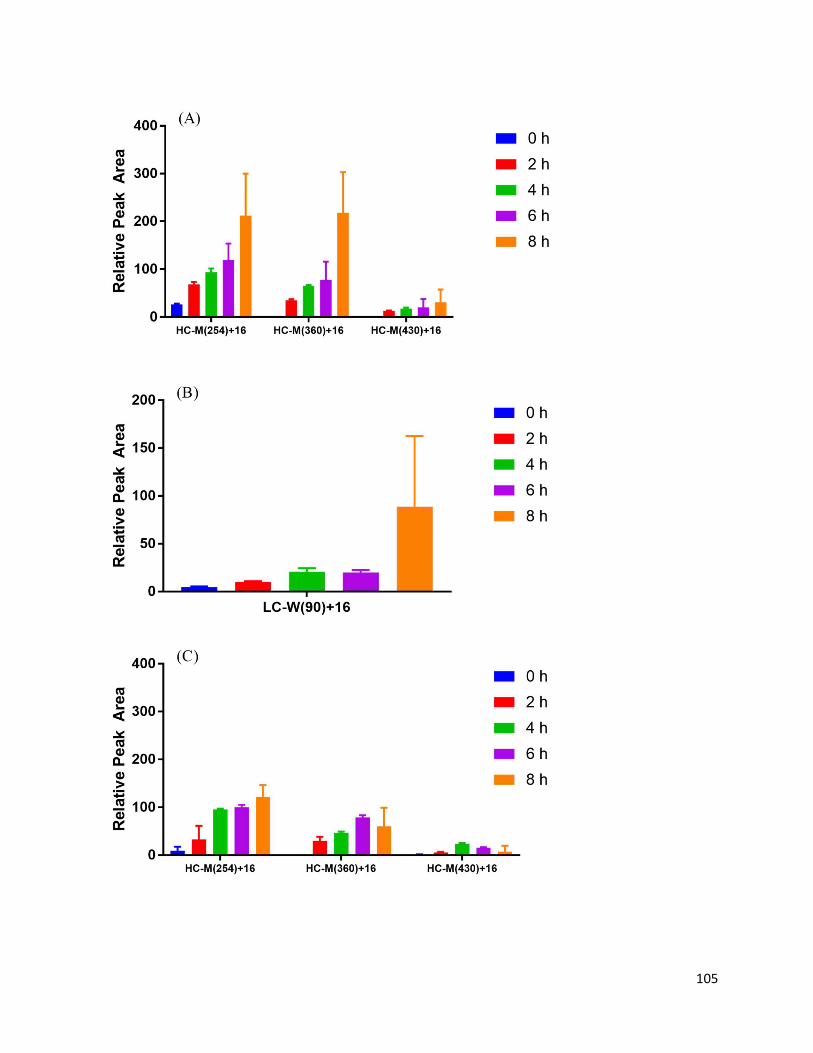
105
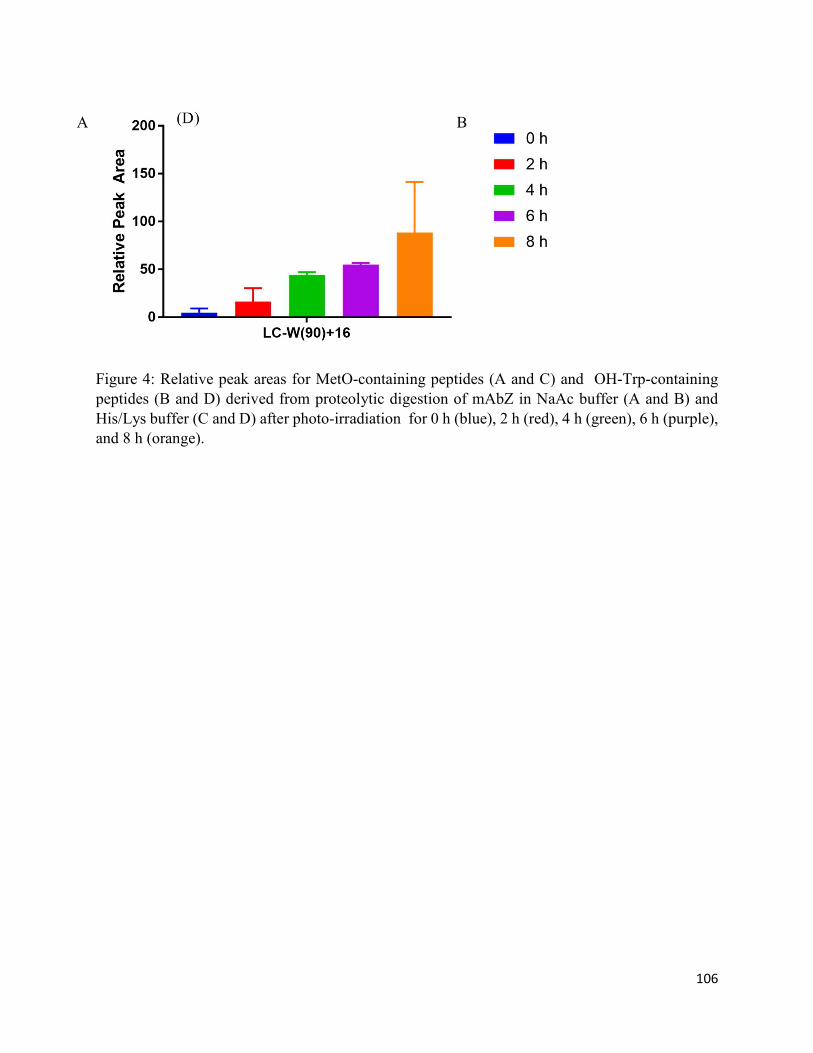
106
Figure 4: Relative peak areas for MetO-containing peptides (A and C) and OH-Trp-containing peptides (B and D) derived from proteolytic digestion of mAbZ in NaAc buffer (A and B) and His/Lys buffer (C and D) after photo-irradiation for 0 h (blue), 2 h (red), 4 h (green), 6 h (purple), and 8 h (orange).
A B

107
Figure 5: Yellow color observed after mAbZ was photo-irradiated in (A) NaAc and (B) His/Lys buffer.
t0 2 h 4 h 6 h 8 h
t0 2 h 4 h 6 h 8 h
Photo-irradiation time
NaAc
His/Lys
Photo-irradiation time
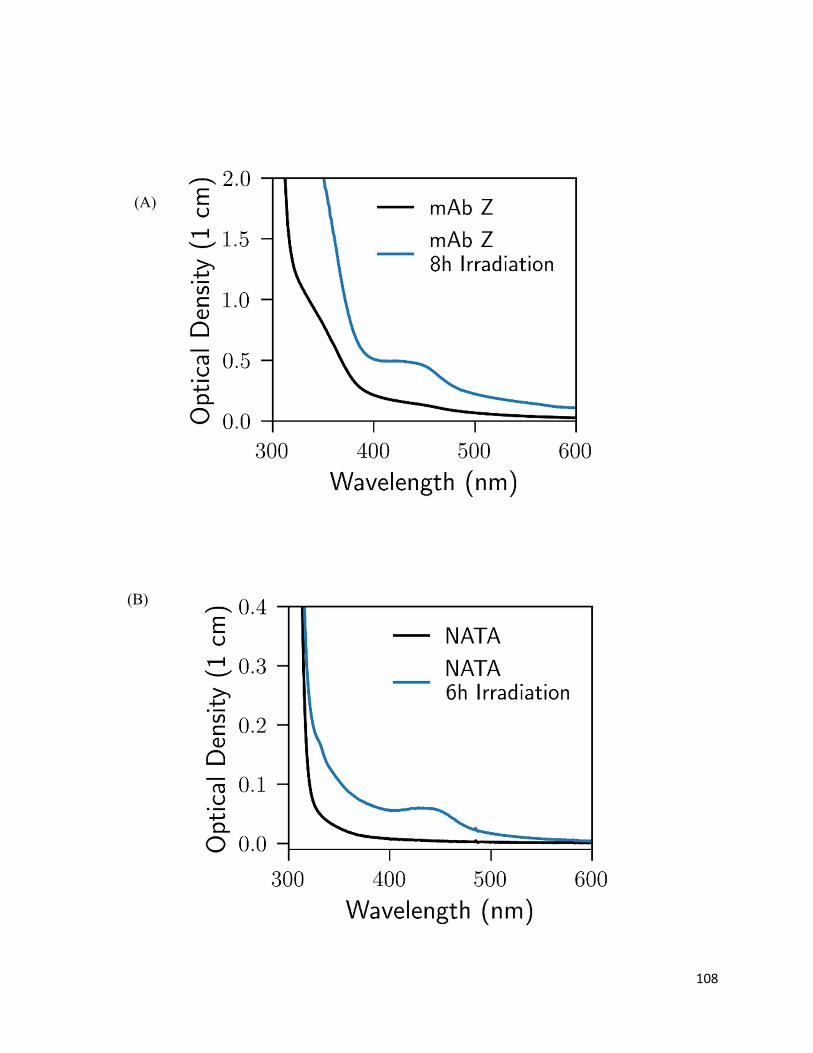
108
(A)
(B)
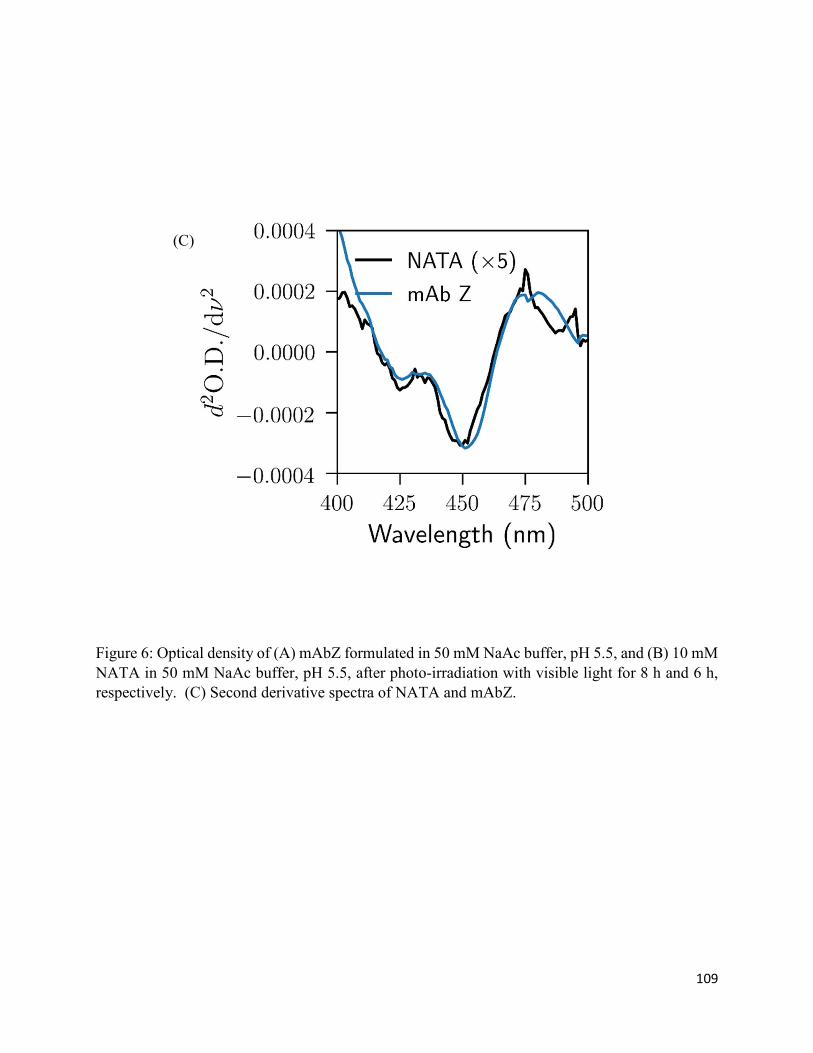
109
Figure 6: Optical density of (A) mAbZ formulated in 50 mM NaAc buffer, pH 5.5, and (B) 10 mM NATA in 50 mM NaAc buffer, pH 5.5, after photo-irradiation with visible light for 8 h and 6 h, respectively. (C) Second derivative spectra of NATA and mAbZ.
(C)
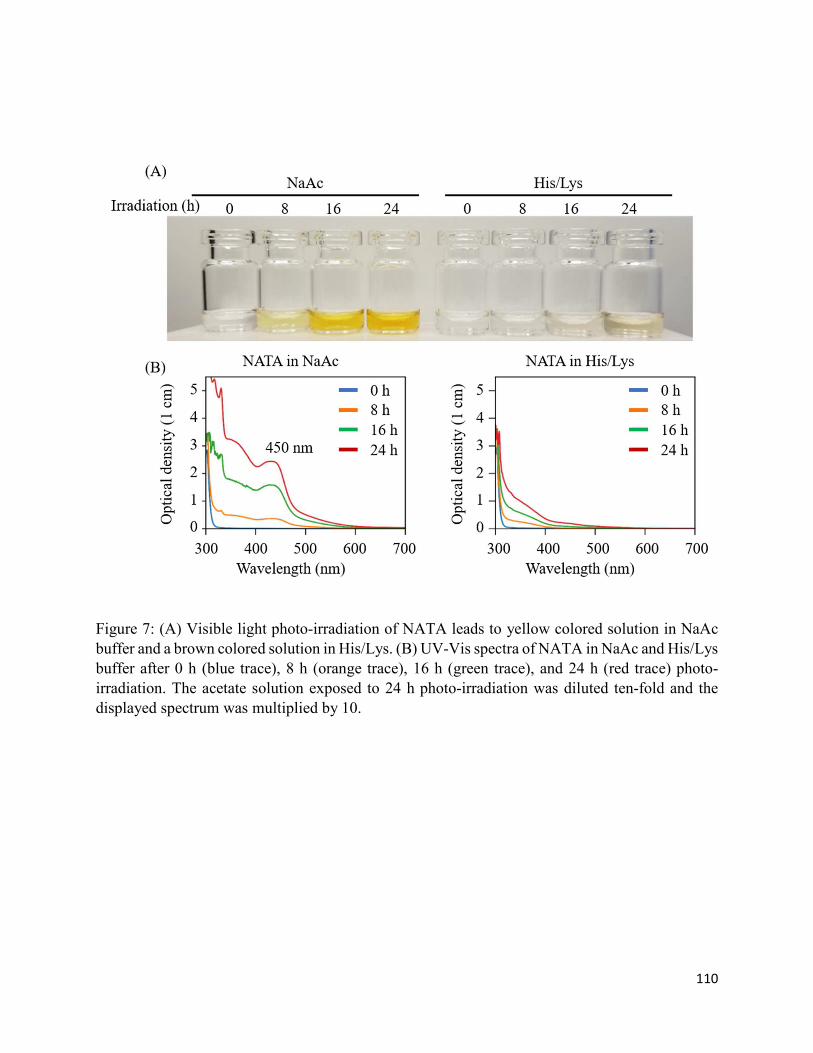
110
Figure 7: (A) Visible light photo-irradiation of NATA leads to yellow colored solution in NaAc buffer and a brown colored solution in His/Lys. (B) UV-Vis spectra of NATA in NaAc and His/Lys buffer after 0 h (blue trace), 8 h (orange trace), 16 h (green trace), and 24 h (red trace) photo-irradiation. The acetate solution exposed to 24 h photo-irradiation was diluted ten-fold and the displayed spectrum was multiplied by 10.
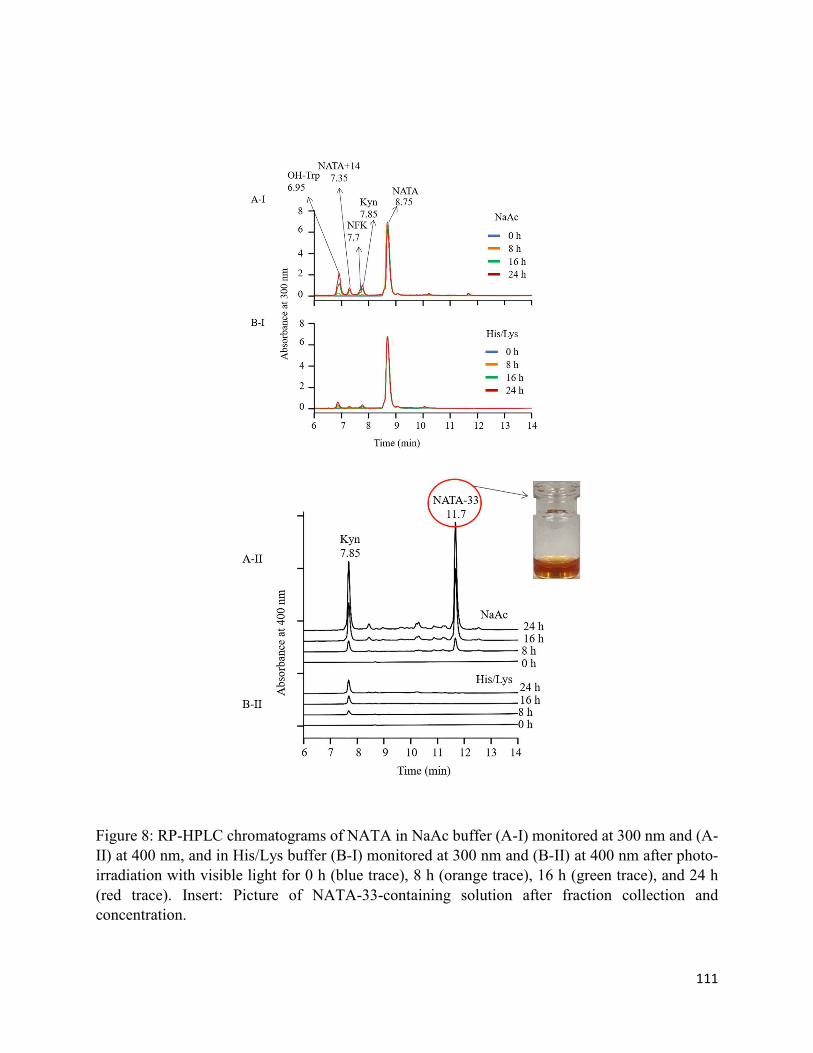
111
Figure 8: RP-HPLC chromatograms of NATA in NaAc buffer (A-I) monitored at 300 nm and (A-II) at 400 nm, and in His/Lys buffer (B-I) monitored at 300 nm and (B-II) at 400 nm after photo-irradiation with visible light for 0 h (blue trace), 8 h (orange trace), 16 h (green trace), and 24 h (red trace). Insert: Picture of NATA-33-containing solution after fraction collection and concentration.
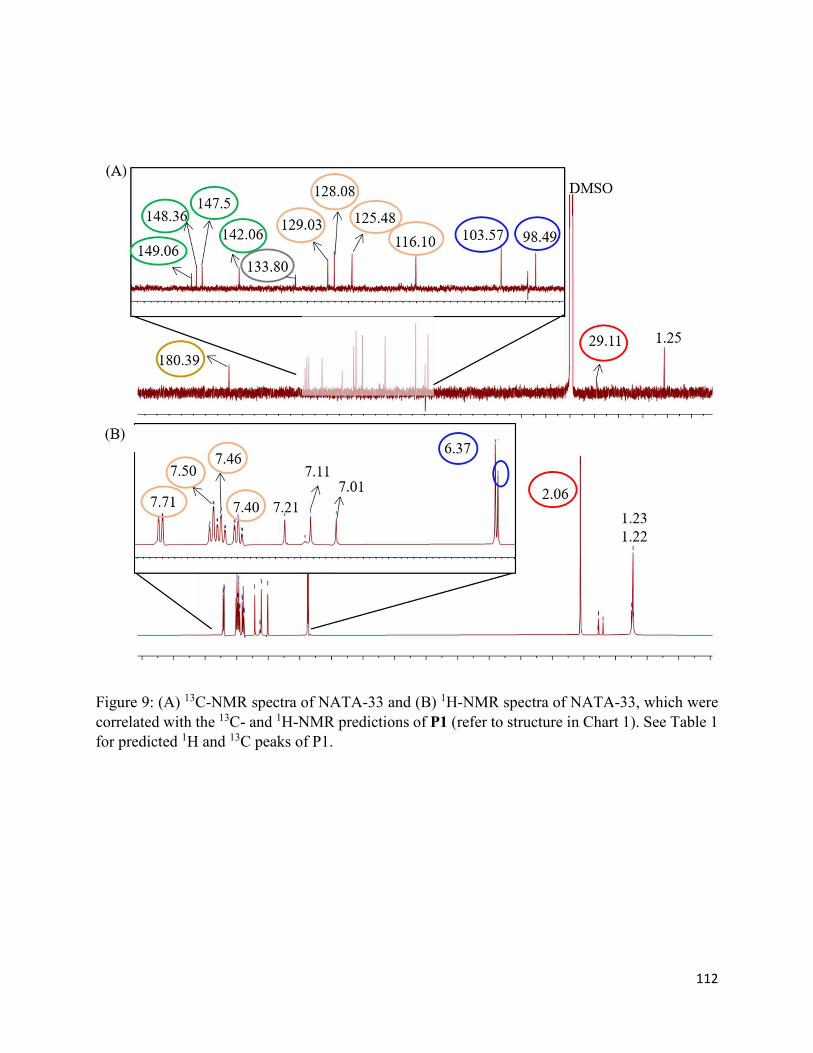
112
Figure 9: (A) 13C-NMR spectra of NATA-33 and (B) 1H-NMR spectra of NATA-33, which were correlated with the 13C- and 1H-NMR predictions of P1 (refer to structure in Chart 1). See Table 1 for predicted 1H and 13C peaks of P1.
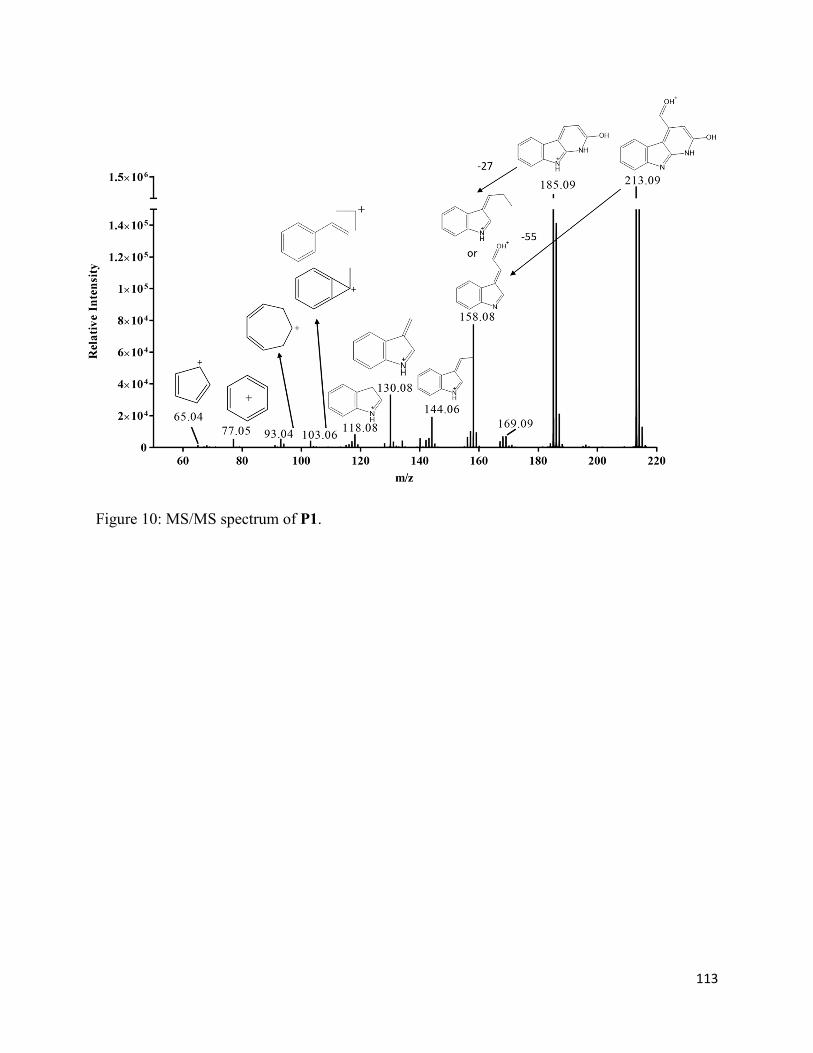
113
Figure 10: MS/MS spectrum of P1.
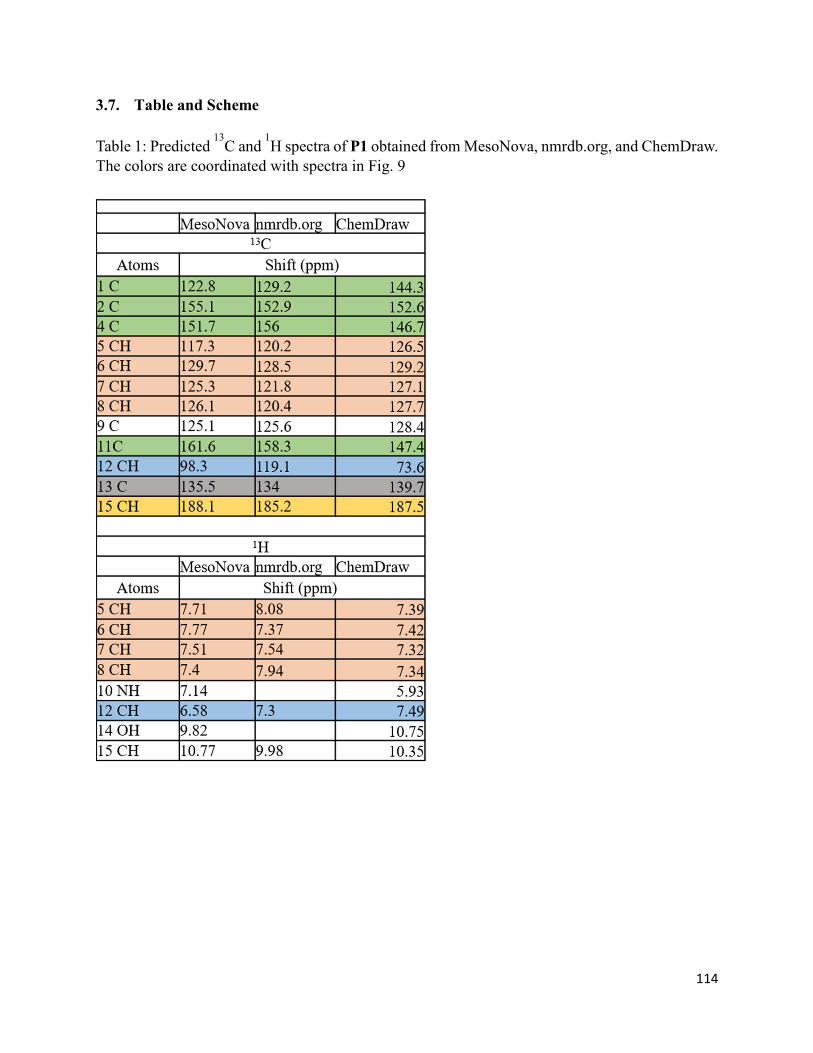
114
3.7. Table and Scheme
Table 1: Predicted 13
C and 1H spectra of P1 obtained from MesoNova, nmrdb.org, and ChemDraw.
The colors are coordinated with spectra in Fig. 9
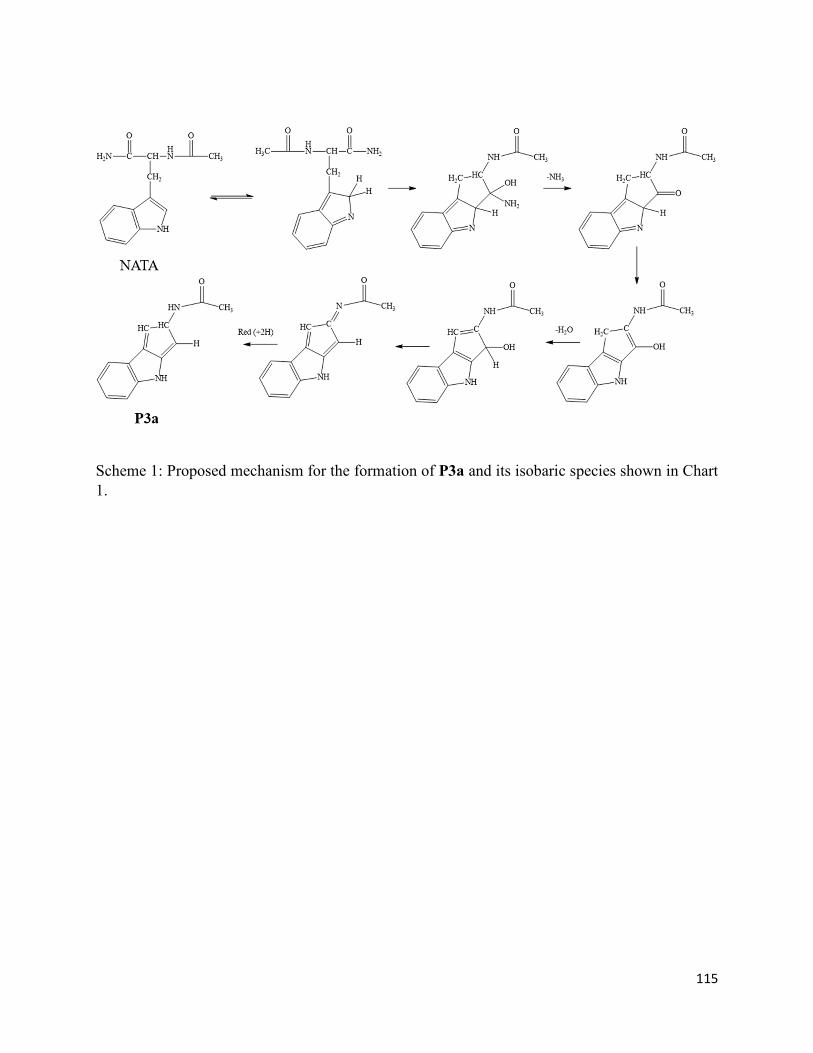
115
Scheme 1: Proposed mechanism for the formation of P3a and its isobaric species shown in Chart 1.

116
3.8. Supplementary Information
Figure S1: (A) Quantification of loss of monomer and (B) formation of aggregates (contains dimer and HMWS) of mAbZ after exposure to visible light. mAbZ was either formulated in NaAc with EDTA, NaAc with His, or NaAc alone.

117
Figure S2: HPLC-MS chromatogram of concentrated NATA-33 photoproduct
35.37 min m/z 213.10 (z = 1)

118
Figure S3: 1H-13C HSQC spectrum of NATA-33. Insert: Table with 1H and 13C HSQC correlation of NATA-33.
1H 13C 6.37 103.57 6.38 98.49 7.40 125.48 7.46 128.08 7.50 116.10 7.71 129.03

119
Figure S4: MS/MS spectrum of unmodified NATA
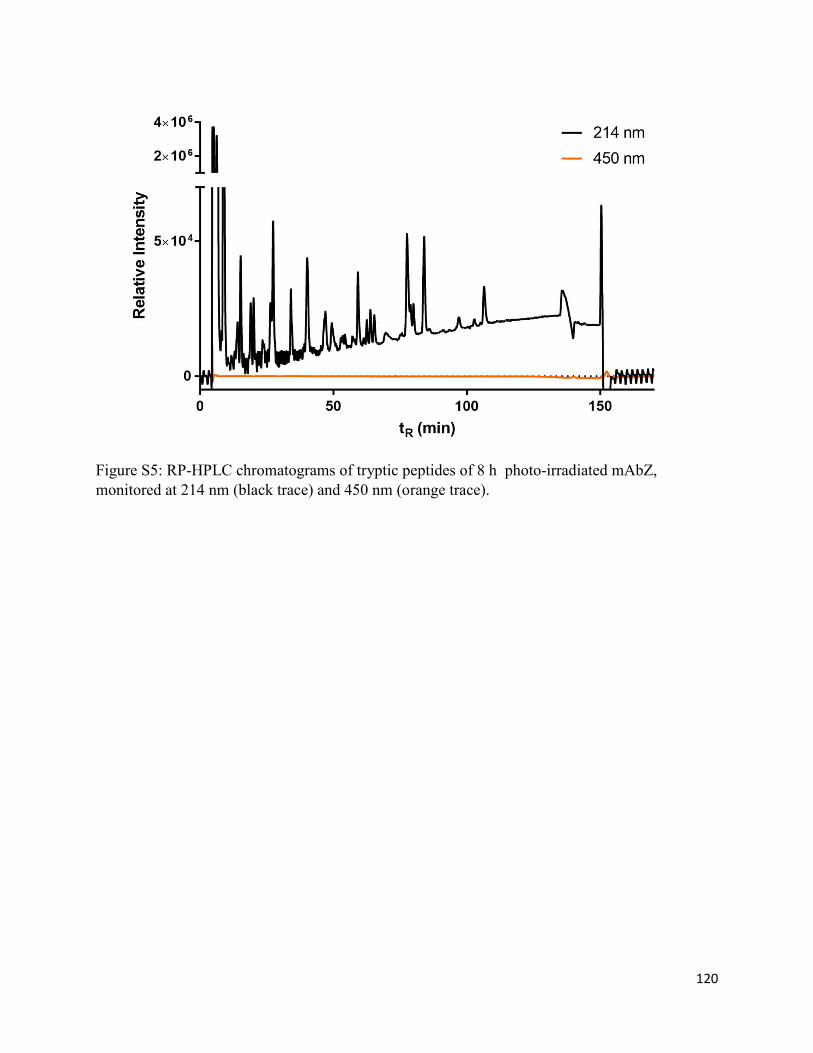
120
Figure S5: RP-HPLC chromatograms of tryptic peptides of 8 h photo-irradiated mAbZ, monitored at 214 nm (black trace) and 450 nm (orange trace).
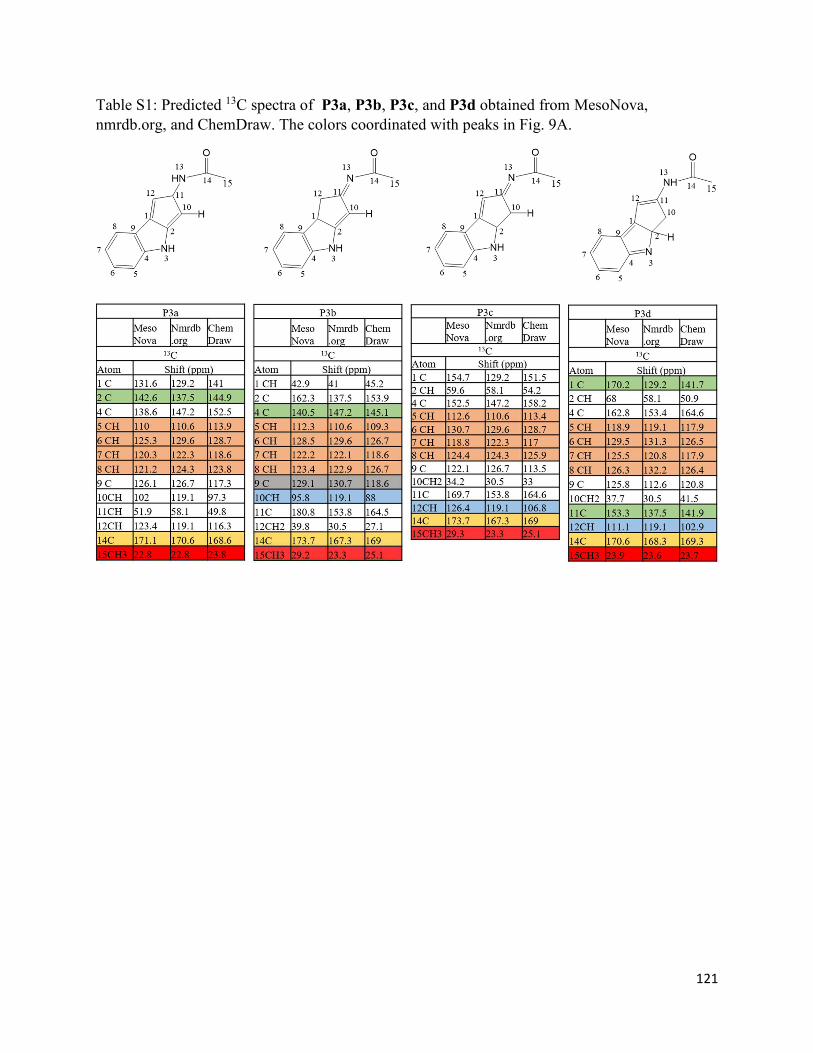
121
Table S1: Predicted 13C spectra of P3a, P3b, P3c, and P3d obtained from MesoNova, nmrdb.org, and ChemDraw. The colors coordinated with peaks in Fig. 9A.

122
Table S2: Predicted 1H peaks of P3a, P3b, P3c, and P3d obtained from MesoNova, nmrdb.org, and ChemDraw. The colors coordinated with peaks in Fig. 9B.
123
Chapter 4: Cis/trans isomerization of unsaturated
fatty acids in polysorbate 80 during light exposure
of a monoclonal antibody-containing formulation
124
4.1. Introduction
Polysorbates are non-ionic surfactants and are frequently present in protein formulations in order
to prevent aggregation or surface adsorption.1-3 They comprise highly heterogenous mixtures of
fatty acid (FA) esters of polyoxyethylene (POE), polyoxyethylated sorbitan and polyoxyethylated
isosorbide.1 The chemical stability of polysorbates is a concern where both oxidation and
hydrolysis products can affect the integrity of pharmaceutical formulations.1-4 For example,
proteins are sensitive to modification by peroxides5-6 and aldehydes/ketones7-8 generated through
polysorbate oxidation. Moreover, free fatty acids (FFAs), generated via hydrolysis9-12 or
oxidation,13 can generate particles, which may cause turbidity and/or protein
adsorption/aggregation.
A common hypothesis is that polysorbate degradation affects protein stability, i.e. that
polysorbate degradation products trigger chemical and/or physical protein degradation. While
there is good evidence supporting this hypothesis, recent studies also point to a role for protein in
the generation of polysorbate degradation products. For example, it was reported that FFA
generation in selected protein formulations can be the result of enzymatic hydrolysis, catalyzed
by small levels of residual host cell proteins such as esterases and/or lipases.9-12 These results
motivated us to evaluate additional potential protein-dependent pathways of polysorbate
degradation. Considering the sensitivity of proteins to redox processes, reactive protein
intermediates may play a more general role in the oxidative degradation of polysorbate.
Here, we report that the light-exposure of polysorbate 80 (PS80)-containing formulations can
induce the cis/trans isomerization of unsaturated FAs in polysorbate esters when proteins are
present. These isomerization reactions likely result from reactions of thiyl radicals,14-19 which can
be generated during the light exposure of proteins.20-22 Evidence for thiyl radical-mediated

125
cis/trans isomerization of mono- and polyunsaturated FAs comes from a series of mechanistic
studies with isolated FAs and their methyl esters, phospholipids, micelles and vesicles.14-19
Light exposure of a monoclonal antibody (mAb) can generate thiyl radicals (RS•) via various
different pathways. First, the photo-ionization of a protein tryptophan (Trp) residue23 can lead to
a hydrated electron, which efficiently reduces a protein disulfide bond to yield a protein thiyl
radical and thiol (reactions 1 and 2).22 Photo-ionization processes of Trp have been observed at
wavelengths > 300 nm,24-25 including typical pharmaceutical photostability testing in light
chambers.26-27
Concomitantly, this photo-ionization generates a tryptophan radical cation (Trp+•), and evidence
for the formation of Trp+• during the light exposure of a mAb was provided by the detection of
specific stable reaction products originating from Trp+• (such as Trp side chain cleavage
products).27-28 In principle, protein thiyl radicals can react with unsaturated and polyunsaturated
FAs to induce cis/trans isomerization. However, in polysorbate-containing solutions such
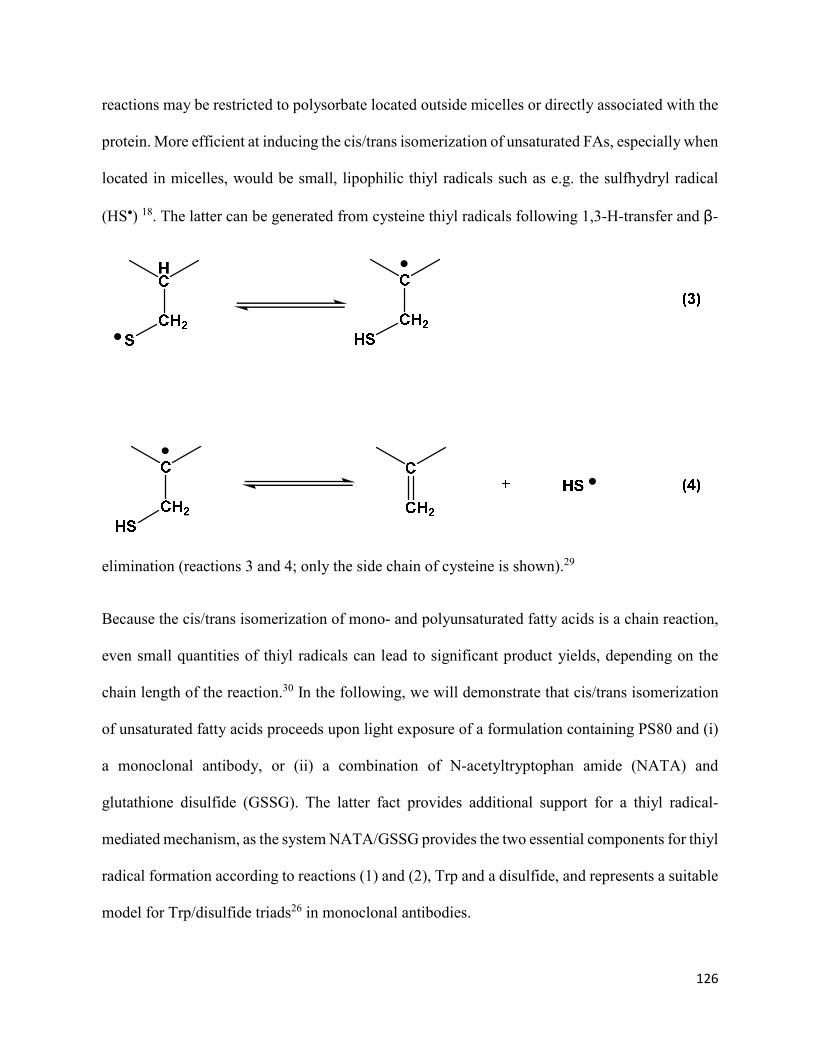
126
reactions may be restricted to polysorbate located outside micelles or directly associated with the
protein. More efficient at inducing the cis/trans isomerization of unsaturated FAs, especially when
located in micelles, would be small, lipophilic thiyl radicals such as e.g. the sulfhydryl radical
(HS•) 18. The latter can be generated from cysteine thiyl radicals following 1,3-H-transfer and β-
elimination (reactions 3 and 4; only the side chain of cysteine is shown).29
Because the cis/trans isomerization of mono- and polyunsaturated fatty acids is a chain reaction,
even small quantities of thiyl radicals can lead to significant product yields, depending on the
chain length of the reaction.30 In the following, we will demonstrate that cis/trans isomerization
of unsaturated fatty acids proceeds upon light exposure of a formulation containing PS80 and (i)
a monoclonal antibody, or (ii) a combination of N-acetyltryptophan amide (NATA) and
glutathione disulfide (GSSG). The latter fact provides additional support for a thiyl radical-
mediated mechanism, as the system NATA/GSSG provides the two essential components for thiyl
radical formation according to reactions (1) and (2), Trp and a disulfide, and represents a suitable
model for Trp/disulfide triads26 in monoclonal antibodies.
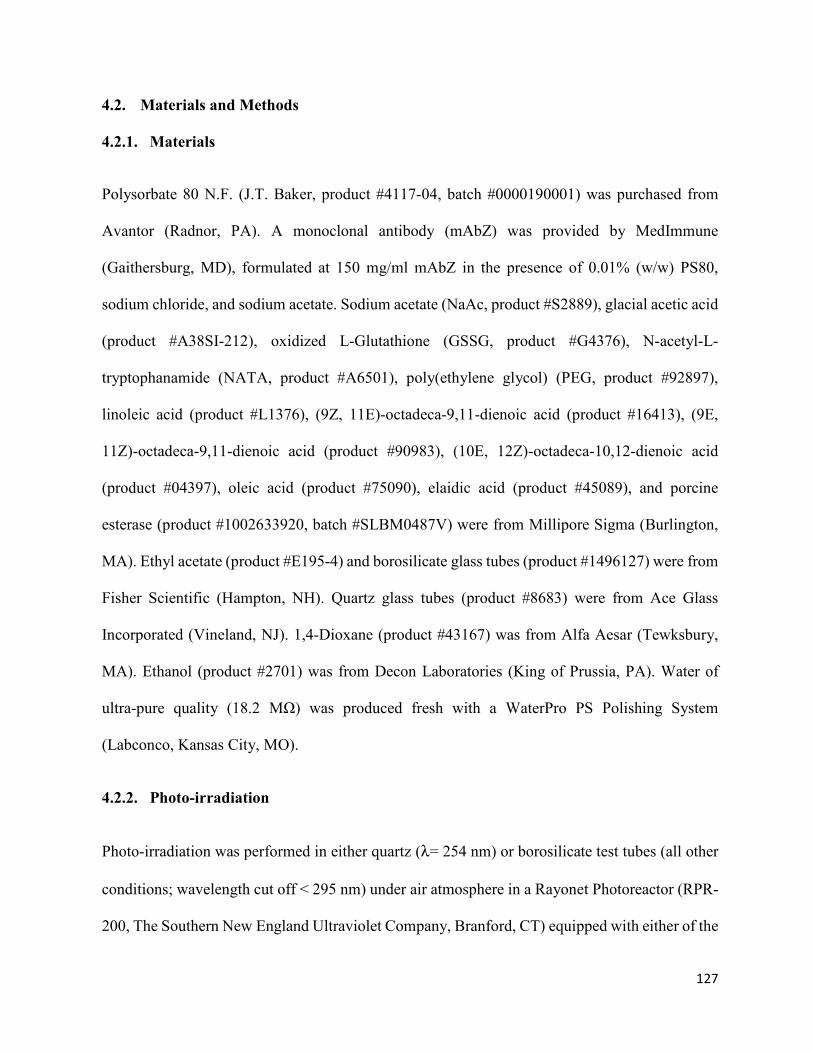
127
4.2. Materials and Methods
4.2.1. Materials
Polysorbate 80 N.F. (J.T. Baker, product #4117-04, batch #0000190001) was purchased from
Avantor (Radnor, PA). A monoclonal antibody (mAbZ) was provided by MedImmune
(Gaithersburg, MD), formulated at 150 mg/ml mAbZ in the presence of 0.01% (w/w) PS80,
sodium chloride, and sodium acetate. Sodium acetate (NaAc, product #S2889), glacial acetic acid
(product #A38SI-212), oxidized L-Glutathione (GSSG, product #G4376), N-acetyl-L-
tryptophanamide (NATA, product #A6501), poly(ethylene glycol) (PEG, product #92897),
linoleic acid (product #L1376), (9Z, 11E)-octadeca-9,11-dienoic acid (product #16413), (9E,
11Z)-octadeca-9,11-dienoic acid (product #90983), (10E, 12Z)-octadeca-10,12-dienoic acid
(product #04397), oleic acid (product #75090), elaidic acid (product #45089), and porcine
esterase (product #1002633920, batch #SLBM0487V) were from Millipore Sigma (Burlington,
MA). Ethyl acetate (product #E195-4) and borosilicate glass tubes (product #1496127) were from
Fisher Scientific (Hampton, NH). Quartz glass tubes (product #8683) were from Ace Glass
Incorporated (Vineland, NJ). 1,4-Dioxane (product #43167) was from Alfa Aesar (Tewksbury,
MA). Ethanol (product #2701) was from Decon Laboratories (King of Prussia, PA). Water of
ultra-pure quality (18.2 MΩ) was produced fresh with a WaterPro PS Polishing System
(Labconco, Kansas City, MO).
4.2.2. Photo-irradiation
Photo-irradiation was performed in either quartz (λ= 254 nm) or borosilicate test tubes (all other
conditions; wavelength cut off < 295 nm) under air atmosphere in a Rayonet Photoreactor (RPR-
200, The Southern New England Ultraviolet Company, Branford, CT) equipped with either of the
128
following lamps (The Southern New England Ultraviolet Company, Branford, CT): RPR-2537A
(λ= 254 nm), RPR-3000A (λmax = 305 nm; emission spectrum between 265 and 340 nm, RPR-
3500A (λmax = 350 nm, emission spectrum between 305 and 416 nm), or RPR-4190A (λmax = 419
nm, emission spectrum between 390 and 475 nm). Actinometry was performed with the
iodide/iodate actinometer31 for the RPR-2537A lamps, and the ferrioxalate actinometer32-34 for
the RPR-3000A, RPR-3500A, and RPR-4190A lamps. In general, photon fluxes for all
experimental conditions were < 4x10⁻⁸ Einstein/s (depending on sample volume). Based on the
used sample volumes and test-tube geometries, our conditions correspond to light intensities of <
40 W.h/m2 for 1 h photo-irradiations at λ = 254 nm and < 25 W.h/m2 for 1 h photo-irradiations at
λmax = 305, 350 and 419 nm§, i.e. < 20% and < 12.5%, respectively, of the minimal intensity (200
W.h/m2) recommended for UV photostability testing by the ICH guideline ICH Q1B.35 A critical
assessment of the ICH Q1B guideline is given in the commentary by Baertschi et al.36 The authors
provide typical UV-A light intensities for indoor lighting with window-filtered daylight at home
and in the clinic (17 W/m2). Our light exposures of < 25 W.h/m2 at λmax = 305, 350 and 419 nm
would correspond to ca. 1-2 h exposure to indoor lighting at home or in the clinic.36
4.2.3. Photo-irradiation of mAbZ formulations containing 0.01% PS80
Aliquots of 500 µl containing the mAbZ formulations containing 0.01% (w/w) were photo-
irradiated for 1 h with 4 lamps using the glassware/lamp type combinations described above. To
separate protein from PS80, the protein was precipitated with 900 µl cold ethanol by incubation
at -20 °C for 1 h. The mAbZ pellet was separated from PS80 by centrifugation for 30 min at
14,000 rpm (16,900g) at 4 °C. The supernatant was recovered and dried in a CentriVap
(Labconco, Kansas City, MO) for 2 h at room temperature. Each dried sample was then dissolved

129
in 100 µl of a 50/50 (v/v) ethanol/water mixture and vortexed to yield a PS80 concentration of
0.01% (w/w) for liquid chromatography-mass spectrometry (LC-MS) analysis. As controls,
aliquots of the mAbZ formulations were wrapped in aluminum foil and subsequently subjected
to the same procedures of sample preparation.
4.2.4. Photo-irradiation of spiked mAbZ formulations containing 0.2% PS80
PS80 was spiked into the mAbZ formulation (see above) to bring the PS80 concentration to 0.2%
(w/w). Aliquots of 200 µl were photo-irradiated at either λ = 254 nm or λmax = 305 nm as described
above for 1 h with 4 lamps, respectively. Precipitation and supernatant drying were performed as
described above. Each dried sample was then dissolved in 1 ml of a 50/50 (v/v) ethanol/water
solution and vortexed to yield a PS80 concentration of 0.02% (w/w) for LC-MS analysis. As
controls, aliquots of the mAbZ formulations were wrapped in aluminum foil and subsequently
subjected to the same procedures of sample preparation.
4.2.5. Photo-irradiation of model peptide formulations containing 0.01% and 0.2% PS80
The combination of Trp and disulfide is the basic entity amenable to light-induced generation of
thiyl radicals according to reactions 1 and 2, and is a suitable model for Trp/disulfide triads26 in
monoclonal antibodies. Stock solutions containing 10 mM GSSG and/or 10 mM NATA were
prepared in 20 or 50 mM NaAc buffer (pH 5.5). An initial stock of 10% (w/w) PS80 in water was
diluted to 0.02% and 0.4% (w/w) in 20 or 50 mM NaAc buffer (pH 5.5), and mixed 1:1 with the
stock solutions containing GSSG, NATA, or both, to bring the final concentration of GSSG and/or
NATA to 5 mM, and PS80 to either 0.01% or 0.2% (w/w). Aliquots of 400 µl were photo-
irradiated at λmax = 305 nm as described above for 1 h with 4 lamps. To ensure comparability,
precipitation and supernatant drying was also performed for model peptide samples as described

130
above. Each dried sample was then dissolved in 100 µl (model peptide formulations with 0.01%
PS80 (w/w)) or 1 ml (model peptide formulations with 0.2% PS80 (w/w)) of a 50/50 (v/v)
ethanol/water solution and vortexed to yield PS80 concentrations of 0.01% and 0.02% (w/w) for
LC-MS analysis, respectively. As dark controls, reaction mixtures were wrapped in aluminum
foil and exposed to 1 h photo-irradiation in the Rayonet reactor. In addition, we confirmed that
the exposure of the reaction mixtures to elevated temperatures (40oC, 2 days) did not result in
cis/trans isomerization.
4.2.6. Photo-irradiation of PS80 in the absence of mAbZ and model peptides
A stock solution of 10% PS80 (w/w) was prepared in water. The PS80 stock solution was diluted
to either 0.01% or 0.2% (w/w) in either 50 or 20 mM NaAc buffer (pH 5.5). Aliquots of 500 µl
were photo-irradiated separately using the glassware / lamp type combinations described above
for 1 h with 4 lamps, respectively. We subsequently subjected these samples to the same
precipitation and drying procedures as described above for the removal of mAbZ from samples
containing PS80. Each dried sample was then dissolved in 100 µl (formulations with 0.01% PS80
(w/w)) or 1 ml (formulations with 0.2% PS80 (w/w)) of a 50/50 (v/v) ethanol/water solution and
vortexed to yield PS80 concentrations of 0.01% and 0.02% (w/w) for LC-MS analysis,
respectively. As dark controls, reaction mixtures were wrapped in aluminum foil and exposed to
1 h photo-irradiation in the Rayonet reactor.
4.2.7. Generation of FFAs from 0.01% and 0.2% PS80 with porcine esterase
FFA generation for analysis from 0.01% (w/w) PS80 solutions required pre-concentration. To
concentrate a sample from 0.01% to approximately 0.05% PS80, 100 µl aliquots from a 500 µl
sample were divided into 5 vials and subjected to precipitation and drying as described above.
131
Then, 100 µl of 10 mM phosphate buffer (pH 7.2) was added to the first of the 5 vials, and
subsequently transferred from one vial to the next to recover PS80. An aliquot of 2 µl of porcine
esterase (10 units; 24 mg esterase/ml; 208 units/mg protein) was added to this concentrated PS80
solution and incubated at 37 °C for 1 h (during 1 h esterase reaction, ca. 27% free oleic acid was
generated, mainly from the hydrolysis of oleic acid monoesters, consistent with earlier data10).
The esterase was precipitated with cold ethanol and the supernatant dried. The dried sample was
dissolved in 50 µl ethanol for LC-MS analysis. The recovery of FFAs was >60%. The dark
control samples were wrapped in aluminum, stored at room temperature and subjected to the same
procedures to obtain FFAs. No pre-concentration step was required for the generation and analysis
of FFAs from 0.2% (w/w) PS80 solutions. They were directly subjected to precipitation and
drying. However, two precipitation methods were compared using either borosilicate glass or
Eppendorf tubes. Interestingly, higher levels of baseline FFA oxidation products were observed
after precipitation in borosilicate glass; therefore, precipitation was conducted in Eppendorf tubes
in order to monitor photo-chemically generated FFA oxidation products.
4.2.8. HPLC-MS analysis of PS80
The PS80 components and their degradants were analyzed by electrospray ionization (ESI) mass
spectrometry on a Waters Q-TOF Premier mass spectrometer (Milford, MA, USA) coupled to a
Waters ACQUITY UPLC system (Milford, MA, USA). The electrospray ionization source was
maintained at 120oC, and the capillary voltage set to 2.8 kV. Data were collected in the MSE mode
(first function) at a mass range of 150-2000 Da. The mass spectrometer was operated in the
positive ion mode with the Masslynx v.4.1 software, and the data were analyzed with the same
software.
132
All analytes were separated on a Prevail™ C18 column (Grace, Deerfield, IL; 150 mm × 2.1 mm,
300 Å pore-size, 3.0 µm particle size). The column temperature was maintained at 40 oC and
either 10 µl of 0.01% (w/w) PS80 or 5 µl of 0.02% (w/w) PS80 (i.e. 1 µg PS80 based on the initial
sample concentration) were injected onto the column and eluted at a flow rate of 0.4 ml/min. Four
mobile phases, A-D, were used to elute PS80 from the column. Mobile phase A contained 2 mM
ammonium formate, and 0.08% formi°acid in water, mobile phase B contained a 7:3 (v/v)
acetonitrile/methanol solution with 0.08% formic acid, mobile phase C consisted of isopropanol,
and mobile phase D contained a 1:9 (v/v) 1,4-dioxane/acetone solution, respectively. Separation
of PS80 components was achieved with the following gradient (all changes linear): initially, the
mobile phase composition was 40% A and 60% B, within 15 min the composition was changed
to 1% A and 99 % B, within the next 5 minthe composition was changed to 1% A, 94% B, and
5% C, within the next 1 min the composition was changed to 1% A, 90% B, and 9% C and held
for 2 min, within the next 1 min the composition was changed to 1% A and 99% D and held for
3 min (wash phase), within the next 1 min the composition was changed back to 40% A and 60%
B and the column was re-equilibrated for 7 min.
4.2.9. HPLC-MS analysis of FFAs
FFAs were analyzed by electrospray ionization mass spectrometry on the same instrument
described above. The column, Masslynx software, and instrument settings remained identical
except that the instrument was operated in the negative ion mode and data were collected in the
MSE mode (first function) at a mass range of 100-2000 Da. 10 µl aliquots were injected onto the
column and eluted at a flow rate of 0.4 ml/min. Three mobile phases, A-C as described above,
were used to elute FFAs from the column. Separation of FFAs was achieved with the following
gradient (all changes linear): initially, the mobile phase composition was 40% A and 60% B,
133
within 1 min the composition was changed to 22% A and 78 % B, within the next 11 min the
composition was changed to 16% A, 80% B, and 4% C, within the next 1 min the composition
was changed to 75% B and 25% C, within the next 2 min the composition was changed to 10%
A, 40% B, and 50%C, within the next 1 min the composition was changed back to 40% A and
60% B, and the column was re-equilibrated for 4 min.
4.2.10. Sample preparation for Raman Fourier transform infrared (FTIR) spectroscopy
Two sets of samples were prepared for Raman and FTIR spectroscopy: (i) 5 mM GSSG, 5 mM
NATA, 0.2% (w/w) PS80 in 20 mM NaAc (pH 5.5); (ii) 147 mg/ml mAbZ formulated with PS80
and NaAc. A dark control and a photo-irradiated sample were produced for each sample
formulation. Aliquots of 3 ml were photo-irradiated at λmax = 305 nm as described above for 1h
with 4 lamps.
PS80 extraction for each sample was performed using a 50/50 (v/v) ethyl acetate/1,4-dioxane
solution (“organic phase”)$: equal volumes of sample and organic phase were mixed by pipetting
and centrifuged at 4500 rpm and 4 °C for 10 min. The organic phase was then collected into a
fresh borosilicate tube and the procedure repeated two more times. The collected organic phases
were dried in a CentriVap for 2 h at room temperature. Each dried sample was dissolved in ethanol
to yield a 50 mg/ml PS80 solution based on initial PS80 concentrations. Reference substances
(oleic acid, elaidic acid, linoleic acid, and the conjugated octadecadienoic acids) were dissolved
or diluted in ethanol to yield final concentrations of 50 mg/ml. Except during photo-irradiation,
all sample and reference solutions were protected from light and kept on ice at all times.
134
4.2.11. Raman and FTIR Spectroscopy
Raman spectra of sample and reference solutions were obtained using a Zetasizer Nano ZS Helix
(Malvern Panalytical, Malvern, United Kingdom) connected to a Kaiser Raman RxN1
spectrometer (Kaiser Optical Systems, Ann Arbor, MI). The spectrometer includes a 785 nm laser
having a maximum power output of 400 mW. For each measurement, 20 replicates of 10 s
exposure intervals were recorded from 100 – 1890 cm-1. The sample cell was set to 25 °C. Raman
spectra were background subtracted, baseline offset corrected, and normalized. Second derivative
spectra were calculated following Savitzky-Golay smoothing with a 13-point 3rd order
polynomial.
FTIR spectra of sample and reference solutions were obtained using a Bruker Tensor 27 FTIR
spectrometer fitted with a Bio-ATR cell (Bruker, Billerica, MA) set to 25 °C. Fir each
measurement, 256 scans were recorded from 800 – 4000 cm-1 at a resolution of 4 cm-1. OPUS 6.5
(Bruker) was used for atmospheric correction and baseline fitting.
4.3. Results
4.3.1. Oleic acid
When we exposed a formulation of 150 mg/mL mAbZ in the presence of 0.01% (w/w) PS80,
NaCl, and NaAc to 1 h photo-irradiation at λmax = 305 nm, some significant changes in PS80
composition were noted by LC-MS analysis (Figure 1A and 1B). In controls (Figure 1A), the
peaks with tR = 11.23 and 12.65 min represent POE sorbitan oleic acid and POE oleic acid,
respectively. Notably, photo-irradiation leads to a change in peak shape for POE sorbitan oleic
acid (Figure 1B; peak I), and a new peak with tR = 12.84 min (Figure 1B; peak IIb), eluting
directly after POE oleic acid (Figure 1B; peak IIa). MS analysis reveals that the new peak with tR
135
= 12.84 min contains a product which is isobaric with POE oleic acid, suggesting the generation
of isomers. None of these changes appear when 0.01% (w/w) PS80 in either 20 mM or 50 mM
NaAc (pH 5.5) is photo-irradiated in the absence of mAbZ (not shown). Figure 2 compares the
LC-MS peaks representatively for the extracted signal of m/z 828.60 (z = +1, [M+NH4] of a
control formulation (Figure 2A) and a formulation photo-irradiated for 1 h at λ = 254nm (Figure
2B) and λmax = 305 nm (Figure 2C) to further illustrate the formation of such isobaric species.
Here, m/z 828.60 represents a POE oleic acid containing 12 ethylene oxide (EO) units, POE (12)
oleic acid. Analogous analyses were made for POE oleic acid components; these contain between
6 and 22 EO units and make up the envelope of all POE oleic acid species present in the peaks
eluting with tR = 12.56 and 12.84 min. The isobaric species with m/z 828.60 forms during photo-
irradiation for 1h at either λ = 254 nm and λmax = 305 nm, but not λmax = 350 nm (Figure 2D).
However, during longer photo-irradiation times (up to 8 h; equivalent to < 200 W.h/m2) at λmax =
350 nm, the isobaric species with m/z 828.60 is generated (Figure S1), indicating that near UV
light is able to trigger the reactions leading to the formation of the isobaric species. In contrast,
visible light photo-irradiation at λmax = 419 nm for up to 12 h did not generate significant yields
of the isobaric reaction product. A similar analysis was also made for POE sorbitan oleic acid
components, were photo-irradiation at λmax = 305 nm resulted in the generation of isobaric
species. This is shown representatively for POE (26) sorbitan oleic acid in Figure S2, where the
signal of m/z 804.56 (z = +2, [M+2NH4]) revealed a shoulder after photo-irradiation.
The formation of a reaction product isobaric with POE oleic acid suggests that oleic acid may
undergo cis/trans isomerization to elaidic acid. In order to evaluate this possibility, we subjected
reaction mixtures to porcine esterase to liberate FFAs. Figure 3 compares formulations containing
no (panel A) or 150 mg/ml mAbZ (panel B), after esterase treatment following 1h photo-
136
irradiation at λmax = 305 nm. Clearly, elaidic acid is generated during photo-irradiation only in
the presence of mAbZ, confirmed by spiking (0.01 mg/mL) with an authentic standard of elaidic
acid (Figure S3).
The conversion of oleic into elaidic acid is likely caused by intermediary thiyl radicals, which can
be generated by photo-induced electron transfer from Trp to protein disulfide bonds22. In fact,
mAbs contain Cys-Cys-Trp triads, which are exquisitely sensitive to photo-degradation26. Further
experimental support for a role of photo-induced electron transfer from Trp to disulfides in the
formation of elaidic acid was, therefore, acquired in a model system where final concentrations
of 5 mM NATA and 5 mM GSSG were added to 0.01% (w/w) PS80 in 20 mM NaAc (pH 5.5).
Photo-irradiation of this reaction mixture for 1h at λmax = 305 nm resulted in the generation of
elaidic acid (Figure 3, panels C and D) when both GSSG and NATA were present but not in
absence of either NATA or GSSG (Figure S4). Hence, thiyl radicals generated by the
NATA/GSSG model system were able to induce cis/trans isomerization of oleic acid. This was
confirmed by positive ion mode ESI-LC-MS showing the formation of isobaric products, e.g.
representatively of POE (12) oleic acid. No isobaric species of POE (12) oleic acid was formed
in the absence of either NATA or GSSG (Figure S5). Quantitation of the extent of cis/trans
isomerization was achieved by two ways. First, POE oleic acid is reasonably well resolved from
POE elaidic acid during HPLC-MS analysis, which allows for quantitation of ca. 70% POE oleic
acid and 30 % POE elaidic acid after 1h photo-irradiation (with λmax = 305 nm) of PS80
formulations containing mAbZ. POE sorbitan oleic acid and POE isosorbide oleic acid are less
well resolved from their elaidic acid isomers, so that direct quantitation of cis/trans isomerization
for these species by HPLC-MS analysis could not be achieved. However, the relative contents of
oleic and elaidic acid were quantified by HPLC-MS analysis after esterase hydrolysis, revealing

137
ca. 90% oleic acid and 10% elaidic acid after 1h photo-irradiation (with λmax = 305 nm) of PS80
formulations containing mAbZ. These data suggest that POE oleic acid is somehow more
sensitive to cis/trans isomerization compared to POE sorbitan oleic acid and POE isosorbide oleic
acid.
4.3.2. Linoleic acid
PS80 contains a significant fraction of linoleic acid, specified as < 18% by the European, the US,
and the Japanese Pharmacopoeia3. While this content of <18% is lower compared to that of oleic
acid (≥58%), the higher reactivity of linoleic acid as well as all polyunsaturated FAs towards
oxidizing radicals37 makes linoleic acid a prominent target for oxidative degradation. With two
isolated double bonds, separated by a bisallylic methylene group, linoleic acid is also a bona fide
target for radical-induced isomerization16. By mass spectrometry analysis of marker ions for oleic
and linoleic acid, we quantified the content of oleic acid as 75.1% in PS80 obtained directly from
J.T.Baker (see Materials) and 64.6% in PS80 present in the MedImmune formulation of mAbZ.
The content of linoleic acid was 14.4% in PS80 directly obtained from J.T. Baker and 7.3%, in
PS80 present in the MedImmune formulation of mAbZ.
The photo-irradiation (1 h at λmax = 305 nm) of a formulation containing 150 mg/mL mAbZ,
0.01% (w/w) PS80, NaCl and NaAc generated isobaric species from linoleic acid. This is shown
in Figure 4, where peaks IIa and IIb, contain isobaric species, representing POE sorbitan linoleic
acid with 26 EO units, POE (26) sorbitan linoleate (m/z 803.56, z = +2, [M+2NH4]). Similar
observations were made for POE (20-32) sorbitan linoleate. In Figure 4, peak V elutes closer to
the diester species and represents most likely POE (20) sorbitan oleate/linoleate or POE (21)
isosorbide palmitate/linoleate (peaks I, II, and IV do not represent monoisotopic masses).
138
This is confirmed by the analysis of FFAs, shown in Figure 5A, where photo-irradiation of the
formulation containing 150 mg/mL mAbZ resulted in a change of the relative intensities of three
isobaric peaks with m/z 279.22 (z = -1, [M-H]), representing linoleic acid and isomers of linoleic
acid. Additional experiments were performed with 0.2% (w/w) of PS80, in order to increase the
sensitivity of our analysis and relate our LC-MS data to Raman and FTIR spectroscopy (vide
infra) which required higher PS80 concentrations. For these experiments, we purchased PS80 and
spiked it into the original mAbZ formulation obtained from MedImmune. Figure 5B‡ compares
non-irradiated controls with photo-irradiated (1 h at either λ = 254 nm or λmax = 305 nm)
formulations after esterase digestion of the reaction mixtures. Again, extraction of the signal with
m/z 279.22 (z = -1, [M-H]) resulted in three isobaric species, similar to the data in Figure 5A#.
Specifically, photo-irradiation with λmax = 305 nm revealed an increased intensity of peaks eluting
with tR = 8.44 min and tR = 9.66 min. Spiking with authentic standards (0.01 mg/mL) of (9Z,
12Z)-octadeca-9,12-dienoic acid (linoleic acid), and conjugated linoleic acids (CLA), specifically
(9Z, 11E)-octadeca-9,11-dienoic acid (rumenic acid), (9E, 11E)-octadeca-9,11-dienoic acid, and
(10E, 12Z)-octadeca-10,12-dienoic acid, was performed to get a general idea on the elution times
of geometric isomers of linoleic acid. To our surprise, linoleic acid ((9Z, 12Z)-octadeca-9,12-
dienoic acid; tR = 8.44 min) clearly represented only a minor component in the PS80 we purchased
to spike into the MedImmune formulations. Instead a peak eluting with tR = 8.78 min, co-eluting
with (9Z, 11E)-octadeca-9,11-dienoic acid (rumenic acid) and (10E, 12Z)-octadeca-10,12-
dienoic acid, represented the major component of PS80. Both, (9Z, 11E)-octadeca-9,11-dienoic
acid (rumenic acid) and (10E, 12Z)-octadeca-10,12-dienoic acid can be generated from (9Z, 12Z)-
octadeca-9,12-dienoic acid (linoleic acid) by hydrogen abstraction from the bisallylic methylene
group, generating an intermediary carbon-centered radical at C-11. The latter usually converts
139
into carbon-centered radicals at C-13 or C-9, hydrogen addition to which would yield (9Z, 11E)-
octadeca-9,11-dienoic acid (rumenic acid) and (10E, 12Z)-octadeca-10,12-dienoic acid,
respectively (we note, that oxygen addition would yield peroxyl radicals and hydroperoxides,
generating oxidation products; see below). Photo-irradiation with both λ = 254 nm and λmax =
305 nm resulted in a slight increase of the peak representing linoleic acid but in significant growth
of a peak with tR = 9.66 min, co-eluting with (9E, 11E)-octadeca-9,11-dienoic acid. A quantitative
comparison of the changes of relative peak areas of the respective FA isomers during photo-
irradiation at λmax = 305 nm is shown in Figure 6. Noteworthy, in formulations containing 0.2%
PS80 small changes are even observed during photo-irradiation in the absence of mAbZ; however,
a significantly higher conversion of cis/trans or trans/cis conjugated FAs into trans/trans
conjugated FAs is observed in the presence of mAbZ.
4.3.3. Oxidation products
The light exposure of formulations containing 150 mg/ml mAbZ, 0.01% (w/w) PS80, NaCl and
NaAc, leads not only to cis/trans isomerization but also to the formation of oxidation products.
Figure 7 shows data (m/z 313.24 (281.24+32); z = -1, [M-H]) representative for oleic acid with
an addition of +32 atomic mass units (amu), consistent with hydroperoxide formation, and
observed during FFA analysis after photo-irradiation and esterase hydrolysis of PS80. Figure 7A
displays a baseline level of the signal with m/z 313.24 even in control PS80, where at least three
isobaric components can be distinguished, eluting with tR = 2.74, 3.08 and 3.12 min. Considering
that radical processes can theoretically introduce hydroperoxide groups at positions C-8, C-9, C-
10, and C-11, the chromatographic resolution of isobaric hydroperoxide products is expected. The
photo-irradiation of the formulations at λ = 254 nm, λmax = 305 nm, and λmax = 350 nm revealed
140
a pronounced increase in the intensities of the isobaric signals with m/z 313.24, and thus is
consistent with the photo-induced generation of radicals from oleic acid followed by the
formation of hydroperoxides.
4.3.4. The model system containing PS80, GSSG, and NATA
Reactions 1 and 2 provide a facile mechanism for the generation of mAbZ thiyl radicals which
can then induce the cis/trans isomerization and/or oxidation of unsaturated fatty acids. In order to
further confirm the feasibility of this mechanism, a formulation containing 0.01% (w/w) PS80, 5
mM GSSG, and 5 mM NATA in either 20 mM or 50 mM NaAc buffer (pH 5.5), was photo-
irradiated for 1 h at λmax = 305 nm. Under these conditions, we observed the conversion of oleic
acid into elaidic acid (Figures 3C, 3D, and S2; see above) analogous to our results in the presence
of mAbZ (Figures 3A and 3B). Furthermore, a significant loss of the signal representing (9Z,
11E)-octadeca-9,11-dienoic acid (rumenic acid) and (10E, 12Z)-octadeca-10,12-dienoic acid was
only in part accounted for by an increase in the signal for (9E, 11E)-octadeca-9,11-dienoic acid
(Figure 8A and B). These unaccounted products are likely oxidation products. Consistent with
this expectation, the photo-irradiation of 0.01% (w/w) PS80, 5 mM GSSG, and 5 mM NATA in
20 mM NaAc buffer (pH 5.5) for 1 h at λmax = 305 nm yielded significant quantities of several
oxidation products isobaric with linoleic acid +16 amu (Figure 8C) and a product isobaric with
linoleic acid +32 amu, likely linoleic acid hydroperoxide (Figure 8D).
4.3.5. Raman and FTIR Spectroscopy
Second derivative Raman spectra of FFA reference solutions are displayed in Figure 9A. In
general, due to the conjugated dienes, CLAs showed significantly stronger Raman scattering than
FAs containing isolated cis or trans bonds. (9E, 11E)-octadeca-9,11-dienoic acid revealed a peak

141
at 1659.5 cm-1 while (9Z, 11E)-octadeca-9,11-dienoic acid and (10E, 12Z)-octadeca-10,12-
dienoic acid both revealed a peak at 1653.0 cm-1. Linoleic, oleic, and elaidic acids showed broad
peaks at 1658.0 cm-1, 1655.0 cm-1, and 1669.0 cm-1, respectively.
Second derivative Raman spectra of solutions containing either individual formulation
components or complete formulations (control and photo-irradiated) are displayed in in Figure
9B. All non-irradiated solutions (controls) containing PS80 showed a peak at 1653.5 cm-1. This
peak clearly indicated the presence of (9Z, 11E)-octadeca-9,11-dienoic acid and/or (10E, 12Z)-
octadeca-10,12-dienoic acid; the shift to a slightly higher wavenumber with respect to the FFA
reference solutions is possibly related to the presence of oleic and linoleic acid. Photo-irradiation
of PS80 in presence GSSG and NATA or in presence of mAbZ had a strong effect on the FA
composition. In both cases, a relative reduction of the peak intensity for (9Z, 11E)-octadeca-9,11-
dienoic acid and/or (10E, 12Z)-octadeca-10,12-dienoic acid and a relative increase of peak
intensity for (9E, 11E)-octadeca-9,11-dienoic acid was observed. In contrast, photo-irradiation of
PS80 alone resulted only in a minor loss of peak intensity at 1653.5 cm-1 and no additional peaks
were observed. The peak at ~1620 cm-1 was attributed to the presence of NATA. Raman
spectroscopy was found advantageous when analyzing CLAs in PS80 because the POE segment
of a polysorbate molecule, which can be represented by PEG, displays no spectral features in the
range from 1700 cm-1 to 1600 cm-1 (Figure 10C). No difference between a freshly prepared 5%
PS80 (Figure 9C) solution in ethanol and the processed PS80 control (Figure 9B) was observed.
FTIR spectra of FFA reference solutions are displayed in Figure 10A. (9E, 11E)-octadeca-9,11-
dienoic acid showed a peak at 988 cm-1 and elaidic acid, containing an isolated trans double bond,
showed a peak at 968 cm-1. (9Z, 11E)-octadeca-9,11-dienoic acid (rumenic acid) and (10E, 12Z)-
octadeca-10,12-dienoic acid both revealed two peaks at ~984 cm-1 and ~948 cm-1. Linoleic acid
142
((9Z, 12Z)-octadeca-9,12-dienoic acid) showed a broad peak at ~913 cm-1, while no characteristic
peak was identified for oleic acid. These reference spectra are in good agreement with earlier
reports38. FTIR spectra of solutions containing either individual formulation components or
complete formulations (control and photo-irradiated) are displayed in Figure 10B. All solutions,
except the ones prepared from buffer solutions in the absence of PS80, revealed peaks at ~986
cm-1, ~950 cm-1, and ~915 cm-1. The peaks at ~986 cm-1 and ~950 cm-1 indicated a mixture of
CLAs: The peak at ~986 cm-1 is located in between the reference peaks for (9E, 11E)-octadeca-
9,11-dienoic acid, and (9Z, 11E)-octadeca-9,11-dienoic acid and (10E, 12Z)-octadeca-10,12-
dienoic acid (984cm-1). The peak at ~950 cm-1 indicated the presence of (9Z, 11E)-octadeca-9,11-
dienoic acid and (10E, 12Z)-octadeca-10,12-dienoic acid. The peak at ~915 cm-1 indicated the
presence of linoleic acid. However, the use of FTIR to assess PS80 has several limitations not
encountered when using Raman spectroscopy as described above. First, FTIR assessment of a 5%
solution of PS80 in ethanol showed very similar spectral features when compared to a saturated
solution of PEG, representing the POE segment of PS80 (Figure 10C). The spectral features of
the fatty acids are only observed after PS80 extraction, drying, and dissolution of the dried sample.
One possible explanation is the limited solubility of PEG in ethanol when compared to PS80,
meaning that extracted PS80 but not free POE readily dissolves after drying. In addition, the
overlapping signals of the CLAs as well as signals from NATA and linoleic acid complicate a
definite assignment beyond the statement that various CLA species are present.
4.4. Discussion
The oxidative degradation of polysorbate is a well-known phenomenon, usually attributed to
oxidation processes induced by transition metal catalysis, reactive oxygen species, and/or light
exposure1-4. In general, pharmaceutical formulators are concerned with the consequences of
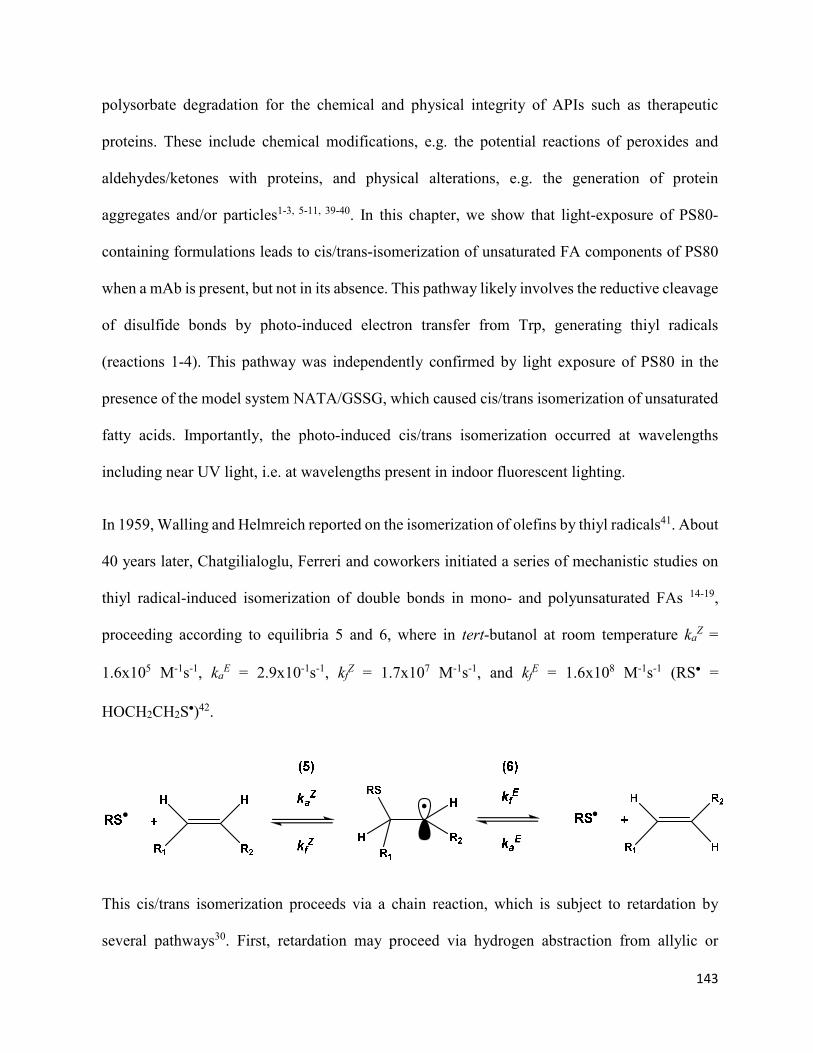
143
polysorbate degradation for the chemical and physical integrity of APIs such as therapeutic
proteins. These include chemical modifications, e.g. the potential reactions of peroxides and
aldehydes/ketones with proteins, and physical alterations, e.g. the generation of protein
aggregates and/or particles1-3, 5-11, 39-40. In this chapter, we show that light-exposure of PS80-
containing formulations leads to cis/trans-isomerization of unsaturated FA components of PS80
when a mAb is present, but not in its absence. This pathway likely involves the reductive cleavage
of disulfide bonds by photo-induced electron transfer from Trp, generating thiyl radicals
(reactions 1-4). This pathway was independently confirmed by light exposure of PS80 in the
presence of the model system NATA/GSSG, which caused cis/trans isomerization of unsaturated
fatty acids. Importantly, the photo-induced cis/trans isomerization occurred at wavelengths
including near UV light, i.e. at wavelengths present in indoor fluorescent lighting.
In 1959, Walling and Helmreich reported on the isomerization of olefins by thiyl radicals41. About
40 years later, Chatgilialoglu, Ferreri and coworkers initiated a series of mechanistic studies on
thiyl radical-induced isomerization of double bonds in mono- and polyunsaturated FAs 14-19,
proceeding according to equilibria 5 and 6, where in tert-butanol at room temperature kaZ =
1.6x10⁵ M-1s-1, kaE = 2.9x10⁻¹s-1, kf
Z = 1.7x10⁷ M-1s-1, and kfE = 1.6x10⁸ M-1s-1 (RS• =
HOCH2CH2S•)42.
This cis/trans isomerization proceeds via a chain reaction, which is subject to retardation by
several pathways30. First, retardation may proceed via hydrogen abstraction from allylic or
144
bisallylic methylene groups such as present in mono- and polyunsaturated FAs. Such reactions
lead to intermediary carbon-centered radicals, which, in the presence of oxygen, will convert into
peroxyl radicals and ultimately FA hydroperoxides. Figure 7 shows representative data for the
formation of oleic acid-derived products, which are +32 amu higher in mass, consistent with the
formation of oleic acid hydroperoxides from PS80. Second, retardation can be achieved by the
reaction of thiyl radicals with conjugated double bonds, such as shown by Graham et al. 43 for the
cis /trans isomerization of 2-butene in the presence of 1,3-butadiene. The latter observation is
relevant for our formulations, as our analysis of FFAs (Figures 5 and 6) shows that PS80 can
contain significant amounts of FAs with conjugated double bonds such as e.g. (9Z, 11E)-
octadeca-9,11-dienoic acid (rumenic acid) and/or (10E, 12Z)-octadeca-10,12-dienoic acid. This
observation, also confirmed by Raman spectroscopy, is consistent with earlier NMR data
presented by Hvattum et al.44, which suggested that the majority of the C18:2 fatty acids in PS80
contain conjugated double bonds. Photo-irradiation of formulations containing 150 mg/mL mAbZ
together with PS80, NaCl and NaAc generated a product co-eluting with (9E, 11E)-octadeca-
9,11-dienoic acid (Figure 5), and it would be feasible to assume that thiyl radicals could convert
(9Z, 11E)-octadeca-9,11-dienoic acid (rumenic acid) into (9E, 11E)-octadeca-9,11-dienoic acid.
We note that different batches of PS80 can contain different amounts of linoleic acid and
conjugated linoleic acids, as we observed when comparing PS80 obtained from J.T. Baker and
PS80 present in the formulations containing mAbZ. We do not know to what extent these
differences are caused by batch-to-batch variability or aging of PS80.
The presence of fatty acids with conjugated double bonds has likely an inhibitory effect30 on the
cis/trans isomerization reactions induced by light exposure of mAbZ and NATA/GSSG under our
experimental conditions. However, in general fatty acids with conjugated double bonds are

145
expected to be rather sensitive to oxidation. Kitaguchi et al. reported a linear relationship of rate
constants for hydrogen abstraction by peroxyl radicals from polyunsaturated fatty acids
depending on the number of bisallylic methylene groups45. Hydrogen abstraction from the
bisallylic methylene groups leads to the formation of pentadienyl radicals. Linoleic acid contains
two non-conjugated double bonds and one bisallylic methylene group. However, CLAs contain
methylene groups on each site of the conjugated double bond system, where hydrogen abstraction
would lead to the generation of pentadienyl radicals. Consequently, we expect that CLAs exhibit
oxidation sensitivities comparable to that of linolenic acid, a highly oxidation-sensitive
polyunsaturated fatty acid. Hence, despite their potential to retard cis/trans isomerization
reactions, CLAs represent prominent targets for radical formation, and origins for oxidation
reactions.
The potential for radical-induced cis/trans isomerization of mono- and polyunsaturated fatty acids
in PS80 is significant for the following reasons. First, the appearance of trans-FAs in
formulations, either in polysorbate esters or FFAs, may serve as a probe for the intermediary
generation of free radicals during manufacturing and/or storage. Second, the chemical and
physical properties of PS80 may change following the formation of trans-FAs. This is concluded
from a series of studies focusing on FFAs, but also focusing on lipids, synthetic model surfactants,
or FAs physically incorporated into micelles or inverted micelles, as outlined in the following.
For example, the critical micelle concentration (cmc) of sodium elaidate (2.5x10⁻³ M) is slightly
below that of sodium oleate (2.7x10⁻³ M), consistent with a greater tendency for association of
elaidic acid as compared to oleic acid, measured in non-polar solvents46. When the physical
properties of elaidyltrimethyl ammonium chloride and oleyltrimethyl ammonium chloride
surfactants were examined, the presence of a trans vs. cis double bond in these synthetic
146
surfactants led to differences in drag-reduction, micellar structure, and shear viscosities47.
Likewise, differential scanning calorimetry experiments of lipids show that the cis/trans
isomerization of 1-palmitoyl-2-oleyl L-α-phosphatidylcholine (POPC) to 1-palmitoyl-2-elaidyl
L-α-phosphatidylcholine (PEPC) changes the phase transition temperature48. The incorporation
of increasing concentrations of elaidic acid into inverted micelles generated from monoolein-oleic
acid reduces the sphericity of these micelles49. Lennox and McClelland studied the chemical
bromination of elaidic and oleic acid50. They reported that physical incorporation into micelles
significantly changed the relative reactivities of the cis and trans double bonds as compared to
bromination in homogenous solution50.
In conclusion, the light-exposure of a PS80-containing formulation containing a monoclonal
antibody resulted in the cis/trans isomerization of unsaturated fatty acids (oleic acid, linoleic and
conjugated linoleic acids). The presence of trans fatty acids may modulate the physico-chemical
properties of PS80 micelles. In addition, the presence of trans fatty acids may serve as a probe for
free radical formation and reactions within formulations. It will be interesting to evaluate whether
free trans fatty acids behave similar or different compared to free cis fatty acids in the formation
of particles.
147
4.5. Footnotes
§ For photo-irradiations at λmax = 305, 350 and 419 nm, light intensities were integrated over the
entire emission spectra of the respective lamps, which are available from The Southern New
England Ultraviolet Company.
$We compared extraction by ethanol, acetonitrile and ethyl acetate/1,4-dioxane (50/50, v/v), and
found no significant differences in extraction efficiency.
‡We observed that over the lifetime of the column, absolute retention times of the components
were subject to shift, while the relative elution order remained constant. This is the reason for the
different retention times in Figures 6A and 6B.
#We note that PS80 (J.T. Baker) originally present in the MedImmune formulation, and PS80
(J.T. Baker), which we purchased later and spiked into the MedImmune formulation appear to
vary in the relative content of the three isobaric species prior to photo-irradiation. At this point,
we do not know whether this is due to batch-to-batch variability or due to the age of the
MedImmune formulations.

148
4.6. References
1. Kerwin, B. A., Polysorbates 20 and 80 used in the formulation of protein biotherapeutics:
structure and degradation pathways. J. Pharm. Sci. 2008, 97 (8), 2924-35.
2. Jones, M. T.; Mahler, H. C.; Yadav, S.; Bindra, D.; Corvari, V.; Fesinmeyer, R. M.; Gupta,
K.; Harmon, A. M.; Hinds, K. D.; Koulov, A.; Liu, W.; Maloney, K.; Wang, J.; Yeh, P. Y.;
Singh, S. K., Considerations for the Use of Polysorbates in Biopharmaceuticals. Pharm Res-
Dordr 2018, 35 (8).
3. Dwivedi, M.; Blech, M.; Presser, I.; Garidel, P., Polysorbate degradation in biotherapeutic
formulations: Identification and discussion of current root causes. Int J Pharmaceut 2018, 552
(1-2), 422-436.
4. Singh, S. R.; Zhang, J.; O'Dell, C.; Hsieh, M. C.; Goldstein, J.; Liu, J.; Srivastava, A., Effect
of polysorbate 80 quality on photostability of a monoclonal antibody. AAPS Pharm.Sci.Tech.
2012, 13 (2), 422-30.
5. Ha, E.; Wang, W.; Wang, Y. J., Peroxide formation in polysorbate 80 and protein stability. J
Pharm Sci-Us 2002, 91 (10), 2252-2264.
6. Lam, X. M.; Lai, W. G.; Chan, E. K.; Ling, V.; Hsu, C. C., Site-Specific Tryptophan
Oxidation Induced by Autocatalytic Reaction of Polysorbate 20 in Protein Formulation.
Pharm Res-Dordr 2011, 28 (10), 2543-2555.
7. Kishore, R. S. K.; Kiese, S.; Fischer, S.; Pappenberger, A.; Grauschopf, U.; Mahler, H. C.,
The Degradation of Polysorbates 20 and 80 and its Potential Impact on the Stability of
Biotherapeutics. Pharm Res-Dordr 2011, 28 (5), 1194-1210.
8. Kishore, R. S. K.; Pappenberger, A.; Dauphin, I. B.; Ross, A.; Buergi, B.; Staempfli, A.;
Mahler, H. C., Degradation of Polysorbates 20 and 80: Studies on Thermal Autoxidation and
Hydrolysis. J Pharm Sci-Us 2011, 100 (2), 721-731.
9. LaBrenz, S. R., Ester Hydrolysis of Polysorbate 80 in mAb Drug Product: Evidence in
Support of the Hypothesized Risk After the Observation of Visible Particulate in mAb
Formulations. J Pharm Sci-Us 2014, 103 (8), 2268-2277.
10. McShan, A. C.; Kei, P.; Ji, J. A.; Kim, D. C.; Wang, Y. J., Hydrolysis of Polysorbate 20 and
80 by a Range of Carboxylester Hydrolases. PDA J Pharm Sci Technol 2016, 70 (4), 332-45.
11. Dixit, N.; Salamat-Miller, N.; Salinas, P. A.; Taylor, K. D.; Basu, S. K., Residual Host Cell
Protein Promotes Polysorbate 20 Degradation in a Sulfatase Drug Product Leading to Free
Fatty Acid Particles. J Pharm Sci-Us 2016, 105 (5), 1657-1666.
12. Hall, T.; Sandefur, S. L.; Frye, C. C.; Tuley, T. L.; Huang, L. H., Polysorbates 20 and 80
Degradation by Group XV Lysosomal Phospholipase A(2) Isomer X1 in Monoclonal
Antibody Formulations. J Pharm Sci-Us 2016, 105 (5), 1633-1642.
13. Zhang, L.; Yadav, S.; Demeule, B.; Wang, Y. J.; Mozziconacci, O.; Schöneich, C.,
Degradation Mechanisms of Polysorbate 20 Differentiated by 18O-labeling and Mass
Spectrometry. Pharm Res 2017, 34 (1), 84-100.
149
14. Chatgilialoglu, C.; Ferreri, C.; Ballestri, M.; Mulazzani, Q. G.; Landi, L., cis-trans
isomerization of monounsaturated fatty acid residues in phospholipids by thiyl radicals. J Am
Chem Soc 2000, 122 (19), 4593-4601.
15. Chatgilialoglu, C.; Ferreri, C.; Guerra, M.; Samadi, A.; Bowry, V. W., The Reaction of Thiyl
Radical with Methyl Linoleate: Completing the Picture. J Am Chem Soc 2017, 139 (13), 4704-
4714.
16. Chatgilialoglu, C.; Ferreri, C.; Melchiorre, M.; Sansone, A.; Torreggiani, A., Lipid
Geometrical Isomerism: From Chemistry to Biology and Diagnostics. Chem Rev 2014, 114
(1), 255-284.
17. Ferreri, C.; Costantino, C.; Landi, L.; Mulazzani, Q. G.; Chatgilialoglu, C., The thiyl radical-
mediated isomerization of cis-monounsaturated fatty acid residues in phospholipids: a novel
path of membrane damage? Chem Commun 1999, (5), 407-408.
18. Lykakis, I. N.; Ferreri, C.; Chatgilialoglu, C., The sulfhydryl radical (HS center dot/S center
dot-): A contender for the isomerization of double bonds in membrane lipids. Angew Chem
Int Edit 2007, 46 (11), 1914-1916.
19. Mihaljevic, B.; Tartaro, I.; Ferreri, C.; Chatgilialoglu, C., Linoleic acid peroxidation vs.
isomerization: a biomimetic model of free radical reactivity in the presence of thiols. Org
Biomol Chem 2011, 9 (9), 3541-3548.
20. Mozziconacci, O.; Kerwin, B. A.; Schöneich, C., Exposure of a monoclonal antibody, IgG1,
to UV-light leads to protein dithiohemiacetal and thioether cross-links: a role for thiyl
radicals? Chem Res Toxicol 2010, 23 (8), 1310-1312.
21. Mozziconacci, O.; Williams, T. D.; Kerwin, B. A.; Schöneich, C., Reversible intramolecular
hydrogen transfer between protein cysteine thiyl radicals and alpha C-H bonds in insulin:
control of selectivity by secondary structure. J Phys Chem B 2008, 112 (49), 15921-32.
22. Vanhooren, A.; Devreese, B.; Vanhee, K.; Van Beeumen, J.; Hanssens, I. A., Photoexcitation
of tryptophan groups induces reduction of two disulfide bonds in goat alpha-lactalbumin.
Biochemistry-Us 2002, 41 (36), 11035-11043.
23. Creed, D., The Photophysics and Photochemistry of the near-Uv Absorbing Amino-Acids .1.
Tryptophan and Its Simple Derivatives. Photochem Photobiol 1984, 39 (4), 537-562.
24. Truong, T. B., Charge-Transfer to a Solvent State .5. Effect of Solute-Solvent Interaction on
the Ionization-Potential of the Solute - Mechanism for Photo-Ionization. J Phys Chem-Us
1980, 84 (9), 964-970.
25. Mossoba, M. M.; Makino, K.; Riesz, P., Photo-Ionization of Aromatic-Amino-Acids in
Aqueous-Solutions - a Spin-Trapping and Electron-Spin Resonance Study. J Phys Chem-Us
1982, 86 (17), 3478-3483.
26. Wecksler, A. T.; Yin, J.; Tao, P. L.; Kabakoff, B.; Sreedhara, A.; Deperalta, G.,
Photodisruption of the Structurally Conserved Cys-Cys-Trp Triads Leads to Reduction-
Resistant Scrambled Intrachain Disulfides in an IgG1 Monoclonal Antibody. Mol Pharmaceut
2018, 15 (4), 1598-1606.
150
27. Bane, J.; Mozziconacci, O.; Yi, L.; Wang, Y. J.; Sreedhara, A.; Schöneich, C., Photo-
oxidation of IgG1 and Model Peptides: Detection and Analysis of Triply Oxidized His and
Trp Side Chain Cleavage Products. Pharm Res-Dordr 2017, 34 (1), 229-242.
28. Haywood, J.; Mozziconacci, O.; Allegre, K. M.; Kerwin, B. A.; Schöneich, C., Light-induced
conversion of Trp to Gly and Gly hydroperoxide in IgG1. Mol Pharm 2013, 10 (3), 1146-50.
29. Nauser, T.; Koppenol, W. H.; Schöneich, C., Reversible Hydrogen Transfer Reactions in
Thiyl Radicals From Cysteine and Related Molecules: Absolute Kinetics and Equilibrium
Constants Determined by Pulse Radiolysis. J Phys Chem B 2012, 116 (18), 5329-5341.
30. Chatgilialoglu, C.; Bowry, V. W., Why Not Trans? Inhibited Radical isomerization Cycles
and Coupling Chains of Lipids and Alkenes with Alkane-thiols. J Org Chem 2018, 83 (16),
9178-9189.
31. Rahn, R. O., Potassium iodide as a chemical actinometer for 254 nm radiation: Use of iodate
as an electron scavenger (vol. 66, pg. 450, 1997). Photochem Photobiol 1997, 66 (6), 885-
885.
32. Hatchard, C. G.; Parker, C. A., A New Sensitive Chemical Actinometer .2. Potassium
Ferrioxalate as a Standard Chemical Actinometer. Proc R Soc Lon Ser-A 1956, 235 (1203),
518-536.
33. Lee, J.; Seliger, H. H., Quantum Yield of Ferrioxalate Actinometer. J Chem Phys 1964, 40
(2), 519-&.
34. Pozdnyakov, I. P.; Kel, O. V.; Plyusnin, V. F.; Grivin, V. P.; Bazhin, N. M., New insight into
photochemistry of ferrioxalate. J Phys Chem A 2008, 112 (36), 8316-8322.
35. Photostability testing of new drug substances and products. Fed Reg 1997, 62, 27115-27122.
36. Baertschi, S. W.; Alsante, K. M.; Tonnesen, H. H., A Critical Assessment of the ICH
Guideline on Photostability Testing of New Drug Substances and Products (Q1B):
Recommendation for Revision. J Pharm Sci-Us 2010, 99 (7), 2934-2940.
37. Yao, J.; Dokuru, D. K.; Noestheden, M.; Park, S. S.; Kerwin, B. A.; Jona, J.; Ostovic, D.;
Reid, D. L., A Quantitative Kinetic Study of Polysorbate Autoxidation: The Role of
Unsaturated Fatty Acid Ester Substituents. Pharm Res-Dordr 2009, 26 (10), 2303-2313.
38. Jackson, J. E.; Paschke, R. F.; Tolberg, W.; Boyd, H. M.; Wheeler, D. H., Isomers of Linoleic
Acid - Infrared and Ultraviolet Properties of Methyl Esters. J Am Oil Chem Soc 1952, 29 (6),
229-234.
39. Tomlinson, A.; Demeule, B.; Lin, B. W.; Yadav, S., Polysorbate 20 Degradation in
Biopharmaceutical Formulations: Quantification of Free Fatty Acids, Characterization of
Particulates, and Insights into the Degradation Mechanism. Mol Pharmaceut 2015, 12 (11),
3805-3815.
40. Dahotre, S.; Tomlinson, A.; Lin, B. W.; Yadav, S., Novel markers to track oxidative
polysorbate degradation in pharmaceutical formulations. J Pharmaceut Biomed 2018, 157,
201-207.
41. Walling, C.; Helmreich, W., Reactivity and Reversibility in the Reaction of Thiyl Radicals
with Olefins. J Am Chem Soc 1959, 81 (5), 1144-1148.
151
42. Chatgilialoglu, C.; Samadi, A.; Guerra, M.; Fischer, H., The kinetics of Z/E isomerization of
methyl oleate catalyzed by photogenerated thiyl radicals. Chemphyschem 2005, 6 (2), 286-
291.
43. Graham, D. M.; Mieville, R. L.; Sivertz, C., Photo-Initiated Reactions of Thiols and Olefins
.I. Thiyl Radical Catalyzed Isomerization of Butene-2 and 1,2-Ethylene-D2. Can J Chem
1964, 42 (10), 2239-&.
44. Hvattum, E.; Yip, W. L.; Grace, D.; Dyrstad, K., Characterization of polysorbate 80 with
liquid chromatography mass spectrometry and nuclear magnetic resonance spectroscopy:
Specific determination of oxidation products of thermally oxidized polysorbate 80. J
Pharmaceut Biomed 2012, 62, 7-16.
45. Kitaguchi, H.; Ohkubo, K.; Ogo, S.; Fukuzumi, S., Additivity rule holds in the hydrogen
transfer reactivity of unsaturated fatty acids with a peroxyl radical: mechanistic insight into
lipoxygenase. Chem Commun 2006, (9), 979-981.
46. Tamamushi, B.; Shirai, M.; Tamaki, K., A Study on the Micellar Solutions of Sodium Oleate
and Elaidate. B Chem Soc Jpn 1958, 31 (4), 467-472.
47. Qi, Y. Y.; Kesselman, E.; Hart, D. J.; Talmon, Y.; Mateo, A.; Zakin, J. L., Comparison of
oleyl and elaidyl isomer surfactant-counterion systems in drag reduction, rheological
properties and nanostructure. J Colloid Interf Sci 2011, 354 (2), 691-699.
48. Ferreri, C.; Pierotti, S.; Barbieri, A.; Zambonin, L.; Landi, L.; Rasi, S.; Luisi, P. L.;
Barigelletti, F.; Chatgilialoglu, C., Comparison of phosphatidylcholine vesicle properties
related to geometrical isomerism. Photochem Photobiol 2006, 82 (1), 274-280.
49. Rappolt, M.; Cacho-Nerin, F.; Morello, C.; Yaghmur, A., How the chain configuration
governs the packing of inverted micelles in the cubic Fd3m-phase. Soft Matter 2013, 9 (27),
6291-6300.
50. Lennox, R. B.; Mcclelland, R. A., Electrophilic Bromination of Micelle-Associated Alkenes
as a Probe of Micelle Structure. J Am Chem Soc 1986, 108 (13), 3771-3781.
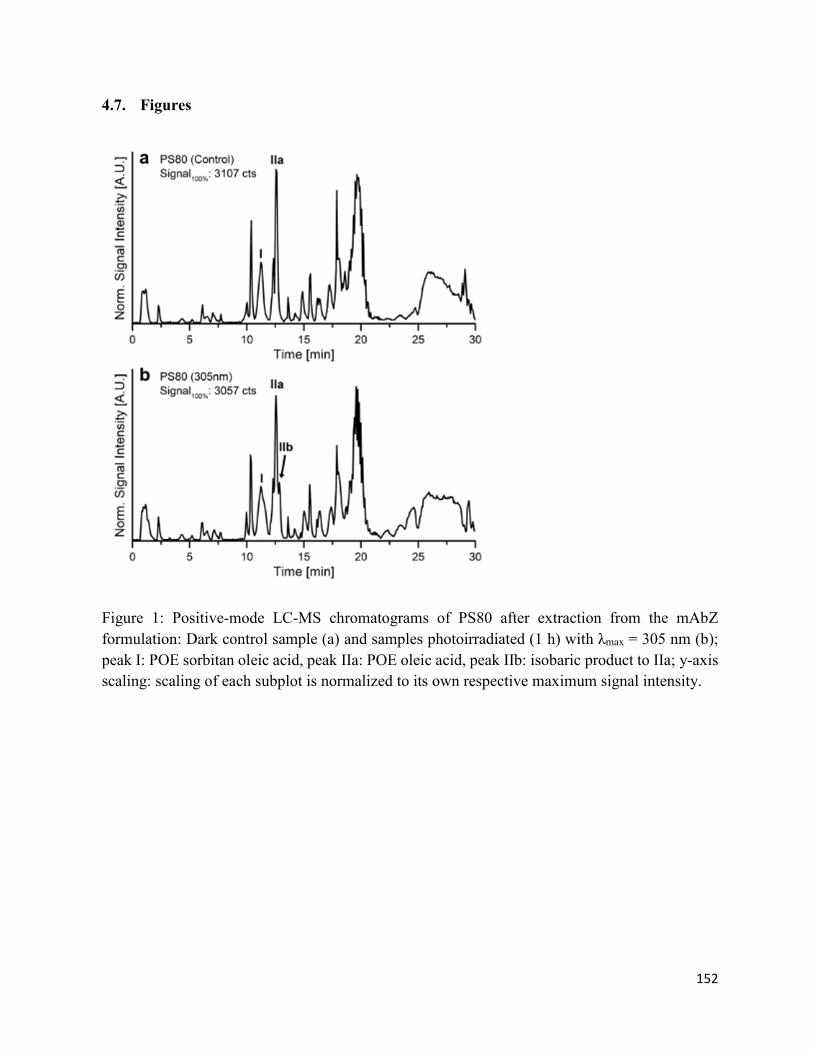
152
4.7. Figures
Figure 1: Positive-mode LC-MS chromatograms of PS80 after extraction from the mAbZ
formulation: Dark control sample (a) and samples photoirradiated (1 h) with λmax = 305 nm (b);
peak I: POE sorbitan oleic acid, peak IIa: POE oleic acid, peak IIb: isobaric product to IIa; y-axis
scaling: scaling of each subplot is normalized to its own respective maximum signal intensity.
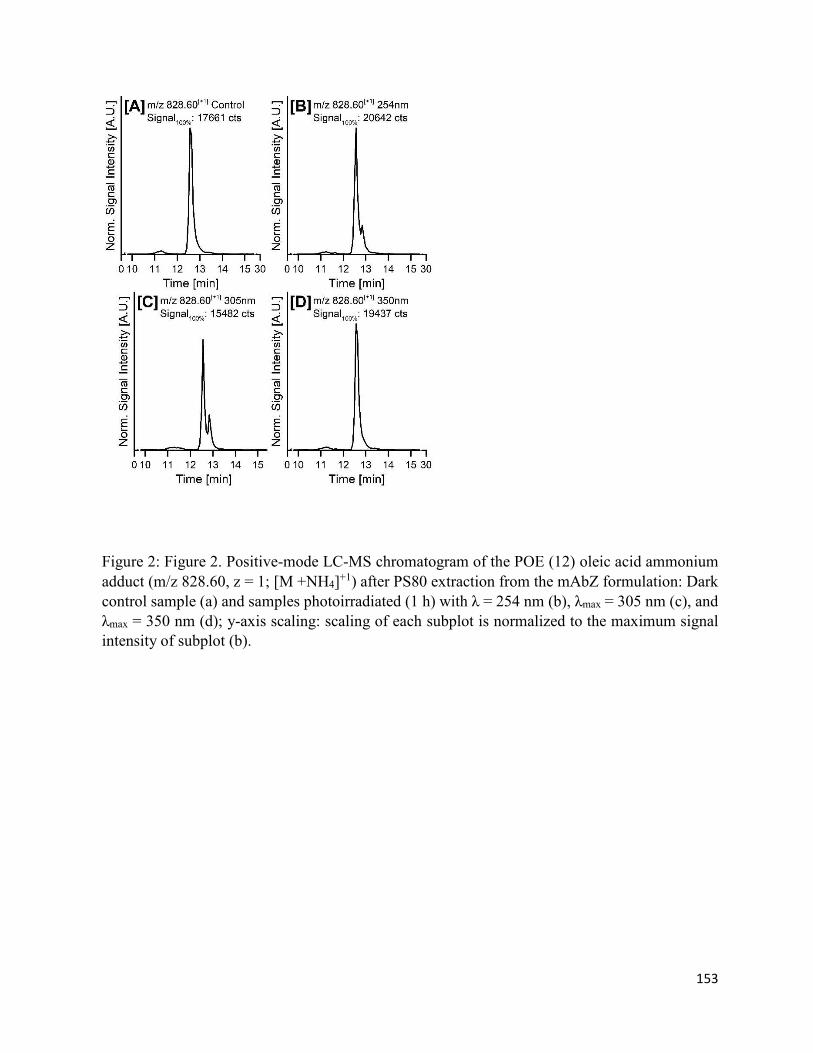
153
Figure 2: Figure 2. Positive-mode LC-MS chromatogram of the POE (12) oleic acid ammonium adduct (m/z 828.60, z = 1; [M +NH4]+1) after PS80 extraction from the mAbZ formulation: Dark control sample (a) and samples photoirradiated (1 h) with λ = 254 nm (b), λmax = 305 nm (c), and λmax = 350 nm (d); y-axis scaling: scaling of each subplot is normalized to the maximum signal intensity of subplot (b).
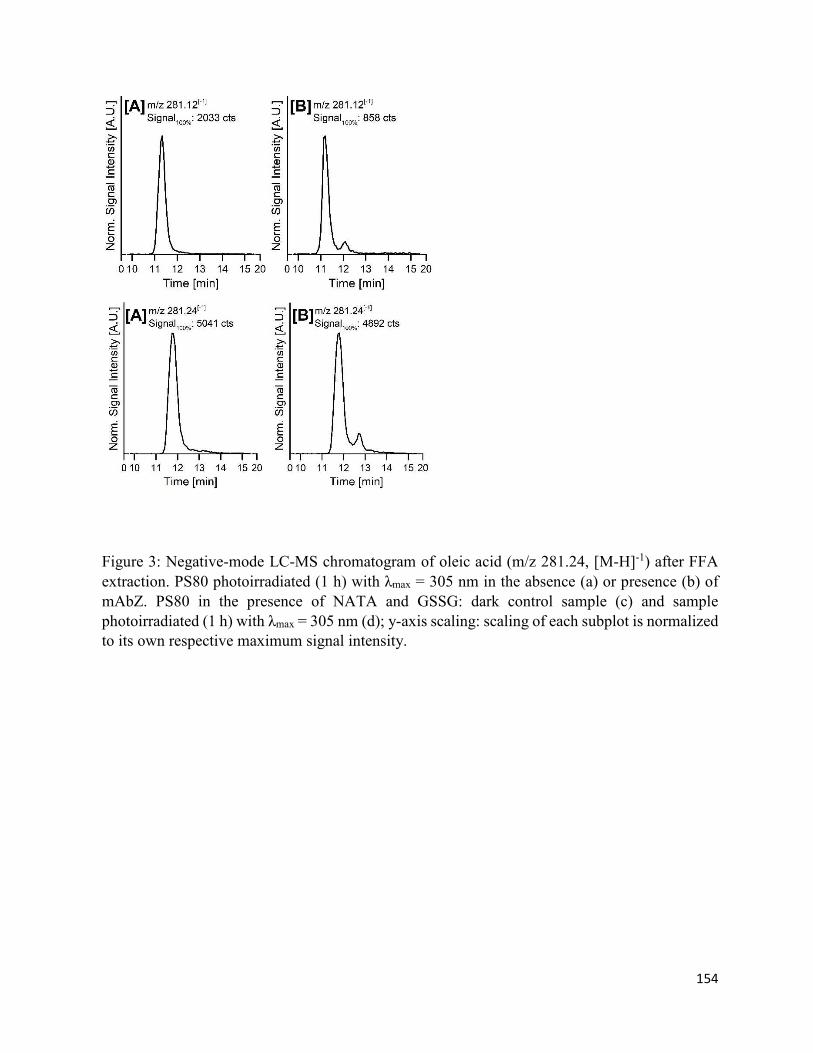
154
Figure 3: Negative-mode LC-MS chromatogram of oleic acid (m/z 281.24, [M-H]-1) after FFA extraction. PS80 photoirradiated (1 h) with λmax = 305 nm in the absence (a) or presence (b) of mAbZ. PS80 in the presence of NATA and GSSG: dark control sample (c) and sample photoirradiated (1 h) with λmax = 305 nm (d); y-axis scaling: scaling of each subplot is normalized to its own respective maximum signal intensity.
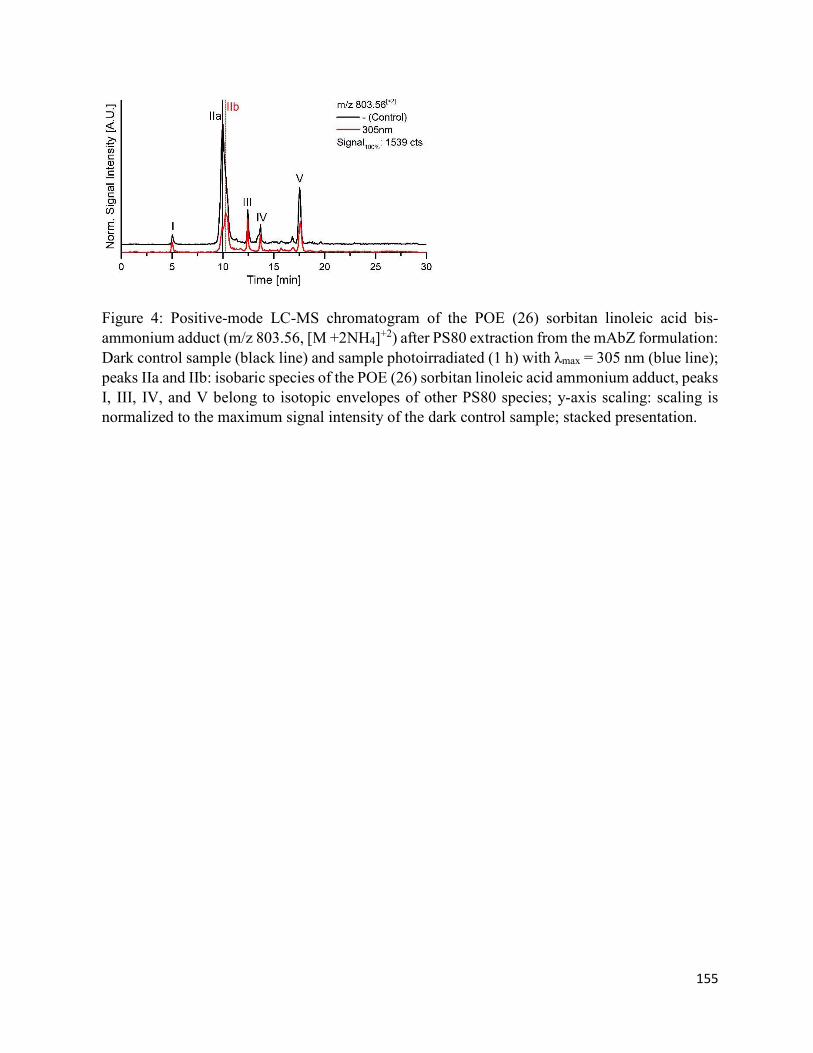
155
Figure 4: Positive-mode LC-MS chromatogram of the POE (26) sorbitan linoleic acid bis-ammonium adduct (m/z 803.56, [M +2NH4]+2) after PS80 extraction from the mAbZ formulation: Dark control sample (black line) and sample photoirradiated (1 h) with λmax = 305 nm (blue line); peaks IIa and IIb: isobaric species of the POE (26) sorbitan linoleic acid ammonium adduct, peaks I, III, IV, and V belong to isotopic envelopes of other PS80 species; y-axis scaling: scaling is normalized to the maximum signal intensity of the dark control sample; stacked presentation.
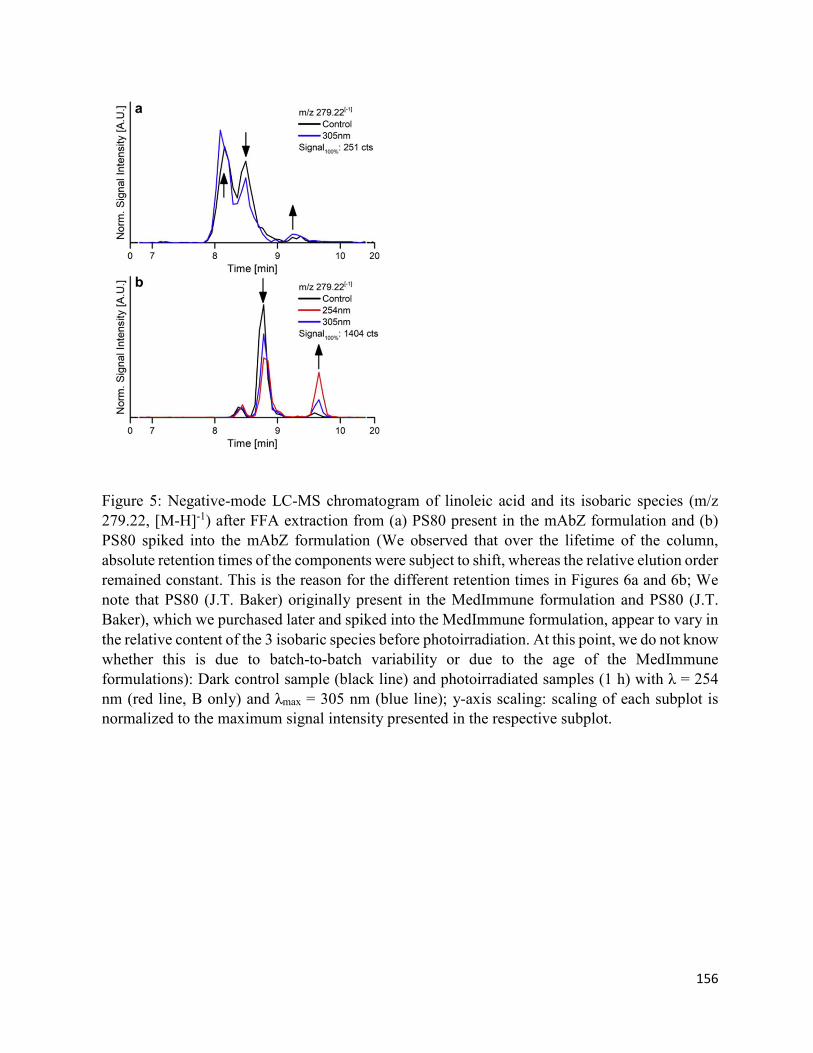
156
Figure 5: Negative-mode LC-MS chromatogram of linoleic acid and its isobaric species (m/z 279.22, [M-H]-1) after FFA extraction from (a) PS80 present in the mAbZ formulation and (b) PS80 spiked into the mAbZ formulation (We observed that over the lifetime of the column, absolute retention times of the components were subject to shift, whereas the relative elution order remained constant. This is the reason for the different retention times in Figures 6a and 6b; We note that PS80 (J.T. Baker) originally present in the MedImmune formulation and PS80 (J.T. Baker), which we purchased later and spiked into the MedImmune formulation, appear to vary in the relative content of the 3 isobaric species before photoirradiation. At this point, we do not know whether this is due to batch-to-batch variability or due to the age of the MedImmune formulations): Dark control sample (black line) and photoirradiated samples (1 h) with λ = 254 nm (red line, B only) and λmax = 305 nm (blue line); y-axis scaling: scaling of each subplot is normalized to the maximum signal intensity presented in the respective subplot.

157
Figure 6: Quantitative comparison of linoleic acid and its isobaric species (m/z 279.22, [M-H]-1) after FFA extraction from PS80 alone and from PS80 spiked into the mAbZ formulation: Dark control samples (black and blue lines, respectively) and photoirradiated samples (1 h) with λmax = 305nm (gray and red lines, respectively); ‘9Z, 11E’ refers to (9Z, 11E)-octadeca-9,11-dienoic acid, ‘10E, 12Z’ refers to (10E, 12Z)-octadeca10,12-dienoic acid, and ‘9E, 11E’ refers to (9E, 11E)-octadeca-9,11-dienoic acid.
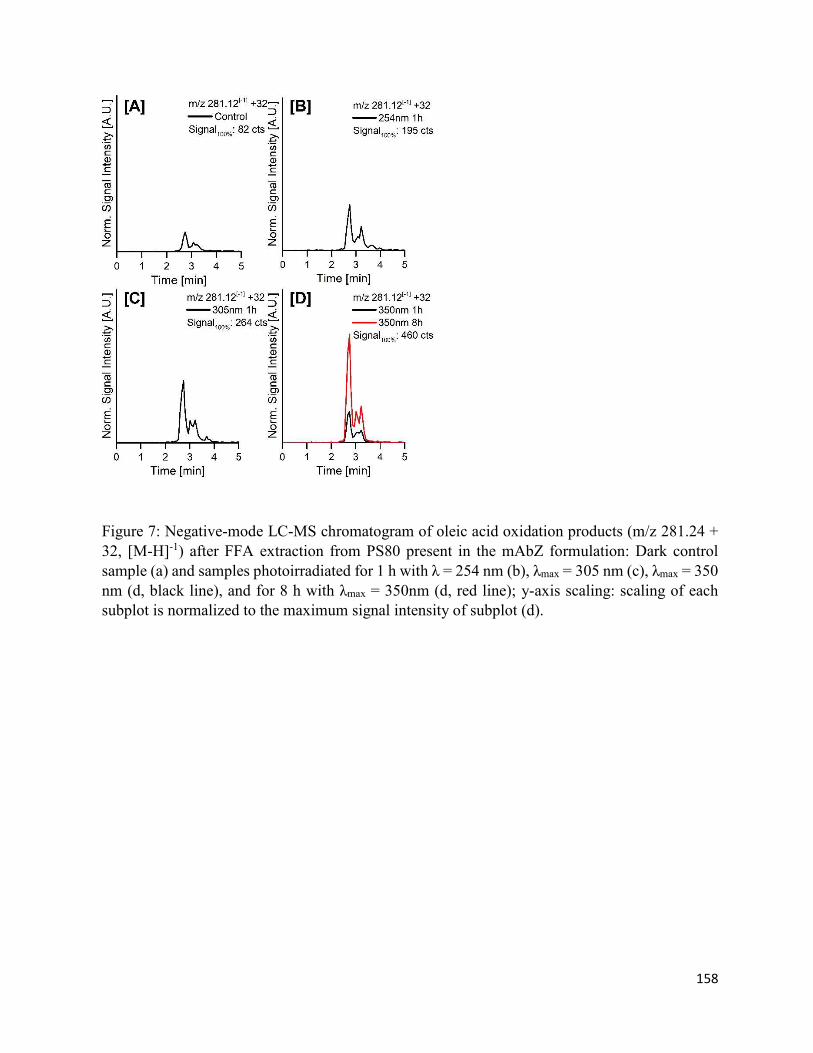
158
Figure 7: Negative-mode LC-MS chromatogram of oleic acid oxidation products (m/z 281.24 + 32, [M-H]-1) after FFA extraction from PS80 present in the mAbZ formulation: Dark control sample (a) and samples photoirradiated for 1 h with λ = 254 nm (b), λmax = 305 nm (c), λmax = 350 nm (d, black line), and for 8 h with λmax = 350nm (d, red line); y-axis scaling: scaling of each subplot is normalized to the maximum signal intensity of subplot (d).
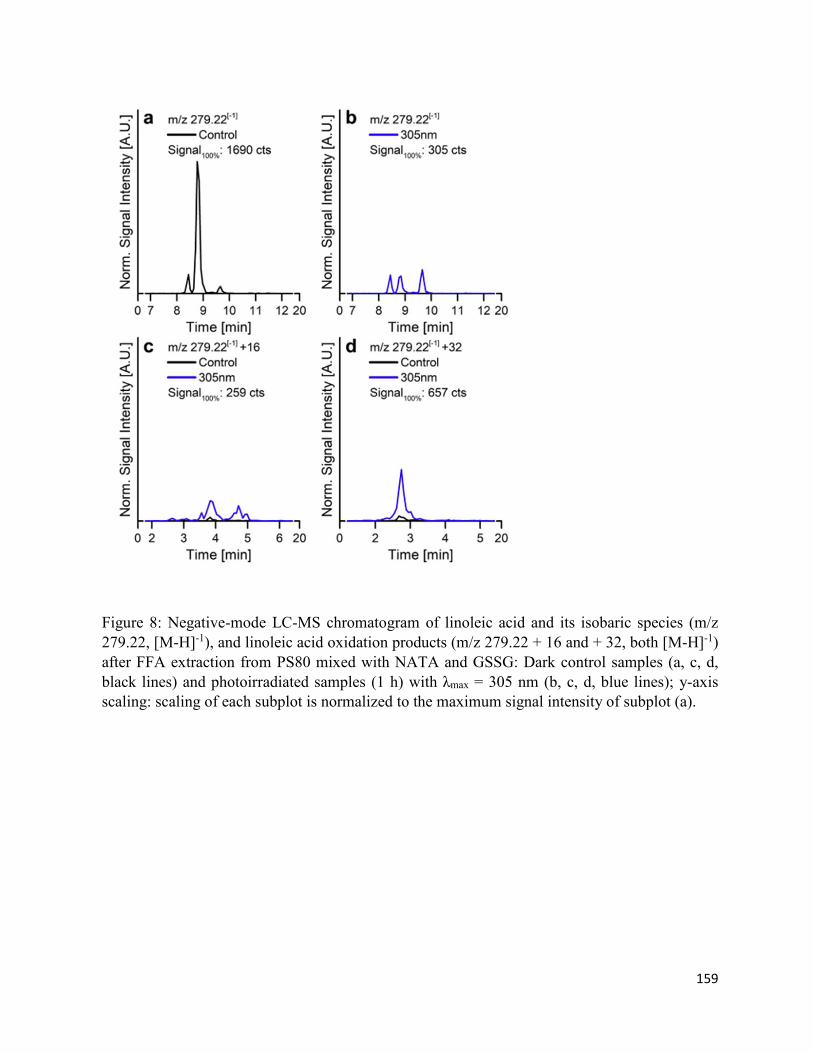
159
Figure 8: Negative-mode LC-MS chromatogram of linoleic acid and its isobaric species (m/z 279.22, [M-H]-1), and linoleic acid oxidation products (m/z 279.22 + 16 and + 32, both [M-H]-1) after FFA extraction from PS80 mixed with NATA and GSSG: Dark control samples (a, c, d, black lines) and photoirradiated samples (1 h) with λmax = 305 nm (b, c, d, blue lines); y-axis scaling: scaling of each subplot is normalized to the maximum signal intensity of subplot (a).
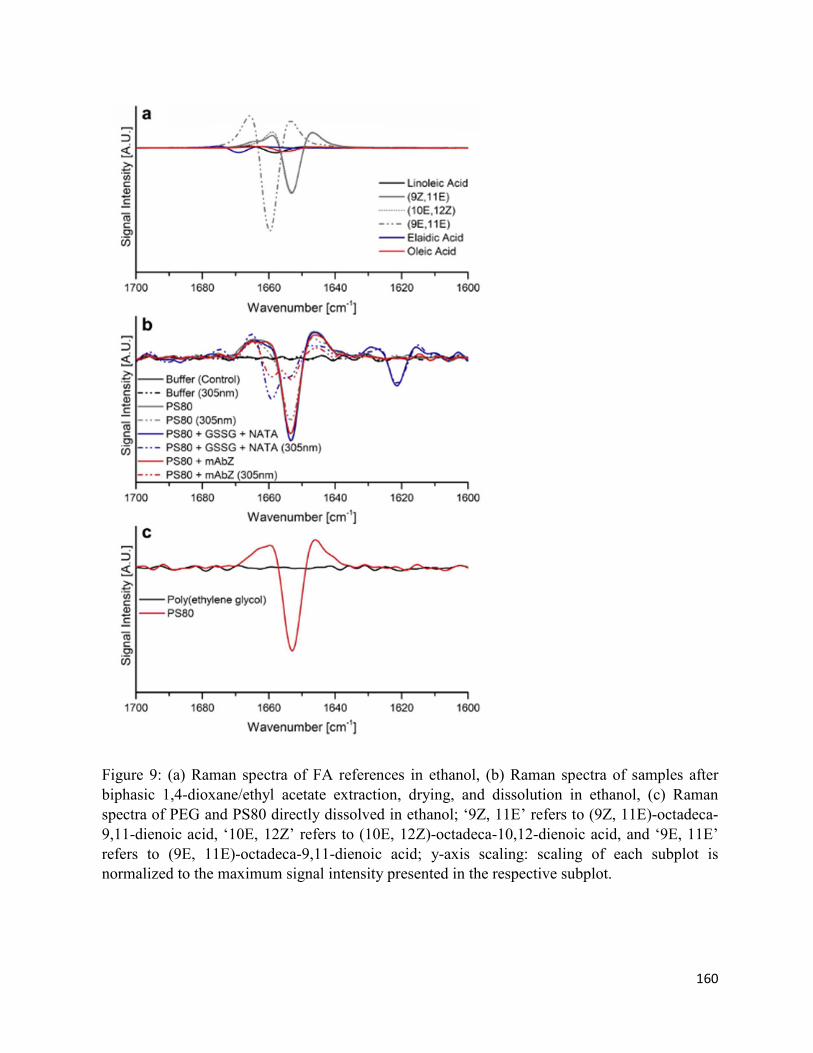
160
Figure 9: (a) Raman spectra of FA references in ethanol, (b) Raman spectra of samples after biphasic 1,4-dioxane/ethyl acetate extraction, drying, and dissolution in ethanol, (c) Raman spectra of PEG and PS80 directly dissolved in ethanol; ‘9Z, 11E’ refers to (9Z, 11E)-octadeca-9,11-dienoic acid, ‘10E, 12Z’ refers to (10E, 12Z)-octadeca-10,12-dienoic acid, and ‘9E, 11E’ refers to (9E, 11E)-octadeca-9,11-dienoic acid; y-axis scaling: scaling of each subplot is normalized to the maximum signal intensity presented in the respective subplot.

161
Figure 10: (a) FTIR spectra of FA references in ethanol, (b) FTIR spectra of samples after biphasic 1,4-dioxane/ethyl acetate extraction, drying, and dissolution in ethanol, (c) FTIR spectra of PEG and PS80 directly dissolved in ethanol; ‘9Z, 11E’ refers to (9Z, 11E)octadeca-9,11-dienoic acid, ‘10E, 12Z’ refers to (10E, 12Z)-octadeca-10,12-dienoic acid, and ‘9E, 11E’ refers to (9E, 11E)-octadeca-9,11-dienoic acid; y-axis scaling: scaling of each subplot is normalized to the maximum signal intensity presented in the respective subplot.
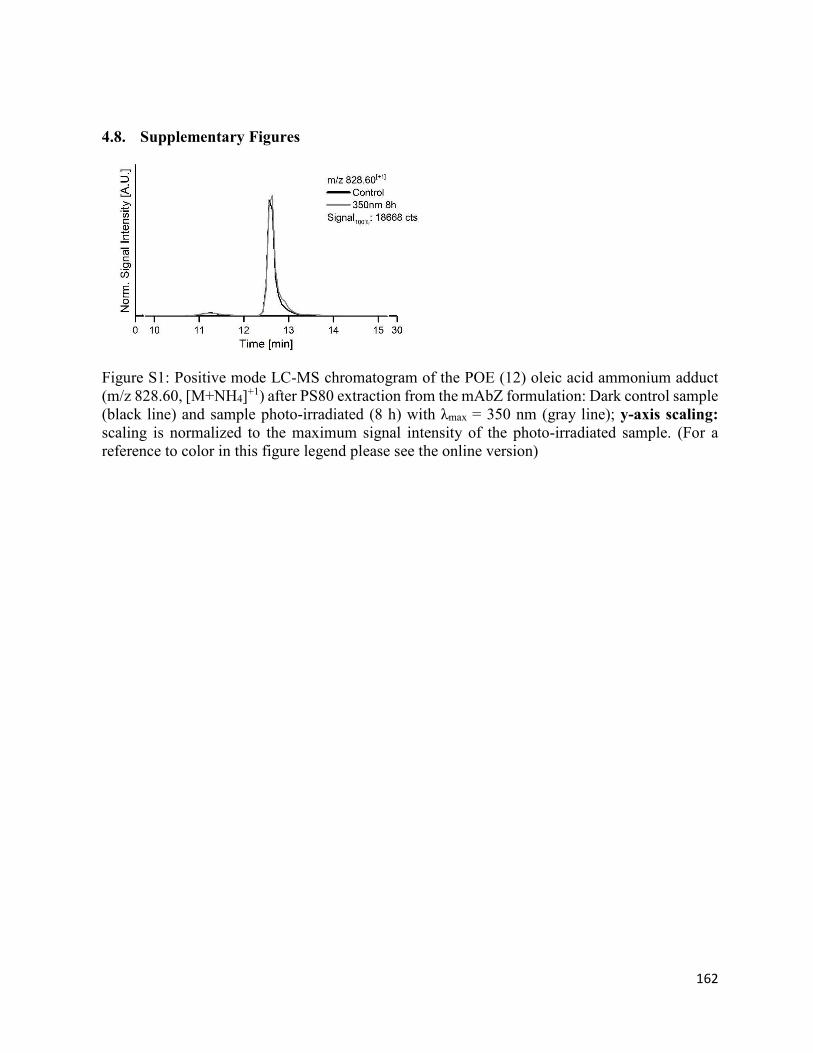
162
4.8. Supplementary Figures
Figure S1: Positive mode LC-MS chromatogram of the POE (12) oleic acid ammonium adduct (m/z 828.60, [M+NH4]+1) after PS80 extraction from the mAbZ formulation: Dark control sample (black line) and sample photo-irradiated (8 h) with λmax = 350 nm (gray line); y-axis scaling: scaling is normalized to the maximum signal intensity of the photo-irradiated sample. (For a reference to color in this figure legend please see the online version)
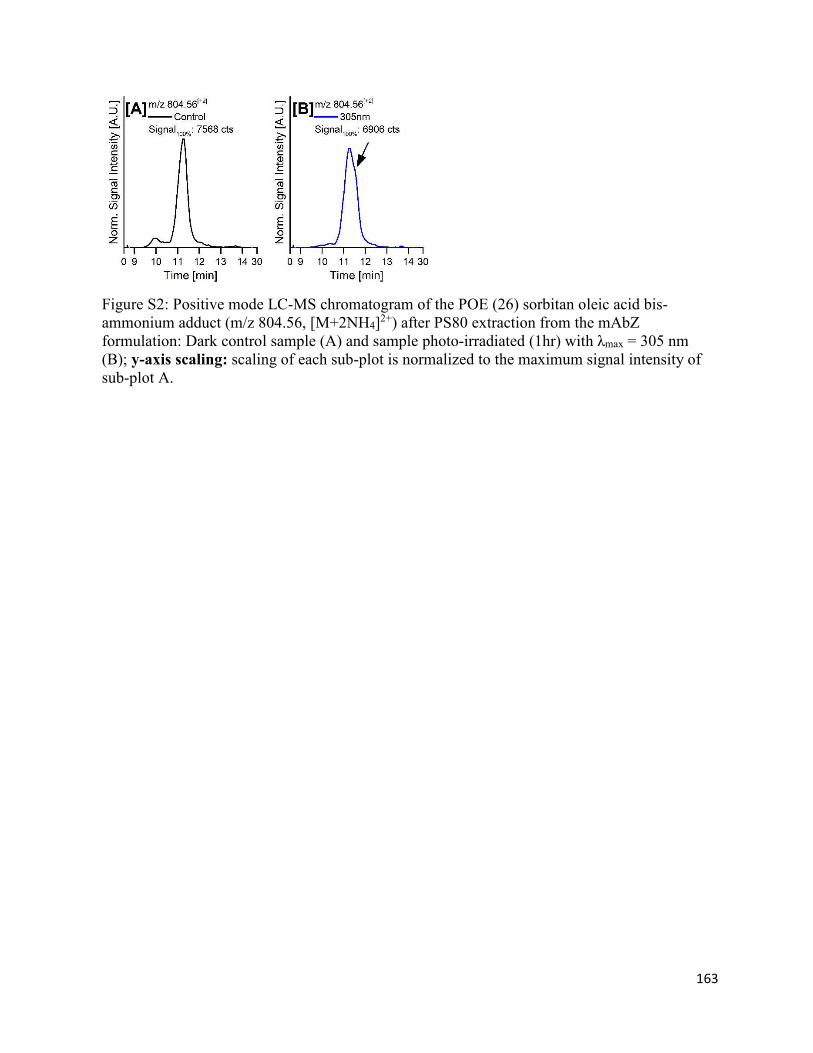
163
Figure S2: Positive mode LC-MS chromatogram of the POE (26) sorbitan oleic acid bis-ammonium adduct (m/z 804.56, [M+2NH4]2+) after PS80 extraction from the mAbZ formulation: Dark control sample (A) and sample photo-irradiated (1hr) with λmax = 305 nm (B); y-axis scaling: scaling of each sub-plot is normalized to the maximum signal intensity of sub-plot A.

164
Figure S3: Negative mode LC-MS chromatogram of oleic acid and its isobaric species (m/z 281.24, [M-H]-1) after FFA extraction from PS80 present in the mAbZ formulation: samples photo-irradiated (1hr) with λmax = 305 nm (blue line) and spiked with elaidic acid (red line); y-
axis scaling: scaling is normalized to the maximum signal intensity of the photo-irradiated sample (blue line). (For a reference to color in this figure legend please see the online version)
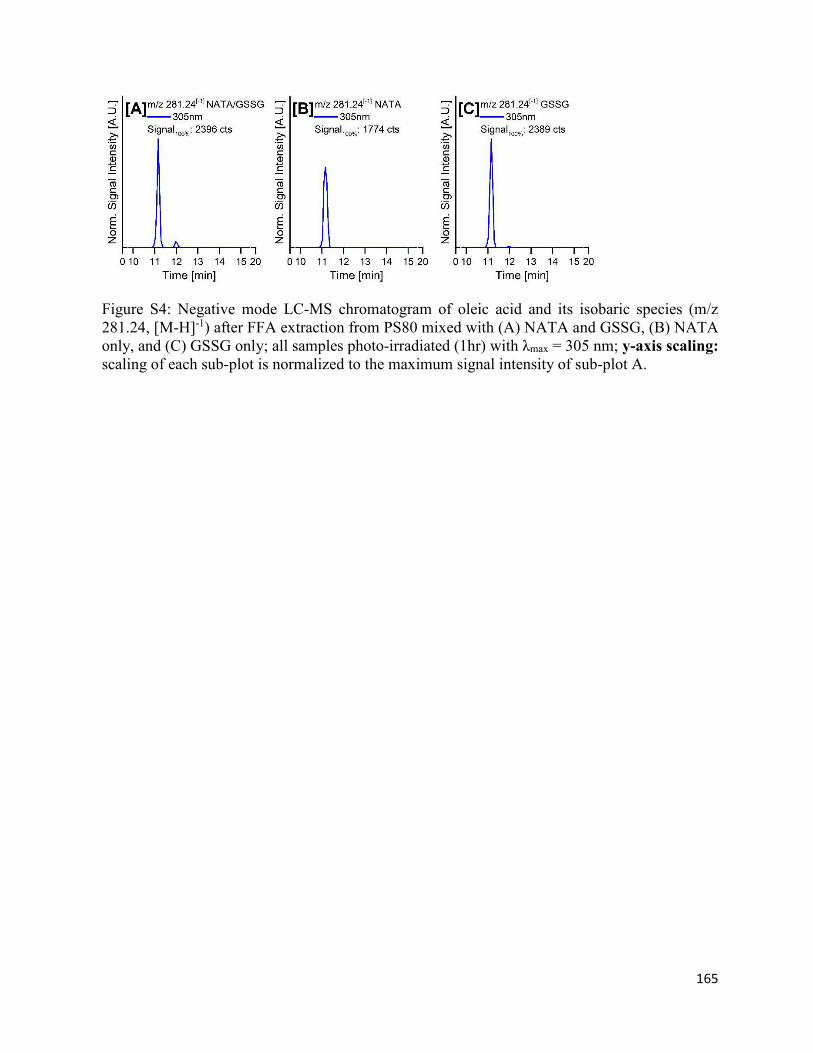
165
Figure S4: Negative mode LC-MS chromatogram of oleic acid and its isobaric species (m/z 281.24, [M-H]-1) after FFA extraction from PS80 mixed with (A) NATA and GSSG, (B) NATA only, and (C) GSSG only; all samples photo-irradiated (1hr) with λmax = 305 nm; y-axis scaling: scaling of each sub-plot is normalized to the maximum signal intensity of sub-plot A.
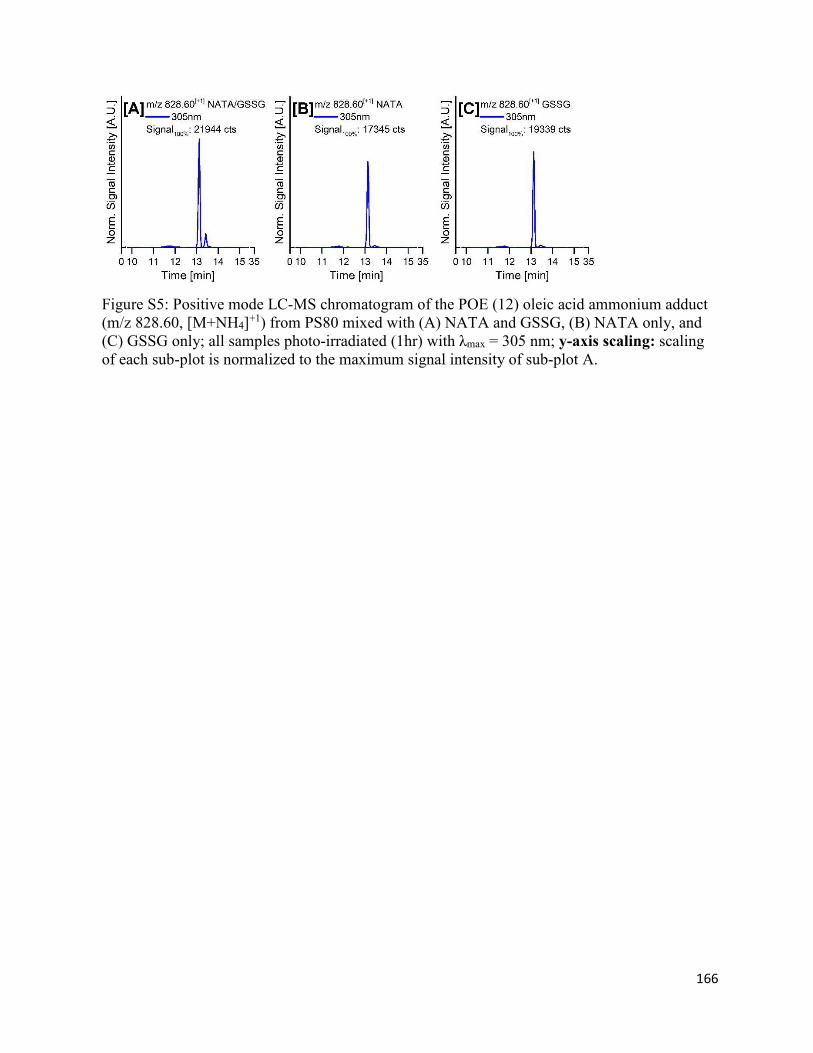
166
Figure S5: Positive mode LC-MS chromatogram of the POE (12) oleic acid ammonium adduct (m/z 828.60, [M+NH4]+1) from PS80 mixed with (A) NATA and GSSG, (B) NATA only, and (C) GSSG only; all samples photo-irradiated (1hr) with λmax = 305 nm; y-axis scaling: scaling of each sub-plot is normalized to the maximum signal intensity of sub-plot A.
167
Chapter 5: Oxidation and Cis/trans Isomerization
of Unsaturated Fatty Acids in Polysorbate 80 via
photo-induced degradation of citrate buffer

168
5.1. Introduction
The development of protein therapeutics involves the use of various excipients to keep them stable
for long shelf lives.1-2 One of the criteria is to maintain the pH of these therapeutics to ensure the
physical and chemical stability. Therefore, a wide variety of buffers such as citrate, acetate,
histidine and phosphate buffers are used.3 Citrate is a polyprotic buffer that has four pKa values,
3.13, 4.75, 5.80, and 14.40,3 and as a result it can buffer over a wide range of pHs. Citrate is
known to have dual effect on proteins; some studies show that citrate accumulates on protein
surfaces, leading to reduced colloidal stability,4-9 while others show that citrate can bind to the
native state of proteins resulting in net stabilization.10-13 For γD-crystalline, citrate buffer in the
formulation inhibits unfolding and aggregation via ligand binding, and retains the conformational
stability of the protein.14-15 In addition, degradation products of citrate can react with the N-
terminus or lysine.16-17 For example, citrate-derived products formed covalent adducts of acetone
and aldimine to a monoclonal antibody that was formulated in citrate buffer in presence of iron
after light exposure.17
Although Fe3+ is rather insoluble in water, it becomes soluble through chelation with citrate.18-19
Depending on the ratio of citrate:Fe3+, pH, temperature, and solvent, a variety of Fe3+-citrate
complexes may be formed.20 These complexes absorb UV and visible light, eventually generating
reactive oxygen species (ROS), which can modify the ingredient of formulation.17 Due to the
generation of ROS, these complexes have also found their use in degrading poorly biodegradable
pollutants in water under UV-A or sunlight.21-23 Even though drug products may not be exposed
to sunlight, the fluorescence lamps in the laboratory settings emit UV-A light and visible light,24
where the Fe3+-citrate complexes absorb. In addition, trace amounts of Fe3+ are present in
formulations as contaminants from excipients.25 Iron may also leach from stainless steel
169
bioreactors,26-27 glass vials27 and/or rubber stoppers.28 As shown in Scheme 1, reactions 1-4, when
a citrate-Fe3+ is exposed to the UV-A light, Fe2+ is generated by a ligand-to-metal charge transfer
(LMCT). Ferrous iron readily reduces oxygen to superoxide (O2•), which can undergo further
dismutation to hydrogen peroxide (H2O2). The combination of Fe2+ and H2O2 promotes the
Fenton reaction (k4 = 1.10 x 10⁶ M-1s-1) to form •OH,29 which is a strong oxidant that can oxidize
proteins and surfactants. Therefore, the entire reaction is referred to as photo-Fenton reaction. An
important aspect of photo-Fenton reaction is the formation of radicals originating from citrate.
Carboxyl radical (R-COO•) (Scheme 1, reaction 1) are formed from citrate after LMCT and
transforms into 3-hydroxy-glurate radical (3-HGA•2) (Scheme 1, reaction 5) after loss of carbon
dioxide, which in the presence of oxygen converts 3-HGA•2 to 3-oxo-glutarate (3-OGA2-)
(Scheme 1, reaction 6).30-31 In terms of R-COO•, it can also degrade to form a carbon dioxide
radical anion (•CO2) after multiple steps (Scheme 1, reaction 7).32 This radical anion is a one-
electron reductant that can reduce the disulfide bond forming a thiyl radical and a thiol.33
Here, we report on the photo-induced oxidation and cis/trans isomerization of polysorbate (PS80)
by ROS and one-electron reductants such as •CO2 and 3-HGA•2, respectively. These radicals
are generated by photo-irradiation of citrate in the presence of Fe3+, present as a contaminant in
protein formulations. We have investigated the roles of •CO2 and 3-HGA•2 in generating thiyl
radicals in a model peptide containing a disulfide bond, oxidized glutathione (GSSG), and
inducing cis/trans isomerization of unsaturated fatty acids of PS80. It is pharmaceutically relevant
as some of the marketed protein biotherapeutics such as Brentuximab Vedotin (Adcetris),
Belimumab (Benlysta), Adalimumab (Humira), and Rituximab (Rituxan) are formulated in citrate
buffer and PS80.
170
5.2. Materials and Methods
PS80 N.F. (J.T. Baker) was purchased from Avantor (Radnor, PA). Sodium acetate, phosphate
monobasic, phosphate dibasic, GSSG, and ferric chloride were purchased from Sigma-Aldrich
Corporation (St. Louis, MO). Citric acid monohydrate was purchased from Fisher Scientific
(Hampton, NH). All the solutions were prepared using fresh water of ultra-pure quality (18.2 MΩ)
using a WaterPro PS Polishing System (Labconco, Kansas City, MO).
5.2.1. Photo-irradiation
The solutions were photo-irradiated under air using 4 ml borosilicate glass vials (cut-off of <295
nm), using four RPR-3500A lamps, emitting wavelengths between 305 nm and 416 nm (λmax =
350 nm), placed in a Rayonet Photoreactor (RPR-200, The Southern New England Ultraviolet
Company, Branford, CT). These four lamps gave a photon flux of ~3x10⁻⁸ Einstein/s and an
irradiance of 6.3 W.h/m2 quantified by ferrioxalate actinometer.34-36 Our experimental conditions
used up to 42 W.h/m2, which is well below the ICH Q1B guideline of the International Conference
of Harmonization (ICH) recommendation of 200 W.h/m2 of UV-A light for the photo-stability
testing of drug product and drug substance.37
5.2.2. Sample preparation
An initial stock of 10% PS80 (w/v) was prepared and diluted to 0.2% (w/v) in water. Similarly,
initial stocks of 100 mM buffers (citrate, phosphate and acetate) at pH 6.0, 200 μM Fe3+ and 50
mM GSSG (pH adjusted to 6.0) were prepared in water. The final desired concentrations of 0.02%
PS80, 10 mM buffers, 1 μM Fe3+, and 5 mM GSSG were achieved by adding 40 μl of 0.2% PS80,
40 μl of 100 mM buffer, 2 μl of 200 μM Fe3+, and 40 μl of 50 mM GSSG; the final volume was
adjusted to 400 μl by the addition of 278 μl of water. The solutions were vortexed and photo-
171
irradiated in borosilicate test tubes under the conditions mentioned above. Some experimental
conditions required either different concentration of Fe3+ (0-50 μM), different concentration of
buffers (10-50 mM), or no GSSG. In these cases, the volumes of the solutions were adjusted
accordingly, and water was added as needed to adjust the final volumes to 400 μl.
In case of Ar-saturated solutions, the solutions were capped with rubber septa and saturated with
Ar for 30 min. During Ar-saturation, the solutions were wrapped in an aluminum foil to prevent
light exposure. After Ar-saturation, the solutions were photo-irradiated as described above. The
photo-irradiated solutions were stored at -80 °C until further analysis by HPLC-mass
spectrometry (MS). Control solutions under air or Ar were either wrapped in an aluminum foil
and placed into the Rayonet Photoreactor during photo-irradiation or were placed in the dark.
5.2.3. Mass spectrometry
Control and photo-irradiated solutions were analyzed by HPLC-electrospray MS in the positive
mode, using a Q-Tof Premier™ (Waters Corporation, Milford, MA) connected to a Waters
ACQUITY UPLC system (Waters Corporation, Milford, MA). The solutions were introduced
into the mass analyzer in the ESI source. The desolvation temperature and source temperature
were maintained at 250 °C and at 120 °C, respectively, and the capillary voltage was set at 2.8
kV. The mass spectrometer was operated in the MSE mode, collecting fragmentation patterns of
PS80, which give unique fragmentation ions of fatty acids.38 The analyzed mass range was 150-
2000 Da. The mass spectrometer settings, UPLC settings, and data analysis were achieved with
the Masslynx v.4.1 software version.
The resolution of PS80 species and its degradation products was achieved by a Prevail™ C18
column (Grace, Deerfield, IL) with dimensions of 150 mm X 2.1 mm, 300 Å pore size, and 3.0
172
mm particle size. For better separation, the column heater was maintained at 40 °C. Five μl of
0.02% PS80 was run at the flow rate of 0.4 ml/min. Four mobile phases were employed for the
separation of the solutions and to clean the column. Mobile phase A contained water, 2 mM
ammonium formate, and 0.08% formic acid, mobile phase B contained 30% methanol, 70%
acetonitrile, and 0.08% formic acid, mobile phase C contained 100% isopropanol, and mobile
phase D contained 10% 1,4-dioxane and 90% acetone. The solvent gradient started with 60% A
and 40% B, and the organic phase gradually increased linearly to 1% A and 99% B within 15
min. The composition was then changed to 1% A, 90% B, and 9% C, and held for 2 min. The
column was then washed using 1% A and 99% D for 3 min and was re-equilibrated for 7 min
before the next run.
5.3. Results
5.3.1. Oxidation products
PS80 is prone to oxidation when exposed to reactive oxygen species, contaminants (such as
metals and peroxides), heat, and light.39 Here, we monitored the degradation of PS80 in the
presence of Fe3+-citrate during exposure to UV-A light. MS chromatogram of a control solution
containing 0.02% PS80 and 10 µM Fe3+ in 10 mM citrate buffer shows PS80 species, which were
eluted in the following order; at tR = 10.32 min POE sorbitan monolinoleate, at tR = 11.74 min
POE sorbitan monooleate, at tR = 13.22 min POE oleate, at tR = 17.82 min POE sorbitan oleate-
linoleate, at tR = 18.64 min POE sorbitan dioleate, and at tR = 20.80 min higher order esters were
eluted. A photo-irradiated solution containing 0.02% PS80 and 10 µM Fe3+ in 10 mM citrate
buffer (Fig. 1, red trace) was compared with a photo-irradiated solution of 0.02% PS80 in 10 mM
citrate buffer without Fe3+ (Fig. 2, blue trace) and a control solution. Photo-irradiation in presence
of Fe3+ revealed the reduction of the peaks at tR = 10.32 min displaying the m/z of POE sorbitan
173
monolinoleate, at tR = 17.82 min displaying the m/z of POE sorbitan oleate-linoleate, and increase
of the peak at tR = 13.90 min displaying the m/z of POE oleate with an increase of 30 Da. In
contrast, photo-irradiation of solutions without Fe3+ did not reveal in significant changes in the
peak intensities compared to the control sample. These observations suggest the involvement of
Fe3+-citrate in the degradation of PS80 via a photo-Fenton reaction. The oxidation products of
PS80 in citrate buffer were quantified after exposure to UV-A light in increased concentration of
Fe3+ and increased photo-irradiation time shown in section 4.1.1 and 4.1.2, respectively.
5.3.1.1. Effect of Fe3+ concentration
The degradation profile of 0.02% PS80 in 10 mM citrate buffer, pH 6.0, was monitored in the
presence of various concentration of Fe3+ between 0 and 50 µM Fe3+ (Fig. 2). The peak areas of
POE (25) sorbitan linoleate (Fig. 2, black trace) display a rapid degradation of this species when
the PS80 solution in 10 mM citrate buffer contained 5 µM Fe3+ and almost all of this species
degraded in the solutions containing ≥10 µM Fe3+ after photo-irradiation. POE (25) sorbitan
monooleate degraded gradually as the Fe3+ concentration increased (Fig. 2, blue trace), indicated
by its peak areas. Among the PS80 species quantified, POE(11) oleate (Fig. 2, red trace)
decreased at a slower rate.
The degradation products of PS80 were monitored by analyzing the peak areas of oxidation
products, specially of products displaying an increase of 16 Da, corresponding to the
addition/insertion of an oxygen atom. These species indicate the formation of hydroxylation
products (Fig. 3). The oxidation product, POE(11) hydroxy-oleate (m/z = 784.57, z = 1) showed
gradual increase in peak area when the Fe3+ concentration was increased from 0 to 50 µM Fe3+.
A similar pattern was observed for POE(25) sorbitan hydroxy-monooleate (m/z = 782.54, z = 2)
174
and POE(25) sorbitan hydroxy-monolinoleate (m/z = 781.54, z = 2) except for the solution
containing 5 μM Fe3+.
5.3.1.2. Duration of light exposure
The solutions containing 0.02% PS80 and 1 µM Fe3+ in 10 mM citrate buffer, pH 6.0, were
exposed to UV-A light for various time between 0 and 200 min (Fig. 3). As in section 4.1.1, the
oxidation products were evaluated by extraction of a desired m/z and calculation of relative peak
areas. The relative peak areas of the oxidation products, such as POE (11) hydroxy-oleate, POE
(25) sorbitan hydroxy-monooleate, POE (25) sorbitan hydroxy-monolinoleate increased on the
light exposure extended to 175 min, but did not change further when the solutions were exposed
for 200 min. A small amount of POE (25) sorbitan hydroxy-monooleate was present in the control
solution as well.
5.3.2. Cis/trans isomerization
5.3.2.1. Cis/trans isomerization of unsaturated fatty acids of PS80 under air
In presence of Fe3+, a citrate-derived radical is •CO2 is formed after exposure to UV-A light.
This radical anion is a reductant and can transfer an electron to a disulfide bond, which
subsequently breaks the bond forming a thiol and a thiyl radical. Our previous study on cis/trans
isomerization of unsaturated fatty acids of PS80 was mediated by thiyl radical after an electron
was transferred to a disulfide bond from a photoionization of tryptophan (Trp).40 Therefore, we
employed a model peptide containing a disulfide bond, GSSG, to accept an electron from •CO2,
reduce to a thiyl radical, and induce cis/trans isomerization of unsaturated fatty acids of PS80.
Therefore, to confirm this hypothesis, 400 µl of solutions containing 0.02% PS80 (w/v), 10 µM
Fe3+, 5 mM GSSG complex prepared in 10-50 mM citrate buffer, at pH 6.0, were exposed to UV-

175
A light for 1 h (Fig. 5). Significant changes in the extracted ion chromatogram (XIC) peaks of
POE(11) oleate and POE(25) sorbitan monooleate were observed for all the light exposed
solutions in comparison to the control sample that was wrapped in aluminum foil during photo-
irradiation. For photo-irradiated solution containing 10, 20, and 50 mM citrate, the extracted ion
chromatograms (XICs) of POE(11) oleate, eluting at tR = 13.22 min, with m/z 784.59 (z = 1) (Fig.
5A), revealed an isobaric peak eluting directly after POE(11) oleate at tR = 13.46 min. The
obtained isobaric peaks have slight increase in peak areas with increase in buffer concentration.
Similarly, XICs of POE(25) sorbitan monooleate displaying a molecular ion with m/z 782.52 (z
= 2) resulted in an unresolved isobaric peak, which was absent in the control sample (Fig. 5B).
The peak areas of these isobaric species indicated that the increase in citrate buffer concertation
has very little effect on their formation. This is because 10 mM citrate was already 1000-fold
higher than 10 µM Fe3+ and all the complexing sites of iron are occupied so increasing the
concentration further had little effect.
Next, we investigated the role of increasing concentration of iron on the formation of isobaric
species. Solutions containing 0.02% PS80 (w/v) and 5 mM GSSG prepared in 10 citrate buffer,
pH 6.0, with Fe3+ concentration ranging from 0 to 10 µM iron were exposed to UV-A light for 1
h (Fig. 6). Representatively, XICs of POE(11) oleate displaying a molecular ion with m/z 784.59
(z = 1) resulted in higher yield of isobaric species in 10 µM Fe3+ compared to 2.5 µM Fe3+
containing photo-irradiated sample and control sample (Fig. 6A). Likewise, XICs of POE(25)
sorbitan monooleate displaying a molecular ion with m/z 782.52 (z = 2) resulted in a new
unresolved peak, which is absent in both 2.5 µM Fe3+ containing photo-irradiated sample and
control sample (Fig. 6B). These data suggest with increasing Fe3+ concentration more citrate bind
176
to iron, giving higher yield of •CO2 that reduces disulfide bonds to thiyl radicals. These thiyl
radicals then induces cis/trans isomerization of the unsaturated fatty acids of PS80.
5.3.2.2. Cis/trans isomerization of unsaturated fatty acids of PS80 under Ar
Since photo-irradiation of citrate-Fe3+ in the UV-A region also generate 3-HGA•2, a reductant,
in absence of oxygen, we investigated the role of such radical anion in reducing disulfide bond of
GSSG and generating thiyl radicals, which can induce cis/trans isomerization of unsaturated fatty
acids in PS80 under Ar-saturation. Therefore, Ar-saturated solutions containing 0.02% PS80, 5
mM GSSG, and 10 µM Fe3+ were prepared in either 10, 20, or 50 mM citrate buffer and exposed
to UV-A light for 1 h.(Fig. 7). XICs of POE(11) oleate displaying a molecular ion with m/z 784.59
(z = 1) resulted in an isobaric species, eluting directly after POE(11) oleate, and XICs of POE(25)
sorbitan monooleate displaying a molecular ion with m/z 782.52 (z = 2) resulted in a new
unresolved peak, which were observed only in the photo-irradiated samples, and not in control
sample. Ar-saturated photo-irradiated solution showed a very little effect of increased citrate
buffer concentration on the yields of these isobaric species. By comparison to the air-saturated
solution (Fig. 5), in Ar-saturated solution, the yields of isobaric species of both POE(11) oleate
and POE(25) sorbitan monooleate were lower. Next, concentration of Fe3+ from 0 to 10 µM was
used in solutions containing 0.02% PS80 and 5 mM GSSG prepared in 10 mM citrate buffer, pH
6.0, and exposed to UV-A light. XICs of POE(11) oleate with m/z 784.59 (z = 1) resulted in
isobaric species eluting at tR = 13.46 min in the photo-irradiated samples, but not in the control
sample. Photo-irradiated solution with 10 µM Fe3+ is in higher yield compared to the photo-
irradiated solution with 2.5 µM Fe3+, which is similar observation made in air-saturated solution;
however, by comparison Ar-saturated solutions have lower yield of isobaric species of POE(11)
oleate. Similarly, XICs of POE(25) sorbitan oleate with m/z 782.52 (z = 2) revealed a smaller

177
shoulder peak in the solution containing 2.5 µM Fe3+ compared to 10 µM Fe3+. Thus, these citrate
buffer and iron concentration dependent experiments were similar in both air and Ar-saturated
solutions; however, yields of these isobaric species were higher in air-saturated solution.
5.3.2.3. Cis/trans isomerization of unsaturated fatty acids in different buffers under Ar
Apart from citrate, other buffers such as acetate and phosphate are used frequently in the
biotherapeutic formulations.3 Additionally, disulfides can directly absorb UV light and form thiyl
radicals, so we investigated the abilities of acetate and phosphate buffers, and disulfide without
buffers in inducing cis/trans isomerization of unsaturated fatty acids of PS80 via thiyl radicals.
Hence, Ar-saturated solutions containing 0.02% PS80, 1 µM Fe3+, and 5 mM GSSG that were
prepared either in no buffer, 10 mM phosphate buffer, 10 mM sodium acetate buffer, or in 10 mM
citrate buffer at pH 6.0 and were exposed to UV-A light for 1 h. XICs of POE(11) oleate
displaying a molecular ion with m/z 784.59 (z = 1), showed a small peak, eluting next to all the
samples, but the yield was higher in citrate buffer. Likewise, XICs of POE(25) sorbitan
monooleate displaying a molecular ion with m/z 782.52 (z = 2) revealed shoulder peaks in all the
samples, but citrate buffer had a prominent shoulder peak. These results suggest that disulfide
bonds without buffers can absorb some UV-A and generate thiyl radicals, which can prompt
cis/trans isomerization. Since, acetate and phosphate buffers did not increase the yield of isobaric
species, they suggest little to no effect on cis/trans isomerization. On the other hand, among the
buffers tested, citrate can form citrate-derived radical ions, which reduce the disulfide bonds to
thiyl radicals and promote cis/trans isomerization of unsaturated fatty acids of PS80.
5.4. Discussion
We observed oxidation of PS80 in solutions containing citrate and Fe3+ after exposure to UV-A
light. In addition, when GSSG, a model system for disulfide bonds in proteins, was added to

178
solutions containing PS80 and Fe3+ in citrate buffer, isobaric species of unsaturated fatty acids of
PS80 species were observed. Therefore, we hypothesized that the oxidation of PS80 species is
initiated by the ROS generated during photo-irradiation and the cis/trans isomerization is carried
out by radical ions, one-electron reductants, which reduce GSSG to give thiyl radicals after one-
electron transfer. These reductants are generated from citrate after LMCT, followed by multiple
steps discussed in section 5.2 and shown in Scheme 1.
5.4.1. Oxidation products
In order to determine the role of ROS in the formation of PS80 oxidation products via the photo-
Fenton reaction, we focused on two experimental conditions (i) different ratios of Fe3+ and citrate
(Fig. 3) and (ii) duration of light exposure (Fig. 4). Our observations indicate that PS80 oxidation
depends both on the concentration of Fe3+ and the duration of light exposure. The effect of an
increasing Fe3+ concentration was most pronounced for oxidation products derived from linoleic
acid (Fig. 2) suggested by rapid decline of POE(25) sorbitan monolinoleate. Our previous studies
showed that a large fraction of linoleic acid is in conjugated forms (CLAs).40 In general, we also
observed an increase in peak areas of the hydroxy products of PS80 species, such as POE(11)
hydroxy-oleate, POE(25) sorbitan hydroxy-oleate, and POE(25) sorbitan hydroxy-linoleate, as
we increased the concentration of Fe3+ (Fig. 3) and with longer UV-A light exposure (Fig. 4). The
formation of ROS such as hydroxyl radical (•OH), a strong oxidant, promotes oxidation of PS80.
Formation of •OH is dependent on the generation and stability of O2•, H2O2, and Fe2+ (Scheme
1, reactions 2-3, 6). The formation of these intermediates depends on the ratio of Fe3+ and citrate
concentration. Feng et al. have illustrated that an increase in citrate concentration from 50 µM to
200 µM with a constant concentration of iron (10 µM) increases the initial rate of •OH formation;
however, beyond 200 µM citrate the initial rate of •OH formation did not change significantly.41
179
In our experimental conditions, we have used 10 mM citrate, which is in excess to carry out the
photo-Fenton reaction. Additionally, in the same study, increasing the concentration of Fe3+ from
10 µM to 100 µM with constant concentration of citrate (300 µM) showed an increase in the
initial rate of •OH formation. This result also supports our results as we observed increased PS80
oxidation product with increasing iron concentration; however, the oxidation product does not
increase linearly with iron concentration because citrate is a quencher of •OH radical.42 The
reaction rate of •OH with citrate is 2.4 x 10⁸ M-1s-1 43 and with unsaturated hydrocarbons, such as
cis-butene, is 3.68 x 10¹⁰ M-1s-1,44 suggesting that the unsaturated hydrocarbon fatty acids in PS80
have higher reactivity with •OH radical. An •OH radical can either abstract a hydrogen atom from
allylic carbon (dehydrogenation), generating a carbon-centered radical which can readily react
with oxygen at the diffusion-limited reaction, or it can add to the unsaturated bond forming
hydroxy radicals (hydroxylation) (Scheme 2).45-47 Such intermediates can lead to peroxy,
hydroxy, keto, and epoxy product formation.48 The unsaturated fatty acids such as oleic acid and
linoleic acid were reported as common targets in PS80.39, 48-49 These PS80 oxidation products can
react with proteins and oxidize labile amino acids such as Met,50-51 affecting the efficacy of
proteins.
5.4.2. Cis/trans isomerization
Our previous work on PS80 demonstrated the role of thiyl radicals in cis/trans isomerization of
unsaturated fatty acids of PS80.40 A thiyl radical was generated after an electron transfer from
photoionized Trp to a disulfide bond after exposure to UV-B light, which was confirmed by using
a model Trp-containing compound, NATA and GSSG. Namely, we observed increase in the
concentration of elaidic acid (cis-oleic acid) in MS negative mode. In our present work, we
generated a citrate-derived one-electron reductant, •CO2, in presence of Fe3+ after exposure to
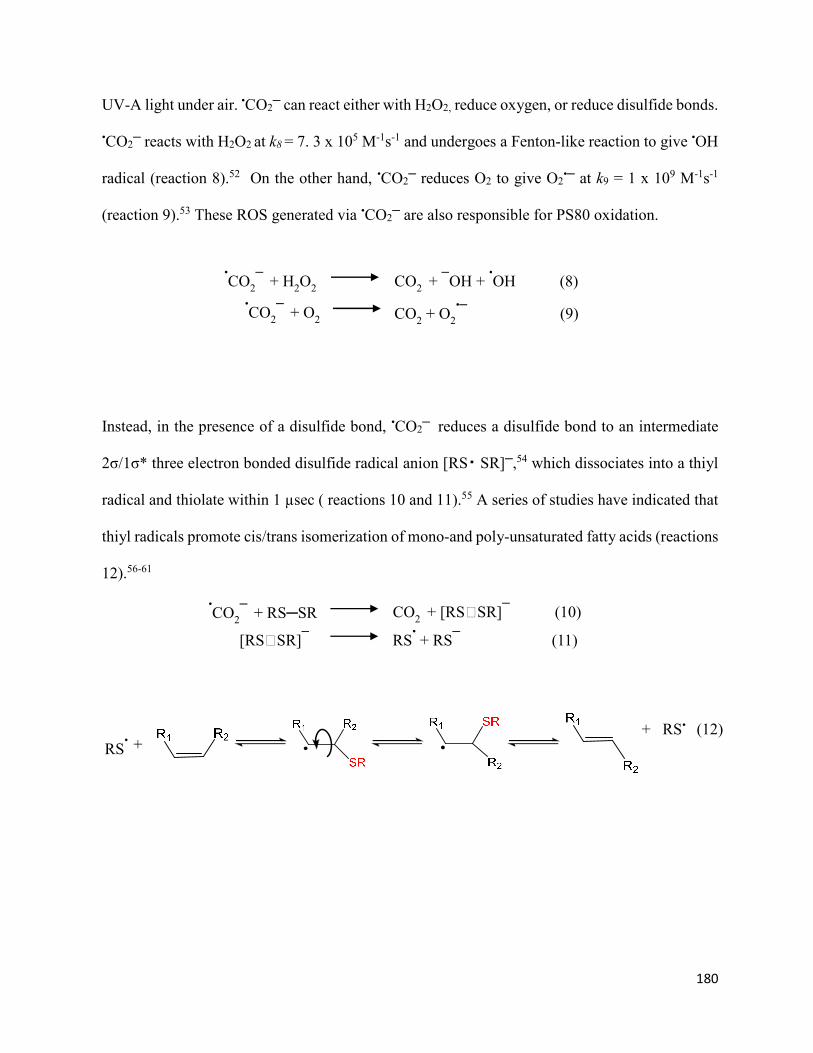
180
UV-A light under air. •CO2 can react either with H2O2, reduce oxygen, or reduce disulfide bonds.
•CO2 reacts with H2O2 at k8 = 7. 3 x 10⁵ M-1s-1 and undergoes a Fenton-like reaction to give •OH
radical (reaction 8).52 On the other hand, •CO2 reduces O2 to give O2
• at k9 = 1 x 10⁹ M-1s-1
(reaction 9).53 These ROS generated via •CO2 are also responsible for PS80 oxidation.
Instead, in the presence of a disulfide bond, •CO2 reduces a disulfide bond to an intermediate
2σ/1σ* three electron bonded disulfide radical anion [RS⸫ SR],54 which dissociates into a thiyl
radical and thiolate within 1 µsec ( reactions 10 and 11).55 A series of studies have indicated that
thiyl radicals promote cis/trans isomerization of mono-and poly-unsaturated fatty acids (reactions
12).56-61
•CO2
+ H2O2 CO2 +
OH +
•OH (8)
•CO2
+ O2 CO2 + O2
• (9)
•CO2
+ RSSR CO2
+ [RS‐SR]
(10)
[RS‐SR] RS
• + RS
(11)
RS• +
+ RS• (12)
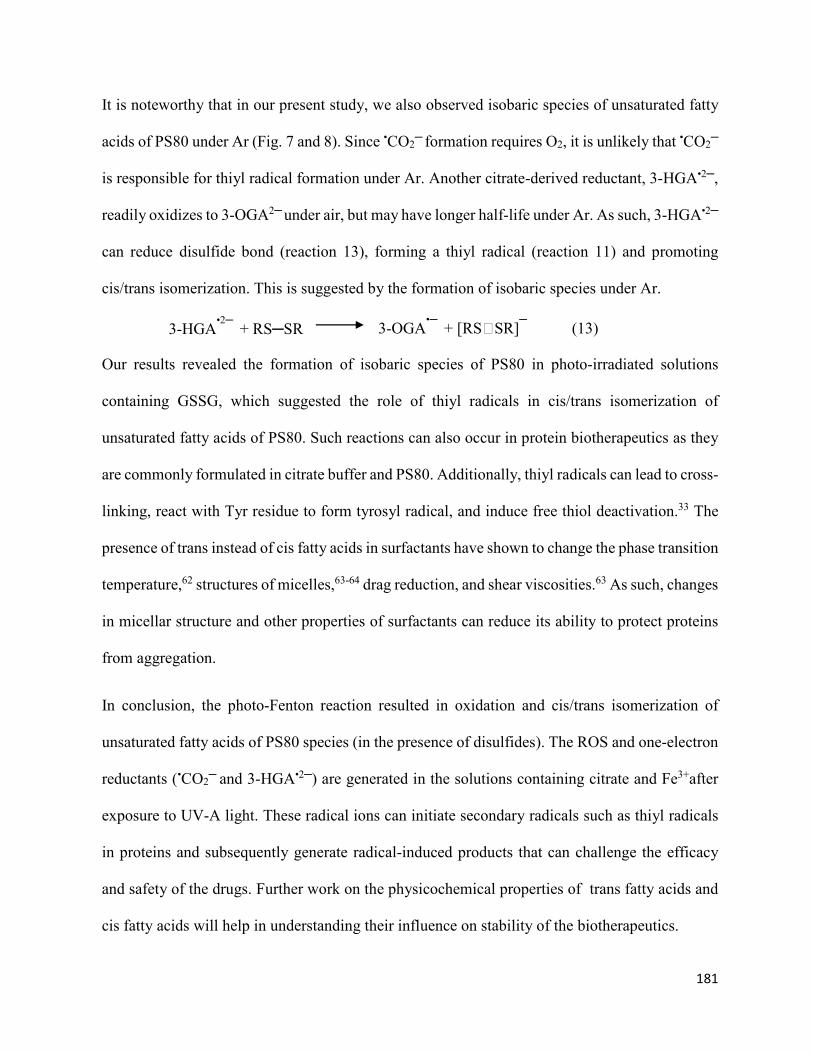
181
It is noteworthy that in our present study, we also observed isobaric species of unsaturated fatty
acids of PS80 under Ar (Fig. 7 and 8). Since •CO2 formation requires O2, it is unlikely that •CO2
is responsible for thiyl radical formation under Ar. Another citrate-derived reductant, 3-HGA•2,
readily oxidizes to 3-OGA2 under air, but may have longer half-life under Ar. As such, 3-HGA•2
can reduce disulfide bond (reaction 13), forming a thiyl radical (reaction 11) and promoting
cis/trans isomerization. This is suggested by the formation of isobaric species under Ar.
Our results revealed the formation of isobaric species of PS80 in photo-irradiated solutions
containing GSSG, which suggested the role of thiyl radicals in cis/trans isomerization of
unsaturated fatty acids of PS80. Such reactions can also occur in protein biotherapeutics as they
are commonly formulated in citrate buffer and PS80. Additionally, thiyl radicals can lead to cross-
linking, react with Tyr residue to form tyrosyl radical, and induce free thiol deactivation.33 The
presence of trans instead of cis fatty acids in surfactants have shown to change the phase transition
temperature,62 structures of micelles,63-64 drag reduction, and shear viscosities.63 As such, changes
in micellar structure and other properties of surfactants can reduce its ability to protect proteins
from aggregation.
In conclusion, the photo-Fenton reaction resulted in oxidation and cis/trans isomerization of
unsaturated fatty acids of PS80 species (in the presence of disulfides). The ROS and one-electron
reductants (•CO2 and 3-HGA•2) are generated in the solutions containing citrate and Fe3+after
exposure to UV-A light. These radical ions can initiate secondary radicals such as thiyl radicals
in proteins and subsequently generate radical-induced products that can challenge the efficacy
and safety of the drugs. Further work on the physicochemical properties of trans fatty acids and
cis fatty acids will help in understanding their influence on stability of the biotherapeutics.
3-HGA•2
+ RSSR 3-OGA•
+ [RS‐SR]
(13)

182
5.5. References
1. Rayaprolu, B. M.; Strawser, J. J.; Anyarambhatla, G., Excipients in parenteral formulations:
selection considerations and effective utilization with small molecules and biologics. Drug
Dev. Ind. Pharm. 2018, 44 (10), 1565-1571.
2. Zhang, Y.; Williams III, R. O.; Tucker, H. O., Formulation strategies in immunotherapeutic
pharmaceutical products. World J. Clin. Oncol. 2020, 11 (5), 275-282.
3. Zbacnik, T. J.; Holcomb, R. E.; Katayama, D. S.; Murphy, B. M.; Payne, R. W.; Coccaro, R.
C.; Evans, G. J.; Matsuura, J. E.; Henry, C. S.; Manning, M. C., Role of Buffers in Protein
Formulations. J. Pharm. Sci. 2017, 106 (3), 713-733.
4. Joshi, V.; Shivach, T.; Kumar, V.; Yadav, N.; Rathore, A., Avoiding antibody aggregation
during processing: establishing hold times. Biotechnol. J. 2014, 9 (9), 1195-1205.
5. Peterson, S. E.; Wang, S.; Ranheim, T.; Owen, K. E., Citrate-mediated disaggregation of
rotavirus particles in RotaTeq® vaccine. Antiviral Res. 2006, 69 (2), 107-115.
6. Roberts, C. J.; Nesta, D. P.; Kim, N., Effects of Temperature and Osmolytes on Competing
Degradation Routes for an IgG1 Antibody. J. Pharm. Sci. 2013, 102 (10), 3556-3566.
7. Roberts, D.; Keeling, R.; Tracka, M.; van der Walle, C. F.; Uddin, S.; Warwicker, J.; Curtis,
R., Specific Ion and Buffer Effects on Protein–Protein Interactions of a Monoclonal Antibody.
Mol. Pharm. 2015, 12 (1), 179-193.
8. Barnett, G. V.; Razinkov, V. I.; Kerwin, B. A.; Hillsley, A.; Roberts, C. J., Acetate- and
Citrate-Specific Ion Effects on Unfolding and Temperature-Dependent Aggregation Rates of
Anti-Streptavidin IgG1. J. Pharm. Sci. 2016, 105 (3), 1066-1073.
9. Barnett, G. V.; Razinkov, V. I.; Kerwin, B. A.; Laue, T. M.; Woodka, A. H.; Butler, P. D.;
Perevozchikova, T.; Roberts, C. J., Specific-Ion Effects on the Aggregation Mechanisms and
Protein–Protein Interactions for Anti-streptavidin Immunoglobulin Gamma-1. J. Phys. Chem.
B 2015, 119 (18), 5793-5804.
10. White, M. C.; Doyle, A. G.; Jacobsen, E. N., A synthetically useful, self-assembling MMO
mimic system for catalytic alkene epoxidation with aqueous H2O2. J. Am. Chem. Soc. 2001,
123 (29), 7194-7195.
11. Kaushik, J. K.; Bhat, R., A mechanistic analysis of the increase in the thermal stability of
proteins in aqueous carboxylic acid salt solutions. Protein Sci. 1999, 8 (1), 222-233.
12. Harinarayan, C.; Skidmore, K.; Kao, Y.; Zydney, A.; Van Reis, R., Small molecule clearance
in ultrafiltration/diafiltration in relation to protein interactions: Study of citrate binding to a
Fab. Biotechnol. Bioeng. 2009, 102 (6), 1718-1722.
13. Kochany, J.; Lipczynska-Kochany, E., Application of the EPR spin-trapping technique for
the investigation of the reactions of carbonate, bicarbonate, and phosphate anions with
hydroxyl radicals generated by the photolysis of H2O2. Chemosphere 1992, 25 (12), 1769-
1782.
14. Goulet, D. R.; Knee, K. M.; King, J. A., Inhibition of unfolding and aggregation of lens protein
human gamma D crystallin by sodium citrate. Exp. Eye Res. 2011, 93 (4), 371-381.

183
15. Ohishi, S. i.; Shimizu, N.; Mihara, K. i.; Imamoto, Y.; Kataoka, M., Light induces
destabilization of photoactive yellow protein. Biochemistry 2001, 40 (9), 2854-2859.
16. Chumsae, C.; Zhou, L. L.; Shen, Y.; Wohlgemuth, J.; Fung, E.; Burton, R.; Radziejewski, C.;
Zhou, Z. S., Discovery of a chemical modification by citric acid in a recombinant monoclonal
antibody. Anal. Chem. 2014, 86 (18), 8932-6.
17. Valliere-Douglass, J. F.; Connell-Crowley, L.; Jensen, R.; Schnier, P. D.; Trilisky, E.; Leith,
M.; Follstad, B. D.; Kerr, J.; Lewis, N.; Vunnum, S.; Treuheit, M. J.; Balland, A.; Wallace,
A., Photochemical degradation of citrate buffers leads to covalent acetonation of recombinant
protein therapeutics. Protein Sci. 2010, 19 (11), 2152-63.
18. Gutteridge, J. M. C., Hydroxyl radical formation from the auto-reduction of a ferric citrate
complex. Free Radic. Biol. Med. 1991, 11 (4), 401-406.
19. Neilands, J., Evolution of biological iron binding centers. In Structure and Bonding, Volume
11, Springer: 1972; pp 145-170.
20. Gautier‐Luneau, I.; Merle, C.; Phanon, D.; Lebrun, C.; Biaso, F.; Serratrice, G.; Pierre, J. L.,
New trends in the chemistry of iron (III) citrate complexes: Correlations between X‐ray
structures and solution species probed by electrospray mass spectrometry and kinetics of iron
uptake from citrate by iron chelators. Chem. Eur. J. 2005, 11 (7), 2207-2219.
21. Rodríguez, E. M.; Núñez, B.; Fernández, G.; Beltrán, F. J., Effects of some carboxylic acids
on the Fe (III)/UVA photocatalytic oxidation of muconic acid in water. Appl. Catal. B 2009,
89 (1-2), 214-222.
22. Ou, X.; Quan, X.; Chen, S.; Zhang, F.; Zhao, Y., Photocatalytic reaction by Fe(III)–citrate
complex and its effect on the photodegradation of atrazine in aqueous solution. J. Photochem.
Photobiol. A: Chem. 2008, 197 (2), 382-388.
23. Seraghni, N.; Belattar, S.; Mameri, Y.; Debbache, N.; Sehili, T., Fe (III)-citrate-complex-
induced photooxidation of 3-methylphenol in aqueous solution. Int. J. Photoenergy 2012,
2012.
24. Nicole, W., Ultraviolet Leaks from CFLs. National Institute of Environmental Health
Sciences: 2012.
25. Buettner, G. R.; Jurkiewicz, B. A., Catalytic metals, ascorbate and free radicals: combinations
to avoid. Radiat. Res. 1996, 145 (5), 532-41.
26. Zhou, S.; Evans, B.; Schöneich, C.; Singh, S. K., Biotherapeutic formulation factors affecting
metal leachables from stainless steel studied by design of experiments. AAPS PharmSciTech
2012, 13 (1), 284-294.
27. Zhou, S.; Schöneich, C.; Singh, S. K., Biologics formulation factors affecting metal
leachables from stainless steel. AAPS PharmSciTech 2011, 12 (1), 411-421.
28. Li, X.; Qian, P., Identification of an exposure risk to heavy metals from pharmaceutical-grade
rubber stoppers. J. Food Drug Anal. 2017, 25 (3), 723-730.
29. Millero, F. J.; Sotolongo, S., The oxidation of Fe(II) with H2O2 in seawater. J.
Geochim.Cosmochim. Acta 1989, 53 (8), 1867-1873.
184
30. Quici, N.; Litter, M. I.; Braun, A. M.; Oliveros, E., Vacuum-UV-photolysis of aqueous
solutions of citric and gallic acids. J. Photochem. Photobiol. A: Chem. 2008, 197 (2-3), 306-
312.
31. Gautier-Luneau, I.; Bertet, P.; Jeunet, A.; Serratrice, G.; Pierre, J.-L., Iron-citrate complexes
and free radicals generation: Is citric acid an innocent additive in foods and drinks? BioMetals
2007, 20 (5), 793-796.
32. Subelzu, N.; Schoneich, C., Near UV and visible light induce iron-dependent photo-
degradation reactions in pharmaceutical buffers: mechanistic and product studies.
(unpublished)
33. Favaudon, V.; Tourbez, H.; Houee-Levin, C.; Lhoste, J. M., Carboxyl radical induced
cleavage of disulfide bonds in proteins. A .gamma.-ray and pulse radiolysis mechanistic
investigation. Biochemistry 1990, 29 (49), 10978-10989.
34. Pozdnyakov, I. P.; Kel, O. V.; Plyusnin, V. F.; Grivin, V. P.; Bazhin, N. M., New insight into
photochemistry of ferrioxalate. J.Phys. Chem. A 2008, 112 (36), 8316-8322.
35. Lee, J.; Seliger, H., Quantum yield of the ferrioxalate actinometer. J. Chem. Phys. 1964, 40
(2), 519-523.
36. Hatchard, C.; Parker, C. A., A new sensitive chemical actinometer-II. Potassium ferrioxalate
as a standard chemical actinometer. Proc. R. Soc. London, Ser. A 1956, 235 (1203), 518-536.
37. Guideline, I. H. T., Photostability testing of new drug substance and products. Fed. Register
1996, 62, 27115-27122.
38. Borisov, O. V.; Ji, J. A.; Wang, Y. J.; Vega, F.; Ling, V. T., Toward understanding molecular
heterogeneity of polysorbates by application of liquid chromatography–mass spectrometry
with computer-aided data analysis. Anal. Chem. 2011, 83 (10), 3934-3942.
39. Kerwin, B. A., Polysorbates 20 and 80 used in the formulation of protein biotherapeutics:
structure and degradation pathways. J. Pharm. Sci. 2008, 97 (8), 2924-35.
40. Prajapati, I.; Peters, B.-H.; Larson, N. R.; Wei, Y.; Choudhary, S.; Kalonia, C.; Hudak, S.;
Esfandiary, R.; Middaugh, C. R.; Schöneich, C., Cis/Trans Isomerization of Unsaturated Fatty
Acids in Polysorbate 80 During Light Exposure of a Monoclonal Antibody–Containing
Formulation. J. Pharm. Sci. 2020, 109 (1), 603-613.
41. Feng, X.; Wang, Z.; Chen, Y.; Tao, T.; Wu, F.; Zuo, Y., Effect of Fe(III)/Citrate
Concentrations and Ratio on the Photoproduction of Hydroxyl Radicals: Application on the
Degradation of Diphenhydramine. Ind. Eng. Chem. Res. 2012, 51 (20), 7007-7012.
42. Bektaşoğlu, B.; Celik, S. E.; Özyürek, M.; Güçlü, K.; Apak, R., Novel hydroxyl radical
scavenging antioxidant activity assay for water-soluble antioxidants using a modified
CUPRAC method. Biochem. Biophys. Res. Chem. 2006, 345 (3), 1194-1200.
43. Zepp, R. G.; Faust, B. C.; Hoigne, J., Hydroxyl radical formation in aqueous reactions (pH 3-
8) of iron (II) with hydrogen peroxide: the photo-Fenton reaction. Environ. Sci. Technol. 1992,
26 (2), 313-319.
44. Morris, E. D.; Niki, H., Reactivity of hydroxyl radicals with olefins. J. of Phys. Chem. 1971,
75 (23), 3640-3641.

185
45. Dorfman, L. M.; Adams, G. E. Reactivity of the hydroxyl radical in aqueous solutions;
National Standard Reference Data System: 1973.
46. Mousset, E.; Oturan, N.; Oturan, M. A., An unprecedented route of OH radical reactivity
evidenced by an electrocatalytical process: Ipso-substitution with perhalogenocarbon
compounds. Appl. Catal. B 2018, 226, 135-146.
47. Oturan, M. A.; Aaron, J.-J., Advanced oxidation processes in water/wastewater treatment:
principles and applications. A review. Crit. Rev. Environ. Sci. Technol. 2014, 44 (23), 2577-
2641.
48. Borisov, O. V.; Ji, J. A.; John Wang, Y., Oxidative Degradation of Polysorbate Surfactants
Studied by Liquid Chromatography–Mass Spectrometry. J. Pharm. Sci. 2015, 104 (3), 1005-
1018.
49. Yao, J.; Dokuru, D. K.; Noestheden, M.; Park, S. S.; Kerwin, B. A.; Jona, J.; Ostovic, D.;
Reid, D. L., A Quantitative Kinetic Study of Polysorbate Autoxidation: The Role of
Unsaturated Fatty Acid Ester Substituents. Pharm. Res. 2009, 26 (10), 2303-2313.
50. Wang, W.; Wang, Y. J.; Wang, D. Q., Dual effects of Tween 80 on protein stability. Int. J.
Pharm. 2008, 347 (1), 31-38.
51. Ha, E.; Wang, W.; Wang, Y. J., Peroxide formation in polysorbate 80 and protein stability. J.
Pharm. Sci. 2002, 91 (10), 2252-64.
52. Kishore, K.; Moorthy, P.; Rao, K., Reactivity of H2O2 with radiation produced free radicals:
steady state radiolysis methods for estimating the rate constants. Int. J. Rad. Appl. C 1987,
29 (4), 309-313.
53. Packer, J.; Mahood, J.; Mora-Arellano, V.; Slater, T.; Willson, R.; Wolfenden, B., Free
radicals and singlet oxygen scavengers: reaction of a peroxy-radical with β-carotene, diphenyl
furan and 1, 4-diazobicyclo (2, 2, 2)-octane. Biochem. Biophys. Res. Chem 1981, 98 (4), 901-
906.
54. Asmus, K.-D., Sulfur-centered three-electron bonded radical species. In Sulfur-centered
reactive intermediates in chemistry and biology, Springer: 1990; pp 155-172.
55. Asmus, K.-D., [15] Sulfur-centered free radicals. In Methods Enzymol., Elsevier: 1990; Vol.
186, pp 168-180.
56. Chatgilialoglu, C.; Ferreri, C.; Ballestri, M.; Mulazzani, Q. G.; Landi, L., Cis− trans
isomerization of monounsaturated fatty acid residues in phospholipids by thiyl radicals. J.
Am. Chem. Soc. 2000, 122 (19), 4593-4601.
57. Chatgilialoglu, C.; Ferreri, C.; Guerra, M.; Samadi, A.; Bowry, V. W., The reaction of thiyl
radical with methyl linoleate: completing the Picture. J. Am. Chem. Soc. 2017, 139 (13), 4704-
4714.
58. Chatgilialoglu, C.; Ferreri, C.; Melchiorre, M.; Sansone, A.; Torreggiani, A., Lipid
geometrical isomerism: from chemistry to biology and diagnostics. Chem. Rev. 2014, 114 (1),
255-284.
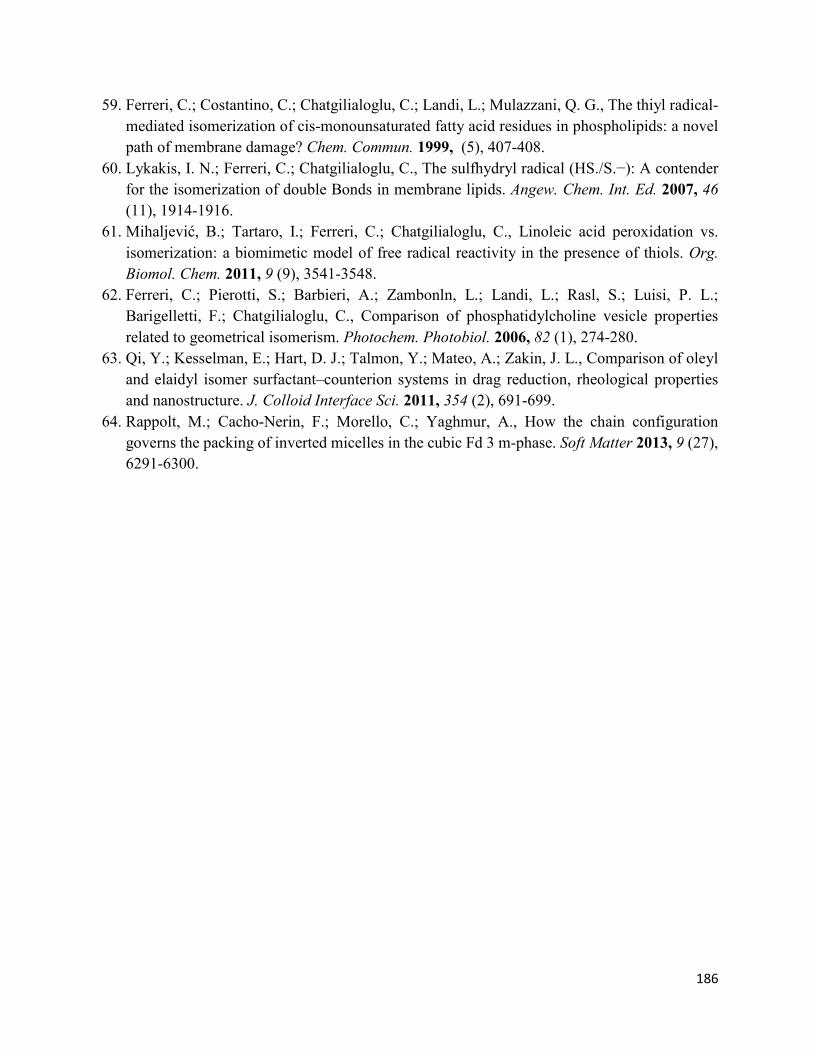
186
59. Ferreri, C.; Costantino, C.; Chatgilialoglu, C.; Landi, L.; Mulazzani, Q. G., The thiyl radical-
mediated isomerization of cis-monounsaturated fatty acid residues in phospholipids: a novel
path of membrane damage? Chem. Commun. 1999, (5), 407-408.
60. Lykakis, I. N.; Ferreri, C.; Chatgilialoglu, C., The sulfhydryl radical (HS./S.−): A contender
for the isomerization of double Bonds in membrane lipids. Angew. Chem. Int. Ed. 2007, 46
(11), 1914-1916.
61. Mihaljević, B.; Tartaro, I.; Ferreri, C.; Chatgilialoglu, C., Linoleic acid peroxidation vs.
isomerization: a biomimetic model of free radical reactivity in the presence of thiols. Org.
Biomol. Chem. 2011, 9 (9), 3541-3548.
62. Ferreri, C.; Pierotti, S.; Barbieri, A.; Zambonln, L.; Landi, L.; Rasl, S.; Luisi, P. L.;
Barigelletti, F.; Chatgilialoglu, C., Comparison of phosphatidylcholine vesicle properties
related to geometrical isomerism. Photochem. Photobiol. 2006, 82 (1), 274-280.
63. Qi, Y.; Kesselman, E.; Hart, D. J.; Talmon, Y.; Mateo, A.; Zakin, J. L., Comparison of oleyl
and elaidyl isomer surfactant–counterion systems in drag reduction, rheological properties
and nanostructure. J. Colloid Interface Sci. 2011, 354 (2), 691-699.
64. Rappolt, M.; Cacho-Nerin, F.; Morello, C.; Yaghmur, A., How the chain configuration
governs the packing of inverted micelles in the cubic Fd 3 m-phase. Soft Matter 2013, 9 (27),
6291-6300.
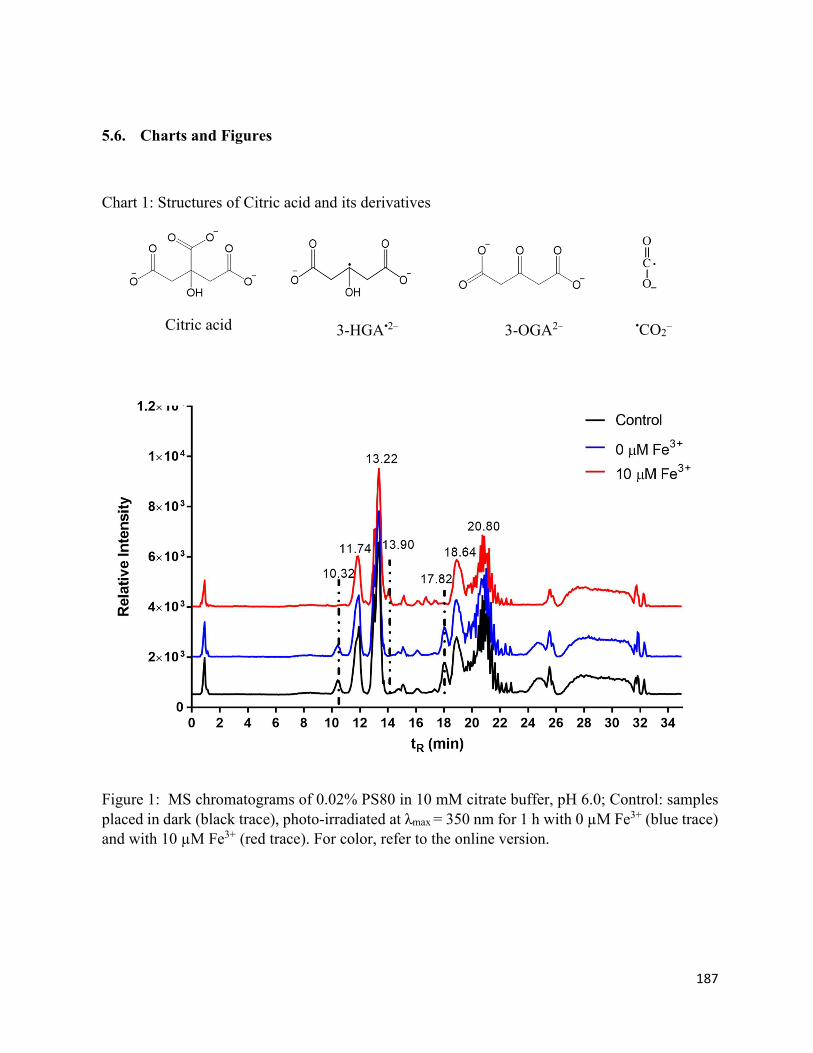
187
5.6. Charts and Figures
Chart 1: Structures of Citric acid and its derivatives
Figure 1: MS chromatograms of 0.02% PS80 in 10 mM citrate buffer, pH 6.0; Control: samples placed in dark (black trace), photo-irradiated at λmax = 350 nm for 1 h with 0 µM Fe3+ (blue trace) and with 10 µM Fe3+ (red trace). For color, refer to the online version.
Citric acid 3-HGA•2‒ 3-OGA2‒ •CO2‒
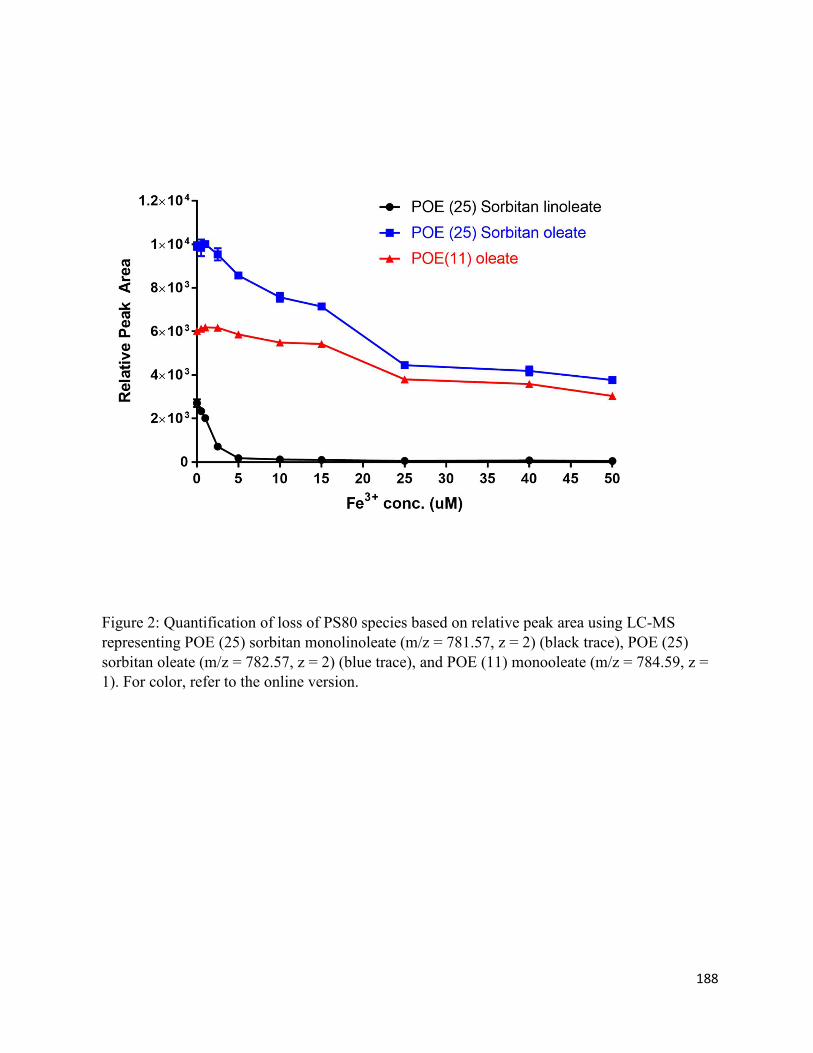
188
Figure 2: Quantification of loss of PS80 species based on relative peak area using LC-MS representing POE (25) sorbitan monolinoleate (m/z = 781.57, z = 2) (black trace), POE (25) sorbitan oleate (m/z = 782.57, z = 2) (blue trace), and POE (11) monooleate (m/z = 784.59, z = 1). For color, refer to the online version.
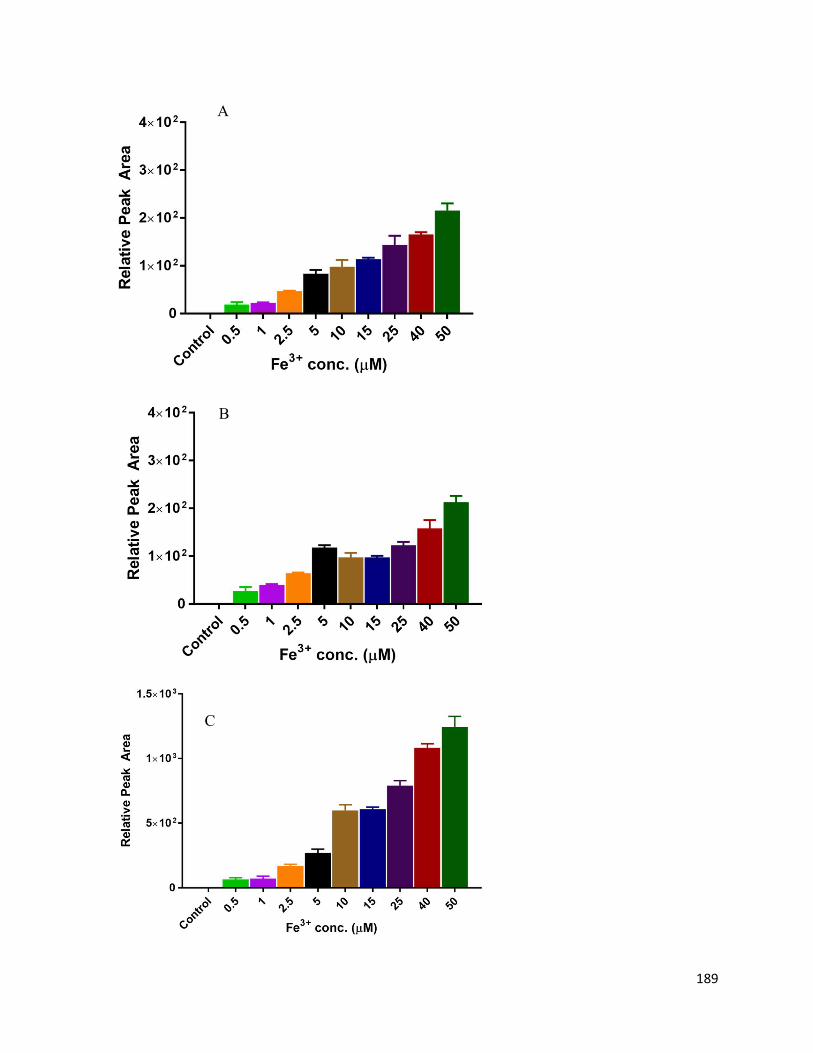
189
A
B
C
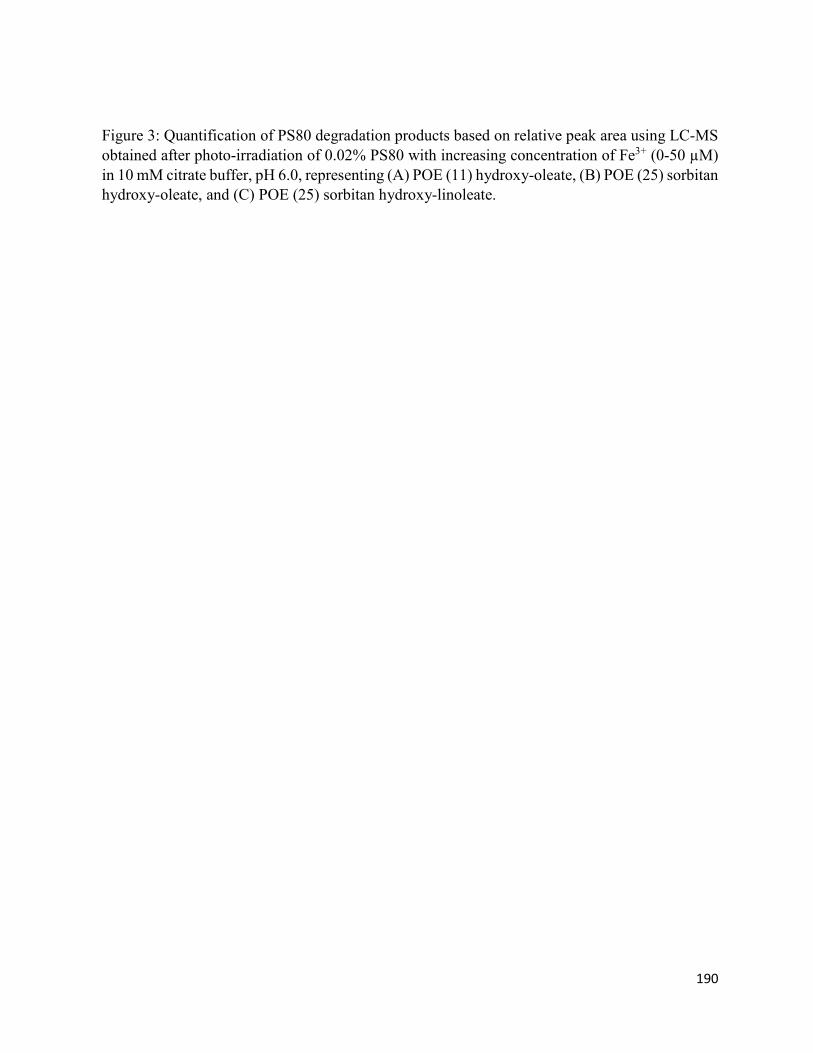
190
Figure 3: Quantification of PS80 degradation products based on relative peak area using LC-MS obtained after photo-irradiation of 0.02% PS80 with increasing concentration of Fe3+ (0-50 µM) in 10 mM citrate buffer, pH 6.0, representing (A) POE (11) hydroxy-oleate, (B) POE (25) sorbitan hydroxy-oleate, and (C) POE (25) sorbitan hydroxy-linoleate.
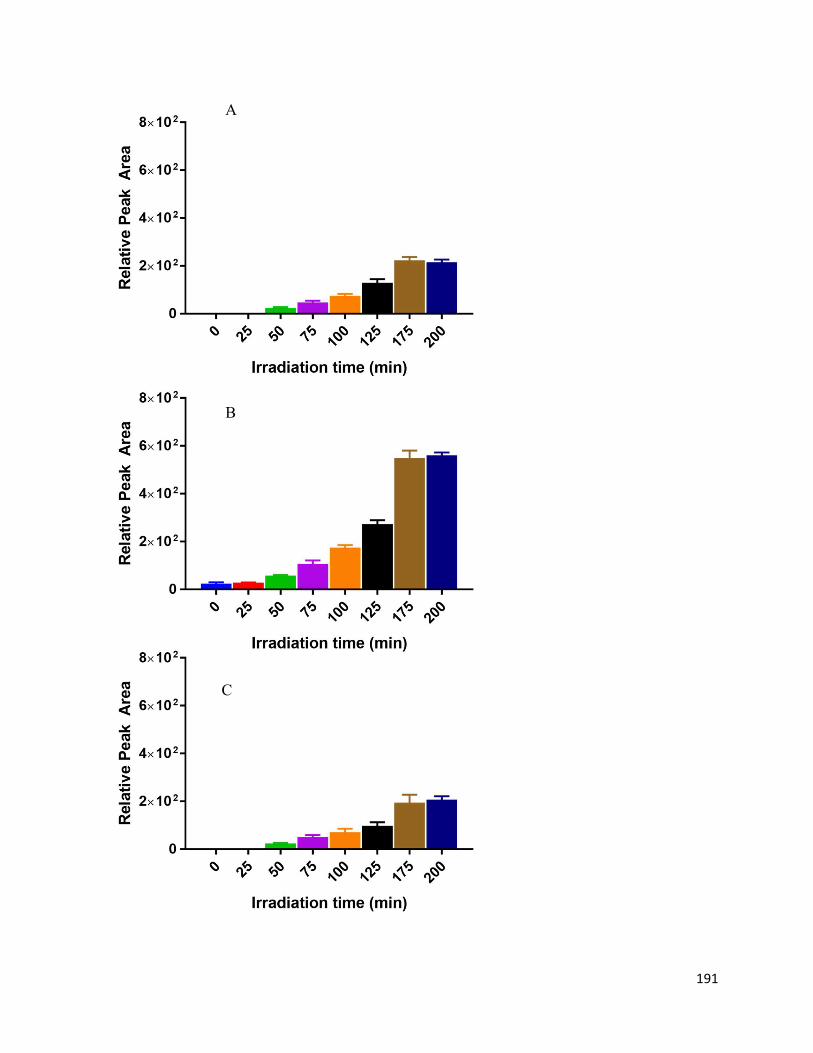
191
A
B
C
192
Figure 4: Quantification of PS80 hydroxylation products based on relative peak area using LC-MS obtained after photo-irradiation (up to 200 min) of 0.02% PS80 with 1 µM Fe3+ in 10 mM citrate buffer, pH 6.0, representing (A) POE (11) hydroxy-oleate, (B) POE (25) sorbitan hydroxy-oleate, and (C) POE (25) sorbitan hydroxy-linoleate.

193
Figure 5: (A) XIC chromatograms of POE(11) oleate and (B) XIC chromatograms of POE(25) sorbitan oleate placed in dark-Control (black trace) and after photo-irradiation of 0.02% PS80 with 10 µM Fe3+ and 5mM GSSG in 10 mM citrate buffer (blue trace), 20 mM citrate buffer (red trace), and 50 mM citrate buffer (green trace) at pH 6.0.
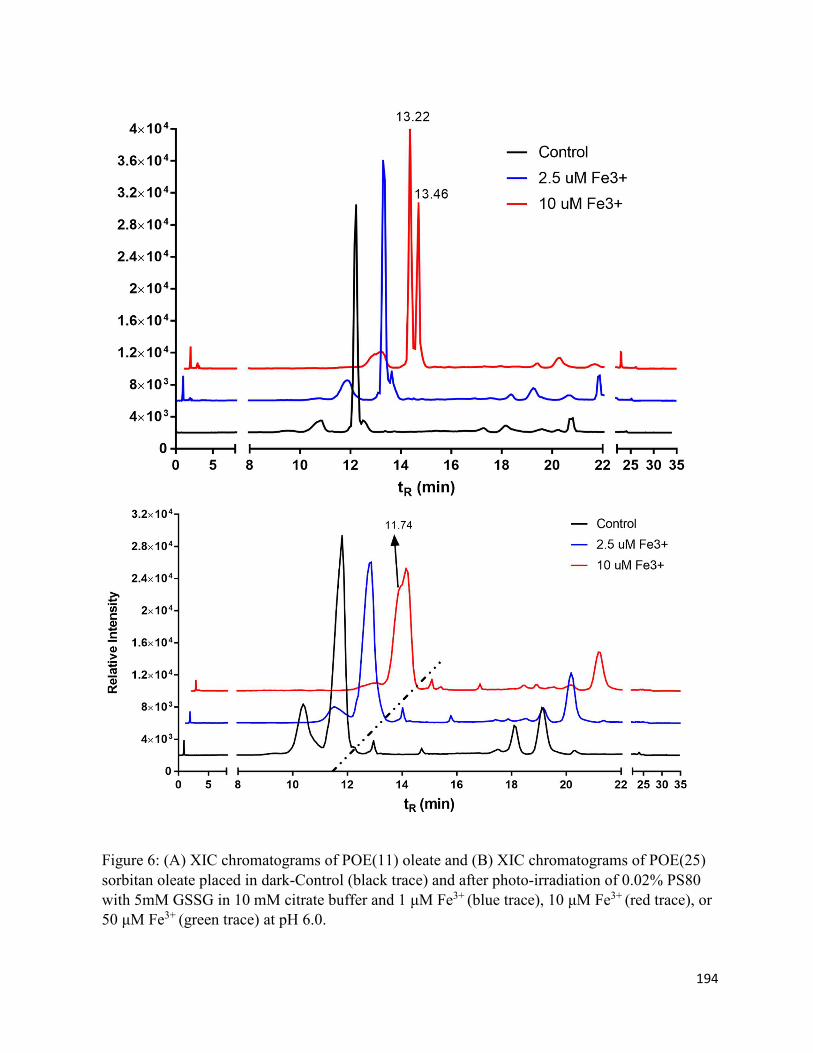
194
Figure 6: (A) XIC chromatograms of POE(11) oleate and (B) XIC chromatograms of POE(25) sorbitan oleate placed in dark-Control (black trace) and after photo-irradiation of 0.02% PS80 with 5mM GSSG in 10 mM citrate buffer and 1 μM Fe3+ (blue trace), 10 μM Fe3+ (red trace), or 50 μM Fe3+ (green trace) at pH 6.0.
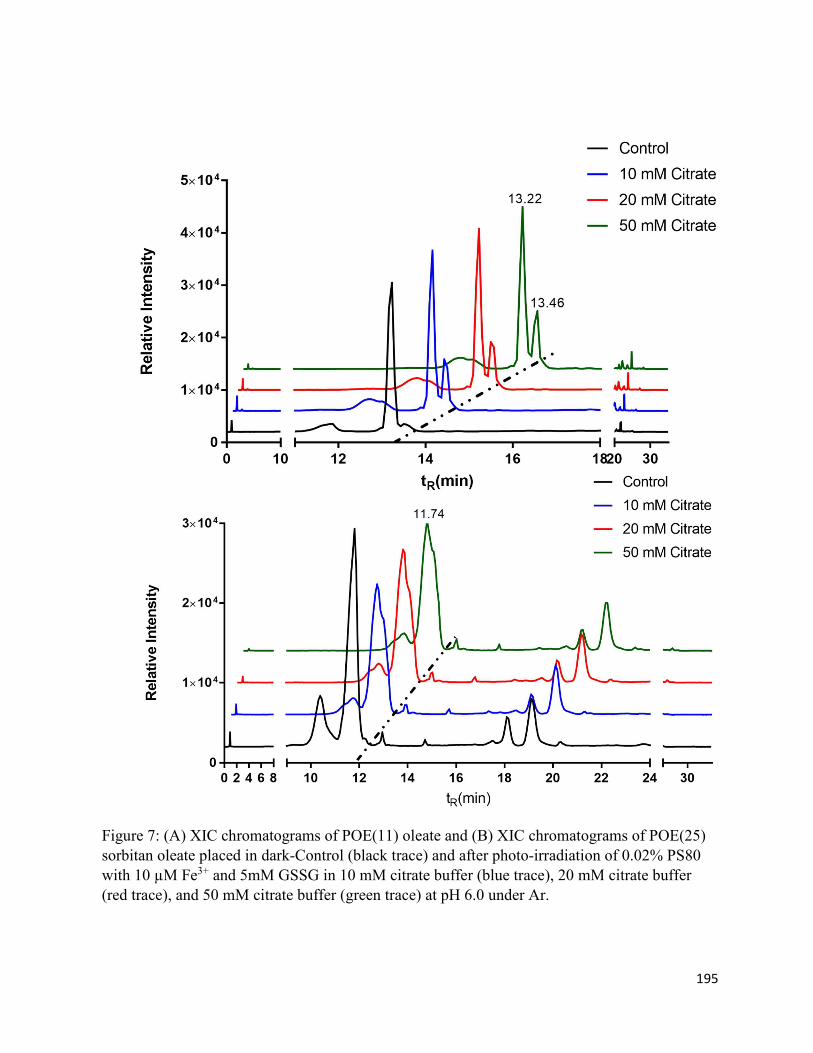
195
Figure 7: (A) XIC chromatograms of POE(11) oleate and (B) XIC chromatograms of POE(25) sorbitan oleate placed in dark-Control (black trace) and after photo-irradiation of 0.02% PS80 with 10 µM Fe3+ and 5mM GSSG in 10 mM citrate buffer (blue trace), 20 mM citrate buffer (red trace), and 50 mM citrate buffer (green trace) at pH 6.0 under Ar.
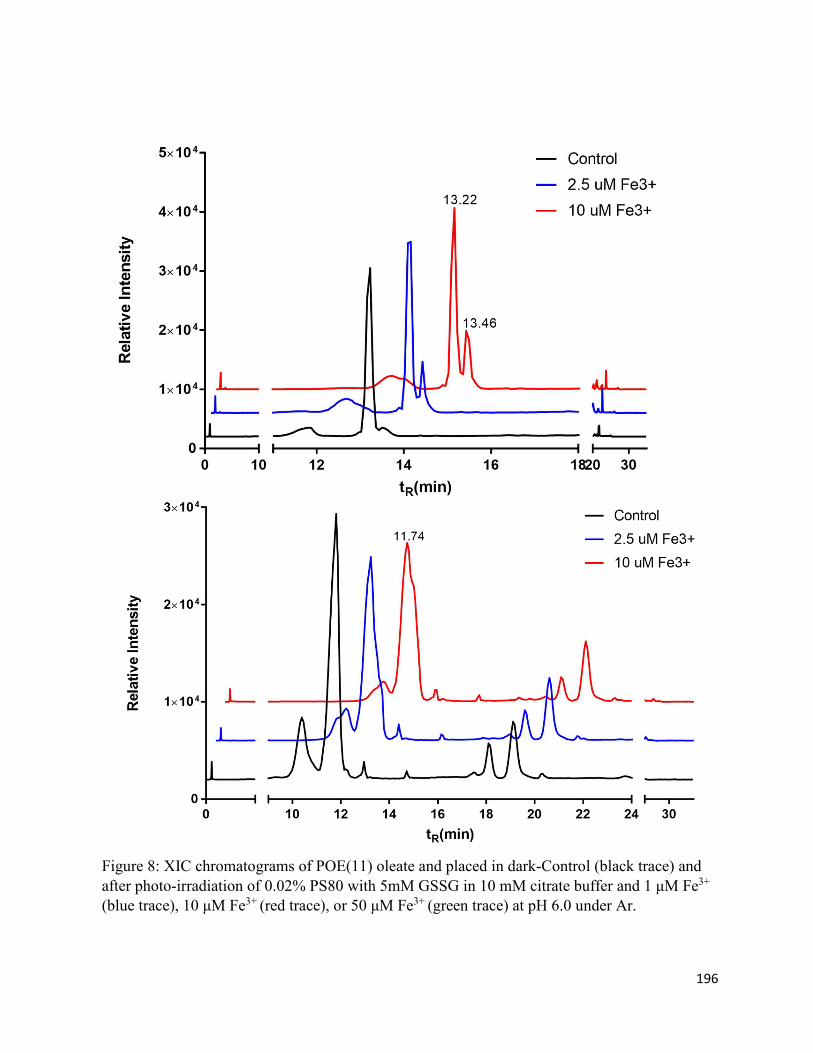
196
Figure 8: XIC chromatograms of POE(11) oleate and placed in dark-Control (black trace) and after photo-irradiation of 0.02% PS80 with 5mM GSSG in 10 mM citrate buffer and 1 μM Fe3+
(blue trace), 10 μM Fe3+ (red trace), or 50 μM Fe3+ (green trace) at pH 6.0 under Ar.
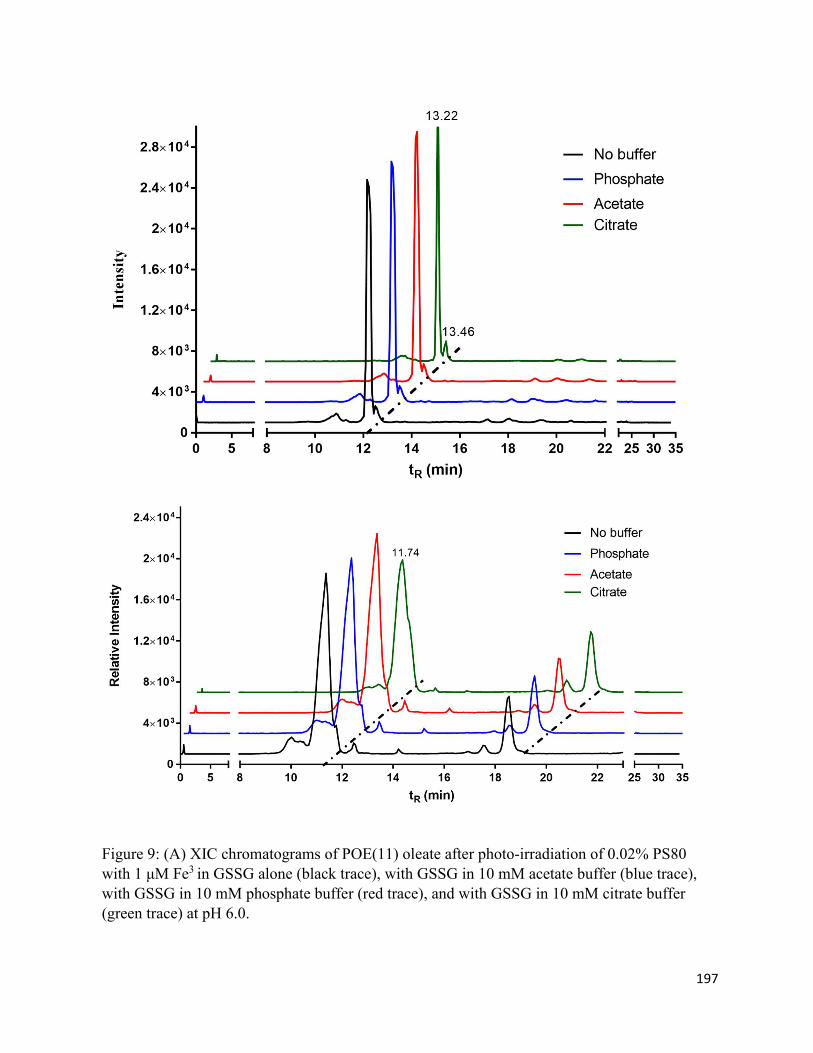
197
Figure 9: (A) XIC chromatograms of POE(11) oleate after photo-irradiation of 0.02% PS80 with 1 μM Fe3 in GSSG alone (black trace), with GSSG in 10 mM acetate buffer (blue trace), with GSSG in 10 mM phosphate buffer (red trace), and with GSSG in 10 mM citrate buffer (green trace) at pH 6.0.

198
5.7. Schemes
Scheme 1: Generation of carboxyl radical (R-COO•), hydroxyl radical (•OH), 3-hydroxy-glutarate radical (3-HGA2-•), 3-oxo-glutarate (3-OGA2-), and carbon dioxide radical anion (•CO2
-) via photo-Fenton reaction.

199
Scheme 2: Degradation of unsaturated fatty acid of PS80 species by hydroxyl radical
Other oxidation products
H2O +
200
Chapter 6: Conclusions and Future Directions

201
6.1. Summary and conclusions
The ingredients in drug products are prone to oxidation upon light exposure. Interactions between
active pharmaceutical ingredients and excipients play a major role in the stability and efficacy of
the drug products and determine their shelf-lives. It is important to monitor any chemical and
physical instabilities that may occur during manufacturing, storage, and delivery of these drug
products. Therefore, the aim of this dissertation is to understand the effect of photo-induced
radicals and radical ions on physical and chemical instabilities of ingredients in the peptide and
protein formulations.
Chapter 2 investigates a role of Met>S•+ on the peptides containing Met-Xn-His sequences,
which are present in protein biotherapeutics such as mAbs and hPTH. A series of novel
photoproducts including a covalent cross-link between Met oxidation product(s) and a neighboring
histidine residue was observed, which is possibly related to a carbon-centered radical generated
via deprotonation of Met>S•+. A Gly or Gly-Gly bridging Met and His also resulted in the cross-
link product, revealing the possibility of these cross-links formation even when Met and His are
not linked by an amide bond. These products were identified by HPLC-MS/MS, by reduction with
NaBH4, derivatization with GRT, and/or alkylation with NEM. The formation of such a cross-link
may lead to nonreducible aggregates and loss in biological efficacy as it changes the Met residues
irreversibly.
Chapter 3 compares the photostability of mAbZ in NaAc and His/Lys buffer when exposed to
visible light. mAbZ formulated in His/Lys buffer is superior to NaAc buffer as less aggregation
and color change were observed in His/Lys buffer. A chromophoric photoproduct responsible for
the color change in mAbZ was characterized by using a model Trp-containing compound, NATA.
The chromophoric product was identified as NATA-33 (loss of 33 Da) by HPLC-MS/MS and the
202
tentative structure of the product was proposed based on 1H-, 13C-, and HSQC NMR spectra. The
proposed structures have three conjugated rings, which are formed with breakage of an amide
bond; such products, if formed in CDR region of a mAb, can affect its binding ability and can
result in a loss of efficacy. Thus, the photo-sensitive proteins should be protected from long
exposure to visible light in addition to UV light.
Chapter 4 identified light-induced cis/trans isomerization of unsaturated fatty acids of PS80 (oleic
and linoleic acid) in the presence of mAbZ under UV-B light. The mechanistic study was carried
out with NATA and disulfide bonds (GSSG), which indicated the role of thiyl radical in cis/trans
isomerization. The trans fatty acids, as revealed by negative mode in MS, were confirmed by
spiking of commercially available free fatty acid standards. The presence of trans fatty acid may
impact the physicochemical properties of PS80 micelles. Furthermore, together with linoleic acid,
we detected conjugated linoleic acids in PS80, which also underwent light-induced cis/trans
isomerization. The conjugated fatty acids are susceptible to radical formation, which can propagate
other reactions within the formulation.
Chapter 5 revealed key roles of UV-A light exposed solutions containing citrate and Fe3+ in the
oxidation and cis/trans isomerization of unsaturated fatty acids of PS80. After generation of light-
induced ROS, oxidation products such as hydroxylation products in PS80 were quantified, which
increased with increasing iron concentration and longer duration of light exposure. On the other
hand, citrate-derived one-electron reductants transfer electrons to disulfide bonds (GSSG), leading
to the formation of thiols and thiyl radicals, which can induce cis/trans isomerization of unsaturated
fatty acids of PS80, suggested by the formation of isobaric products in oleic acids containing
species. The presence of trans-fatty acids in modified PS80 may change the structure of PS80
micelles. Moreover, the radicals and radical ions generated in the photo-irradiated solutions
203
containing citrate and Fe3+ can also directly react with proteins. Subsequently, these radicals and
radical ions can generate secondary protein-bound radicals, which can drive unwanted reactions
and generate oxidation products that can affect their stability and efficacy.
6.2. Future works
The formation of photo-induced cross-links in Met-Xn-His sequence (n = 0-2) of model peptides
is of importance in protein biotherapeutics containing the Met-Xn-His sequence such as mAbs and
hPTH. Further investigations can be carried out to identify such cross-link between Met oxidation
product and His in protein biotherapeutics. Changes in the side chain of amino acids can affect
their function, especially in case of mAb, Met and His play role in receptor binding. Likewise,
identification of chromophoric species leading to color change in mAbs can give insights into
degradation of Trp residue, which is one of the important amino acids in CDR region responsible
for antigen binding.
Our studies on PS80 degradation suggested that both proteins and other excipients such as citrate
buffer (with iron) can lead to oxidation and cis/trans isomerization of PS80. Conversion of cis-
unsaturated fatty acids into trans-unsaturated fatty acids may change the micellar structures of
PS80, so the effect of trans-unsaturated fatty acid on micellar structure and stability of proteins in
liquid formulation can be carried out.