In Vitro Fertilization and Embryo Culture Strongly Impact the Placental Transcriptome in the Mouse...
13
In Vitro Fertilization and Embryo Culture Strongly Impact the Placental Transcriptome in the Mouse Model Patricia Fauque 1,2,3 *, Franc ¸oise Mondon 2,3 , Franck Letourneur 2,4 , Marie-Anne Ripoche 2,3 , Laurent Journot 5 , Sandrine Barbaux 2,3 , Luisa Dandolo 2,3 , Catherine Patrat 1,2 , Jean-Philippe Wolf 1,2 , Pierre Jouannet 1,2 , He ´le ` ne Jammes 2,3,6 , Daniel Vaiman 2,3 1 Service d’Histologie-Embryologie, Biologie de la Reproduction, Ho ˆ pital Cochin, Paris, France, 2 Universite ´ Paris Descartes, Paris, France, 3 De ´partement Ge ´ne ´tique et De ´veloppement, Equipe 21, Institut Cochin, INSERM U567, CNRS (UMR 8104), Paris, France, 4 Plateforme de Ge ´ nomique, Institut Cochin, Paris, France, 5 Institut de Ge ´nomique Fonctionnelle, Montpellier, France, 6 Biologie du De ´veloppement et Reproduction, UMR1198 INRA-ENVA, Jouy en Josas, France Abstract Background: Assisted Reproductive Technologies (ART) are increasingly used in humans; however, their impact is now questioned. At blastocyst stage, the trophectoderm is directly in contact with an artificial medium environment, which can impact placental development. This study was designed to carry out an in-depth analysis of the placental transcriptome after ART in mice. Methodology/Principal Findings: Blastocysts were transferred either (1) after in vivo fertilization and development (control group) or (2) after in vitro fertilization and embryo culture. Placentas were then analyzed at E10.5. Six percent of transcripts were altered at the two-fold threshold in placentas of manipulated embryos, 2/3 of transcripts being down-regulated. Strikingly, the X-chromosome harbors 11% of altered genes, 2/3 being induced. Imprinted genes were modified similarly to the X. Promoter composition analysis indicates that FOXA transcription factors may be involved in the transcriptional deregulations. Conclusions: For the first time, our study shows that in vitro fertilization associated with embryo culture strongly modify the placental expression profile, long after embryo manipulations, meaning that the stress of artificial environment is memorized after implantation. Expression of X and imprinted genes is also greatly modulated probably to adapt to adverse conditions. Our results highlight the importance of studying human placentas from ART. Citation: Fauque P, Mondon F, Letourneur F, Ripoche M-A, Journot L, et al. (2010) In Vitro Fertilization and Embryo Culture Strongly Impact the Placental Transcriptome in the Mouse Model. PLoS ONE 5(2): e9218. doi:10.1371/journal.pone.0009218 Editor: Jay M. Baltz, Ottawa Hospital Research Institute and University of Ottawa, Canada Received November 12, 2009; Accepted January 24, 2010; Published February 15, 2010 Copyright: ß 2010 Fauque et al. This is an open-access article distributed under the terms of the Creative Commons Attribution License, which permits unrestricted use, distribution, and reproduction in any medium, provided the original author and source are credited. Funding: This research was supported by grants from the ‘‘Fond d’Aide la Recherche d’Organon’’ (ALA-570/06) and from the ‘‘Agence de Biomedecine’’ (06.21.DPM OMA 09), France. The funders had no role in study design, data collection and analysis, decision to publish, or preparation of the manuscript. Competing Interests: The authors have declared that no competing interests exist. * E-mail: [email protected] Introduction It is estimated that 2.2% of children born each year in the United States were conceived with the help of assisted reproductive techniques (ART) including in vitro fertilization (IVF) and intra- cytoplasmic sperm injection (ICSI) [1]. Although these techniques are thought to be safe, new evidence suggests an increased risk of morbid congenital problems associated with their use [2,3], such as cerebral palsy and delayed development [4], low birth weight [5,6], and increased major birth defects [3,5–9]. Furthermore, in recent years even if contradictory findings exist [9–12], several reports suggested that IVF increases the risk of epigenetic disorders [13,14] including Beckwith–Wiedemann [15–19], Angelman [18,20,21] and Silver-Russell syndromes [22–24]. While infertility, per se, could be at least partly responsible for these diseases [25], the extent of the anomalies observed indicates that infertility alone does not explain all the alterations, part of them being certainly due to embryo culture and more generally to the reproductive technology applied to the gametes and the embryo. Indeed, studies in animal models have demonstrated that embryo culture [26,27] and in vitro fertilization [28,29] of mouse or bovine preimplantation embryos alter their gene expression patterns when compared with in vivo produced embryos. It is important to investigate whether these changes are only temporary or whether they may subsequently induce deleterious consequenc- es. In mice, post-natal development and behavioral parameters (memory deficiencies at adult stage, altered behaviors and growth anomalies in standard tests) have been shown to be affected by embryo culture during the preimplantation period [30,31]. These abnormal phenotypes could be the consequences of early (around implantation) gene profile modifications with persistent effects. The placenta plays a crucial developmental function as the interface between the mother and the developing fetus. As such, it has been proposed to play the role of a filter against deleterious environmental influences, such as exposure to xenobiotics [32], toxins [33,34], infectious agents and parasites [35]. In the present study, we analyzed the transcriptomic effects of in vitro embryo manipulations on the expression profile of placental genes (analyzed at 10.5 days post-fertilization, as depicted in Figure 1). We show that early manipulations are not completely buffered at PLoS ONE | www.plosone.org 1 February 2010 | Volume 5 | Issue 2 | e9218
Transcript of In Vitro Fertilization and Embryo Culture Strongly Impact the Placental Transcriptome in the Mouse...
In Vitro Fertilization and Embryo Culture Strongly Impactthe Placental Transcriptome in the Mouse ModelPatricia Fauque1,2,3*, Francoise Mondon2,3, Franck Letourneur2,4, Marie-Anne Ripoche2,3, Laurent
Journot5, Sandrine Barbaux2,3, Luisa Dandolo2,3, Catherine Patrat1,2, Jean-Philippe Wolf1,2, Pierre
Jouannet1,2, Helene Jammes2,3,6, Daniel Vaiman2,3
1 Service d’Histologie-Embryologie, Biologie de la Reproduction, Hopital Cochin, Paris, France, 2 Universite Paris Descartes, Paris, France, 3 Departement Genetique et
Developpement, Equipe 21, Institut Cochin, INSERM U567, CNRS (UMR 8104), Paris, France, 4 Plateforme de Genomique, Institut Cochin, Paris, France, 5 Institut de
Genomique Fonctionnelle, Montpellier, France, 6 Biologie du Developpement et Reproduction, UMR1198 INRA-ENVA, Jouy en Josas, France
Abstract
Background: Assisted Reproductive Technologies (ART) are increasingly used in humans; however, their impact is nowquestioned. At blastocyst stage, the trophectoderm is directly in contact with an artificial medium environment, which canimpact placental development. This study was designed to carry out an in-depth analysis of the placental transcriptomeafter ART in mice.
Methodology/Principal Findings: Blastocysts were transferred either (1) after in vivo fertilization and development (controlgroup) or (2) after in vitro fertilization and embryo culture. Placentas were then analyzed at E10.5. Six percent of transcriptswere altered at the two-fold threshold in placentas of manipulated embryos, 2/3 of transcripts being down-regulated.Strikingly, the X-chromosome harbors 11% of altered genes, 2/3 being induced. Imprinted genes were modified similarly tothe X. Promoter composition analysis indicates that FOXA transcription factors may be involved in the transcriptionalderegulations.
Conclusions: For the first time, our study shows that in vitro fertilization associated with embryo culture strongly modify theplacental expression profile, long after embryo manipulations, meaning that the stress of artificial environment ismemorized after implantation. Expression of X and imprinted genes is also greatly modulated probably to adapt to adverseconditions. Our results highlight the importance of studying human placentas from ART.
Citation: Fauque P, Mondon F, Letourneur F, Ripoche M-A, Journot L, et al. (2010) In Vitro Fertilization and Embryo Culture Strongly Impact the PlacentalTranscriptome in the Mouse Model. PLoS ONE 5(2): e9218. doi:10.1371/journal.pone.0009218
Editor: Jay M. Baltz, Ottawa Hospital Research Institute and University of Ottawa, Canada
Received November 12, 2009; Accepted January 24, 2010; Published February 15, 2010
Copyright: � 2010 Fauque et al. This is an open-access article distributed under the terms of the Creative Commons Attribution License, which permitsunrestricted use, distribution, and reproduction in any medium, provided the original author and source are credited.
Funding: This research was supported by grants from the ‘‘Fond d’Aide la Recherche d’Organon’’ (ALA-570/06) and from the ‘‘Agence de Biomedecine’’(06.21.DPM OMA 09), France. The funders had no role in study design, data collection and analysis, decision to publish, or preparation of the manuscript.
Competing Interests: The authors have declared that no competing interests exist.
* E-mail: [email protected]
Introduction
It is estimated that 2.2% of children born each year in the
United States were conceived with the help of assisted reproductive
techniques (ART) including in vitro fertilization (IVF) and intra-
cytoplasmic sperm injection (ICSI) [1]. Although these techniques
are thought to be safe, new evidence suggests an increased risk of
morbid congenital problems associated with their use [2,3], such as
cerebral palsy and delayed development [4], low birth weight [5,6],
and increased major birth defects [3,5–9]. Furthermore, in recent
years even if contradictory findings exist [9–12], several reports
suggested that IVF increases the risk of epigenetic disorders [13,14]
including Beckwith–Wiedemann [15–19], Angelman [18,20,21]
and Silver-Russell syndromes [22–24].
While infertility, per se, could be at least partly responsible for
these diseases [25], the extent of the anomalies observed indicates
that infertility alone does not explain all the alterations, part of
them being certainly due to embryo culture and more generally to
the reproductive technology applied to the gametes and the
embryo. Indeed, studies in animal models have demonstrated that
embryo culture [26,27] and in vitro fertilization [28,29] of mouse or
bovine preimplantation embryos alter their gene expression
patterns when compared with in vivo produced embryos. It is
important to investigate whether these changes are only temporary
or whether they may subsequently induce deleterious consequenc-
es. In mice, post-natal development and behavioral parameters
(memory deficiencies at adult stage, altered behaviors and growth
anomalies in standard tests) have been shown to be affected by
embryo culture during the preimplantation period [30,31]. These
abnormal phenotypes could be the consequences of early (around
implantation) gene profile modifications with persistent effects.
The placenta plays a crucial developmental function as the
interface between the mother and the developing fetus. As such, it
has been proposed to play the role of a filter against deleterious
environmental influences, such as exposure to xenobiotics [32],
toxins [33,34], infectious agents and parasites [35]. In the present
study, we analyzed the transcriptomic effects of in vitro embryo
manipulations on the expression profile of placental genes
(analyzed at 10.5 days post-fertilization, as depicted in Figure 1).
We show that early manipulations are not completely buffered at
PLoS ONE | www.plosone.org 1 February 2010 | Volume 5 | Issue 2 | e9218
post-implantation stage. In fact, roughly 6% of the transcripts are
altered at the threshold of two-fold in placentas of manipulated
embryos compared with placentas of embryos produced in vivo. In
addition, we show by bioinformatics promoter analysis that
specific transcription factors could be involved in these deregula-
tions. Finally, we show that many imprinted genes known to be
crucial for placental development [36,37], are more deregulated
than the rest of the transcriptome, and overall in the up-regulation
direction contrarily to the rest of the genome. Many of these
deregulated imprinted genes belong to the previously identified
imprinted gene network [38], and some were previously found
modulated by ART [14]; Fauque et al., submitted). Interestingly,
we observe that like imprinted genes, genes from the X
chromosome behave similarly to imprinted genes following IVF
manipulations. We discuss the potential impact of these targeted
modifications.
Results
IVF and Embryo Culture Trigger SubstantialTranscriptional Modifications on Placental GeneExpression Profiles
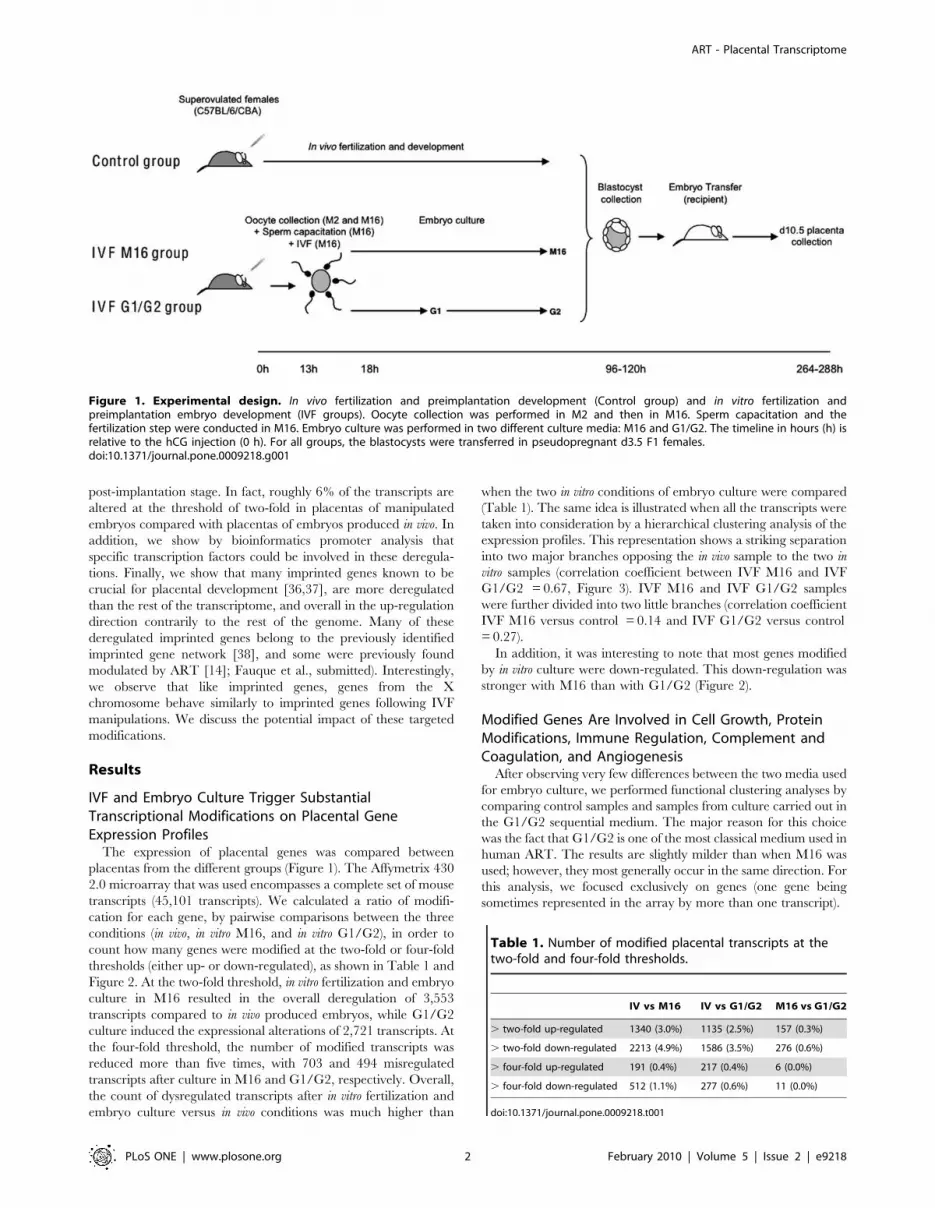
The expression of placental genes was compared between
placentas from the different groups (Figure 1). The Affymetrix 430
2.0 microarray that was used encompasses a complete set of mouse
transcripts (45,101 transcripts). We calculated a ratio of modifi-
cation for each gene, by pairwise comparisons between the three
conditions (in vivo, in vitro M16, and in vitro G1/G2), in order to
count how many genes were modified at the two-fold or four-fold
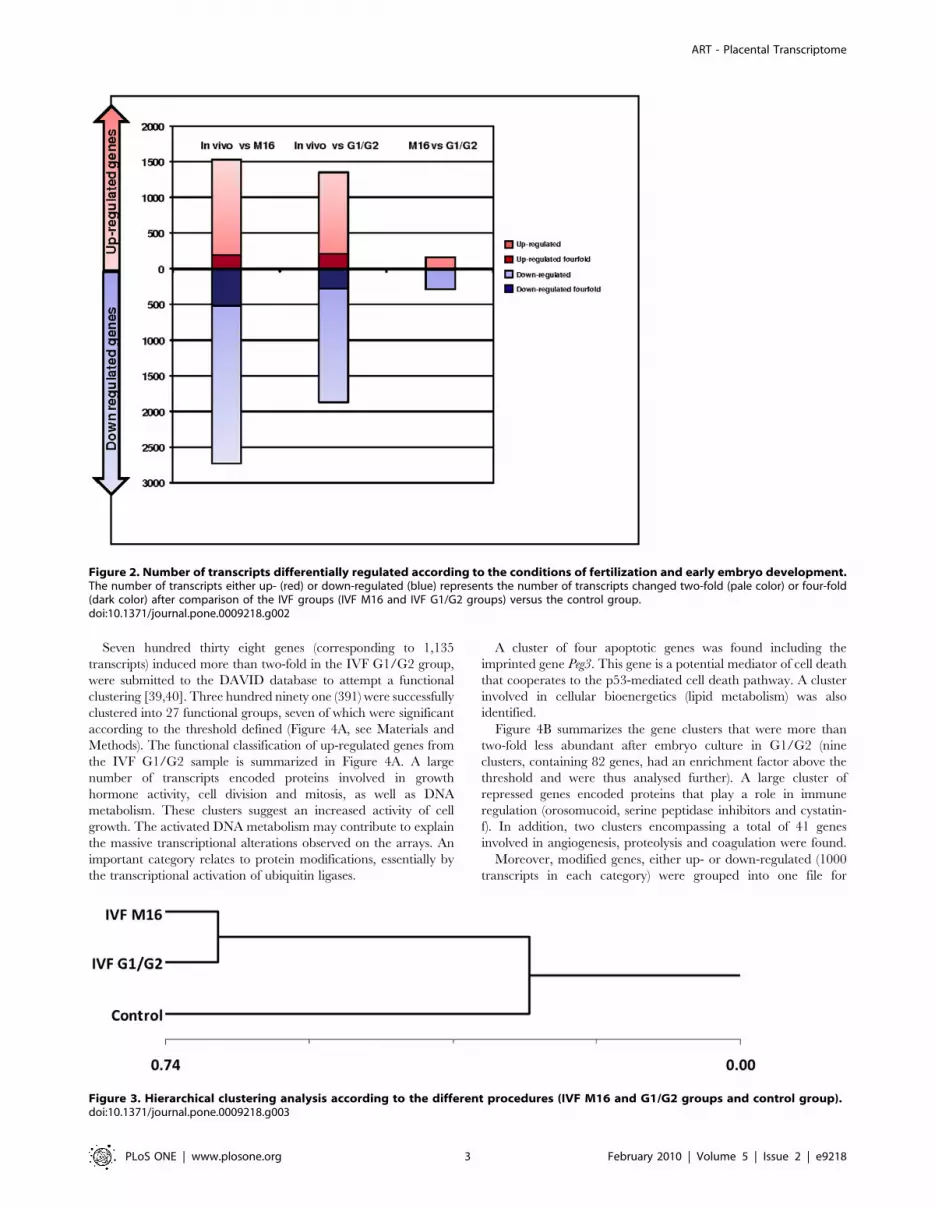
thresholds (either up- or down-regulated), as shown in Table 1 and
Figure 2. At the two-fold threshold, in vitro fertilization and embryo
culture in M16 resulted in the overall deregulation of 3,553
transcripts compared to in vivo produced embryos, while G1/G2
culture induced the expressional alterations of 2,721 transcripts. At
the four-fold threshold, the number of modified transcripts was
reduced more than five times, with 703 and 494 misregulated
transcripts after culture in M16 and G1/G2, respectively. Overall,
the count of dysregulated transcripts after in vitro fertilization and
embryo culture versus in vivo conditions was much higher than
when the two in vitro conditions of embryo culture were compared
(Table 1). The same idea is illustrated when all the transcripts were
taken into consideration by a hierarchical clustering analysis of the
expression profiles. This representation shows a striking separation
into two major branches opposing the in vivo sample to the two in
vitro samples (correlation coefficient between IVF M16 and IVF
G1/G2 = 0.67, Figure 3). IVF M16 and IVF G1/G2 samples
were further divided into two little branches (correlation coefficient
IVF M16 versus control = 0.14 and IVF G1/G2 versus control
= 0.27).
In addition, it was interesting to note that most genes modified
by in vitro culture were down-regulated. This down-regulation was
stronger with M16 than with G1/G2 (Figure 2).
Modified Genes Are Involved in Cell Growth, ProteinModifications, Immune Regulation, Complement andCoagulation, and Angiogenesis
After observing very few differences between the two media used
for embryo culture, we performed functional clustering analyses by
comparing control samples and samples from culture carried out in
the G1/G2 sequential medium. The major reason for this choice
was the fact that G1/G2 is one of the most classical medium used in
human ART. The results are slightly milder than when M16 was
used; however, they most generally occur in the same direction. For
this analysis, we focused exclusively on genes (one gene being
sometimes represented in the array by more than one transcript).
Figure 1. Experimental design. In vivo fertilization and preimplantation development (Control group) and in vitro fertilization andpreimplantation embryo development (IVF groups). Oocyte collection was performed in M2 and then in M16. Sperm capacitation and thefertilization step were conducted in M16. Embryo culture was performed in two different culture media: M16 and G1/G2. The timeline in hours (h) isrelative to the hCG injection (0 h). For all groups, the blastocysts were transferred in pseudopregnant d3.5 F1 females.doi:10.1371/journal.pone.0009218.g001
Table 1. Number of modified placental transcripts at thetwo-fold and four-fold thresholds.
IV vs M16 IV vs G1/G2 M16 vs G1/G2
. two-fold up-regulated 1340 (3.0%) 1135 (2.5%) 157 (0.3%)
. two-fold down-regulated 2213 (4.9%) 1586 (3.5%) 276 (0.6%)
. four-fold up-regulated 191 (0.4%) 217 (0.4%) 6 (0.0%)
. four-fold down-regulated 512 (1.1%) 277 (0.6%) 11 (0.0%)
doi:10.1371/journal.pone.0009218.t001
ART - Placental Transcriptome
PLoS ONE | www.plosone.org 2 February 2010 | Volume 5 | Issue 2 | e9218
Seven hundred thirty eight genes (corresponding to 1,135
transcripts) induced more than two-fold in the IVF G1/G2 group,
were submitted to the DAVID database to attempt a functional
clustering [39,40]. Three hundred ninety one (391) were successfully
clustered into 27 functional groups, seven of which were significant
according to the threshold defined (Figure 4A, see Materials and
Methods). The functional classification of up-regulated genes from
the IVF G1/G2 sample is summarized in Figure 4A. A large
number of transcripts encoded proteins involved in growth
hormone activity, cell division and mitosis, as well as DNA
metabolism. These clusters suggest an increased activity of cell
growth. The activated DNA metabolism may contribute to explain
the massive transcriptional alterations observed on the arrays. An
important category relates to protein modifications, essentially by
the transcriptional activation of ubiquitin ligases.
A cluster of four apoptotic genes was found including the
imprinted gene Peg3. This gene is a potential mediator of cell death
that cooperates to the p53-mediated cell death pathway. A cluster
involved in cellular bioenergetics (lipid metabolism) was also
identified.
Figure 4B summarizes the gene clusters that were more than
two-fold less abundant after embryo culture in G1/G2 (nine
clusters, containing 82 genes, had an enrichment factor above the
threshold and were thus analysed further). A large cluster of
repressed genes encoded proteins that play a role in immune
regulation (orosomucoid, serine peptidase inhibitors and cystatin-
f). In addition, two clusters encompassing a total of 41 genes
involved in angiogenesis, proteolysis and coagulation were found.
Moreover, modified genes, either up- or down-regulated (1000
transcripts in each category) were grouped into one file for
Figure 2. Number of transcripts differentially regulated according to the conditions of fertilization and early embryo development.The number of transcripts either up- (red) or down-regulated (blue) represents the number of transcripts changed two-fold (pale color) or four-fold(dark color) after comparison of the IVF groups (IVF M16 and IVF G1/G2 groups) versus the control group.doi:10.1371/journal.pone.0009218.g002
Figure 3. Hierarchical clustering analysis according to the different procedures (IVF M16 and G1/G2 groups and control group).doi:10.1371/journal.pone.0009218.g003
ART - Placental Transcriptome
PLoS ONE | www.plosone.org 3 February 2010 | Volume 5 | Issue 2 | e9218

Figure 4. Histograms of gene clusters identified by DAVID for genes induced (A) and repressed (B) in IVF G1/G2. Left ordinaterepresents the number of genes present in each cluster and the right ordinate represents the enrichment score as defined (see text).doi:10.1371/journal.pone.0009218.g004
ART - Placental Transcriptome
PLoS ONE | www.plosone.org 4 February 2010 | Volume 5 | Issue 2 | e9218

analyzing enriched pathways using DAVID. This selection
corresponds to a threshold of transcriptional down-regulation of
2.4 fold or less, and to 2.07 fold or more for induced genes. One
thousand seven hundred and eleven (1,711) genes ID were
recognized, 163 of which could be incorporated into 13 KEGG
pathways. Among the detectable pathways that remain significant
after Benjamini-Hochberg correction for multiple testing, we
could identify three major groups of genes (Table 2): Complement
and coagulation cascades, Natural killer-mediated cell toxicity and
Cell adhesion molecules. The main features of these pathways are
presented in Supplemental Figures S1, S2 and S3. This finding
clearly demonstrates that IVF and embryo culture strongly down-
regulate the genes involved in complement pathways, as shown in
Supplemental S1. The expression levels of the pivotal molecules
C3 and C5 were reduced 3.1 and 2.2 fold, respectively. The
complement system behaves as an integrated module of factors,
suggesting that one missing element in the cell membrane attack
complex may be sufficient to inhibit cell lysis. As such, the sole
induction of Complement factor 9, albeit strong (x4.5), is probably
not sufficient to promote cell death since the other components are
not transcriptionnally increased. Interestingly, in the second
pathway significantly enriched (‘‘Natural Killer Cell Mediated
Cytotoxicity’’, Supplemental S2), there is a very strong overrep-
resentation of down-regulated genes, suggesting that this pathway
is blocked. Finally, the group of genes encoding molecules of cell
adhesion is also considerably enriched in down-regulated genes,
especially for genes involved in cell-cell signalling in the frame of
the immune system (Supplemental S3). In this pathway, many
genes are down-regulated more than five-fold (Icos, Itgal, Itgb2,
Ptprc, Selplg). In almost all these cases, the gene expression
alterations induced by culture in M16 were slightly stronger (data
not shown), but the clusters and pathways identified were the
same.
Genes from the X Chromosome Are Specifically Modified(Essentially Up-Regulated) by IVF Manipulations
We attempted to analyze gene expression modifications
according to the chromosome localization. We used the
information available from the Affymetrix database to sort the
data per chromosome, and we performed a Chi2 test to compare
the number of induced/repressed/unmodified genes (at the two-
fold threshold) between each chromosome and the rest of the
genome (See the Supplemental Table S1). A correction was then
applied in order to take into account the multiple testing; with this
correction the statistical test was considered significant if below
0.0025. Using this threshold, only the X chromosome was
different from the rest of the genome (Figure 5A, x2-test = 2.8
10230). This skewed proportion was essentially due to the striking
abundance of up-regulated genes located on this chromosome
(7.4% vs 2.6% for the rest of the genome). By contrast, repressed
genes were not different (3.2% vs 3.6% for the rest of the genome).
The effect on non pseudoautosomal X genes was apparently not
linked to the distance from the X inactivation center (Xic)
(Figure 6). This effect was not due to a skewed representation of
male and female embryos in the different RNA pools that were
used. Since at this early stage, sex determination is starting (Sry is
expressed at 10.5 dpc, the possible skews in representation were
followed using the expression levels of Y-specific markers such as
UtY, which were not different between the groups. Moreover, a
skewed representation of male and female embryos would have the
same consequences on induced and repressed genes, which is not
what we observed. Thus, the X-specific transcriptome modifica-
tions described here appear genuine.
Imprinted Genes Are Overrepresented among ModifiedGenes from the Placenta from IVF and Embryo Cultureand Are Mostly Induced Compared to the Rest of theTranscriptome
Imprinted genes are known to play important functions in
placental development, growth and physiology and are submitted
to epigenetic control. Consequently, we analyzed them specifically
in our study. Previous expression analysis of a subset of 19
imprinted genes belonging to the imprinted gene network [38] on
the placental samples of the present study revealed that
manipulated concepti display significantly disturbed levels of gene
expression (Fauque et al., submitted). Here, using microarrays, we
extend this vision to the complete known set of imprinted genes.
Eighty-nine (89) genes known to be imprinted in mice were thus
analyzed; seventeen (17) were increased more than two-fold, while
eight were reduced more than two-fold by the IVF and embryo
Table 2. KEGG pathways identified starting analysis from the 2000 most modified genes in the placenta after IVF and embryoculture.
Term Gene Count % P-Value Benjamini
KEGG_PATHWAY Complement and coagulation cascades 30 1.8 2.3E-12 4.4E-10
KEGG_PATHWAY Natural killer cell mediated cytotoxicity 29 1.7 0.000015 0.0014
KEGG_PATHWAY Cell adhesion molecules (CAMs) 32 1.9 0.000026 0.0017
KEGG_PATHWAY PPAR signaling pathway 16 0.9 0.0042 0.19
KEGG_PATHWAY C21-Steroid hormone metabolism 6 0.4 0.006 0.21
KEGG_PATHWAY ECM-receptor interaction 16 0.9 0.016 0.4
KEGG_PATHWAY Leukocyte transendothelial migration 20 1.2 0.016 0.36
KEGG_PATHWAY Fructose and mannose metabolism 10 0.6 0.029 0.51
KEGG_PATHWAY Pentose phosphate pathway 7 0.4 0.031 0.49
KEGG_PATHWAY Hematopoietic cell lineage 14 0.8 0.056 0.67
KEGG_PATHWAY Glycolysis/Gluconeogenesis 10 0.6 0.065 0.7
KEGG_PATHWAY Renin-angiotensin system 5 0.3 0.094 0.8
KEGG_PATHWAY Bile acid biosynthesis 7 0.4 0.1 0.79
doi:10.1371/journal.pone.0009218.t002
ART - Placental Transcriptome
PLoS ONE | www.plosone.org 5 February 2010 | Volume 5 | Issue 2 | e9218
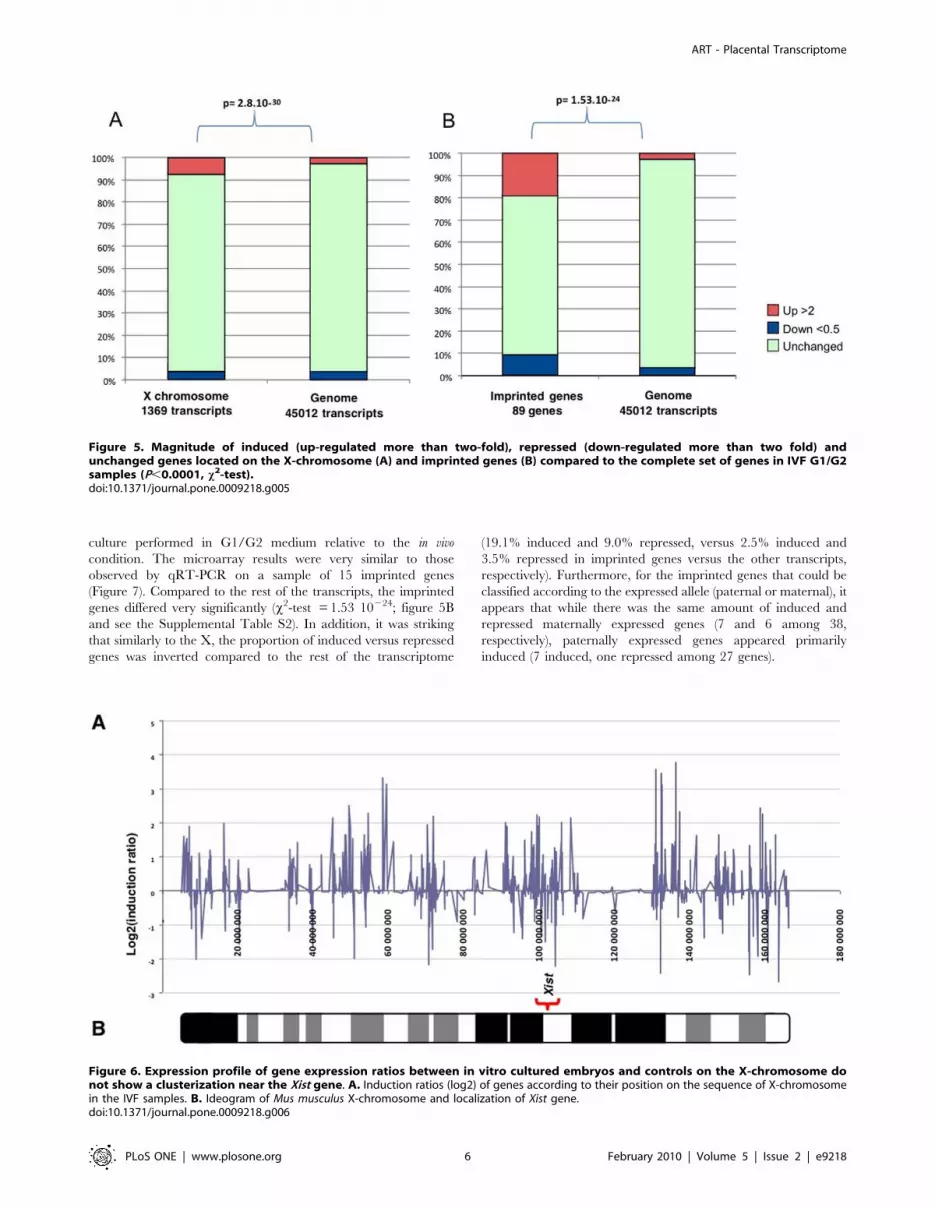
culture performed in G1/G2 medium relative to the in vivo
condition. The microarray results were very similar to those
observed by qRT-PCR on a sample of 15 imprinted genes
(Figure 7). Compared to the rest of the transcripts, the imprinted
genes differed very significantly (x2-test = 1.53 10224; figure 5B
and see the Supplemental Table S2). In addition, it was striking
that similarly to the X, the proportion of induced versus repressed
genes was inverted compared to the rest of the transcriptome
(19.1% induced and 9.0% repressed, versus 2.5% induced and
3.5% repressed in imprinted genes versus the other transcripts,
respectively). Furthermore, for the imprinted genes that could be
classified according to the expressed allele (paternal or maternal), it
appears that while there was the same amount of induced and
repressed maternally expressed genes (7 and 6 among 38,
respectively), paternally expressed genes appeared primarily
induced (7 induced, one repressed among 27 genes).
Figure 5. Magnitude of induced (up-regulated more than two-fold), repressed (down-regulated more than two fold) andunchanged genes located on the X-chromosome (A) and imprinted genes (B) compared to the complete set of genes in IVF G1/G2samples (P,0.0001, x2-test).doi:10.1371/journal.pone.0009218.g005
Figure 6. Expression profile of gene expression ratios between in vitro cultured embryos and controls on the X-chromosome donot show a clusterization near the Xist gene. A. Induction ratios (log2) of genes according to their position on the sequence of X-chromosomein the IVF samples. B. Ideogram of Mus musculus X-chromosome and localization of Xist gene.doi:10.1371/journal.pone.0009218.g006
ART - Placental Transcriptome
PLoS ONE | www.plosone.org 6 February 2010 | Volume 5 | Issue 2 | e9218

Promoter Analysis Reveals a Putative Role of FOXATranscription Factors in Increasing the Expression ofPlacental Genes after IVF
To gain insight into the molecular bases of the aforementioned
transcription alterations induced by IVF followed by embryo
culture, we analyzed the promoter composition of 34 genes
corresponding to the 17 most induced and the 17 most repressed,
using Principal Component Analysis (PCA) (for details, see
Materials and Methods section). Promoter regions were identified
using the Gene2Promoter routine of the Genomatix software
(http://genomatix.de). The number of putative promoters per
gene ranged from one to five. In total, 60 promoters were
identified (See the Supplemental Table S3). Then, putative TFBS
were detected using Genomatix. In addition to the promoter
composition, the level of induction/repression was added to the
data matrix file as a variable for calculating the correlation matrix
prior to PCA, which made it possible to identify axes 1 and 8 as
strongly correlated with this parameter, while the other axes were
not (Figure 8). The first axis was also correlated with the CpG
composition (data not shown), indicating that genes induced by the
IVF/embryo culture protocol have a fairly AT-rich content in
their promoters, while repressed genes have a more GC-rich
content in their promoters. Again, this is in accordance with the
transcriptional induction of Dnmt3a, which can target specific
promoters de novo, essentially if they are rich in CpG islands [41].
The binding sites of the transcription factors which are correlated
with the ‘‘Induction Ratio’’ variable were V$LHXF, V$ATBF,
V$HOXF, V$BRNF, V$HOMF on axis 1, and V$RXRF,
V$AIRE, V$PLAG, V$FKHD, V$GLIF on axis 8, as referred
to in the Genomatix database. The Promoter Content Principal
Component Analysis (PCPCA) was thus able to diagnose TFBS
that clustered on the promoters of induced genes. It was also
interesting to identify whether one (or a few) of these TFBS was
differentially represented in the two types of promoters. Student’s
t-test was therefore applied for each TFBS in order to contrast
promoter contents between induced and repressed genes, after
correction for multiple testing. The most differential binding site
was the V$FKHD bound by ‘‘forkhead’’-containing transcription
factors (ForKHeaD), which was strongly over-represented in IVF-
induced versus IVF-repressed genes (P = 0.001 after correction,
Figure 9). Interestingly, this binding site was the only one to
remain significant after correction, far beyond the next one
V$HNF1 (p = 0.13). We then reanalyze the array data to check for
the transcriptional level (induction/repression) of genes belonging
to the FOX family, since the TFBS for FOX was overrepresented.
FoxA1, FoxA2 and FoxA3 mRNAs were induced 3.3, 4.4 and 6.2 -
fold, respectively. FoxJ2 gene coding another member of the
forkhead transcription factors family was also induced by IVF
manipulations (2.2-fold). Following these observations, we moved
to expression of human placentas near term (controls and from
IVF). Unfortunately, the expression level of these genes is so weak
near term that comparisons are impracticable. We also explored a
few placentas from the first trimester and could observe a much
Figure 7. Comparison of levels of induction for 15 genes between real time RT-PCR and microarrays data. Comparison of inductionratios between qRT-PCR and microarray data. The PCR primers were chosen at positions corresponding to Affymetrix features for analysis by qRT-PCR.As clearly shown, there is a very good correlation of the results between the two approaches.doi:10.1371/journal.pone.0009218.g007
ART - Placental Transcriptome
PLoS ONE | www.plosone.org 7 February 2010 | Volume 5 | Issue 2 | e9218
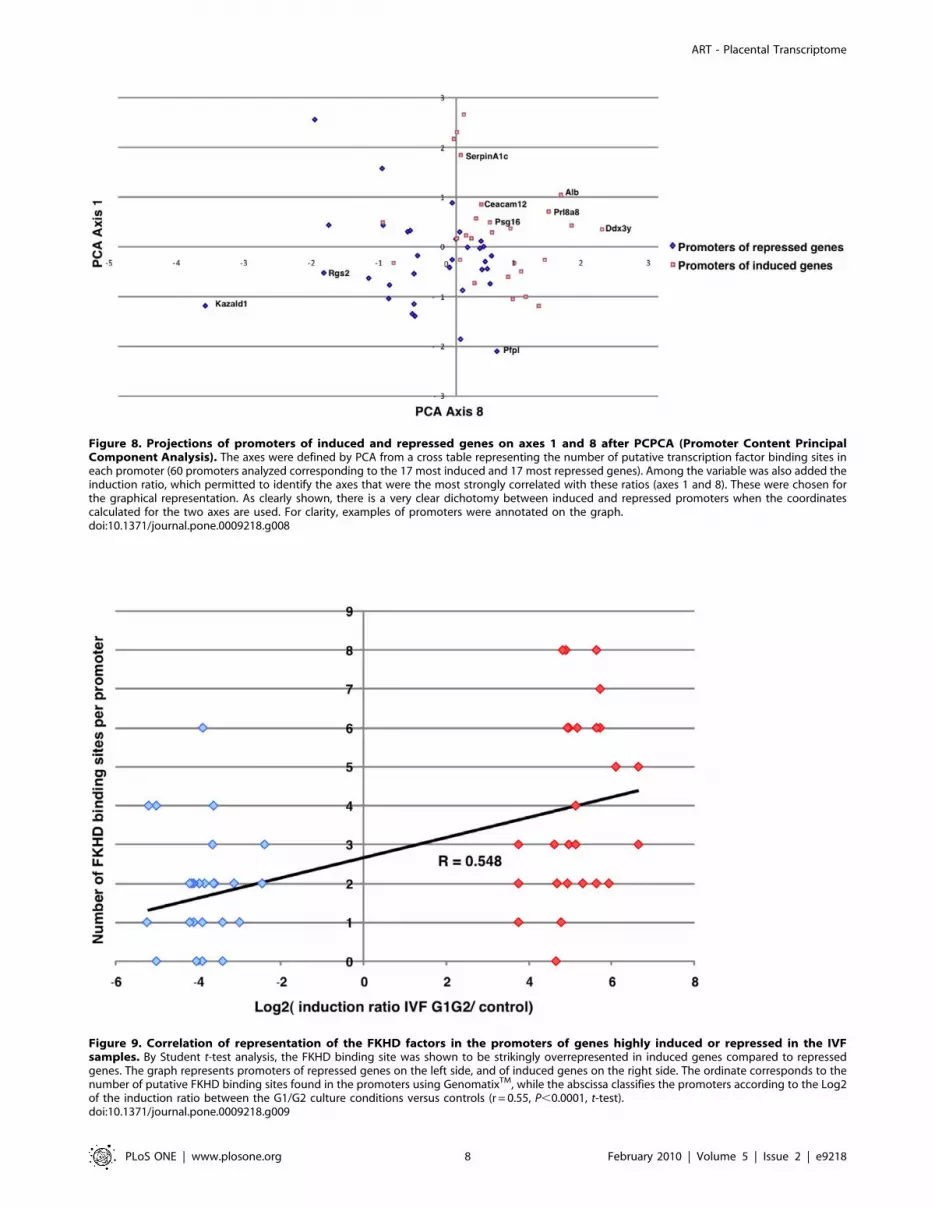
Figure 8. Projections of promoters of induced and repressed genes on axes 1 and 8 after PCPCA (Promoter Content PrincipalComponent Analysis). The axes were defined by PCA from a cross table representing the number of putative transcription factor binding sites ineach promoter (60 promoters analyzed corresponding to the 17 most induced and 17 most repressed genes). Among the variable was also added theinduction ratio, which permitted to identify the axes that were the most strongly correlated with these ratios (axes 1 and 8). These were chosen forthe graphical representation. As clearly shown, there is a very clear dichotomy between induced and repressed promoters when the coordinatescalculated for the two axes are used. For clarity, examples of promoters were annotated on the graph.doi:10.1371/journal.pone.0009218.g008
Figure 9. Correlation of representation of the FKHD factors in the promoters of genes highly induced or repressed in the IVFsamples. By Student t-test analysis, the FKHD binding site was shown to be strikingly overrepresented in induced genes compared to repressedgenes. The graph represents promoters of repressed genes on the left side, and of induced genes on the right side. The ordinate corresponds to thenumber of putative FKHD binding sites found in the promoters using GenomatixTM, while the abscissa classifies the promoters according to the Log2of the induction ratio between the G1/G2 culture conditions versus controls (r = 0.55, P,0.0001, t-test).doi:10.1371/journal.pone.0009218.g009
ART - Placental Transcriptome
PLoS ONE | www.plosone.org 8 February 2010 | Volume 5 | Issue 2 | e9218
higher expression of FOXA1, A2 and A3 around 12 weeks of
gestation (,10–15 times, data not shown). These results are not
incompatible with the idea that FOXA genes could be involved in
human placenta modifications of gene expression when ART is
used, but mostly at early stages of gestation when human samples
are not accessible for testing.
Discussion
To the best of our knowledge, our study demonstrates for the
first time a substantial alteration of placental gene expression
following in vitro manipulation techniques of the embryo (above
6% of the transcripts), with a significant excess of repressed genes
in the complete transcriptome. There are indications that
epigenetic information could be modified in culture and be the
cause of long term expressional modifications. Amongst epigenetic
mediators, four Dnmt are known, amongst which, Dnmt3a and 3b
are known to modify (and not only transmit from one cell
generation to the other) epigenetic alterations. Therefore, our
findings correlate very well with the overexpression of the Dnmt3a
gene, encoding the DNA (cytosine-5-)-methyltransferase 3 alpha (x
2.6 in average), which could bring the genome to an overall
overmethylation, thus inducing the down-regulation of many
genes, especially when their promoter is GC-rich.
The alterations are observed more than 6 days after the in vitro
manipulations (in vitro fertilization and embryo culture) meaning
that a ‘memory’ of the injury has been stored during the
differentiation of the placenta. These alterations may constitute
an important subject of interrogation from the human point of
view (for children conceived by ART). This is especially striking,
due to the fact that part of the embryo culture of this study was
carried out in G1/G2 medium, which is also classically used in
humans. However, since the gamete manipulations and fertiliza-
tion step was performed in M16 medium we can not excluded that
this period of stress could contribute very significantly to the large
effects seen. Additionally, recent studies have shown that embryo
transfer and superovulation could modify imprinted gene
expression [42,43], it would be interesting to perform additional
experiments including both variables (superovulation and embryo
transfer).
Our data show that in vitro fertilization techniques trigger the
induction of genes involved in cellular proliferation and cell cycle
pathways and an alteration of genes involved in apoptosis
pathways. This is probably linked to the invasive properties of
trophoblast cells (which promote degradation of the extra-cellular
matrix via the production of metalloproteases [44,45]). Interest-
ingly we observed a decrease in expression of genes involved in the
angiogenic signaling, which may explain defects in the future
placental function. In addition, repressed gene clusters encom-
passed genes of the immune system. During pregnancies obtained
after IVF and embryo culture, the placenta could therefore be less
able to play its protective filtering role against environmental
aggressions (bacterial, viral or chemical). This result parallels some
of the placental effects of IUGR monitored by transcriptomics in
the rat model [46], where the levels of mRNA encoding genes
protecting the foeto-placental unit against external aggressions
(either xenobiotics or microbial) are reduced.
Interestingly, two categories of genes behave differently from the
bulk of the genome: imprinted genes and X-borne genes. Indeed
these genes are overall induced, while for the rest of the genome,
the reverse situation is observed. Concerning imprinted genes, this
observation is consistent with several reports in humans, suggesting
that IVF increases the risk of diseases caused by aberrant genomic
imprinting, such as Beckwith–Wiedemann syndrome (BWS)
[15–19], Angelman syndrome (AS) [18,20,21] and Silver-Russell
syndrome (SRS) [23,24]. Thus, the epigenetic modifications
induced at the early embryo stage [47–52] could persist at later
stages of development. The observation that early injuries (before
implantation) have consequences much later (on the placenta
imprinting profile) is consistent with the literature, showing that
tissues of trophectoderm origin are unable to restore a correct
genomic imprint for the H19 gene [53] and adequate expression
level of this gene [42]. Our results extend the expression anomalies
on the complete category of imprinted genes, even showing that
they behave differently than the other genes. Interestingly, we
observe that the paternally expressed genes are almost systemat-
ically induced, which suggests a trend towards favoring placental
growth and thus weighing in the balance towards the paternal side
of the materno-paternal conflict [54]. Abundant literature suggests
that the X inactivation processes share at least partly mechanisms
of expression regulation with imprinted genes [55,56]. Again, our
results substantiate this observation. Interestingly, certain X-
linked genes are required in mice for normal placental
development and for embryonic growth and viability, as the
Cited1 gene [57]. In our experimental groups, this gene was up-
regulated (more than 4.5 fold). It is possible that the Cited1 gene
can functionally compensate for the loss of other genes during
embryonic development.
We discovered that the promoters of the most strongly activated
genes are enriched in forkhead recognition sites, which could be
linked to the overexpression of FoxA family genes. These genes
could constitute key elements in the observed modifications in
gene expression. FOXA proteins are critical for development,
differentiation, and metabolism. In particular, mice homozygous
for a null mutation in FOXA1 develop a complex phenotype
characterized by growth and metabolic abnormalities and display
a strong neonatal mortality between days 2 and 14 [58]. In
addition, high expression of FOXA1 is commonly observed in
prostate tumors. FOXA1 is known to be involved in translating
epigenetic signatures since histone H3 lysine 4 dimethylation has
been shown to guide FOXA1 recruitment [59,60]. This may
enhance transcription in a controlled fashion with cell type
specificity by opening chromatin [61]. Therefore, our results
suggest that since IVF results in the transcriptional induction of
FoxA genes, this constitutes a pathway towards wide changes in
gene expression, such as the one observed here. Furthermore, we
showed that FoxJ2 was also up-regulated in IVF samples. FoxJ2
over-expression using transgenic mice has a negative effect on
embryonic development [62].
Our data on the transcriptomic consequences of ART
manipulations in the mouse model at the post-implantation stage
establish expressional disturbances in placental tissues that
consequently modify trophic adjustments and might be connected
to birth weight, obesity, type II diabetes or hypertension later in
life. Such differences have the potential to influence long-term
patterns of gene expression that might be associated with increased
risk of many human diseases. Additionally, our results suggest that
a family of transcriptional regulators (FOXA) may be involved in
the response to the injury in the placenta. In future studies,
analysis of permanent tissues (such as liver, kidney, brain) in mice
following ART will have to be performed.
Materials and Methods
AnimalsFive- to six-week-old F1 (C57BL/6/CBA) females and eight- to
nine-week-old F1 males (Charles River Laboratories, L’Arbresle,
France) were maintained in an animal facility at normal
ART - Placental Transcriptome
PLoS ONE | www.plosone.org 9 February 2010 | Volume 5 | Issue 2 | e9218

temperature (21–23uC) and 14 h light/10 h dark photoperiods
with free access to water and food. Procedures for handling and
experimentation followed ethical guidelines established by the
Federation of European Laboratory Animal Science Associations.
Experimental DesignAll female mice were superovulated and were divided into three
different experimental groups (IVF in M16 medium, IVF in G1/
G2 medium groups versus control group). In the control group,
blastocysts were collected after in vivo fertilization and in vivo
development. In the two IVF groups, blastocysts were obtained
after in vitro fertilization and development. The embryos from IVF
were cultured either in M16 medium (IVF M16 group; Sigma-
Aldrich, Lyon, France) or in sequential G1/G2 medium (G1.G2
group; JCD Laboratories, Lyon, France) respectively. All embryos
were then transferred to pseudopregnant females.
Superovulation. Females were superovulated by intrape-
ritoneal (i.p.) injection of 8 IU (0.1 ml) Pregnant Mare Serum
Gonadotropin (PMSG, Chronogest; Intervet, Beaucouze, France),
followed 47 h later by an i.p. injection of 5 IU (0.1 ml) of human
Chorionic Gonadotropin (hCG, Chorulon; Intervet).
In vitro fertilization and embryo culture. Thirteen hours
post-hCG, cumulus-oocyte complexes were recovered from
oviducts in M2 medium (Sigma-Aldrich) supplemented with
7 mg/ml of BSA (Sigma-Aldrich). After rinsing in M16 medium,
cumulus-oocyte complexes were kept in the incubator (37uC, 5.5%
CO2 in air) in 100 ml drops of M16 medium covered with paraffin
oil (Vitrolife). Spermatozoa were collected from the cauda
epididymis and capacitated for 90 min in M16 medium
supplemented with 7 mg/ml of BSA at 37uC and 5.5% CO2.
Oocytes were inseminated 15 h post-hCG with 106 spermatozoa.
Fertilized eggs (23 h post-hCG) as determined by the presence of
two pronuclei were then transferred to 30 ml drops of fresh
medium covered with paraffin oil. To analyze the embryo culture
medium effects, two different media were tested: the M16 medium
and the sequential G1/G2 medium [63] containing amino acids.
The embryo culture was conducted up to the blastocyst stage at
37uC and 5.5% CO2. The culture medium was changed daily.
Collection of blastocysts. Recipient F1 females were mated
individually with F1 males after hCG injection. The following
morning, females were checked for vaginal copulation plug.
Embryos at the blastocyst stage were obtained by flushing the
uterus 3.5 days p.c. with M2 medium supplemented with BSA
(7 mg/ml).
Embryo transfer recipients. F1 (C57BL/6/CBA) females
of at least 6 weeks of age were mated to vasectomized F1 males 1
day prior to embryo transfer. The morning after mating, females
were checked for the presence of a vaginal plug, and this was
considered as day 0.5 of pseudopregnancy. A total of 40 and 51
embryos (at early, non expanded and fully expanded blastocyst
stages, classification described in our previous study, [52]) were
transferred to the uteri of pseudopregnant females of control and
IVF groups respectively, on pseudopregnant d3.5 according to
standard procedures [42]. On day 10.5, females were sacrificed
and concepti with a normal development (stage 17–18 as defined
by Theiler et al., [64]) were immediately collected (Supplemental
Table S4). After removal of yolk sac and embryos, placentas were
dropped in 250 ml of Trizol reagent (Invitrogen Life Technology,
Cergy, France), snap-frozen and stored at –80uC until further use.
RNA Preparation, cDNA Synthesis, and MicroarrayHybridizations
RNA preparation. Total RNA was extracted from a pool of
five placental samples coming from at least two litters from the
same group with Trizol (Invitrogen Life Technology) according to
the manufacturer’s instructions and treated with DNase I to
eliminate genomic DNA contamination. The integrity of the total
RNA was investigated using the Bioanalyser 2100 and the RNA
6000 nano LabChip kit (Agilent Technologies). Only total RNA
samples with a RIN number .8 were used.
cRNA synthesis and probe array hybridization. cRNA
synthesis was performed using 3 mg of total RNA using the
GeneChip Expression 32 Amplification One-Cycle Target
Labelling, purified and fragmented before hybridization onto the
mouse Affymetrix 430.2.0 GeneChips (Affymetrix Inc., Santa
Clara, CA, USA) according to the manufacturer’s protocol.
Briefly, total RNA was first reverse transcribed using a T7-
Oligo(dT) promoter primer in the first-strand cDNA synthesis
reaction. Following RNase H-mediated second-strand cDNA
synthesis, the double-stranded cDNA was purified and served as a
template in the subsequent in vitro transcription (IVT) reaction. The
IVT reaction was carried overnight at 37uC using the T7 RNA
polymerase and a biotinylated nucleotide analog/ribonucleotide
mix to generate labeled complementary RNA (cRNA). The
biotinylated cRNA targets were then cleaned up, fragmented, and
controlled on bioanalyzer 2100 before hybridization on murine
GeneChip 430 2.0 expression arrays. After washing and staining
using the specific protocols on the fluidics station FS450 (Affymetrix,
Inc.), the chips were scanned with the GeneChip Scanner 3000
according to the manufacturer’s instructions (GeneChip Analysis
Technical Manual, www.affymetrix.com).
Microarray Gene Expression Data AnalysisThe quality controls of the hybridization were performed using
the MAS5 algorithm (implemented in GCOS software from
Affymetrix) to determine the percentage of present probe sets for
each chip of the study: close values were obtained in the range of
expected values for high quality data according to Affymetrix
standards (52.2%, 53.6%, 53.1% for control, M16 and G1/G2,
respectively).
The dataset was then analyzed with GeneSpring (software
version 7.2 -Agilent Technologies, France) for data analysis. The
robust multiarray analysis algorithm (RMA, GeneSpring; Agilent
Technologies) was applied to the data for background adjustment,
normalization, and log2 transformation of perfect match values
[65].
Functional clustering by DAVID (Database for Annotation
and Visualization and Integrated Discovery). Two lists of
genes induced or repressed twice or more in the placentas were
submitted to the DAVID database [40]. Briefly, DAVID
clusterizes genes from a list according to a series of keywords
common to several genes from the list. The proportion of each
keyword from the gene list submitted is compared with the
proportion in the whole genome, making it possible to compute a
P value. Enrichment values are then calculated as the geometric
mean of the inverse log of each P value. These enrichment scores
depend on the number of genes present in the list. Therefore, we
used a simulation to define minimal enrichment thresholds
enabling us to identify gene clusters given by DAVID for further
analysis, as previously described [46]. The groups were considered
significant if they showed an enrichment value greater than 1.75
and 2.70 for induced and repressed gene clusters, respectively.
Promoter content principal component analysis
(PCPCA). A set of genes presenting an average of at least two-
fold induction/repression calculated from the different probes
specific for each gene spotted on the Affymetrix chip was selected
for promoter analysis. Among these genes, the 17 most induced
genes and the 17 most repressed were chosen. Putative promoter
ART - Placental Transcriptome
PLoS ONE | www.plosone.org 10 February 2010 | Volume 5 | Issue 2 | e9218
regions were automatically identified by using the Gene2Promoter
routine of Genomatix (Munich, Germany) software (http://
genomatix.de). The putative transcription factor binding sites
(TFBS) were detected by using the Gene2Promoter function of the
Genomatix software (Genomatix.de). The putative TFBS
composition of 27 promoters from induced genes and 33
promoters from repressed genes was used to generate a
correlation matrix of 153 rows [all the 152 putative TFBS
detected by Genomatix and the log2 (induction ratio) for each
gene] and 60 columns (See the Supplemental Table S3). This table
was used to generate a correlation matrix, which allowed us to
identify Eigen values and principal components, using the
principal component utility from the StatistiXL software (http://
www.statistixl.com). The Eigen values were classified in decreasing
order to define the corresponding axes, the first axis collecting the
highest percentage of information.
KEGG pathways. Differentially expressed genes in IVF versus
control were classified in pathways established by the Kyoto
Encyclopedia of Genes and Genomes (KEGG) pathways [66].
Quantitative RT–PCR Analysis in MouseThe analysis of imprinted gene expression was performed in a
previous study (Fauque et al., submitted) according to published
protocols [38].
Human PatientsPlacentas from control and ART patients were collected from
the Saint Vincent de Paul maternity hospital, Paris. Informed
consent was obtained from the patients under the auspices of a
CPP (Committee for Patient Protection, Paris Cochin), in
conformity with the Helsinki declaration. Total placental RNA
was obtained from isolated placental villi dissected free from
maternal membranes in HBSS on the maternal side as previously
described [67]. Fragments were frozen in TrizolTM prior to RNA
extraction, which was carried out according to previously
published protocols [67].
RNA Extraction and cDNA synthesis in Human. Total
RNA was extracted using Trizol Reagent (Invitrogen) in
accordance with the manufacturer’s instructions. cDNA synthesis
was performed using Superscript cDNA synthesis kit (Invitrogen).
Quantitative RT-PCR analysis in Human. Quantitative
RT PCR was performed using a Light Cycler (Roche) and the
Invitrogen kit (SYBRH). The primers for cDNA amplification (see
Supplemental Table S5) were chosen using the PRIMER3
software (http://frodo.wi.mit.edu/cgi-bin/primer3) with SDHA
as one of the best reference genes for placental structures [68].
StatisticsStudent’s t -test, ANOVA and Mann–Whitney nonparametric
tests were used throughout the study, with a P,0.05 threshold
considered significant.
Supporting Information
Figure S1 Coagulation and complement pathway regulated by
IVF (mammalian KEGG pathway). Induced genes are represented
in red, repressed genes in blue. This representation makes it
possible to identify relevant ways by which IVF associated to
embryo culture in G1/G2 medium may affect the coagulation.
Found at: doi:10.1371/journal.pone.0009218.s001 (2.08 MB
DOC)
Figure S2 Natural cell killer pathways are down-regulated in the
placental following IVF (mammalian KEGG pathway). Induced
genes are represented in red, repressed genes in blue. This
representation makes it possible to identify relevant ways by which
IVF associated to embryo culture in G1/G2 medium may affect
the coagulation.
Found at: doi:10.1371/journal.pone.0009218.s002 (0.13 MB
DOC)
Figure S3 Cell-cell interactions pathways are modified in the
placental following IVF (mammalian KEGG pathway). Induced
genes are represented in red, repressed genes in blue. This
representation makes it possible to identify relevant ways by which
IVF associated to embryo culture in G1/G2 medium may affect
the coagulation.
Found at: doi:10.1371/journal.pone.0009218.s003 (0.14 MB
DOC)
Table S1 Comparison of the number of induced/repressed/
unmodified genes (at the two fold threshold) between each
chromosome and the rest of the genome with the statistical Chi2
test.
Found at: doi:10.1371/journal.pone.0009218.s004 (0.06 MB
DOC)
Table S2 Induction ratios of imprinted genes (red and blue
boxes for up-regulated and down-regulated genes respectively) in
the placenta after IVF (IVF M16 and IVF G1/G2)
Found at: doi:10.1371/journal.pone.0009218.s005 (0.10 MB
DOC)
Table S3 Composition of the promoters from the most induced
(Red) and the most repressed genes (Blue). The first row
corresponds to the accession numbers of the various promoters
analyzed obtained from Genomatix, the second to the induction
ratio, the third to the base2 logarithm of this ratio. Follow locus
names and gene names in the next two rows. The different DNA
binding sites are listed in the left column and classified from the
most significant to the least (Statistical tests - Student with and
without Bonferronni corrections and correlation values in black
when significant) are at the right of the table. The values inside the
table correspond to the number of putative Transcription Factor
binding sites found by Genomatix in each promoter.
Found at: doi:10.1371/journal.pone.0009218.s006 (0.34 MB
DOC)
Table S4 Litter characteristics of control and IVF litters
following embryo transfer.
Found at: doi:10.1371/journal.pone.0009218.s007 (0.04 MB
DOC)
Table S5 Primers for Quantitative PCR in Human.
Found at: doi:10.1371/journal.pone.0009218.s008 (0.03 MB
DOC)
Author Contributions
Conceived and designed the experiments: PF PJ HJ. Performed the
experiments: PF FM FL MAR LJ. Analyzed the data: PF PJ HJ DV.
Contributed reagents/materials/analysis tools: PF SB LD CP JPW PJ HJ
DV. Wrote the paper: PF HJ DV.
References
1. Wright VC, Chang J, Jeng G, Macaluso M (2008) Assisted reproductive
technology surveillance–United States, 2005. MMWR Surveill Summ 57: 1–
23.
2. El-Chaar D, Yang Q, Gao J, Bottomley J, Leader A, et al. (2009) Risk of birth
defects increased in pregnancies conceived by assisted human reproduction.
Fertil Steril 92: 1557–1561.
ART - Placental Transcriptome
PLoS ONE | www.plosone.org 11 February 2010 | Volume 5 | Issue 2 | e9218

3. Hansen M, Bower C, Milne E, de Klerk N, Kurinczuk JJ (2005) Assisted
reproductive technologies and the risk of birth defects–a systematic review. Hum
Reprod 20: 328–338.
4. Stromberg B, Dahlquist G, Ericson A, Finnstrom O, Koster M, et al. (2002)
Neurological sequelae in children born after in-vitro fertilisation: a population-
based study. Lancet 359: 461–465.
5. Olson CK, Keppler-Noreuil KM, Romitti PA, Budelier WT, Ryan G, et al.
(2005) In vitro fertilization is associated with an increase in major birth defects.
Fertil Steril 84: 1308–1315.
6. Merlob P, Sapir O, Sulkes J, Fisch B (2005) The prevalence of major congenital
malformations during two periods of time, 1986–1994 and 1995–2002 in newborns
conceived by assisted reproduction technology. Eur J Med Genet 48: 5–11.
7. Hansen M, Kurinczuk JJ, Bower C, Webb S (2002) The risk of major birth
defects after intracytoplasmic sperm injection and in vitro fertilization.
N Engl J Med 346: 725–730.
8. Klemetti R, Gissler M, Sevon T, Koivurova S, Ritvanen A, et al. (2005)
Children born after assisted fertilization have an increased rate of major
congenital anomalies. Fertil Steril 84: 1300–1307.
9. Kallen B, Finnstrom O, Nygren KG, Olausson PO (2005) In vitro fertilization
(IVF) in Sweden: risk for congenital malformations after different IVF methods.
Birth Defects Res A Clin Mol Teratol 73: 162–169.
10. Bowdin S, Allen C, Kirby G, Brueton L, Afnan M, et al. (2007) A survey of
assisted reproductive technology births and imprinting disorders. Hum Reprod
22: 3237–3240.
11. Manning M, Lissens W, Bonduelle M, Camus M, De Rijcke M, et al. (2000)
Study of DNA-methylation patterns at chromosome 15q11–q13 in children born
after ICSI reveals no imprinting defects. Mol Hum Reprod 6: 1049–1053.
12. Tierling S, Souren NY, Gries J, Lo Porto C, Groth M, et al. (2009) Assisted
reproductive technologies do not enhance the variability of DNA methylation
imprints in human. J Med Genet.
13. Gomes MV, Gomes CC, Pinto W Jr, Ramos ES (2007) Methylation pattern at
the KvDMR in a child with Beckwith-Wiedemann syndrome conceived by
ICSI. Am J Med Genet A 143: 625–629.
14. Katari S, Turan N, Bibikova M, Erinle O, Chalian R, et al. (2009) DNA
methylation and gene expression differences in children conceived in vitro or in
vivo. Hum Mol Genet.
15. DeBaun MR, Niemitz EL, Feinberg AP (2003) Association of in vitro
fertilization with Beckwith-Wiedemann syndrome and epigenetic alterations of
LIT1 and H19. Am J Hum Genet 72: 156–160.
16. Gicquel C, Gaston V, Mandelbaum J, Siffroi JP, Flahault A, et al. (2003) In vitro
fertilization may increase the risk of Beckwith-Wiedemann syndrome related to the
abnormal imprinting of the KCN1OT gene. Am J Hum Genet 72: 1338–1341.
17. Maher ER, Brueton LA, Bowdin SC, Luharia A, Cooper W, et al. (2003)
Beckwith-Wiedemann syndrome and assisted reproduction technology (ART).
J Med Genet 40: 62–64.
18. Ludwig H (2005) Archives of Gynecology and Obstetrics: 135 years. Arch
Gynecol Obstet 271: 1–5.
19. Halliday J, Oke K, Breheny S, Algar E, D JA (2004) Beckwith-Wiedemann
syndrome and IVF: a case-control study. Am J Hum Genet 75: 526–528.
20. Orstavik KH, Eiklid K, van der Hagen CB, Spetalen S, Kierulf K, et al. (2003)
Another case of imprinting defect in a girl with Angelman syndrome who was
conceived by intracytoplasmic semen injection. Am J Hum Genet 72: 218–219.
21. Cox GF, Burger J, Lip V, Mau UA, Sperling K, et al. (2002) Intracytoplasmic
sperm injection may increase the risk of imprinting defects. Am J Hum Genet
71: 162–164.
22. Douzgou S, Mingarelli R, Tarani L, De Crescenzo A, Riccio A (2008) Silver-
Russell syndrome following in vitro fertilization. Pediatr Dev Pathol 11:
329–331.
23. Bliek J, Terhal P, van den Bogaard MJ, Maas S, Hamel B, et al. (2006)
Hypomethylation of the H19 gene causes not only Silver-Russell syndrome
(SRS) but also isolated asymmetry or an SRS-like phenotype. Am J Hum Genet
78: 604–614.
24. Kagami M, Nagai T, Fukami M, Yamazawa K, Ogata T (2007) Silver-Russell
syndrome in a girl born after in vitro fertilization: partial hypermethylation at
the differentially methylated region of PEG1/MEST. J Assist Reprod Genet 24:
131–136.
25. Kovalevsky G, Rinaudo P, Coutifaris C (2003) Do assisted reproductive
technologies cause adverse fetal outcomes? Fertil Steril 79: 1270–1272.
26. Rinaudo PF, Giritharan G, Talbi S, Dobson AT, Schultz RM (2006) Effects of
oxygen tension on gene expression in preimplantation mouse embryos. Fertil
Steril 86: 1252–1265, 1265 e1251–1236.
27. Rinaudo P, Schultz RM (2004) Effects of embryo culture on global pattern of
gene expression in preimplantation mouse embryos. Reproduction 128:
301–311.
28. Giritharan G, Talbi S, Donjacour A, Di Sebastiano F, Dobson AT, et al. (2007)
Effect of in vitro fertilization on gene expression and development of mouse
preimplantation embryos. Reproduction 134: 63–72.
29. Corcoran D, Fair T, Park S, Rizos D, Patel OV, et al. (2006) Suppressed
expression of genes involved in transcription and translation in in vitro
compared with in vivo cultured bovine embryos. Reproduction 131: 651–660.
30. Ecker DJ, Stein P, Xu Z, Williams CJ, Kopf GS, et al. (2004) Long-term effects
of culture of preimplantation mouse embryos on behavior. Proc Natl Acad
Sci U S A 101: 1595–1600.
31. Fernandez-Gonzalez R, Moreira P, Bilbao A, Jimenez A, Perez-Crespo M, et al.
(2004) Long-term effect of in vitro culture of mouse embryos with serum on
mRNA expression of imprinting genes, development, and behavior. Proc Natl
Acad Sci U S A 101: 5880–5885.
32. Polgar O, Robey RW, Bates SE (2008) ABCG2: structure, function and role in
drug response. Expert Opin Drug Metab Toxicol 4: 1–15.
33. Marin JJ, Macias RI, Serrano MA (2003) The hepatobiliary-like excretory
function of the placenta. A review. Placenta 24: 431–438.
34. Marin JJ, Macias RI, Briz O, Perez MJ, Blazquez AG, et al. (2008) Molecular
bases of the fetal liver-placenta-maternal liver excretory pathway for cholephilic
compounds. Liver Int 28: 435–454.
35. Beeson JG, Duffy PE (2005) The immunology and pathogenesis of malaria
during pregnancy. Curr Top Microbiol Immunol 297: 187–227.
36. Fowden AL, Sibley C, Reik W, Constancia M (2006) Imprinted genes, placental
development and fetal growth. Horm Res 65 Suppl 3: 50–58.
37. Hemberger M (2007) Epigenetic landscape required for placental development.
Cell Mol Life Sci 64: 2422–2436.
38. Varrault A, Gueydan C, Delalbre A, Bellmann A, Houssami S, et al. (2006) Zac1
regulates an imprinted gene network critically involved in the control of
embryonic growth. Dev Cell 11: 711–722.
39. Huang da W, Sherman BT, Lempicki RA (2009) Systematic and integrative
analysis of large gene lists using DAVID bioinformatics resources. Nat Protoc 4:
44–57.
40. Dennis G Jr, Sherman BT, Hosack DA, Yang J, Gao W, et al. (2003) DAVID:
Database for Annotation, Visualization, and Integrated Discovery. Genome Biol
4: P3.
41. Turek-Plewa J, Jagodzinski PP (2005) The role of mammalian DNA
methyltransferases in the regulation of gene expression. Cell Mol Biol Lett 10:
631–647.
42. Rivera RM, Stein P, Weaver JR, Mager J, Schultz RM, et al. (2008) Manipulations
of mouse embryos prior to implantation result in aberrant expression of imprinted
genes on day 9.5 of development. Hum Mol Genet 17: 1–14.
43. Fortier AL, Lopes FL, Darricarrere N, Martel J, Trasler JM (2008)
Superovulation alters the expression of imprinted genes in the midgestation
mouse placenta. Hum Mol Genet 17: 1653–1665.
44. Husslein H, Haider S, Meinhardt G, Prast J, Sonderegger S, et al. (2009)
Expression, regulation and functional characterization of matrix metalloprotei-
nase-3 of human trophoblast. Placenta 30: 284–291.
45. Hohn HP, Denker HW (2002) Experimental modulation of cell-cell adhesion,
invasiveness and differentiation in trophoblast cells. Cells Tissues Organs 172:
218–236.
46. Buffat C, Boubred F, Mondon F, Chelbi ST, Feuerstein JM, et al. (2007) Kidney
gene expression analysis in a rat model of intrauterine growth restriction reveals
massive alterations of coagulation genes. Endocrinology 148: 5549–5557.
47. Khosla S, Dean W, Brown D, Reik W, Feil R (2001) Culture of preimplantation
mouse embryos affects fetal development and the expression of imprinted genes.
Biol Reprod 64: 918–926.
48. Li T, Vu TH, Ulaner GA, Littman E, Ling JQ, et al. (2005) IVF results in de
novo DNA methylation and histone methylation at an Igf2-H19 imprinting
epigenetic switch. Mol Hum Reprod 11: 631–640.
49. Sasaki H, Ferguson-Smith AC, Shum AS, Barton SC, Surani MA (1995)
Temporal and spatial regulation of H19 imprinting in normal and uniparental
mouse embryos. Development 121: 4195–4202.
50. Mann MR, Chung YG, Nolen LD, Verona RI, Latham KE, et al. (2003)
Disruption of imprinted gene methylation and expression in cloned preimplan-
tation stage mouse embryos. Biol Reprod 69: 902–914.
51. Doherty AS, Mann MR, Tremblay KD, Bartolomei MS, Schultz RM (2000)
Differential effects of culture on imprinted H19 expression in the preimplan-
tation mouse embryo. Biol Reprod 62: 1526–1535.
52. Fauque P, Jouannet P, Lesaffre C, Ripoche MA, Dandolo L, et al. (2007)
Assisted Reproductive Technology affects developmental kinetics, H19 Imprint-
ing Control Region methylation and H19 gene expression in individual mouse
embryos. BMC Dev Biol 7: 116.
53. Mann MR, Lee SS, Doherty AS, Verona RI, Nolen LD, et al. (2004) Selective
loss of imprinting in the placenta following preimplantation development in
culture. Development 131: 3727–3735.
54. Moore T, Haig D (1991) Genomic imprinting in mammalian development: a
parental tug-of-war. Trends Genet 7: 45–49.
55. Okamoto I, Otte AP, Allis CD, Reinberg D, Heard E (2004) Epigenetic
dynamics of imprinted X inactivation during early mouse development. Science
303: 644–649.
56. Lee JT (2003) Molecular links between X-inactivation and autosomal
imprinting: X-inactivation as a driving force for the evolution of imprinting?
Curr Biol 13: R242–254.
57. Rodriguez TA, Sparrow DB, Scott AN, Withington SL, Preis JI, et al. (2004)
Cited1 is required in trophoblasts for placental development and for embryo
growth and survival. Mol Cell Biol 24: 228–244.
58. Shih DQ, Navas MA, Kuwajima S, Duncan SA, Stoffel M (1999) Impaired
glucose homeostasis and neonatal mortality in hepatocyte nuclear factor 3alpha-
deficient mice. Proc Natl Acad Sci U S A 96: 10152–10157.
59. Kininis M, Kraus WL (2008) A global view of transcriptional regulation by
nuclear receptors: gene expression, factor localization, and DNA sequence
analysis. Nucl Recept Signal 6: e005.
ART - Placental Transcriptome
PLoS ONE | www.plosone.org 12 February 2010 | Volume 5 | Issue 2 | e9218

60. Lupien M, Eeckhoute J, Meyer CA, Wang Q, Zhang Y, et al. (2008) FoxA1
translates epigenetic signatures into enhancer-driven lineage-specific transcrip-tion. Cell 132: 958–970.
61. Cirillo LA, Lin FR, Cuesta I, Friedman D, Jarnik M, et al. (2002) Opening of
compacted chromatin by early developmental transcription factors HNF3(FoxA) and GATA-4. Mol Cell 9: 279–289.
62. Martin-de-Lara F, Sanchez-Aparicio P, Arias de la Fuente C, Rey-Campos J(2008) Biological effects of FoxJ2 over-expression. Transgenic Res 17:
1131–1141.
63. Guerif F, Le Gouge A, Giraudeau B, Poindron J, Bidault R, et al. (2007) Limitedvalue of morphological assessment at days 1 and 2 to predict blastocyst
development potential: a prospective study based on 4042 embryos. HumReprod 22: 1973–1981.
64. Andras Nagy MG, KristinaVintersten, RichardRichard (2003) Manipulating the
Mouse Embryo: A Laboratory Manual.65. Irizarry RA, Bolstad BM, Collin F, Cope LM, Hobbs B, et al. (2003) Summaries
of Affymetrix GeneChip probe level data. Nucleic Acids Res 31: e15.
66. Kanehisa M, Goto S, Kawashima S, Nakaya A (2002) The KEGG databases atGenomeNet. Nucleic Acids Res 30: 42–46.
67. Mondon F, Mignot TM, Rebourcet R, Jammes H, Danan JL, et al. (2005)Profiling of oxygen-modulated gene expression in early human placenta by
systematic sequencing of suppressive subtractive hybridization products. Physiol
Genomics 22: 99–107.68. Meller M, Vadachkoria S, Luthy DA, Williams MA (2005) Evaluation of
housekeeping genes in placental comparative expression studies. Placenta 26:601–607.
ART - Placental Transcriptome
PLoS ONE | www.plosone.org 13 February 2010 | Volume 5 | Issue 2 | e9218