Nonfetal Imaging During Pregnancy: Placental Disease
19
Nonfetal Imaging During Pregnancy: Placental Disease Priyanka Jha, MBBS a, *, Gabriele Masselli, MD b , Michael A. Ohliger, MD, PhD a , Liina P oder, MD a INTRODUCTION Placenta is a vital organ that allows exchange of nutrients and gases between the mother and the developing fetus. 1 The placenta develops by 10 to 14 weeks of pregnancy and is fully functional by the end of the first trimester to support the hor- monal needs of continuing the pregnancy and the metabolic needs of the developing fetus. As such, disease states that affect the placenta can have important consequences for both the mother and the fetus. 1,2 Ultrasound (US) is the first line of imaging for most placental diseases. Per guidelines, all preg- nancies should have an “anatomy scan,” also called as a level one scan, at 18 to 20 weeks of gestation. 3 Although most of this scan focuses on assessing the anatomic development of the fetus, evaluating the placenta is a crucial compo- nent of this examination. 3 MR imaging has an increasingly important role as an adjunct modality for imaging for placental disease processes as well and can be particularly helpful for trouble- shooting and advanced evaluation. 4,5 The most common placental pathologies for which imaging is necessary include placenta accreta spectrum disorders (PASD) and placental masses. Both processes are relatively uncommon; however, the adverse consequences to both the fetus and the mother are substantial and hence should be specifically sought after and never over- looked. This review addresses the normal anat- omy of the placenta, imaging technique and protocols, imaging findings and summarizes the key information that needs to be conveyed to the clinical providers. a Department of Radiology and Biomedical Imaging, University of California San Francisco, 505 Parnassus Avenue, Box 0628, San Francisco, CA, USA; b Department of Radiology, Umberto I Hospital, Sapienza Univer- sity, Via Silvestro Gherardi 38, 00146 Rome, Italy * Corresponding author. E-mail address: [email protected] KEYWORDS Hemorrhage MR imaging Placenta Ultrasound Placenta accreta spectrum disorder Placental masses Placenta previa Abruption KEY POINTS Placenta is a vital organ connecting the maternal and fetal circulations. Placenta accreta spectrum disorders and placental masses are the most common indications for dedicated placental imaging with ultrasound or MR imaging. Placental accreta spectrum disorders present with characteristic imaging findings of irregular lakes, myometrial thinning, abnormal intraplacental vascularity, and placental bulge on ultrasound and MR imaging. Imaging is helpful in assessing the extent of involvement and presurgical planning. Antepartum hemorrhage is an important cause of maternal and fetal morbidity and mortality, and most of the cases are due to placenta abnormalities including placenta previa and placental abrup- tion. MR imaging can help distinguish hematomas from other causes of antepartum bleeding, such as vasa previa, degenerated uterine fibroid, cervical pathology, and placental tumors. Placental masses are most commonly identified during the routine fetal ultrasound examinations. Imaging evaluation should focus on the effect of the mass on fetal well-being in this scenario. Radiol Clin N Am 58 (2020) 381–399 https://doi.org/10.1016/j.rcl.2019.11.004 0033-8389/20/Ó 2019 Elsevier Inc. All rights reserved. radiologic.theclinics.com
-
Upload
khangminh22 -
Category
Documents
-
view
7 -
download
0
Transcript of Nonfetal Imaging During Pregnancy: Placental Disease

Nonfetal Imaging DuringPregnancy: Placental Disease
Priyanka Jha, MBBSa,*, Gabriele Masselli, MDb, Michael A. Ohliger, MD, PhDa,Liina P�oder, MDa
KEYWORDS
� Hemorrhage � MR imaging � Placenta � Ultrasound � Placenta accreta spectrum disorder� Placental masses � Placenta previa � Abruption
KEY POINTS
� Placenta is a vital organ connecting the maternal and fetal circulations.
� Placenta accreta spectrum disorders and placental masses are the most common indications fordedicated placental imaging with ultrasound or MR imaging.
� Placental accreta spectrum disorders present with characteristic imaging findings of irregular lakes,myometrial thinning, abnormal intraplacental vascularity, and placental bulge on ultrasound andMR imaging. Imaging is helpful in assessing the extent of involvement and presurgical planning.
� Antepartum hemorrhage is an important cause of maternal and fetal morbidity and mortality, andmost of the cases are due to placenta abnormalities including placenta previa and placental abrup-tion. MR imaging can help distinguish hematomas from other causes of antepartum bleeding, suchas vasa previa, degenerated uterine fibroid, cervical pathology, and placental tumors.
� Placental masses are most commonly identified during the routine fetal ultrasound examinations.Imaging evaluation should focus on the effect of the mass on fetal well-being in this scenario.
INTRODUCTION
Placenta is a vital organ that allows exchange ofnutrients and gases between the mother and thedeveloping fetus.1 The placenta develops by 10to 14 weeks of pregnancy and is fully functionalby the end of the first trimester to support the hor-monal needs of continuing the pregnancy and themetabolic needs of the developing fetus. As such,disease states that affect the placenta can haveimportant consequences for both the mother andthe fetus.1,2
Ultrasound (US) is the first line of imaging formost placental diseases. Per guidelines, all preg-nancies should have an “anatomy scan,” alsocalled as a level one scan, at 18 to 20 weeks ofgestation.3 Although most of this scan focuseson assessing the anatomic development of the
a Department of Radiology and Biomedical Imaging, UAvenue, Box 0628, San Francisco, CA, USA; b Departmensity, Via Silvestro Gherardi 38, 00146 Rome, Italy* Corresponding author.E-mail address: [email protected]
Radiol Clin N Am 58 (2020) 381–399https://doi.org/10.1016/j.rcl.2019.11.0040033-8389/20/� 2019 Elsevier Inc. All rights reserved.
fetus, evaluating the placenta is a crucial compo-nent of this examination.3 MR imaging has anincreasingly important role as an adjunct modalityfor imaging for placental disease processes aswell and can be particularly helpful for trouble-shooting and advanced evaluation.4,5
The most common placental pathologies forwhich imaging is necessary include placentaaccreta spectrum disorders (PASD) and placentalmasses. Both processes are relatively uncommon;however, the adverse consequences to both thefetus and the mother are substantial and henceshould be specifically sought after and never over-looked. This review addresses the normal anat-omy of the placenta, imaging technique andprotocols, imaging findings and summarizes thekey information that needs to be conveyed to theclinical providers.
niversity of California San Francisco, 505 Parnassust of Radiology, Umberto I Hospital, Sapienza Univer-
radiologic.th
eclinics.com
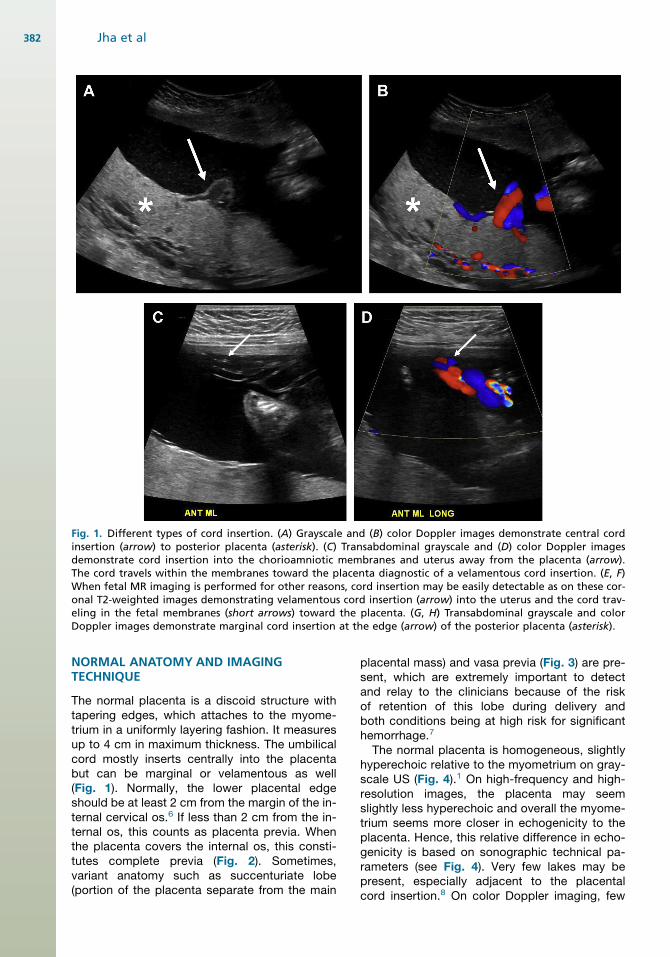
Fig. 1. Different types of cord insertion. (A) Grayscale and (B) color Doppler images demonstrate central cordinsertion (arrow) to posterior placenta (asterisk). (C) Transabdominal grayscale and (D) color Doppler imagesdemonstrate cord insertion into the chorioamniotic membranes and uterus away from the placenta (arrow).The cord travels within the membranes toward the placenta diagnostic of a velamentous cord insertion. (E, F)When fetal MR imaging is performed for other reasons, cord insertion may be easily detectable as on these cor-onal T2-weighted images demonstrating velamentous cord insertion (arrow) into the uterus and the cord trav-eling in the fetal membranes (short arrows) toward the placenta. (G, H) Transabdominal grayscale and colorDoppler images demonstrate marginal cord insertion at the edge (arrow) of the posterior placenta (asterisk).
Jha et al382
NORMAL ANATOMY AND IMAGINGTECHNIQUE
The normal placenta is a discoid structure withtapering edges, which attaches to the myome-trium in a uniformly layering fashion. It measuresup to 4 cm in maximum thickness. The umbilicalcord mostly inserts centrally into the placentabut can be marginal or velamentous as well(Fig. 1). Normally, the lower placental edgeshould be at least 2 cm from the margin of the in-ternal cervical os.6 If less than 2 cm from the in-ternal os, this counts as placenta previa. Whenthe placenta covers the internal os, this consti-tutes complete previa (Fig. 2). Sometimes,variant anatomy such as succenturiate lobe(portion of the placenta separate from the main
placental mass) and vasa previa (Fig. 3) are pre-sent, which are extremely important to detectand relay to the clinicians because of the riskof retention of this lobe during delivery andboth conditions being at high risk for significanthemorrhage.7
The normal placenta is homogeneous, slightlyhyperechoic relative to the myometrium on gray-scale US (Fig. 4).1 On high-frequency and high-resolution images, the placenta may seemslightly less hyperechoic and overall the myome-trium seems more closer in echogenicity to theplacenta. Hence, this relative difference in echo-genicity is based on sonographic technical pa-rameters (see Fig. 4). Very few lakes may bepresent, especially adjacent to the placentalcord insertion.8 On color Doppler imaging, few

Fig. 1. (continued)
Nonfetal Imaging During Pregnancy 383
small caliber intraplacental vessels and subpla-cental vascularity can be seen.8 On MR imaging,placenta is mostly isointense to the myometriumon T1-weighted images and hyperintense to themyometrium on T2-weighted (T2W) images(Fig. 5). Sometimes, the pregnant uterus candevelop vascular congestion, in which case themyometrium demonstrates T2-hyperintenseappearance. In such cases, the placenta rela-tively seems iso- to hypointense to the myome-trium (see Fig. 5). With increasing gestationalage, structure of the cotyledons becomes moreapparent and results in decreased signal inten-sity to intermediate signal intensity comparedwith the surrounding myometrium (Fig. 6).9,10
First and second trimester placentas are very ho-mogeneous in their appearance but with devel-opment of this lobular pattern, the placentabecomes less homogeneous in appearance, as
thin hypointense septa become apparent be-tween the lobules on T2W images (see Fig. 6).Placental septa and cotyledons are more oftenvisible when MR imaging is performed with a3 T system.7
The placental-myometrial interface is demon-strated as a retroplacental clear space on USand as T2-hypointense interface on MR imaging.Given the isointensity of the placenta to the myo-metrium on T1-weighted images, the interfaceis not well seen and is best evaluated on T2Wsequences. The normal subplacental vascularitycan be seen as multiple flow voids in this subpla-cental space. A few flow voids can bepresent within the placenta adjacent to theumbilical cord insertion. The myometrium hasa variable thickness and thins as thepregnancy progresses. The underlying myome-trial wall thins as the pregnancy advances, and

Fig. 2. Complete placenta previa. (A)Endovaginal image of placenta(asterisk) completely covering internalos (arrow). (B) Sagittal T2-weightedMR image demonstrates placenta(asterisk) completely covering the in-ternal os (arrow).
Jha et al384
this finding alone does not imply PASD.11 Themyometrium naturally thins at sites of compres-sion, such as adjacent to the maternal spineand aorta, appearing as a single thin layer of uni-form signal on T2W images. In addition, the myo-metrium is expected to thin as the gestationprogresses, especially at the site of previousscars.12
IMAGING PROTOCOLSUltrasound
US images should evaluate the entire placenta,and images should be acquired documentingthat the entire placenta has been evaluated.Grayscale as well as Doppler imaging shouldbe used. Based on body habitus and depth ofthe placenta, evaluation with a curvilinear 2 to6 Megahertz (mHz) and 9 mHz linear transducerscan be performed.13,14 In all pregnancies,placenta should be evaluated for the locationof implantation, proximity to the cesarean sec-tion scar (if applicable), placenta previa or vasaprevia, succenturiate lobe, and shape and thick-ness of the placenta. After this general
evaluation, particularly in patients with historyof uterine intervention such as cesarean section,myomectomy, embolization, or Asherman syn-drome, attention should be drawn to specificfindings of PASD such as placental heterogene-ity, irregular lacunes or placental lakes, loss ofretroplacental clear space/subplacental lucency,myometrial thinning, abnormal subplacental andintraplacental vascularity, placental bulge, andextrauterine invasion (such as that into thebladder or the parametrium). Studies haveshown improved patient outcomes when tar-geted evaluation of the placenta is performedin patients with suspected PASD.15 Details ofthese findings are discussed later in this article.In addition, with placental evaluation, it is imper-ative to evaluate the area of the internal os withcolor Doppler imaging to evaluate for any aber-rant vessels at this location. If any vessels arepresent, they can be further evaluated withspectral Doppler to look for their maternal versusfetal origin, based on heart rate observations.Vessels demonstrating arterial waveforms atfetal heart rate are highly suspicious for vasaprevia.
Fig. 3. Vasa previa. (A) Endovaginal im-age demonstrates a crossing vesselover internal os (arrow) with fetalheart rate diagnostic of vasa previa.(B) MR imaging sagittal ssFSE per-formed on the same day correlatedwith this finding (arrow). Patient hadruptured membranes, and fluidaround the vessels outlined thefinding. Fluid is seen in the upper va-gina from ruptured membranes (shortarrow). ssFSE, single-shot fast spinecho.

Fig. 4. Normal sonographic appear-ance of the placenta. (A) Transabdomi-nal US demonstrated homogeneouslyhyperechoic second trimester placenta(asterisk) in relationship to hypoechoicmyometrium (arrows). (B) High-resolution image performed with alinear transducer shows the normalplacenta (asterisk) to be slightly less hy-perechoic, and the myometrium (ar-rows) does not seem as hypoechoic incomparison to the placenta. The over-all relative signal of these structuresdepends on imaging parameters.
Nonfetal Imaging During Pregnancy 385
MR Imaging
The authors’ institutional MR imaging protocol forplacental imaging is summarized in Table 1. Inbrief, a combination of T2 (not fat suppressed)and T1 images are necessary. Most of the findingsfor PASD and placental masses are evident onnonfat-suppressed T2W images. T1 images areessential to evaluate for intrinsic hyperintensitysecondary to hemorrhage in PASD and to detectthe presence of fat in placental masses. Occasion-ally, fat-suppressed T1 images may be needed,when evaluating for the presence of fat in placentalmasses. The role of diffusion-weighted imaging inplacental imaging is still evolving. In the author’sexperience, DWI is particularly helpful in caseswith severe myometrial vascular congestion, tohelp delineate the placental-myometrial interface.In this scenario, the placenta demonstrates hyper-intensity, whereas the myometrium does not andhence making their interface better visualized.
Technical details of MR imaging for the placentaare summarized in Michael A. Ohliger and HaileyH. Choi’s article, “Imaging Safety and TechnicalConsiderations in the Reproductive Age Female,”in this issue.
IMAGING FINDINGS/PATHOLOGYPlacenta Accreta Spectrum
PASD is a spectrum of disorders where theplacenta adheres to the underlying myometriumand hence does not separate at the time of deliv-ery, leading to massive hemorrhage, which canbe life threatening to the mother. The spectrumincludes accreta (where the placenta is attacheddirectly to the myometrium, without interveningdecidua), increta (with myometrial invasion),and percreta, where the placenta extendsoutside the uterine serosa and possibly intoadjacent organs such as the bladder and theparametrium. International Federation of
Fig. 5. Normal MR imaging appear-ance of the placenta. (A) Sagittal and(B) axial T2W MR images in secondtrimester demonstrate a homogeneousplacenta (asterisk), slightly hyper toisointense to myometrium (arrows).The signal of myometrium varies onT2W images that depend on the de-gree of physiologic vascular engorge-ment. As seen in (B), numerous flowvoids may be present in the physiolog-ically engorged myometrium (arrows).
Fig. 6. Normal appearance of a“mature” placenta in late gestation.(A) Transabdominal image performedwith high-resolution linear transducerof a patient in the third trimester dem-onstrates the placenta (asterisk) to behyperechoic relative to the myome-trium (arrows) and overall more het-erogeneous in appearance. (B)Sagittal T2W MR image in a patientin her third trimester demonstratesthe placenta (asterisk) to be more het-erogeneous in signal as well.
Jha et al386
Gynecology and Obstetrics has proposed acombined clinical-pathologic classification,which includes both intraoperative observationsas well as findings on gross pathology.16 Oftenrelying on pathology alone can lead to erroneousestimation of the severity of the findings, leadingto this combined system.16 No single imagingfeature has been shown to be diagnostic forPASD, and usually a combination of multiplefindings exists, alerting the reviewers to the cor-rect diagnosis.
UltrasoundOn US some of the commonly reported signs arethe presence of multiple placental lakes with irreg-ular margins (Fig. 7), the loss of retroplacentalclear space, between the placenta and the myo-metrium (see Fig. 7), and presence of placentaprevia (see Fig. 7). Other features include hetero-geneous placenta, asymmetry of placental thick-ness, myometrial thinning, bladder wallinterruption, myometrial, and bladder wall hyper-vascularity (see Fig. 7).
Prominent placental lacunes This is the mostcommonly reported US finding of abnormalplacentation, which is present irrespective of thedepth of invasion (see Fig. 7).14,17 Placentallacunes are vascular anechoic or hypoechoicstructures located within the center of the cotyle-dons. Although a few of these are often presentin normal placentae, imaging findings of PASDrepresent a spectrum of worsening appearance,as they become larger, irregular, and concentratedin the area of invasion and can demonstrate slowinternal flow on real-time imaging.14,17 These are
also often referred as “placental lakes” and givethe placenta the classic “moth-eaten”appearance.14,17
Loss of retroplacental clear space The normalplacental-myometrial interface seems hypoechoicon gray-scale US, which represents the normaldecidua basalis. With PASD, this clear space isobliterated (see Fig. 7),13,17–19 and approximately70% of cases will show this finding.17 In somecases, this area can have prominent subplacentalvascularity.
Myometrial thinning In cases of PAS, myome-trium may be thinned to submillimeter levels andactually becomes undetectable in more severecases (see Fig. 7).14,17 It is reported to occur inabout 50% of cases, which may be reflective ofUS changes that happen at the more invasiveend of the spectrum.14,17
Placental bulge sign With deeper depths of inva-sion, the placenta may bulge outward, creatingan hourglass or snowman configuration of theuterine contour. Along with myometrial thinning,this finding highly suggests myometrial invasion(Figs. 8 and 9).
Bladder wall interruption Bladder wall interrup-tion is defined as the interruption of the hypere-choic fat plane between the uterus and thebladder, which can involve the bladder wall andextend into the bladder lumen in the most severecases.14,20,21 Prominent vessels may be identifiedat the bladder wall, but these are not specific forinvasion (see Fig. 7).14 Spectral interrogation ofthese vessels can be performed, and if fetal heart

Table 1MR imaging protocol for placental imaging at 3 T
Coverage TR TE Flip NEX Slice Matrix FOV Phase Oversample
Patient should drink water before commencing study
Coronal, axial, and sagittalsingle-shot fast spin echo (ssFSE)
Uterus to below cervix 2000 100 X X 4/0 384x256 36 R > L PE FOV 1.0
Axial LAVA FLEX or mDIXONDUAL ECHO
Center over the placenta 4.2 1.2 15 1 3/0 260x256 34 A > P PE FOV 1.1
Coronal ssFSE (nonpropeller) High-resolution imaging(reduced field of view),center over the placenta
2000 100 X X 4/0 384x256 26–28 R > L PE FOV 1.0
Axial T2 FSE (nonpropeller) No fat saturation, high-resolutionimaging (reduced field of view),center over the placenta
4000 120 120 2 4/0 320x256 24 R > L NPW
Sagittal T2 FSE propeller No fat saturation, high-resolutionimaging (reduced field of view),center over the placenta
11,000 74 2 4/0 256x256 24
Axial and sagittal diffusion-weightedimaging (DWI)
Multiple b-values of 0, 50, 500,1000: ADC maps
Routine field of view
5000 30.5 2 6/0 80x80 34 PE FOV 1
Abbreviations: ADC, apparent diffusion coefficient; FOV, field of view; NEX, number of excitations; TE, the echo time; TR, the repetition time.
NonfetalIm
agingDurin
gPregnancy
387

Fig. 7. US features of placenta accreta spectrum (PAS). (A) Endovaginal grayscale image demonstrates completeplacenta previa with multiple placental lakes with irregular margins (arrows) and loss of retroplacental clearspace (short arrows). (B) Endovaginal image with color Doppler demonstrates loss of retroplacental clear spaceand increased retroplacental vascularity (arrow). (C) Endovaginal image demonstrates extensive bladder wall hy-pervascularity (arrows). (D) Intraoperative cystoscopy image obtained during delivery demonstrates prominentsubmucosal vascularity (arrowhead).
Jha et al388
rate can be demonstrated, it highly suggestsbladder invasive PASD.
Asymmetric thickness Invasive placentas oftenappear thickened in the portion implantedon the cervix, and overall the placental thick-ness is increased in the areas involved byPASD.22
MR imagingMR imaging is now recognized for its strengths inassessment of invasive placentation.4 MR imag-ing provides supplemental knowledge in additionto US, particularly in cases of posterior and lateralinvasion, areas that may be technically chal-lenging for US imaging23,24 (see Fig. 8). At the au-thors’ institution, any patient with suspicion for
Fig. 8. MR imaging appearance ofplacenta accreta spectrum. (A) SagittalT2W image demonstrates posteriorplacenta with bulge (dotted line) intothe myometrium. (B) During the sur-gery a subtle blue bulge was notedon the posterior uterus (arrows). Cesar-ean hysterectomy specimen confirmedplacenta increta on pathology.
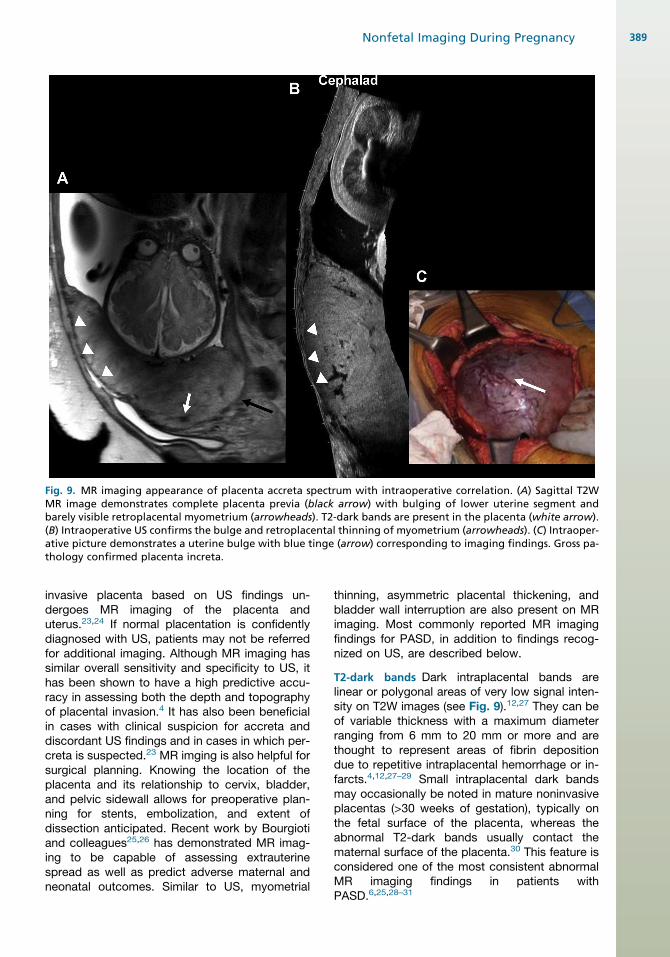
Fig. 9. MR imaging appearance of placenta accreta spectrum with intraoperative correlation. (A) Sagittal T2WMR image demonstrates complete placenta previa (black arrow) with bulging of lower uterine segment andbarely visible retroplacental myometrium (arrowheads). T2-dark bands are present in the placenta (white arrow).(B) Intraoperative US confirms the bulge and retroplacental thinning of myometrium (arrowheads). (C) Intraoper-ative picture demonstrates a uterine bulge with blue tinge (arrow) corresponding to imaging findings. Gross pa-thology confirmed placenta increta.
Nonfetal Imaging During Pregnancy 389
invasive placenta based on US findings un-dergoes MR imaging of the placenta anduterus.23,24 If normal placentation is confidentlydiagnosed with US, patients may not be referredfor additional imaging. Although MR imaging hassimilar overall sensitivity and specificity to US, ithas been shown to have a high predictive accu-racy in assessing both the depth and topographyof placental invasion.4 It has also been beneficialin cases with clinical suspicion for accreta anddiscordant US findings and in cases in which per-creta is suspected.23 MR imging is also helpful forsurgical planning. Knowing the location of theplacenta and its relationship to cervix, bladder,and pelvic sidewall allows for preoperative plan-ning for stents, embolization, and extent ofdissection anticipated. Recent work by Bourgiotiand colleagues25,26 has demonstrated MR imag-ing to be capable of assessing extrauterinespread as well as predict adverse maternal andneonatal outcomes. Similar to US, myometrial
thinning, asymmetric placental thickening, andbladder wall interruption are also present on MRimaging. Most commonly reported MR imagingfindings for PASD, in addition to findings recog-nized on US, are described below.
T2-dark bands Dark intraplacental bands arelinear or polygonal areas of very low signal inten-sity on T2W images (see Fig. 9).12,27 They can beof variable thickness with a maximum diameterranging from 6 mm to 20 mm or more and arethought to represent areas of fibrin depositiondue to repetitive intraplacental hemorrhage or in-farcts.4,12,27–29 Small intraplacental dark bandsmay occasionally be noted in mature noninvasiveplacentas (>30 weeks of gestation), typically onthe fetal surface of the placenta, whereas theabnormal T2-dark bands usually contact thematernal surface of the placenta.30 This feature isconsidered one of the most consistent abnormalMR imaging findings in patients withPASD.6,25,28–31
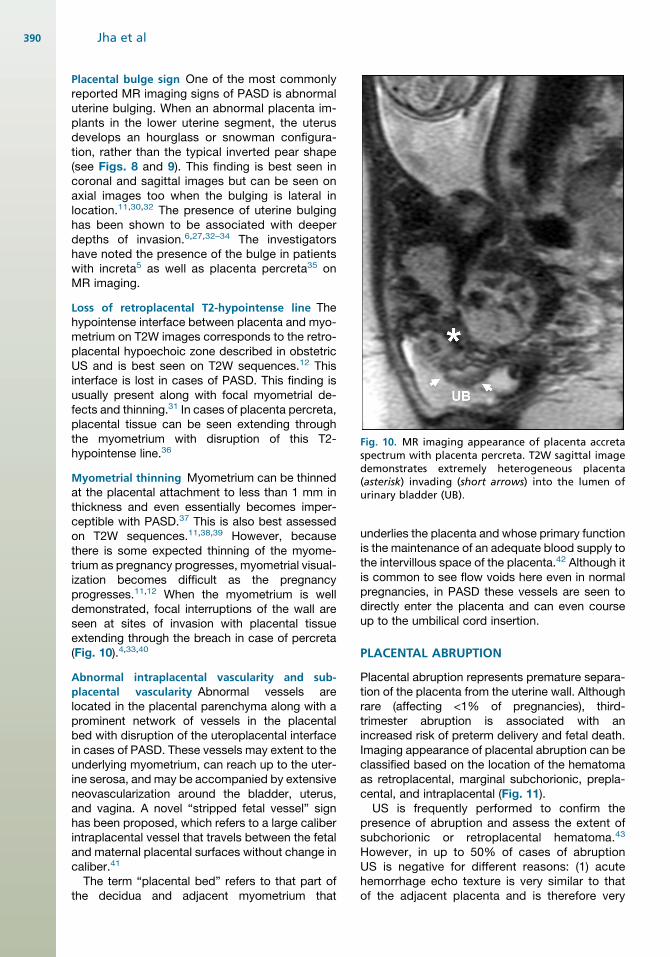
Fig. 10. MR imaging appearance of placenta accretaspectrum with placenta percreta. T2W sagittal imagedemonstrates extremely heterogeneous placenta(asterisk) invading (short arrows) into the lumen ofurinary bladder (UB).
Jha et al390
Placental bulge sign One of the most commonlyreported MR imaging signs of PASD is abnormaluterine bulging. When an abnormal placenta im-plants in the lower uterine segment, the uterusdevelops an hourglass or snowman configura-tion, rather than the typical inverted pear shape(see Figs. 8 and 9). This finding is best seen incoronal and sagittal images but can be seen onaxial images too when the bulging is lateral inlocation.11,30,32 The presence of uterine bulginghas been shown to be associated with deeperdepths of invasion.6,27,32–34 The investigatorshave noted the presence of the bulge in patientswith increta5 as well as placenta percreta35 onMR imaging.
Loss of retroplacental T2-hypointense line Thehypointense interface between placenta and myo-metrium on T2W images corresponds to the retro-placental hypoechoic zone described in obstetricUS and is best seen on T2W sequences.12 Thisinterface is lost in cases of PASD. This finding isusually present along with focal myometrial de-fects and thinning.31 In cases of placenta percreta,placental tissue can be seen extending throughthe myometrium with disruption of this T2-hypointense line.36
Myometrial thinning Myometrium can be thinnedat the placental attachment to less than 1 mm inthickness and even essentially becomes imper-ceptible with PASD.37 This is also best assessedon T2W sequences.11,38,39 However, becausethere is some expected thinning of the myome-trium as pregnancy progresses, myometrial visual-ization becomes difficult as the pregnancyprogresses.11,12 When the myometrium is welldemonstrated, focal interruptions of the wall areseen at sites of invasion with placental tissueextending through the breach in case of percreta(Fig. 10).4,33,40
Abnormal intraplacental vascularity and sub-
placental vascularity Abnormal vessels arelocated in the placental parenchyma along with aprominent network of vessels in the placentalbed with disruption of the uteroplacental interfacein cases of PASD. These vessels may extent to theunderlying myometrium, can reach up to the uter-ine serosa, and may be accompanied by extensiveneovascularization around the bladder, uterus,and vagina. A novel “stripped fetal vessel” signhas been proposed, which refers to a large caliberintraplacental vessel that travels between the fetaland maternal placental surfaces without change incaliber.41
The term “placental bed” refers to that part ofthe decidua and adjacent myometrium that
underlies the placenta and whose primary functionis the maintenance of an adequate blood supply tothe intervillous space of the placenta.42 Although itis common to see flow voids here even in normalpregnancies, in PASD these vessels are seen todirectly enter the placenta and can even courseup to the umbilical cord insertion.
PLACENTAL ABRUPTION
Placental abruption represents premature separa-tion of the placenta from the uterine wall. Althoughrare (affecting <1% of pregnancies), third-trimester abruption is associated with anincreased risk of preterm delivery and fetal death.Imaging appearance of placental abruption can beclassified based on the location of the hematomaas retroplacental, marginal subchorionic, prepla-cental, and intraplacental (Fig. 11).US is frequently performed to confirm the
presence of abruption and assess the extent ofsubchorionic or retroplacental hematoma.43
However, in up to 50% of cases of abruptionUS is negative for different reasons: (1) acutehemorrhage echo texture is very similar to thatof the adjacent placenta and is therefore very

Fig. 11. Coronal MR (A) T2-weighted, (B) T1-weighted, and (C) DWI demonstrate hyperacute placental abruption(asterisk) with intermediate signal intensity on T2-weighted images, high signal intensity on T1-weighted images,and reduced diffusion on high B-value images. (D) In a different patient, hemorrhage can be of very low signalintensity on T2-weighted images as seen on this case of intraamniotic hemorrhage of subacute chronicity (arrow).(E) Corresponding transabdominal US demonstrates diffuse echoes throughout the amniotic sac, correlating tolarge amount of intraamniotic hemorrhage (asterisk).
Nonfetal Imaging During Pregnancy 391
difficult to detect; (2) the imaging appearance ofan abnormally thick and heterogeneous placentais rare, being present only in large acute clots;and (3) many subacute clots result in falselynegative because blood dissects out frombeneath the placenta and drains through the cer-vix.44,45 MR images have intrinsic high soft tissuecontrast and can accurately depict placental-related hemorrhage with a reported high sensi-tivity of 95% to 100% and high specificity of100%.45 By considering the signal intensitychanges on T1-weighted, T2W, and diffusion-weighted images, with special reference to theparamagnetic effects of methemoglobin, it ispossible to estimate the age of the bleeding(see Fig. 11).46 Hyperacute hemorrhage is usu-ally hyperintense on T2W and diffusion-weighted images, being iso- to hypointense onT1-weighted images (see Fig. 11).46 Acute hem-orrhage remains iso- to hypointense on T1-weighted images but now becomes hypointenseon T2W and diffusion-weighed images.46 Sub-acute hemorrhage is T1-hyperintense due topresence of methemoglobin. Chronic hemor-rhage is hypointense on all T1-weighted, T2W,and diffusion-weighted images.46
PLACENTAL MASSES
Uncommonly, the placenta can developmasses, the most common of which is a cho-rioangioma. Broadly, placental masses can beclassified as nontrophoblastic or trophoblasticin origin.47 Trophoblastic masses include molarpregnancy, intraplacental choriocarcinoma, andcomplete hydatidiform mole with twin fetus.Nontrophoblastic masses include chorioan-gioma, placental teratoma, and placentalmesenchymal defect.47 Placenta can get metas-tases from maternal primaries such as lung andbreast cancer but also fetal malignancy such asneuroblastoma.47
Nontrophoblastic Placental Masses
ChorioangiomaThe most common nontrophoblastic mass todevelop in the placenta is a chorioangioma.47 Asthe name suggests, this is a benign proliferationof the vascular channels supported by chorionicstroma.48 Interestingly, these masses occur at anunusual frequency in higher altitudes, and hypoxicorigin of these masses has been postulated.48
Most of these masses are small and

Jha et al392
asymptomatic, being incidentally identified on USperformed for fetal well-being. The masses arecontiguous with fetal circulation, and resultantarteriovenous shunting within the placenta canbe linked to several pregnancy complications,including fetal anemia, thrombocytopenia, nonim-mune fetal hydrops, polyhydramnios, antepartumhemorrhage with premature placental detach-ment, preterm labor, intrauterine fetal growth re-striction (IUGR), and increased perinatalmortality.48
On US, chorioangiomas appear as echogenicmasses, which are characteristically located adja-cent to the placental cord insertion and protrudeinto the amniotic cavity (Fig. 12). On Doppler inter-rogation, internal vascularity pulsating at fetalheart rate can be demonstrated, which is a hall-mark for this diagnosis.48 Larger masses startdeveloping cystic areas and can even cause cho-rioamniotic separation, secondary to profusemucin secretion (see Fig. 12).47 Once diagnosed,careful assessment for polyhydramnios and fetalanemia using middle cerebral arterial Dopplerassessment should be performed. On MR imag-ing, these masses are isointense to the placentaon T1-weighted images and are heterogeneousbeing mostly hyperintense to the placenta onT2W images (see Fig. 12).47 Intrinsic T1 hyperin-tensity can develop at the periphery of the tumorrelated to hemorrhage.
Placental teratomaTeratomas are extremely rare benign tumors of theplacenta with a very favorable outcome. Thesemasses include components from all 3 germ celllines and always lie between the amnion and thechorion, usually on the fetal surface of theplacenta.49 The sonographic andMR imaging find-ings include demonstration of tissues of variableechogenicities or signal intensities demonstratingintratumoral fat, calcifications, and fluid.50 OnUS, fat in a teratoma is hyperechoic to the normalplacenta, whereas intratumoral calcifications areechogenic and demonstrate shadowing.50 Gesta-tional trophoblastic disorders can too present ashyperechoic masses but are unlikely to demon-strate calcification.50 One of the major differentialsfor a teratoma includes a fetus acardiac amor-phous (fetus in fetu). This entity demonstrateswell-formed elements such as partial or completeformation of a vertebral column, ribs, pelvis, andskull base and sometimes a short umbilical cordmay be present connecting this to the placenta.50
Placental mesenchymal defectPlacental mesenchymal defect (PMD) is a rarevascular anomaly of the placenta presenting as
placentomegaly, multicystic mass, and villous hy-perplasia.51 Although this finding may becompletely incidental, preterm delivery, IUGR,fetal anomalies (such as fetal liver cysts or vascularmalformations), fetal overgrowth with Beckwith-Wiedemann syndrome, and even fetal demisehave been associated with this abnormality.51,52
Sonographic features include a multicystic mass,which can closely mimic a partial mole appearinggiven the presence of an enlarged placenta withmultiple cystic masses (Fig. 13).53 Differentiationfrom a molar pregnancy is important for appro-priate management so that the pregnancy is noterroneously terminated. On color Doppler imag-ing, some of these cystic spaces demonstrateslow color flow, also called as a “stained-glass”appearance to the placenta (see Fig. 13).54 In earlypregnancy, lack of flow or slow flow can helpdifferentiate PMD from chorioangioma and molarpregnancies, but this distinction can be difficultin later trimester due to overall increased flow tothe placenta. MR imaging also shows correspond-ing findings of thickened placenta with multiplecystic spaces (see Fig. 13). Ultimately, chromo-somal abnormality helps differentiate these en-tities, with PMD usually having a 46 XXkaryotype, where partial moles are triploid.47
Trophoblastic placental massesTrophoblastic masses include hyaditiform moleand intraplacental choriocarcinoma. Unusualcases such as complete hyaditiform mole withcoexisting twin live fetus can also mimic aplacental mass. All the masses on the tropho-blastic spectrum are associated with dispropor-tionally elevated beta-human chorionicgonadotropin (b-hCG) levels.
Intraplacental choriocarcinoma This is a rarevariant of the choriocarcinoma spectrum, whichis known to be associated with massive fetomater-nal hemorrhage, likely due to villous erosion by thegrowing tumor, leading to fetal anemia and even-tual fetal demise.55 It should be considered in thedifferential for massive fetomaternal hemorrhageof unknown cause in the setting of an elevated b-hCG. On US, small intraplacental choriocarci-nomas can be occult and isoechoic to theplacenta.55 They can also present as hyperechoicmasses, whereas some may have cysticchanges.55 Retroplacental hemorrhage withplacental abruption can develop, which is respon-sible for the associated fetomaternal hemor-rhage.56 Metastases to both mother and fetuscan be present.56
Complete hydatidiform mole with twin live
fetus This is a rare entity in which a normal

Fig. 12. Chorioangioma. (A) Large mixed, solid, and cystic mass (arrows) is seen arising from the placenta and pro-truding into the amniotic cavity. Echogenic foci throughout the mass represent scattered calcifications. (B) Themass is characteristically located adjacent to the placental cord insertion. (C) On spectral Doppler interrogation,the mass demonstrates internal vascularity pulsating at the fetal heart rate, also characteristic of a chorioan-gioma. (D, E) Coronal T2W images demonstrate a heterogenous, exophytic mass (arrow) arising from theplacenta. (E) Separated amnion (black arrows) is seen consistent with chorioamniotic separation resulting fromexcessive mucin secretion by chorioangiomas.
Nonfetal Imaging During Pregnancy 393

Fig. 13. Placental mesenchymaldysplasia. (A) On color Doppler US,the placenta is noted to be thickenedwith multiple tiny cystic spaces (ar-row), which suggests PMD. (B) T2WMR imaging redemonstrates thethickened placenta with diffuse scat-tered T2-hypointense cystic spaces(arrow).
Jha et al394
karyotype fetus develops along with an abnormalmolar pregnancy.57 This entity poses a significantclinical challenge, leading to both maternal andfetal morbidity. Maternal risks include preeclamp-sia, hyperthyroidism, and possibly malignancy;fetal complications include elevated risk of spon-taneous abortion and neonatal thyrotoxicosis.47,57
Although the normal fetus can have a favorableoutcome, nearly 33% of the mothers developpersistent gestational trophoblastic disease afterdelivery.58
US findings include a multilocular cystic masson grayscale images. On Doppler US, overallhypervascularity is seen without demonstrableflow in the cystic components (Fig. 14), a findingthat helps differentiate from PMD.11,23 Identi-fying this mass as separate from the placentaof the normal twin is very important and helpsestablish the diagnosis. This distinction is bestestablished in the early gestational period andgets progressively more difficult with advancinggestation. PMD on the other hand is integrallyintraplacental in location. MR imaging also dem-onstrates the cystic nature of the mass and canshow the membrane separating the molar preg-nancy from the normal pregnancy (seeFig. 14).47 T1-weighted images best depict thehyperintensity associated with hemorrhage,which is common with molar pregnancies, and
often poorly identified on US (see Fig. 14). Typi-cally, there is significant increase in size of thiscystic mass of CHMTF from second to thirdtrimester, in contrast to PMD, which mostcommonly decreases in size as the pregnancyevolves.47
PEARLS, PITFALLS, VARIANTS
Imagers should be aware of common pitfalls thatcan happen in imaging for PASD. Loss of retropla-cental clear space from excess probe pressure is awell-known scenario, which can lead to overcallingaccreta. Hence, when this finding is present inisolation without other features of PASD, probepressure should be reduced and reimaging per-formed. Myometrial contractions can mimicmasses (Fig. 15). In addition, the presence of con-tractions can lead to obscuration of this clearspace (see Fig. 15).MR imaging pitfalls include the presence of
bulging of the uterus in patients without PASD.Similar to other scenarios, this should be inter-preted in combination with other findings.5 Arelatively homogeneous placenta without T2-dark bands or abnormal vascularity may beplacenta implanted in the region of scar that isballooning with the pressure of gestation,without the presence of PASD. Occasionally,
Fig. 14. Complete hyaditiform molewith twin fetus. (A) TransabdominalUS at 24 weeks and (B) correspondingsagittal T2W MR image demonstratesa large cystic mass (asterisk), separatefrom placenta and a normally devel-oped cotwin (arrow).
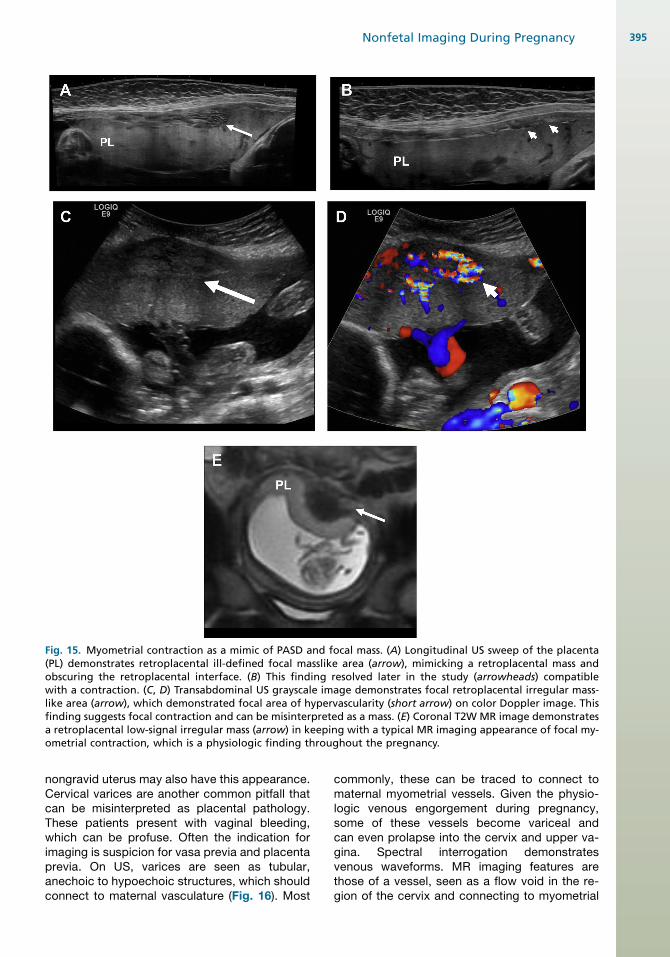
Fig. 15. Myometrial contraction as a mimic of PASD and focal mass. (A) Longitudinal US sweep of the placenta(PL) demonstrates retroplacental ill-defined focal masslike area (arrow), mimicking a retroplacental mass andobscuring the retroplacental interface. (B) This finding resolved later in the study (arrowheads) compatiblewith a contraction. (C, D) Transabdominal US grayscale image demonstrates focal retroplacental irregular mass-like area (arrow), which demonstrated focal area of hypervascularity (short arrow) on color Doppler image. Thisfinding suggests focal contraction and can be misinterpreted as a mass. (E) Coronal T2W MR image demonstratesa retroplacental low-signal irregular mass (arrow) in keeping with a typical MR imaging appearance of focal my-ometrial contraction, which is a physiologic finding throughout the pregnancy.
Nonfetal Imaging During Pregnancy 395
nongravid uterus may also have this appearance.Cervical varices are another common pitfall thatcan be misinterpreted as placental pathology.These patients present with vaginal bleeding,which can be profuse. Often the indication forimaging is suspicion for vasa previa and placentaprevia. On US, varices are seen as tubular,anechoic to hypoechoic structures, which shouldconnect to maternal vasculature (Fig. 16). Most
commonly, these can be traced to connect tomaternal myometrial vessels. Given the physio-logic venous engorgement during pregnancy,some of these vessels become variceal andcan even prolapse into the cervix and upper va-gina. Spectral interrogation demonstratesvenous waveforms. MR imaging features arethose of a vessel, seen as a flow void in the re-gion of the cervix and connecting to myometrial

Fig. 16. Cervical varix. (A) Transabdominal color Doppler US of lower uterine segment and cervix in a pregnantwoman presenting with multiple episodes of vaginal bleeding demonstrates prolapsed vascular structure in thecervical canal (arrow). (B) Spectral Doppler confirms venous flow that suggests a cervical varix. (C) On speculumexamination a “blue bag of worms” appearance of the cervix was noted. (D) Sagittal T2WMR image shows edem-atous cervical stroma (arrow) with central flow voids (short arrow). (E) After transvaginal cerclage placement (ar-row), color Doppler US shows no demonstrable color Doppler flow in the cervical canal. (F) Corresponding MRimages shows decreased stromal T2 signal and collapsed vascular structures, which supports a thrombosed varixpost cerclage placement.
Jha et al396
vessels (see Fig. 15). Differential includes themarginal vein of the placenta, which is locatedat the edge of the placental disc and does notconnect to myometrial vasculature. Varices candevelop throughout the pelvis during pregnancyand can develop in unusual locations such asalong the round ligaments, where they can pre-sent as palpable abnormalities and mimic aninguinal hernia (Fig. 17).Thrombohematomas, also known as Breus
mole, can mimic a placental mass.47 Presenceof myometrial contractions can also lead to glob-ular appearance of subjacent placenta, whichcan mimic a placental mass; however, the“masslike” area will be very similar to theplacenta in echogenicity.47 Doppler imagingcan be useful in this circumstance where the un-derlying area has similar vascularity. This shouldbe addressed by the reimaging after the contrac-tion has resolved.
WHAT THE REFERRING PHYSICIAN NEEDS TOKNOW
Imaging of PASD is focused on diagnosing thepresence and extent of involvement, depth ofplacental invasion, if possible, extrauterineextension, and presurgical planning. Once thepresence of PASD has been established, theradiologist should focus on assessing the loca-tion of the placenta and depth of invasion. Pres-ence of placental bulge sign has been shown tobe a marker for at least myometrial invasive dis-ease. When combined with serosal hypervascu-larity, findings are highly suspicious forplacenta percreta with extrauterine extension.Assessment of the extent of abnormal serosalvascularity can help predict the needs for addi-tional hemostatic measures such as interven-tional radiology embolization. Proximity of theplacenta with the bladder, specially posteriorly,

Fig. 17. Round ligament varices in apatient presenting with right groinlump, which developed and pro-gressed during pregnancy. Clinicalconcern was for inguinal hernia. (A)Transabdominal US showed tubularstructures (arrow), which demon-strated flow on (B) color Doppler im-ages (arrow). Findings in keepingwith pregnancy-related round liga-ment varices.
Nonfetal Imaging During Pregnancy 397
prompts cystoscopy at the time of delivery,possible placement of ureteral stents, creationof bladder patch at surgery, and urology involve-ment with worse involvement.
MR imaging allows to distinguish hematomasfrom other causes of antepartum bleeding andpain, such as vasa previa, degenerated uterinefibroid, cervical pathology, and placental tumors.Moreover, MR imaging helps to determine theage of the blood products based on MR signalcharacteristics of hemoglobin. Consequently,placental bleeding can be categorized into hyper-acute, acute, early subacute, late subacute, andchronic hematomas. Hyperacute and acuteplacental hematomas are considered unstable he-matomas with higher risk of rapid progression orrebleeding, which may require change inmanagement.
In cases with placental masses, the goal of im-aging is to characterize the mass and evaluatefetal well-being. Chorioangiomas can cause fetalanemia, polyhydramnios, chorioamniotic separa-tion, and even hydrops. The larger the size of themass, the higher the risk of complications. If afetal intervention is anticipated, as in the settingof fetal anemia, knowing the location ofthe placenta and cord insertion is helpful toassess the feasibility and access for in uterotransfusion.
SUMMARY
In summary, the placenta should be evaluated atthe time of fetal evaluation with US. Potential riskfactors for PASD should be elicited and if present,features of PASD should be evaluated for theirpresence. Prenatal diagnosis of PASD is essentialfor appropriate management and activation ofmultidisciplinary teams. Placental masses are un-common and can be divided into trophoblasticand nontrophoblastic masses. Molar pregnanciesand choriocarcinomas are trophoblastic masses.Although most nontrophoblastic placental massesare benign, the management focuses on the fetalwell-being.
REFERENCES
1. Norton M. Callen’s ultrasonography in obstetrics and
gynecology. 6th edition. Philadelphia: Elsevier;
2017.
2. Myatt L, Thornburg KL. Effects of prenatal nutrition
and the role of the placenta in health and disease.
Methods Mol Biol 2018;1735:19–46.
3. AIUM-ACR-ACOG-SMFM-SRU practice parameter
for the performance of standard diagnostic obstetric
ultrasound examinations. J Ultrasound Med 2018;
37(11):E13–24.
4. D’Antonio F, Iacovella C, Palacios-Jaraquemada J,
et al. Prenatal identification of invasive placentation
using magnetic resonance imaging: systematic re-
view and meta-analysis. Ultrasound Obstet Gynecol
2014;44(1):8–16.
5. Jha P, Rabban J, Chen L-M, et al. Placenta accreta
spectrum: value of placental bulge as a sign of my-
ometrial invasion on MR imaging. Abdom Radiol
(NY) 2019;44(7):2572–81.
6. Masselli G, Gualdi G. MR imaging of the placenta:
what a radiologist should know. Abdom Imaging
2013;38(3):573–87.
7. Elsayes KM, Trout AT, Friedkin AM, et al. Imaging of
the placenta: a multimodality pictorial review. Radio-
graphics 2009;29(5):1371–91.
8. Philips J, Gurganus M, DeShields S, et al. Preva-
lence of sonographic markers of placenta accreta
spectrum in low-risk pregnancies. Am J Perinatol
2019;36(8):733–80.
9. Blaicher W, Brugger PC, Mittermayer C, et al. Mag-
netic resonance imaging of the normal placenta. Eur
J Radiol 2006;57(2):256–60.
10. Gowland PA, Freeman A, Issa B, et al. In vivo relax-
ation time measurements in the human placenta us-
ing echo planar imaging at 0.5 T. Magn Reson
Imaging 1998;16(3):241–7.
11. Leyendecker JR, DuBose M, Hosseinzadeh K,
et al. MRI of pregnancy-related issues: abnormal
placentation. AJR Am J Roentgenol 2012;198(2):
311–20.
12. Derman AY, Nikac V, Haberman S, et al. MRI of
placenta accreta: a new imaging perspective. AJR
Am J Roentgenol 2011;197(6):1514–21.

Jha et al398
13. Jauniaux E, Bhide A, Kennedy A, et al. FIGO
consensus guidelines on placenta accreta spectrum
disorders: Prenatal diagnosis and screening. Int J
Gynaecol Obstet 2018;140(3):274–80.
14. Jauniaux E, Collins S, Burton GJ. Placenta accreta
spectrum: pathophysiology and evidence-based
anatomy for prenatal ultrasound imaging. Am J Ob-
stet Gynecol 2018;218(1):75–87.
15. Melcer Y, Jauniaux E, Maymon S, et al. Impact of tar-
geted scanning protocols on perinatal outcomes in
pregnancies at risk of placenta accreta spectrum
or vasa previa. Am J Obstet Gynecol 2018;218(4):
443.e1-–8.
16. Jauniaux E, Chantraine F, Silver RM, et al. FIGO
consensus guidelines on placenta accreta spectrum
disorders: Epidemiology. Int J Gynaecol Obstet
2018;140(3):265–73.
17. Jauniaux E, Collins SL, Jurkovic D, et al. Accreta
placentation: a systematic review of prenatal ultra-
sound imaging and grading of villous invasiveness.
Am J Obstet Gynecol 2016;215(6):712–21.
18. Alfirevic Z, Tang A-W, Collins SL, et al. Pro forma
for ultrasound reporting in suspected abnormally
invasive placenta (AIP): an international
consensus. Ultrasound Obstet Gynecol 2016;
47(3):276–8.
19. Collins SL, Ashcroft A, Braun T, et al. Proposal for
standardized ultrasound descriptors of abnormally
invasive placenta (AIP). Ultrasound Obstet Gynecol
2016;47(3):271–5.
20. Finberg HJ, Williams JW. Placenta accreta: prospec-
tive sonographic diagnosis in patients with placenta
previa and prior cesarean section. J Ultrasound Med
1992;11(7):333–43.
21. Shih JC, Jaraquemada JMP, Su YN, et al. Role of
three-dimensional power Doppler in the antenatal
diagnosis of placenta accreta: comparison with
gray-scale and color Doppler techniques. Ultra-
sound Obstet Gynecol 2009;33(2):193–203.
22. Bhide A, Laoreti A, Kaelin Agten A, et al. Lower uter-
ine segment placental thickness in women with
abnormally invasive placenta. Acta Obstet Gynecol
Scand 2019;98(1):95–100.
23. Budorick NE, Figueroa R, Vizcarra M, et al. Another
look at ultrasound and magnetic resonance imaging
for diagnosis of placenta accreta. J Matern Fetal
Neonatal Med 2017;30(20):2422–7.
24. Aitken K, Allen L, Pantazi S, et al. MRI significantly
improves disease staging to direct surgical planning
for abnormal invasive placentation: a single centre
experience. J Obstet Gynaecol Can 2016;38(3):
246–251 e1.
25. Bourgioti C, Zafeiropoulou K, Fotopoulos S, et al.
MRI features predictive of invasive placenta with
extrauterine spread in high-risk gravid patients: a
prospective evaluation. AJR Am J Roentgenol
2018;211(3):701–11.
26. Bourgioti C, Zafeiropoulou K, Fotopoulos S, et al.
MRI prognosticators for adverse maternal and
neonatal clinical outcome in patients at high risk
for placenta accreta spectrum (PAS) disorders.
J Magn Reson Imaging 2018;50(2):602–18.
27. Lax A, Prince MR, Mennitt KW, et al. The value of
specific MRI features in the evaluation of suspected
placental invasion. Magn Reson Imaging 2007;
25(1):87–93.
28. Ueno Y, Kitajima K, Kawakami F, et al. Novel MRI
finding for diagnosis of invasive placenta praevia:
evaluation of findings for 65 patients using clinical
and histopathological correlations. Eur Radiol
2014;24(4):881–8.
29. Goergen SK, Posma E, Wrede D, et al. Interobserver
agreement and diagnostic performance of individual
MRI criteria for diagnosis of placental adhesion dis-
orders. Clin Radiol 2018;73(10):908.e1-9.
30. Azour L, Besa C, Lewis S, et al. The gravid uterus:
MR imaging and reporting of abnormal placentation.
Abdom Radiol (NY) 2016;41(12):2411–23.
31. Bour L, Place V, Bendavid S, et al. Suspected inva-
sive placenta: evaluation with magnetic resonance
imaging. Eur Radiol 2014;24(12):3150–60.
32. Familiari A, Liberati M, Lim P, et al. Diagnostic accu-
racy of magnetic resonance imaging in detecting
the severity of abnormal invasive placenta: a sys-
tematic review and meta-analysis. Acta Obstet Gy-
necol Scand 2018;97(5):507–20.
33. Alamo L, Anaye A, Rey J, et al. Detection of sus-
pected placental invasion by MRI: do the results
depend on observer’ experience? Eur J Radiol
2013;82(2):e51–7.
34. Baughman WC, Corteville JE, Shah RR. Placenta ac-
creta: spectrum of US and MR imaging findings. Ra-
diographics 2008;28(7):1905–16.
35. Chen X, Shan R, Zhao L, et al. Invasive placenta pre-
via: Placental bulge with distorted uterine outline
and uterine serosal hypervascularity at 1.5T MRI -
useful features for differentiating placenta percreta
from placenta accreta. Eur Radiol 2018;28(2):
708–17.
36. Rahaim NSA, Whitby EH. The MRI features of
placental adhesion disorder and their diagnostic
significance: systematic review. Clin Radiol 2015;
70(9):917–25.
37. Twickler DM, Lucas MJ, Balis AB, et al. Color flow
mapping for myometrial invasion in women with a
prior cesarean delivery. J Matern Fetal Med 2000;
9(6):330–5.
38. Lim PS, Greenberg M, Edelson MI, et al. Utility of ul-
trasound and MRI in prenatal diagnosis of placenta
accreta: a pilot study. AJR Am J Roentgenol 2011;
197(6):1506–13.
39. Maldjian C, Adam R, Pelosi M, et al. MRI appear-
ance of placenta percreta and placenta accreta.
Magn Reson Imaging 1999;17(7):965–71.

Nonfetal Imaging During Pregnancy 399
40. Kim JA, Narra VR. Magnetic resonance imaging with
true fast imaging with steady-state precession and
half-Fourier acquisition single-shot turbo spin-echo
sequences in cases of suspected placenta accreta.
Acta Radiol 2004;45(6):692–8.
41. Konstantinidou AE, Bourgioti C, Fotopoulos S, et al.
Stripped fetal vessel sign: a novel pathological
feature of abnormal fetal vasculature in placenta ac-
creta spectrum disorders with MRI correlates.
Placenta 2019;85:74–7.
42. Robert Pijnenborg IB. Roberto Romero placental
bed disorders: basic science and its translation to
obstetrics. Oxford (UK): Cambridge University
Press; 2010.
43. Fadl SA, Linnau KF, Dighe MK. Placental abruption
and hemorrhage-review of imaging appearance.
Emerg Radiol 2019;26(1):87–97.
44. Jha P, Melendres G, Bijan B, et al. Trauma in preg-
nant women: assessing detection of post-traumatic
placental abruption on contrast-enhanced CT
versus ultrasound. Abdom Radiol (NY) 2017;42(4):
1062–7.
45. Masselli G, Brunelli R, Parasassi T, et al. Magnetic
resonance imaging of clinically stable late preg-
nancy bleeding: beyond ultrasound. Eur Radiol
2011;21(9):1841–9.
46. Masselli G, Brunelli R, Di Tola M, et al. MR imaging in
the evaluation of placental abruption: correlation
with sonographic findings. Radiology 2011;259(1):
222–30.
47. Jha P, Paroder V, Mar W, et al. Multimodality imaging
of placental masses: a pictorial review. Abdom Ra-
diol (NY) 2016;41(12):2435–44.
48. Sirotkina M, Douroudis K, Westgren M, et al. Associ-
ation of chorangiomas to hypoxia-related placental
changes in singleton and multiple pregnancy pla-
centas. Placenta 2016;39:154–9.
49. Shimojo H, Itoh N, Shigematsu H, et al. Mature tera-
toma of the placenta. Pathol Int 1996;46(5):372–5.
50. Ahmed N, Kale V, Thakkar H, et al. Sonographic
diagnosis of placental teratoma. J Clin Ultrasound
2004;32(2):98–101.
51. Moscoso G, Jauniaux E, Hustin J. Placental vascular
anomaly with diffuse mesenchymal stem villous hy-
perplasia. A new clinico-pathological entity? Pathol
Res Pract 1991;187(2–3):324–8.
52. Tortoledo M, Galindo A, Ibarrola C. Placental mesen-
chymal dysplasia associated with hepatic and pul-
monary hamartoma. Fetal Pediatr Pathol 2010;
29(4):261–70.
53. Starikov R, Goldman R, Dizon DS, et al. Placental
mesenchymal dysplasia presenting as a twin gesta-
tion with complete molar pregnancy. Obstet Gynecol
2011;118(2 Pt 2):445–9.
54. Kuwata T, Takahashi H, Matsubara S. ’Stained-glass’
sign for placental mesenchymal dysplasia. Ultra-
sound Obstet Gynecol 2014;43(3):355.
55. Aso K, Tsukimori K, Yumoto Y, et al. Prenatal findings
in a case of massive fetomaternal hemorrhage asso-
ciated with intraplacental choriocarcinoma. Fetal Di-
agn Ther 2009;25(1):158–62.
56. Liu J, Guo L. Intraplacental choriocarcinoma in a
term placenta with both maternal and infantile me-
tastases: a case report and review of the literature.
Gynecol Oncol 2006;103(3):1147–51.
57. Unsal MA, Guven S. Complete hydatidiform mole
coexisting with a live fetus. Clin Exp Obstet Gynecol
2012;39(2):262–4.
58. Piura B, Rabinovich A, Hershkovitz R, et al. Twin
pregnancy with a complete hydatidiform mole and
surviving co-existent fetus. Arch Gynecol Obstet
2008;278(4):377–82.