In vitro exposure effects of cyclosporin A and bis(tri- n-butyltin)oxide on lymphocyte...
18
Toxicology 135 (1999) 49–66 In vitro exposure effects of cyclosporin A and bis(tri-n -butyltin)oxide on lymphocyte proliferation, cytokine (receptor) mRNA expression, and cell surface marker expression in rat thymocytes and splenocytes Rob J. Vandebriel a, *, Sander W. Spiekstra a , Barry N. Hudspith b , Clive Meredith b , Henk Van Loveren a a Laboratory for Pathology and Immunobiology, National Institute of Public Health and the En6ironment, P.O. Box 1, 3720 BA Biltho6en, The Netherlands b Immunotoxicology, BIBRA International, Woodmansterne Road, Carshalton, Surrey SM54DS, UK Received 7 January 1999; accepted 21 March 1999 Abstract Rat thymocytes and splenocytes were exposed in vitro to the model compounds Cyclosporin A (CsA), an immunosuppressive drug, and bis(tri-n -butyltin)oxide (TBTO), an immunotoxic environmental contaminant. The lymphocyte transformation test (LTT), cytokine (receptor) mRNA expression (RT-PCR and dot blot hybridisation), and flow cytometry were evaluated as assays for in vitro immunotoxicity, at dose levels that did not show effects on viability, this being the aim of the study. LTT and RT-PCR proved useful assays. Lymphocyte transformation was suppressed by both compounds, while IL-2 mRNA expression was suppressed by CsA but not by TBTO, and both compounds suppressed IL-2R mRNA expression in splenocytes but not in thymocytes. Furthermore, the data obtained suggest that antiproliferative effects may be more relevant than apoptosis induction for TBTO induced thymus atrophy. © 1999 Elsevier Science Ireland Ltd. All rights reserved. Keywords: Bis(tri-n -butyltin)oxide; Cyclosporin A; Dot blot hybridisation; FACS; Lymphocyte transformation test; RT-PCR 1. Introduction The immunosuppressive drug cyclosporin A (CsA) is known for its ability to prevent allograft rejection and allogeneic graft-versus-host disease * Corresponding author. Tel.: +31-30-2742610; fax: +31- 30-2744437. E-mail address; [email protected] (R.J. Vandebriel) 0300-483X/99/$ - see front matter © 1999 Elsevier Science Ireland Ltd. All rights reserved. PII:S0300-483X(99)00049-9
-
Upload
independent -
Category
Documents
-
view
2 -
download
0
Transcript of In vitro exposure effects of cyclosporin A and bis(tri- n-butyltin)oxide on lymphocyte...
Toxicology 135 (1999) 49–66
In vitro exposure effects of cyclosporin A andbis(tri-n-butyltin)oxide on lymphocyte proliferation, cytokine
(receptor) mRNA expression, and cell surface markerexpression in rat thymocytes and splenocytes
Rob J. Vandebriel a,*, Sander W. Spiekstra a, Barry N. Hudspith b,Clive Meredith b, Henk Van Loveren a
a Laboratory for Pathology and Immunobiology, National Institute of Public Health and the En6ironment, P.O. Box 1,3720 BA Biltho6en, The Netherlands
b Immunotoxicology, BIBRA International, Woodmansterne Road, Carshalton, Surrey SM5 4DS, UK
Received 7 January 1999; accepted 21 March 1999
Abstract
Rat thymocytes and splenocytes were exposed in vitro to the model compounds Cyclosporin A (CsA), animmunosuppressive drug, and bis(tri-n-butyltin)oxide (TBTO), an immunotoxic environmental contaminant. Thelymphocyte transformation test (LTT), cytokine (receptor) mRNA expression (RT-PCR and dot blot hybridisation),and flow cytometry were evaluated as assays for in vitro immunotoxicity, at dose levels that did not show effects onviability, this being the aim of the study. LTT and RT-PCR proved useful assays. Lymphocyte transformation wassuppressed by both compounds, while IL-2 mRNA expression was suppressed by CsA but not by TBTO, and bothcompounds suppressed IL-2R mRNA expression in splenocytes but not in thymocytes. Furthermore, the dataobtained suggest that antiproliferative effects may be more relevant than apoptosis induction for TBTO inducedthymus atrophy. © 1999 Elsevier Science Ireland Ltd. All rights reserved.
Keywords: Bis(tri-n-butyltin)oxide; Cyclosporin A; Dot blot hybridisation; FACS; Lymphocyte transformation test; RT-PCR
1. Introduction
The immunosuppressive drug cyclosporin A(CsA) is known for its ability to prevent allograftrejection and allogeneic graft-versus-host disease
* Corresponding author. Tel.: +31-30-2742610; fax: +31-30-2744437.
E-mail address; [email protected] (R.J. Vandebriel)
0300-483X/99/$ - see front matter © 1999 Elsevier Science Ireland Ltd. All rights reserved.
PII: S 0300 -483X(99 )00049 -9
R.J. Vandebriel et al. / Toxicology 135 (1999) 49–6650
following organ and bone marrow transplanta-tion, respectively, as well as its efficacy in thetreatment of certain autoimmune diseases. Histol-ogy reveals cortification of the thymic medulla(De Waal et al., 1997). CsA exerts its action bybinding to cyclophilin. Binding of the CsA/cy-clophilin complex to the protein phosphatase cal-cineurin results in inactivation of calcineurin. As aconsequence, dephosphorylation of the cytosolicsubunit of the nuclear factor of activated T-cells(NFAT), necessary for translocation of this tran-scription factor to the nucleus, is blocked. Ab-sence of this translocation results in a failure toactivate the genes regulated by NF-AT, such asIL-2 (Cai et al., 1996; Ho et al., 1996). CsAexposure inhibits anti-CD3-induced proliferativeresponses and production of IL-2, IL-4, and IFN-g, and IL-2R cell surface expression (Ryffel et al.,1995; Harada et al., 1996). In addition, CsA treat-ment of Con A-stimulated mouse splenocytes re-duces mRNA expression of IL-2 and IFN-g, butnot IL-10 (Han et al., 1995). In the thymus CsAinhibits positive selection. Phorbol myristate ac-etate (PMA) and ionomycin together induce ex-pression of IL-2, IL-4, and IFN-g in CD4−CD8−
and CD4+CD8−, but not in CD4+CD8+ thy-mocytes (Amasaki et al., 1998). Different thymo-cyte subsets preferentially express mRNAsencoding different NFAT family proteins, beingNFATp, NFATc, and NFATx (Amasaki et al.,1998). The activity of all three proteins is inhib-ited by CsA. Thus, similar to splenocytes, CsAinhibits in thymocytes expression of cytokinegenes.
Exposure of rats to the immunotoxic environ-mental contaminant bis(tri-n-butyltin)oxide(TBTO) causes thymus atrophy, with histologyrevealing depletion of cortical thymocytes andabsence of distinct cortico-medullary junctions(Krajnc et al., 1984; Vos et al., 1985; Bressa et al.,1991). TBTO affects the thymus via a direct ac-tion on cortical thymocytes rather than on theepithelial compartment (De Waal et al., 1993).Exposure results in decreased cellular immuneresponses, among which are reduced proliferativeresponses of thymocytes and splenocytes to theT-cell mitogens phytohemagglutinin and Con A,suppressed delayed-type hypersensitivity to oval-
bumin and tuberculin, and reduced IgE titresagainst Trichinella spiralis (Vos et al., 1984, 1990).Furthermore, a reduced percentage of splenic T-cells and a concomitant increased percentage ofsplenic B-cells is found. No exposure effect on theCD4/CD8 ratio is observed in the spleen (Vos etal., 1984). Exposure results in decreased IL-2RmRNA and protein levels in thymus and spleen,as well as increased IL-2 and IFN-g mRNA levelsin spleen (Vandebriel et al., 1998a).
In vitro immunotoxicity testing can be used inrisk assessment for extrapolation of animal datato man, to investigate mechanisms of immunotox-icity, and possibly in some cases as a pre-screen.In this study in vitro exposure was performedusing thymocytes and splenocytes. The modelcompounds used were CsA and TBTO. The aimof this study was to evaluate (1) lymphocytetransformation, (2) cytokine (receptor) mRNA ex-pression, and (3) surface marker expression, asparameters of in vitro immunotoxicity, at doselevels that did not show effects on viability.
2. Materials and methods
2.1. Cell isolation
Spf outbred female Wistar rats (RIV:TOX; ob-tained from our own breeding colony) were usedat the age of 6–8 weeks. Thymi and spleens wereexcised aseptically and stored in Iscove’s modifiedDulbecco’s medium (IMDM; Gibco, Grand Is-land, NY, USA) on ice. The organs were gentlypressed through a cell strainer (70-mm nylon; Fal-con, Becton-Dickinson Labware, Franklin Lakes,NJ, USA). Cells were suspended in 25 ml IMDM,supplemented with 10% fetal calf serum (FCS;PAA, Linz, Austria), 100 IU/ml penicillin, and100 mg/ml streptomycin. This is referred to ascomplete Iscove’s medium. The cells were pelletedfor 10 min at 300×g (4°C) and resuspended in 20ml complete Iscove’s medium. The cells were thenpelleted for 10 min at 300×g (4°C) and resus-pended in 10 ml complete Iscove’s medium. Cellswere counted using a Coulter Counter (CoulterElectronics, Luton, UK). Cell suspensions weretransferred to 25- or 80-cm2 tissue culture flasks
R.J. Vandebriel et al. / Toxicology 135 (1999) 49–66 51
(Falcon) at 5×10⁶ cells/ml, the chemical of inter-est was added, and the cultures were incubated for24 h at 37°C in a humidified atmosphere contain-ing 5% CO2.
2.2. Chemical exposure
A 1 mM stock solution was prepared by dis-solving Cyclosporin A (CsA; a kind gift of Drs P.Herrling and T.J. Petcher, Novartis, Basel,Switzerland) in 96% ethanol. This solution wasdiluted 100 times and subsequently ten times inIMDM, prior to addition to the cell cultures atfinal concentrations of 0.01, 0.03, 0.1, 0.3 and 1mM. Bis(tri-n-butyl-tin)oxide (TBTO; Aldrich,Brussels, Belgium) was diluted in ethanol andIMDM immediately prior to addition to the cellcultures at final concentrations of 0.01, 0.03, 0.1,0.3, 1.0, 3.0, and 10 mM. The final ethanol con-centration in the culture flasks did not exceed0.012% which had no effects on test systemparameters. Following chemical exposure, thecells were harvested and washed once as describedabove and resuspended in complete Iscove’smedium.
2.3. Cell 6iability
Cells were counted as described above and cul-tured in the presence or absence of 2 mg/ml con-canavalin A (Con A; Janssen Chimica, Beerse,Belgium) for 24 h as described above. Cell viabil-ity was examined by trypan blue dye exclusion.Results are expressed as percentage of control9S.E.M.
2.4. Lymphocyte transformation test
Cells were counted as described above. A totalof 1.05×10⁶ cells was cultured in triplicate in 150ml complete Iscove’s medium in U-bottom 96-wellmicrotiter plates (Greiner, Frickenhausen, Ger-many) and in the same plate in triplicate with 0.3mg Con A in 150 ml of complete Iscove’s medium.The plates were incubated at 37°C in a humidifiedatmosphere containing 5% CO2. After incubationfor 48 h, 37 kBq [methyl-3H]thymidine ([3H]TdR;
Amersham, Little Chalfont, UK) was added tothe wells. After 24 h the cells were harvested onglass-fibre filters (LKB-Wallac, Espoo, Finland)using a multiple cell culture harvester (LKB-Wal-lac). Results are expressed in counts per minute(cpm). Percentage incorporation is calculated us-ing the following formula:
mean cpm (Con A)−mean cpm(medium) of test sample
X%= ×100mean cpm (Con A)−mean cpm(medium) of control sample
Results are expressed as percentage ofcontrol9S.E.M.
2.5. RNA isolation
Cells were cultured at 5×10⁶ cells/ml with 2mg/ml Con A for 24 h (RT-PCR) or 6 h (dot blothybridisation). Total RNA was isolated usingRNAzol-B (Campro Scientific, Veenendaal, TheNetherlands) according to the manufacturer’sprotocol. Briefly, cell pellets were treated with 2ml RNAzol-B under gentle pipetting. RNA wasprecipitated in 100% ethanol and washed with75% ethanol. RNA was subjected to electrophore-sis and visualised by ethidium bromide (EtBr)staining. RNA was used only when both 28S and18S rRNA bands were intact.
2.6. cDNA synthesis
RNA was reverse transcribed using the ReverseTranscription System (Promega, Leiden, TheNetherlands). Briefly, 10.5 ml water containing 1mg RNA were mixed with 0.5 ml oligo(dT) primer(500 mg/ml) and incubated for 10 min at 70°C.Samples were then incubated at 4°C for at least 5min. To the mixture, 4 ml MgCl2 (25 mM), 2 ml10×RT-buffer, 2 ml dNTP (10 mM each), 0.5 mlRNasin (50 U/ml) and 0.5 ml AMV-RT (30 U/ml)were added and incubated at 42°C for 1 h. Thereaction was stopped by heating the samples for 5min at 72°C.

R.J. Vandebriel et al. / Toxicology 135 (1999) 49–6652
2.7. Polymerase chain reaction
The PCR mixture contained 5 mg/ml 5%-primer,5 mg/ml 3%-primer, 1.5 mM MgCl2, 200 mM ofeach dNTP (Boehringer Mannheim, Almere, TheNetherlands), and 2 U AmpliTaq polymerase(Perkin-Elmer, Nieuwerkerk a/d IJssel, TheNetherlands) in 1× PCR buffer II (Perkin-Elmer). Primers were synthesised by Perkin-Elmer. Their sequences are shown in Table 1. Asa housekeeping gene, hypoxanthine-guaninephoshoribosyltransferase (HPRT) was used, whilethe IL-10 primer pair denoted (i) was used. Oneand 2 ml cDNA were amplified as follows: 94°Cfor 3 min, followed by various numbers of cyclesat 94°C for 1 min, 60°C for 1 min and 72°C for 2min, and a final step at 72°C for 7 min. Thenumber of cycles was 26 and 28 for IL-2 andIL-2R, 28 and 30 for HPRT and IFN-g, and 32and 34 for IL-10. PCR for IL-4 (up to 43 cycles)did not result in significant amounts of product.PCR products were subjected to electrophoresis
and visualised by EtBr staining. Their intensitieswere quantified using a Gel Doc 1000 (Bio-Rad,Veenendaal, The Netherlands) and Molecular An-alyst software (Bio-Rad), and expressed as opticalunits. To check whether the PCR reactions werewithin their linear range of amplification the in-tensities were compared from 1 and 2 ml cDNAand at two different numbers of cycles. HPRTwas used as a control for the total amount ofmRNA. Results were expressed as ratio betweenthe amount of PCR product from the cytokinestudied and HPRT, as percentage of control9S.E.M.
2.8. Digoxigenin labelling
A total of 2 ml cDNA of unexposed cells wasamplified as described above for 33 cycles. As ahousekeeping gene, glyceraldehyde-3-phosphate-dehydrogenase (GAPDH) was used, while for IL-10 the primer pair (ii) was used. Five ml of PCRproduct was used in a 50-ml PCR mixture. Thismixture contained 1 mg/ml 5%-primer, 1 mg/ml3%-primer, 1.5 mM MgCl2, 200 mM dATP, 200 mMdCTP, 200 mM dGTP, 120 mM dTTP, 70 mMdig-11-dUTP (Boehringer Mannheim), and 0.5 UAmpliTaq polymerase in 1× PCR buffer II. PCRwas performed for 25 cycles in triplicate. A PCRin the absence of dig-11-dUTP, but in the pres-ence of 200 mM dTTP was used as a control (Lionand Haas, 1990).
2.9. Dot blot hybridisation
RNA samples were blotted onto Tropilon-Plusmembrane (Tropix, Bedford, MA, USA) using aBio-Dot apparatus (Bio-Rad) in a dilution seriescontaining 4.2, 1.4, 0.5, 0.2, 0.05, 0.02, and 0.005mg RNA in 27% formamide, 3.8% formaldehyde,and 11× SSC. RNA was fixed to the membraneby UV crosslinking at 125 mJ/cm2 in a GSGenelinker (Bio-Rad). Prehybridisation was per-formed for 4 h at 50°C in 5× SSC, 5× Den-hardt’s, 0.1 mg/ml fragmented herring sperm (fhs)DNA (Sigma, Axel, The Netherlands), and 7%SDS. For hybridisation, 10 ng/ml dig-labelledprobe was added to the hybridisation solution(50% formamide, 5× SSC, 5× Denhardt’s, 7%
Table 1PCR primer sequences
HPRT: Jansen et al., 1992 (385 bp)5%: GTC AAG CAG TAC AGC CCC AAA ATG G3%: TAG TGC AAA TCA AAA GGG ACG CAG C
GAPDH: Fort et al., 1985 (452 bp)5%: ACC ACA GTC CAT GCC ATC AC3%: TCC ACC ACC CTG TTG CTG TA
IL-2: McKnight et al., 1989 (168 bp)5%: AGC AAA AGC TTT CAC TTG GAA3%: GAT GAT GCT TTG ACA GAT GGC
IL-2R: Page and Dallman, 1991 (211 bp)5%: AGC TGT GTC TGT ATG ACC CAC3%: TGA GGT GTA ACT TGC TCT CTT
IL-4: Richter et al., 1990; McKnight et al., 1991 (165 bp)5%: GGG CTT CCA GGG TGC TTC GCA AAT3%: TCA GTG TTG TGA GCG TGG ACT
IL-10: Goodman et al., 1992 (i: 383 bp) (ii: 351 bp)i:5%: GCT CTT ACT GGC TGG AGT GA3%: CCT TGC TTT TAT TCT CAC AGGii:5%: CAC TGC TAT GTT GCC TGC TCT TAC TG3%: GTA TCC AGA GGG TCT TCA GCT TCT CTC
IFN-g: Dijkema et al., 1985, 1986 (288 bp)3%: ATC TGG AGG AAC TGG CAA AAG GAC G5%: CCT TAG GCT AGA TTC TGG TGA CAG C
R.J. Vandebriel et al. / Toxicology 135 (1999) 49–66 53
SDS, 10% dextran sulphate, 0.1 mg/ml fhs DNA),except for GAPDH and IFN-g, where 2.5 and 7ng/ml, respectively, dig-labelled probe wereadded. Hybridisation was performed for 20 h at50°C. After hybridisation, the membranes werewashed twice for 5 min in 2× SSC, 1% SDS atroom temperature, followed by two washes for 15min in 0.1× SSC, 1% SDS at 50°C.
2.10. Immunological detection
Membranes were washed for 1 min in washingbuffer (0.3% Tween-20, 0.1 M maleic acid, 0.15M NaCl, pH 7.5) and blocked for 30 min inblocking buffer (1% Blocking Reagent(Boehringer Mannheim), 10 mg/ml fhs DNA, 0.1M maleic acid, 0.15 M NaCl, pH 7.5). Themembranes were incubated for 30 min in block-ing buffer containing 75 mU anti-dig-alkalinephosphatase Fab fragments (BoehringerMannheim). The membranes were washed threetimes for 1 h in washing buffer. The membraneswere then washed for 2 min in detection buffer(0.1 M Tris–HCl, 0.1 M NaCl, 0.05 M MgCl2,pH 9.5). The membranes were incubated for 5min in 1% CDP-star (Tropix) in detectionbuffer. The membranes were dried shortly be-tween filter papers and sealed in plastic bags.The membranes were exposed to Hyperfilm-ECL(Amersham) for 1, 5, 10, 15, and 30 min. Den-sity analysis of spots was performed using a GelDoc 700 densitometer (Bio-Rad) and MolecularAnalyst software. GAPDH was used as a con-trol for the total amount of mRNA. Results areexpressed as ratio between the optical densityfrom the cytokine studied and GAPDH, as per-centage of control9S.E.M.
2.11. Expression of cell surface determinants
Cells were counted as described above and 75ml of 1.05×10⁷ cells/ml were transferred to U-bottom 96-well microtiter plates (Falcon), pel-leted for 5 min at 460×g (4°C), andresuspended in 100 ml cold (4°C) PBS supple-mented with 1% bovine serum albumin (Sigma)and 0.1% NaN3. Aliquots were stained for anal-
ysis with the mAbs ER-2 (anti-rat CD4-FITC;Serotec, Oxford, UK), OX-8 (anti-rat CD8-bi-otin; Serotec Oxford, UK) and Mark-1 (anti-ratk light chain-FITC; Sanbio, Uden, The Nether-lands). Streptavidin–phycoerythrin (PE) conju-gate (Jackson ImmunoResearch, West Grove,PA, USA) was added to detect OX-8 mAb. Nostaining above background levels was observedusing irrelevant isotype-matched control antibod-ies. Cells were fixed in 0.1% paraformaldehyde/PBS solution. Flow cytometry was performedusing a single-laser FACScan (Becton-DickinsonImmunocytometry Systems, Mountain View,CA, USA). Analyses were performed using theLysis II Software package (Becton-DickinsonImmunocytometry Systems). Percentages ofCD4+CD8+, CD4+CD8−, CD4−CD8+, andCD4−CD8− thymocytes, as well asCD4+CD8−, CD4−CD8+, and Mark-1+
splenocytes were measured. Results are expressedas percentage9S.E.M. In addition, these per-centages were multiplied by the total number ofcells harvested after culture. These results areexpressed as percentage of control9S.E.M.
2.12. Statistics
Statistical analysis was performed using one-way analysis of variance (ANOVA) followed bythe two-tailed Student t-test using the ANOVAcalculated pooled standard deviation. Signifi-cance levels were *PB0.05, **PB0.01 and***PB0.001.
3. Results
3.1. Cell 6iability
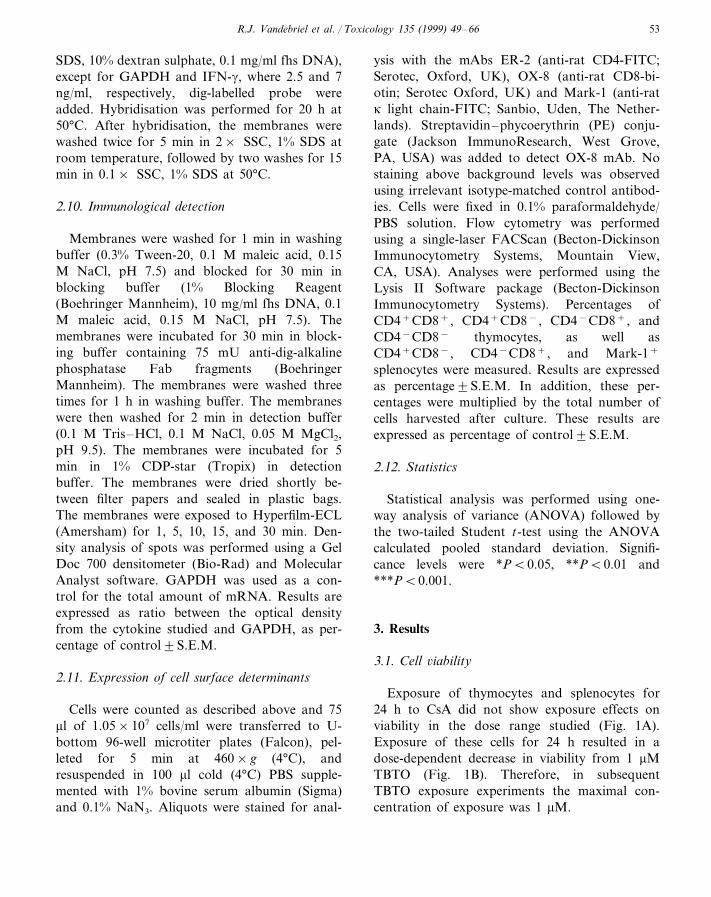
Exposure of thymocytes and splenocytes for24 h to CsA did not show exposure effects onviability in the dose range studied (Fig. 1A).Exposure of these cells for 24 h resulted in adose-dependent decrease in viability from 1 mMTBTO (Fig. 1B). Therefore, in subsequentTBTO exposure experiments the maximal con-centration of exposure was 1 mM.
R.J. Vandebriel et al. / Toxicology 135 (1999) 49–6654
Fig. 1. Viability of thymocytes and splenocytes after (A) CsA exposure, and (B) TBTO exposure. Thymocytes (") and splenocytes(�) were cultured for 24 h in the presence of CsA or TBTO. Viability was assessed by trypan blue dye exclusion. (A) n=12(thymocytes), n=7 (splenocytes); (B) n=8, except where indicated (thymocytes), n=11 (splenocytes). Results are expressed aspercentage viability9S.E.M. Significance levels are *PB0.05, **PB0.01 and ***PB0.001.
3.2. Lymphocyte transformation test
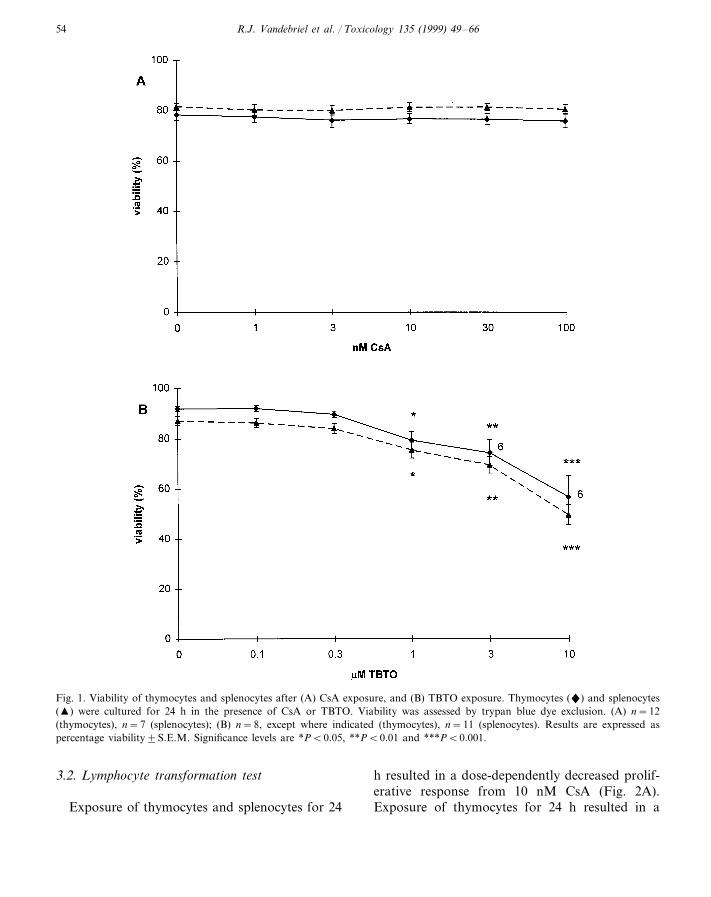
Exposure of thymocytes and splenocytes for 24
h resulted in a dose-dependently decreased prolif-erative response from 10 nM CsA (Fig. 2A).Exposure of thymocytes for 24 h resulted in a
R.J. Vandebriel et al. / Toxicology 135 (1999) 49–66 55
dose-dependently decreased proliferative responsefrom 30 nM TBTO, whereas exposure of spleno-cytes resulted in a dose-dependently decreased
proliferative response from 300 nM TBTO (Fig.2B).
Fig. 2. Lymphoproliferative response of thymocytes and splenocytes after (A) CsA exposure, and (B) TBTO exposure. Thymocytes(") and splenocytes (�) were cultured for 24 h in the presence of CsA or TBTO. Cells were washed and cultured for 48 h in thepresence of Con A, and another 24 h after addition of [methyl-3H]thymidine. The cells were then harvested and counted. (A) n=11,except where indicated (thymocytes); n=7 (splenocytes); (B) n=5, except where indicated. Results are expressed as percentage ofcontrol9S.E.M. Significance levels are *PB0.05, **PB0.01 and ***PB0.001.

R.J. Vandebriel et al. / Toxicology 135 (1999) 49–6656
3.3. RNA isolationCsA exposure did not affect RNA yield (re-
sults not shown). Exposure for 24 h to 100 nMTBTO resulted in a decreased RNA yield. Thisdecrease was more pronounced in case of expo-sure to 300 nM TBTO. Exposure to 1000 nMTBTO resulted in an inability to isolate RNAfrom these cells (results not shown). Therefore,for TBTO exposure the maximum concentrationwas 300 nM in studies using RT-PCR, a tech-nique that requires small amounts of RNA, and100 nM in studies using dot blot hybridisation,a technique that requires larger amounts ofRNA.
3.4. Polymerase chain reaction
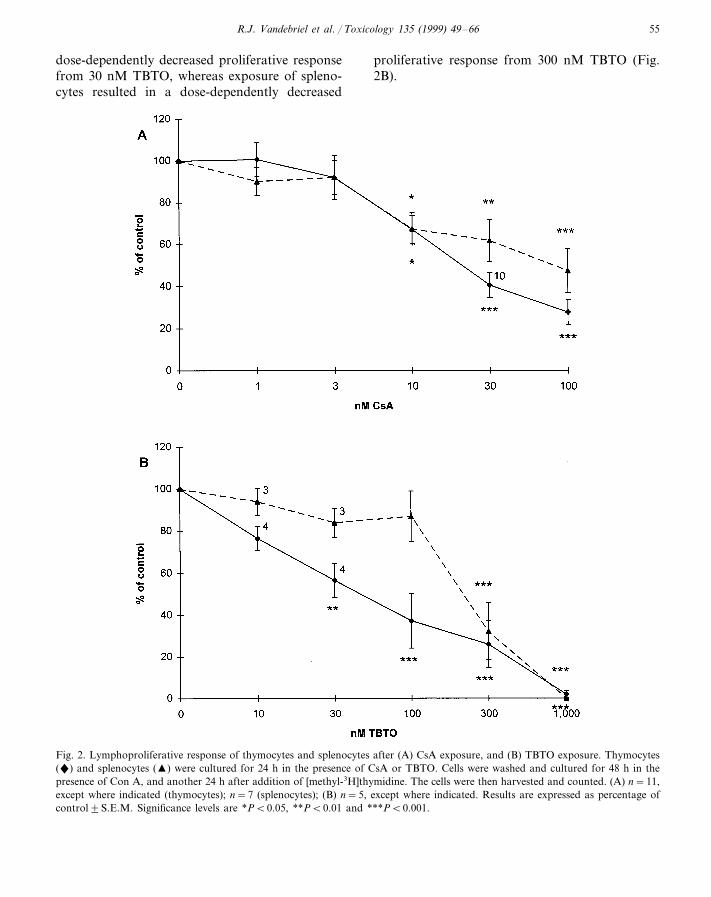
CsA exposure of thymocytes dose-dependentlydecreased IL-2 and IFN-g mRNA expression,whereas IL-2R and IL-10 mRNA expression wasunaffected (Fig. 3). Exposure of splenocytesdose-dependently decreased IL-2, IL-10, andIFN-g mRNA expression, although the exposureeffects on IL-10 and IFN-g were statistically notsignificant. IL-2R mRNA expression was in-creased at 3 nM and decreased at 100 nM (Fig.3).
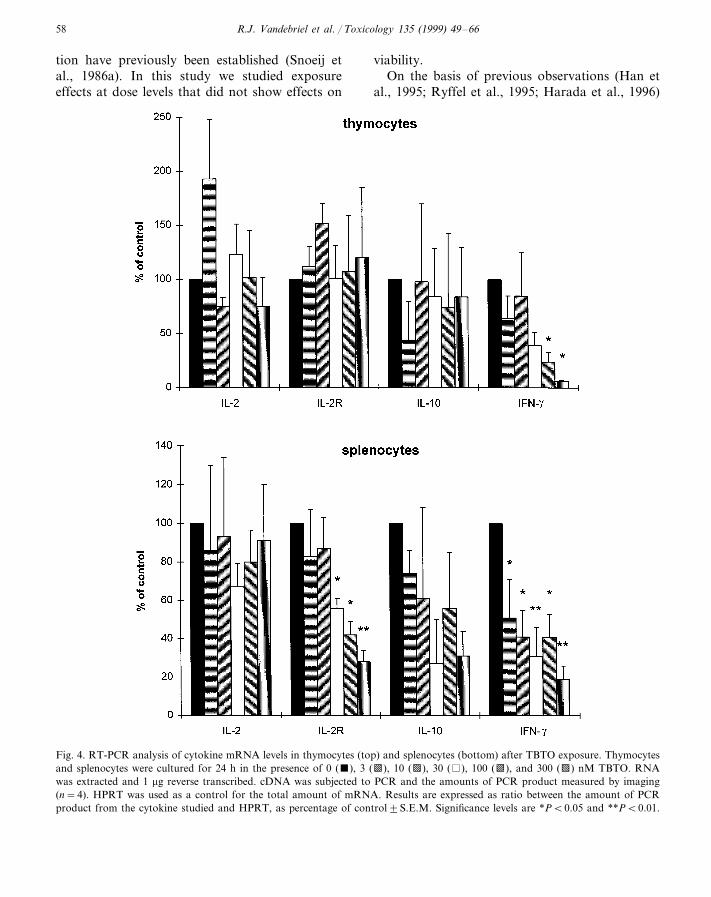
TBTO exposure of thymocytes dose-depen-dently decreased IFN-g mRNA expression from100 nM, whereas IL-2, IL-2R, and IL-10mRNA expression were unaffected (Fig. 4). Ex-posure of splenocytes dose-dependently de-creased IL-2R mRNA expression from 30 nMand IFN-g mRNA expression from 3 nM. IL-10mRNA expression was decreased, although notstatistically significant. IL-2 mRNA expressionwas unaffected (Fig. 4).
3.5. Dot blot hybridisation
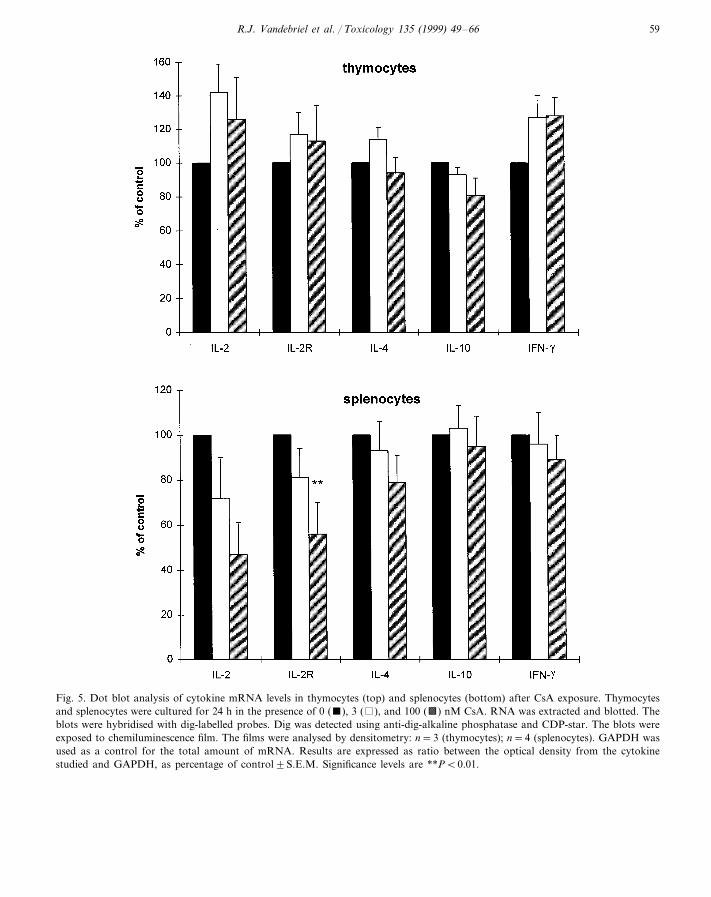
CsA exposure of thymocytes did not affectmRNA expression for any of the genes analysed(Fig. 5). Exposure of splenocytes decreased IL-2R mRNA expression at 100 nM (Fig. 5).TBTO exposure of thymocytes and splenocytesdid not affect mRNA levels for any of the genesanalysed (results not shown).
3.6. Expression of cell surface determinants
No CsA exposure effects on surface markerexpression were detected in the dose range stud-ied (results not shown). TBTO exposure for 24 hdid not affect the percentage of CD4+CD8+,CD4+CD8−, CD4−CD8+, and CD4−CD8−
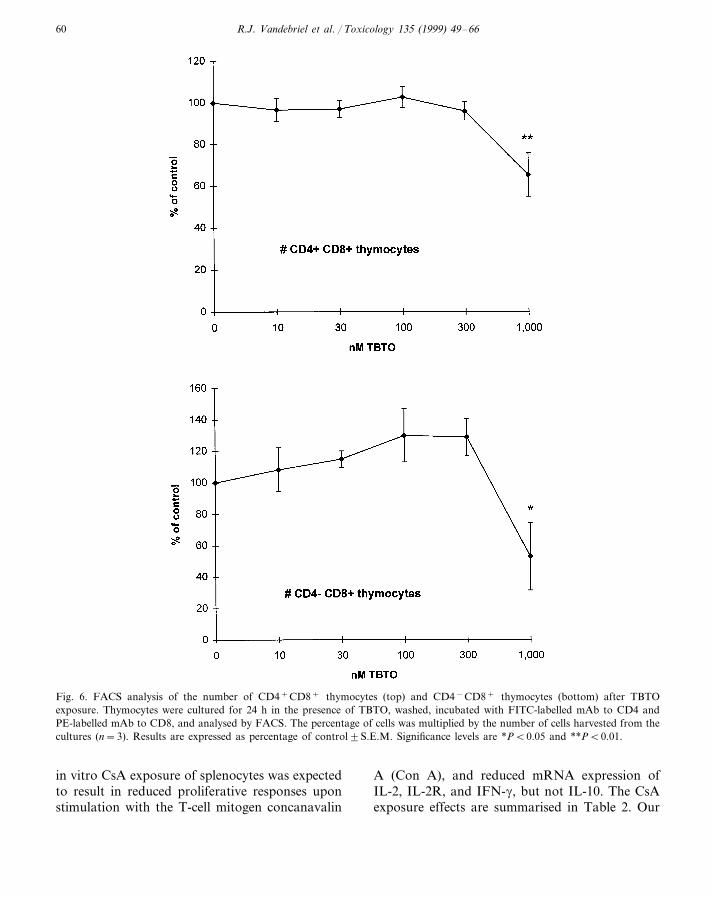
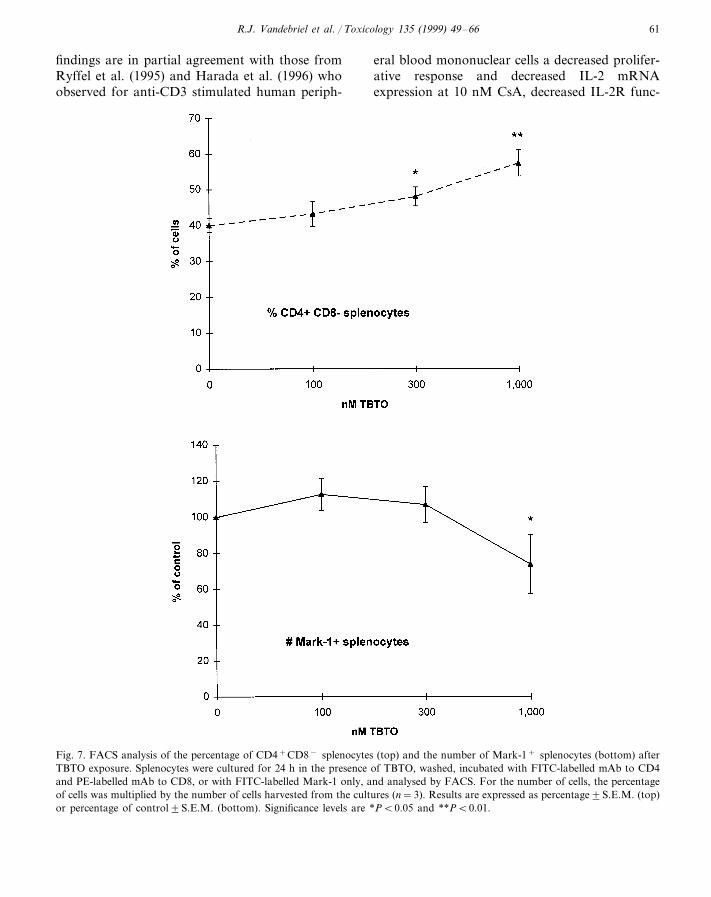
thymocytes in the dose range studied (results notshown). Exposure to this compound did not af-fect the number of CD4+CD8− andCD4−CD8− thymocytes in the dose rangetested (results not shown), whereas the numberof CD4+CD8+ and CD4−CD8+ thymocyteswas decreased at 1,000 nM (Fig. 6). TBTO ex-posure did not affect the percentage ofCD4−CD8+ and Mark-1+ splenocytes (resultsnot shown), whereas the percentage ofCD4+CD8− splenocytes was dose-dependentlyincreased from 300 nM (Fig. 7). Exposure tothis compound did not affect the number ofCD4+CD8− and CD4−CD8+ splenocytes (re-sults not shown), whereas the number of Mark-1+ splenocytes was decreased at 1000 nM (Fig.7).
4. Discussion
In vitro exposure was performed using thymo-cytes, as these cells are in general highly sensitiveto immunosuppressive compounds, and spleno-cytes, as these cells exemplify the functional im-mune system. The parameters evaluated were (1)lymphocyte transformation, as this endpoint isextremely robust, (2) cytokine (receptor) mRNAexpression, as this endpoint is relatively sensitiveand may be informative on mechanisms of im-munotoxicity, and (3) surface marker expression,as this endpoint, especially the CD4/CD8 ratio,has a high concordance for identifying im-munotoxic compounds in vivo (Luster et al.,1992). These parameters can be applied in both invivo and in vitro exposure experiments, enablingdirect comparison of in vivo and in vitro data.The model compounds used were (1) CsA, ofwhich the mechanisms of action and effects oncell proliferation and cytokine mRNA expression
R.J. Vandebriel et al. / Toxicology 135 (1999) 49–66 57
Fig. 3. RT-PCR analysis of cytokine mRNA levels in thymocytes (top) and splenocytes (bottom) after CsA exposure. Thymocytesand splenocytes were cultured for 24 h in the presence of 0 (), 3 ( ), and 100 (a) nM CsA. RNA was extracted and 1 mg reversetranscribed. cDNA was subjected to PCR and the amounts of PCR product measured by imaging (n=3). HPRT was used as acontrol for the total amount of mRNA. Results are expressed as ratio between the amount of PCR product from the cytokinestudied and HPRT, as percentage of control9S.E.M. Significance levels are *PB0.05, **PB0.01 and ***PB0.001.
have been well studied, enabling us to validatethese endpoints, and (2) TBTO, of which in vivoeffects on lymphocyte transformation, cytokine
mRNA expression, and cell surface marker ex-pression have been investigated. In addition, invitro effects of TBTO on lymphocyte transforma-
R.J. Vandebriel et al. / Toxicology 135 (1999) 49–6658
tion have previously been established (Snoeij etal., 1986a). In this study we studied exposureeffects at dose levels that did not show effects on
viability.On the basis of previous observations (Han et
al., 1995; Ryffel et al., 1995; Harada et al., 1996)
Fig. 4. RT-PCR analysis of cytokine mRNA levels in thymocytes (top) and splenocytes (bottom) after TBTO exposure. Thymocytesand splenocytes were cultured for 24 h in the presence of 0 (), 3 (b), 10 (d), 30 ( ), 100 (b), and 300 (d) nM TBTO. RNAwas extracted and 1 mg reverse transcribed. cDNA was subjected to PCR and the amounts of PCR product measured by imaging(n=4). HPRT was used as a control for the total amount of mRNA. Results are expressed as ratio between the amount of PCRproduct from the cytokine studied and HPRT, as percentage of control9S.E.M. Significance levels are *PB0.05 and **PB0.01.
R.J. Vandebriel et al. / Toxicology 135 (1999) 49–66 59
Fig. 5. Dot blot analysis of cytokine mRNA levels in thymocytes (top) and splenocytes (bottom) after CsA exposure. Thymocytesand splenocytes were cultured for 24 h in the presence of 0 (), 3 ( ), and 100 (a) nM CsA. RNA was extracted and blotted. Theblots were hybridised with dig-labelled probes. Dig was detected using anti-dig-alkaline phosphatase and CDP-star. The blots wereexposed to chemiluminescence film. The films were analysed by densitometry: n=3 (thymocytes); n=4 (splenocytes). GAPDH wasused as a control for the total amount of mRNA. Results are expressed as ratio between the optical density from the cytokinestudied and GAPDH, as percentage of control9S.E.M. Significance levels are **PB0.01.
R.J. Vandebriel et al. / Toxicology 135 (1999) 49–6660
Fig. 6. FACS analysis of the number of CD4+CD8+ thymocytes (top) and CD4−CD8+ thymocytes (bottom) after TBTOexposure. Thymocytes were cultured for 24 h in the presence of TBTO, washed, incubated with FITC-labelled mAb to CD4 andPE-labelled mAb to CD8, and analysed by FACS. The percentage of cells was multiplied by the number of cells harvested from thecultures (n=3). Results are expressed as percentage of control9S.E.M. Significance levels are *PB0.05 and **PB0.01.
in vitro CsA exposure of splenocytes was expectedto result in reduced proliferative responses uponstimulation with the T-cell mitogen concanavalin
A (Con A), and reduced mRNA expression ofIL-2, IL-2R, and IFN-g, but not IL-10. The CsAexposure effects are summarised in Table 2. Our
R.J. Vandebriel et al. / Toxicology 135 (1999) 49–66 61
findings are in partial agreement with those fromRyffel et al. (1995) and Harada et al. (1996) whoobserved for anti-CD3 stimulated human periph-
eral blood mononuclear cells a decreased prolifer-ative response and decreased IL-2 mRNAexpression at 10 nM CsA, decreased IL-2R func-
Fig. 7. FACS analysis of the percentage of CD4+CD8− splenocytes (top) and the number of Mark-1+ splenocytes (bottom) afterTBTO exposure. Splenocytes were cultured for 24 h in the presence of TBTO, washed, incubated with FITC-labelled mAb to CD4and PE-labelled mAb to CD8, or with FITC-labelled Mark-1 only, and analysed by FACS. For the number of cells, the percentageof cells was multiplied by the number of cells harvested from the cultures (n=3). Results are expressed as percentage9S.E.M. (top)or percentage of control9S.E.M. (bottom). Significance levels are *PB0.05 and **PB0.01.

R.J. Vandebriel et al. / Toxicology 135 (1999) 49–6662
Table 2CsA exposure effects (nM)
Thymocytes Splenocytes
10Lymphocyte transforma- 10tion test
RT-PCR:33IL-23IL-2R NEa
NENEIL-10IFN-g 3 NE
NESurface marker expression NE
a NE, no effect or no statistically significant effect observed.
not on the thymic epithelium (De Waal et al.,1993), supportive of the assumption that the invitro exposure effects parallel the effects observedin vivo. This suggests reduced proliferative re-sponses to Con A for both thymocytes andsplenocytes (Vos et al., 1984), and reduced IL-2Ra mRNA expression for splenocytes (Vande-briel et al., 1998a). In the latter study, IL-2expression was increased, but only at the highestdose. The TBTO exposure effects are summarisedin Table 3. For thymocytes and splenocytes areduced lymphocyte proliferation was found,while for splenocytes reduced IL-2Ra expressionand a lack of effect on IL-2 expression was found.This suggests that the results obtained in vivo andin vitro are comparable. Possibly, the reducedproliferative response of splenocytes may occurvia reduced IL-2Ra expression (and not via re-duced IL-2 production). The reduced proliferativeresponse of thymocytes is not accompanied byreduced expression of either IL-2 or IL-2Ra. Itshould be noted that thymocytes differ from pe-ripheral T-cells in signal transduction from theT-cell receptor, as evidenced, e.g. by studies usingmice that lack the nonreceptor protein tyrosinekinase p59fyn (Appleby et al., 1992; Stein et al.,1992). Still, the mechanism underlying the an-tiproliferative effect of TBTO remains unresolved.Taken together the results on CsA and TBTO,LTT and RT-PCR are in general of similar sensi-tivity. While LTT is a more robust and easiermethod, RT-PCR may, e.g. dissect effects on IL-2vs. IL-2R.
TBTO exposure decreased RNA yield from 100nM, in line with observations by Snoeij et al.(1986b,c) of decreased RNA synthesis in the sameconcentration range. It cannot be ruled out that,although effects on cytokine (receptor) mRNAexpression were normalised to total mRNApresent, effects on the yield may influence mRNAexpression. This holds for effects at 100 and 300nM, but possibly also for effects at lowerconcentration(s).
The reduced numbers of CD4+CD8+ andCD4−CD8+ thymocytes, and Mark-1+ spleno-cytes are found at the same concentration thatshows reduced viability, and are thus not very
tion at 30 nM CsA, and decreased IFN-g produc-tion at 5 nM CsA. Furthermore, CsA treatment(1 mM) of Con A-stimulated mouse splenocytesreduced IL-2 and IFN-g mRNA expression, butnot IL-10 mRNA expression (Han et al., 1995).Unlike Han et al. (1995) we found decreasedIL-10 mRNA expression, although this was statis-tically not significant. We did not find decreasedIL-2R a-chain (IL-2Ra) mRNA expression inthymocytes, whereas this was clearly seen at 100nM in splenocytes. This may possibly be ex-plained as follows. IL-2 knockout mice show thatIL-2 is essential for lymphoproliferative responsesto Con A (Schorle et al., 1991), while IL-2Raknockout mice have strongly reduced proliferativeresponses of T-cells (Willerford et al., 1995). Thissuggests a major role for IL-2 and/or IL-2Ra inlymphocyte proliferation. IL-2 is able to induceIL-2Ra expression in peripheral lymphoid cells,and IL-2Ra expression in these cells is absent inIL-2 knockout mice (Demaison et al., 1998).However, in thymocytes of these mice IL-2Raexpression is normal, suggesting a different mech-anism of regulating IL-2Ra expression in thymo-cytes compared to splenocytes. The highly specificactivity of CsA on transcription suggested a lackof exposure effects on viability or surface expres-sion of CD4, CD8, and surface Ig (sIg), in linewith our observations.
In vivo TBTO acts directly on thymocytes and
R.J. Vandebriel et al. / Toxicology 135 (1999) 49–66 63
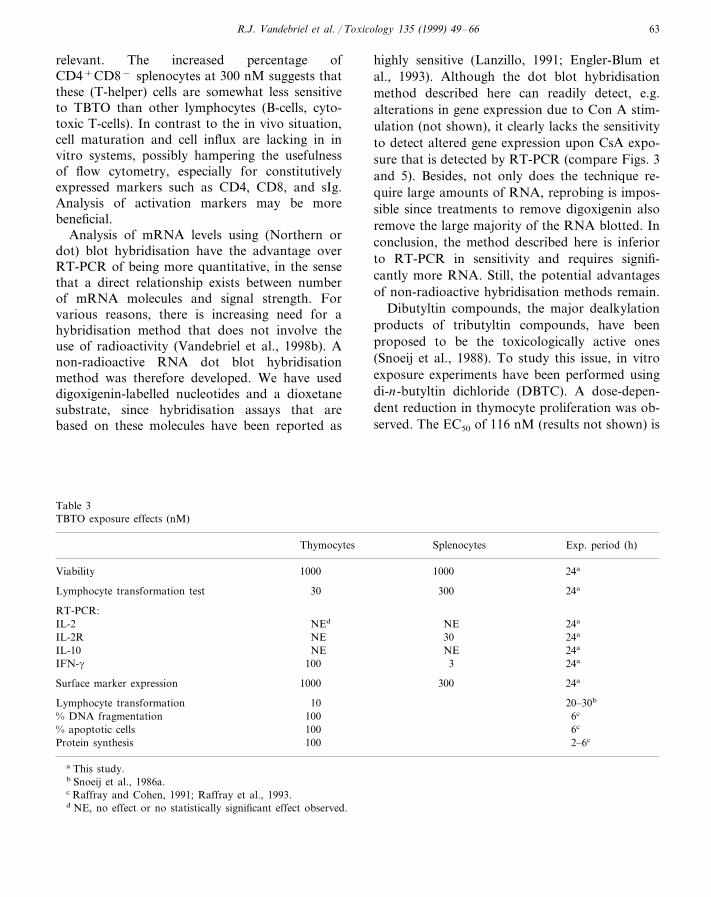
relevant. The increased percentage ofCD4+CD8− splenocytes at 300 nM suggests thatthese (T-helper) cells are somewhat less sensitiveto TBTO than other lymphocytes (B-cells, cyto-toxic T-cells). In contrast to the in vivo situation,cell maturation and cell influx are lacking in invitro systems, possibly hampering the usefulnessof flow cytometry, especially for constitutivelyexpressed markers such as CD4, CD8, and sIg.Analysis of activation markers may be morebeneficial.
Analysis of mRNA levels using (Northern ordot) blot hybridisation have the advantage overRT-PCR of being more quantitative, in the sensethat a direct relationship exists between numberof mRNA molecules and signal strength. Forvarious reasons, there is increasing need for ahybridisation method that does not involve theuse of radioactivity (Vandebriel et al., 1998b). Anon-radioactive RNA dot blot hybridisationmethod was therefore developed. We have useddigoxigenin-labelled nucleotides and a dioxetanesubstrate, since hybridisation assays that arebased on these molecules have been reported as
highly sensitive (Lanzillo, 1991; Engler-Blum etal., 1993). Although the dot blot hybridisationmethod described here can readily detect, e.g.alterations in gene expression due to Con A stim-ulation (not shown), it clearly lacks the sensitivityto detect altered gene expression upon CsA expo-sure that is detected by RT-PCR (compare Figs. 3and 5). Besides, not only does the technique re-quire large amounts of RNA, reprobing is impos-sible since treatments to remove digoxigenin alsoremove the large majority of the RNA blotted. Inconclusion, the method described here is inferiorto RT-PCR in sensitivity and requires signifi-cantly more RNA. Still, the potential advantagesof non-radioactive hybridisation methods remain.
Dibutyltin compounds, the major dealkylationproducts of tributyltin compounds, have beenproposed to be the toxicologically active ones(Snoeij et al., 1988). To study this issue, in vitroexposure experiments have been performed usingdi-n-butyltin dichloride (DBTC). A dose-depen-dent reduction in thymocyte proliferation was ob-served. The EC50 of 116 nM (results not shown) is
Table 3TBTO exposure effects (nM)
SplenocytesThymocytes Exp. period (h)
24a1000Viability 1000
30030Lymphocyte transformation test 24a
RT-PCR:NE 24aIL-2 NEd
NE 30IL-2R 24a
24aNEIL-10 NE100 3 24aIFN-g
1000 300Surface marker expression 24a
20–30bLymphocyte transformation 106c% DNA fragmentation 1006c% apoptotic cells 100
100 2–6cProtein synthesis
a This study.b Snoeij et al., 1986a.c Raffray and Cohen, 1991; Raffray et al., 1993.d NE, no effect or no statistically significant effect observed.
R.J. Vandebriel et al. / Toxicology 135 (1999) 49–6664
38% lower than the EC50 for TBTO (187 nM;above). This corresponds to observations bySnoeij et al. (1988) who found that (on a molarbasis) DBTC is 40% more effective in reducingrelative thymus weights than TBTC. Notably, theassumption is made that dealkylation does notoccur in these in vitro systems. This difference ineffectiveness illustrates that in vitro exposuremodels are often hampered by the lack ofmetabolising systems. In our view, the magnitudeof this difference is within the limits for this study,especially given the large database of endpointsfrom in vivo TBTO exposure studies.
Possibly, DBTC and TBTO remain attached tothe cell surface despite washing, and this mayoccur to a different degree for the two com-pounds. Furthermore, this implies that these com-pounds may exert their effects for a longer periodthan 24 h.
Tri-n-butyltin (TBT) exposure in vitro of thy-mocytes for 20–30 h results in decreased[3H]thymidine incorporation (Snoeij et al., 1986a).Furthermore, similar exposure results within 4 hin altered energy metabolism (increased glucoseconsumption and lactate production), within 1 hin decreased synthesis of DNA, RNA, andprotein, and within 10 min in reduced PGE1-in-duced cAMP production, and a correlation be-tween these effects was observed (Snoeij et al.,1986b,c). In addition, similar exposure resultswithin 15 min in an increased concentration offree intracellular Ca2+ [Ca2+
i ], an increased per-centage of DNA fragmentation, decreased intra-cellular ATP levels, and decreased F-actindepolymerisation. Within 6 h, similar exposureresults in decreased protein synthesis and an in-creased percentage of apoptotic cells. Effects on[Ca2+
i ] and the percentages DNA fragmentationand apoptotic cells were blocked by the Ca2+
chelator BAPTA-AM, in agreement with the piv-otal role of increased [Ca2+
i ] on apoptosis (Aw etal., 1990; Raffray and Cohen, 1991; Chow et al.,1992; Raffray et al., 1993; Chow and Orrenius,1994). Some of these data are summarised inTable 3. By comparing the concentrations neces-sary to induce reduced proliferative responses(10–30 nM) with those necessary to induce apop-tosis (100 nM), it becomes questionable whether
apoptosis is the most important mechanism forthymus atrophy due to TBT exposure, an issueaddressed recently by Gennari et al. (1997). Itmay be argued that the exposure periods used toinduce apoptosis are significantly shorter thanthose used to induce reduced proliferation. Gen-nari et al. (1997) showed, however, that while 10min of exposure required 3.0 mM TBTO for DNAfragmentation, exposure for 22 h still required 1.0mM TBTO. The notion that antiproliferative ef-fects rather than apoptosis underlie thymus atro-phy is supported by Vos et al. (1984) whoobserved exposure-induced antiproliferative ef-fects on thymocytes in vivo at dose levels that didnot affect viability of these cells. In sum, the roleof apoptosis in TBTO-induced thymus atrophy invivo is questionable.
In conclusion, LTT and RT-PCR are usefulparameters in in vitro immunotoxicity testing ofCsA and TBTO. Analysis of cell surface markerexpression should focus on activation markers. Inour hands, non-radioactive dot blot hybridisationwas of inferior sensitivity compared to RT-PCR.
Acknowledgements
Supported by the EU BIOTECH program,cCT92-0316. We thank Jacqueline Bergsma, Ed-wina Rave, Heidy van Spijker, and Helga Tim-merman for excellent technical assistance, Drs P.Herrling and T.J. Petcher for their kind gift ofCsA, Drs Johan Garssen and Henk-Jan Schuur-man for enthusiastic support, and Dr Joseph G.Vos for critical reading of the manuscript.
References
Amasaki, Y., Masuda, E.S., Imamura, R., Arai, K.-I, Arai,N., 1998. Distinct NFAT family proteins are involved inthe nuclear NFAT-DNA binding complexes from humanthymocyte subsets. J. Immunol. 160, 2324–2333.
Appleby, M.W., Gross, J.A., Cooke, M.P., Levin, S.D., Qian,X., Perlmutter, R.M., 1992. Defective T cell receptor sig-naling in mice lacking the thymic isoform of p59fyn. Cell70, 751–763.
Aw, T.Y., Nicotera, P., Manzo, L., Orrenius, S., 1990. Trib-utyltin stimulates apoptosis in rat thymocytes. Arch.Biochem. Biophys. 283, 46–50.
R.J. Vandebriel et al. / Toxicology 135 (1999) 49–66 65
Bressa, G., Hinton, R.H., Price, S.C., Isbir, M., Ahmed, R.S.,Grasso, P., 1991. Immunotoxicity of tri-n-butyltin oxide(TBTO) and tri-n-butyltin chloride (TBTC) in the rat. J.Appl. Toxicol. 11, 397–402.
Cai, W., Hu, L., Foulkes, J.G., 1996. Transcription-modulat-ing drugs: mechanism and selectivity. Curr. Opin. Biotech-nol. 7, 608–615.
Chow, S.C., Orrenius, S., 1994. Rapid cytoskeleton modifica-tion in thymocytes induced by the immunotoxicant trib-utyltin. Toxicol. Appl. Pharmacol. 127, 19–26.
Chow, S.C., Kass, G.E.N., McCabe, M.J. Jr., Orrenius, S.,1992. Tributyltin increases cytosolic free Ca2+concentra-tion in thymocytes by mobilizing intracellular Ca2+, acti-vating a Ca2+entry pathway, and inhibiting Ca2+efflux.Arch. Biochem. Biophys. 298, 143–149.
Demaison, C., Fiette, L., Blanchetiere, V., Schimpl, A., Theze,J., Froussard, P., 1998. IL-2 receptor a-chain expression isindependently regulated in primary and secondarylymphoid organs. J. Immunol. 161, 1977–1982.
De Waal, E.J., Schuurman, H.-J., Rademakers, L.H.P.M.,Van Loveren, H., Vos, J.G., 1993. The cortical epitheliumof the rat thymus after in vivo exposure to bis(tri-n-butyltin)oxide (TBTO). An (immuno)histochemical and ul-trastructural study. Arch. Toxicol. 67, 186–192.
De Waal, E.J., Schuurman, H.-J., Van Loveren, H., Vos, J.G.,1997. Differential effects of 2,3,7,8-tetrachlorodibenzo-p-dioxin, bis(tri-n-butyltin)oxide and cyclosporine on thymushistophysiology. Crit. Rev. Toxicol. 27, 381–430.
Dijkema, R., van der Meide, P.H., Pouwels, P.H., Caspers,M., Dubbeld, M., Schellekens, H., 1985. Cloning andexpression of the chromosomal immune interferon gene ofthe rat. EMBO J. 4, 761–767.
Dijkema, R., van der Meide, P.H., Dubbeld, M., Caspers, M.,Wubben, J., Schellekens, H., 1986. Cloning, expression,and purification of rat IFN-g. Methods Enzymol. 119,453–464.
Engler-Blum, G., Meier, M., Frank, J., Muller, G.A., 1993.Reduction of background problems in nonradioactiveNorthern and Southern blot analyses enables higher sensi-tivity than 32P-based hybridizations. Anal. Biochem. 210,235–244.
Fort, Ph., Piechaczyk, M., El Sabrouty, S., Dani, Ch., Jean-teur, Ph., Blanchard, J.M., 1985. Various rat adult tissuesexpress only one major mRNA species from the glyceralde-hyde-3-phosphate-dehydrogenase multigenic family. Nu-cleic Acids Res. 13, 1431–1442.
Gennari, A., Potters, M., Seinen, W., Pieters, R., 1997. Organ-otin-induced apoptosis as observed in vitro is not relevantfor induction of thymus atrophy at antiproliferative doses.Toxicol. Appl. Pharmacol. 147, 259–266.
Goodman, R.E., Oblak, J., Bell, R.G., 1992. Synthesis andcharacterization of rat interleukin-10 (IL-10) cDNA clonesfrom the RNA of cultured OX8−OX22− thoracic duct Tcells. Biochem. Biophys. Res. Commun. 189, 1–7.
Han, C.W., Imamura, M., Hashino, S., Zhu, X., Tanaka, J.,Imai, K., Matsudaira, T., Asano, S., 1995. Differentialeffects of the immunosuppressants cyclosporin A, FK506
and KM2210 on cytokine gene expression. Bone MarrowTransplant. 15, 733–739.
Harada, Y., Watanabe, S., Yssel, H., Arai, K.I., 1996. Factorsaffecting the cytokine production of human T cells stimu-lated by different modes of activation. J. Allergy Clin.Immunol. 98, S161–S173.
Ho, S., Clipstone, N., Timmermann, L., Northrop, J., Graef,I., Fiorentino, D., Nourse, J., Crabtree, G.R., 1996. Themechanism of action of cyclosporin A and FK506. Clin.Immunol. Immunopathol. 80, S40–S45.
Jansen, J.G., Vrieling, H., van Zeeland, A.A., Mohn, G.R.,1992. The gene encoding hypoxanthine-guanine phosphori-bosyltransferase as target for mutational analysis: PCRcloning and sequencing of the cDNA from the rat. Mut.Res. 266, 105–116.
Krajnc, E.I., Wester, P.W., Loeber, J.G., Van Leeuwen,F.X.R., Vos, J.G., Vaessen, H.A.M.G., Van Der Heijden,C.A., 1984. Toxicity of bis(tri-n-butyltin)oxide in the rat. I.Short-term effects on general parameters and on the en-docrine and lymphoid systems. Toxicol. Appl. Pharmacol.75, 363–386.
Lanzillo, J.J., 1991. Chemiluminescent nucleic acid detectionwith digoxigenin-labeled probes: a model system withprobes for angiotensin converting enzyme which detect lessthan one attomole of target DNA. Anal. Biochem. 194,45–53.
Lion, T., Haas, O.A., 1990. Nonradioactive labeling of probewith digoxigenin by polymerase chain reaction. Anal.Biochem. 188, 335–337.
Luster, M.I., Portier, C., Pait, D.G., White, K.L., Gennings,C., Munson, A.E., Rosenthal, G.J., 1992. Risk assessmentin immunotoxicology. I. Sensitivity and predictability ofimmune tests. Fundam. Appl. Toxicol. 18, 200–210.
McKnight, A.J., Mason, D.W., Barclay, A.N., 1989. Sequenceof rat interleukin 2 and anomalous binding of a mouseinterleukin 2 cDNA probe to rat MHC class II-associatedinvariant chain mRNA. Immunogenetics 30, 145–147.
McKnight, A.J., Barclay, A.N., Mason, D.W., 1991. Molecu-lar cloning of rat interleukin 4 cDNA and analysis of thecytokine repertoire of subsets of CD4+T cells. Eur. J.Immunol. 21, 1187–1194.
Page, T.H., Dallman, M.J., 1991. Molecular cloning of cD-NAs for the rat interleukin 2 receptor a and b chain genes:differentially regulated gene activity in response to mito-genic stimulation. Eur. J. Immunol. 21, 2133–2138.
Raffray, M., Cohen, G.M., 1991. Bis(tri-n-butyltin)oxide in-duces programmed cell death (apoptosis) in immature ratthymocytes. Arch. Toxicol. 65, 135–139.
Raffray, M., McCarthy, D., Snowden, R.T., Cohen, G.M.,1993. Apoptosis as a mechanism of tributyltin cytotoxicityto thymocytes: relationship of apoptotic markers to bio-chemical and cellular effects. Toxicol. Appl. Pharmacol.119, 122–130.
Richter, G., Blankenstein, T., Diamantstein, T., 1990. Evolu-tionary aspects, structure, and expression of the rat inter-leukin 4 gene. Cytokine 2, 221–228.

R.J. Vandebriel et al. / Toxicology 135 (1999) 49–6666
Ryffel, B., Willcocks, J.L., Brooks, N., Woerly, G., 1995.Interleukin-2 receptor (CD25) upregulation on human T-lymphocytes: sensitivity to immunosuppressants is definedby the mode of T-lymphocyte activation. Immunopharma-cology 30, 199–207.
Schorle, H., Holtschke, T., Hunig, T., Schimpl, A., Horak, I.,1991. Development and function of T cells in mice ren-dered interleukin-2 deficient by gene targeting. Nature 352,621–624.
Snoeij, N.J., Van Iersel, A.A.J., Penninks, A.H., Seinen, W.,1986a. Triorganotin-induced cytotoxicity to rat thymus,bone marrow and red blood cells as determined by severalin vitro assays. Toxicology 39, 71–83.
Snoeij, N.J., Punt, P.M., Penninks, A.H., Seinen, W., 1986b.Effects of tri-n-butyltin chloride on energy metabolism,macromolecular synthesis, precursor uptake, and cyclicAMP production in isolated rat thymocytes. Biochim. Bio-phys. Acta 852, 234–243.
Snoeij, N.J., Van Rooijen, H.J.M., Penninks, A.H., Seinen,W., 1986c. Effects of various inhibitors of oxidative phos-phorylation on energy metabolism, macromolecular syn-thesis and cyclic AMP production in isolated ratthymocytes. A regulating role for the cellular energy statein macromolecular synthesis and cyclic AMP production.Biochim. Biophys. Acta 852, 244–253.
Snoeij, N.J., Penninks, A.H., Seinen, W., 1988. Dibutyltin andtributyltin compounds induce thymus atrophy in rats dueto a selective action on thymic lymphoblasts. Int. J. Im-munopharmacol. 10, 891–899.
Stein, P.L., Lee, H.-M., Rich, S., Soriano, P., 1992. pp59fyn
mutant mice display differential signaling in thymocytes
and peripheral T cells. Cell 70, 741–750.Vandebriel, R.J., Meredith, C., Scott, M.P., Roholl, P.J.M.,
Van Loveren, H., 1998a. Effects of in vivo exposure tobis(tri-n-butyltin)oxide, hexachlorobenzene, and ben-zo(a)pyrene on cytokine (receptor) mRNA levels in cul-tured rat splenocytes and on IL-2 receptor protein levels.Toxicol. Appl. Pharmacol. 148, 126–136.
Vandebriel, R.J., Van Loveren, H., Meredith, C., 1998b. Al-tered cytokine (receptor) mRNA expression as a tool inimmunotoxicology. Toxicology 130, 43–67.
Vos, J.G., De Klerk, A., Krajnc, E.I., Kruizinga, W., VanOmmen, B, Rozing, J., 1984. Toxicity of bis(tri-n-butyltin)oxide in the rat. II. Suppression of thymus-depen-dent immune responses and of parameters of nonspecificresistance after short-term exposure. Toxicol. Appl. Phar-macol. 75, 387–408.
Vos, J.G., Krajnc, E.I., Wester, P.W., 1985. Immunotoxicityof bis(tri-n-butyltin)oxide. In: Dean, J., et al. (Eds.), Im-munotoxicology and immunopharmacology. Raven Press,New York, pp. 327–340.
Vos, J.G., De Klerk, A., Krajnc, E.I., Van Loveren, H.,Rozing, J., 1990. Immunotoxicity of bis(tri-n-butyltin)oxide in the rat: effects on thymus-dependent im-munity and on nonspecific resistance following long-termexposure in young versus aged rats. Toxicol. Appl. Phar-macol. 105, 144–155.
Willerford, D.M., Chen, J., Ferry, J.A., Davidson, L., Ma, A.,Alt, F.W., 1995. Interleukin-2 receptor a chain regulatesthe size and content of the peripheral lymphoid compart-ment. Immunity 3, 521–530.
.
.