In situ phase transformation and deformation of iron at high pressure and temperature
34
eScholarship provides open access, scholarly publishing services to the University of California and delivers a dynamic research platform to scholars worldwide. Lawrence Berkeley National Laboratory Title: In-situ Phase Transformation and Deformation of Iron at High Pressure and Temperature Author: Miyagi, Lowell Publication Date: 04-08-2009 Publication Info: Lawrence Berkeley National Laboratory Permalink: http://escholarship.org/uc/item/8wq4g79f Keywords: Iron, high-pressure, high-temperature, laser heating, radial diffraction, texture Abstract: With a membrane based mechanism to allow for pressure change of a sample in a radial diffraction diamond anvil cell (rDAC) and simultaneous infra-red laser heating, it is now possible to investigate texture changes during deformation and phase transformations over a wide range of temperature- pressure conditions. The device is used to study bcc (alpha), fcc (gamma) and hcp (epislon) iron. In bcc iron, room temperature compression generates a texture characterized by (100) and (111) poles parallel to the compression direction. During the deformation induced phase transformation to hcp iron, a subset of orientations are favored to transform to the hcp structure first and generate a texture of (01-10) at high angles to the compression direction. Upon further deformation, the remaining grains transform, resulting in a texture that obeys the Burgers relationship of (110)bcc // (0001)hcp. This is in contrast to high temperature results that indicate that texture is developed through dominant pyramidal {2-1-12} and basal (0001)-{2-1-10} slip based on polycrystal plasticity modeling. We also observe that the high temperature fcc phase develops a 110 texture typical for fcc metals deformed in compression.
-
Upload
independent -
Category
Documents
-
view
2 -
download
0
Transcript of In situ phase transformation and deformation of iron at high pressure and temperature
eScholarship provides open access, scholarly publishingservices to the University of California and delivers a dynamicresearch platform to scholars worldwide.
Lawrence Berkeley National Laboratory
Title:In-situ Phase Transformation and Deformation of Iron at High Pressure and Temperature
Author:Miyagi, Lowell
Publication Date:04-08-2009
Publication Info:Lawrence Berkeley National Laboratory
Permalink:http://escholarship.org/uc/item/8wq4g79f
Keywords:Iron, high-pressure, high-temperature, laser heating, radial diffraction, texture
Abstract:With a membrane based mechanism to allow for pressure change of a sample in a radial diffractiondiamond anvil cell (rDAC) and simultaneous infra-red laser heating, it is now possible to investigatetexture changes during deformation and phase transformations over a wide range of temperature-pressure conditions. The device is used to study bcc (alpha), fcc (gamma) and hcp (epislon) iron.In bcc iron, room temperature compression generates a texture characterized by (100) and (111)poles parallel to the compression direction. During the deformation induced phase transformationto hcp iron, a subset of orientations are favored to transform to the hcp structure first and generatea texture of (01-10) at high angles to the compression direction. Upon further deformation, theremaining grains transform, resulting in a texture that obeys the Burgers relationship of (110)bcc //(0001)hcp. This is in contrast to high temperature results that indicate that texture is developedthrough dominant pyramidal {2-1-12} and basal (0001)-{2-1-10} slip based on polycrystal plasticitymodeling. We also observe that the high temperature fcc phase develops a 110 texture typicalfor fcc metals deformed in compression.
1
In-situ Phase Transformation and Deformation of Iron at High Pressure and
Temperature Lowell Miyagi1, Martin Kunz2, Jason Knight2 , James Nasiatka2, Marco Voltolini1, and Hans-Rudolf
Wenk1 1 Department of Earth and Planetary Science, University of California, Berkeley, CA 94720
2 Advanced Light Source, Lawrence Berkeley Laboratory, Berkeley, CA 94720.
Abstract
With a membrane based mechanism to allow for pressure change of a sample in a
radial diffraction diamond anvil cell (rDAC) and simultaneous infra-red laser heating, it
is now possible to investigate texture changes during deformation and phase
transformations over a wide range of temperature-pressure conditions. The device is
used to study bcc (α), fcc (γ) and hcp (ε) iron. In bcc iron, room temperature
compression generates a texture characterized by (100) and (111) poles parallel to the
compression direction. During the deformation induced phase transformation to hcp iron,
a subset of orientations are favored to transform to the hcp structure first and generate a
texture of (01-10) at high angles to the compression direction. Upon further deformation,
the remaining grains transform, resulting in a texture that obeys the Burgers relationship
of (110)bcc // (0001)hcp. This is in contrast to high temperature results that indicate that
texture is developed through dominant pyramidal ⟨a+c⟩ {2-1-12}⟨2-1-13⟩ and basal
(0001)⟨2-1-10⟩ slip based on polycrystal plasticity modeling. We also observe that the
high temperature fcc phase develops a 110 texture typical for fcc metals deformed in
compression.
I. Introduction
A technique that has emerged in recent years to study the rheology and elasticity
of materials in-situ at ultra-high pressures is the use of the diamond anvil cell (DAC) in
radial x-ray diffraction geometry (rDAC).1-4 With this technique diamonds are used to
impose stress and pressure on a material to induce elastic and plastic deformation. An x-
ray beam is brought in orthogonal to the compression axis through x-ray transparent
gasketing materials and deformation effects are observed on diffraction images as
2
intensity changes along Debye rings (texture) and variations in d-spacings relative to the
compression direction (lattice strain).
While previous work using the rDAC has provided important information on in-
situ rheological behavior through interpretation of texture patterns, these studies were
limited to ambient temperature. As a result little is known about the behavior of
materials at high-temperature and ultra-high pressures. This is of particular importance
to the field of Earth and planetary sciences as it is questionable whether room
temperature studies are appropriate for extrapolation to behavior in planetary interiors
where materials are deforming both at high-pressure and temperature. In order to expand
rDAC experiments to the high-temperature regime, an in-situ laser-heating system for
radial diffraction geometry has been developed at the Advanced Light Source (ALS) of
the Lawrence Berkeley Laboratory (LBL).5 Previously, pressure/stress increase in
rDACs has been controlled through load screws pushing the piston of the rDAC into its
cylinder. This requires manual intervention and is incompatible with in-situ observations
of the effects of pressure and stress increase at high-temperature. Furthermore, manual
pressure change requires re-aligning the sample on the x-ray beam, which is time
intensive and thus limits the resolution in pressure steps for radial diffraction
experiments, even at ambient temperatures. A remote controlled pressure changing
mechanism is thus required. A membrane driven DAC for axial diffraction has been
developed, but the closed design in the radial direction does not allow its application to
radial diffraction.6 Alternately a motor driven mechanism can be used to remotely
change pressure on a screw-driven Mao-Bell DAC from outside a synchrotron
experimental hutch.7 While the solution of a remotely controlled mechanical cell is
advantageous in terms of long-term pressure stability, it bears some drawbacks in terms
of weight and flexibility, especially in view of the need to combine it with in-situ laser
heating. Here we present an approach based on gas-membrane technology. Instead of
designing a new rDAC, we aimed to construct a frame applicable to various designs of
rDACs. In our design, we paid special attention to flexibility (easy to accommodate
several types of rDAC designs), weight (it should not exceed the load limitations of the
high-precision stages on the end-station) and open access (for combination with in-situ
3
laser heating). This development enables the exploration of deformation mechanisms
simultaneously at high-temperature and ultra high-pressure.
Iron is a good candidate for pilot experiments with our new deformation system,
as it has been well studied due to its importance to engineering and deep Earth
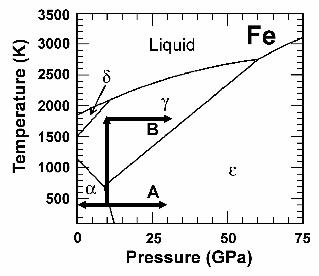
geophysics. The pressure temperature phase diagram of iron is shown in Figure 1.8 At
ambient conditions iron takes a bcc (α) structure, and upon heating transforms to the fcc
structured γ phase (Figure 1). This transformation in steel is of critical importance in
engineering because there is a significant reduction in material strength associated with
the transformation. The high pressure ε phase has an hcp structure, and at ambient
temperature this transformation occurs at pressures above 11 GPa.9,10 Under hydrostatic
conditions the phase boundary is sharp but under non-hydrostatic conditions becomes
spread over a larger pressure range.11 Heating the hcp phase induces a transformation to
the fcc phase12-14 (Figure 1).
It is likely that the bulk of the Earth’s solid inner core is composed of hcp iron
(ε).15,16 After the discovery of seismic anisotropy in the inner core,17,18 it was proposed
that origin of this anisotropy may be due to the development of preferred orientation of
crystals in the inner core.19-23 The texture evolution of hcp Fe was studied at pressures up
to 220 GPa at ambient temperature using the rDAC. Based on the texture pattern with a
maximum of 0001 poles near the compression axis, it was inferred, through the use of
polycrystal plasticity modeling, that slip on the basal (0001) plane was dominant under
these conditions.24-26 In contrast to these experiments, dislocations consistent with
pyramidal ⟨a+c⟩ slip on the {2-1-12}⟨2-1-13⟩ system were observed in an hcp Ni-Cr
stainless steel analog using transmission election microscopy (TEM).27 In rDAC
experiments it was observed that in compression the α-phase of Fe developed two fiber
components of (100) and (111),25 in agreement with textures observed by
metallurgists.28,29 During the phase transformation of the bcc to the hcp phase, hcp Fe
inherited a texture from the parent bcc phase consistent with the Burgers orientation
relationship.25,30
In order to follow up on these previous room temperature experiments we use our
new device to deform polycrystalline iron at high pressure and temperature and obtain in-
situ radial diffraction images. In a first run we deform Fe to high-pressure at ambient
4
temperature in order to convert bcc Fe to hcp Fe and then decompress back to the bcc
phase (Figure 1 path A). This allows us to evaluate the capabilities of our membrane
loading system on a material that has been well documented with radial diffraction. In a
second run we combine laser heating with our membrane loading system to first deform
the bcc phase then convert it by heating into the fcc phase. Finally the fcc phase is
converted to hcp by increasing pressure followed by deformation of the hcp phase at
simultaneous high pressure and temperature (Figure 1 path B). Emphasis of this study is
on texture changes, revealed by diffraction images and interpretation of those changes in
terms of orientation variant selection during phase transformations and active
deformation mechanisms.
II. Experimental Technique
X-ray diffraction experiments were performed on the dedicated high-pressure
beamline 12.2.2 at ALS.31,32 A setup for single-sided in-situ laser heating of a DAC in
radial diffraction geometry was recently implemented on this beamline.5 In order to
remotely change pressure, we constructed an rDAC holding frame which is compatible
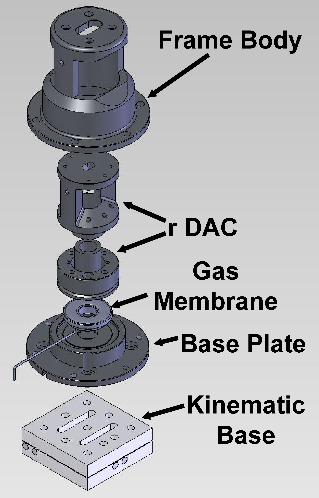
with various radial diffraction cells. The device consists of a frame-body, housing the
rDAC in use, a membrane, and a base plate to constrain the piston against the cylinder
(Figure 2). Spacer blocks allow the holding frame to accommodate various rDAC
designs within the same holding frame such as the Mao style panoramic rDAC and the
smaller Merkel style rDAC (Figure 3). The whole assembly is constructed of Prodec
stainless steel. To minimize restrictions in x-ray access to the sample, the holding frame
has two large windows along the x-ray axis (Fig. 2, 3). The side-posts of the frame
provide sufficient mechanical stability for an expected tensile force of 40 kN as
established by finite element analysis. This should be sufficient to withhold a membrane
pressure in excess of 200 bars. The cap of the holding frame has a smaller access
window to allow for imaging the sample and focusing an infra-red laser onto it (Figure 2,
3). The device was built by Phillips Machining in Martinez, CA.
The loaded rDAC is placed in an upright position (i.e. load axis vertical) into the
holding frame with its load-screws removed. This geometry not only allows easy laser
access but additionally allows the user to rotate the cell about the compression axis
5
during x-ray exposure in order to improve grain statistics while the laser is in operation.
The gas-driven membrane is sandwiched between the base plate and the piston of the
rDAC with the base plate mechanically coupled to the holding frame. The membrane is
connected to a pressure reducer with a 1/16 inch pressure tube through the base-plate.
Pressure change is achieved by applying Helium gas pressure (0 - ~ 150 bars) onto the
membrane which in turn pushes the piston into the cylinder of the rDAC. Custom
designed membranes were produced by a local company (DVM, Livermore, CA). In
order for the membrane to fit into the base of the holding-frame, the pressure tube had to
be welded on to it such that it exits the membrane parallel to its plane with a minimal
vertical displacement. Furthermore, a more solid welding rim was developed in order to
improve the reliability of the gas-membranes. Maximal stroke of the membrane is ~ 0.5
mm.
For the room temperature deformation run the sample of Alfa Aesar Fe powder of
99.9+% purity and spherical grains of <10 µm was loaded into a 2-stage kapton/boron-
epoxy gasket33 with an 80 µm sample chamber. No pressure medium was added to
maximize the macroscopic deviatoric stress. For the second run at high-temperature a
sandwich type sample assembly was used. In order to reduce temperature gradients in
the sample, the polycrystalline Fe sample was loaded into a 50 µm sample chamber. A
small Pt flake, Alfa Aesar foil, 0.004 mm thickness and 99.95% purity was imbedded in
the Fe as an internal pressure standard, and each side of the sample was capped with
platelets of polycrystalline MgO, Alfa Aesar 99.9+% purity to serve as insulating
material between the diamonds and the sample.
The cell within the holding frame is placed onto the goniometer and aligned on its
rotation axis, which serves as a reference point for the detector to sample distance.31
Sample to detector distance and detector non-orthognality were calibrated using a LaB6
standard. For run 1 at ambient temperature no pressure calibrant was used and pressure
was calibrated with a 3rd order Birch-Murnaghan equation of state for bcc Fe and hcp
Fe.34,35 For the high temperature run, pressures were calibrated with the equation of state
for Pt.36 Laser heating was performed applying a fiber IR laser and optical set-up for
radial diffraction.5 Temperature was measured by fitting its spectral glow to a Planck
function.32
6
In the first run (A) pressure was increased at ambient temperature in ~ 0.25 GPa
increments taking in-situ diffraction images at each step up to a pressure of ~22 GPa at
which point the sample was fully converted to the hcp phase. Once full conversion was
achieved the sample was incrementally decompressed back to the bcc phase to ~4 GPa.
For the high-temperature deformation cycle (B) the sample was first compressed to ~ 10
GPa at ambient temperature at which point the laser was turned on and power was
incrementally increased up to 15 W (1900 ±150 K), taking in-situ diffraction images at
each power increase. Once a power of 15 W was reached, pressure was increased
incrementally at high-temperature in 1-2 GPa steps up to ~30 GPa, recording in-situ
diffraction patterns during pressure increase (Figure 1). During data collection the
sample was oscillated ± 5° about the loading axis to increase grain statistics. Once a
pressure of ~30 GPa was attained, the laser was turned of and the sample was
decompressed at room temperature. No data was collected during room temperature
decompression.
Radial diffraction images were quantitatively analyzed for texture using the
Rietveld method as implemented in the software package MAUD.37 Rietveld refinement
with MAUD accounts for instrumental parameters such as beam center, detector tilt, peak
shape, backgrounds, and azimuthal absorption differences. Once instrument parameters
have been fit, structural and microstructural parameters including phase proportions,
differential stresses and texture were refined. For refinements an angular 2θ range of
12°-25.5° at 25 KeV was used for the room temperature run, and a range of 10°-22° at 30
KeV was used for the high temperature run. Textures were calculated using the
tomographic E-WIMV algorithm, which is similar to the WIMV model38 but allows for
arbitrary orientations. For texture calculation cylindrical symmetry was imposed around
the compression axis. The resolution of orientation space was 15° and the refined
orientation distribution was exported to BEARTEX39 and further smoothed with a 10°
Gauss filter. In the case of axial compression, textures can be compactly represented
with an inverse pole figure (IPF). An IPF shows the orientation of the compression axis
relative to the crystallographic directions. The asymmetric sector of the IPF conforms
with the crystal symmetry. Pole densities are expressed in multiples of random
7
distribution (m.r.d.), where 1 m.r.d. corresponds to a random distribution and in the case
of a single crystal the m.r.d. value would be equal to infinity.
III. Results and Discussion
III-I. Room Temperature Deformation
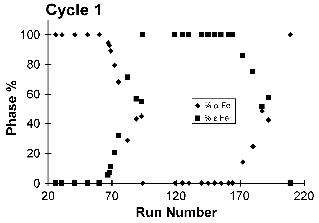
Results for the room temperature compression cycle of Fe are shown in Figures 4,
5, and Table SM-I. Figure 4 shows pressure versus run number, and texture results are
shown with selected inverse pole figures. Of the 209 diffraction patterns collected
during room temperature compression and decompression, full analysis was performed
on 29 patterns and selected IPFs are shown in Figure 4. Details about pressure, lattice
parameters, phase proportions and texture strength for all analyzed patterns are
summarized in Table SM-I.
During the room temperature run we are able to generate a homogeneous pressure
increase yielding a smooth compression-decompression curve (Figure 4). This indicates
that our membrane loading frame has the capability for finely tuned pressure/stress
increase and decrease and will allow us to move closer to the goal of controlled strain
rates in the rDAC. Additionally, the design of an external loading frame with various
spacers is very convenient as it allows the use of several different rDAC designs to
perform in-situ experiments. The compact design of the device makes it possible to move
it to different synchrotron facilities.
During compression, we observe the appearance of the high pressure hcp phase at
10 GPa (Figure 4). Continued compression results in an increase in the proportion of the
hcp phase at the cost of the bcc phase (Figure 5). During the phase transformation we
noticed some discrepancies in the pressures obtained from bcc and hcp phases,
respectively. At ~22 GPa the sample is fully converted (Table SM-I, Figure 4, 5). The
large pressure range over which the transformation occurs is consistent with previous
experimental work 11,25 and can be attributed to stored energy due to lattice strains that do
not contribute to overall deformation but rather accommodate grain-grain compatibility.40
During decompression we do not observe the formation of the bcc phase until
about 8 GPa (Table SM-I, Figure 4, 5 # A 172). With continued pressure decrease, we
observe an increase in the proportion of the bcc phase coupled with a decrease in the
8
proportion of the hcp phase (Figure 5). The hcp phase persists well into the stability field
of the bcc phase (Table SM-I, Fig. 4).
The pressure discrepancies observed during the phase transformation may be
partly due to the different equations of state used; however this difference is likely to be
small. It is known that the coexistence of multiple phases during a phase transformation
can cause volume anomalies between the phases due to differences in compressibility and
thermal expansion.41 Additionally anomalous unit cell parameters have been observed
during the bcc-hcp transformation in iron.42 It is likely that the pressure differences
observed are due to these effects. It is also possible that there are pressure gradients
within the cell. It is interesting to note that during decompression, measured pressures
for the two phases agree much better than during compression (Figure 4). This may
indicate that differential stresses are lower during the phase transformation in
decompression and as a result volume anomalies are smaller. Additionally, pressure
gradients may be lower during decompression.
III-II. Room Temperature Texture
At the start of the experiment the IPF shows that the sample (bcc phase) has no
significant preferred orientation (Figure 4, # A 26(α)). Upon commencement of
compression, the bcc phase develops a texture characterized by maxima in the 100 and
111 directions and a minimum at 110 (Figure 4, # A 69(α)). This agrees with
compression textures reported for bcc metals 28,29 and is attributed to dominant slip on
{110}⟨111⟩. This texture is also consistent with previous texture measurements on bcc
Fe in the rDAC.25
During the initial stages of the phase transformation (Figure 4, # A 67(ε)), the hcp
phase develops a maximum in the 01-10 direction. As the phase transformation
progresses, this texture becomes broader (Figure 4, # A 72(ε)), and shifts to form a
maximum at 11-20 as the phase transformation is completed (Figure 4, # A 125(ε)).
Previous rDAC measurements on hcp Fe reported that after the phase transformation, hcp
Fe developed a maximum at 11-20. This was interpreted as a transformation texture that
was inherited from the parent bcc phase 25 based on Burgers’ orientation relationship30
(110)bcc // (0001)hcp and [-11-1]bcc // [11-20]hcp (Figure 4 inset). An alternate and nearly
9
equivalent description is the martensitic mechanism where {1-100}⟨11-20⟩hcp becomes
{1-12}⟨-111⟩bcc.43 Indeed we do observe in our IPFs that these corresponding orientations
have qualitatively similar texture strengths. 100 and 111 have maxima in the bcc phase
as does the corresponding hcp orientation of 11-20. Additionally 110 is depleted in the
bcc phase and likewise the 0001 hcp orientation is also depleted (Figure 4, # A 69(α), # A
125(ε)). The maximum that is initially observed at 01-10 was not observed in previous
measurements.
The bcc-hcp transformation has been extensively modeled 40,44 and it is generally
accepted that the presence of defects can enhance the phase transformation.45 In
particular the bcc-hcp transition in Zr was modeled in the presence of edge dislocations
and it was found that dislocations enhanced the rate of transformation.46,47 For
{110}⟨001⟩ dislocations in the bcc phase, transformation to the hcp phase first occurs in a
region close to 45° from the dislocation as this is the region with maximum shear strain.46
According to the orientation relationship for bcc-hcp phase transformations the
⟨01-10⟩hcp direction would correspond to ⟨112⟩bcc (Figure 4, inset, # A 69(α), # A 67(ε)).
Those grains with {112} perpendicular to the compression direction will have maximum
compressive stress along ⟨112⟩bcc. The ⟨112⟩bcc direction is near 45° to the {110}⟨001⟩
dislocation and thus grains with this orientation would be most favorably oriented to
develop this dislocation and to transform to the hcp phase. As a result grains with {112}
perpendicular to compression will transform to the hcp phase first, yielding a maximum
at 01-10hcp for the hcp phase (Figure 4, # A 67(ε), # A 72(ε)). With increased pressure
the hcp phase becomes more energetically favored and other orientations will transform
eventually producing a texture in the hcp phase that corresponds to the texture of the
parent bcc phase (Figure 4, # A 69(α) and # A 125(ε)).
An alternate explanation for this behavior is analogous to recrystallization in
NaCl.48 In this model recrystallization favors plastically “soft” grains over plastically
“hard” grains. During recrystallization the “hard” grains have higher strain energy and
are less stable. The result is that “hard” grains are annihilated while “soft” orientations
nucleate and grow.48 If plastically “soft” grains are more stable due to lower strain
energy then they will be less likely to transform. This means that orientations at 100 and
111 in the bcc IPF will be the last grains to transform as they are the most stable (Figure
10
4, # A 69(α)). This will generate a minimum at the corresponding 11-20 orientation in
the hcp phase (Figure 4 inset, # A 67(ε)), as these orientations have yet to transform.
Additionally 110 bcc orientations are depleted in the IPF (Figure 4 inset, # A 69(α)), so
there are very few orientations to transform to the hcp phase. This will generate a
minimum at 0001 in the hcp phase (Figure 4, # A 67(ε)). Since the majority of the
orientations that are favored to transform to the hcp phase are near 112bcc a maximum
will form at the corresponding 01-10hcp orientation (Figure 4, # A 67(ε)). As the hcp
phase becomes more favored, eventually the remaining orientations near 100bcc and
111bcc will also transform to the hcp phase and generate the maximum that is observed at
11-20hcp upon completion of the phase transformation (Figure 4, # A 125(ε)).
As the bcc-hcp transformation occurs there are many symmetrically equivalent
orientation variants that exist between the phases. The number of variants depends on the
exact mechanism of the transformation. For the Burgers mechanism the bcc-hcp
transformation has 12 equivalent variants.30 If all variants are equally favored, texture
will become weaker through the phase transformation. However with variant selection
the texture will remain strong after the phase transformation.49 We observe that the latter
is the case, indicating that variant selection plays an important role during the bcc to hcp
transformation. This is consistent with previous observations.25
Upon decompression, the hcp phase develops a 0001 maximum and the 11-20
maximum becomes depleted (Figure 4 # A 145(ε) and # A 187(ε)). This texture
evolution was observed during compression in previous experiments.24-26 Although
pressure is decreasing in our sample due to decompression, the deviatoric stress
component will still be in a compressive stress state, and thus these results are not
inconsistent with previous measurements. A texture with a 0001 maximum has been
attributed to dominant basal (0001)⟨2-1-10⟩ and prismatic {10-10}⟨-12-10⟩ slip.24,25
During the phase transformation back to the bcc phase, the hcp phase becomes depleted
in 01-10 (Figure 4, # A 187(ε), # A 192(ε)). Correspondingly the bcc phase develops a
maximum at 112 (Figure 4, # A 172(α)). This is consistent with the dislocation
propagated phase transformation suggested for the compression phase of the experiment.
Interestingly, as the transformation progresses to completion, the bcc phase becomes
nearly random again. This indicates that for the reverse transformation (hcp to bcc Fe)
11
variant selection is not as pronounced. It does however appear that those orientations
with {112} at high angle to the compression direction maintain texture during the back
transformation and this subset of grains may exhibit variant selection.
III-III. High Temperature Deformation
The high-temperature cycle was very successful since it allows us for the first
time to combine in-situ radial x-ray diffraction of a sample compressed to high pressure
and heated with an infrared laser to high-temperatures. The described set-up allows
change in both pressure and temperature while diffraction patterns are recorded. This
enabled us to finely step the iron sample through its phase transitions in P-T space, by
varying both pressure and temperature.
For the high temperature deformation cycle, deformation was performed more
quickly to minimize the heating time necessary and only 35 diffraction images were
collected. Of these, 15 images were selected for detailed analysis and results are shown
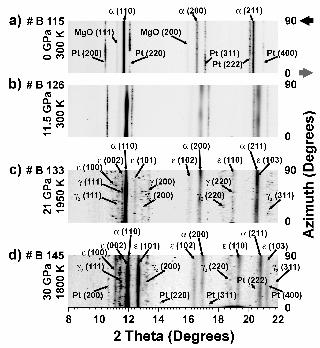
in Table SM-II. In-situ radial diffraction images are shown in Figure 6 and relative phase
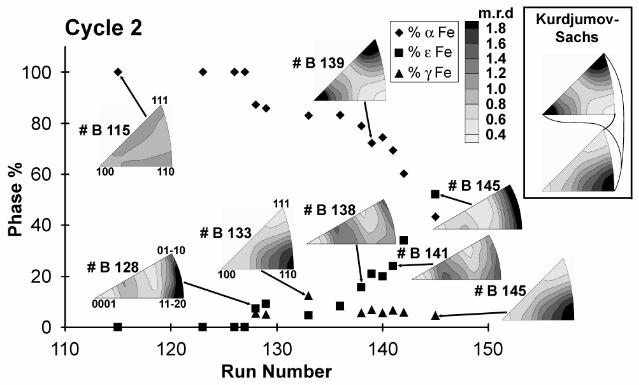
proportions of the three Fe phases versus run number are shown in Figure 7. In Figure 6
images have been “unrolled” using the cake routine in FIT2D.50 Only one quadrant of
each image is shown and compression and extension directions are indicated by arrows.
At the start of the experiment, diffraction images show three phases, the platinum
pressure marker, the MgO insulation, and the bcc Fe sample (Figure 6a). All lines are
straight, exhibiting no significant lattice strain, as is expected. While bcc Fe and MgO
exhibit no significant texturing, the Pt shows texture. The Pt used in this experiment is a
foil and texturing is a result of processing. After compression to 10 GPa, unit cell
parameters have decreased and we observe an azimuthal variation in peak position due to
lattice strains. Diffraction lines have also developed systematic intensity variations that
are indicative of texture (Figure 6b).
After the initial compression, temperature was incrementally increased to 1900
(±150) K (Table SM-II). During the first heating period, we observe the formation of
both the hcp and the fcc phases with slightly more of the hcp phase than the fcc phase
(Table SM-II, Figure 6c, 7). Upon reaching the maximum temperature of 1900 (±150) K
the hcp and fcc phases increase in proportion and we observe a coupled decrease in the
12
phase fraction of the bcc phase (Figure 7) as well as relaxation of lattice strains (Figure
6c). At these conditions there is more of the fcc phase than the hcp phase (Table SM-II,
Figure 7). We also observe grain growth and the development of a spotty pattern
containing the Pt, MgO and a second higher temperature fcc phase (γ2) (Figure 6c). The
diffraction rings in these regions were too spotty for an accurate interpretation and were
not analyzed except to extract unit cell parameters from the Pt for pressure calibration.
We observe significant temperature gradients due to the smaller size of the laser
hotspot compared to the sample. Temperature measurements made during laser heating
only correspond to temperatures at the center of the hotspot. Presumably the edges of the
sample are considerably colder. This, in addition to probable pressure gradients, means
that the x-ray beam passes through the whole sample and thus records a considerable
region of the Fe phase diagram (Figure 1). Temperature gradients can complicate
pressure calibration as it is difficult to tell what part of the sample is at the measured
temperature. However in this experiment the Pt flake was well centered and was visually
confirmed to be in the laser hotspot. In addition, the Pt heavily recrystallized upon
heating, indicating that it is in the very high temperature (1900 K) region of the sample.
As a result we assume the Pt is at the measured hotspot temperature and use this
temperature to calibrate pressure at the center of the sample.
At a temperature of 1900 K, pressure was increased again and we observe an
increase of the hcp phase at the expense of both the bcc and fcc phases (Table SM-I,
Figure 7). With further deformation and pressure increase at high temperature we see the
development of lattice strains and an increase in texture strength in all phases (Figure 6d).
The fcc phase has disappeared except for the most recrystallized region, and at the same
time, the hcp phase has become stronger. Diffraction lines have become smoother due to
grain size reduction associated with deformation (Figure 6d).
III-IV High Temperature Texture
For the high temperature cycle, the bcc phase initially has a random texture
(Figure 7, # B 115(α)). During this initial compression at ambient temperature the bcc
phase develops the typical bcc compression texture of 100 and 111 maxima with a
minimum at 110. This texture is similar to that obtained in the room temperature cycle.
13
This texture does not change much with increased temperature or continued deformation
(Figure 7, # B 139(α)).
After transformation the fcc phase develops a maximum at 110 and minima at 100
and 111. Transformation textures for the bcc to fcc transformation in steel has been
extensively studied.51 The textures observed here are consistent with a phase
transformation following the Kurdjumov and Sachs orientation relationship52 in which
{111}fcc // {1-10}bcc and ⟨1-10⟩fcc // ⟨111⟩bcc (Figure 7, inset). In this case the 100 and 111
maxima in the bcc phase correspond to the 110 maximum for the fcc phase (Figure 7, # B
139(α) and # 133(γ)). The presence of strong texture through the phase transformation
indicates that variant selection is active for the bcc Fe to fcc Fe phase transformation, as
has been previously observed in ultra-low carbon steel.53 The 110 maximum in the fcc
phase remains the same with continued heating and deformation. This texture can also be
generated by slip on {111}⟨110⟩ and is the typical compression texture in fcc metals.29 It
has also been observed in rDAC deformation experiments on fcc Cu.54
During temperature increase the hcp phase appears and has a texture with a 11-20
maximum (Figure 7, # B 128(ε)). These textures indicate that variant selection is also
important in the bcc Fe to hcp Fe transformation at high temperature. We do not observe
the initial development of the 01-10 maximum that was observed in the room temperature
run. This may be due to the different transformation path. In the room temperature run
the transformation was stress induced where as in the high temperature run the hcp phase
appears during heating and presumably the phase transformation is thermally induced.
Additionally transformation kinetics are likely to be very different at room temperature
and high temperature. With continued deformation and heating the maximum at 11-20
disappears and the texture becomes weaker. We also see the formation of a weak
maximum at 01-10 and a girdle 30° offset from 0001 (Figure 7, # B 138(ε)).
Recrystallization experiments on hcp Ti alloys showed that during
recrystallization the 11-20 orientation switches to 01-10.55 This would explain the
depletion of the 11-20 maximum and the formation of a 01-10 maximum. However, the
girdle 30° offset from 0001 cannot be explained by this and is likely due to slip. As
compression continues we observe that the girdle 30° from 0001 remains but the 11-20
maximum appears again (Figure 7, # B 141(ε)), becoming stronger and eventually
14
spreading to form a girdle around the periphery of the IPF (Figure 7, # B 145(ε)). These
textures are in contrast to those obtained in the room temperature run as well as previous
room temperature measurements.24-26
In order to interpret these textures generated at high temperature in hcp iron we
turn to polycrystal plasticity modeling. Texture development depends on the deformation
geometry as well as the relative activities of the different deformation modes such as slip
or deformation twinning. A comparison of textures generated by polycrystal plasticity
modeling to experimental textures can provide insight into which slip systems or twin
modes are active under a given set of conditions. For these simulations we used the Los
Alamos viscoplastic self-consistent code (VPSC).56,57 The VPSC model treats each grain
as an inclusion in a homogeneous but anisotropic medium that has the average properties
of the polycrystal. As deformation proceeds, crystals deform and rotate to generate
preferred orientation. By applying different critical resolved shear stresses (CRSS) to
slip systems and twin modes, the model will favor one deformation mode over another.
This will result in different textures for different combinations of deformation modes. By
determining which simulated texture most closely resembles the experimental texture, we
can infer which slip systems and twining modes are active under the experimental
conditions. Since the experimental ε phase inherits a transformation texture prior to
deformation, we used 2000 grains weighted to have a starting texture as obtained after
recrystallization (Figure 7, # B 138(ε)). This was done in order to account for sample
history, i.e. the initial development of a transformation texture followed by subsequent
recrystallization. We apply an incremental deformation path of 20% compressive strain.
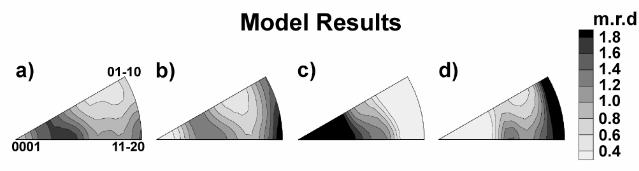
Results are show in Figure 8 and values for critical resolved shear stresses activities of
deformation modes are given in Table I.
Dominant basal slip produces a texture similar to that observed experimentally
(Figure 8a and Figure 7, # B 141(ε)). In this model basal (0001)⟨2-1-10⟩ slip
accommodates most of the deformation with moderate activity of prismatic {10-10}⟨-12-
10⟩ slip (Table I). Twinning modes are inactive in this model. This model accurately
reproduces the girdle offset 30° from 0001 and the maximum at 11-20. However,
dominant basal slip generates a minimum at 01-10 that is not observed experimentally
(Figure 8a and Figure 7, # B 141(ε)). It is noted that for dominant basal slip, higher
15
strains will cause the girdle 30° offset from 0001 to converge at 0001, as has been
observed in room temperature compression of hcp Fe.24-26 Dominant pyramidal ⟨a+c⟩ {2-
1-12}⟨2-1-13⟩ slip and basal (0001) ⟨2-1-10⟩ slip produces a texture that is most similar
to the experimental textures (Figure 8b and Figure 7, # B 141(ε)). This model reproduces
the girdle offset 30° from 0001 as well as a broad maximum at 11-20 that extends about
the periphery. Dislocations consistent with pyramidal ⟨a+c⟩ slip on {2-1-12}⟨2-1-13⟩
were observed with TEM in Ni-Cr stainless steel and it was suggested that this system
may be active in ε-Fe27. Additionally it is expected that many slip systems should
become active at elevated temperature as CRSSs become softer and more similar.
Next we are going to explore the influence of twinning. In hcp metals “tensile”
twinning occurs if a crystal is extended along the c-axis and “compressive” twinning if it
is compressed along the c-axis. Dominant tensile twining on {10-12}⟨-1011⟩ will
produce a broad maximum around 0001 (Figure 8c). In this model twinning initially
accommodates most of the deformation with the other deformation modes relatively
inactive. As favorably oriented grains become twinned and tensile twinning is exhausted
other deformation modes take over (Table I). At 20% strain basal (0001)⟨2-1-10⟩ slip
and pyramidal ⟨a+c⟩ {2-1-12}⟨2-1-13⟩ slip accommodate most of the deformation (Table
I). Dominant compressive twinning on {2-1-12}⟨2-1-1-3⟩, with moderate activity of
other slip systems, will produce a girdle around the periphery of the IPF (Figure 8d).
Again twinning initially accommodates most of the deformation, but at 20% strain
prismatic and basal slip are dominant (Table I). For twinning simulations slip systems
were identically weighted and differences in activities of auxiliary slip systems is due to
maintaining compatibility for different twin modes. Compressive twinning could
produce the girdle observed late in the experiment (Figure 7, # B 145(ε)). However,
mechanical twinning is generally a low temperature deformation mechanism that is active
early in deformation58,59 and so is unlikely in this case.
While this new rDAC heating technique proved very successful, there is still
room for improvement. The major short coming of this technique is the large
temperature gradient within the sample. This may partly be overcome with better
insulating material between the diamond anvils and the sample. The insulating material
used here was polycrystal MgO powder which was often observed to flow away from the
16
sample during heating. It is likely that single crystal MgO or sapphire may provide better
insulation and more even heating. This problem may be less pronounced in oxides and
silicates as these samples have low enough thermal conductivity that they can self-
insulate. Another approach that could help resolve the issue with temperature gradients is
to defocus the laser to provide a larger hotspot size on the sample. The main drawback to
this is that the amount of power needed to heat the sample is much greater than with a
well focused laser beam and significant amounts of heat are absorbed by the body of the
rDAC.
Another technique that is being developed for in-situ radial diffraction and high
pressure and temperature deformation is a resistively heated rDAC.60 This device has the
advantage over laser heating that samples have a much more homogeneous temperature.
This technique however requires a much more complicated setup and is limited to
temperatures less than 1400 K. For temperatures greater than this laser heating remains
the only option for in-situ radial diffraction experiments with deformation at
simultaneous high-pressure and temperature.
IV. Conclusions
A method is described for deformation experiments at ultra-high pressure (>20
GPa) and temperature (>1900 K) using a DAC in radial diffraction geometry, combined
with laser heating. Pressure/stress is remote controlled with a membrane system. This
method is applied to iron, investigating texture changes during deformation and phase
transformation in three phases in-situ: bcc (α), fcc (γ) and hcp (ε). Compression textures
of bcc and fcc iron correspond to those described in the literature, establishing in situ
rDAC experiments as a reliable method. For hcp Fe deformed at high-pressure and high-
temperature different slip systems are active than at low-temperature. At high-
temperature pyramidal ⟨a + c⟩ slip on {2-1-12}⟨2-1-13⟩ appears to be dominant while at
room-temperature basal (0001)⟨2-1-10⟩ slip is dominant. The bcc to hcp Fe
transformation appears to follow the Burgers’ relationship with the additional observation
that at room temperature grains oriented with {112} at high angles to compression are
more favored to transform to the ε-phase. The bcc to fcc Fe phase transformation follows
the Kurdjumov-Sachs orientation relationship. For all transformations observed here,

17
variant selection plays an important role with the exception of the back transformation
from hcp Fe to bcc Fe at room temperature .
Acknowledgements:
The Advanced Light Source is supported by the Director, Office of Science,
Office of Basic Energy Sciences, Materials Sciences Division, of the U.S. Department of
Energy under Contract No. DE-AC02-05CH11231 at Lawrence Berkeley National
Laboratory and University of California, Berkeley, California. COMPRES, the
Consortium for Materials Properties Research in Earth Sciences under NSF Cooperative
Agreement EAR 01-35554 supported this project through funding of MK, as well as
crucial beamline-equipment. HRW and LM acknowledge support from CDAC and NSF
(EAR 0337006).
18
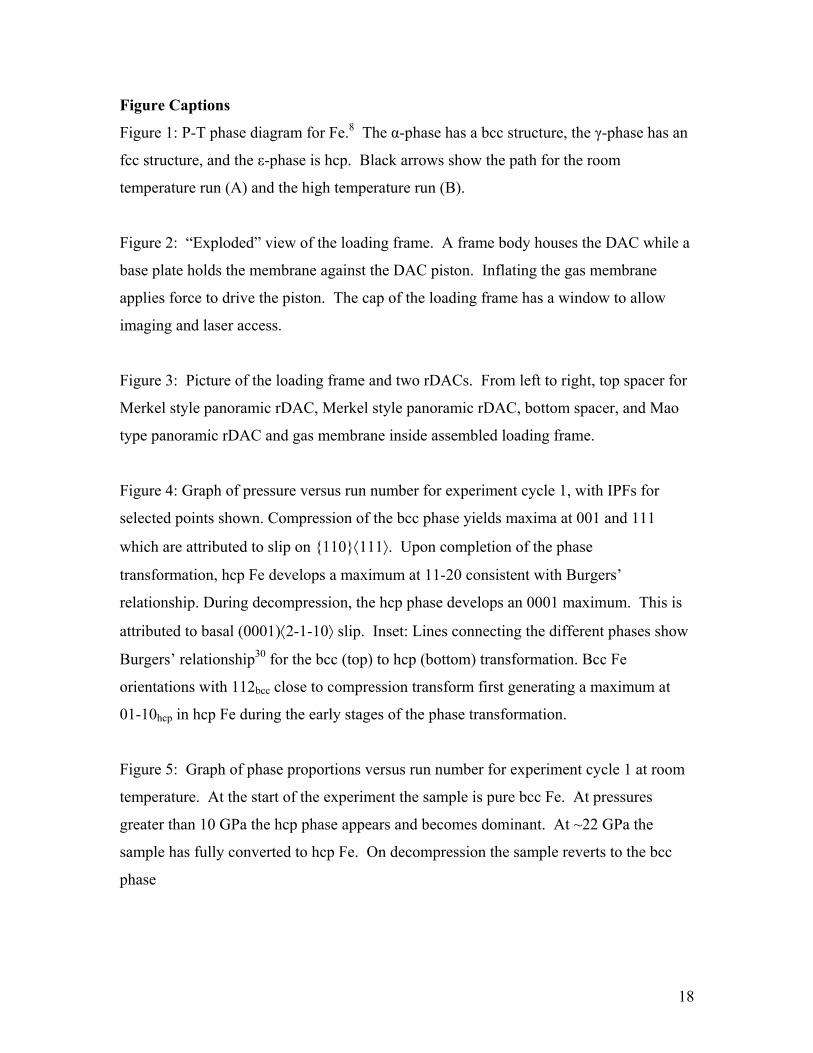
Figure Captions
Figure 1: P-T phase diagram for Fe.8 The α-phase has a bcc structure, the γ-phase has an
fcc structure, and the ε-phase is hcp. Black arrows show the path for the room
temperature run (A) and the high temperature run (B).
Figure 2: “Exploded” view of the loading frame. A frame body houses the DAC while a
base plate holds the membrane against the DAC piston. Inflating the gas membrane
applies force to drive the piston. The cap of the loading frame has a window to allow
imaging and laser access.
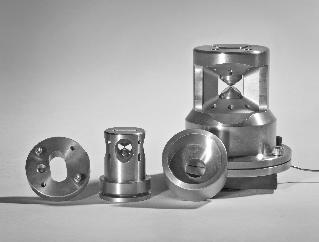
Figure 3: Picture of the loading frame and two rDACs. From left to right, top spacer for
Merkel style panoramic rDAC, Merkel style panoramic rDAC, bottom spacer, and Mao
type panoramic rDAC and gas membrane inside assembled loading frame.
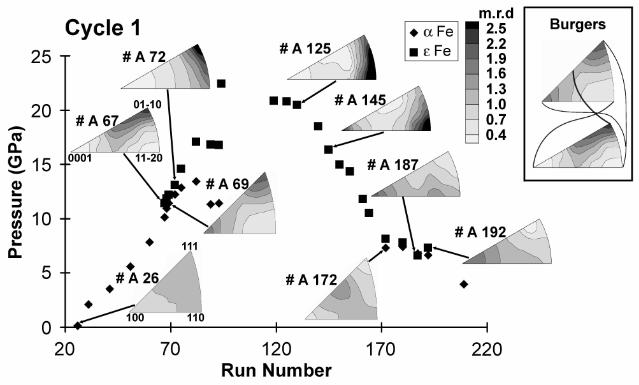
Figure 4: Graph of pressure versus run number for experiment cycle 1, with IPFs for
selected points shown. Compression of the bcc phase yields maxima at 001 and 111
which are attributed to slip on {110}⟨111⟩. Upon completion of the phase
transformation, hcp Fe develops a maximum at 11-20 consistent with Burgers’
relationship. During decompression, the hcp phase develops an 0001 maximum. This is
attributed to basal (0001)⟨2-1-10⟩ slip. Inset: Lines connecting the different phases show
Burgers’ relationship30 for the bcc (top) to hcp (bottom) transformation. Bcc Fe
orientations with 112bcc close to compression transform first generating a maximum at
01-10hcp in hcp Fe during the early stages of the phase transformation.
Figure 5: Graph of phase proportions versus run number for experiment cycle 1 at room
temperature. At the start of the experiment the sample is pure bcc Fe. At pressures
greater than 10 GPa the hcp phase appears and becomes dominant. At ~22 GPa the
sample has fully converted to hcp Fe. On decompression the sample reverts to the bcc
phase
19
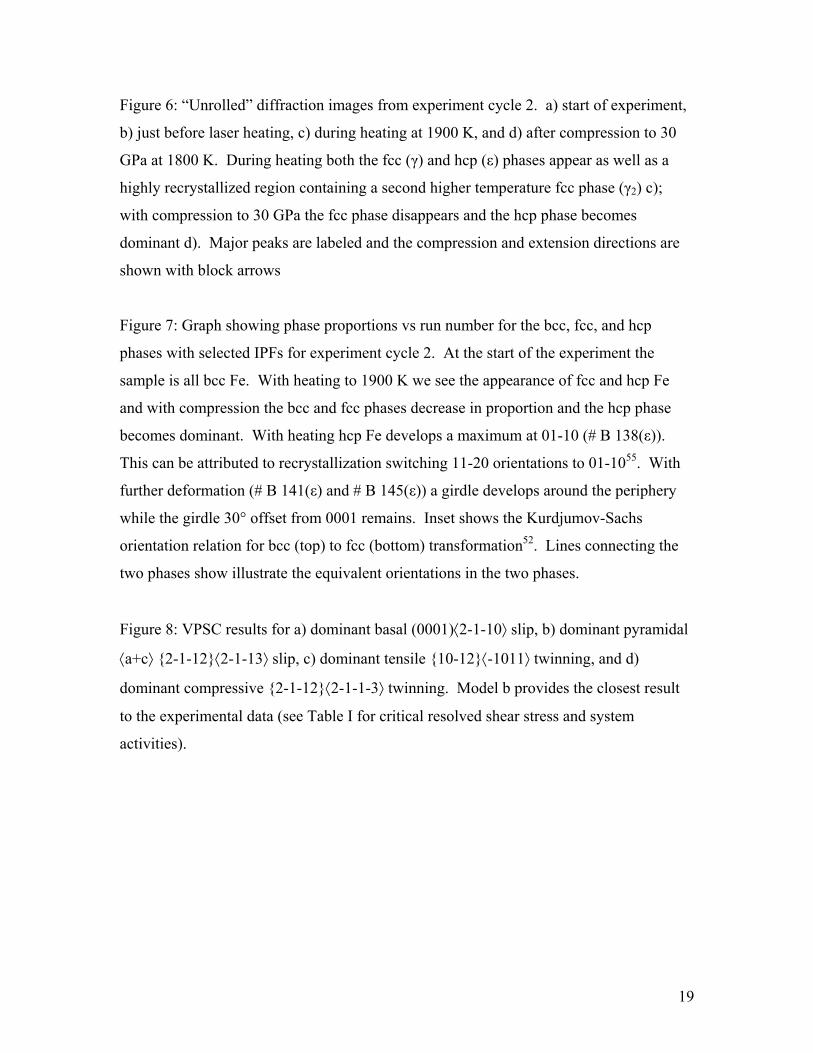
Figure 6: “Unrolled” diffraction images from experiment cycle 2. a) start of experiment,
b) just before laser heating, c) during heating at 1900 K, and d) after compression to 30
GPa at 1800 K. During heating both the fcc (γ) and hcp (ε) phases appear as well as a
highly recrystallized region containing a second higher temperature fcc phase (γ2) c);
with compression to 30 GPa the fcc phase disappears and the hcp phase becomes
dominant d). Major peaks are labeled and the compression and extension directions are
shown with block arrows
Figure 7: Graph showing phase proportions vs run number for the bcc, fcc, and hcp
phases with selected IPFs for experiment cycle 2. At the start of the experiment the
sample is all bcc Fe. With heating to 1900 K we see the appearance of fcc and hcp Fe
and with compression the bcc and fcc phases decrease in proportion and the hcp phase
becomes dominant. With heating hcp Fe develops a maximum at 01-10 (# B 138(ε)).
This can be attributed to recrystallization switching 11-20 orientations to 01-1055. With
further deformation (# B 141(ε) and # B 145(ε)) a girdle develops around the periphery
while the girdle 30° offset from 0001 remains. Inset shows the Kurdjumov-Sachs
orientation relation for bcc (top) to fcc (bottom) transformation52. Lines connecting the
two phases show illustrate the equivalent orientations in the two phases.
Figure 8: VPSC results for a) dominant basal (0001)⟨2-1-10⟩ slip, b) dominant pyramidal
⟨a+c⟩ {2-1-12}⟨2-1-13⟩ slip, c) dominant tensile {10-12}⟨-1011⟩ twinning, and d)
dominant compressive {2-1-12}⟨2-1-1-3⟩ twinning. Model b provides the closest result
to the experimental data (see Table I for critical resolved shear stress and system
activities).
20
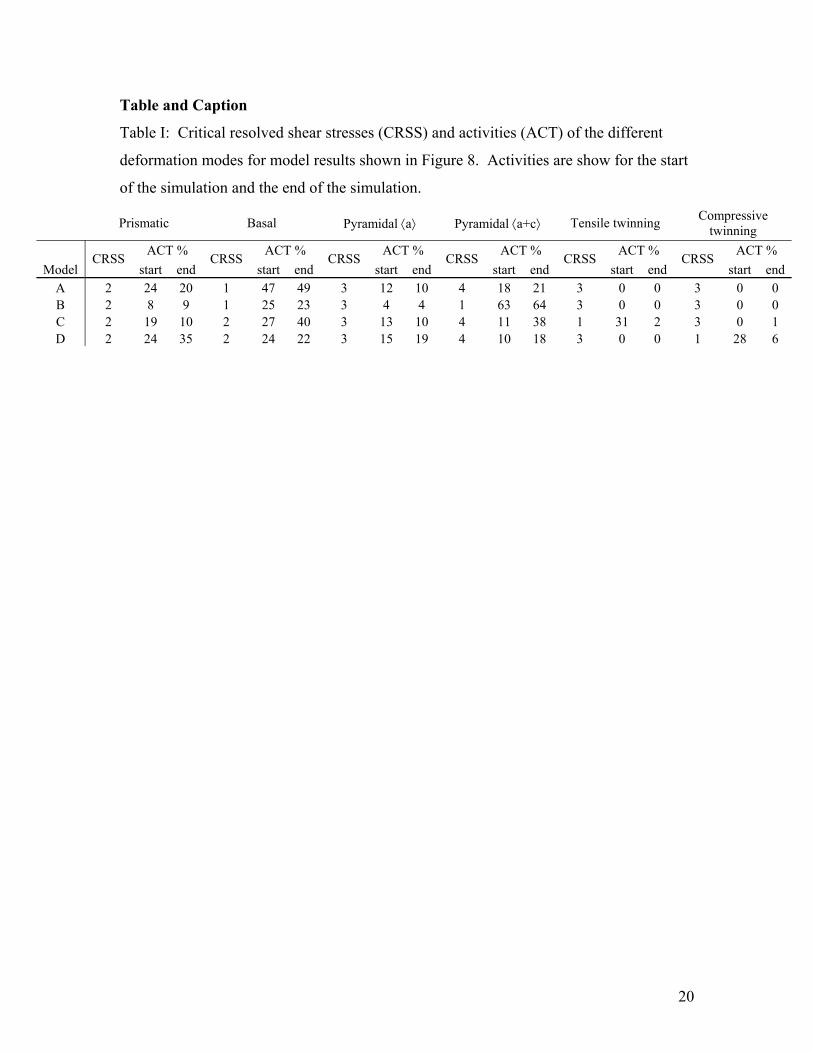
Table and Caption
Table I: Critical resolved shear stresses (CRSS) and activities (ACT) of the different
deformation modes for model results shown in Figure 8. Activities are show for the start
of the simulation and the end of the simulation.
Prismatic Basal Pyramidal ⟨a⟩ Pyramidal ⟨a+c⟩ Tensile twinning Compressive twinning
ACT % ACT % ACT % ACT % ACT % ACT % Model
CRSS start end
CRSS start end
CRSS start end
CRSS start end
CRSS start end
CRSS start end
A 2 24 20 1 47 49 3 12 10 4 18 21 3 0 0 3 0 0 B 2 8 9 1 25 23 3 4 4 1 63 64 3 0 0 3 0 0 C 2 19 10 2 27 40 3 13 10 4 11 38 1 31 2 3 0 1 D 2 24 35 2 24 22 3 15 19 4 10 18 3 0 0 1 28 6
21
Supplemental Material
Table SM-I: Experimental conditions from cycle 1 (room temperature). Associated
errors are given in parenthesis. Texture strength is given by the texture index (F2) which
is a measure of texture sharpness.
Table SM-II: Experimental condition from cycle 2. Errors are given in parentheses and
texture strength is given by the texture index (F2) which is a measure of texture
sharpness.
22
References
1 R.J. Hemley, H-K. Mao, G. Shen, J. Badro, P. Gillet, M. Hanfland, D. Häusermann, Science, 276, 316, 1242 (1997).
2 A.K. Singh, C. Balasingh, H-K. Mao, R.J. Hemley, J.F. Shu, J. Appl. Phys. 83, 12, 7567 (1998). 3 H.K. Mao, J. Shu, G. Shen, R.J. Hemley, B. Li, A.K. Singh, Nature 399, 280 (1999). 4 H-R. Wenk, I. Lonardelli, S. Merkel, L. Miyagi, J. Pehl, S. Speziale, C.E. Tommaseo, J. Phys. Cond. Matter, 18, S933 (2006). 5 M. Kunz, W.A. Caldwell, L. Miyagi, H-R. Wenk, Review of Scientific Instruments, 78 063907-1 (2007). 6 R. LeToullec, J.P. Pinceaux, P. Loubeyre, High Pressure Research 1, 77 (1988). 7 W.L. Mao H-K. Mao, J. Phys. Cond. Matter, 18, S1069 (2006). 8 G. Shen, H-K. Mao, R.J. Hemley, T.S. Duffy, M.L. Rivers, Geophys. Res. Lett. 25, 373 (1998). 9 M.H. Manghnani, L.C. Ming, N. Nakagiri, in High-Pressure Research in Mineral Physics, Geophys. Monogr. Ser., vol. 39, edited by M.H. Manghnani and Y. Syono [AGU, Washington, D. C., 1987], pp. 155–163. 10 E. Huang, W.A. Basset, P. Tao, in High-Pressure Research in Mineral Physics, Geophys. Monogr. Ser., vol. 39, edited by M.H. Manghnani and Y. Syono [AGU, Washington, D. C., 1987], pp. 165–172. 11 N. von Bargen, R. Boehler, High Pressure Res. 6, 133 (1990). 12 S. Akimoto, T. Suzuki, T. Yagi, O. Shimomura, in High-Pressure Research in Mineral Physics, Geophys. Monogr. Ser., vol. 39, edited by M.H. Manghnani and Y. Syono [AGU, Washington, D. C., 1987], pp. 149–154. 13 H-K. Mao, P.M. Bell, C. Hadidiacos, in High-Pressure Research in Mineral Physics, Geophys. Monogr. Ser., vol. 39, edited by M.H. Manghnani and Y. Syono [AGU, Washington, D. C., 1987], pp. 135–138. 14 R. Boehler, M. Nicol, M.L. Johnson, in High-Pressure Research in Mineral Physics, Geophys. Monogr. Ser., vol. 39, edited by M.H. Manghnani and Y. Syono [AGU, Washington, D. C., 1987], pp. 173–176.
23
15 R.J. Hemley, H-K. Mao, Int. Geol. Rev. 43, 1 (2001). 16 Y. Ma, M. Somayazulu, G. Shen, H-K. Mao, J. Shu, R.J. Hemley, Phys. of The Earth Planet. Inter., 143-144, 455 (2004). 17 G. Poupinet, R. Pillet, A. Souriau, Nature 305, 204 (1983). 18 A. Morelli, A.M. Dziewónski, J.H. Woodhouse, Geophys. Res. Lett. 13, 1545 (1986). 19 H-R. Wenk, T. Takeshita, R. Jeanloz, G.C. Johnson, Geophys. Res. Lett. 15, 76 (1988). 20 S. Yoshida, I. Sumita, M. Kumazawa, J. Geophys. Res. 101, 28085 (1996). 21 S. Karato, Nature 402, 871–873 (1999). 22 H-R. Wenk, J.R. Bamgardner, R.A. Lebensohn, C.N. Tomé, J. Geophys. Res. 105, 5663 (2000a). 23 B.A. Buffet, H-R. Wenk, Nature 413, 60 (2001). 24 H-R. Wenk, S. Matthies, R.J. Hemley, H-K. Mao, J. Shu, Nature 405, 1044 (2000b). 25 S. Merkel, H-R. Wenk, P. Gillet, H-K. Mao, R.J. Hemley, Phys. Earth Planet.Inter., 145, 239 (2004). 26 W.L. Mao, V.V. Struzhkin, A. Baron, S. Tsutsui, C. Tommaseo, H-R. Wenk, M. Hu, P. Chow, W. Sturhahn, J. Shu, R.J. Hemley, D.L. Heinz, H-K. Mao, JGR (in press), (2008). 27 J.P. Poirier, F. Langenhorst, Phys. Earth Panet. Int. 129, 347 (2002). 28 C. Barrett, T.B. Massalski, Structure of Metals (Pergamon Press, Oxford, UK, 1980). 29 A.D. Rollett, S.I. Wright, in Texture and Anisotropy. Preferred orientations in Polycrystals and their Effect on Materials Properties edited by U.F. Kocks, C.N. Tomé, H-R. Wenk, [Cambridge University Press, Cambridge, 2000] Ch. 5, pp. 179–239. 30 W.G. Burgers, Physica 1, 561 (1934). 31 M. Kunz, A.A. MacDowell, W.A. Caldwell, D. Cambie, R.S. Celestre, E.E. Domning, R.M. Duarte, A.E. Gleason, J.M. Glossinger, N. Kelez, D.W. Plate, T. Yu, J.M. Zaug, H.A. Padmore, R. Jeanloz, A.P. Alivisatos, S.M. Clark, Journal of Synchrotron Radiation, 12, 650 (2005).
24
32 W.A. Caldwell, M. Kunz, R.S. Celestre, E.E. Domning, M.J. Walter, D. Walker, J. Glossinger, A.A. MacDowell, H.A. Padmore, R. Jeanloz, S.M. Clark, Nuclear Instruments and Methods in Physics research A, 582, 221 (2007). 33 S. Merkel, T. Yagi, Review of Scientific Instruments 76, 046109-3 (2005). 34 J. Zhang, F. Guyot, Physics and Chemistry of Minerals 26, 206 (1999). 35 H-K. Mao, Y. Wu, L.C. Chen, J.F. Shu, A.P. Jephcoat, J. Geophys. Res., 95, 737–21 (1990). 36 Y.W. Fei, A. Ricolleau, M. Frank, K. Mibe, G.Y. Shen, V. Prakapenka, PNAS 104, 9182 (2007). 37 L. Lutterotti, S. Matthies, H-R. Wenk, Int. U. Crystallogr. Comm. Powder Diffr. Newslett. 21, 14 (1999). 38 S. Matthies, G.W. Vinel, Physica Status Solidi B-Basic Research 112, K115 (1982). 39 H-R. Wenk, S. Matthies, J. Donovan, D. Chateigner, Journal of Applied Crystallography 31, 262 (1998). 40 N.R. Barton, D.J. Benson, R. Becker, Modelling and Simulation in Materials Science and Engineering, 13, 707 (2005). 41 N. Hamaya, S. Akimoto, High Temp. High Pressures, 13, 347 (1981). 42 F.M. Wang, R. Ingalls, Phys. Rev. B, 57, 5647 (1998). 43 Z. Nishiyama, Martensitic transformation. (New York, Academic Press, 1978). 44 J.R. Morris, K.M. Ho, Phys. Rev. B, 63, 224116 (2001). 45 J.A. Krumhansl, Phase Transitions 65,109 (1998). 46 Yu N. Gornostyrev, M.I. Katsnelson, A.R. Kuznetsov, A.V. Trefilov, JETP Lett. 70, 380 (1999). 47 A.R. Kuznetsov, Yu N. Gornostyrev, M.I. Katsnelson, A.V. Trefilov, Materials Science and Engineering A 309-310, 168 (2001). 48 H-R. Wenk, G. Canova, Y. Brechet, L. Flandin, Acta Materialia 45, 3283 (1997). 49 H-R. Wenk, I. Lonardelli, D. Williams, Acta Materialia 52, 1899 (2004). 50 A.P. Hammersley, ESRF Internal Report, ESRF97HA02T (1997).
25
51 R.K. Ray, J.J. Jonas, M.P. Butrón-Guillén, J. Savoie, ISIJ International 34, 927 (1994). 52 G. Kurdjumov, G. Sachs, Zeitschrift für Physik A Hadrons and Nuclei 64, 325 (1930). 53 H-R. Wenk, I. Huensche, L. Kestens, Metallurgical and Materials Transactions A 38, 261 (2007). 54 S. Speziale, I. Lonardelli, L. Miyagi, J. Pehl, C.E. Tommaseo, H-R. Wenk, J. Phys. Cond. Matter 18, S1007 (2006). 55 I. Lonardelli, N. Gey, H-R. Wenk, L. Lutterotti, S. Vogel, M. Humbert, Acta Mater. 55, 5718 (2007). 56 R.A. Lebensohn, C.N. Tomé, Mater. Sci. Eng. A175, 71 (1994). 57 C.N. Tomé, G.R. Canova, Self-consistent modeling of heterogeneous plasticity. in Texture and Anisotropy. Preferred orientations in Polycrystals and their Effect on Materials Properties edited by U.F. Kocks, C.N. Tomé, H-R. Wenk, [Cambridge University Press, Cambridge, 2000] Ch. 11, pp. 466–510. 58 C.N. Tomé, S.R. Agnew, W.R. Blumenthal, M.A.M. Bourke, D.W. Brown, G.C. Kaschner, P. Rangaswamy, Mat. Sci. For., 408-412, 263 (2002). 59 L. Wu, A. Jain. D.W. Brown, G.M. Stoica, S.R. Agnew, B. Clausen, D.E. Fielden, P.K. Liaw, Acta Materialia 56, 688 (2008). 60 H-P. Liermann, S. Merkel, L. Miyagi, H-R. Wenk, G. Shen, H. Cynn, W.J. Evans, Eos Trans. AGU 88(52), Fall Meet. Suppl., Abstract MR43A-0975 (2007).