
Improving the performance of DCT-based fragile watermarking using intelligent optimization...
12
Improving the performance of DCT-based fragile watermarking using intelligent optimization algorithms Veysel Aslantas a, * , Saban Ozer b , Serkan Ozturk a a Computer Engineering Department, Erciyes University, Talas Cad, 38039 Kayseri, Turkey b Electrical and Electronics Engineering Department, Erciyes University, 38039 Kayseri, Turkey article info Article history: Received 23 September 2008 Received in revised form 15 April 2009 Accepted 16 April 2009 PACS: 42.30.Rx 42.30.Wb 42.30.Va Keywords: Fragile watermarking DCT Genetic algorithm Differential evolution algorithm Clonal selection algorithm Particle swarm optimization algorithm abstract The performance of a fragile watermarking method based on discrete cosine transform (DCT) has been improved in this paper by using intelligent optimization algorithms (IOA), namely genetic algorithm, differential evolution algorithm, clonal selection algorithm and particle swarm optimization algorithm. In DCT based fragile watermarking techniques, watermark embedding can usually be achieved by modifying the least significant bits of the transformation coefficients. After the embedding process is completed, transforming the modified coefficients from the frequency domain to the spatial domain pro- duces some rounding errors due to the conversion of real numbers to integers. The rounding errors caused by this transformation process were corrected by the use of intelligent optimization algorithms mentioned above. This paper gives experimental results which show the feasibility of using these opti- mization algorithms for the fragile watermarking and demonstrate the accuracy of these methods. The performance comparison of the algorithms was also realized. Ó 2009 Elsevier B.V. All rights reserved. 1. Introduction There has been an explosion in the use and distribution of the multimedia data such as digital image, audio and video due to the rapid development of computers and communication net- works. These data can be easily copied and altered or even stolen. Therefore, a great deal of concern has grown about the protection of these data. Digital watermarking is one of the new methods which provide protection for the digital data by embedding secret information directly into the data. This secret information is known as the watermark and used for several reasons such as con- tent authentication, fingerprinting, copyright protection, content archiving, broadcast monitoring and tamper detection [1]. Digital image watermarks can be categorized into two main groups; visible and invisible. Visible watermarks are the ones which can easily be perceived by the viewer. They are visual pat- terns like logos embedded into one side of an image [2]. Logos or visible watermarks can not only be identified, but also be removed or destroyed easily. On the other hand, invisible watermarks are embedded on the unknown sides of the images and are more robust than visible watermarks. Namely, they cannot be perceived under normal viewing conditions. Only the authorized people can extract the embedded watermark. With respect to robustness, invisible watermarks can be classi- fied as robust, semi-fragile and fragile [2]. Robust watermarks can resist some image manipulations called attacks such as scaling, cropping, compression, etc. Semi-fragile watermarks can be de- stroyed only when user-specified threshold is exceeded. Fragile watermarks can easily be demolished if a slight change occurs on the host image. As a result, unauthorized modifications on the watermarked images can be detected. That is why fragile water- marking methods are mainly used for the purpose of image authentication in the area of satellite or medical imagery. Moreover, fragile watermarking techniques can also be divided into two classes: spatial domain and frequency domain. In the spa- tial domain, watermarks are embedded by modifying the pixel val- ues directly [3–5]. The advantage of using the spatial domain watermarking is that its application is done very easily. However, the main disadvantages of the techniques used in early fragile watermarking systems are the easiness of bypassing the security they provide [6,7] and the failure of lossy compression of the image without damaging the watermark [8]. On the other hand, in the frequency domain, watermarks can be embedded by modifying 0030-4018/$ - see front matter Ó 2009 Elsevier B.V. All rights reserved. doi:10.1016/j.optcom.2009.04.034 * Corresponding author. Tel.: +90 352 4374901; fax: +90 352 437 4375784. E-mail address: [email protected] (V. Aslantas). Optics Communications 282 (2009) 2806–2817 Contents lists available at ScienceDirect Optics Communications journal homepage: www.elsevier.com/locate/optcom
-
Upload
independent -
Category
Documents
-
view
0 -
download
0
Transcript of Improving the performance of DCT-based fragile watermarking using intelligent optimization...
Optics Communications 282 (2009) 2806–2817
Contents lists available at ScienceDirect
Optics Communications
journal homepage: www.elsevier .com/ locate/optcom
Improving the performance of DCT-based fragile watermarking usingintelligent optimization algorithms
Veysel Aslantas a,*, Saban Ozer b, Serkan Ozturk a
a Computer Engineering Department, Erciyes University, Talas Cad, 38039 Kayseri, Turkeyb Electrical and Electronics Engineering Department, Erciyes University, 38039 Kayseri, Turkey
a r t i c l e i n f o
Article history:Received 23 September 2008Received in revised form 15 April 2009Accepted 16 April 2009
PACS:42.30.Rx42.30.Wb42.30.Va
Keywords:Fragile watermarkingDCTGenetic algorithmDifferential evolution algorithmClonal selection algorithmParticle swarm optimization algorithm
0030-4018/$ - see front matter � 2009 Elsevier B.V. Adoi:10.1016/j.optcom.2009.04.034
* Corresponding author. Tel.: +90 352 4374901; faxE-mail address: [email protected] (V. Aslanta
a b s t r a c t
The performance of a fragile watermarking method based on discrete cosine transform (DCT) has beenimproved in this paper by using intelligent optimization algorithms (IOA), namely genetic algorithm,differential evolution algorithm, clonal selection algorithm and particle swarm optimization algorithm.In DCT based fragile watermarking techniques, watermark embedding can usually be achieved bymodifying the least significant bits of the transformation coefficients. After the embedding process iscompleted, transforming the modified coefficients from the frequency domain to the spatial domain pro-duces some rounding errors due to the conversion of real numbers to integers. The rounding errorscaused by this transformation process were corrected by the use of intelligent optimization algorithmsmentioned above. This paper gives experimental results which show the feasibility of using these opti-mization algorithms for the fragile watermarking and demonstrate the accuracy of these methods. Theperformance comparison of the algorithms was also realized.
� 2009 Elsevier B.V. All rights reserved.
1. Introduction
There has been an explosion in the use and distribution of themultimedia data such as digital image, audio and video due tothe rapid development of computers and communication net-works. These data can be easily copied and altered or even stolen.Therefore, a great deal of concern has grown about the protectionof these data. Digital watermarking is one of the new methodswhich provide protection for the digital data by embedding secretinformation directly into the data. This secret information isknown as the watermark and used for several reasons such as con-tent authentication, fingerprinting, copyright protection, contentarchiving, broadcast monitoring and tamper detection [1].
Digital image watermarks can be categorized into two maingroups; visible and invisible. Visible watermarks are the oneswhich can easily be perceived by the viewer. They are visual pat-terns like logos embedded into one side of an image [2]. Logos orvisible watermarks can not only be identified, but also be removedor destroyed easily. On the other hand, invisible watermarks areembedded on the unknown sides of the images and are more
ll rights reserved.
: +90 352 437 4375784.s).
robust than visible watermarks. Namely, they cannot be perceivedunder normal viewing conditions. Only the authorized people canextract the embedded watermark.
With respect to robustness, invisible watermarks can be classi-fied as robust, semi-fragile and fragile [2]. Robust watermarks canresist some image manipulations called attacks such as scaling,cropping, compression, etc. Semi-fragile watermarks can be de-stroyed only when user-specified threshold is exceeded. Fragilewatermarks can easily be demolished if a slight change occurs onthe host image. As a result, unauthorized modifications on thewatermarked images can be detected. That is why fragile water-marking methods are mainly used for the purpose of imageauthentication in the area of satellite or medical imagery.
Moreover, fragile watermarking techniques can also be dividedinto two classes: spatial domain and frequency domain. In the spa-tial domain, watermarks are embedded by modifying the pixel val-ues directly [3–5]. The advantage of using the spatial domainwatermarking is that its application is done very easily. However,the main disadvantages of the techniques used in early fragilewatermarking systems are the easiness of bypassing the securitythey provide [6,7] and the failure of lossy compression of the imagewithout damaging the watermark [8]. On the other hand, in thefrequency domain, watermarks can be embedded by modifying
V. Aslantas et al. / Optics Communications 282 (2009) 2806–2817 2807
the transform coefficients of discrete cosine transform (DCT)[9–13] and discrete wavelet transform [14–16]. The main advanta-ges of using the frequency domain methods are that they can easilybe adapted to lossy compression systems, which have the ability toembed data in the compressed representations, and have ability toreveal how an image has been damaged or altered.
In recent years, the performances of digital watermarking meth-ods have been improved using artificial intelligence techniquessuch as genetic algorithm (GA) [12,17–27], genetic programming[28,29], clonal selection algorithm (CSA) [10], particle swarm opti-mization (PSO) algorithm [11,30,31], differential evolution (DE)[32] and neural networks [33–36]. In DCT based fragile watermark-ing techniques, the original input image is first transformed into itsfrequency domain. Then, the watermarks are generally embeddedby modifying the least significant bits (LSBs) of the frequency do-main coefficients. After the embedding process is completed, trans-forming the modified coefficients from the frequency domain to thespatial domain produces some rounding errors due to the conver-sion of real numbers to integers. In the literature, there are a fewstudies to reduce rounding errors that occur during the transforma-tion process of DCT based fragile watermarking techniques. Thisproblem was addressed by Shih and Wu [12] using GA to find aguiding bit map for whole host image. The guiding bit map is usedto direct the pixel value’s carrying and truncation, which is to re-place the rounding operations. However, the effectiveness of thistechnique highly depends on the guiding bit map. In [13], a heuris-tic method was proposed to enhance the quality of the extractedwatermark. The host image is divided into nonoverlapping blocks,and the pixel values are modified by using the reference coefficientdata. The method proposed in this paper is superior to these meth-ods in terms of the NC (Normalized Cross Correlation) value of theextracted watermark and the PSNR (Peak Signal to Noise Ratio) ofthe watermarked image. The NC value is always 1, which is notthe case with the methods proposed in [12,13].
This paper is organized as follows: In Section 2, the fundamentalconcepts of IOA are described. Section 3 demonstrates the tradi-tional DCT based fragile watermarking method. In Section 4, IOAbased methods which correct the rounding errors are demonstrated.Section 5 demonstrates the simulation results and performancecomparison of the algorithms. Finally, Section 6 concludes thepaper.
2. Intelligent optimization algorithms (IOA)
In this paper, GA, DE, CSA and PSO algorithms are used to improvethe performance of the fragile watermarking technique. In thefollowing subsections, a brief explanation of each algorithm is given.
2.1. Fundamental concepts of GA
GA, invented by Holland [37], is a popular evolutionary optimiza-tion algorithm. This algorithm can find the global optimal solution incomplex multidimensional search spaces. GA is modeled based onthe theory of natural evolution in that the operators it employs areinspired by the natural evolution process. These operators, knownas genetic operators, manipulate individuals in a population overseveral generations to improve their fitness gradually. The mainsteps of a basic GA are given below [38]:
(1) Initialization,(2) Evaluation,(3) Reproduction,(4) Crossover,(5) Mutation,(6) Repeat steps 2–5 until stopping criteria is reached.
A basic GA includes five components that are a random numbergenerator, fitness evaluation unit and genetic operators for repro-duction, crossover and mutation operations. The initial populationrequired at the start of the algorithm is a set of bit strings gener-ated by the random number generator. Each string is a representa-tion of a solution to the optimization problem being addressed.Associated with each string is a fitness value computed by the eval-uation unit. A fitness value is a measure of the goodness of thesolution that it represents. The aim of the genetic operators is totransform the set of strings into sets with higher fitness values.
The reproduction operator performs a natural selection functionknown as ‘‘seeded selection”. Individual strings are copied fromone set (representing a generation of solutions) to the next accord-ing to their fitness values; the higher the fitness value, the greaterthe probability of a string being selected for the next generation.The crossover operator chooses pairs of strings at random and pro-duces new pairs. The simplest crossover operation is to cut the ori-ginal ‘‘parent” strings at a randomly selected point and exchangetheir tails. The number of crossover operations is governed by acrossover rate (Cr). The mutation operator randomly mutates or re-verses the values of bits in a string. The number of mutation oper-ations is determined by a mutation rate. A phase of the algorithmconsists of applying the evaluation, reproduction, crossover andmutation operations. A new generation of solutions is producedwith each phase of the algorithm.
2.2. Fundamental concepts of DE algorithm
DE algorithm is a population based algorithm which uses theoperators similar to the genetic algorithm in the process of cross-over, mutation and selection. This algorithm can be categorizedas a floating-point encoded evolutionary algorithm. The algorithmuses the mutation operation as a search mechanism and the selec-tion operation to direct the search towards the optimum region.The main operation of the algorithm is based on the differencesof randomly sampled pairs of vectors in the population [39]. Themain steps of the DE algorithm are given below [40]:
(1) Initialization,(2) Evaluation,(3) Mutation,(4) Recombination,(5) Evaluation,(6) Selection,(7) Repeat steps 3–6 until stopping criteria is reached.
DE algorithm works by creating an initial population. An individ-ual of the population is selected at random for replacement and otherthree different individuals are selected at random as parents. In DEalgorithm, a uniform probability distribution for all random decisionsis used. With some probability, each variable in the parent is changed.The change is accomplished by adding the multiplication of F (scalingfactor) with the difference of other two parents to generate a candi-date child vector. For this purpose, several strategies were proposedin [41], namely DE/rand/1/bin, DE/best/1/bin, DE/best/2/bin, DE/rand/2/bin, DE/randtobest/1/bin, DE/rand/1/exp, DE/best/1/exp, DE/best/2/exp, DE/rand/2/exp, DE/randtobest/1/exp. DE/x/y/z indicatesDE for Differential Evolution, x is a string which denotes the vectorto be perturbed, y denotes the number of difference vectors takenfor perturbation of x, and z is the recombination method [42]. Thechanging process represents the recombination operation in DEalgorithm. The operation of DE algorithm is formulized below:
XðGþ1Þi;j ¼
XðGÞCi ;jþ F � ðXðGÞAi ;j
� XðGÞBi ;jÞ if ri;j 6 RCr _ j ¼ Di
XðGÞi;j otherwise
8<: ð1Þ
2808 V. Aslantas et al. / Optics Communications 282 (2009) 2806–2817
where i = 1, . . . , npop, j = 1, . . . , nparam, D = 1, . . . , nparam, A = 1, . . . ,npop, B = 1, . . . , npop, C = 1, . . . , npop, Ai – Bi – Ci – i, RCr 2 [0, 1], andr 2 [0, 1].
A, B and C are randomly chosen vector indexes in the popula-tion. They are different from each other and the running index jis the parameter index in ith vector. npop is the number of popula-tion, and nparam indicates the number of parameters to be opti-mized. The randomly chosen index D is used to ensure that thetrial vector will differ from its target (XðGÞi;j ) by at least one parame-ter. G represents the Gth generation. XðGÞi;j represents the solutionset of parameter vector j for ith population obtained at Gth gener-ation. F is the scaling factor which has an effect on the differencevector and RCr is the recombination rate and ri,j is a random valuein [0, 1] to be used in the determination of whether the parameterwill be changed or not. If the change is made, the target vector isreplaced by the newly generated trial vector.
2.3. Fundamental concepts of CSA
The clonal selection principle is used to explain the basic featuresof an adaptive immune response to an antigenic stimulus [43]. Inthe adaptive immune system, any molecule that can be recognizedis called as an Antigen (Ag). Lymphocytes are the basic immunitycells. They are called T and B cells. Unlike the T cells which needthe recognition of antigens via other assisting cells, the B cells canrecognize the antigens without restraint in liquid solutions. Anti-bodies (Abs) are the molecules attached to the surface of the B cellsof which aim is to recognize and bind to the Ags. When binding tothese Abs with a second signal from accessory cells such as theT-helper cell, the B cell is stimulated by the Ag to proliferate and ma-ture into non-dividing the Ab secreting cells, known as plasma cells.This process of cell division generates a clone known as a cell or a setof cells that are the progenies of a single cell. While proliferating anddifferentiating into the plasma cells, the B cells can also differentiateinto the long-lived B memory cells. When these memory cells,which circulate through the blood, lymph, and tissues, are exposedto a second antigenic stimulus, they commence to differentiate intoplasma cells capable of producing high-affinity Abs, pre-selected forthe specific Ag that had stimulated the primary response.
The main steps of the clonal selection algorithm, CLONALG, aregiven below [44];
(1) Initialization,(2) Evaluation and selection,(3) Generation of clones,(4) Hypermutation,(5) Repeat steps 2–4 until stopping criteria is reached.
The algorithm given above can be summarized as follows:Firstly, an initial population of Abs is generated randomly in a gi-ven bounds for the problem (Ag) considered. Each Ab is repre-sented by a binary array. The length of the array is determinedby the desired sensitivity. Then, the fitness value of each popula-tion member is calculated and the Abs are ordered according totheir fitness values. n highest affinity Abs are selected and clonedaccording to the fitness value proportionately. The number ofclones generated for all these selected Abs is given by:
Nc ¼Xn
i¼1
roundbN
i
� �ð2Þ
where Nc is the total number of clones generated for each of the Ags,b is a clonal rate, N is the total number of Abs, and round(�) is theoperator that rounds its argument towards the closest integer.The constructed clones are mutated inversely proportional withthe fitness values. The fitness values of the mutated (mature) clones
are calculated. Each Ab and its clones construct a sub-population.The highest fitness valued Ab of each sub-population is selectedand permitted to live. The low affinity Abs of the population is al-tered with the randomly generated Abs. Thus, the differentiationof the population is obtained. These steps continue until the prede-fined stopping criteria are reached.
2.4. Fundamental concepts of PSO algorithm
PSO, developed by Eberhart and Kenedy [45], is an algorithmwhich takes its root from the social behavior of bird flocking or fishschooling. It attempts to mimic the natural process of group com-munication and can be used to solve many different problems in awide range of domains from neural network training to functionminimization [46].
PSO algorithm has many similar properties with the evolution-ary computation techniques such as GA [47]. The algorithm startswith a random population and searches the optimum solution byupdating the generations. Unlike GA, PSO algorithm does not em-ploy operators such as crossover and mutation. The main steps ofPSO algorithm are given below [48]:
(1) Initialization,(2) Evaluation and selection,(3) Updating the particles,(4) Repeat steps 2–3 until stopping criteria is reached.
The purpose of PSO algorithm is to find the optimal solution byusing a population of particles. This algorithm is initialized with agroup of random particles, each of which represents a candidatesolution to the problem. In every iteration, each particle is updatedby the following two best values. The first value, pbest, is the bestsolution it has achieved so far. And the second value (gbest) trackedby the particle swarm optimizer is obtained by any particle in thepopulation from the previous iteration. With respect to the twobest values, each particle is updated by using the followingequations:
v iðnþ 1Þ ¼ k½Iwi � v iðnÞ þ c1 � rand1ðÞ � ðpbest � piðnÞÞþ c2 � rand2ðÞ � ðgbest � piðnÞÞ� ð3Þ
piðnþ 1Þ ¼ piðnÞ þ v iðnþ 1Þ ð4Þ
where vi is the particle velocity, pi is the current particle (solution),c1 and c2 denote the acceleration coefficients towards pbest andgbest, respectively. These coefficients control how far a particlemoves in a single iteration. Iwi is the inertia weight which controlsthe momentum of the particle. rand1 and rand2 are random num-bers uniformly distributed within [0, 1]. k is the constriction factorwhich guarantees the convergence of PSO algorithm and defined asfollows [31]:
k ¼ 2j2�u�
ffiffiffiffiffiffiffiffiffiffiffiffiffiffiffiffiffiffiffiu2 � 4u
pj
ð5Þ
where u = c1+c2.In order to reduce the likelihood of the particle leaving the
search space, the value of each dimension of every particle velocityvi can be clamped to the range [�vmax
, vmax]. The value of vmax ischosen to be k � pmax (where 0.1 6 k 6 1) [31]. This does not limitthe values of pi to the range [�vmax, vmax], but it only restricts a par-ticle’s maximum distance.
In typical implementations of PSO algorithm, the value of Iwi isdecreased linearly from 1.0 to near 0 in each iteration. Commonly,the inertia weight Iwi is set according to the following equation:
Iwi ¼ Iwmax �Iwmax � Iwmin
itermax� iter ð6Þ
889.88 -51.88 116.22 57.72 -59.13 11.86 56.18 -138.58 -49.88 32.16 -14.18 125.94 20.95 4.88 -167.24 60.10 -70.35 18.35 -26.59 112.49 9.54 -80.59 90.54 128.81 83.67 -83.36 -27.19 -43.73 143.67 68.42 3.16 -15.92
-131.63 93.50 -93.65 71.56 87.88 -2.85 85.20 -34.80 12.54 89.89 80.18 -14.56 35.00 -94.67 75.78 66.36 4.92 39.50 94.54 40.36 167.74 146.11 -1.66 -28.50
-0.18 -71.88 -58.34 -14.60 1.84 -137.03 30.14 -101.26
Fig. 2. DCT performed image of Fig. 1.
1 1
1 0
Fig. 3. The binary watermark.
889.88 -51.88 117.22 56.72 -59.13 11.86 56.18 -138.58 -49.88 33.16 -14.18 125.94 20.95 4.88 -167.24 60.10 -71.35 18.35 -26.59 112.49 9.54 -80.59 90.54 128.81 83.67 -83.36 -27.19 -43.73 143.67 68.42 3.16 -15.92
-131.63 93.50 -93.65 71.56 87.88 -2.85 85.20 -34.80 12.54 89.89 80.18 -14.56 35.00 -94.67 75.78 66.36 4.92 39.50 94.54 40.36 167.74 146.11 -1.66 -28.50
-0.18 -71.88 -58.34 -14.60 1.84 -137.03 30.14 -101.26
Fig. 4. Watermarked image in DCT domain.
218.09 29.14 4.08 65.82 175.53 110.46 30.67 72.91 32.15 170.21 72.15 41.91 112.63 154.58 254.79 39.04
146.22 197.29 20.25 84.03 32.78 137.75 153.99 142.24 170.23 162.31 118.30 75.11 16.89 93.90 89.16 58.43
0.13 115.22 39.24 244.09 39.91 223.95 81.24 169.52 231.95 52.05 99.10 239.98 3.83 95.90 243.22 252.51 38.74 187.86 210.92 7.83 91.71 225.81 61.14 251.45
142.61 40.73 115.81 35.72 26.62 195.73 9.07 62.39
Fig. 5. IDCT performed watermarked image.
218 29 4 66 176 110 31 7332 170 72 42 113 155 255 39
146 197 20 84 33 138 154 142170 162 118 75 17 94 89 58
0 115 39 244 40 224 81 170232 52 99 240 4 96 243 25339 188 211 8 92 226 61 251
143 41 116 36 27 196 9 62
Fig. 6. Rounded watermarked image.
890.00 -52.13 116.61 57.25 -58.75 11.70 56.15 -138.50 -50.19 32.48 -14.26 125.86 20.99 5.03 -167.53 60.34
V. Aslantas et al. / Optics Communications 282 (2009) 2806–2817 2809
where itermax is the maximum number of iterations, and iter is thecurrent number of iterations.
3. Traditional DCT based fragile watermarking method
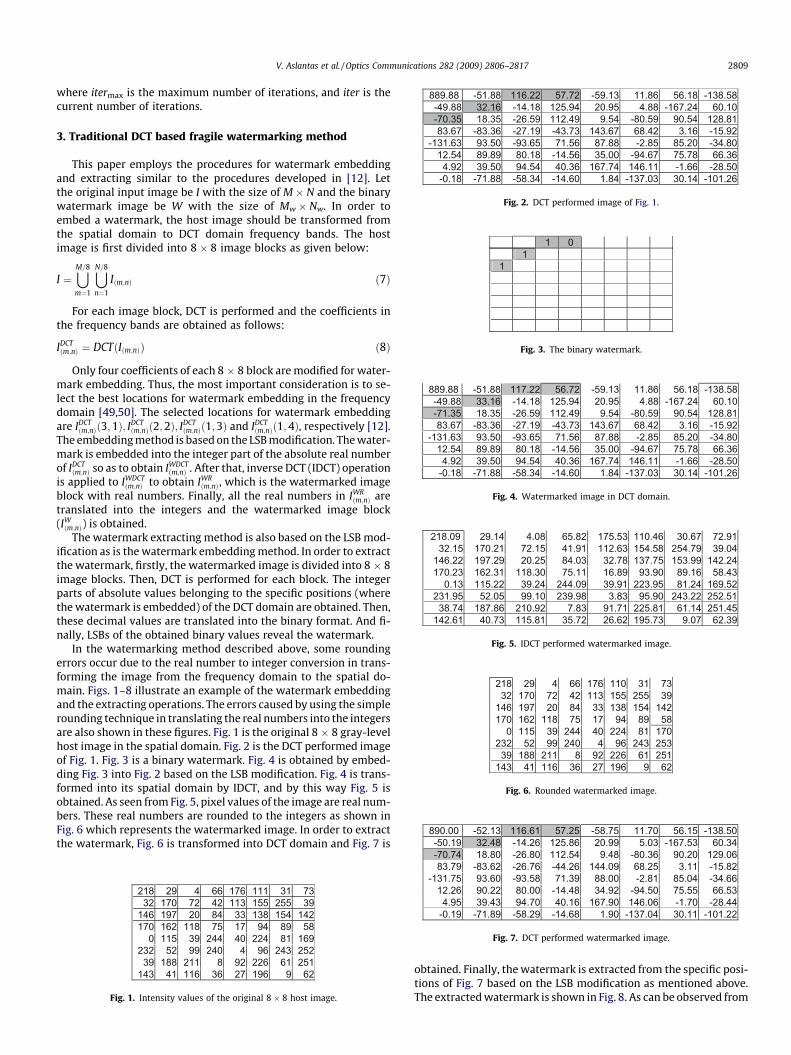
This paper employs the procedures for watermark embeddingand extracting similar to the procedures developed in [12]. Letthe original input image be I with the size of M � N and the binarywatermark image be W with the size of Mw � Nw. In order toembed a watermark, the host image should be transformed fromthe spatial domain to DCT domain frequency bands. The hostimage is first divided into 8 � 8 image blocks as given below:
I ¼[M=8
m¼1
[N=8
n¼1
Iðm;nÞ ð7Þ
For each image block, DCT is performed and the coefficients inthe frequency bands are obtained as follows:
IDCTðm;nÞ ¼ DCTðIðm;nÞÞ ð8Þ
Only four coefficients of each 8 � 8 block are modified for water-mark embedding. Thus, the most important consideration is to se-lect the best locations for watermark embedding in the frequencydomain [49,50]. The selected locations for watermark embeddingare IDCT
ðm;nÞð3;1Þ; IDCTðm;nÞð2;2Þ; I
DCTðm;nÞð1;3Þ and IDCT
ðm;nÞð1;4Þ, respectively [12].The embedding method is based on the LSB modification. The water-mark is embedded into the integer part of the absolute real numberof IDCT
ðm;nÞ so as to obtain IWDCTðm;nÞ . After that, inverse DCT (IDCT) operation
is applied to IWDCTðm;nÞ to obtain IWR
ðm;nÞ, which is the watermarked imageblock with real numbers. Finally, all the real numbers in IWR
ðm;nÞ aretranslated into the integers and the watermarked image block(IWðm;nÞ) is obtained.
The watermark extracting method is also based on the LSB mod-ification as is the watermark embedding method. In order to extractthe watermark, firstly, the watermarked image is divided into 8 � 8image blocks. Then, DCT is performed for each block. The integerparts of absolute values belonging to the specific positions (wherethe watermark is embedded) of the DCT domain are obtained. Then,these decimal values are translated into the binary format. And fi-nally, LSBs of the obtained binary values reveal the watermark.
In the watermarking method described above, some roundingerrors occur due to the real number to integer conversion in trans-forming the image from the frequency domain to the spatial do-main. Figs. 1–8 illustrate an example of the watermark embeddingand the extracting operations. The errors caused by using the simplerounding technique in translating the real numbers into the integersare also shown in these figures. Fig. 1 is the original 8 � 8 gray-levelhost image in the spatial domain. Fig. 2 is the DCT performed imageof Fig. 1. Fig. 3 is a binary watermark. Fig. 4 is obtained by embed-ding Fig. 3 into Fig. 2 based on the LSB modification. Fig. 4 is trans-formed into its spatial domain by IDCT, and by this way Fig. 5 isobtained. As seen from Fig. 5, pixel values of the image are real num-bers. These real numbers are rounded to the integers as shown inFig. 6 which represents the watermarked image. In order to extractthe watermark, Fig. 6 is transformed into DCT domain and Fig. 7 is
218 29 4 66 176 111 31 7332 170 72 42 113 155 255 39
146 197 20 84 33 138 154 142170 162 118 75 17 94 89 58
0 115 39 244 40 224 81 169232 52 99 240 4 96 243 25239 188 211 8 92 226 61 251
143 41 116 36 27 196 9 62
Fig. 1. Intensity values of the original 8 � 8 host image.
-70.74 18.80 -26.80 112.54 9.48 -80.36 90.20 129.06 83.79 -83.62 -26.76 -44.26 144.09 68.25 3.11 -15.82
-131.75 93.60 -93.58 71.39 88.00 -2.81 85.04 -34.66 12.26 90.22 80.00 -14.48 34.92 -94.50 75.55 66.53 4.95 39.43 94.70 40.16 167.90 146.06 -1.70 -28.44
-0.19 -71.89 -58.29 -14.68 1.90 -137.04 30.11 -101.22
Fig. 7. DCT performed watermarked image.
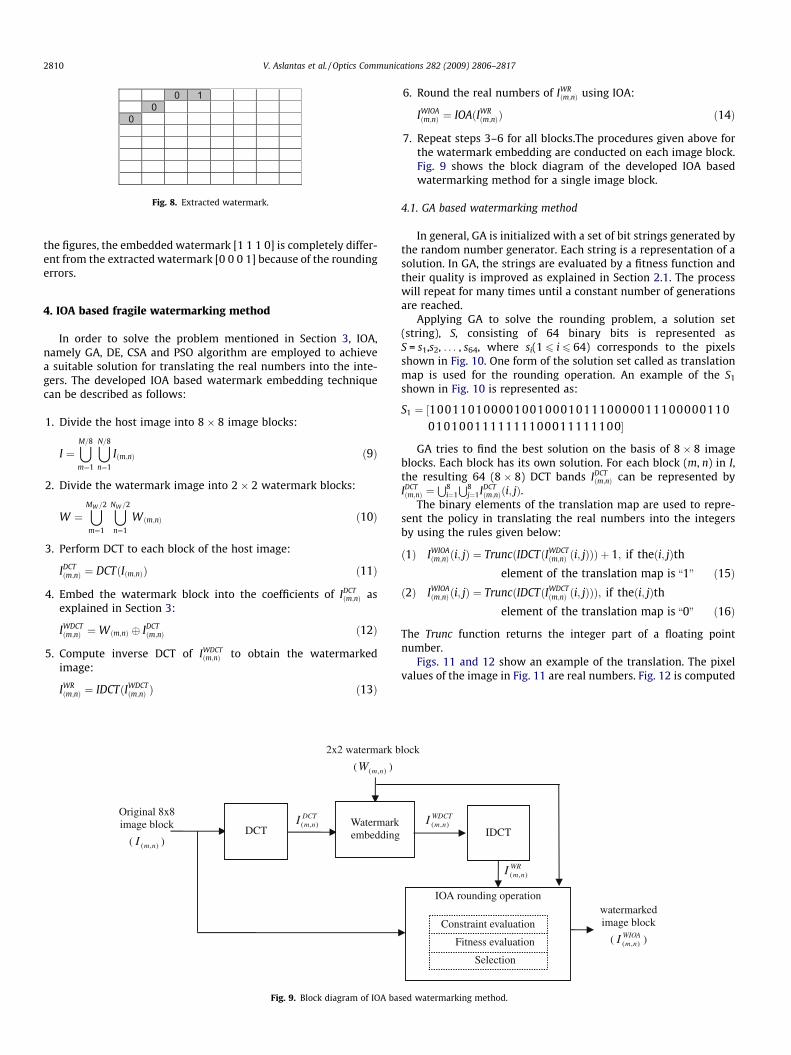
obtained. Finally, the watermark is extracted from the specific posi-tions of Fig. 7 based on the LSB modification as mentioned above.The extracted watermark is shown in Fig. 8. As can be observed from
0 1 0
0
Fig. 8. Extracted watermark.
2810 V. Aslantas et al. / Optics Communications 282 (2009) 2806–2817
the figures, the embedded watermark [1 1 1 0] is completely differ-ent from the extracted watermark [0 0 0 1] because of the roundingerrors.
4. IOA based fragile watermarking method
In order to solve the problem mentioned in Section 3, IOA,namely GA, DE, CSA and PSO algorithm are employed to achievea suitable solution for translating the real numbers into the inte-gers. The developed IOA based watermark embedding techniquecan be described as follows:
1. Divide the host image into 8 � 8 image blocks:
I ¼[M=8
m¼1
[N=8
n¼1
Iðm;nÞ ð9Þ
2. Divide the watermark image into 2 � 2 watermark blocks:
W ¼[MW =2
m¼1
[NW =2
n¼1
W ðm;nÞ ð10Þ
3. Perform DCT to each block of the host image:
IDCTðm;nÞ ¼ DCTðIðm;nÞÞ ð11Þ
4. Embed the watermark block into the coefficients of IDCTðm;nÞ as
explained in Section 3:
IWDCTðm;nÞ ¼W ðm;nÞ � IDCT
ðm;nÞ ð12Þ
5. Compute inverse DCT of IWDCTðm;nÞ to obtain the watermarked
image:
IWRðm;nÞ ¼ IDCTðIWDCT
ðm;nÞ Þ ð13Þ
DCTnmI ),(
2x2 watermark b
( ),( nmW )
DCT
Watermarkembedding
Original 8x8 image block
( ),( nmI )
Fig. 9. Block diagram of IOA ba
6. Round the real numbers of IWRðm;nÞ using IOA:
IWIOAðm;nÞ ¼ IOAðIWR
ðm;nÞÞ ð14Þ
7. Repeat steps 3–6 for all blocks.The procedures given above forthe watermark embedding are conducted on each image block.Fig. 9 shows the block diagram of the developed IOA basedwatermarking method for a single image block.
4.1. GA based watermarking method
In general, GA is initialized with a set of bit strings generated bythe random number generator. Each string is a representation of asolution. In GA, the strings are evaluated by a fitness function andtheir quality is improved as explained in Section 2.1. The processwill repeat for many times until a constant number of generationsare reached.
Applying GA to solve the rounding problem, a solution set(string), S, consisting of 64 binary bits is represented asS = s1,s2, . . . , s64, where si(1 6 i 6 64) corresponds to the pixelsshown in Fig. 10. One form of the solution set called as translationmap is used for the rounding operation. An example of the S1
shown in Fig. 10 is represented as:
S1 ¼ ½1001101000010010001011100000111000001100101001111111100011111100�
GA tries to find the best solution on the basis of 8 � 8 imageblocks. Each block has its own solution. For each block (m, n) in I,the resulting 64 (8 � 8) DCT bands IDCT
ðm;nÞ can be represented byIDCTðm;nÞ ¼
S8i¼1
S8j¼1IDCT
ðm;nÞði; jÞ.The binary elements of the translation map are used to repre-
sent the policy in translating the real numbers into the integersby using the rules given below:
ð1Þ IWIOAðm;nÞ ði; jÞ ¼ TruncðIDCTðIWDCT
ðm;nÞ ði; jÞÞÞ þ 1; if theði; jÞthelement of the translation map is \1" ð15Þ
ð2Þ IWIOAðm;nÞ ði; jÞ ¼ TruncðIDCTðIWDCT
ðm;nÞ ði; jÞÞÞ; if theði; jÞthelement of the translation map is \0" ð16Þ
The Trunc function returns the integer part of a floating pointnumber.
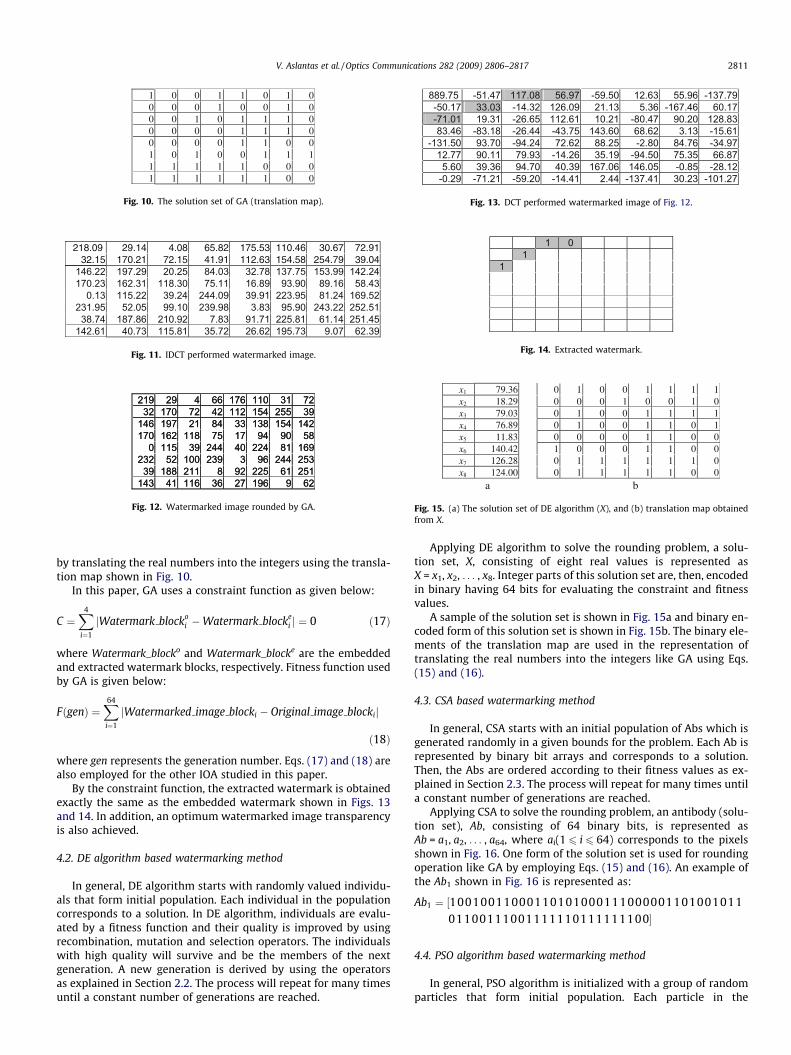
Figs. 11 and 12 show an example of the translation. The pixelvalues of the image in Fig. 11 are real numbers. Fig. 12 is computed
WDCTnmI ),(
WRnmI ),(
lock
IDCT
IOA rounding operation
Constraint evaluation
Fitness evaluation
Selection
WRnmI ),(
watermarked image block
( WIOAnmI ),( )
sed watermarking method.
1 0 0 1 1 0 1 00 0 0 1 0 0 1 00 0 1 0 1 1 1 00 0 0 0 1 1 1 00 0 0 0 1 1 0 01 0 1 0 0 1 1 11 1 1 1 1 0 0 01 1 1 1 1 1 0 0
Fig. 10. The solution set of GA (translation map).
889.75 -51.47 117.08 56.97 -59.50 12.63 55.96 -137.79 -50.17 33.03 -14.32 126.09 21.13 5.36 -167.46 60.17 -71.01 19.31 -26.65 112.61 10.21 -80.47 90.20 128.83 83.46 -83.18 -26.44 -43.75 143.60 68.62 3.13 -15.61
-131.50 93.70 -94.24 72.62 88.25 -2.80 84.76 -34.97 12.77 90.11 79.93 -14.26 35.19 -94.50 75.35 66.87 5.60 39.36 94.70 40.39 167.06 146.05 -0.85 -28.12
-0.29 -71.21 -59.20 -14.41 2.44 -137.41 30.23 -101.27
Fig. 13. DCT performed watermarked image of Fig. 12.
146.22 197.29 20.25 84.03 32.78 137.75 153.99 142.24 170.23 162.31 118.30 75.11 16.89 93.90 89.16 58.43
0.13 115.22 39.24 244.09 39.91 223.95 81.24 169.52 231.95 52.05 99.10 239.98 3.83 95.90 243.22 252.51 38.74 187.86 210.92 7.83 91.71 225.81 61.14 251.45
142.61 40.73 115.81 35.72 26.62 195.73 9.07 62.39
218.09 29.14 4.08 65.82 175.53 110.46 30.67 72.91 32.15 170.21 72.15 41.91 112.63 154.58 254.79 39.04
Fig. 11. IDCT performed watermarked image.
219 29 4 66 176 110 31 7232 170 72 42 112 154 255 39
146 197 21 84 33 138 154 142170 162 118 75 17 94 90 58
0 115 39 244 40 224 81 169232 52 100 239 3 96 244 25339 188 211 8 92 225 61 251
143 41 116 36 27 196 9 62
219 29 4 66 176 110 31 7232 170 72 42 112 154 255 39
146 197 21 84 33 138 154 142170 162 118 75 17 94 90 58
0 115 39 244 40 224 81 169232 52 100 239 3 96 244 25339 188 211 8 92 225 61 251
143 41 116 36 27 196 9 62
Fig. 12. Watermarked image rounded by GA.
1 0 1 1
Fig. 14. Extracted watermark.
a
x1 79.36x2 18.29x3 79.03x4 76.89x5 11.83x6 140.42x7 126.28x8 124.00
b
0 1 0 0 1 1 1 10 0 0 1 0 0 1 00 1 0 0 1 1 1 10 1 0 0 1 1 0 10 0 0 0 1 1 0 01 0 0 0 1 1 0 00 1 1 1 1 1 1 00 1 1 1 1 1 0 0
Fig. 15. (a) The solution set of DE algorithm (X), and (b) translation map obtainedfrom X.
V. Aslantas et al. / Optics Communications 282 (2009) 2806–2817 2811
by translating the real numbers into the integers using the transla-tion map shown in Fig. 10.
In this paper, GA uses a constraint function as given below:
C ¼X4
i¼1
jWatermark blockoi �Watermark blocke
i j ¼ 0 ð17Þ
where Watermark_blocko and Watermark_blocke are the embeddedand extracted watermark blocks, respectively. Fitness function usedby GA is given below:
FðgenÞ ¼X64
i¼1
jWatermarked image blocki � Original image blockij
ð18Þ
where gen represents the generation number. Eqs. (17) and (18) arealso employed for the other IOA studied in this paper.
By the constraint function, the extracted watermark is obtainedexactly the same as the embedded watermark shown in Figs. 13and 14. In addition, an optimum watermarked image transparencyis also achieved.
4.2. DE algorithm based watermarking method
In general, DE algorithm starts with randomly valued individu-als that form initial population. Each individual in the populationcorresponds to a solution. In DE algorithm, individuals are evalu-ated by a fitness function and their quality is improved by usingrecombination, mutation and selection operators. The individualswith high quality will survive and be the members of the nextgeneration. A new generation is derived by using the operatorsas explained in Section 2.2. The process will repeat for many timesuntil a constant number of generations are reached.
Applying DE algorithm to solve the rounding problem, a solu-tion set, X, consisting of eight real values is represented asX = x1, x2, . . . , x8. Integer parts of this solution set are, then, encodedin binary having 64 bits for evaluating the constraint and fitnessvalues.
A sample of the solution set is shown in Fig. 15a and binary en-coded form of this solution set is shown in Fig. 15b. The binary ele-ments of the translation map are used in the representation oftranslating the real numbers into the integers like GA using Eqs.(15) and (16).
4.3. CSA based watermarking method
In general, CSA starts with an initial population of Abs which isgenerated randomly in a given bounds for the problem. Each Ab isrepresented by binary bit arrays and corresponds to a solution.Then, the Abs are ordered according to their fitness values as ex-plained in Section 2.3. The process will repeat for many times untila constant number of generations are reached.
Applying CSA to solve the rounding problem, an antibody (solu-tion set), Ab, consisting of 64 binary bits, is represented asAb = a1, a2, . . . , a64, where ai(1 6 i 6 64) corresponds to the pixelsshown in Fig. 16. One form of the solution set is used for roundingoperation like GA by employing Eqs. (15) and (16). An example ofthe Ab1 shown in Fig. 16 is represented as:
Ab1 ¼ ½1001001100011010100011100000110100101101100111001111110111111100�
4.4. PSO algorithm based watermarking method
In general, PSO algorithm is initialized with a group of randomparticles that form initial population. Each particle in the

1 0 0 1 0 0 1 10 0 0 1 1 0 1 01 0 0 0 1 1 1 00 0 0 0 1 1 0 10 0 1 0 1 1 0 11 0 0 1 1 1 0 01 1 1 1 1 1 0 11 1 1 1 1 1 0 0
Fig. 16. The solution set of CSA (translation map).
Fig. 17. (a) The solution set of PSO algorithm (P), and (b) translation map obtainedfrom P.
0 1 1 1
Fig. 18. Second binary watermark.
141 70 176 16 211 205 176 24755 236 83 31 86 110 131 211170 60 235 7 50 62 253 33 79 33 193 221 130 162 47 215120 105 102 106 54 94 143 201129 162 50 202 148 110 124 88 176 46 102 208 250 77 101 18849 103 39 101 119 110 126 15
Fig. 19. Intensity values of the second host image.
2812 V. Aslantas et al. / Optics Communications 282 (2009) 2806–2817
population corresponds to a solution. In PSO algorithm, particlesare evaluated by a fitness function and their quality is improvedas explained in Section 2.4. The process will repeat for many timesuntil a constant number of iterations are reached.
Applying PSO algorithm to solve the rounding problem, a solu-tion set, P, consisting of eight real values is represented asP = p1, p2, . . . , p8. Integer parts of this solution set are, then, en-coded in binary having 64 bits for evaluating the constraint and fit-ness values.
A sample of the solution set is shown in Fig. 17a and binary en-coded form of this solution set is shown in Fig. 17b. The binary ele-ments of the translation map are used in the representation oftranslating the real numbers into the integers like GA by employ-ing Eqs. (15) and (16).
5. Simulation results
To analyze the effect of the control parameters of GA, the sim-ulations were carried out by embedding the watermark in Fig. 3into the image in Fig. 1 using different mutation types, crossoverrates and crossover types. Then, the mean and standard deviationof fitness values obtained for each 30 runs are given in Table 1.In this table, the number of maximum generation and populationsize are chosen as 100 and 80, respectively and the best solutionis obtained when the mutation type is uniform, the crossover typeis twopoint and the crossover rate is set to 0.2.
To analyze the effect of the control parameters of GA on a differ-ent image and watermark block, the simulations were carried outby embedding the watermark in Fig. 18 into the image in Fig. 19.Their results are shown in Table 2, where population size is chosen
Table 1The effect of the mutation types, crossover rates and crossover types of GA based method
Crossover rate (Cr)
0.1 0.2
Mean Std. Mean St
Mutation type Crossover typeUniform Single point 10.77 1.57 11.07 1.
Two point 11.17 1.68 10.50 1.
Gaussian Single point 10.51 1.07 11.43 1.Two point 10.57 1.48 11.44 1.
as 80. The best performance of GA is derived when the mutationtype is uniform, the crossover type is twopoint and the crossover ra-tio is set to 0.2.
To analyze the effect of the control parameters of DE algorithm,the simulations were carried out by embedding the watermark inFig. 3 into the image in Fig. 1 using different scaling factors (F),recombination rates (RCr) and the strategy types of the algorithm.Then, the mean and standard deviation of fitness values obtainedfor each 30 runs are given in Table 3. In this table, the number ofmaximum generation and population size are chosen as 100 and80, respectively and the best solution is seen when the strategytype is ‘‘DE/best/1/exp”, F = 0.2 and RCr = 0.2.
To analyze the effect of the control parameters of DE algorithmon a different image and watermark block, the simulations werecarried out by embedding the watermark in Fig. 18 into the imagein Fig. 19. Their results are shown in Table 4, where the populationsize and strategy type are chosen as 80 and ‘‘DE/best/1/exp”respectively. The best performance of DE algorithm is derivedwhile F = 0.3 and RCr = 0.3.
To analyze the effect of the control parameters of CSA, the sim-ulations were carried out by embedding the watermark in Fig. 3into the image in Fig. 1 using different clonal rates (Clr) and hyper-mutation rates (Hpr). Then, the mean and standard deviation of thefitness values obtained for each 30 runs are given in Table 5. In thistable, the number of maximum generation and population size arechosen as 100 and 80, respectively. The best solution is seen forHpr = 0.04 and Clr = 0.5.
To analyze the effect of the control parameters of CSA on a dif-ferent image and watermark block, the simulations were carriedout by embedding the watermark in Fig. 18 into the image inFig. 19. Their results are shown in Table 6, where population size
on the first example block.
0.3 0.4 0.5
d. Mean Std. Mean Std. Mean Std.
95 11.47 1.76 12.00 1.91 12.30 2.0250 11.47 2.67 11.00 1.80 12.27 2.27
43 11.50 1.61 11.73 2.03 11.67 1.3548 11.97 2.08 11.80 1.69 12.43 2.24
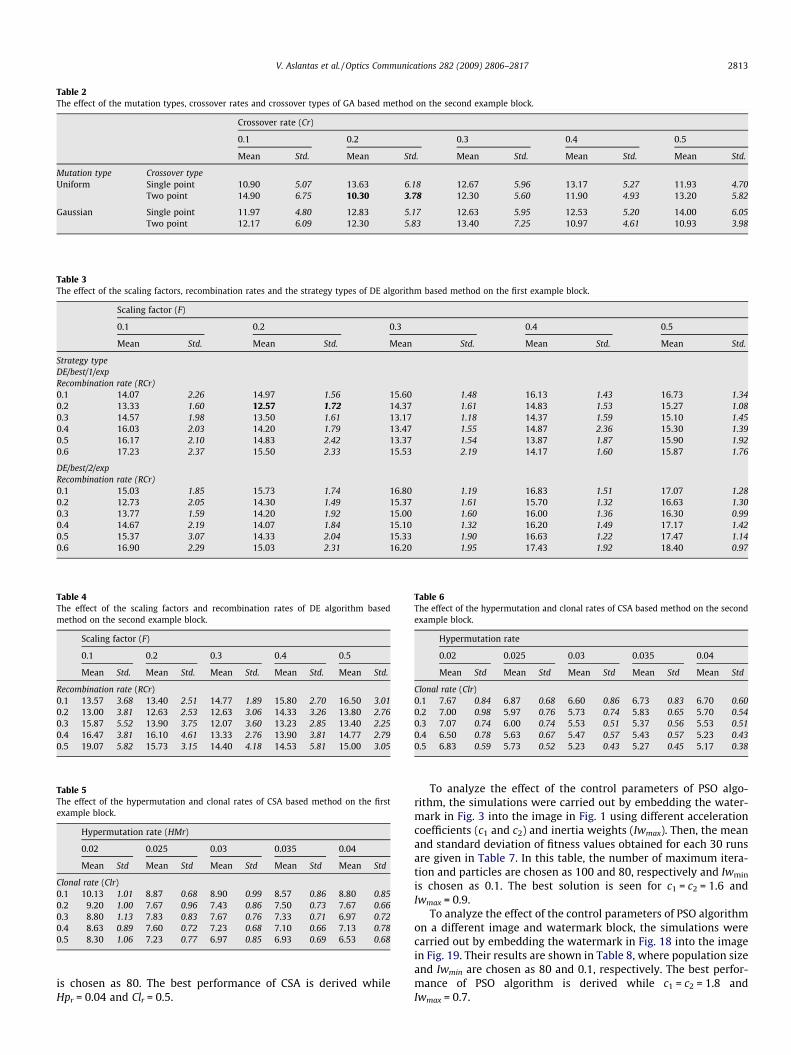
Table 2The effect of the mutation types, crossover rates and crossover types of GA based method on the second example block.
Crossover rate (Cr)
0.1 0.2 0.3 0.4 0.5
Mean Std. Mean Std. Mean Std. Mean Std. Mean Std.
Mutation type Crossover typeUniform Single point 10.90 5.07 13.63 6.18 12.67 5.96 13.17 5.27 11.93 4.70
Two point 14.90 6.75 10.30 3.78 12.30 5.60 11.90 4.93 13.20 5.82
Gaussian Single point 11.97 4.80 12.83 5.17 12.63 5.95 12.53 5.20 14.00 6.05Two point 12.17 6.09 12.30 5.83 13.40 7.25 10.97 4.61 10.93 3.98
Table 3The effect of the scaling factors, recombination rates and the strategy types of DE algorithm based method on the first example block.
Scaling factor (F)
0.1 0.2 0.3 0.4 0.5
Mean Std. Mean Std. Mean Std. Mean Std. Mean Std.
Strategy typeDE/best/1/expRecombination rate (RCr)0.1 14.07 2.26 14.97 1.56 15.60 1.48 16.13 1.43 16.73 1.340.2 13.33 1.60 12.57 1.72 14.37 1.61 14.83 1.53 15.27 1.080.3 14.57 1.98 13.50 1.61 13.17 1.18 14.37 1.59 15.10 1.450.4 16.03 2.03 14.20 1.79 13.47 1.55 14.87 2.36 15.30 1.390.5 16.17 2.10 14.83 2.42 13.37 1.54 13.87 1.87 15.90 1.920.6 17.23 2.37 15.50 2.33 15.53 2.19 14.17 1.60 15.87 1.76
DE/best/2/expRecombination rate (RCr)0.1 15.03 1.85 15.73 1.74 16.80 1.19 16.83 1.51 17.07 1.280.2 12.73 2.05 14.30 1.49 15.37 1.61 15.70 1.32 16.63 1.300.3 13.77 1.59 14.20 1.92 15.00 1.60 16.00 1.36 16.30 0.990.4 14.67 2.19 14.07 1.84 15.10 1.32 16.20 1.49 17.17 1.420.5 15.37 3.07 14.33 2.04 15.33 1.90 16.63 1.22 17.47 1.140.6 16.90 2.29 15.03 2.31 16.20 1.95 17.43 1.92 18.40 0.97
Table 4The effect of the scaling factors and recombination rates of DE algorithm basedmethod on the second example block.
Scaling factor (F)
0.1 0.2 0.3 0.4 0.5
Mean Std. Mean Std. Mean Std. Mean Std. Mean Std.
Recombination rate (RCr)0.1 13.57 3.68 13.40 2.51 14.77 1.89 15.80 2.70 16.50 3.010.2 13.00 3.81 12.63 2.53 12.63 3.06 14.33 3.26 13.80 2.760.3 15.87 5.52 13.90 3.75 12.07 3.60 13.23 2.85 13.40 2.250.4 16.47 3.81 16.10 4.61 13.33 2.76 13.90 3.81 14.77 2.790.5 19.07 5.82 15.73 3.15 14.40 4.18 14.53 5.81 15.00 3.05
Table 5The effect of the hypermutation and clonal rates of CSA based method on the firstexample block.
Hypermutation rate (HMr)
0.02 0.025 0.03 0.035 0.04
Mean Std Mean Std Mean Std Mean Std Mean Std
Clonal rate (Clr)0.1 10.13 1.01 8.87 0.68 8.90 0.99 8.57 0.86 8.80 0.850.2 9.20 1.00 7.67 0.96 7.43 0.86 7.50 0.73 7.67 0.660.3 8.80 1.13 7.83 0.83 7.67 0.76 7.33 0.71 6.97 0.720.4 8.63 0.89 7.60 0.72 7.23 0.68 7.10 0.66 7.13 0.780.5 8.30 1.06 7.23 0.77 6.97 0.85 6.93 0.69 6.53 0.68
Table 6The effect of the hypermutation and clonal rates of CSA based method on the secondexample block.
Hypermutation rate
0.02 0.025 0.03 0.035 0.04
Mean Std Mean Std Mean Std Mean Std Mean Std
Clonal rate (Clr)0.1 7.67 0.84 6.87 0.68 6.60 0.86 6.73 0.83 6.70 0.600.2 7.00 0.98 5.97 0.76 5.73 0.74 5.83 0.65 5.70 0.540.3 7.07 0.74 6.00 0.74 5.53 0.51 5.37 0.56 5.53 0.510.4 6.50 0.78 5.63 0.67 5.47 0.57 5.43 0.57 5.23 0.430.5 6.83 0.59 5.73 0.52 5.23 0.43 5.27 0.45 5.17 0.38
V. Aslantas et al. / Optics Communications 282 (2009) 2806–2817 2813
is chosen as 80. The best performance of CSA is derived whileHpr = 0.04 and Clr = 0.5.
To analyze the effect of the control parameters of PSO algo-rithm, the simulations were carried out by embedding the water-mark in Fig. 3 into the image in Fig. 1 using different accelerationcoefficients (c1 and c2) and inertia weights (Iwmax). Then, the meanand standard deviation of fitness values obtained for each 30 runsare given in Table 7. In this table, the number of maximum itera-tion and particles are chosen as 100 and 80, respectively and Iwmin
is chosen as 0.1. The best solution is seen for c1 = c2 = 1.6 andIwmax = 0.9.
To analyze the effect of the control parameters of PSO algorithmon a different image and watermark block, the simulations werecarried out by embedding the watermark in Fig. 18 into the imagein Fig. 19. Their results are shown in Table 8, where population sizeand Iwmin are chosen as 80 and 0.1, respectively. The best perfor-mance of PSO algorithm is derived while c1 = c2 = 1.8 andIwmax = 0.7.
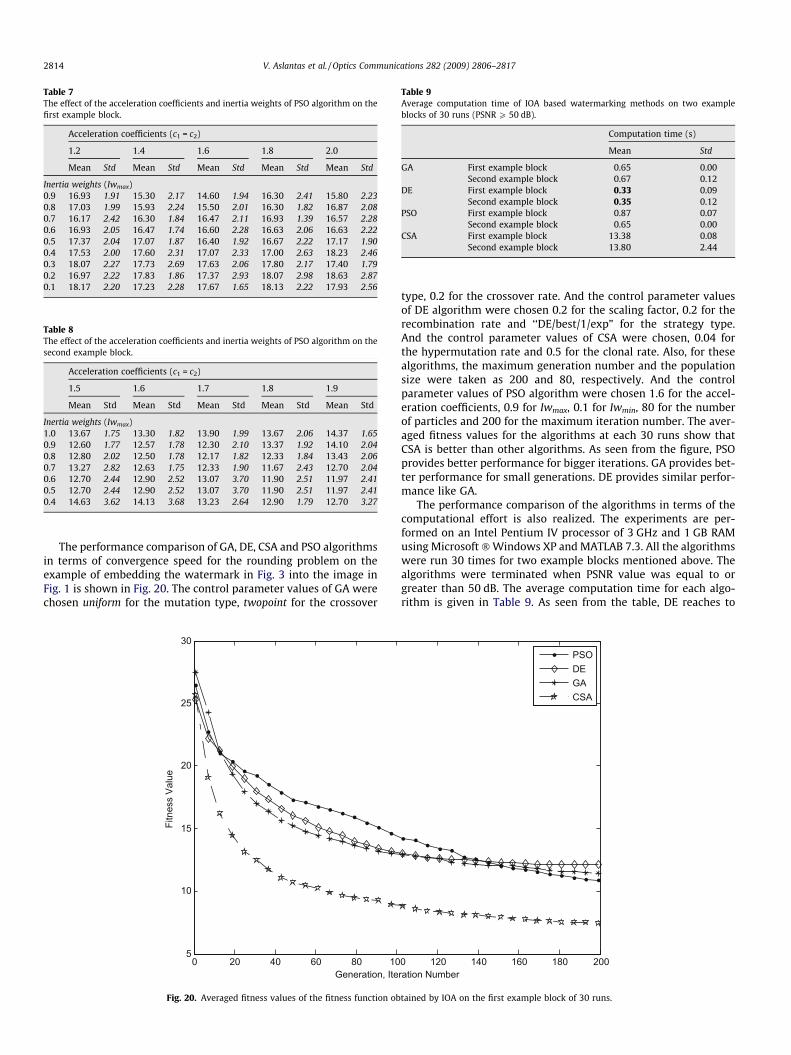
Table 7The effect of the acceleration coefficients and inertia weights of PSO algorithm on thefirst example block.
Acceleration coefficients (c1 = c2)
1.2 1.4 1.6 1.8 2.0
Mean Std Mean Std Mean Std Mean Std Mean Std
Inertia weights (Iwmax)0.9 16.93 1.91 15.30 2.17 14.60 1.94 16.30 2.41 15.80 2.230.8 17.03 1.99 15.93 2.24 15.50 2.01 16.30 1.82 16.87 2.080.7 16.17 2.42 16.30 1.84 16.47 2.11 16.93 1.39 16.57 2.280.6 16.93 2.05 16.47 1.74 16.60 2.28 16.63 2.06 16.63 2.220.5 17.37 2.04 17.07 1.87 16.40 1.92 16.67 2.22 17.17 1.900.4 17.53 2.00 17.60 2.31 17.07 2.33 17.00 2.63 18.23 2.460.3 18.07 2.27 17.73 2.69 17.63 2.06 17.80 2.17 17.40 1.790.2 16.97 2.22 17.83 1.86 17.37 2.93 18.07 2.98 18.63 2.870.1 18.17 2.20 17.23 2.28 17.67 1.65 18.13 2.22 17.93 2.56
Table 8The effect of the acceleration coefficients and inertia weights of PSO algorithm on thesecond example block.
Acceleration coefficients (c1 = c2)
1.5 1.6 1.7 1.8 1.9
Mean Std Mean Std Mean Std Mean Std Mean Std
Inertia weights (Iwmax)1.0 13.67 1.75 13.30 1.82 13.90 1.99 13.67 2.06 14.37 1.650.9 12.60 1.77 12.57 1.78 12.30 2.10 13.37 1.92 14.10 2.040.8 12.80 2.02 12.50 1.78 12.17 1.82 12.33 1.84 13.43 2.060.7 13.27 2.82 12.63 1.75 12.33 1.90 11.67 2.43 12.70 2.040.6 12.70 2.44 12.90 2.52 13.07 3.70 11.90 2.51 11.97 2.410.5 12.70 2.44 12.90 2.52 13.07 3.70 11.90 2.51 11.97 2.410.4 14.63 3.62 14.13 3.68 13.23 2.64 12.90 1.79 12.70 3.27
Table 9Average computation time of IOA based watermarking methods on two exampleblocks of 30 runs (PSNR P 50 dB).
Computation time (s)
Mean Std
GA First example block 0.65 0.00Second example block 0.67 0.12
DE First example block 0.33 0.09Second example block 0.35 0.12
PSO First example block 0.87 0.07Second example block 0.65 0.00
CSA First example block 13.38 0.08Second example block 13.80 2.44
2814 V. Aslantas et al. / Optics Communications 282 (2009) 2806–2817
The performance comparison of GA, DE, CSA and PSO algorithmsin terms of convergence speed for the rounding problem on theexample of embedding the watermark in Fig. 3 into the image inFig. 1 is shown in Fig. 20. The control parameter values of GA werechosen uniform for the mutation type, twopoint for the crossover
0 20 40 60 80 105
10
15
20
25
30
Generation, Ite
Fitn
ess
Valu
e
Fig. 20. Averaged fitness values of the fitness function ob
type, 0.2 for the crossover rate. And the control parameter valuesof DE algorithm were chosen 0.2 for the scaling factor, 0.2 for therecombination rate and ‘‘DE/best/1/exp” for the strategy type.And the control parameter values of CSA were chosen, 0.04 forthe hypermutation rate and 0.5 for the clonal rate. Also, for thesealgorithms, the maximum generation number and the populationsize were taken as 200 and 80, respectively. And the controlparameter values of PSO algorithm were chosen 1.6 for the accel-eration coefficients, 0.9 for Iwmax, 0.1 for Iwmin, 80 for the numberof particles and 200 for the maximum iteration number. The aver-aged fitness values for the algorithms at each 30 runs show thatCSA is better than other algorithms. As seen from the figure, PSOprovides better performance for bigger iterations. GA provides bet-ter performance for small generations. DE provides similar perfor-mance like GA.
The performance comparison of the algorithms in terms of thecomputational effort is also realized. The experiments are per-formed on an Intel Pentium IV processor of 3 GHz and 1 GB RAMusing Microsoft � Windows XP and MATLAB 7.3. All the algorithmswere run 30 times for two example blocks mentioned above. Thealgorithms were terminated when PSNR value was equal to orgreater than 50 dB. The average computation time for each algo-rithm is given in Table 9. As seen from the table, DE reaches to
0 120 140 160 180 200ration Number
PSODEGACSA
tained by IOA on the first example block of 30 runs.
V. Aslantas et al. / Optics Communications 282 (2009) 2806–2817 2815
the desired PSNR value more quickly than other algorithms. In fact,GA, DE and PSO appear to have similar performance. The computa-tion time for CSA is very high compared to the other algorithms.The higher computational time for CSA is due to its computationalcomplexity. If further improvement in PSNR is desired, this can be
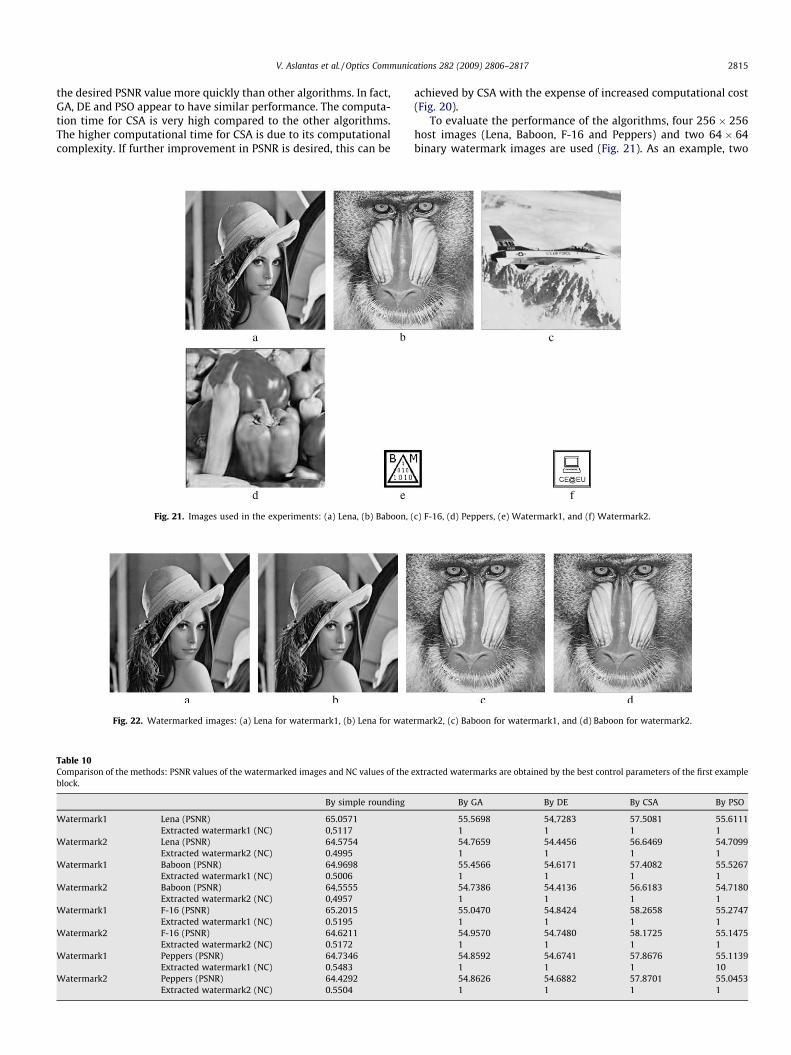
Fig. 21. Images used in the experiments: (a) Lena, (b) Baboon, (
Fig. 22. Watermarked images: (a) Lena for watermark1, (b) Lena for wate
Table 10Comparison of the methods: PSNR values of the watermarked images and NC values of theblock.
By simple rounding
Watermark1 Lena (PSNR) 65.0571Extracted watermark1 (NC) 0,5117
Watermark2 Lena (PSNR) 64.5754Extracted watermark2 (NC) 0.4995
Watermark1 Baboon (PSNR) 64.9698Extracted watermark1 (NC) 0.5006
Watermark2 Baboon (PSNR) 64,5555Extracted watermark2 (NC) 0,4957
Watermark1 F-16 (PSNR) 65.2015Extracted watermark1 (NC) 0.5195
Watermark2 F-16 (PSNR) 64.6211Extracted watermark2 (NC) 0.5172
Watermark1 Peppers (PSNR) 64.7346Extracted watermark1 (NC) 0.5483
Watermark2 Peppers (PSNR) 64.4292Extracted watermark2 (NC) 0.5504
achieved by CSA with the expense of increased computational cost(Fig. 20).
To evaluate the performance of the algorithms, four 256 � 256host images (Lena, Baboon, F-16 and Peppers) and two 64 � 64binary watermark images are used (Fig. 21). As an example, two
c) F-16, (d) Peppers, (e) Watermark1, and (f) Watermark2.
rmark2, (c) Baboon for watermark1, and (d) Baboon for watermark2.
extracted watermarks are obtained by the best control parameters of the first example
By GA By DE By CSA By PSO
55.5698 54,7283 57.5081 55.61111 1 1 154.7659 54.4456 56.6469 54.70991 1 1 155.4566 54.6171 57.4082 55.52671 1 1 154.7386 54.4136 56.6183 54.71801 1 1 155.0470 54.8424 58.2658 55.27471 1 1 154.9570 54.7480 58.1725 55.14751 1 1 154.8592 54.6741 57.8676 55.11391 1 1 1054.8626 54.6882 57.8701 55.04531 1 1 1
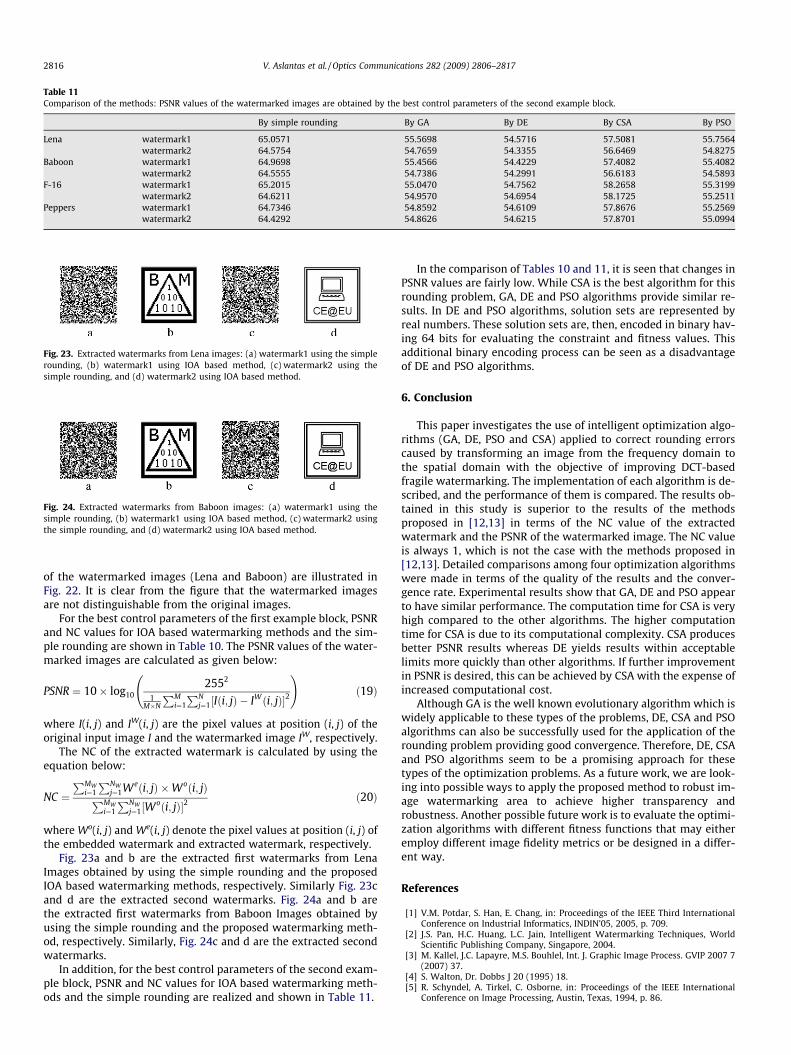
Fig. 23. Extracted watermarks from Lena images: (a) watermark1 using the simplerounding, (b) watermark1 using IOA based method, (c) watermark2 using thesimple rounding, and (d) watermark2 using IOA based method.
Fig. 24. Extracted watermarks from Baboon images: (a) watermark1 using thesimple rounding, (b) watermark1 using IOA based method, (c) watermark2 usingthe simple rounding, and (d) watermark2 using IOA based method.
Table 11Comparison of the methods: PSNR values of the watermarked images are obtained by the best control parameters of the second example block.
By simple rounding By GA By DE By CSA By PSO
Lena watermark1 65.0571 55.5698 54.5716 57.5081 55.7564watermark2 64.5754 54.7659 54.3355 56.6469 54.8275
Baboon watermark1 64.9698 55.4566 54.4229 57.4082 55.4082watermark2 64.5555 54.7386 54.2991 56.6183 54.5893
F-16 watermark1 65.2015 55.0470 54.7562 58.2658 55.3199watermark2 64.6211 54.9570 54.6954 58.1725 55.2511
Peppers watermark1 64.7346 54.8592 54.6109 57.8676 55.2569watermark2 64.4292 54.8626 54.6215 57.8701 55.0994
2816 V. Aslantas et al. / Optics Communications 282 (2009) 2806–2817
of the watermarked images (Lena and Baboon) are illustrated inFig. 22. It is clear from the figure that the watermarked imagesare not distinguishable from the original images.
For the best control parameters of the first example block, PSNRand NC values for IOA based watermarking methods and the sim-ple rounding are shown in Table 10. The PSNR values of the water-marked images are calculated as given below:
PSNR ¼ 10� log102552
1M�N
PMi¼1
PNj¼1½Iði; jÞ � IWði; jÞ�2
!ð19Þ
where I(i, j) and IW(i, j) are the pixel values at position (i, j) of theoriginal input image I and the watermarked image IW, respectively.
The NC of the extracted watermark is calculated by using theequation below:
NC ¼PMW
i¼1
PNWj¼1Weði; jÞ �Woði; jÞPMW
i¼1
PNWj¼1½W
oði; jÞ�2ð20Þ
where Wo(i, j) and We(i, j) denote the pixel values at position (i, j) ofthe embedded watermark and extracted watermark, respectively.
Fig. 23a and b are the extracted first watermarks from LenaImages obtained by using the simple rounding and the proposedIOA based watermarking methods, respectively. Similarly Fig. 23cand d are the extracted second watermarks. Fig. 24a and b arethe extracted first watermarks from Baboon Images obtained byusing the simple rounding and the proposed watermarking meth-od, respectively. Similarly, Fig. 24c and d are the extracted secondwatermarks.
In addition, for the best control parameters of the second exam-ple block, PSNR and NC values for IOA based watermarking meth-ods and the simple rounding are realized and shown in Table 11.
In the comparison of Tables 10 and 11, it is seen that changes inPSNR values are fairly low. While CSA is the best algorithm for thisrounding problem, GA, DE and PSO algorithms provide similar re-sults. In DE and PSO algorithms, solution sets are represented byreal numbers. These solution sets are, then, encoded in binary hav-ing 64 bits for evaluating the constraint and fitness values. Thisadditional binary encoding process can be seen as a disadvantageof DE and PSO algorithms.
6. Conclusion
This paper investigates the use of intelligent optimization algo-rithms (GA, DE, PSO and CSA) applied to correct rounding errorscaused by transforming an image from the frequency domain tothe spatial domain with the objective of improving DCT-basedfragile watermarking. The implementation of each algorithm is de-scribed, and the performance of them is compared. The results ob-tained in this study is superior to the results of the methodsproposed in [12,13] in terms of the NC value of the extractedwatermark and the PSNR of the watermarked image. The NC valueis always 1, which is not the case with the methods proposed in[12,13]. Detailed comparisons among four optimization algorithmswere made in terms of the quality of the results and the conver-gence rate. Experimental results show that GA, DE and PSO appearto have similar performance. The computation time for CSA is veryhigh compared to the other algorithms. The higher computationtime for CSA is due to its computational complexity. CSA producesbetter PSNR results whereas DE yields results within acceptablelimits more quickly than other algorithms. If further improvementin PSNR is desired, this can be achieved by CSA with the expense ofincreased computational cost.
Although GA is the well known evolutionary algorithm which iswidely applicable to these types of the problems, DE, CSA and PSOalgorithms can also be successfully used for the application of therounding problem providing good convergence. Therefore, DE, CSAand PSO algorithms seem to be a promising approach for thesetypes of the optimization problems. As a future work, we are look-ing into possible ways to apply the proposed method to robust im-age watermarking area to achieve higher transparency androbustness. Another possible future work is to evaluate the optimi-zation algorithms with different fitness functions that may eitheremploy different image fidelity metrics or be designed in a differ-ent way.
References
[1] V.M. Potdar, S. Han, E. Chang, in: Proceedings of the IEEE Third InternationalConference on Industrial Informatics, INDIN’05, 2005, p. 709.
[2] J.S. Pan, H.C. Huang, L.C. Jain, Intelligent Watermarking Techniques, WorldScientific Publishing Company, Singapore, 2004.
[3] M. Kallel, J.C. Lapayre, M.S. Bouhlel, Int. J. Graphic Image Process. GVIP 2007 7(2007) 37.
[4] S. Walton, Dr. Dobbs J 20 (1995) 18.[5] R. Schyndel, A. Tirkel, C. Osborne, in: Proceedings of the IEEE International
Conference on Image Processing, Austin, Texas, 1994, p. 86.
V. Aslantas et al. / Optics Communications 282 (2009) 2806–2817 2817
[6] J. Fridrich, M. Goljan, A. Baldoza, in: Proceedings of the IEEE InternationalConference on Image Processing, Vancouver, Canada, 2000, p. 446.
[7] E.T. Lin, E.J. Delp, in: Proceedings of the ACM Multimedia and SecurityWorkshop, Orlando, 1999, p. 25.
[8] R.S. Alomari, A. Al-Jaber, Int. J. Comput. Inform. Sci. 2 (2005) 27.[9] C.T. Li, in: IEEE Proceedings of the Vision, Image, and Signal Processing, vol.
151, 2004, p. 460.[10] V. Aslantas, S. Ozer, S. Ozturk, Lect. Note Comput. Sci. 4628 (2007) 358.[11] V. Aslantas, S. Ozer, S. Ozturk, in: IEEE International Conference on Multimedia
and Expo, Hannover, Germany, 2008, p. 269.[12] F.Y. Shih, Y.T. Wu, J. Vis. Commun. Image Representation 16 (2005) 115.[13] C.C. Chang, Y.C. Chang, J.J. Shen, in: International Conference on Intelligent
Information Hiding and Multimedia Signal Processing, IIH-MSP ’06, 2006, p.453.
[14] C.T. Li, H. Si, J. Electron. Imaging 16 (2007). 013009-1-9.[15] D.A. Winne, H.D. Knowles, D.R. Bull, C.N. Canagarajah, in: Proceeding of the
SPIE, San Jose, 2002, p. 349.[16] E. Ganic, A. Eskicioglu, in: Proceedings of the ACM Multimedia and Security
Workshop, Magdeburg, Germany, 2004, p. 166.[17] V. Aslantas, Int. J. Electron. Commun. (AEU) 62 (2008) 386.[18] S.C. Chu, H.C. Huang, Y. Shi, S.Y. Wu, C.H. Shieh, Circuits, Systems, Signal
Process. 27 (2) (2008) 171.[19] S.P. Maity, M.K. Kundu, Soft Comput. – A Fus. Found. Methodol. Appl. 13 (4)
(2009) 361.[20] H. Huang, Y. Chen, Soft Comput. – A Fus. Found. Methodol. Appl. 13 (4) (2009)
383.[21] H. Huang, C. Chu, Soft Comput. – A Fus. Found. Methodol. Appl. 13 (4) (2009)
333.[22] V. Aslantas, in: International Conference on Information Sciences, Signal
Processing and its Applications, ISSPA2007, Sharjah, UAE, 2007, p. 1.[23] F. Wang, C.L. Jain, J. Pan, J. Network Comput. Appl. 30 (1) (2007) 4.[24] H. Tsai, W. Wang, Imaging Sci. J. 54 (2) (2006) 65.[25] P. Kumsawat, K. Attakitmongcol, A. Srikaew, J. IEEE Trans. Signal Process. 53
(2005) 4707.[26] H.H. Tsai, W.Y. Wang, X.X. Yu, H.L. Won, Nonlinear Signal Image Process.
(2005) 5.
[27] C.S. Shieh, H.C. Huang, F.H. Wang, J.S. Pan, J. Pattern Recognition Soc. 37 (2004)555.
[28] A. Khan, A.M. Mirza, J. Inform. Fus. 8 (2007) 354.[29] H. Harrak, T.D. Hien, Y. Nagata, Z. Nakao, Adv. Soft Comput. 35 (2006) 1615.[30] V. Aslantas, A.L. Dogan, S. Ozturk, in: IEEE International Conference on
Multimedia and Expo, Hannover, Germany, 2008, p. 241.[31] Z. Wang, X. Sun, D. Zhang, Lect. Notes Comput. Sci. 4688 (2007) 307.[32] V. Aslantas, Opt. Commun. 282 (2009) 769.[33] X.B. Wen, H. Zhang, X.Q. Xu, J.J. Quan, Soft Comput. – A Fus. Found. Methodol.
Appl. 13 (4) (2009) 355.[34] F. Zhang, H. Zhang, Neurocomput. J. 67 (2005) 345.[35] Y.C. Fan, W.L. Mao, H.W. Tsao, in: International Conference on Consumer
Electronics, Los Angles, USA, 2003, p. 210.[36] P. Yu, H. Tsai, J. Lin, Signal Process. 81 (3) (2001) 663.[37] J.H. Holland, Adaptation in Natural and Artificial Systems, University of
Michigan Press, 1975.[38] J.H. Holland, Adaptation in Natural and Artificial System: An Introductory
Analysis with Applications to Biology, Control and Artificial Intelligence, MITPress, Cambridge, MA, 1992.
[39] D. Karaboga, S. Okdem, Turkish J. Electric. Comput. Sci. 12 (2000) 53 (ISSN1300-0632).
[40] H.A. Abbass, R. Sarker, C. Newton, IEEE CEC’2001, Seoul, Korea, 2001, p. 971.[41] K. Price, R. Storn, 2004, <http://www.icsi.berkeley.edu/~storn/code.html>.[42] A. Vasan, K.S. Raju, in: Proceedings of the International Conference on
Hydraulic Engineering: (Research and Practice. 2004), 2004, p. 26.[43] F.M. Burnet, The Clonal Selection Theory of Acquired Immunity, Cambridge
University Press, Cambridge, UK, 1959.[44] L.N. De Castro, F.J. Von Zuben, Special Issue Artif. Immune Syst. 6 (3) (2001)
239.[45] J. Kennedy, R.C. Eberhart, in: Proceedings of the IEEE International Conference
on Neural Networks, Australia, 1995, p. 1942.[46] A. Banks, J. Vincent, C. Anyakoha, J. Nat. Comput. 7 (2008) 109.[47] R.C. Eberhart, Y. Shi, Lect. Notes Comput. Sci. 1447 (1998) 611.[48] D.J. Krusienski, W.K. Jenkins, IEEE Circ. Syst. Mag. First Quarter (2005) 8.[49] Y.H. Kim, H. Song, H.J. Kang, Lect. Note Artif. Intell. 3682 (2005) 560.[50] C.T. Hsu, J.L. Wu, IEEE Trans. Image Process. 8 (1999) 58.