Improving the Odds: Strategies for Superior Value Creation ...
54
Improving the Odds Strategies for Superior Value Creation THE VALUE CREATORS REPORT R Improving the Odds Strategies for Superior Value Creation T V C R R
-
Upload
khangminh22 -
Category
Documents
-
view
5 -
download
0
Transcript of Improving the Odds: Strategies for Superior Value Creation ...
Improvingthe Odds
Strategies for Superior Value Creation
THE VALUE CREATORS REPORT
Galley 18/18/12
R
Improving the OddsStrategies for Superior Value Creation
T V C R
R

The Boston Consulting Group (BCG) is a global management consulting fi rm and the world’s leading advisor on business strategy. We partner with clients from the private, public, and not-for-profi t sectors in all regions to identify their highest-value opportunities, address their most critical challenges, and transform their enterprises. Our customized approach combines deep in sight into the dynamics of companies and markets with close collaboration at all levels of the client organization. This ensures that our clients achieve sustainable compet itive advantage, build more capable organizations, and secure lasting results. Founded in 1963, BCG is a private company with 77 offi ces in 42 countries. For more information, please visit bcg.com.

T V C R
IMPROVING THE ODDS
STRATEGIES FOR SUPERIOR VALUE CREATION
GERRY HANSELL
JEFF KOTZEN
ERIC OLSEN
FRANK PLASCHKE
DANIEL STELTER
HADY FARAG
S | T B C G

| I O
CONTENTS
PREFACE
TIME TO CHART A NEW COURSEA Fundamentally Diff erent EnvironmentSuperior Returns with Modest GrowthThree Pathways to Value-Creating GrowthThe Importance of a Company’s Starting Position
DO YOU KNOW YOUR VALUE PATTERN?The Idea of a Value PatternHow a Hard-Assets Company Created ValueLessons from an Industrial High-Value Brand
CHURCH & DWIGHT: KEEPING A FOOT ON THE GASA Healthy Business with Hidden Challenges“The Gas in the Engine”The Elements of a Comprehensive StrategyA New Infl ection Point?
APPENDIX: THE 2012 VALUE CREATORS RANKINGSGlobal RankingsIndustry Rankings
FOR FURTHER READING
NOTE TO THE READER
T B C G |
I O: S for Superior Value Creation is the fourteenth annual report in the Value Creators series published by The
Boston Consulting Group. Each year, we off er commentary on trends in the global economy and world capital markets, share BCG’s latest research and thinking on value creation, describe the experiences of our clients who have materially improved their value-creation performance, and publish detailed empirical rankings of the performance of the world’s top value creators.
This year’s report offers four different perspectives on successful value cre-ation. We begin by exploring how companies can chart a course toward supe-rior value creation in today’s low-growth economic environment. Next, we introduce some new BCG research on the theme of value patterns, distinc-tive company starting positions that cut across industry boundaries and shape the range and types of strategic moves most likely to create value. We follow with a detailed case study of how one BCG client, the consumer-pack-aged-goods company Church & Dwight, has delivered superior shareholder value—with an emphasis on the nuts and bolts of making it happen. Finally, we conclude with our annual rankings of the top ten value creators world-wide and in 21 industries for the five-year period from 2007 through 2011.
PREFACE
| I O
TIME TO CHART A NEW COURSE
L an earthquake, the consequences of the 2008 fi nancial
crisis continue to ripple through the world economy and global equity markets. As a result, companies are being forced to ques-tion their traditional assumptions and reconsider their priorities for value creation. This year’s Value Creators report is designed to help companies chart their course in a value creation environment that is, in many respects, fundamentally diff erent from what they have experienced in past decades.
A Fundamentally Different EnvironmentIn recent Value Creators reports, we have ar-gued that the global economy faces an ex-tended period of below-average growth.1 The outlook for growth has, if anything, become more pessimistic during the past year. The ongoing fiscal crisis in the euro zone has brought at least some European economies to the brink of renewed recession. A June 2012 Economist survey of economic forecasters esti-mates that euro zone GDP will actually con-tract by 0.4 percent in 2012.2
To be sure, growth rates in emerging markets continue to outpace significantly those in the developed world and will continue to do so. And yet signs are proliferating that these growth rates are slowing in many leading emerging markets. For example, Brazil’s GDP
grew a mere 0.8 percent in the first quarter of 2012, its slowest pace in two years.3 India’s GDP grew 5.3 percent in the same period, but that was the country’s slowest rate of growth in the past nine years. In May 2012, China’s official Purchasing Managers Index fell to 50.4, down from 53.3 in April. (Anything be-low 50 indicates a contraction.)4
The outlook for growth has become more pessimistic during the past year.
One bright spot in the global economy, until recently at least, has been the U.S., which witnessed modest but genuine improvements in growth in the early part of 2012. More re-cently, however, even this modest growth has appeared to be slowing, in part due to the fallout of the euro crisis, causing the Interna-tional Monetary Fund to lower its estimates of U.S. growth to 2 percent in 2012 and to 2.25 percent in 2013.5 As of this writing, it is not entirely clear whether the U.S. recovery will be able to sustain itself—or what the impact on the economy of the November presidential election will be.
What has been the impact of these trends on global equity markets? For one thing, they have
T B C G |
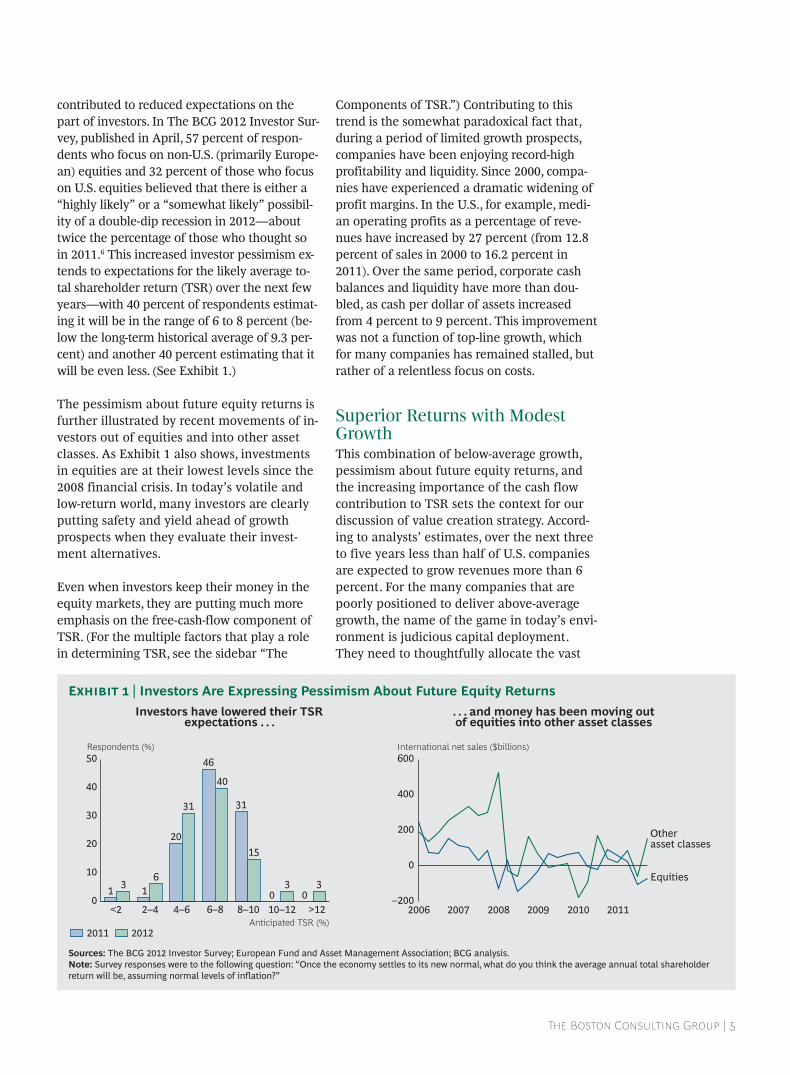
contributed to reduced expectations on the part of investors. In The BCG 2012 Investor Sur-vey, published in April, 57 percent of respon-dents who focus on non-U.S. (primarily Europe-an) equities and 32 percent of those who focus on U.S. equities believed that there is either a “highly likely” or a “somewhat likely” possibil-ity of a double-dip recession in 2012—about twice the percentage of those who thought so in 2011.6 This increased investor pessimism ex-tends to expectations for the likely average to-tal shareholder return (TSR) over the next few years—with 40 percent of respondents estimat-ing it will be in the range of 6 to 8 percent (be-low the long-term historical average of 9.3 per-cent) and another 40 percent estimating that it will be even less. (See Exhibit 1.)
The pessimism about future equity returns is further illustrated by recent movements of in-vestors out of equities and into other asset classes. As Exhibit 1 also shows, investments in equities are at their lowest levels since the 2008 financial crisis. In today’s volatile and low-return world, many investors are clearly putting safety and yield ahead of growth prospects when they evaluate their invest-ment alternatives.
Even when investors keep their money in the equity markets, they are putting much more emphasis on the free-cash-flow component of TSR. (For the multiple factors that play a role in determining TSR, see the sidebar “The
Components of TSR.”) Contributing to this trend is the somewhat paradoxical fact that, during a period of limited growth prospects, companies have been enjoying record-high profitability and liquidity. Since 2000, compa-nies have experienced a dramatic widening of profit margins. In the U.S., for example, medi-an operating profits as a percentage of reve-nues have increased by 27 percent (from 12.8 percent of sales in 2000 to 16.2 percent in 2011). Over the same period, corporate cash balances and liquidity have more than dou-bled, as cash per dollar of assets increased from 4 percent to 9 percent. This improvement was not a function of top-line growth, which for many companies has remained stalled, but rather of a relentless focus on costs.
Superior Returns with Modest GrowthThis combination of below-average growth, pessimism about future equity returns, and the increasing importance of the cash flow contribution to TSR sets the context for our discussion of value creation strategy. Accord-ing to analysts’ estimates, over the next three to five years less than half of U.S. companies are expected to grow revenues more than 6 percent. For the many companies that are poorly positioned to deliver above-average growth, the name of the game in today’s envi-ronment is judicious capital deployment. They need to thoughtfully allocate the vast
Respondents (%)50
40
30
20
10
0>12
30
10–12
30
8–10
15
31
6–8
40
46
4–6
31
20
2–4
61
<2
31
20122011
. . . and money has been moving outof equities into other asset classes
Investors have lowered their TSRexpectations . . .
400
International net sales ($billions)600
Otherasset classes
200
0
–200
Equities
20112008 20102007 20092006Anticipated TSR (%)
Sources: The BCG 2012 Investor Survey; European Fund and Asset Management Association; BCG analysis.Note: Survey responses were to the following question: “Once the economy settles to its new normal, what do you think the average annual total shareholder return will be, assuming normal levels of inflation?”
E | Investors Are Expressing Pessimism About Future Equity Returns

| I O
quantities of cash that they generate and have accumulated on their balance sheets. They should avoid unrealistic growth targets and the temptation to use excess capital to purchase one-time or low-quality revenue growth. Rather, they should focus on keeping their margins strong, take advantage of cur-rently strong free cash flows to increase cash payout, and skew the payout mix toward divi-dends, because dividends tend to put a floor under a company’s stock price in a way that share repurchases do not.
There are signs that dividends are indeed be-coming a more important component of com-
panies’ financial policies. According to one estimate, 429 nonfinancial companies in the U.S. increased their common dividend in fis-cal 2011 by a market-cap-weighted average of 21.5 percent.7 And investors have rewarded them: valuation premiums for healthy compa-nies with a meaningful dividend have ex-panded in the neighborhood of 15 to 20 per-cent over the past year compared with their non-dividend-paying peers. For companies with excess distributable cash, dividends should continue to remain an attractive path to supporting valuations and creating value for owners over time.8 Despite the recent in-creases, dividend payout ratios among the
Total shareholder return is the product of multiple factors. Regular readers of the Value Creators report should be familiar with BCG’s model for quantifying the relative contribution of the various sources of TSR. (See the exhibit below.) The model uses the combination of revenue (that is, sales) growth and change in margins as an indicator of a company’s improvement in fundamental value. It then uses the change in the company’s valuation multiple to determine the impact of investor expecta-tions on TSR. Together, these two factors determine the change in a company’s market capitalization. Finally, the model also tracks the distribution of free cash fl ow to investors and debt holders in the form of dividends, share repurchases, or repay-
ments of debt in order to determine the contribution of free-cash-fl ow payouts to a company’s TSR.
The important thing to remember is that these factors all interact—sometimes in unexpected ways. A company may grow its earnings per share (EPS) through an acquisition and yet not create any TSR, because the new acquisition has the eff ect of eroding the company’s gross margins. And some forms of cash contribution (for example, dividends) have a more positive impact on a company’s valuation multiple than others (for example, share buybacks). Because of these interactions, we recom-mend that companies take a holistic approach to value creation strategy.
THE COMPONENTS OF TSR
Capital gain
Revenue growth
Margin change
TSR
Valuation multiple change
Dividend yield
Cash flowcontribution
Net debt change
Profit growth
Share change
x
x
ƒ
TSR Is the Product of Mutiple Factors
Source: BCG analysis.Note: “Share change” refers to the change in the number of shares outstanding, not to the change in share price.

T B C G |
S&P 1500 companies in 2011 were still 17 percentage points lower than they were as re-cently as 20 years ago. And nearly half of the S&P 1500 companies did not pay any divi-dends at all. (See Exhibit 2.)
A more yield-oriented strategy should help companies beat the TSR market average—keeping in mind that that average will likely be lower than in the precrisis environment and that in a world in which capital apprecia-tion is modest, yield will become a relatively more important contributor to overall TSR. But will that strategy generate enough TSR to enable companies to earn a place in our Val-ue Creators rankings? The evidence suggests that, at least in some cases, the answer is yes.
In recent Value Creators reports, we have iden-tified a set of companies we call cash machines that combine superior TSR with relatively modest growth.9 One can find a number of these companies in this year’s top-ten rankings. Examples include British American Tobacco (number five in the consumer nondurables top ten), McDonald’s (number nine in the retail top ten), and IBM (number eight in the technology top ten). And even in faster-growing develop-ing-world markets, some companies have deliv-ered superior TSR, in part, through above-aver-age cash payouts. Examples include Kia Motors (number two in the automotive OEM top ten); Kumho Petrochemical (number five in the chemicals top ten), and Industrias Peñoles (number two in the mining top ten).
These top performers tend to enjoy stable competitive advantages, high margins, and strong free cash flows. What’s more, they con-tinually reinvest in their core business to maintain those advantages and to sustain—or even improve—their already high margins. When they do so, they are able to deliver su-perior returns over an extended period of time, despite relatively modest growth.
Three Pathways to Value-Creating GrowthFor a select group of companies, however, it is still possible to create superior value through growth—even in today’s low-growth environ-ment. BCG recently scanned 1,500 companies globally to identify those that have been able to grow profitably and significantly since 2008 and have created superior TSR along the way.10 These successful growth stories fall into three distinct categories.
Some of these companies are what we call pure-play category innovators. They are rela-tively young and growing rapidly, and even those that have been around for a decade or more have not lost the growth culture and momentum of a successful startup. These companies have invented something new and are gaining share as they commercialize their innovations. Some examples in this year’s Value Creators rankings include the restau-rant chain Chipotle Mexican Grill (number two in the retail top ten) and the medical
Mean dividend-payout ratio (%)
Companies paying out dividendsMean dividend-payout ratio
Companies payingdividends (%)
80
60
40
20
0
50
40
30
20201220102008200620042002200019981996199419921990
Sources: Bloomberg; BCG analysis.Note: The sample is the S&P 1500.
E | Dividend Payouts Have Yet to Return to Earlier Levels
| I O
technology innovator Intuitive Surgical (num-ber one in the medical technology top ten). With such high-growth businesses, there is always a substantial risk of current growth fading rapidly if the initial innovation starts to run out of steam. But these businesses clearly illustrate the competitive power of breakthrough innovation to gain a profitable market position.
Other successful growth companies are global challengers—market leaders serving high-growth emerging markets. A dramatic exam-ple in this year’s Value Creators rankings is the dominance of companies from China, In-dia, South Korea, and Malaysia among the au-tomotive OEM top ten. (See the “Industry Rankings” in the Appendix: The 2012 Value Creators Rankings.) Such companies have been able to grow sustainably and profitably in part because they are well positioned to capture rapid end-demand growth in their markets. And they are growing not only be-cause they happen to be in high-growth mar-kets: they are growing and winning in the context of very competitive market dynamics.
Finally, the third—and perhaps most interest-ing—group of companies has been successful
despite not having much of a tailwind for growth. These companies do not necessarily serve high-growth end markets. Nonetheless, they have developed new growth platforms that have been big enough to contribute sig-nificantly to the growth of the enterprise as a whole. Some, for instance, have taken advan-tage of the postdownturn growth in more val-ue-conscious segments—for instance, the dis-count retail chain Dollar Tree (number four in the retail top ten) and store-brand over-the-counter drug maker Perrigo (number one in the pharmaceuticals top ten). And others have succeeded in leveraging changes in tech-nology, product design, and business model to deliver breakthrough innovations. The clas-sic examples are Amazon.com (number three in the retail top ten) and Apple (number two in the technology top ten).
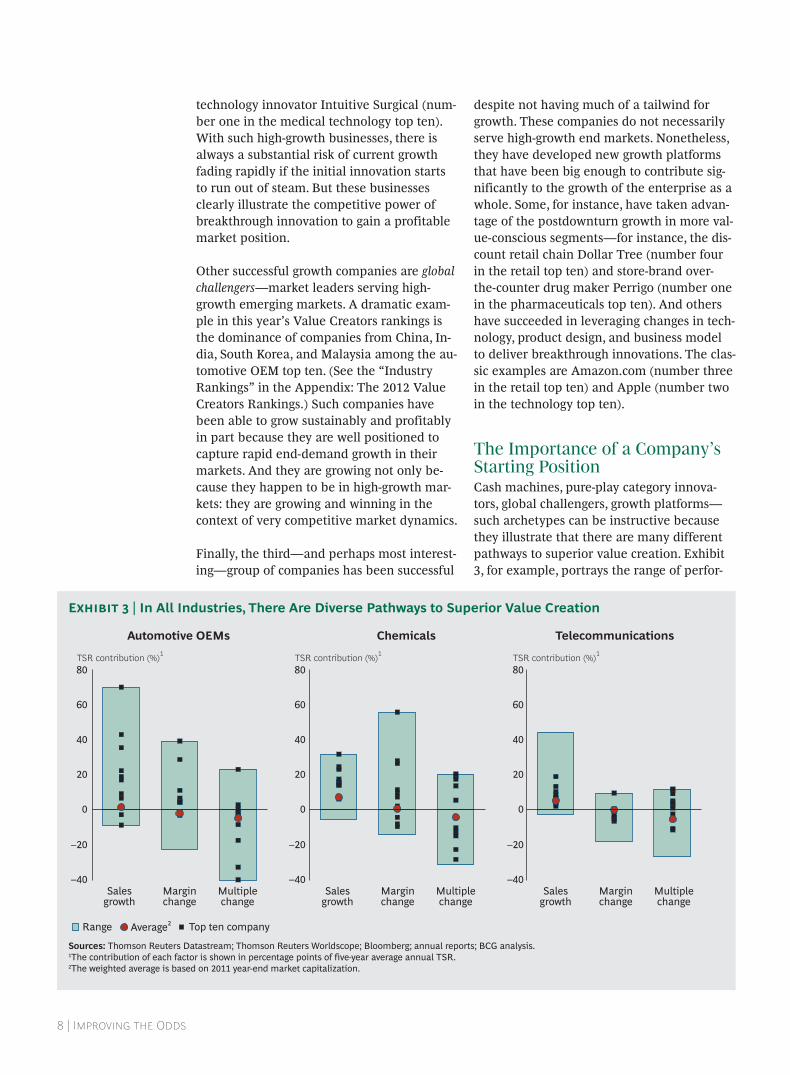
The Importance of a Company’s Starting PositionCash machines, pure-play category innova-tors, global challengers, growth platforms—such archetypes can be instructive because they illustrate that there are many different pathways to superior value creation. Exhibit 3, for example, portrays the range of perfor-
Automotive OEMs Chemicals Telecommunications
TSR contribution (%)1
80
60
40
20
0
–20
–40
TSR contribution (%)1
80
60
40
20
0
–20
–40
TSR contribution (%)1
80
60
40
20
0
–20
–40Multiplechange
Marginchange
Salesgrowth
Multiplechange
Marginchange
Salesgrowth
Multiplechange
Marginchange
Salesgrowth
Top ten companyAverage2Range
Sources: Thomson Reuters Datastream; Thomson Reuters Worldscope; Bloomberg; annual reports; BCG analysis.1The contribution of each factor is shown in percentage points of five-year average annual TSR.2The weighted average is based on 2011 year-end market capitalization.
E | In All Industries, There Are Diverse Pathways to Superior Value Creation

T B C G |
mance across three main dimensions of TSR—sales growth, margin change, and changes in valuation multiples—for three selected indus-tries in the Value Creators database: automo-tive original equipment manufacturers (OEMs), chemicals, and telecommunications. The black squares represent the performance, on each dimension, of the top ten TSR per-formers in each industry. The exhibit shows that the top performers span the full range of performance—some above average and some below average—when it comes to each con-tributor to TSR. Each company took a differ-ent path to its spot in our top-ten rankings.
But for senior executives, such models can also provoke frustration. After all, which value cre-ation strategy to pursue and whether a compa-ny will be able to pursue any successfully de-pend critically on the specifics of its situation. Put another way, the best path for any individ-ual company depends on that company’s start-ing point, as defined by the economics of its business and its current valuation in the equity markets. In the end, each company has to chart its own course and develop a value creation strategy that fits its starting position.
N1. See, for example, Threading the Needle: Value Creation in a Low-Growth Economy, The 2010 Value Creators Report, September 2010.2. See “Focus: A Bleak Outlook for Europe,” Economist, June 7, 2012.3. See “Brazil Loses Steam as World Slows,” Wall Street Journal, June 2, 2012.4. See “Asia Strains Under Euro Crisis,” Wall Street Journal, June 1, 2012.5. See “Europe’s Fade Becomes Drag on Sales for U.S. Companies,” New York Times, June 4, 2012; and “Concluding Statement of the 2012 Article IV Mission to The United States of America,” International Monetary Fund, July 3, 2012.6. See “Back to the Future: Investors Refocus on Yield,” BCG article, April 2012.7. See “Dividends Rising,” CFO magazine, April 2012.8. See “Expect No Let-Up in Dash for Equity Yield,” Financial Times, July 29, 2012.9. See Searching for Sustainability: Value Creation in an Era of Diminished Expectations, The 2009 Value Creators Report, October 2009; and “The Rise of the Cash Machine,” BCG article, February 2012.10. See Collateral Damage: Succeeding in Uncertain Times, BCG Focus, April 2012.

| I O
T successful strategy is whether it creates sustainable value over
time. The appropriate pathway and relevant priorities, however, will be diff erent for, say, a Google, a Gazprom, a Gilead, or a General Dynamics. How does a company’s senior team develop a value creation strategy that truly fi ts the company’s starting position and opportunity set?
The Idea of a Value PatternAlthough the details of each company’s situa-tion are unique, there are recurring common starting positions—combinations of economic priorities, tradeoffs, opportunities, and risks—in which different groups of companies find themselves. BCG has been exploring how to quantify these starting positions. In-depth dis-cussions with professional investors, detailed company vignettes, and a statistical clustering of about 2,700 global companies have led us to identify ten different value patterns—distinc-tive company starting positions that cut across industry boundaries and shape the range and types of strategic moves most likely to create value.1 (See the sidebar “BCG Research on Value Patterns.”)
Some of these value patterns are fairly intui-tive and easy to grasp. For example, distressed companies (roughly 4 percent of the compa-nies in our sample) have a specific and easy-to-recognize profile. They have high debt
levels and severe constraints on liquidity. They often face external headwinds that result in low or negative returns on capital and negative organic-growth rates. Investors, recognizing these companies’ high risk and poor reinvestment economics, value them at low multiples—typically, the market values the enterprise at a discount to its book capital.
Value patterns shape the strategic moves most likelyto create value.
At the other end of the spectrum, there is a healthy high-growth value pattern that most people recognize immediately. This pattern (seen in about 5 percent of the companies in our sample) captures the challenges faced by healthy and successful companies that are still relatively young and growing rapidly (such as the pure-play category innovators Chipotle Mexican Grill and Intuitive Surgi-cal). Their business is expected (and also priced by investors) to double sales several times over in the next five to ten years. Investors, seeing the strong prospects of these companies, value them at high multi-ples, often in the range of four to eight times enterprise book capital.
DO YOU KNOW YOUR VALUE PATTERN?

T B C G |
Since 2010, BCG’s Corporate Development practice has been conducting research on company value patterns. Our research has focused on the S&P 1200—a group of large, publicly traded, nonfi nancial U.S. corpora-tions—in the time period from 2002 through 2011.
We profi led each company’s starting position by measuring six dimensions of company performance that interviews with institutional investors had emphasized as being critical for defi ning diff erent invest-ment types.
A er testing many distinct input variables, we decided to focus on the following ten key metrics within those six critical dimensions:
Business model economics, • as refl ected in a company’s value added (measured by gross margin), capital intensity (measured by capital per dollar of sales), R&D intensity (measured by R&D expenditures as a percentage of sales), and operating-expenditure intensity (measured by operating expenditures as a percentage of sales)
Financial health, • as measured by return on tangible gross investment
Growth exposure, • as measured by analysts’ consensus estimates of a company’s forward-looking three- to fi ve-year revenue growth
Investor expectations and valuation, • as measured by a company’s enterprise price-to-book ratio and equity price-to-revenue ratio
Commercial risk, • as measured by a company’s 100-month median enter-prise-value volatility
Financial risk, • as measured by a com-pany’s ratio of net debt to enterprise market value
When we calculated return on investment (ROI) and capital intensity, we excluded cash balances from the capital base, because cash, which doesn’t earn any return, distorts a company’s profi tability. Since data coverage was not complete for all companies in all years, our fi nal sample consisted of between 850 and 900 compa-nies, depending on the year of analysis.
To sort the companies into groups with common starting positions, we used a statistical clustering tool. The tool uses algorithms to cluster companies so that both the similarities among companies in a given group and the diff erences between groups are maximized. We then tested the resulting groups for robustness (consisten-cy of group profi le over time) using data from 2002, 2007, 2009, and 2011 in inde-pendent clustering analyses. To eliminate survivor bias, the data sets included all S&P 1200 companies with complete data in each given year.
Ten consistent groups—or value pat-terns—emerged from this statistical clustering process. We used these ten group profi les to assign a global sample of 3,900 companies across 61 countries to each of the ten value patterns. Working across countries, we excluded the impact of currency infl ation on forward revenue growth rates by restating the growth in “real” terms.
In the course of our research, we experi-mented with other dimensions and variables to characterize a company’s profi le—for example, dividend payout, dividend yield, earnings predictability, earnings consistency, ROI volatility, beta, and company size. We found that such variables caused the clusters to become unstable over time or to mix companies with clearly diff erent investment challenges in the same segment. What’s more, we found that dropping any of the ten key met-rics noted above degraded the results in a similar fashion.
BCG RESEARCH ON VALUE PATTERNS
| I O
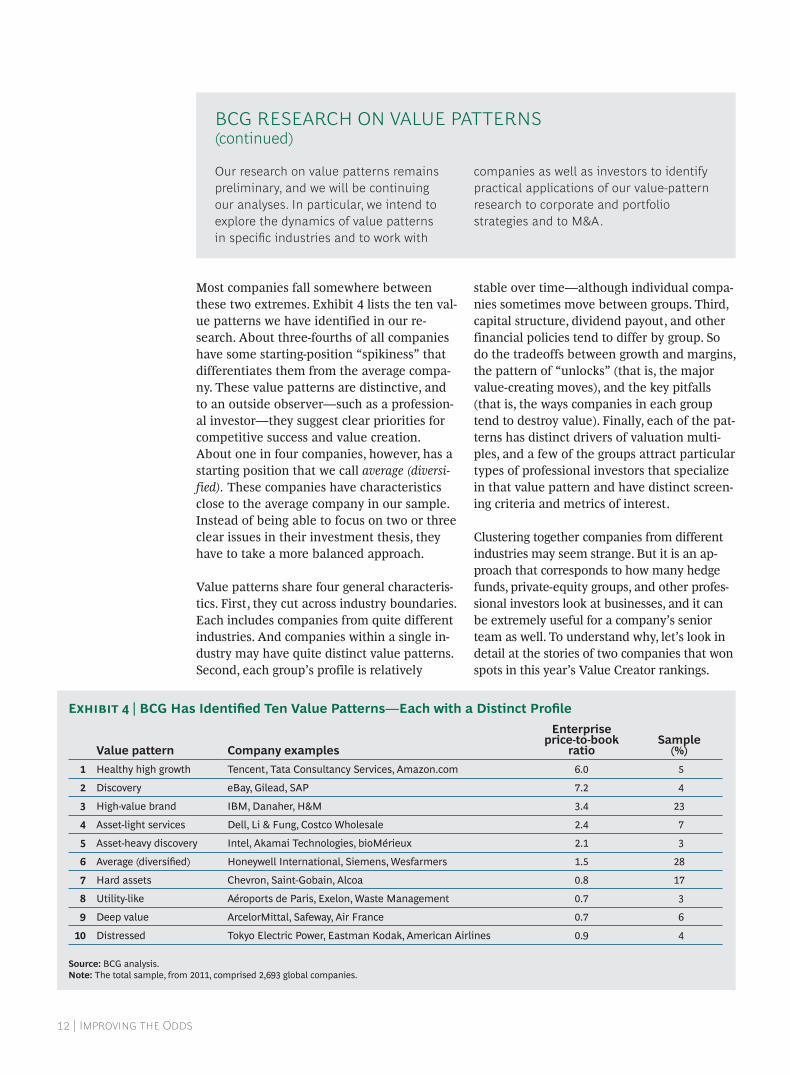
Most companies fall somewhere between these two extremes. Exhibit 4 lists the ten val-ue patterns we have identified in our re-search. About three-fourths of all companies have some starting-position “spikiness” that differentiates them from the average compa-ny. These value patterns are distinctive, and to an outside observer—such as a profession-al investor—they suggest clear priorities for competitive success and value creation. About one in four companies, however, has a starting position that we call average (diversi-fied). These companies have characteristics close to the average company in our sample. Instead of being able to focus on two or three clear issues in their investment thesis, they have to take a more balanced approach.
Value patterns share four general characteris-tics. First, they cut across industry boundaries. Each includes companies from quite different industries. And companies within a single in-dustry may have quite distinct value patterns. Second, each group’s profile is relatively
stable over time—although individual compa-nies sometimes move between groups. Third, capital structure, dividend payout, and other financial policies tend to differ by group. So do the tradeoffs between growth and margins, the pattern of “unlocks” (that is, the major value-creating moves), and the key pitfalls (that is, the ways companies in each group tend to destroy value). Finally, each of the pat-terns has distinct drivers of valuation multi-ples, and a few of the groups attract particular types of professional investors that specialize in that value pattern and have distinct screen-ing criteria and metrics of interest.
Clustering together companies from different industries may seem strange. But it is an ap-proach that corresponds to how many hedge funds, private-equity groups, and other profes-sional investors look at businesses, and it can be extremely useful for a company’s senior team as well. To understand why, let’s look in detail at the stories of two companies that won spots in this year’s Value Creator rankings.
Our research on value patterns remains preliminary, and we will be continuing our analyses. In particular, we intend to explore the dynamics of value patterns in specifi c industries and to work with
companies as well as investors to identify practical applications of our value-pattern research to corporate and portfolio strategies and to M&A.
BCG RESEARCH ON VALUE PATTERNS(continued)
Source: BCG analysis.Note: The total sample, from 2011, comprised 2,693 global companies.
E | BCG Has Identifi ed Ten Value Patterns—Each with a Distinct Profi le
Value pattern Company examples
Enterprise price-to-book
ratioSample
(%)
1 Healthy high growth Tencent, Tata Consultancy Services, Amazon.com 6.0 5
2 Discovery eBay, Gilead, SAP 7.2 4
3 High-value brand IBM, Danaher, H&M 3.4 23
4 Asset-light services Dell, Li & Fung, Costco Wholesale 2.4 7
5 Asset-heavy discovery Intel, Akamai Technologies, bioMérieux 2.1 3
6 Average (diversifi ed) Honeywell International, Siemens, Wesfarmers 1.5 28
7 Hard assets Chevron, Saint-Gobain, Alcoa 0.8 17
8 Utility-like Aéroports de Paris, Exelon, Waste Management 0.7 3
9 Deep value ArcelorMittal, Safeway, Air France 0.7 6
10 Distressed Tokyo Electric Power, Eastman Kodak, American Airlines 0.9 4
T B C G |
Kansas City Southern and FMC Technologies are two U.S. companies in our Value Creators database. In the five-year period from 2007 through 2011, they both delivered enough aver-age annual TSR (19 percent and 28 percent, re-spectively) to be listed in the top-ten rankings in their industries. And yet, each company did so in a different way, reflecting different start-ing positions and the priorities of different val-ue patterns.
How a Hard-Assets Company Created ValueKansas City Southern (KCS) is the smallest of the Class 1 railroad operators in the U.S. The company has a focused market position in the central and south-central part of the country, as well as a strong position in Mexico through its subsidiary, KCS de Mexico. In 2006, KCS had the oldest fleet in the industry, high debt lever-age (with a debt-to-enterprise-value ratio of 44 percent), and a high cost structure relative to its peers. And yet, over the next five years, it delivered an average annual TSR of 19 percent, earning it the number four position in our global transportation and logistics rankings.
How exactly did KCS create superior share-holder value during the period we studied? In 2006, the company’s starting position fit the hard assets value pattern. These are business-es whose economics reflect high capital inten-sity (typically, the historical investment in capital employed for the companies in this group is substantial, in the neighborhood of two to three times annual revenues), mean-ingful debt leverage, mature (and sometimes cyclical) demand, and modest returns on capi-tal. Hard-asset companies cross many differ-ent industries, but businesses commonly found in this value pattern include integrated oil, telecommunications, mining, asset-heavy hospitality, and railroads.
Such businesses have distinct priorities for value creation. First, they need to drive ROI through effective productivity improvements and consolidate their assets to reap cost and capacity efficiencies. Second, they must make sure that their reinvestment bets, which are highly capital intensive, truly contribute to the competitive advantage of the business and take into account the cyclicality of de-
mand. Third, they must do all this while man-aging debt leverage and balance sheet risk. The strategies pursued by KCS in recent years dramatically illustrate these three priorities.
KCS cut costs, improved efficiency, and heavily invest-ed in a clear strategic vision.
Drive return on capital through improved productivity. The company aggressively improved its operational effi ciency, reducing its operating ratio (total expenses as a per-centage of revenue) from 82 percent in 2006 to 73 percent in 2011. In response to the 2008–2009 economic crisis, KCS conducted a comprehensive operational review and redesigned processes to signifi cantly reduce structural cost. And it used some of the savings to refresh its fl eet, which greatly improved effi ciency and contributed to additional savings over the long term. These initiatives, combined with the capacity investments described below, drove more than 200 basis points of improvement in ROI from 2006 through 2011.
Invest in advantaged capacity bets. But KCS didn’t just cut costs and run its existing network more effi ciently. The company also invested heavily in a clear strategic vision: to create new routes and new capacity in a network supporting trade between Asia and North America and between Mexico and the U.S. As a result of long-term growth in Pacifi c container traffi c, the ports of Los Angeles and Long Beach, California, key entry points for Asian imports, have become increasingly congested. To create a viable alternative, KCS has been investing heavily in its Mexican rail network. For example, during the past decade, the company has been building an intermodal facility at the port of Lazaro Cardenas on Mexico’s west coast. KCS has exclusive rail access to the port, which provides an attractive alternative to shippers that are bringing containers from Asia into North America, both for the domestic Mexican market and for further shipment on to the U.S.

| I O
In parallel, the company invested in building the most direct route into the U.S. from Mexico at Laredo, Texas, connecting to its network in Houston and beyond. The new line and other major initiatives to improve service and reduce the cost of freight coming from Mexico to the U.S. have made railroad shipping far more com-petitive with truck shipping and enabled the shift of U.S.-Mexico traffic from trucks to trains. This capability allows KCS to capitalize on grow-ing industrial production in Mexico, especially in the automotive supply chain.
KCS offered new options for customers and benefited from growth in trade.
By offering valuable new options for custom-ers and by positioning itself to benefit from the increasing economic growth in and trade with both Mexico and Asia, KCS has been able to improve its EBITDA (earnings before interest, taxes, depreciation, and amortiza-tion) margin from 28 percent in 2006 to 37 percent in 2011.
Derisk the balance sheet. The 2005 acquisi-tion of its Mexican joint-venture partner le KCS with relatively high fi nancial leverage and limited liquidity (only $31 million in cash on hand). Even as it was investing heavily in network upgrades and new capacity, KCS took action to strengthen its balance sheet, reduc-ing its economic leverage by taking its net debt-to-enterprise value down from 44 percent in 2006 to 20 percent by 2011. As a sign of this progress, the company’s credit rating was upgraded during this period from B to BB+. The combination of refi nanced liabilities and a better credit rating increased the company’s fi nancial fl exibility—and even allowed KCS to initiate a common dividend in early 2012.
Taken together, all these moves allowed KCS to deliver its superior TSR through a bal-anced mix of revenue growth (responsible for 5 percentage points of annual TSR), margin expansion (responsible for 6 percentage points), improvements in the company’s valu-
ation multiple (responsible for 7 percentage points), and free-cash-flow yield (responsible for about 1 percentage point).
Lessons from an Industrial High-Value BrandFMC Technologies is a leading global provider of technology solutions for the oil and gas in-dustry. The company is the market leader in technologically sophisticated systems for deep-water subsea production and processing. In the five years from 2007 through 2011, FMC Tech-nologies delivered an average annual TSR of 28 percent—an extraordinary performance and good enough for the number five position in our global machinery industry rankings. In 2012, FMC Technologies was named “the world’s most admired oil and gas equipment, service company” by Fortune magazine.
How did FMC Technologies deliver this out-come? In 2006, the starting position of FMC Technologies fit the value pattern that we call high-value brand.2 Companies in this value pattern are among the healthiest and strongest businesses in the market. They typically enjoy powerful competitive advan-tages in relatively mature and stable markets. They have proprietary, differentiated prod-ucts with high value added. They enjoy low capital intensity (50 cents in capital for every dollar in revenue), low debt leverage, stable growth in demand, and high returns on capi-tal. High-value-brand companies are healthy category leaders with attractive business eco-nomics, and they are found across many in-dustries. Among the companies in this year’s Value Creators rankings that fit this value pattern are IBM, McDonald’s, and Perrigo.
And yet, despite so healthy a starting posi-tion, high-value-brand companies do not necessarily create more shareholder value on average than the market as a whole. In any given period, there are clear winners in the group that deliver top-quartile returns and also clear losers that deteriorate and end up destroying value.
What’s more, the typical unlocks associated with top-quartile performance from a high-value-brand starting position are rather dif-ferent from those discussed for hard-asset
T B C G |
companies. In this value pattern, companies need to protect and grow the core category. They need to fight pressures toward commod-itization by continually investing in competi-tive differentiation. They need to avoid low-quality growth that comes at the price of eroding margins. And, finally, they need to carefully allocate excess cash—either by rein-vesting it in the portfolio at greater than a dollar in risk-adjusted present value or by returning it to shareholders as a yield-based contribution to TSR.
Protect and grow the core category. FMC Technologies is a clear market leader in subsea infrastructure (the equipment used to exploit deep-water off shore oil and gas deposits). Its products play a critical role in enabling advances in safe and eff ective deep-water production.
As the world’s mature onshore oil and gas fields are gradually depleted, there is a grow-ing demand for new and improved approach-es to deep-water production. But deep-water development is an extraordinarily expensive and technically difficult proposition. For ex-ample, since 2007, Petrobras, Brazil’s national oil company, has discovered several large off-shore fields more than 150 miles from land and more than 3 miles below the water’s sur-face. The company recently announced that it expects to spend more than $125 billion over the next five years to develop these offshore deposits. The financial and technical risks in-volved in these projects are significant, and oil companies increasingly depend on part-ners such as FMC Technologies to supply crit-ical systems and solutions.
Innovation has kept FMC Technologies at the forefront of its sector.
FMC Technologies has a long history of sup-porting category growth in deep-water explo-ration. The company holds many deep-water drilling records and has continued its intense focus on improving its customers’ economics by providing technically superior solutions to
enhance oil recovery. For example, in 2011, FMC Technologies completed its Marlim project, a $90 million subsea processing com-plex for Petrobras, designed to set new indus-try standards for mature-field deep-water oil-water separation and reinjection of water into a subsea reservoir to boost production.
Reinvest to fi ght commoditization. From 2008 through 2011, FMC Technologies doubled its R&D investment and entered into new technology-licensing agreements in order to maintain its technical leadership and to capitalize on the growing demand for deep-water oil and gas production. These steps have made the company a leader in subsea separation boosting and processing systems, a new technology used to increase oil recov-ery in mature fi elds and to develop new fi elds that had previously been too expensive to exploit. The company also completed a series of bolt-on acquisitions to add capabili-ties such as robotics for remotely operated vehicle systems, permanent magnet motors to power pumps, and self-adjusting high-ac-curacy meters suited for permanent monitor-ing of deep-sea wells. Innovation—whether developed internally or acquired from outside—has kept the company at the forefront of its sector.
Avoid low-quality growth and deploy capital carefully. The company also managed its capital bets to concentrate resources in its most advantaged areas. While adding technol-ogy-enhancing acquisitions, FMC Technologies also focused its portfolio with the 2008 spinout of non-oil-related equipment busi-nesses. The combination of organic growth, acquisition, and divestment resulted in expanded gross margins and higher return on capital, each of which increased by 200 basis points.
Taken together, these moves allowed FMC Technologies to deliver its superior TSR through a balanced mix of revenue growth (responsible for 6 percentage points of annu-al TSR), margin expansion (responsible for an additional 6 percentage points), improve-ments in the company’s valuation multiple (responsible for 13 percentage points), and free-cash-flow yield (responsible for 2 per-centage points).
| I O
Value patterns do not offer a one-size-fits-all prescription or strategy cookbook. The strate-gic agenda for any particular company will be highly specific to its particular situation and will reflect critical issues not captured by this kind of outside-in view of a company’s starting position. Nevertheless, because it identifies the types of actions that are more likely to create value, a company’s value pat-tern is an essential input that helps inform the strategic agenda. Knowing your value pat-tern won’t necessarily tell you what to do, but it will tell you where to look—and where the better odds are for value creation success.
N1. See “Value Patterns: The Concept,” BCG Perspectives, May 2012.2. For a more detailed description of high-value-brand companies, see “How Value Patterns Work,” BCG Perspectives, June 2012.

T B C G |
CHURCH & DWIGHTKEEPING A FOOT ON THE GAS
O delivered a truly stellar TSR performance in recent years
is the U.S. consumer-packaged-goods com-pany Church & Dwight. With a 2011 year-end market capitalization of $6.5 billion, the company was too small to be included in this year’s Value Creators consumer nondurables sample (which has a market cap hurdle of $9 billion). But the company’s fi ve-year average annual TSR of 17.6 percent puts it at the same level of performance as our top-ten companies in the consumer nondurables ranking. What’s more, compared with its much larger packaged-goods peers—such as Procter & Gamble, Unilever, Colgate-Palmol-ive, and Clorox—Church & Dwight has been the top value creator in its peer group for the past three, fi ve, and ten years.
Church & Dwight dates back to 1846, when founders Austin Church and John Dwight devel-oped bicarbonate of soda (more commonly known as baking soda). Today, the company’s diverse portfolio includes some 80 global brands and products, including its venerable Arm & Hammer brand, Nair depilatories, the prewash laundry additive OxiClean, Trojan condoms, and First Response home pregnancy and ovula-tion test kits. Church & Dwight’s brands are market-share leaders in many of the segments in which the company competes.
What explains the consistent superior perfor-mance of this mid-cap company? According
to CEO Jim Craigie, one important factor is his use of TSR as an overarching framework for managing the company. “A lot of compa-nies give lip service to the idea of managing for TSR,” explains Craigie, “but they don’t really believe that what they do affects their stock price. They don’t think they can man-age it. At Church & Dwight, being TSR-orient-ed is a mindset that is woven into our cul-ture—a mindset that is shared by me, my entire executive team, and, indeed, by every employee in the company. We are deeply committed to delivering attractive and sus-tainable TSR over the medium to long term.”
A Healthy Business with Hidden ChallengesWhen Craigie joined Church & Dwight as CEO in July 2004, the company was finan-cially healthy and already boasted a strong value-creation track record. But after a long period of delivering top-quartile TSR, it was unclear how the company could sustain that value-creation performance into the future.
In the latter half of the 1990s, Church & Dwight had delivered an average annual TSR of 21.1 percent through organic growth of its main Arm & Hammer brand and through margin improvement due to cost reductions. But a few years later, organic growth had slowed significantly. And, in order to boost the company’s revenue and earnings growth,

| I O
the previous management had taken on debt to fund new growth through acquisitions.
From 2002 through 2005, 75 percent of Church & Dwight’s growth in revenue came from ac-quisitions, which helped the company continue to deliver double-digit TSR of 14.9 percent from 2000 through 2004. Although the new businesses delivered a one-time boost to EPS, they didn’t help boost the company’s organic-growth rate. And as Church & Dwight grew, the availability of acquisition targets that were big enough to really move the company’s growth needle declined. With its valuation hovering at 22 times earnings, the company needed to find a new way to meet those high expectations and continue to deliver superior TSR.
“The Gas in the Engine”Clearly, increasing organic growth had to be part of the company’s new value-creation strategy. But in early 2006, BCG’s analysis of what was driving differences in company valu-ations among Church & Dwight’s packaged-goods peer group helped Craigie realize that the appropriate path forward might be more complicated than he had initially thought. (See the sidebar “Eight Questions That Should In-form Your Value-Creation Strategy.”)
In previous Value Creators reports, we have described BCG’s use of statistical regressions to identify correlations between the range of valuation multiples in a group of competing companies and a comprehensive set of finan-cial and operational variables—including growth, margin, profitability, risk, sustainabil-ity, and uses of free cash flow.1 The approach allows a company’s executives to develop a statistical model that explains differences in valuation multiples in their industry and to take action to earn an improved valuation multiple relative to the company’s peers.
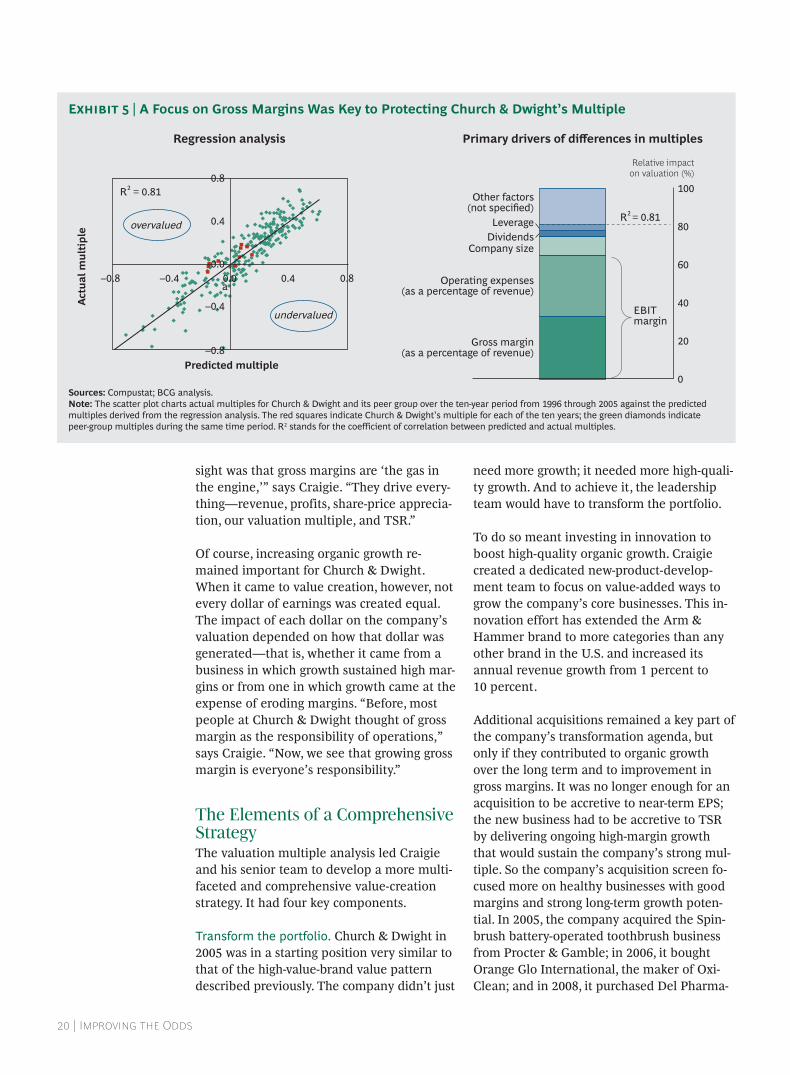
Exhibit 5 (on page 20) shows the results of this analysis for Church & Dwight and its peer group in the period from 1996 through 2005. The scatter plot on the left shows that the model BCG developed, based on statistical regressions of financial data from Church & Dwight and its peer-group companies, predict-ed valuations that were a close fit with the actual valuations in the group, with an R2 of
0.81: 81 percent of the differences in valuation multiples in the group are explained by the model. The bar graph on the right shows that the most influential driver of differences in multiples in this group was the size of a com-pany’s gross margin as a percentage of reve-nue (responsible for 33 percent of the differ-ence in multiples), followed closely by operating expenses as a percentage of reve-nue. In other words, all other things being equal, the higher a company’s margins and the lower its operating expenses as a percent-age of revenue, the higher its valuation multi-ple compared with those of its peers. Together, these two factors make up a company’s EBIT (earnings before interest and taxes) margin.
Gross margin is a key driver of Church & Dwight’s value-creation strategy.
It is interestingly that although revenue growth is an important contributor to TSR, this analysis suggests that in the packaged-goods sector, it is not a key driver of differences in valuation multiples. Indeed, to the degree that growth comes at the price of eroding margins and increasing operating expenditures, it could actually cause a company’s multiple to decline. Thus, if Church & Dwight chose to maximize its organic revenue growth without paying close attention to the impact of that growth on the company’s gross margins, then the impact could be precisely the opposite of what Craigie intended. Instead of sustaining the company’s multiple, the changes could weaken it, and the company might lose more TSR in the decline of its valuation multiple than it would gain from the increased revenue growth.
The insights from the statistical regression analysis had a big impact on how Craigie and his management team thought about the path forward. It wasn’t as if the Church & Dwight executives didn’t understand that gross margins were important. But up until then, they had treated them as just one factor among many affecting the company’s stock price and ability to deliver TSR. “The key in-

T B C G |
Companies collect and analyze a great deal of information in order to estimate their value-creation potential. But in our experi-ence, that information doesn’t always help them answer the most important questions when it comes to creating a detailed value-creation strategy. Below are eight
questions that we believe should inform every company’s strategy to create value. If you don’t know the answers to these questions, you don’t really have a value creation strategy.
EIGHT QUESTIONS THAT SHOULD INFORM YOUR VALUECREATION STRATEGY
1. How has our historical value creation compared with that of our peers and with the market?
5. What fundamental performance drives our plan’s value creation?
2. What factors drive valuations for our company and our peers?
6. What is the impact of diff erent choices and sensitivities on our ability to create value?
3. What types of investors align best with our business and fi nancial strategies?
7. How do diff erent businesses and strategies contribute to our value creation?
4. How much value does our business plan create?
8. How should we allocate capital?
Peer 1
Peer 3
Peer 2
CompanyPeer 5Peer 4
Peer 7
Peer 6
Peer 8Peer 9
Peer 10
3rd Quartile = –2.7%
Median = 4.5%
1st Quartile = 10.9%
0
50
100
150
200
250
300
350
400
450
–60 –30 0 30
Peer 8Peer 7
CompanyPeer 9
Peer 3
Peer 6Peer 1
Peer 5
Peer 2Peer 4
Peer 10
3rd Quartile = –17.8%
Median = –4.8%
1st Quartile = 7.6%
0
100
200
300
400
–80 –40 0 40
Company rank Company rank
Five-year TSR One-year TSR
Average annual TSR (%) Average annual TSR (%)
80
100
60
40
20
0
Peer 5Peer 4
Peer 3Peer 2
Peer 1Company
20
7
21
52
Index
Income
Value
GARP
Growth
Others
Hedgefund
Institutional investor base, by type Investment philosophy
Specialty, international, unclassified, and other styles
Alternative investment strategy seeking customized risk–reward profiles
Funds that follow a particular index and therefore maintain each security that is a component of an index Invest for long-term dividend yield; look for securities with above average yield for risk
Invest when actual value is below intrinsic value; invest when P/E below 15 (or below peers), exit when P/E exceeds average Growth at reasonable price—seek capital gains at reasonable price
Invest in fast-growing companies on the premise that high growth is not fully valued by market; invest when top-line growth is 15%+
%
Other factors(not specified)
Leverage
SizeDividends
OPEX
80
60
40
Relative impacton valuation (%)
100
20
0
–0.8
–0.4
0.4
0.8
–0.8 –0.4 0.4 0.8
Fitted multiple
Act
ual m
ulti
ple
a
undervalued
Company
overvalued
n = 264
. . . found margins moreimportant than growth
Industry valuationmultiple regression . . .
R2 = 0.81
% revenueEBITmargin
Gross margin
R2 = 0.81
Value per share ($)
Businessplan Sensitivitycase
0
20
40
60
80
100
2002
High-low share-price rangeDiscounted-cash-flow model value
2001 20032004
20052006
20072008
20092010
20112012
20132014
20152016
0
40
80
120
20122013
20142015
2016
TSR2012–2016 = –7%
Value creation (cumulative)
Return on capital (%)
Growth (%)
0
500
1,000
1,500
20122013
20142015
2016
CAGR assets = 9% CAGR sales = 13%
Cash profit margin (%)
Capital / Sales (x)
0
1
2
20122013
20142015
2016
05
101520
20122013
20142015
2016
05
101520
20122013
20142015
2016
TSRindex(2012 = 100)
Cash-flowROI (%)
Weighted averagecost of capital (WACC)
Cash flowmargin (%)
Assetturnover(x)
Grossinvestment($millions)
Illustrative strategic levers Change in value ($ per share)
Raise current EV/EBITDA multiple (8.4x) to peer group average (11.2x)Realize ~$125 million in annual procurement savingsImprove working capital efficiency to peer top-quartileTechnology penetration take-up accelerates—own technology winningImprove annual growth and margin improvement of BU-2 by 1 percentSuccessfully expand via successful $300 million acquisition Drive annual incremental growth in BU-3 at 5 percent at current returnsImprove BU-4 annual growth by 2 percent and margin by 1 percentDrive annual incremental growth in BU-5 at 5 percent at current returnsUnsuccessful integration of $300 million acquisitionBU-2 earnings power fades to long-term averageBU-1 earnings power fades to long-term averageBU-3 performance decreases to peer long-term averageBU-5 earnings power fades to long-term average
2811
843222
0–3–3
–10–12
–23
12.70.60.21.3
7.51.0 0.7 0.4
1.0
0
5
10
15
20TSR (%)
Momentumcase
Cost ofequity return
RestructureBU “A”
RestructureBU “B”
Manage costof core BUs
Improvedpricing
Internationalgrowth
Businessplan
Manage forreturns / divest
Core Grow
BU “C”rollup
Divest or liquidateother BUs
Paydividend
Maintain currentleverage
+$0.9 billion in
additional capacity–$1 billion to
–$3 billion –$1.2 billion –$1.7 billion to–$3.7 billion
Invest ingrowth beyond
“base case”
Repurchaseshares
(“excess cash”)
Cash flow from operations aer interest, taxes 6.3 Capital expenditures (1.3)
Changes in working capital (0.4) Excess cash on balance sheet 0.4 Total unallocated cash flow 5.0
$billions
Cumulative four-year (2012–2015) cash generation and investment
| I O
sight was that gross margins are ‘the gas in the engine,’” says Craigie. “They drive every-thing—revenue, profits, share-price apprecia-tion, our valuation multiple, and TSR.”
Of course, increasing organic growth re-mained important for Church & Dwight. When it came to value creation, however, not every dollar of earnings was created equal. The impact of each dollar on the company’s valuation depended on how that dollar was generated—that is, whether it came from a business in which growth sustained high mar-gins or from one in which growth came at the expense of eroding margins. “Before, most people at Church & Dwight thought of gross margin as the responsibility of operations,” says Craigie. “Now, we see that growing gross margin is everyone’s responsibility.”
The Elements of a Comprehensive StrategyThe valuation multiple analysis led Craigie and his senior team to develop a more multi-faceted and comprehensive value-creation strategy. It had four key components.
Transform the portfolio. Church & Dwight in 2005 was in a starting position very similar to that of the high-value-brand value pattern described previously. The company didn’t just
need more growth; it needed more high-quali-ty growth. And to achieve it, the leadership team would have to transform the portfolio.
To do so meant investing in innovation to boost high-quality organic growth. Craigie created a dedicated new-product-develop-ment team to focus on value-added ways to grow the company’s core businesses. This in-novation effort has extended the Arm & Hammer brand to more categories than any other brand in the U.S. and increased its annual revenue growth from 1 percent to 10 percent.
Additional acquisitions remained a key part of the company’s transformation agenda, but only if they contributed to organic growth over the long term and to improvement in gross margins. It was no longer enough for an acquisition to be accretive to near-term EPS; the new business had to be accretive to TSR by delivering ongoing high-margin growth that would sustain the company’s strong mul-tiple. So the company’s acquisition screen fo-cused more on healthy businesses with good margins and strong long-term growth poten-tial. In 2005, the company acquired the Spin-brush battery-operated toothbrush business from Procter & Gamble; in 2006, it bought Orange Glo International, the maker of Oxi-Clean; and in 2008, it purchased Del Pharma-
100
Relative impacton valuation (%)
80
60
40
20
0
Operating expenses (as a percentage of revenue)
Company sizeDividendsLeverage
Other factors(not specified)
–0.8
–0.4
0.0
0.4
0.8
–0.8 –0.4 0.0 0.4 0.8a
undervalued
overvalued
Act
ual m
ulti
ple
Regression analysis
Predicted multiple
Gross margin (as a percentage of revenue)
R2 = 0.81
EBITmargin
Primary drivers of differences in multiples
R2 = 0.81
Sources: Compustat; BCG analysis.Note: The scatter plot charts actual multiples for Church & Dwight and its peer group over the ten-year period from 1996 through 2005 against the predicted multiples derived from the regression analysis. The red squares indicate Church & Dwight’s multiple for each of the ten years; the green diamonds indicate peer-group multiples during the same time period. R2 stands for the coefficient of correlation between predicted and actual multiples.
E | A Focus on Gross Margins Was Key to Protecting Church & Dwight’s Multiple

T B C G |
ceuticals, maker of the oral pain reliever Ora-jel. Although more expensive, on average, than its previous round of acquisitions, these higher-margin businesses delivered not only attractive cost synergies but also a much big-ger footprint in growing categories.
Finally, the weaker brands in Church & Dwight’s portfolio had to become long-term contributors to TSR or else they would be sold or closed down. Craigie created what he called a “tiger team” to deal with the minor brands that were in decline and diluting earn-ings. Among the businesses the company has divested since 2004 are a small pet-products business and the Brillo brand.
As a result of this combination of initiatives, the Church & Dwight portfolio looks very dif-ferent today than it did eight years ago. The strength of the portfolio is much more con-centrated, with eight “power brands”—in-cluding Arm & Hammer, Trojan, OxiClean, Spinbrush, Nair, and Orajel—delivering 80 percent of the company’s revenue and prof-its. The company’s marketing spend is also much more focused on the company’s 8 to 12 top brands, with the lion’s share going to the power brands. In the process, gross margins—the gas in the engine—have increased from 39.1 percent in 2006 to 44.2 percent in 2011, and operating margins have grown from 13 percent to 18.1 percent.
Craigie trained his top managers in the logic and principles of TSR.
Redraw fi nancial policies. A second compo-nent of Church & Dwight’s new value-creation strategy has been changes in the company’s fi nancial policies. Take, for exam-ple, dividends. At 13 cents per share in 2006, Church & Dwight had the lowest dividend yield (0.6 percent) among those of its peers who paid a dividend. Indeed, at the time, the company could have tripled its dividend and still only reached the median level of the S&P. And some competitors had yields of as much as 4.5 percent.
As the company improved its margins and grew its most profitable brands, it began to generate the cash flow that made it possible to raise its dividend substantially. In addition to representing a direct contribution to TSR, any increases in dividend payout also had the virtuous side effect of putting a floor under the company’s market valuation. In February 2011, the company dramatically doubled its dividend payout from 15 percent of net in-come to 30 percent, and in February 2012, in-creased it again to 40 percent.
Institutionalize a TSR culture. At the same time that he was transforming the Church & Dwight portfolio and redrawing the compa-ny’s fi nancial policies, Craigie was also working hard to embed an understanding of and orientation toward TSR in the Church & Dwight culture. As in many other companies, managers at Church & Dwight had tradition-ally focused on delivering growth in operat-ing income and EPS. But not all EPS growth necessarily contributes to TSR. A company can improve its EPS by chasing lower-margin or even unprofi table growth, by engaging in share wars that erode margins and profi tabil-ity, or by making acquisitions that may be EPS-accretive but are TSR-dilutive.
To help them understand this distinction, Craigie trained his top 100 managers in the logic, principles, and analysis of TSR. He also redesigned the Church & Dwight incentive system to include criteria linked directly to a model of how a business unit’s operational improvements actually contribute to TSR.
“My employees know that their efforts can directly affect our stock price,” says Craigie. “The people who run my businesses have be-come millionaires—and they never expected it.” The payoff has been a more stable and more senior management team. “I have only lost one of my top business unit leaders in the past eight years,” explains Craigie. “Why? Because we are winning, and the stock price has tripled in the past eight years. They say, ‘I’m not leaving Church & Dwight. I’m build-ing a growing business, having a lot of fun—and getting rich at the same time.’”
Engage actively with investors. Having reinvented the company’s business and
| I O
fi nancial strategies, Craigie focused on the last element in Church & Dwight’s transfor-mation: to make sure that its investor strategy was aligned with these changes. He began engaging more actively with the company’s investors, being as explicit as possible about how the company intended to deliver attrac-tive and sustainable TSR.
“When I first came to Church & Dwight,” says Craigie, “we were more or less the ‘Rodney Dangerfield’ of consumer-packaged-goods companies. We were tiny compared to the Procter & Gambles and Unilevers of the world. And while our investors liked our TSR performance, they didn’t really understand what made us tick.”
With the help of investor interviews conduct-ed by BCG, Craigie came to understand that in order to build investor confidence in the company, he would have to “deal with the reality of the Wall Street environment” and start looking at the company the way that in-vestors did. This meant developing a detailed action-oriented investment thesis that would deliver top-quartile returns and being clear and public about the “TSR math” that would allow the company to deliver on that thesis.2
Taking a page from the book of late-night TV host David Letterman, Craigie developed a presentation that he titled “Ten Reasons to Buy This Company.” The reasons covered the logic underlying Church & Dwight’s portfolio, including the central role of gross margins in driving TSR; the company’s strategic and highly selective M&A strategy; the fact that Church & Dwight’s free-cash-flow conver-sion—at more than 100 percent of net in-come—was best in class in its industry; and the TSR orientation of the workforce. “We had always set very high EPS targets in the past,” says Craigie. “But now our investors understand how we plan to get there. And, then, we deliver on what we promise—top-quartile TSR.”
The result: “Church & Dwight has gone from being the Rodney Dangerfield of consumer packaged goods to being a company that is admired by many and now featured by ana-lysts as the top packaged-goods value creator. Investors and analysts understand how we
operate the business and, as a result, have bought into our value-creation strategy. They have a much better understanding today of what makes us tick than they did in 2005.”
A New Inflection Point?As the old investment cliché goes, however, past performance is no guarantee of future results. Craigie and his team have had an in-credible run. But how will they ensure that Church & Dwight continues to deliver superi-or shareholder value in the future?
“We’re in a recessionary environment,” Crai-gie says bluntly. “Nobody wants to call it that anymore, but it is. It’s a dismal outlook in the world right now. We still target 10 percent earnings growth. How do we pull the right set of levers to get it? That’s the chess game we are involved in out there.”
But if Church & Dwight, like many other com-panies, is facing macroeconomic headwinds, the idea that the company may be at an in-flection point in how it delivers value is noth-ing new. The fact is, Craigie and his team have gotten very good at refining their value-creation model in order to take into account new circumstances and the company’s cur-rent starting position.
“Every two years we refresh the model,” says Craigie. “In my time here, we have already shifted from emphasizing growth by acquisi-tion to emphasizing organic growth and gross-margin improvement to emphasizing shifts in financial policy by increasing the div-idend. So we’ll probably have to emphasize something else again in the near future. Just as long as we never deviate from the underly-ing value-creation strategy.” Odds are that Church & Dwight will find new ways to keep its foot on the gas.
N1. See the section “Understanding Valuation Multiples” in Avoiding the Cash Trap: The Challenge of Value Creation When Profits Are High, The 2007 Value Creators Report, September 2007, pp. 13–16.2. See “The CEO as Investor,” BCG Perspectives, March 2012.
T B C G |
APPENDIXTHE 2012 VALUE CREATORS RANKINGS
The 2012 Value Creators rankings are based on an analysis of total shareholder return at 1,003 global companies for the five-year peri-od from 2007 through 2011.
To arrive at this sample, we began with TSR data for more than 9,000 companies provided by Thomson Reuters. We eliminated all com-panies that were not listed on a world stock exchange for the full five years of our study or that did not have at least 25 percent of their shares available on public capital mar-kets. We also eliminated certain industries from our sample—for example, financial ser-vices. We chose to exclude financial services because measuring value creation in the sec-tor poses unique analytical problems that make it difficult to compare the performance of financial services companies with compa-nies in other sectors.
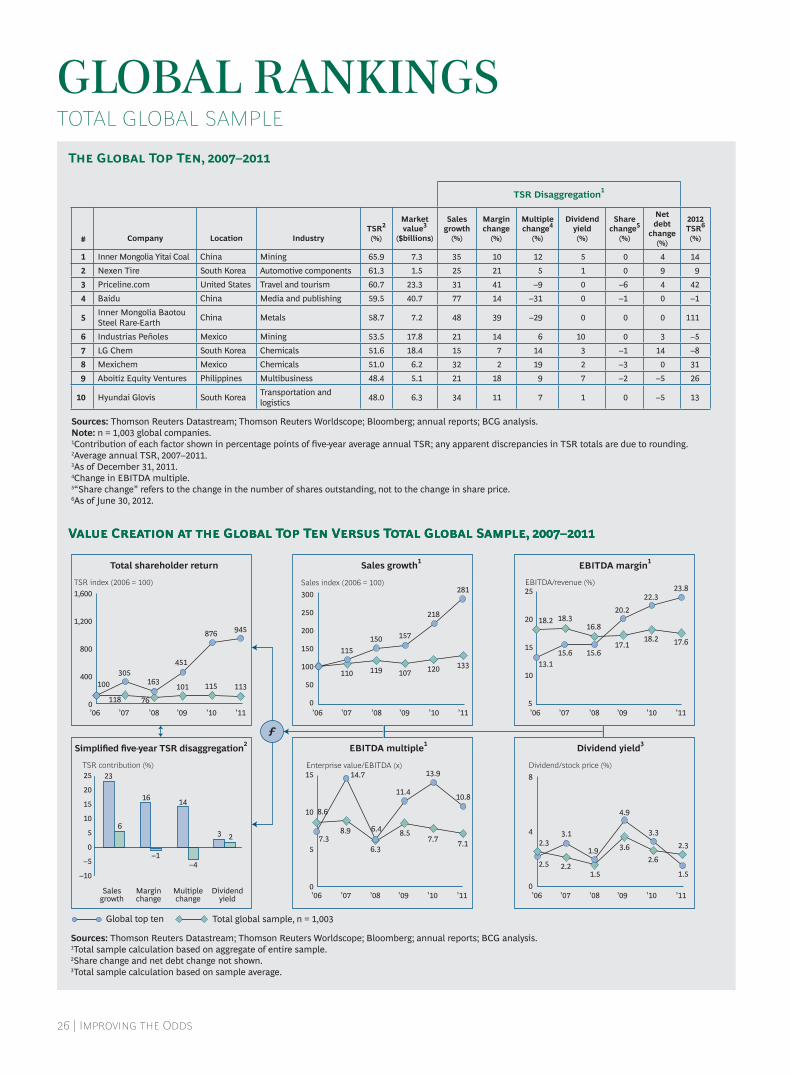
We further refined the sample by organizing the remaining companies into 21 industry groups and establishing an appropriate mar-ket-valuation hurdle to eliminate the smallest companies in each industry. (The size of the market valuation hurdle for each individual industry can be found in the tables in the “Industry Rankings.”) In addition to our 1,003-company comprehensive sample, we separately analyzed those companies with market valuations of more than $35 billion. We have included rankings for these large-cap companies in the “Global Rankings.”
The global and industry rankings are based on five-year TSR performance from 2007 through 2011.1 We also show TSR perfor-mance for 2012 through June 30. In addition, we break down TSR performance into the six investor-oriented financial metrics used in the BCG TSR model.
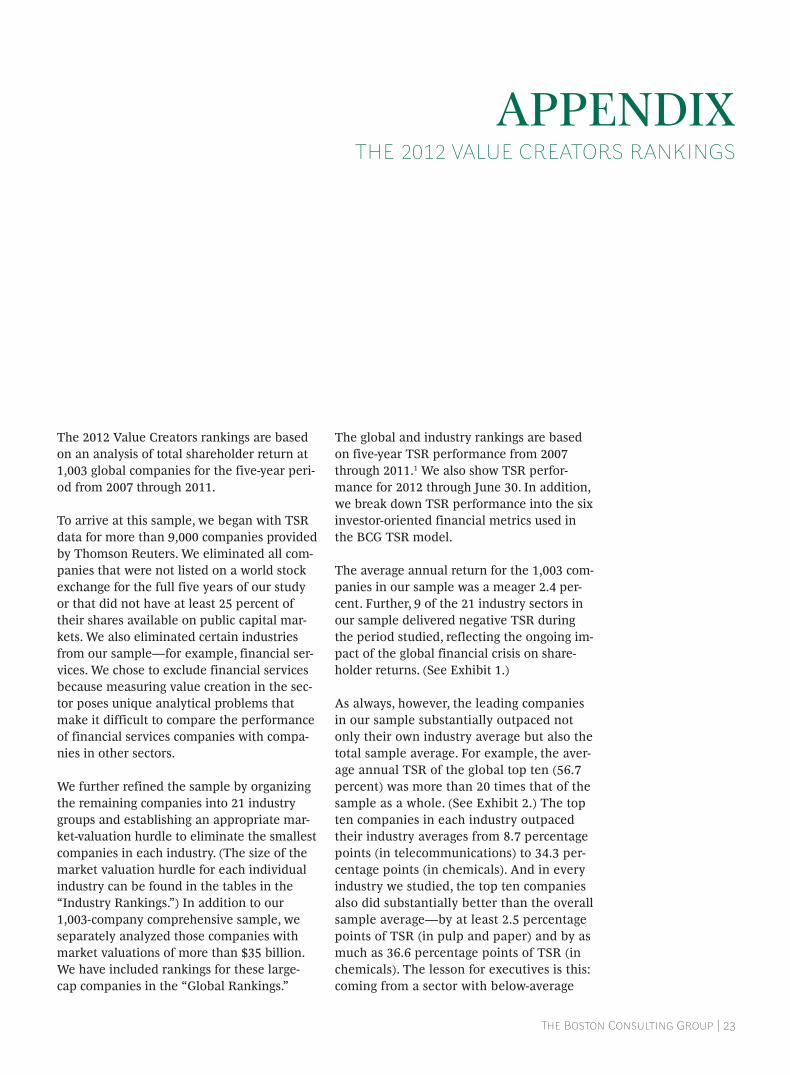
The average annual return for the 1,003 com-panies in our sample was a meager 2.4 per-cent. Further, 9 of the 21 industry sectors in our sample delivered negative TSR during the period studied, reflecting the ongoing im-pact of the global financial crisis on share-holder returns. (See Exhibit 1.)
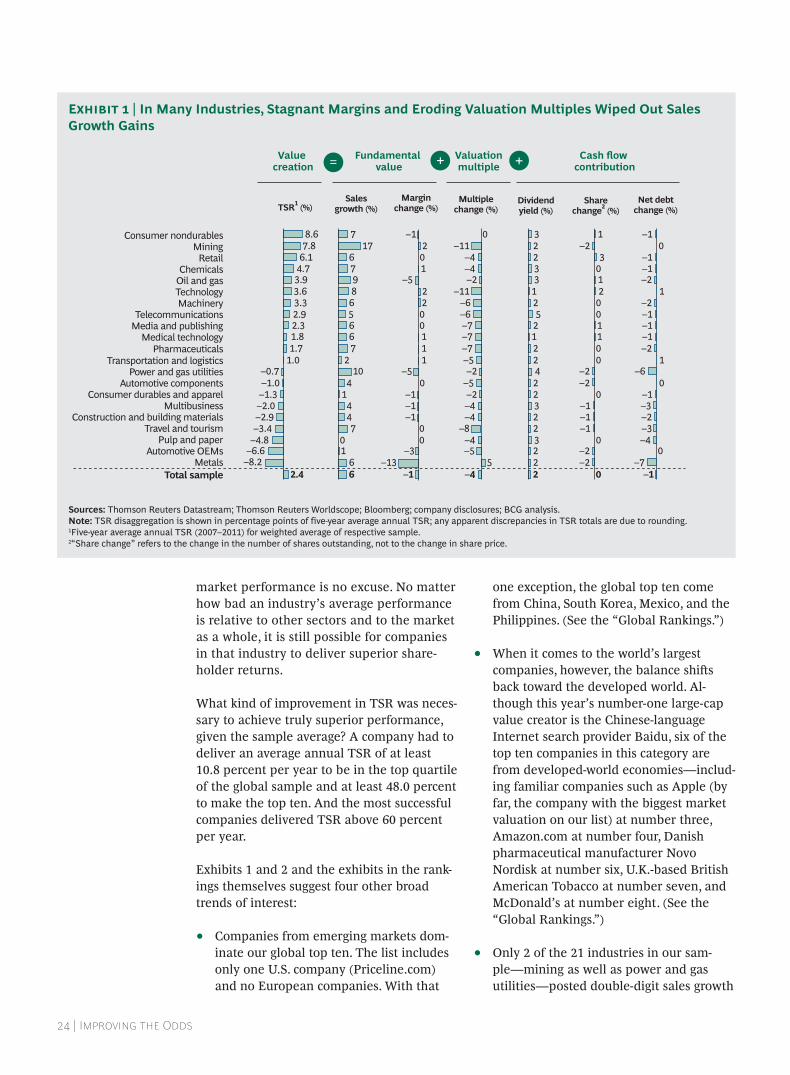
As always, however, the leading companies in our sample substantially outpaced not only their own industry average but also the total sample average. For example, the aver-age annual TSR of the global top ten (56.7 percent) was more than 20 times that of the sample as a whole. (See Exhibit 2.) The top ten companies in each industry outpaced their industry averages from 8.7 percentage points (in telecommunications) to 34.3 per-centage points (in chemicals). And in every industry we studied, the top ten companies also did substantially better than the overall sample average—by at least 2.5 percentage points of TSR (in pulp and paper) and by as much as 36.6 percentage points of TSR (in chemicals). The lesson for executives is this: coming from a sector with below-average
| I O
market performance is no excuse. No matter how bad an industry’s average performance is relative to other sectors and to the market as a whole, it is still possible for companies in that industry to deliver superior share-holder returns.
What kind of improvement in TSR was neces-sary to achieve truly superior performance, given the sample average? A company had to deliver an average annual TSR of at least 10.8 percent per year to be in the top quartile of the global sample and at least 48.0 percent to make the top ten. And the most successful companies delivered TSR above 60 percent per year.
Exhibits 1 and 2 and the exhibits in the rank-ings themselves suggest four other broad trends of interest:
Companies from emerging markets dom- •inate our global top ten. The list includes only one U.S. company (Priceline.com) and no European companies. With that
one exception, the global top ten come from China, South Korea, Mexico, and the Philippines. (See the “Global Rankings.”)
When it comes to the world’s largest •companies, however, the balance shi s back toward the developed world. Al-though this year’s number-one large-cap value creator is the Chinese-language Internet search provider Baidu, six of the top ten companies in this category are from developed-world economies—includ-ing familiar companies such as Apple (by far, the company with the biggest market valuation on our list) at number three, Amazon.com at number four, Danish pharmaceutical manufacturer Novo Nordisk at number six, U.K.-based British American Tobacco at number seven, and McDonald’s at number eight. (See the “Global Rankings.”)
Only 2 of the 21 industries in our sam- •ple—mining as well as power and gas utilities—posted double-digit sales growth
TSR1 (%) Sales
growth (%)Margin
change (%)Multiple
change (%)Dividendyield (%)
Sharechange2 (%)
Net debtchange (%)
Value creation
Fundamental value
Valuationmultiple
Cash flow contribution= + +
Total sample 2.4Metals –8.2
Automotive OEMs –6.6Pulp and paper –4.8
Travel and tourism –3.4Construction and building materials –2.9
Multibusiness –2.0Consumer durables and apparel –1.3
Automotive components –1.0Power and gas utilities –0.7
Transportation and logistics 1.0Pharmaceuticals 1.7
Medical technology 1.8Media and publishing 2.3Telecommunications 2.9
Machinery 3.3Technology 3.6Oil and gas 3.9Chemicals 4.7
Retail 6.1Mining 7.8
Consumer nondurables 8.6
66
10
744
14
102
766568976
177
–1–13
–300
–1–1–1
0–5
1110022
–5102
–1
–45
–5–4
–8–4–4–2
–5–2
–5–7–7–7–6–6
–11–2–4–4
–110
2223223224221252133223
0–2–2
0–1–1–1
0–2–2
0011002103
–21
–1–7
0–4–3–2–3–1
0–6
1–2–1–1–1–2
1–2–1–1
0–1
Sources: Thomson Reuters Datastream; Thomson Reuters Worldscope; Bloomberg; company disclosures; BCG analysis.Note: TSR disaggregation is shown in percentage points of five-year average annual TSR; any apparent discrepancies in TSR totals are due to rounding.1Five-year average annual TSR (2007–2011) for weighted average of respective sample.2“Share change” refers to the change in the number of shares outstanding, not to the change in share price.
E | In Many Industries, Stagnant Margins and Eroding Valuation Multiples Wiped Out Sales Growth Gains

T B C G |
during the period studied, which suggests the impact of lower GDP growth. And only 8 of the 21 industries beat the overall sample sales-growth average of 6 percent. What’s more, relatively modest sales growth was accompanied by negligible improvements in margins—and in some cases, such as that of the metals sector, serious margin erosion.
In all but 2 of the 21 industries, declines •in valuation multiples destroyed value—sometimes dramatically so. For example, declines in valuation multiples were responsible for lowering TSR by 11 percentage points, on average, in mining and in technology; 8 percentage points in travel and tourism; and 7 percentage
points in media and publishing, medical technology, and pharmaceuticals. One eff ect of these across-the-board multiple declines is that dividend yields constitute nearly the entirety of average annual TSR—2 percentage points of the sample-average TSR of 2.4 percent.
N1. TSR is a dynamic ratio that includes price gains and dividend payments for a specific stock during a given period. To measure performance from 2007 through 2011, 2006 end-of-year data must be used as a starting point in order to capture the change from 2006 to 2007, which determines 2007 TSR. For this reason, all exhibits in the report showing 2007–2011 performance begin with a 2006 data point.
TSR1 (%) Sales
growth (%)Margin
change (%)Multiple
change (%)Dividendyield (%)
Sharechange2 (%)
Net debt change (%)
Value creation
Fundamental value
Valuationmultiple
Cash flow contribution= + +
Global top ten 56.7Pulp and paper 4.9
Telecommunications 11.6Power and gas utilities 11.7
Metals 12.9Oil and gas 14.3
Multibusiness 14.7Travel and tourism 15.2
Transportation and logistics 16.7Medical technology 17.4
Consumer durables and apparel 18.8Automotive OEMs 19.3
Media and publishing 20.1Pharmaceuticals 22.0
Technology 23.9Consumer nondurables 24.0
Construction and building materials 25.2Retail 25.9
Machinery 26.9Mining 30.6
Automotive components 30.7Chemicals 39.0
23665
208
2517
81212
8131516
1320
16161922
17
1632
–1–10
2–7
924
05
149
11
–28
–22
9
14–3–3
38
0–2
–10213344
–96
–26
–212
50
3266234221121113213422
–11
–90
–14
0–3
31
–1–2
–2
1
–3
–2
2
–2
–10
–1
–1
11
–2
11
0
10–1
0
–12
–5
1–2
–40
4
133
–211
Sources: Thomson Reuters Datastream; Thomson Reuters Worldscope; Bloomberg; company disclosures; BCG analysis.Note: TSR disaggregation is shown in percentage points of five-year average annual TSR; any apparent discrepancies in TSR totals are due to rounding.1Five-year average annual TSR (2007–2011) for weighted average of respective sample.2“Share change” refers to the change in the number of shares outstanding, not to the change in share price.
E | The Top Ten in Every Industry Easily Beat the Sample Average
| I O
V C G T T V T G S, –
GLOBAL RANKINGSTOTAL GLOBAL SAMPLE
T G T T, –
’06 ’07 ’08 ’09 ’10 ’11’06 ’07 ’08 ’09 ’10 ’11’06 ’07 ’08 ’09 ’10 ’11
’06 ’07 ’08 ’09 ’10 ’11 ’06 ’07 ’08 ’09 ’10 ’11Salesgrowth
Marginchange
Multiplechange
Dividendyield
00
5
10
15
1,600
0
1,200
800
400
945876
451
163305
100
118 76
101 115 113
157
107
218
120
281
133
150115
119110
25
20
15
10
5
18.2 18.316.8
20.2
22.323.8
13.115.6 15.6
17.118.2 17.6
4
8
2.3
2.5 2.2
3.1
1.5
1.9 3.6
4.9
2.6
3.3
2.3
1.5
8.6
14.7
6.4
11.4
13.9
10.8
7.17.78.5
6.3
8.97.3
3 2
–4–1
6
–10
–5
25
10
15
20
0
5
23
16 14
0
50
100
150
200
250
300
ƒ
Total global sample, n = 1,003Global top ten
Total shareholder return
2
1
EBITDA multiple1 3
1
TSR index (2006 = 100) Sales index (2006 = 100) EBITDA/revenue (%)
TSR contribution (%) Enterprise value/EBITDA (x) Dividend/stock price (%)
V C G T T V T G S, –
Sources: Thomson Reuters Datastream; Thomson Reuters Worldscope; Bloomberg; annual reports; BCG analysis.Note: n = 1,003 global companies.1Contribution of each factor shown in percentage points of five-year average annual TSR; any apparent discrepancies in TSR totals are due to rounding.2Average annual TSR, 2007–2011.3As of December 31, 2011.4Change in EBITDA multiple.5“Share change” refers to the change in the number of shares outstanding, not to the change in share price.6As of June 30, 2012.
Sources: Thomson Reuters Datastream; Thomson Reuters Worldscope; Bloomberg; annual reports; BCG analysis.1Total sample calculation based on aggregate of entire sample.2Share change and net debt change not shown.3Total sample calculation based on sample average.
TSR Disaggregation1
# Company Location IndustryTSR2 (%)
Market value3
($billions)
Sales growth
(%)
Margin change
(%)
Multiple change4
(%)
Dividend yield(%)
Share change5
(%)
Net debt
change (%)
2012TSR6
(%)
1 Inner Mongolia Yitai Coal China Mining 65.9 7.3 35 10 12 5 0 4 14
2 Nexen Tire South Korea Automotive components 61.3 1.5 25 21 5 1 0 9 9
3 Priceline.com United States Travel and tourism 60.7 23.3 31 41 –9 0 –6 4 42
4 Baidu China Media and publishing 59.5 40.7 77 14 –31 0 –1 0 –1
5Inner Mongolia Baotou Steel Rare-Earth
China Metals 58.7 7.2 48 39 –29 0 0 0 111
6 Industrias Peñoles Mexico Mining 53.5 17.8 21 14 6 10 0 3 –5
7 LG Chem South Korea Chemicals 51.6 18.4 15 7 14 3 –1 14 –8
8 Mexichem Mexico Chemicals 51.0 6.2 32 2 19 2 –3 0 31
9 Aboitiz Equity Ventures Philippines Multibusiness 48.4 5.1 21 18 9 7 –2 –5 26
10 Hyundai Glovis South KoreaTransportation and logistics
48.0 6.3 34 11 7 1 0 –5 13
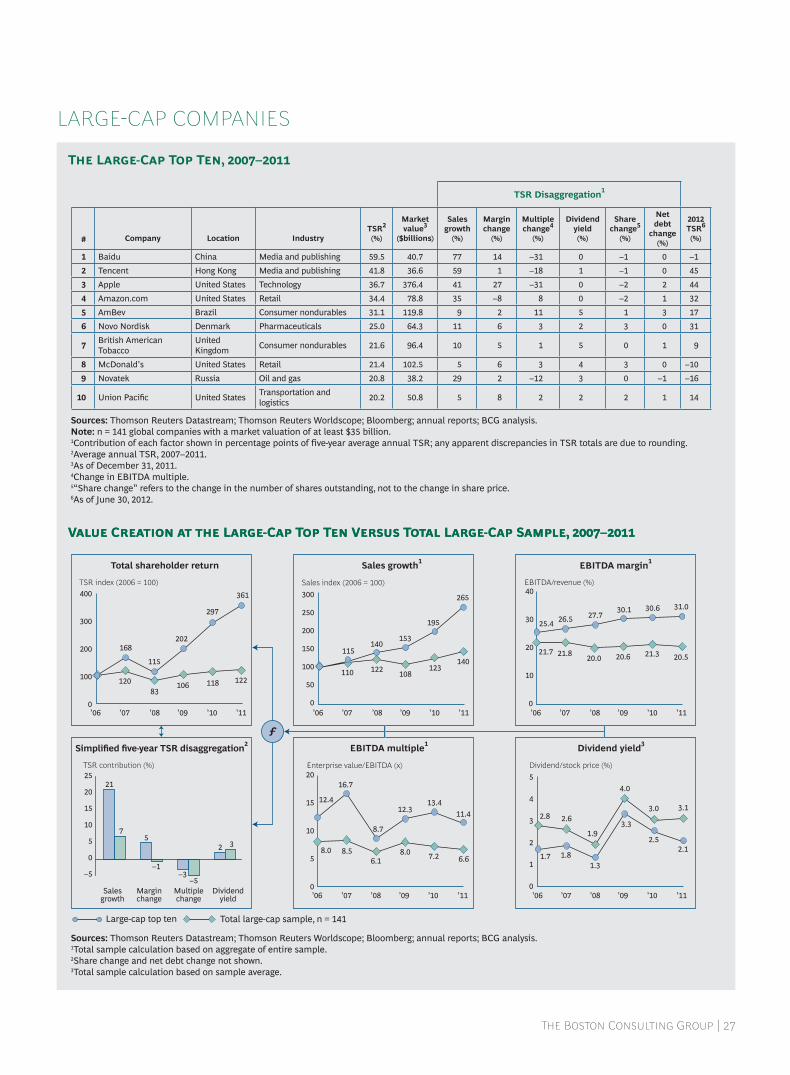
T B C G |
V C L-C T T V T L-C S, –
LARGECAP COMPANIES
T L-C T T, –
122
361
118
297
106
202
83
115
120
168
140
265
123
195
108
153
122
140
110
115
25.4
20.5
31.0
21.3
30.6
20.6
30.1
20.0
27.7
21.8
26.5
21.7
’06 ’07 ’08 ’09 ’10 ’11’06 ’07 ’08 ’09 ’10 ’11’06 ’07 ’08 ’09 ’10 ’11
’06 ’07 ’08 ’09 ’10 ’11 ’06 ’07 ’08 ’09 ’10 ’11Salesgrowth
Marginchange
Multiplechange
Dividendyield
0
1
2
0
5
10
20
15
400
0
300
200
100
40
30
20
10
0
3
4
5
–5
25
10
15
20
0
5
0
50
100
150
200
250
300
3.1
2.1
3.0
2.5
4.0
3.31.9
1.3
2.6
1.8
2.8
1.76.6
11.4
7.2
13.4
8.0
12.3
6.1
8.7
8.5
16.7
8.0
12.4
32
–5–3
–1
57
21
ƒ
Total large-cap sample, n = 141Large-cap top ten
Total shareholder return
2
1
EBITDA multiple1 3
1
TSR index (2006 = 100) Sales index (2006 = 100) EBITDA/revenue (%)
TSR contribution (%) Enterprise value/EBITDA (x) Dividend/stock price (%)
V C L-C T T V T L-C S, –
Sources: Thomson Reuters Datastream; Thomson Reuters Worldscope; Bloomberg; annual reports; BCG analysis.Note: n = 141 global companies with a market valuation of at least $35 billion.1Contribution of each factor shown in percentage points of five-year average annual TSR; any apparent discrepancies in TSR totals are due to rounding.2Average annual TSR, 2007–2011.3As of December 31, 2011.4Change in EBITDA multiple.5“Share change” refers to the change in the number of shares outstanding, not to the change in share price.6As of June 30, 2012.
Sources: Thomson Reuters Datastream; Thomson Reuters Worldscope; Bloomberg; annual reports; BCG analysis.1Total sample calculation based on aggregate of entire sample.2Share change and net debt change not shown.3Total sample calculation based on sample average.
TSR Disaggregation1
# Company Location IndustryTSR2 (%)
Market value3
($billions)
Sales growth
(%)
Margin change
(%)
Multiple change4
(%)
Dividend yield(%)
Share change5
(%)
Net debt
change (%)
2012TSR6
(%)
1 Baidu China Media and publishing 59.5 40.7 77 14 –31 0 –1 0 –1
2 Tencent Hong Kong Media and publishing 41.8 36.6 59 1 –18 1 –1 0 45
3 Apple United States Technology 36.7 376.4 41 27 –31 0 –2 2 44
4 Amazon.com United States Retail 34.4 78.8 35 –8 8 0 –2 1 32
5 AmBev Brazil Consumer nondurables 31.1 119.8 9 2 11 5 1 3 17
6 Novo Nordisk Denmark Pharmaceuticals 25.0 64.3 11 6 3 2 3 0 31
7British American Tobacco
United Kingdom
Consumer nondurables 21.6 96.4 10 5 1 5 0 1 9
8 McDonald’s United States Retail 21.4 102.5 5 6 3 4 3 0 –10
9 Novatek Russia Oil and gas 20.8 38.2 29 2 –12 3 0 –1 –16
10 Union Pacifi c United StatesTransportation and logistics
20.2 50.8 5 8 2 2 2 1 14

| I O
Sources: Thomson Reuters Datastream; Thomson Reuters Worldscope; Bloomberg; annual reports; BCG analysis.1Industry calculation based on aggregate of entire sample.2Share change and net debt change not shown.3Industry sample calculation based on sample average.
’06 ’07 ’08 ’09 ’10 ’11’06 ’07 ’08 ’09 ’10 ’11’06 ’07 ’08 ’09 ’10 ’11
’06 ’07 ’08 ’09 ’10 ’11 ’06 ’07 ’08 ’09 ’10 ’11Salesgrowth
Marginchange
Multiplechange
Dividendyield
0
1
2
0
5
10
15
400
0
300
200
100
20
15
10
5
3
4
–5
25
10
15
20
0
5
0
50
100
150
200
250
300382
43
83
79104 95103
157
217
331
12291
167
268
104
145
109110
117
222
10.59.7
15.0
13.0
8.5
12.8
11.211.4
13.414.2
10.6
12.2
1.5
1.51.8
2.32.7
3.9
0.9
0.9
1.6
2.1
1.9
2.5
6.2
10.7
6.6
10.18.8
5.7
5.56.9
10.4
7.9
9.1
7.922
–5
5
02
4
22
ƒ
Total sample, n = 45Automotive components top ten
Total shareholder return
2
1
EBITDA multiple1 3
1
TSR index (2006 = 100) Sales index (2006 = 100) EBITDA/revenue (%)
TSR contribution (%) Enterprise value/EBITDA (x) Dividend/stock price (%)
Sources: Thomson Reuters Datastream; Thomson Reuters Worldscope; Bloomberg; annual reports; BCG analysis.Note: n = 45 global companies with a market valuation of at least $1.5 billion.1Contribution of each factor shown in percentage points of five-year average annual TSR; any apparent discrepancies in TSR totals are due to rounding.2Average annual TSR, 2007–2011.3As of December 31, 2011.4Change in EBITDA multiple.5“Share change” refers to the change in the number of shares outstanding, not to the change in share price.6As of June 30, 2012.
V C A C T T V I S, –
T A C T T, –
INDUSTRY RANKINGSAUTOMOTIVE COMPONENTS
TSR Disaggregation1
# Company LocationTSR2 (%)
Market value3
($billions)
Sales growth
(%)
Margin change
(%)
Multiple change4
(%)
Dividend yield(%)
Share change5
(%)
Net debt change
(%)
2012TSR6
(%)
1 Nexen Tire South Korea 61.3 1.5 25 21 5 1 0 9 9
2 Astra International Indonesia 41.3 33.5 24 3 6 5 0 3 –6
3 Cheng Shin Rubber Taiwan 35.5 5.4 20 5 3 3 0 5 15
4Huayu Automotive Systems
China 33.3 3.8 60 –21 –14 1 –11 18 0
5 Hyundai Mobis South Korea 29.0 24.6 20 4 5 1 –2 1 –6
6 Xinyi Glass Hong Kong 26.5 2.1 34 –1 –7 6 –3 –2 –7
7 Exide Industries India 25.4 1.8 22 –3 4 2 –2 3 30
8 Hankook Tire South Korea 24.9 5.8 15 –2 6 1 0 3 0
9 LKQ United States 21.2 4.4 33 4 –7 0 –6 –2 11
10 BorgWarner United States 17.3 6.9 9 3 1 1 1 3 3

T B C G |
Sources: Thomson Reuters Datastream; Thomson Reuters Worldscope; Bloomberg; annual reports; BCG analysis.1Industry calculation based on aggregate of entire sample.2Share change and net debt change not shown.3Industry calculation based on sample average.
T A OEM T T, –
V C A OEM T T V I S, –
’06 ’07 ’08 ’09 ’10 ’11’06 ’07 ’08 ’09 ’10 ’11’06 ’07 ’08 ’09 ’10 ’11
’06 ’07 ’08 ’09 ’10 ’11 ’06 ’07 ’08 ’09 ’10 ’11Salesgrowth
Marginchange
Multiplechange
Dividendyield
0
1
2
0
4
2
6
8
300
0
200
100
15
10
5
4
3
5
–5
10
0
5
0
50
100
150
88
264
71 71
172
241
42
6198
161 106
147
97
127
84
98
96
105
108
110
10.6
11.6
10.8
11.3
9.2
11.1
8.7
8.8
12.1
8.8
12.3
9.3
1.6
2.6
2.7
4.4
1.01.5
1.0
1.91.9
1.9
2.8
4.0
5.0
5.9
4.0
5.7
5.0
7.0
4.8
4.44.8
3.13.9
5.2
22
–5
3
–3
5
1
8
ƒ
Total sample, n = 33Automotive OEM top ten
Total shareholder return
2
1
EBITDA multiple1 3
1
TSR index (2006 = 100) Sales index (2006 = 100) EBITDA/revenue (%)
TSR contribution (%) Enterprise value/EBITDA (x) Dividend/stock price (%)
Sources: Thomson Reuters Datastream; Thomson Reuters Worldscope; Bloomberg; annual reports; BCG analysis.Note: n = 33 global companies with a market valuation of at least $2 billion.1Contribution of each factor shown in percentage points of five-year average annual TSR; any apparent discrepancies in TSR totals are due to rounding.2Average annual TSR, 2007–2011.3As of December 31, 2011.4Change in EBITDA multiple.5“Share change” refers to the change in the number of shares outstanding, not to the change in share price.6As of June 30, 2012.
AUTOMOTIVE OEMS
TSR Disaggregation1
# Company LocationTSR2 (%)
Market value3
($billions)
Sales growth
(%)
Margin change
(%)
Multiple change4
(%)
Dividend yield(%)
Share change5
(%)
Net debt change
(%)
2012TSR6
(%)
1 Brilliance Auto Hong Kong 44.7 5.4 –9 28 23 0 –6 9 –20
2 Kia Motors South Korea 38.6 23.8 17 39 –33 1 –3 18 12
3 Great Wall Motors China 33.6 4.4 43 –1 –3 5 –5 –5 39
4 Dongfeng Motor China 30.2 14.8 22 5 –9 2 0 10 –9
5 Hero MotoCorp India 24.3 7.6 19 6 –2 4 0 –3 13
6 Saic Motor China 18.5 24.6 70 –2 –40 1 –5 –5 1
7 Volkswagen Germany 18.1 69.9 9 4 3 3 –3 3 11
8 UMW Malaysia 17.7 2.6 6 11 0 5 –3 –2 33
9 Mahindra & Mahindra India 10.3 8.0 35 –3 –18 2 –4 –2 4
10 Ford United States 7.5 41.1 –3 4 –4 0 –13 24 –10

| I O
’06 ’07 ’08 ’09 ’10 ’11’06 ’07 ’08 ’09 ’10 ’11’06 ’07 ’08 ’09 ’10 ’11
’06 ’07 ’08 ’09 ’10 ’11 ’06 ’07 ’08 ’09 ’10 ’11Salesgrowth
Marginchange
Multiplechange
Dividendyield
0
1
2
0
5
10
15
600
0
400
500
200
100
300
25
15
20
5
10
4
3
5
–5
20
15
0
5
10
0
50
100
150
200
250519
74
171
113139 126141
205
304
530
139
103
144
216
120
144
123112
114
17720.9
17.0
18.9
15.3
17.5
14.5
15.5
16.115.4
15.6 16.0
14.5
1.31.4
1.6
4.3
2.3
2.0
2.72.4
2.82.2
2.6
2.7
10.3
8.9
6.67.4
9.07.6
6.9
5.9
10.5
8.0
9.4
7.232
–4
01
97
17
ƒ
Total sample, n = 97Chemicals top ten
Total shareholder return
2
1
EBITDA multiple1 3
1
TSR index (2006 = 100) Sales index (2006 = 100) EBITDA/revenue (%)
TSR contribution (%) Enterprise value/EBITDA (x) Dividend/stock price (%)
V C C T T V I S, –
Sources: Thomson Reuters Datastream; Thomson Reuters Worldscope; Bloomberg; annual reports; BCG analysis.1Industry calculation based on aggregate of entire sample.2Share change and net debt change not shown.3Industry sample calculation based on sample average.
Sources: Thomson Reuters Datastream; Thomson Reuters Worldscope; Bloomberg; annual reports; BCG analysis.Note: n = 97 global companies with a market valuation of at least $2 billion.1Contribution of each factor shown in percentage points of five-year average annual TSR; any apparent discrepancies in TSR totals are due to rounding.2Average annual TSR, 2007–2011.3As of December 31, 2011.4Change in EBITDA multiple.5“Share change” refers to the change in the number of shares outstanding, not to the change in share price.6As of June 30, 2012.
T C T T, –
CHEMICALS
TSR Disaggregation1
# Company LocationTSR2 (%)
Market value3
($billions)
Sales growth
(%)
Margin change
(%)
Multiple change4
(%)
Dividend yield(%)
Share change5
(%)
Net debt change
(%)
2012TSR6
(%)
1 LG Chem South Korea 51.6 18.4 15 7 14 3 –1 14 –8
2 Mexichem Mexico 51.0 6.2 32 2 19 2 –3 0 31
3 Zhejiang Juhua China 42.1 2.8 16 28 –13 2 –2 12 –17
4 CF Industries United States 42.0 10.3 25 56 –29 1 –5 –5 34
5 Kumho Petrochemical South Korea 40.5 3.7 6 –8 –23 2 –4 68 –28
6 OCI South Korea 36.1 4.6 14 26 –15 1 –4 13 3
7 Honam Petrochemical South Korea 34.9 8.4 23 –5 20 1 0 –5 –21
8 SQM Chile 34.7 15.1 16 9 5 3 0 1 0
9 Croda International United Kingdom 28.7 3.9 17 11 –10 4 0 7 27
10 Cheil Industries South Korea 22.3 4.7 14 –10 17 1 –2 1 –1
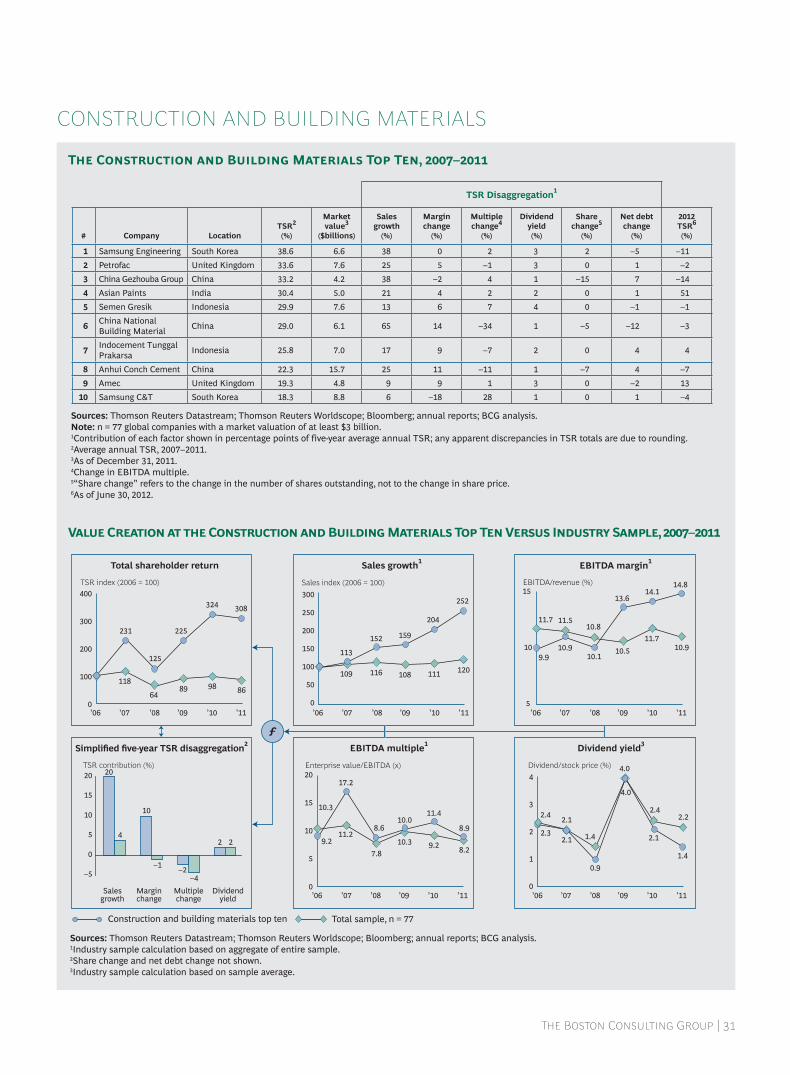
T B C G |
’06 ’07 ’08 ’09 ’10 ’11’06 ’07 ’08 ’09 ’10 ’11’06 ’07 ’08 ’09 ’10 ’11
’06 ’07 ’08 ’09 ’10 ’11 ’06 ’07 ’08 ’09 ’10 ’11Salesgrowth
Marginchange
Multiplechange
Dividendyield
0
1
2
0
5
10
20
15
400
0
200
300
100
15
5
10
3
4
–5
20
15
0
5
10
0
100
50
150
200
250
300
649889
231 225
308
125
324
11886
113
111
159152
204
252
109 108120116
10.811.7
10.510.9
13.6
14.8
10.1
14.1
11.5
10.9
11.7
9.9
1.4
2.4
4.0
2.1
4.0
1.4
0.9
2.1
2.1 2.22.4
2.3
7.89.2
10.0
17.2
10.3
8.98.6
11.4
11.2
8.2
10.3
9.222
–4–2
–1
10
4
20
ƒ
Total sample, n = 77Construction and building materials top ten
Total shareholder return
2
1
EBITDA multiple1 3
1
TSR index (2006 = 100) Sales index (2006 = 100) EBITDA/revenue (%)
TSR contribution (%) Enterprise value/EBITDA (x) Dividend/stock price (%)
V C C B M T T V I S, –
Sources: Thomson Reuters Datastream; Thomson Reuters Worldscope; Bloomberg; annual reports; BCG analysis.1Industry sample calculation based on aggregate of entire sample.2Share change and net debt change not shown.3Industry sample calculation based on sample average.
Sources: Thomson Reuters Datastream; Thomson Reuters Worldscope; Bloomberg; annual reports; BCG analysis.Note: n = 77 global companies with a market valuation of at least $3 billion.1Contribution of each factor shown in percentage points of five-year average annual TSR; any apparent discrepancies in TSR totals are due to rounding.2Average annual TSR, 2007–2011.3As of December 31, 2011.4Change in EBITDA multiple.5“Share change” refers to the change in the number of shares outstanding, not to the change in share price.6As of June 30, 2012.
T C B M T T, –
CONSTRUCTION AND BUILDING MATERIALS
TSR Disaggregation1
# Company LocationTSR2 (%)
Market value3
($billions)
Sales growth
(%)
Margin change
(%)
Multiple change4
(%)
Dividend yield(%)
Share change5
(%)
Net debt change
(%)
2012TSR6
(%)
1 Samsung Engineering South Korea 38.6 6.6 38 0 2 3 2 –5 –11
2 Petrofac United Kingdom 33.6 7.6 25 5 –1 3 0 1 –2
3 China Gezhouba Group China 33.2 4.2 38 –2 4 1 –15 7 –14
4 Asian Paints India 30.4 5.0 21 4 2 2 0 1 51
5 Semen Gresik Indonesia 29.9 7.6 13 6 7 4 0 –1 –1
6China National Building Material
China 29.0 6.1 65 14 –34 1 –5 –12 –3
7Indocement Tunggal Prakarsa
Indonesia 25.8 7.0 17 9 –7 2 0 4 4
8 Anhui Conch Cement China 22.3 15.7 25 11 –11 1 –7 4 –7
9 Amec United Kingdom 19.3 4.8 9 9 1 3 0 –2 13
10 Samsung C&T South Korea 18.3 8.8 6 –18 28 1 0 1 –4
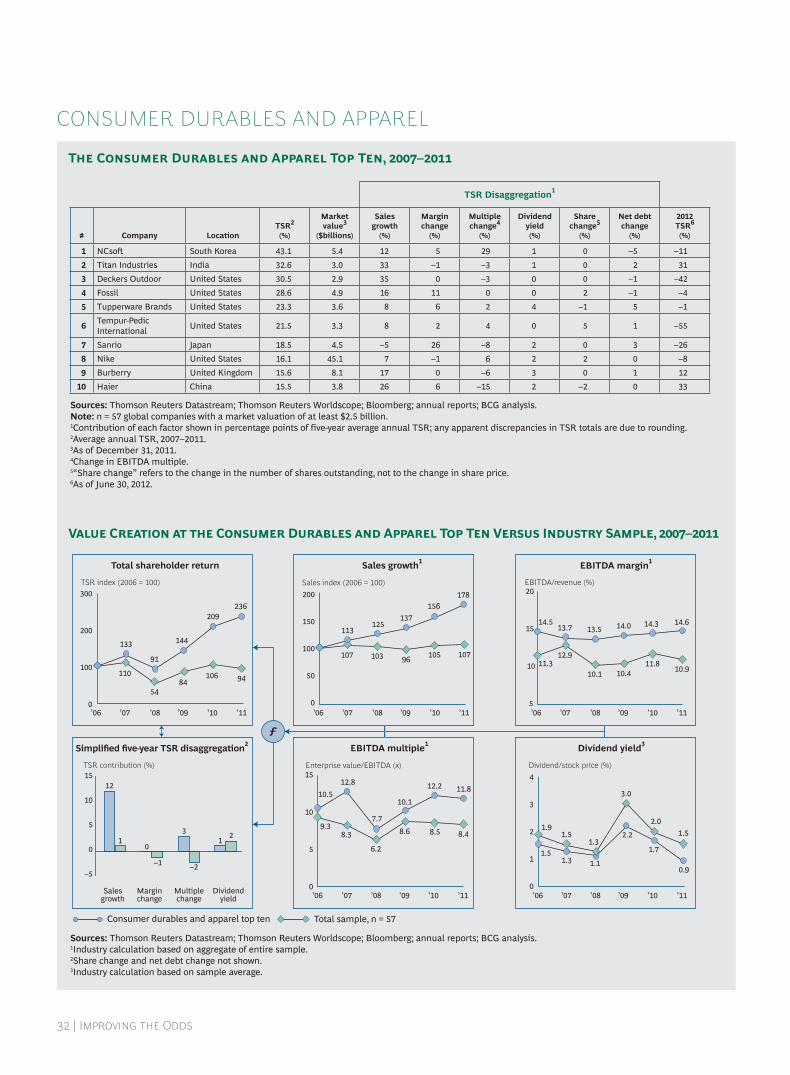
| I O
Sources: Thomson Reuters Datastream; Thomson Reuters Worldscope; Bloomberg; annual reports; BCG analysis.1Industry calculation based on aggregate of entire sample.2Share change and net debt change not shown.3Industry calculation based on sample average.
’06 ’07 ’08 ’09 ’10 ’11’06 ’07 ’08 ’09 ’10 ’11’06 ’07 ’08 ’09 ’10 ’11
’06 ’07 ’08 ’09 ’10 ’11 ’06 ’07 ’08 ’09 ’10 ’11Salesgrowth
Marginchange
Multiplechange
Dividendyield
0
1
2
0
5
10
15
300
0
200
100
20
15
5
10
3
4
–5
15
0
5
10
0
100
50
150
200
91
5484
11094106
133 144
209236
107
178
105
156
96
137
103
125
107
113
10.9
14.6
11.8
14.3
10.4
14.0
10.111.3
14.513.5
12.9
13.7
0.9
1.3
1.1
3.0
1.5 1.52.0
1.3
2.2
1.7
1.9
1.5
8.4
12.2 11.8
8.58.6
10.1
6.2
7.79.3
10.5
8.3
12.8
21
–2
3
–1
01
12
ƒ
Total sample, n = 57Consumer durables and apparel top ten
Total shareholder return
2
1
EBITDA multiple1 3
1
TSR index (2006 = 100) Sales index (2006 = 100) EBITDA/revenue (%)
TSR contribution (%) Enterprise value/EBITDA (x) Dividend/stock price (%)
V C C D A T T V I S, –
Sources: Thomson Reuters Datastream; Thomson Reuters Worldscope; Bloomberg; annual reports; BCG analysis.Note: n = 57 global companies with a market valuation of at least $2.5 billion.1Contribution of each factor shown in percentage points of five-year average annual TSR; any apparent discrepancies in TSR totals are due to rounding.2Average annual TSR, 2007–2011.3As of December 31, 2011.4Change in EBITDA multiple.5“Share change” refers to the change in the number of shares outstanding, not to the change in share price.6As of June 30, 2012.
T C D A T T, –
CONSUMER DURABLES AND APPAREL
TSR Disaggregation1
# Company LocationTSR2 (%)
Market value3
($billions)
Sales growth
(%)
Margin change
(%)
Multiple change4
(%)
Dividend yield(%)
Share change5
(%)
Net debt change
(%)
2012TSR6
(%)
1 NCso South Korea 43.1 5.4 12 5 29 1 0 –5 –11
2 Titan Industries India 32.6 3.0 33 –1 –3 1 0 2 31
3 Deckers Outdoor United States 30.5 2.9 35 0 –3 0 0 –1 –42
4 Fossil United States 28.6 4.9 16 11 0 0 2 –1 –4
5 Tupperware Brands United States 23.3 3.6 8 6 2 4 –1 5 –1
6Tempur-Pedic International
United States 21.5 3.3 8 2 4 0 5 1 –55
7 Sanrio Japan 18.5 4.5 –5 26 –8 2 0 3 –26
8 Nike United States 16.1 45.1 7 –1 6 2 2 0 –8
9 Burberry United Kingdom 15.6 8.1 17 0 –6 3 0 1 12
10 Haier China 15.5 3.8 26 6 –15 2 –2 0 33

T B C G |
Sources: Thomson Reuters Datastream; Thomson Reuters Worldscope; Bloomberg; annual reports; BCG analysis.1Industry calculation based on aggregate of entire sample.2Share change and net debt change not shown.3Industry calculation based on sample average.
’06 ’07 ’08 ’09 ’10 ’11’06 ’07 ’08 ’09 ’10 ’11’06 ’07 ’08 ’09 ’10 ’11
’06 ’07 ’08 ’09 ’10 ’11 ’06 ’07 ’08 ’09 ’10 ’11Salesgrowth
Marginchange
Multiplechange
Dividendyield
0
1
2
0
5
10
15
300
0
200
100
40
20
30
0
10
3
4
–5
15
0
5
10
0
100
50
150
200
123
148
140122 128
133
188168
111
112
20.0
28.6
19.818.5
29.1 29.827.6
20.4
28.7
20.420.3
28.8
11.4
10.1
11.0 11.2
13.6
11.7 12.4
9.6
12.4
11.6
11.0
13.3 3.8
2.5
3.1
3.3
3.1
1.9
2.7
2.0
3.8
3.23.0
4.0
117121
113151
293
134
143
91
171
224
33
0
6
–1
1
7
13
ƒ
Total sample, n = 54Consumer nondurables top ten
Total shareholder return
2
1
EBITDA multiple1 3
1
TSR index (2006 = 100) Sales index (2006 = 100) EBITDA/revenue (%)
TSR contribution (%) Enterprise value/EBITDA (x) Dividend/stock price (%)
V C C N T T V I S, –
Sources: Thomson Reuters Datastream; Thomson Reuters Worldscope; Bloomberg; annual reports; BCG analysis.Note: n = 54 global companies with a market valuation of at least $9 billion.1Contribution of each factor shown in percentage points of five-year average annual TSR; any apparent discrepancies in TSR totals are due to rounding.2Average annual TSR, 2007–2011.3As of December 31, 2011.4Change in EBITDA multiple.5“Share change” refers to the change in the number of shares outstanding, not to the change in share price.6As of June 30, 2012.
T C N T T, –
CONSUMER NONDURABLES
TSR Disaggregation1
# Company LocationTSR2 (%)
Market value3
($billions)
Sales growth
(%)
Margin change
(%)
Multiple change4
(%)
Dividend yield(%)
Share change5
(%)
Net debt change
(%)
2012TSR6
(%)
1 Hengan International Hong Kong 33.1 11.5 33 –5 4 3 –3 1 4
2 AmBev Brazil 31.1 119.8 9 2 11 5 1 3 17
3 Tingyi Hong Kong 27.6 17.0 28 –7 6 2 0 0 –15
4 Estée Lauder United States 24.0 22.2 6 4 11 2 1 0 –4
5British American Tobacco
United Kingdom 21.6 96.4 10 5 1 5 0 1 9
6 BRF Brazil 21.1 18.1 38 15 –16 2 –18 0 –16
7 ITC Ltd. India 20.8 31.4 15 2 2 3 –1 0 31
8 Kweichow Moutai China 20.3 31.7 30 7 –19 1 0 1 24
9 Femsa Mexico 19.8 26.4 10 –4 9 1 0 3 24
10 Lorillard United States 17.2 15.0 8 1 2 5 6 –4 19

| I O
Sources: Thomson Reuters Datastream; Thomson Reuters Worldscope; Bloomberg; annual reports; BCG analysis.1Industry calculation based on aggregate of entire sample.2Share change and net debt change not shown.3Industry calculation based on sample average.
’06 ’07 ’08 ’09 ’10 ’11’06 ’07 ’08 ’09 ’10 ’11’06 ’07 ’08 ’09 ’10 ’11
’06 ’07 ’08 ’09 ’10 ’11 ’06 ’07 ’08 ’09 ’10 ’11Salesgrowth
Marginchange
Multiplechange
Dividendyield
0
1
2
0
5
10
15
400
300
0
200
100
20
15
0
10
3
5
4
–10
–5
20
0
5
10
15
0
100
50
150
250
200
122 123114
124137
213
144
174
113
137
15.2
15.2
13.414.8
17.4
18.9
15.1
19.0
15.3
15.514.1
13.7
6.2
9.99.7
12.4
10.1 10.4
6.6
11.7
10.8
8.3
10.6
10.4
1.12.5
3.8
1.5
4.1
2.3
1.1
3.7
1.9
1.91.8
2.0
71
130101
167179
329
87
303
131 118
23
–6
–2
2
86
16
ƒ
Total sample, n = 70Machinery top ten
Total shareholder return
2
1
EBITDA multiple1 3
1
TSR index (2006 = 100) Sales index (2006 = 100) EBITDA/revenue (%)
TSR contribution (%) Enterprise value/EBITDA (x) Dividend/stock price (%)
V C M T T V I S, –
Sources: Thomson Reuters Datastream; Thomson Reuters Worldscope; Bloomberg; annual reports; BCG analysis.Note: n = 70 global companies with a market valuation of at least $6 billion.1Contribution of each factor shown in percentage points of five-year average annual TSR; any apparent discrepancies in TSR totals are due to rounding.2Average annual TSR, 2007–2011.3As of December 31, 2011.4Change in EBITDA multiple.5“Share change” refers to the change in the number of shares outstanding, not to the change in share price.6As of June 30, 2012.7Goodrich was acquired by United Technologies in July 2012.
T M T T, –
MACHINERY
TSR Disaggregation1
# Company LocationTSR2 (%)
Market value3
($billions)
Sales growth
(%)
Margin change
(%)
Multiple change4
(%)
Dividend yield(%)
Share change5
(%)
Net debt change
(%)
2012TSR6
(%)
1 Sany Heavy Industry China 41.3 15.0 58 7 –21 1 –2 –1 11
2 United Tractors Indonesia 37.9 11.0 32 4 –1 4 –4 3 –18
3 Weichai Power China 35.8 8.2 55 –6 –17 1 –9 11 –20
4 Weir Group United Kingdom 33.8 6.7 21 16 –5 4 0 –3 –24
5 FMC Technologies United States 27.7 12.4 6 6 13 0 2 0 –25
6 Cummins United States 26.2 16.7 10 4 6 2 1 3 11
7 Goodrich7 United States 24.1 15.5 7 6 4 2 0 4 3
8 W.W. Grainger United States 24.0 13.1 7 5 8 2 4 –2 3
9 Fastenal United States 21.7 12.9 9 3 7 2 0 0 –7
10 Seadrill Norway 20.1 16.0 29 12 –20 6 –4 –3 11
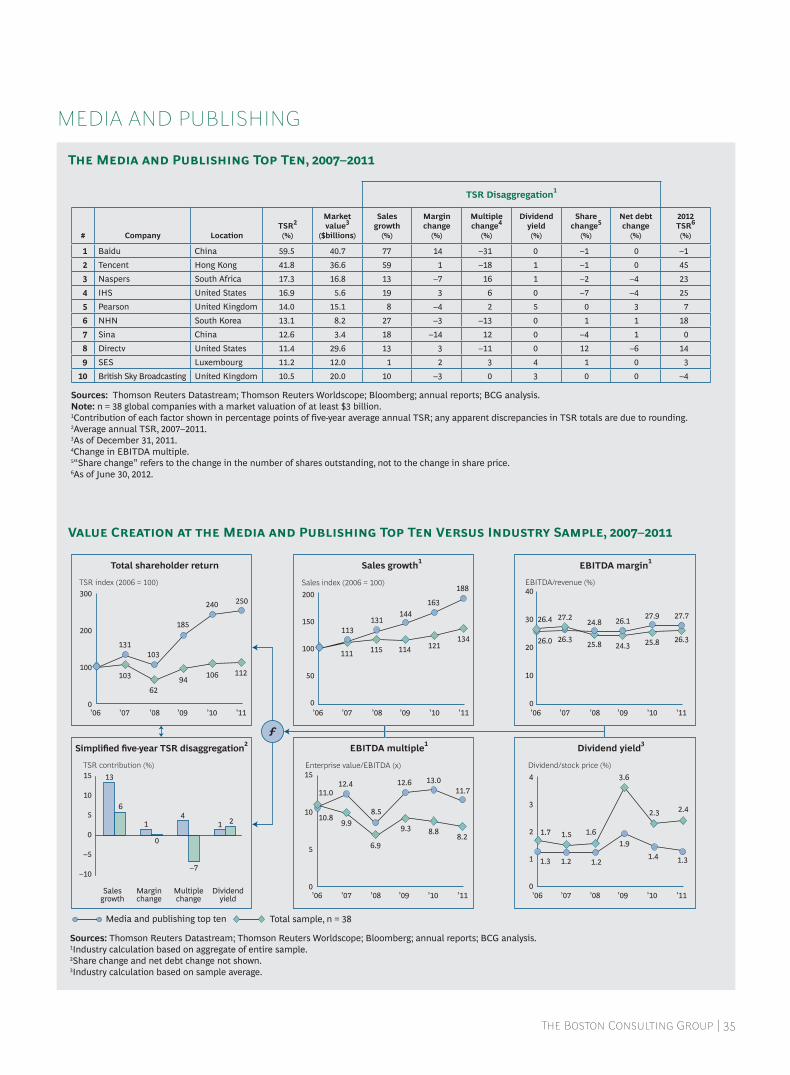
T B C G |
Sources: Thomson Reuters Datastream; Thomson Reuters Worldscope; Bloomberg; annual reports; BCG analysis.1Industry calculation based on aggregate of entire sample.2Share change and net debt change not shown.3Industry calculation based on sample average.
’06 ’07 ’08 ’09 ’10 ’11’06 ’07 ’08 ’09 ’10 ’11’06 ’07 ’08 ’09 ’10 ’11
’06 ’07 ’08 ’09 ’10 ’11 ’06 ’07 ’08 ’09 ’10 ’11Salesgrowth
Marginchange
Multiplechange
Dividendyield
0
1
2
0
5
10
15
300
0
200
100
40
20
30
0
10
3
4
–10
15
0
–5
5
10
0
100
50
150
200
115 121114
113
144
188
131
163
111
134
24.8
25.824.326.3
26.127.7
25.8
27.927.2
26.3
26.4
26.0
6.9
8.89.3
12.4 12.611.7
8.5
13.0
9.9
8.2
11.0
10.8
1.6
2.3
3.6
1.2
1.9
1.31.21.4
1.5
2.4
1.7
1.3
62
10694
131
185
250
103
240
103 112
21
–7
4
0
1
6
13
ƒ
Total sample, n = 38Media and publishing top ten
Total shareholder return
2
1
EBITDA multiple1 3
1
TSR index (2006 = 100) Sales index (2006 = 100) EBITDA/revenue (%)
TSR contribution (%) Enterprise value/EBITDA (x) Dividend/stock price (%)
V C M P T T V I S, –
Sources: Thomson Reuters Datastream; Thomson Reuters Worldscope; Bloomberg; annual reports; BCG analysis.Note: n = 38 global companies with a market valuation of at least $3 billion.1Contribution of each factor shown in percentage points of five-year average annual TSR; any apparent discrepancies in TSR totals are due to rounding.2Average annual TSR, 2007–2011.3As of December 31, 2011.4Change in EBITDA multiple.5“Share change” refers to the change in the number of shares outstanding, not to the change in share price.6As of June 30, 2012.
T M P T T, –
MEDIA AND PUBLISHING
TSR Disaggregation1
# Company LocationTSR2 (%)
Market value3
($billions)
Sales growth
(%)
Margin change
(%)
Multiple change4
(%)
Dividend yield(%)
Share change5
(%)
Net debt change
(%)
2012TSR6
(%)
1 Baidu China 59.5 40.7 77 14 –31 0 –1 0 –1
2 Tencent Hong Kong 41.8 36.6 59 1 –18 1 –1 0 45
3 Naspers South Africa 17.3 16.8 13 –7 16 1 –2 –4 23
4 IHS United States 16.9 5.6 19 3 6 0 –7 –4 25
5 Pearson United Kingdom 14.0 15.1 8 –4 2 5 0 3 7
6 NHN South Korea 13.1 8.2 27 –3 –13 0 1 1 18
7 Sina China 12.6 3.4 18 –14 12 0 –4 1 0
8 Directv United States 11.4 29.6 13 3 –11 0 12 –6 14
9 SES Luxembourg 11.2 12.0 1 2 3 4 1 0 3
10 British Sky Broadcasting United Kingdom 10.5 20.0 10 –3 0 3 0 0 –4
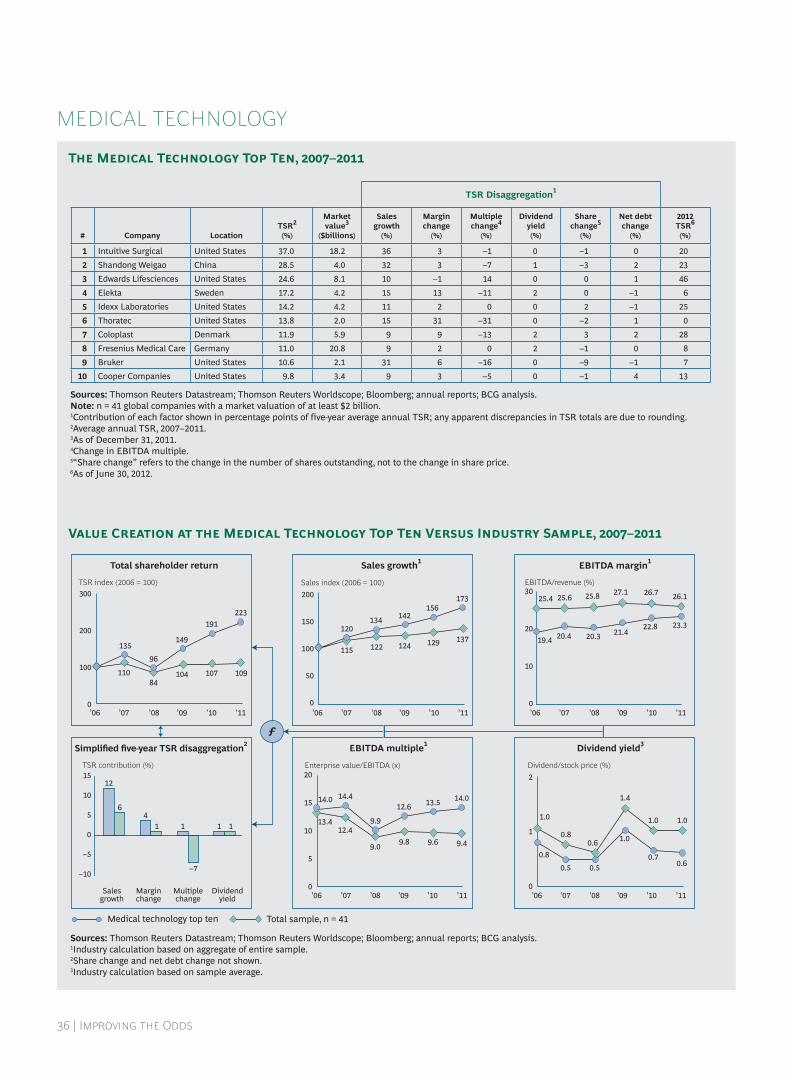
| I O
Sources: Thomson Reuters Datastream; Thomson Reuters Worldscope; Bloomberg; annual reports; BCG analysis.1Industry calculation based on aggregate of entire sample.2Share change and net debt change not shown.3Industry calculation based on sample average.
V C M T T T V I S, –
’06 ’07 ’08 ’09 ’10 ’11’06 ’07 ’08 ’09 ’10 ’11’06 ’07 ’08 ’09 ’10 ’11
’06 ’07 ’08 ’09 ’10 ’11 ’06 ’07 ’08 ’09 ’10 ’11Salesgrowth
Marginchange
Multiplechange
Dividendyield
0
1
0
5
10
20
15
300
0
200
100
30
20
0
10
2
–10
–5
15
0
5
10
0
100
50
150
200
124
173
115137
122 129
120
142134
156
27.1
23.3
25.6 26.125.8 26.7
20.4 21.420.322.8
25.4
19.4
9.8
14.0
12.4
9.49.0 9.6
14.412.6
9.9
13.5
13.4
14.0 1.4
0.6
0.8
1.0
0.6
1.0
0.5
1.0
0.50.7
1.0
0.8
84107104
135149
223
96
191
110 109
11
–7
114
6
12
ƒ
Total sample, n = 41Medical technology top ten
Total shareholder return
2
1
EBITDA multiple1 3
1
TSR index (2006 = 100) Sales index (2006 = 100) EBITDA/revenue (%)
TSR contribution (%) Enterprise value/EBITDA (x) Dividend/stock price (%)
Sources: Thomson Reuters Datastream; Thomson Reuters Worldscope; Bloomberg; annual reports; BCG analysis.Note: n = 41 global companies with a market valuation of at least $2 billion.1Contribution of each factor shown in percentage points of five-year average annual TSR; any apparent discrepancies in TSR totals are due to rounding.2Average annual TSR, 2007–2011.3As of December 31, 2011.4Change in EBITDA multiple.5“Share change” refers to the change in the number of shares outstanding, not to the change in share price.6As of June 30, 2012.
T M T T T, –
MEDICAL TECHNOLOGY
TSR Disaggregation1
# Company LocationTSR2 (%)
Market value3
($billions)
Sales growth
(%)
Margin change
(%)
Multiple change4
(%)
Dividend yield(%)
Share change5
(%)
Net debt change
(%)
2012TSR6
(%)
1 Intuitive Surgical United States 37.0 18.2 36 3 –1 0 –1 0 20
2 Shandong Weigao China 28.5 4.0 32 3 –7 1 –3 2 23
3 Edwards Lifesciences United States 24.6 8.1 10 –1 14 0 0 1 46
4 Elekta Sweden 17.2 4.2 15 13 –11 2 0 –1 6
5 Idexx Laboratories United States 14.2 4.2 11 2 0 0 2 –1 25
6 Thoratec United States 13.8 2.0 15 31 –31 0 –2 1 0
7 Coloplast Denmark 11.9 5.9 9 9 –13 2 3 2 28
8 Fresenius Medical Care Germany 11.0 20.8 9 2 0 2 –1 0 8
9 Bruker United States 10.6 2.1 31 6 –16 0 –9 –1 7
10 Cooper Companies United States 9.8 3.4 9 3 –5 0 –1 4 13

T B C G |
Sources: Thomson Reuters Datastream; Thomson Reuters Worldscope; Bloomberg; annual reports; BCG analysis.1Industry calculation based on aggregate of entire sample.2Share change and net debt change not shown.3Industry calculation based on sample average.
’06 ’07 ’08 ’09 ’10 ’11’06 ’07 ’08 ’09 ’10 ’11’06 ’07 ’08 ’09 ’10 ’11
’06 ’07 ’08 ’09 ’10 ’11 ’06 ’07 ’08 ’09 ’10 ’11Salesgrowth
Marginchange
Multiplechange
Dividendyield
0
2
1
0
5
10
15
300
0
200
100
25
20
15
0
10
7
5
6
4
3
–15
–5
–10
20
15
0
5
10
0
100
50
200
150
300
250
132
251
116
204
94
139
135
166
122
129
11.1
15.4
12.8
18.3
10.1
17.1
15.8
20.8
17.9
22.7
20.9
24.2
7.5
7.3
9.0
9.0
14.3
12.2
4.5
4.57.7
9.3
5.8
5.3
1.4
1.51.4
1.3
4.1
3.9
1.3
1.2
4.1
4.6
6.5
6.2
65
183
100
252
107
239
61
112
148
229
225
8
–13–10
6
20
ƒ
Total sample, n = 29Metals top ten
Total shareholder return
2
1
EBITDA multiple1 3
1
TSR index (2006 = 100) Sales index (2006 = 100) EBITDA/revenue (%)
TSR contribution (%) Enterprise value/EBITDA (x) Dividend/stock price (%)
V C M T T V I S, –
Sources: Thomson Reuters Datastream; Thomson Reuters Worldscope; Bloomberg; annual reports; BCG analysis.Note: n = 29 global companies with a market valuation of at least $4 billion.1Contribution of each factor shown in percentage points of five-year average annual TSR; any apparent discrepancies in TSR totals are due to rounding.2Average annual TSR, 2007–2011.3As of December 31, 2011.4Change in EBITDA multiple.5“Share change” refers to the change in the number of shares outstanding, not to the change in share price.6As of June 30, 2012.
T M T T, –
METALS
TSR Disaggregation1
# Company LocationTSR2 (%)
Market value3
($billions)
Sales growth
(%)
Margin change
(%)
Multiple change4
(%)
Dividend yield(%)
Share change5
(%)
Net debt change
(%)
2012TSR6
(%)
1Inner Mongolia Baotou Steel Rare-Earth
China 58.7 7.2 48 39 –29 0 0 0 111
2 Jindal Steel & Power India 43.4 8.5 39 –1 0 1 0 5 4
3 Korea Zinc South Korea 27.2 4.7 13 –1 7 2 0 6 27
4 Hyundai Steel South Korea 24.0 7.1 20 –2 9 1 0 –4 –12
5 CAP Chile 21.7 5.8 23 20 –25 4 0 0 –1
6 Jiangxi Copper China 14.8 12.0 37 –32 11 2 –4 1 9
7 Companhia Siderúrgica Nacional Brazil 11.8 12.5 13 0 –6 7 1 –3 –20
8Inner Mongolia Baotou Steel Union
China 6.6 4.2 18 –4 10 1 –12 –7 19
9 Posco South Korea 6.4 25.9 22 –17 10 2 0 –10 –4
10 China Steel Taiwan 5.4 14.2 8 –14 15 5 –2 –7 –3

| I O
Sources: Thomson Reuters Datastream; Thomson Reuters Worldscope; Bloomberg; annual reports; BCG analysis.1Industry calculation based on aggregate of entire sample.2Share change and net debt change not shown.3Industry calculation based on sample average.
’06 ’07 ’08 ’09 ’10 ’11’06 ’07 ’08 ’09 ’10 ’11’06 ’07 ’08 ’09 ’10 ’11
’06 ’07 ’08 ’09 ’10 ’11 ’06 ’07 ’08 ’09 ’10 ’11Salesgrowth
Marginchange
Multiplechange
Dividendyield
0
2
1
0
5
10
15
500
0
200
300
400
100
60
40
0
20
8
7
5
6
4
3
–15
–10
–5
20
15
0
5
10
0
100
50
200
150
250
115
134
184160
242
136
138
221
181
124
39.6
39.6
42.2
35.0
35.5
45.1
42.2
43.543.9
34.3
41.7
45.3
5.6
4.2
11.7
10.5
7.4
12.0
8.2
3.85.5
6.58.6
10.2
3.5
8.0
2.9
3.03.0
3.7
1.62.0
4.6
2.3
1.0
1.7
87
185152
219
289
380
120
439
163 146
24
–11
12
2
–2
1719
ƒ
Total sample, n = 35Mining top ten
Total shareholder return
2
1
EBITDA multiple1 3
1
TSR index (2006 = 100) Sales index (2006 = 100) EBITDA/revenue (%)
TSR contribution (%) Enterprise value/EBITDA (x) Dividend/stock price (%)
V C M T T V I S, –
Sources: Thomson Reuters Datastream; Thomson Reuters Worldscope; Bloomberg; annual reports; BCG analysis.Note: n = 35 global companies with a market valuation of at least $7 billion.1Contribution of each factor shown in percentage points of five-year average annual TSR; any apparent discrepancies in TSR totals are due to rounding.2Average annual TSR, 2007–2011.3As of December 31, 2011.4Change in EBITDA multiple.5“Share change” refers to the change in the number of shares outstanding, not to the change in share price.6As of June 30, 2012.
T M T T, –
MINING
TSR Disaggregation1
# Company LocationTSR2 (%)
Market value3
($billions)
Sales growth
(%)
Margin change
(%)
Multiple change4
(%)
Dividend yield(%)
Share change5
(%)
Net debt change
(%)
2012TSR6
(%)
1 Inner Mongolia Yitai Coal China 65.9 7.3 35 10 12 5 0 4 14
2 Industrias Peñoles Mexico 53.5 17.8 21 14 6 10 0 3 –5
3 Randgold Resources United Kingdom 41.1 9.4 34 8 5 0 –6 –1 –12
4Shanxi Lu’An Environmental Energy Development
China 39.0 7.7 22 5 14 4 0 –6 0
5 Grupo México Mexico 28.8 21.6 13 –5 16 3 1 0 11
6 Exxaro Resources South Africa 27.9 7.5 11 38 –25 3 0 0 16
7 Yanzhou Coal Mining China 24.4 10.5 28 2 0 5 0 –10 –28
8 Antofagasta United Kingdom 24.2 18.7 9 –6 17 6 0 –2 –9
9 Cliff s Natural Resources United States 21.9 8.9 29 16 –6 1 –10 –7 –20
10 Buenaventura Peru 19.5 9.6 21 –2 0 1 0 –1 –1

T B C G |
Sources: Thomson Reuters Datastream; Thomson Reuters Worldscope; Bloomberg; annual reports; BCG analysis.1Industry calculation based on aggregate of entire sample.2Share change and net debt change not shown.3Industry calculation based on sample average.
’06 ’07 ’08 ’09 ’10 ’11’06 ’07 ’08 ’09 ’10 ’11’06 ’07 ’08 ’09 ’10 ’11
’06 ’07 ’08 ’09 ’10 ’11 ’06 ’07 ’08 ’09 ’10 ’11Salesgrowth
Marginchange
Multiplechange
Dividendyield
0
2
1
0
5
10
15
300
0
200
100
15
0
10
8
7
5
6
4
3
–10
–5
25
20
15
0
5
10
0
100
50
250
200
150
350
300
120
311
110
235
103
168
115
178
111
138
11.5
8.9
12.0
11.211.1
12.111.3
10.7
12.7
11.7
12.1
12.0
7.5
7.3
10.9
13.011.2
11.6
9.2
11.1
9.8
12.2
10.0
12.4
2.8
2.4
3.4
4.6
4.9
7.5
1.6
2.12.9
3.6
3.1
4.0
90
199
98
222
79
167
59
95119
164
34
–4–2–1
–7
4
25
ƒ
Total sample, n = 39Multibusiness top ten
Total shareholder return
2
1
EBITDA multiple1 3
1
TSR index (2006 = 100) Sales index (2006 = 100) EBITDA/revenue (%)
TSR contribution (%) Enterprise value/EBITDA (x) Dividend/stock price (%)
V C M T T V I S, –
Sources: Thomson Reuters Datastream; Thomson Reuters Worldscope; Bloomberg; annual reports; BCG analysis.Note: n = 39 global companies with a market valuation of at least $4 billion.1Contribution of each factor shown in percentage points of five-year average annual TSR; any apparent discrepancies in TSR totals are due to rounding.2Average annual TSR, 2007–2011.3As of December 31, 2011.4Change in EBITDA multiple.5“Share change” refers to the change in the number of shares outstanding, not to the change in share price.6As of June 30, 2012.
T M T T, –
MULTIBUSINESS
TSR Disaggregation1
# Company LocationTSR2 (%)
Market value3
($billions)
Sales growth
(%)
Margin change
(%)
Multiple change4
(%)
Dividend yield(%)
Share change5
(%)
Net debt change
(%)
2012TSR6
(%)
1 Aboitiz Equity Ventures Philippines 48.4 5.1 21 18 9 7 –2 –5 26
2 Beijing Enterprises Hong Kong 25.0 6.8 33 –5 –5 2 2 –2 1
3 Jardine Matheson Singapore 20.4 17.0 18 6 0 4 –4 –3 5
4 Alfa Mexico 18.4 6.0 19 1 0 3 2 –5 41
5 Industries Qatar Qatar 17.6 20.1 16 2 –6 7 0 –1 1
6 Noble Group Singapore 16.0 5.7 42 –9 –9 4 –7 –5 0
7 WEG Brazil 10.5 6.6 12 –5 2 3 0 –1 5
8 Fraser and Neave Singapore 9.9 6.9 11 1 –6 3 –4 4 15
9 Keppel Singapore 8.3 13.1 6 –3 5 5 –1 –4 13
10 Wharf Holdings Hong Kong 8.0 13.7 12 –1 –1 3 –3 –2 23

| I O
Sources: Thomson Reuters Datastream; Thomson Reuters Worldscope; Bloomberg; annual reports; BCG analysis.1Industry calculation based on aggregate of entire sample.2Share change and net debt change not shown.3Industry calculation based on sample average.
’06 ’07 ’08 ’09 ’10 ’11’06 ’07 ’08 ’09 ’10 ’11’06 ’07 ’08 ’09 ’10 ’11
’06 ’07 ’08 ’09 ’10 ’11 ’06 ’07 ’08 ’09 ’10 ’11Salesgrowth
Marginchange
Multiplechange
Dividendyield
0
2
1
0
4
2
6
8
200
0
100
30
20
0
10
7
5
6
4
3
–5
10
0
5
0
100
50
150
200
139
145
153
120
109
96109
136115
94
17.6
27.3
18.618.4
23.323.9
19.0
23.2
22.321.1
26.825.0
7.07.1
5.2
5.23.9 6.6
4.8
3.8
5.5
5.6
6.1
7.7
2.7
2.32.9
3.34.8
6.7
1.6
1.3
2.83.2
2.8 2.8
195
116
185
107
143
87
107128
149
121
33
–2
0
–5
2
98
ƒ
Total sample, n = 34Oil and gas top ten
Total shareholder return
2
1
EBITDA multiple1 3
1
TSR index (2006 = 100) Sales index (2006 = 100) EBITDA/revenue (%)
TSR contribution (%) Enterprise value/EBITDA (x) Dividend/stock price (%)
V C O G T T V I S, –
Sources: Thomson Reuters Datastream; Thomson Reuters Worldscope; Bloomberg; annual reports; BCG analysis.Note: n = 34 global companies with a market valuation of at least $15 billion.1Contribution of each factor shown in percentage points of five-year average annual TSR; any apparent discrepancies in TSR totals are due to rounding.2Average annual TSR, 2007–2011.3As of December 31, 2011.4Change in EBITDA multiple.5“Share change” refers to the change in the number of shares outstanding, not to the change in share price.6As of June 30, 2012.
T O G T T, –
OIL AND GAS
TSR Disaggregation1
# Company LocationTSR2 (%)
Market value3
($billions)
Sales growth
(%)
Margin change
(%)
Multiple change4
(%)
Dividend yield(%)
Share change5
(%)
Net debt change
(%)
2012TSR6
(%)
1 Tullow Oil United Kingdom 29.6 19.8 17 –1 21 1 –6 –2 5
2 Novatek Russia 20.8 38.2 29 2 –12 3 0 –1 –16
3 Williams Partners United States 17.7 17.4 64 0 –26 12 –33 1 –11
4 CNOOC Hong Kong 16.8 78.1 22 –3 –7 4 –1 1 16
5 Occidental Petroleum United States 16.0 76.0 7 2 5 2 1 0 –7
6 BG Group United Kingdom 15.9 77.4 10 –1 9 1 0 –2 –5
7 Noble Energy United States 15.1 16.8 5 –3 11 1 –1 1 –10
8 PTT Thailand 12.8 28.9 15 –8 3 4 0 –1 4
9 Anadarko Petroleum United States 12.6 38.0 6 –3 1 1 –1 9 –13
10 Chevron United States 11.3 210.8 4 4 –2 4 2 0 1
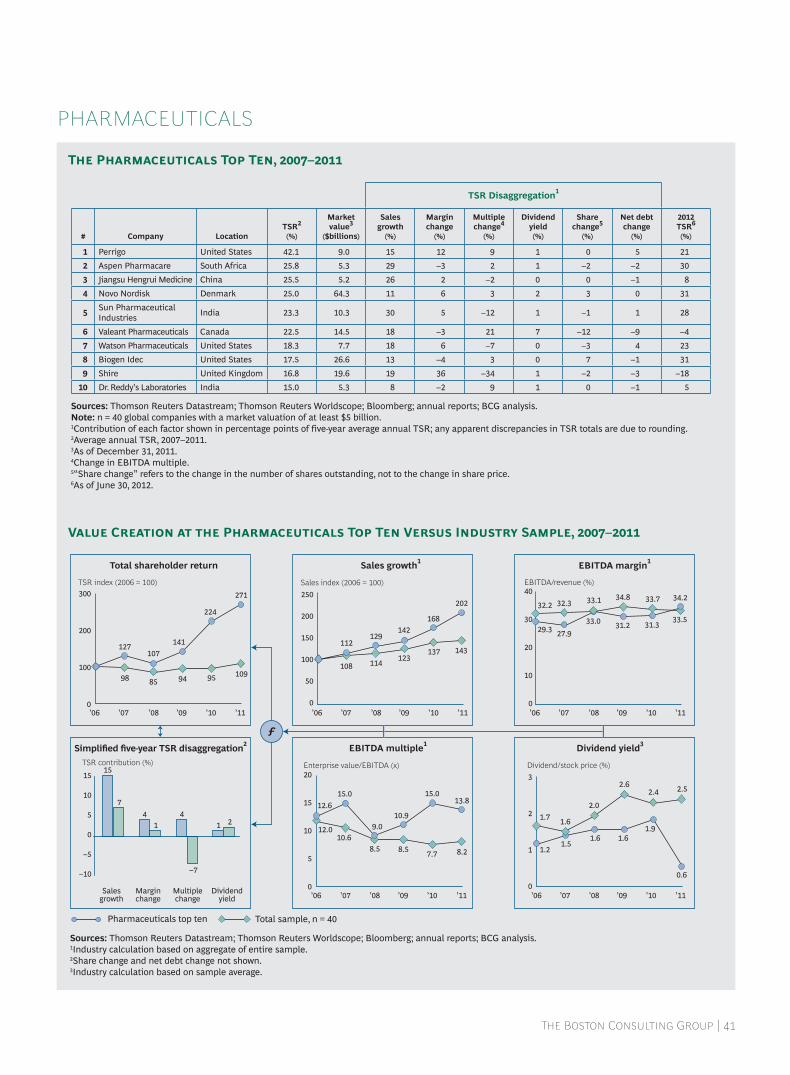
T B C G |
Sources: Thomson Reuters Datastream; Thomson Reuters Worldscope; Bloomberg; annual reports; BCG analysis.1Industry calculation based on aggregate of entire sample.2Share change and net debt change not shown.3Industry calculation based on sample average.
’06 ’07 ’08 ’09 ’10 ’11’06 ’07 ’08 ’09 ’10 ’11’06 ’07 ’08 ’09 ’10 ’11
’06 ’07 ’08 ’09 ’10 ’11 ’06 ’07 ’08 ’09 ’10 ’11Salesgrowth
Marginchange
Multiplechange
Dividendyield
0
2
1
0
10
5
15
20
300
0
100
200
40
20
30
0
10
3
–10
–5
15
10
0
5
0
100
50
150
200
250
123
202
108
143
114137
112
142129
168
34.8 34.232.3
33.5
33.1 33.7
27.931.233.0 31.3
32.2
29.3
15.0
12.0
12.6
8.28.5 8.5 7.7
15.0
10.9
13.8
9.010.6
2.0
2.42.6
1.51.6
0.6
1.61.9
1.6
2.5
1.7
1.2
85 9594
127141
271
107
224
98 109
21
–7
41
4
7
15
ƒ
Total sample, n = 40Pharmaceuticals top ten
Total shareholder return
2
1
EBITDA multiple1 3
1
TSR index (2006 = 100) Sales index (2006 = 100) EBITDA/revenue (%)
TSR contribution (%) Enterprise value/EBITDA (x) Dividend/stock price (%)
V C P T T V I S, –
Sources: Thomson Reuters Datastream; Thomson Reuters Worldscope; Bloomberg; annual reports; BCG analysis.Note: n = 40 global companies with a market valuation of at least $5 billion.1Contribution of each factor shown in percentage points of five-year average annual TSR; any apparent discrepancies in TSR totals are due to rounding.2Average annual TSR, 2007–2011.3As of December 31, 2011.4Change in EBITDA multiple.5“Share change” refers to the change in the number of shares outstanding, not to the change in share price.6As of June 30, 2012.
T P T T, –
PHARMACEUTICALS
TSR Disaggregation1
# Company LocationTSR2 (%)
Market value3
($billions)
Sales growth
(%)
Margin change
(%)
Multiple change4
(%)
Dividend yield(%)
Share change5
(%)
Net debt change
(%)
2012TSR6
(%)
1 Perrigo United States 42.1 9.0 15 12 9 1 0 5 21
2 Aspen Pharmacare South Africa 25.8 5.3 29 –3 2 1 –2 –2 30
3 Jiangsu Hengrui Medicine China 25.5 5.2 26 2 –2 0 0 –1 8
4 Novo Nordisk Denmark 25.0 64.3 11 6 3 2 3 0 31
5Sun Pharmaceutical Industries
India 23.3 10.3 30 5 –12 1 –1 1 28
6 Valeant Pharmaceuticals Canada 22.5 14.5 18 –3 21 7 –12 –9 –4
7 Watson Pharmaceuticals United States 18.3 7.7 18 6 –7 0 –3 4 23
8 Biogen Idec United States 17.5 26.6 13 –4 3 0 7 –1 31
9 Shire United Kingdom 16.8 19.6 19 36 –34 1 –2 –3 –18
10 Dr. Reddy’s Laboratories India 15.0 5.3 8 –2 9 1 0 –1 5
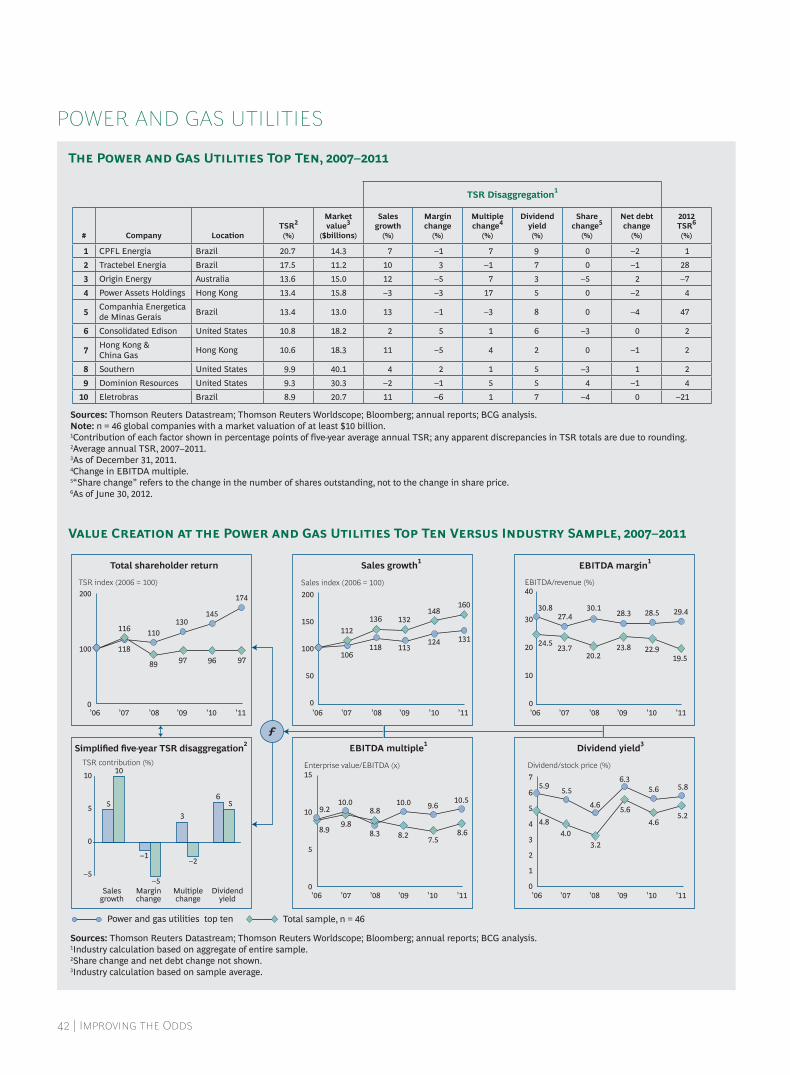
| I O
Sources: Thomson Reuters Datastream; Thomson Reuters Worldscope; Bloomberg; annual reports; BCG analysis.1Industry calculation based on aggregate of entire sample.2Share change and net debt change not shown.3Industry calculation based on sample average.
’06 ’07 ’08 ’09 ’10 ’11’06 ’07 ’08 ’09 ’10 ’11’06 ’07 ’08 ’09 ’10 ’11
’06 ’07 ’08 ’09 ’10 ’11 ’06 ’07 ’08 ’09 ’10 ’11Salesgrowth
Marginchange
Multiplechange
Dividendyield
0
2
1
0
10
5
15
200
0
100
40
20
30
0
10
7
3
4
5
6
–5
10
0
5
0
100
50
150
200
136148
132
106113
131118
124112
160
20.222.923.8
27.4 28.3 29.430.128.5
23.719.5
24.5
30.8
8.8
7.58.2
10.0 10.0 10.5
8.3
9.6
9.88.68.9
9.2
3.2
4.6
5.6
5.56.3
5.8
4.6
5.6
4.0
5.24.8
5.9
89 9697
116130
174
110
145
11897
56
–2
3
–5
–1
10
5
ƒ
Total sample, n = 46Power and gas utilities top ten
Total shareholder return
2
1
EBITDA multiple1 3
1
TSR index (2006 = 100) Sales index (2006 = 100) EBITDA/revenue (%)
TSR contribution (%) Enterprise value/EBITDA (x) Dividend/stock price (%)
V C P G U T T V I S, –
Sources: Thomson Reuters Datastream; Thomson Reuters Worldscope; Bloomberg; annual reports; BCG analysis.Note: n = 46 global companies with a market valuation of at least $10 billion.1Contribution of each factor shown in percentage points of five-year average annual TSR; any apparent discrepancies in TSR totals are due to rounding.2Average annual TSR, 2007–2011.3As of December 31, 2011.4Change in EBITDA multiple.5“Share change” refers to the change in the number of shares outstanding, not to the change in share price.6As of June 30, 2012.
T P G U T T, –
POWER AND GAS UTILITIES
TSR Disaggregation1
# Company LocationTSR2 (%)
Market value3
($billions)
Sales growth
(%)
Margin change
(%)
Multiple change4
(%)
Dividend yield(%)
Share change5
(%)
Net debt change
(%)
2012TSR6
(%)
1 CPFL Energia Brazil 20.7 14.3 7 –1 7 9 0 –2 1
2 Tractebel Energia Brazil 17.5 11.2 10 3 –1 7 0 –1 28
3 Origin Energy Australia 13.6 15.0 12 –5 7 3 –5 2 –7
4 Power Assets Holdings Hong Kong 13.4 15.8 –3 –3 17 5 0 –2 4
5Companhia Energetica de Minas Gerais
Brazil 13.4 13.0 13 –1 –3 8 0 –4 47
6 Consolidated Edison United States 10.8 18.2 2 5 1 6 –3 0 2
7Hong Kong & China Gas
Hong Kong 10.6 18.3 11 –5 4 2 0 –1 2
8 Southern United States 9.9 40.1 4 2 1 5 –3 1 2
9 Dominion Resources United States 9.3 30.3 –2 –1 5 5 4 –1 4
10 Eletrobras Brazil 8.9 20.7 11 –6 1 7 –4 0 –21

T B C G |
Sources: Thomson Reuters Datastream; Thomson Reuters Worldscope; Bloomberg; annual reports; BCG analysis.1Industry calculation based on aggregate of entire sample.2Share change and net debt change not shown.3Industry calculation based on sample average.
’06 ’07 ’08 ’09 ’10 ’11’06 ’07 ’08 ’09 ’10 ’11’06 ’07 ’08 ’09 ’10 ’11
’06 ’07 ’08 ’09 ’10 ’11 ’06 ’07 ’08 ’09 ’10 ’11Salesgrowth
Marginchange
Multiplechange
Dividendyield
0
2
1
0
10
5
15
200
0
100
20
15
5
10
4
3
–5
10
0
5
0
100
50
150
89
134
99 10299 96
108101
116 119
14.5
12.8 13.2
10.5
13.3
14.0
13.5
12.8
12.4
16.3
12.9
12.7
9.1
8.28.9
9.8
11.8
9.5
7.2
8.59.8
8.0
9.8
10.5
1.8
3.0
3.7
2.1
3.5
2.1
1.5
2.2
2.1
2.0
3.2
2.8
56
9180
110118
127
61
137
101
78
32
–4–3
0
3
0
6
ƒ
Total sample, n = 34Pulp and paper top ten
Total shareholder return
2
1
EBITDA multiple1 3
1
TSR index (2006 = 100) Sales index (2006 = 100) EBITDA/revenue (%)
TSR contribution (%) Enterprise value/EBITDA (x) Dividend/stock price (%)
V C P P T T V I S, –
Sources: Thomson Reuters Datastream; Thomson Reuters Worldscope; Bloomberg; annual reports; BCG analysis.Note: n = 34 global companies with a market valuation of at least $0.5 billion.1Contribution of each factor shown in percentage points of five-year average annual TSR; any apparent discrepancies in TSR totals are due to rounding.2Average annual TSR, 2007–2011.3As of December 31, 2011.4Change in EBITDA multiple.5“Share change” refers to the change in the number of shares outstanding, not to the change in share price.6As of June 30, 2012.
T P P T T, –
PULP AND PAPER
TSR Disaggregation1
# Company LocationTSR2 (%)
Market value3
($billions)
Sales growth
(%)
Margin change
(%)
Multiple change4
(%)
Dividend yield(%)
Share change5
(%)
Net debt change
(%)
2012TSR6
(%)
1 Rock-Tenn United States 17.8 4.1 20 8 3 1 –12 –4 –5
2 Jaya Tiasa Holdings Malaysia 15.6 0.6 3 6 6 1 0 0 33
3 Fujian Qingshan Paper China 10.1 0.5 10 –8 14 0 –4 –2 4
4Packaging Corporation of America
United States 6.8 2.5 4 –1 0 4 1 –1 14
5Indah Kiat Pulp & Paper
Indonesia 5.5 0.8 10 –10 4 0 0 1 –15
6 DS Smith United Kingdom 5.2 1.3 6 5 1 5 –2 –10 8
7 MeadWestvaco United States 4.0 4.6 –1 7 –10 5 1 2 10
8 Empresas CMPC Chile 3.7 8.6 16 2 –14 2 –1 –1 5
9 Yuen Foong Yu Paper Taiwan 1.4 0.7 6 11 –14 3 0 –5 2
10 West Fraser Timber Canada 1.2 1.8 –4 –5 12 1 0 –3 25
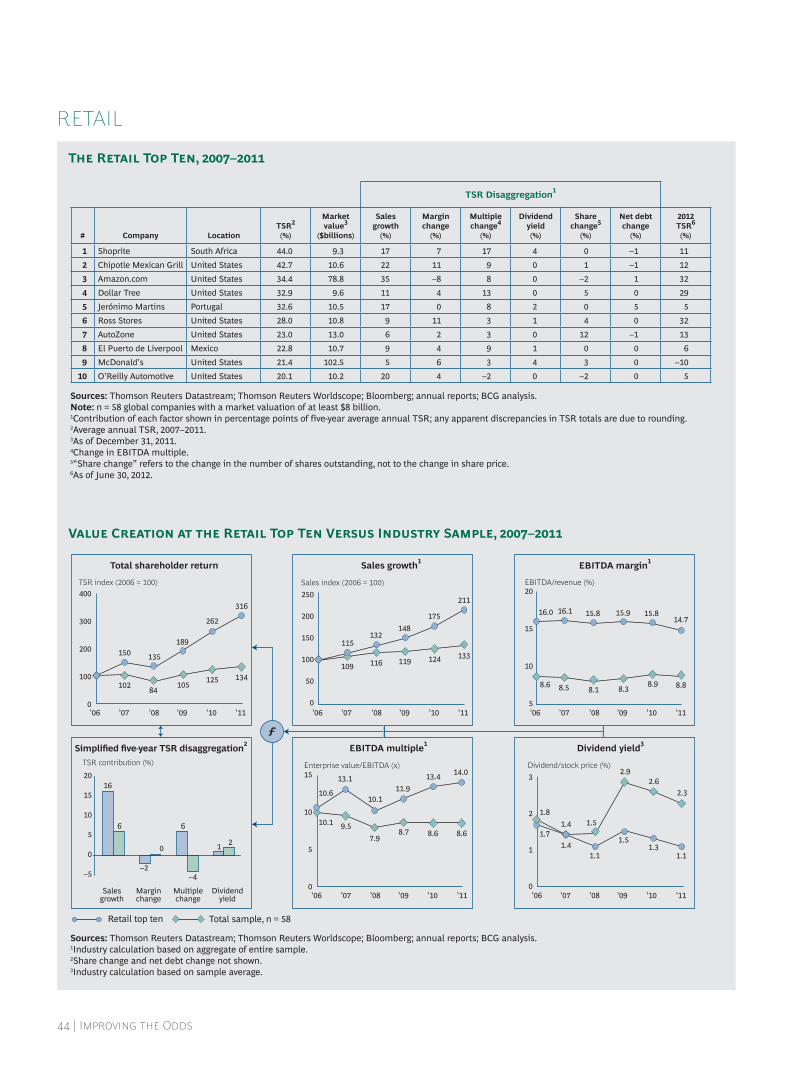
| I O
Sources: Thomson Reuters Datastream; Thomson Reuters Worldscope; Bloomberg; annual reports; BCG analysis.1Industry calculation based on aggregate of entire sample.2Share change and net debt change not shown.3Industry calculation based on sample average.
’06 ’07 ’08 ’09 ’10 ’11’06 ’07 ’08 ’09 ’10 ’11’06 ’07 ’08 ’09 ’10 ’11
’06 ’07 ’08 ’09 ’10 ’11 ’06 ’07 ’08 ’09 ’10 ’11Salesgrowth
Marginchange
Multiplechange
Dividendyield
0
2
1
0
10
5
15
400
0
100
200
300
20
15
5
10
3
–5
20
10
15
0
5
0
100
50
250
150
200
148
115
116
132
109133
211
124
175
119
8.8
14.7
8.9
15.8
8.3
15.9
8.1
15.816.0
8.5
16.1
8.6
8.6
14.0
11.9
13.4
8.7 8.67.9
10.110.6
9.5
13.1
10.11.8
1.71.5
2.62.9
1.41.5
1.11.11.3
1.4
2.3
84125
105
150189
316
135
262
102134
21
–4
6
0
–2
6
16
ƒ
Total sample, n = 58Retail top ten
Total shareholder return
2
1
EBITDA multiple1 3
1
TSR index (2006 = 100) Sales index (2006 = 100) EBITDA/revenue (%)
TSR contribution (%) Enterprise value/EBITDA (x) Dividend/stock price (%)
V C R T T V I S, –
Sources: Thomson Reuters Datastream; Thomson Reuters Worldscope; Bloomberg; annual reports; BCG analysis.Note: n = 58 global companies with a market valuation of at least $8 billion.1Contribution of each factor shown in percentage points of five-year average annual TSR; any apparent discrepancies in TSR totals are due to rounding.2Average annual TSR, 2007–2011.3As of December 31, 2011.4Change in EBITDA multiple.5“Share change” refers to the change in the number of shares outstanding, not to the change in share price.6As of June 30, 2012.
T R T T, –
RETAIL
TSR Disaggregation1
# Company LocationTSR2 (%)
Market value3
($billions)
Sales growth
(%)
Margin change
(%)
Multiple change4
(%)
Dividend yield(%)
Share change5
(%)
Net debt change
(%)
2012TSR6
(%)
1 Shoprite South Africa 44.0 9.3 17 7 17 4 0 –1 11
2 Chipotle Mexican Grill United States 42.7 10.6 22 11 9 0 1 –1 12
3 Amazon.com United States 34.4 78.8 35 –8 8 0 –2 1 32
4 Dollar Tree United States 32.9 9.6 11 4 13 0 5 0 29
5 Jerónimo Martins Portugal 32.6 10.5 17 0 8 2 0 5 5
6 Ross Stores United States 28.0 10.8 9 11 3 1 4 0 32
7 AutoZone United States 23.0 13.0 6 2 3 0 12 –1 13
8 El Puerto de Liverpool Mexico 22.8 10.7 9 4 9 1 0 0 6
9 McDonald’s United States 21.4 102.5 5 6 3 4 3 0 –10
10 O’Reilly Automotive United States 20.1 10.2 20 4 –2 0 –2 0 5

T B C G |
Sources: Thomson Reuters Datastream; Thomson Reuters Worldscope; Bloomberg; annual reports; BCG analysis.1Industry calculation based on aggregate of entire sample.2Share change and net debt change not shown.3Industry calculation based on sample average.
V C T T T V I S, –
’06 ’07 ’08 ’09 ’10 ’11’06 ’07 ’08 ’09 ’10 ’11’06 ’07 ’08 ’09 ’10 ’11
’06 ’07 ’08 ’09 ’10 ’11 ’06 ’07 ’08 ’09 ’10 ’11Salesgrowth
Marginchange
Multiplechange
Dividendyield
0
2
1
0
10
5
15
300
0
100
200
30
20
0
10
3
–15
–10
–5
20
10
15
0
5
0
100
50
250
150
200
115
207
113
149
120136
113130130
158 19.6
17.9
21.518.7 19.2
21.319.0
23.826.3
21.120.1
24.5
6.3
8.1
9.8
14.5
10.89.4
6.9
11.6
10.9
6.9
11.4
12.2
0.81.5
2.0
0.9
2.0
0.70.8
1.8
0.9
1.2
0.8
0.5
68
122108
148175
292
91
243
113 119
11
–11–9
2
98
16
ƒ
Total sample, n = 51Technology top ten
Total shareholder return
2
1
EBITDA multiple1 3
1
TSR index (2006 = 100) Sales index (2006 = 100) EBITDA/revenue (%)
TSR contribution (%) Enterprise value/EBITDA (x) Dividend/stock price (%)
Sources: Thomson Reuters Datastream; Thomson Reuters Worldscope; Bloomberg; annual reports; BCG analysis.Note: n = 51 global companies with a market valuation of at least $9 billion.1Contribution of each factor shown in percentage points of five-year average annual TSR; any apparent discrepancies in TSR totals are due to rounding.2Average annual TSR, 2007–2011.3As of December 31, 2011.4Change in EBITDA multiple.5“Share change” refers to the change in the number of shares outstanding, not to the change in share price.6As of June 30, 2012.
T T T T, –
TECHNOLOGY
TSR Disaggregation1
# Company LocationTSR2 (%)
Market value3
($billions)
Sales growth
(%)
Margin change
(%)
Multiple change4
(%)
Dividend yield(%)
Share change5
(%)
Net debt change
(%)
2012TSR6
(%)
1 ARM Holdings United Kingdom 38.0 12.5 13 6 17 2 1 –1 –14
2 Apple United States 36.7 376.4 41 27 –31 0 –2 2 44
3 Salesforce.com United States 22.7 13.9 35 13 –21 0 –4 –1 36
4 Cerner United States 21.9 10.4 10 8 5 0 –2 1 35
5Check Point So ware Technologies
United States 19.1 10.8 17 3 0 0 2 –2 –6
6 ZTE China 18.2 10.8 30 –11 4 1 –2 –4 –38
7 Citrix Systems United States 17.6 11.3 14 2 3 0 –1 –1 38
8 IBM United States 15.6 213.9 3 5 0 2 5 0 7
9 Altera United States 14.5 11.9 10 12 –12 1 2 1 –8
10 HTC Taiwan 14.1 13.9 35 –13 –17 6 0 2 –22
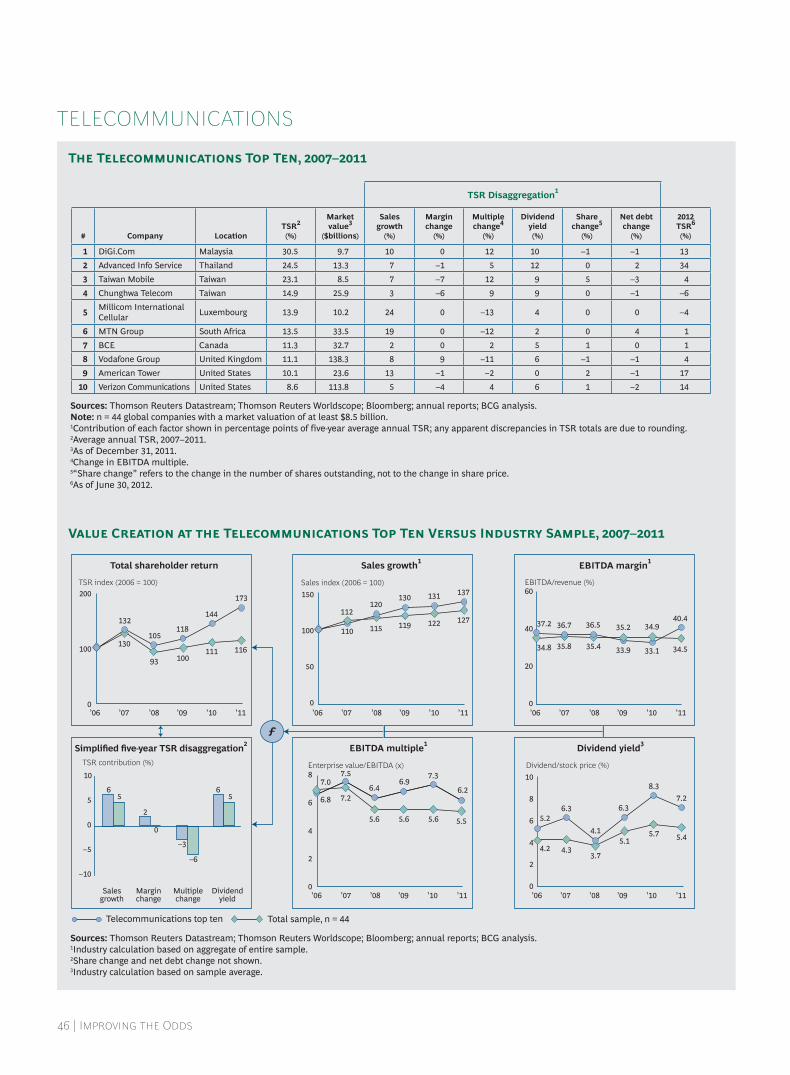
| I O
Sources: Thomson Reuters Datastream; Thomson Reuters Worldscope; Bloomberg; annual reports; BCG analysis.1Industry calculation based on aggregate of entire sample.2Share change and net debt change not shown.3Industry calculation based on sample average.
’06 ’07 ’08 ’09 ’10 ’11’06 ’07 ’08 ’09 ’10 ’11’06 ’07 ’08 ’09 ’10 ’11
’06 ’07 ’08 ’09 ’10 ’11 ’06 ’07 ’08 ’09 ’10 ’11Salesgrowth
Marginchange
Multiplechange
Dividendyield
0
6
4
2
0
6
4
2
8
200
0
100
60
40
0
20
10
8
–10
–5
10
0
5
0
100
50
150
115122119
110
130137
120131
112127
35.4
34.935.236.7
33.9
40.436.5
33.135.8 34.534.8
37.2
5.6 5.65.6
7.56.9
6.26.4
7.3
7.2
5.5
7.0
6.8
3.7
5.75.1
6.3 6.37.2
4.1
8.3
4.3
5.44.2
5.2
93111
100
132118
173
105
144
130116
56
–6
–3
0
2
56
ƒ
Total sample, n = 44Telecommunications top ten
Total shareholder return
2
1
EBITDA multiple1 3
1
TSR index (2006 = 100) Sales index (2006 = 100) EBITDA/revenue (%)
TSR contribution (%) Enterprise value/EBITDA (x) Dividend/stock price (%)
V C T T T V I S, –
Sources: Thomson Reuters Datastream; Thomson Reuters Worldscope; Bloomberg; annual reports; BCG analysis.Note: n = 44 global companies with a market valuation of at least $8.5 billion.1Contribution of each factor shown in percentage points of five-year average annual TSR; any apparent discrepancies in TSR totals are due to rounding.2Average annual TSR, 2007–2011.3As of December 31, 2011.4Change in EBITDA multiple.5“Share change” refers to the change in the number of shares outstanding, not to the change in share price.6As of June 30, 2012.
T T T T, –
TELECOMMUNICATIONS
TSR Disaggregation1
# Company LocationTSR2 (%)
Market value3
($billions)
Sales growth
(%)
Margin change
(%)
Multiple change4
(%)
Dividend yield(%)
Share change5
(%)
Net debt change
(%)
2012TSR6
(%)
1 DiGi.Com Malaysia 30.5 9.7 10 0 12 10 –1 –1 13
2 Advanced Info Service Thailand 24.5 13.3 7 –1 5 12 0 2 34
3 Taiwan Mobile Taiwan 23.1 8.5 7 –7 12 9 5 –3 4
4 Chunghwa Telecom Taiwan 14.9 25.9 3 –6 9 9 0 –1 –6
5Millicom International Cellular
Luxembourg 13.9 10.2 24 0 –13 4 0 0 –4
6 MTN Group South Africa 13.5 33.5 19 0 –12 2 0 4 1
7 BCE Canada 11.3 32.7 2 0 2 5 1 0 1
8 Vodafone Group United Kingdom 11.1 138.3 8 9 –11 6 –1 –1 4
9 American Tower United States 10.1 23.6 13 –1 –2 0 2 –1 17
10 Verizon Communications United States 8.6 113.8 5 –4 4 6 1 –2 14

T B C G |
Sources: Thomson Reuters Datastream; Thomson Reuters Worldscope; Bloomberg; annual reports; BCG analysis.1Industry calculation based on aggregate of entire sample.2Share change and net debt change not shown.3Industry calculation based on sample average.
’06 ’07 ’08 ’09 ’10 ’11’06 ’07 ’08 ’09 ’10 ’11’06 ’07 ’08 ’09 ’10 ’11
’06 ’07 ’08 ’09 ’10 ’11 ’06 ’07 ’08 ’09 ’10 ’11Salesgrowth
Marginchange
Multiplechange
Dividendyield
0
2
1
0
10
5
15
300
200
0
100
40
30
20
0
10
4
3
–10
–5
10
0
5
0
100
50
150
107 10495
106 103
144
119 126
104 109
19.6 20.518.1
28.5 29.7 30.128.4
30.6
19.2 20.119.3
27.6
7.5
8.7
9.9
8.89.8
9.2
7.0
9.69.8
8.3
10.6
8.3 1.8 2.5
3.3
2.1
3.8
2.11.7
2.6
1.9
2.4
2.0
2.1
77105
90
122145
217
102
193
110 105
22
–5
21
22
8
ƒ
Total sample, n = 44Transportation and logistics top ten
Total shareholder return
2
1
EBITDA multiple1 3
1
TSR index (2006 = 100) Sales index (2006 = 100) EBITDA/revenue (%)
TSR contribution (%) Enterprise value/EBITDA (x) Dividend/stock price (%)
V C T L T T V I S, –
Sources: Thomson Reuters Datastream; Thomson Reuters Worldscope; Bloomberg; annual reports; BCG analysis.Note: n = 44 global companies with a market valuation of at least $4.5 billion.1Contribution of each factor shown in percentage points of five-year average annual TSR; any apparent discrepancies in TSR totals are due to rounding.2Average annual TSR, 2007–2011.3As of December 31, 2011.4Change in EBITDA multiple.5“Share change” refers to the change in the number of shares outstanding, not to the change in share price.6As of June 30, 2012.
T T L T T, –
TRANSPORTATION AND LOGISTICS
TSR Disaggregation1
# Company LocationTSR2 (%)
Market value3
($billions)
Sales growth
(%)
Margin change
(%)
Multiple change4
(%)
Dividend yield(%)
Share change5
(%)
Net debt change
(%)
2012TSR6
(%)
1 Hyundai Glovis South Korea 48.0 6.3 34 11 7 1 0 –5 13
2 Vopak Netherlands 20.8 6.8 9 6 4 3 0 –1 26
3 Union Pacifi c United States 20.2 50.8 5 8 2 2 2 1 14
4 Kansas City Southern United States 18.6 7.5 5 6 7 0 –7 7 3
5 J.B. Hunt Transport Services United States 18.4 5.3 6 –3 9 2 4 0 33
6 CCR Brazil 16.4 12.3 19 –1 –2 5 –2 –3 34
7 CSX United States 15.0 22.1 4 5 –1 2 5 0 7
8 C.H. Robinson Worldwide United States 13.2 11.4 10 1 0 2 1 –1 –15
9 Jiangsu Express China 12.8 4.6 13 –4 –5 5 0 4 8
10 Canadian National Railway Canada 11.8 35.2 3 0 4 2 3 0 8
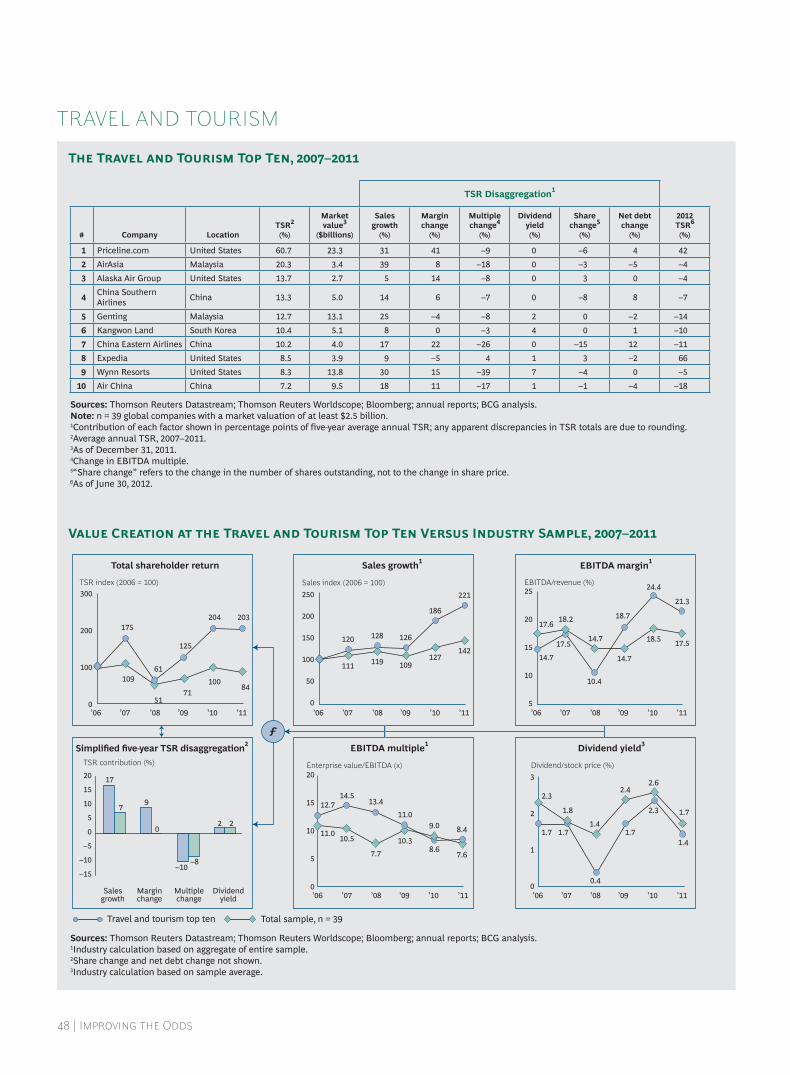
| I O
Sources: Thomson Reuters Datastream; Thomson Reuters Worldscope; Bloomberg; annual reports; BCG analysis.1Industry calculation based on aggregate of entire sample.2Share change and net debt change not shown.3Industry calculation based on sample average.
’06 ’07 ’08 ’09 ’10 ’11’06 ’07 ’08 ’09 ’10 ’11’06 ’07 ’08 ’09 ’10 ’11
’06 ’07 ’08 ’09 ’10 ’11 ’06 ’07 ’08 ’09 ’10 ’11Salesgrowth
Marginchange
Multiplechange
Dividendyield
0
2
1
0
10
5
20
15
300
200
0
100
25
20
15
5
10
3
–15
–10
–5
20
0
5
10
15
0
150
50
100
250
200
109
221
111
142119 127
120 126128
186
18.5
24.4
17.5
21.3
18.7
17.5
10.4
18.2
14.7
14.7
17.6
14.7
7.6
8.49.0
8.610.3
11.0
7.7
13.414.5
11.010.5
12.7
2.4
1.4
1.8 1.71.4
2.6
1.7 1.7
0.4
2.3
2.3
1.7
71
203
10984
51
100
175
125
61
204
22
–8–10
0
97
17
ƒ
Total sample, n = 39Travel and tourism top ten
Total shareholder return
2
1
EBITDA multiple1 3
1
TSR index (2006 = 100) Sales index (2006 = 100) EBITDA/revenue (%)
TSR contribution (%) Enterprise value/EBITDA (x) Dividend/stock price (%)
V C T T T T V I S, –
Sources: Thomson Reuters Datastream; Thomson Reuters Worldscope; Bloomberg; annual reports; BCG analysis.Note: n = 39 global companies with a market valuation of at least $2.5 billion.1Contribution of each factor shown in percentage points of five-year average annual TSR; any apparent discrepancies in TSR totals are due to rounding.2Average annual TSR, 2007–2011.3As of December 31, 2011.4Change in EBITDA multiple.5“Share change” refers to the change in the number of shares outstanding, not to the change in share price.6As of June 30, 2012.
T T T T T, –
TRAVEL AND TOURISM
TSR Disaggregation1
# Company LocationTSR2 (%)
Market value3
($billions)
Sales growth
(%)
Margin change
(%)
Multiple change4
(%)
Dividend yield(%)
Share change5
(%)
Net debt change
(%)
2012TSR6
(%)
1 Priceline.com United States 60.7 23.3 31 41 –9 0 –6 4 42
2 AirAsia Malaysia 20.3 3.4 39 8 –18 0 –3 –5 –4
3 Alaska Air Group United States 13.7 2.7 5 14 –8 0 3 0 –4
4China Southern Airlines
China 13.3 5.0 14 6 –7 0 –8 8 –7
5 Genting Malaysia 12.7 13.1 25 –4 –8 2 0 –2 –14
6 Kangwon Land South Korea 10.4 5.1 8 0 –3 4 0 1 –10
7 China Eastern Airlines China 10.2 4.0 17 22 –26 0 –15 12 –11
8 Expedia United States 8.5 3.9 9 –5 4 1 3 –2 66
9 Wynn Resorts United States 8.3 13.8 30 15 –39 7 –4 0 –5
10 Air China China 7.2 9.5 18 11 –17 1 –1 –4 –18

T B C G |
The Boston Consulting Group publish-es many reports and articles on corpo-rate development and value creation that may be of interest to senior exec-utives. Examples include:
Enabling PMI: Building Capabilities for Eff ective Integration A Focus by The Boston Consulting Group, July 2012
How Value Patterns WorkBCG Perspectives, June 2012
Value Patterns: The ConceptBCG Perspectives, May 2012
The CEO as InvestorBCG Perspectives, March 2012
First, Do No Harm: How to Be a Good Corporate ParentA report by The Boston Consulting Group, March 2012
The Power of Diversifi ed Companies During CrisesA report by The Boston Consulting Group and HHL—Leipzig Graduate School of Management, January 2012
M&A: Using Uncertainty to Your AdvantageA Focus by The Boston Consulting Group and UBS Investment Bank, December 2011
No Time Like the Present to Plan an IPOA report by The Boston Consulting Group, October 2011
Risky Business: Value Creation in a Volatile EconomyThe 2011 Value Creators Report, September 2011
Riding the Next Wave in M&A: Where Are the Opportunities to Create Value?A report by The Boston Consulting Group, June 2011
The Art of PlanningA Focus by The Boston Consulting Group, April 2011
Does Practice Make Perfect? How the Top Serial Acquirers Create ValueA Focus by The Boston Consulting Group and HHL—Leipzig Graduate School of Management, April 2011
Best of Times or Worst of Times?A joint White Paper by The Boston Consulting Group and the Royal Bank of Scotland, January 2011
Threading the Needle: Value Creation in a Low-Growth EconomyThe 2010 Value Creators Report, September 2010
Accelerating Out of the Great Recession: Seize the Opportunities in M&AA report by The Boston Consulting Group, June 2010
Cross-Border PMI: Understanding and Overcoming the ChallengesA Focus by The Boston Consulting Group, May 2010
Megatrends: Tailwinds for Growth in a Low-Growth Environment A Focus by The Boston Consulting Group, May 2010
A er the StormThe 2010 Creating Value in Banking Report, February 2010
Time to Engage—Or Fade Away: What All Owners Should Learn from the Shakeout in Private EquityBCG White Paper, published with the IESE Business School of the University of Navarra, February 2010
FOR FURTHER READING
| I O
About the AuthorsGerry Hansell is a senior partner and managing director in the Chicago offi ce of The Boston Consulting Group and a BCG Fellow. Jeff Kotzen is a senior partner and managing director in the fi rm’s New York offi ce and BCG’s glob-al leader for value creation strategy. Eric Olsen is a senior advisor to the fi rm’s Corporate Development practice. Frank Plaschke is a partner and man-aging director in BCG’s Munich offi ce and the fi rm’s leader for value creation strategy in Europe. Daniel Stelter is a senior partner and managing director in BCG’s Berlin offi ce. Hady Farag is a principal in the fi rm’s Frankfurt offi ce and manager of BCG’s Munich-based Value Creators research team.
AcknowledgmentsThis report is a product of BCG’s Corporate Development practice. The authors would like to acknowledge the contributions of the following global experts in corporate development: Danny Friedman, a senior partner and managing director in the fi rm’s Los Angeles offi ce and leader of the Corpo-rate Development practice in the Americas; Jérôme Hervé, a senior part-ner and managing director in BCG’s Paris offi ce and leader of the Corpo-rate Development practice in Europe; Dinesh Khanna, a partner and manag-ing director in the fi rm’s Singapore of-fi ce and leader of the Corporate Devel-opment practice in the Asia-Pacifi c region; Jens Kengelbach, a partner and managing director in BCG’s Munich offi ce and global head of marketing for the Corporate Development practice; Alexander Roos, a senior partner and managing director in the fi rm’s Berlin offi ce and global leader of the Corpo-rate Development practice; and Brett Schiedermayer, managing director of the BCG ValueScience Center in South San Francisco, California, a research center that develops leading-edge val-
uation tools and techniques for M&A and corporate-strategy applications.
The authors would also like to thank Robert Howard for his contributions to the writing of this report; Kerstin Hobelsberger, Martin Link, and Dirk Schilder of the Value Creators re-search team for their contributions to the research; and Simon Targett, Katherine Andrews, Gary Callahan, Angela DiBattista, Kim Friedman, Pamela Gilfond, and Sara Strassen-reiter for their contributions to the editing, design, and production.
For Further ContactFor further information about the report or to learn more about BCG’s capabilities in corporate development and value management, you may contact one of the authors.
Gerry HansellSenior Partner and Managing DirectorBCG Chicago+1 312 993 [email protected]
Jeff KotzenSenior Partner and Managing DirectorBCG New York+1 212 446 2800kotzen.jeff @bcg.com
Eric OlsenSenior AdvisorBCG Chicago+1 312 993 [email protected]
Frank PlaschkePartner and Managing DirectorBCG Munich+49 89 23 17 [email protected]
Daniel StelterSenior Partner and Managing DirectorBCG Berlin+49 30 28 87 [email protected]
Hady FaragPrincipalBCG Frankfurt+49 69 91 50 [email protected]
NOTE TO THE READER

T B C G | C
The fi nancial analyses in this report are based on public data and forecasts that have not been verifi ed by BCG and on assumptions that are subject to uncertainty and change. The analyses are intended only for general comparisons across companies and industries and should not be used to support any individual investment decision.
© The Boston Consulting Group, Inc. 2012. All rights reserved.
For information or permission to reprint, please contact BCG at:E-mail: [email protected]: +1 617 850 3901, attention BCG/PermissionsMail: BCG/Permissions The Boston Consulting Group, Inc. One Beacon Street Boston, MA 02108 USA
To fi nd the latest BCG content and register to receive e-alerts on this topic or others, please visit bcgperspectives.com.
Follow bcg.perspectives on Facebook and Twitter.
9/12
Abu DhabiAmsterdamAthensAtlantaAucklandBangkokBarcelonaBeijingBerlinBostonBrusselsBudapestBuenos AiresCanberraCasablancaChennai
ChicagoCologneCopenhagenDallasDetroitDubaiDüsseldorfFrankfurtGenevaHamburgHelsinkiHong KongHoustonIstanbulJakartaJohannesburg
KievKuala LumpurLisbonLondonLos AngelesMadridMelbourneMexico CityMiamiMilanMinneapolisMonterreyMontréalMoscowMumbaiMunich
NagoyaNew DelhiNew JerseyNew YorkOsloParisPerthPhiladelphiaPragueRio de JaneiroRomeSan FranciscoSantiagoSão PauloSeattleSeoul
ShanghaiSingaporeStockholmStuttgartSydneyTaipeiTel AvivTokyoTorontoViennaWarsawWashingtonZurich
bcg.com