improving measurement uncertainty in custody transfer ...
10
1 ABSTRACT Improving measurement uncertainty in custody transfer measurement systems is what every organization has been looking for. Technological advancements resulting in improved uncertainty of the products being developed and offered has enabled in achieving this goal. However, adoption of the methods/technology that already exist for custody transfer measurement systems may result in improvement in substantial improvement in the measurement uncertainty and operational efficiency. This paper talks about the use of HART Communication for custody transfer systems. HART protocol has been around since long and has offered powerful diagnostic tools for process industry. However its use in custody transfer measurement loops has many advantages which are elaborated in this this paper. KEY WORDS HART protocol, Measurement Uncertainty, Digital Communication 1.0 INTRODUCTION Custody Transfer measurement systems are the cash registers of any organization involved in custody transfer of hydrocarbons. A small measurement system error can result into huge financial implications on either buyer or seller side. This technical papers aims to explore the use of existing measurement system components in such a way so that total measurement uncertainty is improved without any additional/meagre expenditure. It aims to configure the existing system by tapping the unused potential of the system components as per recommended practices/standards resulting in improvement of measurement uncertainty. The paper restricts itself to Natural Gas custody transfer measurement systems, although it is applicable to other process applications as 2.0 TYPICAL NG CUSTODY TRANSFER MESUREMENT SYSTEM A typical natural gas custody transfer measurement system consists of following components: 2.1 PRIMARY DEVICES The primary device defines the basic type of meter used for gas measurement, including, but not limited to, an orifice, turbine, rotary or Ultrasonic meter. The gas quantity is measured by Primary Meter at Flowing or Line conditions ( At Line pressure and Temperature). Based on the principal used for determining/inferring the, electrical signal (analog or digital) representing primary process variable and having defined relationship with the flowing fluid is FLOTEK.G 2017 -“Innovative Solutions in Flow Measurement and Control- Oil, Water and Gas” August 28-30, 2017, FCRI Palakkad, Kerala, India IMPROVING MEASUREMENT UNCERTAINTY IN CUSTODY TRANSFER MEASUREMENT SYSTEMS Reference No fg: 17027 Pankaj Gupta GAIL (India) Limited [email protected] __________________________________________________________________________________
-
Upload
khangminh22 -
Category
Documents
-
view
1 -
download
0
Transcript of improving measurement uncertainty in custody transfer ...
1
ABSTRACT
Improving measurement uncertainty in
custody transfer measurement systems is
what every organization has been looking
for. Technological advancements resulting
in improved uncertainty of the products
being developed and offered has enabled
in achieving this goal. However, adoption
of the methods/technology that already
exist for custody transfer measurement
systems may result in improvement in
substantial improvement in the
measurement uncertainty and operational
efficiency. This paper talks about the use
of HART Communication for custody
transfer systems. HART protocol has been
around since long and has offered
powerful diagnostic tools for process
industry. However its use in custody
transfer measurement loops has many
advantages which are elaborated in this
this paper.
KEY WORDS
HART protocol, Measurement Uncertainty,
Digital Communication
1.0 INTRODUCTION
Custody Transfer measurement systems
are the cash registers of any organization
involved in custody transfer of
hydrocarbons. A small measurement
system error can result into huge financial
implications on either buyer or seller side.
Efforts are being made on continuous
basis to improve the measurement
uncertainty in the custody transfer
measurement systems. With the
advancement of technologies new , better
and efficient systems/products/procedures
are being evolved which are much more
accurate and adherence to applicable
standards/practices result into smaller
measurement uncertainty.
This technical papers aims to explore the
use of existing measurement system
components in such a way so that total
measurement uncertainty is improved
without any additional/meagre
expenditure. It aims to configure the
existing system by tapping the unused
potential of the system components as per
recommended practices/standards
resulting in improvement of measurement
uncertainty. The paper restricts itself to
Natural Gas custody transfer
measurement systems, although it is
applicable to other process applications as
2.0 TYPICAL NG CUSTODY
TRANSFER MESUREMENT SYSTEM
A typical natural gas custody
transfer measurement system consists
of following components:
2.1 PRIMARY DEVICES
The primary device defines the basic type
of meter used for gas measurement,
including, but not limited to, an orifice,
turbine, rotary or Ultrasonic meter. The
gas quantity is measured by Primary
Meter at Flowing or Line conditions ( At
Line pressure and Temperature). Based
on the principal used for
determining/inferring the, electrical signal
(analog or digital) representing primary
process variable and having defined
relationship with the flowing fluid is
FLOTEK.G 2017 -“Innovative Solutions in Flow Measurement and Control- Oil, Water and Gas”
August 28-30, 2017, FCRI Palakkad, Kerala, India
IMPROVING MEASUREMENT UNCERTAINTY IN CUSTODY
TRANSFER MEASUREMENT SYSTEMS Reference No fg: 17027
Pankaj Gupta GAIL (India) Limited [email protected]
__________________________________________________________________________________
2
propagated to tertiary device, i.e flow
computer for calculation of volumetric flow.
2.2 SECONDARY DEVICE
The secondary device provides Electrical
representation of inputs process variables
, including, but not limited to, static
pressure, temperature, differential
pressure, relative density, and other
variables that are appropriate for inputs
into the tertiary device. Gas composition is
provided by the Gas chromatograph/
SCADA/ Manual input for calculation of
compressibility factor at Base conditions
and line conditions.
2.3 TERTIARY DEVICE
Each primary device requires a
specific or properly configured tertiary
device appropriate to the type of meter
used. The tertiary device is an electronic
computer, programmed to correctly
calculate flow within specified limits, that
receives information from the primary
and/or secondary devices. Flow computer
or Volume correction device implements
various algorithms such as AGA8
calculations for calculation of
compressibility along with other applicable
algorithms like AGA3, AGA7, AGA9,
AGA10 and other calculations for energy
measurement as per
applicable/prevailing/agreed measurement
standards. These devices are type
approved for custody transfer
measurement from various international
bodies like NMi, PTB etc. ensuring the
integrity of implemented algorithm. Thus
Measured or actual volume is then
Converted to Standard Volume by
converting it to base conditions of
pressure and temperature (As per
contractual provisions between the parties
involved).
Each component in the measurement
system has an important role to play and
is associated with device
accuracy/uncertainty. Total uncertainty of
the system is dependent upon the
individual variables uncertainty and
increases with increase in the number of
devices/operations/conversions.
In order to decrease the uncertainty in
measurement, efforts need to be put in to
reduce the number of conversions from
field device (transmitter) to flow computer.
Conventionally 4-20 mA loops have been
used to transmit the field process
parameter to control room devices like
flow computers. This process involves
conversion of the physical process
variable to equivalent electrical 4-20 mA
signal which then goes through the entire
loop to finally arrive at Flow
computer/Control system ADC. There it is
again converted to Equivalent process
value for further calculations. There is an
accuracy/uncertainty statement in this
process. Thus 4-20 mA signal emanating
from the field transmitter is received by the
Flow computer ADC within a tolerance
band. It will be wonderful if the if the
process values could be directly received
by the flow computer ADC without any
intermediate conversion.
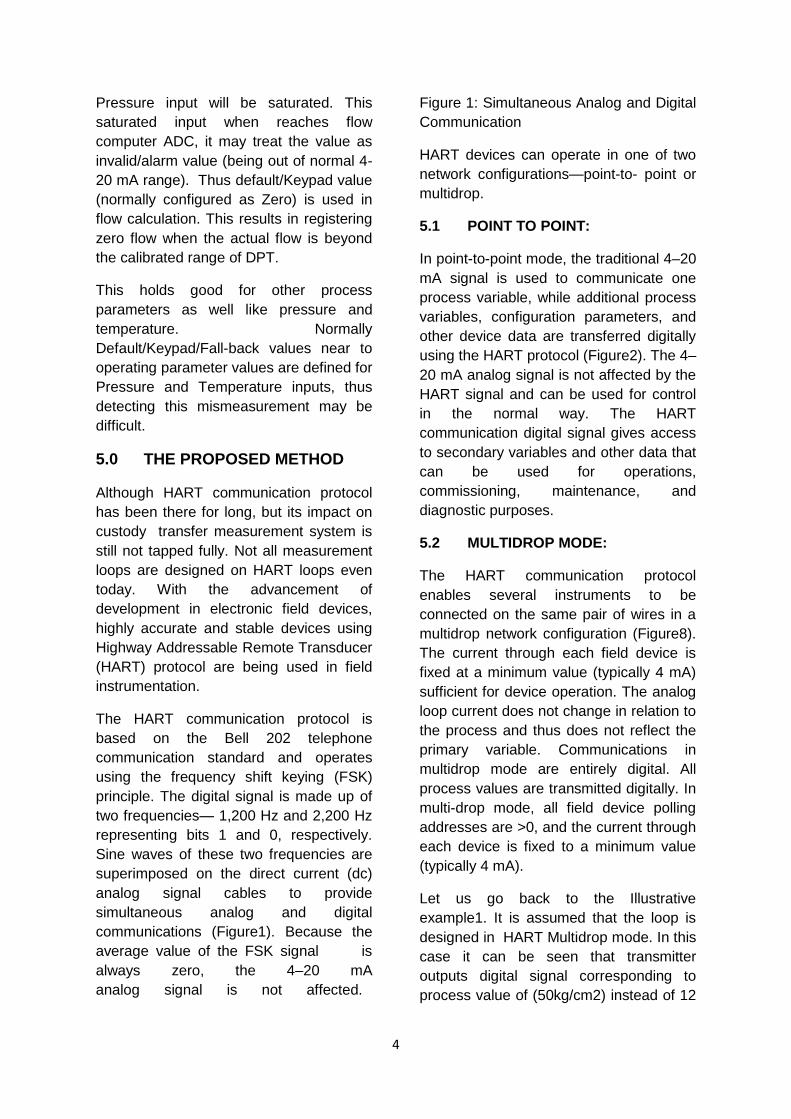
3.0 A TYPICAL CONVENTIONAL INSTRUMENT LOOP DIAGRAM (ANALOG 4-20mA)
A typical conventional instrument loop
diagram (ANALOG 4-20mA) loop diagram
is depicted in Figure-1.
A t ypical loop for metering
P ressure/temperature/Differential
Pressure input consists of following
components:
3
1. Pressure/ Diff. Pressure/Temp Transmitter
2. Intrinsic safety Barrier
3. Flow Computer.
(i) Pressure/ Diff. Pressure/Temp
Transmitter
A transmitter converts the process values
to Linear 4-20 milli Ampere current signal
at the transmitter level. The Physical
process parameter produces some
change in electrical characteristics of the
transmitter electronics which is converted
to equivalent milli- ampere signal by
transmitter electronics.
(ii) Intrinsic safety Barrier
Intrinsic safety barrier is used to limit the
amount of energy available in the
hazardous location in case of any
malfunction of any component of the loop.
For example ,In case of any short circuit in
the field equipment the amount of energy
available in the field (hazardous
atmosphere) is limited and clamped so
that no ignition can take place even if
hazardous mixture is available in the field.
At the same time it is expected that the
Intrinsic safety barrier will replicate the
exact mA signal from field side
(Transmitter) to Safe area side (Flow
Computer). Each barrier will have some
accuracy specifications for its performance
which means that the mA value
transmitted from field transmitter to flow
computer will be within some accuracy
limit based on the instrument
specifications.
(iii) Flow Computer:
The mA signal from the barrier is
transmitted to Flow computer Analog input
channel which consists of Analog to Digital
convertor(ADC). The ADC has again
some accuracy specifications and needs
calibration. This ADC linearly converts the
mA signal back to field process value.
4.0 UNDERLYING ISSUE
As so many components are involved in
the transmission of the field signal ,thus
the physical variable in the field may not
be replicated exactly at the flow computer.
The Value used for flow computation will
be thus in variance with the value
actually transmitted by the transmitter.
This is best explained with the help of an
example presented at Table-1 of
Annexure-1, how this impacts flow
measurement. It can be seen that in worst
case scenario 50 Kg/cm2 will be read as
49.8475 Kg/cm2. This corresponds to -
0.305 % of reading of process value which
translates to -0.338% for flow.
Issue faced in orifice metering :
In case of Orifice metering systems, the
Differential pressure input is the primary
input corresponding to flow. Default
keypad/ fallback value for the DP input is
usually fixed as Zero in flow computer
configuration. Diff. Pressure transmitter is
calibrated in the field for defined range
(SPAN) and same range is fed in the flow
computer as scaled input for DPT ADC
channel.
Let us assume:
Diff. Pr. Transmitter URL: 20000 mmWC
DPT Calibrated Range: 10000 mmWC
If the process conditions are unstable and
demands excess flow beyond the
calibrated span of DPT, the differential
pressure input will saturate above a
particular over range mA. In case of smart
equipment based on the configuration it
may be driven to either low or High
saturation current. Although the
transmitter may have URL much higher
than the calibrated range, the Diff.
4
Pressure input will be saturated. This
saturated input when reaches flow
computer ADC, it may treat the value as
invalid/alarm value (being out of normal 4-
20 mA range). Thus default/Keypad value
(normally configured as Zero) is used in
flow calculation. This results in registering
zero flow when the actual flow is beyond
the calibrated range of DPT.
This holds good for other process
parameters as well like pressure and
temperature. Normally
Default/Keypad/Fall-back values near to
operating parameter values are defined for
Pressure and Temperature inputs, thus
detecting this mismeasurement may be
difficult.
5.0 THE PROPOSED METHOD
Although HART communication protocol
has been there for long, but its impact on
custody transfer measurement system is
still not tapped fully. Not all measurement
loops are designed on HART loops even
today. With the advancement of
development in electronic field devices,
highly accurate and stable devices using
Highway Addressable Remote Transducer
(HART) protocol are being used in field
instrumentation.
The HART communication protocol is
based on the Bell 202 telephone
communication standard and operates
using the frequency shift keying (FSK)
principle. The digital signal is made up of
two frequencies— 1,200 Hz and 2,200 Hz
representing bits 1 and 0, respectively.
Sine waves of these two frequencies are
superimposed on the direct current (dc)
analog signal cables to provide
simultaneous analog and digital
communications (Figure1). Because the
average value of the FSK signal is
always zero, the 4–20 mA
analog signal is not affected.
Figure 1: Simultaneous Analog and Digital
Communication
HART devices can operate in one of two
network configurations—point-to- point or
multidrop.
5.1 POINT TO POINT:
In point-to-point mode, the traditional 4–20
mA signal is used to communicate one
process variable, while additional process
variables, configuration parameters, and
other device data are transferred digitally
using the HART protocol (Figure2). The 4–
20 mA analog signal is not affected by the
HART signal and can be used for control
in the normal way. The HART
communication digital signal gives access
to secondary variables and other data that
can be used for operations,
commissioning, maintenance, and
diagnostic purposes.
5.2 MULTIDROP MODE:
The HART communication protocol
enables several instruments to be
connected on the same pair of wires in a
multidrop network configuration (Figure8).
The current through each field device is
fixed at a minimum value (typically 4 mA)
sufficient for device operation. The analog
loop current does not change in relation to
the process and thus does not reflect the
primary variable. Communications in
multidrop mode are entirely digital. All
process values are transmitted digitally. In
multi-drop mode, all field device polling
addresses are >0, and the current through
each device is fixed to a minimum value
(typically 4 mA).
Let us go back to the Illustrative
example1. It is assumed that the loop is
designed in HART Multidrop mode. In this
case it can be seen that transmitter
outputs digital signal corresponding to
process value of (50kg/cm2) instead of 12

5
mA current signal. The current signal is
fixed at 4 mA.
This digital process variable value of
50kg/cm2 reaches Intrinsic safety barrier
as input from hazardous area transmitter
and is transmitted to safe area flow
computer HART input without getting
effected. As Complete loop is configured
on HART communication the flow
computer receives the digital process
value directly as 50 KG/cm2 which is now
used for flow calculation.
Thus if the conventional loop is compared
with the HART loop, a definitive
improvement in accuracy can be ensured.
Thus the conventional loop, in a worst
case scenario for illustrated example ,
may result in under measurement to the
tune of -0.338 % as compared to HART
Multidrop Mode pertaining to pressure
measurement loop only. Similar
contributions may be expected from
temperature measurement loop. Thus
overall measurement uncertainty would be
far beyond -0.3 %
Similarly In case of Orifice metering
systems with:
Diff. Pr. Transmitter URL: 20000 mmWC
Diff. Pr. Transmitter Calibrated Range:
10000 mmWC
If the process conditions are unstable and
demands excess flow beyond the
calibrated span of DPT , transmitter still
reads the process value and
communicates the same to flow computer
for flow calculation. This hold good for DP
input ranges upto URL. Thus flow
computer will keep on registering the flow
values.
6.0 CONCLUSION
Fiscal measurement systems are the cash
registers of any organization involved in
custody transfer of hydrocarbons . It is
desirable to reduce the uncertainty of
measurement on different accounts so
that accurate Quantity Transaction
Records are available. Efforts are being
made on continuous basis to improve the
measurement uncertainty in the custody
transfer measurement systems. Majority of
the existing systems are already equipped
with instruments which have capabilities
which are underutilized. Optimal
configuration and exploitation of the
unused potential of systems can definitely
improve the measurement uncertainty. A
system consisting of hardware which is
configured for conventional analog
measurement can be configured to use
digital communication protocols like HART
to improve measurement uncertainty.
REFERENCES
[1] HART Communication Foundation. "
HART Field Communication Protocol
Specification".
[2] Bell System Technical Reference:
PUB 41212, "Data Sets 202S and 202T
interface Specification", July 1976.
[3] HART Field Communications Protocol,
Application Guide ,HCF LI 34
[4] HART Communication Protocol,
HCL_LIT-054,Revision 1.1

6
Illustrative example
Impact analysis on flow computation – Signal transmission from field device to flow
computer:
Analog Transmission Loop for pressure measurement
Analog Loop for Static Pressure Measurement:
Calibrated Span: 0-100 Kg/cm2
Operating Pressure: 50 Kg/cm2
It is assumed that the transmitter is operating in such a way that 12 m Amp is being
transmitted for representing 50 kg/cm2 .
(i) Intrinsic Safety Barrier :
transmission accuracy specification : 20 µ A (0.02 mA)
This 12 mA signal reaches Intrinsic safety barrier as input from hazardous area
transmitter and is transmitted to safe area flow computer analog input.
(ii) Flow Computer:
Flow Computer ADC Accuracy : ± 0.02% of FSD at 23°C (73°F).( 0.0044 mA).
Input Range: 0 to 22 mA
Flow computer analog input received: (12 +/- 0.02 )mA i.e. 11.98 to 20.02 mA (
49.875 Kg/cm2 to 50.125 Kg/cm2).
Assuming that 49.875 Kg/cm2 corresponding to 11.98 mA reaches flow computer
input channel.
Process value used for flow computation : 49.8475 Kg/cm2 to 49.9025 Kg/cm2)
corresponding to (11.9756 mA to 11.9844 mA).
Assumptions:
Only signal transmission from field device to tertiary device is used for illustration.
Other effects like:
Reference accuracy including linearity, hysteresis and repeatability
Stability
Ambient temperature effects
Line pressure effects
Vibration effects
Power supply effects
Mounting position effects etc. have not been considered.
Complete Uncertainty calculation as per GUM/ISO 5168 or any other international
standard is not considered.
Only pressure loop has been considered in the illustrative example. Similar calculation for
other parameters like temperature , differential pressure ,if considered , the worst case
scenario impact will be more severe.
7
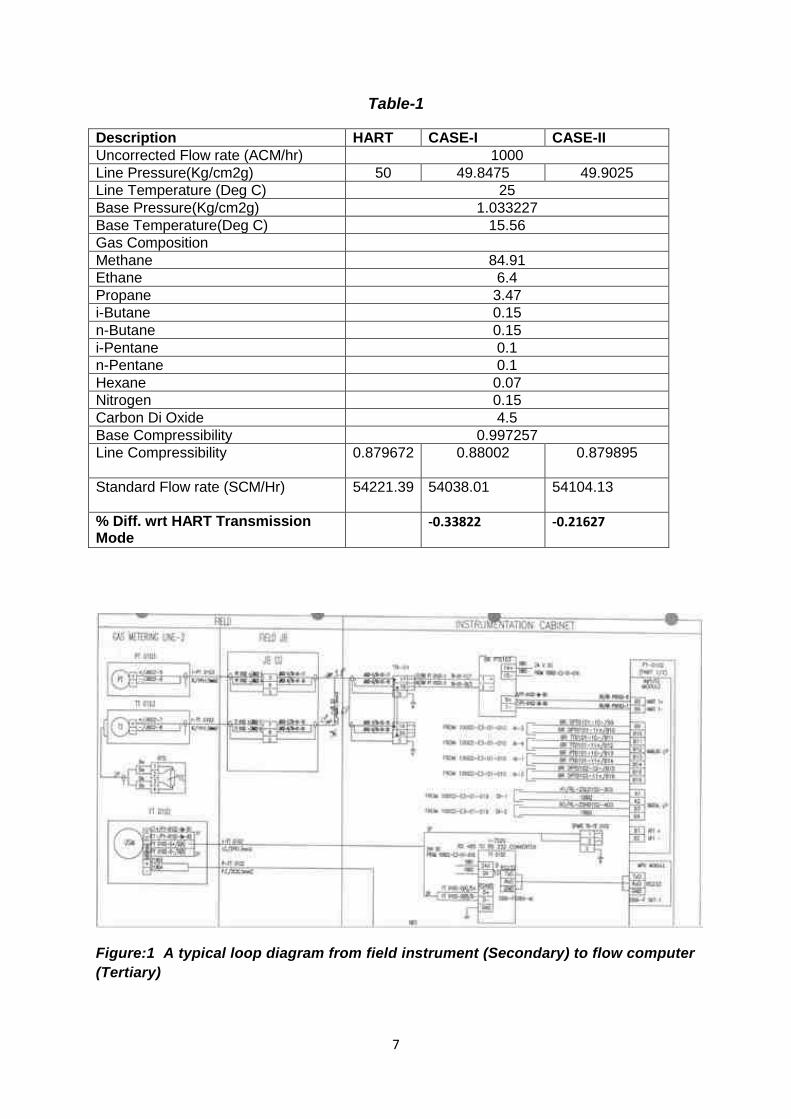
Table-1
Description HART CASE-I CASE-II
Uncorrected Flow rate (ACM/hr) 1000
Line Pressure(Kg/cm2g) 50 49.8475 49.9025
Line Temperature (Deg C) 25
Base Pressure(Kg/cm2g) 1.033227
Base Temperature(Deg C) 15.56
Gas Composition
Methane 84.91
Ethane 6.4
Propane 3.47
i-Butane 0.15
n-Butane 0.15
i-Pentane 0.1
n-Pentane 0.1
Hexane 0.07
Nitrogen 0.15
Carbon Di Oxide 4.5
Base Compressibility 0.997257
Line Compressibility 0.879672
0.88002
0.879895
Standard Flow rate (SCM/Hr) 54221.39
54038.01
54104.13
% Diff. wrt HART Transmission Mode
-0.33822
-0.21627
Figure:1 A typical loop diagram from field instrument (Secondary) to flow computer
(Tertiary)

8
Figure:2 Simultaneous Analog and Digital Communication
Figure:3 Point to Point Mode of Operation

9
Figure:4 Multidrop Mode of Operation

10
Figure:3 Point to Point Mode of Operation
Figure:3 Point to Point Mode of Operation
Figure:4 Multidrop Mode of Operation
Presenting Author Biodata
Name : Pankaj Gupta Designation : Chief Manager Company : GAIL (India) Limited Qualification : MBA (marketing), B.E. (Instrumentation Engg) Area of Expertise :More than 15 years of experience in Instrumentation Maintenance
and Flow measurement. Responsible for maintenance and upkeep of Custody Transfer measurement systems of India’s largest Gas utility, GAIL (India) Limited, A Maharatna enterprise of Govt of India. Maintenance of Various metering systems ( Ultrasonic, Turbine and Orifice) as per international standards .
Significant Achievements:
1. Certified “Functional Safety Engineer “ Level 1 in accordance with IEC 61511:2003 by TUV SUD South Asia Pvt. Ltd.
2. Installation and commissioning of, first of its kind in south east Asia ,High pressure natural gas Calibration facility for Ultrasonic and turbine meter sizes varying from 2 “ to 20 “ . The system is designed and certified by Netherland Meet institute, Netherlands for Ultrasonic and Turbine meter proving.
3. Development of Policies and procedures for Custody transfer measurement systems in GAIL in line with relevant international standards and best practices.
4. Upgradation of Control System packages for RB211 and Allison KC5 and KB5 fleet of GAIL (India) Limited.
Number of Papers Published in Journals: Number of Papers Published in Conferences:
1. Terminal Automation at GAIL Hazira and associated Terminals , published in 5th knowledge sharing seminar held at GAIL GTI Noida, 2012
2. Integration of Upgraded Unit Control Panels of Gas Turbine Generators ( 02 GTGs) and Gas Turbine Compressors(10 GTCs) with Fire and Gas detection and online CO2 weighing system along with Centralized HMI system at GAIL Hazira, published in 5th knowledge sharing seminar held at GAIL GTI Noida, 2012
Presenting author Biodata