Improvement on Citric Acid Production in Solid-state Fermentation by Aspergillus niger LPB BC Mutant...
16
Improvement on Citric Acid Production in Solid-state Fermentation by Aspergillus niger LPB BC Mutant Using Citric Pulp Cristine Rodrigues & Luciana Porto de Souza Vandenberghe & Juliana Teodoro & Ashok Pandey & Carlos Ricardo Soccol Received: 16 April 2008 / Accepted: 15 September 2008 / Published online: 17 October 2008 # Humana Press 2008 Abstract Citric acid (CA) production has been conducted through a careful strain selection, physical–chemical optimization and mutation. The aim of this work was to optimize the physical–chemical conditions of CA production by solid-state fermentation (SSF) using the Aspergillus niger LPB BC strain, which was isolated in our laboratory. The parental and mutant strain showed a good production of CA using citric pulp (CP) as a substrate. The physical–chemical parameters were optimized and the best production was reached at 65% moisture, 30 °C and pH 5.5. The influence of the addition of commercial and alternative sugars, nitrogen sources, salts, and alcohols was also studied. The best results (445.4 g of CA/kg of CP) were obtained with sugarcane molasses and 4% methanol (v/w). The mutagenesis induction of LPB BC was performed with UV irradiation. Eleven mutant strains were tested in SSF where two mutants showed a higher CA production when compared to the parental strain. A. niger LPB B3 produced 537.6 g of CA/kg of CP on the sixth day of fermentation, while A. niger LPB B6 produced 616.5 g of CA/kg of CP on the fourth day of fermentation, representing a 19.5% and 37% gain, respectively. Keywords Citric acid . CP . Aspergillus niger . Solid-state fermentation . Mutation . UV Introduction Citric acid (CA) is one of the most frequently manufactured products from fermentation in the world due to its lower toxicity—among other characteristics—when compared to other acidulates used by the pharmaceutical and food industries. In 2004, the worldwide production of CA was approximately 1.4 million tons, according to the Business Appl Biochem Biotechnol (2009) 158:72–87 DOI 10.1007/s12010-008-8370-5 C. Rodrigues : L. P. de Souza Vandenberghe : J. Teodoro : A. Pandey : C. R. Soccol (*) Bioprocess Engineering and Biotechnology Division, Chemical Engineering Department, Federal University of Paraná (UFPR), Curitiba, PR, Brazil e-mail: [email protected]
Transcript of Improvement on Citric Acid Production in Solid-state Fermentation by Aspergillus niger LPB BC Mutant...

Improvement on Citric Acid Production in Solid-stateFermentation by Aspergillus niger LPB BC MutantUsing Citric Pulp
Cristine Rodrigues &Luciana Porto de Souza Vandenberghe &
Juliana Teodoro & Ashok Pandey &
Carlos Ricardo Soccol
Received: 16 April 2008 /Accepted: 15 September 2008 /Published online: 17 October 2008# Humana Press 2008
Abstract Citric acid (CA) production has been conducted through a careful strainselection, physical–chemical optimization and mutation. The aim of this work was tooptimize the physical–chemical conditions of CA production by solid-state fermentation(SSF) using the Aspergillus niger LPB BC strain, which was isolated in our laboratory. Theparental and mutant strain showed a good production of CA using citric pulp (CP) as asubstrate. The physical–chemical parameters were optimized and the best production wasreached at 65% moisture, 30 °C and pH 5.5. The influence of the addition of commercialand alternative sugars, nitrogen sources, salts, and alcohols was also studied. The bestresults (445.4 g of CA/kg of CP) were obtained with sugarcane molasses and 4% methanol(v/w). The mutagenesis induction of LPB BC was performed with UV irradiation. Elevenmutant strains were tested in SSF where two mutants showed a higher CA production whencompared to the parental strain. A. niger LPB B3 produced 537.6 g of CA/kg of CP on thesixth day of fermentation, while A. niger LPB B6 produced 616.5 g of CA/kg of CP on thefourth day of fermentation, representing a 19.5% and 37% gain, respectively.
Keywords Citric acid . CP. Aspergillus niger . Solid-state fermentation . Mutation . UV
Introduction
Citric acid (CA) is one of the most frequently manufactured products from fermentation inthe world due to its lower toxicity—among other characteristics—when compared to otheracidulates used by the pharmaceutical and food industries. In 2004, the worldwideproduction of CA was approximately 1.4 million tons, according to the Business
Appl Biochem Biotechnol (2009) 158:72–87DOI 10.1007/s12010-008-8370-5
C. Rodrigues : L. P. de Souza Vandenberghe : J. Teodoro : A. Pandey : C. R. Soccol (*)Bioprocess Engineering and Biotechnology Division, Chemical Engineering Department,Federal University of Paraná (UFPR), Curitiba, PR, Brazile-mail: [email protected]

Communications Co. (BCC)’s recent studies on fermentation [1]. Moreover, due to its largeapplication and low price, the CA consumption is expected to grow significantly until 2009,and this raises the need for industries to search for new technological alternatives and forcost reduction in CA production [2].
CA has a variety of applications. Seventy per cent of it is used in the food and beverageindustries, 12% in the pharmaceutical industry, and 18% in other industries. In the foodindustry, it is used as an acidulate due to its lower toxicity and high solubility [3]. Thisproperty has led to an increase in its use in the cleaning process of special boilers andinstallations. In some cases, phosphate is replaced by citrate in detergents in order toincrease its power. In this case, it is used not only for cleaning metal, but also in domesticdetergents. Due to its easy biodegradability, the use of CA expanded and replaced thepolyphosphates.
CA is often produced by fermentation using low cost raw materials. The composition ofthese products varies according to their origin, conservation, and obtaining methods. Agreat variety of substrates can be used in CA production by solid-state fermentation (SSF)such as some by-products and agro-industrial residues. There are countless possibilities inestablishing industrial activities directed to the improvement and/or reprocessing ofbioresidues such as sugarcane bagasse, cassava bagasse, and CP [4], [5], [6], [7], whichcan cause serious environmental problems.
CP is a by-product of the juice industry obtained from the liquid and solid residuestreatment remainders of orange juice extraction. Among these residues are rinds, seeds, andorange pulps, representing 50% of the fruit weight. Since these citric residues are rich incarbohydrates and other nutrients, they are viable substrates to CA production by SSF. Itsannual exportation is around a million tons. It is largely used in animal feed supplements,especially those for cattle [8].
The industrial CA production is performed using A. niger, due to its higher capacity toaccumulate acid when compared to other microorganisms [9], [10], [11]. The mainadvantages of the use of A. niger are: its easy manipulation, its ability to ferment a greatvariety of raw materials, the low cost of its fermentation, and its capacity to obtain highyields of CA [9].
Mutations are abrupt and so are the hereditary modifications in the genetic material. Theorganisms containing the DNA are not static molecules, and their bases are frequentlyexposed to natural or artificial agents that can cause modifications in their structure or inchemical composition [12], [13]. The increase in CA productivity has been achieved usingmutation and strains selection. Strains with certain characteristics—such as enhanced CAproduction and increased fermentation rate—have been previously selected after submittingthe genetic material to physical or chemical mutagenic agents [13], [14], [15], [16]. Themost frequently used method is induction by UV irradiation. Although the UV rays do nothave much energy and, consequently, they do not induce ionization directly, the unicellularorganisms are potent mutagenic agents, since UV rays are absorbed by purine andpyrimidines, making them reactive and inducing mutation [12], [13]. Therefore, themutations induced by UV can randomly provide a strain with a higher capacity of CAproduction when compared to the control strain CA production.
The aim of the present work was to optimize physical and chemical parameters of CAproduction by SSF. CP was used as an alternative substrate/support in order to obtain a CAconcentrate product to be used in animal feed. A mutation of A. niger LPB BC strainthrough UV rays irradiation was performed in order to find a mutant strain with a higherCA accumulation.
Appl Biochem Biotechnol (2009) 158:72–87 73

Materials and Methods
Substrate Preparation for CA Production
CP was kindly made available by Cargill Agrícola S.A, São Paulo—SP; and it was alreadydried and pelletized. Pellets were previously crushed in a grinder to obtain a suitableparticle size between 0.8–2.00 mm.
Microorganism
A. niger LPB BC strain was isolated from sugarcane bagasse in the BiotechnologyProcesses Laboratory (UFPR). One gram of sugarcane bagasse was homogenized in 10 mlof sterile distilled water, agitated in shaker at 120 rpm, 28 °C for 15 min. Successivedilutions were done, and 0.2 ml of each was inoculated in a Petri dish and covered with20 ml of PDA medium (Pour-Plate). All Petri dishes were kept at 28 °C for 7 days. Isolatecolonies were then transferred successively to a new plate until total isolation. One of themwas identified morphologically as Aspergillus niger and named A. niger LPB BC. Thestrain was then maintained in a glass test tube with inclined PDA (Potato Dextrose Agar)medium, from which the microorganisms were replicated. Each strain was incubated forgrowth for 6 days at 28 °C and kept at 4 °C for a maximum of 2 months.
Spores Suspension
The spores were produced in 250 mL Erlenmeyer flasks with 50 mL of PDA medium. Theculture medium was sterilized at 121 °C for 15 min. After cooling (45–55 °C), the mediumwas inoculated in the spore suspension. In order to obtain this suspension, an extraction ofthe spores was performed from an inclined glass tube with PDA medium, where 5 mL ofsterile distilled water, one drop of Tween 80 and previously sterilized glass pearls hadalready been added. Each Erlenmeyer with 50 mL of PDA was inoculated with 0.2 ml ofthis suspension and incubated for 7 days without agitation and forced aeration (aerated bydiffusion).
The spores were recovered (under non-sterile conditions) from the medium surface using30 mL of sterile distilled water, containing one drop of the 0.01% Tween 80 solution, glasspearls and one stirring bar, agitated during 15 min on a magnetic agitator at 600 rpm. Thesuspension obtained was stored at 4 °C for at least 7 days.
Successive spore suspension dilutions were made for spore counting in a Neubauerchamber using an optical microscope. Based on the counting results, the amount of sporesuspension that should be added to the fermentation medium was calculated so as to contain107 spores/g of substrate.
Solid-state Fermentation for CA Production
Parental and mutant strains of A. niger LPB BC were tested in SSF with CP as substrateusing the following initial physical–chemical conditions: 75% initial humidity, obtained byadding a solution containing KH2PO4 (1g/L), ZnSO4 (0.2 g/L) and methanol (4% w/v), pH6.5 in 250 ml Erlenmeyer flasks. The fermentation was conducted at 30 °C for 4 or 5 days.After optimizing the physical–chemical variables of the process, some of these conditionswere then changed.
74 Appl Biochem Biotechnol (2009) 158:72–87

Experimental Design
Statistical experiments and analysis were carried out using the software packageSTATISTICA 7.1 (StatSoft, Tulsa, OK, USA).
Optimization of Physical–Chemical Variables of CA Production
pH and Initial Humidity
A 32–0 full factorial design leading to nine sets of experiments, performed in duplicate, wasused to find optimal conditions for the pH and initial moisture variables, and also to showthe influence of these variables on CA production. Uncoded variables are given in Table 1.The results were adjusted to the following quadratic model (Eq. 01):
by ¼ bo þ b1x1 þ b2x2 þ b12x1x2 þ b11x21 þ b22x
22 þ b122x1x
22 þ b211x2x
21 þ b1122x
21x
22 ð01Þ
Ten grams of CP—with particle size between 0.8 and 2 mm—were distributed in250 mL Erlenmeyer flasks. The substrate was impregnated with the nutritive solutionKH2PO4—1 g/L, ZnSO4·7H2O—0.2 g/L and 4% methanol (v/w) in order to have initialmoisture of 65%, 75%, or 80%. pH was adjusted to 5.5, 6.0, or 7.0, using NaOH and HCl0.1 N. Afterwards, the substrate was inoculated in a concentration of 107 spores/g of dry CPand homogenized for subsequent incubation at 30 °C during 96 h.
Effect of Salt Addition
The Plackett–Burman design was the statistical approach chosen for this optimization study.It allows to investigate up to N–1 variables with N experiments. Plackett–Burman designsare efficient for screening purposes when one knows which components should be present
Table 1 Effect of initial pH and initial moisture on CA production by SSF using CP.
Assay Moisture pH CA production (g/kg of dried CP)
1 65% 5.5 358.052 75% 5.5 290.913 80% 5.5 211.324 65% 6.5 370.385 75% 6.5 307.666 80% 6.5 238.797 65% 7.5 404.018 75% 7.5 317.719 80% 7.5 241.8710 65% 5.5 377.0811 75% 5.5 318.7912 80% 5.5 217.3513 65% 6.5 330.1814 75% 6.5 316.3715 80% 6.5 278.1816 65% 7.5 373.0617 75% 7.5 310.6118 80% 7.5 252.99
Appl Biochem Biotechnol (2009) 158:72–87 75
in the medium [17]. All the experiments are carried out according to a design matrix, whichis based on the number of variables to be studied. A seven factor Plackett–Burman design,resulting in eight runs, performed in duplicate, was used to determine the most significantsalts in CA production. The following salts were used with their respective concentrations:NaCl—1 g/L, KH2PO4—0.7709 g/L, MgSO4·7H2O—0.18 g/L, FeSO4·7H2O—0.0105 g/L,ZnSO4·7H2O—0.1542 g/L, CuSO4·5H2O—0.0005 g/L. The choice of salts for theexperiment was made according to the literature [18], [19], [20], [21], [22], [23]. All thevalues (replicates) were used in statistical evaluations.
Fermentation was carried out at 30 °C for 4 days at an initial pH 5.5, 65% initialhumidity, with the addition of 4% methanol (v/w) without carbon sources.
Effect of Carbon Sources
Experiments were carried out using the previous optimized conditions: pH 5.5, 65%moisture, 4% methanol (v/w) and particle size between 0.8 and 2 mm. Different commercialcarbon sources such as glucose, fructose (30, 60, and 120 g/L) and sucrose (27, 54, 108,and 216 g/L) were tested, regarding their concentration and the molecular weights. Afteranalyzing the preliminary results, other concentrations of glucose (60, 120, and 240 g/L)and sucrose (54, 108, and 216 g/L) were tested. From those results, cheaper carbon sourceswere tested: sugarcane molasses and soy molasses, both diluted so as to have a total sugarconcentration of 108 g/L.
Effect of Nitrogen Sources
The nitrogen sources were chosen based on the optimization of CA production made byVandenberghe [22], where 2.93 g/L of urea was used. Thus, the tests were carried out withthe addition of the following nitrogen sources: NH4Cl, NH4NO3, (NH4)2SO4 and urea inthe corresponding concentrations of 1.8 g of N/L. Fermentation conditions were the same aspresented before.
Effect of Lower Alcohols
Methanol and ethanol were tested in different concentrations such as 2, 4, 6, and 8% (v/w)without the addition of carbon sources. After these tests, methanol was defined as the bestlow alcohol source. Further tests were conducted with 4, 5, 6, and 8% of methanol, usingpH 5.5, 65% initial moisture, and the addition of sugarcane molasses (108 g/L).Fermentation was carried out for 4 days at 30 °C.
Mutation of A. niger BC Induced by UV
Spores of A. niger LPB BC strain were collected from the surface of a test tube containingPDA medium. With the aid of a platinum grip, spores were harvest in a previously preparedand sterilized solution containing Tween 80. This suspension was named “mothersuspension”.
UV Irradiation
The spore suspension was transferred from the glass tube to a Petri dish. An UV lamp wasused in a dark environment in order to hinder the repair mechanisms that could invert the
76 Appl Biochem Biotechnol (2009) 158:72–87

mutagenic effects [12]. The radiation was diffused above the suspension for 2 min to obtain5% strain survival. For the establishment of the irradiation time (2 min) and the estimationof 5% survival of the microorganism, a curve of survival percentage versus UV expositiontime (min) was previously built (data not shown). In the 5% survival zone, there was a largeconcentration of mutants.
In a dark environment, the spore suspension treated with UV light was diluted untilachieving a 10−3 dilution in order to obtain 30 colonies per plate. One ml of the dilutionwas inoculated in three Petri dishes with MM and two Petri dishes with CM, and spreadusing a Drygalski grip.
All Petri dishes containing the “mother” suspension and those with the suspensiontreated with UV irradiation were incubated at 28 °C for 48 h. They were inverted to avoidcontamination by spore dissemination. The plates containing the spores treated with UVlight were placed into closed metal tubes to protect them from light.
Preparation of Culture Mediums
The culture mediums, the minimal (MM) and complete (CM) mediums consisted of amixture of components which are essential for microorganism growth. These mediumswere prepared in the laboratory with dehydrated nutrients.
Minimal Medium (MM)
The MM has the following formulation: NaNO3 6.0 g; KH2PO4 1.5 g; KCl 0.5 g;MgSO4·7H2O 0.5 g; FeSO4 0.01 g; ZnSO4 0.01 g; glucose 10.0 g; agar 15.0 g and thevolume completed to 1,000 ml with distilled water.
Complete Medium (CM)
The CM used presents a formulation similar to that of the MM with the addition of thefollowing ingredients: peptone 2.0 g; yeast extract 2.0 g; hydrolyzed casein 1.5 g; vitaminssolution 1.0 ml; agar 15.0 g; and the volume completed to 1,000 ml with distilled water.
Foster Medium
The Foster medium was prepared with glucose 5 g, peptone 1 g, KH2PO4 1 g, MgSO4
0.5 g, agar 15 g, 65 ml of bromocresol green (BCG) solution (0.5 g of bromocresol green in7 ml of NaOH 0.1 N completed to a volume of 130 ml and stored in a dark flask) andcompleted to 1,000 ml with distilled water. The pH was adjusted to 5.0 and the mediumwas autoclaved at 121 °C for 15 min. The medium was transferred to sterilized Petri dishes(15 ml). After the medium had cooled and solidified, the spores were inoculated on itssurface.
Tests with Strains Obtained From UV Irradiation in Foster Medium
The obtained colonies were transferred to ten Petri dishes containing Foster media. Eachplate contained one control colony and eight treatment colonies. The colonies wereseparated in such a way that five plates containing Foster medium received the coloniesgrown in MM, and five plates received the colonies grown in MC. All plates wereincubated at 28 °C for 48 h.
Appl Biochem Biotechnol (2009) 158:72–87 77
In the Foster medium plates, the colonies and the developed yellow halos weremeasured. The Foster media presented an initial green coloration—due the presence of thebromocresol green (BCG) solution—used as an indicator of pH variation. The Fostermedium coloration changed from green to yellow through acid liberation in that medium.
Kinetics of CA Production by SSF Using the Mutant Strains
A seven-day kinetics was performed in SSF at 30 °C with the A. niger strains and itshowed good CA production results using the same optimized conditions of the originalA. niger BC strain (pH 5.5, addition of aqueous solution of sugar cane molasses with108 g/l of total sugar and 4% methanol (v/w) obtaining a 65% initial moisture). Thismedium was autoclaved at 121 °C for 15 min in 250 mL Erlenmeyer flasks and theninoculated with the A. niger spores suspension. Samples of fermented CP were removedand analyzed daily.
Analytical Methods
CAwas extracted from a solution prepared with 5 g of the fermented material macerated with50 mL of water and homogenized for 15 min with a magnetic agitator. This mixture was thenfiltered in a vacuum pump withWhatman no. 1 filter paper. The filtrate was centrifuged under4,500 rpm for 20 min. pH was determined by using a digital pH meter. The supernatant wasthen diluted (1:4) with Milli-Q water and filtered through a Millipore membrane of 0.45 μmand stored in an Eppendorf. Samples were subjected to high performance liquidchromatograph (HPLC) analysis using a Shimadzu LC-10AD. A 60 °C temperature and5 mM H2SO4 as the mobile phase at a flow-rate of 0.6 mL/min were used. Citric acid wasdetected in the column eluate by differential refractometer (Shimadzu RID-10A).
Results and Discussion
Optimization Steps with the Original Strain A. niger LPB BC
Effect of Initial pH and Moisture on CA Production
The initial pH and initial moisture influence on CA production is presented in Table 1. CAproduction was favored by low levels of initial humidity (65%). However, pH did not havea significant effect at p≤0.05 on CA synthesis, which represents an operational advantage.
However, the initial moisture of the medium influenced CA production showing anincrease tendency with a decrease in moisture content, according to the contour plot inFig. 1. Generally, fungi prefer low pH levels for a good growth; in this work the natural pHof the substrate, which was 5.42±0.075 [8] (without adjustment or buffering) was the bestfor fungi development and CA production. Otherwise, low moisture content causesreduction in the solubility of substrate nutrients, although it can limit biomass production,which is the main condition for CA accumulation.
The results showed that variations on pH did not present significant effect on CAproduction using CP in SSF; however, the initial moisture proved to be an important factor.In fact, CA production using the strain A. niger LPB BC with CP was more effective whenlower levels of initial humidity were used. Therefore, the following conditions wereselected: pH 5.5 and 65% initial moisture. Low levels of initial humidity facilitate gaseous
78 Appl Biochem Biotechnol (2009) 158:72–87

exchanges in the medium, which is enough to guarantee the diffusion of nutrients in thefermentation medium. Besides, those conditions improved CA production-reaching 388.5 gof CA/kg dry CP—and are suitable from an economic and operational point of viewbecause pH adjustment was not necessary—whereas pH 5.5 was near to the natural pHfound in the dried CP (pH 5.42)—and less water will be spent in the process to adjust theinitial moisture without production losses.
CA = –26050,598 + 6501,059522.X – 422,322.X2 + 900,824.Y – 7,3485.Y2 – 230,374.XY
+1;9225XY2 + 15,550YX2 –0,133.X2Y2
where X stands for pH values and Y stands for moisture values.Regression analysis was performed to fit the response function with the experimental
data. The statistical significance of the second-order model equation was checked and thedetermination coefficient (R2) of the model was calculated to be 0.91, indicating that 91%variability in the response could be explained by the model. The Lack-of-Fit tests did notresult in a significant p-value, indicating that the model is sufficiently accurate to predict thefactor responses within the ranges studied (Table 2).
Salt Addition
The results of the salt addition tests to the medium were submitted to statistical analysis,where they had been plotted on Pareto diagram (Fig. 2) with p<0.05 (95% reliability). The
Fitted Surface; Variable: CA production (g/kg dry CP)2 3-level factors, 1 Blocks, 18 Runs; MS Residual=308,4022
DV: CA production (g/kg dry CP)
380 340 300 260 220 180 5,4 5,6 5,8 6,0 6,2 6,4 6,6 6,8 7,0 7,2 7,4 7,6
pH
64
66
68
70
72
74
76
78
80
82
Moi
stur
e
Fig. 1 Contour plot of the effectof initial humidity and pH on CAproduction with CP
Table 2 Analysis of variance of pH and moisture responses.
SS df MS F p
pH L+Q 747.12 2 373.56 1.7068 0.219687Moisture L+Q 27754.54 2 13877.27 63.4053 0.000000Pure error 2845.26 13 218.87Total SS 31346.92 17
p≤0.05 determination coefficient (R2 )=0.91
Appl Biochem Biotechnol (2009) 158:72–87 79

value obtained for R2 was 0.76, which has been considered satisfactory due to the solid-state fermentations nature.
Unexpectedly, none of the salts studied were found above the significance line. Theseresults suggest that none of the studied salts were significant for CA production by SSFusing the CP. This could be explained by the CP’s composition which certainly disposes thenecessary micronutrients to CA synthesis by the A. niger LPB BC strain.
Effect of Different Carbon Sources on CA Production
The best results of CA production were observed with glucose 120 g/L (427.7 g of CA/kgof CP) and with sucrose at 108 g/L (405.6 g of CA/kg of CP). The addition of fructose at120 g/L led to a production of 371.9 g CA/kg dry CP. Further assays were conducted usingonly glucose (60, 120, and 240 g/L) and sucrose (54, 108, and 216 g/L). The increase insucrose concentration (Table 3) had a positive effect on CA production, which reached476.1 g/kg dry CP, representing a 21.2% gain. The control, without addition of carbonsources, reached only 372.2 g CA/kg dry CP. It was suggested that the mycelial growth andthe strain have an extracellular invertase linked to mycelium, and this breaks the sucroseproducing energy exactly at the level in which the increase in CA production is observed.
These results were very significant and confirm that CA can be produced from purifiedcarbohydrates or from crude carbohydrate sources such as sugar cane molasses, beetmolasses, crude sucrose, and starch hydrolyzates, representing a lower production cost.Most of these sources present sugars as mono, bi, and oligosaccharides, among other
-1,07712
-1,17637
1,84775
-2,06084
2,098058
2,24255
-2,27174
p=,05
KH2PO4
ZnSO4
CuSO4
FeSO4
NaCl
MgSO4
MnSO4
0,8 1,0 1,2 1,4 1,6 1,8 2,0 2,2 2,4 2,6
Fig. 2 Pareto chart effect of saltson CA production
Table 3 CA production with the addition of different commercial carbon sources.
Sugar Citric acid production (g/kg of CP)
Glucose (60 g/L) 387.3±1.569Glucose (120 g/L) 432.4±0.848Glucose (240 g/L) 426.7±1.527Sucrose (54 g/L) 371.3±1.131Sucrose (108 g/L) 410.5±1.428Sucrose (216 g/L) 476.1±1.471Control 373.2±0.983
Control Without addition of carbon supplemental source
80 Appl Biochem Biotechnol (2009) 158:72–87

impurities [9], [22]. As these crude sources have bigger sucrose concentration in itsformulation, they can stimulate a significant increase in CA production. The use ofmolasses could be possible in the process of CA production by SSF using CP as substrate/support. Thus, tests with two crude carbon sources, sugarcane molasses, and soy molasseswere carried out.
The concentration of 108 g/L in total sugars was used for sugarcane molasses and soymolasses. There was a decrease in CA production with the use of soy molasses (277.9 g ofCA/kg of CP) when compared to the control without additional carbon source (363.7g ofCA/kg of CP). Soy molasses present higher protein content, which balances the mediumregarding carbon and nitrogen composition and, consequently, favors fungus growth.Growth limitation is essential for CA accumulation [1], [22]. However, the addition ofsugarcane molasses significantly increased the production (420.3 g of CA/kg of CP).Sugarcane molasses is poor in nitrogen content when compared to soybean molasses.Assays with several sugarcane molasses concentrations were carried out in order to find outthe best concentration to be added to the CP in order to increase CA production. Aconcentration of 445.4 g of CA/kg of dry CP was achieved with 108 g/L of sugarcanemolasses, as shown in Fig. 3. Therefore, this condition was used for further studies.
Effect of Nitrogen Sources on CA Production
The high need of nitrogen and phosphorus by some microorganisms is not ideal in SSF dueto the low diffusion rate of these components that occurs in low water activities processes[9], [24], [25]. In this study the nitrogen source showing the best CA production was theNH4Cl (334.6±0.636 g of CA/kg of CP), although this production was lower than the oneobtained without the addition nitrogen (377.6±1.202 g of CA/kg of CP). Thus, it was notnecessary to add supplemental nitrogen sources to the fermentation medium, and thisrepresents a great economical advantage of this process.
Alcohols
The addition of low alcohol decreases the inhibition caused by heavy metals that can bepresent in the fermentation medium. Besides, it facilitates CA permeability through the A.niger membrane.
Tests were made with the addition of three different concentrations of methanol andethanol (2, 4, and 6%) without sugarcane molasses addition, at pH 5.5, 65% initial
Control = no addition of sugarcane molasses
0
50
100
150
200
250
300
350
400
450
500
54 g/L 108 g/L 216 g/L 270 g/L Control
Sugar concentration
CA
pro
du
ctio
n (
g/K
g o
f C
P)Fig. 3 CA production with addi-
tion of different concentrations ofsugarcane molasses
Appl Biochem Biotechnol (2009) 158:72–87 81

moisture, 4 days of fermentation at 30 °C. It was observed that 6% methanol contributed tothe best CA production (438.4 g/kg of dried CP). Thus, new tests were carried out withdifferent methanol concentration (4, 5, 6, and 8%) using the best sugarcane molassesconcentration (108 g/L) at pH 5.5, 65% moisture, during 4 days at 30 °C.
CA production (418.3 and 425.1 g/kg of CP, respectively) was higher with 5% and 6%of methanol, without sugarcane molasses addition. However, when sugarcane molasses at108 g/L of total sugars was added, CA production was 457.9 g/kg of CP with the additionof only 4% of methanol. With 8% of methanol, CA production was not significant, with orwithout sugarcane molasses addition, proving that this methanol concentration inhibits CAaccumulation (Table 4). Thus, 4% of methanol with sugarcane molasses (108 g/L of totalsugar) addition was chosen for CA production by SSF using CP as substrate.
Kinetics of CA Production with the Optimized Conditions
Seven-day kinetics was carried out in duplicate with the optimized conditions: pH 5.5, 65%initial moisture obtained with a solution containing sugarcane molasses (108 g/L of totalsugars) and 4% of methanol and 30 °C. The results are presented in Table 5.
A pronounced decrease in the pH of the medium—from 5.5 to around 2.70—wasobserved on the second day of fermentation justified by the beginning of CA accumulation.The fourth day of fermentation presented the best CA production (441.05 g/kg of dry CP),
Table 4 Citric acid production for different methanol concentrations with or without addition of sugarcanemolasses (108 g/L).
Methanol Citric acid Production (g/kg of CP)
4% Wscm 380.9±1.8384% Ascm 457.9±1.6975% Wscm 418.3±1.5555% Ascm 419.9±1.4146% Wscm 425.1±0.8486% Ascm 420.8±0.9898% Wscm 308.7±0.7078% Ascm 266.1±1.131Control 261.2±0.566
Ascm Addition of sugarcane molasses (108 g/L), Wscm without addition of sugar cane molasses, Controlwithout addition of sugar cane molasses and methanol
Table 5 Kinetics of CA production by SSF using CP with the A. niger LPB BC strain.
Fermentation time hours pH Aw CA production (g/kg of CP) average
0 5.41 0.952 NP24 5.34 0.953 NP48 3.48 0.947 93.1272 2.64 0.951 369.6396 2.70 0.946 441.05120 3.21 0.942 395.19144 3.28 0.947 408.96168 3.26 0.951 376.35
NP There was no CA production
82 Appl Biochem Biotechnol (2009) 158:72–87

when pH values had a little increase and stabilized around 3, due to the decrease of acid inthe medium.
In the study developed by Castro et al. [26], higher biomass productions were observedwhen higher water activity values were used. The water activity during the kinetics of CAproduction by the strain A. niger LPB BC remained with values above 0.94 during thewhole fermentative process, which is very relevant for microorganism development.
Figure 4 shows the strain adaptation stage to the fermentation medium in the first 24 h,when the total sugars consumption and the CA production begin. Mycelia formation wasobserved in 48 h, which was marked by the consumption of sugars in the medium. Thus,the highest CA production occurred in 96 h (441.05 g of CA/kg of dry CP) when all thenecessary sugars were available to metabolism and CA production. Sugars were thenconsumed and its concentration stabilized at 3% of total sugars. This low concentration ofsugars was then used for its maintenance and could lead to CA consumption. This fact wasobserved in the 17.2% decrease in the amount of CA after 144 h of fermentation.
Tests with Strains Obtained from UV Irradiation in Foster Medium
Halo Formation in Foster Medium
The halo formation resulted from the acid production in Foster medium, which was verifiedthrough the observation of a yellow halo formation (initially green), due to the glucosedegradation present in the medium and, consequently, the fall of pH. The obtained resultscan be observed in Fig. 5.
Seventy-two strains were obtained. The qualitative results were analyzed according tothe relation between the diameter of halo formation (DH) and the diameter of colony (DC)of fungus growth (data not shown).
Out of forty strains, replicated in CM, twenty treated strains presented the formation of ayellow halo, which evidenced acid production, representing 52.5% of the total. However,only one of them presented a DH/DC relation (1.87) higher than that presented by thecontrol (1.70). This could mean that this strain probably presented a better capacity toproduce acid when compared to the original strain. Out of the forty colonies seeded in theFoster media derived from MM, 23 (71.88%) showed a halo formation with a yellowcoloration evidencing acid formation. Ten [10] treated colonies presented a DH/DC relationhigher than the DH/DC relation of the control strain (data not shown).
0
5
10
15
20
25
30
35
0 24 48 72 96 120 144 168
Fermentation time (h)
Su
gar
(%
)
0
50
100
150
200
250
300
350
400
450
500
CA
pro
du
ctio
n (
g/K
g o
f C
P)
Sugar %CA
Fig. 4 Total sugars consumptionduring CA production in SSF byA. niger LPB BC
Appl Biochem Biotechnol (2009) 158:72–87 83

According to Azevedo [27], a wild microorganism can grow in a CM, where all thenutrients are provided, or in a MM, where only a carbon source, a nitrogen source, someminerals and small quantities of nutritional supplements are present. A fungus that showsan auxotrophic mutation can only grow in CM, because it does not produce all nutrientsnecessary to its survival in MM. So the A. niger strains obtained from the UV irradiationthat also grew in MM may not present auxotrophism, which could involve a metabolicroute of the production of desired substances to ensure its survival. Consequently, themutant A. niger strains could have suffered some biochemical modifications that induced anincrease in the production of secondary metabolic [falta um substantivo?], such as citricacid (CA).
After mutation induction by UV of A. niger LPB BC strain, qualitative and quantitativetests were done to quantify CA production by ten mutant strains obtained from this study.
CA Production in SSF by Mutant A. niger Strains
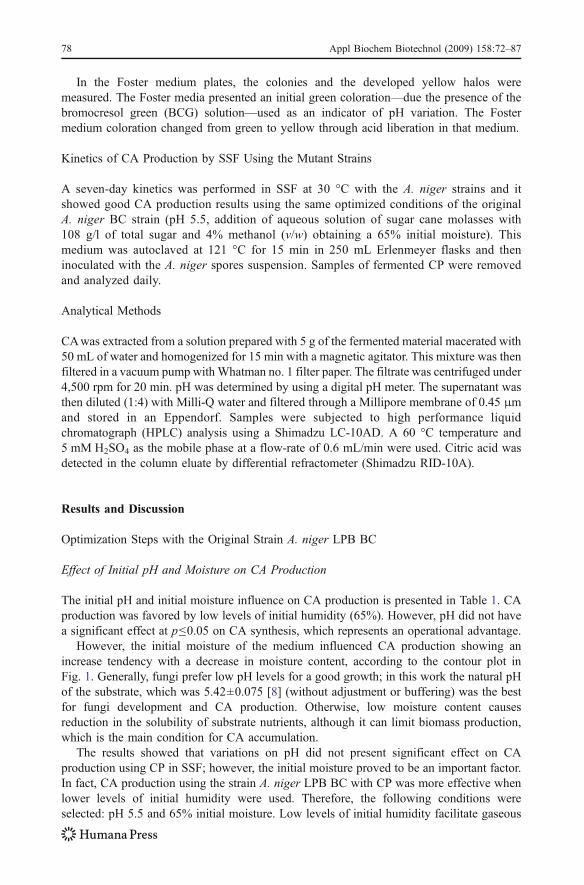
Ten mutant strains that presented the best results in the Foster medium were tested in SSFusing the initial fermentation (before optimization of physical and chemical conditions).These strains were called, A. niger LPB A4, A. niger LPB B3, A. niger LPB B4, A. nigerLPB B6, A. niger LPB B7, A. niger LPB B8, A. niger LPB D1, A. niger LPB D3, A. nigerLPB D4, A. niger LPB D7. Fermentation results on the 4th and 5th days of fermentation arerepresented in Fig. 6.
Five mutant strains (LPB B3, LPB B6, LPB B8, LPB D3, and LPB D7) showed betterresults in CA production than the control A. niger LPB BC strain. Two months after themutation induced by UV irradiation, two strains were chosen: A. niger LPB B3 and A. nigerLPB B6, which showed the best results among all mutant strains.
Kinetic of CA Production in SSF by Mutants Strains
A seven-day kinetics was performed with the mutant strains LPB B3 and LPB B6, usingpreviously optimized conditions (addition of aqueous solution of sugarcane molasses with108 g/l of total sugars and 4% methanol (v/w), obtaining 65% initial moisture, pH 5.5 and30 °C temperature). The results can be observed in Fig. 7.
Fig. 5 Growth of A. niger andhalo formation in Foster medium
84 Appl Biochem Biotechnol (2009) 158:72–87
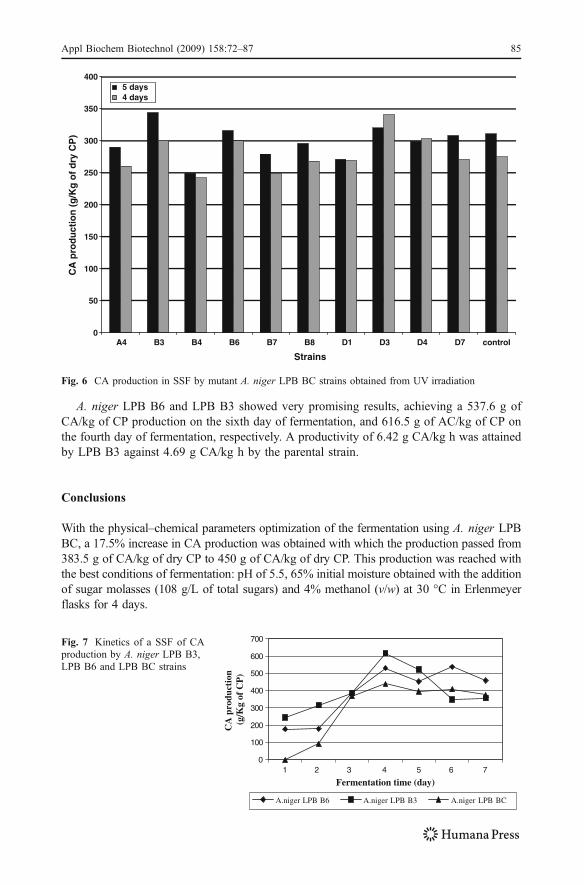
A. niger LPB B6 and LPB B3 showed very promising results, achieving a 537.6 g ofCA/kg of CP production on the sixth day of fermentation, and 616.5 g of AC/kg of CP onthe fourth day of fermentation, respectively. A productivity of 6.42 g CA/kg h was attainedby LPB B3 against 4.69 g CA/kg h by the parental strain.
Conclusions
With the physical–chemical parameters optimization of the fermentation using A. niger LPBBC, a 17.5% increase in CA production was obtained with which the production passed from383.5 g of CA/kg of dry CP to 450 g of CA/kg of dry CP. This production was reached withthe best conditions of fermentation: pH of 5.5, 65% initial moisture obtained with the additionof sugar molasses (108 g/L of total sugars) and 4% methanol (v/w) at 30 °C in Erlenmeyerflasks for 4 days.
0
100
200
300
400
500
600
700
1 2 3 4 6 75
Fermentation time (day)
CA
pro
duct
ion
(g/
Kg
of C
P)
A.niger LPB B6 A.niger LPB B3 A.niger LPB BC
Fig. 7 Kinetics of a SSF of CAproduction by A. niger LPB B3,LPB B6 and LPB BC strains
0
50
100
150
200
250
300
350
400
A4 B3 B4 B6 B7 B8 D1 D3 D4 D7 control
Strains
CA
pro
du
ctio
n (
g/K
g o
f d
ry C
P)
5 days4 days
Fig. 6 CA production in SSF by mutant A. niger LPB BC strains obtained from UV irradiation
Appl Biochem Biotechnol (2009) 158:72–87 85

A. niger LPB BC strain suffered a mutation induced by UV in an attempt to obtain amutant that could produce a higher amount of CA than the control strain. Two mutantstrains were obtained: A. niger LPB B3 and A. niger LPB B6. These mutant strains werechosen to be used in an SSF kinetics using CP as substrate with the same optimizedconditions adopted for A. niger LPB BC.
The results obtained were promising for both mutant strains: A. niger LPB B3 produced537.6 g of CA/kg of CP on the sixth day of fermentation, whereas A. niger LPB B6produced 616.5 g of CA/kg of CP on the fourth day of fermentation. The production of CAwas much higher when compared to the production obtained by the parental strain A. nigerLPB BC, which was around 450 g of CA/kg of CP.
A material containing CA in a concentration above 300 g of CA/kg of dry matter isconsidered suitable for its direct application in animal feed, for example, or extraction. Thedeveloped process must be transferred to a semi-pilot scale in which the produced CA maybe used in animal feed. These results can certainly contribute to the Brazilian agro-industries. First of all, the process utilizes a residue from the orange juice industry toproduce a commercial product. Second, the optimization of physical–chemical conditionsof the process and the mutagenesis induced by UV can be useful and so can be the simplemethods to increase the efficiency of producing biotechnological products and adding valueto different Brazilian agricultural residues and by-products.
References
1. Soccol, C. R., Vandenberghe, L. P. S., Rodrigues, C., & Pandey, A. F. (2006). Food Tech Biotechnol, 45,141–150.
2. Vandenberghe, L. P. S., Soccol, C. R., Pandey, A., & Lebeault, J. M. (2000). Bioresource Technology, 74,175–178. doi:10.1016/S0960-8524(99)00107-8.
3. Kapoor, K. K., Chaudhary, K., & Tauro, P. (1982). In: G. Reed (Ed.), Prescott and Dunn’s industrialmicrobiology. 4ed. Westport, Conn: AVI.
4. Kolicheski, M. B. (1995). Master of Science Thesis, Federal University of Paraná, Curitiba—PR, Brazil5. Soccol, C. R. (1996). Journal of Scientific and Industrial Research, 55, 358–364.6. Pandey, A., Soccol, C. R., Nigam, P., Soccol, V. T., Vandenberghe, L. P. S., & Mohan, R. (2000).
Bioresource Technology, 74, 81–87. doi:10.1016/S0960-8524(99)00143-1.7. Soccol, C. R., & Vandenberghe, L. P. S. (2003). Biochemical Engineering Journal, 13, 205–218.
doi:10.1016/S1369-703X(02)00133-X.8. Rodrigues, C. (2006). Master of Science Thesis, Federal University of Paraná, Curitiba-PR, Brazil.9. Yokoya, F. (1992). Fermentação cítrica, Fundação Tropical de Pesquisas e Tecnologia “André Tosello”,
Campinas, São Paulo, Brazil.10. Pazouki, M., Felse, P. A., Sinha, J., & Panda, T. (2000). Bioprocess Engineering, 22, 353–361.
doi:10.1007/PL00009115.11. Crolla, A., & Kennedy, K. J. (2001). Journal of Biotechnology, 89, 27–40. doi:10.1016/S0168-1656(01)
00278-4.12. Zaha, A. (2003). Biologia molecular básica (3rd ed.). Porto Alegre–RS, Brazil: Mercado Aberto.13. Griffiths, A. J. F., Wesller, S. R., Lewontin, R. C., Gelbart, W. M., Suzuki, D. T., & Miller, J. H. (2006).
Introdução à genética (8th ed.). Rio de Janeiro–RJ, Brazil: Guanabara Koogan.14. Ikram-ul-Haq, , Khurshid, S., Ali, S., Ashraf, H., Qadeer, M. A., & Rajoka, M. I. (2001). World Journal
of Microbiology and Biotechnology, 17, 35–37. doi:10.1023/A:1016625130070.15. Lotfy, W. A., Ghanem, K. M., & El-Helow, E. R. (2007). Bioresource Technology, 98, 3464–3469.
doi:10.1016/j.biortech.2006.11.007.16. Röhr, M., Kubicek, C. P., & Komínek, J. (1983). In: Reed, G., Rehm, H. J. (ed.), Biotechnology.
Chemie, Weiheim. vol. 317. Ooijkaas, L. P., Weber, F. J., Buitelaar, R. M., Tramper, J., & Rinzema, A. (2000). Trends in
Biotechnology, 18, 356–360. doi:10.1016/S0167-7799(00)01466-9.18. Aboud-Zeid, A., & Ashy, M. A. (1984). Agricultural Wastes, 9, 51–76. doi:10.1016/0141-4607(84)
90075-1.
86 Appl Biochem Biotechnol (2009) 158:72–87

19. Shankaranand, V. S., & Lonsane, B. K. (1994). Process Biochemistry, 29, 29–37. doi:10.1016/0032-9592(94)80056-1.
20. Lima, V. L. A. G., Stamford, T. L. M., & Salgueiro, A. A. (1995). Arquivos de Biologia e Tecnologia, 38,773–783.
21. Pintado, J., Torrado, A., González, M. P., & Murado, M. A. (1998). Enzyme and Microbial Technology,23, 149–156. doi:10.1016/S0141-0229(98)00042-8.
22. Vandenberghe, L. (2000). PhD Thesis. Université de Technologie de Compiègne, Compiègne, FR.23. Prado, F. C., Vandenberghe, L. P. S., Lisboa, C., Paca, J., Pandey, A., & Soccol, C. R. (2004).
Engineering in Life Sciences, 4(2). doi:10.1002/elsc.20042002024. Kubicek, C. P., & Röhr, M. (1986). Critical Reviews in Biotechnology, 3, 331–373. doi:10.3109/
07388558509150788.25. Grewal, H. S., & Kalra, K. L. (1995). Biotechnology Advances, 13, 209–234. doi:10.1016/0734-9750
(95)00002-8.26. Castro, M. F. P. M., Gragagnolo, N., & Valentini, S. R. T. (2002). Brazilian Journal of Microbiology, 33,
22–26. doi:10.1590/S1517-83822002000100004.27. Azevedo, J. L. (1998). Genética de Microrganismos. Editora UFG, Goiânia, GO.
Appl Biochem Biotechnol (2009) 158:72–87 87