Web Meeting: Hurricane Traffic Volumes Pilot Results - The ...

VENTRICULAR FUNCTION
Improved quantification of left ventricular volumes and mass
based on endocardial and epicardial surface detection from
cardiac MR images using level set models
CRISTIANA CORSI, PH.D.,1,2 CLAUDIO LAMBERTI, M.S.,1 ORONZO CATALANO, M.D.,3 PETER MACENEANEY, M.D.,2
DIANNA BARDO, M.D.,2 ROBERTO M. LANG, M.D.,2 ENRICO G. CAIANI, PH.D.,4 and VICTOR MOR-AVI, PH.D.2,*
1Department of Electronics, Computer Science and Systems, University of Bologna, Bologna, Italy2University of Chicago Medical Center, Chicago, Illinois, USA3Salvatore Maugeri Foundation, Pavia, Italy4Dipartimento di Bioingegneria, Politecnico di Milano, Milan, Italy
Purpose. The reproducibility of left ventricular (LV) volume and mass measurements based on subjective slice-by-slice tracing of LVborders is affected by image quality, and volume estimates are biased by geometric modeling. The authors developed a technique forvolumetric surface detection (VoSD) and quantification of LV volumes and mass without tracing and geometric approximations. The authorshypothesized that this technique is accurate and more reproducible than the conventional methodology. Methods. Images were obtained in24 patients in 6 to 10 slices from LV base to apex (GE 1.5 T, FIESTA). Volumetric data were reconstructed, and endocardial and epicardialsurfaces were detected using the level set approach. LV volumes were obtained from voxel counts and used to compute ejection fraction(EF) and mass. Conventional measurements (MASS Analysis) were used as a reference to test the accuracy of VoSD technique (linearregression, Bland-Altman). For both techniques, measurements were repeated to compute inter- and intra-observer variability.Results. VoSD values resulted in high correlation with the reference values (EDV: r = 0.98; ESV: r = 0.99; EF: r = 0.91; mass: r = 0.98),with no significant biases (8 ml, 5 ml, 0.2% and �9 g) and narrow limits of agreement (SD: 13 ml, 10 ml, 6% and 9 g). Inter-observervariability of the VoSD technique was lower (range 3 to 5%) than that of the reference technique (5 to 11%; p < 0.05). Intra-observervariability was also lower (1 to 3% vs. 7 to 10%; p < 0.05). Conclusion. VoSD technique allows accurate measurements of LVvolumes, EF, and mass, which are more reproducible than the conventional methodology.
Key Words: Global ventricular function; Ventricular mass; Magnetic resonance imaging; Computer analysis
1. Introduction
Cardiac magnetic resonance imaging (CMRI) is the standardfor left ventricular (LV) volume, ejection fraction (EF), andmass measurements (1–3). However, LV volumes areroutinely obtained using manual or semi-automated tracingof LV borders on multiple 2D slices and computations basedon disk area summation approximation. Understandably, thereproducibility of this subjective and experience-dependentmethodology is limited when endocardial definition is sub-optimal, as sometimes occurs near the apex. Moreover, theuse of fixed slice thickness for disk summation in segmentswhere the endocardium is not perpendicular to the imaging
plane together with the use of fixed number of slicesthroughout the cardiac cycle, without taking into accountsystolic longitudinal shortening, may bias volume measure-ments. Accordingly, our aim was to develop an alternativetechnique for fast and objective quantification of LV volumes,EF, and mass, with minimal user interaction and no need forgeometric modeling. To achieve these goals, we based ourapproach on volumetric reconstruction followed by surfacedetection (VoSD) in the 3D domain and by direct calculationof LV volumes, EF, and mass.
The level-set methods have been shown to provide accurateboundary detection in 2D and 3D echocardiographic images(4–6). We hypothesized that with the superior quality of MRimages, this approach could be effectively applied tovolumetric data reconstructed from these images. We testedthis hypothesis by comparing the results of VoSD techniquewith LV volume, EF, and mass values obtained by theconventional methodology. We also tested the hypothesis thatthe VoSD technique might be more reproducible than theconventional methodology.
Journal of Cardiovascular Magnetic Resonance (2005) 7, 595–602
Copyright D 2005 Taylor & Francis Inc.
ISSN: 1097-6647 print / 1532-429X online
DOI: 10.1081/JCMR-200060624
Received 8 October 2004; accepted 14 February 2005.*Address correspondence to Victor Mor-Avi, Ph.D., University ofChicago Medical Center, 5841 S. Maryland Ave., Chicago, IL60637, USA; Fax: (773) 702-1034; E-mail: [email protected]
1097-6647 D 2005 Taylor & Francis Inc. 595Order reprints of this article at www.copyright.rightslink.com
2. Methods
2.1. Study design
Twenty-four consecutive patients (16 males, 8 females; age:53 ± 17 years) referred for CMRI studies were recruited intothe study, including 6 patients with normal LV size andfunction, 3 patients with coronary artery disease, 5 withdilated cardiomyopathy, 4 with hypertrophic cardiomyopathy,2 with valvular disease, 2 with aortic abnormalities, and 2with other cardiac pathologies. To establish the accuracy ofthe newly developed VoSD technique, images were analyzedusing both the VoSD procedure and the conventionaltechnique, which was used as a reference for comparisons.In a subgroup of randomly selected 12 patients, all measure-ments were repeated twice to assess the reproducibility ofboth techniques by calculating their intra- and inter-observervariability. For each technique, the intra-observer variabilitywas studied by blindly reanalyzing the images by the sameinvestigator at least one week later, and the inter-observervariability was studied by blindly reanalyzing the images by asecond investigator. All tracings were performed by two
experienced investigators, who had previously analyzed atleast 100 CMRI studies. The investigators were blinded to allprior measurements.
2.2. Image acquisition
CMRI data were obtained using a 1.5 Tesla scanner (GeneralElectric, Milwaukee, Wisconsin) with a phased-array cardiaccoil. Electrocardiogram-gated localizing spin-echo sequenceswere used to identify the long-axis of the heart. Steady-statefree precession (FIESTA) dynamic gradient-echo mode wasthen used to acquire images during breath-hold. Cine-loopswere obtained in 6 to 10 short-axis slices, from the atrio-ventricular ring to the apex (9 mmslice thickness, no gaps)witha temporal resolution of 20 frames per cardiac cycle.
2.3. Image analysis: reference technique
Images were analyzed on a Sun workstation using commer-cial software (MASS Analysis, General Electric). Initially, LVslices were selected for analysis beginning with the highest
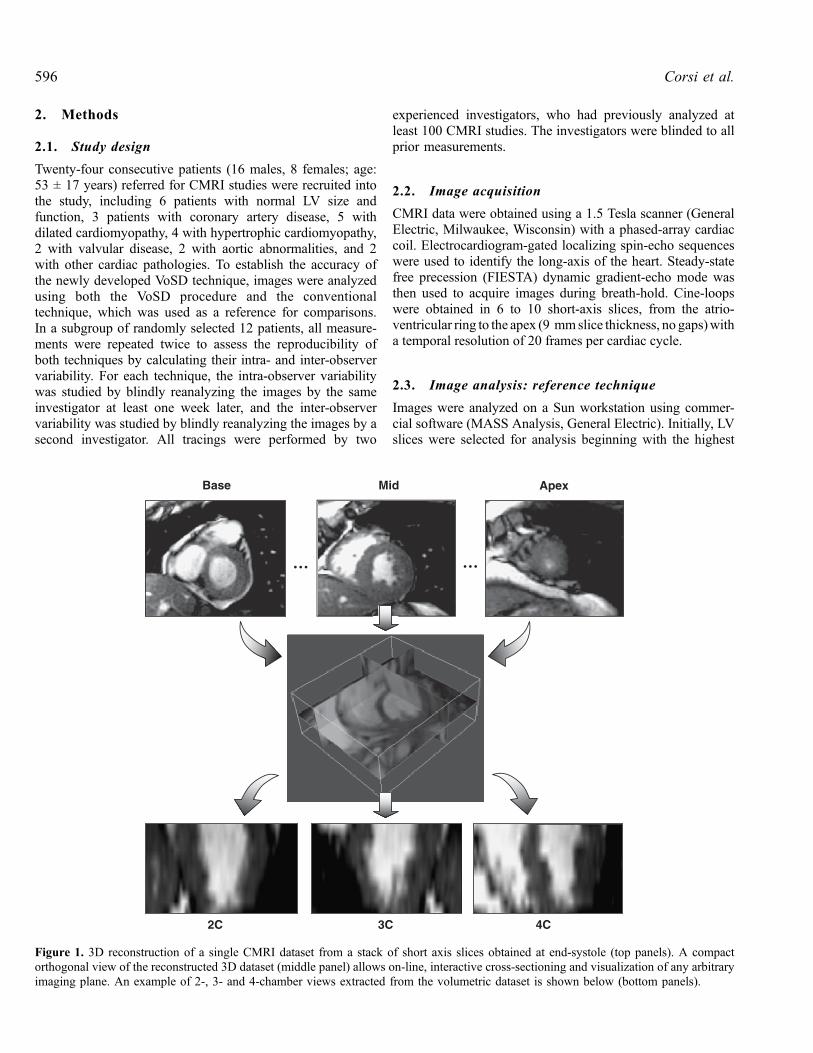
Figure 1. 3D reconstruction of a single CMRI dataset from a stack of short axis slices obtained at end-systole (top panels). A compactorthogonal view of the reconstructed 3D dataset (middle panel) allows on-line, interactive cross-sectioning and visualization of any arbitraryimaging plane. An example of 2-, 3- and 4-chamber views extracted from the volumetric dataset is shown below (bottom panels).
Corsi et al.596
basal slice where the LV outflow tract was not visible andending with the lowest apical slice where the LV cavity wasvisualized. In every slice, LV endocardial contours weretraced semi-automatically frame-by-frame, with the papillarymuscles included in the LV cavity, and manually correctedwhen necessary to optimize the boundary position. Then,ventricular volume was computed throughout the cardiaccycle using a disk-area summation method (modifiedSimpson’s rule). End-diastolic (EDV) and end-systolicvolumes (ESV) were determined as the maximum andminimum LV cavity volume reached during the cardiaccycle. These LV volumes were used to compute the EF as100*(EDV � ESV)/EDV. Epicardial boundaries were thensemi-automatically traced at end-diastole in each slice. LVmass was then computed as the difference between end-diastolic epicardial and endocardial volumes times the massdensity constant (1.05 g/cc).
2.4. Image analysis: VoSD technique
The CMRI datasets were then analyzed using customsoftware, which allows ventricular surface detection usingthe level set approach (4–6). This method uses an implicitrepresentation of curves in the form of a partial differentialequation to track boundaries without geometrical assumptionsor a priori shape knowledge.
First, a fully automated 3D reconstruction of the volumetricdata was performed from the short-axis slices (Fig. 1). Foreach frame, a 3D dataset was generated using trilinear
interpolation, while taking into account slice thickness, thenumber of slices, and the spacing between them. This resultedin a dynamic representation of the entire heart. This dynamicdisplay was used to select end-diastolic and end-systolicframes, which were visually determined as the largest andsmallest LV cavities in the 3D space.
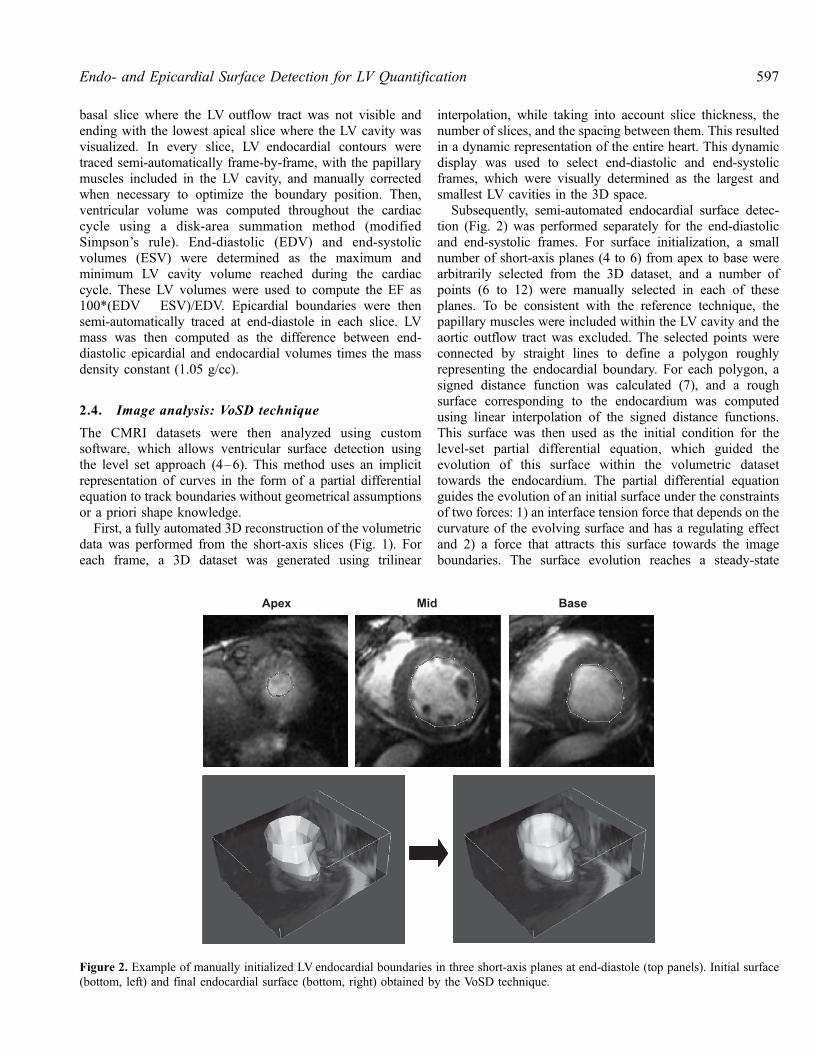
Subsequently, semi-automated endocardial surface detec-tion (Fig. 2) was performed separately for the end-diastolicand end-systolic frames. For surface initialization, a smallnumber of short-axis planes (4 to 6) from apex to base werearbitrarily selected from the 3D dataset, and a number ofpoints (6 to 12) were manually selected in each of theseplanes. To be consistent with the reference technique, thepapillary muscles were included within the LV cavity and theaortic outflow tract was excluded. The selected points wereconnected by straight lines to define a polygon roughlyrepresenting the endocardial boundary. For each polygon, asigned distance function was calculated (7), and a roughsurface corresponding to the endocardium was computedusing linear interpolation of the signed distance functions.This surface was then used as the initial condition for thelevel-set partial differential equation, which guided theevolution of this surface within the volumetric datasettowards the endocardium. The partial differential equationguides the evolution of an initial surface under the constraintsof two forces: 1) an interface tension force that depends on thecurvature of the evolving surface and has a regulating effectand 2) a force that attracts this surface towards the imageboundaries. The surface evolution reaches a steady-state
Figure 2. Example of manually initialized LV endocardial boundaries in three short-axis planes at end-diastole (top panels). Initial surface(bottom, left) and final endocardial surface (bottom, right) obtained by the VoSD technique.
597Endo- and Epicardial Surface Detection for LV Quantification
solution when the two terms that reflect these forces balanceeach other. When the solution of the differential equationconverged, the resultant final surface was used to representthe endocardium, and LV volume was calculated as thenumber of voxels within the detected surface. In addition, EFwas calculated from EDV and ESV according to the sameformula used for the reference technique.
Epicardial surface was detected only in the end-diastolicframe, following the same surface detection procedure,including the manual initialization of a small number ofpoints. To verify the correctness of the endo- and epicardialsurface detection, both surfaces were superimposed on thevolumetric data (Fig. 3), which allowed cross-sectioning inany arbitrary plane and corrections of the initial points whennecessary. After having the position of the endo- andepicardial surfaces confirmed in multiple cross-sectionalplanes, the end-diastolic epicardial volume was calculatedas voxel count inside the detected epicardial surface. From thecalculated end-diastolic endo- and epicardial volumes, LVmass was obtained according to the same formula used for thereference technique.
2.5. Statistical analysis
For each patient, VoSD measurements of LV EDV, ESV, EF,and mass were compared with the values derived by thereference technique using linear regression and Bland-Altmananalyses. Paired t-test versus null values was applied to verifythe significance of the bias. For each measured parameter,intra-observer variability of the reference technique and theVoSD technique were calculated as the absolute differencebetween the repeated measurements by the same investigator
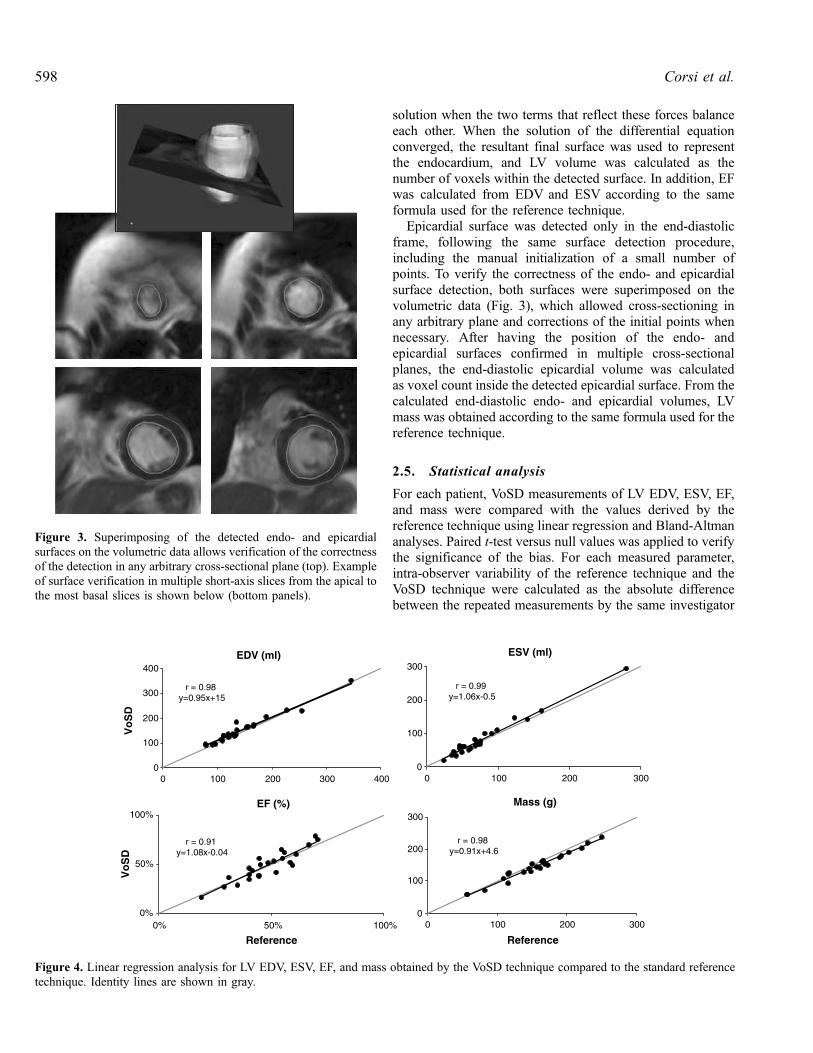
Figure 3. Superimposing of the detected endo- and epicardialsurfaces on the volumetric data allows verification of the correctnessof the detection in any arbitrary cross-sectional plane (top). Exampleof surface verification in multiple short-axis slices from the apical tothe most basal slices is shown below (bottom panels).
Figure 4. Linear regression analysis for LV EDV, ESV, EF, and mass obtained by the VoSD technique compared to the standard referencetechnique. Identity lines are shown in gray.
Corsi et al.598
in percent of their mean. Similarly, inter-observer variabilityof both techniques was calculated for each measuredparameter as the absolute difference between the measure-ments performed by the two investigators in percent of theirmean. For both inter- and intra-observer variability of eachparameter, paired t-test was used to test the significance of thedifferences between the two techniques.
3. Results
All patients had normal sinus rhythm and a mean heart rate of71 bpm (range: 50–115 bpm). Image acquisition lasted
between 10 and 15 sec depending on heart rate, respirationrate, and the quality of ECG signal in each patient. End-diastolic and end-systolic volumes measured from conven-tional semi-automated tracings ranged widely from 78 to345 mL and from 24 to 280 mL, respectively, reflecting theinhomogeneity of the study group. Accordingly, EF alsoranged widely from 19 to 71% and mass from 57 to 245 g.The analysis of a single dataset using the reference techniquerequired between 10 and 20 minutes. In contrast, the VoSDanalysis including data retrieval, frame selection, surfacesinitialization, and computation of volumes and mass werecompleted in every patient in less than 5 minutes on apersonal computer (Pentium II, 755MHz, 512Mb RAM).
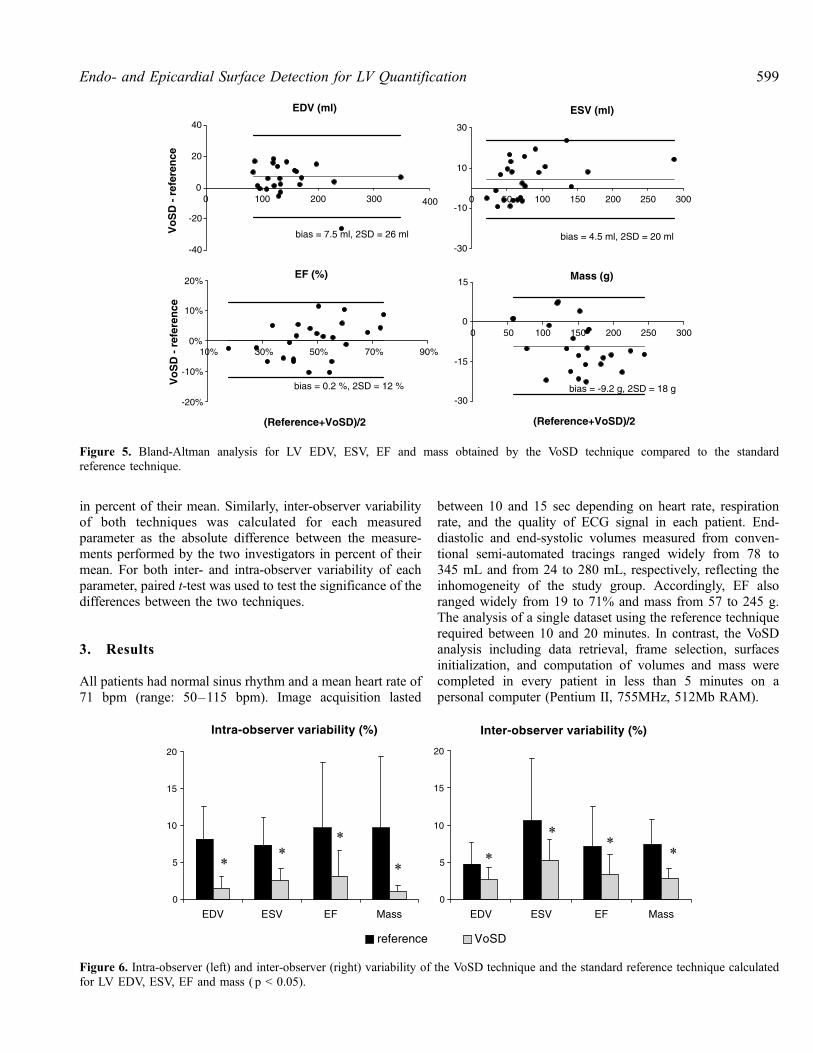
Figure 5. Bland-Altman analysis for LV EDV, ESV, EF and mass obtained by the VoSD technique compared to the standardreference technique.
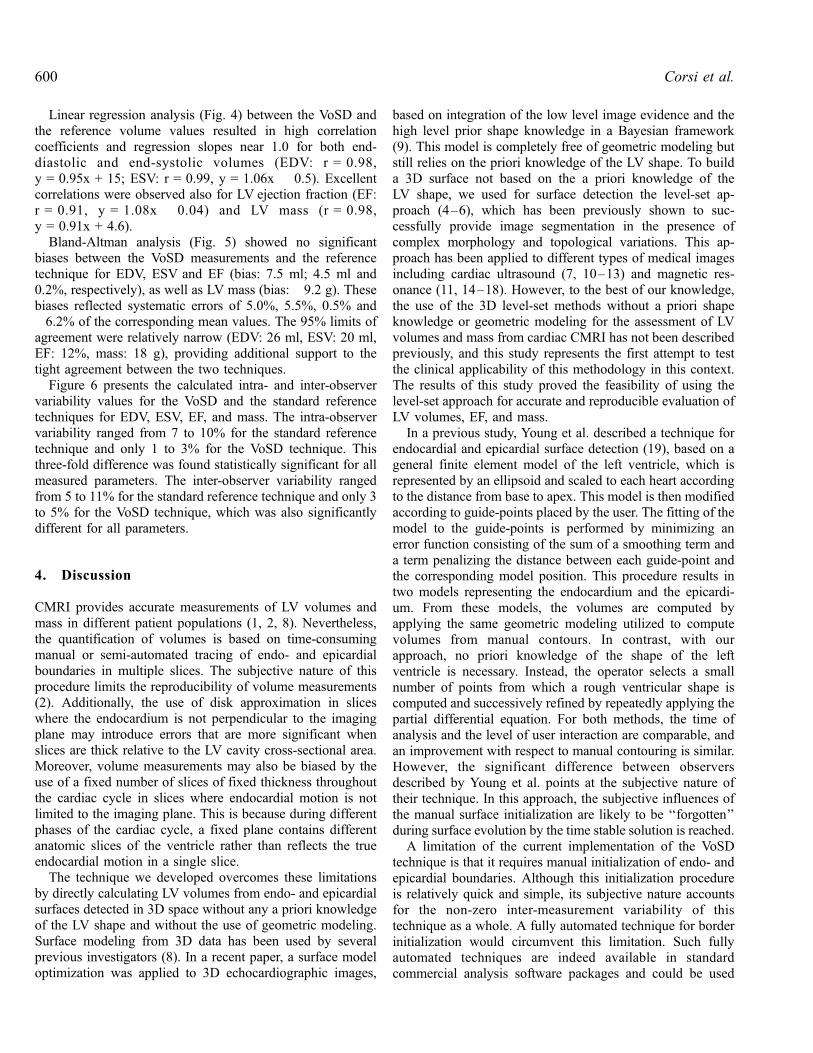
Figure 6. Intra-observer (left) and inter-observer (right) variability of the VoSD technique and the standard reference technique calculatedfor LV EDV, ESV, EF and mass ( p < 0.05).
599Endo- and Epicardial Surface Detection for LV Quantification
Linear regression analysis (Fig. 4) between the VoSD andthe reference volume values resulted in high correlationcoefficients and regression slopes near 1.0 for both end-diastolic and end-systolic volumes (EDV: r = 0.98,y = 0.95x + 15; ESV: r = 0.99, y = 1.06x � 0.5). Excellentcorrelations were observed also for LV ejection fraction (EF:r = 0.91, y = 1.08x � 0.04) and LV mass (r = 0.98,y = 0.91x + 4.6).
Bland-Altman analysis (Fig. 5) showed no significantbiases between the VoSD measurements and the referencetechnique for EDV, ESV and EF (bias: 7.5 ml; 4.5 ml and0.2%, respectively), as well as LV mass (bias: �9.2 g). Thesebiases reflected systematic errors of 5.0%, 5.5%, 0.5% and�6.2% of the corresponding mean values. The 95% limits ofagreement were relatively narrow (EDV: 26 ml, ESV: 20 ml,EF: 12%, mass: 18 g), providing additional support to thetight agreement between the two techniques.
Figure 6 presents the calculated intra- and inter-observervariability values for the VoSD and the standard referencetechniques for EDV, ESV, EF, and mass. The intra-observervariability ranged from 7 to 10% for the standard referencetechnique and only 1 to 3% for the VoSD technique. Thisthree-fold difference was found statistically significant for allmeasured parameters. The inter-observer variability rangedfrom 5 to 11% for the standard reference technique and only 3to 5% for the VoSD technique, which was also significantlydifferent for all parameters.
4. Discussion
CMRI provides accurate measurements of LV volumes andmass in different patient populations (1, 2, 8). Nevertheless,the quantification of volumes is based on time-consumingmanual or semi-automated tracing of endo- and epicardialboundaries in multiple slices. The subjective nature of thisprocedure limits the reproducibility of volume measurements(2). Additionally, the use of disk approximation in sliceswhere the endocardium is not perpendicular to the imagingplane may introduce errors that are more significant whenslices are thick relative to the LV cavity cross-sectional area.Moreover, volume measurements may also be biased by theuse of a fixed number of slices of fixed thickness throughoutthe cardiac cycle in slices where endocardial motion is notlimited to the imaging plane. This is because during differentphases of the cardiac cycle, a fixed plane contains differentanatomic slices of the ventricle rather than reflects the trueendocardial motion in a single slice.
The technique we developed overcomes these limitationsby directly calculating LV volumes from endo- and epicardialsurfaces detected in 3D space without any a priori knowledgeof the LV shape and without the use of geometric modeling.Surface modeling from 3D data has been used by severalprevious investigators (8). In a recent paper, a surface modeloptimization was applied to 3D echocardiographic images,
based on integration of the low level image evidence and thehigh level prior shape knowledge in a Bayesian framework(9). This model is completely free of geometric modeling butstill relies on the priori knowledge of the LV shape. To builda 3D surface not based on the a priori knowledge of theLV shape, we used for surface detection the level-set ap-proach (4–6), which has been previously shown to suc-cessfully provide image segmentation in the presence ofcomplex morphology and topological variations. This ap-proach has been applied to different types of medical imagesincluding cardiac ultrasound (7, 10–13) and magnetic res-onance (11, 14–18). However, to the best of our knowledge,the use of the 3D level-set methods without a priori shapeknowledge or geometric modeling for the assessment of LVvolumes and mass from cardiac CMRI has not been describedpreviously, and this study represents the first attempt to testthe clinical applicability of this methodology in this context.The results of this study proved the feasibility of using thelevel-set approach for accurate and reproducible evaluation ofLV volumes, EF, and mass.
In a previous study, Young et al. described a technique forendocardial and epicardial surface detection (19), based on ageneral finite element model of the left ventricle, which isrepresented by an ellipsoid and scaled to each heart accordingto the distance from base to apex. This model is then modifiedaccording to guide-points placed by the user. The fitting of themodel to the guide-points is performed by minimizing anerror function consisting of the sum of a smoothing term anda term penalizing the distance between each guide-point andthe corresponding model position. This procedure results intwo models representing the endocardium and the epicardi-um. From these models, the volumes are computed byapplying the same geometric modeling utilized to computevolumes from manual contours. In contrast, with ourapproach, no priori knowledge of the shape of the leftventricle is necessary. Instead, the operator selects a smallnumber of points from which a rough ventricular shape iscomputed and successively refined by repeatedly applying thepartial differential equation. For both methods, the time ofanalysis and the level of user interaction are comparable, andan improvement with respect to manual contouring is similar.However, the significant difference between observersdescribed by Young et al. points at the subjective nature oftheir technique. In this approach, the subjective influences ofthe manual surface initialization are likely to be ‘‘forgotten’’during surface evolution by the time stable solution is reached.
A limitation of the current implementation of the VoSDtechnique is that it requires manual initialization of endo- andepicardial boundaries. Although this initialization procedureis relatively quick and simple, its subjective nature accountsfor the non-zero inter-measurement variability of thistechnique as a whole. A fully automated technique for borderinitialization would circumvent this limitation. Such fullyautomated techniques are indeed available in standardcommercial analysis software packages and could be used
Corsi et al.600
instead of the manual initialization. While these commercialtechniques do not always provide perfect boundary detectionwithout manual adjustments, they may provide sufficientinformation for the boundary initialization. In this study, wedid not use commercial software for initialization becausecommercial software does not allow exporting the boundariesfor further processing. Integrating existing techniques ornewer sophisticated algorithms for fully automated boundaryinitialization (20) with the VoSD technique is likely to lead toeven more accurate and reproducible evaluation of LVfunction and mass from CMRI data.
A limitation of this study was the exclusion of basal slicesthat contained the LVoutflow tract, in which the definition ofLV boundaries is most subjective. Including these sliceswould require additional user input and would likely havefurther increased the levels of inter-measurement variabilityfor both techniques, the standard reference, and VoSD. Sincethe extent of this increase in variability cannot be estimatedbased on our results, the potential need to include thesechallenging slices will require further development andtesting of appropriate algorithms.
Another limitation of this study is that the VoSD techniquewas not tested in different specific patient populations. Ofparticular interest would be to establish normal values for thisnew technique. This was not done because we studied a groupof 24 unselected patients of whom only 6 had normal LV sizeand function, and we felt that it would be inappropriate toclaim that values obtained in this small subgroup of subjectscould reliably represent normal values of the generalpopulation. However, the high levels of agreement betweenVoSD technique and standard reference values suggest thatthe normal values should not be different from thosepreviously established. Nevertheless, our goal of testing thefeasibility and validating our newly developed technique in awide range of conditions was achieved by enrollingunselected patients representing a variety of cardiac diseasestates. The results of this study warrant future studies gearedtoward further validation of our technique in more narrowlydefined patient populations.
Despite these limitations, these results showed that thisnew technique is accurate since it provided LV volume, EF,and mass values in close agreement with the standardreference technique. Since this reference technique is widelyconsidered the ‘‘gold standard’’ for these measurements, it isdifficult to directly prove that a new technique could be moreaccurate. Nevertheless, the VoSD approach was found to bemore reproducible than the conventional methodology.Importantly, the levels of inter- and intra-observer variabilityof the latter technique measured in our study was similar tothose reported by several previous investigators (21). Sakumaand colleagues showed in normal subjects an inter-observervariability of 4 and 8% for EDV and ESV, respectively (22);other reports included intra- and inter-observer variability of2 to 7% and 3.6 to 7.3%, respectively (23). A third reportprovided 1.6 to 6.6% and 1.6 to 7.3%, respectively (24), for
intra- and inter-observer variability. Similar results werereported for heart failure patients (24, 25). The intra-observerand inter-observer variability and the negligible biases of theVoSD technique support the hypothesis that this techniquecould result in improvement in diagnostic accuracy. Inaddition, this technique is faster even in its current version,since the interactive part of the procedure only consists of theinitialization of a small number of points in a few planes.
Moreover, theoretically, this approach could allow auto-mated, full temporal analysis of the LV volume by using thedetected surface of each frame as the initial condition for thefollowing frame throughout the cardiac cycle. Thus, manualinteraction would only be necessary for the first frameanalyzed. Importantly, considering that of the 5 minutesnecessary to analyze a single dataset, surface evolution takesonly 30 sec, and analysis of all phases of the cardiac cyclewould only add 30 sec times the number of frames, i.e. lessthan 10 min, which could be further reduced by using a morepowerful computer.
Other potential future applications of this approach mayinclude the evaluation of right ventricular function, whichtoday requires tedious frame-by-frame manual tracing and isknown to be challenging because the morphology of thischamber is complex, irregular, and widely variable betweensubjects (26, 27). The main advantage of VoSD technique inthis context is that it requires no priori knowledge ormodeling of the chamber geometry. Therefore, this approachmay allow easier and more accurate assessment of the rightventricle (28).
In summary, this study proved the clinical feasibility oflevel-set volumetric surface detection from cardiac MRimages geared toward the assessment of LV performance.The results of this validation study demonstrated that theproposed method allows rapid and accurate measurements ofLV volumes, EF, and mass, in agreement with conventionalsemi-automated tracing with the advantage of being fast andindependent of geometrical assumptions or modeling. Impor-tantly, the improved reproducibility of this new techniqueindicates a potential accuracy advantage over the currentstandard reference methodology.
References
1. Dulce MC, Friese K, Albrecht A, Hamm B, Buttner P, Wolf KJ.
Variability and reproducibility in the determination of left-ventricular
heart volume by cine-MR. A comparison of measurement methods.
Rofo 1991; 155:99–108.
2. Pattynama PM, Lamb HJ, Van der Velde EA, van der Wall EE, De
Roos A. Left ventricular measurements with cine and spin-echo MR
imaging: a study of reproducibility with variance component analysis.
Radiology 1993; 187:261–268.
3. Thiele H, Paetsch I, Schnackenburg B, Bornstedt A, Grebe O,
Wellnhofer E, Schuler G, Fleck E, Nagel E. Improved accuracy of
quantitative assessment of left ventricular volume and ejection fraction
by geometric models with steady-state free precession. J Cardiovasc
Magn Reson 2002; 4:327–339.
601Endo- and Epicardial Surface Detection for LV Quantification
4. Osher S, Sethian JA. Fronts propagating with curvature-dependent
speed—algorithms based on Hamilton-Jacobi formulations. J Comput
Phys 1988; 79:12–49.
5. Malladi R, Sethian JA, Vemuri BC. Shape modeling with front
propagation—a level set approach. IEEE Trans Pattern Anal Mach
Intell 1995; 17:158–175.
6. Sethian JA. Level Set Methods and Fast Marching Methods.Cambridge: Cambridge University Press, 1999.
7. Corsi C, Saracino G, Sarti A, Lamberti C. Left ventricular volume
estimation for real-time three-dimensional echocardiography. IEEE
Trans Med Imag 2002; 21:1202–1208.
8. Frangi AF, Niessen WJ, Viergever MA. Three-dimensional modeling
for functional analysis of cardiac images: a review. IEEE Trans Med
Imag 2001; 20:2–25.
9. Song M, Haralick RM, Sheehan FH, Johnson RK. Integrated surface
model optimization for freehand three-dimensional echocardiography.
IEEE Trans Med Imag 2002; 21:1077–1090.
10. Sarti A, Mikula K, Sgallari F. Nonlinear multiscale analysis of three-
dimensional echocardiographic sequences. IEEE Trans Med Imag
1999; 18:453–466.
11. Chen YM, Guo WH, Huang F, Wilson D, Geiser EA. Using prior
shape and points in medical image segmentation. Energy Minim
Methods Comput Vis Pattern Recogn, Proc 2003; 2683:291–305.
12. Lin N, Yu W, Duncan JS. Combinative multi-scale level set framework
for echocardiographic image segmentation. Med Image Anal 2003;
7:529–537.
13. Deschamps T, Malladi R, Ravve I. Fast evolution of image manifolds
and application to filtering and segmentation in 3D medical images.
IEEE Trans Vis Comput Graph 2004; 10:525–535.
14. Chen YM, Tagare HD, Thiruvenkadam S, Huang F, Wilson D,
Gopinath KS, Briggs RW, Geiser EA. Using prior shapes in geometric
active contours in a variational framework. Int J Comput Vis 2002;
50:315–328.
15. Kaus MR, von Berg J, Niessen W, Pekar V. Automated segmentation
of the left ventricle in cardiac MRI. Medical Image Computing and
Computer-Assisted Intervention—Miccai 2003. 2003; 2878(pt 1):
432–439.
16. Lorenzo-Valdes M, Sanchez-Ortiz GI, Mohiaddin R, Rueckert D.
Segmentation of 4D cardiac MR images using a probabilistic atlas and
the EM algorithm. Medical Image Computing and Computer-Assisted
Intervention—Miccai 2003. 2003; 2878(pt 1): 440–450.
17. Paragios N. A level set approach for shape-driven segmentation and
tracking of the left ventricle. IEEE Trans Med Imag 2003; 22:773–
776.
18. Yang J, Staib LH, Duncan JS. Neighbor-constrained segmentation
with level set based 3-D deformable models. IEEE Trans Med Imag
2004; 23:940–948.
19. Young AA, Cowan BR, Thrupp SF, Hedley WJ, Dell’Italia LJ. Left
ventricular mass and volume: fast calculation with guide-point
modeling on MR images. Radiology 2000; 216:597–602.
20. van der Geest RJ, Lelieveldt BP, Angelie E, Danilouchkine M,
Swingen C, Sonka M, Reiber JH. Evaluation of a new method for
automated detection of left ventricular boundaries in time series of
magnetic resonance images using an Active Appearance Motion
Model. J Cardiovasc Magn Reson 2004; 6:609–617.
21. Myerson SG, Bellenger NG, Pennell DJ. Assessment of left ventricular
mass by cardiovascular magnetic resonance. Hypertension 2002;
39:750–755.
22. Sakuma H, Fujita N, Foo TK, Caputo GR, Nelson SJ, Hartiala J,
Shimakawa A, Higgins CB. Evaluation of left ventricular volume and
mass with breath-hold cine MR imaging. Radiology 1993; 188:377–
380.
23. Bogaert JG, Bosmans HT, Rademakers FE, Bellon EP, Herregods
MC, Verschakelen JA, Van de WF, Marchal GJ. Left ventricular
quantification with breath-hold MR imaging: comparison with
echocardiography. Magma 1995; 3:5–12.
24. Bellenger NG, Davies LC, Francis JM, Coats AJ, Pennell DJ.
Reduction in sample size for studies of remodeling in heart failure by
the use of cardiovascular magnetic resonance. J Cardiovasc Magn
Reson 2000; 2:271–278.
25. Matheijssen NA, Baur LH, Reiber JH, van d, V, van Dijkman PR,
van der Geest RJ, de RA, van der Wall EE. Assessment of left
ventricular volume and mass by cine magnetic resonance imaging in
patients with anterior myocardial infarction intra-observer and inter-
observer variability on contour detection. Int J Card Imaging 1996;
12:11–19.
26. Grothues F, Moon JC, Bellenger NG, Smith GS, Klein HU, Pennell
DJ. Interstudy reproducibility of right ventricular volumes, function,
and mass with cardiovascular magnetic resonance. Am Heart J
2004; 147:218–223.
27. Pattynama PM, Lamb HJ, Van der Velde EA, van der Geest RJ, van
der Wall EE, De Roos A. Reproducibility of MRI-derived measure-
ments of right ventricular volumes and myocardial mass. Magn Reson
Imaging 1995; 13:53–63.
28. Battani R, Corsi C, Sarti A, Lamberti C, Piva T, Fattori R.
Estimation of right ventricular volume without geometrical assump-
tions utilizing cardiac magnetic resonance data. Comput Cardiol 2003;
30:81–84.
Corsi et al.602
Copyright © 2022 FDOKUMEN