IMPORT OF CHICKEN LEGS - Ministry of Commerce and ...
55
GOVERNMENT OF INDIA MINISTRY OF COMMERCE & INDUSTRY (DEPARTMENT OF COMMERCE) LOK SABHA STARRED QUESTION NO. 229 TO BE ANSWERED ON 04 th DECEMBER, 2019 IMPORT OF CHICKEN LEGS *229. SHRI A.K.P. CHINRAJ: SHRI SHRIRANG APPA BARNE: Will the Minister of COMMERCE & INDUSTRY (वािण�य एवं उ�ोग मं �ी ) be pleased to state: (a) whether the domestic poultry sector has been adversely affected due to the import of chicken legs from the United States, especially in the Namakal district of Tamil Nadu; (b) if so, the details thereof along with the quantum of chicken legs imported during each of the last three years and the current year; (c) whether the Government has a system in place for the import of livestock products, especially ch icken legs and if so, the details thereof; (d) the corrective steps taken/ proposed to be taken by the Government to block the cheaper imports so as to protect the domestic poultry market; and (e) whether the Government has assessed the impact of consumption of highly freezed chicken on the health of people, if so, the details and the outcome thereof along with the other steps taken by the Government to protect the Indian poultry sector? to protect the Indian poultry sector? ANSWER okf.kT; ,oa m|ks x ea =h ( Jh ih;w’k xks ;y ) THE MINISTER OF COMMERCE AND INDUSTRY (SHRI PIYUSH GOYAL) (a) to (e): A Statement is laid on the Table of the House. *****
-
Upload
khangminh22 -
Category
Documents
-
view
1 -
download
0
Transcript of IMPORT OF CHICKEN LEGS - Ministry of Commerce and ...

GOVERNMENT OF INDIAMINISTRY OF COMMERCE & INDUSTRY
(DEPARTMENT OF COMMERCE)
LOK SABHASTARRED QUESTION NO. 229
TO BE ANSWERED ON 04 th DECEMBER, 2019
IMPORT OF CHICKEN LEGS
*229. SHRI A.K.P. CHINRAJ: SHRI SHRIRANG APPA BARNE:
Will the Minister of COMMERCE & INDUSTRY (वािण�य एवं उ�ोग मं�ी ) be pleased to state:
(a) whether the domestic poultry sector has been adversely affected due to the import of chicken legs from the United States, especially in the Namakal district of Tamil Nadu;
(b) if so, the details thereof along with the quantum of chicken legs imported during each of the last three years and the current year;
(c) whether the Government has a system in place for the import of livestock products, especially ch icken legs and if so, the details thereof;
(d) the corrective steps taken/ proposed to be taken by the Government to block the cheaper imports so as to protect the domestic poultry market; and
(e) whether the Government has assessed the impact of consumption of highly freezed chicken on the health of people, if so, the details and the outcome thereof along with the other steps taken by the Government to protect the Indian poultry sector?to protect the Indian poultry sector?
ANSWER
okf.kT; ,oa m|ksx ea=h ( Jh ih;w’k xks;y )THE MINISTER OF COMMERCE AND INDUSTRY
(SHRI PIYUSH GOYAL)
(a) to (e): A Statement is laid on the Table of the House.
*****

STATEMENT REFERRED TO IN REPLY TO PARTS (a) to (e) OF LOK SABHA STARRED QUESTION NO. 229 FOR ANSWER ON 04th DECEMBER,2019 REGARDING “IMPORT OF CHICKEN LEGS”.
(a) & (b): No report of adverse effect on the domestic poultry sector including Namakal
district in Tamil Nadu, due to import of chicken legs from the United States to India, has been
received in the Ministry. The item Chicken legs does not have any separate ITC (HS) code and
is included under ITC(HS): 02071400 (Cuts and Offal of Fowls of the species Gals). India’s
imports of items under ITC(HS): 02071400 (Cuts and Offal of Fowls of the species Gals) country-
wise for the last three years 2016-17 to 2018-19 and the current financial year 2019-20 (upto
September, 2019) is given below:
India's import of items ITCHS Code 02071400 (Cut and Ofal of Fowls of the Specis Gals) country-wise, for the last three years (2016-17 to 2018-19) and the current financial year 2019-20 (upto September, 2019)
ITCHS Item Description
Country 2016-17 2017-18 2018-19 *2019-20 (upto September, 2019)
Qty.(Kgs)
Value(US $)
Qty.(Kgs)
Value(US $)
Qty.(Kgs)
Value(US $)
Qty.(Kgs)
Value(US $)
02071400 CUTS AND OFAL OF
BRAZIL - - - - - - 27000 21312
FOWLS OF THE SPECIS GALS DOMSTCUS, FRZN
U S A - - - - 122132 80464 - -Others - - - - - - - -
Total 122132 80464 27000 21312
*Note: Figures pertaining to the current financial year 2019-20 are Provisional and subject to changes.
(Source : DGCI&S)

(c) & (d): Yes Sir. As per Department of Animal Husbandry & Dairying’s Notification S.O.
2666 (E) dated 16.10.2014 published in the Gazette, for the import of Livestock products
including chicken legs, a Sanitary Import Permit is required which has to be issued by
Department of Animal Husbandry and Dairying. This Sanitary Import Permit includes Indian
sanitary protocols which have to be certified by the official authorities of the exporting country
before exporting the livestock products into India. The import of these items are restricted by
applying import duty. The current import duty on such items is @ 100% which is maximum rate
available under India’s bound rates.
(e): Food Safety and Standards Authority of India (FSSAI) is the authorised agency under
Ministry of Health & Family Welfare for prescribing standards for food products. FSSAI has
prescribed Standards for fresh or chilled or frozen poultry meat under regulation 2.5.2.11 of Food
Safety and Standards (Food Product Standards and Food Additives) Regulations, 2011 where
conditions for storage of frozen meat and its shelf life is given in detail. Appendix B of these
regulations also prescribes microbiological standards for frozen meat. The products complying
with these standards are considered to be safe for human consumption. However, FSSAI has
no information available on the assessment of the impact of consumption of highly freezed
chicken on the health of the people.
***

GOVERNMENT OF INDIAMINISTRY OF COMMERCE & INDUSTRY
(DEPARTMENT OF COMMERCE)
LOK SABHAUNSTARRED QUESTION NO. 2543
TO BE ANSWERED ON 04 th DECEMBER, 2019
EXPORT/IMPORT FROM TELANGANA
2543. SHRI ANUMULA REVANTH REDDY
Will the Minister of COMMERCE & INDUSTRY (वािण�य एवं उ�ोग मं�ी ) be pleased to state:
(a) the details of the total export and import separately of goods and services respectively in each of the last (a) the details of the total export and import separately of goods and services respectively in each of the last five years from/to the State of Telangana; and
(b) the steps taken in each of the last five years to improve the export of goods and services respectively from the State of Telangana?
ANSWER
okf.kT; ,oa m|ksx ea=h ( Jh ih;w’k xks;y )THE MINISTER OF COMMERCE AND INDUSTRY
(SHRI PIYUSH GOYAL) (SHRI PIYUSH GOYAL) (a) : Exports of Merchandise Goods from the State of Telangana from 2014 -15 till August,
2019 is as below :-
Year Value (Rs. In crore)2014-15 13431.622015-16 35439.232016-17 40239.022017-18 42363.272018-19 50096.84
2019-20 (Upto August, 2019) (**)
20945.08
[Source of data : DGCIS. (**) Figures for 2019-20 are provisional] [Source of data : DGCIS. (**) Figures for 2019-20 are provisional]
(b) : Many steps have been taken by the Government to improve the export of goods and
services from the State of Telangana.
Department of Commerce has launched an Agriculture Export Policy in 2018, which
seeks to harness the export potential of Indian agriculture, through suitable policy instruments.

Under Agri Export Policy, Rang Reddy, Mehaboobnagar and Warangal Districts i n Telangana
have been identified as cluster districts in Telangana for promotion of mangoes, khammam and
Warangal Districts have been identified as clusters for promotion of chilli by Agricultural and
Processed Food Products Export Development Authority (APEDA). APEDA had organised
various sensitization/export promotion/awareness programmes, buyer seller meets, training
programmes for exporters in Telangana to enhance exports of agri products, especially mango,
non-basmati rice, gherkins, etc. Financial assistance is also provided by APEDA for
infrastructure development, quality development, market promotion and development of organic
products. The Government also has a ‘Transport and Marketing Assistance for Specified
Agriculture Products Scheme’ for providing assistance to mitigate the freight disadvantage for
the exports of agricultural products.
Spices Board has established Spice Development Agency (SDA) at Warangal for overall
development of spices produced in the State. To make avail quality expor table surplus Board
is implementing various schemes for post-harvest quality improvement of spices, providing
financial assistance to farmers / farmers groups for turmeric boiler / turmeric polishers etc,
conducting Buyer Sell Meet (BSM).
Government of India ensures a regular dialogue with the State Governments on
measures for promoting exports and for creating a conducive environment to boost exports from
the States. Two delegations comprising of senior most officers of the Department of Commerce
have undertaken visits to the State of Telangana on 04.03.2016 and 13.04.2018 to discuss
issues relating to exports from the States.
At the request of Department of Commerce, State of Telangana has nominated a senior
officer as the Export Commissioner who can coordinate all the export efforts of the different
agencies of the State Government and act as a single window. Similarly a senior officer in the
Department of Commerce has been nominated as a Nodal Officer to coordinate with the State
Government to address issues related to international trade.
****

GOVERNMENT OF INDIAMINISTRY OF COMMERCE & INDUSTRY
(DEPARTMENT OF COMMERCE)
LOK SABHAUNSTARRED QUESTION NO. 2546
TO BE ANSWERED ON 04 th DECEMBER, 2019
RCEP AGREEMENT ON MILK PRODUCTS
2546. SHRI SISIR KUMAR ADHIKARI:SHRI SHANMUGA SUNDARAM K.:
Will the Minister of COMMERCE & INDUSTRY (वािण�य एवं उ�ोग मं�ी ) be pleased to state:
(a) whether the Government had any agreement during negotiations at Regional Comprehensive Economic Partnership (RCEP) comprising ASEAN, China, Australia, New Zealand, Japan and South Korea regarding the import of milk and milk products from New Zealand;
(b) if so, the details of such an agreement under the Regional Comprehensive Economic Partnership (RCEP) and the proposal therein;
(c) whether the domestic dairy producers including co-operative milk producers union have reacted to the Free Trade Agreement(FTA);
(d) if so, the details thereof and the proposal of the Government to sustain domestic productivity, employment and milk producers in the competition thereof;
(e) the total quantum of milk and milk products in India for the current year and for each of the past three years; and
(f) whether the Government is having any proposal to reduce import duty on milk products?(f) whether the Government is having any proposal to reduce import duty on milk products?
ANSWER
okf.kT; ,oa m|ksx ea=h ( Jh ih;w’k xks;y )THE MINISTER OF COMMERCE AND INDUSTRY
(SHRI PIYUSH GOYAL)
(a) to (d): No Sir, during the 3rd RCEP Leaders Summit which was held on 4 November,2019 in Bangkok; India stated that the current structure of the Regional Comprehensive Economic Partnership (RCEP) did not fully reflect the RCEP Guiding Principles or Economic Partnership (RCEP) did not fully reflect the RCEP Guiding Principles or address the outstanding issues and concerns of India, in the light of which India did not join the consensus. The Government held stakeholders’ consultations including with co-operative milk producer’s union which were taken into account while formulating its position under RCEP.

(e): India’s annual production of milk during last 4 years is as under:-
Year *Milk production (figures in Million Tonnes)
2015-16 155.5
2016-17 165.4
2017-18 176.3
**2018-19 187.7
Source: *Annual Report 2018-19 of the Department of Animal Husbandry and Dairying
** Annual “Integrated Sample Survey” of Department of Animal Husbandry and Dairying
(f): As of date, there is no such proposal.
****

GOVERNMENT OF INDIAMINISTRY OF COMMERCE & INDUSTRY
(DEPARTMENT OF COMMERCE)
LOK SABHAUNSTARRED QUESTION NO. 2548
TO BE ANSWERED ON 04 th DECEMBER, 2019
IMPORT OF EDIBLE OIL
2548. SHRI ADHIKARI DEEPAK (DEV):
Will the Minister of COMMERCE & INDUSTRY (वािण�य एवं उ�ोग मं�ी ) be pleased to state:
(a) the country-wise details of crude edible oil import during each of the last three years;(a) the country-wise details of crude edible oil import during each of the last three years;(b) whether there has been a sharp increase in the import of crude edible oil recently; and(c) if so, the details thereof?
ANSWER
okf.kT; ,oa m|ksx ea=h ( Jh ih;w’k xks;y )THE MINISTER OF COMMERCE AND INDUSTRY
(SHRI PIYUSH GOYAL)
(a) to (c): The quantity and value of import of crude edible oil into the country during the last three
years and the current year are as follows:years and the current year are as follows:
Year Quantity(Thousand Tonne)
Value(US$ Million)
% Change in values
2016-17 11040.46 8635.2 ---2017-18 12573.12 9586.4 11.022018-19 12448.15 8227.6 -14.17
2019-20(Apr-Sept,19)* 5870.07 3591.6 -18.82**
Source: DGCI&S, * Provisional, ** As compared to corresponding period in 2018-19.Source: DGCI&S, * Provisional, ** As compared to corresponding period in 2018-19.
Import of crude edible oil had a negative growth of 14.17% in 2018-19 over 2017-18 and negative
growth of 18.82% in 2019-20 (Apr-Sept) as compared with corresponding period of the previous year.
The country-wise details of import of crude edible oil during each of the last three years are given at
Annexure.

Statement referred to in reply of part (a) to (c) of Lok Sabha Unstarred question no. 2548 for answer on 4 th December 2019.
Country-wise Import of Crude Edible Oil for last three years
COUNTRY ITCHS Description
2016-17 2017-18 2018-19
QTY-TON
VAL (MILL US $) QTY-TON
VAL (MILL US $) QTY-TON
VAL (MILL US $)
ARGENTINA 15071000 SOYA BEAN CRUDE OIL W/N DEGUMMED
2747363.50 2211.78 2431682.65 1970.35 2225232.85 1649.23
15121110 SUNFLOWER SEED OIL CRUDE
63630.00 53.15 99420.00 78.75 82932.00 63.99
15121120 SAFFLOWER SEED OIL(KARDI SEED CRUDE OIL)
20289.00 24.15 9698.00 11.84 88.39 0.09
Total 2831282.50 2289.08 2540800.65 2060.94 2308253.24 1713.31AUSTRALIA 15141120 CRUDE RAPE OIL 86.00 0.09 128.32 0.13 86.09 0.08Total 86.00 0.09 128.32 0.13 86.09 0.08BANGLADESH PR 15149120 CRUDE MUSTARD
OIL30.00 0.04
15155010 CRUDE SESAME OIL AND ITS FRACTIONS
878.00 1.02 50.00 0.05
Total 908.00 1.06 50.00 0.05BELGIUM 15149190 CRUDE RAPE SEED
OIL0.13 0.00044
15151100 CRUDE LINSEED OIL AND ITS FRACTIONS
3886.20 3.54 2042.56 1.84 133.00 0.12
Total 3886.20 3.54 2042.56 1.84 133.13 0.12BENIN 15132110 CRUDE PALM KERNEL 150.00 0.16BENIN 15132110 CRUDE PALM KERNEL
OIL150.00 0.16
Total 150.00 0.16BRAZIL 15071000 SOYA BEAN CRUDE
OIL W/N DEGUMMED
483160.08 389.24 523811.37 427.40 619105.95 464.91
Total 483160.08 389.24 523811.37 427.40 619105.95 464.91BULGARIA 15121110 SUNFLOWER SEED
OIL CRUDE109.00 0.09
Total 109.00 0.09CAMBODIA 15111000 CRUDE PALM OIL
AND ITS FRACTNS110.00 0.07
Total 110.00 0.07CANADA 15141120 CRUDE RAPE OIL 34665.00 28.21
15149190 CRUDE RAPE SEED OIL
250.00 0.21
Total 34915.00 28.41COLOMBIA 15111000 CRUDE PALM OIL
AND ITS FRACTNS8500.00 5.95
Total 8500.00 5.95
COUNTRY ITCHS Description 2016-17 2017-18 2018-19

QTY-TON VAL (MILL US $) QTY-TON VAL (MILL
US $) QTY-TONVAL
(MILL US $)
FRANCE 15132120 CURDE BABASSU OIL 0.01 0.0000915149190 CRUDE RAPE SEED
OIL3268.00 3.99
Total 3268.00 3.99 0.01 0.00009GERMANY 15071000 SOYA BEAN CRUDE
OIL W/N DEGUMMED
21970.00 17.97
15111000 CRUDE PALM OIL AND ITS FRACTNS
0.002 0.0001
15121110 SUNFLOWER SEED OIL CRUDE
0.90 0.00076 0.00009
15121120 SAFFLOWER SEED OIL(KARDI SEED CRUDE OIL)
0.14 0.00057 3.43 0.01 0.01 0.00084
15122100 COTN SD OIL CRUD W/N GOSYPL HAS BEEN REMVD
0.00003
15149190 CRUDE RAPE SEED OIL
2984.00 3.50 2252.00 2.99 0.19 0.001
15152100 CRUDE MAIZE(CORN) OIL AND ITS FRACTIONS
0.18 0.002
Total 2984.14 3.50 2256.33 3.01 21970.37 17.98GHANA 15132110 CRUDE PALM KERNEL
OIL233.42 0.19
Total 233.42 0.19GREECE 15071000 SOYA BEAN CRUDE 12986.00 9.43GREECE 15071000 SOYA BEAN CRUDE
OIL W/N DEGUMMED
12986.00 9.43
15122100 COTN SD OIL CRUD W/N GOSYPL HAS BEEN REMVD
0.03 0.0001
Total 12986.03 9.43GUATEMALA 15111000 CRUDE PALM OIL
AND ITS FRACTNS6506.00 4.59
Total 6506.00 4.59GUINEA 15132110 CRUDE PALM KERNEL
OIL27.18 0.03
Total 27.18 0.03HONDURAS 15111000 CRUDE PALM OIL
AND ITS FRACTNS15005.00 10.57
Total 15005.00 10.57INDONESIA 15111000 CRUDE PALM OIL
AND ITS FRACTNS3337081.77 2482.88 4585403.66 3249.93 4156999.71 2341.27

COUNTRY ITCHS Description
2016-17 2017-18 2018-19
QTY-TON VAL (MILL US $) QTY-TON VAL (MILL
US $) QTY-TONVAL
(MILL US $)
15132110 CRUDE PALM KERNEL OIL
23028.00 30.93 61922.00 76.12 67571.00 60.32
Total 3360109.77 2513.81 4647325.66 3326.06 4224570.71 2401.59KOREA RP 15155010 CRUDE SESAME OIL
AND ITS FRACTIONS0.09 0.0003 6.00 0.002
Total 0.09 0.0003 6.00 0.002LIBERIA 15111000 CRUDE PALM OIL
AND ITS FRACTNS18.00 0.01
Total 18.00 0.01MALAYSIA 15100010 OTHER CRUDE OIL
NOT CHMCLY MDFD OBTND FROMOLIVES
0.19 0.00
15111000 CRUDE PALM OIL AND ITS FRACTNS
1961185.71 1409.82 1720856.69 1226.93 1712902.24 1009.41
15121110 SUNFLOWER SEED OIL CRUDE
105.00 0.12
15132110 CRUDE PALM KERNEL OIL
25656.60 39.94 49044.00 59.69 49426.00 42.09
15149190 CRUDE RAPE SEED OIL
0.19 0.00
Total 1986842.31 1449.75 1769901.06 1286.61 1762433.24 1051.62MEXICO 15121120 SAFFLOWER SEED
OIL(KARDI SEED CRUDE OIL)
1745.00 3.14
Total 1745.00 3.14Total 1745.00 3.14NEPAL 15071000 SOYA BEAN CRUDE
OIL W/N DEGUMMED
1484.26 1.35 325.16 0.35 2903.49 3.04
Total 1484.26 1.35 325.16 0.35 2903.49 3.04NETHERLANDS 15071000 SOYA BEAN CRUDE
OIL W/N DEGUMMED
36112.00 27.15
15121120 SAFFLOWER SEED OIL(KARDI SEED CRUDE OIL)
6.08 0.03 6.84 0.03
15149190 CRUDE RAPE SEED OIL
1287.00 1.57
Total 6.08 0.03 6.84 0.03 37399.00 28.73NIGERIA 15111000 CRUDE PALM OIL
AND ITS FRACTNS0.25 0.0001
Total 0.25 0.0001PAPUA N GNA 15111000 CRUDE PALM OIL
AND ITS FRACTNS8700.00 5.99 20141.00 13.93 38194.00 20.90
15132110 CRUDE PALM KERNEL OIL
584.00 0.79 1056.00 1.30 465.00 0.41

COUNTRY ITCHS Description
2016-17 2017-18 2018-19
QTY-TON
VAL (MILL US $) QTY-TON
VAL (MILL US $) QTY-TON
VAL (MILL US $)
Total 9284.00 6.79 21197.00 15.23 38659.00 21.31
PARAGUAY 15071000 SOYA BEAN CRUDE OIL W/N DEGUMMED
184820.00 147.21 185388.31 151.86 5000.00 3.65
15121120 SAFFLOWER SEED OIL(KARDI SEED CRUDE OIL)
693.00 0.85
Total 184820.00 147.21 186081.31 152.72 5000.00 3.65PHILIPPINES 15111000 CRUDE PALM OIL
AND ITS FRACTNS18867.00 13.68 26543.00 18.74 10835.00 7.30
Total 18867.00 13.68 26543.00 18.74 10835.00 7.30RUSSIA 15071000 SOYA BEAN CRUDE
OIL W/N DEGUMMED
15005.00 10.45
15121110 SUNFLOWER SEED OIL CRUDE
25700.00 21.87 1810.34 1.60 31181.97 22.16
15141120 CRUDE RAPE OIL 4917.00 4.14Total 25700.00 21.87 6727.34 5.74 46186.97 32.61
SAUDI ARAB 15071000 SOYA BEAN CRUDE OIL W/N DEGUMMED
19981.00 17.91 19633.00 13.71
DEGUMMED15131100 COCONUT (COPRA)
CRUDE OIL AND FRACTIONS
0.01 0.0002
Total 19981.00 17.91 19633.01 13.71
SINGAPORE 15071000 SOYA BEAN CRUDE OIL W/N DEGUMMED
19289.00 16.42
15111000 CRUDE PALM OIL AND ITS FRACTNS
324739.00 187.41
15149190 CRUDE RAPE SEED OIL
2.09 0.0037
15155010 CRUDE SESAME OIL AND ITS FRACTIONS
4.32 0.02 2.16 0.01
Total 4.32 0.02 2.16 0.01 344030.09 203.83
SOUTH AFRICA 15071000 SOYA BEAN CRUDE OIL W/N DEGUMMED
3500.00 2.71
Total 3500.00 2.71

COUNTRY ITCHS Description
2016-17 2017-18 2018-19
QTY-TON VAL (MILL US $)
QTY-TON VAL (MILL US $)
QTY-TON VAL (MILL US $)
SPAIN 15100010 OTHER CRUDE OIL NOT CHMCLY MDFD OBTND FROMOLIVES
557.93 0.68
15111000 CRUDE PALM OIL AND ITS FRACTNS
66.00 0.08
15121110 SUNFLOWER SEED OIL CRUDE
13.82 0.02
Total 13.82 0.02 623.93 0.76
SWEDEN 15149190 CRUDE RAPE SEED OIL
757.00 0.90
Total 757.00 0.90SWITZERLAND 15071000 SOYA BEAN CRUDE
OIL W/N DEGUMMED
156809.00 111.76
15121110 SUNFLOWER SEED OIL CRUDE
1514.00 1.18
15149190 CRUDE RAPE SEED OIL
0.19 0.0008
Total 158323.19 112.95
THAILAND 15111000 CRUDE PALM OIL AND ITS FRACTNS
396653.00 278.16 171552.96 107.87AND ITS FRACTNS
15132110 CRUDE PALM KERNEL OIL
2531.00 3.51 6020.00 6.04
Total 399184.00 281.67 177572.96 113.91
TOGO 15132110 CRUDE PALM KERNEL OIL
24.00 0.03 912.00 0.98
Total 24.00 0.03 912.00 0.98
TUNISIA 15100010 OTHER CRUDE OIL NOT CHMCLY MDFD OBTND FROMOLIVES
503.00 0.49 805.00 1.34
Total 503.00 0.49 805.00 1.34
TURKEY 15071000 SOYA BEAN CRUDE OIL W/N DEGUMMED
7972.00 5.76
15121120 SAFFLOWER SEED OIL(KARDI SEED CRUDE OIL)
500.00 0.53 500.00 0.48
15132110 CRUDE PALMKERNEL OIL

COUNTRY ITCHS Description
2016-17 2017-18 2018-19
QTY-TON
VAL (MILL US $) QTY-TON
VAL (MILL US $) QTY-TON
VAL (MILL US $)
Total 500.00 0.53 8472.00 6.24U ARAB EMTS 15071000 SOYA BEAN CRUDE
OIL W/N DEGUMMED
2994.00 2.24
15141120 CRUDE RAPE OIL 351809.00 291.27 291385.00 246.44 157539.00 122.0715149190 CRUDE RAPE SEED
OIL19146.00 15.50 520.00 0.44
Total 370955.00 306.77 291905.00 246.88 160533.00 124.31U K 15121110 SUNFLOWER SEED
OIL CRUDE24.00 0.02
15121120 SAFFLOWER SEED OIL(KARDI SEED CRUDE OIL)
0.15 0.002
15132120 CURDE BABASSU OIL 0.01 0.00002Total 24.00 0.02 0.16 0.0022U S A 15071000 SOYA BEAN CRUDE
OIL W/N DEGUMMED
0.003 0.0003
15081000 GROUND NUT OIL CRUDE
0.02 0.00047
15121110 SUNFLOWER SEED OIL CRUDE
1.75 0.0022 14.29 0.03
15121120 SAFFLOWER SEED OIL(KARDI SEED CRUDE OIL)
2013.00 2.90 2547.38 3.16 0.39 0.0048
COUNTRY ITCHS Description 2016-17 2017-18 2018-19
QTY-TON
VAL (MILL US $) QTY-TON
VAL (MILL US $) QTY-TON
VAL (MILL US $)
15131100 COCONUT (COPRA) CRUDE OIL AND FRACTIONS
0.01 0.0005
Total 154.55 0.16Grand Total 11040458.97 8635.23 12573115.63 9586.43 12448147.57 8227.63
*******
CRUDE OIL)15131100 COCONUT (COPRA)
CRUDE OIL AND FRACTIONS
0.001 0.0001
15149190 CRUDE RAPE SEED OIL
9.64 0.02
Total 2014.75 2.90 2547.38 3.16 24.35 0.05UKRAINE 15071000 SOYA BEAN CRUDE
OIL W/N DEGUMMED
24151.64 20.97 10961.00 9.05 20894.00 14.53
15121110 SUNFLOWER SEED OIL CRUDE
1638357.56 1384.09 2137408.76 1742.74 2463997.36 1878.55
15132110 CRUDE PALM KERNEL OIL
1500.00 1.19
15151100 CRUDE LINSEED OIL AND ITS FRACTIONS
508.86 0.53 2567.80 2.15 643.32 0.54
Total 1663018.06 1405.59 2150937.56 1753.94 2487034.68 1894.81UNSPECIFIED 15149120 CRUDE MUSTARD
OIL0.11 0.0002
Total 0.11 0.0002URUGUAY 15121120 SAFFLOWER SEED
OIL(KARDI SEED CRUDE OIL)
154.54 0.16

GOVERNMENT OF INDIAMINISTRY OF COMMERCE & INDUSTRY
(DEPARTMENT OF COMMERCE)
LOK SABHAUNSTARRED QUESTION NO. 2557 (H)
TO BE ANSWERED ON 04 th DECEMBER, 2019
EXPORT SUBSIDY
2557(H). SHRI JAI PRAKASH:
Will the Minister of COMMERCE & INDUSTRY (वािण�य एवं उ�ोग मं�ी ) be pleased to state:
(a) whether the World Trade Organisation (WTO), on appeal by America, has directed India to stop export (a) whether the World Trade Organisation (WTO), on appeal by America, has directed India to stop export subsidy within the prescribed limit;
(b) if so, whether the Government has looked into the said order; and (c) the details of view of the Government in this regard?
ANSWER
okf.kT; ,oa m|ksx ea=h ( Jh ih;w’k xks;y )THE MINISTER OF COMMERCE AND INDUSTRY
(SHRI PIYUSH GOYAL) (SHRI PIYUSH GOYAL)
(a),(b) & (c): The US has challenged India’s schemes which allow for duty free import of raw materials and capital goods used in the manufacture of products that are meant for export purposes. The US has challenged that India’s schemes are prohibited subsidies contingent on export, it is a violation of Article 3.1 of the Agreement on Subsidies and Countervailing Measures (ASCM) of the World Trade Organization (WTO). The Panel Report has been issued and India has already filed appeal against the Panel Report before the Appellate Body of the WTO.
*****

GOVERNMENT OF INDIAMINISTRY OF COMMERCE & INDUSTRY
(DEPARTMENT OF COMMERCE)
LOK SABHAUNSTARRED QUESTION NO. 2562
TO BE ANSWERED ON 04 th DECEMBER, 2019
EXPORTS OF AGRICULTURAL AND ALLIED PRODUCTS
2562. SHRI ANTO ANTONY:SHRI MARGANI BHARAT: SHRI RAJIV PRATAP RUDY: SHRI JAYADEV GALLA:
Will the Minister of COMMERCE & INDUSTRY (वािण�य एवं उ�ोग मं�ी ) be Will the Minister of COMMERCE & INDUSTRY (वािण�य एवं उ�ोग मं�ी ) be pleased to state:
(a) the value in rupees and quantity of agricultural, processed and aquaculture exports from India, State, year and productwise since 2004;
(b) the value in rupees and quantity of agricultural imports to India, State, year and product-wise;(c) whether agriculture exports have come down from US$42,800 million in 2013-14 to US$38,000 million in
2017-18; (d) if so, the reasons for decline in exports and the countries for which the exports have come down;(e) the extent to which the recently approved Agriculture Export Policy by the Cabinet helps in increasing
agriculture exports along with the incentives being given thereunder;(f) the details of the strategic and operational initiatives that have been taken/ proposed to be taken to (f) the details of the strategic and operational initiatives that have been taken/ proposed to be taken to
increase agricultural and processed food export from States, including Maharashtra, during each of the last three years; and
(g) whether such initiatives have benefited small and marginal farmers including farmers in Rajasthan and if so, the details thereof?
ANSWER
okf.kT; ,oa m|ksx ea=h ( Jh ih;w’k xks;y )THE MINISTER OF COMMERCE AND INDUSTRY
(SHRI PIYUSH GOYAL) (SHRI PIYUSH GOYAL) (a & b): Details of agricultural, processed and aquaculture exports from India, year and product-wise, from 2004-05 to 2019-20 (Apr-Oct), may be seen at Annexure-I. The details of India’s imports of agricultural products may be seen at Annexure-II. The State-wise data on exports and imports is not maintained by the Directorate General of Commercial Intelligence & Statistics (DGCI&S).
(c) : Yes, Sir. India’s agricultural exports declined from USD 42.83 billion in 2013 -14 to USD 38.21 billion in 2017-18.

(d) The exports were impacted by factors like stagnant and falling global prices; the global economic slowdown; low crude oil prices impacting sugar, vegetable oils and other bio-fuels related products; subdued global demand; poor domestic crops (reduced acreage/ poor yield/poor quality); lower international prices compared to domestic prices; currency movements in competing countries; international developments with respect to sanctions against Russia & Iran etc. The major importing countries, to which India’s agricultural exports declined during the period, were Bangladesh, Saudi Arabia, Iran, China and Malaysia.
(e & f) The Government has introduced a comprehensive Agriculture Export Policy with the following vision:
“Harness export potential of Indian agriculture, through suitable policy instruments, to make India a global power in agriculture, and raise farmers’ income.”
Inter-alia, the objectives of the Agriculture Export policy are as under:
(i) To diversify our export basket, destinations and boost hi gh value and value added agricultural exports, including focus on perishables.
(ii) To promote novel, indigenous, organic, ethnic, traditional and non -traditional Agri products exports.
(iii) To provide an institutional mechanism for pursuing market access, tackling barriers and dealing with sanitary and phytosanitary issues.
(iv) To strive to double India’s share in world agri exports by integrating with global value chains.(v) Enable farmers to get benefit of export opportunities in overseas market.
The initiatives envisaged in the Agriculture Export Policy have been organised in two categories –The initiatives envisaged in the Agriculture Export Policy have been organised in two categories –Strategic and Operational – as detailed below:
StrategicPolicy measures Infrastructure and logistics supportHolistic approach to boost exports Greater involvement of State Governments in agri exports
Operational
Focus on Clusters
Promoting value added exports
Marketing and promotion of “Brand India”
Attract private investments into production and processing
Establishment of strong quality regimen
Research & Development
Miscellaneous

Following steps have been taken to implement the Agriculture Export Policy:i. An Inter-Ministerial Committee (IMC) has been formed to monitor the implementation of AEP.
ii. The mandate of the existing CoS on ‘Review of Prices of Essential Commodities’ has been expanded to identify the agricultural commodities essential for food security, only which will be subject to export restrictions if the need arises.
iii. Workshops on promoting awareness of Agri Export Policy have been organised.iv. The Agricultural & Processed Food Products Export Development Authority (APEDA) has
prepared State-specific Action Plans and shared them with the respective States for vetting and finalization. A number of States, including Maharashtra, have vetted and finalized their respective plans. The matter is being pursued with the remaining States/UTs.
v. 27 States and 2 UTs have designated nodal agencies to promote agricultural exports. vi. APEDA and National Cooperative Development Corporation (NCDC) have signed an MoU for
greater involvement of cooperatives in agricultural exports. vii. Buyer Seller Meets (BSM) between State authorities, Cooperatives, exporters are being held along
with NCDC in all the States & UTs in a phase wise manner during October to December, 2019.viii. A Farmer Connect Portal has been set up by APEDA on its website for providing a platform for
FPOs, Cooperatives to interact with exporters. ix. Under the AEP, a number of clusters have been identified fo r export-oriented production of
specific products. APEDA is organising Buyer -Seller Meets (BSMs) between exporters and Farmer-Producer Organisations (FPOs) at cluster level in every State.
x. A new Central Sector Scheme – ‘Implementation of Agriculture Export Policy’ – has been approved with an outlay of Rs.206.80 crores for 2019-20.
Promoting agricultural exports from India, including from the State of Maharashtra, is a continuous process. The Department of Commerce has several schemes to promote exports, including exports of agricultural products, viz. Trade Infrastructure for Export Scheme (TIES), Market Access Initiatives (MAI) Scheme, Merchandise Exports from India Scheme (MEIS) etc. In addition, assistance to the (MAI) Scheme, Merchandise Exports from India Scheme (MEIS) etc. In addition, assistance to the exporters of agricultural products is also available under the Export Promotion Schemes of Agricultural & Processed Food Products Export Development Authority (APEDA), Marine Products Export Development Authority (MPEDA), Tobacco Board, Tea Board, Coffee Board, Rubber Board and Spices Board. The Government has also brought out a Central Sector Scheme – ‘Transport and Marketing Assistance for Specified Agriculture Products’ - for providing assistance for the international component of freight, to mitigate the freight disadvantage for the export of agriculture products, and marketing of agricultural products.
(g) Assistance/incentives under the initiatives/schemes for promoting agricultural exports are available to exporters, Trade Promotion Organisations and State agencies engaged in export promotion of agricultural products. The benefits incurred to small and marginal farmers, including the farmers in Rajasthan, are indirect in nature as the increase in agricultural exports is likely to result in increase in realisations earned by the farmers.
******
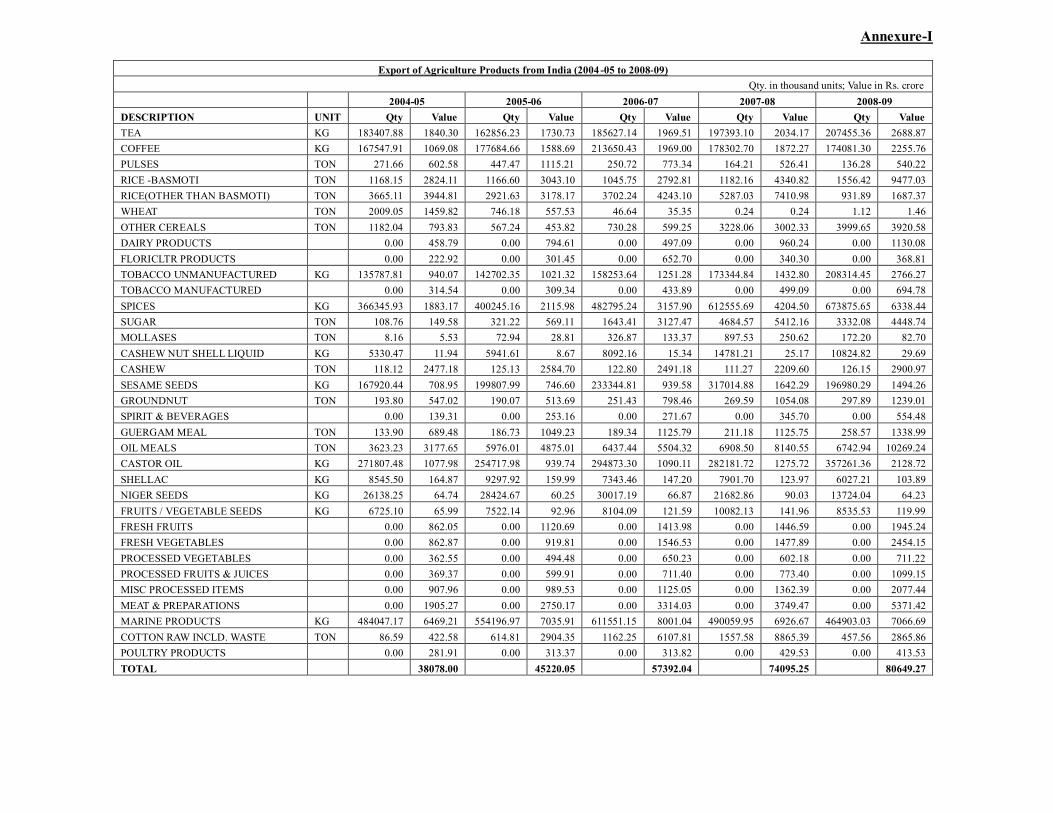
Annexure-I
Export of Agriculture Products from India (2004 -05 to 2008-09)Qty. in thousand units; Value in Rs. crore
2004-05 2005-06 2006-07 2007-08 2008-09DESCRIPTION UNIT Qty Value Qty Value Qty Value Qty Value Qty ValueTEA KG 183407.88 1840.30 162856.23 1730.73 185627.14 1969.51 197393.10 2034.17 207455.36 2688.87COFFEE KG 167547.91 1069.08 177684.66 1588.69 213650.43 1969.00 178302.70 1872.27 174081.30 2255.76PULSES TON 271.66 602.58 447.47 1115.21 250.72 773.34 164.21 526.41 136.28 540.22RICE -BASMOTI TON 1168.15 2824.11 1166.60 3043.10 1045.75 2792.81 1182.16 4340.82 1556.42 9477.03RICE(OTHER THAN BASMOTI) TON 3665.11 3944.81 2921.63 3178.17 3702.24 4243.10 5287.03 7410.98 931.89 1687.37WHEAT TON 2009.05 1459.82 746.18 557.53 46.64 35.35 0.24 0.24 1.12 1.46OTHER CEREALS TON 1182.04 793.83 567.24 453.82 730.28 599.25 3228.06 3002.33 3999.65 3920.58DAIRY PRODUCTS 0.00 458.79 0.00 794.61 0.00 497.09 0.00 960.24 0.00 1130.08FLORICLTR PRODUCTS 0.00 222.92 0.00 301.45 0.00 652.70 0.00 340.30 0.00 368.81TOBACCO UNMANUFACTURED KG 135787.81 940.07 142702.35 1021.32 158253.64 1251.28 173344.84 1432.80 208314.45 2766.27TOBACCO MANUFACTURED 0.00 314.54 0.00 309.34 0.00 433.89 0.00 499.09 0.00 694.78SPICES KG 366345.93 1883.17 400245.16 2115.98 482795.24 3157.90 612555.69 4204.50 673875.65 6338.44SUGAR TON 108.76 149.58 321.22 569.11 1643.41 3127.47 4684.57 5412.16 3332.08 4448.74MOLLASES TON 8.16 5.53 72.94 28.81 326.87 133.37 897.53 250.62 172.20 82.70CASHEW NUT SHELL LIQUID KG 5330.47 11.94 5941.61 8.67 8092.16 15.34 14781.21 25.17 10824.82 29.69CASHEW TON 118.12 2477.18 125.13 2584.70 122.80 2491.18 111.27 2209.60 126.15 2900.97SESAME SEEDS KG 167920.44 708.95 199807.99 746.60 233344.81 939.58 317014.88 1642.29 196980.29 1494.26GROUNDNUT TON 193.80 547.02 190.07 513.69 251.43 798.46 269.59 1054.08 297.89 1239.01SPIRIT & BEVERAGES 0.00 139.31 0.00 253.16 0.00 271.67 0.00 345.70 0.00 554.48GUERGAM MEAL TON 133.90 689.48 186.73 1049.23 189.34 1125.79 211.18 1125.75 258.57 1338.99OIL MEALS TON 3623.23 3177.65 5976.01 4875.01 6437.44 5504.32 6908.50 8140.55 6742.94 10269.24CASTOR OIL KG 271807.48 1077.98 254717.98 939.74 294873.30 1090.11 282181.72 1275.72 357261.36 2128.72SHELLAC KG 8545.50 164.87 9297.92 159.99 7343.46 147.20 7901.70 123.97 6027.21 103.89NIGER SEEDS KG 26138.25 64.74 28424.67 60.25 30017.19 66.87 21682.86 90.03 13724.04 64.23FRUITS / VEGETABLE SEEDS KG 6725.10 65.99 7522.14 92.96 8104.09 121.59 10082.13 141.96 8535.53 119.99FRESH FRUITS 0.00 862.05 0.00 1120.69 0.00 1413.98 0.00 1446.59 0.00 1945.24FRESH VEGETABLES 0.00 862.87 0.00 919.81 0.00 1546.53 0.00 1477.89 0.00 2454.15PROCESSED VEGETABLES 0.00 362.55 0.00 494.48 0.00 650.23 0.00 602.18 0.00 711.22PROCESSED FRUITS & JUICES 0.00 369.37 0.00 599.91 0.00 711.40 0.00 773.40 0.00 1099.15MISC PROCESSED ITEMS 0.00 907.96 0.00 989.53 0.00 1125.05 0.00 1362.39 0.00 2077.44MEAT & PREPARATIONS 0.00 1905.27 0.00 2750.17 0.00 3314.03 0.00 3749.47 0.00 5371.42MARINE PRODUCTS KG 484047.17 6469.21 554196.97 7035.91 611551.15 8001.04 490059.95 6926.67 464903.03 7066.69COTTON RAW INCLD. WASTE TON 86.59 422.58 614.81 2904.35 1162.25 6107.81 1557.58 8865.39 457.56 2865.86POULTRY PRODUCTS 0.00 281.91 0.00 313.37 0.00 313.82 0.00 429.53 0.00 413.53TOTAL 38078.00 45220.05 57392.04 74095.25 80649.27

Annexure-I (contd...)
Export of Agriculture Products from India (2009 -10 to 2014-15)Qty. in thousand units; Value in Rs. crore
2009-10 2010-11 2011-12 2012-13 2013-14 2014-15DESCRIPTION UNIT Qty Value Qty Value Qty Value Qty Value Qty Value Qty ValueTEA KGS 207839.07 2943.53 238146.24 3354.34 271983.56 4078.53 268799.83 4718.79 249907.55 4873.34 234388.70 4171.25COFFEE KGS 157138.32 2032.06 230995.68 3009.91 276520.99 4534.62 254017.79 4711.07 253902.13 4799.10 242975.06 4973.25RICE -BASMOTI TON 2016.87 10889.60 2330.25 11354.63 3169.45 15449.60 3459.83 19409.39 3754.10 29291.82 3698.93 27586.71RICE(OTHER THAN BASMOTI) TON 139.55 365.30 100.68 231.29 3991.77 8659.13 6687.85 14448.81 7136.19 17795.21 8302.21 20441.55WHEAT TON 0.03 0.05 0.40 0.70 749.63 1023.20 6514.82 10529.00 5572.03 9277.65 2924.05 4991.81OTHER CEREALS TON 2881.22 2973.19 3220.09 3648.49 4072.57 5492.92 5441.31 8180.61 4926.05 7178.14 3515.35 5262.16PULSES TON 100.13 408.32 209.02 870.04 173.50 1067.93 202.67 1284.99 345.66 1749.30 222.14 1218.31TOBACCO UNMANUFACTURED KGS 230804.37 3621.44 215879.82 3151.58 197165.22 2899.46 230414.16 3815.76 237106.04 4782.74 219572.23 4162.71TOBACCO MANUFACTURED 0.00 722.96 0.00 833.61 0.00 1106.96 0.00 1214.48 0.00 1351.72 0.00 1705.88SPICES KGS 601402.12 5948.73 688394.39 7886.51 858200.11 13102.50 932591.86 15176.75 895914.70 15146.36 939008.20 14847.75CASHEW TON 107.47 2801.58 92.38 2819.39 107.81 4390.16 104.09 4067.21 120.74 5095.49 134.57 5565.85CASHEW NUT SHELL LIQUID KGS 11226.86 27.62 11918.03 33.77 13185.84 59.46 9191.51 29.84 9480.28 38.61 10937.59 55.81SESAME SEEDS KGS 215693.18 1494.10 360132.29 2307.52 388225.49 2641.66 299482.29 2880.85 257441.09 3583.46 375656.06 4717.77NIGER SEEDS KGS 6004.09 24.23 12863.06 44.51 28225.08 117.27 17904.56 90.13 20841.06 113.61 18155.89 108.96GROUNDNUT TON 340.26 1425.93 433.76 2178.41 832.62 5246.45 535.64 4065.36 509.75 3187.66 788.31 4675.37OTHER OIL SEEDS TON 49.79 139.36 42.82 113.40 61.81 201.43 87.59 414.61 194.46 945.53 247.54 1135.36VEGETABLE OILS TON 14.75 182.90 13.71 114.62 31.97 276.79 36.31 470.49 22.96 323.85 42.05 580.13OIL MEALS TON 4671.14 7831.79 6945.17 11069.58 7405.19 11796.46 6578.17 16519.53 9830.21 17070.13 3904.59 8129.18GUERGAM MEAL TON 217.41 1133.31 421.43 2938.70 702.73 16523.87 406.32 21287.00 601.97 11735.41 665.11 9478.26CASTOR OIL KGS 397990.27 2179.28 424458.12 2982.92 492628.33 4571.67 565994.07 4309.82 544795.66 4364.33 566463.64 4710.42SHELLAC KGS 4044.41 71.30 4333.86 140.07 4337.76 256.79 3603.66 401.74 7743.78 513.96 5242.54 267.47SUGAR TON 44.74 110.21 1733.87 5472.79 2749.43 8766.78 2793.78 8576.32 2535.31 7178.50 1955.19 5328.83MOLLASES TON 31.10 19.77 371.93 214.09 384.13 204.33 342.15 223.03 211.65 147.29 247.61 193.01FRUITS / VEGETABLE SEEDS KGS 8434.00 145.08 11622.33 184.92 15205.81 287.76 17168.00 347.72 19338.58 416.58 12499.31 427.04FRESH FRUITS TON 475.76 1524.21 446.76 1355.19 487.95 1937.22 534.50 2686.55 525.18 3645.62 539.23 3160.08FRESH VEGETABLES TON 2032.40 3014.32 1660.25 2620.48 2040.45 3023.31 2343.88 3407.19 2288.30 5384.47 2081.80 4666.45PROCESSED VEGETABLES KGS 0.00 743.12 0.00 747.92 175114.17 1043.72 159827.79 1102.56 132366.77 1288.86 186036.18 1721.89PROCESSED FRUITS AND JUICES KGS 0.00 1904.18 0.00 1859.96 536361.08 2277.04 536811.78 2577.32 604650.08 3332.05 588375.09 3626.86CEREAL PREPARATIONS TON 172.20 1030.09 213.58 1264.15 299.62 1888.62 292.69 2240.76 319.55 2856.26 313.67 3036.64COCOA PRODUCTS KGS 5863.88 96.99 9077.54 126.97 16678.58 175.98 19083.35 293.92 16229.24 573.22 33365.20 848.66MILLED PRODUCTS KGS 72740.53 153.63 99101.17 197.06 171123.76 358.92 273546.27 603.61 419263.94 1008.01 420854.41 1030.61MISC PROCESSED ITEMS 0.00 838.19 0.00 1065.48 0.00 1434.17 0.00 1853.98 0.00 2531.48 0.00 2772.45ANIMAL CASINGS KGS 1716.90 32.82 1804.72 33.24 1011.22 33.98 645.84 21.46 266.72 28.46 260.15 19.33BUFFALO MEAT TON 490.40 5481.43 726.66 8613.31 984.96 13741.11 1076.10 17408.99 1365.64 26457.82 1503.51 29282.58SHEEP/GOAT MEAT TON 53.07 745.94 12.30 258.83 10.94 252.83 15.29 426.47 22.61 694.12 23.61 828.11OTHER MEAT TON 1.17 10.75 1.03 9.51 0.32 3.67 0.19 2.33 0.27 3.40 0.26 2.67PROCESSED MEAT TON 0.67 8.79 0.92 13.96 0.58 9.50 0.80 9.37 0.51 7.68 0.41 14.20DAIRY PRODUCTS KGS 0.00 796.99 0.00 1216.76 52497.25 647.79 127255.69 2324.68 199090.16 4407.78 104170.98 2169.03POULTRY PRODUCTS 0.00 372.53 0.00 314.33 0.00 458.05 0.00 494.93 0.00 566.80 0.00 651.19FLORICLTR PRODUCTS KGS 0.00 294.46 0.00 296.04 30924.20 365.32 27121.86 423.45 22179.80 455.90 22949.27 460.80NATURAL RUBBER TON 25.60 245.37 29.70 556.16 26.53 443.97 31.59 590.39 10.03 167.85 3.06 43.31ALCOHOLIC BEVERAGES LTR 0.00 584.87 0.00 819.86 216393.01 1469.07 270490.38 1932.45 316249.24 2429.67 269997.23 2264.89MARINE PRODUCTS KGS 698448.12 9899.98 785069.04 11917.11 902411.68 16584.71 965099.42 18841.20 1192882.37 30627.28 1231807.69 33688.38COTTON RAW INCLD. WASTE TON 0.00 9537.08 0.00 13162.42 2006.68 21624.24 2056.70 20276.51 1947.69 22337.84 1142.53 11642.64TOTAL 84807.40 111404.54 180528.94 224691.43 259764.35 236665.61

Annexure-I (contd...)
Export of Agriculture Products from India (2015 -16 to 2019-20)Qty. in thousand units; Value in Rs. crore
2015-16 2016-17 2017-18 2018-19 2019-20 (Apr-Oct)DESCRIPTION UNIT Qty Value Qty Value Qty Value Qty Value Qty ValueTEA KGS 245701.97 4719.00 243429.62 4905.64 272894.98 5396.65 270306.40 5828.34 154573.61 3628.22COFFEE KGS 255744.05 5125.45 288613.37 5646.43 317828.97 6245.36 282839.90 5721.98 158625.48 3114.96RICE -BASMOTI TON 4045.83 22718.60 3985.21 21512.91 4056.85 26870.67 4414.61 32804.30 2057.98 15564.04RICE(OTHER THAN BASMOTI) TON 6464.59 15483.39 6770.83 16929.88 8818.53 23437.23 7648.00 21171.17 2816.50 8013.41WHEAT TON 666.68 1061.77 265.61 447.85 322.79 624.37 226.63 424.47 120.14 231.06OTHER CEREALS TON 967.93 1702.50 734.77 1425.77 864.24 1604.28 1257.24 2426.07 255.19 755.62PULSES TON 255.72 1655.90 136.72 1277.70 179.60 1469.63 287.13 1801.51 131.14 912.16TOBACCO UNMANUFACTURED KGS 215316.96 4373.45 204447.42 4249.85 185363.88 3828.13 189554.21 3984.53 108316.17 2236.85TOBACCO MANUFACTURED 0.00 2078.91 0.00 2174.12 0.00 2193.58 0.00 2874.07 0.00 1676.26SPICES KGS 831681.12 16630.14 1014453.31 19111.25 1096322.85 20084.91 1133889.44 23217.77 695556.22 15641.94CASHEW TON 103.13 5027.99 91.79 5278.61 90.06 5945.28 78.22 4579.17 51.40 2301.59CASHEW NUT SHELL LIQUID KGS 11677.26 57.59 11404.76 43.99 8325.16 32.63 5300.66 26.91 2707.65 13.04SESAME SEEDS KGS 328455.73 3012.31 307328.55 2695.84 336850.37 2990.93 312003.34 3761.62 152851.55 2027.83NIGER SEEDS KGS 14121.56 123.27 14070.46 117.22 9215.04 69.86 13370.58 95.50 6146.38 45.69GROUNDNUT TON 542.73 4075.63 725.71 5444.33 504.04 3386.30 489.19 3297.32 189.74 1512.19OTHER OIL SEEDS TON 204.62 964.47 193.27 846.58 295.10 1126.32 213.84 926.75 48.01 234.08VEGETABLE OILS TON 30.60 522.94 60.47 779.97 37.06 566.04 49.96 744.58 31.95 522.12OIL MEALS TON 2056.36 3599.56 2632.26 5410.10 3570.78 7043.15 4493.29 10557.48 1604.16 3389.98GUERGAM MEAL TON 325.25 3233.87 419.95 3106.62 494.13 4169.56 513.22 4707.05 240.70 2066.41CASTOR OIL KGS 586778.44 4616.10 599195.56 4521.51 697092.50 6730.00 619376.57 6170.12 358927.26 4136.26SHELLAC KGS 6393.50 203.31 6065.00 225.53 6530.85 285.18 6996.04 304.79 3710.83 192.95SUGAR TON 3844.45 9824.52 2544.01 8659.54 1757.93 5225.60 3989.66 9523.14 2666.51 6219.71MOLLASES TON 818.57 656.84 390.67 314.94 123.97 97.45 845.96 586.80 368.50 304.71FRUITS / VEGETABLE SEEDS KGS 13104.11 529.19 11288.62 522.75 14465.77 670.91 17532.40 866.31 7436.20 513.61FRESH FRUITS TON 654.66 4191.24 817.06 4974.21 714.00 4913.28 823.09 5538.15 358.37 2117.92FRESH VEGETABLES TON 2104.36 5237.10 3404.07 5790.71 2448.02 5297.72 3192.49 5679.10 1404.77 3126.32PROCESSED VEGETABLES KGS 174427.54 1697.22 192855.77 1765.75 212203.36 1823.36 228967.00 2055.41 125767.08 1244.95PROCESSED FRUITS AND JUICES KGS 532293.28 3767.08 533152.10 3921.08 573281.42 4169.13 594487.33 4481.25 312810.05 2484.75CEREAL PREPARATIONS TON 316.54 3358.12 339.95 3565.55 353.35 3561.69 347.81 3859.46 198.78 2228.06COCOA PRODUCTS KGS 32652.56 1267.61 25649.50 1086.77 29579.53 1144.35 27607.09 1350.86 18223.82 775.88MILLED PRODUCTS KGS 431464.50 1102.73 255803.65 813.54 270396.97 876.62 307419.30 1063.03 163217.04 604.54MISC PROCESSED ITEMS 0.00 2907.85 0.00 3053.79 0.00 3548.95 0.00 4613.38 0.00 2718.63ANIMAL CASINGS KGS 206.36 17.02 173.24 13.84 12424.66 327.44 14882.83 480.66 6312.33 210.89BUFFALO MEAT TON 1314.22 26684.22 1323.58 26161.38 1350.25 26035.19 1233.38 25091.43 669.28 13358.54SHEEP/GOAT MEAT TON 21.95 837.76 22.01 869.84 22.80 843.61 21.67 867.53 9.72 433.58OTHER MEAT TON 0.00 0.00 0.01 0.21 0.45 7.00 0.85 13.73 0.67 10.34PROCESSED MEAT TON 0.28 6.16 0.14 4.58 0.27 9.89 0.41 13.92 0.26 10.02DAIRY PRODUCTS KGS 77527.13 1677.46 90352.31 1701.18 102262.55 1954.63 180688.06 3375.73 70033.03 1222.86POULTRY PRODUCTS 0.00 769.14 0.00 530.44 0.00 552.09 0.00 687.22 0.00 322.72FLORICLTR PRODUCTS KGS 22691.95 483.41 22020.33 546.71 20703.51 507.32 19694.69 571.43 11163.40 331.90NATURAL RUBBER TON 6.04 386.85 24.46 252.92 7.70 89.69 6.66 77.28 6.11 75.20ALCOHOLIC BEVERAGES LTR 242095.45 2030.92 232179.33 2004.79 241013.37 2105.78 231601.93 2103.97 73960.45 910.24MARINE PRODUCTS KGS 978036.22 31219.48 1185272.87 39593.78 1432456.67 47646.41 1672386.11 47664.94 800351.49 28789.64COTTON RAW INCLD. WASTE TON 1347.07 12821.13 996.09 10907.32 1101.47 12200.05 1143.07 14627.55 153.34 1841.66TOTAL 212459.20 223207.31 247708.20 270617.79 138073.34

Annexure-II
Import of Agriculture Products into India (2004-05 to 2008-09)
Qty. in thousand units; Value in Rs. crore
2004-05 2005-06 2006-07 2007-08 2008-09
DESCRIPTION UNIT Qty Value Qty Value Qty Value Qty Value Qty Value
WHEAT TON 0.22 0.11 0.00 0.00 6079.56 5850.49 1793.21 2657.51 0.02 0.01
RICE TON 0.00 0.00 0.26 0.34 0.16 0.41 0.15 0.42 0.08 0.54
OTHER CEREALS TON 6.36 6.33 27.88 30.09 7.96 11.73 10.42 19.34 20.60 45.46
CEREAL PREPARATION TON 44.53 110.23 42.37 129.23 38.21 132.92 43.94 161.83 29.76 170.17
PULSES TON 1323.30 1757.04 1695.96 2476.25 2270.97 3891.91 2835.06 5374.94 2474.11 6246.40
TEA KG 31199.77 143.86 18747.13 108.14 23293.45 127.06 19725.72 130.95 25159.25 197.00
MILK AND CREAM TON 2.22 12.87 1.63 14.20 3.09 28.90 2.07 29.66 3.24 38.21
CASHEW NUTS TON 470.80 1763.81 543.94 2089.46 586.49 1820.75 591.88 1714.75 614.46 2672.43FRUITS & NUTS EXCL CASHEW NUTS 0.00 1079.95 0.00 1390.32 0.00 1913.11 0.00 1858.64 0.00 2372.89
SPICES KG 104503.33 576.47 108926.57 687.81 118510.73 738.90 140590.38 941.36 122849.53 1076.07
SUGAR TON 932.43 975.70 558.77 651.59 1.05 3.49 0.49 2.24 386.10 583.16
OIL SEEDS 0.00 25.95 0.00 47.03 0.00 104.47 0.00 149.46 0.00 129.58VEGETABLE OILS FIXED (EDIBLE) TON 4692.73 10940.63 4288.11 8960.99 4269.37 9539.90 4903.39 10301.09 6719.35 15837.46
NATURAL RUBBER TON 70.42 415.64 45.29 274.51 89.80 780.51 86.39 788.89 77.76 937.20COTTON RAW:COMB./UNCOMB./WASTRAW:COMB./UNCOMB./WASTE TON 188.39 1115.54 98.76 703.66 81.48 663.07 136.50 912.14 211.69 1690.22
TOTAL 18924.13 17563.62 25607.60 25043.21 31996.80

Annexure-II (contd..)
Import of Agriculture Products into India (2009-10 to 2014-15)Qty. in thousand units; Value in Rs. crore
2009-10 2010-11 2011-12 2012-13 2013-14 2014-15DESCRIPTION UNIT Qty Value Qty Value Qty Value Qty Value Qty Value Qty ValueTEA KGS 34459.38 276.52 20824.06 202.00 22429.49 218.91 22301.32 274.52 22739.91 291.68 28390.47 388.66COFFEE KGS 40884.15 297.34 41634.07 295.00 46055.69 469.52 71201.37 795.72 59940.86 729.02 74884.58 930.47RICE -BASMOTI TON 0.00 0.00 0.00 0.00 0.46 2.47 0.00 0.00 0.00 0.00 0.00 0.00RICE(OTHER THAN BASMOTI) TON 0.07 0.37 0.19 0.92 0.60 3.00 0.72 3.96 1.44 8.29 1.96 10.83WHEAT TON 164.38 231.90 185.28 255.84 0.02 0.08 2.94 6.03 11.27 26.92 29.49 61.34OTHER CEREALS TON 33.69 76.33 30.68 59.53 15.36 30.04 45.58 111.01 22.32 98.03 23.40 61.76PULSES TON 3749.99 10629.16 2777.83 7512.49 3495.84 9448.35 4013.24 13344.63 3643.71 12792.62 4584.85 17062.94TOBACCO UNMANUFACTURED KGS 1074.71 37.76 1320.74 44.61 2015.63 68.57 2166.77 91.94 1549.35 79.52 1930.42 98.17TOBACCO MANUFACTURED 0.00 78.73 0.00 80.36 0.00 113.01 0.00 155.01 0.00 168.87 0.00 200.28SPICES KGS 161782.16 1476.04 124494.40 1595.91 146767.74 2284.85 175559.21 2715.76 155577.43 3451.69 163094.90 4393.25CASHEW TON 755.96 3047.50 529.73 2649.07 811.90 5381.43 898.52 5433.91 776.33 4667.80 933.19 6599.74CASHEW NUT SHELL LIQUID KGS 0.00 0.00 43.00 0.07 195.00 0.32 141.43 0.33 379.07 2.08 1720.40 10.03SESAME SEEDS KGS 9228.56 53.26 8727.92 37.66 609.28 3.93 38050.45 296.03 72928.10 808.64 34767.79 379.99NIGER SEEDS KGS 3504.77 13.33 233.00 0.79 117.23 0.39 0.00 0.00 0.00 0.00 703.00 3.73GROUNDNUT TON 0.39 1.70 0.00 0.00 0.10 0.47 0.04 0.29 0.11 0.36 0.13 0.49OTHER OIL SEEDS TON 56.94 118.18 44.95 74.76 41.22 88.77 44.26 109.74 54.70 166.79 51.56 163.29EDIBLE VEGETABLE OILS TON 6734.45 22316.68 6039.02 25919.59 0.00 0.00 0.00 0.00 0.00 0.00 0.00 0.00VEGETABLE OILS TON 0.00 0.00 0.00 0.00 8442.28 46334.15 11017.66 61270.66 10467.30 56836.35 12731.60 64889.60OIL MEALS TON 127.73 104.69 79.22 75.03 86.13 98.72 148.30 210.38 126.94 199.87 165.10 272.65GUERGAM MEAL TON 0.07 2.41 0.09 2.66 0.30 9.90 0.57 33.61 0.38 21.85 0.13 5.72CASTOR OIL KGS 56.85 0.44 12.61 0.91 55.34 1.29 142.80 2.23 68.95 2.04 52.36 1.81SHELLAC KGS 3552.31 34.10 3293.55 50.55 541.88 22.15 2782.51 172.61 680.72 45.80 1770.84 59.54SUGAR TON 2551.42 5965.80 1034.58 2789.54 99.71 313.83 1122.25 3094.38 880.96 2286.86 1538.64 3668.21MOLLASES TON 45.54 32.29 7.29 6.15 12.40 4.35 14.68 7.50 15.07 8.93 60.28 30.14FRUITS / VEGETABLE SEEDS KGS 12668.02 284.42 11139.67 291.22 13180.92 380.15 16045.49 471.10 8294.15 449.48 14012.28 611.53FRESH FRUITS TON 562.19 2843.47 630.23 3586.51 723.24 4610.67 802.14 6180.42 769.20 7715.87 900.98 9566.81FRESH VEGETABLES TON 5.40 8.14 16.61 40.60 5.04 7.31 7.03 11.24 25.98 41.67 8.24 11.14PROCESSED VEGETABLES KGS 0.00 77.90 0.00 117.48 20500.72 120.19 0.00 149.01 20289.09 173.94 10960.19 104.45PROCESSED FRUITS AND JUICES KGS 0.00 191.12 0.00 251.54 30659.39 315.03 0.00 432.06 31973.06 410.83 33552.68 499.54CEREAL PREPARATIONS TON 39.11 188.92 37.73 243.43 45.82 316.39 50.42 359.98 53.47 419.34 72.72 583.93COCOA PRODUCTS KGS 25227.73 376.08 33802.27 584.21 50759.95 934.32 53331.11 1049.25 51627.35 1071.55 65387.03 1551.63MILLED PRODUCTS KGS 2489.63 9.76 3740.38 10.96 2882.81 11.88 4522.60 23.75 3977.44 22.01 3465.37 17.72MISC PROCESSED ITEMS 0.00 552.34 0.00 664.01 0.00 915.19 0.00 1268.33 0.00 1474.47 0.00 1785.23ANIMAL CASINGS KGS 0.00 0.00 0.00 0.00 0.00 0.00 0.02 0.00 0.22 0.00 0.00 0.00SHEEP/GOAT MEAT TON 0.04 1.22 0.03 0.80 0.01 0.21 0.02 1.52 0.06 5.13 0.09 8.73OTHER MEAT TON 0.33 6.67 0.35 7.01 0.54 12.48 0.43 15.71 0.36 15.80 0.47 19.50PROCESSED MEAT TON 1.41 9.79 0.78 7.56 0.96 9.74 0.57 9.02 0.39 7.64 0.17 5.17DAIRY PRODUCTS KGS 0.00 333.64 0.00 847.83 71903.49 1219.41 0.00 184.25 10487.31 232.68 43837.63 375.01POULTRY PRODUCTS 0.00 26.72 0.00 14.46 0.00 19.72 0.00 18.29 0.00 23.39 0.00 38.22FLORICLTR PRODUCTS KGS 0.00 45.88 0.00 45.48 3064.32 68.64 0.00 85.67 4308.80 112.19 4820.19 113.37NATURAL RUBBER TON 177.13 1602.15 190.73 2928.33 214.42 4248.18 262.74 4590.14 360.27 5537.29 442.13 4990.09ALCOHOLIC BEVERAGES LTR 0.00 1244.26 0.00 1029.13 113182.71 1309.77 0.00 1416.77 114452.98 2076.18 177683.00 2508.66MARINE PRODUCTS KGS 27346.02 303.09 28346.87 429.04 34223.12 569.53 28103.79 452.70 31219.16 411.01 27721.32 453.90COTTON RAW INCLD. WASTE TON 0.00 1241.37 0.00 622.24 77.42 1059.19 232.56 2466.74 180.97 2375.78 289.39 3101.92TOTAL 54141.45 53375.25 81026.50 107316.20 105270.28 125639.16

Annexure-II (contd..)
Import of Agriculture Products into India (2015-16 to 2019-20)Qty. in thousand units; Value in Rs. crore
2015-16 2016-17 2017-18 2018-19 2019-20 (Apr-Oct)DESCRIPTION UNIT Qty Value Qty Value Qty Value Qty Value Qty ValueTEA KGS 23722.24 377.47 24893.01 338.35 24938.77 356.99 28851.38 417.96 14739.39 302.82COFFEE KGS 65612.80 801.83 78041.34 926.81 77217.05 996.50 82772.39 958.59 53650.10 593.54RICE(OTHER THAN BASMOTI) TON 1.02 5.91 1.14 7.25 2.12 12.18 6.87 32.14 3.62 17.27WHEAT TON 517.67 872.59 5749.43 8509.05 1649.73 2357.84 2.75 5.44 1.16 3.07OTHER CEREALS TON 206.14 344.31 311.37 493.18 265.13 433.90 244.32 471.28 353.88 623.58PULSES TON 5797.71 25619.06 6609.49 28523.18 5607.53 18748.57 2527.88 8035.30 1874.44 6258.55TOBACCO UNMANUFACTURED KGS 2883.25 137.30 1969.03 77.21 1542.20 69.47 2595.83 102.89 743.58 16.77TOBACCO MANUFACTURED 0.00 193.92 0.00 228.54 0.00 185.92 0.00 257.52 0.00 129.49SPICES KGS 197058.87 5399.95 242293.68 5760.25 222325.65 6385.26 240555.22 7932.70 174282.00 6353.48CASHEW TON 961.67 8701.28 774.51 9027.09 654.02 9134.33 839.64 11162.32 721.86 6501.32CASHEW NUT SHELL LIQUID KGS 1858.35 5.60 1687.77 3.67 2092.36 5.66 6611.49 21.05 7713.88 19.66SESAME SEEDS KGS 23597.10 179.66 69028.83 442.15 26269.59 176.77 87538.04 875.17 70325.10 710.73NIGER SEEDS KGS 5780.00 44.14 10656.00 82.82 5332.80 29.00 8664.88 40.62 3372.91 17.38GROUNDNUT TON 0.11 0.31 0.33 1.39 1.72 13.04 1.09 8.14 1.81 10.30OTHER OIL SEEDS TON 62.51 218.62 116.64 392.36 127.35 364.59 220.48 745.35 182.95 634.15VEGETABLE OILS TON 15643.74 68676.62 14007.39 73038.98 15361.02 74995.91 15019.30 69023.79 9304.64 39920.07OIL MEALS TON 256.55 429.91 550.43 974.59 485.96 746.67 504.00 869.56 405.35 685.26GUERGAM MEAL TON 0.63 13.93 0.18 2.41 0.43 3.30 0.72 5.90 0.89 14.19CASTOR OIL KGS 31.76 1.10 107.21 1.50 38.37 2.54 223.82 5.32 122.36 6.18SHELLAC KGS 705.39 19.48 459.61 13.43 466.92 18.38 640.96 19.35 625.78 15.82SUGAR TON 1943.13 4037.86 2146.15 6868.61 2402.98 6035.84 1490.61 3175.39 660.08 1446.04SUGAR TON 1943.13 4037.86 2146.15 6868.61 2402.98 6035.84 1490.61 3175.39 660.08 1446.04MOLLASES TON 17.27 7.50 13.84 9.04 72.85 69.29 4.47 1.38 30.75 9.60FRUITS / VEGETABLE SEEDS KGS 14328.07 703.03 14073.87 653.33 16051.46 768.26 19725.77 835.81 13045.59 600.06FRESH FRUITS TON 857.90 11071.57 1057.51 11290.62 994.70 12524.55 1124.18 13931.65 570.72 7477.73FRESH VEGETABLES TON 140.73 394.45 8.55 11.12 15.66 25.64 14.75 24.22 14.97 33.84PROCESSED VEGETABLES KGS 15379.02 120.33 13323.28 115.26 15335.42 134.83 18097.79 161.83 21470.06 160.71PROCESSED FRUITS AND JUICES KGS 40494.96 526.49 42993.07 548.10 53585.04 803.81 59123.89 909.34 33246.87 473.94CEREAL PREPARATIONS TON 61.70 575.42 66.46 579.03 71.10 659.68 90.58 971.36 52.75 564.85COCOA PRODUCTS KGS 56424.69 1398.91 63611.90 1542.28 71257.55 1473.10 87595.13 1845.89 55094.78 1148.80MILLED PRODUCTS KGS 4393.66 21.40 3555.95 16.22 3275.70 13.02 4184.83 15.60 2376.03 8.96MISC PROCESSED ITEMS 0.00 1811.12 0.00 2115.82 0.00 2249.73 0.00 2560.20 0.00 1644.33SHEEP/GOAT MEAT TON 0.05 4.80 0.13 8.50 0.22 13.36 0.12 10.83 0.09 7.76OTHER MEAT TON 0.50 17.18 0.59 19.03 0.78 27.80 0.88 30.65 0.64 21.06PROCESSED MEAT TON 0.07 2.75 0.13 4.47 0.10 3.22 0.12 4.14 0.08 3.10DAIRY PRODUCTS KGS 18303.41 371.58 16906.34 254.84 23393.63 312.59 13643.20 254.12 9693.67 178.78POULTRY PRODUCTS 0.00 26.42 0.00 29.46 0.00 26.87 0.00 41.80 0.00 18.28FLORICLTR PRODUCTS KGS 4768.81 114.40 5568.39 133.81 6241.10 136.46 6374.48 174.09 4602.39 155.53NATURAL RUBBER TON 458.38 4671.64 426.19 4374.63 469.76 5343.74 582.35 6127.66 302.34 3303.03ALCOHOLIC BEVERAGES LTR 303459.28 2935.85 452717.72 3590.33 563769.85 3876.14 587958.73 4678.72 381472.28 2870.47MARINE PRODUCTS KGS 50348.35 639.77 52015.03 633.39 44713.34 793.30 56933.36 1088.13 33270.05 663.44COTTON RAW INCLD. WASTE TON 233.14 2566.21 499.62 6338.92 469.13 6306.77 299.27 4383.40 602.43 7759.89TOTAL 144061.67 167981.01 156634.82 142216.63 91383.84
*******

GOVERNMENT OF INDIAMINISTRY OF COMMERCE & INDUSTRY
(DEPARTMENT OF COMMERCE)
LOK SABHAUNSTARRED QUESTION NO. 2577 (H)
TO BE ANSWERED ON 04 th DECEMBER, 2019TO BE ANSWERED ON 04 th DECEMBER, 2019
LAND UTILIZATION OF SEZ
2577(H). SHRI MITESH RAMESHBHAI PATEL (BAKABHAI):
Will the Minister of COMMERCE & INDUSTRY (वािण�य एवं उ�ोग मं�ी ) be pleased to state:
(a) whether the Government has taken any step to acquire back the land that had been allotted as special economic zones (SEZ) but is not being utilized for the said purpose;
(b) if so, the details thereof; and(c) the steps being taken by the Government to curb the misuse of the land allotted as special economic
zones?
ANSWER
okf.kT; ,oa m|ksx ea=h ( Jh ih;w’k xks;y )okf.kT; ,oa m|ksx ea=h ( Jh ih;w’k xks;y )THE MINISTER OF COMMERCE AND INDUSTRY
(SHRI PIYUSH GOYAL)
(a) to (c): As per Entry No. 18 of the State list in the 7th Schedule to the Constitution of India, ‘land’ is a State subject. The Board of Approval (BoA) approves a proposal for establishment of a Special Economic Zone (SEZ) subject to the terms and conditions prescribed in the SEZ Act, 2005and Rules, 2006 as amended from time to time. The approval is granted only after the concerned State Government recommends the setting up of the SEZ. After the approval, the implementation of SEZ projects by developers is monitored by the Development Commissioners as per SEZ Act and Rules on a regular basis. Based on such monitoring, in case of violation of SEZ Act/Rules, action is initiated against the Developers to recover any fiscal benefit availed by them as well as to penalise them for the violations. De-notification is done based on recommendation of concerned Development the violations. De-notification is done based on recommendation of concerned Development Commissioner and after obtaining the No-objection from the State Government concerned as well as Department of Revenue. Further, in terms of Rule 11(9) of the SEZ Rules, 2006, sale of land in an SEZ is not allowed.
*****

GOVERNMENT OF INDIAMINISTRY OF COMMERCE & INDUSTRY
(DEPARTMENT OF COMME RCE)
LOK SABHAUNSTARRED QUESTION NO. 2585
TO BE ANSWERED ON 04 th DECEMBER, 2019
STEPS FOR PROMOTING EXPORTS
2585. SHRI PARVESH SAHIB SINGH VERMA:
Will the Minister of COMMERCE & INDUSTRY (वािण�य एवं उ�ोग मं�ी ) be pleased to state:
(a) the details of all schemes/ interventions and steps taken by the Government for the promotion of (a) the details of all schemes/ interventions and steps taken by the Government for the promotion of Indian exports in the global trade;
(b) the details of reforms undertaken in the industrial policy for improving business environment and bringing foreign investments in India; and
(c) the details of the steps being taken by the Government to strengthen India’s manufacturing sector vis-a-vis other nations with regard to better performance in Free Trade Agreements?
ANSWER
okf.kT; ,oa m|ksx ea=h ( Jh ih;w’k xks;y )okf.kT; ,oa m|ksx ea=h ( Jh ih;w’k xks;y )THE MINISTER OF COMMERCE AND INDUSTRY
(SHRI PIYUSH GOYAL)
(a) Sir, the Government has been implementing various steps such as exemption/ refund of duties, support to merchandise exports to offset logistics costs, infrastructure support to States etc. to promote Indian exports. The key interventions include:
i. A new Foreign Trade Policy (FTP) 2015-20 was launched on 1st April 2015. The policy, inter alia, rationalised the earlier export promotion schemes and introduced two new schemes, namely Merchandise Exports from India Scheme (MEIS) for improving export of goods and ‘Services Exports from Scheme (MEIS) for improving export of goods and ‘Services Exports from India Scheme (SEIS)’ for increasing exports of services. Duty credit scrips issued under these schemes were made fully transferable. In the Mid-term Review of the FTP in December, 2017, incentive rates for labour intensive / MSME sectors were increased across the board by 2% with an annualfinancial implication of Rs 8,450 cr.
ii. A new Logistics Division was created in the Department of Commerce to coordinate integrated development of the logistics sector. India’s rank in

World Bank’s Logistics Performance Index moved up from 54 in 2014 to 44 in 2018.
iii. Interest Equalization Scheme on pre and post shipment rupee export credit was introduced from 1.4.2015 providing interest equalisation at 3% for labour intensive / MSME sectors. The rate was increased to 5% for MSME sectors with effect from 2.11.2018 and merchant exporters were covered under the scheme with effect from 2.1.2019.
iv. Various measures for improving ease of doing business were taken. India’s rank in World Bank ‘Ease of doing business’ ranking improved from 142 in 2014 to 63 in 2019 with the rank in ‘trading across borders’ moving up from 122 to 80.
v. A new scheme called “Trade Infrastructure for Export Scheme (TIES)” was launched with effect from 1st April 2017 to address the export infrastructure gaps in the country.
vi. A comprehensive “Agriculture Export Policy” was launched on 6th December, 2018 with an aim to double farmers’ income by 2022 and provides an impetus to agricultural exports.
vii. A new scheme called “Transport and Marketing Assistance” (TMA) has been launched for mitigating disadvantage of higher cost of transportation for export of specified agriculture products.
viii. A new scheme called Scheme for Rebate of State and Central Taxes and Levies (RoSCTL) covering export of garments and made-ups was notified on 7.3.2019 providing refund of duties/taxes at higher rates.
ix. Through the Market Access Initiative (MAI) Scheme, reimbursement of expenditure incurred by Indian exporters on meeting statutory compliances abroad is provided, under which the limit cap per exporter has recently been increased from Rs 50 Lacs to Rs 2 Cr per year.
x. As regards steps taken to engage the States in export promotion, the State Governments have been requested to nominate a Senior Officer as the Export Commissioner who can coordinate all export efforts, required from the different agencies of the State Government.
(b) and (c) Government is continuously engaged in strengthening Indian industry through “Ease of Doing Business” reforms and policy interventions for improved market access, attracting foreign investments and better utilization of Free Trade Agreements. Regulatory environment impacts business development. Due to low regulatory burden entrepreneurs can devote their time on core productive activities. It also leads to lower costs for compliance as the requirement of engaging regulatory experts is reduced. Some steps taken for improving business environment and boosting the manufacturing sector in the recent past are detailed in the Annexure.
___**___

ANNEXURE
REFERRED TO IN REPLY TO PART (b) & (c) OF LOK SABHA UNSTARRED QUESTION NO. 2585 FOR ANSWER ON 04.12.2019
i. The World Bank released the Doing Business Report (DBR), 2020 on 24th October, 2019. India ranks 63rd amongst 190 countries as per assessment made by the Doing Business Team. India has leapt 14 ranks from its rank of 77 in the DBR 2019. The DBR is an assessment of 190 economies and covers 10 indicators which span the lifecycle of a business. The indicator wise rank of India in World Bank’s DBR 2020 is as follows:
S. No. Indicator Rank1. Starting a Business 1362. Dealing with Construction Permits 273. Getting Electricity 224. Registering Property 1545. Getting Credit 256. Protecting Minority Investors 137. Paying Taxes 1158. Trading Across Borders 689. Enforcing Contracts 16310. Resolving Insolvency 52
Overall 63
India has improved its rank in 7 out of 10 indicators and has moved closer to international best practices. The 2020 edition of the Report acknowledges India as one of the top 10 improvers, third time in a row, with an improvement of 67 ranks in three years. It is also the highest jump by any large country since 2011.Some of the major indicator wise reforms undertaken by the Government towards easing the business environment in the country are as under:
a. Starting a business - With applicability in both Delhi and Mumbai, India made starting a business easier by abolishing filing fees for the SPICe company incorporation form, electronic memorandum of association, and articles of association.
b. Dealing with construction permits - In Delhi, obtaining construction permits was made easy, thereby reducing the time and cost of obtaining construction permits, and building quality control was improved by strengthening professional certification requirements. Mumbai streamlined the process of obtaining a building permit and reduced costs of scrutiny fees by 90%. The introduction of these reforms resulted in a jump of 25 ranks from 52 last year to 27 in DBR 2020. Also, the Distance to Frontier improved from 73.81 to 78.7.

c. Trading across borders - Trading across borders was made easier by enabling post-clearance audits, integrating trade stakeholders in a single electronic platform, upgrading port infrastructure, and enhancing the electronic submission of documents. This reform is applicable to both Delhi and Mumbai.
d. Resolving insolvency - India’s rank in resolving insolvency improved from 108 to 52 recording a jump of 56 ranks with the Distance to Frontier improving from 40.84 to 62.0. India made resolving insolvency easier by promoting reorganization proceedings in practice. The Insolvency and Bankruptcy Code 2016 has been recognized as a mode of resolving insolvency. Also, time taken in resolving insolvency is now comparable to OECD Countries.
ii. Other initiatives for improving business environment and boost the manufacturing sector year-wise are:
a. 2014: The Department for Promotion of Industry and Internal Trade (DPIIT) in consultation with the State Governments started a comprehensive reform exercise in December, 2014 to create a conducive business environment by streamlining regulatory structures and creating an investor friendly business climate by cutting down red tape.
b. 2015: A 285 point State Reform Action Plan action plan was finalized and shared with States/UTs. The World Bank also partnered with DPIIT in this reform plan and to give the exercise momentum, and conducted 18 workshops to help Departments concerned across States/UTs to understand the essence of the reforms better. States were evaluated on implementation of these of the reforms better. States were evaluated on implementation of these reforms and first ever ranking of States/UTs on Ease of Doing Business was released in September, 2015. The findings of the evaluation were compiled in a report titled “Assessment of State implementation of Business Reforms”
c. 2016: In 2016, DPIIT, in consultation with all States/UTs, released a 340 -point action plan which included recommendations on 58 regulatory processes, policies and process spread across 10 reform areas spanning the lifecycle of a typical business. The States were requested to implement the reforms action plan and submit their responses for evaluation. The final ranking of States/UTs was released on 31st October, 2016 with a national implementation average of 48.93%, which was higher than national average of 32% in 2015. The reform exercise in 2016 saw larger participation and 12 States achieving greater than 90% implementation score.
d. 2017-18: In 2017, the reform exercise featured 372 action points with additions like Central Inspection system, online systems for acquiring trade license, registrations under Legal Metrology Act, 2009, and registration of Partnership Firms & Societies. The assessment for the year 2017-18 was released jointly by DPIIT and the World Bank on 10th July, 2018. 18 States recorded implementation score of 80% and above – these states account for majority of the total area and GDP of the country. Some important achievements under this reform exercise were as follows:

i. 19 States have designed an Information Wizard providing information for all approvals, licenses, registrations timelines, procedure to establish business/industrial unit (pre-establishment & pre-operation)
ii. 21 States/UTs have designed and implemented online Single Window System
iii. 21 States/UTs have implemented a Geographical Information System (GIS) system to provide details about the land earmarked for industrial use across the State
iv. 23 States/UTs have reduced the number of documents required for Obtaining Electricity connection to only two.
v. 8 States/UTs have brought all compliance inspections conducted by Labour, Factories, Boilers Departments and Pollution Control Boards under Central Inspection Framework.
vi. 29 States/ UTs have notified a list of white category industries exempted from taking pollution clearances.
e. 2019: An 80 reform point action plan for the year 2019 was shared with States and UTs for implementation of reforms by 15.06.2019. An important change introduced in the action plan for the year 2019 is that the assessment is based only on the feedback received from users and industries. Further, a 218 point District Reform Action Plan which is spread across 8 areas which are Starting a Business for Construction, Urban Local Body Services, Paying Taxes, Land Reform Enabler, Land Administration and Property Registration Enablers, Obtaining Approval, Miscellaneous and Grievance Redressal/ Paperless Courts and Law & Order has been prepared for targeted action. The District reform plan covers 43 NoCs/ Permissions/ Registrations/ Certificates which will ease doing business in sectors like retail, education, health, food and beverages, real estate, gems and jewelry, mining and entertainment. A suggested questionnaire for the feedback for States/UTs has also been shared with the States. Such questionnaire will assess implementation of the Plan by District level functionaries and effectiveness of utilization of online systems, adherence to mandated timelines and lack of physical touch-points between applicant and department/agency. States/UTs are encouraged to participate in this reform and take onus to conduct the feedback exercise in Districts
GOVERNMENT OF INDIAMINISTRY OF COMMERCE & INDUSTRY
(DEPARTMENT OF COMMERCE)
LOK SABHAUNSTARRED QUESTION NO. 2594
TO BE ANSWERED ON 04 th DECEMBER, 2019
DECLINE IN GOLD DEMAND
2594. MS. MIMI CHAKRABORTY:
Will the Minister of COMMERCE & INDUSTRY (वािण�य एवं उ�ोग मं�ी ) be pleased to state:
(a) whether gold demand in the second half of 2019-20 Financial Year (FY) has crashed over 38 percent (a) whether gold demand in the second half of 2019-20 Financial Year (FY) has crashed over 38 percent in the country;
(b) whether economic slowdown is the main reason behind the sales drop of over 35 percent over the second half of FY 2018-19; and
(c) if so, the details of the steps taken/ to be taken by the Government to revive the gold demand and sales?
ANSWER
okf.kT; ,oa m|ksx ea=h ( Jh ih;w’k xks;y )THE MINISTER OF COMMERCE AND INDUSTRY
(SHRI PIYUSH GOYAL) (SHRI PIYUSH GOYAL) (a) to (c) There is no mechanism to measure the demand and sale of gold in domestic market.
****

GOVERNMENT OF INDIAMINISTRY OF COMMERCE & INDUSTRY
(DEPARTMENT OF COMMERCE)
LOK SABHAUNSTARRED QUESTION NO. 2598 (H)
TO BE ANSWERED ON 04 th DECEMBER, 2019
ASSISTANCE TO GRAPE FARMERS
2598(H). DR. BHARATI PRAVIN PAWAR:
Will the Minister of COMMERCE & INDUSTRY (वािण�य एवं उ�ोग मं�ी ) be pleased to state:
(a) whether the Government is contemplating to provide any assistance to grape farmers in the country, (a) whether the Government is contemplating to provide any assistance to grape farmers in the country, particularly in the Nashik district, in order to export their products to other countries directly;
(b) if so, the details thereof; and (c) if not, the reasons therefor?
ANSWER
okf.kT; ,oa m|ksx ea=h ( Jh ih;w’k xks;y )THE MINISTER OF COMMERCE AND INDUSTRY
(SHRI PIYUSH GOYAL)
(a & b) Promotion of exports of agricultural products like grapes is a continuous process. The (a & b) Promotion of exports of agricultural products like grapes is a continuous process. The Agricultural & Processed Food Products Export Development Authority (APEDA), an autonomous organisation under the administrative control of Department of Commerce, has been mandated with the export promotion of grapes. APEDA has implemented GrapeNet, which is a web-based service offered to the stakeholders for facilitating testing and certification of Grapes for export from India in compliance with the standards identified by NRC Pune, on the basis of consultation with the exporters. GrapeNet collects, stores and reports – forward and backward traces and quality assurance data entered by the stakeholders within the Grapes supply chain in India. Moreover, APEDA has alsobeen providing assistance to the Grape exporters under various components of its export promotion scheme. Under the Agriculture Export Policy, Pune, Nasik and Sangli districts of Maharashtra have been identified as a cluster for export-oriented production of grapes. The farmers, looking to directly export their grapes, can avail of all forms of assistance available to the exporters.
(c) Does not arise in view of (a) & (b) above.
****

GOVERNMENT OF INDIAMINISTRY OF COMMERCE & INDUSTRY
(DEPARTMENT OF C OMMERCE)
LOK SABHAUNSTARRED QUESTION NO. 2634
TO BE ANSWERED ON 04 th DECEMBER, 2019
TRADE WITH BRICS NATIONS
2634. SHRI VIJAY KUMAR DUBEY: SHRI DHANUSH M. KUMAR: SHRI SELVAM G.:SHRI SOYAM BAPU RAO:
Will the Minister of COMMERCE & INDUSTRY (वािण�य एवं उ�ोग मं�ी ) be Will the Minister of COMMERCE & INDUSTRY (वािण�य एवं उ�ोग मं�ी ) be pleased to state:
(a) whether India has participated in the 11th Brazil, Russia, India, China, South Africa (BRICS) Summit recently, if so the details thereof along with the theme of the event;
(b) whether India is facing trade barriers/non-tariff barriers in other BRICS nations and if so, the details thereof along with the steps taken by the Government to remove these barriers;
(c) whether the trade among the BRICS Nations is quite low as compared to their respective total global trade and if so, the details thereof;
(d) the country-wise details of India’s trade with BRICS Nations during each of the last three years and the current year, while also indicating the share of India’s intra BRICS trade to global trade;
(e) the benefits likely to accrue to developing countries in general and to India in particular in the field of finance and trade as a result of these summits;
(f) whether the Government has discussed with the BRICS Nations to increase trade and if so, the details thereof and the response of the BRICS Nations thereon; and
(g) the details of other steps being taken or to be taken by the Government to boost trade with the BRICS Nations?
ANSWER
okf.kT; ,oa m|ksx ea=h ( Jh ih;w’k xks;y )THE MINISTER OF COMMERCE AND INDUSTRY THE MINISTER OF COMMERCE AND INDUSTRY
(SHRI PIYUSH GOYAL)
(a) Hon’ble PM led the Indian delegation to the 11 th BRICS Summit that was held on 14th November 2019 in Brasilia under the theme ‘Economic Growth for an Innovative Future’.
(b) BRICS countries in 2018 agreed upon a non-binding and voluntary Working Mechanism on Technical Regulations, Standards, Metrology and Conformity
Assessment Procedures for identifying, preventing and eliminating technical barriers to trade with a view to facilitating trade and increasing mutual trade flows. The government, through the Institutional mechanisms such as Joint Commission Meetings (JCMs) and Joint Trade Committee (JTCs) addresses market access and other issues like non tariff measures on a regular basis, with a view to increasing India’s trade including with BRICS countries.
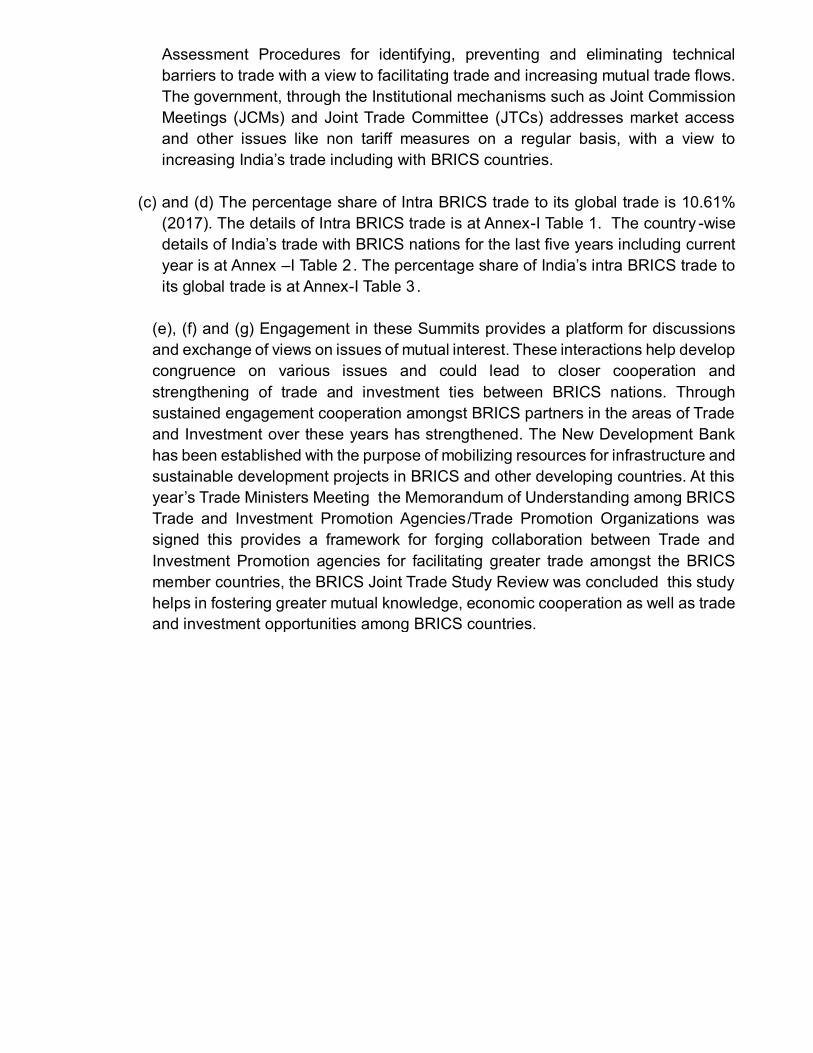
(c) and (d) The percentage share of Intra BRICS trade to its global trade is 10.61% (2017). The details of Intra BRICS trade is at Annex-I Table 1. The country -wise details of India’s trade with BRICS nations for the last five years including current year is at Annex –I Table 2 . The percentage share of India’s intra BRICS trade to its global trade is at Annex-I Table 3 .
(e), (f) and (g) Engagement in these Summits provides a platform for discussions and exchange of views on issues of mutual interest. These interactions help develop congruence on various issues and could lead to closer cooperation and strengthening of trade and investment ties between BRICS nations. Through sustained engagement cooperation amongst BRICS partners in the areas of Trade and Investment over these years has strengthened. The New Development Bankhas been established with the purpose of mobilizing resources for infrastructure and sustainable development projects in BRICS and other developing countries. At this year’s Trade Ministers Meeting the Memorandum of Understanding among BRICS Trade and Investment Promotion Agencies/Trade Promotion Organizations was signed this provides a framework for forging collaboration between Trade and Investment Promotion agencies for facilitating greater trade amongst the BRICS member countries, the BRICS Joint Trade Study Review was concluded this study helps in fostering greater mutual knowledge, economic cooperation as well as trade and investment opportunities among BRICS countries.

ANNEX-I
Table 1: Intra BRICS Trade Data (value in Billion US $) (2017)
Country World Brazil China India Russia South Africa
Intra BRICS
% Share of its
Global Trade
368.49 74.81 5.38 7.60 2.00 89.79 24.37%Brazil
368.49 74.81 5.38 7.60 2.00 89.79 24.37%
China4107.16 87.81 84.22 84.39 39.20 295.61 7.20%
India587.36 7.97 84.42 10.12 10.96 113.47 19.32%
Russian 738.42 5.23 85.90 8.32 0.83 100.28 13.58%
South Africa171.30 1.96 23.89 0.75 8.05 34.65 20.23%
BRICS5972.73 633.81 10.61%
Source: COMTRADESource: COMTRADE
Table 2: India’s Trade with BRCS (in Billion US$)Counterpart 2014-2015 2015-2016 2016-2017 2017-2018 2018-2019 2019-20Brazil 11.4 6.7 6.5 8.6 8.2 3.5China 72.3 70.7 71.5 89.7 87.1 44.7Russia 6.3 6.2 7.5 10.7 8.2 4.9South Africa 11.8 9.5 9.4 10.7 10.6 5.4India's Total Intra -BRICS 101.9 93.1 94.8 119.6 114.1 58.5
Source: DOC
Note: Data for 2019-20 is from April to September, 2019.
Table 3: Percentage Share of India’s Intra-BRICS Trade to Global tradeCountry 2014-2015 2015-2016 2016-2017 2017-2018 2018-2019 2019-20Brazil 1.5 1.04 0.99 1.11 0.97 0.9China 9.54 10.99 10.82 11.66 10.31 11.0Russia 0.84 0.96 1.13 1.39 0.97 1.2South Africa 1.56 1.48 1.42 1.39 1.25 1.3India's Intra-BRICS 13.44 14.47 14.36 15.55 13.5 14.4
Source: DOC
Note: Data for 2019-20 is from April to September, 2019.
****

GOVERNMENT OF INDIAMINISTRY OF COMMERCE & INDUSTRY
(DEPARTMENT OF COMMERCE)
LOK SABHAUNSTARRED QUESTION NO. 2639
TO BE ANSWERED ON 04 th DECEMBER, 2019
EXPORT OF HERBAL MEDICINES
2639. SHRI SUDHAKAR TUKARAM SHRANGARE: SHRI MANSUKHBHAI DHANJIBHAI VASAVA:DR. VIRENDRA KUMAR: MS. PRATIMA BHOUMIK:
Will the Minister of COMMERCE & INDUSTRY (वािण�य एवं उ�ोग मं�ी ) be Will the Minister of COMMERCE & INDUSTRY (वािण�य एवं उ�ोग मं�ी ) be pleased to state:
(a) whether the Government has any policy for the export of herbs and herbal medicines and if so, the details thereof;
(b) whether India’s share in total global export of herbal medicines is very low; (c) if so, the details thereof and the reasons therefor; (d) the country and value-wise details of the total export of herbal medicines during each of the last
three years and the current year; and (e) the steps taken by the Government to promote export of herbal medicines and to create export
avenues for the farmers opting for the cultivation of herbs and medicinal plants across the country?
ANSWER
okf.kT; ,oa m|ksx ea=h ( Jh ih;w’k xks;y )THE MINISTER OF COMMERCE AND INDUSTRY
(SHRI PIYUSH GOYAL)
(a) As per the ITC(HS) Export Policy, 2018, export of 'Herbal Medicines' is free and does not require license from the Directorate General of Foreign Trade (DGFT). However, DGFT has notified prohibitions and restrictions on some products of Plant and Plant DGFT has notified prohibitions and restrictions on some products of Plant and Plant Portions, which is available at https://dgft.gov.in/policies/notifications-archive?page=18.
(b) No Sir.
(c) Does not arise.

(d) The country-wise and value-wise details of the total exports of herbal products during each of the last 3 years and the current year may be seen at ANNEXURE - I.
(e) In order to promote India’s exports and to create export avenues for the farmers opting for the cultivation of herbs and medicinal plants, the Government has taken several measures:
i. Department of Commerce has set up Export Promotion Councils for promoting exports of various product groups / sectors. The mandate of export promotion ofHerbs and Medicinal Plants has been assigned to Shellac & Forest Products Export Promotion Council (SHEFEXIL), headquartered at Kolkata. The export promotion of several Herbal Products has been assigned to Pharmaceuticals Export Promotion Council (PHARMEXCIL), besides others. These EPCs facilitate the exporting community and undertake various export promotional measures for promotion of export of their products.
ii. Under Market Access Initiative (MAI) Scheme of the Department of Commerce, the EPCs / Trade Bodies are provided financial assistance for participation and organizing Trade Fairs, Buyer Seller Meets (BSMs), Reverse Buyer Seller Meets (RBSMs), Research & Product Development, Market Studies, etc.
iii. Merchandise Exports from India Scheme (MEIS) provides incentives to the exporting community for specified goods so as to offset infrastructural inefficiencies and the associated costs of exporting products produced in India, giving special emphasis to those which are of India’s export interest and have the capability to generate employment and enhance India’s competitiveness in the world market.
iv. International Cooperation Scheme of Ayush Ministry provides financial assistance to the exporters for the participation in Trade Fairs, organizing International BusinessMeets & Conferences and product registration reimbursements.Meets & Conferences and product registration reimbursements.
v. The National Medicinal Plants Board (NMPB), Ministry of AYUSH, Government of India has launched a “Voluntary Certification Scheme for Medicinal Plants Produce (VCSMPP)” on 22nd November, 2017 in order to encourage the Good Agricultural Practices (GAPs) and Good Field Collection Practices (GFCPs) of medicinal plants. The VCSMPP will enhance the availability of the certified quality medicinal plants raw material in the country and create export avenues for the farmers opting for the cultivation of herbs and medicinal plants across the country.
vi. Ministry of Ayush through its Quality Certification programme like Ayush mark and Premium mark is also assisting industry in setting up of quality standards.
vii. Ministry of Ayush has also entered into MoUs with a few countries for promotion of traditional medicines which will help exports in the long run.
******

ANNEXURE - 1
Country wise and value wise export of medicinal herbs (Plant and Plant Portion) - Sorted based on the year 2018-19
Sr. No.
EXPORT MARKET April-MARCH 2016-17
April-MARCH 2017-18
April-MARCH 2018-19
April-September
2019-20
Value USD Mn Value USD Mn Value USD Mn Value USD Mn
1 U S A 90.43 99.00 102.89 45.66
2 GERMANY 30.95 46.78 34.07 19.47
3 VIETNAM SOC REP 17.55 20.15 26.76 11.284 CHINA P RP 5.44 9.94 13.48 5.23
5 ITALY 12.82 15.56 12.92 6.89
6 PAKISTAN IR 13.17 10.01 12.45 2.71
7 BANGLADESH PR 3.88 3.71 8.91 4.14
8 U K 9.58 10.41 8.70 5.03
9 AUSTRALIA 6.97 7.02 6.73 2.94
10 FRANCE 6.01 7.30 5.76 3.31
11 U ARAB EMTS 6.42 6.37 5.30 1.82
12 JAPAN 5.59 5.57 5.23 2.78
13 KOREA RP 4.03 4.63 5.15 2.57
14 BELGIUM 4.85 6.46 4.92 3.3314 BELGIUM 4.85 6.46 4.92 3.33
15 CANADA 3.59 3.48 4.00 2.41
16 MEXICO 6.09 3.86 3.75 1.59
17 MALAYSIA 6.20 4.54 3.64 2.21
18 IRAN 4.44 3.83 3.11 2.26
19 NETHERLAND 3.45 5.19 2.83 1.28
20 TAIWAN 2.17 1.97 2.78 0.84
21 AFGHANISTAN TIS 0.83 3.79 2.78 2.32
22 PHILIPPINES 2.26 2.72 2.70 1.25
23 SPAIN 1.67 2.41 2.60 1.30
24 SAUDI ARAB 2.95 3.36 2.60 0.72
25 IRELAND 3.74 2.60 2.29 0.83
26 BRAZIL 1.23 1.58 2.16 1.31
27 SRI LANKA DSR 2.34 2.11 2.14 0.83
28 THAILAND 2.44 2.63 2.03 0.84
29 INDONESIA 1.59 1.45 1.71 0.68
30 AUSTRIA 3.17 3.79 1.54 0.80
31 NEPAL 1.30 1.91 1.53 0.86
32 POLAND 1.94 2.01 1.50 0.85
33 EGYPT A RP 0.76 0.72 1.41 0.60
34 KUWAIT 0.92 0.98 1.08 0.46
35 RUSSIA 0.83 0.88 1.05 0.49
36 DENMARK 3.19 4.22 1.01 0.89

37 QATAR 1.07 1.08 0.88 0.13
38 ROMANIA 0.43 0.48 0.88 0.56
39 COLOMBIA 0.63 1.08 0.76 0.15
40 SOUTH AFRICA 0.79 0.75 0.74 0.62
41 ALGERIA 0.18 0.35 0.72 0.11
42 OMAN 0.33 0.51 0.66 0.03
43 CZECH REPUBLIC 0.70 0.70 0.65 0.23
44 TURKEY 0.46 0.94 0.64 0.38
45 SWITZERLAND 0.33 0.44 0.53 0.31
46 BAHARAIN IS 0.53 0.47 0.52 0.10
47 SINGAPORE 0.44 0.56 0.52 0.28
48 MYANMAR 0.41 0.53 0.48 0.16
49 NEW ZEALAND 0.43 0.42 0.48 0.42
50 GUATEMALA 0.95 0.66 0.46 0.22
51 CHILE 0.28 0.36 0.45 0.41
52 IRAQ 0.32 0.50 0.38 0.16
53 SWEDEN 0.45 0.63 0.36 0.09
54 HUNGARY 0.41 0.50 0.33 0.18
55 SLOVENIA 0.19 0.13 0.33 0.16
56 LATVIA 0.36 0.29 0.32 0.06
57 COSTA RICA 0.31 0.41 0.27 0.08
58 FINLAND 0.33 0.59 0.25 0.21
59 MOROCCO 0.30 0.37 0.25 0.3259 MOROCCO 0.30 0.37 0.25 0.32
60 CAMBODIA 0.00 0.01 0.24 0.04
61 ECUADOR 0.07 0.12 0.23 0.02
62 ARGENTINA 0.16 0.33 0.22 0.09
63 BULGARIA 0.16 0.14 0.22 0.08
64 UKRAINE 0.10 0.13 0.21 0.06
65 MAURITIUS 0.12 0.14 0.21 0.08
66 ISRAEL 0.32 0.66 0.20 0.09
67 LITHUANIA 0.27 0.42 0.18 0.25
68 SLOVAK REP 0.03 0.13 0.16 0.08
69 TUNISIA 0.09 0.06 0.15 0.02
70 CONGO D. REP. 0.00 0.01 0.13 0.02
71 TANZANIA REP 0.03 0.12 0.13 0.02
72 CROATIA 0.02 0.03 0.10 0.03
73 FAROE IS. 0.00 0.00 0.10 0.00
74 HONG KONG 0.14 0.07 0.10 0.03
75 NIGERIA 0.04 0.05 0.10 0.01
76 ESTONIA 0.09 0.11 0.08 0.07
77 NORWAY 0.05 0.16 0.08 0.00
78 GREECE 0.08 0.04 0.08 0.09
79 UGANDA 0.01 0.04 0.07 0.06
80 URUGUAY 0.07 0.05 0.07 0.04
81 LEBANON 0.02 0.07 0.07 0.03
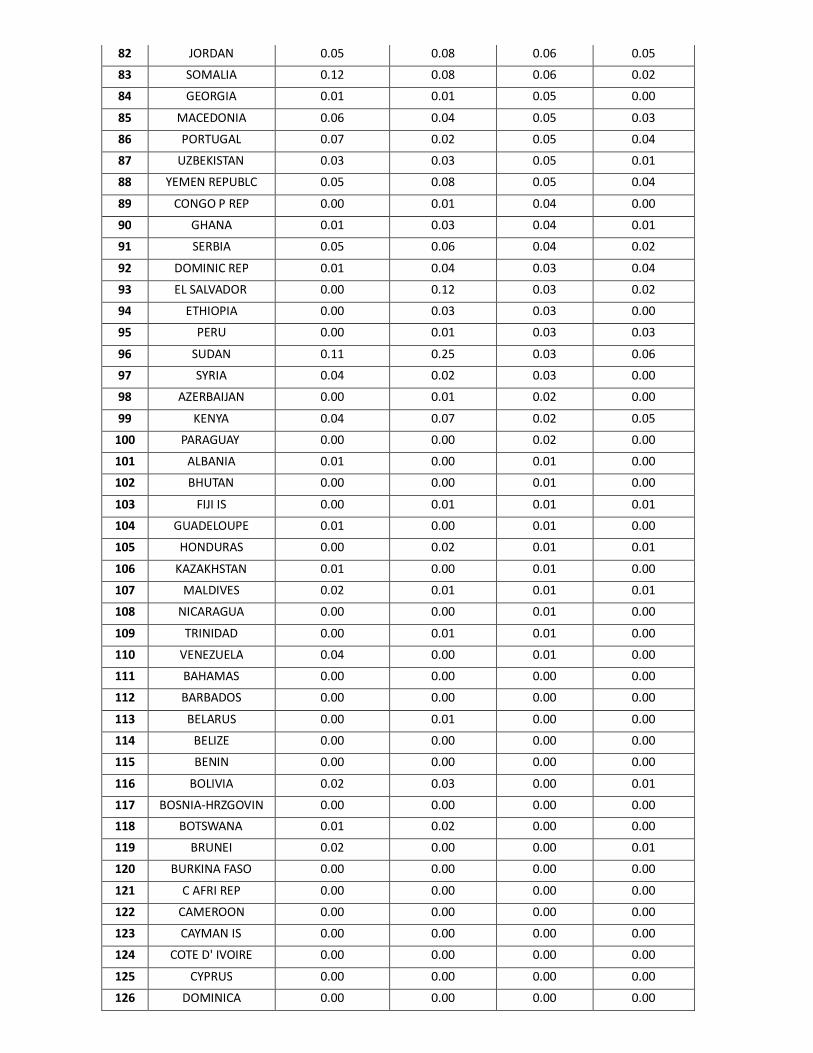
82 JORDAN 0.05 0.08 0.06 0.05
83 SOMALIA 0.12 0.08 0.06 0.02
84 GEORGIA 0.01 0.01 0.05 0.00
85 MACEDONIA 0.06 0.04 0.05 0.03
86 PORTUGAL 0.07 0.02 0.05 0.04
87 UZBEKISTAN 0.03 0.03 0.05 0.01
88 YEMEN REPUBLC 0.05 0.08 0.05 0.04
89 CONGO P REP 0.00 0.01 0.04 0.00
90 GHANA 0.01 0.03 0.04 0.01
91 SERBIA 0.05 0.06 0.04 0.02
92 DOMINIC REP 0.01 0.04 0.03 0.04
93 EL SALVADOR 0.00 0.12 0.03 0.02
94 ETHIOPIA 0.00 0.03 0.03 0.00
95 PERU 0.00 0.01 0.03 0.03
96 SUDAN 0.11 0.25 0.03 0.06
97 SYRIA 0.04 0.02 0.03 0.00
98 AZERBAIJAN 0.00 0.01 0.02 0.00
99 KENYA 0.04 0.07 0.02 0.05
100 PARAGUAY 0.00 0.00 0.02 0.00
101 ALBANIA 0.01 0.00 0.01 0.00
102 BHUTAN 0.00 0.00 0.01 0.00
103 FIJI IS 0.00 0.01 0.01 0.01
104 GUADELOUPE 0.01 0.00 0.01 0.00104 GUADELOUPE 0.01 0.00 0.01 0.00
105 HONDURAS 0.00 0.02 0.01 0.01
106 KAZAKHSTAN 0.01 0.00 0.01 0.00
107 MALDIVES 0.02 0.01 0.01 0.01
108 NICARAGUA 0.00 0.00 0.01 0.00
109 TRINIDAD 0.00 0.01 0.01 0.00
110 VENEZUELA 0.04 0.00 0.01 0.00
111 BAHAMAS 0.00 0.00 0.00 0.00
112 BARBADOS 0.00 0.00 0.00 0.00
113 BELARUS 0.00 0.01 0.00 0.00
114 BELIZE 0.00 0.00 0.00 0.00
115 BENIN 0.00 0.00 0.00 0.00
116 BOLIVIA 0.02 0.03 0.00 0.01
117 BOSNIA-HRZGOVIN 0.00 0.00 0.00 0.00118 BOTSWANA 0.01 0.02 0.00 0.00
119 BRUNEI 0.02 0.00 0.00 0.01
120 BURKINA FASO 0.00 0.00 0.00 0.00
121 C AFRI REP 0.00 0.00 0.00 0.00
122 CAMEROON 0.00 0.00 0.00 0.00
123 CAYMAN IS 0.00 0.00 0.00 0.00
124 COTE D' IVOIRE 0.00 0.00 0.00 0.00
125 CYPRUS 0.00 0.00 0.00 0.00
126 DOMINICA 0.00 0.00 0.00 0.00

127 GUYANA 0.00 0.00 0.00 0.00
128 ICELAND 0.00 0.00 0.00 0.00
129 JAMAICA 0.00 0.00 0.00 0.00
130 KOREA DP RP 0.00 0.00 0.00 0.00
131 KYRGHYZSTAN 0.00 0.00 0.00 0.00
132 LIBYA 0.08 0.13 0.00 0.00
133 MACAO 0.00 0.00 0.00 0.00
134 MADAGASCAR 0.46 0.00 0.00 0.00
135 MALAWI 0.00 0.00 0.00 0.00
136 MARTINIQUE 0.00 0.01 0.00 0.00
137 MONGOLIA 0.00 0.00 0.00 0.00
138 MONTENEGRO 0.00 0.00 0.00 0.01
139 MOZAMBIQUE 0.00 0.00 0.00 0.00
140 NETHERLANDANTIL 0.12 0.00 0.00 0.00
141 PAPUA N GNA 0.00 0.00 0.00 0.00
142 REUNION 0.00 0.00 0.00 0.01
143 SENEGAL 0.00 0.00 0.00 0.00
144 SEYCHELLES 0.00 0.00 0.00 0.00
145 SIERRA LEONE 0.00 0.00 0.00 0.00
146 ST LUCIA 0.00 0.00 0.00 0.00
147 SURINAME 0.00 0.00 0.00 0.00
148 TOGO 0.01 0.00 0.00 0.01
149 US MINOR 0.00 0.00 0.00 0.07149 US MINOR OUTLYING ISLANDS
0.00 0.00 0.00 0.07
150 ZAMBIA 0.00 0.00 0.00 0.00
151 ANGOLA 0.00 0.00 0.00 0.00
152 ARMENIA 0.00 0.00 0.00 0.00
153 DJIBOUTI 0.00 0.00 0.00 0.00
154 GABON 0.00 0.00 0.00 0.00
155 GAMBIA 0.00 0.00 0.00 0.00
156 GUINEA BISSAU 0.00 0.00 0.00 0.00
157 LIBERIA 0.00 0.00 0.00 0.00
158 MALTA 0.00 0.00 0.00 0.00
159 MOLDOVA 0.00 0.00 0.00 0.00
160 MONTSERRAT 0.00 0.00 0.00 0.00
161 NIGER 0.00 0.00 0.00 0.00
162 PANAMA REPUBLIC 0.01 0.01 0.00 0.00
163 RWANDA 0.00 0.00 0.00 0.00
164 ZIMBABWE 0.00 0.00 0.00 0.00
Source: DGCI&S
****

GOVERNMENT OF INDIAMINISTRY OF COMMERCE & INDUSTRY
(DEPARTMENT OF COMMERCE)
LOK SABHAUNSTARRED QUESTION NO. 2662
TO BE ANSWERED ON 04 th DECEMBER, 2019
IMPORT OF PEPPER
2662. KUMARI SHOBHA KARANDLAJE:SHRI MAGUNTA SREENIVASULU REDDY :
Will the Minister of COMMERCE & INDUSTRY (वािण�य एवं उ�ोग मं�ी ) be pleased to state:
(a) whether the domestic black pepper market is witnessing lower prices and subdued demand as compared to last year and illegal imports is the reason behind it and if so, the facts thereof;
(b) the details of the total production of black pepper in the country;(c) whether the import of pepper has increased during the last three years;(d) if so, the details of quantum and value of pepper imported during each of the last three years and
the current year, country -wise;(e) whether the Government has imposed a Minimum Import Price (MIP) for pepper to protect the
interests of domestic pepper growers and if so, the details thereof;(f) whether pepper is smuggled into India from Vietnam, Bangladesh, Nepal and Sri Lanka in the
backdrop of country’s exchequer loss on import duty;(g) if so, the action taken/proposed to be taken to stop unscrupulous and unchecked imports of low (g) if so, the action taken/proposed to be taken to stop unscrupulous and unchecked imports of low
priced black pepper in the country; and (h) whether the Government is bound by ASEAN agreement to import pepper from member countries
at cheaper rate?
ANSWER
okf.kT; ,oa m|ksx ea=h ( Jh ih;w’k xks;y )THE MINISTER OF COMMERCE AND INDUSTRY
(SHRI PIYUSH GOYAL)
(a) The price of domestic black pepper during the last three years has shown decreasing trend:-(a) The price of domestic black pepper during the last three years has shown decreasing trend:-
Year Average domesticprice of pepper (MG1) at Cochin (Rs/Kg)
2016-17 694.77

2017-18 473.73
2018-19 378.21
Source: Spices Board India
It is assumed that the domestic price of black pepper has fallen primarily due to decline in international prices owing to higher production and supply of pepper in the international market and also due to increased import of pepper from other countries into India.
The domestic demand for black pepper has been increasing during the last three years. The details of domestic consumption of pepper during the last three years are given below:-
Domestic consumption of pepper in IndiaYear Domestic
consumption(MT)2017 550002018 565002019(Estimate) 57000
Source: International Pepper Community
(b) Details of the total production of black pepper in the country during the last three years are given below:-
Year Area (hectare) Production (tonnes)
2016-17 134,281 62,0802017-18 139,487 71,4882018-19 138,929 62,425
Source: Directorate of Arecanut and Spices Development, Calicut, Kerala
(c) & (d) Details of quantum and value of pepper imported during each of the last three years and in the current year, country wise, are given below:

Country
2016-17 2017-18 2018-19(P) 2019-20 (Apr-Aug)(EST)
Qty.(MT)
ValueRs.lakhs
Qty.(MT)
ValueRs.lakhs
Qty.(MT)
Value Rs.lakhs
Qty.(MT)
ValueRs.lakhs
Sri Lanka 4900 32830 13660 55169 7800 37986 2003 7842
Vietnam 9500 47785 10825 36757 10900 23653 6657 11129
Indonesia 5000 26000 2320 8141 4050 9761 1034 2350
Brazil 500 2950 1980 6558 1900 4978 956 1528
Others 365 2026 866 2458 300 1614 340 686
Total 20265 111591 29650 109084 24950 77991 10990 23535
(P) – Provisional, (Est) : EstimateSource: DGCI&S Kolkata/DLI from Customs provided by the Spices Board India.
(e) In order to reduce the import of pepper and to stabilize the domestic price of pepper, Government had fixed the CIF value of Rs.500/- per kg. as the Minimum Import Price for black pepper vide Notification of Directorate General of Foreign Trade (DGFT) dated 6/12/2017. Subsequently, an amendment was brought in the Minimum Import Price (MIP) notification by making import of pepper at or above Rs.500/- per kg. free and import below Rs.500/- per kg prohibited vide DGFT Notification dated 21/3/2018.free and import below Rs.500/- per kg prohibited vide DGFT Notification dated 21/3/2018.
(f) & (g) Some representations regarding smuggling of low priced black pepper from other origin to India through Nepal and Bangladesh border were received. In this regard, the field formation of Customs and Directorate of Revenue Intelligence have been alerted and made vigilant at the point of entry in the port to detect and prevent entry of inferior quality pepper, from other countries to India. Customs has booked several cases of attempted smuggling of pepper in the recent past.
Further, on the request of the Government of India, Sri Lanka Authorities have introduced a new procedure to prevent issue of Certificates of Origin for third-country black pepper shipments destined to India. Sri Lanka Authority has also provided access to Indian authorities to examine the scanned copies of Certificates of Origin issued for black pepper exports under ISFLTA and SAFTA and temporarily suspended import of spices including pepper to Sri Lanka through the Entreport Trade and Commercial Hub Operations to prevent these spices being reshipped to India.
(h) Under ASEAN Agreement, import of pepper is allowed at 51% import duty (with effect from 1 st January, 2019) against the normal duty of 70% for import from countries not covered under trade agreements.
****

GOVERNMENT OF INDIAMINISTRY OF COMMERCE & INDUSTRY
(DEPARTMENT OF COMMERCE)
LOK SABHAUNSTARRED QUESTION NO. 2676
TO BE ANSWERED ON 04 th DECEMBER, 2019
EXPORT OF BUFFALO MEAT
2676. SHRI VINCENT H. PALA:
Will the Minister of COMMERCE & INDUSTRY (वािण�य एवं उ�ोग मं�ी ) be pleased to state:
(a) the quantity of buffalo meat exported by India since 2009, year-wise;(a) the quantity of buffalo meat exported by India since 2009, year-wise;(b) the value of Indian buffalo meat exports since 2009, year-wise;(c) the details of the top ten buffalo meat exporters from India;(d) whether any report on cow meat export has come forth; and (e) if so, the details thereof?
ANSWER
okf.kT; ,oa m|ksx ea=h ( Jh ih;w’k xks;y )THE MINISTER OF COMMERCE AND INDUSTRY
(SHRI PIYUSH GOYAL)
(a) & (b): The quantity and value of buffalo meat exported by India since 2009-10 (year-(a) & (b): The quantity and value of buffalo meat exported by India since 2009-10 (year-wise) is given below:-Year Qty. in MT Value (in Rs.
Crore)Value (in USD Million))
2009-10 495538.00 5488.20 1157.902010-11 726718.10 8614.00 1889.902011-12 987714.50 13757.30 2869.402012-13 1108662.40 17420.20 3203.202013-14 1451941.80 26472.40 4352.802014-15 1476309.80 29289.20 4782.202015-16 1314533.60 26688.10 4069.702016-17 1323576.10 26161.50 3912.002016-17 1323576.10 26161.50 3912.002017-18 1350563.50 26033.80 4036.902018-19 1236638.40 25168.30 3608.702019-20 *(upto October 2019)
669280 13346.18 1903.88
* Figures for 2019-20 are provisional and subject to change.
(Source: DGCI&S)

(c) : The details of the top ten buffalo meat exporters from India for the year 2018-19 are
given below:-
Sl. No. Name of Exporter City State1 ALLANASONS PVT. LTD. Mumbai Maharashtra2 HMA AGRO INDUSTRIES LTD. Agra Uttar Pradesh3 RUSTAM FOODS PVT. LTD. Kanpur Uttar Pradesh4 AL-HAMD AGRO FOODS
PRODUCTS PVT. LTD.Aligarh Uttar Pradesh
5 AMROON FOODS PVT. LTD. Ghaziabad Uttar Pradesh6 MIRHA EXPORTS PVT. LTD. New Delhi Delhi7 AL-SAMEER EXPORTS PVT. LTD. Meerut Uttar Pradesh8 FAIR EXPORTS (INDIA) PVT. LTD. Bandra East Maharashtra9 INTERNATIONAL AGRO FOODS Ghaziabad Uttar Pradesh10 MASH AGRO FOODS LTD. Kanpur Uttar Pradesh
(Source: APEDA)
(d) & (e) : As per ITC (HS), 2018 Schedule-2 of Export Policy, beef (which includes meat & edible offal of cow, ox and calf) are prohibited for exports from India.
******

GOVERNMENT OF INDIAMINISTRY OF COMMERCE & INDUSTRY
(DEPARTMENT OF COMMERCE)
LOK SABHAUNSTARRED QUESTION NO. 2696
TO BE ANSWERED ON 04th DECEMBER, 2019
ANTI-DUMPING DUTY
2696. SHRI JASBIR SINGH GILL:
Will the Minister of COMMERCE & INDUSTRY (वािण�य एवं उ�ोग मं�ी ) be pleased to state:
(a) the details of the Government policy on anti-dumping of goods imported; (a) the details of the Government policy on anti-dumping of goods imported; (b) the details of revenue raised through the imposition of anti -dumping duty on various goods; and(c) the criterion adopted in imposing safeguard duty on various products?
ANSWER
okf.kT; ,oa m|ksx ea=h ( Jh ih;w’k xks;y )THE MINISTER OF COMMERCE AND INDUSTRY
(SHRI PIYUSH GOYAL)
(a): Directorate General of Trade Remedies (DGTR) conducts anti -dumping investigations, under the Customs Tariff Act, 1975 and the rules made thereunder, on the basis of a duly substantiated application filed by the domestic industry alleging dumping of goods into the country causing injury to the domestic industry. The basic intent of anti -dumping measures is to eliminate injury caused to the domestic industry by the unfair trade practice of dumping and to create a level playing fi eld for the domestic industry.
(b): The details of revenue raised/receivable through the imposition of anti -dumping duty on various goods in last 4 years is given below:
Year 2016-17 2017-18 2018-19 2019-20 (upto 27thYear 2016-17 2017-18 2018-19 2019-20 (upto 27th
November, 2019)
Revenue from Anti-dumping Duty (in Rs. Crore)
1136.89 1267.62 1307.35 765.37
Source: DG Systems, Department of Revenue(EDI information)

(c): DGTR conducts safeguard investigations under the Customs Tariff Act, 1975 and the rules made thereunder, on the basis of a duly substantiated application filed by the domestic industry. The criteria adopted by DGTR in conducting the safeguard investigation includes, inter alia, evidence of increased imports, serious injury or threat of serious injury to the domestic industry, a causal link between imports and the alleged serious injury or threat of serious injury, etc.
*****

GOVERNMENT OF INDIAMINISTRY OF COMMERCE & INDUSTRY
(DEPARTMENT OF COMMERCE)
LOK SABHAUNSTARRED QUESTION NO. 2698
TO BE ANSWERED ON 04 th DECEMBER, 2019
DEVELOPMENT OF SEZ
2698. SHRI PARTHIBAN S.R.:DR. UMESH G. JADHAV:
Will the Minister of COMMERCE & INDUSTRY (वािण�य एवं उ�ोग मं�ी ) be pleased to state:
(a) the salient features of the Special Economic Zone (SEZ) policy;(b) the details of the SEZs identified and established under this policy in the country, State/UT and
location-wise including Karnataka, particularly in the Hyderabad Karnataka Region and Tamil Nadu along with the details of goods for which these SEZs are functioning;
(c) the details of the funds sanctioned, allocated and utilized for development of SEZs under this policy during each of the last three years and the current year along with the percentage of share fixed for the Union and the States therein;
(d) the location-wise details on the productivity of the above-mentioned SEZs during each of the last three years; and
(e) the details of the targets set, actions taken and achievements made under the policy so far?
ANSWER
okf.kT; ,oa m|ksx ea=h ( Jh ih;w’k xks;y )THE MINISTER OF COMMERCE AND INDUSTRY
(SHRI PIYUSH GOYAL)
(a): The Special Economic Zones (SEZs) policy was launched in April, 2000. The Special Economic Zones Act, 2005, was passed by Parliament in May, 2005 which received Presidential assent on the 23rd of June, 2005. The SEZs Rules, 2006 came into effect on 10th February, 2006. assent on the 23rd of June, 2005. The SEZs Rules, 2006 came into effect on 10th February, 2006. The salient features of the SEZ scheme are:-
(i) A designated duty free enclave to be treated as a territory outside the customs territory of India for the purpose of authorised operations in the SEZ;
(ii) No licence required for import;(iii) Manufacturing or service activities allowed;(iv) The Unit shall achieve Positive Net Foreign Exchange to be calculated cumulatively for
a period of five years from the commencement of production;

(v) Domestic sales subject to full customs duty and import policy in force;(vi) SEZ units will have freedom for subcontracting;(vii) No routine examination by customs authorities of export/import cargo;(viii) SEZ Developers /Co-Developers and Units enjoy Direct Tax and Indirect Tax benefits
as prescribed in the SEZs Act, 2005.
(b): In addition to Seven Central Government Special Economic Zones (SEZs) and 12 State/Private Sector SEZs set-up prior to the enactment of the SEZs Act, 2005, approvals have been accorded to 417 proposals for setting up of SEZs in the country. Presently, out of 349 notified SEZs a total of 238 SEZs are operational. There are no SEZs in the Hyderabad Karnataka Region SEZs a total of 238 SEZs are operational. There are no SEZs in the Hyderabad Karnataka Region area. States/Union Territories-wise distribution of SEZs established in the Country including Karnataka and Tamil Nadu and details of locations of these SEZs are available at www.sezindia.nic.in.
(c) to (e): SEZs being set up under the SEZs Act, 2005 and SEZs Rules, 2006 are primarily private investment driven initiatives. No funds are sanctioned by the Central Government for setting up of SEZ, however, the fiscal concessions and duty benefits have been allowed to developers/units as per the SEZs Act, 2005 and Rules thereunder. As on 30.09.2019, exports from SEZs was Rs. 3,81,912 crores and employment generation was about 21.94 lakh persons and investment of Rs. 5,21,631.44 crores has been made.
*****

GOVERNMENT OF INDIAMINISTRY OF COMMERCE & INDUSTRY
(DEPARTMENT OF COMMERCE)
LOK SABHAUNSTARRED QUESTION NO. 2701
TO BE ANSWERED ON 04 th DECEMBER, 2019
e-MARKETPLACE
2701. SHRI GANESH SINGH:
Will the Minister of COMMERCE & INDUSTRY (वािण�य एवं उ�ोग मं�ी ) be pleased to state:
(a) the details of the salient features of the Government e -Marketplace(GeM); (a) the details of the salient features of the Government e -Marketplace(GeM); (b) whether the GeM has signed MoU with Indian Bank and Canara Bank; (c) if so, the details thereof; (d) whether, through this partnership, both the banks have offered an array of services including
transfer of funds through GeM Pool Accounts (GPA), solicitation on Performance Bank Guarantees (e-PBG), Earnest Money Deposit (EMD) and Payment Gateway to the registered users on the portal and if so, the details of registered users on the portal as on date along with outcome, State -wise including the district of Satna (MP); and
(e) whether the GeM provides tools for direct purchase, bidding and reverse auction for ensuring transparent and efficient procurement and if so, the details of direct purchase, bidding and reverse auction as on date along with outcome, State-wise including the district of Satna (MP)?
ANSWER
okf.kT; ,oa m|ksx ea=h ( Jh ih;w’k xks;y )THE MINISTER OF COMMERCE AND INDUSTRY
(SHRI PIYUSH GOYAL)
(a): GeM SPV has been established as the National Public Procurement Portal to facilitate procurement of Goods & Services required by Central & State Government organizations.Key features of the marketplace are: -
• Marketplace based end to end procurement platform for products and services.• Online validations.• Inclusive & open.• Transparent.• Direct Purchase, e-Bidding, Reverse Auction modes of procurement enabled.• No registration fee/listing fee.

(b),(c)& (d): Yes Sir. GeM has signed Memorandum of Understanding (MoU) with Canara Bank and Indian Bank on 31.10.2019. This MOU provides for the establishment of online banking facility/services from collection and transfer of funds to services like GeM Pool account, ePBG, EMD and payment gateways. Details of registered users on the portal as on 27.11.2019 are:
(A)Registered buyer organisations:40626
(B) Registered sellers and Service providers:303151
The outcome in term of volume of procurement through GeM as on 27.11.2019 is placed at Annexure -A (state wise including Satna (MP).
(e): Yes Sir. The details have been placed at Annexure-A [state wise including Satna (MP)].
****

ANNEXURE ‘A’
Details of Procurement through GeM as on 27.11.2019
State/UT
Order Value through e-
bidding (in cr)
Order Value through (Reverse
Auction) (in cr)
Order Value through direct
Purchase (in cr)ANDAMAN AND NICOBAR ISLANDS 18 1 8
ANDHRA PRADESH 194 17 211ARUNACHAL PRADESH 56 1 46
ASSAM 118 2 69BIHAR 204 284 188
CHANDIGARH 349 4 64CHHATTISGARH 401 19 594
DADRA AND NAGAR HAVELI 1 0 13DAMAN AND DIU 5 0 16
DELHI 720 16 718GOA 1 0 7
GUJARAT 705 407 441HARYANA 95 11 252
HIMACHAL PRADESH 39 23 96JAMMU AND KASHMIR 75 55 153
JHARKHAND 206 56 254JHARKHAND 206 56 254KARNATAKA 63 6 196
KERALA 100 7 127LAKSHADWEEP 6 0 13
MADHYA PRADESH 909 274 848MAHARASHTRA 1,046 176 313
MANIPUR 10 0 14MEGHALAYA 15 0 5
MIZORAM 3 0 3NAGALAND 12 0 11
ORISSA 130 22 156PUDUCHERRY 9 0 8
PUNJAB 206 72 139RAJASTHAN 239 15 152
SIKKIM 1 0 2TAMIL NADU 175 3 152TELANGANA 61 1 457
TRIPURA 21 2 24UTTAR PRADESH 1,171 146 2,059UTTARAKHAND 69 6 111WEST BENGAL 73 17 35All India (in cr) 16,304 15,285 3,379

District
Order Value through e-
bidding (in cr)
Order Value through (Reverse
Auction) (in cr)
Order Value through direct
Purchase (in cr)
Satna District (M P) 9.88
0.02
2.32
****

GOVERNMENT OF INDIAMINISTRY OF COMMERCE & INDUSTRY
(DEPARTMENT OF COMMERCE)
LOK SABHAUNSTARRED QUESTION NO. 2702
TO BE ANSWERED ON 04 th DECEMBER, 2019
IMPORT OF PALM OIL
2702. DR. RAJDEEP ROY:
Will the Minister of COMMERCE & INDUSTRY (वािण�य एवं उ�ोग मं�ी ) be pleased to state:
(a) whether India is taking any concrete action pertaining to palm oil imports from Malaysia in response (a) whether India is taking any concrete action pertaining to palm oil imports from Malaysia in response to the statement by that country’s Prime Minister; and
(b) whether the Government will curtail imports of refined palm oil in India in line with the ‘Make In India’ programme?
ANSWER
okf.kT; ,oa m|ksx ea=h ( Jh ih;w’k xks;y )THE MINISTER OF COMMERCE AND INDUSTRY
(SHRI PIYUSH GOYAL) (SHRI PIYUSH GOYAL)
(a) & (b) Import of edible oil is under Open General License. Import of palm oil happens mainly from ASEAN countries such as Indonesia and Malaysia under the Free Trade Agr eements. Following surge in imports and threat of serious material injury to domestic industry, Government has increased Customs Duty by 5% on imports of refined bleached deodorized palmolein and palm oil into India from Malaysia for a period of 180 days w.e.f. 4th September, 2019 based on the preliminary findings of Directorate General of Trade Remedies (DGTR) under India-Malaysia CECA (Bilateral Safeguard Measures) Rules, 2017. On similar lines, Government will use all available instruments in the National interest, as and when necessary.
********