Implementing sustainability initiatives in business processes
258
1 Sensitivity: Internal Implementing sustainability initiatives in business processes A thesis submitted to The University of Derby for the degree of Doctor of Philosophy in the Derby Business School 2018 Bruno Teixeira Luz Foresti Gallotta
-
Upload
khangminh22 -
Category
Documents
-
view
3 -
download
0
Transcript of Implementing sustainability initiatives in business processes

1
Sensitivity: Internal
Implementing sustainability initiatives in business processes
A thesis submitted to The University of Derby for the degree of Doctor of Philosophy in
the Derby Business School
2018
Bruno Teixeira Luz Foresti Gallotta

2
Sensitivity: Internal
Derby Business School
The University of Derby
Abstract University of Derby
ABSTRACT OF DISSERTATION submitted by Bruno Teixeira Luz Foresti Gallotta
for the degree of Doctor of Philosophy and entitled ‘Implementing sustainability
initiatives in business processes’.
February, 2018
Purpose – The sustainability topic has been receiving a growing importance in the
corporate environment in recent years. More and more companies are adopting
sustainability practices in all their organisational levels, operations and business process
as a whole, however, they have still failed to achieve the anticipated goal. Existing
roadmaps, frameworks and systems do not comprehensively support sustainable business
transformation. This research proposes a four phases framework, based on BPM, to help
organisations to implement sustainability practices in the organisation business processes
and has verified it with industry/academic specialists and validated it in a local
organisation focused on sustainability initiatives.
Design/methodology/approach – A conceptual framework has been created, verified
and validated. The framework is based on Business Process Management (BPM)
principles, which was chosen because due its capability to work in a cross process way
while providing the full control of the process performance. It was then verified using a
Delphi study held with 21 specialists in Sustainable Operations Management from both
academia and industry and validated using an action research study on a biomass
company focused in the development of sustainable energy technologies that wished to
improve the implementation of sustainability initiatives in its business processes and
operations.
Findings – It was identified that organisations still struggle to succeed the
implementation of sustainability projects. The research outlined that the business process
management (BPM) approach can be used as way to implement sustainability practices
in an organisation’s business processes by using the conceptual framework. The benefits
from this approach are the enablement of continuous process improvement, improvement
of process quality; cost reduction; increase in the customer satisfaction; and better control

3
Sensitivity: Internal
over process performance, which can be directly linked to the improvement of the
sustainability improvement.
Research limitations/implication – The main limitation of this research is the
application of the framework in only one real-life scenario, which was expected due the
research method chosen to validate it. Future work aims to apply the framework in
different scenarios, in organisations with different sizes, different maturity level, different
sector, and different locations. Further research will also investigate the symbiosis of the
BPM approach with other management approaches, such as lean/green manufacturing,
project management, green supply chain and carbon footprint. In addition, in a further
moment, once companies are familiarised with the project methodology, it is possible to
create a centre of excellence (an area within the organisation with the best practices/
processes of the industry) in terms of sustainability bringing even more value, improving
continuously and generating more innovation by the form of green reference process
models.
Practical implications – The proposed framework uses a Business Process Management
(BPM) approach, which provides a systemic solution for the organisations adopt
sustainability practices in their business processes.
Keywords – Business Process Management, Sustainability, Sustainability
Implementation, Sustainable Operations Management

4
Sensitivity: Internal
Table of contents
Abstract ............................................................................................................................ 2
List of Tables ..................................................................................................................... 7
List of Figures .................................................................................................................... 8
Dedication ....................................................................................................................... 11
Acknowledgement .......................................................................................................... 11
Chapter 1 - Introduction ................................................................................................. 12
1.1. Introduction ...................................................................................................... 12
1.2. General Overview of the Research and problem statement ............................. 12
1.3. Research Aim and Objectives .......................................................................... 16
1.4. Research Questions .......................................................................................... 17
1.5. Motivations, importance and rationale of the research .................................... 17
1.6. Structure of the dissertation ............................................................................. 17
Chapter 2 – An overview of Sustainability, Sustainability Implementation and how it relates to Business Processes ......................................................................................... 20
2.1 Introduction ...................................................................................................... 20
2.2 What is Sustainability ...................................................................................... 20
2.3. Sustainability and Operations Management ......................................................... 24
2.4 Adoption of Sustainable Initiatives .................................................................. 25
2.5 Companies need to implement sustainability initiatives in their Business Processes ..................................................................................................................... 30
2.6 Sustainability Implementation Problems ......................................................... 31
2.7 Chapter Summary and conclusions .................................................................. 34
Chapter 3 – Literature Review on Business Process Management ................................ 35
3.1. Introduction ...................................................................................................... 35
3.2. Process Management Origin and Evolution .................................................... 35
3.2.1. Scientific Management ............................................................................. 37
3.2.2. Toyota Production System ....................................................................... 38
3.2.3. Lean Manufacturing ................................................................................. 39
3.2.4. Total Quality Management ....................................................................... 40
3.2.5. Six Sigma .................................................................................................. 40
3.2.6. Business Process Reengineering (BPR) ................................................... 41
3.3. Defining Business Process Management (BPM) ............................................. 42
3.3.1. BPM Benefits ........................................................................................... 43
3.3.2. BPM Success Factors ............................................................................... 45

5
Sensitivity: Internal
3.4. Business Process Management (BPM) Phases ................................................ 46
3.4.1. Analyse ..................................................................................................... 49
3.4.2. Design ....................................................................................................... 49
3.4.3. Implement ................................................................................................. 50
3.4.4. Monitor & Control .................................................................................... 50
3.5. Relating Business Process Management (BPM) and Sustainability ................ 50
3.6. Chapter Summary and conclusions .................................................................. 57
Chapter 4 - Research methodology and approach ......................................................... 58
4.1. Introduction .......................................................................................................... 58
4.2. Type of research ............................................................................................... 58
4.3. Research Methodology .................................................................................... 59
4.4. Research Methods ............................................................................................ 62
4.4.1. Delphi Study ............................................................................................. 62
4.4.2. Action Research ........................................................................................ 64
4.5. Chapter summary and conclusions .................................................................. 66
Chapter 5 – Sustainability Implementation Framework for Business Processes ........... 67
5.1. Introduction ...................................................................................................... 67
5.2. Conceptual framework for Sustainability Projects Implementation ................ 67
5.2.1. Analyse ..................................................................................................... 73
5.2.2. Design Phase ............................................................................................ 95
5.2.3. Implement Phase ...................................................................................... 99
5.2.4. Monitor & Control Phase ....................................................................... 101
5.3. Roadmap Enablers ......................................................................................... 107
5.3.1. Governance ............................................................................................. 107
5.3.2. Strategy ................................................................................................... 108
5.3.3. Methods .................................................................................................. 109
5.3.4. Information Technology ......................................................................... 109
5.3.5. Change Management .............................................................................. 110
5.3.6. Leadership .............................................................................................. 111
5.3.7. Organisational Culture ............................................................................ 111
5.5. Chapter summary and conclusions ................................................................ 112
Chapter 6 – Framework Verification using Delphi Study ............................................. 113
6.1. Introduction .................................................................................................... 113
6.2. The Delphi method ........................................................................................ 113
6.3. Participants ..................................................................................................... 117
6.4. The Delphi study ............................................................................................ 121
6.4.1. Questionnaire creation ............................................................................ 121

6
Sensitivity: Internal
6.4.2. Test round ............................................................................................... 123
6.4.3. Delphi Study first round ......................................................................... 123
6.4.4. Delphi Study second round .................................................................... 143
6.5. Final Discussion ............................................................................................. 153
6.6. Chapter Summary and conclusions ................................................................ 154
Chapter 7 – Framework Validation using Action Research .......................................... 155
7.1. Introduction ........................................................................................................ 155
7.2. Study Overview ............................................................................................. 155
7.3. Study timetable .............................................................................................. 155
7.4. Analyse Phase ................................................................................................ 156
7.4.1. Identify Business Scenario ..................................................................... 156
7.4.2. Determine and prioritise processes ......................................................... 161
7.4.3. Define Project Stakeholders ................................................................... 161
7.4.4. Define Project Objectives ....................................................................... 162
7.4.5. Define Metrics ........................................................................................ 162
7.4.6. Record enterprise map (AS-IS Situation) .................................................... 164
7.4.7. Record baseline values ................................................................................. 167
7.5.8. Perform Sustainability Maturity Assessment .............................................. 178
7.5. Design phase .................................................................................................. 180
7.5.1. Define Scope........................................................................................... 180
7.5.2. Identify Improvement opportunities ....................................................... 181
7.5.3. Design TO-BE Process ........................................................................... 187
7.5.4. Record predicted metric values .............................................................. 188
7.5.5. Define implementation Strategy ............................................................. 190
7.6. Implement phase ............................................................................................ 191
7.7. Monitor & Control Phase ............................................................................... 192
7.7.1. Monitor and analyse organisational performance .................................. 192
7.7.2. Monitor and analyse process performance ............................................. 193
7.7.3. Monitor and analyse sustainability metrics ............................................ 194
7.7.4. Realise value ........................................................................................... 197
7.7.5. Identify optimisation opportunities ........................................................ 197
7.8. Chapter summary and conclusion .................................................................. 198
Chapter 8 - Conclusions and recommendations .......................................................... 199
8.1. Introduction ........................................................................................................ 199
8.2. Findings and actions in relation to the project’s aim, objectives and research question ..................................................................................................................... 199
8.3. Discussion ...................................................................................................... 202

7
Sensitivity: Internal
8.3.1. Sustainability Implementation ................................................................ 202
8.3.2. Framework .............................................................................................. 203
8.3.3. Delphi study: .......................................................................................... 204
8.3.4. Action research ....................................................................................... 204
8.4. Research Contribution to the Sustainability Implementation Field – Theoretical Implications ............................................................................................................... 205
8.5. Practical Implications of the Research ........................................................... 205
8.6. Research Limitations and further research .................................................... 206
8.7. Final comments – dissertation experience ..................................................... 206
Bibliography .................................................................................................................. 208
Appendices ................................................................................................................... 234
Appendix A. Experts information for the Delphi study ............................................ 234
Appendix B. Delphi study first round – Questionnaire ............................................. 238
Appendix C. Delphi study second round - Questionnaire ......................................... 245
Appendix D. Delphi study first round - Results ........................................................ 247
Appendix E. Delphi study second round - Results.................................................... 255
List of Tables Table 1 Summary of some challenges found in the literature to implement sustainability initiatives ........................................................................................................................ 13 Table 2 - Summary of some challenges found in the literature to implement sustainability initiatives ........................................................................................................................ 32 Table 3 - Three Waves of Process Evolution. Adapted from .Lusk et al. (2005) .......... 35 Table 4 Different classifications of research. Adapted from Hussey and Hussey (1997) ........................................................................................................................................ 58 Table 5 - GRI Economic Indicators. Adapted from GRI (2013) .................................... 78 Table 6 - GRI Environmental Indicators. Adapted from GRI (2013) ............................ 78 Table 7 - GRI Social Indicators. Adapted from GRI (2013) .......................................... 79 Table 8- A checklist for integrating sustainability in projects and project management (Knoepfel, 2010). ............................................................................................................ 80 Table 9 Subset of enterprise process. Adapted from Smith and Fingar (2003).............. 84 Table 10 - Project Scope Statement model ..................................................................... 97 Table 12 - - Participants information ............................................................................ 119 Table 13 - Groups of questions for the questionnaire .................................................. 122 Table 14 Comments on the question –‘Is Sustainability implementation directly linked to Process Management?’ ................................................................................................. 124 Table 15 Keywords list ................................................................................................. 125 Table 16 Comments to the question 'If Sustainability implementation is related to Process Management, is it justified to use the Business Process Management (BPM) approach?' ...................................................................................................................................... 127 Table 17 keywords list .................................................................................................. 128 Table 18 Comments to the question '- Is it justified to represent the implementation of
8
Sensitivity: Internal
Sustainability initiatives using the BPM tool as the framework suggests?' ................. 130 Table 19 Keywords list ................................................................................................. 131 Table 20 0 Analyse phase acceptance (in percentage) ................................................. 133 Table 21 Comments regarding the Analyse phase ....................................................... 133 Table 22 Keywords list ................................................................................................. 134 Table 23 - Design phase acceptance i(in percentage)................................................... 135 Table 24 Comments regarding the Design phase ......................................................... 136 Table 25 Keywords list ................................................................................................. 136 Table 26 - Implement phase acceptance (in percentage) .............................................. 138 Table 27 Commment regarding Implement phase ....................................................... 138 Table 28 - Monitor and control phase acceptance (in percentage) ............................... 139 Table 29 Comments regarding the enablers for the framework ................................... 140 Table 30 - Summary of the responses .......................................................................... 141 Table 31 Summary of the enablers level of agreement ................................................ 143 Table 32 Comments on the question ‘In your opinion, what are the main challenges to implement sustainability initiatives in organisations?’ ................................................ 144 Table 33 - Summary of the challenges to adopt sustainability initiatives .................... 145 Table 34 Comments on the question 'In your opinion, how is it possible to assess all the sustainability dimensions (social, environmental and economic) in terms of Business Processes?' .................................................................................................................. 147 Table 35 Summary of the ways to assess all the sustainability dimensions ................. 148 Table 36 Comments on the question’ Considering the framework from Figure 1, would you change the order of the steps or suit it in a different phase?’ ................................ 150 Table 37 Comments on 'How would you improve the framework' .............................. 151 Table 38 Level of agreement of the framework phases................................................ 153 Table 39 Production Costs ............................................................................................ 168 Table 40 Water consumed in a one year period .......................................................... 169 Table 41 Formulas to calculate the water used in the process...................................... 170 Table 42 Required data to calculate the water used in the process .............................. 170 Table 43 Summary of flow rate .................................................................................... 171 Table 44 Calculation of the percentage of water reused in the process ....................... 172 Table 45 - Accident records 2015................................................................................. 173 Table 46 Accident records 2016 ................................................................................... 174 Table 47 Percentage of staff that concluded the trainings ............................................ 176 Table 48 Lean and green tools used by the organisation .............................................. 179 Table 49 Green tools used by the organisation ............................................................ 180 Table 50 SWOT Analysis ............................................................................................. 184 Table 51 Monitor Process performance........................................................................ 193 Table 52 Monitor Sustainability performance .............................................................. 194
List of Figures Figure 1 Research Methodology .................................................................................... 16 Figure 2 Sustainable Development Goals. Source: http://www.un.org/sustainabledevelopment/sustainable-development-goals/ ............... 22 Figure 3 represents UN Sustainability Conferences Timeline ....................................... 22 Figure 4 - Triple Bottom Line. Adapted from Elkington.(1997).................................... 23 Figure 5 Source Škrinjar & Trkman 2013 ...................................................................... 45 Figure 6 - BPM implementation. Adapted from Scheer, (2006) .................................... 46

9
Sensitivity: Internal
Figure 7 - BPM implementation. Netjes et al. (2006) .................................................... 47 Figure 8 - BPM implementation cycle. Houy et al., 2010) ............................................ 47 Figure 9 - BPM Lifecycle - ABPMP (2009) .................................................................. 48 Figure 10 - The BPM capability areas and underlying factors (de Bruin & Rosemann, 2007) ............................................................................................................................... 52 Figure 11 Sample business process and related local applications. Source Reiter, Fettke, and Loos (2014 ............................................................................................................... 53 Figure 12 Energy consumption of the sample business process. Source Reiter, Fettke, and Loos (2014 ...................................................................................................................... 53 Figure 13 - Notation extensions. Recker et al. (2011) .................................................... 54 Figure 14 - E.g. of a BPMN model using the sustainability notation. Recker et al. (2012) ........................................................................................................................................ 55 Figure 15 - E.g. of a process at the activity level using EPC notation with the sustainability rations per activity. Houy et al. (2012) ........................................................................... 56 Figure 16 – Research Methodology ............................................................................... 60 Figure 17 Adapted from: (Baskerville & Pries-Heje 1999, p. 4). .................................. 64 Figure 18 Relation between the stakeholders and the triple bottom line ....................... 68 Figure 19 Balanced scorecard for the sustainability implementation............................. 68 Figure 20 Project plan .................................................................................................... 69 Figure 21Process design - Strategy to operations ........................................................... 69 Figure 22Initial framework ............................................................................................. 70 Figure 23 – Conceptual Framework to Implement Sustainability Initiatives in the Business Processes ......................................................................................................... 72 Figure 24 - Breakdown of the Analyse phase................................................................. 74 Figure 25 - The project objectives triangle (Slack et al., 2013) ..................................... 76 Figure 26 - Sustainability Checklist (Sanchez, 2014) .................................................... 81 Figure 27 - Example of Process Design using EPC methodology - Scenario Level ...... 82 Figure 28 - Example of Process Design using EPC methodology - Process Level ....... 83 Figure 29 - Example of Process Design using EPC methodology – Activity Level ...... 83 Figure 30 - Process Design Hierarchy ............................................................................ 83 Figure 31 - Example of a BPMN model. Source Appel et al. (2014) ............................ 87 Figure 32 - Example of a BPMN model. Source: ABPMP (2009), ............................... 87 Figure 33 The building blocks of an Event-driven Process Chain. Source: Reijers et al. (2008) ............................................................................................................................. 88 Figure 34 – Example of an EPC model. Adapted from ABPMP (2009) ....................... 89 Figure 35 - Sales process (EPC) annotated with relevant sustainability ratios. Adapted from Houy et al. (2012) .................................................................................................. 90 Figure 36 – Process Design Hierarchy ........................................................................... 91 Figure 37 - Comparison of low and high maturity and the five maturity stages (Jeston.& Nelis, 2006) .................................................................................................................... 92 Figure 38 - Reporting format showing actual levels (dark colours) and desired levels (light colours) of integration of sustainability aspects (Silvius & Schipper, 2010) ................. 94 Figure 39 - Sustainability maturity assessment. Source Spohn (2004), ......................... 95 Figure 40 - Breakdown of Design Phase ........................................................................ 96 Figure 41 - Breakdown of Implement Phase .................................................................. 99 Figure 42 - Breakdown of Monitor & Control Phase ................................................... 102 Figure 43 - Organisational performance framework (Linkage, 2013) ......................... 103 Figure 44 – Framework to monitor organisational performance. Adapted from Draghici (2014) ........................................................................................................................... 104 Figure 45 - Example of a Monitoring Dashboard. Adapted from Ahmed and Sundaram

10
Sensitivity: Internal
(2012) ........................................................................................................................... 106 Figure 46 Delphi study method .................................................................................... 114 Figure 47Method to analyse the responses of the Delphi study ................................... 117 Figure 48 - e-mail sent to the specialists ...................................................................... 118 Figure 49 - Participation of the study chart .................................................................. 119 Figure 50 - Delphi study composition .......................................................................... 120 Figure 51 - Delphi study distribution per country ........................................................ 121 Figure 52 - Delphi study distribution per position ....................................................... 121 Figure 53 - Is Sustainability implementation directly linked to Process Management? ...................................................................................................................................... 124 Figure 54Keywords distribution ................................................................................... 126 Figure 55 - If Sustainability implementation is related to Process Management, is it justified to use the Business Process Management (BPM) approach? ......................... 127 Figure 56Keywords distribution ................................................................................... 129 Figure 57 - Is it justified to represent the implementation of Sustainability initiatives using the BPM tool as the framework suggests?.................................................................... 130 Figure 58 Keywords distribution .................................................................................. 132 Figure 59 Analyse phase consolidated ......................................................................... 133 Figure 60 Keywords distribution .................................................................................. 134 Figure 61 - Design phase consolidated ......................................................................... 135 Figure 62Keywords distribution ................................................................................... 137 Figure 63 - Implement phase consolidated ................................................................... 138 Figure 64 - Monitor and control phase consolidated .................................................... 139 Figure 65 - Enablers of the framework ......................................................................... 140 Figure 66 - Number of daily responses to the first round of the Delphi Study ............ 141 Figure 67 Challenges to implement sustainability initiatives ....................................... 146 Figure 68 Summary on how to assess al the sustainability dimensions ....................... 149 Figure 69 - .Considering the framework from Figure 1, would you change the order of the steps or suit it in a different phase? ........................................................................ 150 Figure 70 - Number of daily responses for the second round of the Delphi study ....... 153 Figure 71 – Verified Framework .................................................................................. 154 Figure 72 Project Gantt chart........................................................................................ 156 Figure 73 Transformation Process ................................................................................ 158 Figure 74 Categories of Sustainability Indicators (Global Reporting Initiative, 2015) 162 Figure 75 Project Metrics - summary ........................................................................... 164 Figure 76 BPMN symbols ............................................................................................ 164 Figure 77 Energy Generation business scenario .......................................................... 165 Figure 78 Torrefaction process ..................................................................................... 166 Figure 79 Syngas cleaning process ............................................................................... 166 Figure 80 Pelletization Process .................................................................................... 167 Figure 81 Sustainability Performance calculation methods ........................................ 167 Figure 82 Process Performance calculation methods .................................................. 168 Figure 83 Water balance (cooling tower) ..................................................................... 169 Figure 84 Water balance with flow rates data .............................................................. 172 Figure 85 Internal training ............................................................................................ 175 Figure 86 External training ........................................................................................... 175 Figure 87 - Sustainability Performance - Summary ..................................................... 178 Figure 88 Process Performance - Summary ................................................................. 178 Figure 89 Level of lean/green knowledge ................................................................... 179 Figure 90 Project Scope Statement ............................................................................... 181

11
Sensitivity: Internal
Figure 91 Weak tar profitability analysis ..................................................................... 182 Figure 92 Weak tar profitability analysis ..................................................................... 183 Figure 93 Tar Distillation ............................................................................................. 188 Figure 94 - New Syngas cleaning process .................................................................... 188 Figure 95 Sustainability Performance - Predicted ........................................................ 189 Figure 96 Process performance - Predicted .................................................................. 190 Figure 97 Example of an S-curve ................................................................................. 192 Figure 98 Tableau public screen ................................................................................... 196 Figure 99 - Tableau web screen .................................................................................... 196 Figure 100 Scrum framework. Adapted from scrum.org ............................................. 197
Dedication For those who have strong thinking, the impossible is only a matter of opinion (Alexandre
Abrao). This dissertation is dedicated to my family for being always for me when I needed
their support and guidance. This dissertation is particularly dedicated to my friends and
family, who always supported me in this long journey.
Acknowledgement This research was supported by a grant from the Brazilian government through the
program Science Without Borders (SWB).
I also wish to acknowledge gratefully Dr. Jose Arturo Garza-Reyes (dissertation’s
supervisor), Dr. Tony Anosike (dissertation’s co-supervisor), Dr. Ming K. Lim, Dr Ivana
Ebel, Anderson Ferreira, Diandra Melo, Vidrene Kolelas and Neil Butler for their support
to conduct this research project.
12
Sensitivity: Internal
Chapter 1 - Introduction
1.1. Introduction This chapter presents an overview of the research project. It starts by providing the
background, as well as a general overview and description of how it was developed. Then,
the aim and objectives of this research project are presented. Finally, the research
questions that guide this project, importance and motivation of the research, as well as
the dissertation structure are also included in this chapter.
1.2. General Overview of the Research and problem statement The sustainability topic has been receiving growing importance in the corporate
environment in recent years. The motivation factors can be related to social aspects,
regulation aspects, customer requirements, among others (Epstein et al., 2010). Many
organisations are committed to transforming their business processes and have taken
sustainability initiatives. However, many of them have yet failed to achieve the
anticipated goals (Gallotta et al., 2016 and Ahmed and Sundaram, 2012). Every
sustainability project involves changes in the organisation, from the most basic ones (e.g.
replacing disposal plastic cups with individual ceramic mugs) up to drastic changes in the
way in which a company operates. However, according to Burnes (2003), a large
percentage of these change initiatives fail due to different factors that may include the
lack of management support, lack of proper communication, lack of stakeholder
engagement, among others.
In summary, organisations face various challenges when trying to implement change
initiatives to become sustainable. If organisations are unable to overcome a particular
challenge, this might result in the failure of the initiative. Some authors (e.g. Epstein and
Buhovac, 2010; vom Brocke et al., 2012; and Giunipero et al., 2012) have studied and
identified the most common challenges/barriers organisations face when implementing
sustainability initiatives. Table 1 represents a summary of some of these challenges.

13
Sensitivity: Internal
Table 1 Summary of some challenges found in the literature to implement sustainability initiatives
Besides the above challenges, another factor suggested by Ahmed and Sundaram (2012)
as a possible reason for sustainability initiatives to fail is that existing roadmaps,
frameworks and systems do not comprehensively support a sustainable business
transformation nor do they allow decision makers to explore interrelationships and
influences between the sustainability dimensions. Hence, because the sustainability
concept continues to be applied unsystematically, practising organisations experience
considerable difficulties in realising their goals of achieving a full sustainability status.
This is due to a lack of understanding and support for the design, development and
implementation process, and a lack of proper procedural and technological support for
decision making for sustainability management.
According to Slack et al. (2013), whenever a business attempts to satisfy the needs of its
customers, it will use various processes in both its operations and other functions. Each
of these processes will contribute to fulfilling its customers’ needs. Once an organisation

14
Sensitivity: Internal
decides to reorganise its operations, each product is created from a starting point passing
through processes, which contain the necessary elements for the production, to reach a
final stage. This concept is called ‘end-to-end’ process. These end-to-end processes
usually cut across conventional organisational boundaries (Gallotta et al. 2016)
‘Process’ refers to the conversion of inputs (resources) into outputs (goods and services)
(Armistead and Machin, 1997). Although the literature provides numerous definitions for
‘business processes’, all of these reflect, more or less, the same ontology, that a business
process is a series of continuous or intermittent cross-functional activities that are
naturally connected with work flowing through these activities for a particular
outcome/purpose (Hammer and Champy, 1993; Zairi, 1997; Slack et al. 2013; Harmon,
2010). What seems to make the business process approach so distinct is that it not only
focuses on activities, i.e. what is done and/or how they are done, but it also places
emphasis on how these activities are interconnected and how workflows through these
activities to produce efficient and effective results (Bititci et al., 2011). The critical point
is that transformed resources (e.g. materials and information) originate from outside the
boundaries of the organisation, whereas outputs in the form of goods and/or services leave
the boundaries of the organisation.
Nonetheless, many sustainability implementation initiatives have focused in one specific
department of the organisation, e.g. IT (Uddin and Rahman, 2012), warehouse (Tan et al.,
2010; Tan et al., 2008), logistics (Rossi et al., 2013), etc. They, however, do not consider
that those departments work along with other departments into an end-to-end process.
According to Porter’s (1985) model, products pass through activities of a chain in order,
and at each activity, the product gains some value. Similarly, we can consider that the
‘product’ (in the case of a product based industry) gains some ‘sustainability impact’ in
each activity. Therefore, a more refined analysis would consider the whole process
interaction to evaluate the full status of the sustainability implementation.
In this perspective, the research project was undertaken with the aim to help organisations
to adopt sustainability practices in their business processes, transforming their regular
business processes into sustainability business processes (or green business processes)
following a systemic approach. Several approaches can be used to improve business
processes, such as DMAIC (Define, Measure, Analyse, Improve and Control), PDCA
(Plan, Do, Check and Act), lean manufacturing and Six Sigma. For the matters of this

15
Sensitivity: Internal
research, it was employed the Business Process Management (BPM) approach. BPM has
evolved as a holistic management practice for managing and transforming organisational
operations (Hammer, 2010). According to Gartner: “BPM refers to a set of management
disciplines that accelerate effective business process improvement by blending
incremental and transformative methods. BPM’s management practices provide for the
governance of a business process environment toward the goal of improving agility and
operational performance. BPM is a structured approach that employs methods, policies,
metrics, management practices and software tools to manage and continuously optimise
an organisation’s activities and processes” (Hill et al. 2007; Gallotta, 2016). It provides
adequate techniques for the design, execution, controlling as well as the analysis of
business processes in order to improve value creation within single organisations as well
as in inter-organisational value networks – their supply chain (van der Aalst, ter Hofstede,
& Weske, 2003).
The working methodology for this research project was based on an inductive approach
in which a conceptual framework has been created, verified and validated. The framework
is based on Business Process Management (BPM) principles, which was chosen because
due its capability to work in a cross process way while providing the full control of the
process performance, and contains four main phases: (1) ‘Analyse Phase’; (2) ‘Design
Phase’; (3) ‘Implement Phase’; and (4) ‘Monitor & Control Phase’. It was then verified
using a Delphi study held with 21 specialists in Sustainable Operations Management from
both academia and industry and validated using an action research study on a biomass
company focused in the development of sustainable energy technologies that wished to
improve the implementation of sustainability initiatives in its business processes and
operations. The research methodology can be observed in Figure 1.

16
Sensitivity: Internal
Figure 1 Research Methodology
1.3. Research Aim and Objectives This research aimed to provide a full lifecycle solution for the implementation of
sustainability initiatives in business processes by Analysing, Designing, Implementing
and Monitoring & Controlling current (or eventual new) processes in one organisation. It
provided systematic methods for this implementation, aiming to realise the goals of full
sustainability status. The implementation can result in cost reduction, process
optimisation, innovation generation, energy/water consumption reduction, waste
generation reduction, customer satisfaction improvement, employee turnover
improvement, among other benefits to the organisation. The proposed aim was achieved
through the following objectives:
1. Identify what are the current problems/barriers to implementing sustainability
initiatives;
2. Identify and critically review the current sustainability implementation
frameworks found in the literature;
3. Create a framework to effectively implement sustainability practices in
organisations;
4. Identify key persons in sustainable operations management and obtain their
feedback regarding the framework;
5. Employ the framework in a real-world scenario and obtain the feedback;
17
Sensitivity: Internal
1.4. Research Questions The research questions of this research are:
• How can an organisation adopt sustainability practices in their business
processes?
• What are the benefits to adopt sustainability initiatives in the business processes?
• What are the main challenges to adopt sustainability initiatives in the business
processes?
• What is the most efficient way to adopt sustainability initiatives in the business
processes?
1.5. Motivations, importance and rationale of the research As a Business Consultant, the author is interested in the Business Process Management
(BPM) topic because it helps organisations to become process-centric and to manage and
control their business processes. On the other hand, there is the sustainability topic, which
is considered by many the ‘challenge of the century’, how organisations can become more
respectful to the environment in which it is located.
The rationale of this research consists on the benefits that Business Process Management
can bring to the sustainability topic in the organisations, and present a framework to help
them to implement sustainability projects in their business processes, transforming their
regular business processes into sustainability business processes.
This research fits into that perspective as academic knowledge, in the forms of sustainable
operations management and industrial engineering concepts and principles.
1.6. Structure of the dissertation The following section describes the dissertation’s layout with a brief description of each
chapter.
Chapter One: Introduction
This chapter presents a general overview of this research project. In particular, it provides
the research’s background, overview, aim and objectives. The chapter then outlines the
research question, motivations, importance and rationale for undertaking this project, and
finally, the structure of this dissertation.
Chapter Two: An overview of Sustainability, Sustainability Implementation and how it
relates to Business Processes
This chapter starts presenting the Sustainability topic, providing a few definitions and the
evolution of the topic. The chapter then outlines why organisations need to adopt

18
Sensitivity: Internal
sustainability practices in their business and how these initiatives can be implemented.
More than adopting sustainability initiatives in their business processes. Finally, this
chapter also discusses what are the problems and challenges of implementing
sustainability initiatives.
Chapter Three: Literature Review on Business Process Management
This chapter presents the Business Process Management (BPM) approach. The chapter
begins presenting the evolution of concepts that lead to the development of the BPM
methodology, ever since Adam Smith’s division of labour, passing to the Toyota
Production System, Lean Manufacturing, Total Quality Management approach, Six
Sigma, Business Process Reengineering, and finally the Business Process Management.
Then, the chapter goes deep into the concepts of BPM showing the benefits, success
factors and the typical implementation phases. Finally, the chapter brings the relation
between Business Process Management and the sustainability topic. It starts by reviewing
the sustainability role in the current corporate environment and provides arguments to
corroborate that BPM can be used as a tool to enable the implementation of Sustainability
Initiatives in the organisation processes.
Chapter Four: Research methodology and approach
This chapter presents an overview of the methodological aspects of the research and the
manner it was conducted. The first step was to classify the research concerning purpose,
process, logic and outcome. Then, it defines the research methodology used in this
research, aligning it to the aims, objectives and research questions. Finally, the chapter
presents the research methods used and presents the methods for data collection.
Chapter Five: Sustainability Implementation Framework for Business Processes
This chapter presents the creation of the framework to implement sustainability initiatives
in the business processes. It is initially presented the framework with the four main
phases: (Analyse Phase; Design Phase; Implement Phase; and Monitor & Control Phase)
followed by the description of each step contained in the phases. The chapter also
identifies enablers for the framework.
Chapter Six– Framework Verification using Delphi study
This chapter presents the verification of the Sustainability Implementation Framework
using the Delphi method. It is initially presented the concept of the Delphi technique, after
this, it shows the manner to select the participants and how to classify them as specialists.
The chapter then explores the modus to create the questionnaire. Finally, the chapter
provides the results of the study (both first round and second round).

19
Sensitivity: Internal
Chapter Seven – Framework Validation using Action Research
This chapter presents the validation of the Sustainability Implementation Framework
using the action research method. It is initially presented the concept of the action research
method, after this, it describes the project, presents the timeline and justifies the use of
the framework to solve the specific problem. The chapter then explores the phases of the
framework, going through the phases: ‘Analyse’, ‘Design’, ‘Implement’, and ‘Monitor
and Control’. Finally, it proposes adequate recommendations to improve the process’ and
sustainability’s elements investigated
Chapter Eight - Conclusions and recommendations
This chapter presents a summary of the results obtained from the research study, the study
limitations and future research opportunities. Finally, it draws the final conclusions of
this project and the final comments.

20
Sensitivity: Internal
Chapter 2 – An overview of Sustainability, Sustainability
Implementation and how it relates to Business Processes
2.1 Introduction Sustainability is a term with multiple meanings, so this chapter starts by bringing the
concepts of Sustainability, providing a few definitions and the evolution of the topic.
After that, it is justified the importance of sustainability in the Operations Management
scenario and then how the sustainability initiatives can be adopted. More than adopting
sustainability initiatives in their business and operations, organisations need to implement
in their business processes. Current Systems do not address all the aspects of the
sustainability implementation. Thus, finally, this chapter also discusses the problems and
challenges related to the current ways to implement sustainability initiatives.
2.2 What is Sustainability The word sustainability has multiple meanings, and the meanings often differ depending
on whether you are from another culture, you are from the world of multinational
corporations, you are a small business owner, or you are an individual trying to figure
out what a sustainable lifestyle looks like (McNall et al., 2011). However, defining this
concept is not straightforward, and a number of different and contested meanings can be
identified. According to Agyekum-Mensah et al. (2012) and Adams (2006), the idea of
sustainability is relatively recent and can be traced back to a conference held in the 1970s.
Adams (2006) and Kamara et al. (2006) argues that the concept of sustainability emerged
from the UN conference on the human environment – (UNEP, 1972). The most widely
used definition of sustainable development is the “development that meets the needs of
the present without compromising the ability of future generations to meet their own
needs” (World Commission on Environment and Development, 1987).
Ever since the United Nations held conferences to discuss topics related to sustainable
development. In 1992, the United Nations Conference on Environment and Development
(UNCED) succeeded in raising public awareness of the need to integrate environment
and development. One of the outcomes of the conference, the Agenda 21 addresses the
pressing problems of today and also aims at preparing the world for the challenges of the
next century. It reflects a global consensus and political commitment at the highest level
on development and environment cooperation. Its successful implementation is first and
foremost the responsibility of Governments. National strategies, plans, policies and
processes are crucial to achieving this (United Nations, 1992). Other outcomes of the

21
Sensitivity: Internal
conference include the United Nations Framework Convention on Climate Change
(UNFCCC) – a climate change agreement that led to the Kyoto Protocol and the United
Nations Convention to Combat Desertification (UNCCD) (United Nations, 2014).
In 2002 the World Summit on Sustainable Development brought together tens of
thousands of participants, including heads of State and Government, national delegates
and leaders from non-governmental organisations (NGOs), businesses and other major
groups to focus the world's attention and direct action toward meeting difficult challenges,
including improving people's lives and conserving our natural resources in a world that is
growing in population, with ever-increasing demands for food, water, shelter, sanitation,
energy, health services and economic security United Nations (2002).
In 2012, the United Nations Conference on Sustainable Development resulted in a
focused political outcome document (Future we want) which contains clear and practical
measures for implementing sustainable development. In Rio, Member States decided to
launch a process to develop a set of Sustainable Development Goals (SDGs), which was
built upon the Millennium Development Goals and converge with the post-2015
development agenda United Nations (2012).
In 2015, the United Nations Sustainable Development Summit provided a plan of action
for people, planet and prosperity. It also seeks to strengthen universal peace in larger
freedom. In this report, it is recognised that the most significant challenge is to eradicate
the poverty, including extreme poverty, and that it is an indispensable requirement for
sustainable development. It presents the 17 Sustainable Development Goals, as can be
observed in Figure 2. They seek to build on the Millennium Development Goals and
complete what these did not achieve. They are integrated and indivisible and balance the
three dimensions of sustainable development: the economic, social and environmental
United Nations (2015).

22
Sensitivity: Internal
Figure 2 Sustainable Development Goals. Source:
http://www.un.org/sustainabledevelopment/sustainable-development-goals/ - content
removed for copyright reasons
Figure 3 represents the United Nations Conferences timeline.
Figure 3 represents UN Sustainability Conferences Timeline
In 1997, the concept of the Triple Bottom Line was developed by Elkington (1997), which
suggests that business goals are inseparable from the societies and environments within
which they operate. Sustainability can be defined as a multi-dimensional concept
composed by three distinct dimensions: economic, environmental, and social; often
referred to as the “triple bottom-line” (Elkington, 1997; Magon et al.2018). The economic
dimension of sustainability is the ability to generate enough capital flow to ensure

23
Sensitivity: Internal
liquidity and produce a persistent return for the long-term (Vachon and Mao,
2008; Steurer and Konrad, 2009). Environmental sustainability is obtained if a company
consumes natural resources at an inferior pace than the natural regeneration and generates
limited waste and emissions (Vachon and Mao, 2008). Social sustainability is obtained
when the organisation actively supports the preservation and creation of skills as well as
the capabilities of current and future generations, promotes health and supports equal and
democratic treatments within and outside its borders (McKenzie, 2004).
Sustainable businesses aim to deliver balanced and integrated performances in the three
sustainability dimensions. According to Slack et al. (2013), sustainable business creates
an acceptable profit for its owners, but minimises the damage to the environment and
enhances the existence of the people with whom it has contact. In other words, it balances
economic, environmental and societal interests. This gives the organisation its ‘licence to
operate’ in society. Figure 4 illustrates some of the issues involved in the Triple Bottom
Line.
Figure 4 - Triple Bottom Line. Adapted from Elkington.(1997)
According to Gallotta (2016) and Hubbard (2009), some organisations have tackled the
challenge of measuring their TBL environmental performance by adopting internationally
recognised, industry certified environmental management systems (EMSs). These
systems help them develop, implement and communicate environmental policies, set
objectives and targets for reducing environmental impacts and monitor performance
against these targets. The leading EMS system, ISO (International Organisation for
Standardisation) 14001, certifies that an organisation has a particular type of EMS in
place; it signals the firm’s intention to manage its environmental impacts. However, it
does not say anything about how the system is performing (Bansal, 2002). In 1999, the
Economic
SocialEnvironmental

24
Sensitivity: Internal
ISO 14031 (performance measurement system) was introduced to complement ISO
14001, but there are still no internationally recognised benchmarks for acceptable levels
of performance (Dowell et al., 2000; Litten, 2005). Despite that, the social aspect of the
TBL does not have any official standard certification (the closest to that are the rankings
of ‘best employer’, ‘best company to work’ and so on).
2.3. Sustainability and Operations Management Sustainability has been receiving growing importance in the corporate environment in
recent years. Whether the motivation is the concern for society and the environment,
government regulation, stakeholder pressures, or economic profit, most managers
recognise the importance of developing sustainability strategies and activities (Epstein et
al., 2010). According to Gunasakaran et al. (2015), Sustainable Operations Management
(SOM) has started receiving attention from both operations management and
management science researchers. SOM includes topics such as green supply chain (e.g.,
Linton et al., 2007; Darnall et al., 2008), green manufacturing (e.g. Ma, et al., 2018),
circular economy (e.g. Kirchherr et al.2017), lean/green manufacturing (e.g. Mittal et
al.2017), green procurement (e.g., Seuring and Müller, 2008; Walker et al., 2009) and
reverse logistics (RL) (e.g., Dowlatshahi, 2005; Srivastava, 2008). SOM has a potentially
vital role to provide solutions for the complex sustainability challenges faced by many
organisations (Kleindorfer et al., 2005; White and Lee, 2009).
Bringing sustainability to the OM field, Kleindorfer et al. (2005) and Magon et al. (2018)
define sustainable OM as “the set of skills and concepts that allow a company to structure
and manage its business processes to obtain competitive returns on its capital assets
without sacrificing the legitimate needs of internal and external stakeholders and with due
regard for the impact of its operations on people and the environment.” According to Buil
et al. (2016), sustainability is “the transformation of an organisation's management model
towards the achievement of economic goals in a socially and environmentally responsible
manner”. Gunasekaran and Spalanzani (2012) argue, “Sustainability concepts should be
considered as operations strategies similar to agile manufacturing, lean production and
business process reengineering.
The Sustainability topic is important in the current business scenario once the potential
benefits to a company that implement sustainability projects include cost reduction,
process optimisation, innovation generation, lower consumption of natural resources,
brand enhancement and competitive advantage increases. According to Ambec & Lanoie

25
Sensitivity: Internal
(2008) Sustainability also enables greater innovation by encouraging learning and inquiry
among employees, offering access to alternative markets and opportunities to
differentiate products while reducing risk management and agency costs and providing
access to cheaper capital and improved labour costs. Both researchers and practitioners
recognise the importance of SOM as a key strategic component in the development of
cost-effective and sustainable global supply chains to meet the increasing needs of
customers in terms of flexibility, responsiveness and cost while safeguarding natural
resources for future generations
The last twenty years have seen growing pressure on businesses to pay attention to the
environmental and resource consequences of their products and processes (Kleindorfer et
al., 2005), which has resulted into the increase of Sustainable Operations Management
(SOM) research (Walker, 2014). In the 1990s, there was a focus on resource productivity,
and the need to reduce the consumption of resources and to use them more efficiently.
The underlying concern was that if we continue to consume resources at current rates, we
would need over three planets worth of resources (Weizsacker et al., 1997). An interest
in resource productivity was typified by the desire to be green and competitive, to make
a profit or gain a competitive advantage by improving environmental performance (Porter
and Van de Linde, 1995). Interest in environmental performance has continued, with a
focus on green products and processes, reducing waste and CO2 emissions, recycling and
reverse logistics or closed-loop supply chains.
Starik and Marcus (2000) state two common explanations of the emergence and study of
‘‘greening organisations’’ are: (1) this development was the evolving outcome of the
environmental and social movements that received considerable attention in the 1960s
and 1970s; and (2) the perception that organisational entities have or could have
significant impacts on their respective ecosystems became widely held, providing various
motivations for organisational change. One aspect of these overall themes is green supply
chain management issues and how organisations can maximise the potential of their
suppliers to adopt green supply chain management practices (Walker et al., 2008).
2.4 Adoption of Sustainable Initiatives Growing interest in sustainability has been found in both academia and industry (Linton
et al., 2007). According to Stoughton et al. (2012), there are two approaches to adopt
sustainability, (1) top-down approach and (2) catalytic approach.

26
Sensitivity: Internal
A top-down approach is a long-term approach in which leaders “build momentum for
change and promote coordinated movement on multiple fronts” (Mirvis and Manga,
2010). In this approach, leadership creates a precise definition of organisational
sustainability values, which is consistently communicated and reinforced throughout
the organisation.
In the catalytic approach, sustainability initiatives are introduced and implemented
by middle managers (Mirvis and Manga, 2010, Stoughton et al., 2012). These middle
managers often operate within different functional areas of the organisation and
develop their own values and beliefs towards sustainability based on their education
and enculturation into their subculture (Linnenluecke and Griffiths, 2010). As a result,
managers within a given subculture are expected to behave similarly to sustainability
opportunities and challenges, while managers in differing subcultures are expected
to behave differently.
According to Gallotta (2016), several authors have investigated the sustainability
implementation through different perspectives, such as Human aspect (Robinson et al.,
2006 and Vora, 2013); Sustainability Indexes/Reporting facet (Tan et al., 2010; and
Ahmed & Sundaram, 2012); Project Management side (Silvius & Nedeski, 2011; Silvius,
Schipper and Nedesky, 2012; Agyekum-Mensah et al., 2012); Operations aspect (Thies
et al., 2012; Uddin & Rahman, 2012; and Tan et al., 2008) and circular economy;
In this perspective, sustainability implementation can be considered the term to design
the adoption of any sustainability initiative, with direct or indirect effect. Examples of
Sustainability Implementation projects are: Replacing outdated equipment with new
energy-efficient ones; replacing outdated equipment with new water efficient ones;
virtualising IT data centre devices; among others. Similarly, to the concept of
sustainability, a few researchers considers the three aspects of the triple bottom line (such
as Silvius and Nedeski, 2011; Thies et al., 2012; and Sanchez 2014) while others only
consider only the environmental aspect (such as Uddin & Rahman et al.2012, Houy et
al.2012). The local and global external contexts significantly affect the choices a
corporation makes regarding the formulation and implementation of sustainability actions
and product characteristics. For example, manufacturing companies may focus more on
environmental and health issues, while service-oriented companies may emphasise the
social aspects of sustainability (Epstein et al., 2010). This can be justified since most
manufacturing companies have a more significant carbon impact when compared with
service-oriented organisations. More than that, regulations (such as ISO 14000 and ISO

27
Sensitivity: Internal
9000 family standards) have a higher impact on manufacturers when compared with
service-oriented organisations.
Human Aspect:
Concerning the Human aspect Robinson et al. (2006) consider the role of knowledge
management (KM) in promoting corporate sustainability in the construction industry
context. Vora (2013), on the other hand, makes a case for achieving business excellence
through sustainable change management. In this research work, the author breakdowns
change management into leadership, project management and talent management as
pillars and provide insights into how sustainable change is achieved to propel an entity
toward business excellence. Muja et al. (2014) presented a review of recent findings
relevant to sustainability and change management in order to develop a better
understanding of factors that may hinder corporate adoption of sustainability, the role of
sustainability in transformational change, and the change management challenges
involved in integrating sustainability within the corporate culture.
Sustainability Indexes/Reporting
Considering the Sustainability Indexes/Reporting aspect, Tan et al. (2010) implemented
a system to control and manage one warehouse in sustainability terms. The economic
indicators page provides the decision maker with more economic indicators to help
monitor and assess the situation. The three main social indicators consist of average
processing time/pallet, hours/person/month and job satisfaction. The main environmental
indicators page shows the number of trees that have been planted as well as the number
of trees ready to be sold, the carbon credits required to offset current cumulated emission
levels, the current vehicle emissions and minimum vehicle emissions. However, this
study was focused only in the warehouse scenario and evaluates only a few metrics of the
triple bottom line, revenue, income and expenses (Economic), average processing
time/pallet, hours/person/month and job satisfaction (Social) and Carbon Emission
(Environmental). Ahmed & Sundaram (2012), on the other hand, proposes and
implements a generic sustainable business transformation roadmap, which is supported
by a framework and architecture for integrated sustainability modelling and reporting.
This research proposes an SBT Roadmap as a procedural framework and a generic
domain-independent SMART framework and architecture as a technological
infrastructure for realising the SBT roadmap phases and steps.
Project Management

28
Sensitivity: Internal
Regarding the Project Management aspect, Silvius & Nedeski (2011) investigated the
implementation of Sustainability practices in on Information System (IS) Project. This
research studied one project to develop a Remote Application to control lighting, air
condition, entertainment equipment, and other electrical devices in the average home that
usually requires many separate remotes (and batteries). Silvius, Schipper and Nedesky
(2012) analysed 56 case studies on the integration of the concepts of sustainability in the
way organisations initiate, develop and manage projects. Agyekum-Mensah et al. (2012)
proposed a framework to achieve sustainability in the construction industry, covering the
whole lifecycle project, from the planning phase until the deconstruction phase. Silvius
& Schipper (2014) report a literature-based analysis of the coverage of the competencies
required for considering sustainability aspects, in the standards of project management
competencies. The study aims to specify the competence gap of project managers with
regards to sustainability and to provide guidance on how to close this gap.
Operations
Considering the Operations side, Rossi et al. (2013) explored the innovative strategies
undertaken by Logistics Service Providers (LSPs – companies which service portfolio
includes performing partially or entirely the logistics operations) in the eco-efficiency
arena and the logistics and learning capabilities needed to achieve eco-efficiency in
supply chains; Uddin & Rahman (2012), on the other hand, studied energy efficiency and
low carbon enabler green IT framework for data centres in IT departments. To perform
this work, the authors developed an implementation roadmap comprising five phases:
Planning Phase; Identification & Categorisation phase; Recycling, low carbon enabler
policy; Implementation Plan; and Analysis phase. Tan et al. (2008) studied sustainable
enterprise modelling and simulation in a warehousing context. The authors used a specific
modelling software tool (iThink 9.0.2, from iSee Systems) to model and simulate
processes and scenarios. The model analyses the triple bottom line perspectives (social,
economic and environmental).
Operations Management concerns the creation of the products and services and all
organisations produce some mixture of services and products, whether that organisation
is large or small, manufacturing or service, for profit or not for profit, public or private
(Slack et al., 2013). Operations Management (OM) also has an impact on the
sustainability perspective, according to Drake & Spinler (2013) at the micro-level, firms’
operational decisions determine the production and distribution technologies and system
design that they employ. These, in turn, determine how efficiently (and which) materials

29
Sensitivity: Internal
and energy are consumed as well as the type and intensity of waste injected into
ecosystems. Sustainable OM, therefore, potentially has an important role to play in
contributing to solutions for the sustainability challenges that we currently face.
Circular economy
The Circular Economy (CE) is not a new concept, but the term was first used in the
literature in the early nineties by Pearce and Turner (1990). Other authors, such as
Ormazabal et al. (2018), Park et al. (2010), Prieto-Sandoval et al. (2018), Geng et al.,
(2012), (Yuan et al., 2006), Velenturf et al. (2017) have also investigated the circular
economy concept. According to the Ellen MacArthur Foundation (2018), looking beyond
the current "take, make and dispose” extractive industrial model, the circular economy is
restorative and regenerative by design. It entails gradually decoupling economic activity
from the consumption of finite resources, and designing waste out of the system.
Underpinned by a transition to renewable energy sources, the circular model builds
economic, natural, and social capital.
Prieto-Sandoval et al. (2018) proposed that the CE can be understood through four
specific components:
• The recirculation of resources and energy, the minimization of resources demand,
and the recovery of value from waste.
• A multi-level approach due to its implementation at the micro (enterprises and
consumers) (Park et al., 2010), meso (economic agents integrated in symbiosis)
(Geng et al., 2012) and macro (city, regions and governments) levels (Yuan et al.,
2006).
• Its importance as a path to achieve sustainable development (Prieto-Sandoval et
al., 2017, Velenturf et al., 2017).
• Its close relationship with the way society innovates (Prieto-Sandoval et al.,
2018).
As well as creating new opportunities for growth, a more circular economy aims to
reduce waste, drive greater resource productivity (obtain the maximum value of the
resources), deliver competitive economy, and reduce the environmental impacts of
production and consumption of goods

30
Sensitivity: Internal
2.5 Companies need to implement sustainability initiatives in their Business
Processes According to Slack et al. (2013), whenever a business attempts to satisfy its customers’
needs it, will use many processes, both in its operations and its other functions and each
of these processes will contribute some part to fulfilling customer needs. Once the
organisation decides to reorganise its operations, each product is created from a starting
point passing through processes (which contains the necessary elements for the
production) to reach a final stage. This concept is called ‘end-to-end’ process, which
fulfils the customer needs. These end-to-end processes usually cut across conventional
organisational boundaries.
“Process” refers to the conversion of inputs (resources) into outputs (goods and services)
(Armistead et al., 1997). Although the literature provides numerous definitions for
“business processes”, all of these reflect, more or less, the same ontology, that a business
process is a series of continuous or intermittent cross-functional activities that are
naturally connected together with work flowing through these activities for a particular
outcome/purpose (Davenport and Short, 1990; Hammer and Champy, 1993; Davenport,
1993; Ould, 1995; Zairi, 1997; Slack et al., 2013, Harmon, 2010). What seems to make
the business process approach so distinct is that it not only focuses on activities, i.e. what
is done and/or how they are done, but it also places emphasis on how these activities are
interconnected and how workflows through these activities to produce efficient and
effective results (Bititci et al.2011).
According to Armistead et al. (1997), Operations should be viewed as one example of a
business process. The critical point is that transformed resources (such as materials and
information) originate from outside the boundaries of the organisation and that outputs in
the form of goods and services leave the boundaries of the organisation. It is this “end to
end” property which should be used to distinguish business processes. They start with
inputs to the business boundary and finish with outputs from the business boundary.
Nonetheless, several sustainability implementation initiatives focus in one specific
department of the organisation (IT sector in Uddin & Rahman (2012)’s study, warehouse
in Tan et al. (2008) and Tan et al. (2010) studies, Logistics in Rossi et al. (2013)’ study).
They, however, do not consider that those departments work along with other departments
into an end-to-end process (systemic view). According to Michael Porter (1985) model,
products pass through activities of a chain in order, and at each activity, the product gains

31
Sensitivity: Internal
some value. Similarly, we can consider that the “product” (in the case of a product based
industry) gains some ‘sustainability impact’ in each activity. Therefore, a more refined
analysis would consider the whole process interaction to evaluate the full status of the
sustainability implementation.
According to Houy et al. (2012) taking resource scarceness, increasing pollution and the
debate on global warming into consideration, more and more organisations recognise the
upcoming need to improve the sustainability of their business processes. The matter gains
increasing importance in the business context and drives organisations to put more effort
into enhancing resource efficiency and reducing the production of waste materials in the
context of their business activities. According to Thies et al. (2012), most large enterprises
regularly assess their emission inventories, set reduction targets, and report on their
improvements to various stakeholders (Seuring & Muller, 2008). However, leading
enterprises are even going beyond static sustainability reporting by incorporating
environmental and social activities into their core business processes. Organisations
increasingly realise the importance of sustainability, and many are trying to design or
redesign their business processes so that their activities are more environmentally friendly
(Klassen & Vachon, 2003). Such companies have in particular understood the value of
improving their processes to achieve environmental excellence; the same way they
collaborate with others to improve their supply chains with respect to time, quality,
flexibility, agility and total cost (Handfield, Sroufe, & Walton, 2005; Sharfman, Shaft, &
Anex, 2009).
2.6 Sustainability Implementation Problems Many organisations are committed to transforming their business processes and have
taken sustainability initiatives. However, they have still failed to achieve the anticipated
goal (Ahmed & Sundaram 2012). Every sustainability project involves changes in the
organisation, from the most basic ones (like replacing disposal plastic cups for individual
ceramic mugs) up to changes in the company operations. However, according to Burnes
(2003) between 40 and 70 percent of these change initiatives still fail. Those initiatives
fail due to many different reasons, either the lack of management support, lack of proper
communication, lack of stakeholder engagement, among others.
However, the reasons behind the initiatives’ failure might be in the challenges to
implement sustainability initiatives. Once an organisation does not overcome a particular
challenge, it might result in the failure of this initiative. A few authors (such as Epstein et

32
Sensitivity: Internal
al., 2010; Frandsen et al.2013, Seidel et al., 2012; and Giunipero et al., 2012) have
studied those barriers. According to Epstein et al. (2010), the challenges of implementing
sustainability initiatives are setting clear and measurable goals, dealing with financial
incentive pressures; and comprehending Stakeholder reactions. Seidel et al. (2012), on
the other hand, considers that the challenge arises on how sustainability considerations
(such as carbon footprint, renewable energy consumption, wastage production, and other
environmental performance indicators) can be considered in the management of an
organisation’s processes. Frandsen et al. (2013), proposes that the main challenge is
within embed sustainability into the organisation. According to Poveda et al. (2014), the
challenge lies in the sustainability indicators, specifically in selecting the right indicators,
identifying the measurement method and aligning them to the goals and objectives of the
project. To Giunipero et al. (2012) the main barriers to the sustainability adoption are (1)
lack of consensus at the CEO level; (2) costs of sustainability and economic conditions;
(3) lack of sustainability standards (covering all the three aspects from the Triple Bottom
Line) and appropriate regulations; and (4) misalignment of short term and long term
strategic goals.
Ahmed & Sundaram (2012) go even beyond the presented challenges, according to the
authors existing roadmaps, frameworks and systems do not comprehensively support a
sustainable business transformation nor do they allow decision makers to explore
interrelationships and influences between the sustainability dimensions. However,
because the sustainability concept continues to be applied unsystematically, these
practising organisations experience considerable difficulties in realising their goals of full
sustainability status. This is due to a lack of understanding and support for the design,
development and implementation process, and lack of proper procedural and
technological support for decision making for sustainability management.
Stewart et al. (2016) categorises the barriers in (1) internal barriers, such as financial and
other resource constraints, managerial and employee attitudes, poor communication and
past practices and (2) external barriers, such as capital costs, competitive pressures,
industry regulation, technical information, green market opportunities and technical
solutions. Table 2 represents the summary of some challenges found in the literature to
implement sustainability initiatives.
Table 2 - Summary of some challenges found in the literature to implement sustainability

33
Sensitivity: Internal
initiatives
References Challenges
Epstein et al. (2010) Setting clear and measurable goals
Dealing with financial incentive pressures
Comprehending Stakeholder reactions
Seidel et al. (2012) How to consider sustainability aspects in the
management of an organisation’s processes
Giunipero et al. (2012) Lack of consensus at the CEO level
Costs of sustainability and economic conditions;
Lack of sustainability standards and appropriate
regulations
Misalignment of short term and long term strategic
goals.
Ahmed & Sundaram (2012) Existing roadmaps, frameworks and systems do not
comprehensively support sustainable business
transformation
Existing systems do not allow decision makers to
explore interrelationships and influences between the
sustainability dimensions
Sustainability concept continues to be applied
unsystematically
Poveda et al. (2014) Select the right sustainability Indicators
Define the proper measurement method
Align indicators to goals and objectives
Frandsen et al. (2013) How to embed sustainability to the organisation.
Stewart et al. (2016) The barriers are categorised in (1) internal, such as
financial and other resource constraints, managerial and
employee attitudes, poor communication and past
practices and (2) external, such as capital costs,
competitive pressures, industry regulation, technical
information, green market opportunities and technical
solutions.

34
Sensitivity: Internal
2.7 Chapter Summary and conclusions The sustainability concept is quite recent and has several meanings. However, the most
common, presented in the Brundtland Commission’s Report, defines sustainability as the
development that meets the needs of the present without compromising the ability of
future generations to meet their own needs’. Sustainability integrated into operations
management provides benefits to the organisations since it provides new opportunities to
grow, develop new business practices, and drive innovation while being ecologically,
socially and economically correct.
Organisations’ motivation to adopt sustainability practices can be related to compliance,
customer requirements, economic profit, among others. Sustainability implementations
can be studied from different angles (such as regarding the Project Management aspect,
the Human aspect, the Operations aspect) and there are still problems and challenges
associated with these implementations. Some challenges found in the literature consists
in defining measurable goals, selecting the right sustainability Indicators, considering
sustainability aspects in the management of an organisation’s processes. Therefore, any
sustainability initiative must comprehend those challenges and provide a solution that
could overcome them. More than the challenges and barriers to implementing
sustainability initiatives, several approaches focus on one specific department of the
organisation. They, however, do not consider that those departments work along with
other departments into an end-to-end process (systemic view). Therefore, a more refined
analysis would consider the whole process interaction to evaluate the full status of the
sustainability implementation.

35
Sensitivity: Internal
Chapter 3 – Literature Review on Business Process Management
3.1. Introduction Chapter 2 outlined that a more refined analysis needs to consider the whole process
interaction to evaluate the full status of the sustainability implementation and Business
Process Management (BPM) emerges as a right approach. This chapter presents the
Business Process Management (BPM) approach. It starts showing the evolution of
concepts that lead to the development of the methodology, ever since Adam Smith’s
division of labour, passing to the Toyota Production System, Lean Manufacturing, Total
Quality Management approach, Six Sigma, Business Process Reengineering, and finally
the Business Process Management. It goes deep in the concepts of BPM showing the
benefits, success factors and the typical implementation phases. Finally, the chapter
brings the relation between Business Process Management and the sustainability topic. It
starts by reviewing the sustainability role in the current corporate environment and
provides arguments to corroborate that BPM can be used as a tool to enable the
implementation of Sustainability Initiatives in the organisation processes.
3.2. Process Management Origin and Evolution Business Process Management (BPM) may be a new label, although the ideas leading to
business process management are old. The process management concept started in the
Scientific Management era; the concept was followed by the Toyota Production System;
Lean Manufacturing; Total Quality Management; Six Sigma; Business Process
Reengineering; and, finally, Business Process Management. According to Smith & Fingar
(2003), the Process Management concept can be divided into four phases: industrial age;
Process Improvement; Process Reengineering; and Business Process Management. The
BPM timeline in Table 3 presents the three waves of process evolution since industrial
revolution concept (Gallotta, 2016). The timeline illustrates that the shaping of BPM into
its present state is the result of significant business drivers, business tools, organisation
development methodologies, key technological developments, technology and
measurement tools, standards, and related controls (Lusk et al., 2005). Table 3 - Three Waves of Process Evolution. Adapted from .Lusk et al. (2005)
Phase Time Focus Business Technology ToolsEnablers
Industrial
Age
Specialisation
of Labour
Functional
Hierarchies Mechanisation
Scientific
Management

36
Sensitivity: Internal
1750
-
1960s
Task
Productivity
Command &
control
Standardisatio
n
PDCA
improvement
Cycle
Cost
Reduction Assembly line
Record-
keeping
Financial
modelling
Information Age
1st wave -
process
improvement
1970s
-
1980s
Quality
management
Multi-industry
enterprises
Computerized
automation TQM
Continuous
flow
Line of
business
organisation
Management
systems
Statistical
Process
Control
Task efficiency
Mergers &
acquisitions MRP
Process
improvement
methods
2nd wave -
Process
reengineerin
g
1990s
Process
Innovation
Flat
organisation
Enterprise
architecture
Activity-based
costing
Best practices
End-to-end
processes ERP Six Sigma
Better, faster,
cheaper
value
propositions -
speed to
market,
customer
intimacy,
operational
excellence CRM Buy vs build
Business via
internet
Supply Chain
Management
Process
redesign/
reengineering
methods
3rd wave -
Business
2000
+
Assessment,
adaptability &
agility
Networked
organisation
Enterprise
application
integration
Balanced
scorecard

37
Sensitivity: Internal
Process
Management 24X7 global
business
Hyper
competition
Service
Oriented
Architecture
Self-service &
Personalisatio
n
Continual
transformatio
n
Market
growth driven
Outsourcing,
co-sourcing,
in-sourcing
Process
Effectiveness
over resource
efficiency BPM methods
Organisationa
l efficiency
over
operational
efficiency
3.2.1. Scientific Management
According to Snabe et al. (2008), the foundation for process management can be traced
back to Adam Smith, who wrote the groundbreaking book: “An Inquiry into the Nature
and Causes of the Wealth of Nations (1776)”. While at its core Smith's book focused
on answering the question “Why are some nations rich and others poor?” his ideas
and conclusions have broad applicability and are especially relevant to contemporary
management. Adam Smith was the first to realise that specialisation and the division
of labour were the primary sources of productivity, and he was the first to
conceptualize the “invisible hand principle” demonstrating the tendency for self-
interested individuals to be guided towards undertaking activities valued by the
whole of society in a free market system governed by the rule of law and market
prices. (Crowley et al., 2010).
The next stage in the evolution is the scientific management movement, initiated by
Frederick Winslow Taylor at the end of the XIX century. Taylor’s work titled “The
Principles of Scientific Management” brought a revolution in shaping the early twentieth-
century factory system (Jaffee, 2001). In this book, he formalised the replacement of the
rule of thumb for scientific methods. Taylor focuses his argument on the work efficiency,
which involved making the tasks most intelligently with the most effort economy (Taylor,
38
Sensitivity: Internal
1911). According to Uddin et al. 2015), Taylor through his scientific analysis of finding
inefficiency in traditional organised businesses established the point that, each motion of
work should be executed under maximum capacity of workers with a predetermined
method of work under specific training format, ensuring high profit and resulting good
worker manager relationship (Caldari, 2007). Taylor thus introduced a clear vision for the
division of labour depending on responsibilities and rank and introduced science in the
labour selection process in organisation management. (Uddin et al. 2015).
The final stage in the evolution of the scientific management movement was initiated by
Ford's mass production factory, which represented a revolution in the sense that the
application of these principles significantly improved productivity by organising
manufacturing processes differently (Snabe et al., 2008). Ford adopted the principles of
Scientific Management from 1908 to 1914, resulting in promoting Ford and his modified
methodology of Fordism internationally (Waddell, et al.2013).
In the scientific field, the methods and mathematical tools were used to organise and
manage processes. According to Slack et al. (2013), the vital thing to remember about
scientific management is that it is not particularly ‘scientific’ as such, although it certainly
does take an ‘investigative’ approach to improve operations. Perhaps a better term for it
would be ‘systematic management’. During this period, two fields of study had a
significant role: the method study and the work measurement (Gallotta, 2016).
3.2.2. Toyota Production System
The next industrial engineering paradigm was the Toyota Production System. According
to Ohno (1988), the initial step of the Toyota Production System is to identify waste.
According to the author the waste can be classified into: waste of overproduction; waste
of time on hand (waiting time); waste of transportation; waste of processing; waste of
inventory; waste of movement; and waste of making defective products (Gallotta, 2016).
The next issue Ohno addressed was Supply. Probably the most critical and essential
aspect of the Toyota production system is the just-in-time production concept. Just-in-
time production is exactly what it says, production of a part, component or subassembly
must occur just in time, not any earlier nor any later, reducing in-process inventory and
inventory produced by parts or component suppliers to a considerable and significant
extent (Pegels 1984).
In manufacturing, just-in-time means that a later process gets only what it needs from an
earlier process. The earlier process immediately produces what was required with no
delays. To improve the process flow, Ohno (1988) decided that instead of putting the

39
Sensitivity: Internal
machines of one process together and having to carry parts between processes, he would
design the plant layout according to the operation flow. This system increased production
efficiency by two to three times over "one operator, one process", which mass production
required (Gallotta, 2016).
3.2.3. Lean Manufacturing
Following the evolution of the concepts of Toyota Production System, there is the rising
of the Lean Manufacturing approach, which is an integrated socio-technical system whose
main objective is to eliminate waste by concurrently reducing or minimising supplier,
customer, and internal variability (Shah and Ward, 2007). While just-in-time
manufacturing is focused on efficiency, lean manufacturing is focused on using efficiency
to add value for the customer. The main practices that support lean manufacturing
objectives are continuous flow; Just in Time; Reduction in setup time; Total production
maintenance (TPM); Employee involvement; Continuous improvement; and Supplier
development (Shah and Ward, 2003, 2007; Bhasin and Burcher, 2006; Pettersen, 2009;
Agus and Hajinoor, 2012; Gallotta, 2016). According to Krajevski et al. (2012), the goals
of a lean system are to eliminate the waste (MUDA), produce services and products only
as needed, and to continuously improve the value-added benefits of operations. The eight
type of wastes are: overproduction, inappropriate processing, waiting, transportation,
motion, inventory, defects and underutilization of employees.
In recent years, lean practices have been linked to green practices by several authors (eg.
Cruz-Machado & Leitner, Zhu et al., 2008, Duarte & Machado, 2017). According to
Duarte & Machado (2017), the lean management paradigm involves continuous
improvement in quality, productivity and time by reducing cost and waste across all
operations (Cruz-Machado & Leitner, 2010) and the green paradigm is intended to reduce
environmental risks and negative environmental impacts while improving the ecological
efficiency and eliminating environmental waste in organisations (Zhu et al., 2008).
Therefore, it is possible to conclude that both paradigms aims to reduce the waste across
the operations and, consequently, to the organisations. The Environmental Protection
Agency (EPA, 2009) mentions that green and lean professionals often operate in parallel
universes, using different languages and involving different people, despite having
similar goals and using some similar tools (EPA, 2009). Their strategies focus on waste
reduction, efficient use of resources and customer value (Carvalho et al., 2011).
Several authors have related lean and green subjects to manufacturing processes
(Pampanelli et al., 2014, Kurdve et al., 2014, Jabbour et al. 2013, Chiarini, 2014, Verrier

40
Sensitivity: Internal
et al., 2016). Jabbour et al. (2013) found evidence that Lean management has a positive
impact on environmental management, which itself has a positive impact on operational
performance and Chiarini (2014) underlines interesting links between specific basic lean
tools and their consequences on environmental performance. However, according to
Verrier et al. (2016), only few studies proposed Lean and Green models but most
confirmed the ability of a joint Lean and Green philosophy to reduce the usage of
resources and increase cost benefits.
3.2.4. Total Quality Management
The next step in the process management concept is the Total Quality Management
(TQM). According to Fotopoulos & Psomas (2009), making the step towards TQM was
much more difficult as there was widespread confusion about the components of TQM
and how they could be implemented. They argue that Deming's 14 points and cycle (plan,
do, check, act - PDCA), Juran's quality trilogy (planning, control and improvement),
Crosby's absolutes of quality management (conformance to requirements, prevention,
zero defects and cost of quality), Garvin's quality dimensions, Ishikawa's cause and effect
diagram, Feigenbaum's three steps to quality (quality leadership, modern quality
technology and organisational commitment) and Taguchi's advice to companies to turn
to statistical process control and design of experiments constitute the most critical aspects
of the TQM framework that quality gurus have recommended (Gallotta, 2016). Deming
confirmed that improving product quality should not be dependent on mass inspection.
Quality comes not from inspection, but from the improvement of the production process
(Deming, 1986).
For Ahire et al. (1996), TQM works on the belief that the overall quality of products can
be enhanced by improving the quality of the processes directly or indirectly related to
them. Dale (2003), on the other hand, mentioned that, according to TQM approach, the
achievement of the highest level of quality involves the application of quality
management principles to all aspects of the organisation, including customers and their
integration with the key business process (Gallotta, 2016).
3.2.5. Six Sigma
TQM led to another approach called Six Sigma. Six Sigma is a series of practices
developed by Motorola at the 1980s. According to Linderman et al. (2003), Six Sigma is
“an organised and systematic method for strategic process improvement and new product
and service development that relies on statistical methods and the scientific method to
41
Sensitivity: Internal
make dramatic reductions in customer-defined defect rates”. It uses an improvement
procedure generally known under the acronym DMAIC (Define, Measure, Analyse,
Improve and Control) de Mast et al. (2012). DMAIC is similar in function to its
predecessors in manufacturing problem solving, such as Plan-Do-Check-Act and the
Seven-Step method of Juran and Gryna (Balakrishnan et al., 1995).
3.2.6. Business Process Reengineering (BPR)
At the beginning of the 1990s, it was developed the concept of Business Process
Reengineering (BPR). According to Radhakrishnan & Balasubramanian (2008), Business
Process Reengineering (BPR) is the redesigning of business processes, associated
systems and organisational structures to achieve substantial improvements in business
performance. The business reasons for making such changes could include poor financial
performance, external competition, market share loss, or emerging market opportunities.
BPR is the examination and change of the following business components: strategy;
processes; technology; organisation; and culture. Successful BPR implementation can
result in cost reductions or cycle time reduction. It can also potentially create substantial
improvements in quality, customer service, and other parameters of business
performance. According to Hammer and Champy (1993), BPR is the “fundamental
rethinking and radical redesign of business processes to achieve dramatic improvements
in critical, contemporary measures of performance, such as cost, quality, service and
speed” (Gallotta, 2016).
According to Hammer (1993), the principles of reengineering process are: 1. Organise
around outcomes, not tasks; 2. Have those who use the output of the process perform the
process; 3. Subsume information processing work into the real work that produces the
information; 4. Treat geographically dispersed resources as though they were centralised;
5. Link parallel activities instead of integrating their results; 6. Put the decision point
where the work is performed, and build control into the process; 7. Capture information
once and at the source.
Radhakrishnan & Balasubramanian (2008) justifies that BPR is fundamental because in
reengineering business people need to ask questions such as: ‘why do we do what we do?’
and ‘why do we do it the way we do?’ Asking these fundamental question forces the
organisation to look at the unspoken rules and assumptions that underline the way they
conduct their business and find opportunities for change. It is radical because the radical
redesign implies in getting to the root of things (not a superficial assessment); radical
redesign means disregarding all existing structures and procedures, and inventing

42
Sensitivity: Internal
completely new ways to accomplish work, reengineering is about business re-invention
(not necessarily b business improvement). It is dramatic because Reengineering is not
about making incremental improvements, but about achieving quantum leaps in
performance (significant changes). Moreover, it relates to processes because processes
define how an organisation can develop a new product, how it can perform in a better
way, how can the organisation do the same work at a lower cost and, mainly, why does
the company do what it does at all (Gallotta, 2016).
According to Hammer and Champy (2004), the seven principles for Business Process
Reengineering are: Organising around results and outcomes (not tasks); Having those
who use the output of the process perform the process; Subsuming information-
processing work into real work that produces the information; Treating geographically
dispersed resources as though they were centralised; Linking parallel activities instead of
integrating their results; Putting the decision point where the work is performed, and build
control into the process; and capturing information once and at the source (Gallotta,
2016).
3.3. Defining Business Process Management (BPM) BPM has evolved as a holistic management practice for managing and transforming
organisational operations (Hammer, 2010). BPM is built on several management
approaches, embracing aspects of the total quality management (TQM) approach from
the 1980s and the business process re-engineering (BPR) approach from the 1990s
(Rosemann et al.2010).
BPM can be defined as a paradigm that includes methods, techniques, and tools to support
the design, enactment, management and analysis of operational business processes
(Meidan et al. 2017). According to Hill et al. (2007): “BPM refers to a set of management
disciplines that accelerate effective business process improvement by blending
incremental and transformative methods. BPM’s management practices provide for
governance of a business process environment toward the goal of improving agility and
operational performance. BPM is a structured approach that employs methods, policies,
metrics, management practices and software tools to manage and continuously optimise
an organisation’s activities and processes”.
Business Process Management (BPM) has gained importance over the last decades and
many organisations today focus their attention on identifying and documenting business
processes, defining key performance indicators (KPIs) for measuring and monitoring

43
Sensitivity: Internal
process performance, and implementing means for continuous process improvement and
innovation (vom brocke, Gartner, 2013; Rosemann, 2014; vom Brocke & Rosemann,
2015; Zairi, 1997). It provides adequate techniques for the design, execution, controlling
as well as the analysis of business processes in order to improve value creation within
single organisations as well as in inter-organisational value networks (van der Aalst, ter
Hofstede, & Weske, 2003). According to Seidel et al. (2012) in their efforts to manage
and improve business processes, BPM enables business benefits concerning costs,
flexibility, time savings, quality, or, indeed, sustainable practices (Gallotta, 2016).
According to Jeston & Nelis (2006), historically, process literature has suggested that
there are three critical aspects to a process improvement project: process, people, and
technology. The BPM approach considers those three aspects comprehensively since
process design needs to be linked to the company strategy and aiming to reach the process
objectives; people are key to implement the proposed processes, they are the agents of
change; and technology means the tools that support processes and people, not necessarily
means a BPM software or application (even though it could be) (Gallotta, 2016).
The BPM discipline calls for organisations to see themselves as a collection of highly
integrated processes instead of a mere set of functions and departments (McCormack and
Johnson, 2001). BPM, therefore, is a comprehensive management approach to align
business processes with corporate strategy, to analyse, optimise and implement best-in-
class processes.
3.3.1. BPM Benefits
Rudden (2007) identified that the organisation that incorporates successfully the BPM
philosophy gains benefits in terms of Efficiency; Effectiveness; and Agility.
Efficiency usually is the first benefit to be observed by an organisation that deploys a
BPM initiative. According to the author, most processes have significant waste because
of manual effort, poor hand-offs between departments and a general inability to monitor
overall progress. The initial deployment of a BPM solution eliminates these problems and
the benefit is typically expressed in full-time equivalent time saved. The efficiency can
also be identified in the elimination of manual data entry, reduction of process cycle time
and reduction of manual analysis. BPM tools may be pressed into roles beyond providing
do-more-with-less efficiency. BPM tools offer the potential for greater business agility,
as workflow apps can be quickly rolled out and modified to deal with shifting business
trends or changes in the regulatory environment. Besides, some customers are looking to
deploy BPM to improve customer-facing processes as well as back-office tasks.
44
Sensitivity: Internal
Once an organisation has realised the necessary efficiencies that a more controlled
process brings, they will often focus on making the process more effective. The returns
are typically expressed in the context of making better decisions. One telecommunication
service provider found that by better controlling their billing disputes process they were
able to reduce by $3 million the amount they were paying out each quarter (approximately
10%). Their BPM deployment helped them identify duplicate issues, research disputes
more throughly, and enforce more consistent payout policies. The effectiveness can also
be identified in handling exceptions faster and better and in making a more consistent
execution of tasks.
According to Rudden (2007), the third key benefit that BPM provides is agility. In the
world of Process Management, the ability to change quickly is essential. The driver for
change can be internal or external, new opportunities can arise, customers may change
their demands. BPM provides a platform to change the organisation processes in a faster
and controlled way. The agility can be identified in faster regulatory compliance and in
supporting new business models.
Other authors (such as Jeston & Nelis, 2008; Scheer, 2006; Snabe et al., 2008) identify
other benefits obtained from BPM implementations, such as enablement of continuous
process improvement; improvement of process quality; cost reduction; increase in the
customer satisfaction; and better control over process performance.
According to (Škrinjar & Trkman 2013), BPM is an approach for increasing Business
Process Orientation (BPO), improving the process maturity level and leading to better
performance. Figure 5 represents the BPM contribution.

45
Sensitivity: Internal
Figure 5 Source Škrinjar & Trkman (2013) - content removed for copyright reasons
Ittner & Larcker (1997) highlight that some BPM practices and techniques improve
profitability, while others have little effect on financial performance.
3.3.2. BPM Success Factors
According to Jeston & Nelis (2008), BPM projects are usually complex. This type of
project has the potential to cross departments and, increasingly, organisation boundaries,
as clients, vendors and partners become more involved. It will involve many diverse and
complex stakeholder relationships both inside and outside the organisation. According to
the authors, this type of initiatives has the following success factors: Leadership; Project
Management alignment; Linkage to organisation strategy; Structured approach to
implement BPM initiatives; People change management; People and empowerment; and
Value Realisation (Gallotta, 2016).
Today, it is observed more and more organisations considering BPM in various business
contexts (Harmon & Wolf, 2014), although it is also observed more and more
organisations reporting on project failure. Thus, much research has been conducted to
examine success factors for BPM in general (Ravesteyn & Batenburg, 2010; Trkman,
2010) and how these factors influence the different stages of BPM adoption (Buh,
Kovačič, & Indihar Štemberger, 2015). According to Benner & Tushman (2003) one
reason for the frequency of BPM project failure is the lack of knowledge about how to
sufficiently address the different contexts in which BPM is applied; or, in other words,

46
Sensitivity: Internal
BPM approaches, methods and models are not sensitive enough to diverse business
contexts (Brocke et al. 2016)
3.4. Business Process Management (BPM) Phases The literature provides numerous approaches to implement Business Process
Management concepts in an organisation. Morais et al. (2014) compared thirty-one (31)
different models to implement BPM projects with the model proposed by ABPMP
(Association of Business Process Management Professionals). Scheer (2006), for
instance, proposed a four steps implementation roadmap (Strategy, Design,
Implementation, and Controlling presented in Figure 6); Netjes et al. (2006), on the other
hand, proposed a five phases implementation steps (design, configuration, execution,
control, and diagnosis, providing – Figure 7) and Houy et al. (2010) proposed a cycle
perspective of BPM with six phases (Strategy development, definition and modelling,
implementation, execution, monitoring and control, optimisation and improvement –
presented in Figure 8).
Figure 6 - BPM implementation. Adapted from Scheer, (2006) - content removed for
copyright reasons
47
Sensitivity: Internal
Figure 7 - BPM implementation. Netjes et al. (2006) - content removed for copyright
reasons
Figure 8 - BPM implementation cycle. Houy et al., 2010) - content removed for
copyright reasons
According to ABPMP (2009), the management practice of BPM may be characterised as
a continuous lifecycle of integrated BPM activities. While several variations of BPM
lifecycles are recognised, most lifecycles can be summarised by an iterative, phased set
of activities including: (1) Planning; (2) Analysis; (3) Design and Modelling; (4)
Implementation; (5) Monitoring and Control; and (6) Refinement (Gallotta, 2016). As
business processes move through the lifecycle, they are enabled or constrained by a
variety of factors including the four primary factors of Leadership, Values, Culture and
Beliefs.

48
Sensitivity: Internal
Figure 9 shows the model of the BPM lifecycle proposed by ABPMP (2009). In the cycle,
the analysis step adds activities aimed at aligning business objectives with their processes,
whether to establish them or update them, and based on the scope, techniques are applied
to map the business context through interviews, documental analysis, simulations or other
instruments of prospection. The design of business processes involves the creation of new
specifications for them, their activities and tasks, rules and definitions for exchanging
information among functional groups (handoffs), physical design and IT infrastructure.
Management during implementation should be viewed as an “orchestration” activity and
it involves training, metric policies and performance evaluation, strategic alignment
evaluation and risk analysis and monitoring. The monitoring and control of processes deal
with adjustments of resources to ensure process objectives through performance
measurements and evaluation. The refining step is associated with organisational change,
continuous improvement and optimisation activities in search of the efficiency and
effectiveness of processes implemented in the organisation.
Figure 9 - BPM Lifecycle - ABPMP (2009) - content removed for copyright reasons
Morais et al. (2014) study indicates a moderate convergence of Business Process
Management (BPM) models in literature with the ABPMP reference model,
essentially in the models’ intermediate steps: for the analysis, design and modelling,
implementation and monitoring and control phases, the activities of studied models
were mapped to the ABPMP (2009) BPM lifecycle, so that each step of the studied

49
Sensitivity: Internal
models corresponds to two or more steps of the ABPMP model or various steps of a
studied model correspond to a step of the reference model.
As it was discussed in chapter 2, the sustainability implementation success is directly
related to the alignment of the strategy and business processes in an explicit manner. This
way, it was proposed a four phases framework (Analyse, Design; Implement; and Monitor
& Control), in which the Analyse phase has broken down the elements from the “process
planning & strategy” into the identification of business scenario, determination and
prioritisation of processes, identification of project stakeholders, definition of project
objectives, definition of metrics, record enterprise map, record baseline values and
sustainability maturity assessment. The four phases framework also can be related to
Deming’s PDCA cycle, which might facilitate the implementation of the sustainability
initiatives.
3.4.1. Analyse
The ‘Analyse’ phase is critical to evaluate the strategy, business environment and
processes identifying business goals and defining requirements. This phase provides
structure and direction for continued customer-centric process management. It lays a
foundation for a holistic BPM approach to ensure the alignment with organisational
strategy and the integration of strategy, people, processes, and systems across functional
boundaries. This phase sets the strategy and direction for the BPM process. It also
identifies appropriate BPM organisational roles and responsibilities, executive
sponsorship, goals, and expected performances measures and methodologies. (ABPMP,
2009). After this phase, the project should have the current process design (as-is
situation), the concrete process goals and the initial process ownership definition
(Gallotta, 2016).
3.4.2. Design
In the ‘Design’ phase there is the designing of potential process alternative; identification
of potential changes in the current design; modelling the process alternatives, mapping
the proposed alternatives (to-be) to existing systems/applications; and defining the
implementation strategy. According to ABPMP (2009) Process design activities focus on
the design of how end-to-end work occurs to deliver value to customers. The sequence of
activities, including the design of what work is performed, at what time, in what location,
by what process actors using what methodology is documented. Design defines what the
organisation wants the process to be and answers the what, when, where, who and how

50
Sensitivity: Internal
questions of how end-to-end work is executed. An essential component of the design is
also ensuring that the proper management controls and metrics are in place for compliance
and performance measurement. In an iterative BPM lifecycle, first designing activities
may look at standardising or automating current ad hoc activities, while more mature
design activities may look at redesign or radically reminding a process, or incremental
improvements designed for optimisation. After this phase, the project should have the
project scope; the expected process designs (to-be situation), and the implementation plan
(Gallotta, 2016).
3.4.3. Implement
According to ABPMP (2009), process transformation implements the output of the
iterative analysis and design cycle. It addresses organisational change management
challenges and is aimed at continuous improvement and process optimisation. In this
context, “optimised processes” are those that consistently achieve predefined goals in
terms of both efficiency and effectiveness. During the ‘Implement’ phase there is the
process transformation (following up activities, monitoring the realisation progress,
performing roll-out & change management activities and designing a support concept);
and the process execution (solution go-live) (Gallotta, 2016).
3.4.4. Monitor & Control
Finally, in the ‘Monitor & Control’ phase, there is the measurement of the project
performance. Measurement of the process performance; and the analysis of the results.
According to ABPMP (2009), continuous measuring and monitoring of business
processes provide the information necessary for process managers to adjust resources to
meet process objectives. In the context of the BPM lifecycle, measuring and monitoring
also provides critical process performance information through key measurements related
to goals and value to the organisation. The analysis of process performance information
may result in improvement, redesign or reengineering activities (Gallotta, 2016).
3.5. Relating Business Process Management (BPM) and Sustainability According to vom Brocke et al. (2012), business process management to date has not
explicitly focused on sustainability as a change objective or driver. Although, approaches
relating BPM and Sustainability already exist, e.g. (Ghose et al.2009; Hoesch-Klohe et
al. 2010; Houy et al.2012; Seidel et al.2012. According to Opitz et al. (2014), green BPM
is the sum of all management activities that help to monitor and reduce the environmental
impact of business processes in their design, improvement, implementation, or operation

51
Sensitivity: Internal
stages, as well as lead to cultural change within the process lifecycle. The intention behind
Green BPM is the incorporation of environmental objectives into the management of
business processes. To achieve this objective, BPM has to be extended by ecologically
oriented complements, as are the consideration of environmental strategy as a part of the
process strategy, or the awareness for energy consumption and pollution (Houy et
al.2012)).
According to Levina (2015) the majority of the sustainability initiatives focus on reducing
the general resource usage (such as electricity), cost savings was the second exclusive
goal mentioned by the enterprises, implying that the environmental benefits that result
from the accordant activities are considered as a by-product of lean or optimisation
actions rather than the goal itself, while providing a unique proposition to gain customers
and market share. Process management techniques, especially techniques for process
optimisation, are also shown to result in environmental benefits, i.e. resource usage or
waste reduction, without being explicitly focused on designing green processes. As
various industries are present in the study sample, indications about favoured managing
techniques for green initiatives among the industries can deviate. It was observed that
manufacturing companies tend to adopt lean and sustainable benefits but also that service-
oriented enterprises financially and environmentally benefit from conscious resource
usage by applying and adopting the same techniques. According to Houy et al. (2012)
Green BPM methods are still in the early stages and so far, only a few approaches exist.
Seidel et al. (2012), for example, created a framework for Green BPM Research and
Practice by building on a model of BPM capabilities (de Bruin & Rosemann, 2007;
Rosemann & vom Brocke, 2010) (presented in Figure 10). Essentially, the model
describes a set of six capability areas that are key to the management of business processes
in an organisation: Strategic Alignment is the continual tight linkage of business process
management to organisational priorities and processes, enabling achievement of business
goals; Governance establishes relevant and transparent accountability and decision-
making processes to align rewards and guide actions in business process management;
Methods are the approaches and techniques that support and enable consistent business
process management actions and outcomes; Information Technology is the software,
hardware, and information management systems that enable and support business process
management activities; People are the individuals and groups who continually enhance
and apply their business process management-related expertise and knowledge; and

52
Sensitivity: Internal
Culture is the collective values and beliefs that shape business process management-
related attitudes and behaviours (Gallotta, 2016).
Figure 10 - The BPM capability areas and underlying factors (de Bruin & Rosemann,
2007) - content removed for copyright reasons
Reiter, Fettke, and Loos (2014) introduce a combined approach of IT and BPM for
efficient energy use in a process. The authors used a three-layer view that aims to
introduce an integrated view of business processes, their related applications and the
corresponding IT components. Later on, they evaluated the energy consumption from the
sample business process. Figures 11 and 12 represents the sample business process and
related energy consumption.

53
Sensitivity: Internal
Figure 11 Sample business process and related local applications. Source Reiter, Fettke,
and Loos (2014) - content removed for copyright reasons
Figure 12 Energy consumption of the sample business process. Source Reiter, Fettke, and
Loos (2014

54
Sensitivity: Internal
Recker et al. (2011), in turn, created a notation for the documentation of carbon footprint
information in a process model. Then, they applied the modelling approach to a real-
world company and started measuring carbon footprints of the business processes.
However, this research only focused in one particular stage of the business process
lifecycle (actually two distinct, considering the case studies), more than that the study
only focused in selected emission drivers and emission sources, it was only assessing
Carbon footprint, not the whole sustainability status (Gallotta, 2016). Figure 13 shows
the notation and Figure 14 the application of the notation in the business processes.
Figure 13 - Notation extensions. Recker et al. (2011) - content removed for copyright
reasons

55
Sensitivity: Internal
Figure 14 - E.g. of a BPMN model using the sustainability notation. Recker et al. (2012)-
content removed for copyright reasons
Houy et al. (2012), on the other hand, assessed and demonstrated both organisational and
technological opportunities and challenges of Green BPM for the improvement of the
sustainability of business activities. According to the authors in Green BPM every
business activity in a process model can be annotated with an adequate ratio representing
the consumption of resources and the production of waste materials. By accumulating the
annotated values, the total consumption of needed resources or the total production of
waste materials in a process can be measured and controlled. This method facilitates an
optimised organisation of activities in a process and the controlling of the ecological
impact of its execution. To investigate the organisational as well as technological
opportunities of Green BPM (Gallotta, 2016). Figure 15 shows one sales process
represented by an Event-driven Process Chain (EPC) with the respective resource
consumption

56
Sensitivity: Internal
Figure 15 - E.g. of a process at the activity level using EPC notation with the
sustainability rations per activity. Houy et al. (2012) - content removed for copyright
reasons
According to Houy et al. (2012) future research should further develop concepts for Green
BPM; e.g. in the form of green reference process models or procedure models for the
implementation of green processes. Furthermore, adequate techniques and tools for the
realisation of Green BPM potentials in inter-organisational scenarios throughout the
whole business process lifecycle can considerably contribute to more sustainable business
activities.
Therefore, this research aims to provide a full lifecycle solution for improvement of
business processes into sustainability business processes by Analysing, Designing,
Implementing and Monitoring & Controlling current (or eventual new) processes in one
organisation to transform them in sustainable processes, optimised processes. (Gallotta,
2016)

57
Sensitivity: Internal
3.6. Chapter Summary and conclusions By definition, Business Process Management (BPM) is a management approach to align
business processes with the corporative strategy to analyse, optimise and implement the
best processes into an organisation. However, BPM is more than one methodology, it is
a concept that involves several areas within the organisation. It relates people, strategy,
governance, methods, Information Technology and culture with processes and operations.
Chapter 2 has demonstrated that current management models do not address the
sustainability challenges fully, so it is crucial to develop new approaches to overcome
this situation. In this scenario, Business Process Management rises as an excellent
approach to be used as an enabler, due to its capacity to organise the companies in
processes structures, helping them to understand those processes and change them
according to the current sustainability requirements. Chapter 4 will present the
methodological aspects involved in the research, and chapter 5 will provide the
framework that was developed for the research.

58
Sensitivity: Internal
Chapter 4 - Research methodology and approach
4.1. Introduction This chapter presents an overview of the methodological aspects of the research and the
manner it was conducted. The first step was to classify the research regarding purpose,
process, logic and outcome. Then, it defines the research methodology used in this
research, aligning it to the aims, objectives and research questions. Finally, the chapter
presents the research methods used and presents the methods for data collection.
4.2. Type of research According to Hussey and Hussey (1997), it is essential to know and classify the research
to clearly understand what the researcher is doing. Table 4 shows the different
classifications of research.
Table 4 Different classifications of research. Adapted from Hussey and Hussey (1997)
Type of research Basis of classification
Exploratory, descriptive, analytical or predictive Purpose of research
Quantitative or qualitative Process of the research
Deductive or inductive Logic of the research
Applied or basic Outcome of the research
Based on this classification and their characteristics, the research carried out in this
project can be classified, according to its purpose, as exploratory. This is due to the lack
of studies successfully combining business process management and sustainability
implementation detailed in chapter 2. Furthermore, the present investigation will not only
describe the research process but also analyse it, propose changes and evaluate
accordingly.
According to Robson (2002), an exploratory study is a valuable means of finding out
‘what is happening; to seek new insights; to ask questions and to assess phenomena in a
new light’. Shields (2013) states that exploratory research is intended to study a problem
in a more transparent way, in order to establish priorities, develop definitions and improve
the research design. For Dudovskiy (2016) the main advantages of the exploratory
research are the flexibility and adaptability to change and the effectiveness to lay the
groundwork for future studies. According to the author, the main disadvantages are the
generation of qualitative information (leading the interpretation of the information

59
Sensitivity: Internal
subjected to bias), and the lower number of samples generated by the study.
Concerning process, this research is qualitative as the success of sustainability
implementation is an intangible concept. For Walliman (2010), qualitative data cannot be
accurately measured and counted, and are generally expressed in words rather than
numbers. The research evaluates sustainability implementation in an interpretive way,
demonstrating its application in a small environment. According to Atieno (2009), the
main disadvantage of qualitative methods is that their findings cannot be extended to
broader populations with the same degree of certainty that quantitative analyses can. This
is because the findings of the research are not tested to discover whether they are
statistically significant or due to chance.
Concerning logic, the research can be classified as inductive since a theoretical
framework was developed and then verified and validated. According to Goddard &
Melville (2004), the inductive approach starts with the observations and theories are
proposed towards the end of the research process as a result of observations. This goes in
the same direction as this research, since the research questions.
Thus, the rationale of this research consists on the benefits that Business Process
Management can bring to the sustainability topic in the organisations, and present a
framework to help them to implement sustainability projects in their business processes,
transforming their regular business processes into sustainability business processes.
Finally, since the framework proposed in this research was tested in a real-world scenario,
it can be classified as applied. According to Kothari (2008), applied research “aims at
finding a solution for an immediate problem facing society, or an industrial/business
organisation, whereas fundamental research is mainly concerned with generalisations and
with the formulation of a theory”. For Dudovskiy (2016), “the advantages and
disadvantages of applied and fundamental research mirror and contrast each other. On the
positive side, applied research can be helpful in solving specific problems in business and
other settings. Nevertheless, on the negative side, findings of applied research cannot be
usually generalised. In other words, the applicability of the new knowledge generated as
a result of applied research is limited to the research problem”.
4.3. Research Methodology

60
Sensitivity: Internal
As it was defined in Chapter 1, this research project aims to provide a full lifecycle
solution for the implementation of sustainability initiatives in business processes by
Analysing, Designing, Implementing and Monitoring & Controlling current (or eventual
new) processes in one organisation. In order to complete this work, the proposed
methodology, presented in Figure 16, was carried out.
Figure 16 – Research Methodology
The initial step of the research was to perform an extensive critical literature review in
the field of sustainability and business process management. Chapter 2 demonstrates that
currently, companies want to adopt sustainability practices in their organisational levels,
operations and business process as a whole. However, these organisations have still failed
to reach the sustainability level they wished at the beginning of the project. Moreover,
despite the existence of some standards (such as ISO 14000, ISO 14001 and ISO 26000),
current models to implement sustainability practices do not address the sustainability
challenge fully (Ahmed & Sundaram, 2012). Chapter 3 brings the relationship between
business process management and sustainability and provides arguments to corroborate

61
Sensitivity: Internal
that BPM can be used as a tool to enable the implementation of sustainability initiatives
in the organisation processes.
The second step, then, was to identify what were the current problems and challenges to
implementing sustainability in organisations. Some challenges found in the literature
consists in defining measurable goals, selecting the right sustainability Indicators,
considering sustainability aspects in the management of an organisation’s processes.
More than the challenges and barriers to implementing sustainability initiatives, several
approaches focus on one specific department of the organisation. They, however, do not
consider that those departments work along with other departments into an end-to-end
process (systemic view). Therefore, a more refined analysis would consider the whole
process interaction to evaluate the full status of the sustainability implementation. The
systemic view is observed in the business process management approach; thus, it justifies
the use of the methodology.
After identifying the problems and challenges to implement sustainability in
organisations, it was developed the conceptual framework showing how the business
process management method can transmit the sustainability strategy into operation areas
and help companies to overcome the implementation challenges. The framework
summarises the concepts from Morais et al. (2014), ABPMP (2009). Scheer (2006),
Netjes et al. (2006), and Houy et al. (2010) and relate it to the sustainability adoption.
Chapter 5 provides the details of the framework.
In order to verify the conceptual framework, a Delphi study was performed. The study
was held between June 2016 and August 2016 and contained the participation of twenty-
one specialists in the field of sustainable operations from both academia and industry and
their feedback was evaluated. In total, there were fourteen researchers from the academia
and seven from the industry. The participants were based in six different countries (Brazil,
Germany, UK, Mexico, Sweden and Netherlands) and it was used online based
questionnaires to gather the data. Chapter 6 provides the details of the Delphi study.
Finally, the research validated the framework in a real-world scenario by using the action
research method. The study was held between August 2016 and January 2017 and was
held on a biomass company focused in the development of sustainable energy
technologies that wished to improve the implementation of sustainability initiatives in its
business processes and operations. Chapter 7 provides the details of the action research
study
62
Sensitivity: Internal
4.4. Research Methods The research used two methods: Delphi Study and Action research. The Delphi method
was used to verify the framework proposed in chapter 5 and the Action research to
validate it, testing it in a real-life scenario.
4.4.1. Delphi Study
According to Linstone & Turoff (2002), the Delphi method may be viewed as one of the
spinoffs of defence research. "Project Delphi" was the name given to an Air Force-
sponsored Rand Corporation study, starting in the early 1950's, concerning the use of
expert opinion. The objective of the original study was to "obtain the most reliable
consensus of a group of experts ... by a series of intensive questionnaires interspersed
with controlled opinion feedback.". The intent of the Delphi, as it was initially conceived,
was to create a method, using expert opinions, to forecast long-range trends related to the
military potential of future science and technology and their effects on political issues
(Gordon, 1994; Linstone & Turoff, 1975).
Sackman (1974) identified the following as the characteristics of a conventional Delphi:
• A formal and structured questionnaire is used.
• Questionnaire items may be generated by the moderator, the panellists, or both.
• Either quantitative or qualitative scales may be used.
• The process consists of two or more rounds.
• Questionnaires may or may not include open-ended questions.
• Feedback from each round is in the form of statistical feedback, usually involving
some measure of central tendency and some measure of dispersion.
• Feedback from each round may include selected textual information.
• Individual responses to items are kept anonymous.
• Iteration with feedback continues until consensus is reached, as determined by the
moderator.
• Participants do not meet face to face and may be geographically dispersed.
• Outliers (i.e. upper and lower quartile) may be asked to justify their responses in
writing
According to Sommerville (2008), the Delphi method has some advantages, such as:
information can be gathered from participants in different geographical locations,
participants have anonymity (reducing halo effects associated with their opinion); and the
specialists time to consider carefully their responses before replying (Adams & O'Brien,

63
Sensitivity: Internal
2004; Garrod, 2004; Gordon, 1994). According to Sommerville (2008), one disadvantage
of the Delphi method is the high attrition rate. Since the method requires lengthy
responses in the early rounds of the process and the active participation of participants
over several weeks, the potential for a high drop-out rate of panellists exists (Borg & Gall,
1983).
Therefore, it is possible to consider that the Delphi method is suitable to verify the
framework since it gathers the opinions of specialists in sustainable operations
management from several locations over the proposed framework. Other approaches that
could have been used for the verification would have been the use of surveys or even
focus groups. However, even though fact that a survey would have a higher number of
respondents, the reliability of the responses would be lower, and it would lack the
interaction between the panellists and the researcher. Using a focus group, on the other
hand, would be interesting due to the high level of commitment of the participants,
however, the fact that the specialists in the topic are in different geographical locations
would make this option inviable.
4.4.1.1. Methods for data collection
For the Delphi study, the method for data collection was the use of a questionnaire. In the
research, the questionnaire term is used as a general term to include all techniques of data
collection in which each person is asked to respond to the same set of questions in a
predetermined order (de Vaus 2001).
In a general view, it was identified eight groups of questions. 1) Sustainability, 2) Process
Improvement, 3) Process Improvement & Sustainability, 4) Analyse phase, 5) Design
phase, 6) Implement phase, 7) Monitor & control phase, and 8) Enablers of the
implementation.
Saunders (2012) identifies five types of questionnaires: Internet meditated, via a portal,
via delivery and collection, via telephone, in a structured interview. Since the specialists
were spread all over the World, the study was performed via internet, using the Google
forms web application. The advantages of using this application were: it provides enough
techniques for the creation of the questionnaire, it is a freeware application, it provides
electronic control of the respondents and it provides automatic data analysis. More than
that, it provides reliability for the study, since all the registers are kept recorded online.
The main disadvantages found in this approach was the low level of response rate
(29.16%) and the time took to complete (each phase of the study had about one month of
duration).

64
Sensitivity: Internal
4.4.2. Action Research
According to Maestrini et al. (2016), Action research can be defined as an emergent
investigation process that integrates theory and action to couple scientific knowledge with
existing organisational knowledge and to address real organisational problems together
with the people of the system under inquiry (Coghlan, 2011, Shani and Pasmore,
1985, Rapaport, 1970 and Lewin, 1947). It is a participatory and collaborative approach
and is aimed at bringing change to organisations, developing competencies, and
contributing to scientific knowledge through a co-inquiry cyclical process (Coghlan and
Shani, 2014, Reason and Bradbury, 2008 and Shani and Pasmore, 1985). According to
van der Hoorn (2016), Gibson (2004) and Newton (2006), Action research can be
described as a process that considers a situation (the dependent variables); brings an
intervention to the situation (action/independent variable); and then reassesses the
situation (reflection on the intervention or effect of the independent variable on the
dependent variable). Figure 17 represents this cycle.
Figure 17 Adapted from: (Baskerville & Pries-Heje 1999, p. 4). - content removed for
copyright reasons
According to Mapotse (2017), Kurt Lewing was the first to coin the term “Action
Research” in 1944. In his 1946 paper "Action Research and Minority Problems" he
described action research as "a comparative research on the conditions and effects of
various forms of social action and research leading to social action" that uses "a spiral of
steps, each of which is composed of a circle of planning, action and fact-finding about
the result of the action".

65
Sensitivity: Internal
Therefore, it is possible to consider that the Action Research method is suitable to validate
the framework. The selection of the action research method relies on the intervention to
a situation (a problem faced by the organisation) and the study that was seeking to assess
the outcomes (using the sustainability implementation framework). The action research
was suitable because it enabled mutual benefits to both the organisation and the research
itself. Besides that, there was an alignment between the research method and the research
study context. There is a constant feedback process held during the project execution with
the ongoing research. The empirical study goes beyond merely reporting observations, it
provides an environment to improve the framework and validation from a real-world
context.
Another approach that could have been used for the validation of the framework would
have been the use of case studies. However, the case study has an impersonal character
and the researcher only observes the situation from an outside point of view. According
to Bryman & Bell (2011), in action research, the investigator virtually becomes part
of the arena being studied with the purpose of solving organisational problems.
This orientation appears to involve a surrendering of detachment, and it is not
surprising that many practitioners display concern about the ethical bases of their
enterprise. However, action research is explicitly concerned to develop findings
that can be applied in organisations, a position that contrasts with the peripheral
relevance to organisations that much organisational research exhibits.
4.4.2.1. Methods for data collection
For the Action Research, the collection of data was made based on the observation and
action to a specific problem. The study was held on a biomass company focused in the
development of sustainable energy technologies that wished to improve the
implementation of sustainability initiatives in its business processes and operations. Due
to legal requirements, some information of the organisation was omitted in the study
description. The study was held between August 2016 and January 2017. In that period,
the researcher went to the company three days a week (Mondays, Wednesdays and
Fridays) between 7 am and 4 pm to collect the data. The study followed the four phases
of the framework (Analyse, Design; Implement; and Monitor & Control) and was aimed
to provide a solution to the generation of an excess of a particular residue (tar) from the
organisation. More details of the action research can be found in chapter 7.

66
Sensitivity: Internal
4.5. Chapter summary and conclusions This chapter has presented the research methodology and approach followed. It briefly
reviewed the different classification in which research can be defined, and based on that,
it classified the actual research as exploratory (purpose), qualitative (process), inductive
(logic) and applied (outcome). The chapter then presents the research methodology that
was carried out. Finally, the chapter presents the research methods (Delphi method and
action research) and their methods for data collection. Next chapter will provide the
framework proposed by the research.

67
Sensitivity: Internal
Chapter 5 – Sustainability Implementation Framework for
Business Processes
5.1. Introduction Chapter 2 has highlighted the lack of attention paid to the implementation of
Sustainability in business processes. This chapter presents the framework that is
developed to facilitate the implementation of sustainability initiatives in the business
processes. The chapter initially presents the framework, which is based on Business
Process Management principles (described in Chapter 3), containing four main phases:
(Analyse Phase; Design Phase; Implement Phase; and Monitor & Control Phase). Then,
the chapter describes each step contained in the phases (Identify Business Scenario;
Identify Project Stakeholders; Define Project Objectives; Define Metrics; Record
enterprise map - AS-IS Situation; Record baseline values; Perform Sustainability
Maturity Assessment; Define Scope; Identify improvement opportunities; Design TO-BE
Process; Record predicted metric values; Define implementation strategy; Transform
Business Processes; Execute the new Processes; Monitor and analyse organisational
performance; Monitor and analyse process performance; Monitor metrics; Realise value;
and Identify optimisation opportunities). The chapter also identifies enablers for the
framework’s implementation (governance, strategy, methods, information technology,
change management, leadership, and culture) and discuss their roles.
5.2. Conceptual framework for Sustainability Projects Implementation Initially, the framework would demonstrate how the Business Process Management
(BPM) combined with Project Management methodologies (Silvius & Schipper, 2010,
Silvius & Nedeski, 2011, PMI, 2004); balanced scorecard tools (Sanchez, 2014), among
other management tools can transmit the sustainability corporate strategy into its
operational area and help companies to overcome the implementation challenges.
Who and Why
The main stakeholders in this Project are:
• Shareholders – internal aspect
• Employees – internal aspect
• Customers – external aspect
• Community – external aspect

68
Sensitivity: Internal
Figure 18 represents the relation between the stakeholders and the triple bottom line and
figure 19 represents the balanced scorecard.
Figure 18 Relation between the stakeholders and the triple bottom line
Figure 19 Balanced scorecard for the sustainability implementation
How and when?

69
Sensitivity: Internal
The implementation would be defined as a project, following the PMI (2004) guidelines.
Figure 20 represents the project plan.
Figure 20 Project plan
The process modelling would evaluate the process design in three levels of details:
Process Landscape, Process and Activities. Ranging from the strategic level to the
operations level. Figure 21 represents the process design, from the strategy to operations.
Figure 21Process design - Strategy to operations
The initial framework was represented by figure 22 and aimed to demonstrate the relation
between strategy and operations. In this approach, the project management would be an
enabler for the implementation of sustainability initiatives.
Bruno Gallotta
MELHORAR

70
Sensitivity: Internal
Figure 22Initial framework
As it was explained in Section 3.4, according to ABPMP (2009) the management practice
of BPM may be characterised as a continuous lifecycle of integrated BPM activities.
While several variations of BPM lifecycles are recognised, for the matters of this research,
in order to integrate the sustainability topic into BPM, a four phases methodology
(Analyse, Design; Implement; and Monitor & Control) was carried out. These four phases
were chosen because they represent the BPM approach with stages analogues to the ones
presented in other sustainability implementation frameworks (such as the models from
Ahmed & Sundaram, 2012 – with the phases of ‘Discover & Learn’; ‘Strategize’;
‘Design’; ‘Transform’; and ‘Monitor & Control’ – and from Uddin & Rahman, 2012 -
with the phases ‘Planning’; Identification & Categorisation; Recycling & Low Carbon
Enabler; Implementation; and Analysis). ‘Analyse’ phase contains the steps of ‘Identify
Business Scenario’, ‘Identify Project Stakeholders’, ‘Define Project Objectives’, ‘Define
Metrics’, ‘Record enterprise map - AS-IS Situation’, ‘Record baseline values’, and
‘Perform Sustainability Maturity Assessment’; Design phase contains the steps of ‘Define
Scope’, ‘Identify improvement opportunities’, ‘Design TO-BE Process’, ‘Record
predicted metric values’, and ‘Define implementation strategy’; Implement phase
contains the steps of ‘Transform Business Processes’, and ‘Execute the new Processes’;
and Monitor & Control phase contains the steps of ‘Monitor and analyse organisational

71
Sensitivity: Internal
performance’, ‘Monitor and analyse process performance’, ‘Monitor metrics’, ‘Realise
value’, and ‘Identify optimisation opportunities’). Figure 23 presents the detailed
information of the main implementation phases and its sub-activities suggested to be
carried out in each phase.

72
Sensitivity: Internal
Figure 23 – Conceptual Framework to Implement Sustainability Initiatives in the Business Processes

73
5.2.1. Analyse
Socrates’ famous quote ‘Know thyself’ can have many philosophical meanings; one
possible meaning is that by knowing yourself, it is possible to know your role in the
World. In the case of the business environment, in order to understand the role in the
market, it is required to comprehend the inner aspects of the organisation fully. To
understand these aspects, the analytical capability is fundamental. Regarding the
implementation framework, the ‘Analyse’ phase aims to assess and evaluate all the
relevant aspects related to the sustainability implementation in the business processes
(Gallotta, 2016).
The first step in the Analyse phase is to identify the current business scenario, identifying
the customer’s requirements, supplier’s requirements and current regulations that may
affect the project. Once this assessment is concluded, it is defined and prioritised the
processes to be considered in the project, the stakeholders are identified and the primary
project objectives. After this, the metrics are defined (aligned to the project objectives),
the enterprise map (current situation) is created, the baseline values are recorded and,
finally, the sustainability maturity assessment is performed (Gallotta, 2016). Figure 24
shows the breakdown of the steps in this phase.
In terms of sustainability, the main aspects of this phase regarding sustainability are the
definition of metrics related to water management, energy management, employee
satisfaction or any other triple bottom line metric and the sustainability maturity
assessment. The outcome of the Analyse phase is the definition of the current
sustainability status and the identification of the future stage.

74
Figure 24 - Breakdown of the Analyse phase
5.2.1.1. Identify Business Scenario
The purpose of this stage is for the project team members obtain sufficient understanding
of the current business environment to enable further project phases. The step analyse
comprises all the factors which may affect the project during its lifecycle. It comprises
factors related to the current regulatory needs, the external business environment
(customers and suppliers needs) and the internal environment (organisation cultural
aspects).
Examples of regulatory impacts in the business can be found in Japan. According to
Debnath (2015), after 2011 Fukushima nuclear power plant accident, Japan Nuclear

75
Regulatory Commission set the new regulation standards of the nuclear power plant. The
new regulations forced electric power companies to increase the investment in a coastal
barrier to meet the new standard. Besides that, current policymakers are now discussing
the possibility of complete switching from the nuclear power plants to other means for
electricity (Gallotta, 2016).
Another Japanese example of the impact of regulations was the Kyoto Protocol.
According to Debnath (2015) in 2001, Japan was able to reduce CO2 emissions to 8.2%
below 1990 levels (one of the proposals of the Kyoto Protocol). The Japanese example is
significant once this initial commitment might have helped Japanese organisations to
connect Corporate Social Responsibility (CSR) activities with the products by making
them environment-friendly (examples of those initiatives are: Toyota Prius, Nissan Leaf
and Panasonic Eco Navi).
The American automobile industry demonstrates the changes in customer needs. Before
1973 the American market was dominated by ‘muscle cars’ (such as Chevrolet Corvette,
Ford Mustang, and Chevrolet Camaro). The 1970’s changed this business scenario due to
the oil crises (1973 and 1979), in which the oil barrel price jumped from U$3 (before the
first crisis) to nearly U$40 (after the second crisis). The increase in oil price forced
consumers to seek alternatives in smaller cars. One company which benefited from this
situation was Toyota since this company’s cars were smaller than the American ones and
had a lower fuel consumption.
Regarding the organisational culture, some researchers have suggested that while the
tools, techniques and change strategies may be present, failure occurs because the
fundamental culture of the organisation remains the same (Cameron & Quinn, 2006).
Linnenluecke & Griffiths (2010) suggest that the successful implementation of culture
change for corporate sustainability might be mostly dependent on the values and
ideological underpinnings of an organisation’s culture and that these, in turn, affect how
corporate sustainability is implemented and the types of outcomes that can be observed.
This means that would be easier to find successful sustainability implementation cases in
organisations that have Sustainability as their inner DNA (Gallotta, 2016).
5.2.1.2. Determine and prioritise processes
After identifying the current business scenario, the organisation needs to define the
processes to be managed and studied along the project. It is essential to prioritise because
mapping the whole enterprise might implicate in the consumption of a lot of effort (or
time) (Gallotta, 2016).

76
5.2.1.3. Define Stakeholders
After determining and prioritizing the processes to be studied, the relevant stakeholders
are identified. Stakeholders are the individuals or groups affected by the project. The level
of participation of stakeholders in analysis can vary considerably from passive
consultation to active engagement. The level of participation of stakeholders in analysis
can vary considerably from passive consultation to active engagement. Categorisation
methods follow either top-down analytical categorisations or bottom-up reconstructive
methods. Finally, some methods have been developed to investigate the relationships that
exist between stakeholders in the context of the issue of interest. Examples include actor
linkage matrices and social network analysis (Sanchez, 2014).
During this step, it will be defined the key stakeholders in the project and their goals. At
the end of the project, it will be evaluated if the stakeholders have achieved their project
goals defined in this phase (Gallotta, 2016).
5.2.1.4. Define Project Objectives
After defining the project stakeholders, the objectives are set. According to Slack et al.
(2013) objectives help to provide a definition of the endpoint which can be used to
monitor progress and identify when success has been achieved. Traditionally projects are
considered in terms of cost, time and quality (Gallotta, 2016). Figure 25 shows the
‘project objectives triangle’ with these three types of project marked. However, a few
authors such as Reijers & Mansar, 2005, Seidel et al. 2012, Agyekum-Mensah 2012) also
suggest objectives in terms of flexibility and sustainability. With the emergence of
environmental sustainability as an additional dimension of organisational performance,
the classical process imperatives are increasingly subjected to critical scrutiny. This is
because they do not appropriately reflect environmental objectives such as “minimise
energy consumption”, “reduce carbon footprint,” or “provide ecologically sustainable
solutions.” (Seidel et al. 2012)
Figure 25 - The project objectives triangle (Slack et al., 2013) - content removed for copyright reasons

77
5.2.1.5. Define Metrics
After defining the project objectives, the relevant metrics are defined. The metrics
definition is one critical aspect in the Sustainability Implementation Project since it is
related to a few challenges to implementing those kinds of initiatives (Select the right
sustainability indicators, define the proper measurement method and align indicators to
goals and objectives). According to Silvius et al. (2012), elaborating on the three
perspectives of the triple bottom line concept, several organisations developed
frameworks of indicators that would allow organisations to evaluate the sustainability
aspects of different policies and projects, as well as to monitor progress. In fact, the
literature on these models is a veritable jungle of different approaches and numerous case
studies (Olsson et al., 2004). A widely-used framework in sustainability reporting is the
Sustainability Reporting Guidelines (SRG) by the Global Reporting Initiative (GRI).
Companies can use the SRG to indicate to shareholders and consumers their economic,
social and environmental performance. GRI’s objective is to facilitate sustainability
reporting for companies and thereby stimulate them to operate more sustainably. The
SRG framework consists of an extensive set of indicators, from which companies can
select a set that is relevant to their operations or industry (Silvius et al. 2012).
GRI has indicators to provide information on the economic, environmental and social
performance. According to GRI (2013) the economic dimension of sustainability
concerns the organisation’s impacts on economic conditions of its stakeholders, and on
economic systems at local, national, and global levels; the environmental dimension of
sustainability concerns the organisation’s impact on living and non-living natural
systems, including land, air, water and ecosystems; the Environmental Category covers
impacts related to inputs (such as energy and water) and outputs (such as emissions,
effluents and waste). In addition, it covers biodiversity, transport, and product and
service-related impacts, as well as environmental compliance and expenditures; and the
social dimension of sustainability concerns the impacts the organisation has on the social
systems within which it operates. According to the GRI (2013), there are 91 indicators
(as can be viewed in table 5, table 6 and table 7) and many of them can be used as
metrics and evaluate the performance in the business processes, e.g. ‘direct economic
value generated and distributed’, ‘proportion of spending on local suppliers at significant
locations of operation’, ‘energy consumption within the organisation’, ‘reduction of
energy consumption’, ‘direct Greenhouse Gas (GHG) emissions (scope 1)’, ‘operations

78
with significant actual and potential negative impacts on local communities’ (Gallotta,
2016)..
Table 5 - GRI Economic Indicators. Adapted from GRI (2013) - content removed for copyright reasons
Table 6 - GRI Environmental Indicators. Adapted from GRI (2013) - content removed for copyright
reasons

79
Table 7 - GRI Social Indicators. Adapted from GRI (2013) - content removed for copyright reasons

80
At the 2010 IPMA Expert Seminar ‘Survival and Sustainability as Challenges for Project”
(Knoepfel, 2010), one of the goals was to ‘translate’ the concepts of sustainability to
practically applicable tools for project management professionals. Based on the SRG, the
participants of the seminar developed a ‘Sustainability Checklist’ for projects and project
managers. Table 8 provides this Sustainability Checklist (Silvius et al. 2012).
Table 8- A checklist for integrating sustainability in projects and project management (Knoepfel, 2010). - content
removed for copyright reasons

81
Sanchez (2014) has also provided a ‘Sustainability Checklist’ for projects relating the
goals, the metrics (Measure column) and the group to be beneficiated from the initiative
(Figure 26).
Figure 26 - Sustainability Checklist (Sanchez, 2014) - content removed for copyright reasons
So, depending on what are the goals of the project, different metrics can be adopted. For
example, a company can define ‘Increase flexibility’, ‘reduce water consumption’,
‘reduce energy consumption’ and ‘increase health and safety standards’ as metrics to be
measured along the project. All those metrics will be evaluated and associated with
relevant processes or activities and later will be monitored along the project. The intention
to that is to be possible to assess the performance of those metrics in the beginning and
comparing it to the final stage, displaying the evolution of the metrics and showing the
sustainability impact of the project (Gallotta, 2016).
5.2.1.6. Record Enterprise Map (AS-IS situation)
After defining the metrics, it is recorded the enterprise map with the current process
situation. An enterprise map is the modelling representation of the hierarchy of business

82
processes of an organisation. Scheer, (2006), for instance, defined three levels to create
process mapping. A first level, called ‘Scenario’ level which comprises all the macro
processes in the company (or the ones in the project scope); a second level, ‘Process’
level which encompasses the processes within the macro process; and, finally, an
‘Activity’ level which represent the process steps from the specific process (Figures 27,
28 and 29 represents one example of the three design levels).
Figure 27 - Example of Process Design using EPC methodology - Scenario Level

83
Figure 28 - Example of Process Design using EPC methodology - Process Level
Figure 29 - Example of Process Design using EPC methodology – Activity Level
It is called process mapping (or enterprise mapping) due to the analogy to a world map
(Figure 30). In this representation, observing the processes at the ‘scenario level’ would
be the same as observing a world map in the broadest way, in this case the countries are
analogues to the macro-processes; drilling down to the process level, it is observed the
processes, which can be related to the cities of a country; and in the third level, the
activities can be related to the streets of a particular city (Gallotta, 2016).
According to ABPMP (2009), Process modelling combines a set of processes and skills
which provide insight and understanding of business process and enable analysis, design
and performance measurements. “Business Process Modelling” is the set of activities
involved in creating representations of an existing or proposed business process. During
business modelling, it is essential to be able to describe the business processes on different
World map representing the countries. E.g.: UK, France, and Japan.
Map representing the cities of a country. E.g. London, Manchester, Derby
Map representing the streets of a city. E.g. Market St, Ashbourne Rd, Kedlestone Rd.
Scenario level representing the macro-processes. E.g. E.g. Manufacturing, Demand
Process Level representing the processes within the macro-process. E.g. Automatic Assembly, Order Entry, Billing
Activity Level representing the activities within the processes. E.g. record data; process document, ship material Figure 30 - Process Design Hierarchy

84
levels (Gale & Eldred, 1996). According to Davenport (1993), business processes are
divided into core processes, supporting processes, and management processes. Core
Processes represents the key processes in the organisation, the processes that add primary
value to an output, they represent the essential activities an organisation performs to fulfil
their mission (E.g. Manufacturing, Quality Management, Order Entry Management);
Supporting Processes gives support to the core processes, usually managing resources
and/or infrastructure required by the core processes and not bringing direct delivery value
to the business (E.g. Financial Accounting, Maintenance, Technical Support); and
Management Processes, which are the processes responsible for managing, monitoring
and controlling business activities ensuring that core process address operational,
financial, regulatory and legal goals, they also to do not bring direct value to the business
(E.g. Financial Planning, Demand Planning) (Gallotta, 2016).
According to Smith and Fingar (2003), Hammer and Champy once observed that “hardly
any company contains more than ten or so principal processes”. Davenport likewise
advised that the “fewer and broader the processes, the greater the possibility for
innovation… and the greater the understanding measuring the change”. Principal
processes mainly exist in the rarefied environment of the corporate strategy office, far
away from the “engine and cog” processes that actually run the business. Principal
processes require hundreds of tangible supporting processes (observed in Table 9) and
thousands of distinct process variants, all of which are needed and all of which need to
be managed. The supporting processes include many unique internal processes, industry
best practices, and sub-processes to ensure compliance with standards, legal
requirements, and regulatory guidelines. Table 9 Subset of enterprise process. Adapted from Smith and Fingar (2003)
Account Management Organisational Learning
Advance Planning & Scheduling Payroll Processing
Advertising Performance Management
Assembly Performance Monitoring
Asset Management Performance Review
Benefits administration Physical Inventory
Branch Operations Planning and Resource Allocation
Budget Control Post-Sales Service

85
Build to Order Problem/Resolution Management
Call Centre Service Process Design
Capacity Reservation Procurement
Capital Expenditures Product Data Management
Check Request Processing Product Design, Development
Collateral Fulfilment Product/Brand Marketing
Collections Production Scheduling
Commissions Processing Program Management
Compensation Promotions
Component Fabrication Property Tracking/Accounting
Corporate Communications Proposal Preparation
Credit Request/Authorization Publicity Management
Customer Acquisition Real Estate Management
Customer Inquiry Recruitment
Customer Requirements
Identification
Returns & Depot Repairs
Customer Self Service Returns Management
Customer/Product Profitability Sales Channel Management
Demand Planning Sales Commission Planning
Distribution / VAR Management Sales Cycle Management
Financial Planning Sales Planning
Financial Close/Consolidation Service Agreement Management
Hiring/orientation Service Fulfilment
Installation Management Service Provisioning
Integrated Logistics Shipping
Internal Audit Site Survey & Solution Design
Inventory Management Six Sigma
Investor Relations Sourcing
Invoicing Strategy Development
IT Service Management Succession Planning
Knowledge Management Supply Chain Planning

86
Manufacturing Supply Planning
Manufacturing Capability
Development
Test
Market Research & Analysis Time & Expense Processing
Market Test Timekeeping/Reporting
Materials Procurement Training
Materials Storage Treasury/Cash Management
Order Dispatch & Fulfilment Warehousing
Order Fulfilment Warranty Management
Order Management Zero-Based Budgeting
Other important aspects are the modelling standards and notations. According to ABPMP
(2009) some of the benefits of using a standards-based approach include: common
symbology, language, and technique which facilitate communication and understanding;
standards-based models provide common and consistently defined processes definitions
which eases the process of design, analysis and measurement and facilitates model reuse;
an ability to leverage modelling tools based on common standards and notations; and an
ability to import and export models created in various tools for reuse in other tools.
Currently, there are several modelling techniques in use, such as Event-driven Process
Chains (EPCs), Yet Another Workflow Language (YAWL), diagrams offered by the
Unified Modelling Language (UML) and Business Process Model and Notation (BPMN).
However, to deal with business processes, there is a prominence of the use of EPCs and
BPMNs (Gallotta, 2016).
According to ABPMP (2009), Business Process Model Notation (BPMN) is a relatively
new standard created by the Business Process Management Initiative. BPMN appears to
be emerging as the most extensive, most widely accepted business process modelling
notation in the industry. It provides a simple, yet robust, symbology for modelling all
aspects of business processes. According to Ottensooser et al. (2012), the Business
Process Modelling Notation (BPMN) depicts the flow of a business process as a graph.
Activities are the dominant type of nodes in such a graph (captured as rounded boxes)
while the arcs define temporal and logical order. Activities are usually annotated with
short text labels following a Verb, as for instance “place order” (Mendling et al., 2010).
There are also diamond-shaped routing elements for describing decisions based on certain

87
conditions or parallel execution. Actors are represented as so-called swim lanes, in which
activities can be placed (Gallotta, 2016). Figures 31 and 32 provide examples of the
BPMN notation to describe a business process.
Confirm order
Monitor shipment
Create invoice
Process payment
Confirm arrival
Figure 31 - Example of a BPMN model. Source Appel et al. (2014) - content removed for copyright
reasons
Receive order
Check credit Fulfil order Send
invoice
Figure 32 - Example of a BPMN model. Source: ABPMP (2009) - content removed for copyright
reasons
Event-driven Process Chains (EPC), on the other hand, are very similar to activity
diagrams regarding the addition of events or outcomes of tasks. An EPC is an ordered
sequence of events and functions that provides various connectors that allow alternative
and parallel execution of processes. The tasks (activities) are followed by outcomes
(events) of the task, developing a very detailed process model. A significant strength of
EPC is claimed to be its simplicity and easy-to-understand notation. This makes EPC a
widely accepted technique to denote business processes (ABPMP, 2009)
According to Reijers et al. (2009), the Event-driven process chains (EPC) language was
developed in 1992 at the Institute for Information Systems in Saarbrücken. The primary
goal behind this development was to allow business users to describe processes on the
level of their business logic in a form that is easily understandable (Gallotta, 2016). A
specific EPC model (or simply EPC) consists of the following building blocks:
• Functions: The basic building blocks are functions. A function corresponds to an
activity (task, process step) which needs to be executed.
• Events: Events describe the situation before and/or after a function is executed.
An event corresponds to the postcondition of the function it succeeds (if any) and

88
to the precondition of the function it precedes (if any).
• Logical connectors: Connectors can be used to show the different paths the
process can take. Through the use of connectors, paths can be split and joined.
There are three types of connectors. ∧ (and), XOR (exclusive or) and ∨ (inclusive
or).
• Arcs: Functions, events and connectors are connected by directed arcs.
Figure 33 shows the representation of these building blocks.
Figure 33 The building blocks of an Event-driven Process Chain. Source: Reijers et al. (2008)
Figure 34 represents the same process described in figure 27, with the EPC nomenclature.

89
Figure 34 – Example of an EPC model. Adapted from ABPMP (2009) - content removed for copyright
reasons
Houy et al. (2012) used Event-driven Process Chains (EPC) and Business Process
Modelling Notation (BPMN) to represent process flows and to use the principles of the
Green BPM. According to the authors, by accumulating the annotated values of the
sustainability metrics, the total consumption of needed resources or the total production
of waste materials in a process it can be measured and controlled. This method facilitates
an optimised organisation of activities in a process and the controlling of the ecological
impact of its execution (Gallotta, 2016).
According to Houy et al. (2012) in Green BPM every business activity in a process model
can be annotated with an adequate ratio representing the consumption of resources and
the production of waste materials. By accumulating the annotated values, the total

90
consumption of needed resources or the total production of waste materials in a process
can be measured and controlled. This method facilitates an optimised organisation of
activities in a process and the controlling of the ecological impact of its execution. In
order to investigate the organisational as well as technological opportunities of Green
BPM (Gallotta, 2016). Figure 35 shows one sales process represented by an Event-driven
Process Chain (EPC) with the respective resource consumption.
Figure 35 - Sales process (EPC) annotated with relevant sustainability ratios. Adapted from Houy et al. (2012) -
content removed for copyright reasons
Using the example data, it is possible to identify the total electric consumption, the total
fuel consumption and the total CO2 production (or other metrics, depending on the case)
of a particular process and in a further moment propose a new design, showing the
potential savings in a comprehensive way. Using the three-level approach, defined in
section 3.3.1.3. Record enterprise map, it is possible to evaluate the metrics in the
Scenario level, Process level and Activities level. This means a full identification of the
sustainability footprint along all the scoped business unity (Gallotta, 2016). Figure 36

91
shows the Process Design Hierarchy, every metric that is evaluated in the activity level is
accumulated at the process level which is accumulated to the Scenario Level.
Figure 36 – Process Design Hierarchy
5.2.1.7. Record baseline values
After recording the enterprise map, the consumption values are associated with the
processes.
5.2.1.8. Perform Sustainability Maturity Assessment
After recording the baseline values, it is possible to perform the sustainability maturity
assessment. In this stage, it will be evaluated formally at the current level of sustainability
awareness and the desired stage. Generically, Maturity Assessment is a practical way to
‘translate’ complex concepts into organisational capabilities and to raise awareness for
potential development (Silvius & Schipper, 2010). They provide guidance for action
plans and allow organisations to monitor their progress (Dinsmore, 1998). Most maturity
models are derived from the Software Engineering Institute’s Capability Maturity Model
(Carnegie Mellon Software Engineering Institute, 2002) and thereby based on the
maturity of processes.
Jeston & Nelis. (2006), for instance, proposed a BPM maturity model which shows the
different maturity levels and the characteristics of low maturity and high maturity levels
(Gallotta, 2016). This maturity model framework is observed in Figure 37.

92
Figure 37 - Comparison of low and high maturity and the five maturity stages (Jeston.& Nelis, 2006) - content
removed for copyright reasons
According to the authors, companies that are in the ‘Initial’ stage have either no or
unstructured attempts towards BPM (some characteristics of this type of organisations:
Individual efforts; minimal employee involvement; low reliance on external BPM
expertise; and high levels of manual interventions and workarounds); organisations in the
‘Repeatable’ stage are starting to build BPM capabilities and are increasing the number
of employees that are seeing the organisation with the process perspective (some
characteristics of this type of organisations: first documented processes; Recognition of
the importance of BPM; Increased involvement of executives and top management; and
increased reliance on external BPM expertise); companies in the ‘Defined’ stage have the
BPM even more developed and almost all the employees possesses the process view
(some characteristics of this type of organisations: focus on the management of the early
phases of the process lifestyle; use of elaborate process modelling tools; comprehensive
and formal BPM training sessions; and less reliance on external expertise); organisations
in the ‘Managed’ stage have already implemented the BPM along the whole organisation
and is starting to enjoy the benefits of having the BPM aligned to the company strategy
(This kind of organisations has some of this characteristics: an established Process
Management Centre of Excellence that maintains standards; Exploration of business
process controlling methods and technologies; formal, designated process management
positions; Continuous extension and consolidation of process management initiatives;
and Minimal reliance on external expertise); and companies in the ‘Optimised’ stage are

93
enjoying the benefits of having the BPM entrenched as a core part of both strategic and
operational management within the organisation (this kind of organisations has some of
this characteristics: Process management is a part of managers’ activities, accountabilities
and performance measurements; wide acceptance and use of standard methods and
technologies; and incorporates customers, suppliers, distributors and other stakeholders
(Gallotta, 2016).
However, the potential use of the maturity assessment tool is not exclusive to
Management or BPM, some researchers (such as Ness et al., 2007; Singh et al., 2012;
Silvius and Schipper, 2010) have already proposed sustainability maturity assessments
(Gallotta, 2016).
According to Ness et al. (2007) “The purpose of sustainability assessment is to provide
decision-makers with an evaluation of global to local integrated nature–society systems
in short and long-term perspectives in order to assist them to determine which actions
should or should not be taken in an attempt to make society sustainable”. According to
Singh et al. (2012), there are many sustainability assessment methodologies for
evaluating the performance of companies, such as The World Business Council for
Sustainable Development (WBCSD), the Global Reporting Initiative (GRI) and
Organisation for Economic Co-operation and Development (OECD). According to the
author, indicators or metrics can be used to assess and evaluate performance; provide
trends on improvement as well as warning information on declining trend for the various
dimensions of sustainability; and provide information to decision-makers to formulate
strategies and communicate the achievements to the stakeholders.
Silvius and Schipper (2010) developed a maturity model to assess, monitor, and improve
the incorporation of the principles and concepts of sustainability in projects. The model
comprises a series of questions to cover aspects of the respondent, the project that is
assessed, the organisational context of the project and the actual assessment questions.
The model assesses the level (resources, business process, business model,
products/services) on which the different aspects of sustainability are considered in the
project. The sustainability aspects are grouped into economic aspects, environmental
aspects and social aspects. Presenting the project’s maturity separately on these three
pillars of sustainability (Gallotta, 2016). Figure 38 shows the conceptual model of the
assessment.

94
Figure 38 - Reporting format showing actual levels (dark colours) and desired levels (light colours) of integration of
sustainability aspects (Silvius & Schipper, 2010) - content removed for copyright reasons
According to Silvius & Schipper (2010), the approach indicates that sustainability can be
realised in different levels: (1) level of the resources, (2) level of the business processes,
(3) level of the business model, and (4) level of project
The first level is the level of the resources used in the project. For instance, selecting
different resources to reach the same functionality while being less harmful to the
environment, (e.g. using hybrid cars instead of regular fuelled cars). These actions can,
for example, reduce the environmental impact of the project. They reduce the negative
impact of the project but do not take away the cause of non-sustainability.
The second level is related to the business processes. A more sustainable process takes
away the cause of non-sustainable effects instead of just limiting or compensating them.
For example, using teleconferencing for project meetings, instead of travelling to the
meeting location.
The third level of consideration is looking at the business model in which the project is
delivered. For instance, changing the contract for a project from just the construction
phase to the full lifecycle may have favourable effects on the project delivery because of
the emphasis on the full lifecycle of the project and the project deliverable.
The fourth and final level of consideration takes into account the result or deliverable of
the project. This connects the consideration of sustainability in project management to
the sustainability of the project itself. It demonstrates how the project contributes to a
more sustainable society.
Spohn (2004), on the other hand, evaluated the maturity level differently way. The author
proposed a five steps approach (presented in Figure 39), in which organisations that are
in the first level are only committed to the compliance aspects (just following the current

95
regulations); in the second level, organisations start to care about the materials use and
start to use performance indicators; in the third level the organisation uses facility effect
indicators; in the fourth level the organisation start to use indicators in the supply-chain
and product lifecycle; and in the fifth and last level, the organisation start to use
sustainable system indicators to monitor the performance (Gallotta, 2016).
Figure 39 - Sustainability maturity assessment. Source Spohn (2004) - content removed for copyright
reasons
Therefore, in this phase, the organisation will assess which is the current level of
sustainability in their processes and evaluate what is the desired level. This is a crucial
element in the framework since it provides guidance to it (Gallotta, 2016).
5.2.2. Design Phase
The ‘Design’ phase aims to propose the changes in the business processes, design the
expected situation. The first step in the ‘Design’ phase is to define the project scope and
the improvement opportunities, by conducting collaborative meetings aiming at designing
the new processes. After this new design, the metrics are assigned to the related activities
and the implementation strategy is defined. This phase relates the process changes to the
sustainability impacts, demonstrating the direct effects of the process changes into the
metrics defined during the Analyse phase. Figure 40 shows the breakdown of the steps
in this phase.

96
Figure 40 - Breakdown of Design Phase
5.2.2.1. Define Scope
The first stage in the Design Phase is the ‘Define Scope’. According to the PMI (2004),
the project scope statement describes, in detail, the project’s deliverables and the work
required to create those deliverables. The project scope statement also provides a common
understanding of the project scope among all project stakeholders and describes the
project’s major objectives. It also enables the project team to perform more detailed
planning, guides the project team’s work during execution, and provides the baseline for
evaluating whether requests for changes or additional work are contained within or
outside the project’s boundaries. Usually, those aspects are recorded in a table (Gallotta,
2016). Table 10 represents a model of a Project Scope Statement.

97
Table 10 - Project Scope Statement model
Project Scope Statement
Project Name
Date
Project
Justification
Project
Description
Project
Deliverables
Out of Scope items
Project Objectives
Constraints
Assumptions
5.2.2.2. Identify Improvement opportunities
After recording the Enterprise Map and defining the project scope it is required to identify
the improvement opportunities. These improvement opportunities can have different
sources, such as sustainability benchmarks (internal and external) and best practices for
the relevant processes. In this phase, the collaboration character is fundamental, ethical
practice of work is to organise the meetings or workshops with people affected by the
business processes (not only the ones responsible for the specific business process but
with people from connected processes as well). E.g. if the organisation is studying the
process ‘Order Entry’ and it relates to the process ‘Outbound Logistics’, the meeting must
contain the business owners and business analysts from ‘Order Entry’ process and at least
one person representing the ‘Outbound Logistics’ process (preferably the business owner
or someone with full understanding on the process) (Gallotta, 2016).
According to Scheer, A. (2006) for each meeting, for example, an invitation including an
agenda must be sent to all colleagues concerned. After the meeting, the minutes of the
meeting must be sent to all participants within 24 hours. All work processes must be
designed efficiently and any form of waste avoided. These processes are documented and
are transparent to each employee. It is the aim to guarantee a constant, uniform process
flow and assure high quality.

98
5.2.2.3. Design TO-BE process
After identifying the improvement opportunities, the TO-BE process (expected) is
designed. A good work practice in this particular step is to keep the process designs in a
shared folder, or shared space within the organisation so everyone could be able to check
and make sure that the proposed design reflects the best-case scenario for the proposed
processes (Gallotta, 2016).
5.2.2.4. Record predicted metric values
After designing the new to-be process, the metrics are recorded to the new processes
predicting the new metric values per process (Gallotta, 2016).
5.2.2.5. Define Implementation Strategy
The final stage in the Design phase is to define the implementation strategy. There are
four types of Implementation scenarios that can be conducted in project implementation:
‘Big Bang’, ‘Parallel’, ‘Relay’ and a combination of one or more strategy. According to
Jeston & Nelis (2006) in the ‘Big Bang’ approach the proposed change is introduced in
one major overhaul; in the ‘Parallel’ method the proposed change is introduced step by
step (e.g. by location or business unit), with the next roll-out starting before the previous
one is finished; in the ‘Relay’ approach the proposed change is introduced step by step,
with each roll-out only starting once the previous one has been completed; and the last
scenario is a combination of the abovementioned implementation approaches (Gallotta,
2016).
According to the authors, ‘Big Bang’ has the advantage of being fast to implement,
although the risk of disruption to the business is high; ‘Parallel’ method provides a
relatively fast implementation and the ability to make use of lessons learned from
preceding implementations is valuable, even though additional resources will be required
to assist with overlapping implementations, and the coordination of these simultaneous
roll-outs will be high and potentially complex; in the ‘Relay’ approach lessons learned
from the preceding roll-out(s) can be fully taken into account and the same
implementation team can be used, the negative aspect from this technique is that it
involves lack of speed, as this implementation could, depending upon the circumstances,
take some time to complete; and the ‘Combination’ approach provides the organisation
with the benefits of tailoring the roll-out to the specific situation; flexible and yet still
manageable (Gallotta, 2016).

99
5.2.3. Implement Phase
The ‘Implementation’ phase is when the project is in fact implemented, when the
technical execution happens, so it is when the business processes will be transformed to
‘green business processes’ (strong commitment with Project Management and Change
Management aspects) and further executed, incorporated by the organisation day by day
routine (go-live scenario). During this phase, the tasks need to be followed up and if
changes are required, they need to be recorded in a change request form that should be
addressed and incorporated (or not, depending on the decision of the project committee)
in the project scope. The changes aim to improve the sustainability performance,
represented by the metrics. Figure 41 shows the breakdown of the steps in this phase.
Figure 41 - Breakdown of Implement Phase
5.2.3.1. Transform Business Processes
The executing phase brings the transformation of the business processes. In this step, all
the proposed designs come to life concerning business processes. According to Jeston and
Nelis (2008) projects often fail because the implementation is merely restricted to being
one of the closing steps of the project, and is mainly centred on one-way communication
to inform the users and other stakeholders of the benefits of the new solution for the
organisation. Moreover, most activities are focused on ensuring that users can use the
new solution (e.g. training), and not on whether they want to use it (e.g. motivation of

100
staff). The best way to ensure smooth implementation is to start considering
implementation issues at the initiation of the project, by adopting Project Management
guidelines (Gallotta, 2016).
Before defining Project Management, it is essential to define the concept of Project.
According to Slack et al. (2013) a project is a set of activities with a defined start point
and a defined end state, which pursues a defined goal and uses a defined set of resources.
Technically many small-scale operations management endeavours, taking minutes or
hours, conform to this definition of a project.
The Association of Project Management Body of Knowledge (APM BoK), defines
Project Management as, “the planning, organisation, monitoring and control of all aspects
of a project and motivation of all involved to achieve the project objectives safely and
within agreed time, cost and performance criteria” (Association of Project Management
(APM), 1995). The Project Management Institute (2004), on the other hand, defines
Project Management as the application of knowledge, skills, tools and techniques to
project activities to meet project requirements. Project management is, therefore, the
accomplished of a specific work through the application and integration of the project
management processes of initiating, planning, executing, monitoring and controlling, and
closing. Managing a project involves identifying requirements; establishing clear and
achievable objectives; balancing the competing demands for quality, scope, time and cost;
and adapting the specifications, plans, and approach to the different concerns and
expectations of the various stakeholders (Gallotta, 2016).
Several studies, such as Box & Platts, (2005), Margherita (2014) and Lee & Dale (1998) have linked successfully Project Management and Business Process Management.
According to Box & Platts (2005) creating and maintaining alignment of purpose for
change initiatives in the business processes requires an understanding of the environment
in which the change is being made, good leadership and effective project management.
Margherita (2014) states that project management system of the organisation can support
its process management system by providing a structure and method of the process as a
set of parts which can be conceived as “micro-work packages” or “micro-projects”. More
than that, the process management can support project management by providing the
method for implementing lifecycle, state of advancement and work modelling. According
to Lee & Dale (1998), Effective project management plays a critical operational, and
sometimes strategic, role in BPM implementation and in handling organisational change
(Gallotta, 2016).
101
However, the project management itself does not ensure the success of the
implementation. Other aspects have a crucial role, such as leadership and change
management. According to Epstein et al. (2010), leading corporations such as Nike, P&G,
The Home Depot Inc., and Nissan Motor Co. are successful in implementing their
sustainability initiatives primarily because of committed leadership, organisational
culture and people. Moreover, though sensitive to stakeholder concerns and impacts,
these leading companies are internally committed to improving corporate sustainability
performance. All four companies incorporate sustainability issues into their corporate
strategies; they have specific sustainability strategies and aligned organisational
structures; performance measurement systems with some social and environmental
metrics are also in place. However, leadership and organisational culture have been found
to be the critical determinants of successful management of the various trade-offs middle
managers face when they try to simultaneously manage social, environmental, and
financial performance (Gallotta, 2016).
5.2.3.2. Execute the new Processes
After transforming the business processes, the organisation starts to adopt the new
practices in the routine, by executing these new processes. This adoption depends on the
type of implementation defined in the step 5.2.2.5. Define Implementation Strategy.
Usually, before the ‘go-live’ of the solution, organisations make some tests, dry runs (or
pilot). A similar example is found in the television industry, in which the studios prepare
‘pilots’ of TV shows and, depending on the acceptance of the audience, they carry on
with other episodes. In organisations, these dry runs may occur in small business unities
or with small control groups and, only after that, the solution has the official ‘go-live’
(Gallotta, 2016).
5.2.4. Monitor & Control Phase
The ‘Monitor & Control’ phase contains the steps to evaluate the status of the
sustainability implementation. In this phase, it is initially monitored the organisational
performance (using dashboards to analyse objectives, resources and results). After this
step, the process performance (based on the Process Performance Indicators) is monitored
and the metrics are monitored. Afterwards, once the value is fully realised (all the
objectives are realised, the comparison between actual metric values with initial and
predicted ones) the sustainability implementation project is formally closed. However,
since the sustainability requirements (from the market, customers, and regulations) are

102
always changing, it is essential to have a step to identify optimisation opportunities,
giving a cyclic characteristic to the framework. Figure 42 shows the breakdown of the
steps in this phase.
Figure 42 - Breakdown of Monitor & Control Phase
5.2.4.1. Monitor and analyse organisational performance
The first step in the ‘Monitor & Control Phase’ is to ‘Monitor and analyse the
organisational performance’. According to Draghicia et al. (2014), performance
assessments and audits define the system/organisation perspective that incorporates the
complexities of various dynamic and interacting processes of modern organisations.

103
Linkage (2013), proposed a framework (Figure 43) to provide a practical structure for
organisational analysis, framing the right questions as focused on each of the five key
elements: (1) Strategy: Does my organisation know where it is headed (quantitative and
qualitative data)? (2) Execution: What are the issues around getting things done? (3)
Systems: What is blocking my organisation in terms of process, structure, etc.? (4)
Growth: Where is my organisation’s growth going to come from? (5) Culture: What does
my organisation stand for? What type of change is the organisation (and its people)
currently experiencing? The general tendency of the organisational performance
approach takes into consideration different organisational dimensions (customers and
stakeholders satisfaction, human resources performance, definition of key performance
indicators, continuous improvement, and most economical and financial indicators, all
aspects integrated into the strategic management system) (Brudan, 2010).
Figure 43 - Organisational performance framework (Linkage, 2013) - content removed for copyright
reasons
Draghicia et al. (2014), on the other hand, proposed a model for the organisational
performance management (focus on the evaluation, analysis and monitor activity) in the
context of the actual trends in the field. The proposed framework (Figure 44) takes into
consideration three organisational determinants: objectives, resources and results. The
relation between them defines three critical organisational characteristics: efficiency
(described in our approach from the perspective of intellectual capital management),
effectiveness and pertinence (diagnosis from the perspective of organisational and
manager/leader behaviour) (Gallotta, 2016).

104
Figure 44 – Framework to monitor organisational performance. Adapted from Draghici (2014) - content
removed for copyright reasons
5.2.4.2. Monitor and analyse process performance
After monitoring and analysing the organisational performance, the organisation need to
monitor and analyse the process performance. According to del-Río-Ortega et al. (2013)
to improve processes, it is essential to evaluate their performance, since it helps the
organisation to define and measure progress towards their goals. Performance
requirements on business processes can be specified by means of Process Performance
Indicators (PPIs), a particular case of KPIs. PPIs can be defined as quantifiable metrics
that allow evaluating the efficiency and effectiveness of business processes. They can be
measured directly by data that is generated within the process flow and are aimed at the
process controlling and continuous optimisation (Rosenberg et al. 2011).
According to del-Río-Ortega et al. (2013) and Franceschini et al. (2007) four
requirements for the definition of PPIs can be established: expressiveness (the definition
should be unambiguous and complete); understandability (PPIs should be comprehended
and accepted by process managers and employees); traceability with the business process
(enabling to maintain coherence between both assets, Business Process models and PPIs);
and possibility to be automatically analysed (allowing thus not only to gather the

105
information required to calculate PPI values, but also to infer knowledge on which are
the business process elements related to PPI) (Gallotta, 2016).
After monitoring and analysing the organisational performance, it is required to monitor
and analyse the process performance. del-Río-Ortega et al. (2013) proposes a PPINOT
model, which allows a definition of PPIs (Process Performance Indicators) and correlates
them with business processes. After modelling the process, the first step is to define the
PPIs that are necessary to evaluate it; Once PPIs are defined, the next step is to decide
how to calculate them from the data that is generated during the execution of the process;
After deciding how measures are obtained, they must be actually gathered during the
execution of the process so that the values of the PPIs can be calculated based on them;
and Finally, PPIs can change because of an evolution of the business process and, hence,
they should be updated accordingly, or they can also change independently of the business
process (Gallotta, 2016).
5.2.4.3. Monitor Metrics
After monitoring and analysing process performance, the organisation will monitor the
metrics in the new processes. Ahmed and Sundaram (2012) developed a system that
supports the monitoring and controlling of the organisational, sustainability metrics using
various dynamic dashboards available through a number of reporting sub-systems such
as Ad-hoc Reports, Organisation Benchmark Report, Organisation Performance
Indicators, Strategic Performance Indicators, Process Benchmark Report, Ad-hoc Report
Documents, Strategy Documents, Design Documents, Transform Documents, metrics
Report, Monitor and Control Report and All Saved Reports. The dashboards are easy to
use monitoring and controlling devices which have rich dynamic runtime features, as
shown in (Gallotta, 2016). The dashboards (Figure 45) allow filtering using any or all of
the attributes, namely organisation, metrics, and business process. It displays a list of
databases and datasets associated through configuration.

106
Figure 45 - Example of a Monitoring Dashboard. Adapted from Ahmed and Sundaram (2012) - content removed
for copyright reasons
5.2.4.4. Realise value
After monitoring the metrics, it is possible to evaluate the actual state of the sustainability
implementation. According to Jeston & Nelis (2008), a project is only complete once the
reason for its existence has been achieved and it has been handed over to the business in
such a way that the business can now sustain the project outcomes. If the initial goals are
not fully realised, it is necessary to investigate the reasons and start the cycle in the
missing point (e.g. the problem was during the ‘implement’ phase, so an action plan is
required to overcome this problem) (Gallotta, 2016).
5.2.4.5. Identify optimisation opportunities
Some optimisation techniques for improvement found in the literature include ‘scatter
diagrams’, cause-effect diagrams’, ‘Pareto diagrams’, and ‘why-why analysis’.
According to Slack et al. (2013), ‘scatter diagrams’ provide a quick and simple method
of identifying whether there is evidence of a connection between two sets of data. This
type of graph only identifies the existence of a relationship, not necessarily the existence
of a cause–effect relationship. According to Slack et al. (2013), ‘cause–effect diagrams’
are a particularly effective method of helping to search for the root causes of problems.
They do this by asking what, when, where, how and why questions. Cause–effect
diagrams (which are also known as ‘Ishikawa diagrams’) have become extensively used
in improvement programmes. This is because they provide a way of structuring group
brainstorming sessions. Often the structure involves identifying possible causes under the
(rather old-fashioned) headings of: machinery, workforce, materials, methods and money.
Pareto’s mathematical model, on the other hand, has become linked with the “80/20” rule
“which states that 20 percent of the known variables will account for 80 per cent of the
107
results” (Basile, 1996). Juran labelled ‘Pareto’ the principle of the ‘vital few and trivial
many’. It is a shorthand name for the phenomenon that in any population which
contributes to a common effect, a relative few of the contributors account for the bulk of
the effect” (Juran, 2001). According to Juran (1954), “in any series of elements to be
controlled, a selected small fraction, in terms of numbers of elements, always accounts
for a significant fraction in terms of effect. In other words, it helps the organisation to
identify what are the areas causing more difficulty in the business.
According to Slack et al. (2013), ‘why–why analysis’ starts by stating the problem and
asking why that problem has occurred. Once the reasons for the problem occurring have
been identified, each of the reasons is taken in turn and again the question is asked why
those reasons have occurred, and so on. This procedure is continued until either a cause
seems sufficiently self-contained to be addressed by itself or no more answers to the
question ‘Why?’ can be generated.
According to Jeston & Nelis (2008), the continuous improvement approach from BPM is
an amalgam of the ones from Lean Six Sigma, TQM and BPR, however, it does not focus
heavily on statistical process control or bottom-up experimentation, but addresses the
basics of process improvement and change.
5.3. Roadmap Enablers The phases and steps described above might not be enough to ensure the success of the
implementation of the Sustainability Initiatives in the business processes. Other aspects
are relevant for this implementation and should be considered along with the project.
These aspects are viewed as enablers to the implementation (they facilitate their
implementation), they are: Governance, Strategy, Methods, Information Technology,
Change Management, Leadership, and Culture.
5.3.1. Governance
Corporate governance involves a set of relationships between a company’s management,
its board, its shareholders and other stakeholders. Corporate governance also provides the
structure through which the objectives of the company are set, and the means of attaining
those objectives and monitoring performance are determined (OECD, 2004). According
to ABPMP (2009) in order to discover and manage key processes, it is essential to have
the organisational discipline to utilise methodologies to document, store, manage and
continuously improve the business processes, particularly those that make up the value
chains (Gallotta, 2016).
108
According to Jeston & Nelis (2008), there are two levels of impact of governance into
BPM initiatives: the impact on the processes and the impact on the management of the
processes. According to the authors, the impact on the process refers to the increasing
rules and regulations applying to processes. The best way to address this is to ensure that
governance is included within the process architecture (which is the foundation for the
design of new processes in the ‘design TO-BE process’ phase and the reviewing and
assessment of the existing processes in the ‘design AS-IS processes’). The Impact on the
management of the business processes refers to the fact that governance forces
organisations to take all the necessary measures to ensure that the processes are managed
and under control and that they are appropriately administered (Gallotta, 2016).
Good governance is vital in every sphere of the society whether it be the corporate
environment or general society or the political environment. According to Aras &
Crowther (2008) a growing number of researchers have recognised that the activities of
an organisation impact upon the external environment and have suggested that such an
organisation should therefore be accountable to a broader audience than merely its
shareholders. Those suggestions probably first arose in the 1970s (Ackerman, 1975) and
a concern with a broader view of company performance is taken by some writers who
evince concern with the social performance of a business, as a member of society at large.
This concern was stated by Ackerman (1975) who argued that big business was
recognising the need to adapt to a new social climate of community accountability, but
that the orientation of business to financial results was inhibiting social responsiveness.
5.3.2. Strategy
‘Strategy’ is not an easy term to define. According to Slack et al. (2013) linguistically the
word derives from the Greek word ‘strategos’, which means ‘leading an army’. Moreover,
although there is no direct historical link between Greek military practice and modern
ideas of strategy, the military metaphor is powerful. Both military and business strategy
can be described in similar ways, and include some of the following: setting broad
objectives that direct an enterprise towards its overall goal; planning the path to achieve
these goals; stressing long-term objectives; dealing with the total picture rather than
stressing individual activities; and being detached from, and above, the confusion and
distractions of day-to-day activities (Gallotta, 2016).
In Operations, according to Slack et al. (2013) strategy concerns the pattern of strategic
decisions and actions which set the role, objectives and activities of the operation.
According to ABPMP (2009) in BPM, the alignment between business process objectives

109
and enterprise strategy is essential to realise fully the BPM benefits. Customer
requirements must drive business strategy, metrics, objectives and organisation. Precise
definition of end-to-end business processes with process owners should include extended
business processes and more detailed business activities (or work packages) (Gallotta,
2016). According to Wijethilake (2017), theoretically, proactive sustainability
strategy1 improves corporate sustainability performance through efficient use of
resources, increased cost advantage, reduced waste and discharge, promotion of social
reputation, improved customer preferences, and generation of new innovative capabilities
(Banerjee, 2001, Bhupendra and Sangle, 2015, Christmann, 2000, Judge and Douglas,
1998, Sharma and Vredenburg, 1998).
5.3.3. Methods
According to Jeston & Nelis (2008), methods, in the context of BPM, have been defined
as the approaches and techniques, which support and enable consistent process actions.
Distinct methods can be applied to principal, discrete stages of the process lifecycle. An
advantage of associating the method capability with a specific process lifecycle stage is
the resultant ability to assess methods that serve a particular purpose, rather than purely
all methods relating to BPM. For instance, it is possible to evaluate specific methods for
designing processes as distinct from those used for improving processes. This form of
analysis is considered to be particularly beneficial, given the common practice of methods
being developed, marketed and implemented to meet the needs of a specific process
lifecycle stage. Process methods can be observed in several moments of the
implementation: for the process design and modelling; for the process implementation
and execution; for the monitoring & control (e.g. use of dashboards); and in process
improvement.
5.3.4. Information Technology
According to Jeston & Nelis (2008) Information technology (IT) refers to the software,
hardware and information management systems that support and enable process
activities. Similarly, to the methods maturity assessment, the IT components focus on the
specific needs of each process lifecycle stage and are evaluated from viewpoints such as
customizability, suitability of automation and integration with related IT solutions. IT
solutions can be observed in several moments of the implementation: for the process
design and modelling; for the process implementation and execution; for the monitoring
& control (e.g. use of dashboards); and in process improvement (Gallotta, 2016).

110
According to ABPMP (2009), once a process has been designed, putting that process into
operation may involve a number of information technology support applications. The use
of systems to support the execution of BPM in an organisation’s internal operations and
activities involving interactions with trading partners and customers may considered in
the following categories: Electronic Document Management Systems (EDMS) that
capture, organise and provide information required for the execution of steps in a process;
electronic forms for information capture and distribution; workflow routing and
management; and workgroup collaboration. The integration of management systems
allows organisations to be simultaneously coherent and consistent in satisfying the
demands of sustainability in an optimal way (Vivanco et al., 2018, Rebelo et al.,
2016, Salomone, 2008).
5.3.5. Change Management
Since every implementation project involves changes in the organisation, Change
Management aspects need to be considered in the project. According to Slack et al. (2013)
refers to the need for the implementation team to formally prepare a change management
programme and be conscious of the need to consider the implications of such a project.
One vital task is to build user acceptance of the project and a positive employee attitude.
This might be accomplished through education about the benefits and need for the new
processes. Part of this building of user acceptance should also involve securing the
support of opinion leaders throughout the organisation (Gallotta, 2016).
According to BPMNP (2009), change management for BPM initiatives should directly
address the five S aspects (strategy, structure, system, staffing and shared values) aligned
with organisation strategy, structure, and environment. This holistic approach helps the
organisation achieving intended objectives and minimising unintended consequences
(Gallotta, 2016). According to Doppelt (2003), implementing sustainable business
practices is about much more than the technical, financial, or political. It is about the
human factors. Doppelt found that the critical missing ingredient in the adoption of
sustainability measures is organisational and cultural change. Sustainability measures
require a paradigm shift from the traditional linear “take-make-waste” economic model
to a circular “borrow-use-return” system. These fundamental changes in operations and
organisational design often require substantial changes in culture.

111
5.3.6. Leadership
According to ABPMP (2009) the role of executive leadership is critical to business
process management initiatives. The executive leader sets the vision, tone and pace of
business process improvement. He determines the direction and strategy of BPM,
focusing the enterprise on its broader objectives. He is the responsible for allocating
resources and reward success. He may unify the various missions and groups throughout
the enterprise, appoint and empower process owners or other individuals playing key
roles in the management of business processes. Executive leaders may even be process
owners themselves, owning and institutionalising the process of process management.
They could act as ‘champions’ inspiring the enterprise to change, sometimes by creating
a sense of urgency to overcome scepticism and resistance. To do this, they must
communicate the case for process management and remove obstacles, which may impede
progress toward the goal. They are responsible for creating the environment for success,
sometimes through influence and persuasion, other times by resolving conflicts and
removing barriers. The critical role for leadership in sustainability is to encourage the
introduction and reflective consideration of deeper contextual information (ecological,
social, cultural, and geographic) into the field of salience for collective meaning making:
helping to develop a ‘biosphere consciousness’ (Kurucz et al., 2017; Rifkin, 2009).
5.3.7. Organisational Culture
According to Slack et al. (2013), an organisation’s culture is usually taken to mean its
shared values, ideology, and pattern of thinking and day-to-day ritual. Different
organisations will have different cultures stemming from their circumstances and their
history. According to ABPMP (2009), every organisation has a culture that impacts and
is impacted by the internal and external processes of that organisation. That culture
includes how the work is performed and what motivates the members of the organisation
to do the work. By changing the process, the culture may also change. This may lead to
unintended consequences as new processes are put into place. Part of the ‘Analyse’ phase
is to ask questions that will help the analysis team understand the culture of the
organisation and those unwritten rules that determine how and by who work is really
accomplished. The goal of these discussions is to understand what will happen to the
organisation when the process is changed.
Several studies have pointed to internal organisational pressures for the adoption of
sustainability practices, such as staff turnover due to decreasing firm loyalty and
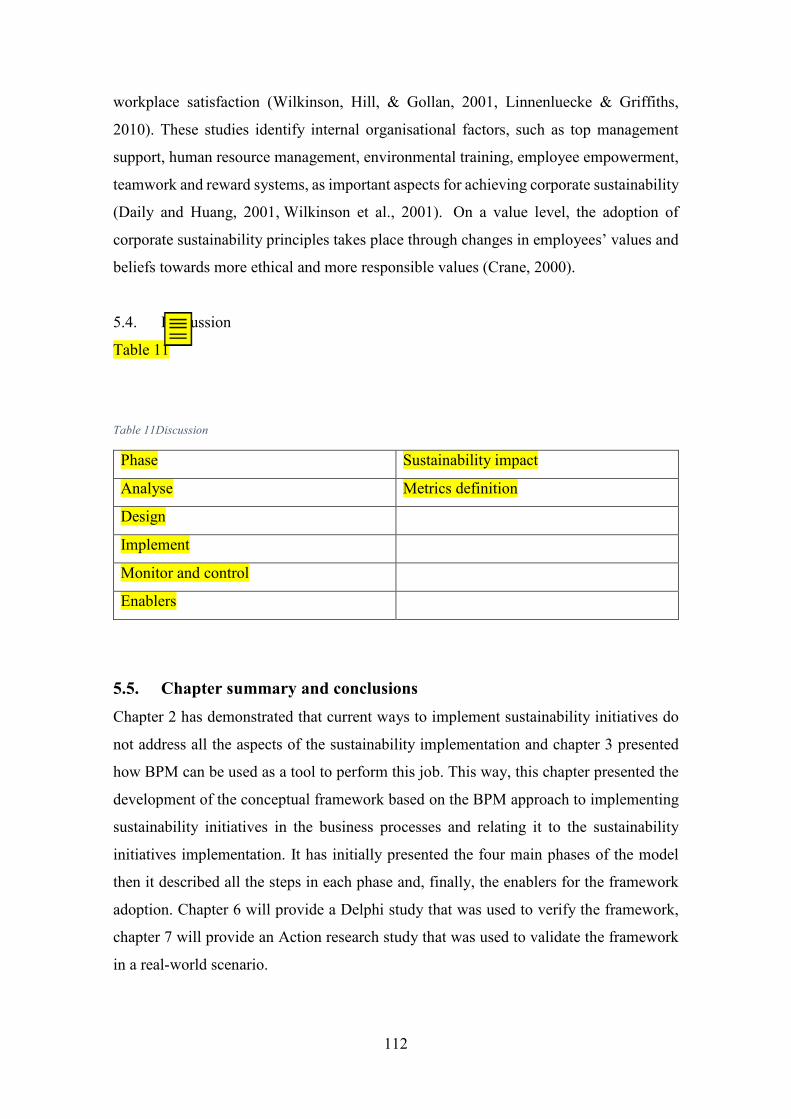
112
workplace satisfaction (Wilkinson, Hill, & Gollan, 2001, Linnenluecke & Griffiths,
2010). These studies identify internal organisational factors, such as top management
support, human resource management, environmental training, employee empowerment,
teamwork and reward systems, as important aspects for achieving corporate sustainability
(Daily and Huang, 2001, Wilkinson et al., 2001). On a value level, the adoption of
corporate sustainability principles takes place through changes in employees’ values and
beliefs towards more ethical and more responsible values (Crane, 2000).
5.4. Discussion
Table 11
Table 11Discussion
Phase Sustainability impact
Analyse Metrics definition
Design
Implement
Monitor and control
Enablers
5.5. Chapter summary and conclusions Chapter 2 has demonstrated that current ways to implement sustainability initiatives do
not address all the aspects of the sustainability implementation and chapter 3 presented
how BPM can be used as a tool to perform this job. This way, this chapter presented the
development of the conceptual framework based on the BPM approach to implementing
sustainability initiatives in the business processes and relating it to the sustainability
initiatives implementation. It has initially presented the four main phases of the model
then it described all the steps in each phase and, finally, the enablers for the framework
adoption. Chapter 6 will provide a Delphi study that was used to verify the framework,
chapter 7 will provide an Action research study that was used to validate the framework
in a real-world scenario.
Bruno Gallotta
Discussion about chapter and relation to sustainability
113
Chapter 6 – Framework Verification using Delphi Study
6.1. Introduction Chapter 5 presented the development of the conceptual framework based on the BPM
approach to implementing sustainability initiatives in the business processes. This chapter
presents the verification of the framework using the Delphi method.
The Delphi technique seeks to obtain consensus on the opinions of experts, termed panel
members, through a series of questionnaires. As part of the process, the responses from
each round are fed back in summarised form to the participants who are then given an
opportunity to respond again to the emerging data. This chapter explains the method.
After this, it shows the manner to select the participants and how to classify them as
specialists. The chapter then explores the modus to create the questionnaire. Finally, the
chapter provides the results of the study (both round 1 and round 2).
6.2. The Delphi method The Delphi method relies on the use of expert opinions “to obtain the most reliable
consensus” via a series of questionnaires with controlled feedback within a Panel (Dalkey
and Helmer, 1963 and Hasson et al.2000), According to Linstone and Turoff (1975), the
Delphi technique is " a method for structuring a group communication process so that the
process is effective in allowing a group of individuals, as a whole, to deal with a complex
problem”. The purpose of this technique is either forecasting/issue identification or
concept/framework development (Okoli and Pawlowski, 2004 and Schmiedel et al.2013).
The Delphi method was originated in the 1950s by the RAND Corporation (Linstone and
Turoff, 1976), became highly popular from the mid-90s (Habibi et al.2014) and according
to McKenna (1994), the Delphi method has been used in over 1,000 published research
projects.
According to Krigsholm, et al. (2017) there are several variants of the method, but all
Delphi studies have some key elements in common. First, a Delphi study consists of
multiple rounds of formal questionnaires, and the respondents are anonymous to one
another. Second, a Delphi study builds upon iterative, controlled feedback. That is, after
each round experts can revisit and rethink their answers in the light of the information
provided. Third, a Delphi study presents a statistical summary of the group’s responses.
The literature presents a scattered view of the number of participants in the study. Hogarth
(1978) claims that between six and twelve members are the ideal number of participants
for the Delphi study, according to Clayton (1997), if a mixture of experts with different

114
specialties is used, between five and ten members are enough. According to Habib et al.
(2014) while some Delphi studies considered less than 10 members in their panels (such
as Malone et al.2005 and Strasser et al.2005), other studies included more than 100
participants (such as Kelly et al.2005 and Meadows et al. 2005). The Delphi panel is
obtained with the participation of the specialists. The specialists are individuals with
knowledge and expertise of the study subject.
Figure 46 presents the methodology that was carried out for this study.
Figure 46 Delphi study method
In order to quantify the expert’s opinions, it was used the Likert scale. According to
Wadagave et al. (2016), Likert scale is a psychometric response scale primarily used in
questionnaires to assess subject’s perception. Most commonly seen as a 5-point scale
(Ordinal data), each level on the scale is assigned a numeric value (Jamieson, 2004).
For the maters of this study, it was used the following definition:
1 = strongly disagree
2 = somewhat disagree
3 = neither disagree or agree
Delphi Study round 2Web-based 4 questions questionnaire
Participants agreement for indicators on a 5 point Linkert scale (n=15 respondents). Response analysis for consensus.
Delphi Study round 1Web-based 8 questions questionnaire
Participants agreement for indicators on a 5 point Linkert scale (n=21 respondents). Response analysis for consensus.
Selection of experts
Specialists in the area of sustainability and operations management (n=93 specialists)
Definition of the problem
How can sustainability and operations management experts help to improve the sustainability implementation framework

115
4 = somewhat agree
5 = strongly agree
Therefore, the average response value is defined by the following formula:
𝐴𝐴𝐴𝐴𝐴𝐴𝐴𝐴𝐴𝐴𝐴𝐴𝐴𝐴 = ∑ 𝑟𝑟𝑟𝑟𝑟𝑟𝑟𝑟𝑟𝑟𝑟𝑟𝑟𝑟𝑟𝑟 𝑖𝑖𝑟𝑟𝑖𝑖𝑟𝑟𝑖𝑖𝑛𝑛0
𝑟𝑟
In order to convert this average into percentage, it was used the following formula:
𝑃𝑃𝐴𝐴𝐴𝐴𝑃𝑃𝐴𝐴𝑃𝑃𝑃𝑃𝐴𝐴𝐴𝐴𝐴𝐴 = 𝐴𝐴𝐴𝐴𝑟𝑟𝑟𝑟𝐴𝐴𝐴𝐴𝑟𝑟5
*5 because it is the maximum numeric value of the scale. If it were defined a 7-point
scale, the denominator would be equals to n x 7.
Exemplifying:
If a particular question had the following answers
Somewhat Disagree
Somewhat Agree
Strongly Agree
Somewhat Agree
Neither agree or disagree
The answers, in numeric ways would be:
Somewhat Disagree 2
Somewhat Agree 4
Strongly Agree 5
Somewhat Agree 4
Neither agree or disagree 3
The average would be:

116
𝐴𝐴𝐴𝐴𝐴𝐴𝐴𝐴𝐴𝐴𝐴𝐴𝐴𝐴 = ∑ 𝑟𝑟𝑟𝑟𝑟𝑟𝑟𝑟𝑟𝑟𝑟𝑟𝑟𝑟𝑟𝑟 𝑖𝑖𝑟𝑟𝑖𝑖𝑟𝑟𝑖𝑖60
6
𝐴𝐴𝐴𝐴𝐴𝐴𝐴𝐴𝐴𝐴𝐴𝐴𝐴𝐴 = 3.66
The percentage would be:
𝑃𝑃𝐴𝐴𝐴𝐴𝑃𝑃𝐴𝐴𝑃𝑃𝑃𝑃𝐴𝐴𝐴𝐴𝐴𝐴 = 3.665
𝑃𝑃𝐴𝐴𝐴𝐴𝑃𝑃𝐴𝐴𝑃𝑃𝑃𝑃𝐴𝐴𝐴𝐴𝐴𝐴 = 73.33%
Since the main objective of the Delphi study is to obtain consensus, it is important first
to define the concept of consensus. A consensus is in essence, a general agreement, a
unanimity, the majority of opinion of a determined group. Some authors have suggested
the level of consensus for the Delphi study: Loughlin and Moore (1979) suggest it should
be set at 59% agreement amongst respondents, McKenna (1994) suggests 51%, and Orton
(1981) suggested a level of 55%. Robert and Schermers, et al. (2011) consider different
types of majority, such as greater than one half (more than 50%), three fifths (60%), two
thirds (66%) and three quarters (75%). Therefore, any question with a score of acceptance
higher than 75% was considered as a consensus.
After checking the agreement level, if the question has a score lower than 75% it is
flagged for the second round. If the score is higher than 75%, the comments were analysed
using the textalyser tool to identify the prominent keywords. Finally, the keywords are
analysed and discussed. Figure 47 represents the analysis method employed by the
Delphi study. For the qualitative questions, the initial step is to check whether the
recommendation should be considered. If so, the comments were analysed using the
textalyser tool to identify the prominent keywords. Finally, the keywords are analysed
and discussed.

117
Check if the agreement level
is over 75%
Flag as a new question for the
second round
Use textalyser tool to identify
coments’ keywords
Use textalyser tool to identify
comments’ keywords
Analyse keywords
End
Analyse keywords End
Yes
No
Check if the recommendation
should be considered
Use textalyser tool to identify
coments’ keywords
Analyse keywords
End
Discard
Yes
No
Start
Check if the question is
quantitative or qualitative
QuantitativeQualitative
Figure 47Method to analyse the responses of the Delphi study
6.3. Participants Some researchers argue that an expert is “any individual with relevant knowledge and
experience of a particular topic” (Cantrill et al. 1999ˆ). The participants for this study
were found on Linkedin, Research gate, conference publications, and universities
websites. In order to be considered a specialist, the person should occupy 1) Industry:
Experience with leadership positions (such as Manager, Director, position) with more
than 3 years of experience in Sustainability and operations management or 2) Academia:
Involvement with sustainability and operations management for at least 3 years and
publications of the topic. After this, 93 people were identified as potential participants for
the study. Appendix A list the 93 specialists identified.
Since the participants were spread around the globe (Brazil, US, UK, Mexico, etc), the
questionnaire was sent through the following e-mail. In the e-mail, it was explained the
reasons for the study, a brief explanation of the method and the expected time to complete

118
the survey. Figure 48 represents the e-mail that was sent. The e-mails were sent on the
22nd of June 2016 and defined a one-month deadline for completion (first round).
From the total of 93 people contacted, 21 responded to the e-mail and agreed to take part
in the study, representing a total of 29.16% response rate (Figure 49).
Dear researcher,
I am writing to invite you to participate in a Delphi study to support the research A framework for the implementation of sustainability business processes
What is a Delphi study? The Delphi technique seeks to obtain consensus on the opinions of experts,
termed panel members, through a series of questionnaires. As part of the process, the responses
from each round are fed back in summarised form to the participants who are then given an
opportunity to respond again to the emerging data. The Delphi is, therefore, an iterative multi-stage
process designed to combine opinion of specialists into group consensus
This research aims to provide a complete solution to implement sustainability initiatives using the
Business Process Management tool.
As an established expert in this field, we are keen to gain your views on how to construct an ‘expert
consensus’ implementation framework. This will then be validated using the data of other
researchers from the same field of study. It is envisaged that this should take between 10-15 minutes
to complete. After validating the framework, it will be empirically tested using the case study tool.
Your expertise would be extremely beneficial to develop a credible sustainability implementation
framework and I would be very grateful if you would consider participating in this Delphi study.
Please access the questionnaire through the following link
http://goo.gl/forms/91fD20YsLtcrMGAz1
Kind regards
Figure 48 - e-mail sent to the specialists

119
Figure 49 - Participation of the study chart
Among the participants, there were people from different job positions, such as
Researchers, Lecturers, Professors, Managers, Directors and CEOS from different
organisations in several countries.
In total, there were fourteen researchers from the academia and seven from the industry.
The participants were based on six different countries (Brazil, Germany, UK, Mexico,
Sweden and Netherlands). The specialists comprised nine different job positions (Green
developer, management partner, researcher, lecturer, senior lecturer, professor, manager,
sustainability VP and sustainability consultant). Table 12, figure 50, 51 and 52 represent
the participants’ information. Table 12 - - Participants information
Position Institution Country Focus
Researcher USP Brazil Academic
Professor UFBA Brazil Academic
Researcher USP Brazil Academic
Lecturer Senac Brazil Academic
Researcher
Instituto de Pesquisas Energéticas
e Nucleares - IPEN Brazil Academic
Professor UFSC Brazil Academic
Researcher UNIP Brazil Academic
Managing Partner SYSTEMICA Brazil Industry
Professor Uni Autonoma Mexico Academic
21
72
Participation on the study
Participated Didn't participate

120
Sustainability
Consultant BASF Brazil Industry
Manager Nestle Brazil Industry
Sustainability VP Corbetti Geothermal plc Brazil Industry
Sustainability
Consultant SAP Germany Industry
Senior Lecturer Instituto Politécnico Nacional Mexico Academic
Green developer GREENDEV Netherlands Industry
Researcher Volvo Sweden Industry
Researcher Cranfield University UK Academic
Senior Lecturer Brighton UK Academic
Professor Coventry University UK Academic
Professor University of Northampton UK Academic
Lecturer Surrey UK Academic
Figure 50 - Delphi study composition
14
7
Delphi Study Composition
Academics Industry

121
Figure 51 - Delphi study distribution per country
Figure 52 - Delphi study distribution per position
6.4. The Delphi study
6.4.1. Questionnaire creation
The initial challenge to create the questionnaire relies on how to define the appropriate
questions in order to obtain the most accurate and valuable results from the respondents.
The questions need to be concise, direct and should have a logical connection. It should
10
1
2
5
11
Delphi Study distribution per country
Brazil Germany Mexico UK Netherlands Sweden
12
1
1
56
2
21
Delphi Study distribution per position
Green Developer Lecturer Manager
Managing Partner Professor Researcher
Senior Lecturer Sustainability Consultant Sustainability VP

122
englobe all the required information, but in the interim, it should not consume much time
from the respondents.
In a general view, it was identified 8 groups of questions. 1) Sustainability, 2) Process
Improvement, 3) Process Improvement & Sustainability, 4) Analyse phase, 5) Design
phase, 6) Implement phase, 7) Monitor & control phase, and 8) Enablers of the
implementation. Table 13 identifies the groups of questions for the questionnaire. Table 13 - Groups of questions for the questionnaire
Sustainability
Process Improvement
Process Improvement &
Sustainability
Analyse
Identify Business Scenario
Determine and prioritise processes
Define stakeholders
Define project objectives
Define Metrics
Record enterprise map
Record baseline values
Perform Sustainability maturity assessment
Design
Define Scope
Identify Improvement Opportunities
Design to-be process
Record predicted metrics values
Define Implementation Strategy
Implement Transform Business Processes
Execute new processes
Monitor & Control
Monitor and analyse organisational
performance
Monitor and analyse process performance
Monitor Metrics
Realise value
Identify optimisation opportunities
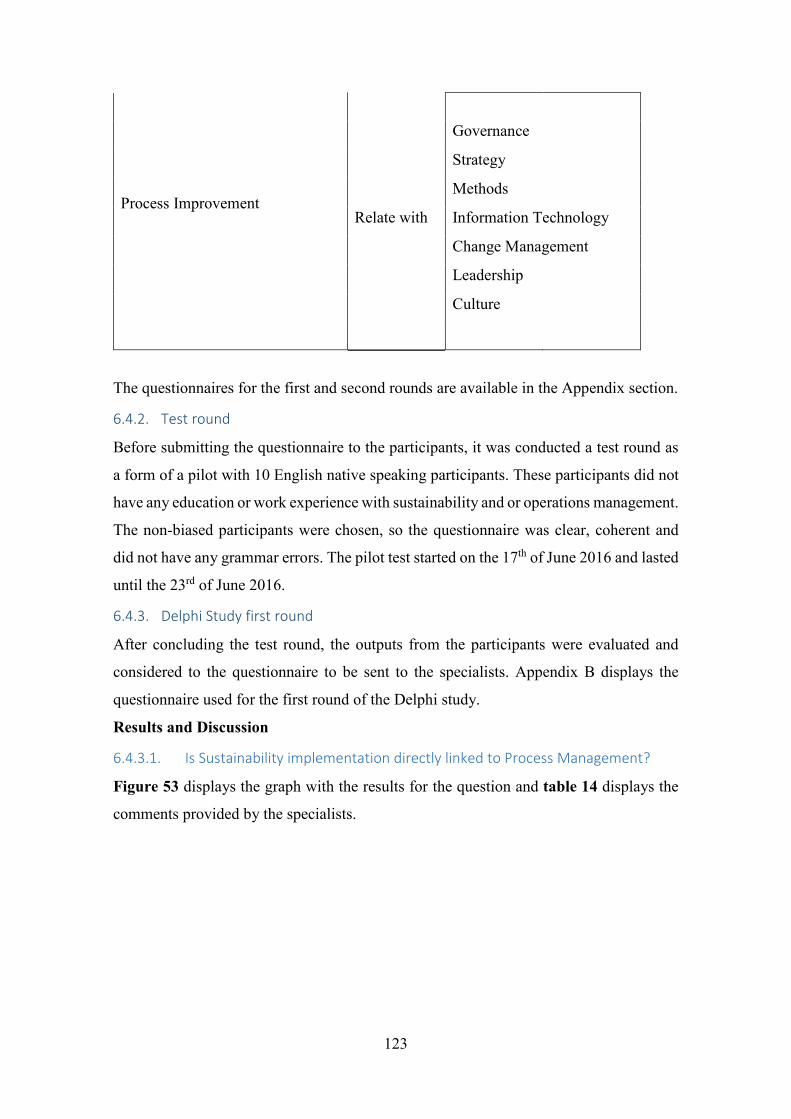
123
Process Improvement
Relate with
Governance
Strategy
Methods
Information Technology
Change Management
Leadership
Culture
The questionnaires for the first and second rounds are available in the Appendix section.
6.4.2. Test round
Before submitting the questionnaire to the participants, it was conducted a test round as
a form of a pilot with 10 English native speaking participants. These participants did not
have any education or work experience with sustainability and or operations management.
The non-biased participants were chosen, so the questionnaire was clear, coherent and
did not have any grammar errors. The pilot test started on the 17th of June 2016 and lasted
until the 23rd of June 2016.
6.4.3. Delphi Study first round
After concluding the test round, the outputs from the participants were evaluated and
considered to the questionnaire to be sent to the specialists. Appendix B displays the
questionnaire used for the first round of the Delphi study.
Results and Discussion
6.4.3.1. Is Sustainability implementation directly linked to Process Management?
Figure 53 displays the graph with the results for the question and table 14 displays the
comments provided by the specialists.

124
Figure 53 - Is Sustainability implementation directly linked to Process Management?
Comments Table 14 Comments on the question –‘Is Sustainability implementation directly linked to Process Management?’
It is not something indispensable, but the process view helps in the sustainability adoption.
Sustainability is a wider concept related to the environment, social, and economic issues.
I want to answer both; I think the sustainability implementation takes several ways into the
organisation. Sometimes the initiative of people is created before any intent of changing the
process and procedures.
In my point of view, when we approach sustainability, we definitively have to rethink our
process (inbound and outbound). That s why sustainability is linked to process management
Sustainability is linked to business processes results in several ways. There are business
processes that directly affect sustainability results, such as product development and
manufacturing; and some business processes can influence business sustainability, for
example, the strategic planning and human resource management processes.
The process should be sustainable in any stage (waste, energy and ultimately reworkable)
If you do not have sustainable processes, how can you talk about sustainability in a company?
No 24%
Yes76%
1. Is Sustainability Implementation directly linked to Process Management?
No
Yes

125
There is a need to create changes, new approaches to sustainability, in the core processes of
companies.
For any implementation, it is more efficient to link with process management, to reduce
waste of materials and waste of time, for example.
I believe that sustainability must be part of the process as a whole. In addition, not that it
should be implemented as separate processes and actions that already exist in the business.
In my view, the implementation activity is a process in itself, which has to be adequately
managed.
It can be linked. However, you also can implement a Process Management without using the
sustainability issues.
It is one part of sustainability implementation but it is the part that will realise many of the
benefits operationally.
Life itself is made of processes. They are everywhere, not only on manufacturing places.
thus, sustainability can be related to every scope of our lives
Table 15 was obtained using the text analyser software and it contains the keywords of
the responses. Figure 54 represents the keywords distribution. Table 15 Keywords list
Word Occurrences Frequency Rank sustainability 14 8.4% 1 process 9 5.4% 2
processes 8 4.8% 3 business 5 3% 4 management 4 2.4% 5 implementation 4 2.4% 5 linked 3 1.8% 6
view 3 1.8% 6 part 3 1.8% 6 you 3 1.8% 6

126
Figure 54Keywords distribution
Sustainability and processes (“process” and “processes”) were the most cited keywords,
with 14 and 17 occurrences, respectively, representing a total of 18.6% frequency. This
makes sense since the question was regarding the linkage between “sustainability” and
“process management”.
6.4.3.2. If Sustainability implementation is related to Process Management, is it
justified to use the Business Process Management (BPM) approach?
Figure 55 displays the graph with the results for the question and table 16 displays the
comments provided by the specialists.
14
98
54 4
3 3 3 3
Occurrences

127
Figure 55 - If Sustainability implementation is related to Process Management, is it justified to use the Business Process
Management (BPM) approach?
Comments Table 16 Comments to the question 'If Sustainability implementation is related to Process Management, is it justified
to use the Business Process Management (BPM) approach?'
It could be a process level. Some processes may help to support key strategies.
I consider it important to integrate the sustainability into the management system yes, but
that also depend on how and in which extent the BPM is applied. That could differ in
organisations.
All company has business processes, but most of them do not explicitly adopt BPM.
Furthermore, there are companies which adopt BPM and have problems in its
implementation and execution. Therefore, if all company has business processes and these
business processes result in corporate sustainability, BPM can contribute to sustainability
implementation.
BPM is about efficiency and cost not about sustainability
You can only verify the success of a sustainability implementation if you have data to
measure, monitor, and control sustainability issues linked to the strategic goals of a
organisation
No 5%
Yes95%
2. If Sustainability implementation is related to Process Management, is it justified to use the
Business Process Management (BPM) approach?
No
Yes

128
it provides a holistic view of the company’s core processes
If with BPM you can manage the process, it is the way to have information and control of
the system, so it is the way to manage sustainability implementation.
Yes, the inclusion of the sustainability issue should be part of the end-to-end process. It
makes no sense to apply sustainability separately, because this complicates the
understanding and the application on a daily basis.
Yes, I think you can use a BPM approach to manage processes properly.
Although I say yes, this is because of the alignment with strategic goals. It may be that more
flexibility is required for sustainability implementation including trial and error and so parts
of it should be used.
You may use the BPM to make the process lean and improve the sustainability of a process
by eliminating unnecessary things that may be identified with the BPM
Table 17 was obtained using the text analyser software and it contains the keywords of
the responses. Figure 56 represents the keywords distribution. Table 17 keywords list
Word Occurrences Frequency Rank
sustainability 11 7.4% 1
bpm 9 6% 2
processes 6 4% 3
you 5 3.4% 4
implementation 5 3.4% 4
process 5 3.4% 4
may 4 2.7% 5
yes 4 2.7% 5
business 3 2% 6
manage 3 2% 6

129
Figure 56 Keywords distribution
Sustainability, bpm and processes were the most cited keywords, with 11, 9 and 6
occurrences, respectively, representing a total of 17.4% frequency. This makes sense
since the question was regarding the use of BPM in over the sustainability topic.
6.4.3.3. Considering the BPM frameworks from Figure 1, Figure 2 and Figure 3, is
it justified to represent the implementation of Sustainability initiatives using
the BPM tool as the framework from Figure 4 suggests?
Figure 57 displays the graph with the results for the question and table 18 displays the
comments provided by the specialists.
11
9
65 5 5
4 43 3
Occurrences

130
Figure 57 - Is it justified to represent the implementation of Sustainability initiatives using the BPM tool as the
framework suggests?
Comments Table 18 Comments to the question '- Is it justified to represent the implementation of Sustainability initiatives using
the BPM tool as the framework suggests?'
It is not possible to read all the items from the figure. They are really small.
It looks a bit complex in Figure 4, but core activities in the middle looks fine.
I believe that you should be careful with 1) analysis and design steps need to be more re ned
in order to avoid overlaps. 2) not clear how to taken into consideration policies or strategies
already implemented, such as environmental policy or code of ethics, or value map, like
materiality, which have been hugely used by lead rms.
Yes, it seems ok, but I think this is a leading question:-) And it doesn’t consider the current
state of the organisation, such as culture, other strategies etc. I think that would influence
how well the process can be followed.
The inclusion of sustainability in BPM lifecycle is crucial for sustainable business processes.
Nowadays, when we talk about corporate sustainability it is essential mentioning the product
lifecycle perspective and its value chain. Some business processes determine the value chain
and most of the environmental and social impacts occurs along the product lifecycle.
No 14%
Yes86%
3. Is it justified to represent the implementation of Sustainability initiatives using the BPM tool as the
framework suggests?
No
Yes

131
Therefore, BPM has to promote the inclusion of lifecycle thinking into business process. One
suggestion is to include this concept in the middle of your conceptual framework as a
discipline (e.g. lifecycle management).
sustainability should be part of the design
Actually, I would prefer something simpler than that.
it contains the specific actions to the desired implementation
Figure 4 is more complete related to sustainable process since the initial part of the program
(for example Analyse: Perform Sustainable Maturity Assessment), but Fig 4 is also a "mix"
in most of other processes compared to Figs 1, 2 and 3.
I believe it makes sense to apply this process in the implementation of sustainability. It
seemed a complete process and tying the initiative.
I think Fig. 4 captures well aspects from Fig. 1 & 2. I am not very sure if it links well with
Fig. 3. The design covers many of the ideas from BPM.
Table 19 was obtained using the text analyser software and it contains the keywords of
the responses. Figure 58 represents the keywords distribution. Table 19 Keywords list
Word Occurrences Frequency Rank
lifecycle 5 2.8% 1
process 5 2.8% 1
fig 4 2.3% 2
sustainability 4 2.3% 2
think 3 1.7% 3
well 3 1.7% 3
bpm 3 1.7% 3
processes 3 1.7% 3
business 3 1.7% 3
sustainable 3 1.7% 3

132
Figure 58 Keywords distribution
This question had a more scattered level of responses. The most cited words were
“process(es)” with 7 occurrences and “lifecycle” and “fig” with 4 occurrences. This
makes sense since the question was regarding the use of the framework to implement
sustainability initiatives in a lifecycle way.
6.4.3.4. Which of the steps would be mandatory to an Analyse phase?
Figure 59 displays the summary of the questions for the Analyse phase, table 20 displays
the analyse phase acceptance rates and table 21 displays the comments provided by the
specialists.
5 5
4 4
3 3 3 3 3 3
Occurrences

133
Figure 59 Analyse phase consolidated
Table 20 0 Analyse phase acceptance (in percentage)
Identify Business Scenario 87.62%
Determine and prioritise
processes 83.81%
Define stakeholders 80.00%
Define project objectives 87.62%
Define metrics 80.00%
Record enterprise map 75.24%
Analyse phase 82.38%
Comments Table 21 Comments regarding the Analyse phase
I think this stage could be a pre-diagnosis step - where is the firm?
One of the issues with Environmental and social metrics is that these seem harder and more
complicated to be defined as metrics.
Does the step "define project objectives" makes reference to business processes
improvements projects or the BPM project? If the response is about the business processes
StronglyDisagree
SomewhatDisagree
Neither agreeor disagree
SomewhatAgree Strongly Agree
Identify Business Scenario 1 1 1 4 14Determine and prioritize processes 1 1 2 6 11Define stakeholders 1 2 3 5 10Define project objectives 1 1 2 2 15Define Metrics 1 1 4 6 9Record enterprise map 0 2 6 8 5
1 1 14
14
1 1 2
6
11
1 2 3
5
10
1 1 2 2
15
1 14
6
9
0 2
6
8
5
Analyse phase
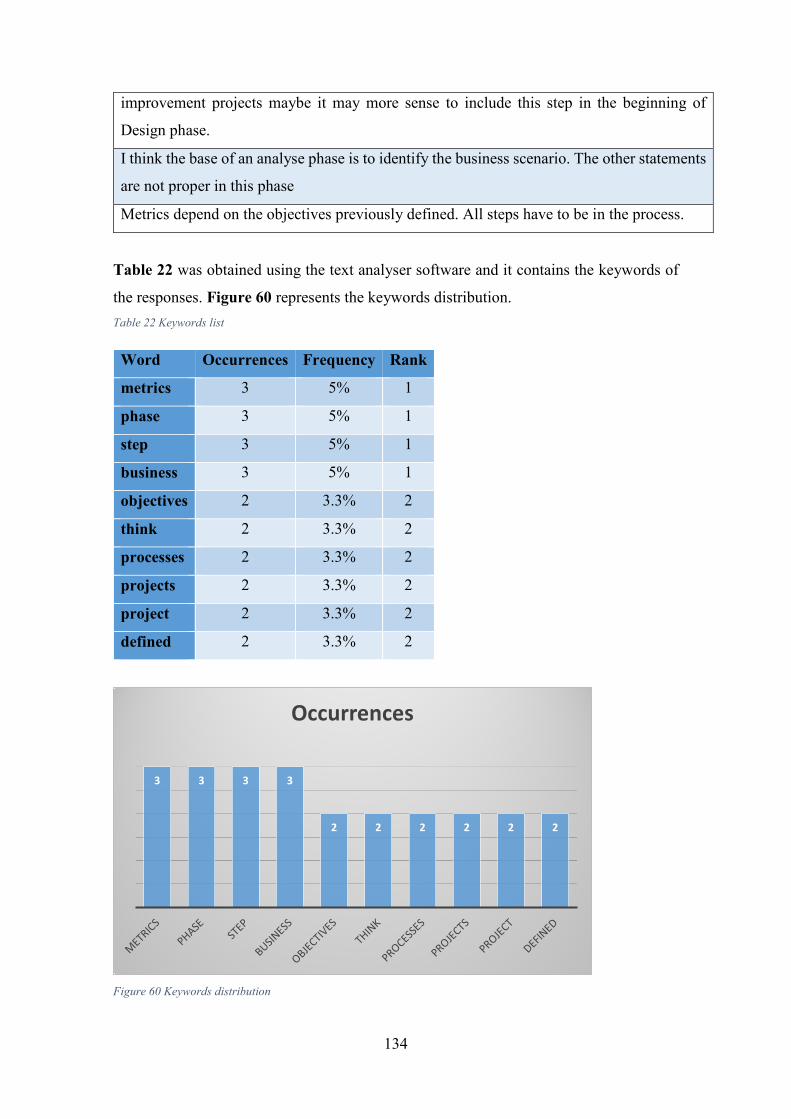
134
improvement projects maybe it may more sense to include this step in the beginning of
Design phase.
I think the base of an analyse phase is to identify the business scenario. The other statements
are not proper in this phase
Metrics depend on the objectives previously defined. All steps have to be in the process.
Table 22 was obtained using the text analyser software and it contains the keywords of
the responses. Figure 60 represents the keywords distribution. Table 22 Keywords list
Word Occurrences Frequency Rank
metrics 3 5% 1
phase 3 5% 1
step 3 5% 1
business 3 5% 1
objectives 2 3.3% 2
think 2 3.3% 2
processes 2 3.3% 2
projects 2 3.3% 2
project 2 3.3% 2
defined 2 3.3% 2
Figure 60 Keywords distribution
3 3 3 3
2 2 2 2 2 2
Occurrences

135
Metrics, phase, step and business were the most cited keywords, with three occurrences
each, representing a total of 20% frequency.
6.4.3.5. Which of the steps would be mandatory to a Design phase?
Figure 61 displays the summary of the questions for the Design phase, table 23 displays
the design phase acceptance rates and table 24 displays the comments provided by the
specialists.
Figure 61 - Design phase consolidated
Table 23 - Design phase acceptance i(in percentage)
Define scope 80.00%
Identify improvement
opportunities 84.76%
Design to-be process 90.48%
Record predicted metrics values 79.05%
Define Implementation strategy 87.62%
Design phase 85%
StronglyDisagree
SomewhatDisagree
Neither agreeor disagree
SomewhatAgree Strongly Agree
Define Scope 0 1 0 7 13Identify improvement opportunities 2 1 3 5 10Design to-be process 0 1 2 6 12Record predicted metrics values 1 1 1 9 9Define implementation strategy 0 0 2 7 12
0 1 0
7
13
21
3
5
10
0 12
6
12
1 1 1
9 9
0 02
7
12
Design Phase

136
Comments Table 24 Comments regarding the Design phase
Element ticked as strongly disagree at the former item, I suggest to you to consider at the
design phase. The topic 2 should be included at the phase 1.
Sometimes the process to innovation is unknown and not linear. And for a company that is
perhaps the largest gains of sustainability.
identify improvement opportunities is in the analyze phase. I would put "de ne metrics
values" in this phase I think Identify Improvement Opportunities would t better the Monitor
& Control phase
I think Identify Improvement Opportunities would t better the Monitor & Control phase
Table 25 was obtained using the text analyser software and it contains the keywords of
the responses. Figure 62 represents the keywords distribution. Table 25 Keywords list
Word Occurrences Frequency Rank
phase 6 12% 1
opportunities 3 6% 2
improvement 3 6% 2
identify 3 6% 2
better 2 4% 3
control 2 4% 3
monitor 2 4% 3
think 2 4% 3
perhaps 1 2% 4
company 1 2% 4

137
Figure 62Keywords distribution
“Phase”, “opportunities” and “improvement” were the most cited keywords, with 6, 3 and
3 occurrences, respectively, representing a total of 24% frequency.
6.4.3.6. Which of the steps would be mandatory to an Implement phase?
Figure 63 displays the summary of the questions for the Implement phase, table 26
displays the implement phase acceptance rates and table 27 displays the comments
provided by the specialists.
6
3 3 3
2 2 2 21 1
Occurrences

138
Figure 63 - Implement phase consolidated
Table 26 - Implement phase acceptance (in percentage)
Transform business
processes 82.86%
Execute new processes 89.52%
Implement phase 87.14%
Comments Table 27 Commment regarding Implement phase
What about
capabilities
6.4.3.7. Which of the steps would be mandatory to a Monitor and Control phase?
Figure 64 displays the summary of the questions for the Monitor and Control phase, table
28 displays the monitor and control phase acceptance rates.
StronglyDisagree
SomewhatDisagree
Neither agreeor disagree
SomewhatAgree Strongly Agree
Transform Business Processes 0 1 4 5 11Execute new processes 0 0 6 5 10
0 1
4
5
11
0 0
6
5
10
Implement phase

139
Figure 64 - Monitor and control phase consolidated
Table 28 - Monitor and control phase acceptance (in percentage)
Monitor and analyse organisational
performance 91.43%
Monitor and analyse process
performance 95.24%
Monitor metrics 91.43%
Realise value 83.81%
Identify optimisation opportunities 86.67%
Monitor and control phase 89.71%
No comments for this question.
6.4.3.8. Which of these options can be viewed as enablers to the implementation of
sustainability projects? Figure 65 displays the graph with the results for the enablers to the implementation fo
sustainability projects and table 29 displays the comments provided by the specialists.
StronglyDisagree
SomewhatDisagree
Neither agreeor disagree
SomewhatAgree Strongly Agree
Monitor and analyseorganisationalperformance 0 1 0 6 14
Monitor and analyse processperformance 0 0 1 3 17
Monitor metrics 0 0 2 5 14Realise value 0 0 4 9 8Identify optimisation opportunities 0 1 5 2 13
0 1 0
6
14
0 0 1 3
17
0 0 2
5
14
0 04
98
0 1
5
2
13
Monitor and Control phase

140
Figure 65 - Enablers of the framework
Comments Table 29 Comments regarding the enablers for the framework
My main concern is the difference between your model and management system standards,
such as ISO 14001:2015, which has been updating process, including elements like
leadership or 26000.
I am not sure what you mean by methods - do you mean implementation methods and if so,
what do these include?
6.4.3.9. Number of daily responses
Figure 66 represents the number of responses over the time.
71.40%
90.50%
28.60%
28.60%
33.33%
71.40%
71.40%
4.80%
4.80%
COORPORATE GOVERNANCE
BUSINESS STRATEGY
METHODS
INFORMATION TECHNOLOGY
CHANGE MANAGEMENT
LEADERSHIP
ORGANISATIONAL CULTURE
CAPABILITIES
KEY PERSONS
Which of these options can be viewed as enablers to the implementation of
sustainability projects

141
Figure 66 - Number of daily responses to the first round of the Delphi Study
6.4.3.10. Discussion
The lowest acceptance rates were found in the items 'Record enterprise map' (75.24%),
'Is Sustainability Implementation directly linked to Process
Management?' (76.19%), 'Design to-be process' (81.67%). While the highest
acceptance rates were found in the items 'is it justified to use the Business Process
Management (BPM) approach' (95.24%), 'Monitor and analyse process
performance' (95.24%) and 'Monitor metrics' (91.67%). The steps of the framework
have received the following rates: Analyse (82.38%), Design (85%), Implement
(87.14%), and Monitor and Control (89.71%). Regarding the framework enablers,
Business Strategy had the highest acceptance rate (90.5%), whilst Methods and
Information Technology received only 28.6%. Table 30 summarises the results of the
study.
Table 30 - Summary of the responses
Is Sustainability implementation directly linked to
Process Management?
76.19%
is it justified to use the Business Process Management
(BPM) approach?
95.24%

142
Is it justified to represent the implementation of
Sustainability initiatives using the BPM tool as the
framework suggests?
85.71%
Analyse
phase
Identify Business Scenario 87.62% 82.38%
Determine and prioritise processes 83.81%
Define stakeholders 80.00%
Define project objectives 87.62%
Define metrics 80.00%
Record enterprise map 75.24%
Design
phase
Define scope 80.00% 85%
Identify improvement opportunities 84.76%
Design to-be process 90.48%
Record predicted metrics values 79.05%
Define Implementation strategy 87.62%
Implement
phase
Transform business processes 82.86% 87.14%
Execute new processes 89.52%
Monitor
and
control
phase
Monitor and analyse organisational
performance
91.43% 89.71%
Monitor and analyse process performance 95.24%
Monitor metrics 91.43%
Realise value 83.81%
Identify optimisation opportunities 86.67%
Therefore, it was concluded that there was a consensus in all of the questions, since all of
them had an accepting rating of over than 75%, as it was defined on the topic 6.5.
Regarding the enablers for the framework, there was a scattered opinion on its
applicability. The conceptual framework proposed the following enablers: Organisational

143
Culture, Leadership, Change Management, Information Technology, Business Strategy
and Corporate Governance. Table 31 represents the level of agreement of the enablers Table 31 Summary of the enablers level of agreement
Organisational Culture 71.4%
Leadership 71.4%
Change Management 33.33%
Information Technology 28.6%
Methods 28.6%
Business Strategy 90.5%
Corporate Governance 71.4%
Considering the level of consensus defined in section 6.5, Organisational Culture,
Leadership, Business Strategy and Corporate Governance were considered as the
framework enablers.
6.4.4. Delphi Study second round
After concluding the first round, another questionnaire was used. Appendix C displays
the questionnaire used for the second round of the Delphi study.
Since the consensus regarding the steps of the framework was obtained during the first
phase of the Delphi study, the second phase was used to assess other aspects of the
framework.
The second phase of the study had only four questions:
1. In your opinion, what are the main challenges to implement sustainability
initiatives in organisations?
2. In your opinion, how is it possible to assess all the sustainability dimensions
(social, environmental and economic) in terms of Business Processes?
3. Considering the framework from Figure 1, would you change the order of the
steps or suit it in a different phase?
4. How would you improve the framework? Feel free to add any other comment.
Questions 1 and 2 had a more generic character in order to improve the rationale of the
research based on the experience of the specialists. E.g. of one output: The multiple
factors a company needs to consider parallel with sustainability, such as other factors
coming from global competition (e.g. profitability, conditions compared to low-cost

144
countries), meeting different customer demands, legislative and not, as well as just
responding to other future trends such as digitalisation, flexibility, etc.”
Questions 3 and 4 were related to the framework, more specifically to its organisation,
display, and if they would change anything to improve the framework. E.g. of one output:
“In my opinion, the framework could include an initial step or a pre-activity to develop
and to clarify the concept of sustainability. This activity could also be included in the first
step "identify business scenario", but the important is to provide criteria or perspectives
for assessing performance operation against the chosen definition. This definition can be
included into bpm policy as mission and vision to be seen and diffused across the whole
organisation.”
Results and discussion
6.4.4.1. In your opinion, what are the main challenges to implement sustainability
initiatives in organisations?
Table 32 provides the comments for the question and lists the keywords found on every response. Table 32 Comments on the question ‘In your opinion, what are the main challenges to implement sustainability
initiatives in organisations?’
Comment Keywords
Dealing with resistance from individuals, the result and
costs/resources involved.
Cost
I think that the main challenge is to create awareness of the
importance of sustainability in terms of value added for the
whole organisation and its supply chain. Another point we
have to stress is that organisations have to perceive that being
sustainable means to be cost- efficient.
Awareness; cost
The biggest challenges are the people; enable them to be
ready; and resources: human, financial and time.
People; cost; time
The multiple factors a company needs to consider parallel
with sustainability, such as other factors coming from global
competition (e.g. profitability, conditions compared to low-
cost countries), meeting different customer demands,
legislative and not, as well as just responding to other future
trends such as digitalisation, flexibility, etc.
Costs; customer
demands;
regulations

145
Cost, leadership buy-in, employee knowledge, unaware of
benefits (or risk of not doing so) Redesign processes,
implement change, and manage related costs.
Cost; people;
processes
cost Cost
Management of change Change management
to expand understanding about sustainability and roles in the
company Leadership compromised
Leadership
Change the leadership team the mind-set. Leadership
In my opinion, the main challenge to implement sustainable
practices in organisation is related to organisational culture.
In general, many companies see sustainability as additional
cost or legal requirements. There are many sustainable
business practices but most companies have not yet adopted
them.
Organisational
culture
Most of the times the organisations are not willing to make
changes towards a sustainable performance due to decreases
in their monetary performance. The short-term profit
overcomes the long-term goal of sustainability.
Costs
The main challenge is to change the mind-set of the leaders
and bring sustainability for the main aspect, more important
than sales.
Leadership
Table 33 and Figure 67 summarises the main challenges to implement sustainability
initiatives. Table 33 - Summary of the challenges to adopt sustainability initiatives
Keywords Recurrence Statistics
Cost 7 54%
Leadership 3 23%
Awareness 1 8%
People 1 8%
Customer demands 1 8%
Regulations 1 8%

146
Change management 1 8%
Processes 1 8%
Figure 67 Challenges to implement sustainability initiatives
Thus, leadership and cost were identified as the main challenges related to the
sustainability adoption by the organisations (“cost” was mentioned by 54% of the
specialist and “Leadership” by 23%). According to one specialist, “the multiple factors a
company needs to consider parallel with sustainability, such as other factors coming from
global competition (e.g. profitability, conditions compared to low-cost countries),
meeting different customer demands, legislative and not, as well as just responding to
other future trends such as digitalisation, flexibility, etc.”. Another specialist related the
sustainability implementation with the organisational culture, “in my opinion, the main
challenge to implement sustainable practices in organisation is related to organisational
culture. In general, many companies see sustainability as additional cost or legal
requirements. There are a lot of sustainable business practices, but most companies have
not yet adopted them”.
6.5.2.2. In your opinion, how is it possible to assess all the sustainability dimensions
(social, environmental and economic) in terms of Business Processes?
Table 34 provides the comments for the question and lists the keywords found on every response.
7
31 1 1 1 1 1
Challenges to implement sustainability

147
Table 34 Comments on the question 'In your opinion, how is it possible to assess all the sustainability dimensions
(social, environmental and economic) in terms of Business Processes?'
Comment Keywords
Quantifying the different aspect, using indicators Indicators
It is very difficult to assess all three dimensions in one single
scale.
-
I think that the main point is to link all these three dimensions
form the triple bottom line. A holistic view of the triple botton
line is crucial to achieve and assess sustainability in terms of
Business Processes. Unfortunately, it s my perception that
sustainability is something vague and mostly related to
strategic level of organisations. So, one must create a bridge
between strategy and operations to assess sustainability.
Triple bottom line
the company needs to implement a policy that considers the
TBL.
Triple bottom line
Hard question, I think business process management is one of
the parts to reach sustainability, it is like the map how to drive
and measures on the way, but it cannot work without having
the people (driver), the organisation (the vehicle) and the
systems (surroundings) to work and understand where to go.
People, organisations
and systems
Clear KPIs/benchmarks so they must be addressed, even if the
plan is to address in the future
Indicators
You need to contextualise process outcomes within in the
specific dimensions, and relate their potential impact on
social, environmental and economic aspects.
Triple bottom line
leadership Leadership
Specific scorecard like balanced scorecard Balanced scorecard
In my opinion, it is necessary a maturity of the field, more
motivation of actors, and a series of indicators to measure
Indicators

148
these three dimensions, while balancing the achievement of
competing interests.
It is necessary a global vision and indicators that complete all
process in parallel.
Indicators
Apply for training and consultancy in order to have the
advantages for the 3BL (triple bottom line - social,
environmental and economic)
Training
In order to assess all the sustainability dimensions in terms of
business processes it is important to identify how and what
the business processes influence each dimension, which
activities and aspects are relevant, and which are the hotspots
for each dimension in order to allow companies to prioritise
the activities and aspects with highest potential for
improvement in terms of sustainability. Thus, companies
could develop and implement performance indicators on
business process, but it is still a challenge to solve trade-offs
between the three dimensions.
Indicators
Using eMergy or Lifecycle Assessment approaches. Lifecycle Assessment
there is a tool called lifecycle assessment that can calculate all
the impacts for evaluation
Lifecycle Assessment
Table 35 and Figure 68 summarises the ways to assess all the sustainability dimensions Table 35 Summary of the ways to assess all the sustainability dimensions
Keyword Recurrence Statistics
Indicators 5 36%
Triple bottom line 2 14%
Lifecycle assessment 2 14%
Organisations 1 7%
Systems 1 7%
Leadership 1 7%
Balanced scorecard 1 7%
Training 1 7%
People 1 7%

149
Figure 68 Summary on how to assess al the sustainability dimensions
Therefore, indicators, Lifecycle assessment (LCA) and triple bottom line (TBL) were the
most cited keywords (respectively with 36%, 14% and 14% of the respondents).
According to one specialist, “the main point is to link all these three dimensions form the
triple bottom line. A holistic view of the triple bottom line is crucial to achieve and assess
sustainability in terms of Business Processes. Unfortunately, it s my perception that
sustainability is something vague and mostly related to strategic level of organisations.
So, one must create a bridge between strategy and operations to assess sustainability.”
and also related business processes with the sustainability dimensions. Another specialist
stated that “In order to assess all the sustainability dimensions in terms of business
processes it is important to identify how and what the business processes influence each
dimension, which activities and aspects are relevant, and which are the hotspots for each
dimension in order to allow companies to prioritise the activities and aspects with highest
potential for improvement in terms of sustainability. Thus, companies could develop and
implement performance indicators on business process, but it is still a challenge to solve
trade-offs between the three dimensions”.
6.5.2.3.Considering the framework from Figure 1, would you change the order of the
steps or suit it in a different phase?
Figure 69 displays the graph with the results for the question and table 36 displays the
comments provided by the specialists.
5
2 2 1 1 1 1 1
How to assess all the sustainability dimensions

150
Figure 69 - .Considering the framework from Figure 1, would you change the order of the steps or suit it in a different
phase?
Comments Table 36 Comments on the question’ Considering the framework from Figure 1, would you change the order of the
steps or suit it in a different phase?’
Comment Yes or No Keyword
Sustainability maturity should be part of monitor
and control depending on individual situation
N Sustainability
maturity
In my opinion, the framework is broad in terms of
scope and adoption. Therefore, I am satisfied with
the way the framework is conceived.
Y
The order is fine. Y
It makes sense to have them in that order, but I am
considering the factors in the middle to also
influence a lot if this wheel will work. In addition,
what other dominant strategies and focuses the
organisation have. Are they aligned?
N Enablers
Detailed enough at that level Y
87%
13%
Would you change the order of the steps or suit it in a different phase?
No
Yes

151
The framework seems to follow a logical
managerial sequence.
Y
That’s the way it works Y
It’s fine Y
it seems to integrate the necessary actions to
create and act on improvement areas for
sustainability I think that it is ok
Y
I think this is a reasonable correct order. Y
The steps are well structured and make sense in
terms of logic.
Y
I'd not change Y
I think its fine Y
Question 3 was intended to observe if the order of the steps on the framework were correct
and logic. Most of the specialists agreed on the order (87%). Most of the specialists stated
that the framework “was fine”, but one stated that “Sustainability maturity should be part
of monitor and control depending on individual situation”, this was considered to the final
version of the framework, but it was clarified on chapter 5 that the framework is flexible
and might change according to the situation. Another specialist made another observation,
“It makes sense to have them in that order, but I am considering the factors in the middle
to also influence a lot if this wheel will work. Moreover, what other dominant strategies
and focuses the organisation have. Are they aligned?” which relates the framework with
the proposed enablers, justified on the first round of the Delphi study,
6.5.2.4.How would you improve the framework? Feel free to add any other comment.
Table 37 provides the comments for the question and lists the keywords found on every response. Table 37 Comments on 'How would you improve the framework'
Comment Keyword
see 3
hard to say, depending on the appropriateness according to the
situation
No improvements
I believe it is OK.

152
The alignment to other objectives and goals would be the
suggestion for improvement. More detail - what do these steps
mean to someone without business experience?
Goals; objectives
It seems ok as it is.
no clue
Add delegation and identification of key deliverables Deliverables
The centre of the model looks a bit messy, no clear position of
elements.
No comments
No additional suggestion.
In my opinion, the framework could include an initial step or a
pre-activity to define and clarify the concept of sustainability.
This activity could also be included in first step "identify
business scenario", but the important is to provide criteria or
perspectives for assessing performance operation against the
chosen definition. This definition can be included into bpm
policy as mission and vision to be seen and diffused across the
whole organisation.
Define
sustainability
I'd not
Monitor & Control: I suggest to include "indicators review /
metrics review"
Indicators
Question 4 was intended to obtain final comments regarding the framework. Most of the
answers were “it looks fine”, but some specialists mentioned other aspects, such as
“appropriateness”, “identification of key deliverables”, “alignment to other objectives
and goals”, “metrics review” (which is already as the step “monitor metrics”) and “the
creation of an initial step to define the concept of sustainability”.
6.5.2.5.Number of daily responses
Figure 70 represents the number of responses over the time.

153
Figure 70 - Number of daily responses for the second round of the Delphi study
6.5. Final Discussion The first round of the Delphi Study identified a level of agreement of the phases of the
framework as follows (table 38): Table 38 Level of agreement of the framework phases
Analyse phase 82.38%
Design phase 85%
Implement phase 87.14%
Monitor and Control phase 89.71%
Therefore, there were no change regarding the phases of the framework.
The second round of the Delphi Study identified that the steps of the framework are in
the correct order (87% level of agreement). Therefore, there was no changes regarding
the order of the steps to be followed by the framework.
After the verification of the framework by the specialists using the Delphi Study, the main
change was regarding the enablers. The conceptual framework proposed the following
enablers: Organisational Culture, Leadership, Change Management, Information
Technology, Business Strategy and Corporate Governance. After the experts’ feedback,
the verified framework contained the enablers: Organisational Culture, Leadership,
Business Strategy and Corporate Governance. Figure 71 represents the verified
framework

154
Figure 71 – Verified Framework
6.6. Chapter Summary and conclusions The chapter provided a Delphi study to verify the framework to implement sustainability
initiatives in the business processes. The study successfully obtained a consensus in the
phases and steps of the conceptual framework and provided feedback from the specialists.
According to them, leadership, people and cost were identified as the main challenges
related to the sustainability adoption by the organisations and key performance indicators
(KPIs), Lifecycle assessment (LCA) and triple bottom line (TBL) were identified as the
main methods to assess al the sustainability dimensions in terms of business processes.
After the verification of the framework by the experts, the main change was regarding the
enablers. The chapter summarises the results of the study and presents the verified
framework. Next chapter will provide the validation of the framework using the Action
Research method.

155
Chapter 7 – Framework Validation using Action Research
7.1. Introduction Chapter 6 presented the verification of the conceptual framework based on the BPM
approach to implementing sustainability initiatives in the business processes proposed in
chapter 5. This chapter presents the validation of the framework using the action research
method. Action research is a comparative research to solve an immediate problem led by
individuals working in partnership with other teams whilst conducting research. This
chapter starts providing an overview of the study, and it explores the phases of the
framework, going through the phases: ‘Analyse’, ‘Design’, ‘Implement’, and ‘Monitor
and Control’.
7.2. Study Overview Biomass represents approximately 10% of the energy sources in the World (2010 World
Energy Council). The most common use of biomass for energy is direct combustion,
gasification, carbonisation and pyrolysis. In this perspective, torrefaction emerges as a
thermal biomass pre-treatment method that can reduce the significant limitations of
biomass (such as heterogeneity and lower energy density). However, one of the outputs
from the torrefaction process is the generation of tar. Tar is brown or black liquid
composed of hydrocarbons which, in long exposure, can cause cancer. This study was
performed in a biomass power generation company that was producing an excess of tar.
In order to provide a solution to the excess of tar generated, it was used the framework to
implement sustainability business processes using the Business Process Management
(BPM) approach.
7.3. Study timetable The study was held between August 2016 and January 2017. Figure 72 represents the
project Gantt chart that was used for the project.

156
Figure 72 Project Gantt chart
The framework contains four phases (Analyse, Design; Implement; and Monitor &
Control). ‘Analyse’ phase contains the steps of ‘Identify Business Scenario’, ‘Identify
Project Stakeholders’, ‘Define Project Objectives’, ‘Define Metrics’, ‘Record enterprise
map - AS-IS Situation’, ‘Record baseline values’, and ‘Perform Sustainability Maturity
Assessment’; Design phase contains the steps of ‘Define Scope’, ‘Identify improvement
opportunities’, ‘Design TO-BE Process’, ‘Record predicted metric values’, and ‘Define
implementation strategy’; Implement phase contains the steps of ‘Transform Business
Processes’, and ‘Execute the new Processes’; and Monitor & Control phase contains the
steps of ‘Monitor and analyse organisational performance’, ‘Monitor and analyse process
performance’, ‘Monitor metrics’, ‘Realise value’, and ‘Identify optimisation
opportunities’). This section presents the validation of the proposed framework for the
implementation of sustainability initiatives.
7.4. Analyse Phase
7.4.1. Identify Business Scenario
7.4.1.1. The company
Company A is a biomass power generation company. The organisation defines itself as
an energy innovation company and uses torrefaction to transform wood into bio-coal.
The primary focus of the company is to develop sustainable energy technologies,
implement technology into renewable energy production plants, license technology to
third parties and develop state-of-the-art torrefaction technology. This commitment to
sustainability was the main reason to select Company A as one of the participants of the
Action Research.

157
7.4.1.2. Biomass
According to the 2010 World Energy Council, 10% of the energy in the World is
generated from Biomass. According to the Digest of United Kingdom Energy Statistics
(DUKES) 2016, in 2015 25.3% of the renewable energy fuel use was originated from
(plant) Biomass sources. According to the study, 24.6% of the energy consumption in the
UK came from renewable sources. Thus, it is possible to conclude that (plant) Biomass
energy represents 6.22% of the energy consumption in the UK. This represents an amount
of 5196,81 GWh.
Biomass is a versatile energy resource that could be used as a sustainable energy resource
in solid, liquid and gaseous form of energy sources (Nhuchhen et al.2014). According to
Basu (2010), Biomass has a unique appeal in environmental aspect because it makes no
net contribution of CO2 to the atmosphere. Regulations for making biomass economically
viable are in place in many countries. E.g. if biomass replaces fossil fuels in a power
plant, that power plant could earn carbon credits – sold in the market for additional
revenue in countries where such trades are in practice.
According to Basu (2010), the most common use of biomass for energy is direct
combustion, followed by gasification, carbonisation and pyrolysis. In this perspective,
torrefaction emerges as a thermal biomass pre-treatment method that has an ability to
reduce the significant limitations of biomass (such as heterogeneity, lower bulk density,
lower energy density, hygroscopic behaviour, and fibrous nature). Torrefaction aims to
produce high-quality solid biomass products (Nhuchhen et al.2014).
According to Basu (2010), torrefaction is a thermochemical process where biomass is
slowly heated to within a specified temperature range and retained there for a stipulated
time such that is results in near complete degradation of its hemicellulose content while
maximising mass and energy yield of solid product. The torrefacation process converts
biomass, steam and N2 into biochar (and wood, ash, water, tar and gases CO, CH4 and
H2 as byproducts). Figure 73, represents the transformation process.

158
Figure 73 Transformation Process
7.4.1.3. The current problem
Currently, the plant is producing an excess of tar. Tar can be defined as hydrocarbons
with a molecular weight higher than benzene (Manattis et al., 2010) constituted by
polycyclic aromatic components with a high boiling point (Eriksson, 2012). They are formed
during gasification in a series of complex reactions (Milne et al., 1997). When cooled
down, tars can condense while increased temperatures can result in the formation of more
complex compounds with higher boiling points (Edinger et al., 2016). This can cause
clogging and fouling of pipes, heat exchangers or particulate filters. As a result, tar
formation and its control are still considered as one of the major challenges in the
implementation of biomass gasification technology (Ruiz et al., 2013). Tar is listed at
number 19999 from United Nations’ list of dangerous goods (United Nations, 2015).
According to the Occupational Safety and Health Administration (OSHA), the legal limit
(permissible exposure limit) for tar pitch volatiles exposure in the workplace as 0.2 mg/m3
benzene-soluble fraction over an 8-hour workday. The National Institute for Occupational
Safety and Health (NIOSH) has set a recommended exposure limit (REL) of 0.1 mg/m3
cyclohexane-extractable fraction over an 8-hour workday. At levels of 80 mg/m3, coal tar
pitch volatiles are immediately dangerous to life and health (CDC, 2016). According to
the CDC (2016), the long exposure to tar can cause lung, kidney and skin cancer.
Inputs•Biomass•N2 Torrefaction
Process
Outputs•Biochar•Ash•Water•Tar•Gas

159
Organisation A classifies the tar into two categories: weak tar (approximately 93%) and
heavy tar (approximately 7%). According to the organisation tests, weak tar is composed
of 86% water and 14% organic compounds (alcohols, acids, phenols, benzene, ether, and
aldehyde); and heavy tar is composed of 23% water, 55% organic compounds (alcohols,
acids, phenols, benzene, ether, and aldehyde) and 22% of char.
Another problem with the tar is the final destination. Currently, the weak tar is being
collected by a third party company that charges £190 per 1000 L (1 IBC – 1m3).
According to the organisation, in 2015, approximately 95 IBCs of weak tar were disposed,
which represents a cost of £18,050. Currently, the tar problem is still bearable. However,
considering that the company is not still working in full production and it is also deploying
a new production line, the amount of tar generated will increase significantly in the next
few years and this might become a big problem. Therefore, the initial idea of the project
is to try to either: use the tar in the process, dispose it down the drain or sell it to other
companies.
7.4.1.4. What has been done
The responsible chemical engineer had already tested a few approaches to treat the tar.
The tests already done are as follow: solvent extraction, filtration with activated carbon,
neutralisation, and vacuum distillation.
1- Solvent Extraction
The solvent extraction test aims to remove tar (organic compounds) from weak tar. This
was done with five different solvents (Dichloromethane, MEK, N-butanol, MIBK and
MEKP) at a different volume.
Results: The mixing of each of these solvents with weak tar formed two separate layers.
The volume of weak tar and solvent used for each test did not generally change after
mixing. This indicates that no extraction was achieved, probably because of the complex
nature of weak tar.
2- Filtration with activated carbon
The filtration with activated carbon test aims to remove phenols from weak tar. Activated
carbon was used as a filter in this case.
Results: No change in colour and pH of weak tar was observed. The test was not done
properly and will be repeated.
3- Neutralisation

160
The neutralisation test aims to change the pH of weak tar from three to seven - nine in
order to meet the requirements needed to dispose it off down the drain. This was done
using a base such as sodium hydroxide.
Results: The test was successful, but by changing the pH using sodium hydroxide, we
increased the total dissolved solids and COD in weak tar making it unsuitable to be
disposed of down the drain.
4- Vacuum distillation
The vacuum test aims to remove water from weak tar under vacuum to lower the boiling
point of chemicals and prevent the formation of solid tar which tends to occur when high
temperatures around 140C are reached.
Results: From 100ml weak tar, 50ml concentrated weak tar and approximately 25ml clear
liquid were produced. The clear liquid which is also known as distillate has a pH of 3.
Water removed from weak tar will always be mixed with low boiling compounds such as
acetic acid, acetone etc. The sugars can be the ones responsible for weak tar brown colour
7.4.1.5. What can be done?
The chemical engineer was still trying to find alternatives to provide treatment to the tar.
One of the approaches is the Reverse Osmosis, which aims to remove impurities in weak
tar and hopefully produce clean water with a reduced number of organic compounds in
it.
Another possibility is the utilisation of the tar back into the process. Weak tar can be
converted to heavy tar by distilling off the water. The heavy tar produced can be mixed
with biochar, sulphur and moisture; under pressure and heat (90C) this mixture will form
strong bonds in pellets. However, this approach might have a few problems, such as
causing pipe blockage. There could be a possibility to transform heavy tar into solid, mill
and add it in the pellet line in powder form. Apart from that, in order to reuse the tar, it
will be needed to redesign the process
Another possible solution would be selling the tar to other companies. By analysing the
composition of the weak tar, it was identified that it has a similar composition of
something that is called ‘wood vinegar’. According to the Food and Fertilizer Technology
Center for the Asian and Pacific Region (2005), wood vinegar is a by-product from
charcoal production that improves soil quality, eliminates pests and controls plant growth,
but is slightly toxic to fish and very toxic to plants if too much is applied. It accelerates
the growth of roots, stems, tubers, leaves, flowers, and fruit. In some instances, it may
hold back plant growth if the wood vinegar is applied at different volumes. Wood vinegar

161
is safe to living matters in the food chain, especially, insects that help pollinate plants.
Therefore, one way to capitalise with tar would be to sell it to agriculture companies.
Therefore, any chosen solution would involve changes in the current process structure. In
this scenario, the BPM methodology would be very suitable, since it will provide methods
for the successful implementation of those changes aiming to improve the process
performance, a better use of resources, and the transformation of expenses into revenue
and enablement of innovation.
7.4.2. Determine and prioritise processes
Since the purpose of the action research was to validate empirically the framework for
the implementation of sustainability business processes, the selected processes needed
to have a significant impact in terms of sustainability. Since resources and time are scarce,
it was defined to only study one business scenario of Company A, the energy generation.
This business scenario is composed of 4 processes: Torrefaction, Syngas Cleaning,
Syngas Combustion, and Pelletization. For the matters of this project, it was decided to
only focus on the processes of Torrefaction, Syngas Cleaning, and Pelletization. This
decision was taken because they are the processes affected by the tar generation and that
might need process change. The process of Syngas Generator is only a technical process
that collects the syngas for combustion, in order to generate green electricity. In the future,
Company A aims to reuse the syngas generated as an input of the process of Torrefaction
(currently it uses natural gas)
7.4.3. Define Project Stakeholders
7.4.3.1. Internal Stakeholders
Company A has 14 internal stakeholders: one Operations Manager, one Mechanical
Engineer, one Chemical Engineer, one Employed Contractor, one Site Supervisor, six
Plant Operator, and three Temporary Staff.
7.4.3.2. External Stakeholders
Currently, Company A is not operating on a full scale, it is still in the ramp-up stage, so
there are only potential customers. In that case, the potential customers are coal-fired
power stations, companies in the Energy sector. Other external stakeholders are suppliers.
Company A uses mainly timber suppliers, originated in the forestry industry.
Company A is a joint venture company with financial partners from the Netherlands and
United States of America. Regarding legal and governmental entities, since Company A

162
is located in the United Kingdom, it needs to follow the standards and requirements of
the United Kingdom Policies.
7.4.4. Define Project Objectives
The project objective was to perform an Action Research to help Company A find a
solution to the tar generated through the conversion of biomass in energy. The current
process generates large amounts of weak tar that can be hazardous to the employees, so
it needs to be dealt with appropriately.
7.4.5. Define Metrics
The Global Reporting Initiative (2015) defines the following categories (Figure 74) of
Economic, Environmental and Social metrics (indicators). It was discussed with the
responsible for Company A, and the following aspects were selected to be monitored:
Economic Performance (Economic); Materials, Water, Effluents and Waste
(Environmental); and Occupational health and safety (Social).
Figure 74 Categories of Sustainability Indicators (Global Reporting Initiative, 2015) -
content removed for copyright reasons

163
According to the GRI (2015), the economic performance can be measured in terms of
direct economic value generated; Financial implications and other risks and opportunities
for the organisation’s activities due to climate change; Coverage of the organisation’s
defined benefit plan obligations; and Significant financial assistance received from the
government. For the project, the most adherent would be the direct economic value
generated, in the form of operating costs.
According to the organisation, the materials performance can be measured in terms of
Materials used by weight or volume; and Percentage of materials used that are recycled
input materials. For the project, the most adherent would be the amount of materials
consumed.
According to Global Reporting Initiative (2015), the water performance can be measured
in terms of Total water withdrawal by source; Water sources significantly affected by the
withdrawal of water; and Percentage and the total volume of water recycled and reused.
For the matters of the project, it was selected the percentage of water reused by the
process.
According to GRI (2015), the Emissions, Effluents, and Waste performance can be
measured in terms of total direct and indirect greenhouse gas emissions by weight; Other
relevant indirect greenhouse gas emissions by weight; Initiatives to reduce greenhouse
gas emissions and reductions achieved; Emissions of ozone-depleting substances by
weight; NO, SO, and other significant air emissions by type and weight; Total water
discharge by quality and destination; Total weight of waste by type and disposal method;
Total number and volume of significant spills; Weight of transported, imported, exported,
or treated waste deemed hazardous; Identity, size, protected status, and biodiversity value
of water bodies and related habitats significantly affected by the reporting organisation’s
discharges of water. For this project, the most relevant indicator was the total weight of
waste by type (tar) and disposal method.
According to the organisation, the Occupational Health and Safety performance can be
measured in terms of Injury rate (IR); Occupational disease rate (ODR); Lost day rate
(LDR); and Absentee rate (AR). For this study, it was only assessed the Injury Rate. More
than that, it will also be assessed the health and safety related training per employee (and
furthermore relate them to the Injury rate).
In terms of process, Slack et al., (2013) define that the process performance can be
measured in terms of Cost, Time and Quality. For this project, it was considered the
production cost per ton (cost); cycle time per ton; and percentage of products (biochar

164
pelletized) under specification (quality). Therefore, Figure 75 summarises the metrics to
be measured in the project.
Figure 75 Project Metrics - summary
7.4.6. Record enterprise map (AS-IS Situation)
BPMN (Business Process Management Notation) was used to design the enterprise map
(process mapping).
In this representation, Figure 76 represents the symbols that were used:
Process in scope Process out of scope
Input / Output Activity
Activity that connects 2 AND connector
processes
Interaction of Process, process associated
Figure 76 BPMN symbols

165
Company A works with two (2) levels of process (level of Process and level of Activities).
The Energy Generation business Scenario contains four Processes, Torrefaction, Syngas
cleaning, Syngas generator and Pelletization. This project studied only the processes of
Torrefaction, Syngas cleaning and Pelletization. They were chosen because they are the
ones that affect the tar generation. Syngas combustion is currently is only a technical
process that collects the syngas for combustion, in order to generate green electricity. In
the future, Company A aims to reuse the syngas in the process of Torrefaction (currently
Company A uses natural gas to trigger the operation). Figure 77 represents the Energy
Generation Business Scenario.
Figure 77 Energy Generation business scenario
Torrefaction is a thermochemical process that involves the conversion of biomass to
biochar. The process uses biomass as primary input. In this process, the reactor uses the
heat power of the hot exhaust gas (natural gas) to trigger the operation (no contact with
the biomass). Later on, once the biochar is generated, it is cooled down by cooling water
from cooling tower. The process has biochar (dust) and syngas (with Organic Volatiles)
as outputs. Figure 78 represents the Torrefaction Process.

166
Syngas cleaning is the process to clean the gas that is generated by the Torrefaction
Process. This is the process most affected by the tar since it is where the tar is generated.
In this process, the tar is separated into weak tar and heavy tar. Figure 79 represents the
Syngas Cleaning Process
Figure 78 Torrefaction process
Figure 79 Syngas cleaning process

167
The Pelletization process is the process to pelletize the biochar (dust). The process
combines the biochar dust with lubricant, water and binder in order to produce biochar
pellets. Figure 80 represents the Pelletization process.
Figure 80 Pelletization Process
7.4.7. Record baseline values
Some metrics were obtained through the access of information provided by Company A,
others were obtained through observation of the current process performance, and others
were obtained through calculations. Some of the metrics (such as the occupational health
and safety) were only evaluated in a scenario level due to the lack of information on the
process level. Figure 81 represents the sustainability performance metrics calculation
method and Figure 82 the process performance indicators.
Figure 81 Sustainability Performance calculation methods

168
7.4.7.1. Operational costs
Table 39 represents the costs of production from Company A (with two production lines).
Table 39 Production Costs
Fixed Costs
Annual cost '000
Euros
Maintenance and spare parts 286.4
Personnel costs 477.2
Engineering costs 14.0
Consultancy/temporary 14.0
Rent 50.0
General and administrative costs 20.0
Insurance 42.8
Total Fixed Costs 904.4
Variable Costs
Annual cost '000
Euros
Biomass ~ 5967.4
Electricity ~ 368.8
Start-up liquid fuel cost ~ 3
Freight cost ~ 613.6
Royalty costs ~ 200
Total Variable Costs 7152.8
Figure 82 Process Performance calculation methods

169
Raw material expenses constitute the significant part of the Project’s operating expenses.
The main cost item is the cost of purchased biomass; electricity and other are minor items.
7.4.7.2. Materials used by weight or volume
According to the organisational reports, in 2015, it was used 44 tons of wood. With the
full production and the two operation lines working, it is planned to produce 30, 000 tons
of biochar, which represents 50,420 tons of wood. According to the report, it was also
used 2 tons of binders. In full production, it will be used 1,950,000 tons of binders. Last
year, it was also used 500 Kg of lubricant in the last year. In full production, it will be
used 30,000 tons of lubricant.
7.4.7.3. Water reused in the process
In order to identify the water reused in the process, it was analysed the water balance of
the cooling tower. Figure 83 represents this water balance.
In order to determine the water reused in the process, it was collected four bills from one
operating year. Table 40 represents the water consumption over one year period
Table 40 Water consumed in a one year period
Cooling Tower
Evaporated water
Process recirculation water
Towns water flow rate
Bleed discharge
Rainwater flow rate
Figure 83 Water balance (cooling tower)

170
Month/Year Water consumed (m3)
Jul - Oct 2015 262
Oct - Jan 2015 242
Jan - Apr 2016 189
Apr - Jul 2016 257
Total 950
It was estimated that from that 950 m3, 56 m3 was used in toilet per annum and the rest
(894 m3) was used by the process. Considering that the plant is only available for 91% of
the days in a year, it was considered that the flow rate consumed was 0.13 m3/h.
Table 41 represents the formulas that were used to calculate the water used in the process.
Table 42 represents the required data to obtain the results from table 3.
Table 41 Formulas to calculate the water used in the process
where:
Table 42 Required data to calculate the water used in the process

171
Thus, table 43 shows the summary of the flow rate of water from the cooling tower and
Figure 84 represents the water balance with the respective flow rates.
Table 43 Summary of flow rate
Evaporated
water (m3/h) 0.5

172
Considering that the plant was operating for 10 months in the past year (July 2015 – July
2016), from which the reactor was working for 176 hours, it is possible to conclude that
the amount of water that entered the process was 5256 m3 ([rainwater flow rate + towns
water flow rate] x 7200 h) and the amount of water reused by the process was 10,468.48
m3. Thus, it is possible to conclude that the percentage of water reused in the process is
66.57% (Process recirculation / [Rainwater flow rate + towns water flow rate + process
recirculation]). Table 44 displays the calculations used to obtain this percentage.
Table 44 Calculation of the percentage of water reused in the process
Process
recirculation
(m3/h)
59.48
Rainwater flow rate
(m3/h) 0.6
Towns water flow
rate (m3/h) 0.13
Bleed discharge
(m3/h) 0.23
Time without maintenance
(months) 10
Time without maintenance
(hours) 7200
Reactor working (h) 176
Rainwater (m3) 4320
Towns water consumption
(m3) 936
Cooling Tower
Figure 84 Water balance with flow rates data

173
7.4.7.4. Total weight of waste by type and disposal method - tar
According to the latest mass balance available in the company, in full production (with
the two lines working), it will be generated an output of 8301 m3 of weak tar. However,
since Company A is not working in full production yet, the actual results were different.
According to the organisation, in 2015, approximately 95 IBCs of weak tar were disposed,
representing an amount of 95 m3.
7.4.7.5. Injury rate
Tables 45 and 46 display the accident records from 2015 and 2016, respectively.
Table 45 - Accident records 2015
Process Recirculation (Water
in the cooling tower) (m3) 10468.48
Calculation
Percentage of water
reused by the
process
Percentage of water
reused by the
process 66.57%
𝑃𝑃𝐴𝐴𝑃𝑃𝑃𝑃𝐴𝐴𝑃𝑃𝑃𝑃 𝑅𝑅𝐴𝐴𝑃𝑃𝑅𝑅𝐴𝐴𝑃𝑃𝑅𝑅𝑅𝑅𝐴𝐴𝑃𝑃𝑅𝑅𝑃𝑃𝑃𝑃𝑃𝑃𝐴𝐴𝑃𝑃𝑃𝑃𝐴𝐴𝑃𝑃𝑃𝑃 𝑅𝑅𝐴𝐴𝑃𝑃𝑅𝑅𝐴𝐴𝑃𝑃𝑅𝑅𝑅𝑅𝐴𝐴𝑃𝑃𝑅𝑅𝑃𝑃𝑃𝑃 + 𝑅𝑅𝐴𝐴𝑅𝑅𝑃𝑃𝑅𝑅𝐴𝐴𝑃𝑃𝐴𝐴𝐴𝐴 + 𝑇𝑇𝑃𝑃𝑅𝑅𝑃𝑃𝑃𝑃 𝑅𝑅𝐴𝐴𝑃𝑃𝐴𝐴𝐴𝐴 𝑃𝑃𝑃𝑃𝑃𝑃𝑃𝑃𝑅𝑅𝑐𝑐𝑐𝑐𝑃𝑃𝑅𝑅𝑃𝑃𝑃𝑃

174
Table 46 Accident records 2016
In order to calculate the Injury rate (IR), GRI (2015) defines the following formula:
𝐼𝐼𝑅𝑅 =𝑇𝑇𝑃𝑃𝑃𝑃𝐴𝐴𝑅𝑅 # 𝑃𝑃𝑜𝑜 𝑅𝑅𝑃𝑃𝑖𝑖𝑅𝑅𝐴𝐴𝑅𝑅𝐴𝐴𝑃𝑃𝑇𝑇𝑃𝑃𝑃𝑃𝐴𝐴𝑅𝑅 ℎ𝑃𝑃𝑅𝑅𝐴𝐴𝑃𝑃 𝑅𝑅𝑃𝑃𝐴𝐴𝑤𝑤𝐴𝐴𝑤𝑤
𝑥𝑥 200,000
Note: The factor 200,000 is derived from 50 working weeks, with 40 work hours per week
for companies with less than 100 employees.
For 2015, the Injury rate was 70. For 2016, since it was only assessed six months, the
injury rate was 130.
7.4.7.6. Health and safety training per employee
Company A has internal and external training related to health and safety. Figures 85 and
86 represent, respectively, the internal and external training records.

175
Figure 85 Internal training
Completed Accredited Prior Learning
Ongoing High Importance Training
Need
Figure 86 External training

176
While some of this training is specifically related to machinery, others are directly related
to health and safety standards and procedures:
• Emergency Procedures
• General Process Description
• Emergency First Aid at Work
• Risk Assessment
• Work at Height
• Manual Handling
• Use of Fire Fighting Equipment
• Legionella Awareness
• Confined Space & Top Man Awareness
• Rigging and Slinging
• COSHH Awareness
• Vehicle Movements
• Abrasive Wheel Use / Selection and Hand Tool Use
• PASMA Tower Scaffold
• IPAF (Access Platform)
Some of these trainings are required for a specific task or job; however, some of them are
necessary for all positions. These trainings are: Emergency First Aid at work, Risk
Assessment, Work at height, and Use of firefighting equipment.
At the moment, five staff members still need to conclude the ‘Emergency First aid at
work’ training; three staff members still need to conclude ‘Work at height’ training; and
one still needs to conclude the ‘use of firefighting equipment’. Only the ‘Risk assessment’
training was concluded by all the employees. Table 47 represents the percentage of staff
that concluded the trainings.
Table 47 Percentage of staff that concluded the trainings
Training Percentage of Staff that
concluded the training
Emergency First Aid at work 70.59%
Risk Assessment 100.00%
Work at height 82.35%

177
Use of firefighting equipment 94.12%
7.4.7.7. Production cost per ton (Pct)
Considering the last year production of 31 tons and cost of production of 4,286,000.6
euros (1 production line), the cost per ton was
𝑃𝑃𝑃𝑃𝑃𝑃 =𝐶𝐶𝑃𝑃𝑃𝑃𝑃𝑃 𝑃𝑃𝑜𝑜 𝑐𝑐𝐴𝐴𝑃𝑃𝑤𝑤𝑅𝑅𝑃𝑃𝑃𝑃𝑅𝑅𝑃𝑃𝑃𝑃
𝐴𝐴𝑐𝑐𝑃𝑃𝑅𝑅𝑃𝑃𝑃𝑃 𝑃𝑃𝑜𝑜 𝑏𝑏𝑅𝑅𝑃𝑃 𝑃𝑃𝑃𝑃𝐴𝐴𝑅𝑅 𝑐𝑐𝐴𝐴𝑃𝑃𝑤𝑤𝑅𝑅𝑃𝑃𝐴𝐴𝑤𝑤
Pct = 97,409.1 euros/ton
7.4.7.8. Cycle time per ton (Ct)
Since the company is not working in full production, it is hard to evaluate precisely the
cycle time per ton. So, in order to evaluate the cycle time, it will be used the amount of
coal produced last year (31 tons) and the working time of the reactor (176 hours).
𝐶𝐶𝑃𝑃 =𝐴𝐴𝑐𝑐𝑃𝑃𝑅𝑅𝑃𝑃𝑃𝑃 𝑃𝑃𝑜𝑜 𝑏𝑏𝑅𝑅𝑃𝑃 𝑃𝑃𝑃𝑃𝐴𝐴𝑅𝑅 𝑐𝑐𝐴𝐴𝑃𝑃𝑤𝑤𝑅𝑅𝑃𝑃𝐴𝐴𝑤𝑤
𝑃𝑃𝑅𝑅𝑐𝑐𝐴𝐴
Cycle time = 0.176 tons/h
7.4.7.9. Percentage of products (pellet) under specification (Pus)
𝑃𝑃𝑅𝑅𝑃𝑃 =𝐴𝐴𝑐𝑐𝑃𝑃𝑅𝑅𝑃𝑃𝑃𝑃 𝑃𝑃𝑜𝑜 𝑏𝑏𝑅𝑅𝑃𝑃 𝑃𝑃𝑃𝑃𝐴𝐴𝑅𝑅 𝑐𝑐𝐴𝐴𝑃𝑃𝑤𝑤𝑅𝑅𝑃𝑃𝑃𝑃𝑃𝑃 𝑅𝑅𝑃𝑃𝑤𝑤𝐴𝐴𝐴𝐴 𝑃𝑃𝑐𝑐𝐴𝐴𝑃𝑃𝑅𝑅𝑜𝑜𝑅𝑅𝑃𝑃𝐴𝐴𝑃𝑃𝑅𝑅𝑃𝑃𝑃𝑃
𝐴𝐴𝑐𝑐𝑃𝑃𝑅𝑅𝑃𝑃𝑃𝑃 𝑃𝑃𝑜𝑜 𝑏𝑏𝑅𝑅𝑃𝑃 𝑃𝑃𝑃𝑃𝐴𝐴𝑅𝑅 𝑐𝑐𝐴𝐴𝑃𝑃𝑤𝑤𝑅𝑅𝑃𝑃𝐴𝐴𝑤𝑤
From the total mass of biochar used in the last year to make pellets, 48% of it came out
as a dust at the end of the cooler. From that 52% of produced pellets, only 6% met the
criteria (3.12% of the total produced).
Figure 87 summarises the sustainability performance metrics and Figure 88 summarises
the process performance indicators.

178
Figure 87 - Sustainability Performance - Summary
Figure 88 Process Performance - Summary
7.5.8. Perform Sustainability Maturity Assessment
A lean/green study that was held on the company prior to the action research. The study
evaluated the results from a lean-green measurement based on the presence of specific
process improvement tools and result of staff’s opinions as regards the lean-green nature
of the company.
The study uses the Verrier et al. (2016) maturity deployment model which aims to
evaluate the level of lean knowledge in an organisation and thus recommend the best way
to implement it. The study used a structured questionnaire to assess the lean & green
level.

179
It was observed that although the organisation had a few lean/green tools in practice the
understanding of what it was fell between the first and second levels of the maturity model
that is: level1 (Initial), limited awareness of L&G issues and level 2 (Managed),
Occasional basic Lean and green actions). Figure 89 represents the level of lean & green
knowledge. It is possible to observe that only 22% of the company’s workforce had
knowledge of lean or green manufacturing with the majority of that percentage being top
management personnel.
Figure 89 Level of lean/green knowledge
Another study evaluated the lean and green tools used by the organisation. Table 48 Lean and green tools used by the organisation
Lean tools Weighting Weighting of tools
present
Kaizen .4 .2
5S .2 .1
Visual Management .2 .1
TPM .1 .1
Standardised work .1 .1
Lean score 60%
A lean score of 60% was obtained based on the partial implementation of some lean tools
such as the 5s which was visible on only one part of the facilities and also the kaizen
22%
78%
Level of lean & green knowledge
Knowledgible
Not Knolwedgible

180
process which seems not to be fully operational with regard to employee participation and
a set continuous improvement method thus it was given a presence score of .2.
Table 49 Green tools used by the organisation
Green Tools Weighting Weighting of Green tools
present
1SO14000 .5 .2
3R’S .3 .2
EVSM .1
Energy Management .1
Green tools score 40%
A green tool score of 40% was obtained due to the fact that a lot of the basic green
measurements such as, water usage control, or energy management, or a set framework
such as the EVSM, which checks to see the effect of the firm’s everyday operation on the
environment seems to be missing.
One factor that might justify the lack of lean and green practices is the fact that the
company is still in the ramp-up phase, and have not achieved the full production. Thus, it
is possible to conclude that in terms of process management it is in the Initial stage. In
terms of sustainability, it is also on the stage due to the lack of green measurements or
practices. One of the outputs of this project was the creation of metrics (performance
indicators). Those metrics, associated with the improvement of the process maturity level
(from initial to repeatable) can help Company A to move into the level 2 of the
sustainability maturity assessment framework.
7.5. Design phase
7.5.1. Define Scope
The scope of the Project was to treat the tar. The project evaluated the feasibility of using
the weak tar in the process of Pelletization and to sell the remaining tar to other
companies. More than that, the project can help the organisation to achieve the level 2 of
the process maturity level and of sustainability maturity level. Figure 90 represents the
Project Scope Statement.

181
Figure 90 Project Scope Statement
7.5.2. Identify Improvement opportunities
The main objective of the project was to provide a solution to the tar generated through
the conversion of biomass in energy. The initial idea was to reutilise the tar in the process
as a binder would reduce the amount of tar disposed and would also reduce the number
of binders required to run the operations (reducing costs of operation). Other objectives
of the project are to raise the percentage of water reused on the process, relate the injury
rates with the specific process (in order to control them in a better way) and relate the
injury rates with the health and safety trainings. It was identified six (6) possible solutions
to solve this issue: Disposal down the drain; Sell the weak tar; Filtration using activated
carbon or other chemicals; Incineration (Oxidiser) – Option 1 with weak tar in liquid
form; Incineration (Oxidiser) – Option 2 with weak tar in vapour form; and Inject directly
in stack
7.5.2.1. Disposal down the drain
For this solution, weak tar will have to be treated to meet the requirements in order to
dispose it down the drain. The pH of weak tar is 3 and this needs to be neutralized. In that
case, the TDS (Total Dissolved Solids) and COD (Chemical Oxygen Demand) will
increase. Reverse osmosis can be used to remake TDS but high pressure is needed due to
such thing TDS contents. This may be impossible to do on site and might require a lot
more money.

182
7.5.2.2. Sell it
Last year, Company A spent £18,050 to dispose the tar (95 IBCS, using services of a
third-party company). With the full production, the organisation will generate,
theoretically, 8,301 m3 of tar (8,301 IBCs), consisting a cost of £1,577,190 per year (if
disposed in the current way).
One of the alternatives to deal with this exceeding tar would be selling the weak tar to
other companies in the form ‘wood vinegar’ (or pyroligneous acid). Thus, theoretically,
it might be possible to transform weak tar into wood vinegar.
It was found one supplier of wood vinegar that charges £1,700 for 1 m3. Considering that
last year it was produced 95 m3 of tar (95% of weak tar – 90.25 m3), this would represent
a £156,403.25 profit. Considering the values of full production (8,301 m3 of weak tar),
this could represent a £14,385,633 profit*. The remaining heavy tar produced could be
used back in the process in form of binders. According to the responsible engineer, it is
hard to evaluate the total savings of this approach, however, it would represent in a
reduction of binders needed (1,950,000 tons of binders per year for the case of two lines,
representing 1,303,924 pounds) and also it would improve the calorific power of the final
product. Figure 91 and 92 represent the weak tar profitability analysis without
considering the costs of transportation. It might take a while to identify/contact potential
buyers
Figure 91 Weak tar profitability analysis

183
Figure 92 Weak tar profitability analysis
Nonetheless, this would also need a redesign of the process, the process to transform weak
tar into wood vinegar and the connection between the channels of communication from
Company A and the buying organisation (added to the costs to create the network, costs
to transport the wood vinegar, among others).
7.5.2.3. Filtration using activated carbon or other chemicals
Activated carbon or other material can be used to clean (removing phenols from weak tar
and other unwanted compounds) weak tar. However, the use of this approach would
produce more waste that will need to be removed off-site, leading to higher costs.
7.5.2.4. Incineration (Oxidiser) – Option 1 with weak tar in liquid form
Weak tar needs to be atomised to make the evaporation more efficient. In this approach,
VOCs (Volatile Organic Compounds) will be combusted and converted into CO2 and
H2O, which will be released into the atmosphere. This solution has not been tested yet
and needs calibration time. The process of atomization can involve other costs, which can
be very costly to the organisation.
7.5.2.5. Incineration (Oxidiser) – Option 2 with weak tar in vapour form
This approach is similar to the last one, except that in this option the weak tar would be
boiled and fed in a vapour phase, instead of being atomised. This process, however, is
cheaper since there is already a tank.
7.5.2.6. Injected directly in the stack
This approach is to release of VOCs in the atmosphere. This represents a clear
environmental problem and also might affect the local companies.

184
7.5.2.7. SWOT Analysis
In order to identify which solution is more adherent to the current problem, it was created
a SWOT analysis, comparing the Strengths, Weaknesses, Opportunities, and Threats of
the proposed solutions to the weak tar problem. Table 50 displays the SWOT analysis.
Table 50 SWOT Analysis
Weak tar
treatment
solutions
SWOT analysis
Disposal down the
drain

185
Sell it
Filtration using
activated carbon or
other chemicals

186
Incineration
(Oxidiser) – Option 1
with weak tar in
liquid form
Incineration
(Oxidiser) – Option 2
with weak tar in
vapour form

187
Injected directly in
the stack
With the SWOT analysis, it was possible to identify that the alternative ‘Incineration
(Oxidiser) – Option 2 with weak tar in vapour form’ is the best one, since it is viable, will
save material (heavy tar in form of binders) and have controllable risks.
Regarding the injury rates, it was identified that in 2015 most of the accidents were
located inside the control room and in the reactor (28.57% each one). In 2016, most of
the accidents were located on the Pellet line (41.66%). This might require training on the
safety aspects on the pellet line. Another objective in terms of trainings would be to have
100% of the staff capacitated in the ‘High Importance Training Need’.
7.5.3. Design TO-BE Process
In the new process, the tar generated in the ‘Syngas Cleaning’ process will be reused as
moisture, binders and some of it will be stored. In this new process, after the weak tar
goes to the storage tank, it will be distilled. Some of the weak tar will stay in liquid form
will be stored in IBCs and some of it will be used as binders. The weak tar in vapour form
will be oxidised (combusted) with the syngas from the process and the VOCs will be
converted into CO2 and H2O. Figure 93 represents the tar distillation and Figure 94 the
new ‘Syngas cleaning’ process

188
Figure 94 - New Syngas cleaning process
7.5.4. Record predicted metric values
With the new process design, theoretically, the weak tar distillation would have an
efficiency of 65% (65% of the volatile composts would be combusted and transformed
into CO2 + H2O). This would represent a reduction of 33.25 m3 (representing saves of
£11,732 on cost) of tar based on last year results (95 m3) and 64.27 m3 (representing saves
of £12,212.06) based on the theoretical result of full production. Therefore it is possible
Storage tank
Storage tank
Oxidiser
Distillation
Weak tar in liquid form will either be sent directly to the pellet line or stored in an IBC
CO2 + H20 released
Figure 93 Tar Distillation

189
to conclude that this will cause a reduction in the operating costs, use of materials (since
tar will be used as moisture), and production cost per ton.
More than that, the tool to control the process will help to control the cycle time,
percentage of products under specification, percentage of water reused, injury rate and
health and safety trainings.
Figures 95 and 96 display, respectively, the predicted Sustainability Performance and
Process Performance.
Figure 95 Sustainability Performance - Predicted

190
Figure 96 Process performance - Predicted
The company is currently not in full production, therefore it is hard to predict precisely
the values of the TO-BE situation. Thus, one proposal of this work is to establish the
routine management. In order to do that, it is proposed a model with the phases of: Assign
metrics/process ownership; Define regular measurements periods; Record the metrics in
a specific tool; update the dashboard; and Define regular meetings.
7.5.5. Define implementation Strategy
The final stage in the Design phase was to define the implementation strategy. There were
mainly four types of Implementation scenarios that can be conducted in a project
implementation: ‘Big Bang’, ‘Parallel’, ‘Relay’ and a combination of one or more
strategy. According to Jeston & Nelis (2006) in the ‘Big Bang’ approach the proposed
change is introduced in one major overhaul; in the ‘Parallel’ method the proposed change
is introduced step by step (e.g. by location or business unit), with the next roll-out starting
before the previous one is finished; the ‘Relay’ approach the proposed change is
introduced step by step, with each roll-out only starting once the previous one has been
completed; and the last scenario is a combination of the abovementioned implementation
approaches.
For this project, it was used the Parallel method, once it provides a relatively fast
implementation and the ability to make use of lessons learned from preceding
implementations is valuable. In that case, the two parallel initiatives will be the
deployment of the Incineration (Oxidisation) with weak tar in vapour form solution and

191
the Occupational health and safety initiatives. In the case of the incineration, it will be
needed to test the distillation method and then adapt the plant to the new procedure.
7.6. Implement phase During the Implement phase, there were found a few problems in the Incineration
(Oxidiser) – Option 2 with weak tar in vapour form. The main issue was the formation of
solid heavy tar at the bottom of the tank, it was blocking the strainer, interrupting the feed.
Besides that, there were other problems involved in that, such as: the need of a new tank,
the need to insulate the pipes, the need of continuous monitoring, resulting in many costs.
More than that, it was likely that the solution did not work due the viscosity of the tar.
Therefore, there was a management decision to change the approach, changing to a
simpler solution. The approach chosen was the Oxidiser - Option 1 with weak tar in liquid
form. This because there is no need to have a tank, there is no need to worry about
insulation, the heavy tar turning into solid, there is a reduction on maintenance costs since
there is no need to continuously monitor the process. It involves fewer costs. This
approach is currently being tested by the organisation and the development will be carried
over the next months.
In the future, the company aims to implement the new process, reusing the tar generated
in the ‘Syngas Cleaning’ as moisture, binders and some of it will be stored. In this way,
after the weak tar goes to the storage tank, it will be distilled. Some of the weak tar will
stay in liquid form will be stored in IBCs and some of it will be used as an additive.
To help in the implementation of the project it was used the Project Management
methodology. To schedule the activities, it was used a Gantt chart (or bar chart). The chart
consists of a horizontal scale divided into time units - days, weeks, or months - and a
vertical scale showing project work elements - tasks, activities, or work packages.
(Nicholas & Steyn 2008).
According to Slack et al. (2013), the monitored measures of project performance at any
point in time need to be assessed so that project management can make a judgement
concerning overall performance. At the beginning of a project, some activities can be
started, but most activities will be dependent on finishing. Eventually, only a few
activities will remain to be completed. Figure 97 shows an example of an S-curve. In this
example, the chart represents the progress of the project (in percentage) versus the time
(in days). It is possible to observe that in a few moments such as day 20 and day 80 the
actual project pace was faster’ than what was expected; while in others, such as day 60 it

192
was slower than what was expected. This is a good tool to monitor the project
performance and to make sure that the ‘project real status’ meets the ‘projected status’
(or planned status) at the end of the project time. If the project is delayed and unable to
reach the final project deadline, the project committee must intervene and define
strategies to mitigate this issue, it can be the case of hiring new resources, negotiating a
new deadline, negotiating extra-hours to the employees in the project, among other
options.
Figure 97 Example of an S-curve
7.7. Monitor & Control Phase
7.7.1. Monitor and analyse organisational performance
According to Jaafreh et al. (2013), based on a previous review, researchers adopted the
measurement of organisational performance in term of customer satisfaction, where this
Support by Deming (1986) confirmed the focus on quality would lead to outcomes such
as employee and customer satisfaction, efficiency, and profitability. The measurement of
organisational performance adopted as follows: Customer retention (Improved
satisfaction of our clients) (NIST, 2010; Sila, 2007); Reliability and timely delivery of
products/services reaches the customer faster (Wilson & Collier, 2000, Sila, 2007);
Personalized service (Flynn et al., 1995; Sila, 2007); Value for the money spent (A
reduction in the number of customer complaints and grievances) (Dean & Bowen, 1994;
NIST, 2010; Sila, 2007).
According to Sila (2007), customer and employee satisfaction and streamlined processes
together produce improved operational and financial results, which will eventually lead

193
to business excellence. A study by Wilson & Collier (2000) empirically tested the causal
relationships of the MBNQA framework and overall IS quality. They found significant
impact and on business results. There is growing evidence that QM implementation has
improved organisations’ performance and significantly affected most organisations
(Dewhurst et al., 2003). Several studies showed that QMPs had the most substantial effect
on the quality performance measures such as Flynn et al. (1994) and others founded
positively correlated with organisational performance such as (Powell, 1995; Ahire et al.,
1996; Samson & Terziovski, 1999; Agus, 2003; Rao et al., 1999; Kaynak, 2003; Prajogo
& Sohal, 2003; 2006; Sila & Ebrahimpour, 2005; Zu, 2009).
7.7.2. Monitor and analyse process performance
The main aspects to be monitored in the oxidiser are the Pressure and Temperature (of
the oxidiser). In order to avoid flooding the oxidiser, it is required to monitor the weak
tar flow rate, which is reflected by the pressure. Thus, a pressure gauge would adequate
to be used as a process control tool.
The oxidiser temperature is another critical aspect. In order to destroy all the VOCs, the
temperature should be between 700 - 1000 degrees Celsius. That because temperatures
below 700 degrees Celsius can cause incomplete combustion, which would release
organic components to the atmosphere (the complete combustion only releases CO2 and
H2O).
The process metrics defined in section 7.6.5. Define metrics can be monitored as follows:
Table 51 Monitor Process performance
Process performance
How to monitor
Cost Production Cost per ton
(Pct)
Monitor cost of
- Wood
- Binders
- Water
Time Cycle time per ton (Ct)
- Monitor batch times on a weekly/monthly basis
- Use of statistical tools, such as scatter plot
analysis
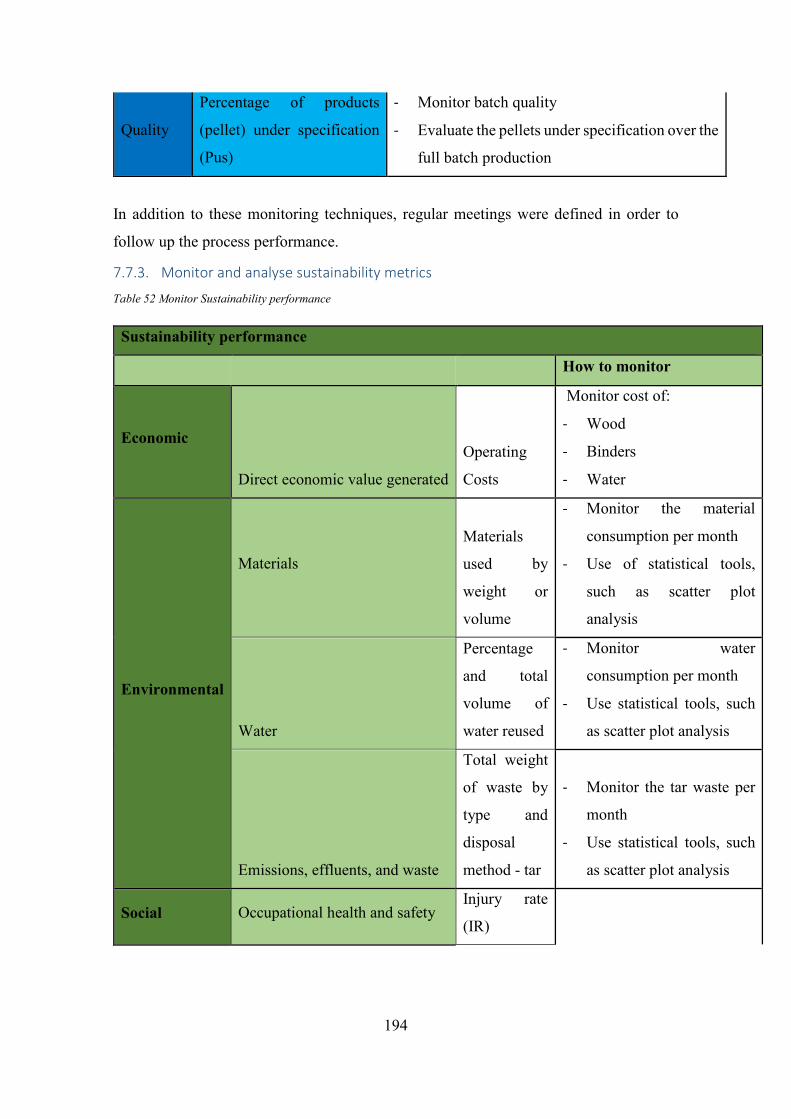
194
Quality
Percentage of products
(pellet) under specification
(Pus)
- Monitor batch quality
- Evaluate the pellets under specification over the
full batch production
In addition to these monitoring techniques, regular meetings were defined in order to
follow up the process performance.
7.7.3. Monitor and analyse sustainability metrics
Table 52 Monitor Sustainability performance
Sustainability performance
How to monitor
Economic
Direct economic value generated
Operating
Costs
Monitor cost of:
- Wood
- Binders
- Water
Environmental
Materials
Materials
used by
weight or
volume
- Monitor the material
consumption per month
- Use of statistical tools,
such as scatter plot
analysis
Water
Percentage
and total
volume of
water reused
- Monitor water
consumption per month
- Use statistical tools, such
as scatter plot analysis
Emissions, effluents, and waste
Total weight
of waste by
type and
disposal
method - tar
- Monitor the tar waste per
month
- Use statistical tools, such
as scatter plot analysis
Social Occupational health and safety Injury rate
(IR)

195
Occupational
diseases rate
(ODR)
Monitor the occupational
health and safety data
Lost day rate
(LDR)
Absentee
rate (AR)
In order to help to monitor and control the sustainability metrics, it was suggested routine
management with the following steps:
• Assign metrics ownership
The metrics owner is someone who monitors and reports the metrics. This approach has
some advantages from a complexity viewpoint:
- It focuses attention on the key sustainability issues for the organisation
- It splits the responsibility amongst the personnel while providing
- It improves the awareness of the sustainability metrics in the organisation
• Define constant measurements
The constant measurements help to provide more data over time. With more data, it is
possible to define trends and analyse patterns.
• Record in a Statistical Process Control chart / Create and update Dashboard
According to Silva et al. (2017), Statistical process control (SPC) is the designation of the
approach, which utilises multivariable models for the purposes of process monitoring.
The strategy is well documented in the literature (such as Barla et al., 2014; 2011; Kona
et al., 2013; MacGregor and Cinar, 2012; Macgregor and Kourti, 1995; MacGregor et al.,
2005).
In order to facilitate the view of the SPC data, it was recommended the creation of a
Dashboard. A dashboard provides real-time information aggregating and extracting data
from the KPIs (or metrics). It is a useful tool for analysis. For this project, it was used the
software Tableau Public, an open source web application that allows the publication of
the dashboard on the web, to exemplify the application of a Dashboard.
Figure 98 represents the Software view of the SPC and Figure 99 represents the web
view of the SPC.

196
Figure 98 Tableau public screen
Figure 99 - Tableau web screen
• Define regular meetings for follow up

197
Regular meetings are helpful to make the staff aware of the current developments on the
metrics. Beyond that, they help to inform and to solve potential issues faced by the
organisation.
The model defined to be followed was one agile methodology, known as Scrum, which
is based on principles of lean manufacturing (James, 2009). According to Scrum
organisation, Scrum can be identified as a management and control process that cuts
through complexity to focus on building products that meet business needs. Management
and teams are able to get their hands around the requirements and technologies and
deliver working products, incrementally and empirically. According to Vlietland (2015),
a Scrum development lifecycle consists typically of short (2–4 weeks) iterations, which
enables swift feedback from related stakeholders about the developed solution. Figure
100 represents the Scrum framework.
Scrum team
Product backlog
Sprint planning
Sprint backlog
Sprint review
Sprint retrospective
Increment
Figure 100 Scrum framework. Adapted from scrum.org - content removed for copyright reasons
The primary objective of the definition of the routine is to achieve repeatability in the
process.
7.7.4. Realise value
After monitoring the metrics, it is possible to evaluate the actual state of the sustainability
implementation. According to Jeston & Nelis (2008), a project is only complete once the
reason for its existence has been achieved and it has been handed over to the business in
such a way that the business can now sustain the project outcomes. If the initial goals are
not fully realised, it is necessary to investigate the reasons and start the cycle in the
missing point.
7.7.5. Identify optimisation opportunities
The last step in the Monitor & Control phase and in the whole cycle is to ‘Identify
optimisation opportunities’. As Heraclitus would say, “the only constant in life is

198
change”. For the sustainability topic is not different, changes are constant and they can
be related to the legal requirements, the customer needs, the market new best practices.
Thus, it is essential to have the concept of the continuous improvement in the framework
(Gallotta, 2016).
7.8. Chapter summary and conclusion The chapter provides an Action Research study to validate the framework to implement
sustainability initiatives in the business processes presented in chapter 5. The action
research has a participatory and collaborative bias and contributes mutually to the
Organisation and the Research. The study represents an empirical application of the
framework in a biomass company focused in sustainable energy technologies. The
company is generating an excess of tar and it is currently disposing the substance using a
third-party company. In order to provide a solution to the excess of tar generated, it was
used the framework to implement sustainability business processes using the Business
Process Management (BPM) approach. The project has concluded the Analyse and
Design phases. During the Implement phase, there were found a few problems with the
proposed solution and then another approach was designed. Finally, in the Monitor and
Control phase, there were identified methods to measure the process performance and
sustainability performance.

199
Chapter 8 - Conclusions and recommendations
8.1. Introduction This final chapter develops the conclusions of this dissertation. Chapter 1 has provided
the introduction of the research, outlining the problem statement, the aims, objectives,
research question and rationale. Chapter 2 has presented the concepts of sustainability,
how it is being implemented by organisations and what are the challenges and problems
with the current ways to implement them. This chapter has identified the lack of attention
paid to the implementation of Sustainability in business processes. One methodology to
help the implementation of sustainability practices in business process is Business
Process Management (BPM), which was detailed in Chapter 3, presenting the Process
Management origin and evolution; the definition of the concept; the phases to implement
the approach; and how it can be related to Sustainability. Chapter 4 has presented the
Research Methodology and approach. In Chapter 5, it was developed the Conceptual
Framework to Implement Sustainability Initiatives in the Business Processes. Chapter 6
verified the framework using the Delphi method. Chapter 7 has provided the validation
of the framework using the action research method. Finally, chapter 8, begins with the
findings from the research project. Then, it is related to the project aim and objectives.
The chapter also outlines the research contribution for the sustainability topic, the
practical implications, the limitations and future work. Finally, the chapter presents the
final conclusions and the final comments (related to the dissertation experience).
8.2. Findings and actions in relation to the project’s aim, objectives and
research question This section summarises the evidence gathered through this research project and the
results obtained from the different studies performed. Its objective is to draw conclusions
over the research aim and objectives presented in section 1.3 and the research questions
included in section 1.4.
This research aimed to provide a full lifecycle solution for improvement of business
processes into sustainability business processes in one organisation by conducting a
literature review in the fields of sustainability, sustainability implementation and
Business Process Management; identifying and critically review the best practices
frameworks to implement sustainability projects; creating a model or framework to help
organisations to implement sustainability practices in their business processes in a better
way; and creating a conceptual study case using the model developed.
200
Conduct a literature review in the fields of sustainability, sustainability implementation
and Business Process Management;
Chapter 2 has provided the literature review in the fields of Sustainability and
Sustainability Implementation. ‘Sustainability’ has several definitions. This chapter then
begins reviewing the concept of sustainability ever since the initial ideas of the topic
(presented at the UN conference on the human environment in 1972). After that, the
chapter discussed that organisations need to adopt sustainability practices, the current
ways to implement them and what are the challenges and problems with current ways to
implement sustainability initiatives. One possible approach to tackle these problems is to
use the BPM approach. Chapter 3 have provided a complete literature review in the
Business Process Management field, presenting definitions, the Process Management
origin and evolution; the definition of the concept; the phases to implement the approach;
and how it can be related to Sustainability.
Identify and critically review the best practices frameworks to implement sustainability
initiatives;
Chapter 2 has identified the best practices frameworks found in the literature to implement
sustainability initiatives from different angles, such as Human aspect (Robinson et al.,
2006 and Vora, 2013); Sustainability Indexes/Reporting facet (Tan et al., 2010; and
Ahmed & Sundaram, 2012); Project Management side (Silvius & Nedeski, 2011; Silvius,
Schipper and Nedesky, 2012; Agyekum-Mensah et al., 2012); and Operations aspect
(Thies et al., 2012; Uddin & Rahman, 2012; and Tan et al., 2008).
It was identified that current models to implement sustainability practices do not address
fully the sustainability challenge (Ahmed & Sundaram, 2012). Beyond that, several
sustainability implementation initiatives focus in one specific department of the
organisation (IT sector in Uddin & Rahman (2012)’s study, warehouse in Tan et al. (2008)
and Tan et al. (2010) studies, Logistics in Rossi et al. (2013)’ study). They, however, do
not consider that those departments work along with other departments into an end-to-
end process (systemic view). Therefore, a more refined analysis would consider the whole
process interaction to evaluate the full status of the sustainability implementation.
Create a model or framework to help organisations to implement sustainability practices
in their business processes in a better way;
Chapter 5 has presented the Conceptual Framework to Implement Sustainability
Initiatives in the Business Processes created during the MRes stage of the research, which

201
is based on Business Process Management principles containing four main phases:
(Analyse Phase; Design Phase; Implement Phase; and Monitor & Control Phase). Then,
the chapter describes each step contained in the phases (Identify Business Scenario;
Identify Project Stakeholders; Define Project Objectives; Define Metrics; Record
enterprise map - AS-IS Situation; Record baseline values; Perform Sustainability
Maturity Assessment; Define Scope; Identify improvement opportunities; Design TO-BE
Process; Record predicted metric values; Define implementation strategy; Transform
Business Processes; Execute the new Processes; Monitor and analyse organisational
performance; Monitor and analyse process performance; Monitor metrics; Realise value;
and Identify optimisation opportunities). The chapter also identifies enablers for the
framework’s implementation (governance, strategy, methods, information technology,
change management, leadership, and culture) and discuss their role.
Verify the conceptual model
Chapter 6 presents the verification of the framework proposed in chapter 5 using the
Delphi method. The study reported a consensus in the phases and steps of the conceptual
framework and provided feedback from the panellists. According to them, leadership,
people and cost were identified as the main challenges related to the sustainability
adoption by the organisations and key performance indicators (KPIs), Lifecycle
assessment (LCA) and triple bottom line (TBL) were identified as the primary methods
to assess al the sustainability dimensions in terms of business processes. After the
verification of the framework by the experts, the main change was regarding the enablers,
according to them, the main enablers for the framework’s implementation should be:
Corporate governance, business strategy, organisational culture and leadership.
Validate the conceptual model
Chapter 7 presents the validation of the framework proposed in chapter 5 using action
research. The study exemplified the use of the framework in a real-world biomass
company based in the UK that was having a problem with residue from its production.
The study aimed to propose new processes and ways to minimise its generation. The
project has faced some difficulties while implementing the proposed solution, but have
concluded the Analyse and Design phases. In the Monitoring and Control phase, it was
identified methods to measure the process performance and sustainability performance
and it presents a list of recommendations for the organisation to improve its production
and sustainability status.

202
The research questions were:
• How can an organisation adopt sustainability practices in their business
processes?
• What are the benefits to adopt sustainability initiatives in the business processes?
• What are the main challenges to adopt sustainability initiatives in the business
processes?
• What is the most efficient way to adopt sustainability initiatives in the business
processes?
The research outlined that the business process management (BPM) approach can be used
as a way to implement sustainability practices in an organisation’s business processes by
using the conceptual framework (presented in chapter 5). The benefits from this approach
are the enablement of continuous process improvement, improvement of process quality;
cost reduction; increase in the customer satisfaction; and better control over process
performance (Gallotta, 2016), which can be directly linked to the improvement of the
sustainability improvement.
8.3. Discussion
8.3.1. Sustainability Implementation
As it was discussed in chapter 2, Sustainability is already a subject relevant to the business
community for a while and this concept is becoming an increasingly strategic and
integrated into companies. More and more organisations are looking to adopt
sustainability practices in their operations, strategy, and processes. Sustainability has
been receiving growing importance in the corporate environment in recent years and
Sustainable Operations Management (SOM), in particular, has started receiving attention
from both operations management and management science researchers, since it has a
potentially vital role in providing solutions for the complex sustainability challenges
faced by many organisations (Kleindorfer et al., 2005; White and Lee, 2009).
However, adopting sustainability practices is not something trivial. The project
implementation involves several elements of an organisation (such as stakeholders,
culture and business environment) and has several barriers (such as setting clear and
measurable goals, comprehending stakeholder reactions and selecting the right
sustainability Indicators). Existing roadmaps, frameworks and systems do not
comprehensively support sustainable business transformation nor allow decision makers
to explore interrelationships and influences between the sustainability dimensions. More

203
than that, several current solutions tend to focus on one specific department of the
organisation. This goes in the opposite direction of recent administration theories that
considers process-centric as a key characteristic to improve the organisation’s
performance. Thus, a more refined analysis would consider the whole process interaction
to evaluate the full status of the sustainability implementation.
Nonetheless, many sustainability implementation initiatives have focused in one specific
department of the organisation, e.g. IT (Uddin and Rahman, 2012), warehouse (Tan et al.,
2010; Tan et al., 2008), logistics (Rossi et al., 2013), etc. They, however, do not consider
that those departments work along with other departments into an end-to-end process.
According to Porter’s (1985) model, products pass through activities of a chain in order,
and at each activity, the product gains some value. Similarly, we can consider that the
‘product’ (in the case of a product-based industry) gains some ‘sustainability impact’ in
each activity. Therefore, a more refined analysis would consider the whole process
interaction to evaluate the full status of the sustainability implementation.
8.3.2. Framework
In order to develop the Conceptual Framework to Implement Sustainability Initiatives in
the Business Processes, it was initially analysed current ways to implement sustainability.
After that, the literature review identified what were the barriers to implementing
sustainability initiatives. The next step was to identify potential methodologies to address
the problem. Business process management was chosen due to its capability to work in a
cross process way while providing the full control of the process performance. Chapter 5
provides the different BPM models found in the literature. As it was discussed in chapter
2, the sustainability implementation success is directly related to the alignment of the
strategy and business processes in an explicit manner. This way, it was proposed a four
phases framework (Analyse, Design; Implement; and Monitor & Control), in which the
Analyse phase has broken down the elements from the “process planning & strategy” into
the identification of business scenario, determination and prioritisation of processes,
identification of project stakeholders, definition of project objectives, definition of
metrics, record enterprise map, record baseline values and sustainability maturity
assessment. The four phases framework also can be related to Deming’s PDCA cycle,
which might facilitate the implementation of the sustainability initiatives.

204
8.3.3. Delphi study:
The Delphi method was used to verify the framework once it gathered the opinions of
specialists in sustainable operations management from several locations over the
proposed framework. However, as it was more discussed in chapter 6, one disadvantage
of the Delphi method is the high attrition rate. Since the method requires lengthy
responses in the early rounds of the process and the active participation of participants
over several weeks, the potential for a high drop-out rate of panellists exists
(Sommerville, 2008; Borg & Gall, 1983). This was actually one of the issues of the study,
since there was a drop out of 23% from round one to round two (from 21 to 16
respondents).
Another aspect that was observed was the low number of responses (21 from 93 people
contacted), this might have two causes. One is because most of the participants identified
were found on LinkedIn, Research gate, conference publications, and universities. The
other cause might be related to the time of the year, since the study was held between
June and August 2016, which corresponds to the European summer, time of the year that
most people are out of the office for their annual leave.
8.3.4. Action research
The action research method was used to validate the framework. Company A was chosen
for the study due to its commitment to sustainability practices. Company A, however, is
a small enterprise with a lower level of process maturity. This aspect affected the research,
once it was unable to achieve its full potential. The implementation phase identified a
problem in the proposed solution for the problem and it was redesigned. The monitor and
control phase was not entirely followed, the step “monitor and control organisational
performance” was not relevant to the organisation and, thus, was not performed. Since
the implementation was not concluded, the steps of “Realise value” and “identify
optimisation opportunities” were also not able to be concluded. In several moments, the
action research study faced some difficulties regarding the boundaries between the
academic purposes and the business interests.
After concluding the study, an interview was held with the managing director of the
company to obtain his feedback regarding the research and the framework. According to
him, the initial view of the framework is “dense” and “seems too complex”. However,
after analysing the steps and phases, the framework reads well and “have a good flow”.
According to his feedback, the research is essential for new production systems but might

205
face difficulty to be adopted on small companies, due to its lack of process/sustainability
maturity. In order to improve it, he recommended to fully understanding what is the target
for this research, company size, company location and industry. Finally, he proposed the
creation of best practices in terms of sustainable processes.
8.4. Research Contribution to the Sustainability Implementation Field –
Theoretical Implications Chapter 2 has identified the best practices frameworks found in the literature to implement
sustainability initiatives from different angles, such as Human aspect (Robinson et al.,
2006 and Vora, 2013); Sustainability Indexes/Reporting facet (Tan et al., 2010; and
Ahmed & Sundaram, 2012); Project Management side (Silvius & Nedeski, 2011; Silvius,
Schipper and Nedesky, 2012; Agyekum-Mensah et al., 2012); and Operations aspect
(Thies et al., 2012; Uddin & Rahman, 2012; and Tan et al., 2008). It was identified that
current models to implement sustainability practices do not address fully the
sustainability challenge (Ahmed & Sundaram, 2012).
This research, then, provides a new approach for the implementation of sustainability
initiatives in business processes, combining aspects from operations management field to
the sustainability topic. According to Gunasakaran et al. (2015), Sustainable Operations
Management (SOM) has started receiving attention from both operations management
and management science researchers. This study provides a new step for the application
of sustainability practices in the Operations Management scenario, providing tools and
methods to improve the likelihood of success of those initiatives.
8.5. Practical Implications of the Research The last twenty years have seen growing pressure on businesses to pay attention to the
environmental and resource consequences of their products and processes (Kleindorfer et
al., 2005), which has resulted into the increase of Sustainable Operations Management
(SOM) research (Walker, 2014). According to Houy et al. (2012) taking resource
scarceness, increasing pollution and the debate on global warming into consideration,
more and more organisations recognise the upcoming need to improve the sustainability
of their business processes. According to Thies et al. (2012), leading enterprises are even
going beyond static sustainability reporting by incorporating environmental and social
activities into their core business processes. Organisations increasingly realises the
importance of sustainability, and many are trying to design or redesign their business
processes so that their activities are more environmentally friendly (Klassen & Vachon,

206
2003). Such companies have in particular understood the value of improving their
processes to achieve environmental excellence; the same way they collaborate with others
to improve their supply chains with respect to time, quality, flexibility, agility and total
cost (Handfield, Sroufe, & Walton, 2005; Sharfman, Shaft, & Anex, 2009).
The research, then, provides a framework using the Business Process Management
(BPM) approach, which offers a systemic solution for the organisations adopt
sustainability practices in their business processes. The advantages of the use of this
methodology include: enablement of continuous process improvement; improvement of
process quality; cost reduction; increase in the customer satisfaction; and better control
over process performance (Gallotta, 2016). This study provides an applied overview of
the topic and can be used as a handbook for managers, consultants and practitioners in
the topic of sustainable operations management.
8.6. Research Limitations and further research The main limitation of this research is the application of the framework in only one real-
life scenario, which was expected due to the research method was chosen to validate it.
Future work aims to apply the framework in different scenarios, in organisations with
different sizes, different maturity level, different sector, and different locations. Further
research will also investigate the symbiosis of the BPM approach with other management
approaches, such as lean/green manufacturing, project management, green supply chain
and carbon footprint. In addition, in a further moment, once companies are familiarized
with the project methodology, it is possible to create a centre of excellence (an area within
the organisation with the best practices/ processes of the industry) in terms of
sustainability bringing even more value, improving continuously and generating more
innovation by the form of green reference process models.
8.7. Final comments – dissertation experience The author’s personal experience in conducting this research project and writing his
dissertation can be considered at the same time stressful, but also positive and satisfactory.
As a PhD (new Route) student and Business Consultant, this research project has allowed
the author to apply Business Process Management (BPM) concepts to the Sustainability
topic.
Regarding the dissertation’s writing process that the author went through, it was observed
an improvement in the academic writing skills. The author appreciates the guidance
offered by Dr Jose Arturo Garza-Reyes (dissertation’s supervisor) and Dr Tony Anosike

207
(dissertation’s co-supervisor) and the previous research and training experience acquired
during this study.

208
Bibliography
Ackerman, R.W. (1975), The Social Challenge to Business, Harvard University Press,
Cambridge, MA
Adams, W. (2006), “The future of sustainability: re-thinking environment and
development in the twenty-first century”, IUCN Renowned Thinkers Meeting,
IUCN, Gland, 29-31 January
Adams, C., & O'Brien, H. (2004). Delphi method. Retrieved November, 2017, from
www.arches.uga.edu/~cadamrun/7320/delphi.htm
Agus, A. and Hajinoor, M.S. (2012), “Lean production supply chain management as
driver towards enhancing product quality and business performance: case study of
manufacturing companies in Malaysia”, International Journal of Quality &
Reliability Management, Vol. 29 No. 1, pp. 92-121.
Agus, Ahmad, A, and Jaafar, M. (2009). An Empirical Investigation on The Impact of
Quality Management on Productivity and Profitability: Associations and Mediating
Effect. Contemporary Management Research, 5(1), pp. 77-92.
Agyekum-Mensah, G, Knight, A. and Coffey, C. (2012) 4Es and 4 Poles model of
sustainability: Redefining sustainability in the built environment Structural Survey
Vol. 30 No. 5, pp. 426-442.
Ahire, S., Golhar, D., & Waller, M. (1996). Development and Validation of TQM
Implementation Constructs. Decision Sciences, 27(1), pp. 23–56.
Ahmed, M. D., Sundaram, D. (2012) Sustainability modelling and reporting: From
roadmap to implementation Vol. 53 No. 3, pp. 611-624.
Ambec, S. and Lanoie, P. (2008), “Does it pay to be green? A systematic overview”,
Academy of Management Perspectives, Vol. 22 No. 4, pp. 45-62.

209
Aras, G. Crowther, D. (2008) "Governance and sustainability: An investigation into the
relationship between corporate governance and corporate sustainability",
Management Decision, Vol. 46 Issue: 3, pp.433-448
Armistead, C., & Machin, S. (1997). Implications of business process management for
operations management. International Journal of Operations and Production
Management, Vol. 1 No. 1, pp. 886–898
Appel, S., Kleber, P., Frischbier, S., Freudenreich, T. and Buchmann, A. (2014).
Modeling and execution of event stream processing in business processes.
Information Systems, Vol. 46, pp.140-156.
Association of Business Process Management Professionals (ABPMP) (2009), Guide to
the Business Process Management Common body of knowledge (BPM CBOK),
Version 2.0 – APPMP, Indiana, USA
Association of Project Management (APM) (1995), APM Body of Knowledge (BoK),
revised version 2, APM, High Wycombe.
Atieno, O (2009), “an analysis of the strengths and limitation of qualitative and
quantitative research paradigms”, problems of education in the 21st century. Volume
13
Balakrishnan, A, Kalakota, R, Whinston, A. (1995). Document-centered information
systems to support reactive problem-solving in manufacturing. International Journal
of Production Economics, 38 (1995), pp. 31-58
Banerjee, S. (2001). Managerial perceptions of corporate environmentalism:
interpretations from industry and strategic implications for organizations. J. Manag.
Stud., 38 (4) (2001), pp. 489-513
Basile, F. (1996). “Great management ideas can work for you”, Indianapolis Business
Journal, Vol. 16, pp.53‐4.

210
Baskerville, R. Pries-Heje, J. (1999). Grounded Action Research: A Method for
Understanding IT in Practice. Accounting, Management and Information
Technologies, vol. 9 no. 1, pp. 1–23.
Basu, P. (2010). Biomass gasification and pyrolysis. Burlington, MA: Academic Press.
Benner, M., & Tushman, M. (2003). Exploitation, Exploration, and Process Management:
The Productivity Dilemma Revisited. The Academy of Management Review, Vol.
28, pp. 238-256.
Bhasin, S. and Burcher, P. (2006), “Lean viewed as a philosophy”, Journal of
Manufacturing Technology Management, Vol. 17 No. 1, pp. 56-72.
Bhupendra, K., Sangle, S. (2015). What drives successful implementation of pollution
prevention and cleaner technology strategy? The role of innovative capability. J.
Environ. Manag., 155, pp. 184-192
Bititci, U., Ackermann, F., Ates, A., Davies, J., Garengo, P., Gibb, S., MacBryde, J.,
Mackay, D., Maguire, C., van der Meer, R., Shafti, F., Bourne, M. and Umit Firat,
S. (2011). Managerial processes: business process that sustain performance. Int Jrnl
of Op & Prod Mnagemnt, Vol. 31 No. 8, pp.851-891.
Borg, W. R., & Gall, M. D. (1983). Educational research: An introduction (4th ed.). New
York: Longman
Box, S. and Platts, K. (2005). Business process management: establishing and
maintaining project alignment. Business Process Management Journal, Vol. 11 No.
4, pp.370-387.
Brudan, A. (2010). Rediscovering performance management: systems, learning and
integration. Measuring Business Excellence, Vol. 14 No. 1, 109-123.
Bryman, A. & Bell, E. (2011) “Business Research Methods” 3rd edition, Oxford
University Press

211
Buh, B., Kovačič, A., Indihar Štemberger, M., (2015). Critical success factors for
different stages of business process management adoption – a case study. Economic
Research-Ekonomska Istraživanja Vol. 28, pp. 243–258.
Buil, M., Aznar, J, Galiana, J. Rocafort-Marco, A. (2016). An explanatory study of MBA
students with regards to sustainability and ethics commitment Journal of
Sustainability Vol. 8 No. 3 pp. 280
Burnes, B. (2003), "Managing change and changing managers from ABC to XYZ",
Journal of Management Development, Vol. 22 No. 7, pp. 627-642.
Caldari, K. (2007), ‘Alfred Marshall's critical analysis of scientific management, ‘The
European Journal of the History of Economic Thought, vol. 14, no. 1, pp. 55-78,
Cantrill JA, Sibbald B, Buetow S.The Delphi and nominal group techniques in health
services research. International Journal of Pharmacy Practice 1996;4:67–74.
Carnegie Mellon Software Engineering Institute (2002), Carnegie Mellon Software
Engineering Institute: Capability maturity models, Available at
http://www.sei.cmu.edu/cmmi/ (Acessed in May 2015).
Carvalho, H., Duarte, S. and Cruz-Machado, V. (2011), “Lean, agile, resilient and green:
divergencies and synergies”, The International Journal of Lean Six Sigma, Vol. 2
No. 2, pp. 151-179.
CDC - NIOSH Pocket Guide to Chemical Hazards (2016) - Coal tar pitch volatiles.
Available at www.cdc.gov.
Chiarini, A. (2014). Sustainable manufacturing-greening processes using specific Lean
production tools: an empirical observation from European motorcycle component
manufacturers. J. Clean. Prod., 85, pp. 226-233
Christmann, P. (2000). Effects of ‘best practices’ of environmental management on cost
advantage: the role of complementary assets. Acad. Manag. J., 43 (4), pp. 663-680
Clayton, M. J. (1997). Delphi: A technique to harness expert opinion for critical decision-
makingtasks in education. Educational Psychology, 17(4), pp. 373-384.

212
Coghlan, D., Shani, A. (2014). Creating action research quality in organization
development: Rigorous, reflective and relevant. Syst. Pract. Action Res., 27 (6)
(2014), pp. 523-536.
Crane, A. Corporate greening as amoralization (2000). Organization Studies, 21 (4), pp.
673-696
Crittenden, John; Trussell, Rhodes; Hand, David; Howe, Kerry and Tchobanoglous,
George (2005). Water Treatment Principles and Design, Edition 2. John Wiley and
Sons. New Jersey.
Crowley, G., Sobel, R (2010) "Adam Smith: managerial insights from the father of
economics", Journal of Management History, Vol. 16 Issue: 4, pp.504-508.
Cruz-Machado, V. and Leitner, U. (2010), “Lean tools and lean transformation process
in health care”, International Journal of Management Science and Engineering
Management, Vol. 5 No. 5, pp. 383-392.
Daily, B., S. Huang (2001). Achieving sustainability through attention to human resource
factors in environmental management. International Journal of Operations &
Production Management, 21 (12), pp. 1539-1552.
Dale, B.G. (2003), “TQM: an overview”, in Dale, B.G. (Ed.), Managing Quality, 4th ed.,
Blackwell Publishing, Oxford, pp. 3‐33.
Dalkey, N. and Helmer, O. (1963), “An experimental application of the Delphi method
to the use of experts”, Management Science, Vol. 9 No. 3, pp. 458-467
Davenport, T.H. & Short, J.E. (1990 Summer). "The New Industrial Engineering:
Information Technology and Business Process Redesign," Sloan Management
Review, pp. 11-27.
Davenport, T.H. (1993). Process Innovation, Harvard Business School Press, Boston,
MA.

213
Dean, J., & Bowen, D. (1994). Management Theory and Total Quality: Improving
Research and Practice Through Theory Development. Academy of Management
Review, 19(3), 392-418.
Debnath, S. (2015). Environmental Regulations Become Restriction or a Cause for
Innovation – A Case Study of Toyota Prius and Nissan Leaf. Procedia - Social and
Behavioral Sciences, 195, pp.324-333.
de Bruin, T., & Rosemann, M. (2007). Using the Delphi technique to identify BPM
capability areas. Paper presented at the 18th Australasian conference on information
systems, Toowoomba, Australia.
Deming, W.E. (1986). Out of the Crisis. MIT Press: Cambridge, MA.
del-Río-Ortega, A., Resinas, M., Cabanillas, C. and Ruiz-Cortés, A. (2013). On the
definition and design-time analysis of process performance indicators. Information
Systems, Vol. 38 No. 4, pp.470-490.
De Vaus, D. (2001) Research Design in Social Research, London: Sage
Dewhurst, F., Martınez-Lorente, A., & Sanchez-RodrıGuez, C. (2003). An Initial
Assessment of the Influence of IT on TQM: A Multiple Case Study. International
Journal of Operations and Production Management, 23(4), 348–374.
Digest of UK Energy Statistics (DUKES) (2016). Available at
https://www.gov.uk/government/uploads/system/uploads/attachment_data/file/5409
53/Chapter_6_web.pdf
Dinsmore, P.C. (1998), How grown-up is your organisation? PM Network, Vol. 12, No.
6, pp. 24-26
Doppelt, B. (2009). Leading Change toward Sustainability. London: Routledge.
Dowell G, Hart S, Yeung B. (2000). Do corporate global environmental standards create
or destroy market value? Management Science, Vol. 46 No. 8: pp. 1059–1074.

214
Draghicia, A. , Popescua, A. , Gogana, L. (2014) A proposed model for monitoring
organisational performance, Procedia, Timisoara, Romania. Vol. 124. pp 544-551.
Drake, D. and Spinler, S. (2013). “Sustainable Operations Management: An Enduring
Stream, or Passing Fancy?”. Manufacturing & Service Operations Management
Journal, Vol 15 No. 4, pp. 689-700.
Duarte, S. and Cruz Machado, V. (2017). Green and lean implementation: an assessment
in the automotive industry. International Journal of Lean Six Sigma 8(1), pp. 65–88.
Dudovskiy, J. (2016). The Ultimate Guide to Writing a Dissertation in Business Studies:
A Step-by-Step Assistance
Edinger, P., Schneebeli, J., Struis, R., Biollaz, S. and Ludwig, C. (2016). On-line liquid
quench sampling and UV–Vis spectroscopy for tar measurements in wood
gasification process gases. Fuel, 184, pp.59-68.
Elkington, J. (1997). Cannibals with Forks: the Triple Bottom Line of 21st Century
Business. Capstone Publishing, Ltd, Oxford.
EPA – United States Environmental Protection Agency (2009), “The environmental
professional’s guide to Lean & Six Sigma”, available at: www.epa.gov/lean/
Epstein, M. J. and Buhovac, A. R. (2010) Solving the sustainability implementation
challenge. Organisational Dynamics Vol 39, pp. 306-315
Eriksson, A. (2012) Torrefaction and gasification of biomass: The potential of
torrefaction combined with entrained-flow gasification for production of synthesis-
gas. KTH Royal Institute of Technology, Stockholm.
Flynn, B.B., Schroeder, R.G., & Sakakibara, S. (1994). A Framework for Quality
Management Research and an Associated Measurement Instrument. Journal of
Operations Management, 11(4), pp. 339-366.
Fotopoulos, C.B. and Psomas, E.L. (2009), “The impact of ‘soft’ and ‘hard’ TQM
elements on quality management results”, International Journal of Quality and
Reliability Management, Vol. 26 No. 2, pp. 150-163

215
Food and Fertilizer Technology Center for the Asian and Pacific Region (2005).
Agricultural Production Sciences Research and Development Office. Department of
Agriculture, Thailand. Available at
http://www.agnet.org/library.php?func=view&id=20110720153306. Accessed in
September 2016
Franceschini, F., Galetto, M. and Maisano, D. (2007). Management by measurement.
Berlin: Springer Verlag.
Gallotta, B. (2016), "A conceptual framework for the implementation of sustainability
business processes ", Master of Research (MRes) Dissertation, University of Derby,
Derby, UK
Gallotta, B., Garza-Reyes, J.A., Anosike, A., Lim, M. and Roberts, I (2016). A conceptual
framework for the implementation of sustainability business processes. Proceedings
of the 27th Production and Operations Management Society (POMS) Conference,
Orlando, FL., US, May 6-8.
Garrod, B. (2004). Lecture notes on the Delphi technique. Retrieved November 2017,
from http://users.aber.ac.uk/bgg/rm.htm
Geng, Y., Fu, J., Sarkis, J.,Xue, B. (2012). Towards a national circular economy indicator
system in China: an evaluation and critical analysis. J. Clean. Prod., 23, pp. 216-224
Goddard, W. & Melville, S. (2004) “Research Methodology: An Introduction” 2nd
edition, Blackwell Publishing
Gordon, T. J. (1994). The Delphi method. Washington, DC: American Council for the
United Nations University.
Ghose, A., Hoesch-Klohe, K., Hinsche, L., & Le, L.-S. (2009). Green business process
management: A research agenda. Australasian Journal of Information Systems, Vol.
16 No. 2, pp. 103–117.
Gibson, N (2004). Action Research. Sage Publications, Inc., Thousand Oaks, CA

216
Giunipero, L., Hooker, R. and Denslow, D. (2012). Purchasing and supply management
sustainability: Drivers and barriers. Journal of Purchasing and Supply Management,
Vol. 18 No. 4, pp.258-269.
GRI (2013), The Sustainability Reporting Guidelines, available at:
https://www.globalreporting.org/standards/g4/Pages/default.aspx (accessed April
2015)
Gunasekaran, A., Spalanzani, A. (2012). Sustainability of manufacturing and services:
investigations for research and applications. International Journal Production
Economics, Vol. 140, Issue 1, pp. 35-47
Hammer, M. and Champy, J. (1993), Reengineering the Corporation: A Manifesto for
Business Revolution, New York, NY: Harper Business.
Habibi, A., Sarafrazi, A., Izadyar, S. (2014). Delphi Technique Theoretical Framework
in Qualitative Research 1. Master of Business Administration, Isfahan University,
Iran 2, Master of EMBA, Payam Noor University, Iran 3, Master of Marketing
Management, Guilan University, Iran
Hammer, M. and Champy, J. (1994). Reengineering the corporation. New York, NY:
Harper Business.
Hammer, M. (2010). What is business process management? In: vom Brocke, J., et al.
(Eds.), Green Business Process Management. Springer- Verlag, Berlin, Heidelberg,
Germany, pp. 3-16.
Handfield, R., Sroufe, R., & Walton, S. (2005). Integrating environmental management
and supply chain strategies. Business Strategy and the Environment, Vol. 14 No. 1,
pp. 1–19.
Harmon, P. (2010), “Scope and evolution of business process management”, Handbook
on Business Process Management, International Handbooks Information System,
Part I, Vol. 1, Springer, Warren, MI, pp. 37-81.

217
Harmon, P.; Wolf, C. (2014), “The State of Business Process Management”. BP Trends,
available at https://www.bptrends.com/bpt/wp-content/uploads/BPTrends-State-of-
BPM-Survey-Report.pdf. Accessed on December 2017.
Hasson, F., Keeney, S. and McKenna, H. (2000), “Research guidelines for the Delphi
survey technique”, Journal of Advanced Nursing, Vol. 32 No. 4, pp. 1008-1015
Hill, J; Cantara, M; Deitert, E and Kerremans, M (2007). Magic Quadrant for Business
Process Management Suites, Gartner, Inc.,
Hoesch-Klohe, K., & Ghose, A. (2010). Business process improvement in Abnoba. Paper
presented at the Proceedings of the 1st international workshop on services, energy,
& ecosystem (SEE 2010), San Francisco, CA, USA.
Hogarth, R. M. (1978). A note on aggregating opinions. Organizational Behavior and
Human Performance, 21, pp. 40-46.
Houy, C., Fettke, P., & Loos, P. (2010). Empirical research in business process
management – Analysis of an emerging field of research. Business Process
Management Journal, Vol. 16 No. 4, pp. 619–661.
Houy, C., Reiter, M. Fettke, P., Loos, P., Hoesch-Klohe, K., and Ghose, A. (2012).
Advancing Business Process Technology for Humanity: Opportunities and
Challenges of Green BPM for Sustainable Business Activities. In: vom Brocke, J., et
al. (Eds.), Green Business Process Management. Springer- Verlag, Berlin,
Heidelberg, Germany, pp. 15-37
Hubbard, G. (2009) Measuring organizational performance: beyond the triple bottom
line. Business Strategy and the Environment, Vol. 18, No. 3, pp. 177-191, 2009.
Hussey, J, and Hussey, R. (1997), Business Research A Practical Guide for
Undergraduate and Postgraduate Students, London.
Inside Climate News (2016). With Some Tar Sands Oil Selling at a Loss, Why Is
Production Still Rising? Available at
https://insideclimatenews.org/news/23022016/tar-sands-becoming-worthless-
production-rises-even-prices-plummet. Accessed in September 2016.
218
Ittner, C. D., and Larcker, D. F. (1997). Quality strategy, strategic control systems, and
organizational performance. Accounting, Organizations and Society Vol 22, pp.
293–314.
Jaafreh, A. B., & Al-abedallat, A. Z. (2012). The Effect of Quality Management Practices
on Organizational Performance in Jordan: An Empirical Study. International Journal
of Financial Research, 4(1).
Jabbour, C., Jabbour, A., Govindan, K., Teixeira, A., Freitas, W. (2013). Environmental
management and operational performance in automotive companies in Brazil: the
role of human resource management and lean manufacturing. J. Clean. Prod., 47, pp.
129-140
Jaffee, D. 2001, ‘THE RISE OF THE FACTORY SYSTEM’, Organization theory:
Tension and Change, McGraw Hill, Boston
Jamieson, S., 2004. Likert scales: how to (ab)use them. Med. Educ. 38, pp. 1217–1218.
Juran, J.M. (1954), “Universals in management planning and controlling”, The
Management Review, November, pp. 748‐61.
Juran, J.M. (2001). “The non‐Pareto principle; mea culpa”, The Juran Institute, available
at: www.juran.com/research/articles/sp7515.html (accessed in june, 2015)
Jeston, J. and Nelis, J. (2006). Business Process Management Practical Guidelines to
Successful Implementations. Oxford: Elsevier.
Jeston, J. and Nelis, J. (2008). Management by process: A roadpmap to sustainable
Business Process Management. Amsterdam: Elsevier/Butterworth-Heinemann.
Judge, W. Douglas, T. (1998). Performance implications of incorporating natural
environmental issues into the strategic planning process: an empirical assessment. J.
Manag. Stud., 35 (2), pp. 241-262
Kaynak, H. (2003). The Relationship between Total Quality Management Practices and
Their Effects on Firm Performance. Journal of Operations Management, 21(4), pp.
405–435.

219
Kelly KP and D Porock (2005) A survey of paediatric oncology nurses’ perceptions of
parent educational needs. Journal of Paediatric Oncology Nursing 22(1), pp. 58–66.
Kirchherr, J., Reike, D., & Hekkert, M. (2017). Conceptualizing the circular economy:
An analysis of 114 definitions. Resources, Conservation and Recycling, 127, 221–
232.
Klassen, R. D.,& Vachon, S. (2003). Collaboration and evaluation in the supply chain:
The impact on plant-level environmental investment. Production and Operations
Management, Vol. 12 No. 3, pp. 336–352.
Kleindorfer, P., Singhal, K., Van Wasenhove, L., 2005. Sustainable operations
management. Production and Operations Management Vol. 14 No. 4, pp. 482–492.
Knoepfel, H. (Ed.) (2010). Survival and Sustainability as Challenges for Projects,
International Project Management Association, Zurich.
Kothari, C.R. (2008) “Research Methodology: Methods and Techniques” New Age
International
Krajevski, L, Malhotra, M, Ritzman, L. (2012). Operations Management: Processes and
Supply Chains, Global Edition. Pearson.
Krigsholm, P., Zavialova, S., Riekkinen, K., Ståhle, P., & Viitanen, K. (2017).
Understanding the future of the Finnish cadastral system – A Delphi study. Land Use
Policy, 68, 133-140.
Kurdve, M., Zackrisson, M., Wiktorsson, M., Harlin, U. (2014). Lean and Green
integration into production system models – experiences from Swedish industry J.
Clean. Prod., 85, pp. 180-190
Kurucz, E.C., Colbert, B.A., Lüdeke-Freund, F., Upward, A., Willard, B., (2017).
Relational leadership for strategic sustainability: practices and capabilities to
advance the design and assessment of sustainable business models. Journal of
Cleaner Production 140, pp. 189–204.

220
Laurence M. Harwood; Christopher J. Moody (13 June 1989). Experimental organic
chemistry: Principles and Practice (Illustrated ed.). WileyBlackwell. pp. 147–149.
Lee, R. and Dale, B. (1998). Business process management: a review and
evaluation. Business Process Management Journal, Vol. 4 No. 3, pp. 214-225.
Levina, O. (2015) "Exploring the Role of Business Process Management in Sustainability
Initiatives". MCIS 2015 Proceedings. pp. 35
Lin, C., Frank Chen, F., Wan, H., Min Chen, Y. and Kuriger, G. (2013). Continuous
improvement of knowledge management systems using Six Sigma methodology.
Robotics and Computer-Integrated Manufacturing, 29(3), pp. 95-103
Linderman, K, Schroeder, R, Zaheer, S, Choo, S (2003). Six sigma: a goal-theorectic
perspective. Journal of Operations Management. Vol 21, pp.193-203
Linkage (2013). Organisational Development (OD) Consulting. Available at:
http://linkageasia.com/our-leadership-consultingexpertise/organisational-
development-od-consulting/ (accessed in may 2015)
Linnenluecke, M.K. and Griffiths, A. (2010), “Corporate sustainability and
organizational culture”, Journal of World Business, Vol. 45, pp. 357-66
Linton, J.D., Klassen, R. and Jayaraman, V. (2007), “Sustainable supply chains: an
introduction”, Journal of Operations Management, Vol. 25 No. 6, pp. 8
Linstone, H. and Turoff, M. (1975). The Delphi method. Reading, Mass.: Addison-
Wesley Pub. Co., Advanced Book Program.
Linstone, H. and Turoff, M. (2002). The Delphi Method: Techniques and Applications.
Reading, Mass.: Addison-Wesley Pub. Co., Advanced Book Program.
Litten L. (2005). Measuring and Reporting Institutional Sustainability. Association for
Institutional Research Annual Forum, San Diego. Marshall
Loughlin, K, Moore, L. (1979). Using Delphi to achieve congruent objectives and
activities in a pediatrics department. Journal of medical education 54(2), pp.101-6

221
Lusk, S., Paley, S, and Spanyi, A (2005) The Evolution of Business Process Management
as a Professional Discipline. BPTrends. Available at
http://w.bptrends.com/publicationfiles/06-
05%20WP%20ABPMP%20Activities%20-%20Lusk%20et%20al2.pdf (accessed in
June 2015).
Ma, P., Zhang, C., Hong, X., & Xu, H. (2018). Pricing decisions for substitutable products
with green manufacturing in a competitive supply chain. Journal of Cleaner
Production.
Maestrini, V., Luzzini, D., Shani, A. and Canterino, F. (2016). The action research cycle
reloaded: Conducting action research across buyer-supplier relationships. Journal of
Purchasing and Supply Management, 22(4), pp.289-298.
Magon, R.B., Thomé, A.M.T., Ferrer, A.L.C., Scavarda, L.F., 2018. Sustainability and
performance in operations management research. Journal of Cleaner Production 190,
104–117.
Malone D, J Abarca, P Hansten, A Grizzle, E Armstrong, RV Bergen, B Duncan-Edgar,
S Solomon and R Lipton (2005) Identification of serious drug-drug interactions:
Results of the partnership to prevent drug-drug interactions. American Journal of
Geriatric Pharmacotherapy 3(2), pp. 65–76.
Maniatis, K. and Beenackers, A. (2010). Tar Protocols. IEA Bioenergy Gasification Task.
Biomass and Bioenergy, 18(1), pp.1-4.
Mapotse, T. A. (Ed.). (2018). Cross-Disciplinary Approaches to Action Research and
Action Learning. Advances in Knowledge Acquisition, Transfer, and Management.
IGI Global.
Margherita, A. (2014). Business process management system and activities. Business
Process Mgmt Journal, Vol. 20 No. 5, pp. 642-662.
de Mast, J, Lokkerbol, J. (2012). An analysis of the Six Sigma DMAIC method from the
perspective of problem solving, International Journal of Production Economics,
Volume 139, Issue 2,

222
McCormack, K. and B. Johnson (2001), "Business process orientation, supply chain
management, and the e-corporation," IIE Solutions, Vol. 33 No. 10, pp. 33-37.
McNall, S., Hershauer, J. and Basile, G. (2011). The business of sustainability. Santa
Barbara, Calif.: Praeger.
Meadows A, LMaine, E Keyes, K Pearson and K Finstuen (2005) Pharmacy executive
leadership issues and associated skills, knowledge, and abilities. Journal of the
American Pharmacists Association 45(1), pp. 55–62.
Mendling, J., Reijers, H., Recker, J. (2010). Activity labeling in process modeling:
empirical insights and recommendations Information Systems, Vol. 35 No. 4), pp.
467–482.
Milne, T.; Agblevor, F.; Davis, M.; Deutch, S.; Johnson, D. 1997a. “A Review of the
Chemical Composition of Fast-Pyrolysis Oils from Biomass,” in Developments in
Thermochemical Biomass Conversion. Edited by A.V. Bridgwater and D.G.B.
Boocock. London: Blackie Academic, pp. 409–424.
Mirvis, P. and Manga, J. (2010), “Integrating corporate citizenship: leading from the
middle”, in Smith, N.C., Bhattacharya, C.B., Vogel, D. and Levine, D.I. (Eds),
Global Challenges in Responsible Business, Cambridge University Press,
Cambridge, pp. 78‐106.
Mittal, V. K., Sindhwani, R., Kalsariya, V., Salroo, F., Sangwan, K. S., & Singh, P. L.
(2017). Adoption of Integrated Lean-Green-Agile Strategies for Modern
Manufacturing Systems. Procedia CIRP, 61, pp. 463–468.
McKenna, H.P. (1994) The Delphi technique: a worthwhile approach for nursing?.
Journal of Advanced Nursing; 19:1221–1225.
McKenzie, S. 2004. Social Sustainability: towards Some Definitions. Hawke Research
Institute, University of South Australia, Magill, vol. 27.

223
Morais, R., Kazan, S., Dallavalle, S., Costa, A. (2014) "An analysis of BPM lifecycles:
from a literature review to a framework proposal", Business Process Management
Journal, Vol. 20 Issue: 3, pp.412-432.
Muja, N., H. Appelbaum, S., Walker, T., Ramadan, S. and Sodeyi, T. (2014).
Sustainability and organisational transformation: putting the cart before the horse?
(part one). Industrial and Commercial Training, Vol. 46 No. 5, pp.249-256.
Ness, B., Urbel Piirsalu, E., Anderberg, S., Olsson, L., 2007. Categorising tools FOS
sustainability assessment. Ecological Economics Vol. 60, 498–508.
Netjes, M. , Reijers, H. and Van der Aalst, W.P. (2006), “Supporting the BPM life-cycle
with FileNet”, Proceedings of the Workshop on Exploring Modeling Methods for
Systems Analysis and Design (EMMSAD), Namur University, Namur, pp. 497-508.
Newton, J. (2006). Action Research. SAGE Publications, London, England.
Nhuchhen, D., Basu, P. and Acharya, B. (2014). A Comprehensive Review on Biomass
Torrefaction. International Journal of Renewable Energy & Biofuels, pp.1-56.
Nicholas, J. and Steyn, H. (2008). Project management for business, engineering, and
technology. Amsterdam: Elsevier Butterworth Heinemann.
NIST. (2010). National Institute of Standards and Technology: the 2009-2010 Criteria for
Performance Excellence (MBNQA).
OECD (2004), “Principles of corporate governance”, available
at: www.oecd.org/corporate/ca/corporategovernanceprinciples/31557724.pdf
(acessed in March, 2015)
Ohno, T. (1988). Toyota production system. Cambridge, Mass.: Productivity Press.
Olsson, J.A., Hilding-Rydevik, T., Aalbu H. and Bradley, K. (2004). “Indicators for
Sustainable Development”, Discussion paper, European Regional Network on
Sustainable Development.

224
Okoli, C. and Pawlowski, S.D. (2004), “The Delphi method as a research tool: an
example, design considerations and applications”, Information & Management, Vol.
42, pp. 15-29
Opitz, N., Krup, H., & Kolbe, L. M. (2014). Green Business Process Management -- A
Definition and Research Framework. In 2014 47th Hawaii International Conference
on System Sciences. IEEE.
Ormazabal, M., Prieto-Sandoval, V., Puga-Leal, R. and Jaca, C. (2018). Circular
Economy in Spanish SMEs: Challenges and opportunities. Journal of Cleaner
Production, 185, pp.157–167.
Ottensooser, A., Fekete, A., Reijers, H., Mendling, J. and Menictas, C. (2012). Making
sense of business process descriptions: An experimental comparison of graphical and
textual notations. Journal of Systems and Software, Vol. 85 No. 3, pp.596-606.
Ould, M.A. (1995), Business Processes: Modelling and Analysis for Re-engineering and
Improvement, Wiley, Chichester.
Pampanelli, A., Found, P., Bernardes, A (2014). A Lean and Green Model for a
production cell. J. Clean. Prod., 85, pp. 19-30
Park, J. Sarkis, J., Wu, Z. (2010). Creating integrated business and environmental value
within the context of China’s circular economy and ecological modernization. J.
Clean. Prod., 18 (2010), pp. 1492-1499
Pearce, D., Turner, K. (1990). Economics of Natural Resources and the Environment, vol.
1990, Harvester Wheats, Brighton
Pegels, C. (1984),"The Toyota Production System — Lessons for American
Management", International Journal of Operations & Production Management, Vol.
4 No. 1 pp. 3 – 11.
Pettersen, J. (2009), “Defining lean production: some conceptual and practical issues”,
The TQM Journal, Vol. 21 No. 2, pp. 127-142.
Porter, M. (1985). Competitive advantage. New York: Free Press.

225
Poveda, C. and Lipsett, M. (2014). An integrated approach for sustainability assessment:
the Wa-Pa-Su project sustainability rating system. International Journal of
Sustainable Development & World Ecology, Vol. 21 No.1, pp.85-98.
Powell, T.C. (1995). Total Quality Management as Competitive Advantage: A Review
and Empirical Study. Strategic Management Journal, 16, 15–37
Prajogo, D.I., & Sohal, A.S. (2003). The Relationship between TQM Practices, Quality
Performance, and Innovation Performance: an Empirical Examination. International
Journal of Quality and Reliability Management, 20(8), 901-918.
Prieto-Sandoval, V., Jaca, C., Ormazabal, M. (2018). Towards a consensus on the circular
economy. J. Clean. Prod., 179 (2018), pp. 605-615,
Project Management Institute (2004). A Guide to the Project Management Body of
Knowledge. 3rd ed. Newtown Square, Pennsylvania: Project Management Institute,
Inc.. pp. 37-42
Radhashnan, R, Balasubramanian, S. (2008) Business Process Reengineering: Text and
Cases. (2008). New Deli: PHI Learning Private Limited.
Rao, S. S., L. E. Solis, Raghu-Nathan. (1999). A Framework for International Quality
Management Research: Development and Validation of a Measurement. Total
Quality Management, 10(7), 1047-1075.
Ravesteyn, P., Batenburg, R. (2010) "Surveying the critical success factors of BPM‐
systems implementation", Business Process Management Journal, Vol. 16 Issue: 3,
pp.492-507
Reason, P., Bradbury, H. (2008). Handbook of Action Research (2nd ed.), Sage, London
Rebelo, M., Santos, S., Silva, R. (2016). Integration of management systems: towards a
sustained success and development of organizations. J. Clean. Prod., 127, pp. 96-
111,

226
Recker, J., M. Rosemann, and E. R. Gohar. (2011). “Measuring the Carbon Footprint of
Business Processes.” Business Process Management Workshops January: pp. 511–
20
Reijers, H., Mans, R. and van der Toorn, R. (2009). Improved model management with
aggregated business process models. Data & Knowledge Engineering, Vol. 68 No.
2, pp.221-243.
Rifkin, J. (2009). The Empathic Civilization: the Race to Global Consciousness in a
World in Crisis Penguin, New York
Robson, C. (2002). Real World Research: A Resource for Social Scientists and
Practitioner Researchers. Oxford: Blackwell
Robinson, H., Anumba, C., Carrillo, P. and Al‐Ghassani, A. (2006). STEPS: a knowledge
management maturity roadmap for corporate sustainability. Business Process Mgmt
Journal, Vol. 12 No. 6, pp.793-808.
Rosemann, M., & vom Brocke, J. (2010). The six core elements of business process
management. In J. vom Brocke & M. Rosemann (Eds.), Handbook on business
process management: Introduction, methods and information systems. Vol. 1, pp.
107–122.
Rosenberg, A., Chase, G., Omar, R., Taylor, J., von Rosing, M. (2011). Applying real-
world BPM in an SAP environment. Bonn: Galileo Press.
Rossi, S., Colicchia, C., Cozzolino, A. and Christopher, M. (2013). The logistics service
providers in eco-efficiency innovation: an empirical study. Supply Chain
Management: An International Journal, Vol. 18 No. 6, pp.583-603.
Rudden, J (2007). Making the Case for BPM: A Benefits Checklist. BPTrends, pp. 1-8
Ruiz, J., Juárez, M., Morales, M., Muñoz, P. and Mendívil, M. (2013). Biomass
gasification for electricity generation: Review of current technology barriers.
Renewable and Sustainable Energy Reviews, 18, pp.174-183.

227
Sackman, H. (1974). Delphi assessment: Expert opinion, forecasting and group process.
Santa Monica, CA: Rand Corporation.
Sanchez, M. A. (2014) Integrating sustainability issues into project management. Journal
of Cleaner Production Vol. 30, 1-12
Saunders, M., Lewis, P. and Thornhill, A. (2012). Research methods for business
students.
Scheer, A. (2006). Agility by Aris business process management. Berlin: Springer.
Schmiedel, T., vom Brocke, J., Recker, J. (2013) "Which cultural values matter to
business process management? Results from a global Delphi study", Business
Process Management Journal, Vol. 19 Issue: 2, pp.292-317
Seidel, S., Recker, J., vom Brocke, J., (2012): Green Business Process Management:
Towards the Sustainable Enterprise. Heidelberg, Germany – Springer.
Seuring, S., Müller, M., (2008). From a literature reviewto a conceptual framework for
sustainable supply chain management. J. Clean. Prod. Vol. 16, pp. 1699-1710.
Shah, R. and Ward, P.T. (2003), “Lean manufacturing: context, practice bundles, and
performance”, Journal of Operations Management, Vol. 21 No. 2, pp. 129-149.
Shah, R. and Ward, P.T. (2007), “Defining and developing measures of lean production”,
Journal of Operations Management, Vol. 25 No. 4, pp. 785-805.
Shani, A., Pasmore, W. (1985). “Organization inquiry: towards a new model of the action
research process”. D.D. Warrick (Ed.), Contemporary Organization Development:
Current Thinking and Applications Contemporary Organization Development, pp.
438-448
Sharfman, M. P., Shaft, T. M., & Anex, R. P. (2009). The road to cooperative supply-
chain environmental management: Trust and uncertainty among pro-active firms.
Business Strategy and the Environment, Vol. 18 No. 1, pp. 1–13.

228
Sharma, S. Vredenburg, H. (1998). Proactive corporate environmental strategy and the
development of competitively valuable organizational capabilities. Strat. Manag. J., 19
(8), pp. 729-753
Shields, P, Rangarajan, N. (2013). A Playbook for Research Methods: Integrating
Conceptual Frameworks and Project Management
Sila, I., & Ebrahimpour, M. (2005). Critical Linkages among TQM Factors and Business
Results. International Journal of Operations and Production Management, 25(11),
pp. 1123-55.
Sila, I. (2007). Examining the Effects of Contextual Factors on TQM and Performance
through the Lens of Organizational Theories: An Empirical Study. Journal of
Operations Management, 25, pp. 83-109
Siva, V., Gremyr, I., Bergquist, B., Garvare, R., Zobel, T.,Isaksson, R. (2016). The
support of Quality Management to sustainable development: a literature review. J.
Clean. Prod., 138, pp. 148-157
Silvius, A., Schipper, R. (2010). A Maturity Model for Integrating Sustainability in
Projects and Project Management In: 24th World Congress of the International
Project Management Association (IPMA) Istanbul, Turkey
Silvius, A. and Nedeski, S. (2011) Sustainability in IS Projects: A Case Study.
Communications of the IIMA (CIIMA) Vol. 11 No. 4, pp. 1-12.
Silvius, A, Schipper, R, Nedeski, S (2012) Sustainability in Project Management:
Reality Bites In: 26th World Congress of the International Project Management
Association (IPMA) p 1053-1061
Silvius, A. and Schipper, R. (2014). Sustainability in Project Management Competencies:
Analyzing the Competence Gap of Project Managers. JHRSS, Vol. 2 No. 2, pp.40-
58.
Singh, R., Murty, H., Gupta, S. and Dikshit, A. (2012). An overview of sustainability
assessment methodologies. Ecological Indicators, Vol. 15 No.1, pp.281-299.

229
Skrinjar, R. and Trkman, P. (2013). Increasing process orientation with business process
management. International Journal of Information Management. Vol 33, Issue 1, pp.
48-60
Slack, N; Brandon-Jones; A Johnston, R (2013). Operations Management. Pearson,
Harlow
Smith, H. and FINGAR, P. (2003). Business Process Management (BPM): The Third
Wave. Tampa, FL: Meghan-Kiffer Press, ISBN.
Snabe, J. H; Rosenberg, A; Moller, C; Scavillo, M (2008). Business Process Management
- The SAP Roadmap. Boston: Galileo Press Inc.
Sommerville, J. (2008). Effective Use of the Delphi Process in Research: Its
Characteristics, Strengths and Limitations
Spohn, O.M., 2004. Sustainable Development Indicators within the German Water
Industry –A Case Study Carried out at Chalmers University of Technology, Sweden
Starik, M., Marcus, A., 2000. Introduction to the special research forum on the
management of organisations in the natural environment: a field emerging from
multiple paths, with many challenges ahead. Academy of Management Journal Vol.
43 No. 4, pp. 539–546.
Steurer and Konrad, 2009
R. Steurer, A. KonradBusiness-society relations in Central-Eastern and Western Europe:
how those who lead in sustainability reporting bridge the gap in corporate (social)
responsibility
Scand. J. Manag., 25 (1) (2009), pp. 23-36
Stoughton, A., Ludema, J (2012) "The driving forces of sustainability", Journal of
Organizational Change Management, Vol. 25 Issue: 4, pp.501-517

230
Strasser S, L London and E Kortenbout (2005) Developing a competence framework and
evaluation tool for primary care nursing in South Africa. Education for Health 18(2),
pp. 133–144.
Tan, K., Daud Ahmed, M. and Sundaram, D. (2008). Sustainable Warehouse
Management Modelling. 21st Annual Conference of the National Advisory
Committee on Computing Qualifications (NACCQ 2008), Auckland, New Zealand.
Samuel Mann and Mike Lopez (Eds). Pp. 109-115
Tan, K., Daud Ahmed, M. and Sundaram, D. (2010). Sustainable enterprise modelling
and simulation in a warehousing context. Business Process Mgmt Journal, Vol. 16
No. 5, pp.871-886.
Taylor, F. W. (1911). The principles of scientific management. New York, Harper &
Brothers.
Thies, H, Dada, A, and Stanoevska-Slabeva, K. (2012). The Potential of a Network-
Centric Solution for Sustainability in Business Processes. In: vom Brocke, J., et al.
(Eds.), Green Business Process Management. Springer- Verlag, Berlin, Heidelberg,
Germany, pp. 15-37.
Trkman, P (2010). “The critical success factors of business process management”.
International Journal of Information Management Vol 30, pp. 125-134
Uddin, N. and Hossain, F. (2015) Evolution of Modern Management through Taylorism:
An Adjustment of Scientific Management Comprising Behavioral Science. Procedia
Computer Science, 62, pp. 578–584.
Uddin, M. and Rahman, A. (2012). Energy efficiency and low carbon enabler green IT
framework for data centres considering green metrics. Renewable and Sustainable
Energy Reviews, Vol. 16 No. 6, pp.4078-4094.
UNEP (1972), The United Nations Conference on Human Environment, UNEP,
Stockholm, pp. 5-16.

231
United Nations (1987). Report of the World Commission on Environment and
Development: Our Common Future.
United Nations (1992). United Nations Conference on Environment & Development
United Nations (2012). Rio+20 – United Nations Conference on Sustainable
Development".
United Nations (2015) – European Agreement – Concerning the International Carriage of
Dangerous Goods by Road. Available at
http://www.unece.org/fileadmin/DAM/trans/danger/publi/adr/adr2015/ADR2015e_
WEB.pdf
Vachon, S., Mao, Z. (2008). Supply chain strength to sustainable development: a country-
level analysis. Journal of Cleaner Production, Vol. 16 No.15, pp. 1552-1560
van der Aalst, W. M. P., & ter Hofstede, A. H. M. (2005). YAWL: Yet another workflow
language. Information Systems, Vol. 30 No. 4, pp. 245–275.
van der Hoorn, B., 2016. Discussing project status with the project-space model: An
action research study. International Journal of Project Management 34, 1638–1657.
Velenturf, B., Deutz, P., Cecchin, A. (2017). Circular Economy Driving International
Sustainable Development Research Resource. Recover. From Waste
Verrier, B. et al. 2016. Lean and Green strategy: the Lean and Green House and maturity
deployment model. Journal of Cleaner Production 116, pp. 150–156.
Vivanco, H.M Bernardo, A. Cruz-Cázares, M. (2018). Sustainable innovation through
management systems integration. Journal of Cleaner Production 196, 1176–1187.
Vora, K. M. (2013). Business excellence through sustainable change management. The
TQM Journal, Vol. 25 No. 6, pp.625-640.
Wadgave, U., & Khairnar, M. R. (2016). Parametric tests for Likert scale: For and against.
Asian Journal of Psychiatry, 24, 67–68

232
Waddell, D. , Jones, G. R. and George, J. (2013), CONTEMPORARY MANAGEMENT,
3rd Edn, McGraw-Hill Education, NSW, Australia, pp. 5-27, pp. 37-55
Walliman, N. S. R. (2010). Research Methods: The Basics. 2nd ed. London: Routledge.
pp. 106-114.
Wilson, D. D., & Collier, D. A. (2000). An Empirical Investigation of the Malcolm
Baldrige National Quality Award Causal Model. Decision Science, 31(2), pp. 361-
390
Yang, T. and Chen, C. (2009). An incentive pay system for project management based on
responsibility assignment matrix and fuzzy linguistic variables. Expert Systems with
Applications, Vol. 36 No. 10, pp. 12585-12591.
Yuan, Z., Bi, J., Moriguichi, Y. (2006). The circular economy: a new development
strategy in China. J. Ind. Ecol., 10, pp. 4-8,
Walker, H., Di Sisto, L., McBain, D., (2008). Drivers and barriers to environmental
supply chain management practices: lessons from the public and private sector.
Journal of Purchasing and Supply Management Vol. 14 No.1, 69–85.
Weizsacker, E., Lovins, A.B. and Lovins, L.H. (1997), Factor Four: Doubling Wealth,
Halving Resource Use, Earthscan, London
Wijethilake, C., 2017. Proactive sustainability strategy and corporate sustainability
performance: The mediating effect of sustainability control systems. Journal of
Environmental Management 196, 569–582.
Wilkinson, A. Hill, M., Gollan, P. (2001). The sustainability debate. International Journal
of Operations & Production Management, 21 (12), pp. 1492-1502.
Zhu, Q., Sarkis, J. and Lai, K. (2008), “Confirmation of a measurement model for green
supply chain management practices implementation”, International Journal
Production Economics, Vol. 111 No. 2, pp. 261-273

233
Zu, Xingxing. (2009). Infrastructure and Core Quality Management Practices: How Do
They Affect Quality? International Journal of Quality and Reliability Management,
26(2), pp. 129-149.
Zairi, M. (1997), “Business process management: a boundaryless approach to modern
competitiveness”, Business Process Management Journal, Vol. 3 No. 1, pp. 64-80.

234
Appendices
The appendices section contains information that is too detailed for the thesis. Appendix
A is, B, C, D ,E
Appendix A. Experts information for the Delphi study
Occupation Institution
Adjunct Associate Professor of Operations Management MIT
Adjunct Lecturer of Finance Northwestern University
Affiliate Professor HEC Paris
Assistant Professor University of Warwick
Assistant Professor, Department of Operations,
Innovation and Data Sciences
ESADE Business & Law
School
Assistant Professor, Department of Operations,
Innovation and Data Sciences
ESADE Business & Law
School
Associate Fellow University of Oxford
Associate Professor
University of
Massachusetts Lowell
Associate Professor in Operations Management University of Oxford
Associate Professor of Business Administration Harvard Business School
ASSOCIATE PROFESSOR OF OPERATIONS,
TECHNOLOGY AND INFORMATION
MANAGEMENT Cornell
Associate Professor of Technology and Operations
Management Insead Business School
Associate Professor, Department of Operations,
Innovation and Data Sciences
ESADE Business & Law
School
Business Operations & Supply Chain Expert | Consultant
| Visiting Professor Cranfield University
Business Projects Manager B2Blue.com
CEO
Galica Lean & Galica
EHSS

235
CEO
Global Supply and
Procurement
CEO Monsanto
Chair Professor Universität Liechtenstein
Coffee and Sustainability Operations Manager Nestlé Nespresso S.A.
Department of Management and Technology Universita Bocconi
Deputy Director Operations & Utilities University of Surrey
Director Triple Bottom Line Ltd
Director of Corporate Sustainability WWF
Director of Strategy and Operations University of Cambridge
Director of Process Improvement Willmott Dixon Interiors
Environment & Sustainability Director OST Energy
Environmental Officer Cytec
European Sustainability Manager HAVI Global Solutions
Executive Director, Haas School of Business
Fred R. Sullivan Professor
Wharton University of
Pennsylvania
Green developer Greendevelopments
Head of Energy and Environment: Imperial College London
Lecturer
Pontificia Universidade
Catolica
Lecturer Senac
Lecturer
Universidade Federal de
Minas Gerais
Lecturer in Operations Management Durham University
Lecturer in Sustainable Enterprise University of Surrey
Lecturer in Operations & Supply Chain Management Coventry University
Lecturer in Operations Management Aston University
Manager AB INBEV
Manager Nestle
Manager Strategy & Sustainability
Manager Sustainability Services PwC AG

236
Managing Consultant Urbanag CIC
Managing Partner Systemica
Operations Manager University of Cambridge
Operations Sustainability Manager Kingston University
Practitioner Unipart Expert Practices
Professional Researcher Haas School of Business
Professor Heriot Watt University
Professor Lancaster University
Professor
Universidad Autónoma de
Aguascalientes
Professor Universidade de Sao Paulo
Professor
Universidade Federal da
Bahia
Professor
Universidade Federal de
Minas Gerais
Professor
Universidade Federal de
Santa Catarina
Professor University of St Gallen
Professor University of Surrey
Professor of Logistics Huddersfield
Professor of Operations, Information, and Technology Stanford University
Professor of Performance Management/Controlling University of St Gallen
Professor of Supply Chain and Operations Management Coventry University
Professor of Technology and Operations Management Insead Business School
Professor, Department of Operations, Innovation and
Data Sciences
ESADE Business & Law
School
Reader in Supply Chain Management University of Nottingham
Research Associate MIT
Research Fellow University of Oxford
Research Professor
Universidade Municipal de
Sao Caetano do Sul
Researcher Cranfield University

237
Researcher
Instituto de Pesquisas
Energéticas e Nucleares -
IPEN
Researcher Universidade de Sao Paulo
Researcher Universidade de Sao Paulo
Researcher Universidade Paulista
Researcher Volvo
Safety & Sustainability Improvement Specialist Network Rail
Senior Associate University of Cambridge
Senior Distribution Development Manager Coca-Cola Enterprises
Senior Lecturer MIT
Senior Lecturer University of Bradford
Senior Lecturer University of Brighton
Senior Lecturer in Operations Management and Business
Excellence
Instituto Politécnico
Nacional
Senior Lecturer in Operations Management University of Northampton
Senior Project Manager University of Cambridge
Service Process Design Consultant
Paraboloidal Management
and Consultancy
Sr. Manager, Corporate Social Responsibility Strategy
and Sustainability Operations Raytheon
Sustainability Consultant BASF
Sustainability Consultant SAP
Sustainability VP Corbetti Geothermal plc
Sustainability Manager Waste Management
Sustainability Operations Manager RobecoSAM
Vice President Sustainability, Strategic Operations
Manager Healthy Buildings
VISITING PROFESSOR OF BUSINESS
ADMINISTRATION Tuck school of business

238
Appendix B. Delphi study first round – Questionnaire

239
Content removed for copyright reasons

240
content removed for copyright reasons

241

242

243

244

245
Appendix C. Delphi study second round - Questionnaire

246

247
Appendix D. Delphi study first round - Results

248

249

250

251

252

253

254

255
Appendix E. Delphi study second round - Results

256

257

258