Ghana - Project for the Creation of Sustainable Tsetse and ...
Upload
khangminh22Category
view
0download
0
1
Implementation of a Sustainable Project Management Methodology for Cal Poly SAE Baja
A Senior Project submitted
In Partial Fulfillment
of the Requirements for the Degree of
Bachelor of Science in General Engineering
the Faculty of California Polytechnic State University,
San Luis Obispo
by
Theo Graziadei
March 2013
Graded by:______________ Date of Submission__________________________
Checked by:_____________ Approved by:_____________________________

2
ABSTRACT
Implementation of a Sustainable Project Management Methodology for SAE Baja
Theo Graziadei
A lack of project organization manifested through unclear team goals, rush deliveries of
materials, lost tools and materials, half days of effort due to improper planning, wasted design
time, missed submission dates, lack of clear job positions at competition, and low competition
scores. A process was created to properly manage the team and it was implemented through the
use of various templates, examples, and calculation programs. Each deliverable received
feedback from this project’s stakeholders and changes were reflected in the final process. The
results were as follows:
Table 1: Summary of Results
Implement a sustainable project management methodology
Each step of the process tested on 2012-2013 Cal Poly SAE Baja team
Complete Milestones on or before their due dates
On time: • Competition Registration • Cost Report • Design Report (On Schedule) • Go/No Go date 2 weeks early
Reduce current year’s waste by 50% over last year
• No rushed shipments • No half days • Cost report decreased from $16,500 to $15,000
Create the opportunity to increase current year’s points by at least 25% over last year’s overall point score
• Competition Score Estimation: 800 points • Previous year’s score: 517.15 • 54.7% increase

3
ACKNOWLEDGMENTS
This project would not have been possible without the technical knowledge of Roya Javadpour
and John Fabijanic or without the support of the current Cal Poly SAE Baja team lead Scott Frey
and his team.

4
ABSTRACT ................................................................................................................................................ 2
ACKNOWLEDGMENTS .......................................................................................................................... 3
LIST OF TABLES ...................................................................................................................................... 7
LIST OF FIGURES .................................................................................................................................... 8
I. INTRODUCTION .................................................................................................................................. 9
Background ............................................................................................................................................................ 9
Problem ................................................................................................................................................................. 9
Purpose ............................................................................................................................................................... 10
Objectives ............................................................................................................................................................ 11
Scope ................................................................................................................................................................... 11
Deliverables ......................................................................................................................................................... 12
Solution Approach ............................................................................................................................................... 12
II. LITERATURE REVIEW ................................................................................................................... 13
Background .......................................................................................................................................................... 13
Overview ............................................................................................................................................................. 14
Conception and Selection .................................................................................................................................... 14
Systems Engineering ............................................................................................................................................... 16
Innovation ............................................................................................................................................................... 17
Planning ............................................................................................................................................................... 18
Execution ............................................................................................................................................................. 20
Team Culture ........................................................................................................................................................... 20
Leadership ............................................................................................................................................................... 20
Control Process ....................................................................................................................................................... 21
Quality ..................................................................................................................................................................... 22
Inventory Control .................................................................................................................................................... 23
Test/Closeout ...................................................................................................................................................... 24

5
III. DESIGN .............................................................................................................................................. 25
Specifications ....................................................................................................................................................... 25
Constraints .......................................................................................................................................................... 26
Design Methodology ............................................................................................................................................ 26
Necessary Process Documentation ...................................................................................................................... 27
IV. METHODS ......................................................................................................................................... 30
V. RESULTS AND DISCUSSION .......................................................................................................... 38
VI. CONCLUSIONS AND RECOMMENDATIONS ............................................................................ 40
REFERENCES .......................................................................................................................................... 43
APPENDIX A. START HERE: MANAGEMENT PROCESS OUTLINE ...................................... 45
APPENDIX B. STEP 1: PROJECT DEFINITIONS ......................................................................... 50
APPENDIX C. STEP 2: COMMUNICATIONS CHARTER ............................................................ 52
APPENDIX D. STEP 3: STATEMENT OF AUTHORITY ............................................................. 54
APPENDIX E. STEP 4: SUB-SYSTEM PRIORITY MATRIX ...................................................... 55
APPENDIX F. STEP 5: PDR TEMPLATE SLIDES OUTLINE ..................................................... 57
APPENDIX G. STEP 6: 2012 BAJA SCHEDULE .......................................................................... 58
APPENDIX H. STEP 6.1: DELIVERABLE DESIGN DECISIONS 2012 .................................... 74
APPENDIX I. STEP 6.2: MICROSOFT PROJECT 2010 WALKTHROUGH ........................... 78
APPENDIX J. STEP 7: CDR TEMPLATE SLIDES OUTLINE ...................................................... 83
APPENDIX K. BENEFIT AND RESOURCE QUANTIFICATION ALGORITHM ..................... 84

6
APPENDIX L. BENEFIT AND RESOURCE QUANTIFICATION ALGORITHM USE CASE .. 89
APPENDIX M. STEP 7.1: HOW TO USE THE BENEFIT AND RESOURCE PROGRAM ...... 96
APPENDIX N. STEP 7.2: BENEFIT-RESOURCE SLIDES OUTLINE ..................................... 101
APPENDIX O. STEP 7.3: RISK ANALYSIS TEMPLATE .......................................................... 103
APPENDIX P. STEP 8: SIGN-OUT SHEET ................................................................................. 105
APPENDIX Q. STEP 9: TEST PREPARATION AND INCIDENT LOG .................................. 107
APPENDIX R. STEP 10: TEAM COMPETITION ASSIGNMENTS ......................................... 109
APPENDIX S. STEP 11: POST SEASON DEBRIEF QUESTIONS ........................................... 113

7
List of Tables
TABLE 1: 2011 LOSS ESTIMATES ................................................................................................................... 10
TABLE 2: ESTIMATED PROJECT COST ............................................................................................................ 10
TABLE 3: ABC INVENTORY EXAMPLE (RUSSELL AND TAYLOR, 2009) ............................................................ 24
TABLE 4: COMPREHENSIVE DELIVERABLES LIST ........................................................................................... 27
TABLE 5: DELIVERABLE FEEDBACK ................................................................................................................ 38

8
List of Figures
FIGURE 1: SYSTEMS ENGINEERING ‘VEE’ MODEL ......................................................................................... 17

9
I. Introduction
Background
The Society of Automotive Engineers (SAE) is a global body of scientists, engineers, and
practitioners that advances self-propelled vehicle and system knowledge in a neutral forum for
the benefit of society (About SAE Baja, 2012). Every year SAE hosts international university
competitions to provide students with the opportunity to not only design, build, test, promote,
and race a vehicle within the limits of the rules, but also to generate financial support for their
project and manage their educational priorities (About SAE Baja, 2012).
Baja SAE consists of three regional competitions that simulate real-world engineering design
projects and their related challenges. Engineering students are tasked to design and build an off-
road vehicle that will survive the severe punishment of rough terrain and sometimes even water
(About SAE Baja, 2012).
The competition consists of three days. The first day is a static day and is when technical
inspection, the sales presentation, and design presentation take place. The design presentation is
judged on serviceability, manufacturability, ergonomics, and innovation. The second day
consists of four dynamic events: maneuverability, rock crawl, acceleration, and hill climb. The
final day is a four hour wheel-to-wheel race.
Problem
In the previous five years of competition monitored, it was noticed that a lack of project
organization manifested in a multitude of ways. Problems experienced included:
• Unclear team goals
• Rush deliveries of materials

10
• Lost tools and materials
• Half days of effort due to improper planning
• Wasted design time
• Missed submission dates
• Lack of clear job positions at competition
• Low competition scores
Listed below is an estimate of the lost time and money which could have been avoided as well as
the costs the team may incur by funding this project. It was decided that in the event that this
project avoided one rush shipment, the project would pay for itself.
Table 2: 2011 Loss estimates
Incident Description Incident Frequency Incident Impact Total
Half Days 12 3 hours 36 hours
Rush Shipments 1 $142.87 $142.87
Table 3: Estimated Project cost
Supply Quantity Cost + (8.75% Tax) Item Total
Folders (12 Pack) 1 $5.43 $5.43
Template Disks 6 $10.86 $65.16
Printing Supplies N/A Subsidized $0
Total $70.59
Purpose
The purpose of this senior project is to prepare Cal Poly SAE Baja for competition in an
organized, efficient, and cost effective manner. The team and car are to be competition ready by
the dates required by the competition and the Cal Poly SAE constitution.

11
Objectives
• Implement a sustainable project management methodology
• Complete Milestones on or before their due dates
o Team registered no later than December 17th, 2012
o Cost Report submitted by March 1st, 2013
o Car running by March 3rd, 2013
o Design Report submitted by April 8th, 2013
o Team Competition Assignments drafted before April 16th, 2013
o Cal Poly Baja car competition ready no later than May 2nd, 2013
• Reduce current year’s waste by 50% over last year
• Create the opportunity to increase current year’s points by at least 25% over last year’s
overall point score
Scope
It will be the responsibility of this project to generate and implement all methodologies through
the use of its deliverables; however it is up to the SAE Baja team to use these deliverables
throughout the 2012-2013 competition season and monitor the progress of the team. The only
exception will be the Schedule of Activities and Resources. The current team lead, team
manager, and sub-system leads will be working on the Schedule of Activities and Resources
jointly with this project’s manager to ensure its accuracy so that it can be used as an example for
following years. Once a detailed schedule is made and agreed upon, it will be the job of the
current team lead and manager to alter the schedule as they are faced with obstacles and monitor
their progress.
Scope must also be limited to the project management process. Formalizing that process may
require the integration on the basic steps of the mechanical design process. However, the

12
specific methods of mechanical design will be up to the team to learn and implement within the
structure provided by this report.
Certain management processes overviewed, particularly in the control phase, may require more
resources than this project has available. Those processes will be mentioned for the use of the
team if they wish to implement them in the future, but will not be implemented by this project.
Due to the variability in testing, the testing process will be left up to the discretion of the team
and sub-system leads.
Deliverables
It was asked by the current team lead that this project design a management process as well as
create a schedule which can be used as an example of level of detail required for future years.
The team lead also asked for an outline of a typical design review for Baja’s annual preliminary
and critical design reviews. It was asked by the technical advisor to create a method by which
the benefit and resource usage of a new sub-system design can be quantified. In addition, all
requirements for the senior project class must be met. Expected deliverables include:
• Project management process outline
o Necessary process documentation
• Preliminary Design Review
• Critical Design Review
• Benefit and Resource Quantification
• Detailed schedule
Solution Approach
The process implemented will first be researched and alternative approaches to solve the
observed problems will be considered. Documentation of the research performed will be located
in the Literature Review section of this report. A process corresponding with the current

13
timeline of the team will be created and documented using various templates, examples, and
calculation based programming. Deliverables will be considered living documents and given to
the stakeholders for use and improvements will be made based on their feedback. Finalized
deliverables will be created based on the feedback, as well as a management process outlining
the template’s use, will be given to the current team lead for use in next year’s competition
season. Furthermore, the mechanical design process will be integrated to ensure that team and
sub-system goals are met by the designs. All sub-assemblies will be considered as projects as
well as the Baja car and team as a whole.
As such, the templates will be designed so that students are capable of correctly utilizing them
the first time. Furthermore, a process outline will be provided to suggest a timeline for each part
of the process. Thus, the process should be streamlined yearly for both the team lead and system
leads. Since the sustainability of this project is of high importance and its application is to a
team which is constantly changing to meet demands by the school and competition, continuous
improvement will be built into the system. The students will be allowed input at the end of each
season to suggest improvements upon the current management system.
II. Literature Review
Background
The first phase of the SAE Baja project is the design stage (About SAE Baja 2012), however it is
important to note that SAE Baja is a Mechanical Engineering Competition. At the start of this
project, the Mechanical Design Process was not a consideration until it was asked by the current
SAE Baja team lead to develop template slides to aid the mechanical engineering students in a
series of two design presentations followed by a design judging at the annual competition.

14
The literature review will contain information on current Project Management and Mechanical
Design Processes. The goals of this review are to find and merge similarities in the processes,
integrate dissimilarities, and tailor these processes for the use of Cal Poly SAE Baja.
Overview
Methodologies included in this report are: Design�Build�Test (About Baja SAE, 2012), the
Mechanical Design Process (Budynas, Nisbett, Shigley, 2011), and
Conception�Selection�Planning�Evaluation and Termination (Meredith and Mantel,1989).
It is also necessary to find ways to formalize the management process in a manner which is
sustainable and specifically tailored to the needs of the SAE Baja team at Cal Poly.
The team volunteers its time for the sole purpose of learning automotive design and
manufacturing principles. In addition to the time requirements of SAE Baja, each member is
also enrolled in a full load of classes every quarter. As such, their time is very limited.
Therefore, it was necessary to research ways to implement the project management process in a
time efficient manner.
Conception and Selection
The mechanical design process consists of: Identification of Need, Problem Definition,
Synthesis, Analysis and Optimization, Evaluation, and Presentation (Budynas et al, 2011). The
Identification of Need and Problem Definition steps coincide with the project management
process of conception and selection.
The identification of need suggests that there is a customer in mind that has a need which must
be fulfilled by the project. Therefore, the purpose of the project is to meet the need of the

15
customer. It is important for the project manager to clearly understand the problem that the
customer is facing and create goals and/or objectives to meet them (Meredith and Mantel, 1989).
To minimize the risk that the project gets off-track or falls short of meeting commitments to the
customer, objectives and/or goals are formed (Meredith and Mantel, 1989). Goals are also
sometimes known as objectives, but it is important to note that objectives are sometimes specific,
quantified targets that represent steps toward accomplishing the goals (Worth, 2009).
The Identification of Need, Problem Statement, and Goal Creation steps were developed during
the definition phase, but the Synthesis, Analysis/Optimization, Evaluation, and Presentation steps
had yet to be accounted for. These steps will be included in the management process and will
become part of the planning stage, even though it is not a typical management process. It is
outside of the scope of this project to review literature for the Analysis/Optimization, Evaluation,
and Presentation steps of the Mechanical design process. Since these steps allow the students to
plan the work, it is suggested that these steps take place during the planning phase.
The ME approach to the design process adds complexity to the management process, but it still
does not account for many steps in the definition phase that will aid in a successful project. This
is because the design process doesn’t include many aspects of the Project Proposal. The project
proposal states client requirements (Summers, 2005). Clients are sometimes known as the
stakeholders. The stakeholders are anyone who has a vested interest in the project (Lewis,
1991). The Proposal needs to state the stakeholders in order to meet their requirements. The
project proposal also includes the statement of work. The statement of work includes the goals,
project constraints, such as budget and schedule, and success metrics (Summers, 2005). Finally,
the specifics of what is to be given to the customer at the end of the project need to be defined

16
(deliverables) and the scope of the project developed for each sub-system (Summers, 2005). The
purpose of scoping is to create a process through which clarity, agreement, and commitment are
obtained (Briner et al, 1996). The scoping process will help the key players in the organization
think about what the implications of the project might be and how it may affect the project
definition (Briner et al, 1996).
Systems Engineering
The methodology which seems to fit all of the above steps is the systems engineering process.
Specifically, the systems engineering “Vee” model encompasses all three processes.
Requirements are the necessary attributes defined for a system before and during design. The
customer’s need is the ultimate system requirement from which all other requirements flow
(Grady, 1993). Requirements are the formal means of communicating needs and ideas between
people. (Bahill, 1997). Both the preliminary and detailed design match with the current
mechanical engineering process. Little is said about the development stage in Bahill’s paper, but
if the development phase is treated like the control stage for project management and the build
stage outlined by SAE, then it fits well that the next step is testing. Finally, the car is operated
during competition. For SAE Baja, there is a feedback loop after the operation/maintenance
phase to the requirements phase the next year. The car and team’s performance are reviewed
during in informal audit called the debrief meeting and the review information is used to create
projects for the next season.

17
Figure 1: Systems Engineering ‘Vee’ Model
Innovation
Not only is innovation an important part of the conception/selection process, but it is also one of
the design judging criteria. Therefore, an innovation process should be considered, annually, by
the team. The innovation process is as follows:
1. Discovering Opportunities: Identify the target customers, Identify the problem that the
target customers face, and discover signals that the customers are dissatisfied with the
current state of things.
2. Blueprinting the Idea: Use multiple sources of inspiration to develop an idea (look at
current similar designs), determine where your idea can be “good enough”, and develop a
comprehensive blueprint for your idea.
3. Assess and Test Idea: Assess the potential of your idea, Identify the biggest assumptions
behind realizing that potential, design experiments to address the validity of those
assumptions, and draw conclusions from those experiments.

18
4. Move Forward: Manage resources to maximize progress and delegate tasks.
(Anthony, 2012)
The Cal Poly SAE Baja team should identify its target market and assess any needs that the
market may have. At least one need should be chosen and the problem solved by a small team
created by the SAE Baja Team Lead. Since this need will be innovative, the team should follow
the steps outlined above, but also follow the project management process outlined in this report.
Planning
Once the project definition has been completed, the planning stage allows the team to plan the
work that takes place during the Build stage. Since the Build stage is a series of manufacturing
processes, it must be preceded by the planning stage. The planning stage consists of creating a
work breakdown structure (WBS), scheduling, resource considerations, a team control system,
and risk analysis (Lewis, 1991).
Typically, the planning stage starts with a work breakdown structure (WBS). The WBS breaks
the work down into smaller increments or tasks, each of which can be estimated with relatively
good accuracy in terms of time and budget (Lewis, 1991). The WBS simplifies the work, but it
does not create a sequence of the activities (Lewis, 1991). There are multiple methods of
sequencing the activities. A simple bar chart can be constructed, but it is impossible to see the
interrelationships between the various tasks (Lewis, 1991). Henry Gantt developed a system of
using a bar chart to schedule and report progress using a bar chart, which were subsequently
called “Gantt Charts” (Lewis, 1991).
Of the literature reviewed, two major processes were considered to create a Gantt Chart, the
Performance Evaluation Review Technique (PERT) and the Critical Path Method (CPM). The
19
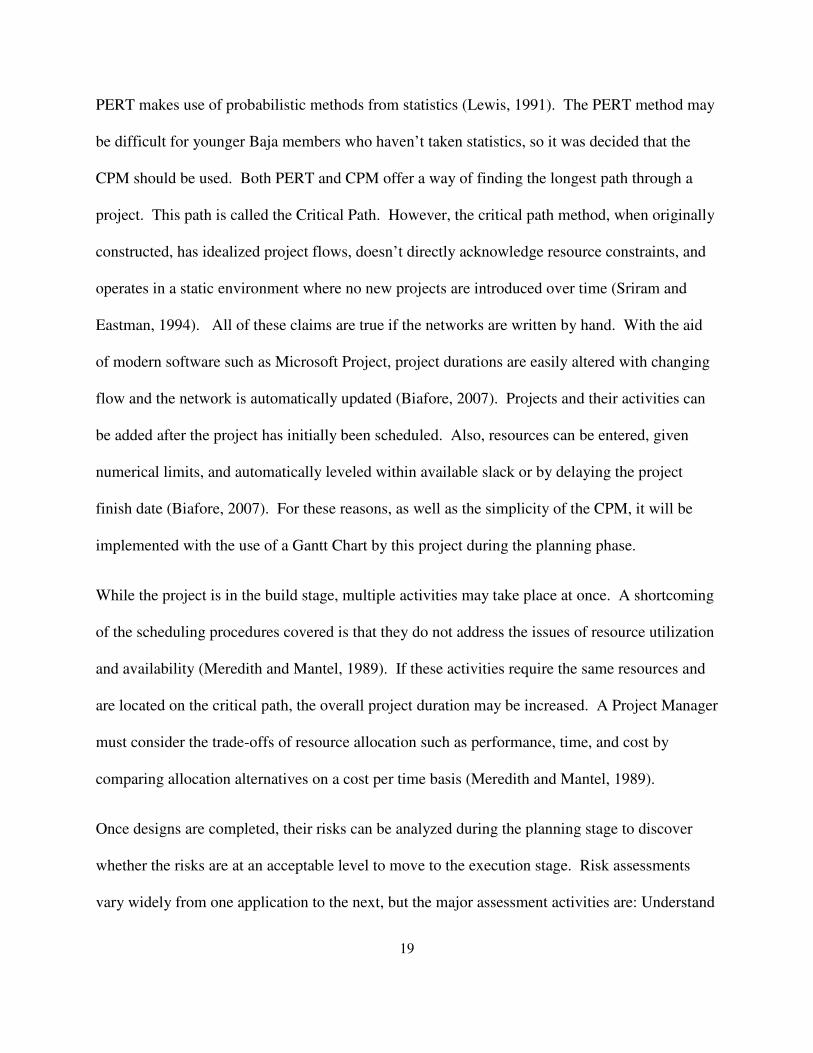
PERT makes use of probabilistic methods from statistics (Lewis, 1991). The PERT method may
be difficult for younger Baja members who haven’t taken statistics, so it was decided that the
CPM should be used. Both PERT and CPM offer a way of finding the longest path through a
project. This path is called the Critical Path. However, the critical path method, when originally
constructed, has idealized project flows, doesn’t directly acknowledge resource constraints, and
operates in a static environment where no new projects are introduced over time (Sriram and
Eastman, 1994). All of these claims are true if the networks are written by hand. With the aid
of modern software such as Microsoft Project, project durations are easily altered with changing
flow and the network is automatically updated (Biafore, 2007). Projects and their activities can
be added after the project has initially been scheduled. Also, resources can be entered, given
numerical limits, and automatically leveled within available slack or by delaying the project
finish date (Biafore, 2007). For these reasons, as well as the simplicity of the CPM, it will be
implemented with the use of a Gantt Chart by this project during the planning phase.
While the project is in the build stage, multiple activities may take place at once. A shortcoming
of the scheduling procedures covered is that they do not address the issues of resource utilization
and availability (Meredith and Mantel, 1989). If these activities require the same resources and
are located on the critical path, the overall project duration may be increased. A Project Manager
must consider the trade-offs of resource allocation such as performance, time, and cost by
comparing allocation alternatives on a cost per time basis (Meredith and Mantel, 1989).
Once designs are completed, their risks can be analyzed during the planning stage to discover
whether the risks are at an acceptable level to move to the execution stage. Risk assessments
vary widely from one application to the next, but the major assessment activities are: Understand

20
the Risk, Identify the Source of Risk, Consequence Assessment, Likelihood Assessment, Risk
Characterization, Communicate Uncertainty, and Documentation of the Process (Yoe, 2012). It
is also important to decide upon contingency plans and what the contingency trigger will be.
Execution
The execution stage has many names. For Project Managers, it is the Process Control stage. It is
also known as the Build stage and/or Work stage by SAE Baja. Since there are so many ways
that a Project Manager can implement process control during the execution stage, it will be
broken into several categories: Team Culture, Leadership, Control Process, Quality, and
Inventory Control.
Team Culture
The proper attitude is what makes a successful project. A winning attitude is necessary to form a
winning habit. Unfortunately, contrary to many claims, winning pays (Golembiewski, 2008). It
brings positive publicity to the University and the potential for new resources (Golembiewski,
2008). However, winning a competition is not everything. One must keep the perspective that
the point of SAE Baja is to enhance the students’ education (Golembiewski, 2008). In order to
win, the student engineer must consider the trade-offs that will earn the greatest amount of points
in competition. However, learning must be considered a priority as well. It is outside of the
scope of this project to ensure the progress of the students’ learning, but simply by following the
process, all students should learn something about the project management process.
Leadership
Based on the review of available literature, the following section gives suggestions that the team
should follow for the SAE Baja leadership roles.

21
As a generalization, the team leader creates and communicates their vision to the team, but
effective executive leadership theory considers the leader, the leader’s behavior, and the situation
(Taylor and Rosenbach, 1989). As such, the leader should be able to recognize and articulate the
need to significantly alter the direction and operation of the project. This needs to be done in
multiple ways such as align the managers to the benefit and application of this new direction
(Briner et al, 1996). Resistance situations require considerable thought and subtlety to overcome
seemingly natural resistance (Pinto and Trailer, 1999). A good leader can understand long term
objectives, fill in short term details, and communicate those visions in ways that are compelling
(Taylor and Rosenbach, 1989).
Managers positions are much more action oriented. Their responsibilities fall primarily into
three separate areas. They have a responsibility to the parent organization, the project, and the
members of the team (Meredith and Mantel, 1989). They must keep senior management fully
informed, reduce the likelihood of risks, and make sure that the project is preserved in spite of
the conflicting demands made by the stakeholders (Meredith and Mantel, 1989).
Historically, the leadership roles have not been specifically defined. It is the goal of this project
not only to provide recommendations to leadership roles, but also to keep in mind that the roles
are kept dynamic to adapt to new leaders’ availabilities and strengths. The suggestions from the
review of literature and from the IME Project Management course will be given to the SAE Baja
Team and should be read at the start and finish of every competition season. During the
Closeout Phase, the audit should review how well the Team Lead and manager followed these
roles and make specific suggestions for the next season’s Team Lead and Team Manager.
Control Process

22
It is the job of the Project Manager as well as the Sub-System Leads to monitor the plan and take
corrective action if the project falls behind schedule or goes over budget. Earned value analysis
(EVA) is a method of quantifying the project’s process at any given time (Cullen 2012). The
formulas are simple and can easily be implemented by SAE Baja and can be automatically
generated by regularly updating Microsoft Project (Biafore, 2007). A detailed schedule will
need to be kept in order to track the planned value of the project. Expenses need to be logged to
determine the actual cost of the project as it progresses. Once a status update with the Earned
Value (EV) is reported, the Schedule Variance (SV) and Cost Variance (CV) can be calculated.
The Schedule Variance can be used to monitor the progress of the project and the Cost Variance
can be used to track if the project is over or under budget. Finally, each sub-system should be
evaluated by using performance indexes for cost and schedule which provide insight to the sub-
system’s cost and time efficiency, respectively. All of the above values will be calculated for the
team by keeping an updated schedule of activities and resources using Microsoft Project.
Quality
There are fourteen steps of quality improvement (Crosby, 1984). However, only relevant steps
are included in this review. Some steps have been combined to simplify the process. The steps
and their application are as follows:
1. Management Commitment: Ensure that management is truly committed.
2. Measurement: The hassle of measurements is not having clear measurements. Quality must
be measurable or it is nearly impossible to communicate in definite terms.
3. Cost of Quality: Tradeoffs must be discussed of the Price of Conformance and the Price of
Nonconformance
4. Quality Awareness: All students must be aware of what defines quality.

23
5. Corrective Action: What actions are necessary for a nonconformance part?
6. Goal Setting: Set goals to work up to the ultimate zero defects goal.
7. Error-Cause Removal: Ask what problems are being encountered and how these problems
can be addressed.
8. Team recognition/Zero Defect Celebration: A huge team milestone
9. Sustainability: Make sure that future teams can recreate quality control processes.
(Crosby, 1984)
Quality is often sacrificed in the name of time efficiency for SAE Baja since there is often less
than ten months to design, build, and test a race vehicle in an international competition. Part
quality has been a huge debate amongst the team members and a system must be in place to
settle disputes. A dispute resolution process will be implemented by this project, but the quality
improvement process should be implemented by the team. It is outside of the scope of this
project to implement a part quality improvement process; however, quality improvement will be
considered annually to improve this management process.
Inventory Control
One of the types of waste being reduced by this project is inventory loss. In order for the team to
manage their inventory, it must first be classified. One of management’s oldest and soundest
techniques is the concept of the vital few and the trivial many developed by Pareto in the 1530’s
(Plossl and Welch, 1979). This management system has been adapted in a variety of ways
including the ABC system (Plossl and Welch, 1979). The ABC system classifies three groups of
inventory and their typical characteristics:

24
Table 4: ABC Inventory Example (Russell and Taylor, 2009)
Inventory Class Importance % Value By Unit Cost *Demand
% by Inventory Units
A High 70-80 5-15 B Medium 30 15 C Low 5-10 50-60
These inventory classes are used to determine the frequency that these inventory units need to be
checked for losses, with Class A being the most frequently checked class. Thus, 80% of the
dollar loss can be found by closely monitoring 20% of the inventory (Summers, 2005). In the
past, important components have been lost due to a lack of accountability. It is highly
recommended that the team manager create a small team to classify everything in the Baja cage
and create an inventory checklist as well as a frequency to check each inventory class.
Test/Closeout
A major vehicle for the evaluation of the project’s successes and failures is the project audit
(Meredith and Mantel, 1989). The result of an audit is a set of recommendations that might help
both ongoing and future projects to:
1. Identify problems earlier
2. Clarify performance, cost, and time relationships
3. Improve project performance
4. Locate opportunity for future technological advances
5. Evaluate the quality of project management
6. Reduce costs
7. Speed the achievement of results
8. Identify mistakes, remedy them, and avoid them in the future

25
9. Provide information to the client
10. Reconfirm the organization’s interest in an commitment to the project
(Meredith and Mantel 1989)
At this stage, testing for SAE Baja is performed to verify their design and manufacturing
processes. However, the car is not yet ready for competition. Once testing has been conducted,
the car goes back to the design phase for any issues discovered during testing. The final design
validation is completed at competition. The competition performance information is used to
perform an informal team audit. The audit is then used to create the project’s problem
statements for the next year’s car so that the project process can be repeated. It is recommended
that the audit process answer the questions outlined above to aid the next year’s team.
III. Design
Specifications
During the conception of this project, the current Cal Poly Faculty advisor, this project’s advisor,
and the current team lead specified that the following qualitative criteria be met by this project’s
design.
1. Ease of Use: The management process should not add significant time to the current
process or daily operations
2. Applicability: Each step of the process must be tailored toward SAE Baja to minimize the
learning time yearly

26
3. Usefulness: Future teams should see the benefit from the continuous use of this project
annually. Each step should be action-oriented by giving the user something to do, not
just to read.
4. Flexibility: This project’s manager added flexibility as qualitative criteria such that each
sub-system lead could use this management process for their own sub-system.
Constraints
Due to limited budget, the current team lead had asked that the cost of this project not exceed
$100. Furthermore, if any process experimentation needed to be considered or feedback needed,
the process timeline must match the team’s timeline. For example, the project definition process
created by this project must be completed for testing before the team is ready to define their
projects in order for feedback to be given.
Design Methodology
Each problem that was observed was considered while conducting the review of literature.
Before the theoretical process was introduced, each problem was categorized into larger
categories and a tentative countermeasure was suggested. Below is a summary of the problems
and their countermeasures:
• Points and Objectives: A project definition template will create specific, measurable, and
attainable goals for the car and each sub-system. A performance matrix will be used to
evaluate these goals based on their relative benefit during each competition event. By
placing focus on designs with the greatest return, there will be a potential for an increase
points earned at competition over previous years.

27
• Waste: A schedule of activities and resources will ensure that all team members have the
resources they need for their scheduled tasks. The schedule should decrease waste in the
form of half days, rushed shipments. Lost tools will be minimized by the competition
assignments. Finally, non-value added design effort should be drastically decreased by
constantly considering the team and sub-system goals listed in the definition template.
• Missed Milestones: Sign-out sheets will be created for each member to log their
progression. The continual use of Sign-Out Sheets to update the Schedule of Activities
and Resources will eliminate missed deadlines as well as most project delays.
Necessary Process Documentation
It is important to note that the countermeasures listed above create a new list of deliverables
which fit under “necessary process documentation” from the deliverables section in this
report. There was also an increase in scope to create testing goals and log sub-system failures
during testing. Below is a new, more comprehensive list of the deliverables as well as a
description and outline of each.
Table 5: Comprehensive Deliverables List
Deliverable Purpose Description
Project Definition Template
Provides clarity during the design process by identifying: • Problem Statement • Stakeholders • Goals • Success metrics • Scope • Deliverables
Each item includes: • Definition (for beginning members) • Specific examples applying to Baja

28
Drafted Communication Plan
A roster of all new and continuing Cal Poly SAE Baja continuing members ensures that all members are reachable
This plan includes space for email and telephone as well as space for preferred communication methods for each member.
Statement of Authority
Clearly distinguishes the decision making process to avoid breakdowns in chain of command
Signature verifying agreement to this process before the start of the competition year
Weighted Project Priority Matrix
• Matrix to distinguish potential relative benefit of each sub-system in relation to another
• Allows the team lead to allocate more resources for high priority projects
Each sub-system is weighted based on their potential relative benefit based on criteria decided upon by the team lead. A summation for each system can be generated and each sub-system is ranked by importance.
Preliminary Design Review Slides
• Streamlines the mechanical design process and integrate the management process
• Presented in a public forum for design feedback
• Project definition template review • Listed design alternatives • Design matrix • Design decision
Benefit/ Resource Quantification
• Quantifies benefit and resource of alternative designs or of sub-systems by calculating indices
• Used to aid team lead in project cuts or system lead to make design alternative decisions
Indices calculated based on: • Part manufacturing times • Potential benefit -from project priority or design
matrix • Skill level required • System or design alternative cost
Critical Design Review Slide Template
• Streamlines the mechanical design process and integrates the management process
• Presented in a public forum for design feedback
• Brief review of the PDR • Review of how the system and team goals were
met • Statement of system parameters • Consideration of sub-system integration • Risk analysis
Schedule of Activities and Resources
• Creates a list of daily project tasks
• Estimates project duration • Calculates slack and critical
path • Levels and assigns resources
• Includes work breakdown structure • Task Predecessors • Task Duration • Task Priority • Resource Input

29
Microsoft Project Walkthrough
Outlines a step-by-step process to create a usable schedule for SAE Baja
Describes how to: • Set project start date and calendar • Create a work breakdown structure • Estimate task durations • Set task predecessors • Set priorities • Assign and level resources • Monitor schedule using sign-out sheets
Sign-Out Sheet/Task Log
• Filled out by each team member after work day
• Used by current team manager to update schedule
• Used by proceeding year’s manager for task duration estimation
Each sheet logs: • Name of worker • Date • Task duration • Percent complete (for schedule updates) • Comments
Team Competition Assignments
• Six unique jobs were created so that there was no job confusion during testing or at competition.
• A description of the jobs, volunteer sign-ups slots, and lead organizer help was included.
Jobs included: • Drivers • Pit crew • Maintenance • Spotters • Organizers • Lead organizer
Testing Goal Sheet/Incident Log
• Creates testing goals for more productive test days
• Logs incidents to document the problem and its countermeasure to avoid repeat mistakes
• Test Purpose/Goals • Test Procedure • Test Results • Conclusions/Recommendations • Incident Description • Incident Countermeasure • Future Recommendations
Post Season Audit Questionnaire
• Creates a log of the informal audit performed annually by the team called “the debrief meeting”
• Increases meeting productivity
• Members fill out a two part questionnaire before the meeting:
• Managerial improvement-allows for continuous improvement of the management process
• Problems and/or recommendations to future sub-system
Management Process Outline
Outlines the overall management process
• Recommends suggested timelines relative to an academic year
• Provides an ordered use of the deliverables from this project

30
IV. Methods
The process was put into effect during the 2012-2013 competition season and feedback was
collected during the process. Each step was formalized by creating a template, example, or
calculation based program such that it could be quickly and easily used by a first year member
who was following the process. Each deliverable was treated as a prototype; feedback was
recorded and was changed to reflect the feedback in the final process.
Each sub-system lead was asked to fill out the project definition template (Appendix B). The
team lead was also asked to fill out a project definition to create vehicle goals, which would
become design criteria, and team goals which were used to benefit the team yearly. Success
metrics included being on time and on schedule. It was instructed that goals be specific,
measurable and attainable. Typical stakeholders included all club members, SAE faculty
advisors, and club sponsors. The project definition was included with the statement of authority
(Appendix D) and the communications charter (Appendix C) to complete a project proposal for
review by the team lead. All sub-systems were considered projects and new design proposals
were not guaranteed funding until after the Critical Design Review (CDR).
Sub-system benefit potential was evaluated using the sub-system priority matrix (Appendix E)
on a scale of 0�2 where 0 was no potential, 1 was some potential, and 2 was high potential. The
team lead was asked to fill out this matrix using initial estimates of design criteria from the
vehicle goals on the definition template. Once each sub-system was given a weighted score, it
was prioritized so that resources could be delegated during the design phase. The matrix was
used again in the same manner after the design phase was completed so that resources could be
delegated based on the project priority and manufacturing requirements.

31
The Preliminary Design Review (PDR) is a review of the current or changing design for each
sub-system and is presented to the SAE advisors and the SAE student members. It was asked by
the current team lead to create template slides which outlined the material typically in a PDR
(Appendix F). During the PDR, the sub-system creates alternatives for each major deliverable.
These designs are then weighted in a design matrix so that an alternative decision can be made.
It was asked of the sub-system leads to put each major deliverable design decision into one of
three categories: fabricate, order, or recycle. Fabricate means that the deliverable must have raw
materials ordered so that final parts can be made. An order code means that the final part will be
purchased. A recycle code means that the part will be recycled from a previous year’s car.
Recycling often takes place on high expense items such as air shocks because the team cannot
and/or does not need to buy new parts. These design codes are used by the team manager to
create the detailed schedule of activities and resources. The PDR slides were created as a
template for all members to follow for each major deliverable. A design decision code example
was also made with all typical deliverable for each sub-system.
The benefit-resource quantification was, perhaps, the most difficult to implement. It was decided
by this project’s manager that the quantification serve a dual purpose. The benefit-resource
indices could serve as a method of comparing sub-system deliverable alternatives or as a way for
the team lead to deny proposals that didn’t have enough benefit for the resources required with
respect to other sub-systems. There were multiple steps in quantifying benefit and resource
usage.
1. All project stakeholders were asked what qualified as a design benefit and how resource
is best quantified. The following qualities were decided upon:

32
• Benefit
o Performance gains
o Service time decreases
• Resource
o Skill level required - lower skill levels result in a lower calculated resource usage
o Total manufacturing time required
o Cost
It is important to note that time and cost were purposefully separated due to the fact that all work
was done by unpaid volunteers.
2. Skill levels were defined by the same system as the Cal Poly Machine shop: red, yellow, and blue
tag. A red tag holder was able to access grinders, sand blasters, cutting equipment, and
bending/forming machines. Yellow tag holders had access to manual lathes and mills as well as a
welder. However, only students who were deemed good enough to weld by the team lead
counted as having the welding skill in the program. Lastly, blue tag holders had access to the
CNC machines. The number of skill hours was defined as the total number of hours each student
with the particular skill in question had to spend working on the project.
3. The following formulas were developed using these descriptions as a guide:
������� ��� � �� ������� ���� � ��� ������� ������ ������� ���� �
���������� ��� � ������ ������� ���������� ������� �����

33
����� ��� � ���������� ��� ! ������� ���
������ �"��� ���� #����$���� � %&���� ����� ' %�"���)
���� �"��� ���� *�����+�� � �,�+�� �� ���-�� ���� �"�������� ���-�� � ���� � ' ����� ���� .�,��
���� ��� � % ������ �"��� ���� #����$�������� �"��� ���� *�����+��
/��� ��� � �,+������ ,��� ����� ���� ,���
0���,��� ��� � ���� ��� ! /��� ���
Formula descriptions:
• The Service Index is a percent difference in service time. It is defined as a difference
between the time the old sub-system design took to service and the time the new sub-system
design will take to service. Only changes were asked to be measured. If certain deliverables
remained exactly the same, then service times were not used in the program.
o Both times were recorded in minutes. Mathematically, a percent difference is unit less.
• A performance index was calculated by using the sub-system priority scores from the project
priority matrix and dividing it by the total points possible. Total points possible can be
calculated by multiplying all competition component points by the maximum benefit
potential.
o Since the formula divides sub-system points by total points, the result is unit less.
• The benefit index is calculated by adding the percent difference to the performance index.
o Two unit less indices are used to calculate the benefit index. It is therefore, unit less as
well.
• Sub-system skill times were calculated by estimating a manufacturing time for each
deliverable, or part, and estimating the percent of that time each skill will need to be utilized
for that deliverable. A summation for each deliverable skill time was calculated and was

34
used as a sub-system skill time. Deliverable manufacturing times were recorded in hours.
When multiplied by a percent, the units for sub-system skill times are hours.
• Total team time available for each skill was estimated by multiplying the percent of people
with each skill by the total team time, in hours. However, all blue tag holders are able to
operate yellow and red tag machines. Yellow tag holders are able to operate red tag machines
as well. In order to provide incentive for the sub-system leads, the percent of people with
each skill was calculated by dividing the number of team members that could offer the skill
by the total number of members on the team.
o For example, if 50% of the team has a red tag and 50% has a yellow tag. Team red tag
time was calculated by multiplying 100% by the total team time available because all
members can operate red tag machines and tools. Team yellow tag time was calculated
by multiplying 50% by the total team time available because red tag holders cannot
operate yellow tag machines and tools. Mathematically, this makes it appear as though
there are more red tag hours. This decreases the time index for red tag manufacturing
and, thus, provides incentive for sub-system leads to use more red tag manufacturing
processes. However, it is important to note that, for this example, when added, red tag
hours and yellow tag hours would be 150% of total team hours. It is because of this
phenomenon that skill hours cannot be considered a simple percent of total hours and all
indices should be used for comparison purposes only.
• A time index was calculated by dividing the sub-system skill hours by the total skill hours.
This creates a unit less index.
• A cost index was calculated by dividing the sub-system budget by the total team budget. This
creates a unit less index.
• The time and cost index were added to calculate the resource index. All indices are unit less.

35
4. Once benefit and resource were quantified by these equations, two programs were considered for
data entry. A program would need to accept system parameter entry from the user and calculate
the indices. Both Microsoft Excel and Matlab were considered for their ease of use and
familiarity. Matlab was chosen because the program could prompt the user for necessary
information instead of having to search for entry points (as would be necessary in Excel).
5. An algorithm was created in Matlab (Appendix K). The algorithm prompted the user for
information which was to be used in the formulas listed above. The algorithm was created in
consideration of human error and allowed users to edit mistyped information before moving to
the next step. It also summarized their sub-system parameters in a chart for review before
displaying their benefit and resource indices.
6. The algorithm was then used to calculate extreme cases for benefit and resource. Each index was
recorded and a weight was created by this project’s manager to ensure that, even in extreme
cases, no single index would exceed a value of one. This was done to avoid the influence of
naturally stronger weights of certain index calculations.
7. A slideshow presentation was created to introduce the concept of benefit-resource quantification
to the team which included design tips for lowering resource usage and increasing benefit.
(Appendix N)
8. A guide was made to teach students how to properly use the program. (Appendix M)
The Critical Design Review (CDR) is presented in a similar fashion as the Preliminary Design Review.
However, sub-system designs were to be finalized by this point. Both the management process and
mechanical design process were fully integrated into this step, as this was the completion of the planning
stage from the management process (Appendix J). A slideshow was created so that the integrated steps
would be followed and presented. The steps were as follows:

36
1. The students were instructed to briefly review the PDR.
2. The synthesis step was presented as sub-system integration. Integration was the means
by which the presenting sub-system interacted with other sub-systems.
3. Analysis and optimization was presented by stating all relevant sub-system parameters
as well as the methods used to obtain them.
4. An evaluation step described how the new design met all team and sub-system goals
from the project definition sheet.
5. The management process was also included by having each sub-system fill out a risk
analysis template and presenting a breakdown of their budget.
Once all deliverables had design decisions made, the project manager for this project worked
jointly with the team manager, team lead, and sub-system leads to create a work breakdown
structure, identify task predecessors, estimate the task durations, and assign resources and
priority values for each task. During the build phase, this schedule was to be followed and
updated by the sign-out sheets (Appendix P) once weekly by the team manager so that machines
could be reserved for use and materials were delivered by their intended use date.
Once the build stage was completed, the car could be tested to validate the success of the design and
manufacturing processes. During testing, it was unclear what the purpose of each day was. If there was a
purpose, the testing method was unclear. Finally, if there was a system failure, there was no log of the
incident or how to avoid it in the future. A testing and incident log was created so that all events of a
testing day could be recorded (Appendix Q).
After testing the team would go to competition. One at competition, team members were not
sure of the jobs they were to be performing at competition. As such, team members would

37
switch between multiple jobs based on the current needs of the team. During crucial times at
competition, team members would have a discussion about who was able to perform the tasks
needed, wasting valuable time and creating added stress for the team lead. The team competition
assignments were created as a means of preventing idle time as well as to reduce the quantity of
lost tools and materials (Appendix R).
Once competition was over, the team lead would hold a post-season “debrief” meeting. Team
members would talk about things that they would improve in the following years over the
previous year. The team manager typically takes notes about the improvements and some of
them would be considered the following year. There was no obvious direction of the meeting
and important points would often get missed. A post-season questionnaire was created to audit
the team members and increase the efficiency of these meetings (Appendix S). There were two
parts to the questionnaire. The first part asked for specific improvements to the SAE officers as
well as the team and sub-system leads. This part was meant to be anonymous and it was
instructed that comments be limited to a problem statement and a suggested countermeasure. It
was important that the team members did not use this as an opportunity to tear down other team
members so a note was added to that effect. The second part was used to obtain information for
the sub-system so that future sub-system designers could read about suggested improvements in
the definition and design process. It was also built into the questionnaire that this management
process is considered and recommendations be given to improve the process. This was done so
that continuous improvement could be built into the process to maximize sustainability.
Finally, an outline of the overall process will be created with similar information as this section.
It has an 11 step process to manage the team throughout the competition season and provides

38
typical completion times for each step. This process will be located in a binder which houses a
new team lead flash drive as well as all necessary process documentation. The management
process outline paper will outline the final design with all suggested changes implemented
(Appendix A).
V. Results and Discussion
Once an initial process had been created, the following feedback was given during the testing process:
Table 6: Deliverable Feedback
Deliverable Feedback Implemented Change
Project Definition Template
• Space for date • Define statement of work • Include SAE rules and Cal Poly
charter • Allow for more space for goals • Define stakeholders • Too much detail on goal
specificity example • Success Metrics= Measurements
• Space for date added • Statement of work defined and applied to Baja • A URL was provided for the SAE rules and it was
instructed that the rules and charter must be followed
• Added space for goals • Stakeholders defined and examples given • Goal specificity example made more simple • Metrics explained as measurements
Drafted Communication Plan
No specific feedback
Statement of Authority
No specific feedback
Weighted Project Priority Matrix
• Change design criteria to competition components to shift thought process and increase competition points
• More resolution on the potential scale
• Design criteria was changed to competition components with their score as the weight
• A potential scale of 0-5 was used for added flexibility
Preliminary Design Review Slides
• No specific feedback given

39
Benefit/ Resource Quantification
• Decrease technicality of slideshow presentation
• Change input order so % Weld time wasn’t confused with % Yellow tag time
• A list of things should be printed at program start that the user needs to input
• Explain service times to be considered
• Part name entry for review • Infinite loop issue • Part review table out of
alignment
• The slideshow was introduced as “Best Bang for the Buck”. Examples were given of high/ low benefit and resource as well as a theoretical graph for how the indices will be used
• Input reordered • Instructions added to beginning of program • Service times explanation added to instructions • The program took input for part names that were
displayed when part information was reviewed • Program simplified, infinite loop fixed • Table review changed to list review • “How to Use Benefit and Resource Program”
walkthrough was created
Critical Design Review Slide Template
• Add a budget considerations slide
• A budget slide was added. It was asked that the sub-system lead consider major deliverables as well as fluids, hardware, etc.
Schedule of Activities and Resources
• Create a Microsoft Project Walkthrough paper to teach new managers how to use program
• Add task priority
• Paper created • Priorities added
Microsoft Project Walkthrough
No feedback given
Sign-Out Sheet/ Task Log
• Ask for set-up time • Ask for tools used • Add description and examples
of the types of comments needed for each task
• Faster information entry
• Set-up time ranges included in check box for fast entry
• Typical tools used included in check box for fast entry
• Descriptions and examples added
Team Competition Assignments
• Add strapping down the driver to Pit Crew job description
• Job description modified

40
Testing Goal Sheet/Incident Log
• Add descriptions for each section and how they pertain to Baja
• Descriptions added
Post Season Audit Questionnaire
• Ask about the most important thing the team member learned from this year’s competition
• Ask about specific changes for next year’s designs
• Questions added
Management Process Outline
• Add Table of Contents • Ease folder navigation
• Table of Contents added • Tabs added for each process document
The 2012-2013 competition season was the first to test this management process. The competition will
not occur until after the completion of this project so specific competition results could not be acquired
such as competition organization and point scores. However, a competition score estimation that was
made by the current team lead states an expected point score of 800 points. This is a 54.7% increase from
the previous year’s score of 517.15. In addition to a potential increase in score, the team had a running
car that met the Go/No Go criteria two full weeks before the scheduled date. It was also reported that the
team was registered for competition on time, there had be no rushed shipments, the cost report was
submitted on time, and the design report was underway to be finished and submitted on time. Cost report
was down from a vehicle total of $16,500 to $15,000.
Since missed submission dates and low competition scores were problems which this project set to solve,
these results were expected. This process design encompasses all major process steps and adds steps
where necessary; however there is still significant bias in the mechanical design process. Specific ways
to reduce bias will be discussed further in the recommendations section of this report. This project cost
significantly less than the maximum $100 limit set by the current team lead at a final cost of $87.05. This
was 87% of the budget set by the team lead, but 23% over the original budget estimation.
VI. Conclusions and Recommendations

41
Poor project organization manifested through unclear team goals, rush deliveries of materials,
lost tools and materials, half days of effort, wasted design time, missed submission dates, and a
lack of clear job positions at competition. Ultimately, wasted effort, wasted funds, and low
competition score resulted from this lack of organization. A process was created to properly
manage the team and it was implemented through the use of various templates, examples, and
the Benefit and Resource Quantification. Each deliverable received feedback from this project’s
stakeholders and changes were reflected in the final process.
The most important result from this project is that the Cal Poly SAE Baja team saw a benefit
from a more organized project management process. A follow-up project should be scheduled
such that the project finish date is after the competition season so that more specific results can
be reviewed and feedback on the overall process is given to adjust the final process.
At the conclusion of this project, many recommendations should be considered by future team
leads for implementation:
1. The team should consider a method of quantifying the benefit of a sub-system which
does not include the bias of the team lead such as in the Project Priority Matrix. A lap
performance simulator, competition points estimator, or similar tool would allow for a
less biased quantification of design value with less dependence on the team lead’s
judgment.
2. A new Microsoft Project walkthrough should be created every year which a new version
comes out.
3. A minimum of one project which follows the innovation process outlined in the
Literature Review section should be considered yearly.

42
4. An inventory control system such as the one in Literature Review section should be
created.
5. A part quality control method such as the one in Literature Review section should be
created.
6. Should the team find that the budget section in the critical design review and detailed
schedule of activities and resources are not adequate, a bill of materials and ordering
schedule should be created.
7. The team lead and team manager follow the roles discussed in the Literature Review
section.

43
REFERENCES
Anthony, Scott D. The little black book of innovation: how it works, how to do it. Boston, Mass.:
Harvard Business Review Press, 2012. Print.
Bahill, A. Terry, and Frank F. Dean. The requirements discovery process. Washington, D.C.:
United States. Dept. of Energy. Office of Financial Management and Controller ;, 1997. Print.
Biafore, Bonnie. Microsoft Project 2007 the Missing Manual.. Sebastopol: O'Reilly Media, Inc.,
2008. Print.
Briner, Wendy, Colin Hastings, and Michael Geddes. Project leadership. 2nd ed. Aldershot,
England: Gower, 1996. Print.
Budynas, Richard G, J. Keith Nisbett, and Joseph Edward Shigley. "Design." Shigley's
mechanical engineering design. 9th ed New York: McGraw-Hill, 2011 4-11.Print.=)
Crosby, Philip B.. Quality without tears: the art of hassle-free management. New York:
McGraw-Hill, 1984. Print.
Cullen, Scott. "Earned Value Analysis | Whole Building Design Guide." WBDG - The Whole
Building Design Guide. N.p., n.d. Web. 2 Nov. 2012.
<http://www.wbdg.org/resources/value_analysis.php>.
Dasu, Sriram, and Charles M. Eastman. Management of design: engineering and management
perspectives. Boston: Kluwer Academic Publishers, 1994. Print.
Gambhir, Sukhdeep Singh. A user-centered system development model based on Facilitator-
Assisted Requirements Elicitation (FARE). San Luis Obispo: Polylearn, 1998. Print.
Golembiewski, Dick. "SAE Collegiate Design Series: Baja SAE®: Resources-Managing

44
Projects." Student Central. N.p., 25 Feb. 2008. Web. 2 Nov. 2012.
<http://students.sae.org/competitions/bajasae/resources.htm>.
Grady, J.O., System Requirements Analysis. New York, McGraw Hill, 1993
Lewis, James P.. Project planning, scheduling & control a hands-on guide to bringing projects
in on time and on budget. Rev. ed. Chicago, Ill.: Irwin, 1995. Print.
Meredith, Jack R., and Samuel J. Mantel. Project management. 2nd ed. Canada: John Wiley &
Sons, 1989. Print.
Pinto, Jeffrey K., and Jeffrey W. Trailer. Essentials of project control. Newton Square, PA:
Project Management Institute, 1999. Print.
Plossl, George W., and W. Evert Welch. The role of top management in the control of inventory.
Reston, Va.: Reston Pub. Co., 1979. Print.
Russell, Roberta S and Bernard W. Taylor. Operations management: creating value along the
supply chain. 6th ed. Hoboken, NJ: John Wiley & Sons, 2009. Print.
"SAE Collegiate Design Series: Baja SAE: About Baja SAE." Student Central. N.p., n.d. Web. 1
Nov. 2012. <http://students.sae.org/competitions/bajasae/about.htm>.
Summers, Donna C. Quality management: creating and sustaining organizational effectiveness.
Upper Saddle River, N.J.: Pearson Prentice Hall, 2005. Print.
Taylor, Robert L, and William E. Rosenbach. Leadership: challenges for today's manager. New
York: Nichols Pub., 1989. Print.
Worth, Michael J. Nonprofit management: principles and practice. Second Edition ed. Los
Angeles: SAGE Publications, 2009. Print.
Yoe, Charles E. Principles of risk analysis: decision making under uncertainty. Boca Raton, FL:
CRC Press, 2012. Print.

45
Appendix A. Start Here: Management Process Outline
Before the competition season begins, read all post season debrief questionnaires from the
previous season. Consider the innovation process in the Literature Review section of the
“Sustainable Project Management Process for Cal Poly SAE Baja” senior project written by
Theo Graziadei. Please fill out all templates on NEW printouts. DO NOT write on the templates
printed in this folder, they are for reference purposes only. Quotes refer to files on the team lead
flash drive under “Project Management Process”. The team lead flash drive should be tethered
to the front flap of this binder.
Project Proposal - First two weeks of fall quarter
1. “Project Definition” Template:
o Fill out a project definition template for overall team goals
o Have each sub-system lead fill out a project definition template. If you are a sub-
system lead, then you must fill another one out for your sub-system as well.
o Make sure that all components are included in the deliverables section. (i.e. it must
be defined who will produce a rotor carrier - brakes or drivetrain). Don’t let
major deliverables go through design unaccounted for.
2. “Communications Charter”: After a few weeks, you should know who will be staying
with Baja.
o Read the instructions during a team meeting and pass out the roster for everyone to
fill out.
o Update the Google Group and email the final copy to everyone on the team.
3. “Statement of Authority” (Conflict Resolution):
46
o Print as many copies as there are members on the communication plan
o Read the instructions during a team meeting and have each member sign a sheet
o Collect the sheets and store for review in the event of future disputes
4. “Sub-System Priority Matrix” Template:
o Read the instructions and follow
� Use the “Project Definition” sheet for each sub-system
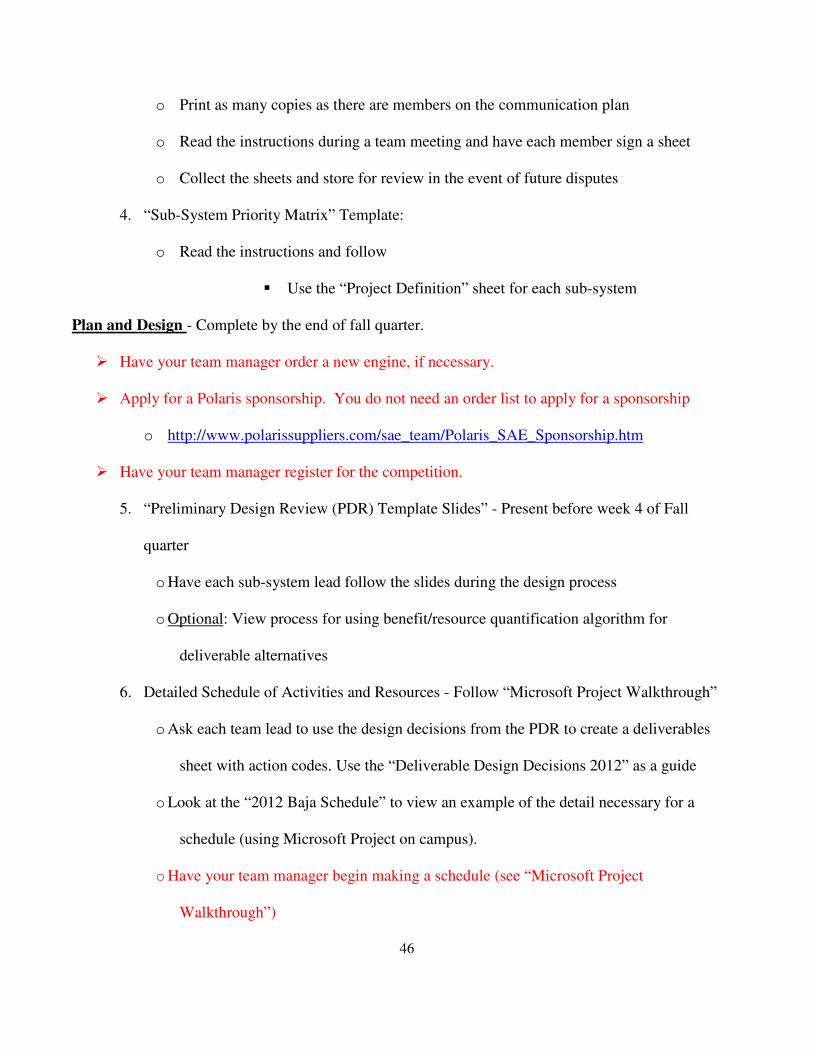
Plan and Design - Complete by the end of fall quarter.
� Have your team manager order a new engine, if necessary.
� Apply for a Polaris sponsorship. You do not need an order list to apply for a sponsorship
o http://www.polarissuppliers.com/sae_team/Polaris_SAE_Sponsorship.htm
� Have your team manager register for the competition.
5. “Preliminary Design Review (PDR) Template Slides” - Present before week 4 of Fall
quarter
o Have each sub-system lead follow the slides during the design process
o Optional: View process for using benefit/resource quantification algorithm for
deliverable alternatives
6. Detailed Schedule of Activities and Resources - Follow “Microsoft Project Walkthrough”
o Ask each team lead to use the design decisions from the PDR to create a deliverables
sheet with action codes. Use the “Deliverable Design Decisions 2012” as a guide
o Look at the “2012 Baja Schedule” to view an example of the detail necessary for a
schedule (using Microsoft Project on campus).
o Have your team manager begin making a schedule (see “Microsoft Project
Walkthrough”)

47
o Work with your team manager to enter priorities for each task. Consider the Go/No
Go date.
7. “Critical Design Review (CDR) Template Slides” – Present before week 10 of Fall
quarter
o Review and present the Benefit/ Resource Index slides at a team or sub-system
meeting
o Have each sub-system lead follow the CDR slides during the design process-send out
CDR slides and “Risk Analysis” template to each sub-system lead.
o Re-evaluate each sub-system’s priority based on their final estimates of the goals
from their “Project Definition” template. Use the “Sub-System Priority Matrix”.
o Have each sub-system lead evaluate their project using the “br_index” program
� Read “How to Use the Benefit and Resource Program”
o In the event of limited budget, cut new sub-system designs that have lower benefits
and/or higher resource utilizations than other sub-systems
� If there will be any frame building over Winter Break, order frame material after CDR.
� BEGIN WORKING ON DESIGN AND COST REPORT ASAP!!! YOU WILL REGRET
IT IF YOU PUT IT OFF!!! HAVE THE SUB-SYSTEM LEADS HELP!!!
Build – Should be completed AT LEAST one month before the Baja car leaves for competition.
Check Go/ No Go date with SAE officers.
8. Have each team member fill out the “Sign-Out Sheet(s)” every day after work
o Have your team manager update the schedule weekly using the “Sign-Out Sheet(s)”

48
o Use the updated schedule to make sure that each sub-system is on schedule for
manufacturing, ordering, and assembling. Use this information during each weekly
team meeting.
Test and Closeout – After Go/ No Go date
� Have your team manager begin looking for hotels for competition travel.
9. “Test Preparation and Incident Log” – Complete before testing
o Before each drive/ testing day, have a sub-system lead fill out the test
preparation sheet
o Print and bring the test preparation sheet to each drive/ testing day
o In the event of a sub-system failure, log the results using the incident log.
Take pictures.
o A number of the incident logs should be printed and filled out during
competition in the event of an incident
10. “Team Assignments at Competition” – Before leaving for competition
o Print the “Team Assignments at Competition” and read each job
description out loud at a team meeting.
o Ask for volunteers for each position. Make sure each position is
accounted for.
o E-mail the completed form so each member has a description of their roles
at competition.
o Run through the entire SAE rule book and make sure that the car passes all
rules.

49
o Print and bring each sub-system’s “Risk Analysis” template from the
CDR.
o Print and bring each sub-system’s “Project Definition” template. These
templates will be used when filling out the “Post Season Debrief
Questions”.
o Print and bring all necessary car documentation (bolt equivalencies, frame
material receipts, etc.)
o Make sure the manager has secured hotel rooms.
11. “Post Season Debrief Questions” – Night after competition (endurance race)
o Before the debrief meeting, have each member fill out the post season
debrief questions
o The first part of the questions are meant to be anonymous
o The second part of the questions are to be used for improvements by
future sub-system designers
o Review the questionnaire during the meeting
o Allow team members to keep their questionnaire until after the meeting to
make any edits during the meeting

50
Appendix B. Step 1: Project Definitions
School Year:
Sub-System Name:
Project Classification (circle one): Compliance/ Emergency (must be done to meet rules)
Strategic (meant to meet team goals) Stakeholders: List any person(s) who will influence project in any way. (ex: Baja team, Baja team lead, SAE advisors, SAE officers, sponsors, etc.)
Purpose: Gap between where you are and where you want to be. This gap must be confronted with obstacles that make closing the gap difficult. Purpose should answer why are we doing this project? (Typically a negative statement)
Statement of Work: Contract between you and SAE Baja. Once the statement of work is formally agreed upon, it becomes the requirements that your sub-system must meet.
Rules:
All projects must meet or exceed the current year’s rules as stated by SAE Baja international. http://students.sae.org/competitions/bajasae/rules/
All Projects must adhere to the Cal Poly SAE constitution.
(list more here)
Goals: Should be based on the purpose statement. Be specific (ex: “serviceability” should be written as “increase serviceability of brake assembly and drivetrain”). Make sure the goals are measurable (ex: service time should be decreased by 10%). Don’t set unrealistic goals. Don’t set goals that aren’t challenging, either. Include all team goals (ex: if the team goals are to reduce weight by 30 lbs, include how many of those pounds your system will lose)

51
Constraints: Time (Estimate Min/Max duration of Project)
Budget (Estimate Max Budget of Project)
(add more here)
Success Metrics: How do you measure success of the project? Included are common metrics for every project. Success metrics must be measurable/ quantifiable.
On Time On Budget High Quality No damage (to people socially or physically) (add more here)
Scope: Puts clear boundaries on project while taking into account the stakeholder’s expectations. Describes major activities and defines project’s place in relationship to other projects. Should answer what this project will and will not do.
Deliverables: What major components are the project supposed to produce? (ex: suspension must deliver A-arms, air shocks, uprights, etc.)
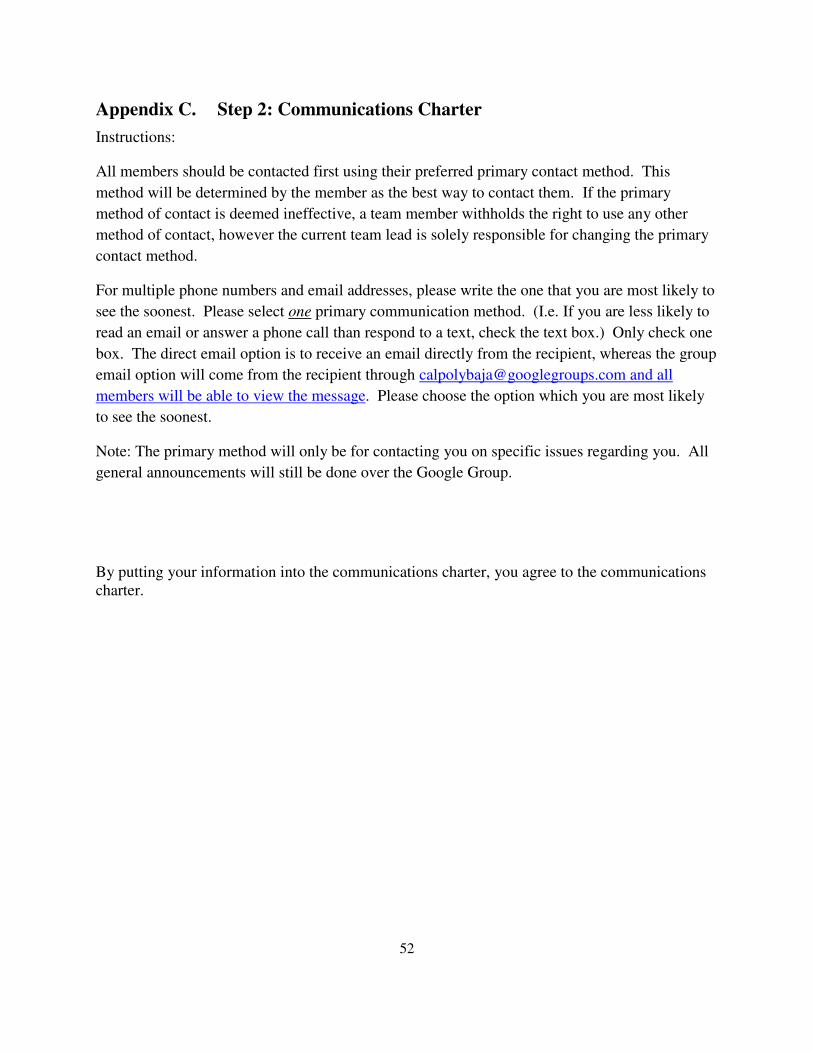
52
Appendix C. Step 2: Communications Charter
Instructions:
All members should be contacted first using their preferred primary contact method. This method will be determined by the member as the best way to contact them. If the primary method of contact is deemed ineffective, a team member withholds the right to use any other method of contact, however the current team lead is solely responsible for changing the primary contact method.
For multiple phone numbers and email addresses, please write the one that you are most likely to see the soonest. Please select one primary communication method. (I.e. If you are less likely to read an email or answer a phone call than respond to a text, check the text box.) Only check one box. The direct email option is to receive an email directly from the recipient, whereas the group email option will come from the recipient through [email protected] and all members will be able to view the message. Please choose the option which you are most likely to see the soonest.
Note: The primary method will only be for contacting you on specific issues regarding you. All general announcements will still be done over the Google Group.
By putting your information into the communications charter, you agree to the communications charter.

53
Name Email Address Direct Group Phone Number Text Call
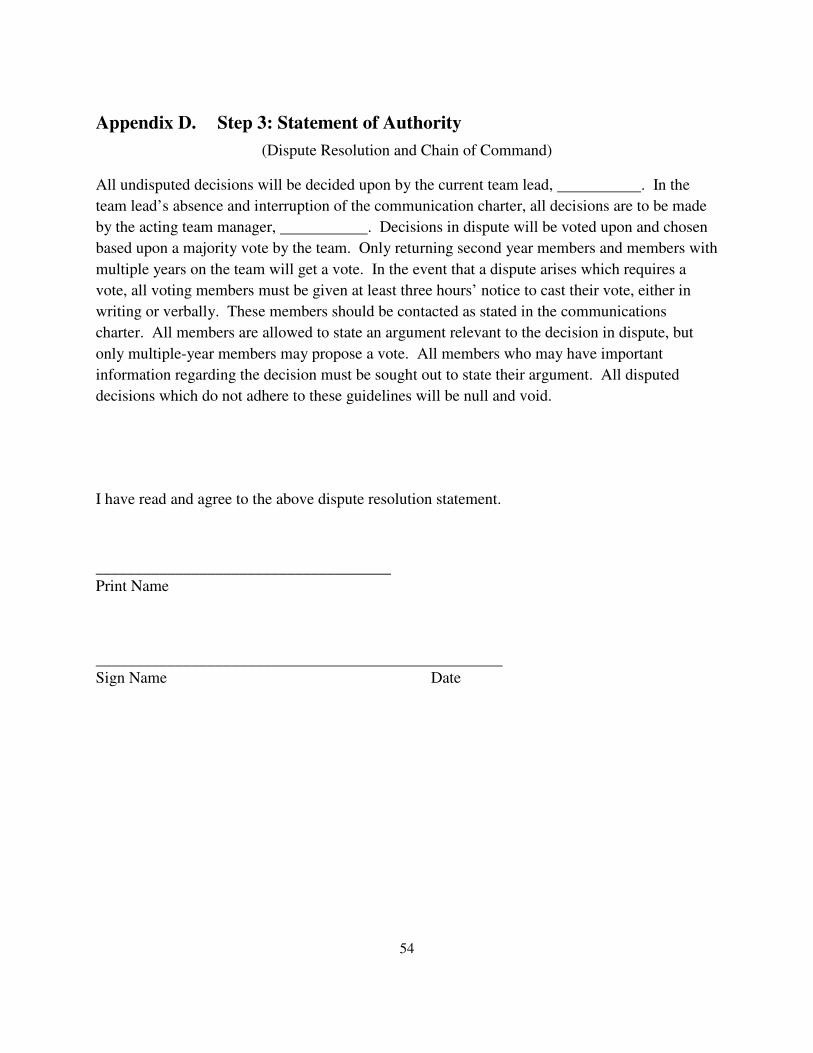
54
Appendix D. Step 3: Statement of Authority
(Dispute Resolution and Chain of Command)
All undisputed decisions will be decided upon by the current team lead, . In the team lead’s absence and interruption of the communication charter, all decisions are to be made by the acting team manager, . Decisions in dispute will be voted upon and chosen based upon a majority vote by the team. Only returning second year members and members with multiple years on the team will get a vote. In the event that a dispute arises which requires a vote, all voting members must be given at least three hours’ notice to cast their vote, either in writing or verbally. These members should be contacted as stated in the communications charter. All members are allowed to state an argument relevant to the decision in dispute, but only multiple-year members may propose a vote. All members who may have important information regarding the decision must be sought out to state their argument. All disputed decisions which do not adhere to these guidelines will be null and void.
I have read and agree to the above dispute resolution statement.
_____________________________________ Print Name ___________________________________________________ Sign Name Date

55
Appendix E. Step 4: Sub-System Priority Matrix
Read Instructions Carefully Before Evaluating Matrix
Instructions:
1. Project Definition: Consider all non-compliance/emergency sub-systems. A safety sub-system is a compliance sub-system because it must be done. It should be your first priority and does not need to be evaluated in this matrix. Base the potential benefit upon goals from “Project Definition” template.
» Goals must be specific, measurable, and attainable
2. Evaluate Potential: Evaluate the potential benefit that the sub-system being considered will have, relative to the other sub-systems, in aiding the competition component being considered (see the proceeding matrix)
» Values assigned are an arbitrary scale of 0-5, where a value of zero means zero potential and a value of five mean high potential
3. Record: Multiply Potential Score by Competition Component Weight and record under weighted score
4. Total: Add up and record the Total Weighted Score for each sub-system. 5. Prioritize: Evaluate the Priority of the project based on its total weighted score. (1-7) 6. Assign: Assign more people to sub-systems with a higher priority, greater design
difficulty, and/or greater manufacturing complexity Notes:
o Extra spaces may be included or required based on the number of sub-systems and competition components considered.
o It is possible to have sub-systems of equal priority. o Projects that will benefit design report/presentation, cost, or other non-dynamic
components of competition should be considered

56
Frame Suspension Drive Train
Brakes Steering Panels
Competition
Component
Weight Subsystem
Benefit
Potential
Weighted Score
Weighted Score
Weighted Score
Weighted Score
Weighted Score
Weighted Score
Endurance
(400pts)
No�Hi Potential
(0-5)
Design Report
(150pts) No�Hi Potential
(0-5)
Cost (100pts) No�Hi Potential
(0-5)
Maneuverability (75pts) No�Hi Potential
(0-5)
Acceleration
(75pts) No�Hi Potential
(0-5)
Hill Climb (75pts) No�Hi Potential
(0-5)
Acceleration (75pts) No�Hi Potential
(0-5)
Rock Crawl (75pts) No�Hi Potential
(0-5)
Sales Presentation
(75pts) No�Hi Potential
(0-5)
Design Presentation
(50pts) No�Hi Potential
(0-5)
Total Weighted Score
Priority

57
Appendix F. Step 5: PDR Template Slides Outline
� Write your sub-system name, and the names of the members here. Purpose/Problem Statement
� State the purpose and or problem of your sub-system as from your project definition sheet � i.e. The Problem is that the radio box is not water proof � The Purpose of my Project is to design a waterproof box
Goals � Restate your goals on your Project Definition sheet
� Goals must be specific, measurable, and attainable � Your goals may become your functional criteria (see design matrix slide)
� i.e. � Weight: <1 pound w/o radio and wires. � Completely waterproof to incident water (not at depth) � Cost: <$10
Deliverables � Restate the major deliverables from your project definition sheet � Deliverables should include all components on in your system
� i.e. � one box fitted to radio � One reseal able cap � One Frame mount
Design Alternatives � State all design alternatives considered to fulfill your functional criteria
� i.e. Box Materials � Poly Carbonate � 1018 Steel � 6061 Aluminum
� Water Proofing � groove and gasket � Threaded cap � glue
DESIGN/DECISION MATRIX � You must include a weighted design/decision matrix to choose between the design alternatives
� List alternatives � Include Functional criteria
� Can be based off of goals: i.e. weight and effectiveness � Include Functional criteria weights � Evaluate alternatives based on criteria and fill in your matrix
� If you do not know how to create a decision matrix, ask your current team lead � You may need more than one decision matrix for more than one deliverable
Design Choice � Based on the decision matrix, choose the design alternative with the highest weighted score
� You may also use the benefit and resource program to analyze the alternatives further � Ask your team lead for details

58
Appendix G. Step 6: 2012 Baja Schedule
Task Name Duration Start Finish Predecessors Resource
Names Priority
Baja 201.88 days? Tue
9/18/12
Sat
5/11/13 500
Design 59.5 days Tue
9/18/12
Thu
12/6/12 500
Frame 17.85 days Tue
9/18/12
Thu
10/11/12 500
Project Definition 2.55 days Tue
9/18/12
Thu
9/20/12 500
Project Alternatives 2.55 days Thu
9/20/12
Sat
9/22/12 12
500
Alternative Decision 2.55 days Sat
9/22/12
Thu
9/27/12 13
500
PDR Slides 2.55 days Thu
9/27/12
Sat
9/29/12 14
500
Project Details/ Final Design 2.55 days Sat
9/29/12
Thu
10/4/12 15
500
Risk Analysis 2.55 days Thu
10/4/12
Sat
10/6/12 16
500
CDR Slides 2.55 days Sat
10/6/12
Thu
10/11/12 17
500
Suspension 17.85 days Thu
9/20/12
Sat
10/13/12 500
Project Definition 2.55 days Thu
9/20/12
Sat
9/22/12 500
Project Alternatives 2.55 days Tue
9/25/12
Thu
9/27/12 4
500
Alternative Decision 2.55 days Thu
9/27/12
Sat
9/29/12 5
500
PDR Slides 2.55 days Sat
9/29/12
Thu
10/4/12 6
500
Project Details/ Final Design 2.55 days Thu
10/4/12
Sat
10/6/12 7
500
Risk Analysis 2.55 days Sat
10/6/12
Thu
10/11/12 8
500
CDR Slides 2.55 days Thu
10/11/12
Sat
10/13/12 9
500
Brakes 59.5 days Tue
9/18/12
Thu
12/6/12 500

59
Project Definition 8.5 days Tue
9/18/12
Thu
9/27/12 500
Project Alternatives 8.5 days Thu
9/27/12
Tue
10/9/12 20
500
Alternative Decision 8.5 days Tue
10/9/12
Sat
10/20/12 21
500
PDR Slides 8.5 days Sat
10/20/12
Thu
11/1/12 22
500
Project Details/ Final Design 8.5 days Thu
11/1/12
Tue
11/13/12 23
500
Risk Analysis 8.5 days Tue
11/13/12
Sat
11/24/12 24
500
CDR Slides 8.5 days Sat
11/24/12
Thu
12/6/12 25
500
Drivetrain 59.5 days Tue
9/18/12
Thu
12/6/12 500
Project Definition 8.5 days Tue
9/18/12
Thu
9/27/12 500
Project Alternatives 8.5 days Thu
9/27/12
Tue
10/9/12 28
500
Alternative Decision 8.5 days Tue
10/9/12
Sat
10/20/12 29
500
PDR Slides 8.5 days Sat
10/20/12
Thu
11/1/12 30
500
Project Details/ Final Design 8.5 days Thu
11/1/12
Tue
11/13/12 31
500
Risk Analysis 8.5 days Tue
11/13/12
Sat
11/24/12 32
500
CDR Slides 8.5 days Sat
11/24/12
Thu
12/6/12 33
500
Steering 59.5 days Tue
9/18/12
Thu
12/6/12 500
Project Definition 8.5 days Tue
9/18/12
Thu
9/27/12 500
Project Alternatives 8.5 days Thu
9/27/12
Tue
10/9/12 36
500
Alternative Decision 8.5 days Tue
10/9/12
Sat
10/20/12 37
500
PDR Slides 8.5 days Sat
10/20/12
Thu
11/1/12 38
500
Project Details/ Final Design 8.5 days Thu
11/1/12
Tue
11/13/12 39
500
Risk Analysis 8.5 days Tue Sat 40
500

60
11/13/12 11/24/12
CDR Slides 8.5 days Sat
11/24/12
Thu
12/6/12 41
500
Safety 59.5 days Tue
9/18/12
Thu
12/6/12 500
Project Definition 8.5 days Tue
9/18/12
Thu
9/27/12 500
Project Alternatives 8.5 days Thu
9/27/12
Tue
10/9/12 44
500
Alternative Decision 8.5 days Tue
10/9/12
Sat
10/20/12 45
500
PDR Slides 8.5 days Sat
10/20/12
Thu
11/1/12 46
500
Project Details/ Final Design 8.5 days Thu
11/1/12
Tue
11/13/12 47
500
Risk Analysis 8.5 days Tue
11/13/12
Sat
11/24/12 48
500
CDR Slides 8.5 days Sat
11/24/12
Thu
12/6/12 49
500
Panels 59.5 days Tue
9/18/12
Thu
12/6/12 500
Project Definition 8.5 days Tue
9/18/12
Thu
9/27/12 500
Project Alternatives 8.5 days Thu
9/27/12
Tue
10/9/12 52
500
Alternative Decision 8.5 days Tue
10/9/12
Sat
10/20/12 53
500
PDR Slides 8.5 days Sat
10/20/12
Thu
11/1/12 54
500
Project Details/ Final Design 8.5 days Thu
11/1/12
Tue
11/13/12 55
500
Risk Analysis 8.5 days Tue
11/13/12
Sat
11/24/12 56
500
CDR Slides 8.5 days Sat
11/24/12
Thu
12/6/12 57
500
Manufacturing 199.88 days? Tue
9/18/12
Thu
5/9/13 500
Frame 56.65 days Thu
10/11/12
Tue
12/18/12 11
500
Firewall Tubes-DONE 2 days Thu
10/11/12
Sat
10/13/12 500
Rear Floor Tubes-DONE 0.5 days Sat
10/13/12
Sat
10/13/12 106
500
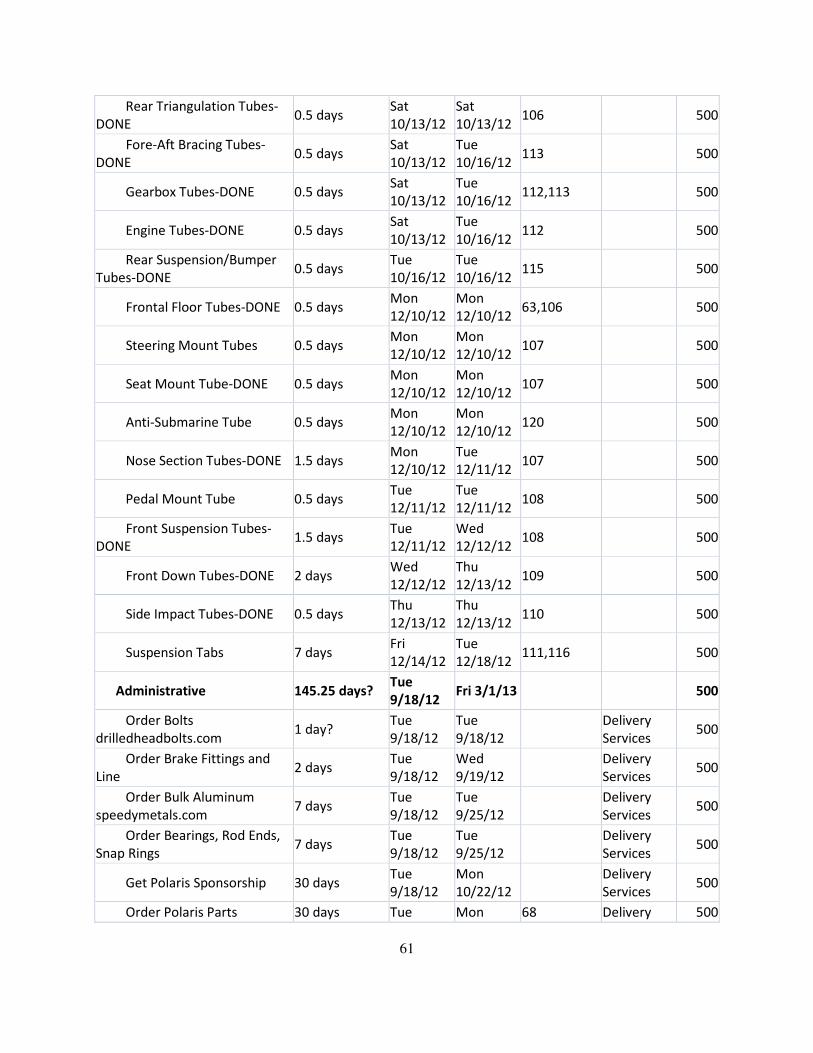
61
Rear Triangulation Tubes-
DONE 0.5 days
Sat
10/13/12
Sat
10/13/12 106
500
Fore-Aft Bracing Tubes-
DONE 0.5 days
Sat
10/13/12
Tue
10/16/12 113
500
Gearbox Tubes-DONE 0.5 days Sat
10/13/12
Tue
10/16/12 112,113
500
Engine Tubes-DONE 0.5 days Sat
10/13/12
Tue
10/16/12 112
500
Rear Suspension/Bumper
Tubes-DONE 0.5 days
Tue
10/16/12
Tue
10/16/12 115
500
Frontal Floor Tubes-DONE 0.5 days Mon
12/10/12
Mon
12/10/12 63,106
500
Steering Mount Tubes 0.5 days Mon
12/10/12
Mon
12/10/12 107
500
Seat Mount Tube-DONE 0.5 days Mon
12/10/12
Mon
12/10/12 107
500
Anti-Submarine Tube 0.5 days Mon
12/10/12
Mon
12/10/12 120
500
Nose Section Tubes-DONE 1.5 days Mon
12/10/12
Tue
12/11/12 107
500
Pedal Mount Tube 0.5 days Tue
12/11/12
Tue
12/11/12 108
500
Front Suspension Tubes-
DONE 1.5 days
Tue
12/11/12
Wed
12/12/12 108
500
Front Down Tubes-DONE 2 days Wed
12/12/12
Thu
12/13/12 109
500
Side Impact Tubes-DONE 0.5 days Thu
12/13/12
Thu
12/13/12 110
500
Suspension Tabs 7 days Fri
12/14/12
Tue
12/18/12 111,116
500
Administrative 145.25 days? Tue
9/18/12 Fri 3/1/13
500
Order Bolts
drilledheadbolts.com 1 day?
Tue
9/18/12
Tue
9/18/12
Delivery
Services 500
Order Brake Fittings and
Line 2 days
Tue
9/18/12
Wed
9/19/12
Delivery
Services 500
Order Bulk Aluminum
speedymetals.com 7 days
Tue
9/18/12
Tue
9/25/12
Delivery
Services 500
Order Bearings, Rod Ends,
Snap Rings 7 days
Tue
9/18/12
Tue
9/25/12
Delivery
Services 500
Get Polaris Sponsorship 30 days Tue
9/18/12
Mon
10/22/12
Delivery
Services 500
Order Polaris Parts 30 days Tue Mon 68 Delivery 500

62
10/23/12 11/26/12 Services
Order Frame Material 7 days Sat
12/1/12
Sat
12/8/12 11
Delivery
Services 500
Competition Registration 1 day Mon
12/17/12
Mon
12/17/12
Eric
Hamilton 500
Order System Material
Onlinemetals.com 14 days
Thu
12/20/12 Fri 1/4/13
Delivery
Services 500
Order Engine 102 days Tue
9/18/12
Mon
1/14/13
Delivery
Services 500
Cost Report 14 days Tue
2/12/13 Fri 3/1/13
500
Steering 86.75 days Fri
12/7/12
Sun
3/3/13 42
500
O) Steering Column-DONE 7 days Fri
12/7/12
Fri
12/14/12
Delivery
Services 500
Lower Trunion Block-DONE 2 days Fri 1/4/13 Sat 1/5/13 64 Mill,Ryan
Slein 500
Upper Trunion Blocks-
DONE 1.5 days Fri 1/4/13
Sun
1/6/13 64
Mill,Ryan
Slein 500
Clean Rack and Pinion 0.5 days Sat 2/2/13 Sat 2/2/13
Random
Noob 900
Steering Links 35.38 days Fri 1/4/13 Sat
2/16/13 500
Cut Steering Links-DONE 0.25 days Fri 1/4/13 Fri 1/4/13 64
Horizontal
Bandsaw,Ra
ndom Noob
500
Face and Chamfer Ends of
Steering Links 0.25 days Fri 1/4/13 Fri 1/4/13 174
Lathe,Rand
om Noob 500
Drill Holes - Steering Links 0.5 days Sat 1/5/13 Sat 1/5/13 176 Lathe,Rand
om Noob 500
Tap Holes - Steering Links 0.25 days Sat 1/5/13 Sat 1/5/13 177 Lathe,Rand
om Noob 500
Mill Steering Link Flats 0.5 days Sun
1/6/13
Sun
1/6/13 178
Mill,Rando
m Noob 500
Assemble Rod Ends 0.5 days Sat
2/16/13
Sat
2/16/13
Random
Noob 500
Steering Stops 0.5 days Sun
3/3/13
Sun
3/3/13
Horizontal
Bandsaw,Ra
ndom Noob
950
Suspension 139.82 days Sat
10/13/12
Thu
3/21/13 10
500
Front Arms 113.33 days Sat
10/13/12
Thu
2/14/13 500

63
Rear Links 4.85 days Fri 1/4/13 Mon
1/7/13 500
Cut Rear Links-DONE 0.4 days Fri 1/4/13 Fri 1/4/13 64
Horizontal
Bandsaw,Ra
ndom Noob
500
Face and Chamfer Ends
of Rear Links-DONE 0.4 days Fri 1/4/13 Sat 1/5/13 99
Lathe,Rand
om Noob 500
Drill Holes into Rear
Links-DONE 0.4 days Sat 1/5/13 Sat 1/5/13 101
Lathe,Rand
om Noob 500
Tap Rear Link Holes-
DONE 0.4 days Sat 1/5/13 Sat 1/5/13 102
Lathe,Rand
om Noob 500
Assemble Rod Ends 0.4 days Sat 1/5/13 Sat 1/5/13 103,66 Random
Noob 500
Mill Flats - Rear Links-
DONE 3.25 days Sat 1/5/13
Mon
1/7/13 103
Mill,Rando
m Noob 500
Lower A Arms 91.8 days Sat
10/13/12
Thu
1/17/13 500
Bearing Holder-DONE 7 days Sat
10/13/12
Mon
10/22/12
Delivery
Services 500
Cut Lower A Arm Tubes-
DONE 0.5 days Fri 1/4/13 Fri 1/4/13 64
Horizontal
Bandsaw,Ra
ndom Noob
500
Slit Lower A Arm Tubes-
DONE 1 day Sat 1/5/13 Sat 1/5/13 79
Vertical
Bandsaw,Ra
ndom Noob
500
Oil Filled Bronze
Bearings 2 days Fri 1/4/13 Sat 1/5/13 64
Lathe,Rand
om Noob 500
Bushing Holders-DONE 2.38 days Fri 1/4/13 Sun
1/6/13 64
Lathe,Rand
om Noob 500
Notch Lower A Arm
Tubes-DONE 3 days Sat 1/5/13
Mon
1/7/13 79
Grinder,Kyl
e VanAllen 500
Bearing Holder
Duckfoot-DONE 3.38 days Fri 1/4/13
Mon
1/7/13 64
Vertical
Bandsaw,Ky
le
VanAllen,Dr
ill
Press,Grind
er
500
Weld Lower A Arm
Assembly 0.1 days
Mon
1/7/13
Mon
1/7/13
79,80,81,82,
84,85
Tig
Welder,Sco
tt Frey
500
Heat Treat Lower A Arm 1 day Mon
1/7/13
Thu
1/10/13 86
Furnace,Kyl
e VanAllen 500
Assemble Rod Ends and 1 day Sat Thu 87,66 Kyle 500

64
Spherical Bearings 1/12/13 1/17/13 VanAllen
Upper A Arms 113.33 days Sat
10/13/12
Thu
2/14/13 500
Bearing Holder-DONE 7 days Sat
10/13/12
Mon
10/22/12
Delivery
Services 500
Cut Upper A Arm Tubes-
DONE 0.5 days Fri 1/4/13 Fri 1/4/13 64
Horizontal
Bandsaw,Ra
ndom Noob
500
Crush Upper A Arm
Tubes-DONE 0.1 days Sat 1/5/13 Sat 1/5/13 90
Kyle
VanAllen 500
Upper A Arm Threaded
Inserts-DONE 1.5 days Fri 1/4/13 Sat 1/5/13 64
Lathe,Rand
om Noob 500
Notch Upper A Arm
Tubes-DONE 1.5 days Sat 1/5/13
Sun
1/6/13 91
Grinder,Kyl
e VanAllen 500
Weld Upper A Arm
Assembly 1 day
Sun
1/6/13
Thu
1/10/13 94,93,92
Tig
Welder,Kyle
VanAllen
500
Heat Treat Upper A Arm 1 day Sat 2/2/13 Sat 2/2/13
Furnace,Kyl
e VanAllen 500
Assemble Rod Ends and
Spherical Bearings 1 day
Thu
2/14/13
Thu
2/14/13 96,66
Kyle
VanAllen 500
Rear Uprights 25.38 days Sat
2/16/13
Thu
3/21/13 500
Machine Part 10 days Sat
2/16/13
Sat
3/16/13
Kyle
VanAllen 500
Drill Bolt Holes 1.63 days Sat
3/16/13
Thu
3/21/13 74
Mill,Kyle
VanAllen 500
Insert Bearing 0.5 days Thu
3/21/13
Thu
3/21/13 74
Kyle
VanAllen 500
Drivetrain 102.75 days? Thu
12/6/12
Sat
3/23/13 34
500
Engine Crush Cans 1.38 days Thu
12/6/12
Sat
12/8/12 65
Mill,Matt
Myers 500
(Un)Bolt Wheels 0.1 days Mon
12/10/12
Mon
12/10/12
Random
Noob 500
Gearbox Tube Inserts 43.6 days Thu
12/6/12
Sun
1/6/13 500
Drill Holes In Gearbox
Tube 2 days
Thu
12/6/12
Mon
12/10/12 115
Hand
Drill,Matt
Myers
500
Weld Gearbox Tube
Inserts 0.5 days
Mon
12/10/12
Mon
12/10/12 243 Scott Frey 500
Machine Gearbox Tube
Inserts-DONE 1.5 days Fri 1/4/13
Sun
1/6/13 64
Lathe,Nick
Bonafede 500

65
Shifter Linkage 2.75 days Sat 2/2/13 Thu
2/7/13
Plasma
Cutter,Drill
Press,Tig
Welder,Mat
t
Myers,Scott
Frey
990
Gas Tank Tabs 3.95 days? Sat
2/2/13
Thu
2/7/13 500
Gas Tank Tabs 0 days? Sat 2/2/13 Sat 2/2/13
500
Cut Gas Tank Tabs 0.3 days Sat 2/2/13 Sat 2/2/13 64
Cutoff
Wheel,Rand
om Noob
500
Drill Hole - Gas Tank Tabs 0.3 days Sat 2/2/13 Sat 2/2/13 236
Drill
Press,Rand
om Noob
500
Weld Gas Tank Tabs 0.6 days Tue
2/5/13
Thu
2/7/13 237
Tig
Welder,Sco
tt Frey
500
O) Throttle Cable 7 days Sat 2/2/13 Sat 2/9/13
Delivery
Services 995
Throttle Cable Guide
Dowels 2.03 days
Sat
2/9/13
Tue
2/12/13 500
Machine Throttle Cable
Guide Dowels 0.63 days Sat 2/9/13 Sat 2/9/13
Lathe,Matt
Myers 995
Weld Throttle Cable
Guide Dowels 0.75 days Sat 2/9/13
Tue
2/12/13 247
Tig
Welder,Sco
tt Frey
995
Drip Pan 1 day Sat 2/9/13 Sat
2/16/13
Random
Noob 950
Front Hubs 0.2 days Sat
2/16/13
Sat
2/16/13
Random
Noob 970
Engine 25.48 days Mon
1/14/13
Sat
2/16/13 500
Order Engine 0 days Mon
1/14/13
Mon
1/14/13 62
Matt
Myers,Nick
Bonafede
500
Test Engine 0.5 days Sat
2/16/13
Sat
2/16/13
Matt
Myers,Nick
Bonafede
980
Mount Engine 0.1 days Sat
2/16/13
Sat
2/16/13 214
Random
Noob 985
(Un)Bolt CVT 0.2 days Sat
2/16/13
Tue
2/19/13 215
500
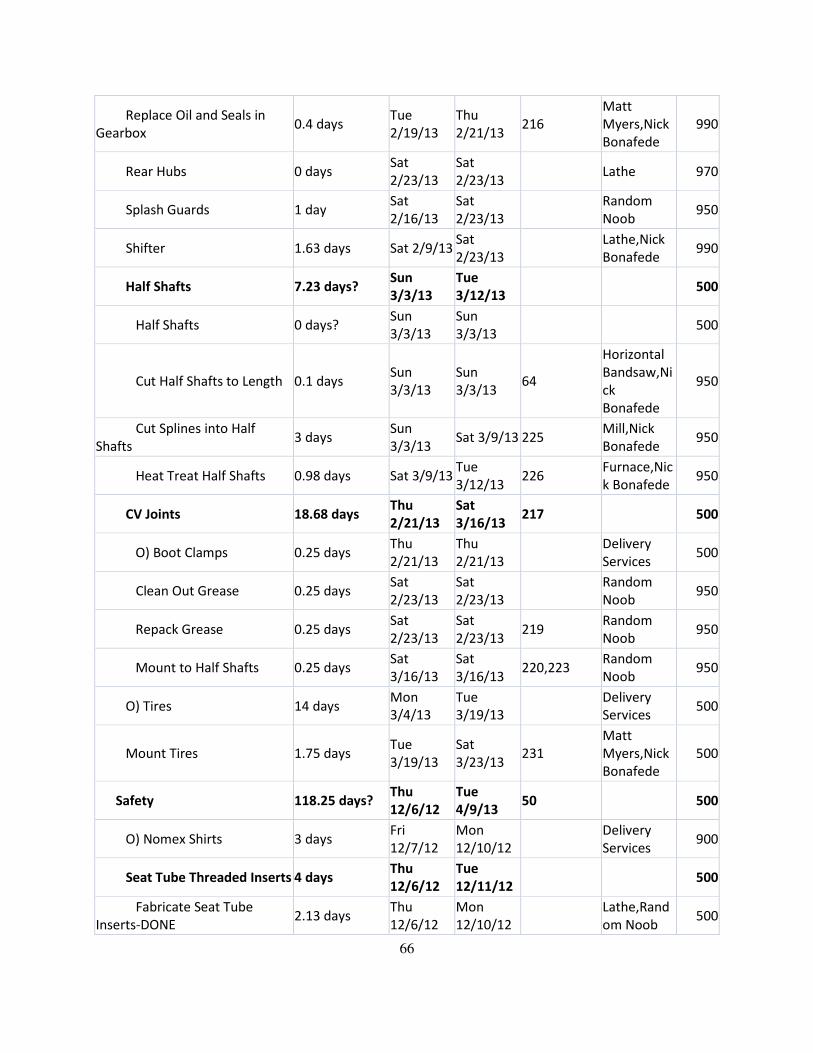
66
Replace Oil and Seals in
Gearbox 0.4 days
Tue
2/19/13
Thu
2/21/13 216
Matt
Myers,Nick
Bonafede
990
Rear Hubs 0 days Sat
2/23/13
Sat
2/23/13 Lathe 970
Splash Guards 1 day Sat
2/16/13
Sat
2/23/13
Random
Noob 950
Shifter 1.63 days Sat 2/9/13 Sat
2/23/13
Lathe,Nick
Bonafede 990
Half Shafts 7.23 days? Sun
3/3/13
Tue
3/12/13 500
Half Shafts 0 days? Sun
3/3/13
Sun
3/3/13 500
Cut Half Shafts to Length 0.1 days Sun
3/3/13
Sun
3/3/13 64
Horizontal
Bandsaw,Ni
ck
Bonafede
950
Cut Splines into Half
Shafts 3 days
Sun
3/3/13 Sat 3/9/13 225
Mill,Nick
Bonafede 950
Heat Treat Half Shafts 0.98 days Sat 3/9/13 Tue
3/12/13 226
Furnace,Nic
k Bonafede 950
CV Joints 18.68 days Thu
2/21/13
Sat
3/16/13 217
500
O) Boot Clamps 0.25 days Thu
2/21/13
Thu
2/21/13
Delivery
Services 500
Clean Out Grease 0.25 days Sat
2/23/13
Sat
2/23/13
Random
Noob 950
Repack Grease 0.25 days Sat
2/23/13
Sat
2/23/13 219
Random
Noob 950
Mount to Half Shafts 0.25 days Sat
3/16/13
Sat
3/16/13 220,223
Random
Noob 950
O) Tires 14 days Mon
3/4/13
Tue
3/19/13
Delivery
Services 500
Mount Tires 1.75 days Tue
3/19/13
Sat
3/23/13 231
Matt
Myers,Nick
Bonafede
500
Safety 118.25 days? Thu
12/6/12
Tue
4/9/13 50
500
O) Nomex Shirts 3 days Fri
12/7/12
Mon
12/10/12
Delivery
Services 900
Seat Tube Threaded Inserts 4 days Thu
12/6/12
Tue
12/11/12 500
Fabricate Seat Tube
Inserts-DONE 2.13 days
Thu
12/6/12
Mon
12/10/12
Lathe,Rand
om Noob 500

67
Drill Holes In Seat Tube-
DONE 0.5 days
Mon
12/10/12
Mon
12/10/12 120
Hand
Drill,Ryan
Slein
500
Weld Seat Tube Inserts-
DONE 0.5 days
Tue
12/11/12
Tue
12/11/12 184,185
Scott
Frey,Tig
Welder
500
O) Fire Extinguisher 5 days Fri
12/7/12
Wed
12/12/12
Delivery
Services 980
Fire Extinguisher Mount 0.5 days Wed
12/12/12
Wed
12/12/12 106,192
Drill
Press,Rand
om Noob
750
Fabricate Siren Mount 0.5 days Fri 1/4/13 Sat 1/5/13 64
Cutoff
Wheel,Shee
t Metal
Shear,Rand
om Noob
970
Mount Backup Siren 0.1 days Sat 1/5/13 Sat 1/5/13 205 Random
Noob 800
Seat 0.1 days Sat 2/9/13 Sat 2/9/13 183 Random
Noob 500
Fabricate Brake/Backup
Light Mount 0.5 days Sat 2/9/13 Sat 2/9/13 64
Sheet Metal
Shear,Cutof
f
Wheel,Rand
om Noob
900
Mount Brake Light 0.1 days Sat 2/9/13 Sat 2/9/13 199 Random
Noob 800
Mount Backup Light 0.1 days Sat 2/9/13 Sat 2/9/13 199 Random
Noob 800
Seat Belt Tabs 32.63 days Fri 1/4/13 Thu
2/14/13 500
Cut Seat Belt Tabs 0.6 days Fri 1/4/13 Sat 1/5/13 64
Plasma
Cutter,Rand
om Noob
500
Drill Hole - Seat Belt Tabs 0.3 days Sat 1/5/13 Sat 1/5/13 189
Drill
Press,Rand
om Noob
500
Weld Seat Belt Tabs 0.6 days Sat 2/9/13 Thu
2/14/13 190
Tig
Welder,Sco
tt Frey
500
Transponder Tab(s) 3.48 days Sat
2/9/13
Thu
2/14/13 500
Cut Transponder Tab(s) 0.3 days Sat 2/9/13 Sat 2/9/13 64 Plasma
Cutter,Rand600

68
om Noob
Drill Hole - Transponder
Tab(s) 0.3 days Sat 2/9/13 Sat 2/9/13 208
Drill
Press,Rand
om Noob
600
Weld Transponder Tab(s) 0.6 days Sat 2/9/13 Thu
2/14/13 209
Tig
Welder,Sco
tt Frey
600
Brake Light Wiring 1 day Tue
2/12/13
Thu
2/14/13 198 Ryan Slein 800
O) Seat Belt 5 days Sat 2/9/13 Thu
2/14/13
Delivery
Services 950
Verify Helmets 0.1 days Sat
2/16/13
Sat
2/16/13
Random
Noob 850
Verify Radios 1 day Sat 2/9/13 Sat
2/16/13
Random
Noob 800
Radio Box Mount 1 day Sat 2/9/13 Sat
2/16/13
Drill
Press,Cutoff
Wheel,Rand
om Noob
750
Mount Transponder 0.1 days Sat
2/16/13
Sat
2/16/13 207
Random
Noob 600
Backup Light Wiring 1 day Tue
2/12/13
Sat
2/16/13 202 Ryan Slein 800
Radio Box 3 days Sat 2/9/13 Fri 3/1/13
Random
Noob 800
Safety 0 days? Tue
4/9/13
Tue
4/9/13 500
Panels 88.45 days? Sat
1/5/13
Thu
4/25/13 58
500
Throttle Plate Cover 0.5 days Sat
2/16/13
Sat
2/16/13
Cutoff
Wheel,Rand
om Noob
400
False Floor 11.03 days Sat
2/2/13
Sat
2/16/13 500
Cut False Floor 1.13 days Sat 2/2/13 Sat 2/9/13
Sheet Metal
Shear,Rand
om Noob
900
Bend False Floor 1.78 days Sat 2/9/13 Sat
2/16/13 283
Sheet Metal
Brake,Rand
om Noob
900
Firewall 15.63 days Sat
2/2/13
Sat
2/23/13 500
Firewall Template 1 day Sat 2/2/13 Sat 2/9/13
Random
Noob 500

69
Cut Firewall 1 day Sat
2/16/13
Sat
2/23/13 253,64
Random
Noob 900
Skid Plates 22 days Sat
2/9/13
Sat
3/9/13 500
Nose Plate 10.88 days Sat 2/9/13 Sat
2/23/13
Composite
Room[50%]
,Ryan Slein
990
Belly Pan 22 days Sat
2/9/13
Sat
3/9/13 500
Belly Pan Template 0.5 days Sat 2/9/13 Sat 2/9/13
Ryan Slein 950
Layup Belly Pan 2.63 days Sat 2/9/13 Sat
2/16/13 276
Composite
Room[50%]
,Ryan Slein
990
Belly Pan Tabs 5.63 days Sun
3/3/13
Sat
3/9/13 500
Cut Belly Pan 0.6 days Sun
3/3/13
Tue
3/5/13
Plasma
Cutter,Rand
om Noob
800
Drill Holes - Belly Pan 0.5 days Tue
3/5/13 Sat 3/9/13 279
Drill
Press,Rand
om Noob
800
Weld Belly Pan 0.3 days Sat 3/9/13 Sat 3/9/13 280
Tig
Welder,Sco
tt Frey
800
CVT Cover 6 days Tue
3/5/13
Tue
3/12/13 500
Cut CVT Cover Mold 2 days Tue
3/5/13 Sat 3/9/13
Ryan Slein 700
Layup CVT Cover 1 day Sat 3/9/13 Tue
3/12/13 286
Composite
Room[50%]
,Ryan Slein
700
Body Panels 12.25 days Sun
3/3/13
Tue
3/19/13 500
Body Panel Tabs 1.15 days Sun
3/3/13
Tue
3/5/13 500
Cut Body Panel Tabs 0.3 days Sun
3/3/13
Sun
3/3/13 64
Plasma
Cutter,Rand
om Noob
600
Drill Hole - Body Panel
Tabs 0.3 days
Sun
3/3/13
Sun
3/3/13 259
Drill
Press,Rand
om Noob
600
Weld Body Panel Tabs 0.33 days Sun
3/3/13
Tue
3/5/13 260
Tig
Welder,Sco
tt Frey
600

70
Body Panel Templates 1 day Sun
3/3/13
Tue
3/5/13 Ryan Slein 700
Layup Body Panels 3.5 days Tue
3/12/13
Tue
3/19/13 256
Composite
Room,Ryan
Slein
700
Number Panels 61.28 days? Sat
1/5/13
Sat
3/23/13 500
Number Standoffs 0.1 days Sun
3/3/13
Sun
3/3/13
Random
Noob 300
Number Panel Tabs 48.78 days? Sat
1/5/13
Thu
3/7/13 500
Cut Number Panel Tabs 0.3 days Sat 1/5/13 Sat 1/5/13 64
Plasma
Cutter,Rand
om Noob
500
Drill Hole - Number
Panel Tabs 0.3 days Sat 1/5/13 Sat 1/5/13 268
Drill
Press,Rand
om Noob
500
Weld Number Panel
Tabs 0.3 days Sat 1/5/13 Sat 1/5/13 269
Tig
Welder,Sco
tt Frey
500
Number Panel Tabs 0 days? Sun
3/3/13
Sun
3/3/13 500
Number Panel Tabs 0 days? Thu
3/7/13
Thu
3/7/13 500
Number Panel Templates 1 day Sun
3/3/13 Sat 3/9/13
Random
Noob 500
Numbers 1.13 days Sun
3/3/13 Sat 3/9/13
Scroll
Saw,Rando
m Noob
500
Layup Number Panels 3.25 days Sat 3/9/13 Sat
3/23/13 263
Composite
Room[50%]
,Random
Noob
500
Nose Cover 88.15 days? Sat
1/5/13
Thu
4/25/13 500
Nose Cover Tabs 0.9 days Sat
1/5/13
Sat
1/5/13 500
Cut Nose Cover Tabs 0.3 days Sat 1/5/13 Sat 1/5/13 64
Plasma
Cutter,Rand
om Noob
500
Drill Hole - Nose Cover
Tabs 0.3 days Sat 1/5/13 Sat 1/5/13 295
Drill
Press,Rand
om Noob
500
Weld Nose Cover Tabs 0.3 days Sat 1/5/13 Sat 1/5/13 296 Tig 500

71
Welder,Sco
tt Frey
Nose Cover 0 days? Sun
3/3/13
Sun
3/3/13 500
Nose Cover Template 0.1 days Sun
3/3/13
Sun
3/3/13
Random
Noob 500
Layup Nose Cover 3.23 days Sun
3/3/13
Sat
3/16/13 292
Composite
Room[25%]
,Random
Noob
500
Nose Cover 0 days? Thu
4/25/13
Thu
4/25/13 500
Brakes 140.38 days? Thu
12/6/12
Thu
5/9/13 26
500
Front 75.88 days Thu
12/6/12
Sat
2/16/13 500
O) Front Hubs 0 days Thu
12/6/12
Thu
12/6/12 69
Delivery
Services 500
O) Front Calipers 0 days Thu
12/6/12
Thu
12/6/12 69
Delivery
Services 500
O) Front Master Cylinder 0 days Thu
12/6/12
Thu
12/6/12 69
Delivery
Services 500
O) Pressure Switches 0 days Thu
12/6/12
Thu
12/6/12 69
Delivery
Services 500
O)Front Rotors 0 days Thu
12/6/12
Thu
12/6/12 69
Delivery
Services 500
Front Caliper Mount 6 days Fri 1/4/13 Sat 2/2/13 64 Mill,Ryan
Flatland 500
Pedals 35.38 days Fri 1/4/13 Sat
2/16/13 500
Fabricate Pedal Box 1 day Fri 1/4/13 Sat
1/5/13 500
Cut Pedal Box Tubes 0.5 days Fri 1/4/13 Fri 1/4/13 64
Horizontal
Bandsaw,Ra
ndom Noob
500
Weld Pedal Box 0.5 days Sat 1/5/13 Sat 1/5/13 133
Tig
Welder,Sco
tt Frey
500
Fabricate Brake Pedal 35.38 days Fri 1/4/13 Sat
2/16/13 500
Cut Brake Pedal Sheet 0.5 days Fri 1/4/13 Thu
1/17/13 64
Horizontal
Bandsaw,Ry
an Flatland
500
Bend Brake Pedal 0.25 days Thu Thu 136 Ryan 500

72
Sheet 2/14/13 2/14/13 Flatland
Drill Brake Pedal Sheet 0.5 days Thu
2/14/13
Sat
2/16/13 137
Mill,Ryan
Flatland 500
Weld Brake Pedal
Sheet 0.25 days
Sat
2/16/13
Sat
2/16/13 138
Tig
Welder,Sco
tt Frey
500
Fabricate Gas Pedal 32.58 days Sun
1/6/13
Sat
2/16/13 500
Cut Gas Pedal Sheet 0.5 days Sun
1/6/13 Sat 2/9/13 64
Plasma
Cutter,Ryan
Flatland
500
Bend Gas Pedal Sheet 0.25 days Thu
2/14/13
Thu
2/14/13 141
Ryan
Flatland 500
Drill Gas Pedal Sheet 0.5 days Thu
2/14/13
Sat
2/16/13 142
Mill,Ryan
Flatland 500
Weld Gas Pedal Sheet 0.25 days Sat
2/16/13
Sat
2/16/13 143
Tig
Welder,Sco
tt Frey
500
Rear 76.55 days Thu
12/6/12
Tue
2/19/13 500
O) Rear Rotor(s) 0 days Thu
12/6/12
Thu
12/6/12 69
Ryan
Flatland 500
O) Rear Caliper 0 days Thu
12/6/12
Thu
12/6/12 69
Ryan
Flatland 500
(Un)Bolt Rear Master
Cylinder 0.1 days Sat 1/5/13 Sat 1/5/13 132
Random
Noob 500
Rear Rotor Carrier 4 days Thu
12/6/12
Thu
1/17/13 65
Lathe,Ryan
Flatland 500
Recycle Bias Bar 0.1 days Sat
2/16/13
Sat
2/16/13 146,135,140
Random
Noob 500
Rear Caliper Mount 36.05 days Fri 1/4/13 Tue
2/19/13 500
Cut Rear Caliper Mount
Sheet Steel 0.5 days
Sun
1/6/13 Sat 2/9/13 64
Plasma
Cutter,Ryan
Flatland
500
Weld Rear Caliper
Mount Sheet steel 0.38 days Sat 2/9/13
Tue
2/12/13 152
Tig
Welder,Sco
tt Frey
950
Inserts 33.48 days Fri 1/4/13 Thu
2/14/13 500
Machine Rear Caliper
Inserts 2 days Fri 1/4/13
Sat
1/19/13 64
Lathe,Ryan
Flatland 500
Drill Rear Caliper
Insert Holes 1 day
Tue
1/22/13
Thu
2/14/13 158
Hand
Drill,Ryan 500

73
Flatland
Weld Rear Caliper
Inserts 0.25 days
Thu
2/14/13
Thu
2/14/13 159
Tig
Welder,Sco
tt Frey
900
Cut Rear Caliper Mount
Tubes 0.2 days
Tue
2/12/13
Sat
2/16/13 153
Horizontal
Bandsaw,Ra
ndom Noob
500
Notch Rear Caliper
Mount Tubes 0.63 days
Sat
2/16/13
Sat
2/16/13 154
Grinder,Rya
n Flatland 500
Weld Rear Caliper
Mount Tubes 0.25 days
Sat
2/16/13
Tue
2/19/13 155
Scott
Frey,Tig
Welder
500
Brake Lines 70.13 days? Sat
2/9/13
Thu
5/9/13 500
Brake Lines 0 days? Sat 2/9/13 Sat 2/9/13
500
O) Front Soft Brake Line 0 days Sat 2/9/13 Sat 2/9/13 70 Ryan
Flatland 500
Front Split Line 1 day Sat 2/9/13 Thu
2/21/13 70,146
Flaring
Tool,Ryan
Flatland
500
Run Rear Line 0.75 days Sat 2/9/13 Thu
2/21/13 70,146
Flaring
Tool,Ryan
Flatland
500
Brake Lines 0 days? Thu
5/9/13
Thu
5/9/13 500
Assemble 2 days Thu
5/9/13
Sat
5/11/13
72,105,123,1
67,180,211,2
51,97,100,11
7,149,147,16
5,170,204,23
2,257
500

74
Appendix H. Step 6.1: Deliverable Design Decisions 2012
Frame
Action
Codes Duration
Legend
Firewall Tubes O 2 weeks
Action
Action
Code
Front Floor Tubes F 4 hours
Order O
Nose Section Tubes F 12 hours
Fabricate F
Front Suspension Tubes F 12 hours
Reuse R
Front Down Tubes F 2 days
Side Impact Tubes F 4 hours
Rear Floor Tubes F 3 hours
Rear Triangulation Tubes F 5 hours
Fore-Aft Bracing Tubes F 6 hours
Gearbox Tubes F 3 hours
Rear Suspension/Bumper
Tubes F 6 hours
Suspension Tabs F 7 days
Steering Mount Tubes F 2 hours
Pedal Mount Tube F 2 hours
Seat Mount Tube F 1 hour
Engine Tubes F 2 hours
Anti-Submarine Tube F 1 hour
Paint Chassis F 1 day
Suspension
Action
Codes
Weld Upper A-Arms F .5 hours
Notch Tubes F 1.5 days
Upper Bearing Holder O 7 days
Upper Threaded Inserts F 1 day
Weld Lower A-Arms F .5 hours
Lower Bearing Holder O 7 days
Shock Mount Tab F 2 days
Lower A-Arm Bushing Inserts F 2 days
Lower A-Arm Bushings F 1 days
Rear Control Links F 4 days
Front Shocks R .5 hour
Rear Shocks R .5 hour
Front Uprights R 2 hours
Rear Uprights F 1 month
Brakes Action

75
Codes
Gas Pedal F 8 hours
Brake Pedal F 8 hours
Front Master Cylinder O 1 month
Rear Master Cylinder R .5 hours
Bias Bar R .5 hours
Front Calipers O 1 month
Front Caliper Mount F 3 days
Rear Caliper(s) O 1 week
Front Soft Brake Lines O 1 week
Front Split Line F 3 hours
Rear Run Line F 3 hours
Front Rotors O 1 month
Rear Rotor(s) O 1 month
Rear Rotor Mount F 10 hours
Rear Caliper Mount F 5 hours
Pedal Box F 6 hours
Front Caliper Line Tabs F 1 hour
Pressure Switches O 2 days
Brake Bleeding F 3 hours
Drivetrain
Action
Codes
Duration
(days)
Engine O Jan-13
CVT R 0.2
Gearbox R 0.2
CV Joints R 0.5
Half Shafts F 1
Front Hubs R 0.2
Rear Hubs O 14
Wheels R 0.1
Tires O 14
Engine Crush Cans F 1
Gearbox Tube Threaded Inserts F 1
Throttle Cable O 7
Throttle Cable Guide Dowels F 0.5
Shifter F 1
Shifter Linkage F 1
Gas Tank Tabs F 0.5
Splash Guards F
Drip Pan F
Gas Tank O 14

76
Steering Action
Codes
Rack and Pinion R 4 hours
Upper Trunion Blocks F 1 day
Lower Trunion Blocks F 2 days
Steering Stops F 2 hours
Tie Rods F 3 hours
Steering Wheel O 3 days
Steering Shaft O 3 days
Bearing Holder O 1 day
Bearing O 3 days
U Joint O 3 days
Quick Release O 3 days
Safety
Action
Codes
Seat R 1 day
Seat Tube Threaded Inserts F 4 hours
Seat Belt O 5 days
Seat Belt Tabs F 1 day
Fire Extinguisher O 5 days
Fire Extinguisher Mount F 4 hours
Helmets R 0
Radios R 0
Radio Box F 3 days
Radio Box Mount F 4 hours
Brake Light R .5 hour
Brake/Backup Light Mount F 4 hours
Brake Light Wiring F 1 day
Nomex Shirts O 3 days
Backup Light R .5 hours
Backup Light Wiring F 1 day
Backup Siren R .5 hour
Siren Mount F 4 hours
Transponder R .5 hours
Transponder Tab(s) F 2 hours
Panels
Action
Codes
Nose Skid Plate F 5 days
Belly Pan Skid Plate F 5 days
Skid Plate Tabs F 1 day
Body Panels F 6 days

77
Firewall F 2 days
Body Panel Tabs F 2 days
CVT Cover F 4 days
False Floor F 2 days
Throttle plate cover F 1 day
Nose Cover F 2 days
Nose Cover Tabs F 2 hours
Number Display Panel(s) F 2 days
Numbers F 1 day
Number Standoffs R 1 hour

78
Appendix I. Step 6.2: Microsoft Project 2010 Walkthrough
I highly suggest watching the “Learn Microsoft Project In 16 minutes Flat” video posted on YouTube
or another similar video. It will explain the basics as they are described here with a video to follow. If
you need relevant examples, read the rest of this walkthrough and/ or the “2012 Baja Schedule”.
http://www.youtube.com/watch?v=sPwURRG9_Gs
Step 1: Set baseline calendars
Go to the Project tab and click the “Project Information” button. Set the project start date to the first day
of Fall quarter. Next, edit the project calendar. Click the “Change Working Time” button. It is easiest if
you set all days as work days. Look up major academic holidays (Winter Break, Spring Break, etc.) and
enter them as exceptions. Set a new schedule for each major holiday. Use the resource calendars to
adjust availabilities of individuals (see Enter Resources section).
Step 2: The Work Breakdown Structure (WBS)-Finish before PDR
A work breakdown structure is breakdown of the Baja Project. For example, Baja consists of six basic
sub-systems: Frame, suspension, drivetrain, brakes, panels, and safety equipment. Let’s use suspension
as an example. Suspension can be broken down into front and rear and again by upper and lower. Then,
each component can be broken down into parts. For example, the front upper A-Arm consists of two
arms, a bearing holder, and two threaded inserts.
The arms, bearing holder, and threaded inserts are considered low level tasks. Low level tasks are tasks
that have been broken down enough that time and cost estimations can be ACCURATELY created.

79
Tasks that have sub-tasks are called summary tasks (look at the model for clarification). Each breakdown
is represented by a new line and an indentation.
Have each sub-system lead fill out a “Deliverable Design Decision” sheet by following the “Deliverable
Design Decisions 2012” example. Use your knowledge of the car’s manufacturing and the deliverable
design decisions from each sub-system lead to create a WBS for the entire Baja Project. Look at the 2012
Baja Schedule for an idea of how detailed to make the list. Here is how the work breakdown structure
would look for this example:
Model:
Baja Project Suspension Front Lower Upper Manufacture Arms…………….… (summary task) Cut arms to length…… (low –level task) Notch arms Cut Bearing Holder Cut Threaded Inserts Weld Upper A-Arm assembly Rear Drivetrain
Make sure to include ordering parts, the cost report, and the design report as tasks. Under the Task tab,
next to the font choice, you will see green arrows. These arrows adjust the breakdown level by moving
the indent.
Step 3: Estimate task durations – Finish after PDR
This step is fairly straightforward. The first thing to do is highlight all tasks, right click and click
automatically schedule tasks. This makes sure that all summary tasks are automatically calculated. Meet
with each sub-system lead to estimate durations for each low level task. Durations can be based on past
experience, but it is preferred if the previous year’s sign out sheet is used to estimate the duration of

80
similar tasks. Enter the durations for each low level task. You can also use the task start and finish date to
automatically calculate the task durations. Summary tasks are automatically calculated by adding up the
low-level tasks. As such, since Baja Project is the main summary task, its total duration and finish date
will be automatically calculated.
Step 4: Enter predecessors – Finish before CDR
Each task has a corresponding number to the left of it in the margin. If one task must be completed before
another task, the task number must be entered in the predecessors’ column. For example, the A-arm can’t
be welded until all components are complete. If ordering welding rod has a task number of 1,
manufacturing arms has a task number of 3, cut bearing holder has a task number of 4, and cut threaded
inserts has a task number of 6, then welding the A-arm assembly has predecessors 1, 3, 4, and 6.
Step 5: Enter task priorities – Finish before CDR
Meet with the team lead to consider each task’s priority. Higher priorities are assigned to tasks that are
more important than others. Consider assigning a higher priority to tasks that need to be completed
before the Go/No Go date. Make sure that you are in the Gantt Chart view. Find an empty column, click
the arrow to view the dropdown menu, scroll down, and click Priority. Assign numerical values for the
priority of each task.
Step 6: Enter resources – Finish before CDR
All tasks require resources. Resources are defined as anything that will be needed to complete the task.
Part manufacturing for Baja requires a tool/ machine, a person, and material for each task. First you must
go to the Task tab and click the button that says “Gantt Chart”. You will notice a drop down menu
appears where you can click Resource Sheet.

81
Enter the sub-system leads, team lead, team manager, and all basic machines and tools as resources.
Look at the “2012 Baja Schedule” to see how it should look. Then enter the number of each resource that
you have. 100% means that you have one resource. For example, three lathes would be entered as 300%.
You can double click people as well as machines and edit their schedule to match their availabilities. Do
this by going to “Change Working Time”, click the “Work Weeks” tab, and filling in typical work weeks
for the individual.
Finally, go back to the Gantt-chart view and type in the amount of each resource needed to complete the
task under the Resource Names column.
You may notice little red stick figures to the left of the task. This means that one resource is over-
allocated. For example, there may only be one Joe Blo on your team, but Microsoft Project will schedule
Joe Blo as if he can do everything at once. Even though the number of Joe Blo’s has been set, Microsoft
Project won’t take into account the number of Joe Blo’s until you level resources. Go to the Resource tab
and click Level All. You may consider clicking leveling options and looking over the settings. It is
recommended that you allow task splitting since most tasks can be stopped and continued on another day.
Step 7: Monitor the schedule – Finish before CDR
Print a report of each person’s tasks to be completed on their due dates. Go to the “Project” tab, click the
“Reports” button, click the “Custom” button, scroll to the bottom of the pop-up list, click “Who Does
What When”, and click “Print”. Tape this list in the hangar so that all team members can see it.
Make sure that every team member fills out a sign-out sheet after each work day. Record the percent
complete of each task by double clicking the task and entering the information under percent complete.
After you entered all of the preceding information, a critical path was automatically created. The critical
path is a list of tasks which, if delayed, will delay the project completion date. This path is highlighted in
red in the Network Diagram view. This view is located under the task tab and can be found by clicking

82
the drop down menu under Gantt chart. Make sure that no task on the critical path is delayed, especially
if your project completion date is close to your Go/No Go date.

83
Appendix J. Step 7: CDR Template Slides Outline
� Put your name and sub-system name on this slide Relevant 3d views
� Don’t keep your audience in suspense � Include all relevant shots of the 3D model and any changes that were necessary
� Your system MUST have a Solidworks part file of every major deliverable in the car assembly
Brief PDR Review � Briefly describe purpose, goals, and major deliverables of the sub-system � Briefly describe all design alternatives considered for each major deliverable � Briefly ID the alternative decision and WHY it was chosen
� Include design Criteria given by the team lead � Include relevant PDR backup slides in case you are asked to elaborate
Team Goals � Specifically address how your system met team goals set by team Lead
� I.e. Weight, cost, serviceability, and design for manufacturability and assembly. � Include all formulas, theories, and/or methods used to achieve these results � System Goals
� Specifically address how your system meets all of the sub-system goals set by sub-system lead � I.e. Stiffness, Deflection, and Efficiency � Consider designed modes of failure (ask team lead)
� Ex: tie rods fail first in steering because they are cheap and easy to replace � Include all formulas, theories, and/or methods used to achieve these results
Parameters and Dimensions � Describe all relevant parameters and/or dimensions for your system
� Tables and part drawings may be useful in this case � Describe how you chose these dimensions and parameters
Packaging and Integration � Show how your system interacts with other systems
� Make sure that your system fits with surrounding systems on the car (packaging) � Make sure that your system functions well with all connected systems (integration)
Risk Analysis � Fill out the Risk Analysis Template (from team lead) � Include a description of all relevant risks to your system � On this slideshow, identify the risk events and their responses
� Ignoring an unlikely risk is NOT an option � Identify the contingencies in place if the risks occur
Budget � Include a budget for all fabricated or ordered deliverables
� Include all hardware (nuts, bolts, washers, studs, etc), fluids, etc. � This will become your order form and bill of materials
Questions � Pause for Questions

84
Appendix K. Benefit and Resource Quantification Algorithm
function br_index
clc; clear; close all;
%Predefinition ***Fill These in before running program*** %Enter total number on team, how many people have each type of skill, total
team hours, total team budget, & and all index weights. %From Team Lead team_num=17; %***ASK TEAM LEAD*** red_tag=10; %***ASK TEAM LEAD*** yellow_tag=4; %***ASK TEAM LEAD*** blue_tag=2; %***ASK TEAM LEAD*** welders=1; %***ASK TEAM LEAD*** team_budget=10000; %***ASK TEAM LEAD*** total_hrs=2000; %***ASK TEAM LEAD*** service_weight=.017; %***ASK TEAM LEAD*** manufacturing_weight=.058; %***ASK TEAM LEAD*** point_weight=1; %***ASK TEAM LEAD*** cost_weight=1; %***ASK TEAM LEAD***
%Sub-System Benefit: From Project Priority Matrix total_weighted_score=5000; %***ASK TEAM LEAD*** system_weighted_score=3000; %***ASK TEAM LEAD***
%LEAVE THE REST OF THE CODE ALONE
systime_red=0; systime_yellow=0; systime_blue=0; systime_weld=0; totalpart_time=0;
tpercent_red = (red_tag + yellow_tag + blue_tag + welders) / team_num; tpercent_yellow = (yellow_tag + blue_tag) / team_num; tpercent_blue = blue_tag / team_num; tpercent_weld = welders / team_num;
ttime_red = tpercent_red * total_hrs; ttime_yellow = tpercent_yellow * total_hrs; ttime_blue = tpercent_blue * total_hrs; ttime_weld = tpercent_weld * total_hrs;
%Before you start... fprintf('\n***BEFORE YOU START!!!***\n\n'); fprintf('1.) Have your team lead evaluate your sub-system benefit based on
the Project Priority Matrix\n'); fprintf('\n2.) Have your team lead fill in all spaces in the code area that
say "***ASK TEAM LEAD***" in green writing\n');

85
fprintf('\n3.) Finish your sub-system budget and add up all deliverable costs
that are due to design changes\n'); fprintf(' Ex: "Our sub-system decided to use a new kind throttle cable"
This is a CHANGING DESIGN\n'); fprintf(' Ex: "Our system decided to use the same rear caliper, but we
cannot reuse the old one. \n We need to buy a new one" This is NOT
A CHANGING DESIGN\n'); fprintf('\n4.) Estimate a decrease or increase in service time due to design
changes. \n Have old and new service times ready.\n'); fprintf(' Ex: Account for service times (assembly, adjustment, repair)
that could change as a result of the new designs.\n'); fprintf(' If bolting parts on will take the same time, you do not have
to account for wrench turning time.\n') fprintf('\n5.) Calculate the number of different parts by using the
deliverables section in your problem\n definition page and breaking every
component down by the number of parts to be made.\n'); fprintf(' Ex: An A-Arm May have a bearing holder, two tubes, and two
threaded inserts. There are THREE DIFFERENT PARTS\n') fprintf('\n6.) Estimate the total time each different part will take to
manufacture in hours\n'); fprintf('\n7.) Add up the total manufacturing time for your system\n'); fprintf(' Total System Hours = SUM(#DifferentParts*#PartsMade)\n'); fprintf(' Ex: Part 1: Time = 2 hours--> 2 parts needed\n'); fprintf(' Part 2: Time = 3 hours--> 3 parts needed\n'); fprintf(' Total System Hours = (2 hours*2 parts) + (3 hours*3 parts)=
13 hours\n'); fprintf('\n8.) Estimate the percent of the total time each different part
will take for each skill (red tag, welder, etc...)\n'); fprintf(' Ex: A part takes 1 hour to weld and 9 hours to mill--The part is
10 percent welder and 90 percent yellow tag\n'); fprintf('\n9.) Write all of the information down and give it to your team
manager for scheduling\n\n'); fprintf('\n***READ THE ABOVE TEXT BEFORE YOU START***\n');
%Enter your system traits system_cost=input('\nEnter the total CHANGING subsystem budget in USD(This is
Amurrica): $'); while system_cost>team_budget fprintf('Your system cost is more than the teams budget!') system_cost=input('\nEnter the total CHANGING subsystem budget(This is
Amurrica): $'); end
system_dur=input('\nEnter the total subsystem manufacturing hours(total part
times): '); old_svctime=input('\nEnter the old service time for your system (min): '); new_svctime=input('\nEnter the new service time for your system (min): '); num_parts=input('\nEnter the number of different parts: ');
%Enter part information-function input start while totalpart_time~=system_dur %Prevent part times from not being equal
to total time totalpart_time=0; for i=1:num_parts

86
ppercent_red=0; ppercent_yellow=0; ppercent_blue=0; ppercent_weld=0;
fprintf('\nConsider Part %d\n', i);
%Enter part times and skill percents part_name=input('What is the name of this part? ', 's'); part_time=input('Enter the total time for the part in hours: '); num_part=input('Enter the number of this part you will make: '); total_percent=100; edit=1; while total_percent~=100 || edit==1 %Prevent total time percent
from going over 100% fprintf('\nRed Tag: Basic grinding, sawing, shearing,
drilling, bending, and media blasting\n'); ppercent_red=input('Enter the percent of time which requires
a red tag: %'); if ppercent_red<100 fprintf('\nWelder: Estimate the time per part assuming
the welder is already setup\n'); ppercent_weld=input('Enter the percent of time which
requires a welder: %'); if ppercent_red+ppercent_weld<100 fprintf('\nYellow Tag: Estimate the time per part on
Lathes and Mills including setup\n') ppercent_yellow=input('Enter the percent of time which
requires a yellow tag: %'); if ppercent_red+ppercent_yellow+ppercent_weld<100 fprintf('\nBlue Tag: Estimate the time per part on CNC
Lathes and Mills including coding and setup\n'); ppercent_blue=input('Enter the percent of time which
requires a blue tag(CNC): %'); end end end
fprintf('\nPlease Review Traits For Part #%d: ', i); disp(part_name); fprintf('Part Manufacturing Time: %d Hours', part_time); fprintf('\nNumber of parts made: %d', num_part); fprintf('\nPart Percent Red: %d', ppercent_red); fprintf('\nPart Percent Yellow: %d', ppercent_yellow); fprintf('\nPart Percent Blue: %d', ppercent_blue); fprintf('\nPart Percent Weld: %d', ppercent_weld);
edit=input('\nWould you like to edit this information?(yes=1 or
no=2) ');
total_percent=ppercent_red+ppercent_yellow+ppercent_blue+ppercent_weld; if total_percent~=100 && edit==2 fprintf('\nTotal percent not equal to 100\n'); ppercent_red=0; %Reset part percents for edit
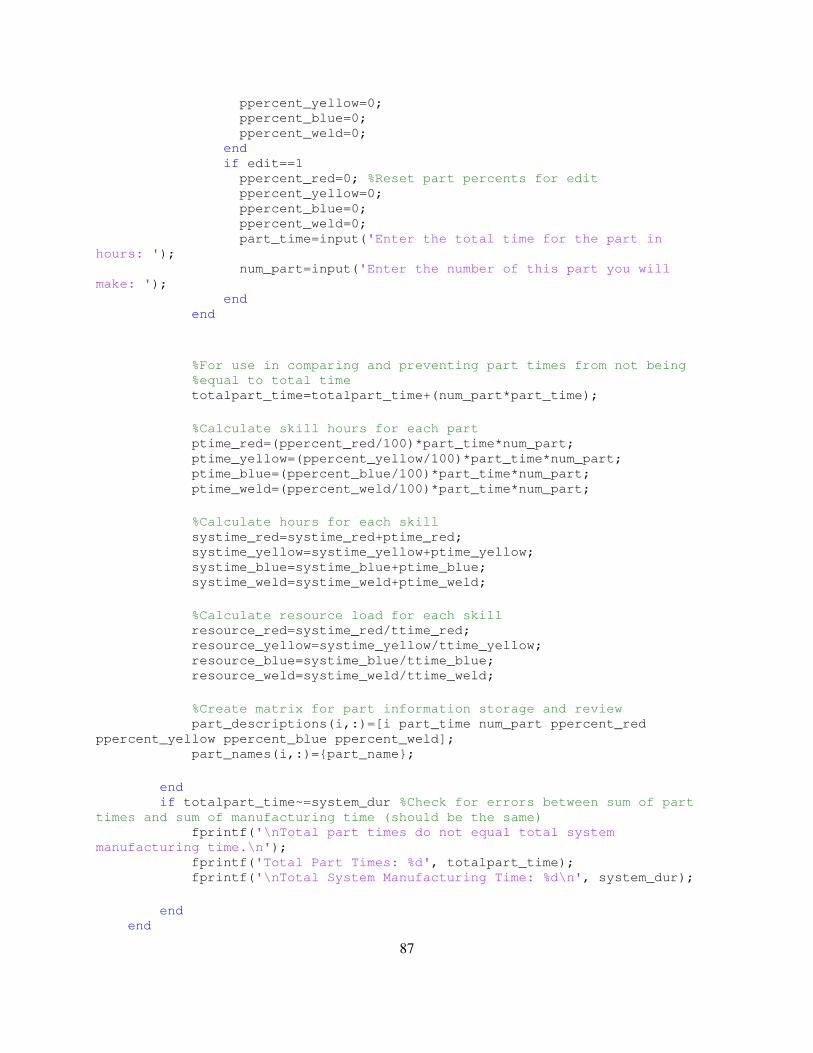
87
ppercent_yellow=0; ppercent_blue=0; ppercent_weld=0; end if edit==1 ppercent_red=0; %Reset part percents for edit ppercent_yellow=0; ppercent_blue=0; ppercent_weld=0; part_time=input('Enter the total time for the part in
hours: '); num_part=input('Enter the number of this part you will
make: '); end end
%For use in comparing and preventing part times from not being %equal to total time totalpart_time=totalpart_time+(num_part*part_time);
%Calculate skill hours for each part ptime_red=(ppercent_red/100)*part_time*num_part; ptime_yellow=(ppercent_yellow/100)*part_time*num_part; ptime_blue=(ppercent_blue/100)*part_time*num_part; ptime_weld=(ppercent_weld/100)*part_time*num_part;
%Calculate hours for each skill systime_red=systime_red+ptime_red; systime_yellow=systime_yellow+ptime_yellow; systime_blue=systime_blue+ptime_blue; systime_weld=systime_weld+ptime_weld;
%Calculate resource load for each skill resource_red=systime_red/ttime_red; resource_yellow=systime_yellow/ttime_yellow; resource_blue=systime_blue/ttime_blue; resource_weld=systime_weld/ttime_weld;
%Create matrix for part information storage and review part_descriptions(i,:)=[i part_time num_part ppercent_red
ppercent_yellow ppercent_blue ppercent_weld]; part_names(i,:)={part_name};
end if totalpart_time~=system_dur %Check for errors between sum of part
times and sum of manufacturing time (should be the same) fprintf('\nTotal part times do not equal total system
manufacturing time.\n'); fprintf('Total Part Times: %d', totalpart_time); fprintf('\nTotal System Manufacturing Time: %d\n', system_dur);
end end

88
%Calculate Resource indices time_index=(resource_red + resource_yellow + resource_blue +
resource_weld)*manufacturing_weight; cost_index=(system_cost/team_budget)*cost_weight; resource_index=time_index+cost_index;
%Calculate Benefit indices point_index=(system_weighted_score/total_weighted_score)*point_weight; svc_index=((old_svctime-new_svctime)/old_svctime)*service_weight; benefit_index=point_index+svc_index;
%Print Results fprintf('\nPlease review your Part Traits\n\n'); for i=1:num_parts fprintf('\nPart Name:'); disp(part_names(i,1)); fprintf('Part Time: %d Hours', part_descriptions(i,2)); fprintf('\nNumber of parts made: %d', part_descriptions(i,3)); fprintf('\nPart Percent Red: %d', part_descriptions(i,4)); fprintf('\nPart Percent Yellow: %d', part_descriptions(i,5)); fprintf('\nPart Percent Blue: %d', part_descriptions(i,6)); fprintf('\nPart Percent Weld: %d\n', part_descriptions(i,7)); end
fprintf('\nThe Benefit Index For Your Subsystem is: %.5f THEOS\n',
benefit_index); fprintf('The Resource Index For Your Subsystem is: %.5f THEOS\n',
resource_index);
fprintf('\nTypical High Benefit: 1.0167\n'); fprintf('Typical Low Benefit: -1.0028\n'); fprintf('Typical High Resource: 2.0200\n'); fprintf('Typical Low Resource: 1.3000e-004\n'); fprintf('\n***NOTE***\n THESE ARE TYPICAL RESULTS. YOUR RESULTS MAY
VARY, ESPECIALLY WHEN CHANGING INDEX WEIGHTS\n\n'); end

89
Appendix L. Benefit and Resource Quantification Algorithm Use Case
***BEFORE YOU START!!!***
1.) Have your team lead evaluate your sub-system benefit based on the Project Priority Matrix
2.) Have your team lead fill in all spaces in the code area that say "***ASK TEAM LEAD***" in green writing
3.) Finish your sub-system budget and add up all deliverable costs that are due to design changes
Ex: "Our sub-system decided to use a new kind throttle cable" This is a CHANGING DESIGN
Ex: "Our system decided to use the same rear caliper, but we cannot reuse the old one.
We need to buy a new one" This is NOT A CHANGING DESIGN
4.) Estimate a decrease or increase in service time due to design changes.
Have old and new service times ready.
Ex: Account for service times (assembly, adjustment, repair) that could change as a result of the new designs.
If bolting parts on will take the same time, you do not have to account for wrench turning time.
5.) Calculate the number of different parts by using the deliverables section in your problem
definition page and breaking every component down by the number of parts to be made.
Ex: An A-Arm May have a bearing holder, two tubes, and two threaded inserts. There are THREE DIFFERENT PARTS
6.) Estimate the total time each different part will take to manufacture in hours
7.) Add up the total manufacturing time for your system

90
Total System Hours = SUM(#DifferentParts*#PartsMade)
Ex: Part 1: Time = 2 hours--> 2 parts needed
Part 2: Time = 3 hours--> 3 parts needed
Total System Hours = (2 hours*2 parts) + (3 hours*3 parts)= 13 hours
8.) Estimate the percent of the total time each different part will take for each skill (red tag, welder, etc...)
Ex: A part takes 1 hour to weld and 9 hours to mill--The part is 10 percent welder and 90 percent yellow tag
9.) Write all of the information down and give it to your team manager for scheduling
***READ THE ABOVE TEXT BEFORE YOU START***
Enter the total CHANGING subsystem budget in USD(This is Amurrica): $1000
Enter the total subsystem manufacturing hours(total part times): 10
Enter the old service time for your system (min): 60
Enter the new service time for your system (min): 45
Enter the number of different parts: 2
Consider Part 1
What is the name of this part? Bearing Holder
Enter the total time for the part in hours: 2.5
Enter the number of this part you will make: 2
Red Tag: Basic grinding, sawing, shearing, drilling, bending, and media blasting

91
Enter the percent of time which requires a red tag: %50
Welder: Estimate the time per part assuming the welder is already setup
Enter the percent of time which requires a welder: %60
Please Review Traits For Part #1: Bearing Holder
Part Manufacturing Time: 2.50 Hours
Number of parts made: 2
Part Percent Red: 50
Part Percent Yellow: 0
Part Percent Blue: 0
Part Percent Weld: 60
Would you like to edit this information? (yes=1 or no=2) 2
Total percent not equal to 100
Red Tag: Basic grinding, sawing, shearing, drilling, bending, and media blasting
Enter the percent of time which requires a red tag: %50
Welder: Estimate the time per part assuming the welder is already setup
Enter the percent of time which requires a welder: %20
Yellow Tag: Estimate the time per part on Lathes and Mills including setup
Enter the percent of time which requires a yellow tag: %20
Blue Tag: Estimate the time per part on CNC Lathes and Mills including coding and setup

92
Enter the percent of time which requires a blue tag (CNC): %10
Please Review Traits For Part #1: Bearing Holder
Part Manufacturing Time: 2.50 Hours
Number of parts made: 2
Part Percent Red: 50
Part Percent Yellow: 20
Part Percent Blue: 10
Part Percent Weld: 20
Would you like to edit this information? (yes=1 or no=2) 2
Consider Part 2
What is the name of this part? Suspension Links
Enter the total time for the part in hours: 5
Enter the number of this part you will make: 2
Red Tag: Basic grinding, sawing, shearing, drilling, bending, and media blasting
Enter the percent of time which requires a red tag: %100
Please Review Traits For Part #2: Suspension Links
Part Manufacturing Time: 5 Hours
Number of parts made: 2
Part Percent Red: 100
Part Percent Yellow: 0
Part Percent Blue: 0
Part Percent Weld: 0

93
Would you like to edit this information? (yes=1 or no=2) 2
Total part times do not equal total system manufacturing time.
Total Part Times: 15
Total System Manufacturing Time: 10
Consider Part 1
What is the name of this part? Bearing Holder
Enter the total time for the part in hours: 5
Enter the number of this part you will make: 1
Red Tag: Basic grinding, sawing, shearing, drilling, bending, and media blasting
Enter the percent of time which requires a red tag: %100
Please Review Traits For Part #1: Bearing Holder
Part Manufacturing Time: 5 Hours
Number of parts made: 1
Part Percent Red: 100
Part Percent Yellow: 0
Part Percent Blue: 0
Part Percent Weld: 0
Would you like to edit this information? (yes=1 or no=2) 2
Consider Part 2
What is the name of this part? 5
Enter the total time for the part in hours: 1

94
Enter the number of this part you will make: 5
Red Tag: Basic grinding, sawing, shearing, drilling, bending, and media blasting
Enter the percent of time which requires a red tag: %100
Please Review Traits For Part #2: 5
Part Manufacturing Time: 1 Hours
Number of parts made: 5
Part Percent Red: 100
Part Percent Yellow: 0
Part Percent Blue: 0
Part Percent Weld: 0
Would you like to edit this information? (yes=1 or no=2) 2
Please review your Part Traits
Part Name: 'Bearing Holder'
Part Time: 5 Hours
Number of parts made: 1
Part Percent Red: 100
Part Percent Yellow: 0
Part Percent Blue: 0
Part Percent Weld: 0
Part Name: 'Links'
Part Time: 1 Hours
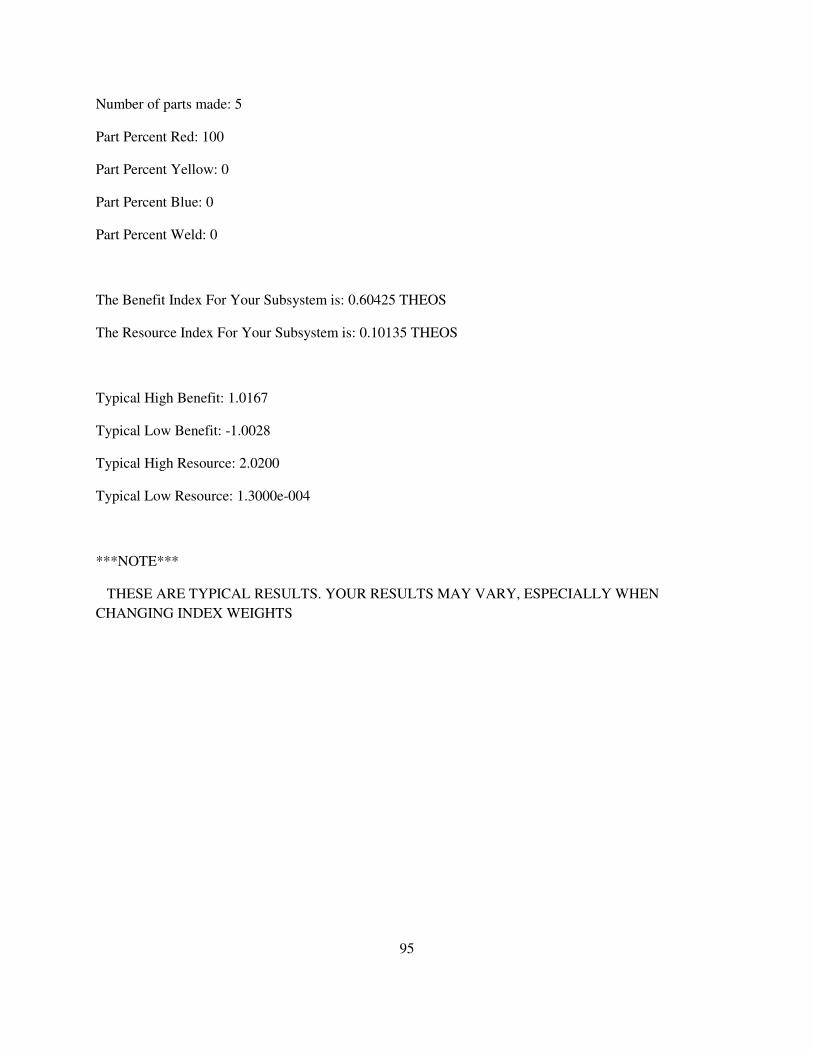
95
Number of parts made: 5
Part Percent Red: 100
Part Percent Yellow: 0
Part Percent Blue: 0
Part Percent Weld: 0
The Benefit Index For Your Subsystem is: 0.60425 THEOS
The Resource Index For Your Subsystem is: 0.10135 THEOS
Typical High Benefit: 1.0167
Typical Low Benefit: -1.0028
Typical High Resource: 2.0200
Typical Low Resource: 1.3000e-004
***NOTE***
THESE ARE TYPICAL RESULTS. YOUR RESULTS MAY VARY, ESPECIALLY WHEN CHANGING INDEX WEIGHTS

96
Appendix M. Step 7.1: How to Use the Benefit and Resource Program
IDEA:
The benefit and resource program is meant as a way to compare
design alternatives or sub-systems to each other. Sub-system
leads can choose the best design alternative before the PDR by
comparing the indexes that this program calculates. The team
lead can cut bad sub-system designs by comparing the index for
each sub-system.
This program is based on the idea of “best bang for the buck”.
Designs that have better performance (best bang) relative to
another AND have a lower resource usage (lowest buck) are the
better designs. Higher benefit indexes are better. Lower
resource indexes are better. See “Benefit and Resource Index
slides”.
Below are instructions for the sub-system leads and the team
leads. It will tell how to use the program for design
alternatives before the PDR or for sub-system cutting before the
CDR.

97
INSTRUCTIONS:
CDR:TEAM LEAD 1. Add up all of the sub-system manufacturing hours.
2. Add up all of the sub-system budgets
3. Use the CDR information to re-evaluate each sub-system using the sub-system priority matrix
4. Count the total number of people on the team that have a red, yellow, and blue tag as well as the number of welders
5. Open ‘br_index’ in MATLAB and fill out all numbers next to
the notes in green that say "%***ASK TEAM LEAD***" in green
writing. Use the numbers you calculated for steps 1-4.
a. If you feel lucky, play with the index weights
6. Send the program to all of your sub-system leads with all
of the new numbers
7. Once the sub-system leads follow the instructions under
“CDR: SUB-SYSTEM LEAD”, get the indexes from them. Compare
the indexes and, if needed, cut bad designs.
***Optional: Design Alternatives for PDR
PDR: SUB-SYSTEM LEAD
1. Open “br_index” program in MATLAB
2. Team Lead: Count the total number of people on the team
that have a red, yellow, and blue tag as well as the number
of welders and enter into program next to the notes in
green that say "%***ASK TEAM LEAD***" in green writing

98
3. Use your weighted design alternative matrix score (from PDR
slides) and put in place of “system_weighted_score”.
4. Use an estimate of your sub-system budget and put in place
of “team_budget”.
5. Use an estimate of your total sub-system manufacturing time
and put in place of “total_hrs”.
6. Press the green arrow (looks like a play button)
7. When prompted for the total number of different parts,
enter 1.
8. Use service times, part cost (instead of sub-system cost),
manufacturing time, and skill percent (see program prompt)
for the deliverable alternative.
9. Record the benefit and resource indexes
10. Repeat for all other alternatives being considered
11. Better alternatives will have a higher benefit and
lower resource index. Choose the better alternative to
proceed with the critical design review.
CDR:SUB-SYSTEM LEAD
1.) Have your team lead evaluate your sub-system benefit based
on the Project Priority Matrix
2.) Have your team lead fill in all spaces in the code area
that say "***ASK TEAM LEAD***" in green writing
3.) Finish your sub-system budget and add up all deliverable
costs that are due to design changes

99
Ex: "Our sub-system decided to use a new kind throttle cable"
This is a CHANGING DESIGN
Ex: "Our system decided to use the same rear caliper, but we
cannot reuse the old one. We need to buy a new one" This is
NOT A CHANGING DESIGN
4.) Estimate a decrease or increase in service time due to
design changes.
Have old and new service times ready.
Ex: Account for service times (assembly, adjustment, repair)
that could change as a result of the new designs.
If bolting parts on will take the same time, you do not have
to account for wrench turning time.
5.) Calculate the number of different parts by using the
deliverables section in your problem
definition page and breaking every component down by the
number of parts to be made.
Ex: An A-Arm May have a bearing holder, two tubes, and two
threaded inserts. There are THREE DIFFERENT PARTS
6.) Estimate the total time each different part will take to
manufacture in hours
7.) Add up the total manufacturing time for your system
Total System Hours = SUM(#DifferentParts * #PartsMade)
Ex: Part 1: Time = 2 hours--> 2 parts needed
Part 2: Time = 3 hours--> 3 parts needed
Total System Hours = (2 hours*2 parts) + (3 hours*3
parts)= 13 hours
8.) Estimate the percent of the total time each different part
will take for each skill (red tag, welder, etc...)
Ex: A part takes 1 hour to weld and 9 hours to mill--The part
is 10 percent welder and 90 percent yellow tag
9.) Write all of the information down and give it to your team
manager for scheduling

100
You may quit the program at any time by pressing CTRL+C,
HOWEVER ALL YOUR INFORMATION WILL BE LOST

101
Appendix N. Step 7.2: Benefit-Resource Slides Outline
Bang for the buck � There is limited time and budget � The team lead needs to know which designs to cut � No guarantee that your design will make it on the car
Quantifying bang for the buck � A program was made to help the team lead decide which designs to cut, if necessary � Designs must provide benefit � (serviceability, performance gains, etc.) � Designs must not use too many resources � (people, skills, money, time, etc.) � Bang for the buck is quantified
� Bang=Benefit � Buck=Resources
Good example � A frame redesign makes the drivetrain easier to service and cuts down the number of
tubes � This decreases service time and decreases sub-system cost � This design change will definitely go on the car
Bad example � A new suspension design decided that using carbon fiber would save a half pound � Using carbon fiber triples the cost of material and quadruples manufacturing time � There is no way that design change will go on the car
The program � All sub-system leads must use the program to quantify their design’s “bang for the buck” � How NOT to beat the program � No Lying � No Cheating � No Stealing � No “Cooking the Books” � No “Baiting the Hooks” � No Likewise Shady Dealings
How to use the program � Ask your team lead for the file � Open the file in Matlab � Locate and click the green arrow to run the program � Follow the instructions and prompts
How to beat the program � Meet your system goals from your project definition sheet � Reduce service times � Decrease the part manufacturing times � Design parts to use more red and yellow tag skills � Decrease the cost of your system � Only use this program for deliverables that you are changing � Recycled deliverables do not cost anything and will require little resources.

102

103
Appendix O. Step 7.3: Risk Analysis Template
Definitions:
Risk Event: Brainstorm generalized things that could go wrong with your sub-system.
I.e. May not pass rules, may break, may not have enough time to manufacture
Likelihood: Assign a value (1-5) which describes how likely the risk is to occur
Impact: Assign a value (1-5) which describes the impact of the event
I.e. A system not passing rules may stop the team from competing and would have an impact=5
Detention Difficulty: Ask how difficult it is to stop the risk from ever occurring
I.e. If all you have to do to avoid the system from not passing rules is change one bolt, then the detention difficulty=1
When: When is the risk likely to occur? Consider the phases of the project such as definition, planning, building, and competition
Response: Consider how the risk will be reduced. Typically, a risk can be accepted, avoided, monitored and prepare contingencies, transferred, or mitigate (work hard to reduce the risk). Accepting the risk should be a last resort.
Contingency Plan: If the risk comes to fruition, what is the backup plan?
Trigger: What event will occur that will trigger the contingency plan?
I.e. Once the bolt is inspected, the trigger for the contingency plan should be the judge saying that it will not pass technical inspection.
Who’s Responsible: Assign a member of the team to reduce the risk using the Response and enacting the contingency plan. They will be responsible for this risk until the new competition year begins.

104
Risk Assessment
Risk Event Likelihood Impact Detention Difficulty
Risk Response
Risk Event When Response Contingency Plan Trigger Who’s Responsible

105
Appendix P. Step 8: Sign-Out Sheet
Name: ____________________________________________ Date: ___________________
Task Description: Task #1. _____________________________________________________________
(If Necessary) Task #2. _____________________________________________________________
Tools Used (check all that apply):
1. □Mill □Lathe □Drill Press □Pneumatic Cutoff Wheel □Plasma Cutter □ Band saw □ Welder
□Other_______________
2. □Mill □Lathe □Drill Press □Pneumatic Cutoff Wheel □Plasma Cutter □ Band saw □ Welder
□Other_______________
Estimated Setup Time (minutes):
1. □0-10 □10-20 □20-30 □30-40 □40-50 □50-60 □Other________________
2. □0-10 □10-20 □20-30 □30-40 □40-50 □50-60 □Other________________
Total Time Today (hours):
1. □0-1 □1-2 □2-3 □3-4 □4-5 □5-6 □6-7 □7-8 □8-9 □9-10 □10-11 □11-12 □Other_______________
2. □0-1 □1-2 □2-3 □3-4 □4-5 □5-6 □6-7 □7-8 □8-9 □9-10 □10-11 □11-12 □Other_______________
Estimated Percent Complete:
1. □0-10 □10-20 □20-30 □30-40 □40-50 □50-60 □60-70 □70-80 □80-90 □90-100 □Finished
2. □0-10 □10-20 □20-30 □30-40 □40-50 □50-60 □60-70 □70-80 □80-90 □90-100 □Finished
Specific Comments: Please provide comments that may clarify times or help someone doing a similar task in the
future. Include any last minute design changes.
Ex: “I had to change the grinding wheel to a cutoff wheel during setup.” or “It would be faster if we didn’t if
there was no pocket in the trunion block” (Use back if necessary)
_____________________________________________________________________________________________
_____________________________________________________________________________________________
_____________________________________________________________________________________________
_____________________________________________________________________________________________
____________________________________________________________
--Cut------------------------------------------------------------------------------------------------------------------------------------------------------------------
-----------------------
Sign-Out Sheet
Name: ____________________________________________ Date: ___________________
Task Description: Task #1. _____________________________________________________________
(If Necessary) Task #2. _____________________________________________________________
Tools Used (check all that apply):
1. □Mill □Lathe □Drill Press □Pneumatic Cutoff Wheel □Plasma Cutter □ Band saw □ Welder
□Other_______________
2. □Mill □Lathe □Drill Press □Pneumatic Cutoff Wheel □Plasma Cutter □ Band saw □ Welder
□Other_______________
Estimated Setup Time (minutes):
1. □0-10 □10-20 □20-30 □30-40 □40-50 □50-60 □Other________________
2. □0-10 □10-20 □20-30 □30-40 □40-50 □50-60 □Other________________
Total Time Today (hours):
1. □0-1 □1-2 □2-3 □3-4 □4-5 □5-6 □6-7 □7-8 □8-9 □9-10 □10-11 □11-12 □Other_______________
2. □0-1 □1-2 □2-3 □3-4 □4-5 □5-6 □6-7 □7-8 □8-9 □9-10 □10-11 □11-12 □Other_______________
Estimated Percent Complete:
1. □0-10 □10-20 □20-30 □30-40 □40-50 □50-60 □60-70 □70-80 □80-90 □90-100 □Finished
2. □0-10 □10-20 □20-30 □30-40 □40-50 □50-60 □60-70 □70-80 □80-90 □90-100 □Finished

106
Specific Comments: Please provide comments that may clarify times or help someone doing a similar task in the
future. Include any last minute design changes.
Ex: “I had to change the grinding wheel to a cutoff wheel during setup.” or “It would be faster if there was no
pocket in the trunion block” (Use back if necessary)
_____________________________________________________________________________________________
_____________________________________________________________________________________________
_____________________________________________________________________________________________
_____________________________________________________________________________________________
____________________________________________________________

107
Appendix Q. Step 9: Test Preparation and Incident Log
Report Prepared by: Date:
Test Location:
PRE-TEST PREPARATION
Test Purpose and Goals: What is the purpose of the test? What data do you wish to
collect? (ex: The purpose of the test is to verify that the suspension has only 2 degrees
of camber change during bump)
Test Procedure: (ex: measure the ride height, raise the car off of the ground, cycle the
suspension for bump, use angle finder to measure the camber change)
TEST RESULTS
Data: Log the resulting data.
Conclusions & Recommendations: Use the data along with the goals to draw
conclusions and provide future recommendations (ex: The camber change was lower in
the Optimum-K model. Find the cause. Inconsistency was likely due to manufacturing
inaccuracy.)

108
INCIDENT LOG
Incident Description: TAKE A PICTURE. Also, describe the incident.
Countermeasure: What method was used to fix the problem. (Note: the word
countermeasure is used to imply that there may be a better solution in the future. This
was done to keep continuous improvement in mind)
Future Recommendations: What do you suggest be done in the future (if not the
countermeasure) to fix the problem, perhaps on a more permanent basis.

109
Appendix R. Step 10: Team Competition Assignments
Drivers
Drive during competition between and during dynamic events including brake testing. Drivers must be present the entire time during technical inspection and must be able to perform the vehicle egress as stated by rules. Drivers must also have the most seat time in the vehicle of any team members.
1.
2.
Pit Crew
Members of the pit crew must stand in the pit area during the entirety of the Endurance race. One member must refuel the vehicle while the other holds the fire extinguisher and must be able to use it in the event of a fire. The pit crew must also report any damage to the team lead or manager immediately. The pit crew is also responsible for buckling the driver in after refueling and/or in the event of a driver switch.
1.
2.
Maintenance
Anyone doing maintenance on the car must have thorough knowledge of the car as well as “on the fly” machining practices. Their job includes but is not limited to: fixing any damage incurred to the vehicle during operation, making sure all fluid levels are checked before each event, and making any alterations to the vehicle in the event of a failed technical inspection.
1.
2.
3.
Spotters
During the first dynamic day, one spotter will watch each of the four events: acceleration, maneuverability, rock crawl, and hill climb. If track times are drastically changing with the number of runs, the team lead or manager must be notified immediately. Once the Baja car makes it to the track to which the spotter was designated, that spotter will talk with the driver to ensure that the best routes and maneuvers are taken.
During the second dynamic day, spotters will stand at pre-determined locations along the side of the track and report anything out of the ordinary pertaining to the Baja car to the team leader or team manager immediately.
1. Acceleration:
2. Hill Climb:
3. Rock Crawl:
110
4. Maneuverability:
Organizers:
Organizers are responsible for the safety box during the entirety of competition. They must know where all tools/supplies are located at all times. Organizers are also responsible to make sure that all items are accounted for after use, especially during and after emergency maintenance. As such, only organizers can hand out tools.
There will be one lead organizer who is known as the “Tool God”. The Tool God is in charge of tool/supply organization and must make sure that everything that is needed is packed and everything that is packed is repacked at the end of the competition. Finally, the Tool God is responsible for the torque wrench. The Tool God must torque every bolt down to the bolt’s specification before every dynamic event and any bolts which have been changed during the endurance race. For the Tool God’s convenience, a bolt specification chart has been provided.
1. Tool God:
2.
3.

111
U.S. BOLT GRADES
SAE 2 SAE 5 SAE 7 SAE 8
2 5 7 8 SOCKET HEAD CAP SCREW
I.D. Marks No
marking
s 3 lines 5 lines 6 lines Allen head
Material Low
carbon
Medium-
carbon,
tempered
Medium-
carbon,
quenched &
tempered
Medium-
carbon,
quenched &
tempered
High-carbon,
quenched &
tempered
Tensile
strength
(Minimum)
74,000
psi 120,000 psi 133,000 psi 150,000 psi 160,000 psi
U.S. BOLT TORQUE SPECIFICATIONS Torque in pounds-foot
2 2 5 5 7 7 8 8 Socket head
cap screw
Socket
head
cap
screw
Bolt
Dia.
Thread
per
inch Dry Oiled Dry Oiled Dry Oiled Dry Oiled Dry Oiled
1/4 20 4 3 8 6 10 8 12 9 14 11 1/4 28 6 4 10 7 12 9 14 10 16 13 5/1
6 18 9 7 17 13 21 16 25 18 29 23
5/16
24 12 9 19 14 24 18 29 20 33 26
3/8 16 16 12 30 23 40 30 45 35 49 39 3/8 24 22 16 35 25 45 35 50 40 54 44 7/1
6 14 24 17 50 35 60 45 70 55 76 61
7/16
20 34 26 55 40 70 50 80 60 85 68
1/2 13 38 31 75 55 95 70 110 80 113 90 1/2 20 52 42 90 65 100 80 120 90 126 100 9/1 12 52 42 110 80 135 100 150 110 163 130

6 9/1
6 18 71 57 120
5/8 11 98 78 150
5/8 18 115 93 180
3/4 10 157 121 260
3/4 16 180 133 300
7/8 9 210 160 430
7/8 14 230 177 470
1 8 320 240 640
1 12 350 265 710
Top
BOLT TORQUE FACTORS
LUBRICANT OR
PLATING
Oil
Dry Film (Teflon or
moly based)
Dry Wax (Cetyl alcohol)
Chrome plating
Cadmium plating
Zinc plating
112
120 90 150 110 170 130 181
150 110 190 140 220 170 230
180 130 210 160 240 180 255
260 200 320 240 380 280 400
300 220 360 280 420 320 440
430 320 520 400 600 460 640
470 360 580 440 660 500 700
640 480 800 600 900 680 980
710 530 860 666 990 740 1060
BOLT TORQUE FACTORS
LUBRICANT OR
PLATING TORQUE CHANGES
Reduce torque 15% to 25%
Dry Film (Teflon or
moly based) Reduce torque 50%
Dry Wax (Cetyl alcohol) Reduce torque 50%
Chrome plating No change
Cadmium plating Reduce torque 25%
Zinc plating Reduce torque 15%
181 144
230 184 255 204 400 320 440 350 640 510 700 560 980 780 1060 845

113
Appendix S. Step 11: Post Season Debrief Questions
Please fill out this questionnaire in the spirit of constructive criticism. State the problem in simple terms and suggest solutions. THERE IS NO NEED TO TEAR DOWN A CLUB MEMBER. You may consider specific jobs that were performed that may need improvement or suggest tasks that may have helped the team. Please consider any and all suggestions that may be improved upon in future years. You may write one the back, if needed.
During the current season, review the performance of the team lead, team manager, and SAE officers. This section is to remain anonymous.
1. What specific suggestions would you give to improve the performance of the current team lead?
2. What specific suggestions would you give to improve the performance of the current team
manager?
3. What specific suggestions would you give to the SAE officers for next year to improve the club as
a whole or the team as a whole?
4. Did you have ample time and resources to complete your project? Do not simply answer yes/no.
Also provide feedback for improvement.

114
5. When faced with a problem, was the team lead, team manager, or system lead always
successful in working with you to find a solution? Do not simply answer yes/no. If you have a
specific example please explain.
6. Based on this season’s performance, who would you suggest for the team lead or team
manager’s positions and why?
7. Are there any other suggestions to help the team be more successful during next year’s
competition?
8. Think of any issues that you may have had staying on schedule. What specific improvements
would you make to the schedule?
9. Think of any issues that you may have had using the management templates. What specific
improvements would you make to the templates (including this one)?

115
10. Think of any issues that you may have had with the management process. What specific
improvements would you make to the process?

116
Sub-system: ___________________________ Sub-System Lead: ___________________________
Sub-System Team: ___________________________ ___________________________
___________________
________ Please review the definitions sheet for your subsystem from the beginning of the season.
1. Were the system problems from last year solved with your new design? □Yes (skip 1a) □No
a. If no, what suggestions do you have to solve the problems from last season?
2. What problems did you face during testing or competition that needs to be fixed by next year’s
design?
3. Were your system’s goals specific, measurable, and attainable? □Yes (skip 4b) □No (skip 4a)
a. Did you meet those goals? □Yes □No
i. If no, how would you suggest that next year’s design team meet those goals?
b. How would you suggest that those goals are changed so that next year’s design team
can measure and attain them?
4. Were your system’s success metrics specific, measurable, and attainable? □Yes (skip 5b) □No
(skip 5a)
a. Was your sub-system team successful? □Yes □No
i. If no, how would you suggest that next year’s design team meet those goals?

117
b. How would you suggest that those metrics are changed so that next year’s design team
can measure and attain them?
5. Identify any stakeholders that were missed.
6. Identify any deliverables that were missed.
7. Look at your risk analysis. Were there any risks that were not assessed that should have been?
i.e. Something unforeseen went wrong with your system (during manufacturing, testing, or
competition) and was not on your risk analysis. List those events here.
8. Were any of the risks listed on your risk analysis realized (did any of them happen)? If so, did
the person responsible follow the contingency described on your risk analysis?
9. What are the most important things you learned this year?
Copyright © 2022 FDOKUMEN