Autostereotypes and Heterostereotypes In Sensory Impaired ...
Upload
independentCategory
view
0download
0
Impaired Error Monitoring and Correction Function in Autism
Estate Sokhadze, PhD1, Joshua Baruth, MS2, Ayman El-Baz, PhD3, Timothy Horrell3, GuelaSokhadze3, Thomas Carroll1, Allan Tasman, MD1, Lonnie Sears, PhD4, and Manuel F.Casanova, MD1,21Department of Psychiatry & Behavioral Sciences, University of Louisville, Louisville, KY 402022Department of Anatomical Sciences and Neurobiology, University of Louisville, Louisville, KY402023Department of Bioengineering, University of Louisville, Louisville, KY 402024Department of Pediatrics, University of Louisville, Louisville, KY 40202
AbstractIntroduction—Error monitoring and correction is one of the executive functions and is importantfor effective goal directed behavior. Deficient executive functioning, including reduced errormonitoring ability, is one of the typical features of such neurodevelopmental disorders as autism,probably related to perseverative responding, stereotyped repetitive behaviors, and an inability toaccurately monitor ongoing behavior. Our prior studies of behavioral and event-related potential(ERP) measures during performance on visual oddball tasks in high-functioning autistic (HFA)children showed that despite only minor differences in reaction times HFA children committedsignificantly more errors.
Methods—This study investigated error monitoring in children with autism spectrum disorder(ASD) with response-locked event-related potentials - the Error-related Negativity (ERN) and Error-related Positivity (Pe) recorded at fronto-central sites. The ERN reflects early error detectionprocesses, while the Pe has been associated with later conscious error evaluation and attention re-allocation. Reaction times (RT) in correct trials and post-error slowing in reaction times weremeasured. In this study fourteen subjects with ASD and 14 age- and IQ- matched controls receiveda three-category visual oddball task with novel distracters.
Results—ERN had a lower amplitude and longer latency in the ASD group but was localized inthe caudal part of anterior cingulate cortex (ACC) in both groups. The Pe component was significantlyprolonged in the ASD group but did not reach significance in amplitude differences compared tocontrols. We found significant post-error slowing in RTs in controls, and post-error acceleration inRTs in the ASD group.
Conclusions—The reduced ERN and altered Pe along with a lack of post-error RT slowing inautism might be interpreted as insensitivity in the detection and monitoring of response errors and areduced ability of execute corrective actions. This might result in reduced error awareness and failurein adjustment when dealing with situations where erroneous responses may occur. This deficit mightbe manifested in the perseverative behaviors often seen in individuals with ASD. The results arediscussed in terms of a general impairment in self-monitoring and other executive functionsunderlying behavioral and social disturbances in ASD.
Communication should be addressed to: Estate (Tato) M. Sokhadze, Ph.D., Research Assistant Professor, Cognitive NeuroscienceLaboratory, Department of Psychiatry & Behavioral Sciences, University of Louisville School of Medicine, 401 E Chestnut Street, Suite610, Louisville, KY 40202, Phone : (502) 852-0404, Fax : (502) 813-6665, [email protected].
NIH Public AccessAuthor ManuscriptJ Neurother. Author manuscript; available in PMC 2011 April 1.
Published in final edited form as:J Neurother. 2010 April 1; 14(2): 79–95. doi:10.1080/10874201003771561.
NIH
-PA Author Manuscript
NIH
-PA Author Manuscript
NIH
-PA Author Manuscript
KeywordsAutism; Executive functions; Error monitoring; Reaction time; Cingulate cortex; oddball task
INTRODUCTIONAutism spectrum disorders (ASD) are pervasive developmental disorders characterized by theearly onset of impairments in social and communication skills along with restricted andrepetitive interests and activities. These conditions range from a severe form called autisticdisorder, through cases known as pervasive developmental disorders not otherwise specified(PDD-NOS), the category that “… includes “atypical autism” – presentations that do not meetthe criteria for autistic disorder because of late age of onset, atypical symptomatology, orsubthreshold symptomatology…” (p. 84, DSM-IVTR, APA, 2000) are a much milder formknown as Asperger’s syndrome. There is growing evidence that executive function deficitsmay contribute to these core symptoms (Hill, 2004). One important executive function knownto be compromised in ASD is the ability to select a contextually appropriate response amongseveral competing ones, and simultaneously inhibit contextually inappropriate responses toavoid committing an error. Another executive deficit observed during performance on speededreaction time tasks in autism is manifested in an abnormality related to response errormonitoring and post-error response correction.
Current theory and research suggests that deficits in response monitoring may contribute tosocial-emotional and social-cognitive impairments in autism (Henderson et al., 2006).Executive deficit hypotheses of autism emphasize that many of the everyday behaviors ofautistic individuals, such as, perseverative responding, repetitive behaviors, poor imitationskills, and joint attention impairments may involve an inability to consistently and accuratelymonitor ongoing behaviors (Mundy, 2003). Therefore, impairments specific to self-monitoringfunction have been already outlined in earlier models of autism (Russell, 1997; Russell &Jarrold, 1998). Several recent reports (Bogte et al., 2007; Henderson et al. 2006; Thakkar etal., 2008; Vlamings et al., 2008) indicate that children and adult patients with ASD showreduced error processing and deficient behavioral correction after an error is committed. Thisfinding could be explained as a reflection of ASD patients’ lower sensitivity to behavioralerrors and/or reduced behavior correction ability.
Performance on behavioral tasks is monitored by a brain system that is responsive to errors(Falkenstein et al., 2000; Gehring & Knight, 2000; Gehring et al., 1993; Luu et al., 2000,2003). Evidence from functional magnetic resonance imaging (fMRI),electroencephalographic (EEG) and event-related potential (ERP) studies outlines that errormonitoring is a function of the medial frontal cortex (MFC), including the supplementary eyefields, rostral cingulate motor area, and dorsal anterior cingulate cortex (ACC) (reviewed inRidderinkhof et al., 2004). Recent neuropathological studies in autism suggest the presence ofsignificant minicolumnar abnormalities in brain regions related to error monitoring, i.e., MFCand ACC (for references see Casanova et al., 2006a, b)
Error sensitivity can be readily examined by measuring response-locked event-related potentialcomponents associated with brain responses to errors. Two specific components relevant inthis context are the error-related negativity (ERN, more rarely referred to as Ne) and the error-related positivity (Pe). The ERN is a response-locked negative ERP deflection, emergingbetween 0 and 150 ms after the onset of the incorrect behavioral response – a commission error.Usually this ERN is followed by a positive wave referred to as the Pe potential. Although thereis discussion about the exact meaning of the Pe (Overbeek et al., 2005), most studies indicatethat the Pe is related to the conscious recognition of the error (Nieuwenhuis et al., 2001) or the
Sokhadze et al. Page 2
J Neurother. Author manuscript; available in PMC 2011 April 1.
NIH
-PA Author Manuscript
NIH
-PA Author Manuscript
NIH
-PA Author Manuscript
attribution of motivational significance to the committed error (Falkenstein et al., 2000). Thissuggests that the ERN reflects an initial automatic brain response as a result of an error, andthe Pe possibly indicates the conscious reflection and comprehension of the error (Overbeeket al., 2005). The magnitude of the ERN is associated with behavioral evidence of self-monitoring (i.e., self-correction and post-error slowing responses) and therefore is interpretedas a biomarker of error processing (van Veen and Carter, 2002). Dipole modeling has localizedERN sources to the caudal ACC, while Pe has been localized to the more rostral ACC division(Bush et al., 2000; Gehring & Knight, 2000; Herrmann et al., 2004; Van Veen & Carter,2002; West, 2003). ERN and Pe are generally accepted as neural indices of response-monitoring processes in psychophysiological research and clinical neurophysiology.
One of the important research questions is whether this error-related frontal activity isassociated with a premorbid trait reflecting an initial deficiency of behavioral control andregulation, and whether this deficit can be generated as a result of neuropathological statesassociated with behavioral control deficits (e.g., pervasive developmental disorders). Severalclinical research studies have demonstrated an excessive error processing in patients withobsessive–compulsive disorders (OCD) (Johannes et al., 2001), anxiety disorders (Markela-Lerenc et al., 2004) and Tourette syndrome (Gehring et al., 2000). On a contrary, reduced errorprocessing manifestations were reported in borderline personality disorder (de Bruijn et al.,2006) and schizophrenia (Mathalon et al., 2002). In psychiatric studies, a decreased ERN istypically related to increased severity of psychomotor poverty symptoms (Bates et al., 2004).Furthermore, error processing has also been found to be reduced in non-clinical traits such ashigh impulsivity (Ruchsow et al., 2005).
Neuroanatomically and functionally, the anterior cingulate cortex (ACC) provides an interfacebetween frontal action selection processes, limbic emotion or motivation processes, and motoroutput regulation (Coles et al., 2001; Holroyd & Coles, 2002; Taylor et al., 2007). The integralrole of the ACC in self-monitoring and guiding attention in goal-directed actions suggests thatit may be an important focus for autism research. Disturbances in attention regulation andbehavioral rigidity may result in social orienting deficits and a chronic disruption of socialinformation processing and social learning that together may contribute to the social, cognitiveand emotional deficits observed in autistic children (Dawson et al., 1998; Klin et al., 2003;Mundy, 1995; Mundy & Neal, 2001).
Several neuroimaging studies (Barnea-Goraly et al., 2004; Hall et al., 2003) suggest thatanomalous functioning of the ACC may distinguish between individuals with autism andcontrols. Haznedar et al. (2000) observed that a sample of children with autism displayedhypometabolism in the right ACC relative to controls, while an Asperger’s disorder sub-sampledisplayed left ACC hypometabolism relative to controls. There have been also several ERN-based empirical demonstrations of connections between ACC function and autism. Childrenwith high functioning autism displayed longer ERN latencies but did not differ in amplitudeof the ERN relative to children in the control group in the Eriksen flanker task. (Henderson etal., 2006). There is other evidence of abnormal response monitoring in autism, in particularreduced error self-correction (Russell & Jarrold, 1998) and reduced post-error slowing, acompensatory mechanism to improve performance on the subsequent trial (Bogte et al.,2007). Since the evaluation of ongoing behavior and its consequences is necessary to determinewhether or not current behavior adjustment strategies should be maintained, abnormal responsemonitoring and deficient adaptive correction may contribute to the behavioral inflexibilityassociated with ASD.
The current study examined the possibility that patients with autism exhibit a deficiency in theprocessing of error, reflected by a reduction in the ERN and Pe response-locked brainpotentials. Further, we expected that ASD patients would have higher rates of error in the
Sokhadze et al. Page 3
J Neurother. Author manuscript; available in PMC 2011 April 1.
NIH
-PA Author Manuscript
NIH
-PA Author Manuscript
NIH
-PA Author Manuscript
cognitive task. In addition, in normal subjects it has been observed that after an error has beencommitted, subjects show slower RT and decreased error rates. These changes have beeninterpreted as revealing changes in the speed–accuracy strategy of the subject possibly due toerror-induced control processes. We investigated the possibility that patients with ASD showa deviant post-error response pattern.
MethodsParticipants
Participants with autism spectrum disorder (ASD) (study enrollment eligibility age range 9 to21 years) were recruited through the University of Louisville Weisskopf Child EvaluationCenter (WCEC). Diagnosis was made according to the Diagnostic and Statistical Manual ofMental Disorders (DSM-IV-TR) (APA 2000) and further ascertained with the AutismDiagnostic Interview – Revised (ADI-R) (LeCouteur et al. 2003). All ASD patients were alsoclinically evaluated with the Autism Diagnostic Observation Schedule (ADOS, Lord et al.,1989) and had a medical evaluation by a developmental pediatrician. All subjects had normalhearing based on past hearing screens. Participants either had normal vision or wore correctivelenses. Participants with a history of seizure disorder, significant hearing or visual impairment,a brain abnormality conclusive from imaging studies or an identified genetic disorder wereexcluded. All participants were high-functioning persons with ASD with full scale IQ > 80assessed using the Wechsler Intelligence Scale for Children, Fourth Edition (WISC-IV;Wechsler 2003) or the Wechsler Abbreviated Scale of Intelligence (WASI, Wechsler 2004).
Social and behavioral functioning for participants was evaluated utilizing caregiverquestionnaires and clinician ratings. Measures included:
Aberrant Behavior Checklist (ABC). The ABC (Aman & Singh, 1994) is a clinicianadministered rating scale assessing five problem areas: Irritability, Lethargy/SocialWithdrawal, Stereotypy, Hyperactivity, and Inappropriate Speech, and is based on caregiverreports. Each area contains multiple items receiving a rating from 0 to 3. Items are summedand high scores for each area reflect severity of the problem area.
Social Responsiveness Scale (SRS). The SRS (Constantino & Gruber, 2005) is a caregivercompleted rating scale assessing social interest and interaction. The scale provides adimensional measure of social interaction allowing the rating of social skills in autism as wellas non-autistic individuals.
Repetitive Behavior Scale – Revised (RBS). The RBS (Bodfish, Symons, & Lewis, 1999) is acaregiver completed rating scale assessing repetitive and restricted behavior patterns. The RBSis a measure of different behaviors: stereotyped, self-injurious, compulsive, ritualistic,sameness, and restricted range (Bodfish, et. al., 2000). Items from scales are summed to obtaina measure of the severity of repetitive behavior.
Half of the subjects with autism in this study were taking medication: one patient was takingstimulants (Concerta - Methylphenidate HCl), while 6 patients were taking antidepressants(Prozac - Fluoxetine HCl, Zoloft – Sertraline HCl), and mood stabilizers (Depakote -Divalproex Sodium, Abilify – Aripiprazole).
Controls were recruited through advertisements in the local media. All control participantswere free of neurological or significant medical disorders, had normal hearing and vision, andwere free of psychiatric, learning, or developmental disorders based on self- and parent reports.Subjects were screened for history of psychiatric or neurological diagnosis using the StructuredClinical Interview for DSM-IV Non-Patient Edition (SCID-NP, First et al. 2001). Participants
Sokhadze et al. Page 4
J Neurother. Author manuscript; available in PMC 2011 April 1.
NIH
-PA Author Manuscript
NIH
-PA Author Manuscript
NIH
-PA Author Manuscript
within the control and autism groups were attempted to be matched by age, full scale IQ, andsocioeconomic status of their family. Socioeconomic status of ASD and control groups wascompared based on parent education and annual household income. Participants in both groupshad similar parent education levels.
Participating subjects and their parents (or legal guardians) were provided with full informationabout the study including the purpose, requirements, responsibilities, reimbursement, risks,benefits, alternatives, and role of the local Institutional Review Board (IRB). The consent andassent forms approved by the IRB were reviewed and explained to all subjects who expressedinterest to participate. All questions were answered before a consent signature was requested.If the individual agreed to participate, she/he signed and dated the consent form and receiveda copy countersigned by the investigator who obtained consent.
ERP data acquisition, and signal processingElectroencephalograpic (EEG) data were acquired with a 128 channel Electrical GeodesicsInc. (EGI) system (v. 200) consisting of Geodesic Sensor Net electrodes, Net Amps and NetStation software (Electrical Geodesics Inc., Eugene, OR) running on a Macintosh G4 computer.EEG data are sampled at 500 Hz and 0.1 – 200 Hz analog filtered. Impedances were kept under50 KΩ. According to the Technical Manual of EGI (2003) this Net Sensor electrode impedancelevel is sufficient for quality recording of EEG with this system.
The Geodesic Sensor Net is a lightweight elastic thread structure containing silver/silverchloride electrodes housed in a synthetic sponge on a pedestal. The sponges are soaked in apotassium chloride solution to render them conductive. EEG data are recorded continuously.EEG channels with high impedance or visually detectable artifacts (e.g., channel drift, grossmovement, etc.) were marked as “bad” using Net Station event marker tools in “on-line” modefor further removal in “off-line” mode using Net Station Waveform Tools.
Response-locked EEG data are segmented off-line into 1000 ms epochs spanning 500 ms pre-stimulus to 500 ms post-stimulus around the critical stimulus events – commission error. Dataare digitally screened for artifacts (eye blinks, movements), and contaminated trials areremoved using artifact rejection tools. The Net Station Waveform Tools’ Artifact Detectionmodule in “off-line” mode marks EEG channels “bad” if the fast average amplitude exceeds200 µV, the differential average amplitude exceeds 100 µV, or if the channel has zero variance.Segments are marked bad if they contain more than 10 bad channels or if eye blinks or eyemovements are detected (> 70 µV). After detection of “bad” channels, Net Station’s “Badchannel replacement” function is used for the replacement of data in “bad” channels with datainterpolated from the remaining good channels (or segments) using spherical splines (moreinformation on interpolation methods used in EGI Net Station systems can be found in Fletcheret al., 1996; Luu et al., 2001; Srinivasan et al., 1998).
Remaining data are digitally filtered using 60 Hz Notch and 0.3–20 Hz bandpass filters andare then segmented by condition and averaged to create ERPs. Averaged ERP data are baselinecorrected (500 ms) and re-referenced into an average reference frame. All stimulus presentationand behavioral response collection is controlled by a PC computer running E-prime software(Psychology Software Tools Inc., PA). Visual stimuli are presented on a 15" display. Manualresponses are collected with a 5-button keypad (Serial Box, Psychology Software Tools, Inc,PA).
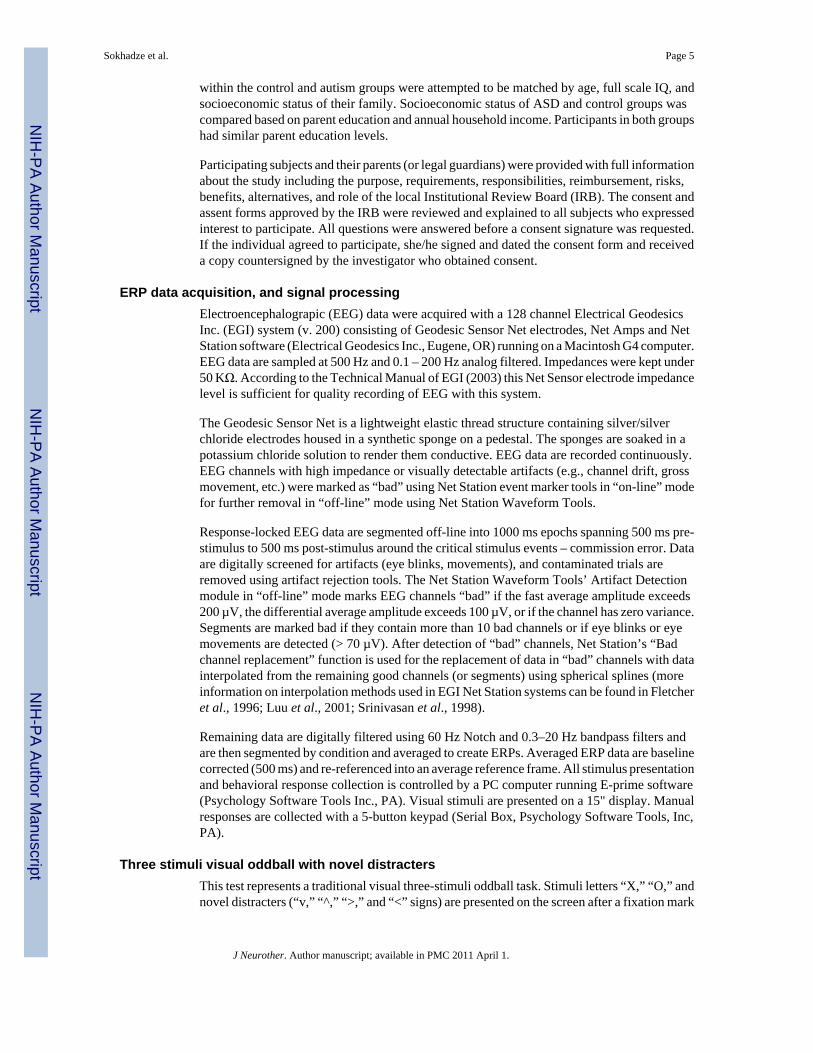
Three stimuli visual oddball with novel distractersThis test represents a traditional visual three-stimuli oddball task. Stimuli letters “X,” “O,” andnovel distracters (“v,” “^,” “>,” and “<” signs) are presented on the screen after a fixation mark
Sokhadze et al. Page 5
J Neurother. Author manuscript; available in PMC 2011 April 1.
NIH
-PA Author Manuscript
NIH
-PA Author Manuscript
NIH
-PA Author Manuscript
“+”. One of the stimuli (“O”) is presented on 50% of the trials (frequent standard); the novelstimuli stimulus (e.g., “>”) is presented on 25% of the trials (rare distracter), whereas the third(“X”) is presented on the remaining 25% of the trials and represents the target. Subjects areinstructed to press a key when they see the target letter on the screen. Each stimulus is presentedfor 250 ms, with a 1100 –1300 ms inter-trial interval. There are 480 trials in total, with a breakevery 240 trials. The complete sequence takes 20 minutes.
Behavioral measuresBehavioral response measures were mean reaction time (in ms) and response accuracy (percentof correct hits). Number and percent of commission and omission errors were calculated foreach participant.
Event-Related Potentials (ERP)ERP dependent measures were: adaptive mean amplitude and latency of two ERP peaks (i.e.,ERN, Pe) within a temporal window across two region-of-interest (ROI) channel groups at themidline fronto-central area. Each ROI contained at least 4 electrodes. A list of ERP dependentvariables included stimulus-averaged amplitude and latency of the fronto-central ERPcomponents: Error-related Negativity (ERN) (40–150 ms post-stimulus) and Error-relatedPositivity (Pe) (100–200 ms).
The frontal and fronto-central ROIs for both ERN and Pe components included the followingEGI channels: Midline frontal and fronto-central ROI - Fz and FCz, and the extended fronto-central ROI contained 5 EEG sites – FCz, 2 left EGI channels 7 and 13 (between FCz and FC3and C1) and 2 right EGI channels 113 and 107 (between FCz and FC2 and C2). The layout ofthese ROIs is presented in Figure 1.
Dipole Source LocalizationDipole source localization was performed on grand average ERP files using the Brain ElectricalSource Analysis software package (BESA v.5.2., MEGIS, Munich, Germany). BESA is oneof the most widely used software packages for source analysis and dipole localization in EEGresearch (Scherg & Berg, 1996; Schreg, 2005). BESA provides a standardized, realistic headmodel and allows for hypothesis testing for EEG/ERP data.
Statistical data analysisStatistical analyses were performed on the subject-averaged behavioral and ERP data with thesubject averages being the observations. The primary analysis model is the repeated measuresANOVA, with dependent variables being reaction time (RT), accuracy, commission andomission error rate (percent), post-error RT, and all the specific ERP components’ (ERN, Pe)amplitudes and latencies at selected ROIs. The data of each behavioral and ERP dependentvariable for each relevant ROI was analyzed using one-way ANOVA. The between subjectfactor was Group (ASD, CNT). Post-hoc analysis was conducted where appropriate. A-priorihypotheses were tested with Student’s t-tests for 2 groups with unequal variance. In allANOVAs, Greenhouse-Geisser corrected p-values were employed where appropriate. SPSSv.14 and Sigma Stat 3.1 packages were used for statistical analysis.
ResultsParticipants
The mean age of 14 participants enrolled in the ASD group was 13.0 ± (standard deviation)2.5 years (range 9–18 years, 11 males, 3 females), while the mean age of the Control (CNT)group (N=14) was 14.1 ± 3.9 years (9–21, 9 males, 5 females). The age difference between
Sokhadze et al. Page 6
J Neurother. Author manuscript; available in PMC 2011 April 1.
NIH
-PA Author Manuscript
NIH
-PA Author Manuscript
NIH
-PA Author Manuscript
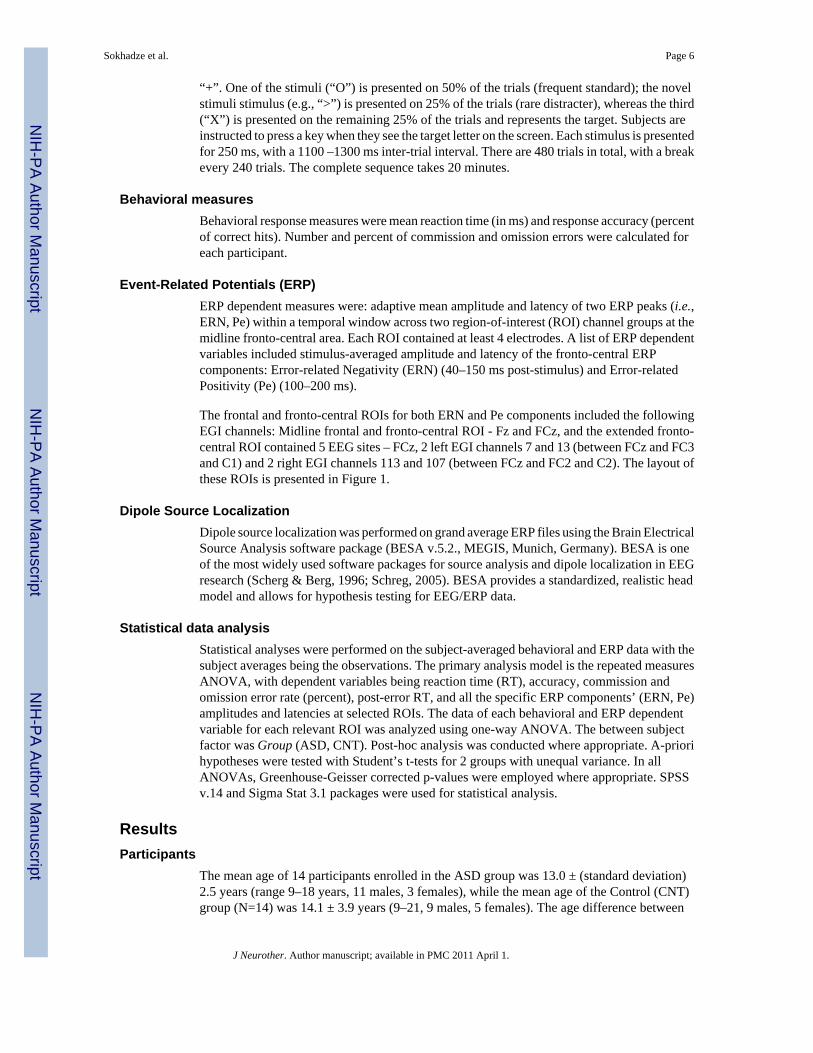
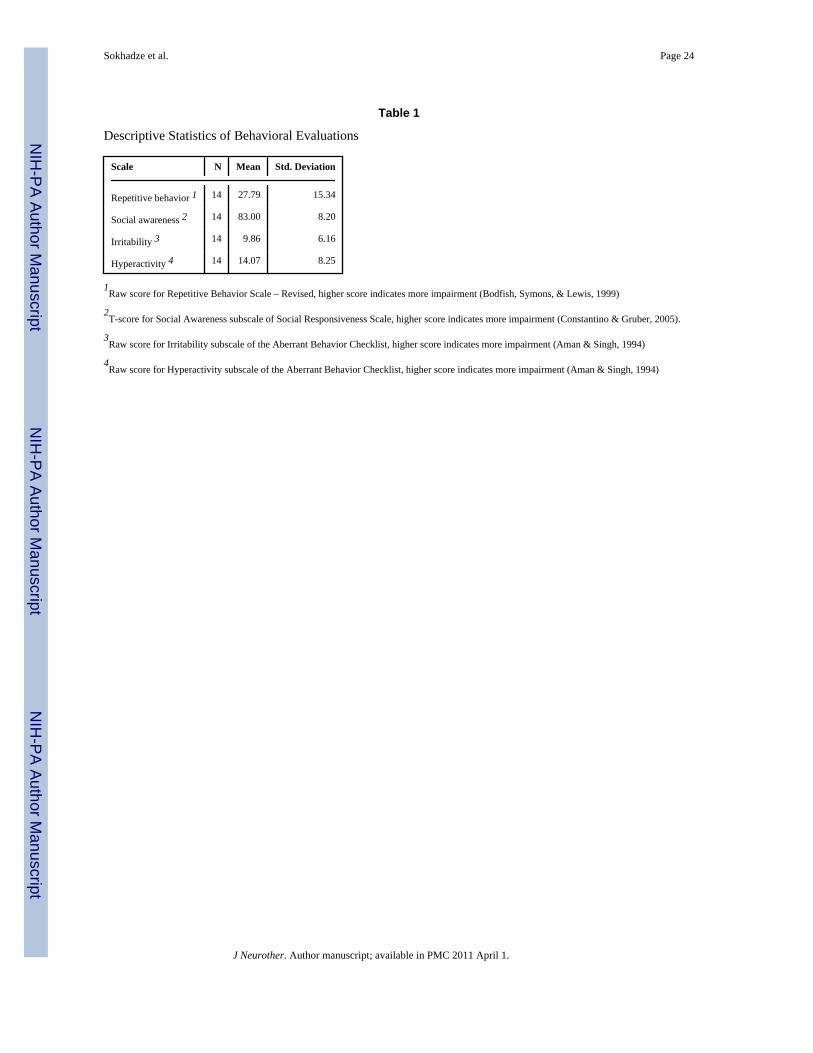
groups was not significant (p=0.39, n.s.). All children with autism were high functioning. MeanFull Scale IQ score for children with autism was 92.2 ± 15.3 and was not significantly differentfrom the group IQ of the typical children. The tests were Full Scale IQ scores from either theWechsler Intelligence Scale for Children, Fourth Edition (WISC-IV; Wechsler, 2003), or theWechsler Abbreviated Scale of Intelligence (WASI, Wechsler 2004). Descriptive statistics ofbehavioral evaluations using Aberrant Behavior Checklist (ABC). (Aman & Singh, 1994),Social Responsiveness Scale (SRS) (Constantino & Gruber, 2005), and Repetitive BehaviorScale – Revised (RBS)(Bodfish, Symons, & Lewis, 1999) are presented in Table 1 Theapproximate household incomes used to assess socio-economic status of children did not revealany statistically significant group differences. All subjects except two in the ASD group andone in the control group were right-handed (assessed using Edinburgh handedness inventory,Oldfield, 1971)
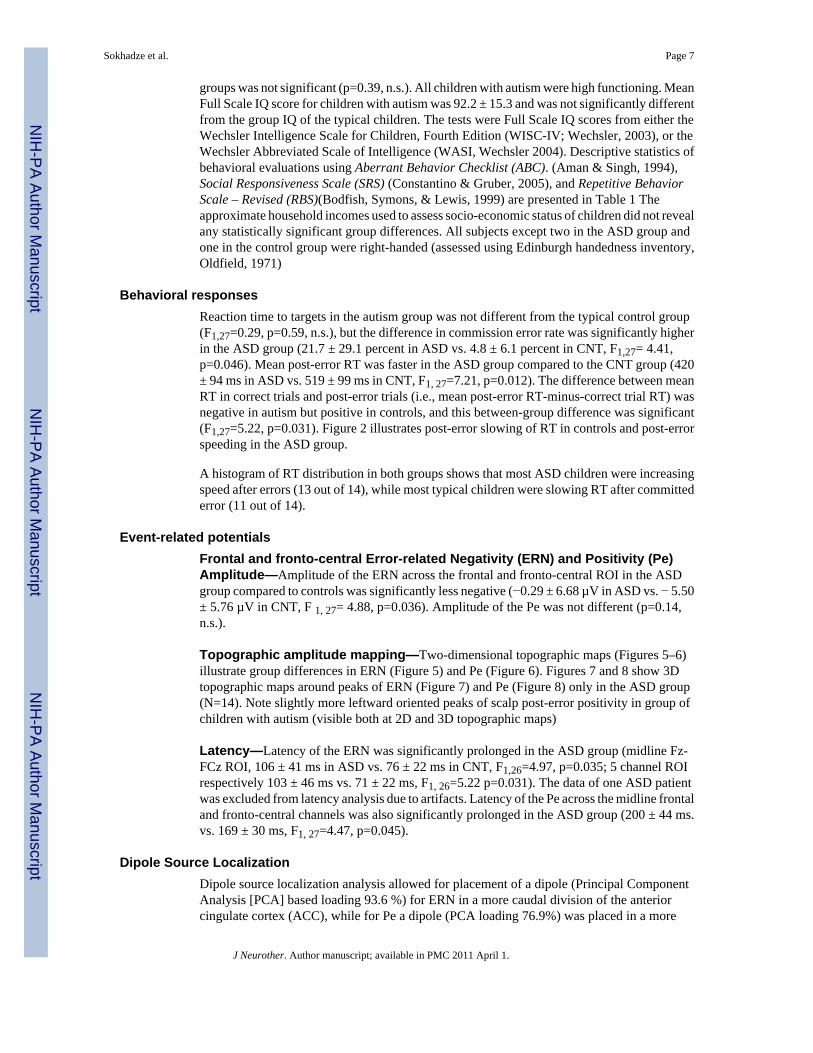
Behavioral responsesReaction time to targets in the autism group was not different from the typical control group(F1,27=0.29, p=0.59, n.s.), but the difference in commission error rate was significantly higherin the ASD group (21.7 ± 29.1 percent in ASD vs. 4.8 ± 6.1 percent in CNT, F1,27= 4.41,p=0.046). Mean post-error RT was faster in the ASD group compared to the CNT group (420± 94 ms in ASD vs. 519 ± 99 ms in CNT, F1, 27=7.21, p=0.012). The difference between meanRT in correct trials and post-error trials (i.e., mean post-error RT-minus-correct trial RT) wasnegative in autism but positive in controls, and this between-group difference was significant(F1,27=5.22, p=0.031). Figure 2 illustrates post-error slowing of RT in controls and post-errorspeeding in the ASD group.
A histogram of RT distribution in both groups shows that most ASD children were increasingspeed after errors (13 out of 14), while most typical children were slowing RT after committederror (11 out of 14).
Event-related potentialsFrontal and fronto-central Error-related Negativity (ERN) and Positivity (Pe)Amplitude—Amplitude of the ERN across the frontal and fronto-central ROI in the ASDgroup compared to controls was significantly less negative (−0.29 ± 6.68 µV in ASD vs. − 5.50± 5.76 µV in CNT, F 1, 27= 4.88, p=0.036). Amplitude of the Pe was not different (p=0.14,n.s.).
Topographic amplitude mapping—Two-dimensional topographic maps (Figures 5–6)illustrate group differences in ERN (Figure 5) and Pe (Figure 6). Figures 7 and 8 show 3Dtopographic maps around peaks of ERN (Figure 7) and Pe (Figure 8) only in the ASD group(N=14). Note slightly more leftward oriented peaks of scalp post-error positivity in group ofchildren with autism (visible both at 2D and 3D topographic maps)
Latency—Latency of the ERN was significantly prolonged in the ASD group (midline Fz-FCz ROI, 106 ± 41 ms in ASD vs. 76 ± 22 ms in CNT, F1,26=4.97, p=0.035; 5 channel ROIrespectively 103 ± 46 ms vs. 71 ± 22 ms, F1, 26=5.22 p=0.031). The data of one ASD patientwas excluded from latency analysis due to artifacts. Latency of the Pe across the midline frontaland fronto-central channels was also significantly prolonged in the ASD group (200 ± 44 ms.vs. 169 ± 30 ms, F1, 27=4.47, p=0.045).
Dipole Source LocalizationDipole source localization analysis allowed for placement of a dipole (Principal ComponentAnalysis [PCA] based loading 93.6 %) for ERN in a more caudal division of the anteriorcingulate cortex (ACC), while for Pe a dipole (PCA loading 76.9%) was placed in a more
Sokhadze et al. Page 7
J Neurother. Author manuscript; available in PMC 2011 April 1.
NIH
-PA Author Manuscript
NIH
-PA Author Manuscript
NIH
-PA Author Manuscript
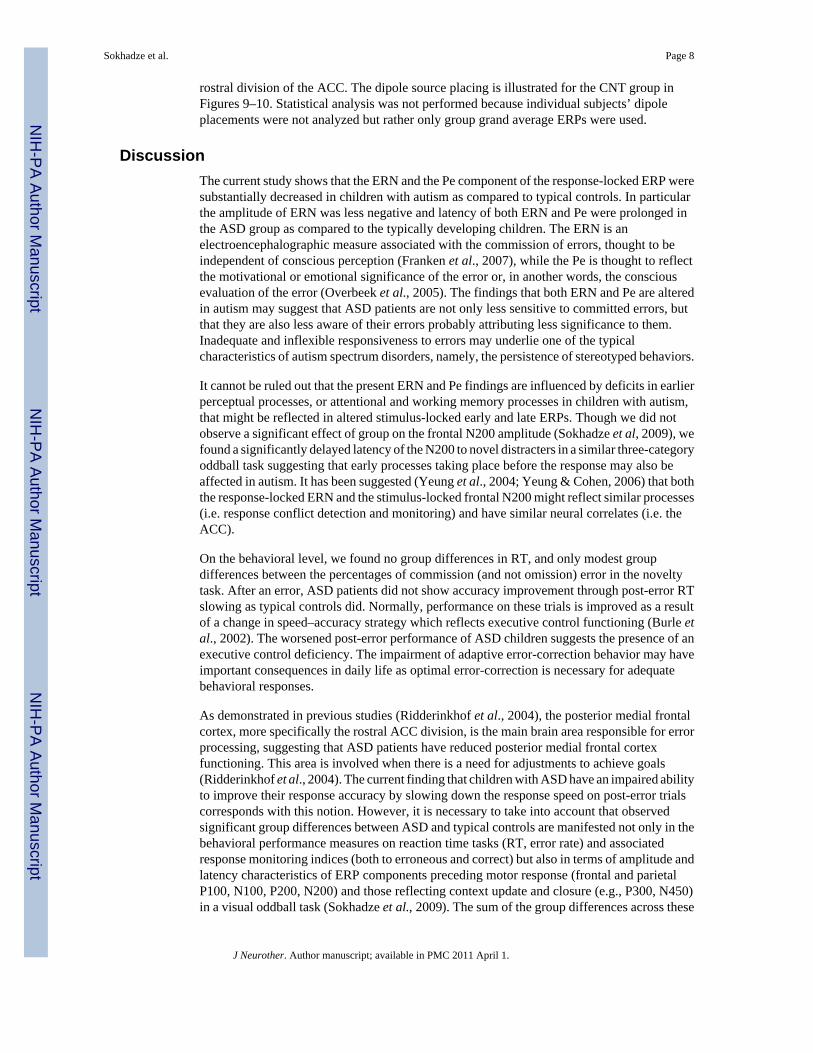
rostral division of the ACC. The dipole source placing is illustrated for the CNT group inFigures 9–10. Statistical analysis was not performed because individual subjects’ dipoleplacements were not analyzed but rather only group grand average ERPs were used.
DiscussionThe current study shows that the ERN and the Pe component of the response-locked ERP weresubstantially decreased in children with autism as compared to typical controls. In particularthe amplitude of ERN was less negative and latency of both ERN and Pe were prolonged inthe ASD group as compared to the typically developing children. The ERN is anelectroencephalographic measure associated with the commission of errors, thought to beindependent of conscious perception (Franken et al., 2007), while the Pe is thought to reflectthe motivational or emotional significance of the error or, in another words, the consciousevaluation of the error (Overbeek et al., 2005). The findings that both ERN and Pe are alteredin autism may suggest that ASD patients are not only less sensitive to committed errors, butthat they are also less aware of their errors probably attributing less significance to them.Inadequate and inflexible responsiveness to errors may underlie one of the typicalcharacteristics of autism spectrum disorders, namely, the persistence of stereotyped behaviors.
It cannot be ruled out that the present ERN and Pe findings are influenced by deficits in earlierperceptual processes, or attentional and working memory processes in children with autism,that might be reflected in altered stimulus-locked early and late ERPs. Though we did notobserve a significant effect of group on the frontal N200 amplitude (Sokhadze et al, 2009), wefound a significantly delayed latency of the N200 to novel distracters in a similar three-categoryoddball task suggesting that early processes taking place before the response may also beaffected in autism. It has been suggested (Yeung et al., 2004; Yeung & Cohen, 2006) that boththe response-locked ERN and the stimulus-locked frontal N200 might reflect similar processes(i.e. response conflict detection and monitoring) and have similar neural correlates (i.e. theACC).
On the behavioral level, we found no group differences in RT, and only modest groupdifferences between the percentages of commission (and not omission) error in the noveltytask. After an error, ASD patients did not show accuracy improvement through post-error RTslowing as typical controls did. Normally, performance on these trials is improved as a resultof a change in speed–accuracy strategy which reflects executive control functioning (Burle etal., 2002). The worsened post-error performance of ASD children suggests the presence of anexecutive control deficiency. The impairment of adaptive error-correction behavior may haveimportant consequences in daily life as optimal error-correction is necessary for adequatebehavioral responses.
As demonstrated in previous studies (Ridderinkhof et al., 2004), the posterior medial frontalcortex, more specifically the rostral ACC division, is the main brain area responsible for errorprocessing, suggesting that ASD patients have reduced posterior medial frontal cortexfunctioning. This area is involved when there is a need for adjustments to achieve goals(Ridderinkhof et al., 2004). The current finding that children with ASD have an impaired abilityto improve their response accuracy by slowing down the response speed on post-error trialscorresponds with this notion. However, it is necessary to take into account that observedsignificant group differences between ASD and typical controls are manifested not only in thebehavioral performance measures on reaction time tasks (RT, error rate) and associatedresponse monitoring indices (both to erroneous and correct) but also in terms of amplitude andlatency characteristics of ERP components preceding motor response (frontal and parietalP100, N100, P200, N200) and those reflecting context update and closure (e.g., P300, N450)in a visual oddball task (Sokhadze et al., 2009). The sum of the group differences across these
Sokhadze et al. Page 8
J Neurother. Author manuscript; available in PMC 2011 April 1.
NIH
-PA Author Manuscript
NIH
-PA Author Manuscript
NIH
-PA Author Manuscript
behavioral and stimulus- and response-averaged ERP indices of the ASD patients’ performanceis that it reflects global deficits in attentional processes, more specifically deficits in effectivedifferentiation of target and distracter stimuli. This latter interpretation is supported by thesignificant differences between the ASD patients and typically developing controls in termsof the stimulus-locked ERP amplitudes and latencies, and the correlation between subjects’behavioral performance measures and specific ERP components magnitude.
Post-error adaptive correction of responses might be explained by some recent neurobiologicalfindings. There are reports about an excessive preservation of short-distance connections (i.e.,local over-connectivity) and relative poor long-distance connections (i.e., distant under-connectivity) in the neocortex of individuals with autism (Casanova, 2005, 2006; Just et al.,2004; Williams & Casanova, 2009). These cortical connectivity abnormalities may explainwhy persons with autism tend to focus on details rather than perceiving the whole Gestalt. Thisover-focusing on details may imply an excessively laborious and ineffective way of handlingeach trial in the cognitive test, and lower availability of resources after an error when effort isneeded to react appropriately. This may result in insufficient activation of the ACC (Bogte etal., 2007), and thus error detection and post-error reaction may be hampered (Bauman &Kemper, 2005; Minshew et al., 2005). Structural and functional deficiencies of the ACC maycontribute to the atypical development of joint attention and social cognition in autism (Mundy,2003). Our interpretation of the results of this study is consistent with many aspects of theoryand research that suggests that ACC-mediated response monitoring may contribute to social-emotional and social-cognitive development in autism (Mundy, 2003). However, whileemphasizing the possible role of ACC-related self-monitoring deficits in autism, Mundy(2003) also noted that according to Devinsky and Luciano (1993) these ACC impairmentrelated behavioral deficits emerge only when they are combined with disturbances in otherrelated functional neural networks, e.g., dorsolateral prefrontal cortex.
There are several limitations in this study that should be mentioned. We could not rule outmedication effects in studying the neurobiology of autism. Approximately half of the childrenin our ASD sample were medicated at the time of study and there was a variability in the typeof medication children were taking. Therefore, it was not possible to analyze the associationsbetween specific classes of medications (i.e., stimulants, antidepressants, mood stabilizers) andthe ERN/Pe and behavioral measures in this study of only 14 ASD children. Another limitationor methodological issue to consider in this study was the large proportion of participants inboth the ASD and control children samples that had relatively low numbers of commissionerror trials. The number of errors was introducing some additional variability in the amplitudeand latency characteristics of individual subject’s data. This is a critical issue in all errormonitoring research that has to be considered given the large variance of number of error trialson which the ERN and Pe analyses are based. Finally, the dipole source localization in thisstudy was performed only on grand average ERN/Pe waveforms using realistic head model(for adults) and this prevented us from being able to make any statistical analysis to make anydefinitive statements about the individual differences in the ERN/Pe dipole localizations in ourpopulation of children and adolescents. The BESA-based dipole source localization was mostlyfor demonstration purposes taking into account the extensive literature on the likely ACCsource localization of ERN and Pe dipoles (for review see Holroyd & Coles, 2002).
CONCLUSIONSIn summary, the present findings reveal that autism is associated with reduced error processingand impaired behavioral correction after an error is made. Because adequate error processingis necessary for optimal behavioral performance, it is plausible that these deficits contribute tothe maintenance of the preservative behaviors typical for autism. Our study reports abnormalresponse monitoring and correction functions observed in behavioral and electrocortical
Sokhadze et al. Page 9
J Neurother. Author manuscript; available in PMC 2011 April 1.
NIH
-PA Author Manuscript
NIH
-PA Author Manuscript
NIH
-PA Author Manuscript
indices of the ACC in ASD that might be related to the restricted, repetitive behavior typicalof this neurodevelopmental disorder. This abnormal function may result from compromisedfunctional and structural connectivity in the neural circuitry subserving response monitoringand error correction. These findings suggest that functional abnormalities of the ACC reflectedin lower amplitude and delayed ERN and Pe measures may compromise response monitoringand contribute to behavioral repetition in ASD. Impairments in an ability to correctly and timelyevaluate committed error and to learn from errors may lead to behavior that is rigid andrepetitive rather than adaptively guided by action outcomes. Deficits in adjustments of erraticbehavior during interaction with peers may as well affect social interaction of children withautism. Elucidating the neurobiological basis and clinical significance of response monitoringand correction deficits in ASD represents a promising direction for further quantitative EEG-based research. The ERN and Pe along with behavioral performance measures can be used asfunctional outcome measures to assess the effectiveness of behavioral interventions (e.g. socialskills training) or neurotherapies (e.g., repetitive transcranial magnetic stimulation [rTMS] orneurofeedback) in children with autism spectrum disorders and thus may have importantpractical implications.
AcknowledgmentsThis work was supported by the National Institutes of Health grant R01 MH086784
ReferencesAman, MG.; Singh, NN. Aberrant Behavior Checklist - Community. Supplementary Manual. East
Aurora, NY: Slosson Educational Publications; 1994.American Psychiatric Association. Diagnostic and statistical manual of mental disorders (DSM-IVTR).
4th ed.. Washington, D.C: 2000. Text RevisedBarnea-Goraly N, Kwon H, Menon V, Eliez S, Lotspeich L, Reiss A. White matter structure in autism:
Preliminary evidence form diffusion tensor imaging. Biological Psychiatry 2004;55:323–326.[PubMed: 14744477]
Bates AT, Liddle PF, Kiehl KA, Ngan ETC. State dependent changes in error monitoring in schizophrenia.Journal Psychiatric Research 2004;38:347–356.
Bauman, ML.; Kemper, TL. Structural brain anatomy in autism: What is the evidence?. In: Bauman,ML.; Kemper, TL., editors. The neurobiology of autism. 2nd ed.. Baltimore: John Hopkins UniversityPress; 2005. p. 121-135.
Bogte H, Flamma B, van der Meere J, van Engeland H. Post-error adaptation in adults with highfunctioning autism. Neuropsychologia 2007;45:1707–1714. [PubMed: 17320119]
Bodfish, JW.; Symons, FJ.; Lewis, MH. Repetitive Behavior Scale. Western Carolina Center ResearchReports. 1999.
Bodfish JW, Symons FS, Parker DE, Lewis MH. Varieties of repetitive behavior in autism: Comparisonsto mental retardation. Journal of Autism and Developmental Disorders 2000;30:237–243. [PubMed:11055459]
Burle C, Possamai CA, Vidal F, Bonnet M, Hasbroucq T. Executive control in the Simon effect: anelectromyographic and distributional analysis. Psychological Research 2002;66:324–336. [PubMed:12466929]
Bush G, Luu P, Posner M. Cognitive and emotional influences in the anterior cingulate cortex. Trendsin Cognitive Science 2000;4:214–222.
Casanova, MF. Minicolumnar pathology in autism. In: Casanova, MF., editor. Recent developments inautism research. New York: Nova Biomedical Books; 2005. p. 133-144.
Casanova MF. Neuropathological and genetic findings in autism: the significance of a putativeminicolumnopathy. Neuroscientist 2006;12(5):435–441. [PubMed: 16957005]
Sokhadze et al. Page 10
J Neurother. Author manuscript; available in PMC 2011 April 1.
NIH
-PA Author Manuscript
NIH
-PA Author Manuscript
NIH
-PA Author Manuscript
Casanova MF, van Kooten I, Switala AE, van England H, Heinsen H, Steinbuch HWM, Hof PR, SchmitzC. Abnormalities of cortical minicolumnar organization in the prefrontal lobes of autistic patients.Clinical Neuroscience Research 2006a;6(3–4):127–133.
Casanova MF, van Kooten I, Switala AE, van England H, Heinsen H, Steinbuch HWM, Hof PR, TrippeJ, Stone J, Schmitz C. Minicolumnar abnormalities in autism. Acta Neuropathologica 2006b;112(3):287–303. [PubMed: 16819561]
Coles MGH, Scheffers MK, Holroyd CB. Why is there an ERN/Ne on correct trials. Responserepresentations, stimulus-related components, and the theory of error-processing. BiologicalPsychology 2001;56:173–189. [PubMed: 11399349]
Constantino, JN.; Gruber, CP. The Social Responsiveness Scale (SRS) Manual. Los Angeles CA: WesternPsychological Services; 2005.
Dawson G, Meltzoff A, Osterling J, Rinaldi J, Brown E. Children with autism fail to orient to naturally-occurring social stimuli. Journal of Autism and Developmental Disorders 1998;28:479–485.[PubMed: 9932234]
de Bruijn ER, Grootens KP, Verkes RJ, Buchholz V, Hummelen JW, Hulstijn W. Neural correlates ofimpulsive responding in borderline personality disorder: ERP evidence for reduced actionmonitoring. Journal of Psychiatry Research 2006;40:428–437.
Devinsky, O.; Luciano, D. The contributions of cingulate cortex to human behavior. I. In: Gabriel, M.;Vogt, BA., editors. Neurobiology of cingulate cortex and limbic thalamus: A comprehensivehandbook. Cambridge, MA: Birkhauser; 1993. p. 527-556.
Falkenstein M, Hoormann J, Christ S, Hohnsbein J. ERP components on reaction errors and theirfunctional significance: a tutorial. Biological Psychology 2000;51:87–107. 51. [PubMed: 10686361]
First, MB.; Spitzer, RL.; Gibbon, M.; Williams, JBW. Structured clinical interview for DSM-IV-TR axisI disorders – non- patient edition (SCID - NP). New York: New York State Psychiatric Institute;2001.
Fletcher EM, Kussmaul CL, Mangun GR. Estimation of Interpolation Errors in Scalp TopographicMapping. Electroctoencephalography and Clinical Neuraphysiology 1996;98:422–434.
Franken HA, van Strien JW, Franzek EJ, van de Wetering BJ. Error-processing deficits in patients withcocaine dependence. Biological Psychology 2007;75:45–51. [PubMed: 17196732]
Gehring WJ, Knight RT. Prefrontal-cingulate interactions in action monitoring. Nature Neuroscience2000;3:516–520.
Gehring WJ, Himle J, Nilsenson L. Action monitoring dysfunction in obsessive-compulsive disorder.Psychological Science 2000;11:1–6. [PubMed: 11228836]
Gehring WJ, Goss B, Coles MGH, Meyer DE, Donchin E. A neural system for error detection andcompensation. Psycholological Science 1993;4:385–390.
Hall G, Szectchman H, Hahmias C. Enhanced salience and emotion recognition in Autism: A PET study.American Journal of Psychiatry 2003;160:1439–1441. [PubMed: 12900306]
Haznedar M, Buchsbaum M, Wei T, Hof P, Cartwright C, Bienstock C, et al. Limbic circuitry in patientswith autism spectrum disorders studied with positron emission tomography and magnetic resonanceimaging. American Journal of Psychiatry 2000;157:1994–2001. [PubMed: 11097966]
Henderson H, Schwartz C, Mundy P, Burnette C, Sutton S, Zahka N, Pradella A. Response monitoring,the error-related negativity, and differences in social behavior in autism. Brain and Cognition2006;61:96–109. [PubMed: 16458401]
Herrmann MJ, Remmler J, Ehlis A-C, Heindrich A, 7 Fallgatter AJ. Source localization of the error-related-negativity (ERN/Ne) and positivity (Pe). Cognitive Brain Research 2004;20:294–299.[PubMed: 15183400]
Hill EL. Evaluating the theory of executive dysfunction in autism. Developmental Review 2004;24:189–233.
Holroyd A, Coles MGH. The neural basis of human error processing: Reinforcement learning, dopamine,and the error related negativity. Psychological Review 2002;109:679–709. [PubMed: 12374324]
Johannes S, Wieringa BM, Nager W, Rada D, Dengler R, Emrich HM, et al. Discrepant target detectionand action monitoring in obsessive–compulsive disorder. Psychiatry Research 2001;108:101–110.[PubMed: 11738544]
Sokhadze et al. Page 11
J Neurother. Author manuscript; available in PMC 2011 April 1.
NIH
-PA Author Manuscript
NIH
-PA Author Manuscript
NIH
-PA Author Manuscript
Just MA, Cherkassky V, Keller TA, Minshew NJ. Cortical activation and synchronization duringsequence comprehension in high-functioning autism: Evidence of underconnectivity. Brain2004;127:1811–1821. [PubMed: 15215213]
Klin A, Warren J, Schultz R, Volkmar F. The enactive mind, or from actions to cognition: Lessons fromautism. Philosophical Transaction of the Royal Society of London 2003;10:1–16.
Le Couteur, A.; Lord, C.; Rutter, M. The Autism Diagnostic Interview – Revised (ADI-R). Los Angeles,CA: Western Psychological Services; 2003.
Lord C, Rutter M, Goode S, Heemsbergen J, Jordan H, Mawhood L, Schopler E. Autism diagnosticobservation schedule: a standardized observation of communicative and social behavior. Journal ofAutism Developmental Disorders 1989;19(2):185–212.
Luu P, Tucker DM, Derryberry D, Reed M, Poulsen C. Electrophysiological responses to errors andfeedback in the process of action regulation. Psychological Science 2003;14:47–53. [PubMed:12564753]
Luu P, Flaisch T, Tucker DM. Medial frontal cortex in action monitoring. Journal of Neuroscience2000;20:464–469. [PubMed: 10627622]
Luu P, Tucker DML, Englander R, Lockfeld A, Lutsep H, Oken B. Localizing acute stroke-related EECchanges: Assessing the effects of spatial undersampling. Journal of Clinical Neurophysiology2001;18:302–317. [PubMed: 11673696]
Markela-Lerenc J, Ille N, Kaiser S, Fiedler P, Mundt C, Weisbrod M. Prefrontal-cingulate activationduring executive control: Which comes first? Cognitive Brain Research 2004;18:278–287. [PubMed:14741314]
Mathalon DH, Fedor M, Faustman WO, Gray M, Askari N, Ford JM. Response-monitoring dysfunctionin schizophrenia: an event-related brain potential study. Journal of Abnormal Psychology2002;111:22–41. [PubMed: 11866176]
Minshew, NJ.; Sweeney, JA.; Bauman, ML.; Webb, SJ. Neurological aspects of autism. In: Volkmar,FR.; Paul, R.; Klin, A.; Cohen, D., editors. Handbook of autism and pervasive developmentaldisorders. 3rd ed.. New York: Wiley & Sons; 2005. p. 473-514.
Mundy P. Joint attention and social-emotional approach behavior in children with autism. Developmentand Psychopathology 1995;7:63–82.
Mundy P. The neural basis of social impairments in autism: The role of the dorsal medial-frontal cortexand anterior cingulate system. Journal of Child Psychology and Psychiatry 2003;44:793–809.[PubMed: 12959489]
Mundy P, Neal R. Neural plasticity, joint attention and a transactional social-orienting model of autism.International Review of Mental Retardation 2001;23:139–168.
Nieuwenhuis S, Ridderinkhof KR, Blom J, Band GP, Kok A. Error-related brain potentials aredifferentially related to awareness of response errors: evidence from an antisaccade task.Psychophysiology 2001;38:752–760. [PubMed: 11577898]
Oldfield RC. The assessment and analysis of handedness: the Edinburgh inventory. Neuropsychologia1971;9:97–113. [PubMed: 5146491]
Overbeek TJM, Nieuwenhuis S, Ridderinkhof KR. Dissociable components of error processing. Journalof Psychophysiology 2005;19:319–329.
Ridderinkhof KR, Ullsperger M, Crone EA, Nieuwenhuis S. The role of the medial frontal cortex incognitive control. Science 2004;306:443–447. [PubMed: 15486290]
Ruchsow M, Spitzer M, Groen G, Grothe J, Kiefer M. Error processing and impulsiveness in normals:evidence from event-related potentials. Cognitive Brain Research 2005;24:317–325. [PubMed:15993769]
Russell, J. How executive disorders can bring about an inadequate theory of mind. In: Russell, J., editor.Autism as an executive disorder. Oxford, UK: Oxford University Press; 1997. p. 256-304.
Russell J, Jarrold C. Error-correction problems in autism: evidence for a monitoring impairment? Journalof Autism Developmental Disorders 1998;28:177–188.
Schreg, M. BESA. Getting started with BESA. Washington, DC: Workshop; 2005 Nov 17–18.Scherg M, Berg P. New concepts of brain source imaging and localization. Electroencephalography &
Clinical Neurophysiology - Supplement 1996;46:127–137. [PubMed: 9059786]
Sokhadze et al. Page 12
J Neurother. Author manuscript; available in PMC 2011 April 1.
NIH
-PA Author Manuscript
NIH
-PA Author Manuscript
NIH
-PA Author Manuscript

Sokhadze E, Tasman A, El-Baz A, Baruth J, Mathai G, Sears L, Casanova M. Event-related study ofnovelty processing abnormalities in autism. Applied Psychophysiology & Biofeedback 2009;34:37–51. [PubMed: 19199028]
Srinivasan R, Tucker DM, Murias M. Estimating the spatial Nyquist of the human EEC. BehaviorResearch Methods, Instruments, and Computers 1998;30:8–19.
Taylor SF, Stern ER, Gehring WJ. Neural systems for error monitoring: recent findings and theoreticalperspectives. Neuroscientist 2007;13:160–172. [PubMed: 17404376]
Thakkar KN, Polli FE, Joseph RM, Tuch DS, Hadjikhani N, Barton JJ, Manoach DS. Responsemonitoring, repetitive behaviour and anterior cingulate abnormalities in autism spectrum disorders(ASD). Brain 2008;131:2464–2478. [PubMed: 18550622]
Van Veen V, Carter CS. The timing of action-monitoring process in the anterior cingulate cortex. JournalCognitive Neuroscience 2002;14(4):593–602.
Vlamings PH, Jonkman LM, Hoeksma MR, van Engeland H, Kemner C. Reduced error monitoring inchildren with autism spectrum disorder: an ERP study. European Journal of Neurosciences2008;28:399–406.
Wechsler, D. Wechsler Intelligence Scale for Children- Fourth Edition. San Antonio, TX: HarcourtAssessment, Inc; 2003.
Wechsler, D. Wechsler Abbreviated Scale for Intelligence. San Antonio, TX: Harcourt Assessment, Inc;2004.
West R. Neural correlates of cognitive control and conflict detection in the Stroop and digit-locationtasks. Neuropsychologia 2003;41:1122–1135. [PubMed: 12667546]
Williams EL, Casanova MF. Autism and dyslexia: A spectrum of cognitive styles as defined byminicolumnar morphometry. Medical Hypotheses. 2009 E-publication. DOI: 10.1016/j.mehy.2009.08.003.
Yeung N, Cohen JD. The impact of cognitive deficits on conflict monitoring. Predictable dissociationsbetween the error-related negativity and N2. Psychological Science 2006;17:164–171. [PubMed:16466425]
Yeung N, Cohen JD, Botvinick MM. The neural basis of error detection: conflict monitoring and theerror-related negativity. Psychological Review 2004;111:931–959. [PubMed: 15482068]
Sokhadze et al. Page 13
J Neurother. Author manuscript; available in PMC 2011 April 1.
NIH
-PA Author Manuscript
NIH
-PA Author Manuscript
NIH
-PA Author Manuscript
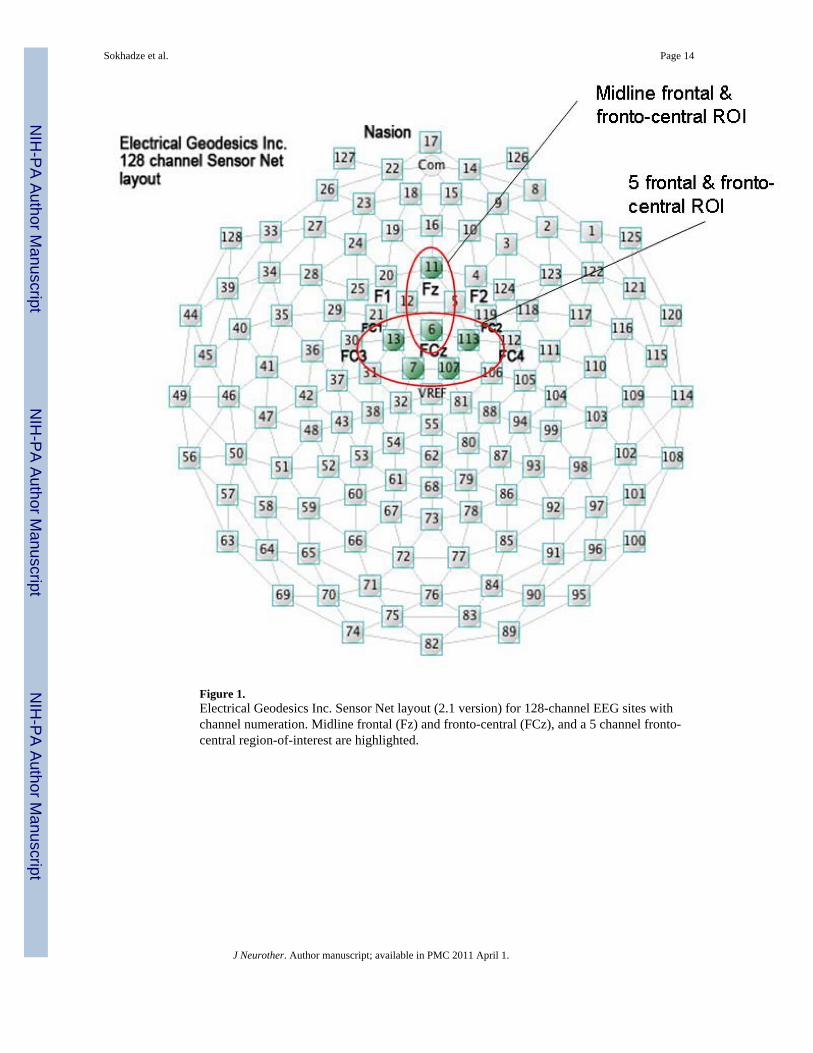
Figure 1.Electrical Geodesics Inc. Sensor Net layout (2.1 version) for 128-channel EEG sites withchannel numeration. Midline frontal (Fz) and fronto-central (FCz), and a 5 channel fronto-central region-of-interest are highlighted.
Sokhadze et al. Page 14
J Neurother. Author manuscript; available in PMC 2011 April 1.
NIH
-PA Author Manuscript
NIH
-PA Author Manuscript
NIH
-PA Author Manuscript
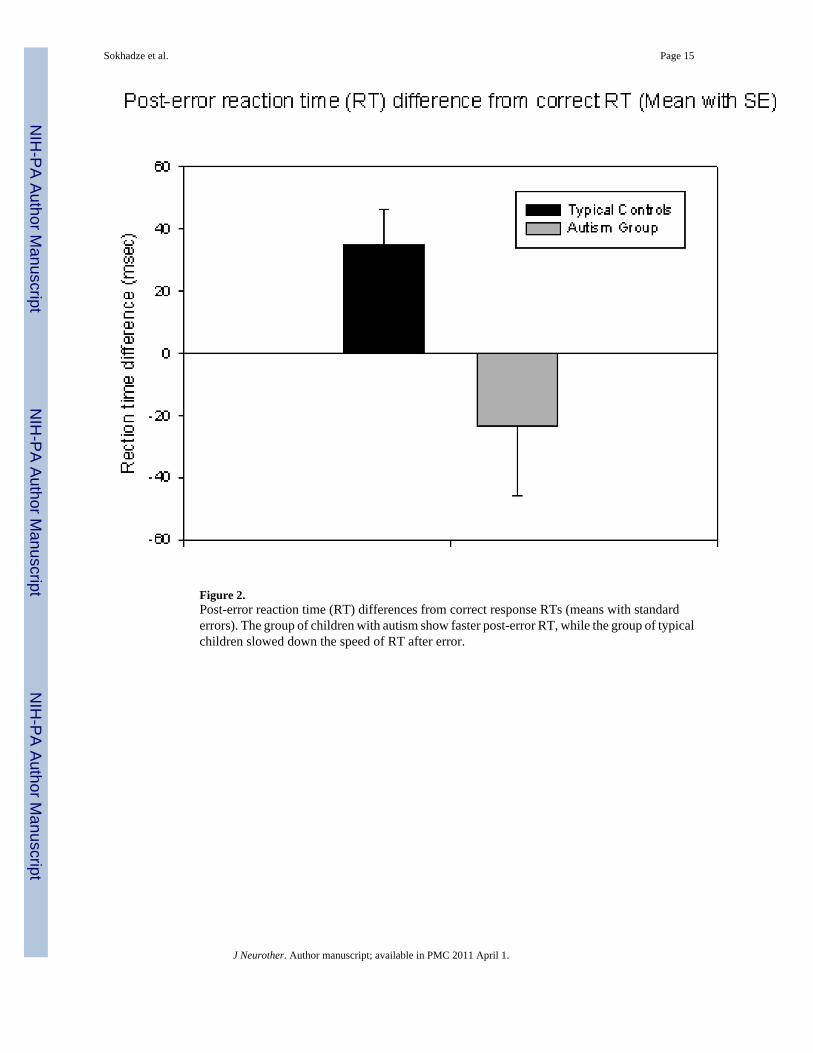
Figure 2.Post-error reaction time (RT) differences from correct response RTs (means with standarderrors). The group of children with autism show faster post-error RT, while the group of typicalchildren slowed down the speed of RT after error.
Sokhadze et al. Page 15
J Neurother. Author manuscript; available in PMC 2011 April 1.
NIH
-PA Author Manuscript
NIH
-PA Author Manuscript
NIH
-PA Author Manuscript
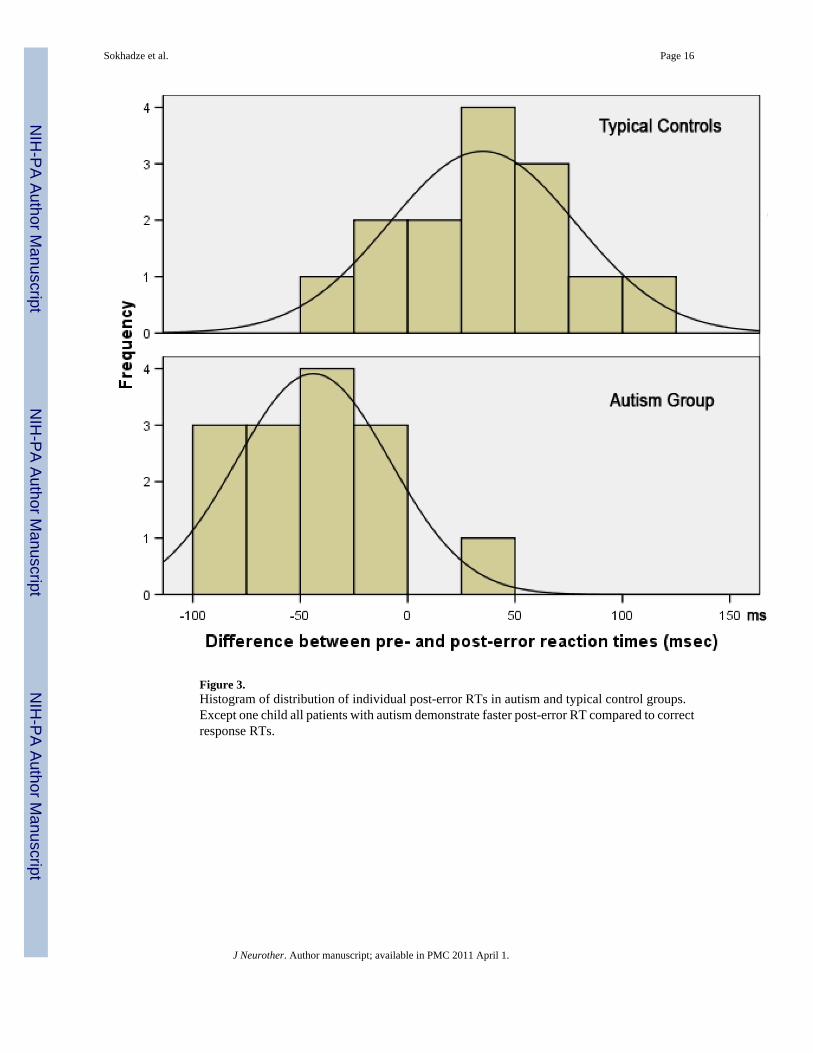
Figure 3.Histogram of distribution of individual post-error RTs in autism and typical control groups.Except one child all patients with autism demonstrate faster post-error RT compared to correctresponse RTs.
Sokhadze et al. Page 16
J Neurother. Author manuscript; available in PMC 2011 April 1.
NIH
-PA Author Manuscript
NIH
-PA Author Manuscript
NIH
-PA Author Manuscript
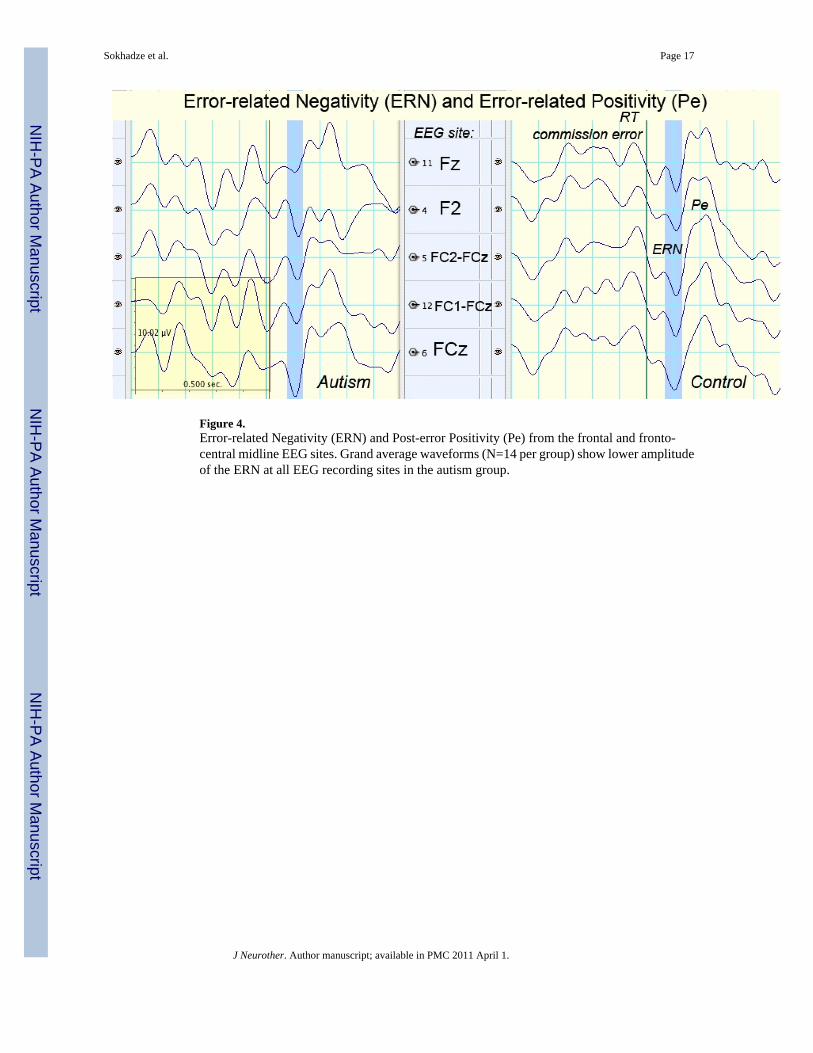
Figure 4.Error-related Negativity (ERN) and Post-error Positivity (Pe) from the frontal and fronto-central midline EEG sites. Grand average waveforms (N=14 per group) show lower amplitudeof the ERN at all EEG recording sites in the autism group.
Sokhadze et al. Page 17
J Neurother. Author manuscript; available in PMC 2011 April 1.
NIH
-PA Author Manuscript
NIH
-PA Author Manuscript
NIH
-PA Author Manuscript
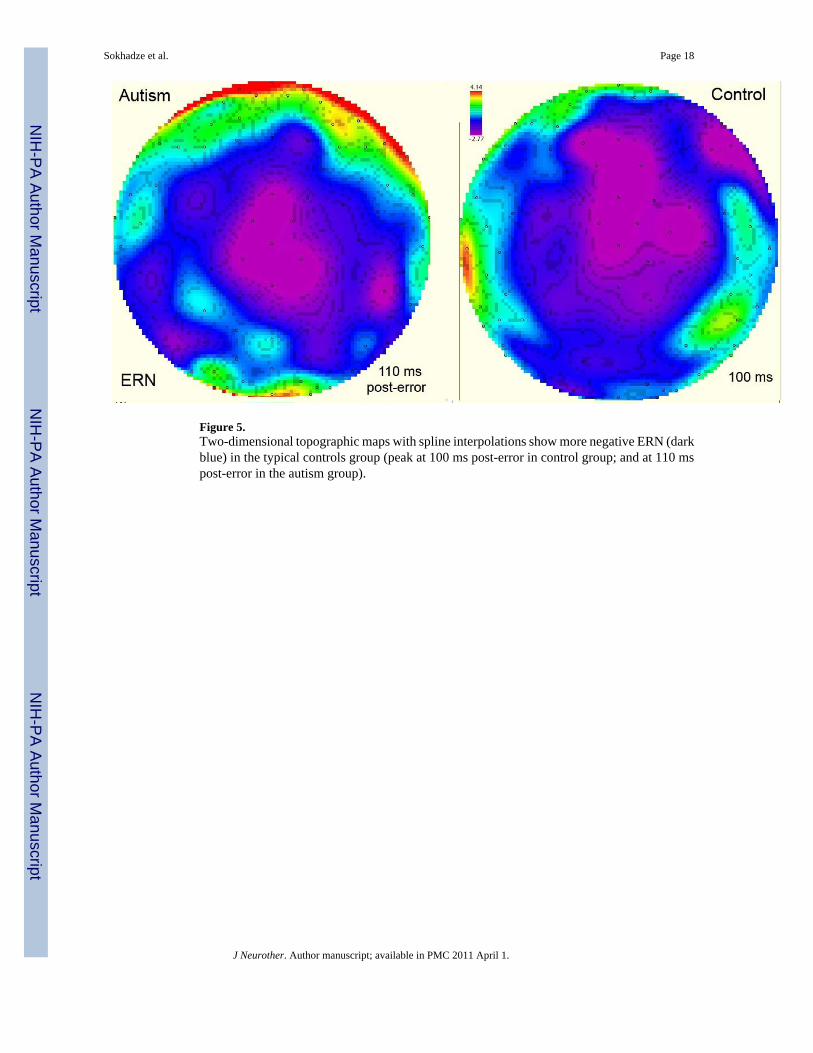
Figure 5.Two-dimensional topographic maps with spline interpolations show more negative ERN (darkblue) in the typical controls group (peak at 100 ms post-error in control group; and at 110 mspost-error in the autism group).
Sokhadze et al. Page 18
J Neurother. Author manuscript; available in PMC 2011 April 1.
NIH
-PA Author Manuscript
NIH
-PA Author Manuscript
NIH
-PA Author Manuscript
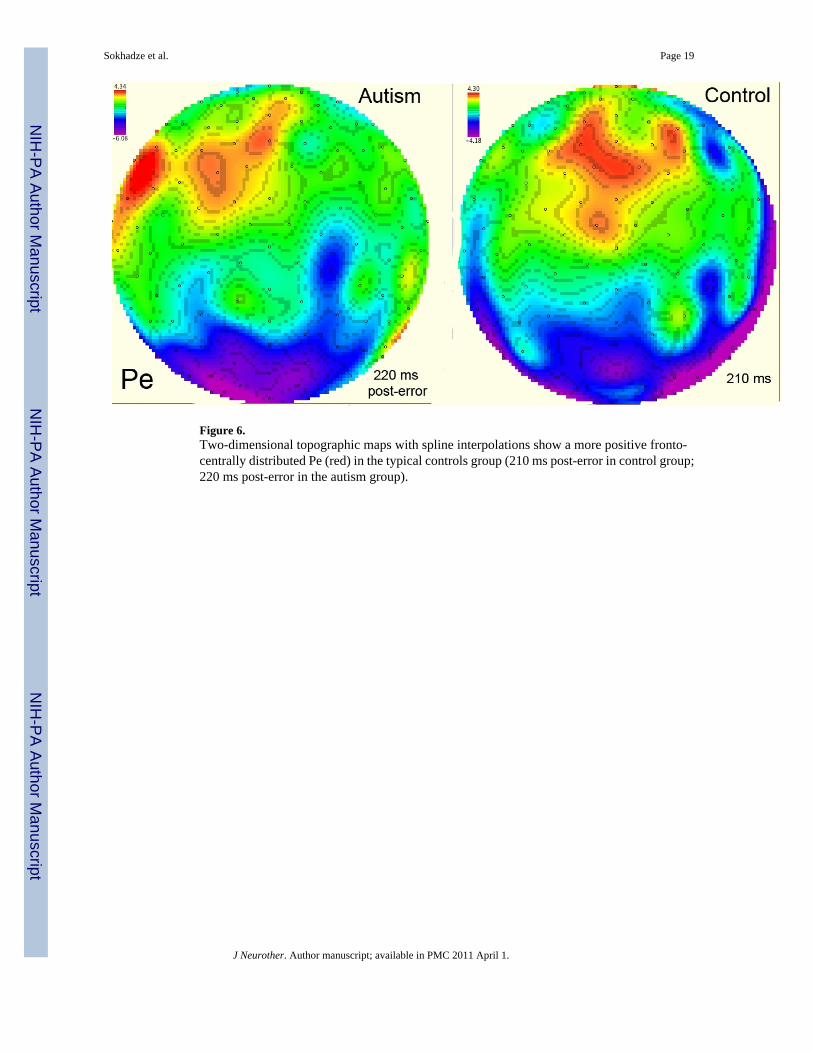
Figure 6.Two-dimensional topographic maps with spline interpolations show a more positive fronto-centrally distributed Pe (red) in the typical controls group (210 ms post-error in control group;220 ms post-error in the autism group).
Sokhadze et al. Page 19
J Neurother. Author manuscript; available in PMC 2011 April 1.
NIH
-PA Author Manuscript
NIH
-PA Author Manuscript
NIH
-PA Author Manuscript
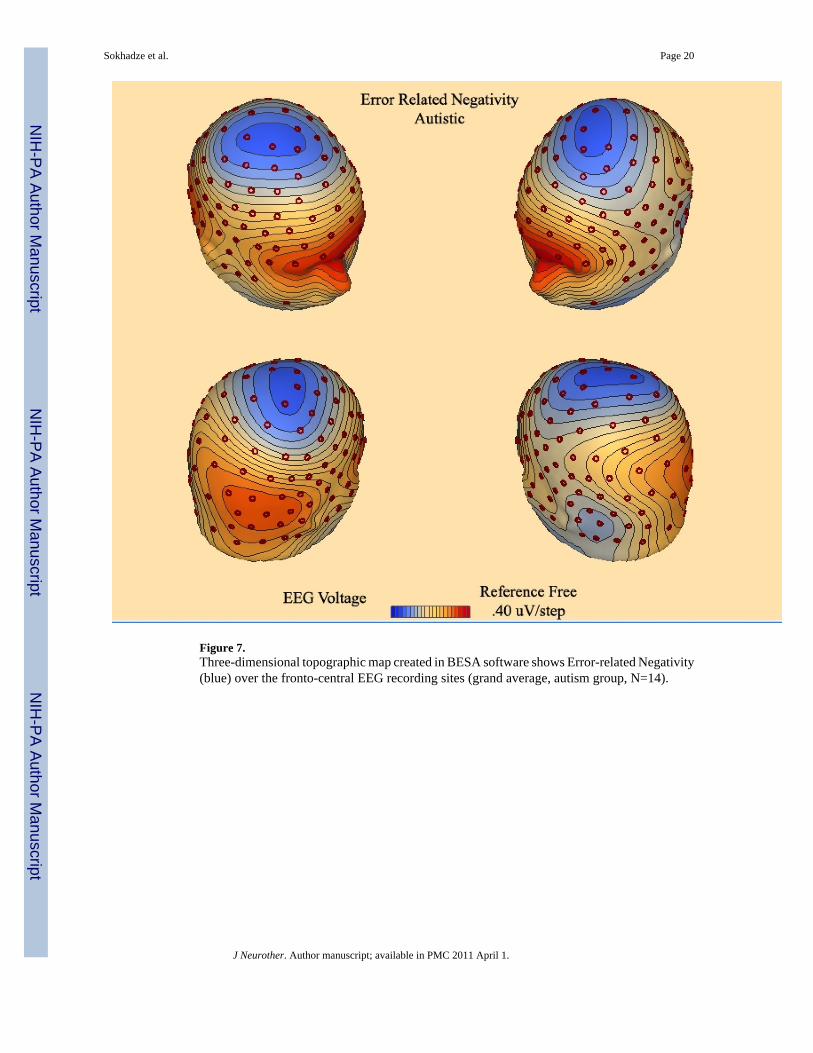
Figure 7.Three-dimensional topographic map created in BESA software shows Error-related Negativity(blue) over the fronto-central EEG recording sites (grand average, autism group, N=14).
Sokhadze et al. Page 20
J Neurother. Author manuscript; available in PMC 2011 April 1.
NIH
-PA Author Manuscript
NIH
-PA Author Manuscript
NIH
-PA Author Manuscript
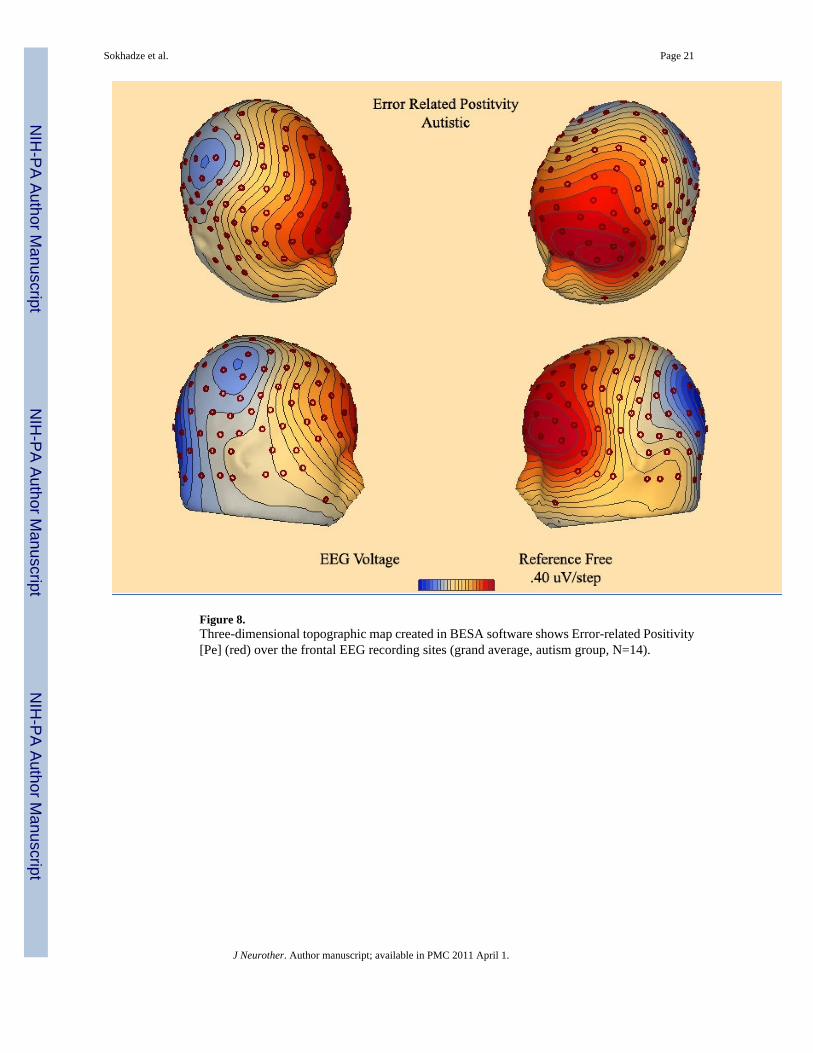
Figure 8.Three-dimensional topographic map created in BESA software shows Error-related Positivity[Pe] (red) over the frontal EEG recording sites (grand average, autism group, N=14).
Sokhadze et al. Page 21
J Neurother. Author manuscript; available in PMC 2011 April 1.
NIH
-PA Author Manuscript
NIH
-PA Author Manuscript
NIH
-PA Author Manuscript
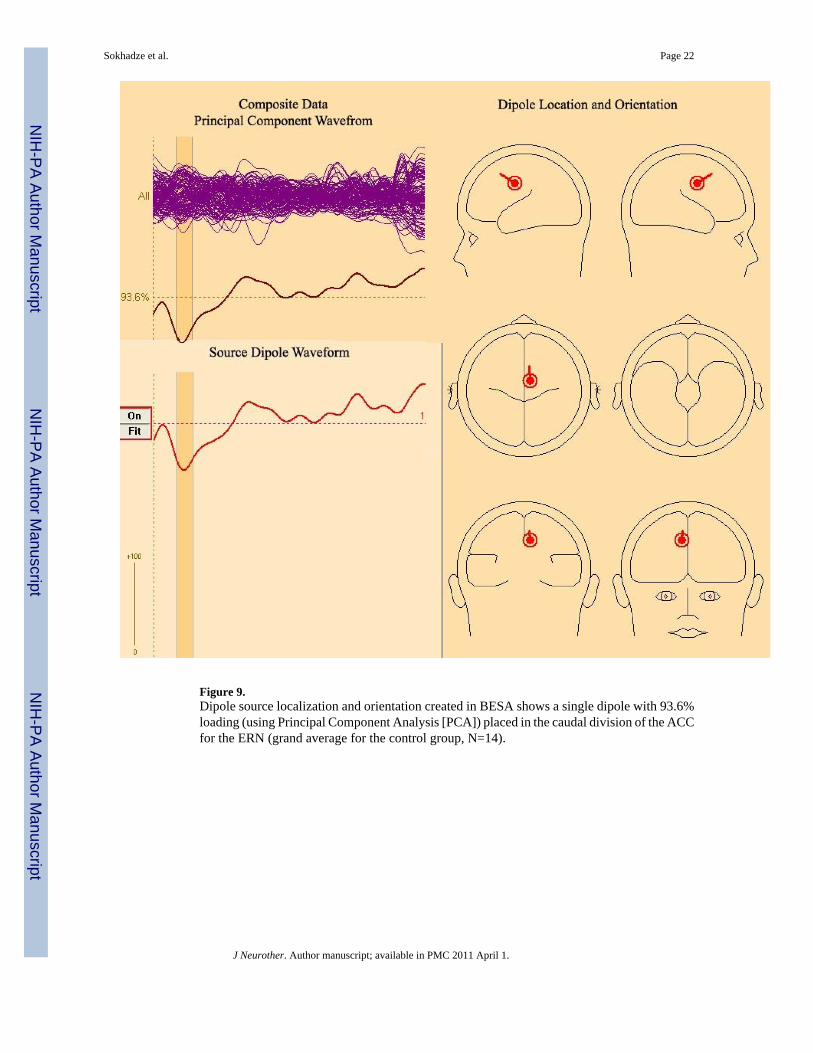
Figure 9.Dipole source localization and orientation created in BESA shows a single dipole with 93.6%loading (using Principal Component Analysis [PCA]) placed in the caudal division of the ACCfor the ERN (grand average for the control group, N=14).
Sokhadze et al. Page 22
J Neurother. Author manuscript; available in PMC 2011 April 1.
NIH
-PA Author Manuscript
NIH
-PA Author Manuscript
NIH
-PA Author Manuscript
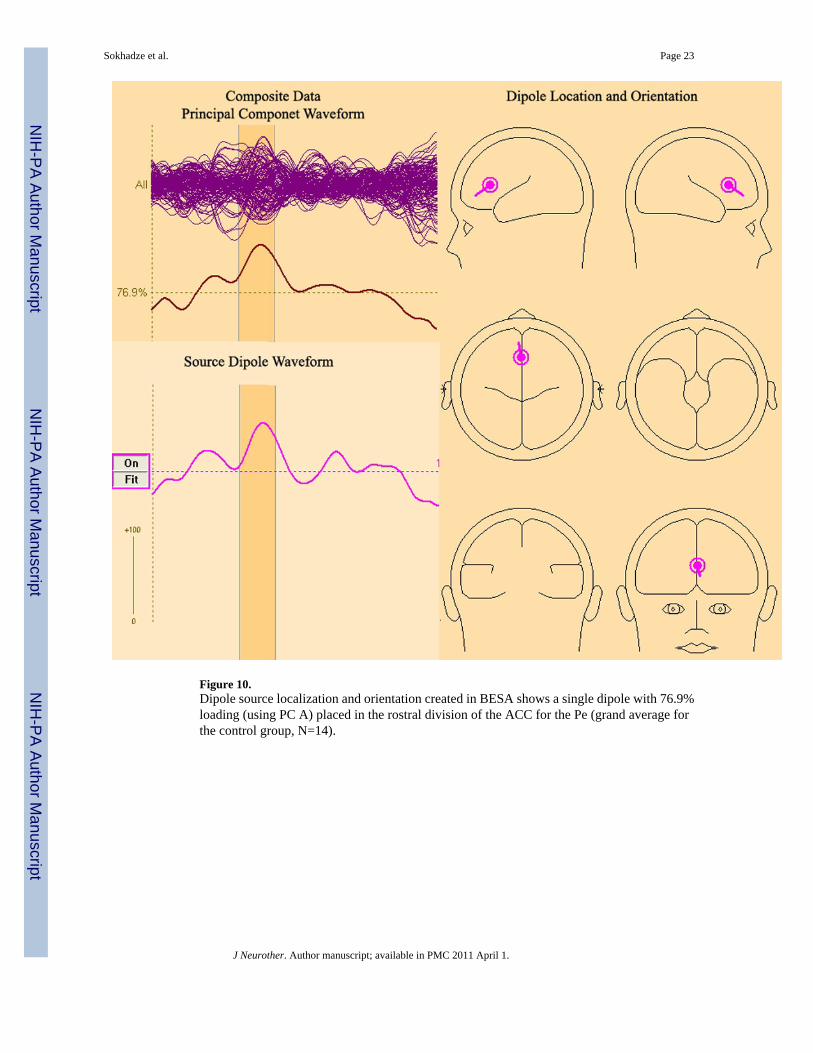
Figure 10.Dipole source localization and orientation created in BESA shows a single dipole with 76.9%loading (using PC A) placed in the rostral division of the ACC for the Pe (grand average forthe control group, N=14).
Sokhadze et al. Page 23
J Neurother. Author manuscript; available in PMC 2011 April 1.
NIH
-PA Author Manuscript
NIH
-PA Author Manuscript
NIH
-PA Author Manuscript
NIH
-PA Author Manuscript
NIH
-PA Author Manuscript
NIH
-PA Author Manuscript
Sokhadze et al. Page 24
Table 1
Descriptive Statistics of Behavioral Evaluations
Scale N Mean Std. Deviation
Repetitive behavior 1 14 27.79 15.34
Social awareness 2 14 83.00 8.20
Irritability 3 14 9.86 6.16
Hyperactivity 4 14 14.07 8.25
1Raw score for Repetitive Behavior Scale – Revised, higher score indicates more impairment (Bodfish, Symons, & Lewis, 1999)
2T-score for Social Awareness subscale of Social Responsiveness Scale, higher score indicates more impairment (Constantino & Gruber, 2005).
3Raw score for Irritability subscale of the Aberrant Behavior Checklist, higher score indicates more impairment (Aman & Singh, 1994)
4Raw score for Hyperactivity subscale of the Aberrant Behavior Checklist, higher score indicates more impairment (Aman & Singh, 1994)
J Neurother. Author manuscript; available in PMC 2011 April 1.
Copyright © 2022 FDOKUMEN