Impact of the economic and financial crisis on women, men ...
31
Impact of the economic and financial crisis on women, men and youth Sara Demofonti Introduction In recent years, a severe economic crisis has invested many countries in the world, resulting in a rather diverse landscape, as each country was of course affected in its own particular way. At the same time, economists have identified a limited set of main causes for the present situation, the most significant being a credit crisis, which then led to the collapse of confidence in the stock markets as well as a rise in commodity prices, notably that of oil. Around the world stock markets have fallen, large financial institutions have collapsed or been bought out, and governments in even the wealthiest nations have had to come up with rescue packages to bail out their financial systems. For the developing world, the rise in food prices as well as the knock-on effects from the financial instability and uncertainty in industrialized nations have had a compounding effect. The first signs of this so called Great Recession appeared on the world scene in August 2007. They were followed by a significant fall in GDP in 2009, considered to be the most important since the Thirties. The U.S. housing crisis and the subsequent collapse of Lehman Brothers has caused economic repercussions worldwide. Industrial production in Europe decreased rapidly in the autumn of 2008, and was further reduced a year later. In 2009, the global economy greatly suffered the effects of this financial crisis originating in the United States and having become more intense in the last part of 2008. The decline in economic activity in some of the most important countries of the world reached a peak in the first quarter of the year. In April 2009, and for the first time in Europe, the male unemployment rate exceeded that of women, even if rather slightly. Some signs of a partial recovery after the end of a recession in the third quarter of 2009, were perceived between the end of that year and 2010. In the period 2010-2011, the crisis spread to include sovereign debt and public finances of many countries, notably those of the Eurozone, which, as in the cases of Portugal, Ireland and Greece, have received substantial loans from of the IMF and the EU (the so-called rescue loans), but at the same time heavily suffered from restrictive budgetary policies on public accounts. It was in 2012 that the recession was joined by weak signs of recovery in some western countries. The growth in the euro area showed a negative rate in France and Germany, and industrial production declined, while the Southern European countries showed grave signs of stagnation.
-
Upload
khangminh22 -
Category
Documents
-
view
0 -
download
0
Transcript of Impact of the economic and financial crisis on women, men ...
Impact of the economic and financial crisis on women, men and youth
Sara Demofonti
Introduction
In recent years, a severe economic crisis has invested many countries in the world, resulting in a
rather diverse landscape, as each country was of course affected in its own particular way. At the
same time, economists have identified a limited set of main causes for the present situation, the
most significant being a credit crisis, which then led to the collapse of confidence in the stock
markets as well as a rise in commodity prices, notably that of oil.
Around the world stock markets have fallen, large financial institutions have collapsed or been
bought out, and governments in even the wealthiest nations have had to come up with rescue
packages to bail out their financial systems.
For the developing world, the rise in food prices as well as the knock-on effects from the financial
instability and uncertainty in industrialized nations have had a compounding effect.
The first signs of this so called Great Recession appeared on the world scene in August 2007. They
were followed by a significant fall in GDP in 2009, considered to be the most important since the
Thirties. The U.S. housing crisis and the subsequent collapse of Lehman Brothers has caused
economic repercussions worldwide. Industrial production in Europe decreased rapidly in the
autumn of 2008, and was further reduced a year later.
In 2009, the global economy greatly suffered the effects of this financial crisis originating in the
United States and having become more intense in the last part of 2008. The decline in economic
activity in some of the most important countries of the world reached a peak in the first quarter of
the year. In April 2009, and for the first time in Europe, the male unemployment rate exceeded
that of women, even if rather slightly.
Some signs of a partial recovery after the end of a recession in the third quarter of 2009, were
perceived between the end of that year and 2010.
In the period 2010-2011, the crisis spread to include sovereign debt and public finances of many
countries, notably those of the Eurozone, which, as in the cases of Portugal, Ireland and Greece,
have received substantial loans from of the IMF and the EU (the so-called rescue loans), but at the
same time heavily suffered from restrictive budgetary policies on public accounts.
It was in 2012 that the recession was joined by weak signs of recovery in some western countries.
The growth in the euro area showed a negative rate in France and Germany, and industrial
production declined, while the Southern European countries showed grave signs of stagnation.

Reactions and initiatives
Given its magnitude, the crisis has been receiving worldwide attention. Countries have been
reacting by adopting various measures to curb and combat its negative effects.
The crisis has affected almost all of the 28 Member States, but some have been hit the hardest.
For example Spain and Ireland, the two countries that, with the extraordinary economic growth
that affected them between 1990 and 2000, have become symbols of the potential that European
economic integration has to offer. Their growth models, based primarily on real estate for the first
and for the second financial services, have demonstrated to be fragile. Equally vulnerable the new
Member States of Central and Eastern Europe, the other major victims of the crisis. Most of them
do not yet benefit from the guarantees that the euro provides in situations precarious financial
and monetary. So many of these countries, most notably Bulgaria, Hungary and the Baltic
countries, they find themselves today to depend on financial aid from the International Monetary
Fund.
Almost all Member States have therefore developed a set of national plans, following almost all
the same chronology: first, a bailout of the banks, in order to avoid a total collapse of the financial
system; then an economic recovery plan, the scope could be expanded on a regular basis, and
which combines measures of investment, especially in infrastructure and energy, and consumer
support. Some Member States have undertaken in the preparation of plans to rescue the economy
and central areas most at risk, such as the French plan for the benefit of the automotive industry.
In Europe, economic policy has addressed the economic recession pursuing two strategies: 1)
efforts to bring the financial system to a more normal operating condition, and 2) supporting
aggregate demand with massive doses of monetary and fiscal stimulus. In 2009, the European
Council approved a European Economic Recovery Plan, which contains specific actions to be taken
at Community level: 1) increasing financial assistance to small and medium-sized enterprises
through the European Investment Bank, and 2) accelerating and improving the procedures of both
the European Social Fund (ESF) and the European Globalisation Adjustment Fund (EGF).
The Council of Europe has divided the actions to be taken against the crisis in five priority areas:
- Investing in people and modernizing labour markets;
- Unlocking business potential, especially that of small and medium-sized enterprises;
- Investing in knowledge and innovation;
- Investing in energy and climate change;
- Investing in international affairs.
An important study conducted by the European Commission on the 27 member states between
2008 and 2012, with the aim of investigating the impact of the economic crisis on women and
men and gender equality policies, underlined four conclusions:
- there has been a levelling down of gender gaps in employment, unemployment, wages, and
poverty during the crisis;
- the labour market behaviour of women during the crisis has been similar to that of men;
- there is evidence of a contained but uneven retrenchment in welfare provisions in the first
years of the crisis, there is a threat that fiscal consolidation may ultimately reduce both the
welfare provisions being made and the related employment with associated gender
equality impacts;
- in the vast majority of countries gender mainstreaming has not been implemented in policy
design and policy implementation over the crisis.
The European Parliament dedicated the 2013 International Women's Day (8 March) to "The
women's responses to the crisis". Within the framework of this event, the Parliament conducted a
telephone survey Flash in 27 European Member States, which involved 25,556 people and focused
on women and gender differences in the context of the crisis. The survey addresses some very
important arguments, the most significant of which are the different perceptions of the impact of
the crisis on gender differences and the specific areas that need to receive priority. With regard to
the former aspect, the survey has shown that nearly one in three Europeans argue that the crisis
has worsened notably the pay gap (30%) and made it more difficult for women to reconcile work
and private life (30%). As to the latter topic, two out of three Europeans (66%) believe that work
and the fight against unemployment, among young people in particular, are at the top of the
priority list. More women (72%) than men (60%) expressed their opinions.
In October 2008 the Australian government announced that it would guarantee bank deposits.
With the economy facing a recession, an economic stimulus package worth $10.4 billion was
announced. This included payments to seniors, careers and families. The payments were made in
December 2008, just in time for Christmas spending, and retailers predominantly reported strong
sales. The automotive industry was also given a helping hand, as several major lenders had
withdrawn from the market completely, leaving banks to fill the gaps in lending.
In the context of the European Commission’s Europe 2020 strategy, the flagship initiative 'Youth
on the move' is specifically targeting youth unemployment rates via a range of policies ranging
from concrete recommendations for Member States, new legislative initiatives and better
information tools for young people and stronger involvement of the business sector.
The European Commission also adopted in December 2011 a new 'Youth Opportunities Initiative',
calling on Member States to work on preventing early school leaving; helping youngsters develop
skills relevant to the labour market; ensuring work experience and on-the-job training and helping
young people find a first good job.
Women, men and the crisis
While the crisis has affected many countries, its effects have been different enough to evidence,
as in the case of Europe, a situation that is rather varied and different between women and men.
What follows is an analysis of the recent behaviour of the European labour market, which has
been suffering greatly from the economic recession.
It has been also provided an overview of what happened in some countries of the world with
particular emphasis on employment and unemployment rates in Australia, Canada, Japan, Mexico,
South Africa and United States.

Employment
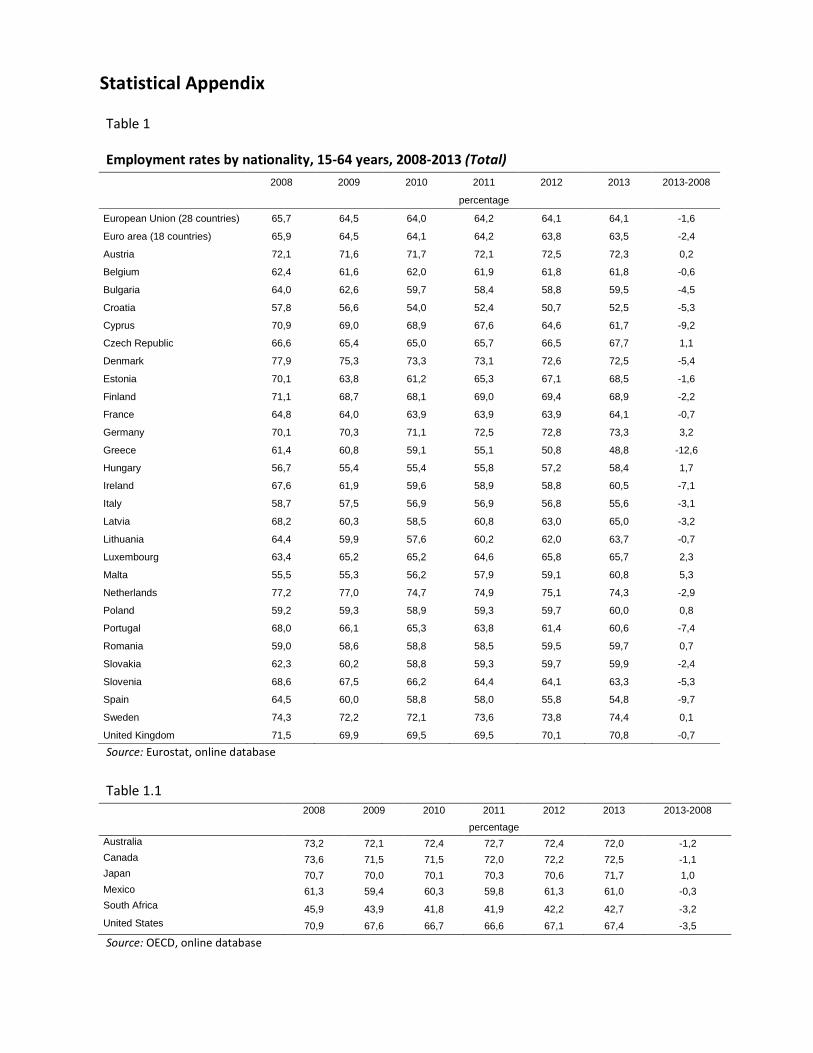
With regard to employment, the examined data show that the crisis has not equally affected all
countries. There has been a decline in employment everywhere except in Malta (+5.3%), Germany
(+3.2%), Luxembourg (+2.3%), Hungary (+1.7), Poland (+0.8%), Romania (+0.7%), Austria (+0.2%)
and Sweden (+0.1%) – countries that have not registered a strong job crisis, and instead boasted a
more or less relevant increase of values during the period 2008-2013. In countries such as Greece
(-12,6%), Spain (-9,7%), Cyprus (-9,2%) but also Portugal (-7,4%) and Ireland (-7,1%) where the
phenomenon has had a very strong impact, there has been a drastic reduction in employment
rates (see Table 1).
Where the decrease was significant, it concerned mostly men. In Greece, Spain, Cyprus and
Portugal the male employment rate fell by more than 10%, but Ireland, Croatia, Denmark and
Bulgaria also suffered significant loss (see Table 2). On the other side, men from Germany,
Hungary, Romania and Malta did not have a particularly difficult period in terms of employment;
their rates even increased by 1.9%, 1.3%, 1.2% and 1.1% respectively. In Luxembourg, Poland and
Czech Republic no decrease too.
In countries where the crisis has had a strong intensity, women have indeed been affected by the
phenomenon, albeit less than men. Thus, in the period 2008-2013, the decline in the employment
rate of women reached a maximum of -8.7% in Greece, -6.0 in Cyprus, -5.1% in Spain, -5.0% in
Slovenia, -4.6% in Portugal, and - 4.3% in Ireland (see Table 3). At the same time, an increase in
rates, over the five years analyzed, has been consistent in Malta (+9.3%), Germany (+4.5%) and
Luxembourg (+4.0%), while also visible, to a lesser extent, in Hungary, Czech Republic, Austria,
Belgium, Poland and Lithuania. The sectors of economic activity that most suffered the crisis, such
as industry and construction, are all male dominated, which explains the greater decrease in their
employment. On the contrary, despite the crisis, employment in the sector of household services,
which employs many women, continued to grow.
In the case of Italy, it was owing to a combination of many different factors that women, despite
the economic downturn, did not suffer a drastic reduction of their employment rates. Thanks to an
analysis of employment by gender, age groups, and sectors of economic activity, we may gain an
insight into the nature of those underlying causes. In fact, while for young women aged between
15 and 34 years there was a decrease in employment, this negative trend was balanced by a
growing number of foreign female workers aged 35-49 years, who work mainly in household
services, as well as of Italian women over 49 years. These women, who had known a particularly
low employment rate in the past, as a result of the various reforms of the pension system occurred
over time, have remained in the labour market. Furthermore it is important to emphasize that the
new growth of female employment rates that occurred in Italy for 2012 has been the result of new
family strategies adopted to face the job loss of a partner. In fact, Italian women have started to
look for, and find, jobs among the unqualified professions.
An analysis of what happened in the six countries considered outside of Europe can be seen that
only in Japan, the employment rate has increased, albeit by only one percentage point in the
period of the crisis, but has dropped significantly in the United States (- 3.5%) and South Africa (-
3.2%), but lower than values referred to Europe.
With reference to the employment rate for men in the same six countries, it should be noted that
the decrease occurred everywhere although with different intensity. It ranges from -5.1% for
South Africa and -3.9% for the United States to -0.8% for Japan. The female employment rate has
followed a different trend. It has increased in Japan (+2.7%) and Mexico (+1.2%) and decreased in
the other four countries, especially the United States (-3.2%).
One may thus conclude that in terms of a decrease in employment rates, women have less
suffered the effects of the crisis when compared to men. It should not be ignored, however, that
at the same time the quality of work has declined, with a widening gender gap for result. As a
matter of fact, the statistics for women show a growing number of atypical workers, of those
employed in unskilled occupations and among the over-skilled.
Unemployment
Among the 28 countries of the European Union, Germany is the only one where the
unemployment rate has decreased (-2.2%) in the years between 2008 and 2013 (see Table 4). In all
the other countries, the financial crisis has caused an increase, which in some cases has reached
alarming figures. In Greece (+19.7%), Spain (+14,8%) and Cyprus (+12,2%), the percentage has
more than doubled, but also Croatia, Portugal, Bulgaria, Lithuania, Italy and Slovenia have seen
their unemployment rates increase significantly. Increase in the remaining countries is lower.
The increase in male unemployment appears slightly higher than for women (see Tables 5-6).
In Ireland, Spain and Greece, among the few countries that have this data available, in addition to
the dramatic increase in unemployment, there has also been a remarkable growth in the long-
term unemployment rate (see Tables 7-9).
Outside Europe, the increase in the unemployment rate was much lower, the highest is that of
South Africa (-2.2%), the lowest that of Japan (+ 0.1%). In particular, women in the United States
are those who register the highest increase among the six countries considered (+ 1.7%).
The analysis of employment and unemployment rates, in particular in Europe, over recent years
carried out so far shows that the gap between men and women has reduced due to a worsening
of men’s conditions rather than to the improvement in those of women.
Part-time employment
During the economic and financial crisis period, part-time employment rates have not increased
that much (see Table 10). The growth is only slight everywhere and often following-up on trends
already visible for the previous four years. The most significant increase occurred in Ireland (+
5.4%), followed by Cyprus (+5.1%) and Spain (+4.1).
At the same time, several countries have witnessed a strong growth in involuntary part-time
employment (see Tables 13-15). In twenty-four out twenty-eight countries the percentages
increased, especially where there has also been more loss of employment. Ireland suffered an
increase of 30.1%, Spain 27.3%, Cyprus 25.5%, Greece 24.1% and Italy 21.5%. Hungary, Poland,
Bulgaria and Lithuania performed only slightly better. Totally different numbers occur for Germany
(-7.1%), Belgium (-4.9%).
A gender analysis of the trends of the part-time employment demonstrates that a plurality of
behaviours has been adopted. A slight decrease in the values for men is shown only in Croatia and
Poland, as opposed to a slight increase for the other countries (see Table 11). As for the women
(see Table 12), rates fell in Sweden (-3.2%), Croatia (-2.4%), Luxembourg (-2.3%), Poland (-0.5%)
and Denmark (-0.3%), whereas all other countries witnessed a mild growth reached low values,
with a maximum in Cyprus (+4.8 %) and Italy (+4.0%).
With reference to involuntary part-time employment, the numbers for men show the sharpest
increase and decrease in a framework of general increase that reaches, in some cases,
considerably high values: from 2008 to 2013, involuntary male part-time work increased by 38.1%
in Ireland, 31.0% in Cyprus, and 30.7% in Spain. Only five countries witnessed a decrease, notably
Luxembourg (-17.9 %) and Germany (-12.9%). For women, there is a general increase in rates of
involuntary part-time work, showing a big growth in some cases, like in Spain, Ireland, Greece and
Italy (see Table 15) and a significant decrease in three countries: Germany, Belgium and Finland.
In countries like Italy, where the general increase in part-time work has been caused by the growth
of involuntary part-time employment, there is no correlation with the number of children women
have, and therefore it is not possible to consider it a woman’s choice.
Temporary employment
None of the countries analysed witnessed notable changes with regard to temporary employment
(see Tables 16-18). There has been an evident decrease only in Spain (-7.0% for women and -5.3%
for men), probably because of past policies on labour flexibility.
Youth and the crisis
In times of economic recession, the labour market contracts and the number of unemployed
people rises sharply. But for young people these periods are doubly troubling. They are the first
targets of job cuts but also their transition from school to the job market becomes almost
impossible. This is one of the most significant conclusions of the latest UN World Youth Report
launched on 6 February 2012, which included a wide consultation process with youth all over the
world.
According to the report, during economic downturn, young people are often the ‘last in’ and the
‘first out’ – the last to be hired, and the first to be dismissed. This issue has particularly severe
implications for the school to work transition, the period when young people enter the labour
market to look for their first job. Young people’s participation in the labour force has been
shrinking. Between 1998 and 2008, the youth labour force participation rate fell from 54.7 to 50.8
per cent. In 2009, the world total of unemployed youth reached a historical record of 75.8 million.
All over the world, youth unemployment rates are significantly higher than adult rates, though with
considerable variation.

The UN Secretary-General’s high-level panel report on sustainable development, “Resilient People,
Resilient Planet”, states that young people are the most affected by the economic crisis. There are
currently 81 million youth unemployed and an additional 152 million work but live in households
that earn less than the equivalent of 1 euro a day.
This situation results in a lack of hope to young people and social instability.
In Europe, youth unemployment has worsened over 2011 to an unprecedented level of 5.5 million
with more than 10 million people unemployed for more than a year. In 2013, the youth
unemployment rate was 23.4% in the EU 28 countries and 24.0% in the Euro area, up from
respectively 21.4% and 20.8 % in 2011.
In Spain, Ireland and Greece, unemployment rates for youth almost doubled, reaching more than
40% in the case of Spain and reversing all of the earlier positive trends experienced over the 2000s.
With the exception of Austria, Germany and Switzerland, none of the advanced economies saw a
return of unemployment rates for younger people to pre-crisis levels in 2011.
To better understand the effect that the economic and financial crisis has produced on young
people in the various countries of the world the "NEET" population has been analyzed. The NEET
are young people aged between 15 and 29 who are neither in employment nor in education and
training and for these reasons are at risk of becoming socially excluded. They are individuals with
income below the poverty-line and lacking the skills to improve their economic situation.
Data referred to Europe show that the share of young people who are neither employed nor in
education or training aged 15-29 as a percentage of the total number of young people in the
corresponding age group is significantly increased in Greece, Croatia, Cyprus, Bulgaria, Italy and
Romania (see table 19-21). In other countries around the world the values are not increased so
much (Canada, Australia, United States), instead in Mexico there was a decrease (-1.8%). The most
affected by increases are young males in Greece, Cyprus and Croatia and with much lower values
the Australians and Canadians (1.9%). More modest increases for women, however, exceed 10
percentage points in Greece.
Measuring the crisis
At the 43rd
Commission on the Status of Women in 2009, participants in an interactive expert
panel on the gender side of the financial crisis, highlighted the role of the UN as a democratic
forum for the heads of state and ministers of all sectors, not just economic ones, to discuss the
measures to be taken to overcome the financial crisis and to examine its causes. On that same
occasion, Italy promoted the particular need to improve the collection and use of sex-
disaggregated data for assessing the differential impact of the financial crisis on women and men.
A same invitation to reconsider the formulation of gender indicators has been embraced by the
European Commission in the report The Impact of the economic crisis on the situation of women
and men and on gender equality policies, emphasizing that “the apparent improvement in the
majority of gender gaps, despite the worsening of employment, wages, working conditions and

income for men and women raises questions about how the gender gaps are able to measure
gender equality in times of downturn.”
In late 2010, the UNECE Task Force on Gender Equality Indicators was established. Its efforts, which
involved many European countries as well as international agencies and organizations, has
produced interesting suggestions for the selection and use of appropriate indicators when
measuring phenomena like the recent crisis. The results, which include the proposal of sets of
indicators grouped by topics, have been presented in the Task Force report on “Indicators of
Gender Equality”.
Conclusions
- Worldwide has been experiencing a financial and economic crisis; its effects have been different
across the States and for women, men and youth
- Labour markets across the EU were severely impacted by the recession
- In Europe, nearly all 28 countries have witnessed a decrease in the employment rate (Malta,
Germany, and Luxembourg excepted) as well as an increase in the unemployment rate (apart from
Germany)
- While the gender gap in employment and unemployment rates has diminished during the crisis,
this has been due to a worsening of men’s conditions on the labour market rather than to the
improvement in those of women
- Young people are the most affected by the economic crisis
- Male employment appears to have been more severely hit by the crisis, probably related to the
fact that lay-offs have occurred especially in “male-dominated” sectors. Economists, however, fear
that the effect of the crisis on women will soon arrive
- There is a strong need for appropriate indicators to correctly measure the gender differences.
The apparent reduction of most of the gender gaps occurred in combination with a worsening in
terms of employment, wages, working conditions and income.

References
Banca d’Italia (2013), Cronologia della crisi 2007-2012, a cura di Enrico Galanti, Quaderni
di Ricerca Giuridica n° 72, Appendice
European Commission (2009), Report from the Commission to the Council, the European
Parliament, the European Economic and Social Committee and the Committee of the
Regions. Equality between women and men – 2009. Available at: http://eur-
lex.europa.eu/LexUriServ/LexUriServ.do?uri=COM:2009:0077:FIN:EN:PDF
European Commission (2013), The impact of the economic crisis on the situation of
women and men and on gender equality policies, Luxembourg, Publications Office of the
European Union. Available at: http://ec.europa.eu/justice/gender-
equality/files/documents/130410_crisis_report_en.pdf
European Parliament (2011), Gender aspects of the economic downturn and financial
crisis, Brussels. Available at:
http://www.europarl.europa.eu/RegData/etudes/etudes/join/2011/453208/IPOL-
FEMM_ET(2011)453208_EN.pdf
Eurostat (2014), LFS data. 2007-2013. Available at:
http://epp.eurostat.ec.europa.eu/portal/page/portal/employment_unemployment_lfs/d
ata/data base
http://ec.europa.eu/social/main.jsp?catId=748&langId=en
http://ec.europa.eu/social/main.jsp?langId=en&;catId=950&newsId=1143&furtherNews=
yes
http://ec.europa.eu/social/main.jsp?langId=en&;catId=950&newsId=1143&furtherNews=
yes
http://ec.europa.eu/youthonthemove/about/policy-actions/index_en.htm
http://www.glieuros.eu/L-Europa-e-la-crisi,2744.html?lang=fr
http://www.globalissues.org/article/768/global-financial-
crisis#Acrisissoseveretheworldfinancialsystemisaffected
http://www.unric.org/en/youth-unemployment/27414-youth-the-hardest-hit-by-the-
global-financial-crisis
International Labour Organisation (2009), Global employment trends for women.
Geneva. Available at:
http://www.ilo.org/wcmsp5/groups/public/@dgreports/@dcomm/documents/publicati
on/wcms _103456.pdf
International Labour Organisation (2013), Global Employment Trends for youth 2013: A
generation at risk. Geneva. Available at: http://ilo.org/wcmsp5/groups/public/---
dgreports/---dcomm/documents/publication/wcms_212423.pdf
International Labour Organisation (2014), Global Employment Trends 2014: The risk of a
jobless recovery. Geneva. Available at: http://ilo.org/wcmsp5/groups/public/---
dgreports/---dcomm/---publ/documents/publication/wcms_233953.pdf
Istat (2013), Rapporto Annuale 2013. La situazione del Paese. Roma
Istat (2013), Noitalia. 100 statistiche per capire il Paese in cui viviamo. Roma
OECD (2014), OECD Factbook. Available at: http://www.oecd-
ilibrary.org/docserver/download/3013081e.pdf?expires=1414156092&id=id&accname=g
uest&checksum=78BFC60900F8F7A3E2E4DD082CF9435F
Seguino Stephanie (2009), The Global economic crisis, its gender implications, and policy
responses. Burlington, University of Vermont. Available at:
http://www.uvm.edu/~sseguino/pdf/global_crisis.pdf
Smith Mark (2009), Analysis note: Gender equality and Recession, Grenoble. Ecole de
Management. Available at: http://www.epp-
women.org/media/documents/2009/Equality-crisis-final[1]_copy_1.pdf
United Nations. United Nations Secretary-General’s High-level Panel on Global Sustainability
(2012), Resilient People, Resilient Planet: A future worth choosing. New York.
Statistical Appendix
Table 1
Employment rates by nationality, 15-64 years, 2008-2013 (Total)
2008 2009 2010 2011 2012 2013 2013-2008
percentage
European Union (28 countries) 65,7 64,5 64,0 64,2 64,1 64,1 -1,6
Euro area (18 countries) 65,9 64,5 64,1 64,2 63,8 63,5 -2,4
Austria 72,1 71,6 71,7 72,1 72,5 72,3 0,2
Belgium 62,4 61,6 62,0 61,9 61,8 61,8 -0,6
Bulgaria 64,0 62,6 59,7 58,4 58,8 59,5 -4,5
Croatia 57,8 56,6 54,0 52,4 50,7 52,5 -5,3
Cyprus 70,9 69,0 68,9 67,6 64,6 61,7 -9,2
Czech Republic 66,6 65,4 65,0 65,7 66,5 67,7 1,1
Denmark 77,9 75,3 73,3 73,1 72,6 72,5 -5,4
Estonia 70,1 63,8 61,2 65,3 67,1 68,5 -1,6
Finland 71,1 68,7 68,1 69,0 69,4 68,9 -2,2
France 64,8 64,0 63,9 63,9 63,9 64,1 -0,7
Germany 70,1 70,3 71,1 72,5 72,8 73,3 3,2
Greece 61,4 60,8 59,1 55,1 50,8 48,8 -12,6
Hungary 56,7 55,4 55,4 55,8 57,2 58,4 1,7
Ireland 67,6 61,9 59,6 58,9 58,8 60,5 -7,1
Italy 58,7 57,5 56,9 56,9 56,8 55,6 -3,1
Latvia 68,2 60,3 58,5 60,8 63,0 65,0 -3,2
Lithuania 64,4 59,9 57,6 60,2 62,0 63,7 -0,7
Luxembourg 63,4 65,2 65,2 64,6 65,8 65,7 2,3
Malta 55,5 55,3 56,2 57,9 59,1 60,8 5,3
Netherlands 77,2 77,0 74,7 74,9 75,1 74,3 -2,9
Poland 59,2 59,3 58,9 59,3 59,7 60,0 0,8
Portugal 68,0 66,1 65,3 63,8 61,4 60,6 -7,4
Romania 59,0 58,6 58,8 58,5 59,5 59,7 0,7
Slovakia 62,3 60,2 58,8 59,3 59,7 59,9 -2,4
Slovenia 68,6 67,5 66,2 64,4 64,1 63,3 -5,3
Spain 64,5 60,0 58,8 58,0 55,8 54,8 -9,7
Sweden 74,3 72,2 72,1 73,6 73,8 74,4 0,1
United Kingdom 71,5 69,9 69,5 69,5 70,1 70,8 -0,7
Source: Eurostat, online database
Table 1.1
2008 2009 2010 2011 2012 2013 2013-2008
percentage Australia 73,2 72,1 72,4 72,7 72,4 72,0 -1,2 Canada 73,6 71,5 71,5 72,0 72,2 72,5 -1,1 Japan 70,7 70,0 70,1 70,3 70,6 71,7 1,0 Mexico 61,3 59,4 60,3 59,8 61,3 61,0 -0,3 South Africa 45,9 43,9 41,8 41,9 42,2 42,7 -3,2 United States 70,9 67,6 66,7 66,6 67,1 67,4 -3,5
Source: OECD, online database
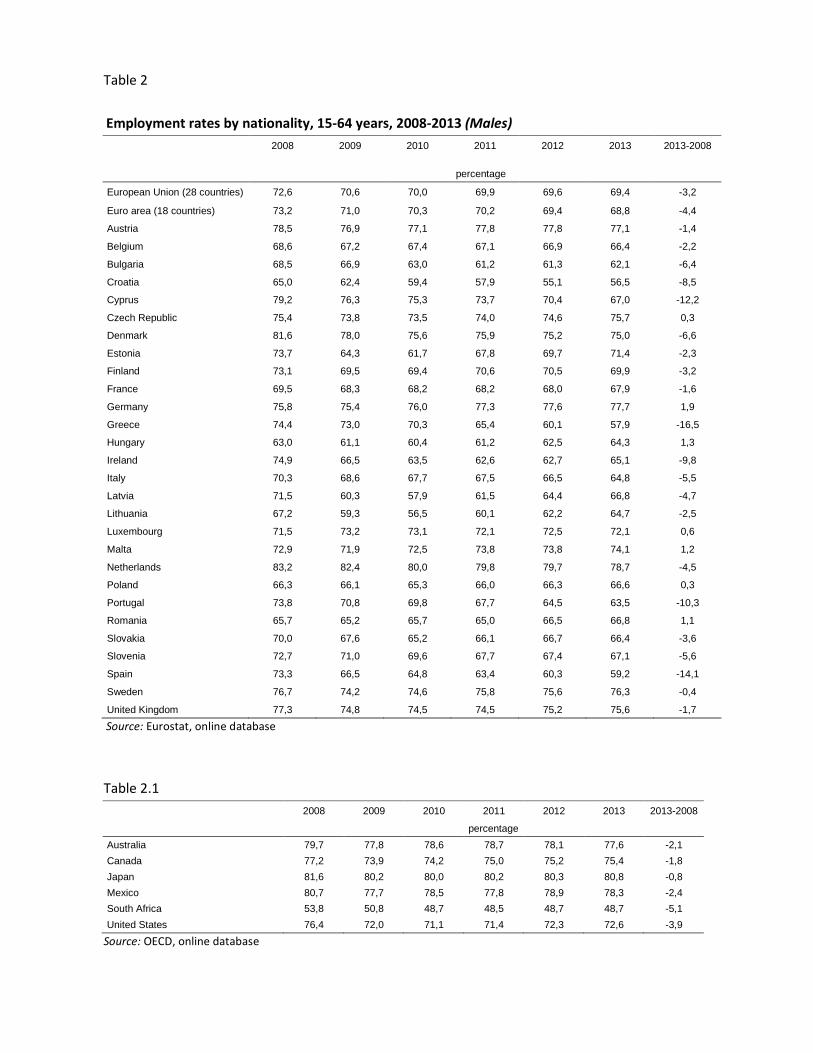
Table 2
Employment rates by nationality, 15-64 years, 2008-2013 (Males)
2008 2009 2010 2011 2012 2013 2013-2008 percentage
European Union (28 countries) 72,6 70,6 70,0 69,9 69,6 69,4 -3,2
Euro area (18 countries) 73,2 71,0 70,3 70,2 69,4 68,8 -4,4
Austria 78,5 76,9 77,1 77,8 77,8 77,1 -1,4
Belgium 68,6 67,2 67,4 67,1 66,9 66,4 -2,2
Bulgaria 68,5 66,9 63,0 61,2 61,3 62,1 -6,4
Croatia 65,0 62,4 59,4 57,9 55,1 56,5 -8,5
Cyprus 79,2 76,3 75,3 73,7 70,4 67,0 -12,2
Czech Republic 75,4 73,8 73,5 74,0 74,6 75,7 0,3
Denmark 81,6 78,0 75,6 75,9 75,2 75,0 -6,6
Estonia 73,7 64,3 61,7 67,8 69,7 71,4 -2,3
Finland 73,1 69,5 69,4 70,6 70,5 69,9 -3,2
France 69,5 68,3 68,2 68,2 68,0 67,9 -1,6
Germany 75,8 75,4 76,0 77,3 77,6 77,7 1,9
Greece 74,4 73,0 70,3 65,4 60,1 57,9 -16,5
Hungary 63,0 61,1 60,4 61,2 62,5 64,3 1,3
Ireland 74,9 66,5 63,5 62,6 62,7 65,1 -9,8
Italy 70,3 68,6 67,7 67,5 66,5 64,8 -5,5
Latvia 71,5 60,3 57,9 61,5 64,4 66,8 -4,7
Lithuania 67,2 59,3 56,5 60,1 62,2 64,7 -2,5
Luxembourg 71,5 73,2 73,1 72,1 72,5 72,1 0,6
Malta 72,9 71,9 72,5 73,8 73,8 74,1 1,2
Netherlands 83,2 82,4 80,0 79,8 79,7 78,7 -4,5
Poland 66,3 66,1 65,3 66,0 66,3 66,6 0,3
Portugal 73,8 70,8 69,8 67,7 64,5 63,5 -10,3
Romania 65,7 65,2 65,7 65,0 66,5 66,8 1,1
Slovakia 70,0 67,6 65,2 66,1 66,7 66,4 -3,6
Slovenia 72,7 71,0 69,6 67,7 67,4 67,1 -5,6
Spain 73,3 66,5 64,8 63,4 60,3 59,2 -14,1
Sweden 76,7 74,2 74,6 75,8 75,6 76,3 -0,4
United Kingdom 77,3 74,8 74,5 74,5 75,2 75,6 -1,7
Source: Eurostat, online database
Table 2.1
2008 2009 2010 2011 2012 2013 2013-2008
percentage Australia 79,7 77,8 78,6 78,7 78,1 77,6 -2,1
Canada 77,2 73,9 74,2 75,0 75,2 75,4 -1,8
Japan 81,6 80,2 80,0 80,2 80,3 80,8 -0,8
Mexico 80,7 77,7 78,5 77,8 78,9 78,3 -2,4
South Africa 53,8 50,8 48,7 48,5 48,7 48,7 -5,1
United States 76,4 72,0 71,1 71,4 72,3 72,6 -3,9
Source: OECD, online database

Table 3
Employment rates by nationality, 15-64 years, 2008-2013 (Females)
2008 2009 2010 2011 2012 2013 2013-2008
percentage
European Union (28 countries) 58,8 58,3 58,1 58,4 58,6 58,8 0,0
Euro area (18 countries) 58,5 58,1 57,9 58,3 58,2 58,3 -0,2
Austria 65,8 66,4 66,4 66,5 67,3 67,6 1,8
Belgium 56,2 56,0 56,5 56,7 56,8 57,2 1,0
Bulgaria 59,5 58,3 56,4 55,6 56,3 56,8 -2,7
Croatia 50,7 51,0 48,8 47,0 46,2 48,5 -2,2
Cyprus 62,9 62,3 63,0 62,1 59,4 56,9 -6,0
Czech Republic 57,6 56,7 56,3 57,2 58,2 59,6 2,0
Denmark 74,1 72,7 71,1 70,4 70,0 70,0 -4,1
Estonia 66,6 63,2 60,8 63,0 64,7 65,7 -0,9
Finland 69,0 67,9 66,9 67,4 68,2 67,8 -1,2
France 60,2 59,8 59,7 59,7 60,0 60,5 0,3
Germany 64,3 65,2 66,1 67,7 68,0 68,8 4,5
Greece 48,6 48,9 48,0 45,0 41,7 39,9 -8,7
Hungary 50,6 49,9 50,6 50,6 52,1 52,8 2,2
Ireland 60,2 57,4 55,8 55,1 55,1 55,9 -4,3
Italy 47,2 46,4 46,1 46,5 47,1 46,5 -0,7
Latvia 65,2 60,4 59,0 60,2 61,7 63,4 -1,8
Lithuania 61,8 60,4 58,5 60,2 61,8 62,8 1,0
Luxembourg 55,1 57,0 57,2 56,9 59,0 59,1 4,0
Malta 37,7 38,0 39,5 41,5 44,0 47,0 9,3
Netherlands 71,1 71,5 69,3 69,9 70,4 69,9 -1,2
Poland 52,4 52,8 52,6 52,7 53,1 53,4 1,0
Portugal 62,5 61,5 61,0 60,1 58,5 57,9 -4,6
Romania 52,5 52,0 52,0 52,0 52,6 52,6 0,1
Slovakia 54,6 52,8 52,3 52,5 52,7 53,4 -1,2
Slovenia 64,2 63,8 62,6 60,9 60,5 59,2 -5,0
Spain 55,4 53,3 52,8 52,6 51,2 50,3 -5,1
Sweden 71,8 70,2 69,6 71,3 71,8 72,5 0,7
United Kingdom 65,8 65,0 64,6 64,5 65,1 65,9 0,1
Source: Eurostat, online database
Table 3.1
2008 2009 2010 2011 2012 2013 2013-2008
percentage
Australia 66,7 66,3 66,1 66,7 66,6 66,4 -0,3
Canada 70,1 69,0 68,8 68,9 69,2 69,6 -0,5
Japan 59,7 59,8 60,1 60,3 60,7 62,5 2,7
Mexico 44,1 43,0 43,8 43,4 45,3 45,3 1,2
South Africa 38,4 37,3 35,3 35,6 36,0 36,9 -1,5
United States 65,5 63,4 62,4 62,0 62,2 62,3 -3,2
Source: OECD, online database
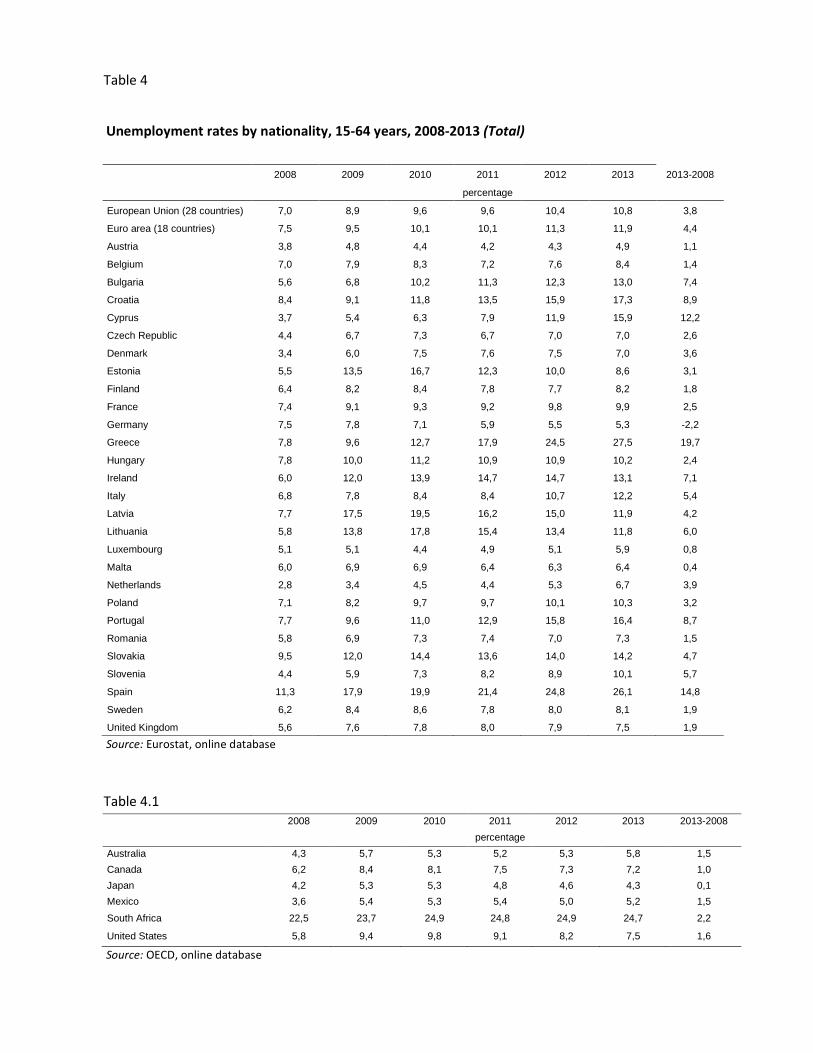
Table 4
Unemployment rates by nationality, 15-64 years, 2008-2013 (Total)
2008 2009 2010 2011 2012 2013 2013-2008
percentage
European Union (28 countries) 7,0 8,9 9,6 9,6 10,4 10,8 3,8
Euro area (18 countries) 7,5 9,5 10,1 10,1 11,3 11,9 4,4
Austria 3,8 4,8 4,4 4,2 4,3 4,9 1,1
Belgium 7,0 7,9 8,3 7,2 7,6 8,4 1,4
Bulgaria 5,6 6,8 10,2 11,3 12,3 13,0 7,4
Croatia 8,4 9,1 11,8 13,5 15,9 17,3 8,9
Cyprus 3,7 5,4 6,3 7,9 11,9 15,9 12,2
Czech Republic 4,4 6,7 7,3 6,7 7,0 7,0 2,6
Denmark 3,4 6,0 7,5 7,6 7,5 7,0 3,6
Estonia 5,5 13,5 16,7 12,3 10,0 8,6 3,1
Finland 6,4 8,2 8,4 7,8 7,7 8,2 1,8
France 7,4 9,1 9,3 9,2 9,8 9,9 2,5
Germany 7,5 7,8 7,1 5,9 5,5 5,3 -2,2
Greece 7,8 9,6 12,7 17,9 24,5 27,5 19,7
Hungary 7,8 10,0 11,2 10,9 10,9 10,2 2,4
Ireland 6,0 12,0 13,9 14,7 14,7 13,1 7,1
Italy 6,8 7,8 8,4 8,4 10,7 12,2 5,4
Latvia 7,7 17,5 19,5 16,2 15,0 11,9 4,2
Lithuania 5,8 13,8 17,8 15,4 13,4 11,8 6,0
Luxembourg 5,1 5,1 4,4 4,9 5,1 5,9 0,8
Malta 6,0 6,9 6,9 6,4 6,3 6,4 0,4
Netherlands 2,8 3,4 4,5 4,4 5,3 6,7 3,9
Poland 7,1 8,2 9,7 9,7 10,1 10,3 3,2
Portugal 7,7 9,6 11,0 12,9 15,8 16,4 8,7
Romania 5,8 6,9 7,3 7,4 7,0 7,3 1,5
Slovakia 9,5 12,0 14,4 13,6 14,0 14,2 4,7
Slovenia 4,4 5,9 7,3 8,2 8,9 10,1 5,7
Spain 11,3 17,9 19,9 21,4 24,8 26,1 14,8
Sweden 6,2 8,4 8,6 7,8 8,0 8,1 1,9
United Kingdom 5,6 7,6 7,8 8,0 7,9 7,5 1,9
Source: Eurostat, online database
Table 4.1
2008 2009 2010 2011 2012 2013 2013-2008
percentage
Australia 4,3 5,7 5,3 5,2 5,3 5,8 1,5
Canada 6,2 8,4 8,1 7,5 7,3 7,2 1,0
Japan 4,2 5,3 5,3 4,8 4,6 4,3 0,1
Mexico 3,6 5,4 5,3 5,4 5,0 5,2 1,5
South Africa 22,5 23,7 24,9 24,8 24,9 24,7 2,2
United States 5,8 9,4 9,8 9,1 8,2 7,5 1,6
Source: OECD, online database

Table 5
Unemployment rates by nationality, 15-64 years, 2008-2013 (Males)
2008 2009 2010 2011 2012 2013 2013-2008
percentage
European Union (28 countries) 6,6 9,0 9,6 9,6 10,4 10,8 4,2
Euro area (18 countries) 6,9 9,4 9,9 9,9 11,2 11,8 4,9
Austria 3,6 5,0 4,6 4,0 4,4 4,9 1,3
Belgium 6,5 7,8 8,1 7,1 7,7 8,7 2,2
Bulgaria 5,5 7,0 10,9 12,3 13,5 13,9 8,4
Croatia 7,0 8,0 11,4 13,8 16,2 17,7 10,7
Cyprus 3,2 5,3 6,2 8,1 12,6 16,6 13,4
Czech Republic 3,5 5,9 6,4 5,8 6,0 5,9 2,4
Denmark 3,2 6,6 8,4 7,7 7,5 6,7 3,5
Estonia 5,8 16,7 19,3 13,1 10,9 9,1 3,3
Finland 6,1 8,9 9,1 8,4 8,3 8,8 2,7
France 6,9 8,9 8,9 8,7 9,7 10,0 3,1
Germany 7,4 8,1 7,5 6,2 5,7 5,6 -1,8
Greece 5,1 7,0 10,1 15,2 21,6 24,5 19,4
Hungary 7,6 10,3 11,6 11,0 11,2 10,2 2,6
Ireland 7,1 15,0 17,1 17,8 17,7 15,0 7,9
Italy 5,5 6,8 7,6 7,6 9,9 11,5 6,0
Latvia 8,4 20,9 22,7 18,6 16,2 12,6 4,2
Lithuania 6,0 17,1 21,2 17,9 15,2 13,1 7,1
Luxembourg 4,3 4,4 3,8 3,8 4,5 5,4 1,1
Malta 5,6 6,5 6,7 6,0 5,7 6,5 0,9
Netherlands 2,5 3,4 4,4 4,5 5,3 7,1 4,6
Poland 6,4 7,8 9,4 9,0 9,4 9,7 3,3
Portugal 6,6 9,0 10,0 12,6 15,9 16,3 9,7
Romania 6,7 7,7 7,9 7,9 7,6 7,9 1,2
Slovakia 8,4 11,4 14,2 13,6 13,5 14,0 5,6
Slovenia 4,0 5,9 7,5 8,2 8,4 9,5 5,5
Spain 10,1 17,7 19,6 21,1 24,6 25,6 15,5
Sweden 5,9 8,7 8,7 7,8 8,2 8,2 2,3
United Kingdom 6,1 8,6 8,6 8,7 8,3 8,0 1,9
Source: Eurostat, online database
Table 5.1
2008 2009 2010 2011 2012 2013 2013-2008
percentage
Australia 4,0 5,8 5,2 5,0 5,3 5,9 1,8
Canada 6,7 9,6 8,9 8,0 7,8 7,6 0,9
Japan 4,3 5,5 5,6 5,0 4,7 4,5 0,2
Mexico 3,4 5,6 5,4 5,4 4,9 5,2 1,8
South Africa 19,8 22,0 23,0 22,7 23,0 23,1 3,3
United States 6,2 10,5 10,7 9,5 8,3 7,8 1,6
Source: OECD, online database

Table 6
Unemployment rates by nationality, 15-64 years, 2008-2013 (Females) 2008 2009 2010 2011 2012 2013 2013-2008
percentage
European Union (28 countries) 7,5 8,9 9,6 9,7 10,5 10,8 3,3
Euro area (18 countries) 8,3 9,7 10,3 10,4 11,5 12,0 3,7
Austria 4,1 4,6 4,2 4,3 4,3 4,9 0,8
Belgium 7,6 8,1 8,5 7,2 7,4 8,2 0,6
Bulgaria 5,8 6,6 9,5 10,1 10,8 11,8 6,0
Croatia 10,1 10,3 12,3 13,2 15,6 16,8 6,7
Cyprus 4,3 5,5 6,4 7,7 11,1 15,2 10,9
Czech Republic 5,6 7,7 8,5 7,9 8,2 8,3 2,7
Denmark 3,7 5,3 6,5 7,5 7,5 7,3 3,6
Estonia 5,1 10,3 14,1 11,6 9,1 8,2 3,1
Finland 6,7 7,6 7,6 7,1 7,1 7,5 0,8
France 7,9 9,4 9,7 9,7 10,0 9,7 1,8
Germany 7,7 7,3 6,6 5,6 5,2 5,0 -2,7
Greece 11,5 13,3 16,4 21,5 28,2 31,4 19,9
Hungary 8,1 9,7 10,7 10,9 10,6 10,2 2,1
Ireland 4,6 8,2 9,9 10,8 11,0 10,7 6,1
Italy 8,5 9,3 9,7 9,6 11,9 13,1 4,6
Latvia 7,1 14,1 16,3 13,8 14,0 11,1 4,0
Lithuania 5,6 10,5 14,5 12,9 11,6 10,5 4,9
Luxembourg 6,0 6,1 5,1 6,3 5,9 6,4 0,4
Malta 6,8 7,6 7,1 7,1 7,3 6,3 -0,5
Netherlands 3,0 3,5 4,5 4,4 5,2 6,3 3,3
Poland 8,0 8,7 10,0 10,4 10,9 11,1 3,1
Portugal 8,9 10,3 12,1 13,2 15,7 16,6 7,7
Romania 4,7 5,8 6,5 6,8 6,4 6,6 1,9
Slovakia 10,9 12,8 14,6 13,6 14,5 14,5 3,6
Slovenia 4,8 5,8 7,1 8,2 9,4 10,9 6,1
Spain 12,8 18,1 20,2 21,8 25,1 26,7 13,9
Sweden 6,6 8,0 8,5 7,8 7,7 7,9 1,3
United Kingdom 5,1 6,4 6,8 7,3 7,4 7,0 1,9
Source: Eurostat, online database
Table 6.1
2008 2009 2010 2011 2012 2013 2013-2008
percentage Australia 4,6 5,5 5,5 5,4 5,4 5,7 1,1
Canada 5,71 7,05 7,27 7,07 6,85 6,68 1,0
Japan 4,00 4,98 4,83 4,42 4,30 3,91 -0,1
Mexico 4,0 5,0 5,3 5,4 5,0 5,1 1,1
South Africa 25,9 25,7 27,2 27,3 27,2 26,7 0,8
United States 5,5 8,2 8,7 8,5 8,0 7,2 1,7
Source: OECD, online database
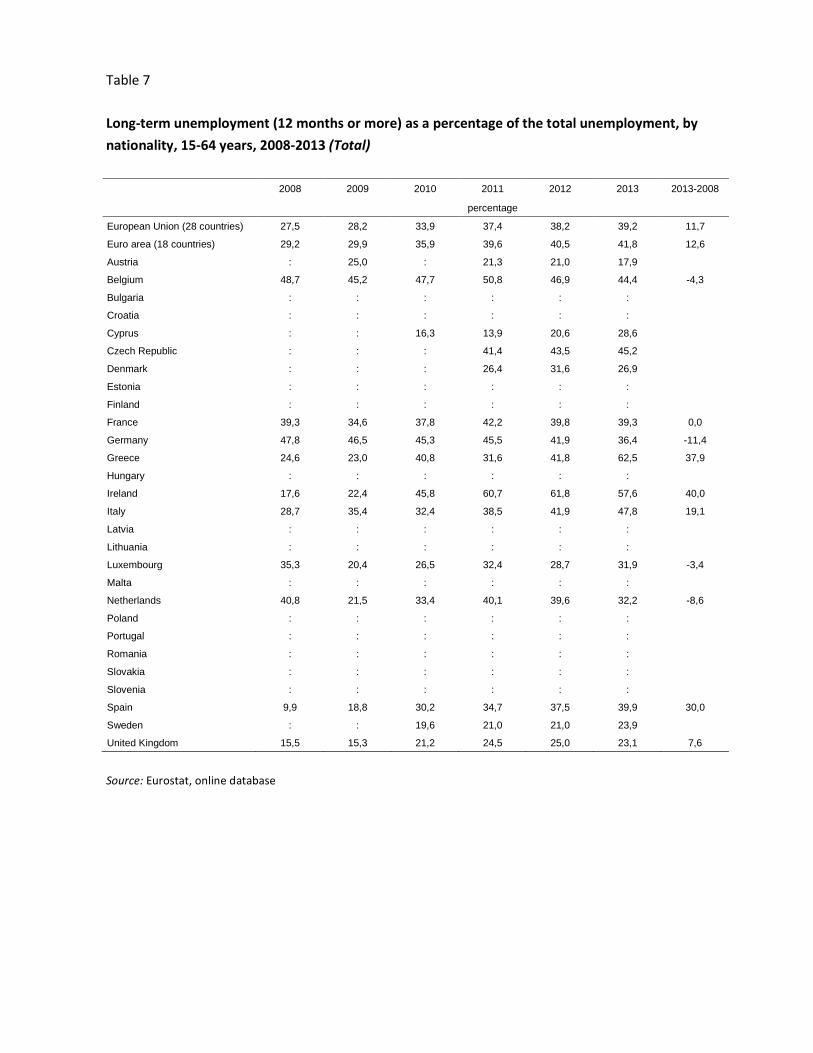
Table 7
Long-term unemployment (12 months or more) as a percentage of the total unemployment, by
nationality, 15-64 years, 2008-2013 (Total)
2008 2009 2010 2011 2012 2013 2013-2008
percentage
European Union (28 countries) 27,5 28,2 33,9 37,4 38,2 39,2 11,7
Euro area (18 countries) 29,2 29,9 35,9 39,6 40,5 41,8 12,6
Austria : 25,0 : 21,3 21,0 17,9
Belgium 48,7 45,2 47,7 50,8 46,9 44,4 -4,3
Bulgaria : : : : : :
Croatia : : : : : :
Cyprus : : 16,3 13,9 20,6 28,6
Czech Republic : : : 41,4 43,5 45,2
Denmark : : : 26,4 31,6 26,9
Estonia : : : : : :
Finland : : : : : :
France 39,3 34,6 37,8 42,2 39,8 39,3 0,0
Germany 47,8 46,5 45,3 45,5 41,9 36,4 -11,4
Greece 24,6 23,0 40,8 31,6 41,8 62,5 37,9
Hungary : : : : : :
Ireland 17,6 22,4 45,8 60,7 61,8 57,6 40,0
Italy 28,7 35,4 32,4 38,5 41,9 47,8 19,1
Latvia : : : : : :
Lithuania : : : : : :
Luxembourg 35,3 20,4 26,5 32,4 28,7 31,9 -3,4
Malta : : : : : :
Netherlands 40,8 21,5 33,4 40,1 39,6 32,2 -8,6
Poland : : : : : :
Portugal : : : : : :
Romania : : : : : :
Slovakia : : : : : :
Slovenia : : : : : :
Spain 9,9 18,8 30,2 34,7 37,5 39,9 30,0
Sweden : : 19,6 21,0 21,0 23,9
United Kingdom 15,5 15,3 21,2 24,5 25,0 23,1 7,6
Source: Eurostat, online database
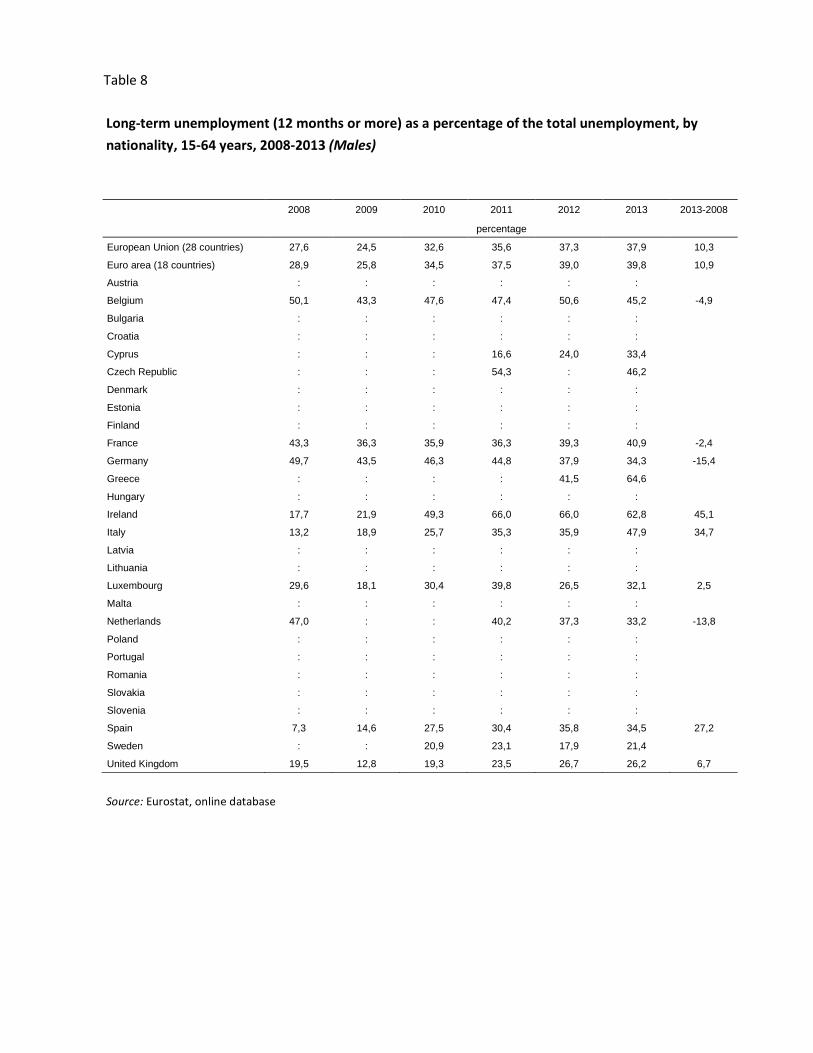
Table 8
Long-term unemployment (12 months or more) as a percentage of the total unemployment, by
nationality, 15-64 years, 2008-2013 (Males)
2008 2009 2010 2011 2012 2013 2013-2008
percentage
European Union (28 countries) 27,6 24,5 32,6 35,6 37,3 37,9 10,3
Euro area (18 countries) 28,9 25,8 34,5 37,5 39,0 39,8 10,9
Austria : : : : : :
Belgium 50,1 43,3 47,6 47,4 50,6 45,2 -4,9
Bulgaria : : : : : :
Croatia : : : : : :
Cyprus : : : 16,6 24,0 33,4
Czech Republic : : : 54,3 : 46,2
Denmark : : : : : :
Estonia : : : : : :
Finland : : : : : :
France 43,3 36,3 35,9 36,3 39,3 40,9 -2,4
Germany 49,7 43,5 46,3 44,8 37,9 34,3 -15,4
Greece : : : : 41,5 64,6
Hungary : : : : : :
Ireland 17,7 21,9 49,3 66,0 66,0 62,8 45,1
Italy 13,2 18,9 25,7 35,3 35,9 47,9 34,7
Latvia : : : : : :
Lithuania : : : : : :
Luxembourg 29,6 18,1 30,4 39,8 26,5 32,1 2,5
Malta : : : : : :
Netherlands 47,0 : : 40,2 37,3 33,2 -13,8
Poland : : : : : :
Portugal : : : : : :
Romania : : : : : :
Slovakia : : : : : :
Slovenia : : : : : :
Spain 7,3 14,6 27,5 30,4 35,8 34,5 27,2
Sweden : : 20,9 23,1 17,9 21,4
United Kingdom 19,5 12,8 19,3 23,5 26,7 26,2 6,7
Source: Eurostat, online database

Table 9
Long-term unemployment (12 months or more) as a percentage of the total unemployment, by
nationality, 15-64 years, 2008-2013 (Females)
2008 2009 2010 2011 2012 2013 2013-2008
percentage
European Union (28 countries) 27,3 32,5 35,3 39,3 39,1 40,5 13,2
Euro area (18 countries) 29,5 34,9 37,5 41,7 42,0 43,8 14,3
Austria : : : : : :
Belgium 47,3 47,4 47,7 54,5 42,0 43,4 -3,9
Bulgaria : : : : : :
Croatia : : : : : :
Cyprus : : : : 16,3 22,4
Czech Republic : : : : 54,3 44,3
Denmark : : : : : :
Estonia : : : : : :
Finland : : : : : :
France : 32,3 39,2 47,8 40,5 37,5
Germany 45,7 50,6 44,0 46,3 46,1 38,9 -6,8
Greece : 29,0 51,2 44,4 42,1 60,0
Hungary : : : : : :
Ireland : 23,4 39,1 52,3 55,1 50,6
Italy 35,3 44,2 36,6 40,7 46,4 47,7 12,4
Latvia : : : : : :
Lithuania : : : : : :
Luxembourg 40,3 22,5 22,5 26,4 30,9 31,7 -8,6
Malta : : : : : :
Netherlands : : 40,9 40,0 41,3 31,3
Poland : : : : : :
Portugal : : : : : :
Romania : : : : : :
Slovakia : : : : : :
Slovenia : : : : : :
Spain 12,4 24,5 33,6 39,1 39,3 45,8 33,4
Sweden : : 18,4 19,1 24,2 26,5
United Kingdom : 17,5 22,9 25,5 23,5 20,3
Source: Eurostat, online database

Table 10
Part-time employment as percentage of the total employment by nationality, 15-64 years, 2008-
2013 (Total)
2008 2009 2010 2011 2012 2013 2013-2008
percentage
European Union (28 countries) 17,5 18,0 18,5 18,7 19,1 19,5 2,0
Euro area (18 countries) 18,8 19,4 19,8 20,3 20,8 21,5 2,7
Austria 22,6 23,7 24,3 24,3 24,9 25,7 3,1
Belgium 22,4 23,2 23,7 24,7 24,7 24,3 1,9
Bulgaria 2,0 2,1 2,2 2,2 2,2 2,5 0,5
Croatia 6,9 6,9 7,5 7,6 6,3 5,4 -1,5
Cyprus 6,8 7,5 8,3 9,0 9,7 11,9 5,1
Czech Republic 4,3 4,8 5,1 4,7 5,0 5,8 1,5
Denmark 23,8 25,2 25,6 25,1 24,8 24,7 0,9
Estonia 6,4 9,4 9,8 9,3 9,2 8,9 2,5
Finland 12,7 13,3 13,9 14,1 14,1 14,0 1,3
France 16,8 17,2 17,6 17,6 17,7 18,1 1,3
Germany 25,1 25,3 25,5 25,7 25,7 26,2 1,1
Greece 5,4 5,9 6,3 6,7 7,7 8,4 3,0
Hungary 4,3 5,2 5,5 6,4 6,6 6,3 2,0
Ireland 18,1 21,0 22,2 23,1 23,5 23,5 5,4
Italy 14,1 14,1 14,8 15,2 16,8 17,7 3,6
Latvia 5,9 8,2 9,4 8,8 8,9 7,5 1,6
Lithuania 6,5 7,9 7,8 8,3 8,9 8,4 1,9
Luxembourg 17,9 17,6 17,5 18,0 18,5 18,7 0,8
Malta 11,1 11,0 11,6 12,6 13,2 14,3 3,2
Netherlands 46,8 47,7 48,3 48,5 49,2 50,0 3,2
Poland 7,7 7,7 7,7 7,3 7,2 7,1 -0,6
Portugal 8,8 8,5 8,5 10,3 11,2 11,1 2,3
Romania 8,6 8,5 9,7 9,3 9,1 8,8 0,2
Slovakia 2,5 3,4 3,8 4,0 4,0 4,5 2,0
Slovenia 8,1 9,5 10,3 9,5 9,0 9,3 1,2
Spain 11,6 12,4 12,9 13,5 14,4 15,7 4,1
Sweden 25,7 26,0 25,8 25,2 25,0 24,7 -1,0
United Kingdom 24,2 25,0 25,7 25,5 25,9 25,5 1,3
Source: Eurostat, online database

Table 11
Part-time employment as percentage of the total employment by nationality, 15-64 years,
2008-2013 (Males)
2008 2009 2010 2011 2012 2013 2013-2008
percentage
European Union (28 countries) 7,0 7,4 7,9 8,1 8,4 8,8 1,8
Euro area (18 countries) 6,8 7,3 7,6 8,1 8,5 9,1 2,3
Austria 6,9 7,4 7,8 7,8 7,8 8,8 1,9
Belgium 7,5 8,2 8,4 9,2 9,0 8,7 1,2
Bulgaria 1,6 1,8 2,0 2,0 2,0 2,0 0,4
Croatia 5,3 5,2 5,4 5,9 5,2 4,6 -0,7
Cyprus 3,4 4,0 5,1 6,1 6,4 8,4 5,0
Czech Republic 1,6 2,0 2,2 1,8 2,2 2,5 0,9
Denmark 13,3 14,3 14,0 14,2 14,8 14,8 1,5
Estonia 3,6 6,2 6,1 5,0 5,1 5,5 1,9
Finland 7,9 8,3 8,9 9,4 9,1 8,8 0,9
France 5,6 5,8 6,4 6,5 6,4 6,7 1,1
Germany 8,3 8,6 8,7 9,0 9,1 9,5 1,2
Greece 2,6 2,9 3,5 4,3 4,7 5,4 2,8
Hungary 3,0 3,6 3,6 4,4 4,3 4,1 1,1
Ireland 7,1 10,2 11,4 12,5 13,3 13,5 6,4
Italy 4,8 4,7 5,1 5,5 6,7 7,4 2,6
Latvia 4,3 6,8 7,6 7,0 6,7 5,7 1,4
Lithuania 4,8 6,7 6,4 6,7 6,9 6,4 1,6
Luxembourg 2,7 4,5 3,4 4,3 4,7 5,1 2,4
Malta 4,1 4,6 4,9 5,4 5,7 6,7 2,6
Netherlands 22,8 23,6 24,2 24,3 24,9 26,2 3,4
Poland 5,1 5,0 5,0 4,7 4,5 4,5 -0,6
Portugal 4,1 4,4 5,0 7,1 8,4 8,2 4,1
Romania 8,1 8,0 9,6 8,7 8,6 8,4 0,3
Slovakia 1,3 2,6 2,6 2,7 2,8 3,3 2,0
Slovenia 6,2 7,4 7,4 7,1 6,3 6,5 0,3
Spain 4,0 4,7 5,2 5,8 6,4 7,7 3,7
Sweden 11,9 12,6 12,7 12,3 12,5 12,8 0,9
United Kingdom 9,8 10,4 11,0 11,0 11,5 11,4 1,6
Source: Eurostat, online database
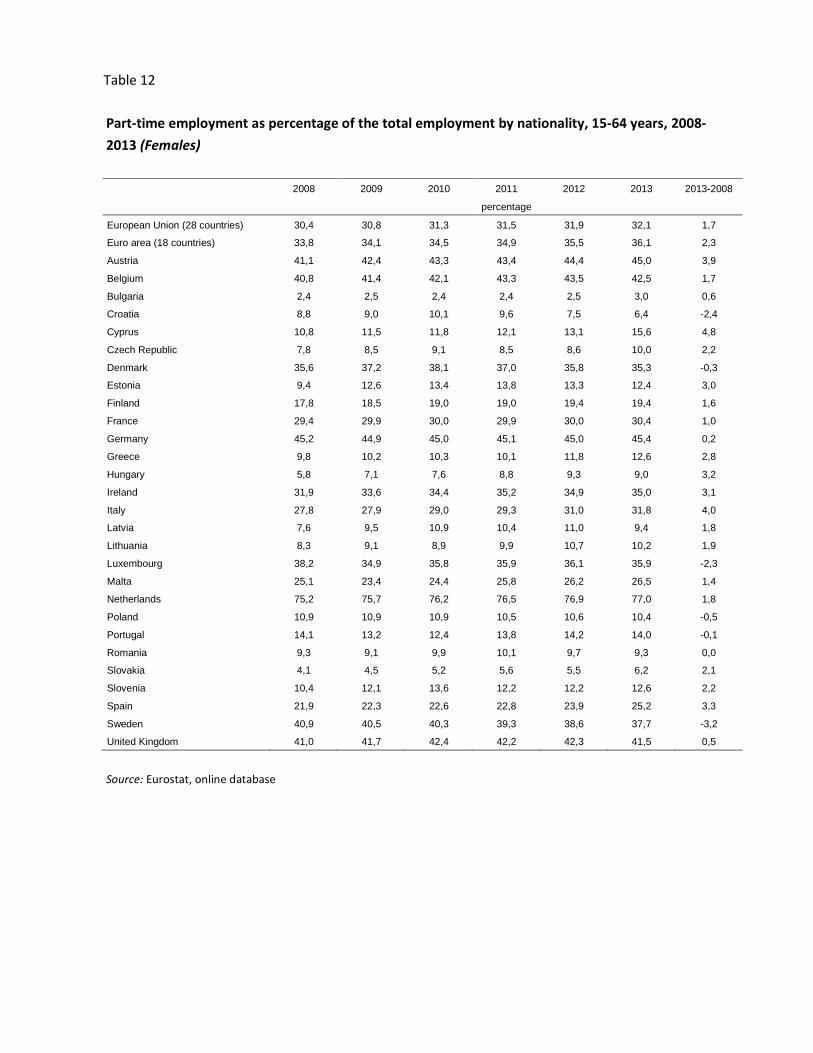
Table 12
Part-time employment as percentage of the total employment by nationality, 15-64 years, 2008-
2013 (Females)
2008 2009 2010 2011 2012 2013 2013-2008
percentage
European Union (28 countries) 30,4 30,8 31,3 31,5 31,9 32,1 1,7
Euro area (18 countries) 33,8 34,1 34,5 34,9 35,5 36,1 2,3
Austria 41,1 42,4 43,3 43,4 44,4 45,0 3,9
Belgium 40,8 41,4 42,1 43,3 43,5 42,5 1,7
Bulgaria 2,4 2,5 2,4 2,4 2,5 3,0 0,6
Croatia 8,8 9,0 10,1 9,6 7,5 6,4 -2,4
Cyprus 10,8 11,5 11,8 12,1 13,1 15,6 4,8
Czech Republic 7,8 8,5 9,1 8,5 8,6 10,0 2,2
Denmark 35,6 37,2 38,1 37,0 35,8 35,3 -0,3
Estonia 9,4 12,6 13,4 13,8 13,3 12,4 3,0
Finland 17,8 18,5 19,0 19,0 19,4 19,4 1,6
France 29,4 29,9 30,0 29,9 30,0 30,4 1,0
Germany 45,2 44,9 45,0 45,1 45,0 45,4 0,2
Greece 9,8 10,2 10,3 10,1 11,8 12,6 2,8
Hungary 5,8 7,1 7,6 8,8 9,3 9,0 3,2
Ireland 31,9 33,6 34,4 35,2 34,9 35,0 3,1
Italy 27,8 27,9 29,0 29,3 31,0 31,8 4,0
Latvia 7,6 9,5 10,9 10,4 11,0 9,4 1,8
Lithuania 8,3 9,1 8,9 9,9 10,7 10,2 1,9
Luxembourg 38,2 34,9 35,8 35,9 36,1 35,9 -2,3
Malta 25,1 23,4 24,4 25,8 26,2 26,5 1,4
Netherlands 75,2 75,7 76,2 76,5 76,9 77,0 1,8
Poland 10,9 10,9 10,9 10,5 10,6 10,4 -0,5
Portugal 14,1 13,2 12,4 13,8 14,2 14,0 -0,1
Romania 9,3 9,1 9,9 10,1 9,7 9,3 0,0
Slovakia 4,1 4,5 5,2 5,6 5,5 6,2 2,1
Slovenia 10,4 12,1 13,6 12,2 12,2 12,6 2,2
Spain 21,9 22,3 22,6 22,8 23,9 25,2 3,3
Sweden 40,9 40,5 40,3 39,3 38,6 37,7 -3,2
United Kingdom 41,0 41,7 42,4 42,2 42,3 41,5 0,5
Source: Eurostat, online database
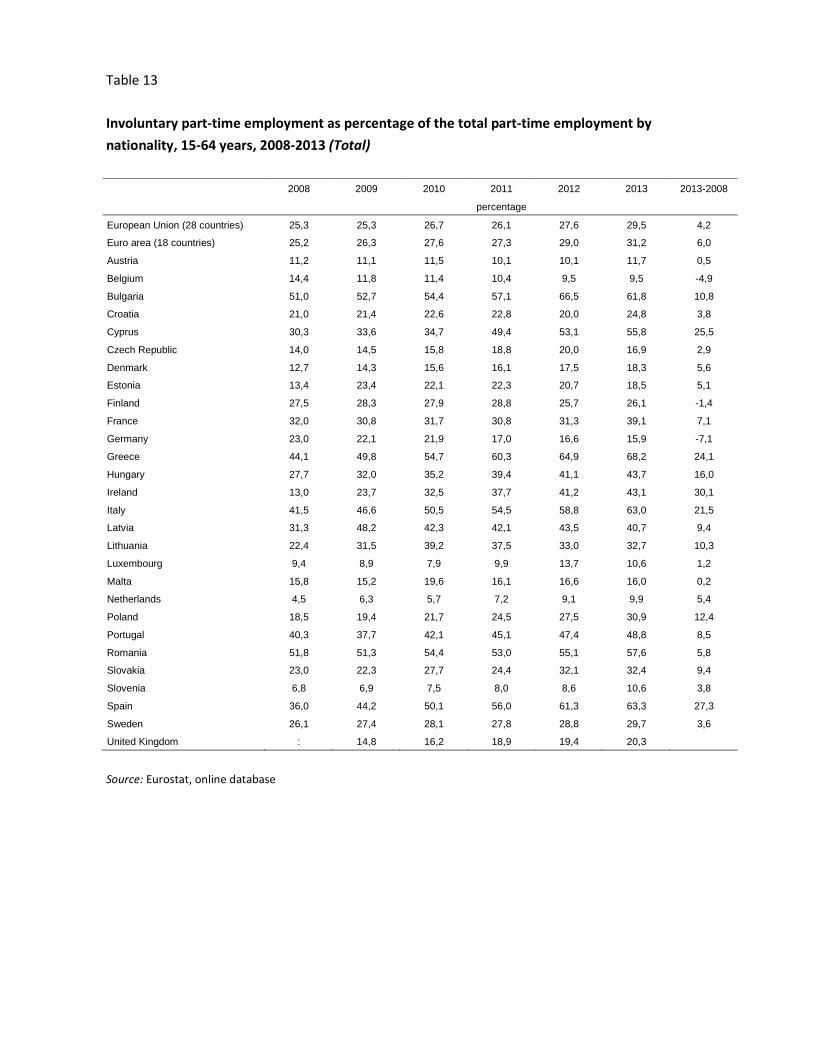
Table 13
Involuntary part-time employment as percentage of the total part-time employment by
nationality, 15-64 years, 2008-2013 (Total)
2008 2009 2010 2011 2012 2013 2013-2008
percentage
European Union (28 countries) 25,3 25,3 26,7 26,1 27,6 29,5 4,2
Euro area (18 countries) 25,2 26,3 27,6 27,3 29,0 31,2 6,0
Austria 11,2 11,1 11,5 10,1 10,1 11,7 0,5
Belgium 14,4 11,8 11,4 10,4 9,5 9,5 -4,9
Bulgaria 51,0 52,7 54,4 57,1 66,5 61,8 10,8
Croatia 21,0 21,4 22,6 22,8 20,0 24,8 3,8
Cyprus 30,3 33,6 34,7 49,4 53,1 55,8 25,5
Czech Republic 14,0 14,5 15,8 18,8 20,0 16,9 2,9
Denmark 12,7 14,3 15,6 16,1 17,5 18,3 5,6
Estonia 13,4 23,4 22,1 22,3 20,7 18,5 5,1
Finland 27,5 28,3 27,9 28,8 25,7 26,1 -1,4
France 32,0 30,8 31,7 30,8 31,3 39,1 7,1
Germany 23,0 22,1 21,9 17,0 16,6 15,9 -7,1
Greece 44,1 49,8 54,7 60,3 64,9 68,2 24,1
Hungary 27,7 32,0 35,2 39,4 41,1 43,7 16,0
Ireland 13,0 23,7 32,5 37,7 41,2 43,1 30,1
Italy 41,5 46,6 50,5 54,5 58,8 63,0 21,5
Latvia 31,3 48,2 42,3 42,1 43,5 40,7 9,4
Lithuania 22,4 31,5 39,2 37,5 33,0 32,7 10,3
Luxembourg 9,4 8,9 7,9 9,9 13,7 10,6 1,2
Malta 15,8 15,2 19,6 16,1 16,6 16,0 0,2
Netherlands 4,5 6,3 5,7 7,2 9,1 9,9 5,4
Poland 18,5 19,4 21,7 24,5 27,5 30,9 12,4
Portugal 40,3 37,7 42,1 45,1 47,4 48,8 8,5
Romania 51,8 51,3 54,4 53,0 55,1 57,6 5,8
Slovakia 23,0 22,3 27,7 24,4 32,1 32,4 9,4
Slovenia 6,8 6,9 7,5 8,0 8,6 10,6 3,8
Spain 36,0 44,2 50,1 56,0 61,3 63,3 27,3
Sweden 26,1 27,4 28,1 27,8 28,8 29,7 3,6
United Kingdom : 14,8 16,2 18,9 19,4 20,3
Source: Eurostat, online database

Table 14
Involuntary part-time employment as percentage of the total part-time employment by
nationality, 15-64 years, 2008-2013 (Males)
2008 2009 2010 2011 2012 2013 2013-2008
percentage
European Union (28 countries) 32,4 34,1 36,1 36,4 38,4 40,1 7,7
Euro area (18 countries) 32,6 35,0 36,4 36,6 38,7 40,7 8,1
Austria 15,2 17,5 17,5 15,1 13,8 16,9 1,7
Belgium 17,2 15,5 15,1 16,4 14,0 13,7 -3,5
Bulgaria 53,3 58,3 59,9 61,4 66,8 65,8 12,5
Croatia 28,8 32,0 32,5 28,6 24,8 29,3 0,5
Cyprus 31,5 39,8 44,0 60,3 65,2 62,5 31,0
Czech Republic 8,0 9,5 11,4 17,1 14,6 8,6 0,6
Denmark 9,8 14,3 15,4 13,7 13,8 15,2 5,4
Estonia 17,5 26,0 18,8 22,6 19,5 19,5 2,0
Finland 23,4 28,4 27,0 26,2 24,1 28,7 5,3
France 34,7 35,3 35,5 36,3 38,3 45,5 10,8
Germany 37,5 38,6 37,8 28,4 26,6 24,6 -12,9
Greece 48,0 56,8 65,4 68,6 69,6 70,7 22,7
Hungary 31,0 36,7 39,2 43,9 45,2 47,1 16,1
Ireland 23,6 42,3 51,9 56,7 59,9 61,7 38,1
Italy 54,9 61,0 64,8 69,1 73,0 76,7 21,8
Latvia 39,1 55,4 47,5 43,4 45,2 40,0 0,9
Lithuania 20,4 32,8 38,7 41,0 32,3 32,7 12,3
Luxembourg 27,7 14,6 : 16,1 13,0 9,8 -17,9
Malta 27,7 23,1 34,7 25,0 28,7 25,9 -1,8
Netherlands 5,6 8,0 7,5 9,4 12,9 13,5 7,9
Poland 17,6 19,4 22,3 24,0 26,9 30,4 12,8
Portugal 36,0 36,5 38,3 39,1 40,7 42,2 6,2
Romania 65,0 64,2 65,7 64,5 67,1 68,2 3,2
Slovakia 37,6 27,7 34,8 28,0 35,4 34,2 -3,4
Slovenia 6,0 5,8 6,7 6,7 7,5 8,8 2,8
Spain 39,4 47,0 55,1 65,7 68,9 70,1 30,7
Sweden 24,9 28,1 29,3 28,3 30,2 31,6 6,7
United Kingdom : 28,3 31,9 35,5 37,5 38,4
Source: Eurostat, online database

Table 15
Involuntary part-time employment as percentage of the total part-time employment by
nationality, 15-64 years, 2008-2013 (Females)
2008 2009 2010 2011 2012 2013 2013-2008
percentage
European Union (28 countries) 23,3 22,9 24,0 23,1 24,3 26,3 3,0
Euro area (18 countries) 23,3 24,2 25,4 24,8 26,3 28,5 5,2
Austria 10,4 9,8 10,3 9,1 9,3 10,6 0,2
Belgium 13,8 11,0 10,5 8,9 8,4 8,5 -5,3
Bulgaria 49,0 48,1 49,0 53,7 66,2 58,6 9,6
Croatia 15,1 14,1 16,4 18,5 16,1 21,0 5,9
Cyprus 29,8 31,2 30,3 43,5 46,8 51,9 22,1
Czech Republic 15,6 16,1 17,2 19,3 22,0 19,5 3,9
Denmark 13,9 14,3 15,7 17,1 19,2 19,7 5,8
Estonia 11,7 22,1 23,6 22,2 21,2 18,1 6,4
Finland 29,4 28,2 28,3 30,1 26,5 24,7 -4,7
France 31,5 29,9 30,9 29,6 29,8 37,9 6,4
Germany 19,8 18,8 18,7 14,7 14,4 13,9 -5,9
Greece 42,6 46,8 49,4 55,4 62,1 66,7 24,1
Hungary 25,6 29,3 33,0 36,8 38,9 41,9 16,3
Ireland 9,6 18,0 25,7 30,6 33,6 35,1 25,5
Italy 38,0 43,0 46,8 50,6 54,5 58,6 20,6
Latvia 26,9 43,4 39,1 41,2 42,5 41,0 14,1
Lithuania 23,6 30,7 39,5 35,3 33,5 32,7 9,1
Luxembourg 7,7 7,9 7,9 8,9 13,9 10,8 3,1
Malta 12,0 12,2 13,9 12,8 12,1 11,9 -0,1
Netherlands 4,2 5,8 5,1 6,5 7,8 8,6 4,4
Poland 19,1 19,4 21,4 24,9 27,9 31,2 12,1
Portugal 41,7 38,2 43,8 48,4 51,6 52,8 11,1
Romania 37,6 37,2 40,7 40,6 41,7 45,5 7,9
Slovakia 17,0 18,3 23,4 22,3 30,0 31,2 14,2
Slovenia 7,3 7,7 8,1 8,9 9,2 11,8 4,5
Spain 35,1 43,4 48,7 52,9 58,7 60,8 25,7
Sweden 26,4 27,2 27,7 27,6 28,3 29,0 2,6
United Kingdom : 11,1 11,5 13,8 13,9 14,8
Source: Eurostat, online database
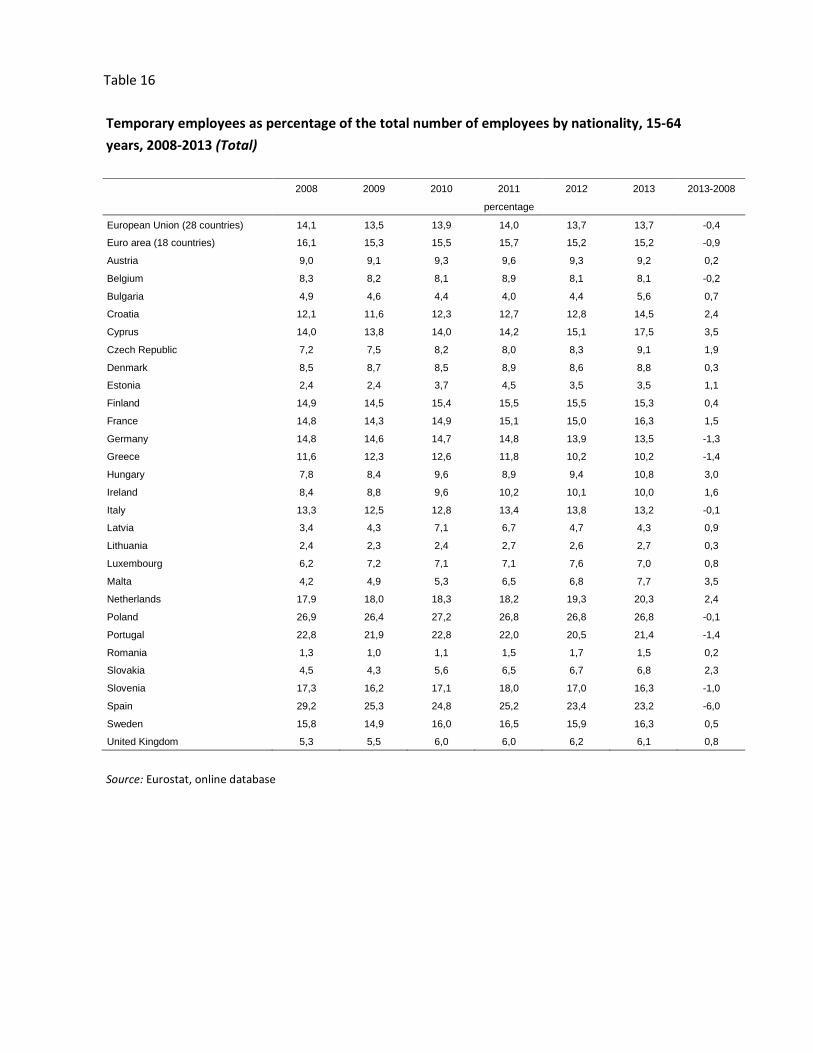
Table 16
Temporary employees as percentage of the total number of employees by nationality, 15-64
years, 2008-2013 (Total)
2008 2009 2010 2011 2012 2013 2013-2008
percentage
European Union (28 countries) 14,1 13,5 13,9 14,0 13,7 13,7 -0,4
Euro area (18 countries) 16,1 15,3 15,5 15,7 15,2 15,2 -0,9
Austria 9,0 9,1 9,3 9,6 9,3 9,2 0,2
Belgium 8,3 8,2 8,1 8,9 8,1 8,1 -0,2
Bulgaria 4,9 4,6 4,4 4,0 4,4 5,6 0,7
Croatia 12,1 11,6 12,3 12,7 12,8 14,5 2,4
Cyprus 14,0 13,8 14,0 14,2 15,1 17,5 3,5
Czech Republic 7,2 7,5 8,2 8,0 8,3 9,1 1,9
Denmark 8,5 8,7 8,5 8,9 8,6 8,8 0,3
Estonia 2,4 2,4 3,7 4,5 3,5 3,5 1,1
Finland 14,9 14,5 15,4 15,5 15,5 15,3 0,4
France 14,8 14,3 14,9 15,1 15,0 16,3 1,5
Germany 14,8 14,6 14,7 14,8 13,9 13,5 -1,3
Greece 11,6 12,3 12,6 11,8 10,2 10,2 -1,4
Hungary 7,8 8,4 9,6 8,9 9,4 10,8 3,0
Ireland 8,4 8,8 9,6 10,2 10,1 10,0 1,6
Italy 13,3 12,5 12,8 13,4 13,8 13,2 -0,1
Latvia 3,4 4,3 7,1 6,7 4,7 4,3 0,9
Lithuania 2,4 2,3 2,4 2,7 2,6 2,7 0,3
Luxembourg 6,2 7,2 7,1 7,1 7,6 7,0 0,8
Malta 4,2 4,9 5,3 6,5 6,8 7,7 3,5
Netherlands 17,9 18,0 18,3 18,2 19,3 20,3 2,4
Poland 26,9 26,4 27,2 26,8 26,8 26,8 -0,1
Portugal 22,8 21,9 22,8 22,0 20,5 21,4 -1,4
Romania 1,3 1,0 1,1 1,5 1,7 1,5 0,2
Slovakia 4,5 4,3 5,6 6,5 6,7 6,8 2,3
Slovenia 17,3 16,2 17,1 18,0 17,0 16,3 -1,0
Spain 29,2 25,3 24,8 25,2 23,4 23,2 -6,0
Sweden 15,8 14,9 16,0 16,5 15,9 16,3 0,5
United Kingdom 5,3 5,5 6,0 6,0 6,2 6,1 0,8
Source: Eurostat, online database

Table 17
Temporary employees as percentage of the total number of employees by nationality, 15-64
years, 2008-2013 (Males)
2008 2009 2010 2011 2012 2013 2013-2008
percentage
European Union (28 countries) 13,3 12,7 13,3 13,5 13,2 13,3 0,0
Euro area (18 countries) 15,1 14,2 14,7 15,0 14,5 14,6 -0,5
Austria 8,9 9,1 9,8 9,7 9,3 9,4 0,5
Belgium 6,6 6,5 6,7 7,7 7,0 7,2 0,6
Bulgaria 5,5 5,1 5,0 4,4 4,9 6,1 0,6
Croatia 11,9 11,4 12,1 12,7 12,9 14,8 2,9
Cyprus 8,2 7,6 7,1 7,1 9,0 10,3 2,1
Czech Republic 5,7 6,1 6,8 6,7 6,9 7,6 1,9
Denmark 7,6 7,8 8,1 8,3 7,9 8,1 0,5
Estonia 3,5 3,0 5,0 5,7 4,7 4,1 0,6
Finland 11,1 10,5 12,3 12,6 12,6 12,2 1,1
France 13,7 12,9 14,0 14,5 14,2 15,5 1,8
Germany 14,7 14,4 14,5 14,6 13,9 13,4 -1,3
Greece 10,0 10,8 11,1 10,7 8,9 9,3 -0,7
Hungary 8,6 9,0 10,0 9,4 10,3 11,2 2,6
Ireland 7,1 7,7 8,9 9,8 9,9 10,1 3,0
Italy 11,5 10,8 11,4 12,3 12,9 12,4 0,9
Latvia 4,8 5,9 9,4 8,0 6,3 5,3 0,5
Lithuania 3,0 3,1 3,3 3,7 3,5 3,5 0,5
Luxembourg 5,9 6,3 6,2 6,3 7,2 5,6 -0,3
Malta 3,3 3,7 4,2 5,6 6,1 7,0 3,7
Netherlands 16,2 16,0 16,9 17,0 18,2 19,3 3,1
Poland 26,2 26,2 27,4 27,5 27,3 27,2 1,0
Portugal 21,5 20,7 22,2 21,7 20,7 21,2 -0,3
Romania 1,3 1,1 1,2 1,8 2,0 1,8 0,5
Slovakia 4,4 4,5 5,5 6,3 6,4 6,6 2,2
Slovenia 15,2 14,9 15,2 16,4 15,6 15,6 0,4
Spain 27,5 23,6 23,6 24,0 22,1 22,2 -5,3
Sweden 13,2 12,6 14,1 14,5 13,8 14,0 0,8
United Kingdom 4,7 5,1 5,6 5,6 5,7 5,6 0,9
Source: Eurostat, online database

Table 18
Temporary employees as percentage of the total number of employees by nationality, 15-64
years, 2008-2013 (Females)
2008 2009 2010 2011 2012 2013 2013-2008
percentage
European Union (28 countries) 15,0 14,5 14,6 14,5 14,2 14,3 -0,7
Euro area (18 countries) 17,3 16,5 16,5 16,5 15,9 15,9 -1,4
Austria 9,1 9,0 8,9 9,5 9,3 9,0 -0,1
Belgium 10,2 10,2 9,6 10,3 9,3 9,1 -1,1
Bulgaria 4,3 4,1 3,9 3,7 4,0 5,1 0,8
Croatia 12,3 11,9 12,6 12,7 12,7 14,1 1,8
Cyprus 20,0 20,0 20,8 20,9 20,9 24,2 4,2
Czech Republic 9,1 9,3 9,8 9,5 9,9 10,9 1,8
Denmark 9,4 9,6 8,8 9,4 9,3 9,5 0,1
Estonia 1,4 1,9 2,6 3,4 2,4 2,9 1,5
Finland 18,7 18,3 18,4 18,4 18,2 18,3 -0,4
France 16,1 15,7 15,8 15,7 15,8 17,2 1,1
Germany 14,8 14,8 15,0 14,9 14,0 13,6 -1,2
Greece 13,9 14,3 14,6 13,2 11,8 11,3 -2,6
Hungary 7,0 7,8 9,2 8,4 8,5 10,4 3,4
Ireland 9,8 9,8 10,2 10,6 10,4 9,8 0,0
Italy 15,7 14,6 14,5 14,7 14,9 14,2 -1,5
Latvia 2,0 2,9 5,2 5,5 3,3 3,4 1,4
Lithuania 1,8 1,6 1,7 1,8 1,9 1,9 0,1
Luxembourg 6,6 8,3 8,3 8,2 8,2 8,8 2,2
Malta 5,8 6,9 7,0 8,1 8,0 8,7 2,9
Netherlands 19,8 20,2 19,8 19,5 20,5 21,4 1,6
Poland 27,6 26,6 27,0 26,1 26,2 26,3 -1,3
Portugal 24,1 23,3 23,5 22,2 20,4 21,6 -2,5
Romania 1,1 1,0 1,0 1,3 1,2 1,2 0,1
Slovakia 4,7 4,0 5,8 6,8 7,2 7,0 2,3
Slovenia 19,6 17,6 19,2 19,7 18,5 17,1 -2,5
Spain 31,2 27,2 26,1 26,5 25,0 24,2 -7,0
Sweden 18,5 17,3 17,9 18,5 18,0 18,6 0,1
United Kingdom 5,9 5,9 6,4 6,4 6,7 6,5 0,6
Source: Eurostat, online database

Table 19
Youth neither employed nor in education or training, 15-29 years, 2008-2012 (Total)
2008 2009 2010 2011 2012 2013 2013-2008
percentage
European Union (28 countries) 13,0 14,7 15,2 15,4 15,8 15,9 2,9
Euro area (17 countries) 13,2 14,9 15,2 15,2 15,8 15,9 2,7
Austria 8,6 9,1 8,8 8,2 7,8 8,3 -0,3
Belgium 12,0 12,8 13,0 13,8 14,4 14,9 2,9
Bulgaria 18,5 20,8 23,6 24,7 24,7 25,7 7,2
Croatia 11,5 13,3 16,8 18,0 18,8 22,3 10,8
Cyprus 10,9 11,5 12,9 14,8 17,3 20,4 9,5
Czech Republic 10,7 12,7 12,9 12,1 12,9 12,8 2,1
Denmark 5,0 6,5 7,3 7,6 8,2 7,5 2,5
Estonia 11,4 18,3 18,1 14,7 15,1 14,3 2,9
Finland 8,9 11,3 10,5 10,0 10,4 10,9 2,0
France 12,4 14,5 14,6 14,4 14,8 13,8 1,4
Germany 11,0 11,4 10,8 9,7 9,3 8,7 -2,3
Greece 14,8 15,9 18,6 23,0 26,8 28,5 13,7
Hungary 15,8 17,6 17,5 17,7 18,8 18,8 3,0
Ireland 16,0 20,3 21,5 22,0 21,3 18,6 2,6
Italy 19,3 20,5 22,1 22,7 23,9 26,0 6,7
Latvia 13,6 20,8 20,7 19,1 17,2 15,6 2,0
Lithuania 11,9 15,0 17,0 14,7 13,9 13,7 1,8
Luxembourg 9,2 7,5 6,1 6,6 7,6 7,2 -2,0
Malta 11,4 12,6 12,2 12,1 11,7 11,3 -0,1
Netherlands 4,6 5,3 5,7 5,5 6,2 7,1 2,5
Poland 12,7 14,0 14,8 15,2 15,7 16,2 3,5
Portugal 11,9 12,5 13,6 13,9 15,6 16,4 4,5
Romania 13,2 15,7 18,4 19,1 19,1 19,6 6,4
Slovakia 15,3 17,3 19,0 18,7 18,8 19,0 3,7
Slovenia 7,5 9,3 9,4 9,4 11,8 12,9 5,4
Spain 15,3 19,9 20,0 20,6 22,2 22,5 7,2
Sweden 8,0 9,9 8,3 7,9 8,4 7,9 -0,1
United Kingdom 13,1 14,4 14,6 15,5 15,4 14,7 1,6
Source: Eurostat, online database
Table 19.1
2008 2009 2010 2011 2012 2012-2008
percentage Australia 10,4 12,3 11,8 11,5 11,7 1,3
Canada
11,7 13,3 13,5 13,3 13,2 1,5
Korea 18,6 19,0 19,2 18,8 18,5 -0,1
Mexico 23,9 24,8 22,5 22,7 22,0 -1,8
United States 14,6 16,9 16,1 15,9 1,3
Source: OECD, online database

Table 20
Youth neither employed nor in education or training, 15-29 years, 2008-2012 (Males)
2008 2009 2010 2011 2012 2013 2013-2008
percentage
European Union (28 countries) 10,2 12,7 13,3 13,4 13,9 14,1 3,9
Euro area (17 countries) 10,7 13,3 13,6 13,6 14,4 14,7 4,0
Austria 6,3 7,4 7,2 6,6 6,4 7,1 0,8
Belgium 10,1 11,3 11,8 12,3 13,3 14,1 4,0
Bulgaria 15,4 17,9 21,4 23,0 23,0 23,8 8,4
Croatia 9,8 11,9 17,2 18,8 19,5 22,5 12,7
Cyprus 8,3 8,6 10,8 14,2 17,2 20,7 12,4
Czech Republic 4,9 8,0 8,3 7,6 8,4 8,2 3,3
Denmark 4,6 6,6 7,8 7,2 8,0 7,0 2,4
Estonia 6,9 16,5 16,5 12,8 11,8 11,1 4,2
Finland 7,4 10,4 9,6 9,1 9,4 10,4 3,0
France 10,4 13,2 13,1 12,6 13,5 12,3 1,9
Germany 8,2 9,5 8,8 7,8 7,3 6,8 -1,4
Greece 9,8 10,8 14,1 19,6 24,2 26,8 17,0
Hungary 11,2 14,2 14,6 14,0 15,4 14,9 3,7
Ireland 15,4 21,4 22,2 22,9 22,1 18,4 3,0
Italy 15,6 17,6 19,3 20,1 21,8 24,4 8,8
Latvia 10,5 20,9 20,5 17,9 16,0 13,9 3,4
Lithuania 11,1 16,3 19,3 15,9 14,8 13,2 2,1
Luxembourg 7,0 6,2 5,1 5,0 6,2 6,7 -0,3
Malta 7,0 8,9 8,4 9,4 9,1 9,3 2,3
Netherlands 3,3 4,4 5,1 4,8 5,3 6,7 3,4
Poland 8,8 10,7 12,3 12,3 12,8 13,4 4,6
Portugal 9,2 11,0 11,6 12,9 15,5 16,0 6,8
Romania 8,9 11,5 14,4 16,2 16,1 16,3 7,4
Slovakia 10,5 13,2 16,2 16,0 15,5 16,2 5,7
Slovenia 6,6 8,8 8,9 9,4 10,9 11,7 5,1
Spain 14,0 20,4 20,3 20,8 22,8 22,8 8,8
Sweden 7,2 9,6 7,7 7,4 7,9 7,5 0,3
United Kingdom 9,8 12,1 11,9 12,7 12,3 11,9 2,1
Source: Eurostat, online database
Table 20.1
2008 2009 2010 2011 2012 2012-2008
percentage Australia 6,9 9,4 9,0 8,5 8,8 1,9
Canada 11,0 13,6 14,3 13,1 12,9 1,9
Korea 16,7 17,3 17,7 17,4 17,4 0,6
Mexico 9,0 10,7 10,0 10,2 9,6 0,6
United States 12,2 14,8 14,3 13,5 12,8 0,6
Source: OECD, online database
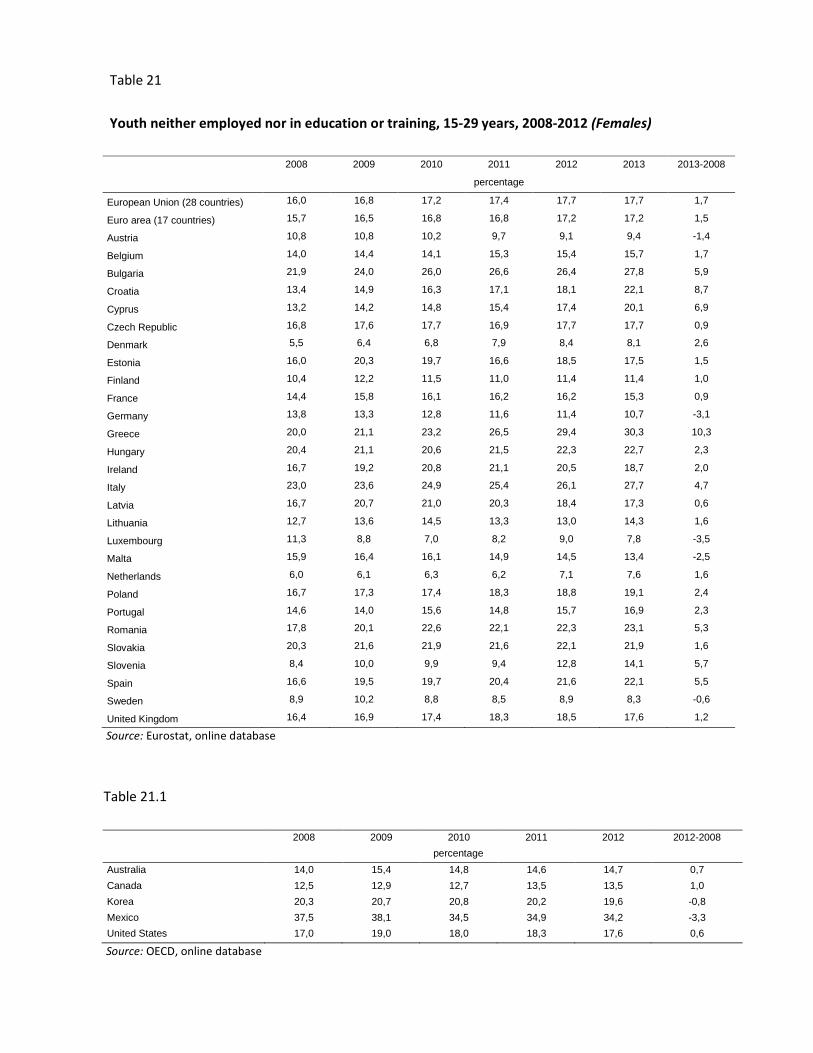
Table 21
Youth neither employed nor in education or training, 15-29 years, 2008-2012 (Females)
2008 2009 2010 2011 2012 2013 2013-2008
percentage
European Union (28 countries) 16,0 16,8 17,2 17,4 17,7 17,7 1,7
Euro area (17 countries) 15,7 16,5 16,8 16,8 17,2 17,2 1,5
Austria 10,8 10,8 10,2 9,7 9,1 9,4 -1,4
Belgium 14,0 14,4 14,1 15,3 15,4 15,7 1,7
Bulgaria 21,9 24,0 26,0 26,6 26,4 27,8 5,9
Croatia 13,4 14,9 16,3 17,1 18,1 22,1 8,7
Cyprus 13,2 14,2 14,8 15,4 17,4 20,1 6,9
Czech Republic 16,8 17,6 17,7 16,9 17,7 17,7 0,9
Denmark 5,5 6,4 6,8 7,9 8,4 8,1 2,6
Estonia 16,0 20,3 19,7 16,6 18,5 17,5 1,5
Finland 10,4 12,2 11,5 11,0 11,4 11,4 1,0
France 14,4 15,8 16,1 16,2 16,2 15,3 0,9
Germany 13,8 13,3 12,8 11,6 11,4 10,7 -3,1
Greece 20,0 21,1 23,2 26,5 29,4 30,3 10,3
Hungary 20,4 21,1 20,6 21,5 22,3 22,7 2,3
Ireland 16,7 19,2 20,8 21,1 20,5 18,7 2,0
Italy 23,0 23,6 24,9 25,4 26,1 27,7 4,7
Latvia 16,7 20,7 21,0 20,3 18,4 17,3 0,6
Lithuania 12,7 13,6 14,5 13,3 13,0 14,3 1,6
Luxembourg 11,3 8,8 7,0 8,2 9,0 7,8 -3,5
Malta 15,9 16,4 16,1 14,9 14,5 13,4 -2,5
Netherlands 6,0 6,1 6,3 6,2 7,1 7,6 1,6
Poland 16,7 17,3 17,4 18,3 18,8 19,1 2,4
Portugal 14,6 14,0 15,6 14,8 15,7 16,9 2,3
Romania 17,8 20,1 22,6 22,1 22,3 23,1 5,3
Slovakia 20,3 21,6 21,9 21,6 22,1 21,9 1,6
Slovenia 8,4 10,0 9,9 9,4 12,8 14,1 5,7
Spain 16,6 19,5 19,7 20,4 21,6 22,1 5,5
Sweden 8,9 10,2 8,8 8,5 8,9 8,3 -0,6
United Kingdom 16,4 16,9 17,4 18,3 18,5 17,6 1,2
Source: Eurostat, online database
Table 21.1
2008 2009 2010 2011 2012 2012-2008
percentage
Australia 14,0 15,4 14,8 14,6 14,7 0,7
Canada
12,5 12,9 12,7 13,5 13,5 1,0
Korea 20,3 20,7 20,8 20,2 19,6 -0,8
Mexico 37,5 38,1 34,5 34,9 34,2 -3,3
United States 17,0 19,0 18,0 18,3 17,6 0,6
Source: OECD, online database