
Impact of Systems and Information Quality on Mission Effectiveness
37
Impact of Systems and Information Quality on Mission Effectiveness Paul Labbé, P. Engineer René Proulx Defence Scientist, IEEE Senior Member Defence Research Establishment Valcartier/ Centre de recherches pour la défense, Valcartier 2459 Pie-XI Blvd. North Val-Bélair (Québec), Canada G3J 1X5 Tel.: (418) 844-4000 X 4479 FAX: (418) 844-4538 [email protected] Senior System Analyst, Mathematician Neuring Inc. 7 rue de Laval Québec (Québec), Canada G1R 3T8 Tel./FAX: (418) 692-3878 [email protected] [email protected] Abstract To resolve an outstanding issue in assessing the value to mission effectiveness of the insertion of information technology in command and control, the Defence Research Establishment Valcartier (DREV) has explored means and methods for linking information quality and system measures of performance (MOPs) to decision and mission measures of effectiveness (MOEs). The resulting model-based measures (MBMs) assess the capabilities of afloat-command information systems to support over-the-horizon targeting (OTH-T). Results obtained showed that the impact of system and information quality on mission success rate is non-linear but displays similar characteristic curves independent of the data set selected. Hypothesizing invariance to data for similar OTH-T parameters indicates the usefulness of such empirical curves in supporting a decision-maker. Applying this approach to large ensembles of data collected during live or man- in-the-loop simulation should allow a better understanding of invariant and variant aspects of OTH-T success rates and the choice of critical values for thresholds used to decide whether or not to engage a target at a given time and shooter location. Other results focus on the dependence of MBM metrics on model parameters such as weapon and contact uncertainty areas. These results should be useful in assessing the validity of MBM metrics for various engagements. 1. Introduction Parameters such as entropy can be used to characterize computing information quantity, others such as expected-positional-error to reflect its quality or accuracy, throughput to measure systems performance, and level of success in achieving a particular operational objective to assess mission effectiveness. But the global optimization needed to ensure effective battle force operations requires that these parameters be computed in terms of value toward desired end results. Such optimization cannot be done from a local point of view unless an appropriate “looking glass” is used to transform local information into global metrics and as long as the end results are reliably reflected in information available locally. The effect of communications, command, control and information system (C3IS) improvements or changes on military operations or on mission effectiveness can be evaluated through characterizations of system performance and of information quality known as MOPs. Such results, however, fall short of demonstrating the impact of C3IS improvements or changes on the actual capability to conduct successful operations or on mission effectiveness, defined here as
-
Upload
independent -
Category
Documents
-
view
0 -
download
0
Transcript of Impact of Systems and Information Quality on Mission Effectiveness
Impact of Systems and Information Quality on Mission Effectiveness
Paul Labbé, P. Engineer René Proulx
Defence Scientist, IEEE Senior MemberDefence Research Establishment Valcartier/
Centre de recherches pour la défense, Valcartier2459 Pie-XI Blvd. North
Val-Bélair (Québec), Canada G3J 1X5Tel.: (418) 844-4000 X 4479 FAX: (418) 844-4538
Senior System Analyst, MathematicianNeuring Inc.
7 rue de LavalQuébec (Québec), Canada G1R 3T8
Tel./FAX: (418) [email protected]@usa.net
Abstract
To resolve an outstanding issue in assessing the value to mission effectiveness of the insertion ofinformation technology in command and control, the Defence Research Establishment Valcartier(DREV) has explored means and methods for linking information quality and system measuresof performance (MOPs) to decision and mission measures of effectiveness (MOEs). Theresulting model-based measures (MBMs) assess the capabilities of afloat-command informationsystems to support over-the-horizon targeting (OTH-T). Results obtained showed that the impactof system and information quality on mission success rate is non-linear but displays similarcharacteristic curves independent of the data set selected. Hypothesizing invariance to data forsimilar OTH-T parameters indicates the usefulness of such empirical curves in supporting adecision-maker. Applying this approach to large ensembles of data collected during live or man-in-the-loop simulation should allow a better understanding of invariant and variant aspects ofOTH-T success rates and the choice of critical values for thresholds used to decide whether ornot to engage a target at a given time and shooter location. Other results focus on the dependenceof MBM metrics on model parameters such as weapon and contact uncertainty areas. Theseresults should be useful in assessing the validity of MBM metrics for various engagements.
1. Introduction
Parameters such as entropy can be used to characterize computing information quantity, otherssuch as expected-positional-error to reflect its quality or accuracy, throughput to measuresystems performance, and level of success in achieving a particular operational objective toassess mission effectiveness. But the global optimization needed to ensure effective battle forceoperations requires that these parameters be computed in terms of value toward desired endresults. Such optimization cannot be done from a local point of view unless an appropriate“looking glass” is used to transform local information into global metrics and as long as the endresults are reliably reflected in information available locally.
The effect of communications, command, control and information system (C3IS) improvementsor changes on military operations or on mission effectiveness can be evaluated throughcharacterizations of system performance and of information quality known as MOPs. Suchresults, however, fall short of demonstrating the impact of C3IS improvements or changes on theactual capability to conduct successful operations or on mission effectiveness, defined here as
MOEs. Only by relating information quality and system MOPs to decision and mission MOEs ina causal manner can one establish the value of the static and dynamic information a commanderuses to plan operations and to make decisions. This relationship fulfills an essential analysisrequirement for comparing the effects of changes in wide-area picture (WAP) systems andprocedures on mission effectiveness and can also contribute to cost-effective planning of bothsystem development and military operations [1-6].
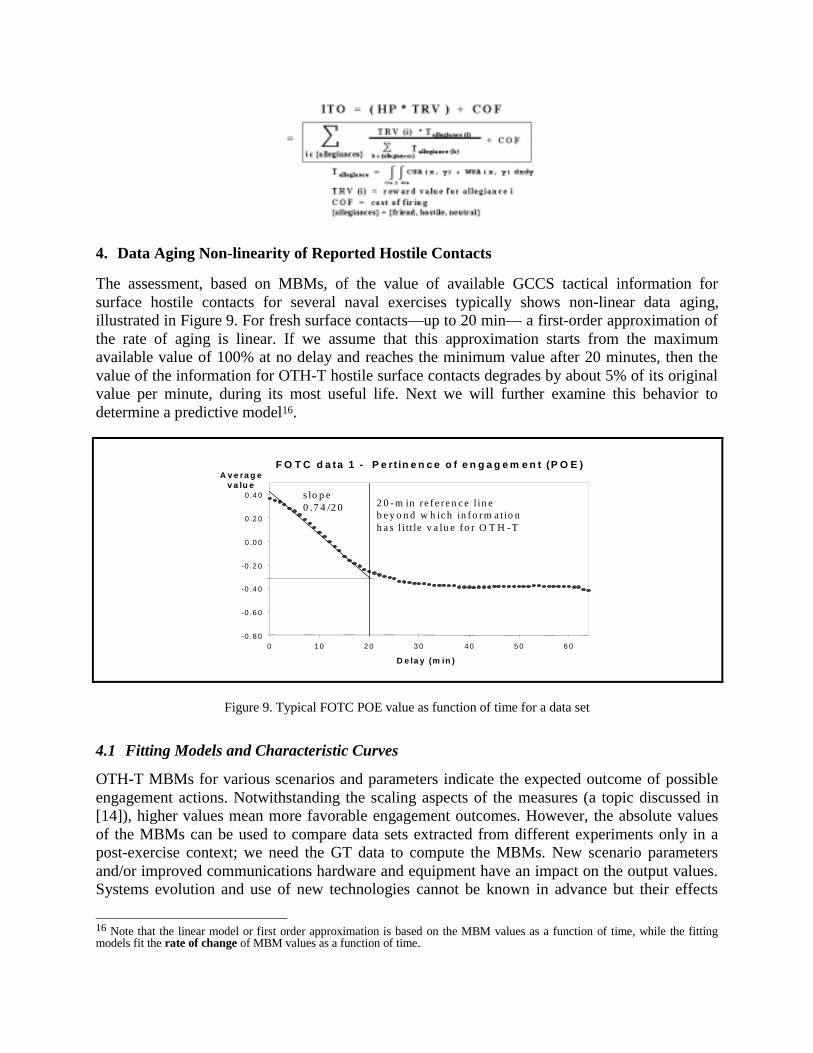
This paper presents a simplified version of this encompassing objective using a measure ofmission effectiveness that can be approximated by assessing the outcomes of hypothetical targetengagements. MBMs were developed to compute the value of information used by a commanderwhen deciding to intercept a target at a given time (including the people, procedures, systemsand sensors involved in the generation and sharing of this data). Consequently, these MBMs linkinformation quality and systems MOPs to a MOE. Computation of the measures is performed ina simulation setting in which commanders use current information for OTH-T. Models weredesigned to account for errors in the reported information of track data, for weapon footprintsand for contact uncertainty parameters. Different probability distributions, utility functions anddecision models are used to compute the expected outcome of engagements, yielding two similarmeasures: pertinence-of-engagement (POE) and intended-target-opportunity (ITO).
Some geopolitical conflicts call for drastic changes in normal rules-of-engagement (ROEs).When engaging potential targets, it is crucially important to predict and evaluate the aggregateimpact of an offensive action such as the launch of a missile. This impact may be estimated invarious ways and from different points of view. It may include the cost and effort of conductingan offensive action, expected enemy damage as a result of such action, tactical consequences,geopolitical changes and many other factors. It is unlikely that a simple measure of impact couldapply to all cases of interest, but any such measure should capture an essential component of theimpact, by establishing some quantification of the outcomes of an offensive action.
In the context examined, the POE assesses the general outcome of launching a weapon at atarget, an identified hostile contact in the decision-maker database. This measure relies on autility function that considers the cost of firing weapons, hit probabilities of objects in thefootprints of available weapons and the pertinence-reward value that combines allegiances ofthese objects (ships, in this case). The ITO assesses the outcome in a similar manner but it ismore specific. Its target-reward-value, which combines allegiances of objects in weapons’footprints, gives lower weights to hostile ships other than the intended target. Thus, the ITOprovides a more accurate estimate of the impact of a system in terms of mission effectivenesswhen certain targets have a determinant role in courses of action crucial to mission success.
This work is an extension of the study performed by an AUS-CAN-NZ-UK-US1 working groupfor the Command and Control Board. It focuses on information management, defined here as acollection of effective processes needed to produce, store, retrieve and share information in anyformat, on any medium and via any means of exchange to support operations and missions. Thestudy found that mission effectiveness is increased by such architectural changes as modifyingbroadcast procedures at the track coordinator, basing transmission priority on the value of trackinformation to the mission and on the fusion of local to global information.
1 Australia, Canada, New Zealand, United Kingdom and United States committees for operations interoperability.
Results also showed that by using appropriate MBMs and experimental data from operational orexperimental systems, one could project the impact of architectural changes on missioneffectiveness. Accumulated results gathered from applying MBMs to various experimental datacollected from simulated and live military exercises allowed us to build an empirical model ofdata aging for OTH-T. Typical curves of data aging and timeliness pace have been obtained. It islikely that typical critical times and formulas (inequalities) for engagements could be deducedfrom these results. Once these critical times and formulas are established, ground-truth (GT) datawill not be necessary to apply them in real-time applications. Consequently, if results arecoherent across various military exercises it is expected that one would be able to use thesetimeliness models of the impact of information on mission effectiveness to predict, in real-timesituations, the probability of success of an OTH-T engagement. This probability excludesdamage assessment and the kill probability of the weapon used. Our MBM probability of successindicates the value of the information to the decision whether or not to engage a specific target.The transformation of these probabilities into kill probabilities and damage levels requiresseveral refinements that may use classified information: specifics of each target, including itsstatus and environment, and specifics of each weapon used against a target, includingcountermeasures, environmental, geographical and relative-geometry factors.
This paper defines various parameters and aspects of MBMs. Sensitivity of the measures tovariations in certain parameters is examined. Non-linearity of data aging and its rate are studiedand modeled. A targeting predictive model is provided. Impacts on mission effectiveness ofreported potential architecture changes are summarized.
2. Background
To study WAP systems (WAPSs), the AUS-CAN-NZ-UK-US C3 (command, control andcommunications) defined a work program and set up an ad-hoc working group to investigate themanagement of organic and non-organic information in a maritime environment (MONIME).MONIME was mandated to conduct a series of experiments to collect sufficient data for WAPsystems analyses, characterization and requirements definition [7]. Experimental data include the1993 Tactical Information Management Simulation (TIMSIM ’93) [8], the Rim of the Pacificlive exercises 1994 and 1996 (RIMPAC ’94 and RIMPAC ’96 [9, 10]) and the second 1995Maritime Command Operational Training Exercise held along the Pacific Coast (MARCOT ’95-2) data [11]. Results and recommendations from this series of experiments form the basis of theAUS-CAN-NZ-UK-US C3 Organization’s “Handbook 5 (HB5), Guidelines for MaritimeInformation Management”: guidelines to be used in the procurement of national C3I WAP-basedsystems for the compilation and sharing of accurate WAPs [1].
2.1 Architecture and Information Flow Used in Experiments
The architecture and information flow used in the sampled TIMSIM and RIMPAC exercises arebased on a central node that processes data from local and remote sources or sensors (includingspace-based assets). The Force Over-the-horizon Track Coordinator (FOTC) requires severalGlobal Command and Control Systems (GCCSs) and is a man-intensive information processingand management function usually assigned to a suitably equipped ship, e.g., a carrier vehicle(CV). The FOTC fuses and compiles the tactical picture. Procedures allow the data—mainly
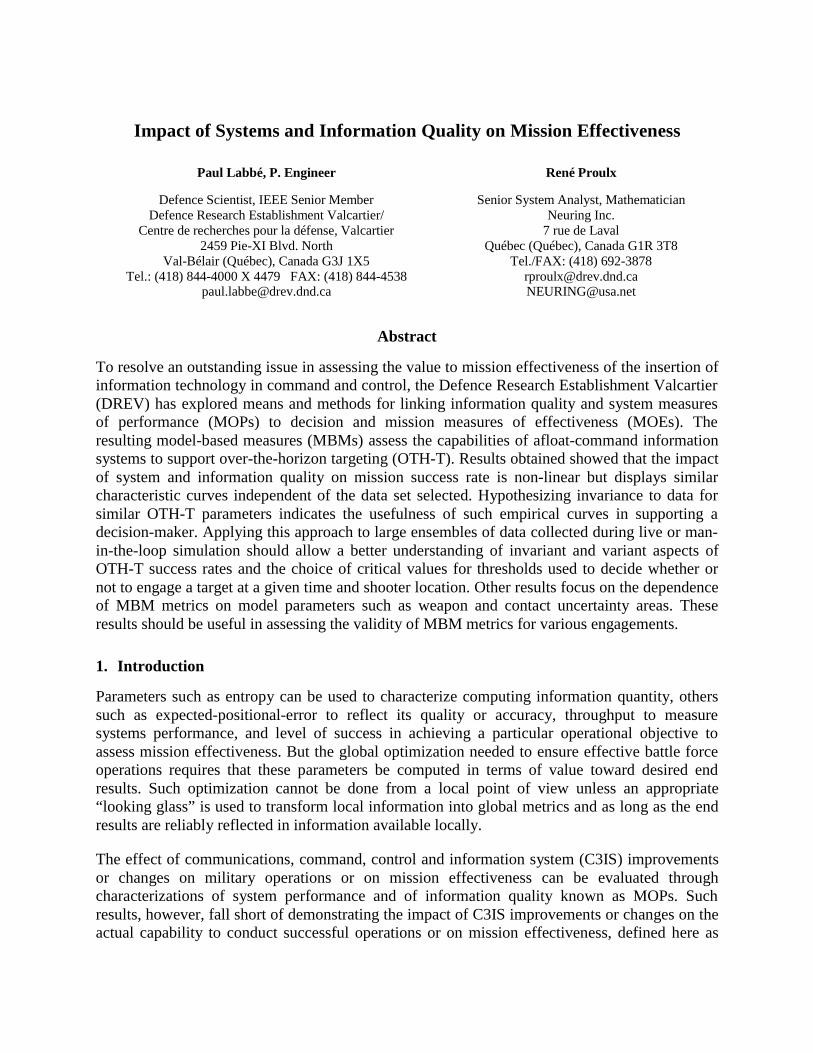
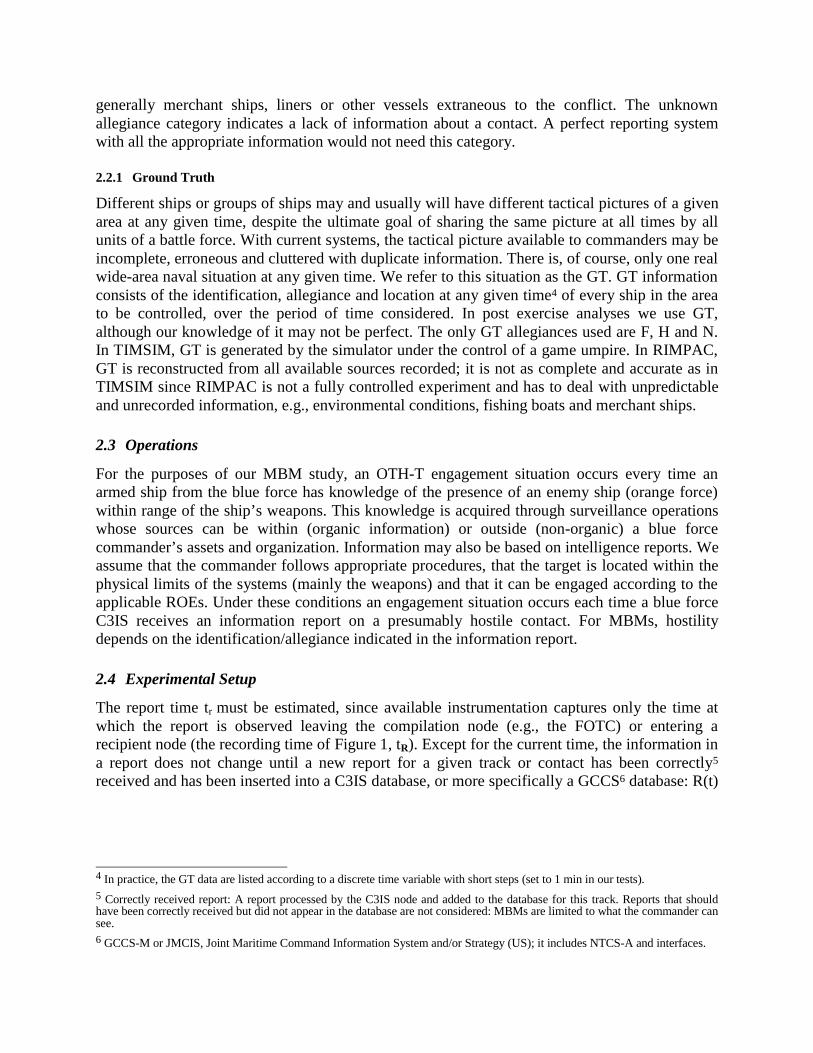
track information—to be broadcast periodically2 by satellite or radio, using the Allied CommandInformation Exchange System (ACIXS)3, for example. High-interest tracks can be sent overnarrow-bandwidth radio channels to participating units not on ACIXS. Participating units useGCCS in conjunction with their C3IS for planning and operations. TIMSIM includes data for theTomahawk Weapons Control System (TWCS). In Figure 1, track coordination occurs at theFOTC node and information arriving to the FOTC is similar to that fed to a TWCS, althoughinformation-management procedures are slightly different since the two systems serve differentpurposes.
communications
FOTC functions require severalGCCS and trained staff
tF FOTC database time
tRPreceiving
time
tP participant GCCSdatabase time
database
tRF transmission time
tR recording times
database
tactical picturetransmitted
tpos of localinformation
sources & sensors
tpos of remoteinformation
sources & sensors
tactical picturereceived
other tP & tRPof participants
Figure 1. Information flow of the wide-area systems used in the experiments
2.2 Tactical Information Segment Used for the Tests
OTH-T MBMs were tested for the surface segment of a wide-area naval tactical picture ofwarships sailing within their areas of operational interest (AOIs) that report on a variety ofcontacts. However, the information-exchange traffic included all types of tracks (e.g., air andsubmarine) and other systems and operations information required, but our MBMs onlyaddressed the value of the information regarding OTH-T against hostile ships. The ships of thesurface tracks can be classified according to their perceived or reported allegiance as friendly(F), hostile (H), neutral (N) or unknown (U), a subset of NATO-defined allegiances. Friendlyand hostile ships are military vessels of the forces in conflict. Usually we refer to friendly shipsas the “blue” force and to hostile ones as the “orange” or “red” force. Neutral contacts are
2 Periodic update times observed in our data include 20, 15 and 10 min.3 The OTCIXS, Officer in Tactical Command Information Exchange System, or ACIXS, is a communications system that usessatellite technologies at data rates ranging from 2 400 to 9 400 kb/s. TADIXS, Tactical Data Information Exchange System, is thereal system (UHF SATCOM data link) and OTCIXS or ACIXS is a concept.
generally merchant ships, liners or other vessels extraneous to the conflict. The unknownallegiance category indicates a lack of information about a contact. A perfect reporting systemwith all the appropriate information would not need this category.
2.2.1 Ground Truth
Different ships or groups of ships may and usually will have different tactical pictures of a givenarea at any given time, despite the ultimate goal of sharing the same picture at all times by allunits of a battle force. With current systems, the tactical picture available to commanders may beincomplete, erroneous and cluttered with duplicate information. There is, of course, only one realwide-area naval situation at any given time. We refer to this situation as the GT. GT informationconsists of the identification, allegiance and location at any given time4 of every ship in the areato be controlled, over the period of time considered. In post exercise analyses we use GT,although our knowledge of it may not be perfect. The only GT allegiances used are F, H and N.In TIMSIM, GT is generated by the simulator under the control of a game umpire. In RIMPAC,GT is reconstructed from all available sources recorded; it is not as complete and accurate as inTIMSIM since RIMPAC is not a fully controlled experiment and has to deal with unpredictableand unrecorded information, e.g., environmental conditions, fishing boats and merchant ships.
2.3 Operations
For the purposes of our MBM study, an OTH-T engagement situation occurs every time anarmed ship from the blue force has knowledge of the presence of an enemy ship (orange force)within range of the ship’s weapons. This knowledge is acquired through surveillance operationswhose sources can be within (organic information) or outside (non-organic) a blue forcecommander’s assets and organization. Information may also be based on intelligence reports. Weassume that the commander follows appropriate procedures, that the target is located within thephysical limits of the systems (mainly the weapons) and that it can be engaged according to theapplicable ROEs. Under these conditions an engagement situation occurs each time a blue forceC3IS receives an information report on a presumably hostile contact. For MBMs, hostilitydepends on the identification/allegiance indicated in the information report.
2.4 Experimental Setup
The report time tr must be estimated, since available instrumentation captures only the time atwhich the report is observed leaving the compilation node (e.g., the FOTC) or entering arecipient node (the recording time of Figure 1, tR). Except for the current time, the information ina report does not change until a new report for a given track or contact has been correctly5
received and has been inserted into a C3IS database, or more specifically a GCCS6 database: R(t)
4 In practice, the GT data are listed according to a discrete time variable with short steps (set to 1 min in our tests).5 Correctly received report: A report processed by the C3IS node and added to the database for this track. Reports that shouldhave been correctly received but did not appear in the database are not considered: MBMs are limited to what the commander cansee.6 GCCS-M or JMCIS, Joint Maritime Command Information System and/or Strategy (US); it includes NTCS-A and interfaces.
= constant for t ∈ [tpos , time of a new report for that track[7. Only the associated time andidentification (i.e., the unit identifier) of the database change.
Assuming no processing or transmission delays, at time tpos we assess the goodness of the sensordata for a decision (sensor baseline). After a delay (tr – tpos), i.e., at time tr, we assess anotherMBM as soon as a report enters a GCCS database. A report R(tr) tells us where to apply theMBM and time tr tells us when in the GT file. For the results presented in this paper weconsidered decision times occurring from 0 to 64 min after the position time, in order to assesssuccess rate non-linearity as a function of information age (tr – tpos).
The FOTC is at the compilation node, and the time tF of Figure 1 is the FOTC time estimatedfrom the transmission time tRF (tRF > tF). An information item is stored in the database as soon asit has been processed by the FOTC staff and GCCSs. Then it is queued to outgoing messagelists—the FOTC broadcast or another information service—until the next transmissionopportunity. The time when a report is received from another participating GCCS unit is referredto as the participant time8 or tP in Figure 1. All this happens in real time, while sampling theprocess of developing and sharing a common WAP.
In practice, the information reports received by a ship are entered manually or automatically intoan input queue, not directly into the database, and the report time thus represents the time atwhich this operation was performed, without regard for delays due to instrumentation. So thereare two recording times, tRF and tRP: tRF for the FOTC and tRP for the participant receiving time,with tF < tRF < tRP < tP. For our purposes, we consider that the commander of a ship hasknowledge of an incoming contact information report at tr , which we approximate with tRF andtRP depending on the measure required.
2.5 Areas of Uncertainty
The positional information in WAP systems is uncertain for several reasons. For example, anysensor that estimates the location and identification of an object it has detected does so withfinite resolution. One aspect of its resolution, the positional accuracy, leads to an area-of-uncertainty (AOU) around the estimated location. In some systems this contact AOU is providedby the source of data, but since AOUs are not yet systematically provided for in all the contactreports subjected to our analysis we impose an alternative in our model that is described later.There are also other types of AOUs that naturally arise in physical systems.
2.6 Time of Engagement Opportunity
An engagement situation occurs whenever the commander of an armed blue ship receives aninformation report on a presumed hostile contact. This report holds a position time tpos and areport time tr, with tpos < tr. The models may use either of these two values as the actual time ofengagement opportunity, i.e., the time at which an engagement may take place (or might haveoccurred). Of course, in reality an engagement decision cannot be taken before the existence of
7 Brackets opened toward the outside mean that the exact value is excluded of the range of the variable, e.g., t ∈ [tpos , time of anew report for that track[ includes t0 but excludes the new report time. Otherwise double accounting of data would occur.8 Note that tP for the participating GCCS unit time is larger than tpos , the “position time” from the sensor, and larger than tF due tothe delays required to process and transmit the information.
the information report is known. However, allowing the selection of different times ofengagement in the models yields essential measures for estimating the impact of system changeson mission effectiveness.
The baseline assessment models used may be viewed as “optimal” since they are equivalent toassuming that information reports are available instantaneously, when they are generated bysensors/sources (i.e., position time = report time = time of engagement opportunity). Thesemodels represent the maximum usefulness value of the available information that can beprovided to a commander. This value is the source or sensor baseline, which can be used toevaluate the impact of systems architecture changes on mission effectiveness.
The delay models are “time degraded” models where the target information has not been updatedsince position time (i.e., position time < report time = time of engagement opportunity)9. Timedegradation of the information represents system limitations that are assumed to be sub-optimal.In previous studies [4] we have shown that assuming dead-reckoning of the intended targetduring the time of delay actually yields a worse engagement outcome than assuming a staticposition, so the results presented here were obtained using delay models with no target locationprediction. The precise definition and parameters of the MBM simulation models and scenariosare given in [12-14].
Actual engagement decisions are few in live or realistic exercises, so the conclusions drawn fromtheir outcomes have very little, if any, statistical significance. In contrast, applying the models aswe did over the experimental data yields samples approximately a hundredfold larger, whichreinforces the statistical soundness of inferences made.
3. Some Definitions
An encompassing definition of a MBM follows:
1. A MBM is a measure in which a particular decision-maker (DM) has been removed from thecommand and control loop in order to assess the value of a set of MOPs for certain MOEs,systematically by simulation. Since several DMs may influence a function, they are removedindividually, one at a time.
2. MBMs replace the complex, man-in-the-loop decision process with simplified models.
3. All staff other than the decision-maker for the function under study is included in the systemassessment.
4. The simulation models link MOPs to MOEs by evaluating the results of actions, based on GT.
Specifically, the reported MBMs are defined for OTH-T. Such MBMs assess the value of theinformation made available to a commander by examining each tactical report of track data thatmeets a particular set of engagement conditions. Location, systems and temporal data are used toestablish the engagement parameters and scenarios. Outcomes subsequent to decisions areassessed using both decision-process model definitions and algorithms that include hit-probability calculations, as well as GT information about actual target locations (possiblebecause this is a post-exercise analysis). AOUs are used to represent the intrinsic level of 9 The position time or sensor detection time is earlier than the report time. We set the time of an engagement to the report time soas to measure the effect of data aging on the result of the engagement.
uncertainty of missile-interception areas, of GT data and of the information presented by C3ISsto commanders. The measures assign reward values that take into account the allegiances ofcontacts in the interception area and a utility cost for firing a missile.
Using MBMs as a yardstick based on OTH-T effectiveness, various potential changes to thearchitecture used in Coalition exercises that might improve the timeliness and accuracy of theinformation made available to decision makers at time of decision (a MOP) are assessed in termsof their impact on OTH-T potential success rates (a MOE). In this paper, information processingincludes sensor data processing, data fusion, situation assessment, weapon pairing, actionplanning and other deliberative processes that take place before sending the engagement data tothe shooter. The information exchange concerns the geographical distribution of the requiredengagement data from an information-processing node to a shooter. Updated information is usedduring weapon deployment until final interception or success is confirmed. Resourceoptimization would benefit from decision support based on OTH-T MBM characteristic curvesand the critical age of information required for a given mission success rate.
3.1 Scenario
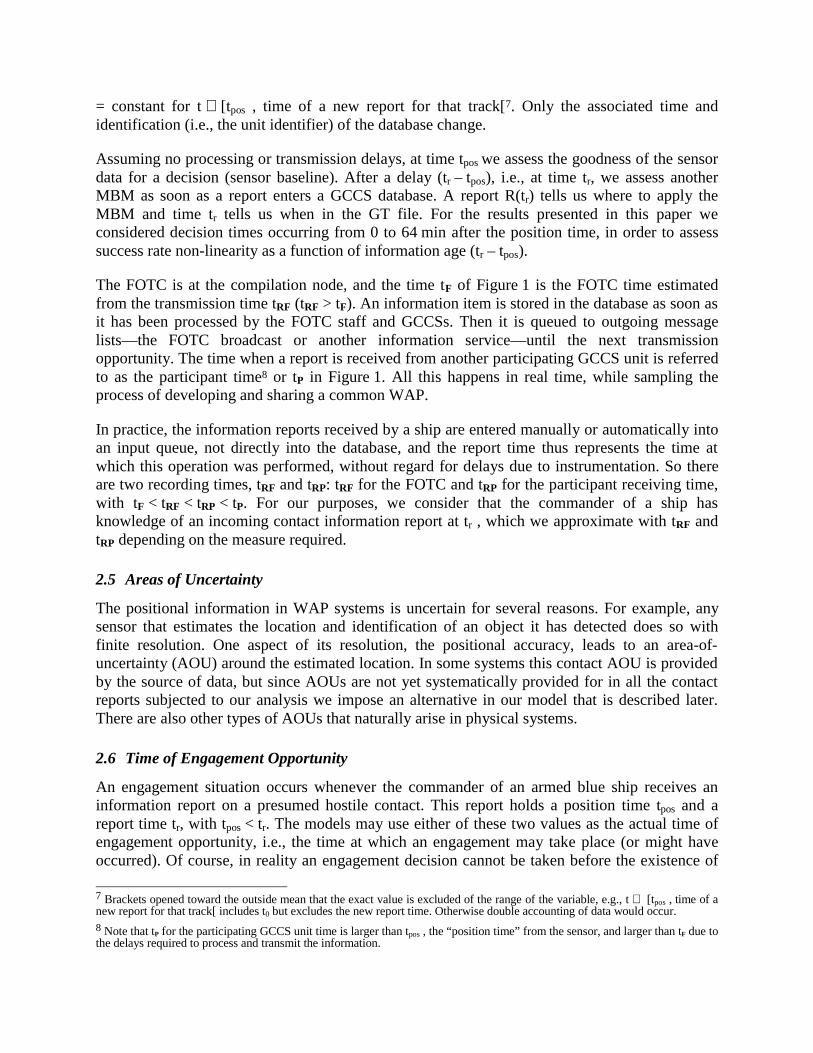
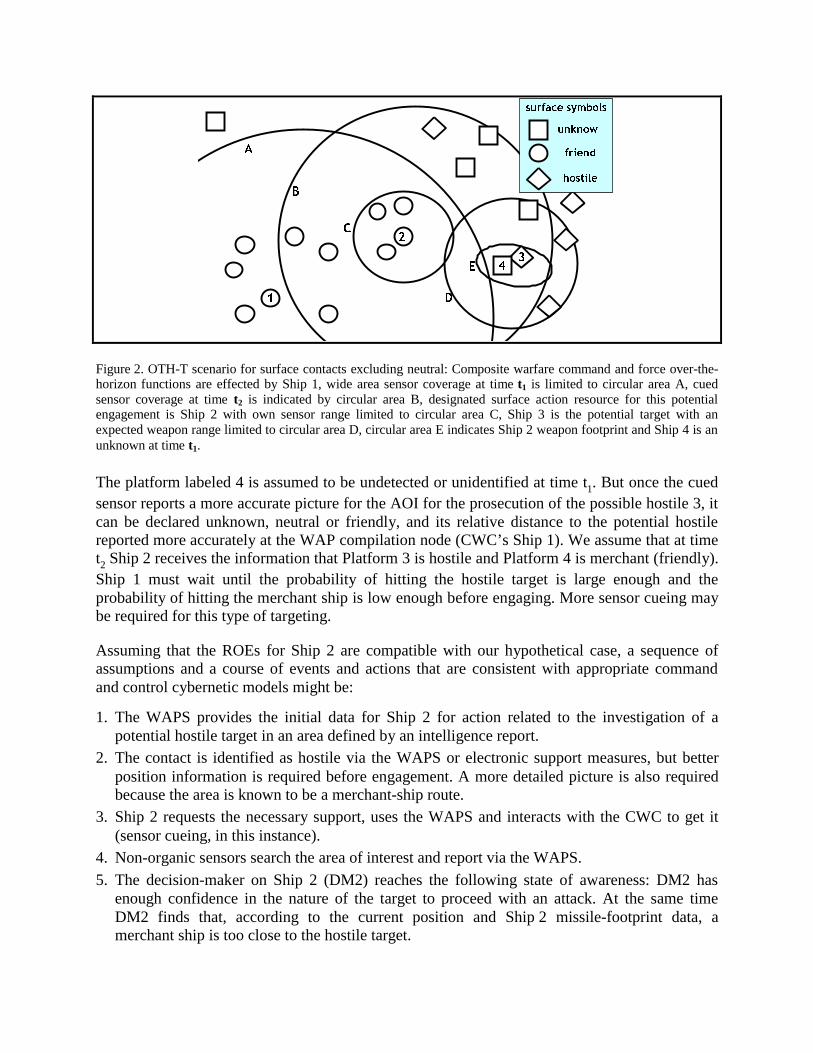
In Figure 2 we assume that the WAP compilation and CWC (composite warfare commander) areboth on Platform 1. At time t1 a wide-area sensor and various other sources provide the WAP inthe area delimited by the circle A. At time t1 Ship 2 of a SAG (surface action group) is identifiedas the candidate to investigate an area reported by intelligence as of interest. The tactical sensorsof Ship 2 are limited to the area of circle C. According to an intelligence report and encyclopedicdata, the suspected hostile target may have weapon area coverage capabilities that arerepresented by circle D. The elliptical area labeled D represents the capability of an appropriateShip 2 weapon to maneuver around the aim position once it is in its “lock-on some target” phase.This missile footprint can be deduced from the engagement geometry, scenario parameters andmissile characteristics, but to keep our model simple and unclassified we selected typicalcharacteristics described and used in previous MBM definitions [4].
�
%
&
(
$
'
�
��
VXUIDFH V\PEROV
XQNQRZ
IULHQG
KRVWLOH
Figure 2. OTH-T scenario for surface contacts excluding neutral: Composite warfare command and force over-the-horizon functions are effected by Ship 1, wide area sensor coverage at time t1 is limited to circular area A, cuedsensor coverage at time t2 is indicated by circular area B, designated surface action resource for this potentialengagement is Ship 2 with own sensor range limited to circular area C, Ship 3 is the potential target with anexpected weapon range limited to circular area D, circular area E indicates Ship 2 weapon footprint and Ship 4 is anunknown at time t1.
The platform labeled 4 is assumed to be undetected or unidentified at time t1. But once the cuedsensor reports a more accurate picture for the AOI for the prosecution of the possible hostile 3, itcan be declared unknown, neutral or friendly, and its relative distance to the potential hostilereported more accurately at the WAP compilation node (CWC’s Ship 1). We assume that at timet2 Ship 2 receives the information that Platform 3 is hostile and Platform 4 is merchant (friendly).Ship 1 must wait until the probability of hitting the hostile target is large enough and theprobability of hitting the merchant ship is low enough before engaging. More sensor cueing maybe required for this type of targeting.
Assuming that the ROEs for Ship 2 are compatible with our hypothetical case, a sequence ofassumptions and a course of events and actions that are consistent with appropriate commandand control cybernetic models might be:
1. The WAPS provides the initial data for Ship 2 for action related to the investigation of apotential hostile target in an area defined by an intelligence report.
2. The contact is identified as hostile via the WAPS or electronic support measures, but betterposition information is required before engagement. A more detailed picture is also requiredbecause the area is known to be a merchant-ship route.
3. Ship 2 requests the necessary support, uses the WAPS and interacts with the CWC to get it(sensor cueing, in this instance).
4. Non-organic sensors search the area of interest and report via the WAPS.
5. The decision-maker on Ship 2 (DM2) reaches the following state of awareness: DM2 hasenough confidence in the nature of the target to proceed with an attack. At the same timeDM2 finds that, according to the current position and Ship 2 missile-footprint data, amerchant ship is too close to the hostile target.
6. As time passes, new data show that the hit probability for the hostile target is high enough andunintended hit probability is low enough to allow the target to be engaged, using a missile of acertain type from Ship 2. Ship 2 may use more organic or non-organic sensor support for thistargeting.
7. Ship 2 monitors the progress of action and continues its mission. Based on newly acquiredinformation or on a damage report, some of the previous actions may be repeated.
The decisions made by this model result in a random variable described by the outcomes, i.e., theconsequences of action, so the above assumptions and courses of events are part of the model towhich we apply statistical tests. The results of these tests indicate if the hypothesis is acceptableat the significance level of the tests. This is a multiple-step approach, since statistical evidencemust also be found for the quality of the data used and which set or sets are to be used.
Pt1
ship’s real course
one track report
next report forsame track
predictions
P t2Rt0
Rt0, nextT t0G
T t1G
T t2G
e 0,0e 0,1
e 1,1e 0,2
e 2,2
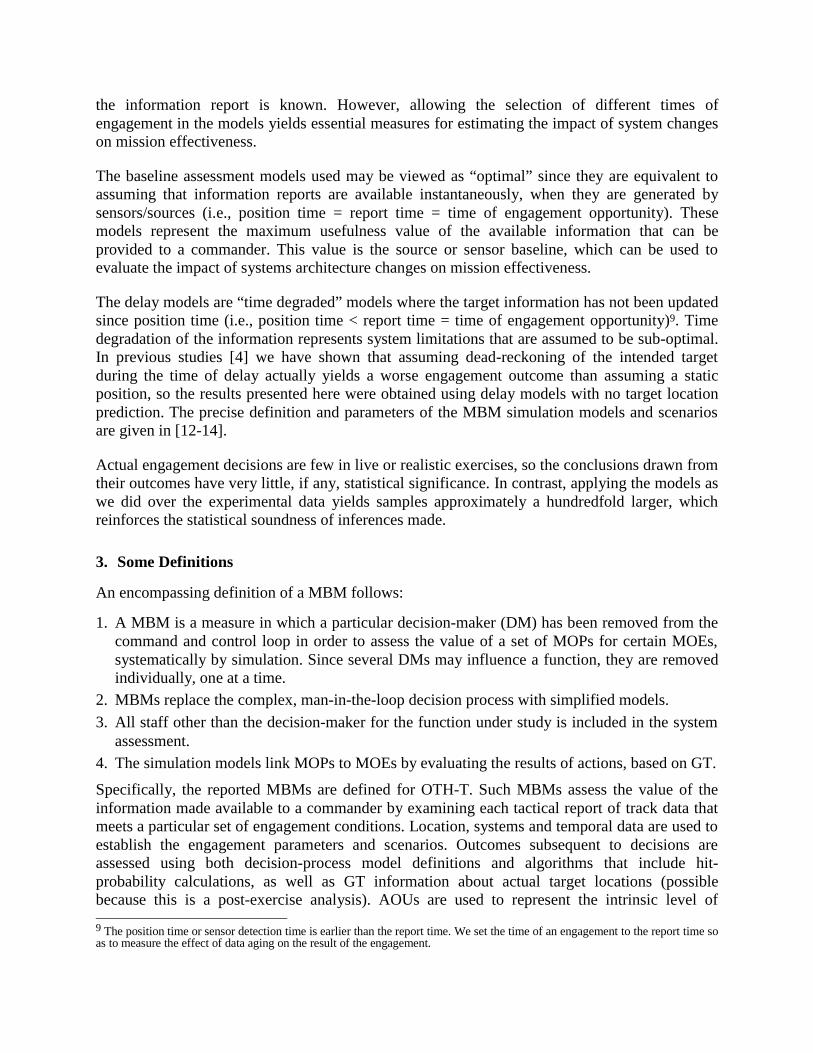
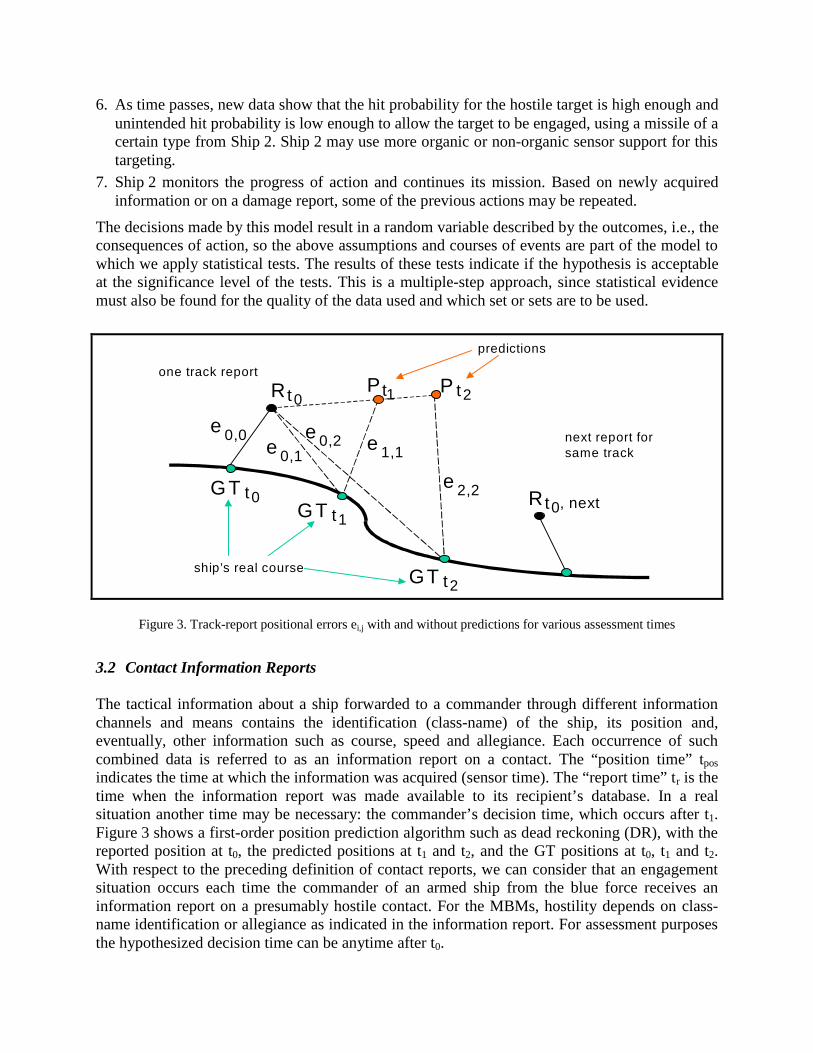
Figure 3. Track-report positional errors ei,j with and without predictions for various assessment times
3.2 Contact Information Reports
The tactical information about a ship forwarded to a commander through different informationchannels and means contains the identification (class-name) of the ship, its position and,eventually, other information such as course, speed and allegiance. Each occurrence of suchcombined data is referred to as an information report on a contact. The “position time” tpos
indicates the time at which the information was acquired (sensor time). The “report time” tr is thetime when the information report was made available to its recipient’s database. In a realsituation another time may be necessary: the commander’s decision time, which occurs after t1.Figure 3 shows a first-order position prediction algorithm such as dead reckoning (DR), with thereported position at t0, the predicted positions at t1 and t2, and the GT positions at t0, t1 and t2.With respect to the preceding definition of contact reports, we can consider that an engagementsituation occurs each time the commander of an armed ship from the blue force receives aninformation report on a presumably hostile contact. For the MBMs, hostility depends on class-name identification or allegiance as indicated in the information report. For assessment purposesthe hypothesized decision time can be anytime after t0.
3.2.1 Positional Uncertainty
The positional information in WAPS is uncertain for a number of reasons. This lack of precisionis expressed by an AOU: there is a probability pi that the object lies anywhere within this areaand a probability po = 1 - pi that it lies outside. Typically, a system may use a confidence level of95%; that is, the probability of the object being outside by chance only is 0.05. In some systemsthe contact AOU is provided by the source of data, but since this information is not available forall the contact reports used in our analysis, we have simplified the computation by assuming thatpo is null or negligible (i.e., pi = 1).
3.3 Weapon-uncertainty Area
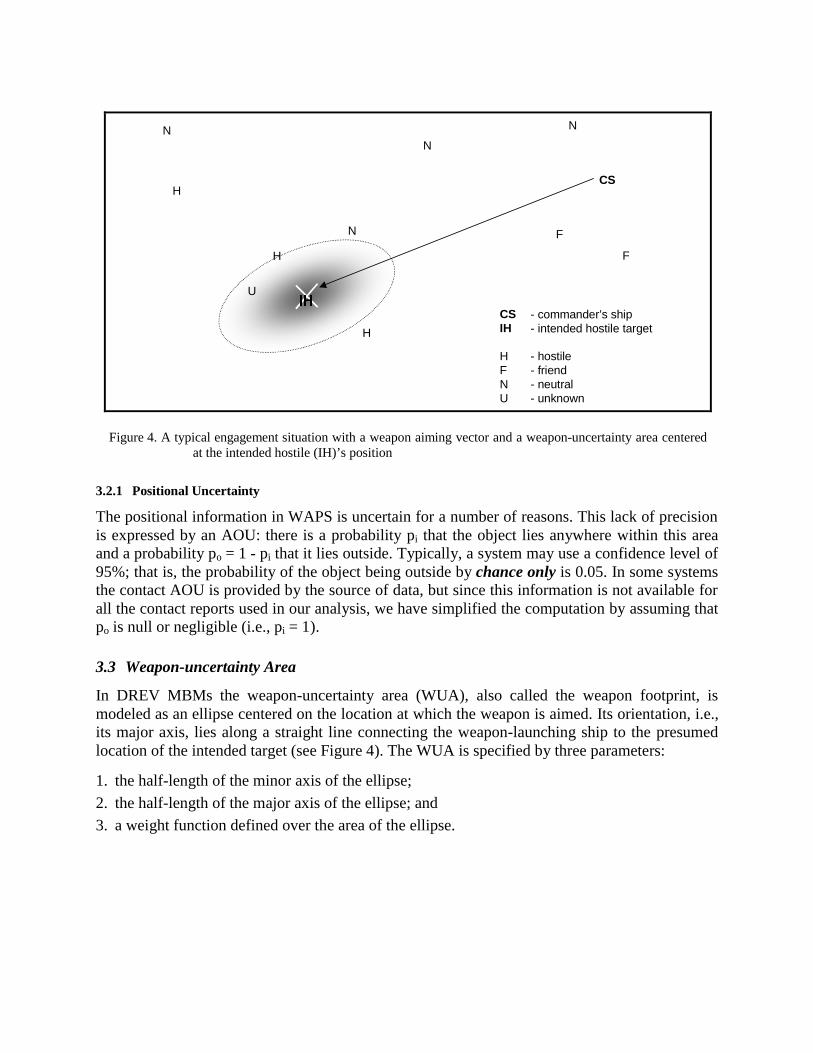
In DREV MBMs the weapon-uncertainty area (WUA), also called the weapon footprint, ismodeled as an ellipse centered on the location at which the weapon is aimed. Its orientation, i.e.,its major axis, lies along a straight line connecting the weapon-launching ship to the presumedlocation of the intended target (see Figure 4). The WUA is specified by three parameters:
1. the half-length of the minor axis of the ellipse;
2. the half-length of the major axis of the ellipse; and
3. a weight function defined over the area of the ellipse.
NN
U
H
N
FN
H
H
CSIH
HFNU
- commander’s ship- intended hostile target
- hostile- friend- neutral- unknown
,+
CS
F
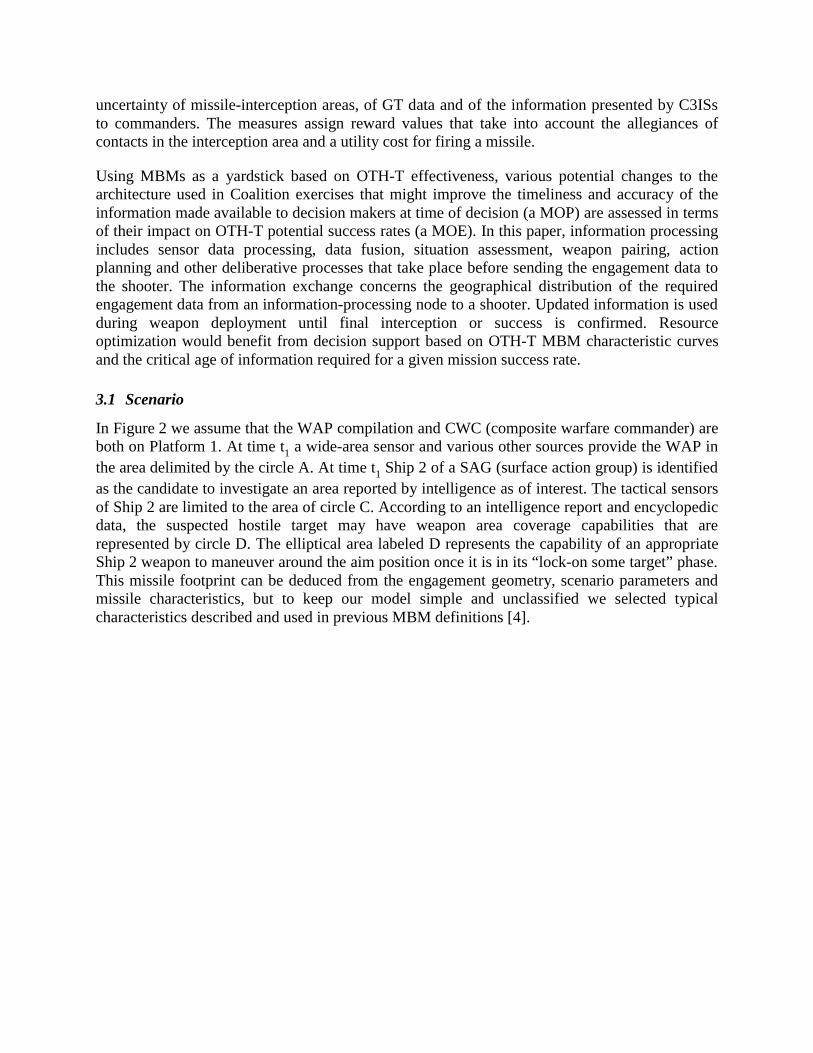
Figure 4. A typical engagement situation with a weapon aiming vector and a weapon-uncertainty area centeredat the intended hostile (IH)’s position
The weight function, defined over all points within the elliptic area (Figure 4), assigns to eachsuch point a weight indicating the likelihood of that point’s being hit by the weapon if it islaunched. Although any suitable function can be used for this weapon parameter, we use uniformand triangular functions as a starting point. These functions can be described as follows:
=elsewhere ,0
WUAin the ),( points allfor ,1),( uniform
yxyxW
( ) ( )
−+−−
=
elsewhere ,0
WUAin the ),( points allfor ,),(
),(
),( triangular
22
yxyxR
cyycxxyxR
yxW
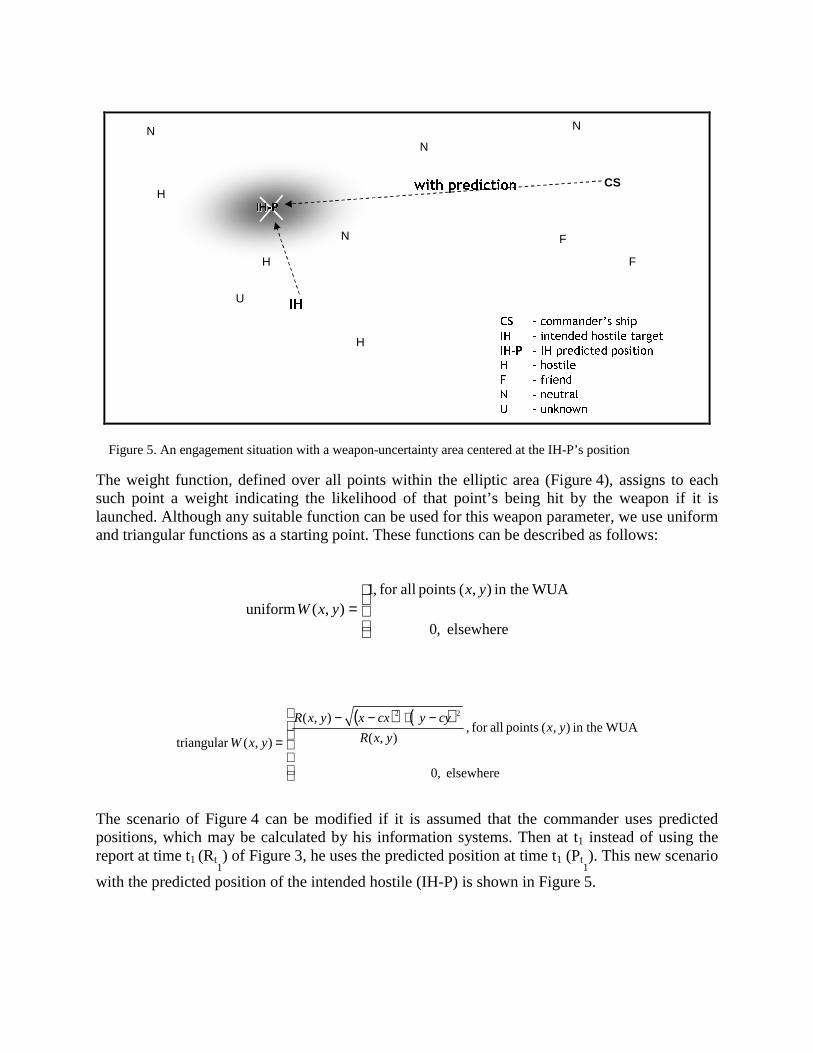
The scenario of Figure 4 can be modified if it is assumed that the commander uses predictedpositions, which may be calculated by his information systems. Then at t1 instead of using thereport at time t1 (Rt
1) of Figure 3, he uses the predicted position at time t1 (Pt
1). This new scenario
with the predicted position of the intended hostile (IH-P) is shown in Figure 5.
&6
,+
,+�3
+
)
1
8
� FRPPDQGHU·V VKLS
� LQWHQGHG KRVWLOH WDUJHW
� ,+ SUHGLFWHG SRVLWLRQ
� KRVWLOH
� IULHQG
� QHXWUDO
� XQNQRZQ
ZLWK SUHGLFWLRQ
,+�3,+�3
NN
U
H
N
FN
H
HCS
F
,+
Figure 5. An engagement situation with a weapon-uncertainty area centered at the IH-P’s position
1
+
)
&6
,+
+
)
1
8
� FRPPDQGHU·V VKLS
� LQWHQGHG KRVWLOH WDUJHW
� KRVWLOH
� IULHQG
� QHXWUDO
� XQNQRZQ
&6
)+
)
)
1
11
1
1
DFWXDO
WDUJHW
,+
1
++
1
++
8
+
,+
1
1
JURXQG�WUXWK
SRVLWLRQ
&6· GLVSOD\HG
SRVLWLRQ
&6· GLVSOD\HG
WDUJHW SRVLWLRQ
11
FLUFXODU�
XQFHUWDLQW\
DUHD
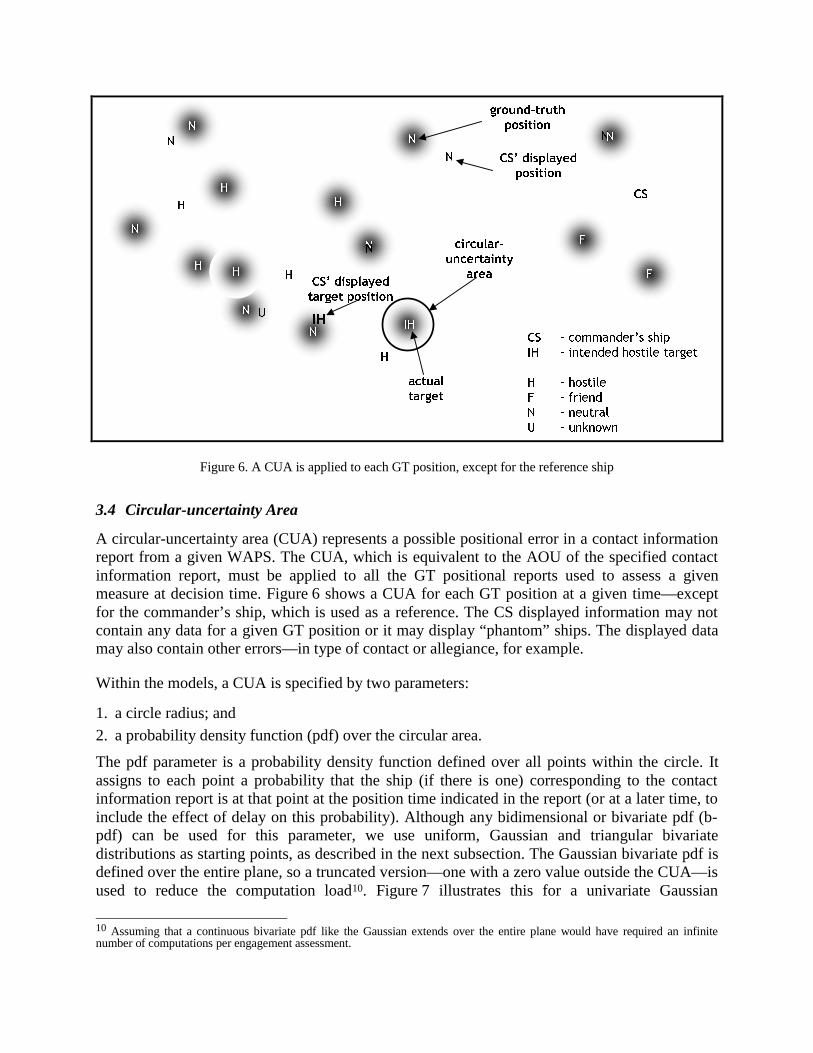
Figure 6. A CUA is applied to each GT position, except for the reference ship
3.4 Circular-uncertainty Area
A circular-uncertainty area (CUA) represents a possible positional error in a contact informationreport from a given WAPS. The CUA, which is equivalent to the AOU of the specified contactinformation report, must be applied to all the GT positional reports used to assess a givenmeasure at decision time. Figure 6 shows a CUA for each GT position at a given time—exceptfor the commander’s ship, which is used as a reference. The CS displayed information may notcontain any data for a given GT position or it may display “phantom” ships. The displayed datamay also contain other errors—in type of contact or allegiance, for example.
Within the models, a CUA is specified by two parameters:
1. a circle radius; and
2. a probability density function (pdf) over the circular area.
The pdf parameter is a probability density function defined over all points within the circle. Itassigns to each point a probability that the ship (if there is one) corresponding to the contactinformation report is at that point at the position time indicated in the report (or at a later time, toinclude the effect of delay on this probability). Although any bidimensional or bivariate pdf (b-pdf) can be used for this parameter, we use uniform, Gaussian and triangular bivariatedistributions as starting points, as described in the next subsection. The Gaussian bivariate pdf isdefined over the entire plane, so a truncated version—one with a zero value outside the CUA—isused to reduce the computation load10. Figure 7 illustrates this for a univariate Gaussian
10 Assuming that a continuous bivariate pdf like the Gaussian extends over the entire plane would have required an infinitenumber of computations per engagement assessment.
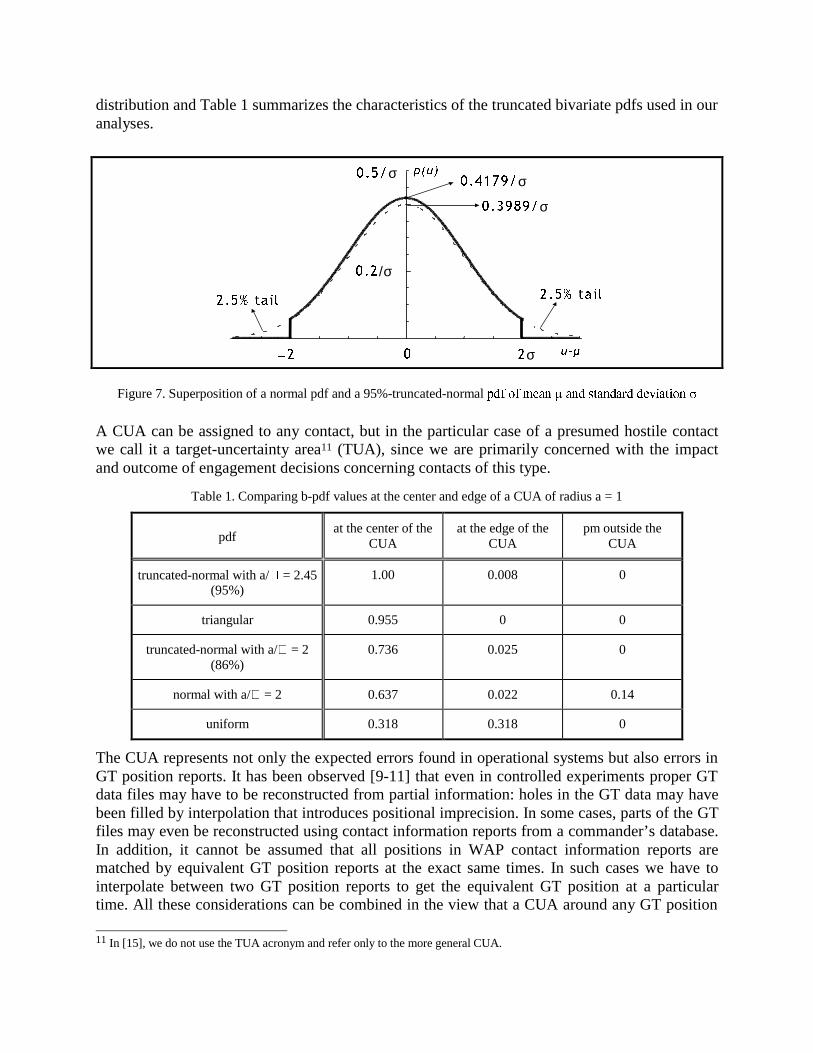
distribution and Table 1 summarizes the characteristics of the truncated bivariate pdfs used in ouranalyses.
�� �σ
���� WDLO
����σ
�
�������σ
�������σ
��� /�� WDLO
S�X�
X�õ
Figure 7. Superposition of a normal pdf and a 95%-truncated-normal SGI RI PHDQ � DQG VWDQGDUG GHYLDWLRQ 1
A CUA can be assigned to any contact, but in the particular case of a presumed hostile contactwe call it a target-uncertainty area11 (TUA), since we are primarily concerned with the impactand outcome of engagement decisions concerning contacts of this type.
Table 1. Comparing b-pdf values at the center and edge of a CUA of radius a = 1
pdfat the center of the
CUAat the edge of the
CUApm outside the
CUA
truncated-normal with a/� = 2.45(95%)
1.00 0.008 0
triangular 0.955 0 0
truncated-normal with a/� = 2(86%)
0.736 0.025 0
normal with a/� = 2 0.637 0.022 0.14
uniform 0.318 0.318 0
The CUA represents not only the expected errors found in operational systems but also errors inGT position reports. It has been observed [9-11] that even in controlled experiments proper GTdata files may have to be reconstructed from partial information: holes in the GT data may havebeen filled by interpolation that introduces positional imprecision. In some cases, parts of the GTfiles may even be reconstructed using contact information reports from a commander’s database.In addition, it cannot be assumed that all positions in WAP contact information reports arematched by equivalent GT position reports at the exact same times. In such cases we have tointerpolate between two GT position reports to get the equivalent GT position at a particulartime. All these considerations can be combined in the view that a CUA around any GT position
11 In [15], we do not use the TUA acronym and refer only to the more general CUA.
report represents a combination of all the errors in both the CS contact information and GTposition reports. This simplification reduces the computation required for each MBM.
Finally, we will later show that considering CUAs around GT positions accounts for all possibleWUA center-position alignments within a given TUA (the CUA of a target). The uncertainty ofthe TUA is therefore transferred and blended into an equivalent positional uncertainty around theGT location values in the vicinity of the WUA. This allows computations in the models to use asingle WUA for a given target and still accounts for all the uncertainty involved (Figure 8).
1
+
1
)
&6
)+
)
)
1
11
1
1
DFWXDO
WDUJHW
,+
1
+
+
1
++
8
+
,+
1
1
,+�3,+�3
&6
,+
,+�3
+
)
1
8
� FRPPDQGHU·V VKLS
� LQWHQGHG KRVWLOH WDUJHW
� ,+ SUHGLFWHG SRVLWLRQ
� KRVWLOH
� IULHQG
� QHXWUDO
� XQNQRZQ
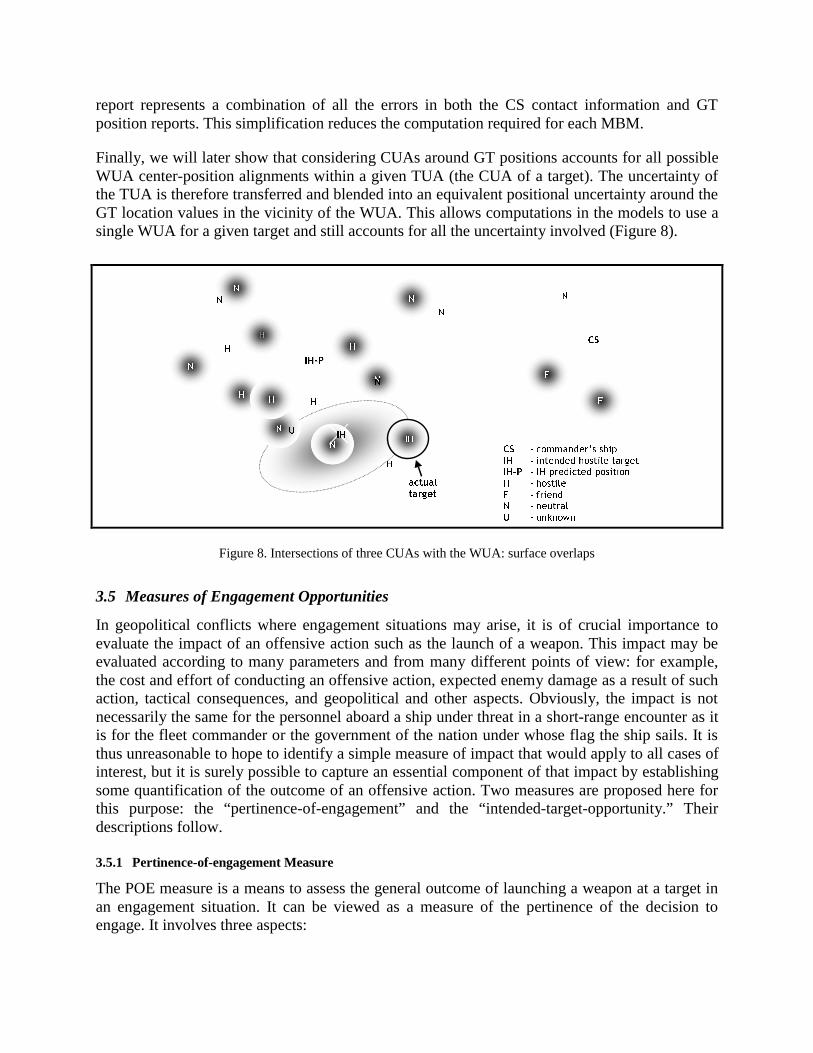
Figure 8. Intersections of three CUAs with the WUA: surface overlaps
3.5 Measures of Engagement Opportunities
In geopolitical conflicts where engagement situations may arise, it is of crucial importance toevaluate the impact of an offensive action such as the launch of a weapon. This impact may beevaluated according to many parameters and from many different points of view: for example,the cost and effort of conducting an offensive action, expected enemy damage as a result of suchaction, tactical consequences, and geopolitical and other aspects. Obviously, the impact is notnecessarily the same for the personnel aboard a ship under threat in a short-range encounter as itis for the fleet commander or the government of the nation under whose flag the ship sails. It isthus unreasonable to hope to identify a simple measure of impact that would apply to all cases ofinterest, but it is surely possible to capture an essential component of that impact by establishingsome quantification of the outcome of an offensive action. Two measures are proposed here forthis purpose: the “pertinence-of-engagement” and the “intended-target-opportunity.” Theirdescriptions follow.
3.5.1 Pertinence-of-engagement Measure
The POE measure is a means to assess the general outcome of launching a weapon at a target inan engagement situation. It can be viewed as a measure of the pertinence of the decision toengage. It involves three aspects:
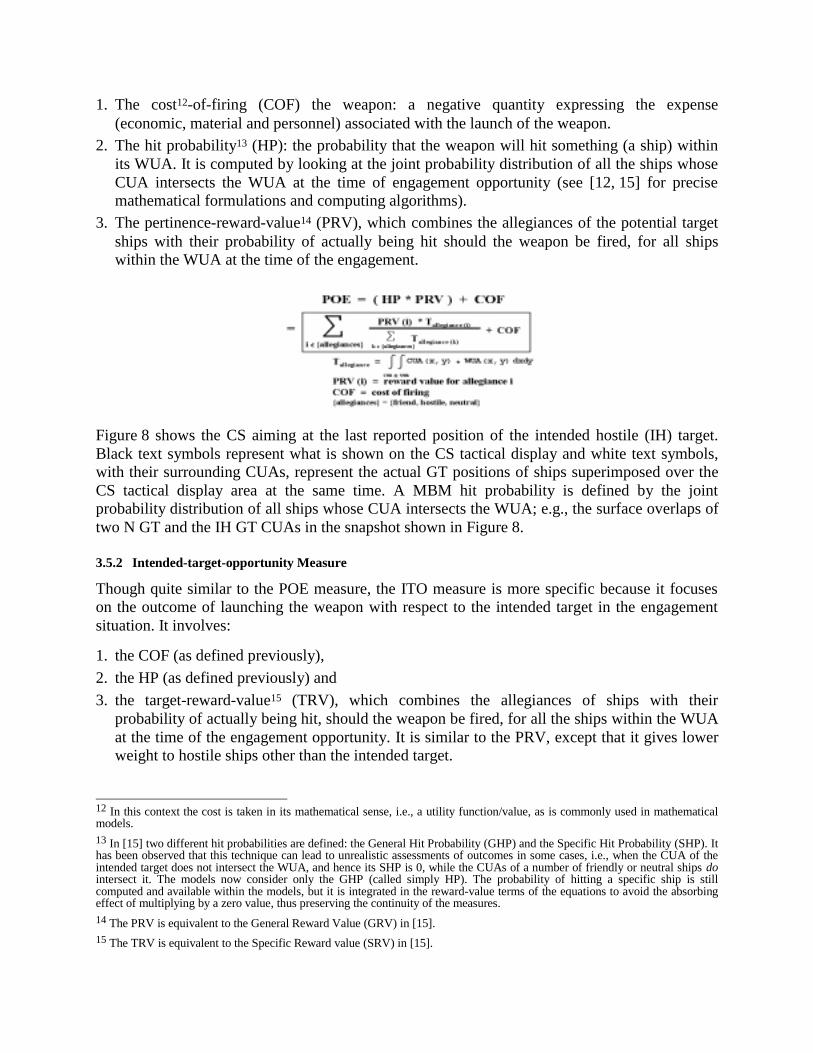
1. The cost12-of-firing (COF) the weapon: a negative quantity expressing the expense(economic, material and personnel) associated with the launch of the weapon.
2. The hit probability13 (HP): the probability that the weapon will hit something (a ship) withinits WUA. It is computed by looking at the joint probability distribution of all the ships whoseCUA intersects the WUA at the time of engagement opportunity (see [12, 15] for precisemathematical formulations and computing algorithms).
3. The pertinence-reward-value14 (PRV), which combines the allegiances of the potential targetships with their probability of actually being hit should the weapon be fired, for all shipswithin the WUA at the time of the engagement.
Figure 8 shows the CS aiming at the last reported position of the intended hostile (IH) target.Black text symbols represent what is shown on the CS tactical display and white text symbols,with their surrounding CUAs, represent the actual GT positions of ships superimposed over theCS tactical display area at the same time. A MBM hit probability is defined by the jointprobability distribution of all ships whose CUA intersects the WUA; e.g., the surface overlaps oftwo N GT and the IH GT CUAs in the snapshot shown in Figure 8.
3.5.2 Intended-target-opportunity Measure
Though quite similar to the POE measure, the ITO measure is more specific because it focuseson the outcome of launching the weapon with respect to the intended target in the engagementsituation. It involves:
1. the COF (as defined previously),
2. the HP (as defined previously) and
3. the target-reward-value15 (TRV), which combines the allegiances of ships with theirprobability of actually being hit, should the weapon be fired, for all the ships within the WUAat the time of the engagement opportunity. It is similar to the PRV, except that it gives lowerweight to hostile ships other than the intended target.
12 In this context the cost is taken in its mathematical sense, i.e., a utility function/value, as is commonly used in mathematicalmodels.13 In [15] two different hit probabilities are defined: the General Hit Probability (GHP) and the Specific Hit Probability (SHP). Ithas been observed that this technique can lead to unrealistic assessments of outcomes in some cases, i.e., when the CUA of theintended target does not intersect the WUA, and hence its SHP is 0, while the CUAs of a number of friendly or neutral ships dointersect it. The models now consider only the GHP (called simply HP). The probability of hitting a specific ship is stillcomputed and available within the models, but it is integrated in the reward-value terms of the equations to avoid the absorbingeffect of multiplying by a zero value, thus preserving the continuity of the measures.14 The PRV is equivalent to the General Reward Value (GRV) in [15].15 The TRV is equivalent to the Specific Reward value (SRV) in [15].
4. Data Aging Non-linearity of Reported Hostile Contacts
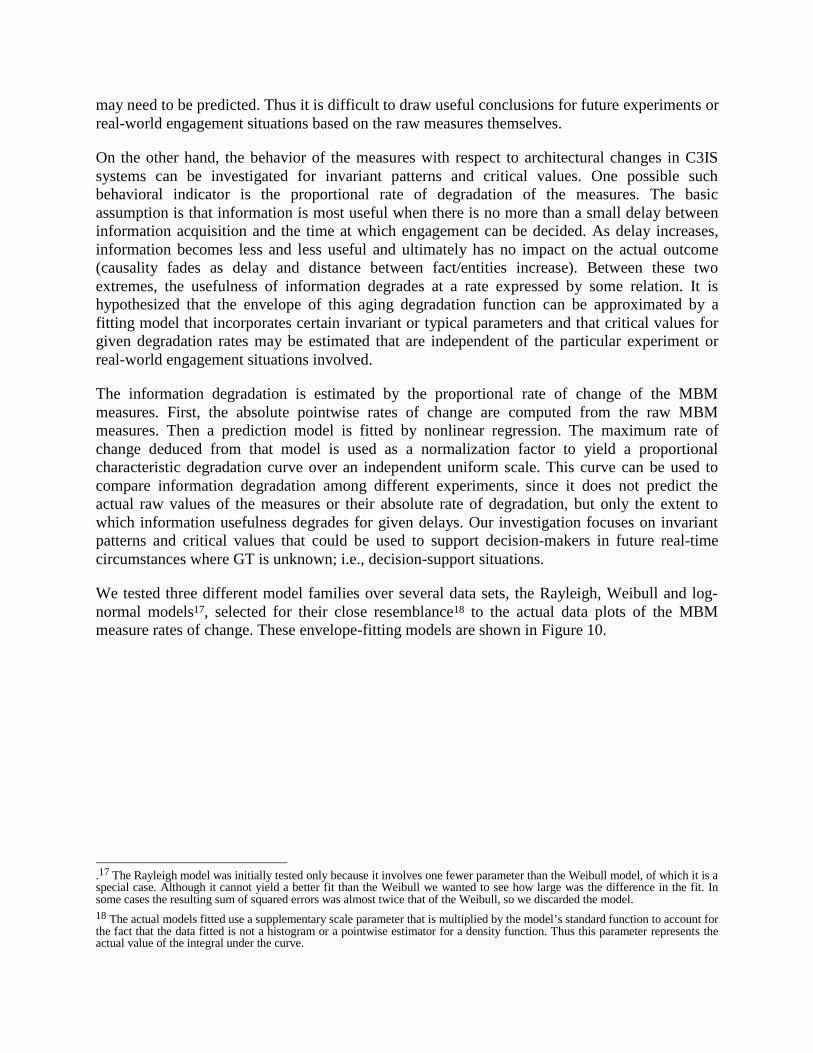
The assessment, based on MBMs, of the value of available GCCS tactical information forsurface hostile contacts for several naval exercises typically shows non-linear data aging,illustrated in Figure 9. For fresh surface contacts—up to 20 min— a first-order approximation ofthe rate of aging is linear. If we assume that this approximation starts from the maximumavailable value of 100% at no delay and reaches the minimum value after 20 minutes, then thevalue of the information for OTH-T hostile surface contacts degrades by about 5% of its originalvalue per minute, during its most useful life. Next we will further examine this behavior todetermine a predictive model16.
F O T C d a ta 1 - P e r t in e n c e o f e n g a g e m e n t (P O E )
-0 .8 0
-0 .6 0
-0 .4 0
-0 .2 0
0 .0 0
0 .2 0
0 .4 0
0 1 0 2 0 3 0 4 0 5 0 6 0
D e la y (m in )
A v e ra g ev a lu e
2 0 -m in re fe ren c e l in eb e y o n d w h ic h in fo rm a tio nh a s l i tt le v a lu e fo r O T H -T
s lo p e0 .7 4 /2 0
Figure 9. Typical FOTC POE value as function of time for a data set
4.1 Fitting Models and Characteristic Curves
OTH-T MBMs for various scenarios and parameters indicate the expected outcome of possibleengagement actions. Notwithstanding the scaling aspects of the measures (a topic discussed in[14]), higher values mean more favorable engagement outcomes. However, the absolute valuesof the MBMs can be used to compare data sets extracted from different experiments only in apost-exercise context; we need the GT data to compute the MBMs. New scenario parametersand/or improved communications hardware and equipment have an impact on the output values.Systems evolution and use of new technologies cannot be known in advance but their effects
16 Note that the linear model or first order approximation is based on the MBM values as a function of time, while the fittingmodels fit the rate of change of MBM values as a function of time.
may need to be predicted. Thus it is difficult to draw useful conclusions for future experiments orreal-world engagement situations based on the raw measures themselves.
On the other hand, the behavior of the measures with respect to architectural changes in C3ISsystems can be investigated for invariant patterns and critical values. One possible suchbehavioral indicator is the proportional rate of degradation of the measures. The basicassumption is that information is most useful when there is no more than a small delay betweeninformation acquisition and the time at which engagement can be decided. As delay increases,information becomes less and less useful and ultimately has no impact on the actual outcome(causality fades as delay and distance between fact/entities increase). Between these twoextremes, the usefulness of information degrades at a rate expressed by some relation. It ishypothesized that the envelope of this aging degradation function can be approximated by afitting model that incorporates certain invariant or typical parameters and that critical values forgiven degradation rates may be estimated that are independent of the particular experiment orreal-world engagement situations involved.
The information degradation is estimated by the proportional rate of change of the MBMmeasures. First, the absolute pointwise rates of change are computed from the raw MBMmeasures. Then a prediction model is fitted by nonlinear regression. The maximum rate ofchange deduced from that model is used as a normalization factor to yield a proportionalcharacteristic degradation curve over an independent uniform scale. This curve can be used tocompare information degradation among different experiments, since it does not predict theactual raw values of the measures or their absolute rate of degradation, but only the extent towhich information usefulness degrades for given delays. Our investigation focuses on invariantpatterns and critical values that could be used to support decision-makers in future real-timecircumstances where GT is unknown; i.e., decision-support situations.
We tested three different model families over several data sets, the Rayleigh, Weibull and log-normal models17, selected for their close resemblance18 to the actual data plots of the MBMmeasure rates of change. These envelope-fitting models are shown in Figure 10.
.17 The Rayleigh model was initially tested only because it involves one fewer parameter than the Weibull model, of which it is aspecial case. Although it cannot yield a better fit than the Weibull we wanted to see how large was the difference in the fit. Insome cases the resulting sum of squared errors was almost twice that of the Weibull, so we discarded the model.18 The actual models fitted use a supplementary scale parameter that is multiplied by the model’s standard function to account forthe fact that the data fitted is not a histogram or a pointwise estimator for a density function. Thus this parameter represents theactual value of the integral under the curve.
Model 1: � lognormal(�� ��σπ
θσµθσ
µ
x
ExF
x
2),,,(
2
2
2
])log[( +−−
=
Model 2: � Weibull(�� �� θαββαθ ααβα
−+−−
= 1)(
),,,( xExFx
Model 3: � Rayleigh(��2
2 2
2
),,(σ
θσθσ xE
xF
x−
=
Figure 10. The models used for fitting the envelope of the rate of aging of early life OTH-T information
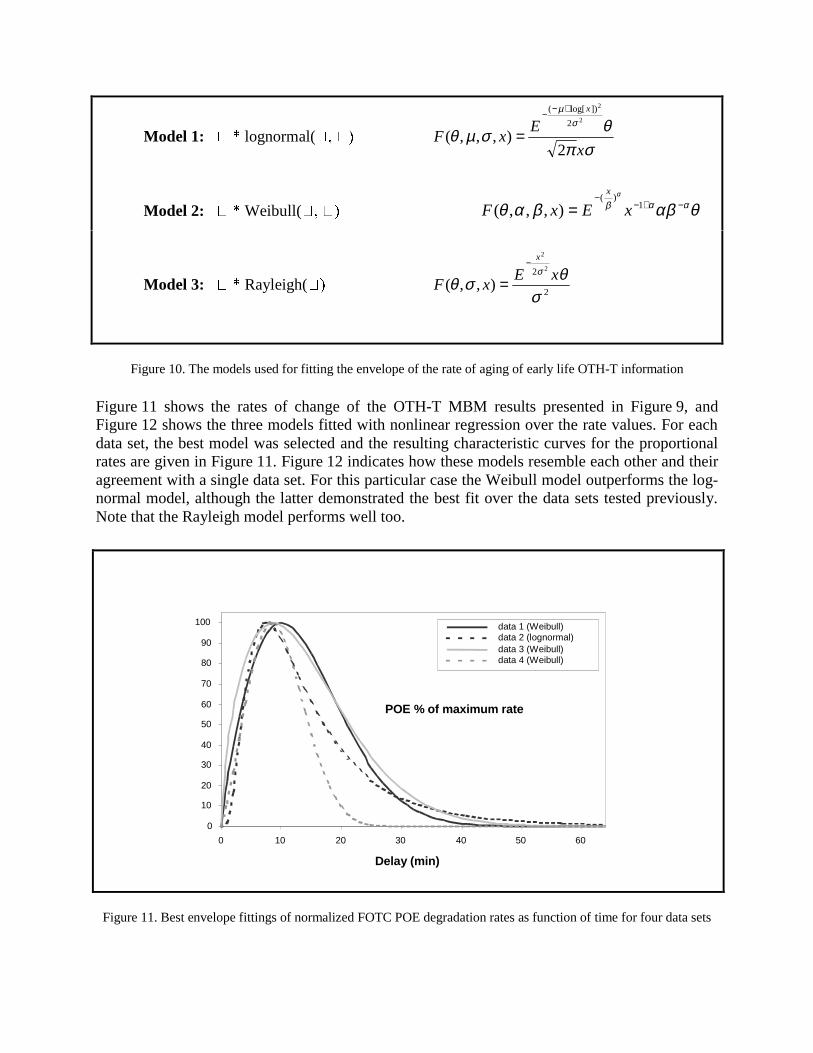
Figure 11 shows the rates of change of the OTH-T MBM results presented in Figure 9, andFigure 12 shows the three models fitted with nonlinear regression over the rate values. For eachdata set, the best model was selected and the resulting characteristic curves for the proportionalrates are given in Figure 11. Figure 12 indicates how these models resemble each other and theiragreement with a single data set. For this particular case the Weibull model outperforms the log-normal model, although the latter demonstrated the best fit over the data sets tested previously.Note that the Rayleigh model performs well too.
0
10
20
30
40
50
60
70
80
90
100
0 10 20 30 40 50 60
Delay (min)
POE % of maximum rate
data 1 (Weibull) data 2 (lognormal) data 3 (Weibull) data 4 (Weibull)
Figure 11. Best envelope fittings of normalized FOTC POE degradation rates as function of time for four data sets
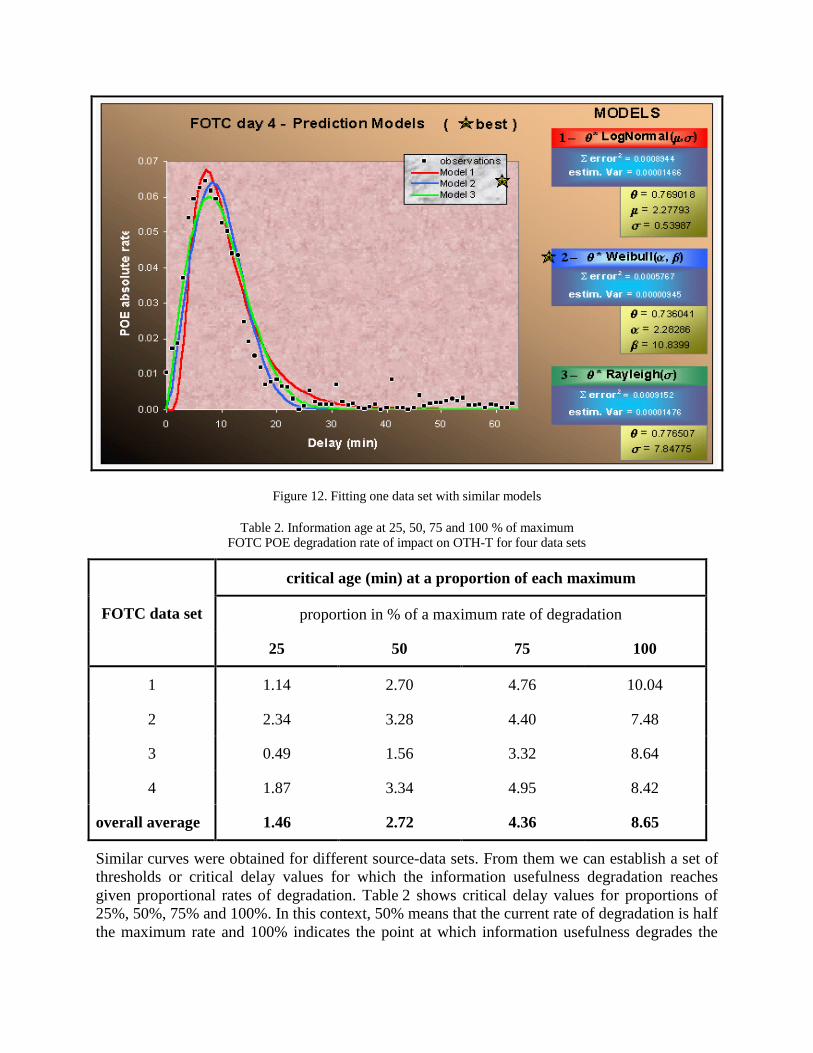
Figure 12. Fitting one data set with similar models
Table 2. Information age at 25, 50, 75 and 100 % of maximumFOTC POE degradation rate of impact on OTH-T for four data sets
critical age (min) at a proportion of each maximum
proportion in % of a maximum rate of degradationFOTC data set
25 50 75 100
1 1.14 2.70 4.76 10.04
2 2.34 3.28 4.40 7.48
3 0.49 1.56 3.32 8.64
4 1.87 3.34 4.95 8.42
overall average 1.46 2.72 4.36 8.65
Similar curves were obtained for different source-data sets. From them we can establish a set ofthresholds or critical delay values for which the information usefulness degradation reachesgiven proportional rates of degradation. Table 2 shows critical delay values for proportions of25%, 50%, 75% and 100%. In this context, 50% means that the current rate of degradation is halfthe maximum rate and 100% indicates the point at which information usefulness degrades the
most rapidly. After that point the degradation rate falls as the usefulness of the informationbecomes negligible. Consequently, one must focus on the segment where the slope is positive,i.e., the leftmost part up to 100%, since success rates are higher in this segment.
Average delays such as those given in Table 2 may serve as threshold values to help a decision-maker decide at what time taking an action becomes urgent or when further delay would beparticularly hazardous. It can also indicate when information becomes obsolete and should bediscarded, refreshed or updated by redeploying new information-gathering assets. Theproportions can be different from those illustrated and any particular proportion value could beused to define a new threshold.
4.2 Dependency of Model Parameters
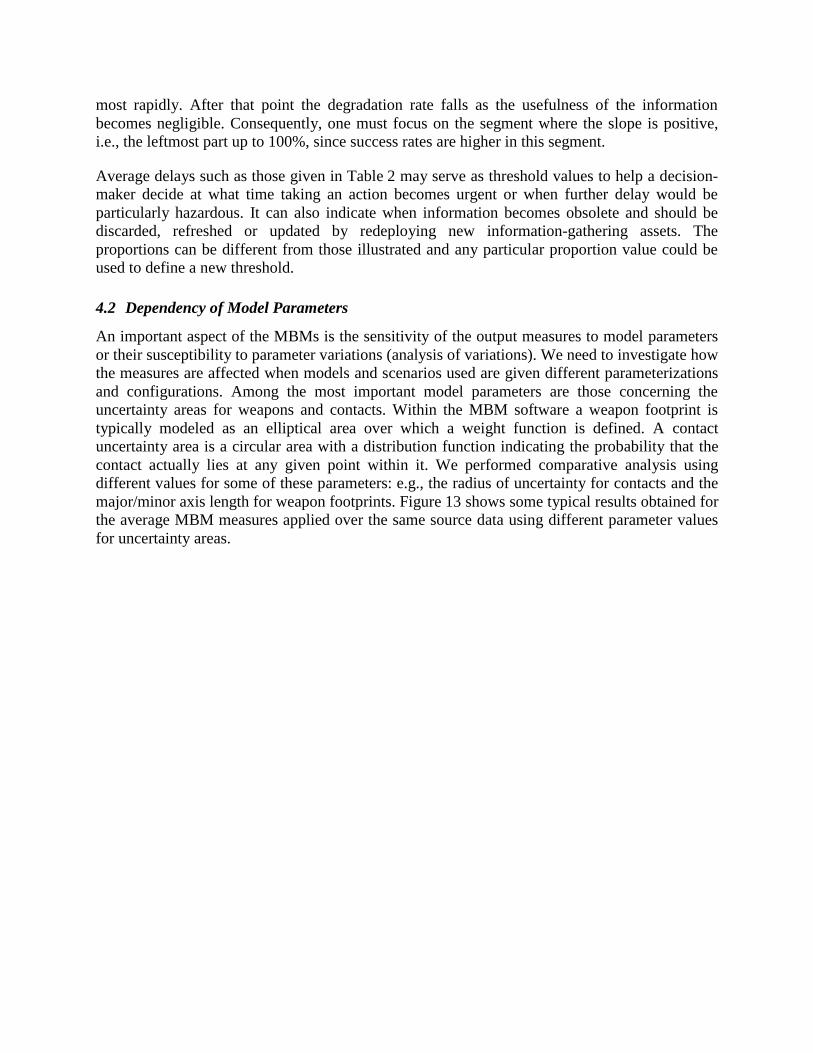
An important aspect of the MBMs is the sensitivity of the output measures to model parametersor their susceptibility to parameter variations (analysis of variations). We need to investigate howthe measures are affected when models and scenarios used are given different parameterizationsand configurations. Among the most important model parameters are those concerning theuncertainty areas for weapons and contacts. Within the MBM software a weapon footprint istypically modeled as an elliptical area over which a weight function is defined. A contactuncertainty area is a circular area with a distribution function indicating the probability that thecontact actually lies at any given point within it. We performed comparative analysis usingdifferent values for some of these parameters: e.g., the radius of uncertainty for contacts and themajor/minor axis length for weapon footprints. Figure 13 shows some typical results obtained forthe average MBM measures applied over the same source data using different parameter valuesfor uncertainty areas.
FOTC data 1 - Pertinence of engagement (POE)
-0.80
-0.60
-0.40
-0.20
0.00
0.20
0.40
0 10 20 30 40 50 60
Delay (min)
Averagevalue
WUA: 15 x 10 km - CUA: 5 km
WUA: 7.5 x 5 km - CUA: 5 km
WUA: 15 x 10 km - CUA: 2.5 km
Figure 13. FOTC POE results as function of time for three sets of MBM uncertainty area parameters
Table 3. Information age at 25, 50, 75 and 100 % of maximumFOTC POE degradation rate of impact on OTH-T for three MBM parameter sets
critical age (min) at a proportion of each maximumparameters (km)
proportion in % of a maximum rate of degradation
WUA CUA 25 50 75 100
15 x 10 5 1.46 2.72 4.36 8.65
7.5 x 5 5 1.28 2.19 3.29 6.07
15 x 10 2.5 2.42 3.61 5.01 8.59
overall average 1.72 2.84 4.22 7.77
The curves in Figure 13 indicate that reducing the radius of the contact uncertainty area yields aslightly better measure output. This is to be expected since a weapon footprint centered at thecontact reported location is more likely to cover all or a greater part the contact uncertainty areawhen its radius is smaller: the actual location of the contact is more likely to lie within theweapon footprint and a successful action result is more probable. On the other hand, if theweapon has a smaller footprint it may not overlap as many CUAs and as much of their areas,
leading to more misses. Unsurprisingly, the discriminating effect of these parameter variationsvanishes when delay increases. MBM parameter dependency is most acute in the range of criticaldelays where information still has some value. This effect needs investigation in more detail:e.g., what are the limits of this observed trend and what is the best weapon-to-contact ratio withrespect to the parameters used to describe uncertainty areas?
Constructing the characteristic curves as described in the previous section for different parametervalues yield the corresponding threshold critical delay values for the same proportional rates ofdegradation. Table 3 shows the comparative critical values for average delays according todifferent uncertainty-area parameters.
It is not yet known if the overall averages can be considered to be robust estimators for anyparticular set of parameters. More analysis results for different sets of such parameters must beprocessed to reach a conclusion. It could be that invariance holds for different source data setsonly if the uncertainty area parameters are constant, or that it holds regardless of theseparameters. This is one aspect that we wish to investigate more closely in future work. We alsowant to study sensitivity with respect to other parameters.
4.3 Fitting Results of a Live Exercise
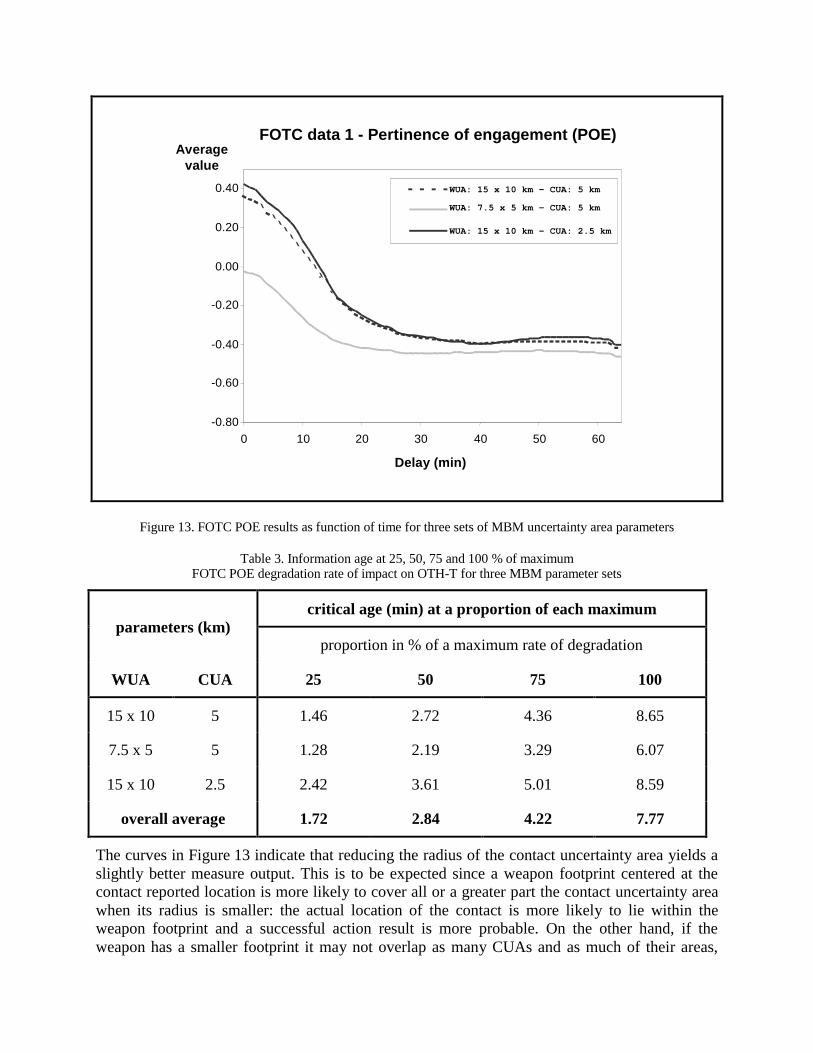
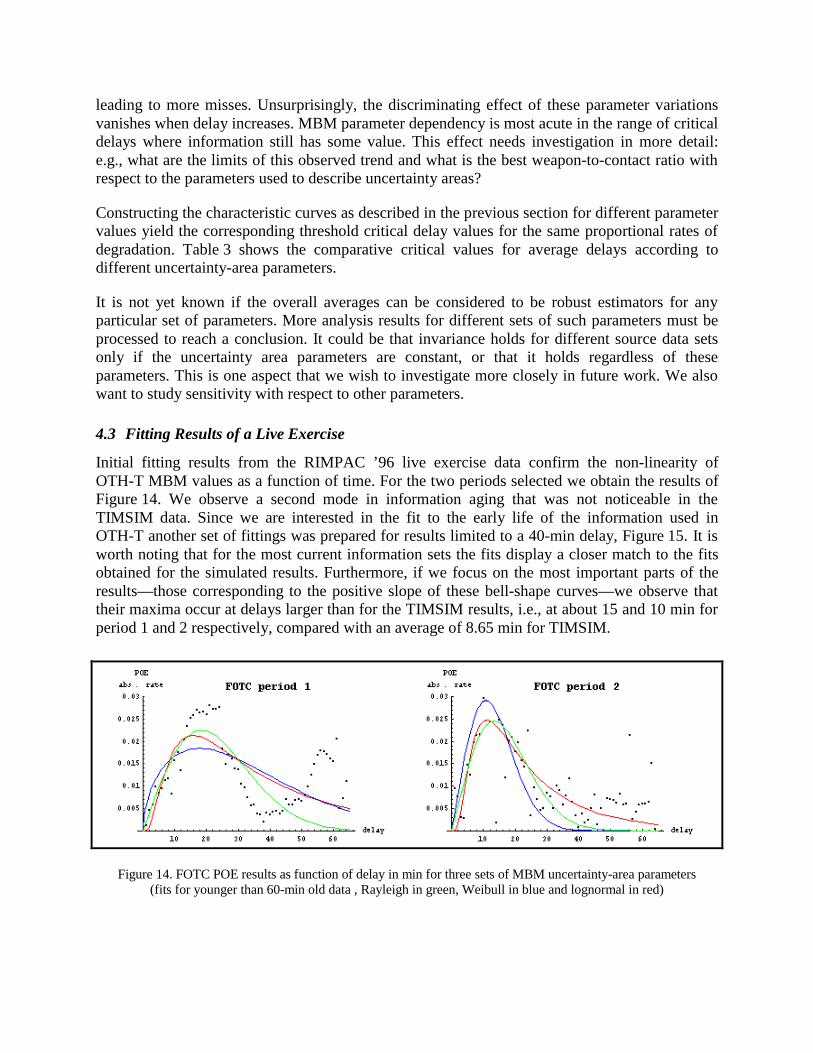
Initial fitting results from the RIMPAC ’96 live exercise data confirm the non-linearity ofOTH-T MBM values as a function of time. For the two periods selected we obtain the results ofFigure 14. We observe a second mode in information aging that was not noticeable in theTIMSIM data. Since we are interested in the fit to the early life of the information used inOTH-T another set of fittings was prepared for results limited to a 40-min delay, Figure 15. It isworth noting that for the most current information sets the fits display a closer match to the fitsobtained for the simulated results. Furthermore, if we focus on the most important parts of theresults—those corresponding to the positive slope of these bell-shape curves—we observe thattheir maxima occur at delays larger than for the TIMSIM results, i.e., at about 15 and 10 min forperiod 1 and 2 respectively, compared with an average of 8.65 min for TIMSIM.
Figure 14. FOTC POE results as function of delay in min for three sets of MBM uncertainty-area parameters(fits for younger than 60-min old data , Rayleigh in green, Weibull in blue and lognormal in red)
Figure 15. FOTC POE fitting results as function of delay in min for two periods of RIMPAC ‘96(fits for younger than 40-min old data, Rayleigh in green, Weibull in blue and lognormal in red)
5. Measuring the Value of Certain Architectural Changes Using MBMs
In this section we summarize results reported previously on the impact of various architecturalchanges that affect cooperative engagement or OTH-T. One of the authors has reported [16]recently on an agent-based architecture framework to implement the proposed changes and tosupport a Canadian Technology Demonstration that would allow further investigation of thereported improvements.
5.1 Possible GCCS Tests for Assessing Improvement to Information Sharing
A short examination of the GCCS transmission-queue management abilities (outgoing messages)for broadcast in the FOTC function and other information forwarding functions reveals a varietyof information management (IM) possibilities. Here are several that may improve the value ofthe shared information for missions.
Outgoing messages may be selected for a given geographical area that matches the operationalAOIs of the deployed units. Different transmitting strategies may be defined, each with its ownoutgoing message queue. During RIMPAC exercises, ACIXS and HIT19 broadcasts were used. Itis also possible to use the time currency of reports to select data older or younger than a certainvalue, allowing use of a first-in/first-out (FIFO) or a last-in/first-out (LIFO) strategy.
Some information management heuristics that improve tactical information sharing may bedefined from the results of HB5 and the exploitation of the GCCS IM transmission abilities.However, schemes or information-management heuristics that prioritize data to be sent based onits information value to a task or a mission cannot currently be implemented easily within theGCCS software. For more complicated schemes that identify data to be sent based on thesignificance of changes relative to thresholds defined for tasks and missions (e.g., attributechanges such as an allegiance shift of “unknown” to “hostile,” or a new position more than2 nmi20 from the last reported position), software improvements are needed. Some of therequired modifications are appropriate to the application software of the information node, while
19 High interest track.20 Nautical mile.
others are more related to the middleware arena. Should the middleware use an independentversion of the sharable database to interact with other units and with the local informationdatabases of its unit, or not?
5.2 Priority Based on Information Value to Missions
In Coalition operations a large variety of information needs to be exchanged at many differentlevels of quality of service. If one assumes that the radio-communications asset to be used can beexploited via some kind of priority scheme (exploiting the NATO Communication SystemNetwork Interoperability (CSNI) project results), there is a need to assess the value andtimeliness of the data to be exchanged as a function of the requirements for the successfulaccomplishment of the tasks of each addressee.
Assigning priority to messages, packets or cells in terms of task or mission effectiveness requiresthe extraction of the information they contain; that is, to find what each piece of data means forits end user. Then using knowledge about the missions and tasks to be accomplished and fromestablished time and location value attributes for information per task, the value of the data andrelated time-line requirements can be assessed. Then through an appropriate combination offactors in a utility function, the current priority of the data can be computed from the time-dependent value of the information contained. The value of some data may depend on acombination of information from other data to be sent simultaneously; the value is conditional onthe possibility of sending both sets of data within a given time interval. For this and relatedreasons, the priority of all time-dependent pieces of information stacked in such queues must bereassessed just prior to each transmission opportunity.
For example, a 1-hour moving time window for a complete database update combined with a 1-min partial synchronization for priority information (“improved timeliness” rather than “real-time”) may impact OTH-T for surface warfare and significantly increase the probability ofsuccess for the mission. To update the distributed databases and improve partial synchronization,new information is sent as soon as possible using a priority scheme based on the value of the newinformation relative to that of the backlog information. The backlog information is required forthe 1-h database coherence imposed by certain mission effectiveness criteria. A scheme of thisnature trades the bandwidth, manpower and system resources needed to share high-value timelyinformation essential for higher mission effectiveness against a small decrease in databasesynchronization and coherence. Delaying the exchange of data with less information value doesnot substantially decrease the success of the overall combination of tasks and missions to beconducted over the various AOIs. The result is not true optimization but is a solution that can becomputed in a finite time with only the local and current information and knowledge available toa unit, aided by information accessible over the network.
5.3 A Simple Information Management Heuristic
A simple yet efficient heuristic to improve the value of shared information might be to use twotransmitting queues for the FOTC broadcast. One would be defined for outgoing messages thatare the most current, say no older than 1 min. Few reports fall in this category, so frequent shortbroadcasts at every minute would be possible, whenever information is ready to be sent at atransmission opportunity. This should help increase database synchronization responsiveness and
timeliness. A second queue for outgoing messages older than 60 min would be used to maintainthe coherence of the database and to resynchronize when a new participant joins the net. Itstransmission might be spread over a moving time window to avoid transmitting the same datamore than once every hour, since the potential quantity of data is large enough to saturateACIXS. And limiting the geographical area of the reports to be sent would help further, withoutadversely affecting most missions. Using such an information management heuristic (IMH)would allow a unit moving from one FOTC area to another to adapt its database progressively,impoverishing its database coherence with the former FOTC and enriching the coherence andsynchronization with its new FOTC. The unit would then be more quickly ready for newassignments.
Our short review of GCCS documentation suggests that the current version used by the CanadianNavy, JMCIS TAC4, cannot easily implement an IMH with transmission priority based on thevalue of the messages to a mission, as computed by the utility function described in [13].However, the just-proposed simple IMH can easily be implemented with the current GCCSsoftware and hardware, since it does not require the computation of the information value (autility function to do so is not yet available).
5.4 Qualifying Track Information in Lieu of Coding
Statistics may provide insightful information about a set of observations without requiring thatan end user examine all the data. Statistics, confidence levels, degrees of belief and the value andquality of attributes are candidates for decreasing the amount of information that must beexamined before one reaches a conclusion or decides to act. It seems logical that they can also beused to de-clutter WAPs. Currently there are standards that define such quality factors fortactical information: an AOU for a position attribute, a track quality number for a Link 1121 trackreport, for example. Schemes for assigning these values were designed with sufficient care andunderstanding of operations and of the physical phenomena at play to offer a clear benefit tousers who want to share the best tactical information while exchanging the least amount of dataand using the minimum radio channel capacity. Since such schemes improve the amount ofuseful information correctly exchanged, one may consider them a form of coding based on thevalue of information, rather than on the quantity of information bits exchanged, as defined byShannon. Unfortunately, adherence to these standards and schemes is not mandatory, so endusers are often deprived of their potential benefits.
To conserve channel capacity, unneeded information redundancy should be removed; e.g., if newinformation concerning a track becomes available before a transmission opportunity, the oldpiece of information should be preempted (in 1-min and 1-h broadcasts). A statistical process cantake into account the multiple versions available and summarize the information to be sent to theend user.
21 NATO tactical data radio system.
In the case of the proposed IMH, it might be argued that a 1-h broadcast interval is too long tosupport database coherence. On the other hand, if better adherence is imposed to schemes thatassign quality factors to tactical information or track attributes, the global value of the part of theinformation common to all the participating databases in a geographical area will increase.Furthermore, the ability to send short broadcasts of timely information every minute by using thechannel capacity saved by exchanging less data during global broadcasts with the 1-h broadcastshould greatly improve database coherence and synchronization.
5.5 IMHs Expected Effectiveness Gain
The total loss in OTH-T mission effectiveness due to data aging between the sensor and theFOTC broadcast was found to be 63% with the MBMs [15]. Consequently, 63% is the maximumachievable MBM improvement of WAPs and procedures, assuming instantaneous trackmanagement and information exchange. For this particular result the average time delay wasaround 20 min for the hostile tracks.
Track data updates at the FOTC databases occur as they are produced by their respective trackmanagers. Their frequency depends on a large variety of factors, including conflict status andtempo, current operations, surveillance-asset deployment, staff load, stress and training, and
22 Adapted from The Naval Strategic Capital Program presented at the Canadian 1998 Information Management Seminar, slidetitle: “Ship Integrated Information Management System (SIIMS)”. CCS, combat control system; MMHS, maritime messagehandling system; SCS, ship communication system; MARLANT/MARPAC; maritime command Atlantic and Pacificrespectively; SHINCOM, shipboard integrated communication system; OGDs, other government departments; MCOIN, maritimecommand operational information network; J2CIS, Joint C2 and Intelligence System;
NATIONALWAN
PCs
HFX COMBATSYSTEM COMMANDAND CONTROL SYSTEM
JMCIS
NEWDATA LINKS
DUAL STARWARFARE
FUNCTIONS
NEWWEAPONSANDSENSORS
RedundantInterfaces
CENTRAL
CCS
COMPUTER
SYSTEM
CENTRAL
CCS
COMPUTER
SYSTEM
TRACKDATABASE NON-
ORGANICDATABASE
OTHERDATABASES
TRACKMANAGEMENT
DATAFUSION
TEWA
INFORMATIONMANAGEMENT
EXISTINGWEAPON/SENSOR
PROCESSING
WEAPON/SENSORINPUT/OUTPUTPROCESSING
LIMITEDTRACK
MANAGEMENT
WEAPONINTERFACES
SENSORINTERFACES
LIMITEDGLOBAL
DATA BASEWEAPONS
ANDSENSORS
WEAPON/SENSORINPUT/OUTPUT
PROCESSING
MCOIN
OGDs
J2CIS
MARPAC
MARLANT
COALITION WAN
SHIPLAN
MMHS
New CCS, Sensors & Weapons
CCSGateways
FDDI Ring
EXISTING
Scanner
SHINCOMII/III
Laptop computer
Laser printers
SCS
Laser printers
Ops LAN
Legacy CCS, Sensors & Weapons
CSNIlike
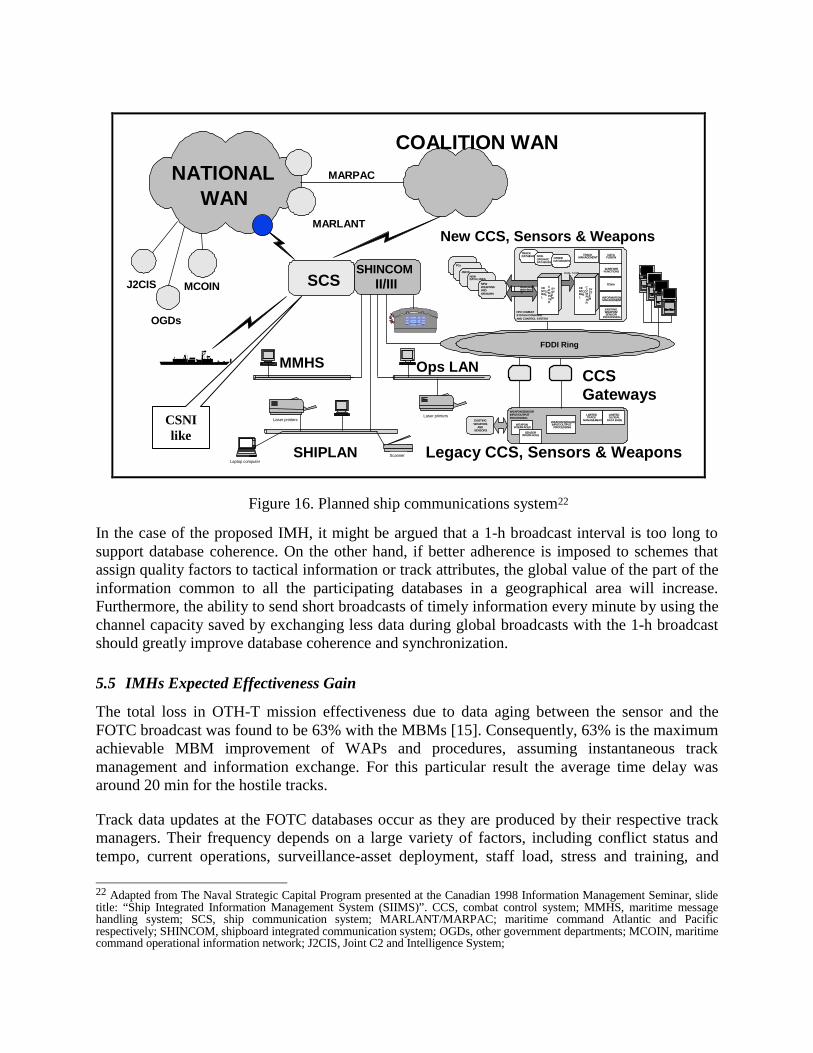
Figure 16. Planned ship communications system22
FOTC operations orders. Nevertheless, it is reasonable to assume that the staff cannot manuallyupdate all tracks at the same time, only over a period of time. If we assume a periodic broadcastfrom the FOTC at every 15 min and track data updates occurring uniformly during this 15-minperiod, then some updates may have occurred just at the beginning of this period and others justbefore its end. Over several broadcasts the mean delay should be around half the broadcastperiod, 7.5 min for this case.
The proposed naïve IMH imposes a 1-min short broadcast, or a mean delay of 0.5 min. Based onthe estimated data aging imposed by a 15-min FOTC broadcast procedure of 7.5 min, the timecurrency gain of this IMH should be approximately 7 min. Though the effect of data aging onMBM might not be linear, a first approximation is to assume linearity. In such a case, the IMHsexpected effectiveness gain would be (7/20)•63%, or 22%. This result applies to the impact onOTH-T effectiveness based on the experimental data analyzed for hostile surface contactsreported by the FOTC.
5.6 Sensors-to-shooter Improvement and Cooperative Engagement
It is desirable to use remote sensor information for targeting in certain scenarios in whichweapons are available with effective ranges much in excess of the ranges of the sensors on theship. Some missiles possess substantial target tracking and homing capabilities, and in scenarioswhere the target can easily be identified by the missile seeker, such as a ship in open-ocean area,precise targeting is not essential. However, a timely tactical picture is necessary to providesufficient lead-time for high probability of mission success. On the other hand, some targets maybe more difficult to seek against their backgrounds. In such cases it may be necessary to usealternate final homing of a missile that relies more on accurate inertial and navigation andaccurate geodetic position estimated by intelligence and surveillance. If the target is mobile,continuous updates of the target position must be provided during the flight of the missile. Otherengagements may require intermediate target positional accuracy and rely on the seeker for thefinal intercept phase. In dynamic cases, improved sensor-to-shooter timeliness is needed tomaintain a sufficiently high kill probability to make the engagement cost-effective.
In light of these considerations, the Canadian Navy plans to improve information connectivityfor national and coalition operations (Figure 16). Initially, exploiting the NATO CommunicationSystem Network Interoperability (CSNI) project results would provide the connectivity required,but the cooperative engagement capability (CEC) concept must be implemented and integrated.Canadian research and development toward the Ship Integrated Information ManagementSystem (SIIMS), planned for 2010, should address these important issues. This system shouldencompass the integration of middleware strategies and the cooperative engagement concept aswell as the optimization of information sharing as described in HB5, where information value isused to prioritize information exchange.
5.7 Reported Time Lines for the Joint Attack Command and Control System
Reported Time Lines for the Joint Attack Command and Control System (JACCS) in the 1999Joint Warrior Interoperability Demonstrations (JWID ’99) plan (JW002) (based on JWID ’98results) can be used as time references for improved C3IS timeliness. Values provided in secondsare converted to min: ta acquisition and transmission delay, 1.5 min; tc compilation, 1.3 min; tJ
pairing (JACCS), 0.2 min and tw weapon control, 0.5 min; for a tt total from sensor to shooter of3.5 min for the updates. For complex imagery to be interpreted by trained operators andtransformed into information and knowledge before devising a plan it is likely that the mean totaldelay would be around 7 min, but the 3.5 min mean delay figure might hold for updates.
5.8 Remote Sensing
A remote-sensing asset such as Canada RADARSAT has demonstrated its ability to providesynthetic-aperture radar imagery of surface and subsurface structures that intelligence staff coulduse to identify potential targets. Other imagery, geological and geolocational information arethen used to enhance the understanding of the sensed image and to describe a potential target fora mission accurately. Precision OTH-T is required for some missions. Missiles used in thesemissions may rely heavily on precise inertial navigation, with assistance possible from othersystems such as GPS.
Some remote sensing assets offer only limited time-window opportunities for a givengeographical area. The opportunity is periodic and depends on the elliptic orbit of the satelliterelative to the area to be observed. Furthermore, specific antenna and processing patternscombined with the competition for services in response to other customer’s requests further limitthe availability, accuracy (since it depends on observation time and amount of processing done)and response time of remote sensing systems. However, for the intelligence purposes of betteridentifying and precisely locating underground structures such delays are acceptable: thepotential target is not likely to move during the process. In fact such steps can often be takenwell before the force asset is moved into weapon range of the potential target. Updates are moreor less related to changes occurring in the vicinity of the area of interest and can be sensed withalternate means (tactical sensors and visual contacts).
5.9 Adapting Model-based Measures to Precision Targeting
Precision targeting is not immune to error. Errors may be induced during the sensing andidentification process, the interpretation and understanding of the situation, the plan definition(including weapon-target pairing) and execution, or may be due to environment changes thataffect the probability of success or even the validity of the mission (a target found to be of novalue during the missile flight). For these reasons the statistical models used in MBMs may beadapted to precision targeting. Although in this paper we did not do so, we assume that theresults still have sufficient significance for our initial assessment of the value of the improvedsensor-to-shooter architecture in terms of mission effectiveness, primarily because of the largepotential impact observed.
Current MBM implementations assume missiles with no partiality other than the statisticaldistribution defined over the weapon footprint uncertainty area. Though targets are assumed tobe in the open ocean, the uncertainty areas employed are useable in other environments, as longas the assumed missile still responds as described for the implemented MBMs. Future MBMstudies will report on the effects of varying the uncertainty parameters. Also it is assumed thatthe target does not move significantly from the time the missile is fired to the interception time ti.In fact we have set the flight time to zero. MBMs can be computed for the effective interceptiontime applicable to more maneuverable targets or large ti delay values.
5.10 Sensors-to-shooter Improvement in Terms of Expected OTH-T Effectiveness Gain
According to previous analyses and as reported here, it seems that the information processingtime from the sensors to the FOTC database (after the situation assessment process) for thecollected data is the remainder of the 20 min from the 7.5 min required for the broadcast:12.5 min. As indicated above, for new contacts we may assume a delay of 7 min; that is, atimeliness improvement of 5.5/12.5. The potential gain due to this MOP improvement can beassociated with the remainder of the maximum total gain available, (12.5/20)•63%, or 39%. Thepotential gain for this MOP improvement is (5.5/12.5)•39%, or 17%. For the 3-min updates theMOP improvement is 9/12.5 and the potential mission gain is 28%. In both cases we assume thecurrent FOTC broadcast delay or an alternate architecture for managing, processing anddistributing the data from the sensors to the shooter that adds a mean delay of 7.5 min.
If we assume that the information concept of the FOTC is modified as described above, thenthese potential gains are slightly lower than optimum. First we have 7 min plus 0.5 min or animprovement of (12.5/20)•63%; that is, 39%. Second, we have 3 min plus 0.5 min or a gain of(16.5/20)•63%, or 52%.
If we assume that the information concept is as described for JWID, these potential gains areslightly higher than with the integrated information concept with the FOTC. First we have 7 minor an improvement of (13/20)•63%, or 41%. Second, we have 3 min or a gain of (17/20)•63%;that is, 54%.
6. Architecture Changes
This section summarizes the differences in potential results offered by the architectures assessedin this paper.
6.1 Architecture ZeroThis is the reference architecture (Figure 1) for which experimental data were collected asdescribed at the beginning of this paper. The maximum available improvement to informationprocessing and sharing, in terms of the impact on OTH-T mission effectiveness for the hostilesurface tactical picture, from this architecture to a hypothetical perfect information system wasfound to be 63%.
6.2 Architecture OneArchitecture One represents the procedure change proposed in a paper in preparation for MILCOM ’99 thataddresses the impact on mission effectiveness of improving the FOTC broadcast timeliness MOP. Informationprocessing in this architecture is as in Architecture Zero. Results for Architecture Zero are used to show the relativevalue of timeliness improvements in terms of the impact on OTH-T mission effectiveness for the hostile surfacetactical picture. The maximum relative impact on OTH-T was found to be 22%.
6.3 Architecture Two
Architecture Two (Figure 1 but with improved FOTC information processing or separatehardware and software, as for JWID) represents changes to information processing alone,without changing the information-sharing procedures, which remain as in Architecture Zero: thatis, the mean delay for the FOTC broadcast information exchange is 7.5 min. Results forArchitecture Zero are used to show the relative value of such improvement in terms of the impact
on OTH-T mission effectiveness for the hostile surface tactical picture. The maximum relativeimpact on OTH-T of this MOP improvement to information processing was found to be 17% fora 7-min initial mean delay and 28% for 3-min updates (information generation time).
6.4 Architecture Three
Architecture Three (with an improved FOTC broadcast and information processing, and GCCSintegrated into the ship command and control system) represents changes to both information-processing and information-sharing procedures. Information sharing in this architecture is similarto that in Architecture Zero but the mean delay for the FOTC broadcast information exchange is0.5 min. Results for Architecture Zero are used to show the relative value of such improvementin terms of the impact on OTH-T mission effectiveness for the hostile surface tactical picture.The maximum relative impact on OTH-T of this MOP improvement to information processingand sharing was found to be 39% for a 7-min initial mean delay and 52% for 3-min updates(information generation time and delivery to the shooter).
6.5 Architecture Four
Architecture Four (hardware and software in addition to that required for theFOTC/GCCS/ACIXS integrated concept) represents changes to information processing alone,without changing information-sharing procedures of the FOTC but using additional assets.Information processing and sharing in this architecture uses supplementary hardware, functionsand staff. We found an initial delay of 7 min and with updates at every 3 min. Results forArchitecture Zero are used to show the relative value of this improvement in terms of the impacton OTH-T mission effectiveness for the hostile surface tactical picture. The maximum relativeimpact on OTH-T of this MOP improvement to information processing and sharing was found tobe 41% for a 7-min initial mean delay and 54% for 3-min updates (information generation timeand delivery to the shooter).
7. Conclusions and Recommendations
Despite the complexity of the systems evaluated, the new measures were able to recognizechanges and variations in the systems and in the opposing forces that classic measures did notdetect or identify.
The reported method thus offer better discrimination among system options and reducedevelopment risk by accurately estimating the impact that changes in procedures, systems andinformation have on mission effectiveness.
Results from the version of DREV MBMs presented in [17] lead to the following conclusions:
1. improvements in WAPS capabilities versus hostile ships that can be obtained by optimizingsensor suites appear to be limited to about 9%, and that gain is possible only if the WAPSthemselves are optimized first;
2. changes in WAP systems and procedures can improve performance in excess of 63% for theITO, from the reference value at sensor time at the FOTC node (assuming instantaneous trackmanagement and information exchange);
3. improvements exceed 77% at the Surface Action Group 1 (SAG1) nodes under the sameconditions, providing that communications improvements from the FOTC to the SAGs aremade (i.e., including the assumptions from 2); and finally,
4. communications impact the distributed picture by only 14% all cases at SAG1, about 1.5times as much as sensors.
Consequently, the most important step to improve overall performance is better exploitation ofalready available sensor and source data by improving WAP systems, concepts and proceduresat the tactical information management node or in a distributed version of it, the FOTC.
Based on the results obtained for hostile surface contacts and for the surveillance deploymentused during the TIMSIM exercise, an improvement of 4% in sensor performance alone, withoutimproving the WAP systems and communications, would provide less than 1.3% (was 1.6%)improvement in the shared picture. This apparent loss in exploiting available information may beof concern to users and to experts such as the members of the Copernicus Requirements WorkingGroup (CRWG), who are developing improved GCCS, related architectures and procedures.
If we assume that the initial information value for hostile surface OTH-T is 100% at sensor time(it should be less than 100% since it normally contains a certain level of uncertainty andinaccuracy, see [18]) and if we accept the first order approximation presented in this paper, thenthe rate of degradation of the value of information is about 5% a minute during its most usefullife for OTH-T hostile surface contacts.
Better transfer of sensor, intelligence and Link 11 data is required to improve the assistance thatWAPS provides for commander decisions. We recommend that operators and commanders afloatbe provided with more efficient data management aids, including some automation in theselection, exploitation, fusion and integration of Link 11 data.
MBMs demonstrate the feasibility of statistically estimating the impact of information andsystems quality on decision outcomes and mission effectiveness. Generally speaking, raw datathat directly relates the quality of command information systems to measures of effectiveness aresparse and expensive to obtain, so it is very difficult to demonstrate information and systemsqualities and their impacts on decision outcomes and mission effectiveness. DREV MBMsaddress this difficult problem. They improve estimation accuracy using the same raw datacurrently available from instrumented military exercises. Results from both versions of MBMs[8-11, 19-26] provide insights that were not available with the measures currently applied to suchdata.
For the hostile-ship picture found in a commander’s database, we have defined two MBMs tocapture the essential components of the impact of the information used in engagement decisions:the POE for the pertinence of engagements and the ITO for the intended target opportunity. TheITO measure amplifies the POE’s significance by assigning a smaller reward if the hostile targetthat is intercepted is not the intended one. Both measures use a fixed cost for launching a missileand both compute interception probabilities and reward values. In both cases, hypothetical blue-on-blue engagements are assigned large negative values to indicate the counter-productivity ofsuch actions. Over a large number of engagements these measures provide a fair evaluation ofthe goodness of the picture used in the decision process.
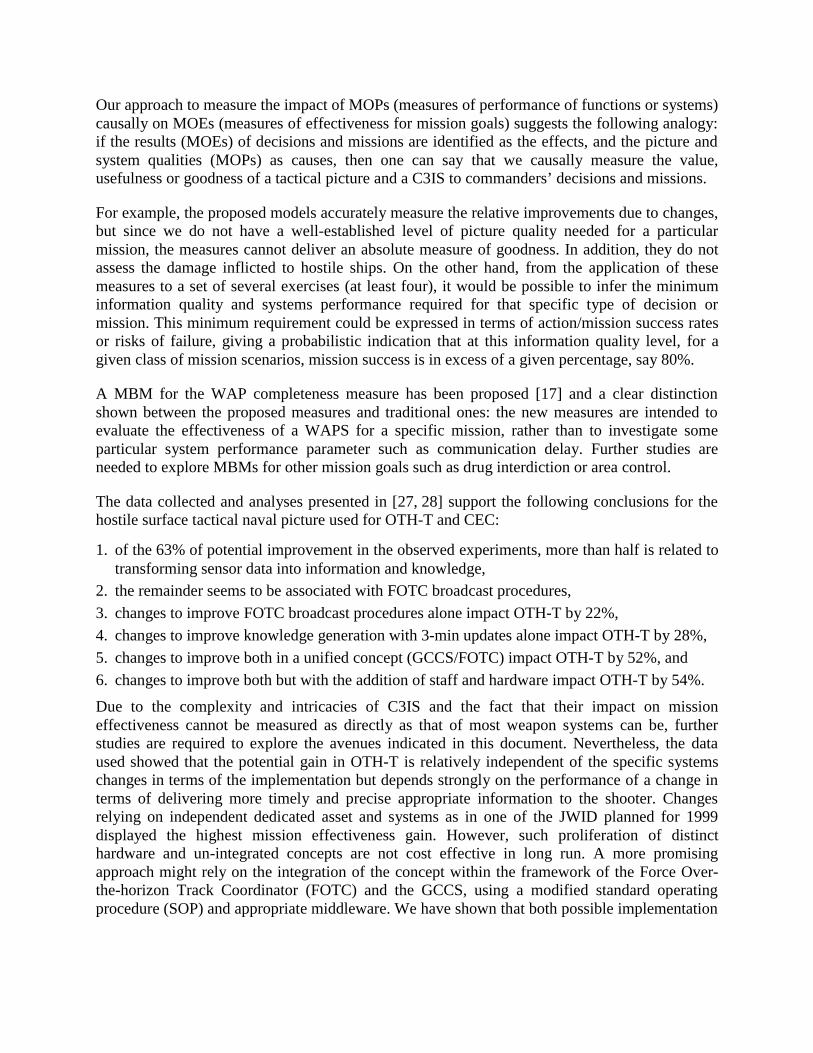
Our approach to measure the impact of MOPs (measures of performance of functions or systems)causally on MOEs (measures of effectiveness for mission goals) suggests the following analogy:if the results (MOEs) of decisions and missions are identified as the effects, and the picture andsystem qualities (MOPs) as causes, then one can say that we causally measure the value,usefulness or goodness of a tactical picture and a C3IS to commanders’ decisions and missions.
For example, the proposed models accurately measure the relative improvements due to changes,but since we do not have a well-established level of picture quality needed for a particularmission, the measures cannot deliver an absolute measure of goodness. In addition, they do notassess the damage inflicted to hostile ships. On the other hand, from the application of thesemeasures to a set of several exercises (at least four), it would be possible to infer the minimuminformation quality and systems performance required for that specific type of decision ormission. This minimum requirement could be expressed in terms of action/mission success ratesor risks of failure, giving a probabilistic indication that at this information quality level, for agiven class of mission scenarios, mission success is in excess of a given percentage, say 80%.
A MBM for the WAP completeness measure has been proposed [17] and a clear distinctionshown between the proposed measures and traditional ones: the new measures are intended toevaluate the effectiveness of a WAPS for a specific mission, rather than to investigate someparticular system performance parameter such as communication delay. Further studies areneeded to explore MBMs for other mission goals such as drug interdiction or area control.
The data collected and analyses presented in [27, 28] support the following conclusions for thehostile surface tactical naval picture used for OTH-T and CEC:
1. of the 63% of potential improvement in the observed experiments, more than half is related totransforming sensor data into information and knowledge,
2. the remainder seems to be associated with FOTC broadcast procedures,
3. changes to improve FOTC broadcast procedures alone impact OTH-T by 22%,
4. changes to improve knowledge generation with 3-min updates alone impact OTH-T by 28%,
5. changes to improve both in a unified concept (GCCS/FOTC) impact OTH-T by 52%, and
6. changes to improve both but with the addition of staff and hardware impact OTH-T by 54%.
Due to the complexity and intricacies of C3IS and the fact that their impact on missioneffectiveness cannot be measured as directly as that of most weapon systems can be, furtherstudies are required to explore the avenues indicated in this document. Nevertheless, the dataused showed that the potential gain in OTH-T is relatively independent of the specific systemschanges in terms of the implementation but depends strongly on the performance of a change interms of delivering more timely and precise appropriate information to the shooter. Changesrelying on independent dedicated asset and systems as in one of the JWID planned for 1999displayed the highest mission effectiveness gain. However, such proliferation of distincthardware and un-integrated concepts are not cost effective in long run. A more promisingapproach might rely on the integration of the concept within the framework of the Force Over-the-horizon Track Coordinator (FOTC) and the GCCS, using a modified standard operatingprocedure (SOP) and appropriate middleware. We have shown that both possible implementation
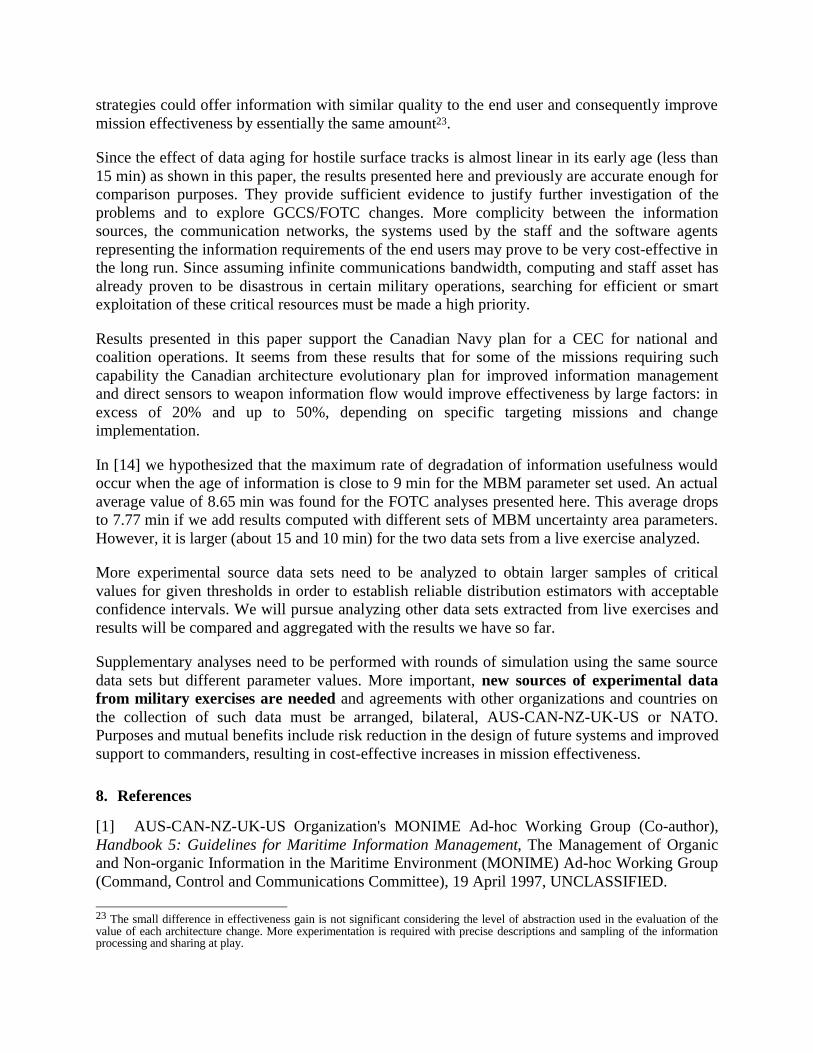
strategies could offer information with similar quality to the end user and consequently improvemission effectiveness by essentially the same amount23.
Since the effect of data aging for hostile surface tracks is almost linear in its early age (less than15 min) as shown in this paper, the results presented here and previously are accurate enough forcomparison purposes. They provide sufficient evidence to justify further investigation of theproblems and to explore GCCS/FOTC changes. More complicity between the informationsources, the communication networks, the systems used by the staff and the software agentsrepresenting the information requirements of the end users may prove to be very cost-effective inthe long run. Since assuming infinite communications bandwidth, computing and staff asset hasalready proven to be disastrous in certain military operations, searching for efficient or smartexploitation of these critical resources must be made a high priority.
Results presented in this paper support the Canadian Navy plan for a CEC for national andcoalition operations. It seems from these results that for some of the missions requiring suchcapability the Canadian architecture evolutionary plan for improved information managementand direct sensors to weapon information flow would improve effectiveness by large factors: inexcess of 20% and up to 50%, depending on specific targeting missions and changeimplementation.
In [14] we hypothesized that the maximum rate of degradation of information usefulness wouldoccur when the age of information is close to 9 min for the MBM parameter set used. An actualaverage value of 8.65 min was found for the FOTC analyses presented here. This average dropsto 7.77 min if we add results computed with different sets of MBM uncertainty area parameters.However, it is larger (about 15 and 10 min) for the two data sets from a live exercise analyzed.
More experimental source data sets need to be analyzed to obtain larger samples of criticalvalues for given thresholds in order to establish reliable distribution estimators with acceptableconfidence intervals. We will pursue analyzing other data sets extracted from live exercises andresults will be compared and aggregated with the results we have so far.
Supplementary analyses need to be performed with rounds of simulation using the same sourcedata sets but different parameter values. More important, new sources of experimental datafrom military exercises are needed and agreements with other organizations and countries onthe collection of such data must be arranged, bilateral, AUS-CAN-NZ-UK-US or NATO.Purposes and mutual benefits include risk reduction in the design of future systems and improvedsupport to commanders, resulting in cost-effective increases in mission effectiveness.
8. References
[1] AUS-CAN-NZ-UK-US Organization's MONIME Ad-hoc Working Group (Co-author),Handbook 5: Guidelines for Maritime Information Management, The Management of Organicand Non-organic Information in the Maritime Environment (MONIME) Ad-hoc Working Group(Command, Control and Communications Committee), 19 April 1997, UNCLASSIFIED.
23 The small difference in effectiveness gain is not significant considering the level of abstraction used in the evaluation of thevalue of each architecture change. More experimentation is required with precise descriptions and sampling of the informationprocessing and sharing at play.
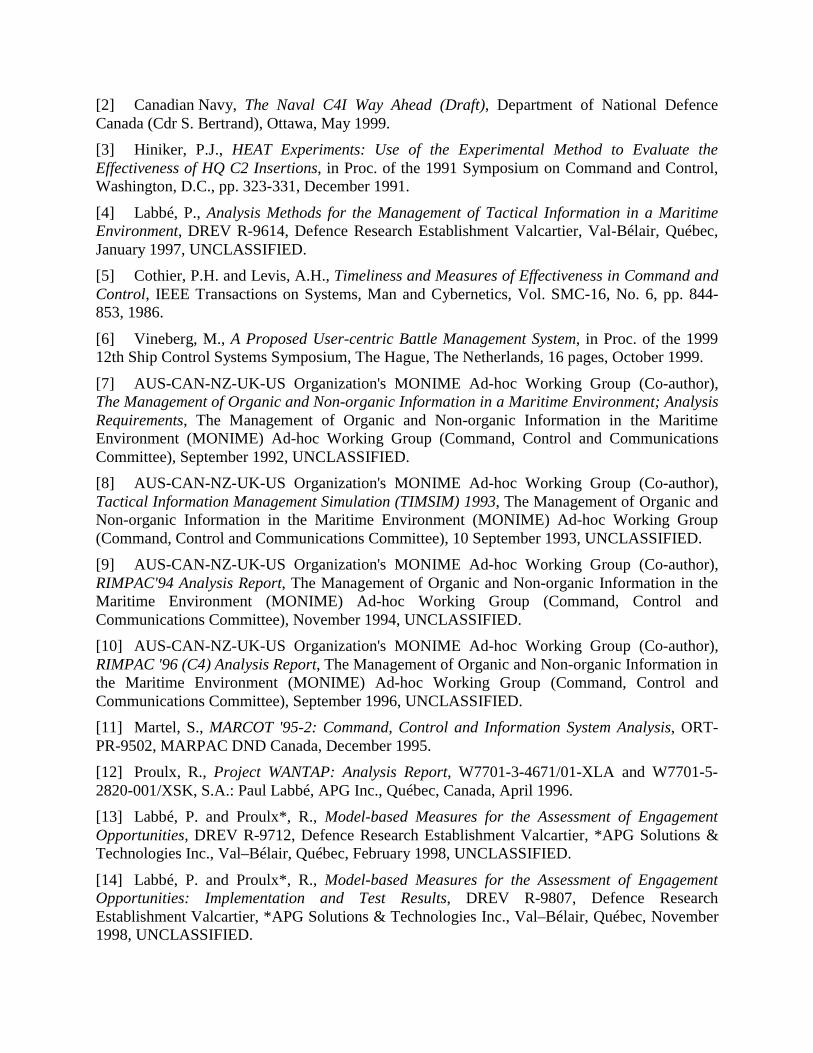
[2] Canadian Navy, The Naval C4I Way Ahead (Draft), Department of National DefenceCanada (Cdr S. Bertrand), Ottawa, May 1999.
[3] Hiniker, P.J., HEAT Experiments: Use of the Experimental Method to Evaluate theEffectiveness of HQ C2 Insertions, in Proc. of the 1991 Symposium on Command and Control,Washington, D.C., pp. 323-331, December 1991.
[4] Labbé, P., Analysis Methods for the Management of Tactical Information in a MaritimeEnvironment, DREV R-9614, Defence Research Establishment Valcartier, Val-Bélair, Québec,January 1997, UNCLASSIFIED.
[5] Cothier, P.H. and Levis, A.H., Timeliness and Measures of Effectiveness in Command andControl, IEEE Transactions on Systems, Man and Cybernetics, Vol. SMC-16, No. 6, pp. 844-853, 1986.
[6] Vineberg, M., A Proposed User-centric Battle Management System, in Proc. of the 199912th Ship Control Systems Symposium, The Hague, The Netherlands, 16 pages, October 1999.
[7] AUS-CAN-NZ-UK-US Organization's MONIME Ad-hoc Working Group (Co-author),The Management of Organic and Non-organic Information in a Maritime Environment; AnalysisRequirements, The Management of Organic and Non-organic Information in the MaritimeEnvironment (MONIME) Ad-hoc Working Group (Command, Control and CommunicationsCommittee), September 1992, UNCLASSIFIED.
[8] AUS-CAN-NZ-UK-US Organization's MONIME Ad-hoc Working Group (Co-author),Tactical Information Management Simulation (TIMSIM) 1993, The Management of Organic andNon-organic Information in the Maritime Environment (MONIME) Ad-hoc Working Group(Command, Control and Communications Committee), 10 September 1993, UNCLASSIFIED.
[9] AUS-CAN-NZ-UK-US Organization's MONIME Ad-hoc Working Group (Co-author),RIMPAC'94 Analysis Report, The Management of Organic and Non-organic Information in theMaritime Environment (MONIME) Ad-hoc Working Group (Command, Control andCommunications Committee), November 1994, UNCLASSIFIED.
[10] AUS-CAN-NZ-UK-US Organization's MONIME Ad-hoc Working Group (Co-author),RIMPAC '96 (C4) Analysis Report, The Management of Organic and Non-organic Information inthe Maritime Environment (MONIME) Ad-hoc Working Group (Command, Control andCommunications Committee), September 1996, UNCLASSIFIED.
[11] Martel, S., MARCOT '95-2: Command, Control and Information System Analysis, ORT-PR-9502, MARPAC DND Canada, December 1995.
[12] Proulx, R., Project WANTAP: Analysis Report, W7701-3-4671/01-XLA and W7701-5-2820-001/XSK, S.A.: Paul Labbé, APG Inc., Québec, Canada, April 1996.
[13] Labbé, P. and Proulx*, R., Model-based Measures for the Assessment of EngagementOpportunities, DREV R-9712, Defence Research Establishment Valcartier, *APG Solutions &Technologies Inc., Val–Bélair, Québec, February 1998, UNCLASSIFIED.
[14] Labbé, P. and Proulx*, R., Model-based Measures for the Assessment of EngagementOpportunities: Implementation and Test Results, DREV R-9807, Defence ResearchEstablishment Valcartier, *APG Solutions & Technologies Inc., Val–Bélair, Québec, November1998, UNCLASSIFIED.
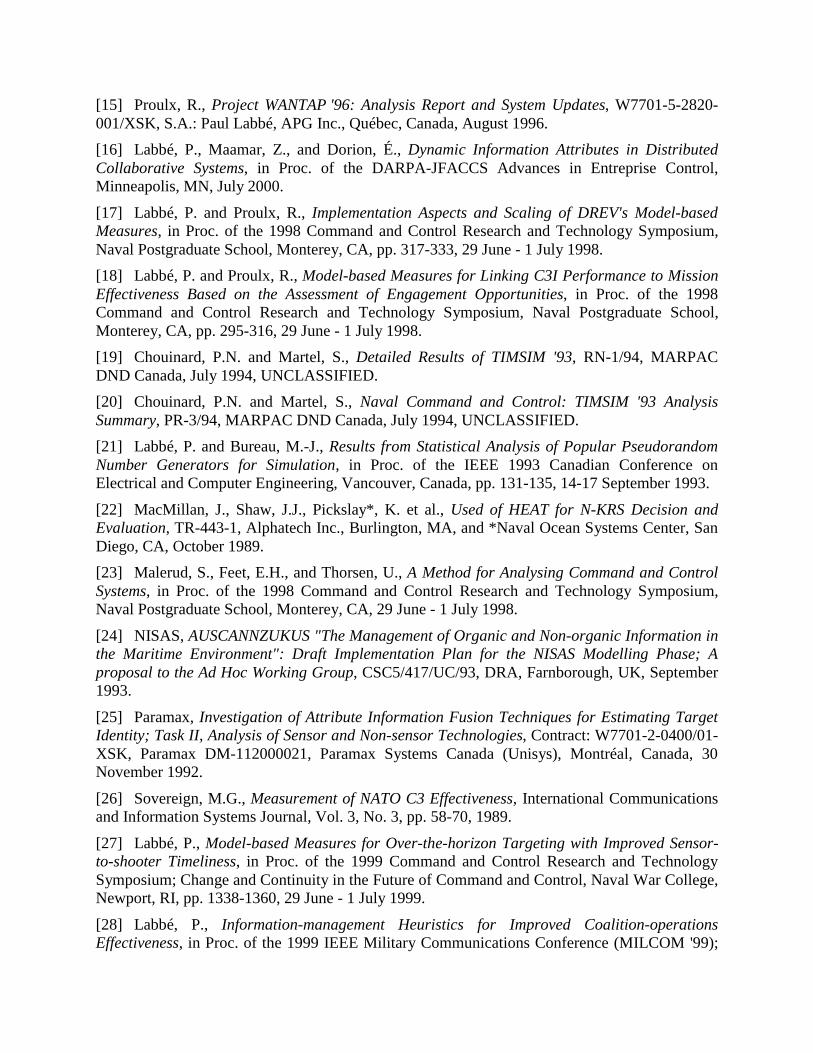
[15] Proulx, R., Project WANTAP '96: Analysis Report and System Updates, W7701-5-2820-001/XSK, S.A.: Paul Labbé, APG Inc., Québec, Canada, August 1996.
[16] Labbé, P., Maamar, Z., and Dorion, É., Dynamic Information Attributes in DistributedCollaborative Systems, in Proc. of the DARPA-JFACCS Advances in Entreprise Control,Minneapolis, MN, July 2000.
[17] Labbé, P. and Proulx, R., Implementation Aspects and Scaling of DREV's Model-basedMeasures, in Proc. of the 1998 Command and Control Research and Technology Symposium,Naval Postgraduate School, Monterey, CA, pp. 317-333, 29 June - 1 July 1998.
[18] Labbé, P. and Proulx, R., Model-based Measures for Linking C3I Performance to MissionEffectiveness Based on the Assessment of Engagement Opportunities, in Proc. of the 1998Command and Control Research and Technology Symposium, Naval Postgraduate School,Monterey, CA, pp. 295-316, 29 June - 1 July 1998.
[19] Chouinard, P.N. and Martel, S., Detailed Results of TIMSIM '93, RN-1/94, MARPACDND Canada, July 1994, UNCLASSIFIED.
[20] Chouinard, P.N. and Martel, S., Naval Command and Control: TIMSIM '93 AnalysisSummary, PR-3/94, MARPAC DND Canada, July 1994, UNCLASSIFIED.
[21] Labbé, P. and Bureau, M.-J., Results from Statistical Analysis of Popular PseudorandomNumber Generators for Simulation, in Proc. of the IEEE 1993 Canadian Conference onElectrical and Computer Engineering, Vancouver, Canada, pp. 131-135, 14-17 September 1993.
[22] MacMillan, J., Shaw, J.J., Pickslay*, K. et al., Used of HEAT for N-KRS Decision andEvaluation, TR-443-1, Alphatech Inc., Burlington, MA, and *Naval Ocean Systems Center, SanDiego, CA, October 1989.
[23] Malerud, S., Feet, E.H., and Thorsen, U., A Method for Analysing Command and ControlSystems, in Proc. of the 1998 Command and Control Research and Technology Symposium,Naval Postgraduate School, Monterey, CA, 29 June - 1 July 1998.
[24] NISAS, AUSCANNZUKUS "The Management of Organic and Non-organic Information inthe Maritime Environment": Draft Implementation Plan for the NISAS Modelling Phase; Aproposal to the Ad Hoc Working Group, CSC5/417/UC/93, DRA, Farnborough, UK, September1993.
[25] Paramax, Investigation of Attribute Information Fusion Techniques for Estimating TargetIdentity; Task II, Analysis of Sensor and Non-sensor Technologies, Contract: W7701-2-0400/01-XSK, Paramax DM-112000021, Paramax Systems Canada (Unisys), Montréal, Canada, 30November 1992.
[26] Sovereign, M.G., Measurement of NATO C3 Effectiveness, International Communicationsand Information Systems Journal, Vol. 3, No. 3, pp. 58-70, 1989.
[27] Labbé, P., Model-based Measures for Over-the-horizon Targeting with Improved Sensor-to-shooter Timeliness, in Proc. of the 1999 Command and Control Research and TechnologySymposium; Change and Continuity in the Future of Command and Control, Naval War College,Newport, RI, pp. 1338-1360, 29 June - 1 July 1999.
[28] Labbé, P., Information-management Heuristics for Improved Coalition-operationsEffectiveness, in Proc. of the 1999 IEEE Military Communications Conference (MILCOM '99);

Into the Next Millennium-Evolution of Data Into Knowledge, Fort Monmouth & Atlantic City,NJ, 31 October - 3 November 1999.


![Mission Manager[1]](https://static.fdokumen.com/doc/165x107/6313fe215cba183dbf075a68/mission-manager1.jpg)