Impact of IT Outsourcing on Business & IT Alignment - Vrije ...
476
Impact of IT Outsourcing on Business & IT Alignment Academic Dissertation Barry Derksen
-
Upload
khangminh22 -
Category
Documents
-
view
0 -
download
0
Transcript of Impact of IT Outsourcing on Business & IT Alignment - Vrije ...

Impact of IT Outsourcing on Business & IT Alignment
Business & IT alignment (BIA) has been an area of interest in both industry and academic research for over 35
years. It received signi� cant attention from the strategic alignment model article published by Henderson &
Venkatraman in 1992. BIA is about the integration of IT for the business. All businesses focus on opportuni-
ties to grow, constantly aiming to obtain predetermined targets using strategies such as customer intimacy,
operational excellence or best product. It is the expectation that the IT organisation enables and drives this
growth, recognizing that the IT organisation must contend with their own challenges. The development
and implementation of their respective strategies often lead to discrepancies. The result is a gap between
business & IT. BIA is about closing that gap. The assumption is that doing nothing means creating a chasm.
BIA is consistently reported as a key concern of business & IT management as one of the top 3 concerns in
the last decade.
Today, IT outsourcing (ITO), especially with the advent of cloud computing, are key also among the top IT
management concerns. ITO has grown in the past two decades. Organisations decide to outsource due
to the belief that outside vendors can deliver services at lower costs. Many organisations expect to gain a
better price and/or quality of service by using ITO. But industry research performed shows that outsourcing
of IT services is not always successful. Some industry research: 50% of the ITO engagements do not deliver
the objectives. 50% of the ITO engagements have to be renegotiated, and 25% of the outsourced IT is trans-
ferred to another supplier or back in-house within two years after the outsourcing deal. The question arises
whether ITO is increasing the BIA gap or not. Is ITO penny wise but pound foolish or not?
At the end, the goal of both BIA and ITO should be improving the desired e� ectiveness and e� ciency of IT in
meeting business objectives. This book provides business & IT managers, consultants and researchers
several major insights regarding BIA and ITO based on an extensive research represented by 907 business
& IT managers of which 28 case research organisations, 183 survey research organisations and 62 organisa-
tions conducting an abbreviated survey.
Barry Derksen
Barry Derksen
Impact of IT O
utsourcing on Business & IT A
lignment
Impact of IT Outsourcingon Business & IT Alignment
Academic Dissertation
Barry Derksen
Omslag Proefschrift Barry.indd 1 29-10-2012 8:45:48

VRIJE UNIVERSITEIT
Impact of IT outsourcing on Business & IT alignment
ACADEMISCH PROEFSCHRIFT
ter verkrijging van de graad Doctor aan
de Vrije Universiteit Amsterdam,
op gezag van de rector magnificus
prof.dr. L.M. Bouter,
in het openbaar te verdedigen
ten overstaan van de promotiecommissie
van de Faculteit der Economische Wetenschappen en Bedrijfskunde
op dinsdag 15 januari 2013 om 15.45 uur
in de aula van de universiteit,
De Boelelaan 1105
door
Barry Derksen
geboren te Nijmegen

promotoren: prof.drs. J.A. Oosterhaven
prof.dr. A.A.I. Holtgrefe

iii
Impact of IT Outsourcing on Business & IT Alignment
members Ph.D. reading: Prof.dr. E. Beulen (Tilburg University)
Prof.dr. M. Creemers (Nyenrode Business University)
dr. J.N. Luftman (Society for Information Management /
Global Institute for IT management)
Prof.dr. J.B.F. Mulder (Antwerp managementschool,
University of Antwerp)
Prof.dr. R. Paans (VU, University Amsterdam)
dr. R.P.W. Poels (Twynstra Gudde)
cover illustration: Prof.dr. Aad Kranenonk †
lay-out: P.J.H. Gerlach
editorial (language): K. Wrede, drs. L.L. Bestebroer
ISBN: 978-90-817866-1-4
NUR-code: 160
NUR –description: Economie, recht en bedrijfskunde
Copyright © 2013, Barry Derksen MSc MMC CISA CGEIT
All rights reserved. No part of this book may be reproduced or transmitted in any form or by any
means, electronic or mechanical, including photography, recording, or any information storage and
retrieval system, without prior written permission of the author.

iv
vPreface and Acknowledgements
“Do what you love” Best advice received by Ted Koppel (ABC presentator), source: Fortune
Preface and Acknowledgements
I’m lucky, I do what I like and I liked conducting this research. It was something I had wanted to do for
over eight years, but really started in 2008 rather than 2003 when I first realized I wanted to perform
research in an area that provided in depth study of the business & IT area I work in.
The initial activities for this dissertation were aimed at performing research on IT innovation and the ef-
fectiveness of IT. That study was to provide answers to business managers, management consultants,
and researchers, who questioned whether the IT experts should be more involved in innovation ques-
tions. That portion of the research was performed in 2004 and was published in several articles and the
annual book, ‘Trends in IT’. Although it was successful research, I never proceeded with this subject to
realise a PhD dissertation.
In 2008, I worked together with Herman van Bolhuis on a multi-client study on the subject of Busi-
ness & IT alignment. After talking and discussing with Professor Luftman about the same multi-client
study, I started to think that since working in this area for the past ten years, there was still one major
aspect I wanted to emphasise. I felt more emphasis was needed on the theoretical framing of my
thoughts and concepts on Business & IT alignment in relation to IT outsourcing. This resulted in this
PhD dissertation.
I began working on this dissertation in July 2008 with the hypothesis “Business & IT alignment ma-
turity in situations where IT is outsourced are less than in situations where IT outsourcing is low or
no IT outsourcing is applicable”. The concepts and research described in this dissertation lean heav-
ily on authors, researchers, management consultants and organisations who understand and have
captured the management perspective on organisational renewal, technological innovation, and IT
vi
managerial issues related to Business & IT alignment, outsourcing and maturity. Many insights in the
themes of managing and measuring Business & IT alignment, in combination with IT outsourcing,
were drawn from the work of Jerry Luftman, Arno Oosterhaven, Rob Poels, Aart van der Vlist, Guus
Delen, Erik van Beulen, Peter Noordam, and many more experts.
The work of dr. Jerry Luftman and my initial conversations with him started my actual work on this
dissertation. But my quest for a ideal area of research started in 2003 after graduating for the post
graduate Master of Management Consulting at the Vrije Universiteit in Amsterdam. Years before I
started the post graduate., Prof. dr. Aad Kranendonk was the teacher and person who convinced me
to start off at KPMG Management Consulting. His persuasive character convinced me to start with
the post graduate Master of Management Consulting. There I met Prof. drs. Arno Oosterhaven and
after working with him on my paper for the post graduate called ‘The ineffectiveness of ITIL on TCO’, he
became the natural best choice to be my promoter. I asked dr. Jerry Luftman to be involved, due to
his work, but also because of his enthusiasm in the field of alignment. Before and during this study, I
have been privileged to work with a number of leaders in the academic world, as well in the business
world, and I would like to thank them and convey how much I value my interactions with and learn-
ing from them.
Professors Arno Oosterhaven, Guus Holtgrefe and Jerry Luftman have provided me with the perfect
academic environment and contemporary thinking on business & IT alignment and IT outsourcing.
They have been extremely valuable at several stages of the theory/research and powerfully influ-
enced the results of this dissertation.
I owe a special debt to my old ‘Trends in IT’ authors: Aart van der Vlist and Peter Noordam, both of
whom helped me for over a period of 17 years in performing assignments, analysing complex situa-
tions, and writing books and articles.
I appreciated the discussions I had with the expert team (in changing composition): Prof. dr. Gert van
der Pijl, dr. Rob Poels, drs. Peter Noordam, Jan Jaap Jacobsma, Prof. dr. Erik Beulen, dr. Guus Delen, Prof.
dr. Theo Huibers, Gilbert Silvius, drs. Theo Bosselaers, dr. Hilda Folkerts, Prof.dr. Hans Mulder, Michiel
Dijkman, Prof. dr. Ronald Batenburg. Thank you for attending the several workshops beginning De-
cember 2008; up to the last one at the end of 2011.
Special thanks to Paul Gerlach and Katy Wrede who carried out the tough parts of editing texts, pro-
ducing the graphics and creating the final outcome of this dissertation.
Thanks to my Stedin colleagues for listening to my stories about my research and their interest (get-
ting the two letters and a dot). Thanks to Jorrit van de Walle and other partners at Business & IT Trends
Institute (BITTI) for being sensitive to the energy needed to perform a Phd. research instead of realiz-
ing another research; book; article or other BITTI related research material. Also many thanks to all the
case companies, their contact persons, respondents and others who contributed to this dissertation.
viiPreface and Acknowledgements
And last, but certainly not least, a note of major thanks to my family. Drs. Leonie Bestebroer, ‘my girl’
for life, who has been wonderfully responsive, capable, and persistent in supporting me in the special
wish to write this dissertation. I also want to thank my three brave boys, Matthijs, Thomas and Tijn
who always delivered the right smile and more than enough positive energy to write the next ver-
sion of this dissertation. Leonie, Matthijs, Tijn and Thomas must have seen a lot of the world while
I was writing in the lower floor of the house in the hidden Church of Leiden… The little Church of-
ten offered me the quietness and peace to write the next version of this dissertation. Another place
which offered me great inspiration and quietness was the mountain view in the chalet Anneloes in
Zweisimmen (nearby Gstaad) in Switzerland, which was totally separated from the hectic life in the
Netherlands. It goes a bit back in time with a view of the Rinderberg. Loes & Leo……I completely
support your decision to buy this beautiful second home, and even more happy to be a shareholder.
Finally, all of my work to achieve this, is the continuous search of a competitive boy seeking acknowl-
edgement and a constant flow of new knowledge. Dad, Mam, I hope you are proud of this achieve-
ment. Thanks.
Note: As a management advisor / (interim) manager I advise people and organisations. Searching for the
best advice, i’m interested in what people see as their best advice. In several chapters I added a line of the
best (personal) advice at executive level received.
viii
Contents
Preface and acknowledgements v
Summary x
Dutch Summary xvii
Research background & approach
Part I: Background & approach 1In part I the background & approach are provided. Business & IT alignment and IT out-sourcing are defined. The structure of this dissertation is provided.
Part II: Research design 35In Part II the chosen research design is described more thoroughly. Secondly the litera-ture research is described as well as the data gathering for field research.
Literature research
Part III: Business & IT alignment components 53In Part III the six determining components for Business & IT alignment are described. These are: communication, competency / value measurement, governance, partnership, scope & architecture and skills.
Part IV: IT Outsourcing characteristics 83In Part IV the characteristics of IT outsourcing: type of relationship, scope organisational, scope functional, vendor construction, governance, experience, contract, project man-agement, service (level) management and transition result with regard to IT outsourcing are described.
Part V: Measuring BIA maturity and the ITO influence (BIAS) 111In Part V the considerations regarding the approach of measuring the level of BIAS are described as well as the findings of literature and field research of ITO factors and their influence on BIA. In this part the identification, selection and measuring methodology is described as well.
Part VI: Relevant contingency factors 153The investigated contingency factors (industry, size of organisation, geographical area, role respondent, business & IT proposition and the people & culture factors) which pos-sibly influence the level of BIA and/or BIAS are identified and described in Part VI. In this part the identification and measuring methodology is also described.

ixContents
Field research / detailed results
Part VII: Detailed Results 179Part VII describes the detailed field research results. The survey, short survey and the case studies of the participating organisations, are described.
Consolidated results & analysis
Part VIII: Consolidated results 247In part VIII the survey, short survey and case results are consolidated. The consolidated results are analysed and described.
Part IX: Analysis and interpretation 297In part IX the answers to the main questions are provided, contributions to science and businesses are described and the hypothesis is tested.
Appendices 321A References 323B List of LinkedIn groups addressed for response 334C ITO questionnaire 337D BIA questionnaire 341E ITO Survey research questionnaire 356F Short Survey questionnaire (Dutch) 358G SPSS variable overview 361H Expert panel 365I Case results 366J BIA score & degree ITO using imputation 447K About the author 448

x
Impact of IT Outsourcing on Business & IT Alignment
Summary
IT outsourcing does not matter…from an alignment perspectiveThis dissertation is the end result of over four years of research, and over fifteen years of experience in
the area of Business & IT alignment and the impact of Information Technology (IT1) outsourcing. This
dissertation tests the hypothesis ‘IT outsourcing has a negative impact on Business & IT alignment’. Besides
testing the hypothesis this dissertation also provided answers to major industry questions using the
following research questions:
1. Does the business & IT alignment differ depending on the degree of IT outsourcing?
2. On which aspects / areas of interest does the alignment differ?
3. Does IT outsourcing influence the level of alignment maturity?
4. What are the determining characteristics for alignment in IT outsourcing situations?
The hypothesis was rejected. The main conclusion is that IT outsourcing does not negatively impact
business & IT alignment maturity. IT outsourcing can have a small positive influence on alignment
maturity, based upon the correlation between degree of IT outsourcing and Business & IT alignment.
This is different in several situations from the contingency perspective (for example industry and size
of organisation).
Overall the impact is small although statistically significant. Based upon the research results, IT out-
sourcing is not in favour but also not negative for alignment maturity.
1 In this dissertation IT and ICT (Information Communication Technology) is perceived as equal
xiSummary
ContributionsThe rich data set of in total 273 organisations (218 for both alignment & IT outsourcing), and 907 re-
spondents were used to test the hypothesis and answer the research questions.
Next to answering these questions and testing the hypothesis, this research made several contribu-
tions towards science and business. These are:
– Set of evaluated alignment components;
– Set of evaluated IT outsourcing characteristics;
– Business & IT alignment in outsourced situations measurement mechanism;
– Set of differences in business & IT alignment in outsourced situations –scores based upon contin-
gency factors;
– Evidence with regard to the impact of IT outsourcing on business & IT alignment;
– Set of determining IT outsourcing characteristics with regard to alignment maturity;
– An extended data set with data on the areas alignment maturity, IT outsourcing and contingency
factors of 273 organisations and 907 businesses & IT respondents.
Definitions and research modelIn this dissertation, Business & IT alignment (alignment) is described as: ‘...realising and optimizing in an
on-going process; the relational mechanism between business & IT by working on the IT effectiveness of the
organisation in order to realise enterprise business objectives’.
IT outsourcing is defined as: a process whereby an organisation decides to contract out or to sell the firm’s
IT assets, people and/or activities to a third party supplier, who in exchange provides and possibly manages
these assets, people and/or activities for a fee over an agreed period of time.
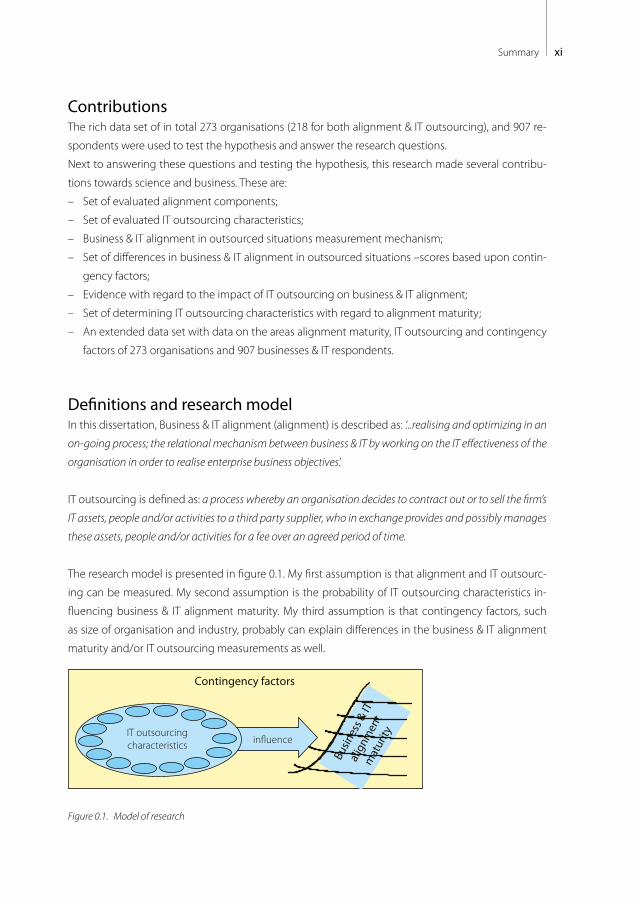
The research model is presented in figure 0.1. My first assumption is that alignment and IT outsourc-
ing can be measured. My second assumption is the probability of IT outsourcing characteristics in-
fluencing business & IT alignment maturity. My third assumption is that contingency factors, such
as size of organisation and industry, probably can explain differences in the business & IT alignment
maturity and/or IT outsourcing measurements as well.
Contingency factors
Busin
ess &
ITal
ignm
ent
mat
urityIT outsourcing
characteristics in�uence
Figure 0.1. Model of research

xii
Study of literature and researchPreceding the field research, top ranked Management of Information Systems (MIS) international
journals were reviewed in the areas of alignment and IT outsourcing. The results were used to de-
velop a measurement mechanism to test the hypothesis and answer the several main and sub ques-
tions of this dissertation.
For measuring alignment, the Luftman [2002] Strategic Alignment Measurement mechanism was
evaluated and used. This mechanism uses six leading components to measure alignment maturity:
communications, value measurements, governance, partnership, architecture and skills. Within the six
components, forty-one sub components have been discussed in the literature research and applied
in the research model.
For measuring IT outsourcing, no specific measurement mechanism was found in the literature re-
search, which could adequately measure the degree and maturity level of IT outsourcing. Based upon
the literature research, ten major indicators were identified and it is expected that these IT outsourcing
characteristics will influence alignment. The identified IT outsourcing characteristics were: type of IT
outsourcing relationship, scope of IT outsourcing - organisational, scope of IT outsourcing-functional, single
or multivendor IT outsourcing, governance of IT outsourcing, IT outsourcing experience, IT outsourcing -con-
tract, -project management, -service level management and -transition result.
The contingency factors researched were related to: organisational factors, business & IT proposition,
and people & culture factors. The alignment components, IT outsourcing characteristics and contin-
gency factors were measured independent from each other.
Case, survey & short survey researchThe case research existed of twenty-eight cases, which consists of 454 business & IT professionals,
and was used for more detailed analysis. The survey research was done within 183 organisations
consisting of 270 business & IT professionals. The short survey was conducted within 62 organisations
consisting of 183 business & IT representatives, but mainly for the industries ‘housing corporation’ and
‘education’. The data set created provides a well-represented cross section of Dutch organisations.
Covering multiple industries and all sizes of organisations.
Within the case research, the alignment survey was carried out, as well as an IT outsourcing inter-
view; and in fourteen cases, a workshop regarding people & culture factors was held. In the survey
research, the alignment survey was held combined with a number of IT outsourcing questions. The
short survey used just six alignment questions and one IT outsourcing question.

xiiiSummary
AnalysisThe field research resulted in a rich dataset of case, survey and short survey research. In this rich data-
set, several perspectives have been analysed and over thirty conclusions were drawn. Some of the
findings within the three research approaches are in contradiction. The causes are sometimes based
upon the contingency factors ‘industry’, ‘role respondent’ and ‘size of organisation’.
Interestingly, the case research showed a small negative, but not significant, correlation between
alignment maturity and degree of IT outsourcing; whereas the survey research showed a small, but
positive and significant correlation. Based upon the results of the case, survey and short survey re-
search, the influence of degree of IT outsourcing (what and how much is outsourced with regard to
IT, see part IV) is small, yet positive, for alignment maturity.
Based upon the literature research a measurement model was created. This model is described in
part V and VI. During the analysis, four main research questions were answered:
First, the question if alignment maturity differs depending on the degree of IT outsourcing, was answered.
This resulted in the answer: yes, alignment maturity differs depending on the degree of IT outsourcing.
Secondly, the aspects / areas of interest in which the alignment differs were identified. On average,
all components of alignment maturity are positively influenced by the degree of IT outsourcing. The
components ‘value measurement’ and ‘architecture and scope’ are most positively influenced. The
lowest contribution was found in the component ‘governance’.
Thirdly, the question if IT outsourcing does influence the maturity level of alignment was answered
positively. Several IT outsourcing characteristics were identified which influence alignment maturity.
The fourth question discussed which characteristics are determining for alignment in IT outsourced
situations. These are:
– System development;
– User & acceptance testing;
– IT outsourcing contract;
– IT outsourcing project management;
– IT outsourcing transition result;
– Size of IT outsourcing deal;
– Type of relationship IT supplier;
– IT outsourcing scope functional and particularly:
– Break/fix services;
– Workspace automation;
– Help & service desk.
xiv
Next to answering these main question, a sub question as to whether there are contingency fac-
tors that show different results with regard to Business & IT alignment in outsourced situations was
answered positively. The contingency factors that showed different results are: ‘industry’, ‘size of
organisation’, ‘role respondent’, ‘business proposition’, ‘IT proposition’ and ‘people & culture’.
In the analysis, a comparison was also made with the research results of Luftman [2012] and Poels
[2006] on the area of alignment. Differences have been explained.
ConclusionsThe hypothesis: ‘IT outsourcing has a negative impact on Business & IT alignment’ is tested in this dis-
sertation, and based upon the overall (case, survey & short survey) results the hypothesis is:
REJECTED, IT outsourcing does not have a negative impact on alignment.
Organisations using IT outsourcing have, on average, a higher level of alignment. This difference is relatively small but significant.
This rejected hypothesis is based on the overall result, as well as the single results of the case, survey
and short survey research and exists of:
1. Result case research:
There is no significant (negative) influence between the maturity of alignment and the Degree of IT out-
sourcing. The hypothesis that IT outsourcing has a negative impact on business & IT alignment is rejected.
Within the case research there were a few characteristics, which did significantly support the hypoth-
esis; these characteristics are: system development and user & acceptance testing.
2. Result survey research:
There is a small significant positive correlation between alignment maturity and Degree of IT outsourc-
ing. The hypothesis that IT outsourcing has a negative impact on business & IT alignment is rejected.
Within the survey research, no findings were made that support the hypothesis.
3. Short survey research
There is no correlation between alignment maturity and Degree of IT outsourcing. The hypothesis that
IT outsourcing has a negative impact on business & IT alignment is rejected.
The short survey research did not provide further possibilities to analyse this result on IT outsourcing
characteristics.

xvSummary
Next to degree of IT outsourcing the impact of the identified characteristics of IT outsourcing:
type of relationship, scope organisational, scope functional, vendor construction, governance, expe-
rience, contract, project man- agement, service (level) management and transition result were ex-
plored resulting in several perspectives with regard to the impact of IT outsourcing on Business & IT
alignment (part VII).
Regarding the rejection of the hypothesis, a number of considerations were made. Although a relative-
ly small yet positive contribution of degree IT outsourcing was found with regard to alignment maturit,
the results do not indicate that increasing the degree of IT outsourcing is the determining factor for re-
alising a higher level of alignment. But there are strong indications that aspects such as IT outsourcing
maturity, type of IT outsourcing relationship, elements of IT outsourcing-functional scope and other
do contribute to higher level of alignment. But this is also dependent on contingency aspects such as
size of organisation and industry. A number of the contingency factors show different and contradic-
tory results with regard to the contribution of degree IT outsourcing towards alignment maturity. A
number of assumptions can be made with regard to the causes of the influence of degree IT outsourc-
ing. These are also suggestions for further research. Possible causes of the contradictory results could
be (although the rich data set in this dissertation provides parts of the answers):
– Further differentiation in IT outsourcing such as offshore, cloud, on-shore sourcing. The kinds of IT
outsourcing might impact the influence of degree IT outsourcing at alignment maturity.
– Alignment maturity differs between industries. Interestingly, the industry ‘financial services’ scores
high at alignment maturity and low at degree IT outsourcing where ‘housing corporation’ scores
relatively low on the level of alignment maturity and relatively high on degree IT outsourcing.
– Dependent on the size of organisation (and possibly the age of organisation), a growing curve
seems to appear. In this growing curve, young small organisations tend to use IT outsourcing rap-
idly to a degree (maturity level) of 2.75 (in a scale of 1 to 5). Growing further up to 1,000 employees
the organisations tend to follow a strategy of internal sourcing. The alignment maturity tends to
follow the same curve, starting relatively high, but declining along the way up to a size of 500
employees. From the size of 1,000 employees, the degree IT outsourcing increases as well as the
alignment maturity but a turning point is found at a size of 10,000 employees. Using IT outsourc-
ing partners might positively influence the professionalism of the internal IT organisation, which
would correspond with the results in this dissertation.
Strongly stated: degree of IT outsourcing is NOT the ‘must do’ intervention for realising higher levels
of alignment maturity. Further research is suggested to find successful mixes (IT outsourcing char-
acteristics) for using degree IT outsourcing for realising alignment maturity. These mixes should also
consider the differences due to the contingency factors.
Finally, the overall results also indicate that both internal and external IT organisations are not able
to distinguish significantly from each other from an alignment perspective. Although the number of
xvi
organisations which completely outsourced their IT is limited, the differences between levels of align-
ment maturity are small.
Considering the research performed and the analysis made, the conclusion is that IT outsourcing
does not matter (from an alignment perspective). But it might matter when further analysis is per-
formed using the IT outsourcing characteristics and contingency factors.
xviiSamenvatting
Invloed van IT uitbesteding op bedrijfsvoering & IT aansluiting
Samenvatting
IT uitbesteding doet er niet toe…vanuit het perspectief aansluiting tussen bedrijfsvoering en ITDit proefschrift is het eindresultaat van meer dan vier jaar onderzoek en meer dan vijftien jaar prak-
tijkervaring op het gebied van aansluiting tussen bedrijfsvoering en IT2 (business & IT alignment)
enerzijds en de beïnvloeding van IT uitbesteding anderzijds. Dit proefschrift test de hypothese:
‘IT uitbesteding heeft een negatieve invloed op de aansluiting tussen bedrijfsvoering en IT’. Naast het testen
van de hypothese geeft dit proefschrift ook antwoorden op bedrijfsvraagstukken gebruik makend
van de volgende onderzoeksvragen:
1. Verschilt de professionaliteit van de aansluiting afhankelijk van de mate van IT uitbesteding?
2. Op welke gebieden verschilt de aansluiting?
3. Beïnvloedt IT uitbesteding de mate van professionaliteit van de aansluiting?
4. Wat zijn de bepalende kenmerken voor de professionaliteit van de aansluiti
De hypothese is afgewezen. De belangrijkste conclusie is dat IT uitbesteding geen negatieve invloed
heeft op de aansluiting tussen bedrijfsvoering en IT gebaseerd op de correlatie tussen de mate van
IT uitbesteding en aansluiting tussen bedrijfsvoering en IT. IT uitbesteding kan een kleine positieve
invloed hebben op de professionaliteit (volwassenheid) van de aansluiting tussen bedrijfsvoering en
IT (hierna afgekort als aansluiting). Dit is verschillend in diverse situaties vanuit het perspectief van
contingentie factoren (bijvoorbeeld branche en omvang van de organisatie).
2 Met IT (Informatie Technologie) en ICT (Informatie Communicatie Technologie) wordt in dit proefschrift hetzelfde bedoeld.
xviii
Algemeen kan worden gesteld dat de invloed klein is, hoewel statistisch relevant. Gebaseerd op de
onderzoeksresultaten is IT uitbesteding niet een argument voor maar ook niet tegen professionalise-
ring van de aansluiting.
BijdragenDe rijke dataset van in totaal 273 organisaties (218 voor aansluiting en uitbesteding) en 907 respond-
enten is gebruikt om de hypothese te testen en de onderzoeksvragen te beantwoorden.
Met het beantwoorden van deze vragen en het toetsen van de hypothese heeft dit onderzoek een
bijdrage geleverd aan wetenschap en organisaties. Deze zijn:
– Set van geëvalueerde onderdelen van aansluiting bedrijfsvoering en IT;
– Set van geëvalueerde kenmerken van IT uitbesteding;
– Mechanisme om de aansluiting van bedrijfsvoering en IT te meten wanneer IT is uitbesteedt;
– Set van verschillen in aansluiting in situaties waarbij IT is uitbesteed, gebaseerd op de contingen-
tie factoren;
– Bewijsvoering met betrekking tot de impact van IT uitbesteding op de aansluiting;
– Set van bepalende IT uitbesteding kenmerken met betrekking tot de professionaliteit van de aan-
sluiting.
– Een rijke data set (273 organisaties met 907 respondenten) met data op de gebieden: aansluiting
professionaliteit, IT uitbesteding en contingentie factoren.
Definities en onderzoek modelIn dit proefschrift wordt de aansluiting tussen bedrijfsvoering en IT omschreven als: ‘…het realiseren
en optimaliseren van het relationele mechanisme tussen bedrijfsvoering en IT in een voortdurend proces
om de organisatorische doelstellingen te behalen’.
IT uitbesteding is gedefinieerd als: ‘een proces waarbij een organisatie besluit om de IT bezittingen, men-
sen en/of activiteiten te verkopen aan of te contracteren met een externe leverancier. Deze leverancier levert
en/of stuurt deze bezittingen, mensen en/of activiteiten aan tegen een vergoeding voor een overeengeko-
men periode.’
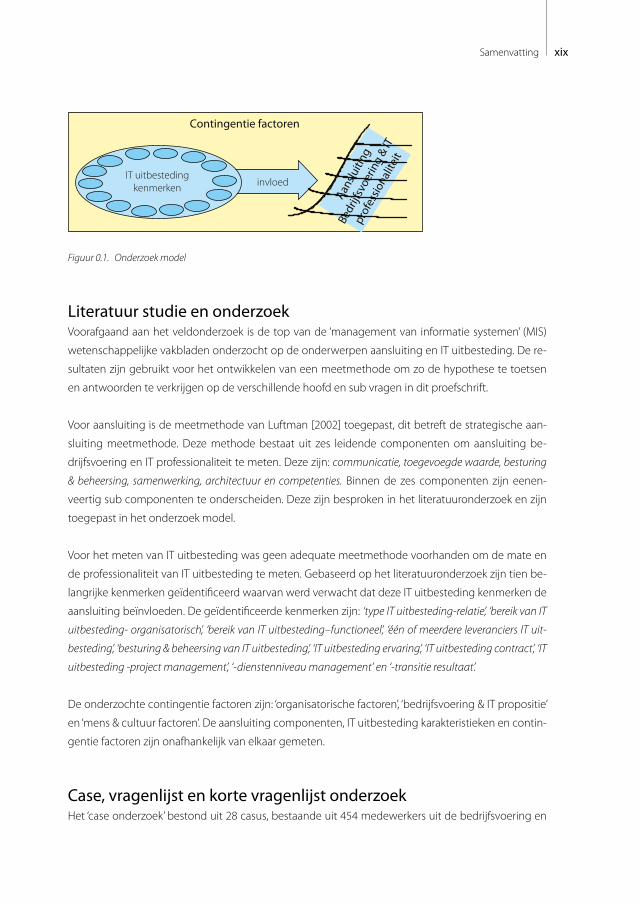
Het onderzoek model is weergegeven in figuur 0.1. Mijn eerste aanname hierbij was dat de aanslui-
ting en IT uitbesteding meetbaar zijn. Mijn tweede aanname was de mogelijkheid dat de kenmerken
van IT uitbesteding invloed hebben op de professionaliteit van de aansluiting. Mijn derde aanname
was dat er contingentie factoren (bijv. omvang organisatie en branche) zijn die mogelijkerwijs ver-
schillen tussen de professionaliteit van de aansluiting en/of IT uitbesteding kunnen verklaren.
xixSamenvatting
Contingentie factoren
Aans
luiti
ng
Bedr
ijfsv
oerin
g &
IT
prof
essio
nalit
eit
IT uitbestedingkenmerken invloed
Figuur 0.1. Onderzoek model
Literatuur studie en onderzoekVoorafgaand aan het veldonderzoek is de top van de ‘management van informatie systemen’ (MIS)
wetenschappelijke vakbladen onderzocht op de onderwerpen aansluiting en IT uitbesteding. De re-
sultaten zijn gebruikt voor het ontwikkelen van een meetmethode om zo de hypothese te toetsen
en antwoorden te verkrijgen op de verschillende hoofd en sub vragen in dit proefschrift.
Voor aansluiting is de meetmethode van Luftman [2002] toegepast, dit betreft de strategische aan-
sluiting meetmethode. Deze methode bestaat uit zes leidende componenten om aansluiting be-
drijfsvoering en IT professionaliteit te meten. Deze zijn: communicatie, toegevoegde waarde, besturing
& beheersing, samenwerking, architectuur en competenties. Binnen de zes componenten zijn eenen-
veertig sub componenten te onderscheiden. Deze zijn besproken in het literatuuronderzoek en zijn
toegepast in het onderzoek model.
Voor het meten van IT uitbesteding was geen adequate meetmethode voorhanden om de mate en
de professionaliteit van IT uitbesteding te meten. Gebaseerd op het literatuuronderzoek zijn tien be-
langrijke kenmerken geïdentificeerd waarvan werd verwacht dat deze IT uitbesteding kenmerken de
aansluiting beïnvloeden. De geïdentificeerde kenmerken zijn: ‘type IT uitbesteding-relatie’, ‘bereik van IT
uitbesteding- organisatorisch’, ‘bereik van IT uitbesteding–functioneel’, ‘één of meerdere leveranciers IT uit-
besteding’, ‘besturing & beheersing van IT uitbesteding’, ‘IT uitbesteding ervaring’, ‘IT uitbesteding contract’, ‘IT
uitbesteding -project management’, ‘-dienstenniveau management’ en ‘-transitie resultaat’.
De onderzochte contingentie factoren zijn: ‘organisatorische factoren’, ‘bedrijfsvoering & IT propositie’
en ‘mens & cultuur factoren’. De aansluiting componenten, IT uitbesteding karakteristieken en contin-
gentie factoren zijn onafhankelijk van elkaar gemeten.
Case, vragenlijst en korte vragenlijst onderzoekHet ‘case onderzoek’ bestond uit 28 casus, bestaande uit 454 medewerkers uit de bedrijfsvoering en
xx
IT. Het ‘case onderzoek’ is toegepast voor detail analyses. Het ‘vragenlijstonderzoek’ is uitgevoerd bij
183 organisaties bestaande uit 270 medewerkers uit bedrijfsvoering en IT. Het ‘verkorte vragenlijst
onderzoek’ is uitgevoerd binnen 62 organisaties bestaande uit 183 medewerkers uit bedrijfsvoering
en IT. Vooral binnen de branches: ‘woningcorporaties’ en ‘onderwijs’. De data set die is gevormd biedt
een goede doorsnede van de Nederlandse organisaties. Hierdoor zijn meerdere branches en de di-
verse soorten van omvang van organisaties betrokken.
Bij het case onderzoek zijn de aansluiting vragenlijst en het IT uitbesteding interview toegepast. In
veertien casus is een workshop gehouden onder meer met betrekking tot de mens en cultuur fac-
toren. In het vragenlijstonderzoek was de aansluiting vragenlijst gecombineerd toegepast met een
verkorte IT uitbesteding vragenlijst. De vragenlijst voor het verkorte vragenlijst onderzoek bestond
uit zes aansluiting bedrijfsvoering en IT vragen en één IT uitbesteding vraag.
AnalyseDe analyse volgt uit het veldonderzoek en bestaat uit een rijke dataset gebaseerd op het ’case on-
derzoek’, ‘vragenlijst onderzoek’ en het ‘verkorte vragenlijst onderzoek’. Met deze rijke dataset zijn
verschillende perspectieven geanalyseerd en meer dan dertig conclusies zijn hieruit voortgekomen.
Sommige bevindingen binnen de onderzoeken zijn in contradictie wanneer bijvoorbeeld wordt ge-
keken naar het case onderzoek in vergelijking tot het vragenlijstonderzoek. De oorzaken liggen on-
der meer bij de contingentiefactoren ‘ branche’, ‘rol respondent’ en ‘omvang organisatie’ .
Interessant is dat het case onderzoek een klein negatief maar niet significant verband toonde tussen
de professionaliteit van de aansluiting en IT uitbesteding terwijl het vragenlijst onderzoek juist een
klein maar significant verband aantoont. Gebaseerd op het gezamenlijke resultaat van het case- , het
vragenlijst- en het verkorte vragenlijst- onderzoek is de beïnvloeding van de mate van IT uitbeste-
ding (wat en hoeveel is uitbesteed met betrekking tot IT, zie ook deel IV) beperkt, maar positief voor
de mate van professionaliteit van de aansluiting.
Gebaseerd op het literatuur onderzoek is een meetmodel ontwikkelt. Dit model is beschreven in deel
V en VI. Gedurende de analyse zijn vier hoofdvragen beantwoord:
Ten eerste de vraag of IT uitbesteding wel of niet de professionaliteit van de aansluiting beïnvloedt.
Deze werd positief beantwoord. IT uitbesteding beïnvloedt de professionaliteit van de aansluiting.
Als tweede zijn de gebieden waarin de aansluiting tussen bedrijfsvoering en IT verschilt geïdenti-
ficeerd. Gemiddeld worden alle componenten van de aansluiting positief beïnvloed door de mate
van IT uitbesteding. Het component ‘waarde meting’ en ‘ architectuur en bereik’ worden het meest
positief beïnvloed. Het component ‘besturing & beheersing’ wordt het minst positief beïnvloed.
xxiSamenvatting
Als derde is de vraag of IT uitbesteding het professionaliteitsniveau van aansluiting beïnvloedt po-
sitief beantwoord. Verschillende IT uitbesteding kenmerken zijn geïdentificeerd welke de mate van
professionaliteitsniveau van aansluiting beïnvloeden.
Ten vierde zijn de bepalende kenmerken voor de aansluiting in situaties waar IT uitbesteding van
toepassing is geïdentificeerd. Deze zijn:
– Systeem ontwikkeling;
– Gebruikers- en acceptatie testen;
– IT uitbesteding contract;
– IT uitbesteding project management;
– IT uitbesteding transitie resultaat;
– Omvang van IT uitbesteding;
– Type relatie met IT leverancier;
– IT uitbesteding bereik – functioneel en in het bijzonder:
– ‘Break/fix’ dienstverlening;
– Werkplek automatisering;
– ‘Help & service desk’.
Naast het beantwoorden van deze hoofdvragen is ook de sub vraag of er contingentie factoren zijn
waarbij de aansluiting met IT uitbesteding verschillende uitkomsten laten zien positief beantwoord.
De contingentie factoren die verschillen in de resultaten laten zien zijn: ‘branche’, ‘omvang van organi-
satie’, ‘bedrijfspropositie’, ‘IT propositie’ en ‘mens & cultuur’.
In de analyse is tevens een vergelijking gemaakt met de onderzoeksresultaten van Luftman [2012] en
Poels [2006] met betrekking tot aansluiting bedrijfsvoering en IT. De verschillen zijn toegelicht.
ConclusiesDe hypothese: ‘IT uitbesteding heeft negatieve gevolgen voor de aansluiting tussen bedrijfsvoering en IT’ is
getoetst in dit proefschrift. Gebaseerd op het totaal resultaat (case, vragenlijst en verkorte vragenlijst)
is de hypothese:
VERWORPEN,IT uitbesteding heeft geen negatieve gevolgen voor
de aansluiting tussen bedrijfsvoering en IT.Organisaties die IT uitbesteding toepassen hebben gemiddeld een hogere
mate van aansluiting. Dit verschil is relatief klein maar significant.
De verworpen hypothese is gebaseerd op het totaal resultaat als ook op de afzonderlijke resultaten
van de case, de vragenlijst en de verkorte vragenlijst bestaande uit:
xxii
1. Resultaat case onderzoek:
Er is geen significant (negatieve) beïnvloeding tussen de professionaliteit van de aansluiting en de mate
van IT uitbesteding. De hypothese dat IT uitbesteding een negatieve invloed heeft op aansluiting be-
drijfsvoering en IT is verworpen.
Binnen het case onderzoek zijn enkele bevindingen gemaakt die wel een significante ondersteuning
van de hypothese boden, deze zijn: systeemontwikkeling en gebruiker- & acceptatie testen.
2. Resultaat vragenlijstonderzoek:
Er is een significant positieve correlatie tussen de professionaliteit van de aansluiting en de mate van IT
uitbesteding. De hypothese dat IT uitbesteding een negatieve invloed heeft op aansluiting bedrijfsvoer-
ing en IT is verworpen.
Binnen het vragenlijstonderzoek zijn geen bevindingen waargenomen die de hypothese ondersteu-
nen.
3. Resultaat verkorte vragenlijstonderzoek:
Er is geen correlatie tussen de professionaliteit van de aansluiting en de mate van IT uitbesteding. De
hypothese dat IT uitbesteding een negatieve invloed heeft op aansluiting bedrijfsvoering en IT is verwor-
pen.
De verkorte vragenlijst gaf geen mogelijkheden tot verdere analyse van dit resultaat met betrekking
tot de IT uitbesteding factoren.
Naast de mate van IT uitbesteding is de invloed van de geïdentificeerde karakteristieken (type IT
uitbesteding-relatie’, ‘bereik van IT uitbesteding- organisatorisch’, ‘bereik van IT uitbesteding–functi-
oneel’, ‘één of meerdere leveranciers IT uitbesteding’, ‘besturing & beheersing van IT uitbesteding’, ‘IT
uitbesteding ervaring’, ‘IT uit- besteding contract’, ‘project management’, ‘diensten niveau manage-
ment’ en ‘transitie resultaat’) op IT uitbesteding gemeten. Dit resultaat is terug te vinden in deel VII.
Met het verwerpen van de hypothese zijn een aantal overwegingen gemaakt. Hoewel een relatief
beperkte maar positieve en significante bijdrage van de mate van IT uitbesteding is gevonden in
relatie tot de professionaliteit van de aansluiting geven de resultaten geen indicatie dat het vergroten
van de mate van IT uitbesteding een garantie biedt voor het realiseren van een hogere mate van aan-
sluiting. Maar er zijn sterke aanwijzingen dat onderwerpen als IT uitbesteding volwassenheid, type
van IT uitbesteding relatie, elementen van IT uitbesteding – functioneel bereik en andere bijdragen
aan een hoger niveau van professionaliteit van de aansluiting. Echter dit is ook afhankelijk van andere
contingentie factoren zoals omvang van organisatie en branche. Een aantal contingentie factoren
tonen verschillend en tegengestelde resultaten met betrekking tot de bijdrage van de mate van IT
xxiiiSamenvatting
uitbesteding gericht op de professionaliteit van de aansluiting. Een aantal aannames kunnen wor-
den gemaakt met betrekking tot de oorzaken van de invloed van de mate van IT uitbesteding. Deze
vormen eveneens aanbevelingen voor verder onderzoek. Mogelijke oorzaken van de tegengestelde
resultaten zijn:
– Verdere differentiatie in IT uitbesteding zoals ‘offshore’, ‘cloud’, ‘on-shore’ uitbesteding. De diverse
typen van IT uitbesteding kan mogelijkerwijs gevolgen hebben voor de beïnvloeding van de
mate van IT uitbesteding op aansluiting professionaliteit.
– De aansluiting professionaliteit verschilt tussen branches. Interessant is dat de branche ‘financiële
diensten’ een relatief hoge score heeft op aansluiting professionaliteit en een relatief lage mate
van IT uitbesteding, terwijl ‘woning corporaties’ relatief laag scoren op de mate van aansluiting
professionaliteit en relatief hoog op de mate van IT uitbesteding.
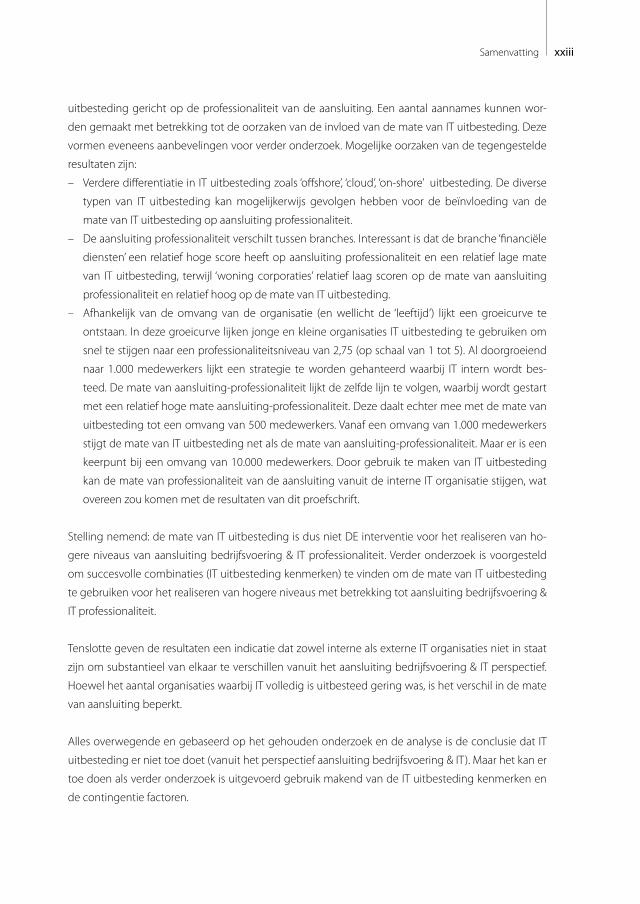
– Afhankelijk van de omvang van de organisatie (en wellicht de ‘leeftijd’) lijkt een groeicurve te
ontstaan. In deze groeicurve lijken jonge en kleine organisaties IT uitbesteding te gebruiken om
snel te stijgen naar een professionaliteitsniveau van 2,75 (op schaal van 1 tot 5). Al doorgroeiend
naar 1.000 medewerkers lijkt een strategie te worden gehanteerd waarbij IT intern wordt bes-
teed. De mate van aansluiting-professionaliteit lijkt de zelfde lijn te volgen, waarbij wordt gestart
met een relatief hoge mate aansluiting-professionaliteit. Deze daalt echter mee met de mate van
uitbesteding tot een omvang van 500 medewerkers. Vanaf een omvang van 1.000 medewerkers
stijgt de mate van IT uitbesteding net als de mate van aansluiting-professionaliteit. Maar er is een
keerpunt bij een omvang van 10.000 medewerkers. Door gebruik te maken van IT uitbesteding
kan de mate van professionaliteit van de aansluiting vanuit de interne IT organisatie stijgen, wat
overeen zou komen met de resultaten van dit proefschrift.
Stelling nemend: de mate van IT uitbesteding is dus niet DE interventie voor het realiseren van ho-
gere niveaus van aansluiting bedrijfsvoering & IT professionaliteit. Verder onderzoek is voorgesteld
om succesvolle combinaties (IT uitbesteding kenmerken) te vinden om de mate van IT uitbesteding
te gebruiken voor het realiseren van hogere niveaus met betrekking tot aansluiting bedrijfsvoering &
IT professionaliteit.
Tenslotte geven de resultaten een indicatie dat zowel interne als externe IT organisaties niet in staat
zijn om substantieel van elkaar te verschillen vanuit het aansluiting bedrijfsvoering & IT perspectief.
Hoewel het aantal organisaties waarbij IT volledig is uitbesteed gering was, is het verschil in de mate
van aansluiting beperkt.
Alles overwegende en gebaseerd op het gehouden onderzoek en de analyse is de conclusie dat IT
uitbesteding er niet toe doet (vanuit het perspectief aansluiting bedrijfsvoering & IT). Maar het kan er
toe doen als verder onderzoek is uitgevoerd gebruik makend van de IT uitbesteding kenmerken en
de contingentie factoren.

xxiv
Part IBackground& approach

2 Part I – Background & approach
31 Background
Contents
1 Background 5
2 Defining Business & IT alignment 92.1 BIA can be described as… 9
2.2 …realising and optimising in an ongoing process… 9
2.3 …the relational mechanism… 10
2.4 …between the business and IT… 11
2.5 …by working on the IT effectiveness of the organisation… 11
2.6 … in order to realise enterprise business objectives. 12
3 Defining IT outsourcing 153.1 ITO can be described… 15
3.2 … outsource the firms IT assets, people and/or activities… 16
3.3 …who in exchange provides and possibly manages these assets,
activities and/or services… 17
3.4 …for a fee over an agreed period of time 18
4 Problem definition 214.1 …BIA is a problem of IT and business, every business… 21
4.2 …being an accurate challenge for over 2 decades… 22
4.3 …and where ITO might impact the BIA challenge… 22
4.4 …with no silver bullet available 23
5 Research approach 255.1 Hypothesis, research objective and questions 26
5.2 Literature research 26
5.3 Field research 28
5.4 Analysis 29
5.5 Expert panel 29
6 Structure of this dissertation 31

4 Part I – Background & approach
51 Background
“Be nice, do your best – and most important, keep it in perspective” Best advice received by Meg Whitman (eBay), source: Fortune
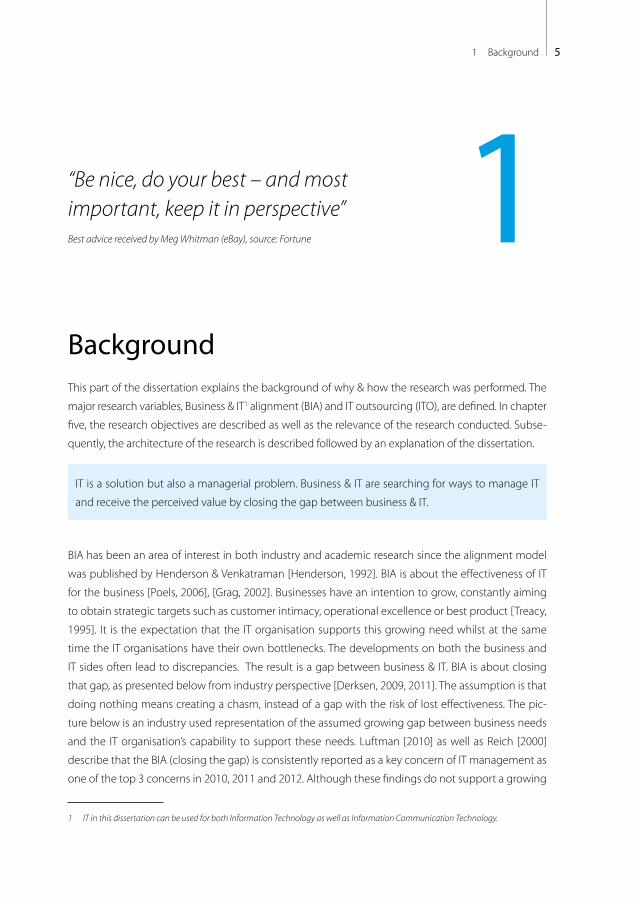
BackgroundThis part of the dissertation explains the background of why & how the research was performed. The
major research variables, Business & IT1 alignment (BIA) and IT outsourcing (ITO), are defined. In chapter
five, the research objectives are described as well as the relevance of the research conducted. Subse-
quently, the architecture of the research is described followed by an explanation of the dissertation.
IT is a solution but also a managerial problem. Business & IT are searching for ways to manage IT
and receive the perceived value by closing the gap between business & IT.
BIA has been an area of interest in both industry and academic research since the alignment model
was published by Henderson & Venkatraman [Henderson, 1992]. BIA is about the effectiveness of IT
for the business [Poels, 2006], [Grag, 2002]. Businesses have an intention to grow, constantly aiming
to obtain strategic targets such as customer intimacy, operational excellence or best product [Treacy,
1995]. It is the expectation that the IT organisation supports this growing need whilst at the same
time the IT organisations have their own bottlenecks. The developments on both the business and
IT sides often lead to discrepancies. The result is a gap between business & IT. BIA is about closing
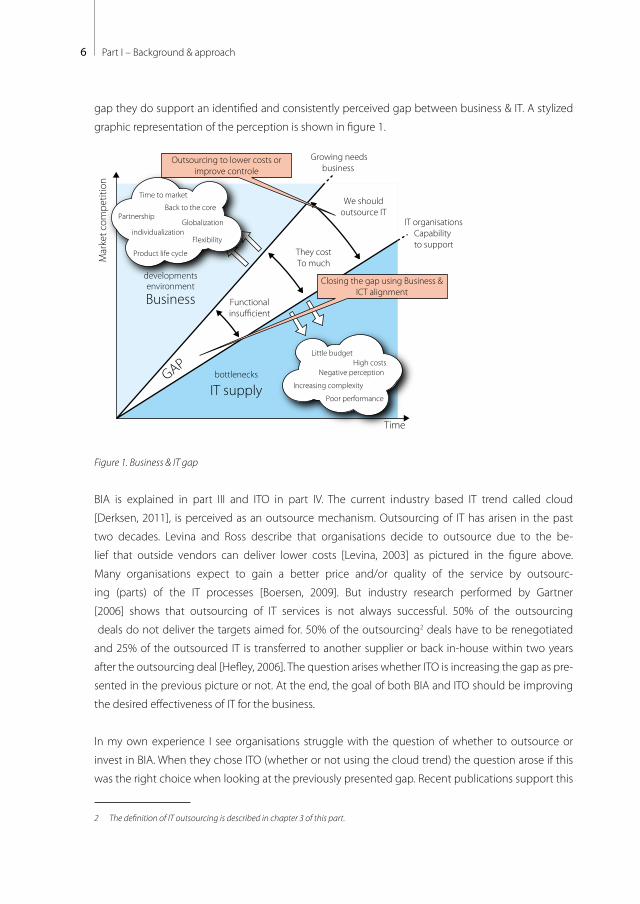
that gap, as presented below from industry perspective [Derksen, 2009, 2011]. The assumption is that
doing nothing means creating a chasm, instead of a gap with the risk of lost effectiveness. The pic-
ture below is an industry used representation of the assumed growing gap between business needs
and the IT organisation’s capability to support these needs. Luftman [2010] as well as Reich [2000]
describe that the BIA (closing the gap) is consistently reported as a key concern of IT management as
one of the top 3 concerns in 2010, 2011 and 2012. Although these findings do not support a growing
1 IT in this dissertation can be used for both Information Technology as well as Information Communication Technology.
1
6 Part I – Background & approach
gap they do support an identified and consistently perceived gap between business & IT. A stylized
graphic representation of the perception is shown in figure 1.
Mar
ket c
ompe
titio
n
Time
developmentsenvironment
Business
bottlenecks
IT supplyGAP
Functionalinsu�cient
They costTo much
We shouldoutsource IT
IT organisationsCapability to support
Growing needsbusiness
Little budgetHigh costs
Negative perception
Increasing complexity
Poor performance
Time to market
Back to the corePartnership
Globalizationindividualization
Flexibility
Product life cycle
Outsourcing to lower costs or improve controle
Closing the gap using Business & ICT alignment
Figure 1. Business & IT gap
BIA is explained in part III and ITO in part IV. The current industry based IT trend called cloud
[Derksen, 2011], is perceived as an outsource mechanism. Outsourcing of IT has arisen in the past
two decades. Levina and Ross describe that organisations decide to outsource due to the be-
lief that outside vendors can deliver lower costs [Levina, 2003] as pictured in the figure above.
Many organisations expect to gain a better price and/or quality of the service by outsourc-
ing (parts) of the IT processes [Boersen, 2009]. But industry research performed by Gartner
[2006] shows that outsourcing of IT services is not always successful. 50% of the outsourcing
deals do not deliver the targets aimed for. 50% of the outsourcing2 deals have to be renegotiated
and 25% of the outsourced IT is transferred to another supplier or back in-house within two years
after the outsourcing deal [Hefley, 2006]. The question arises whether ITO is increasing the gap as pre-
sented in the previous picture or not. At the end, the goal of both BIA and ITO should be improving
the desired effectiveness of IT for the business.
In my own experience I see organisations struggle with the question of whether to outsource or
invest in BIA. When they chose ITO (whether or not using the cloud trend) the question arose if this
was the right choice when looking at the previously presented gap. Recent publications support this
2 The definition of IT outsourcing is described in chapter 3 of this part.

71 Background
view on BIA and ITO [Boot, 2010], [Gianotte, 2009]. Currently there is experience in ITO as well as BIA,
but little industry and academic research on the combination of both, despite the original goal to
reduce the (BIA) gap. Based upon the above described research experience, the hypothesis of this
dissertation is that ITO negatively influences the BIA. In order to investigate this further, a few prelimi-
nary main questions were made when writing this dissertation:
– Does the BIA differ depending on the degree of ITO?
– On which aspects / areas of interest does the BIA differ?
– Does ITO influence the level of BIA? And if so:
– What are the determining characteristics for BIA in ITO situations?
IT has existed for over 50 years and outsourcing (in terms of out-tasking, outsourcing, near shoring,
off shoring and recently cloud-sourcing) of IT should be relatively easy especially when reading ar-
ticles such as the one from Carr (IT doesn’t matter [2003]). In my practice I often experience the op-
posite. ITO did not always help the business [Hefley, 2006], [Boeren, 2009]. The number of complaints
grew as well, as the costs. Listening to the many complaints and reading articles about ITO reveals
that the external IT suppliers want to be a business partner, but their clients see them differently (like
an ordinary supplier aiming for more revenues) and the effectiveness of IT has declined (return on in-
vestments, user/client satisfaction, added value for business). These developments are an important
reason to start the research in BIA in ITO situations.
It is questionable if the current approach of outsourcing of IT increases the effectiveness of IT and
helps businesses achieve their strategic goals.
My goal is to fulfil the need of organisations to gain more (BIA) effectiveness from IT in outsourced
situations. I don’t believe it helps organisations to switch every two to four years to another out-
source party, which looks cheaper at first, but are then confronted with more expenses introduced
via ‘request for changes’, ‘extra incidents’ and poor BIA. If it is correct that ITO leads to lower levels of
BIA, then ITO might be penny wise but pound foolish in popular speaking terms. Improving the BIA
of business and outsourced IT should help to realise the business goals of the demand side of IT.
Therefore I want to search for the differences in the BIA depending on the degree of ITO and examine
which factors influence the BIA in outsourced situations. By exploring the characteristics of ITO that
influence the BIA, organisations and science are helped in determining and developing interventions
those organisations can use to improve the BIA.
In this dissertation two subjects have a central focus: “BIA” and “ITO”. When providing the definition of
BIA and ITO a few perspectives will be discussed regarding the subjects hereafter. Further explana-
tions will be provided in part III and IV. First the BIA definition used in this dissertation is provided
followed by the definition of ITO.

8 Part I – Background & approach

92 Defining Business & IT alignment
“Teachers are important”Haig Balisan, Directeur Koninklijk Zoologisch genootschap Natura Artis Magistra
source: Intermediair 2/9/2009
Defining Business & IT alignmentThis chapter elaborates on some relevant concepts in order to position BIA. The definition of BIA will
be described as well as the relevance of BIA and its challenges.
2.1 BIA can be described as…A number of definitions of BIA can be given. Henderson & Venkatraman [Henderson, 1992] intro-
duced BIA stating; “We argue that the inability to realise value from IT investments is, in part, due to the
lack of alignment between the business and IT strategies of organisations.” They argued that economic
performance is directly related to the ability of management to create a strategic fit between the po-
sition of an organisation and the design of an appropriate administrative structure. This is supported
by Byrd et al [Byrd, 2006] for small and medium firms as well.
Chan [Chan, 2007] described a few practical, but not very precise definitions: ‘Alignment is the busi-
ness and IT working together to reach a common goal.’ And ‘Strategic alignment is then, everyone
rowing in the same direction’.
A practical definition of BIA used in this dissertation is adopted from Poels [2006]: The best possible use
of IT resources to meet enterprise objectives. Adding upon this definition the following elements can be
used to describe BIA: realising and optimising, in an ongoing process, the relational mechanism between
the business and IT by working on the IT effectiveness of the organisation in order to realise enterprise busi-
ness objectives. This description of BIA is explained in the following paragraphs using the headings.
2.2 …realising and optimising in an ongoing process…For more than two decades, IT alignment has appeared as a top concern for IT professionals and busi-
ness executives [Luftman, 2005, 2012]. Many research papers and articles have been realised on the
2
10 Part I – Background & approach
challenges of BIA [Chan, 2007] and the importance has been stressed [Henderson, 1992], [Luftman,
2005] and recently linked with return on investment (ROI) [Poels, 2006], [Byrd, 2006], [Gragg, 2002],
[Tallon, 2007].
BIA challenges will stay over time and have to be realised in each new era [Nolan, 1992], [Zee, 2004].
This is (partly) seen by others [Parker, 1988], [Henderson, 1993], and Papp [1999] described that BIA
is a process rather than an end state. Poels [2006] wrote a number of interventions that help realise
and/or optimise BIA.
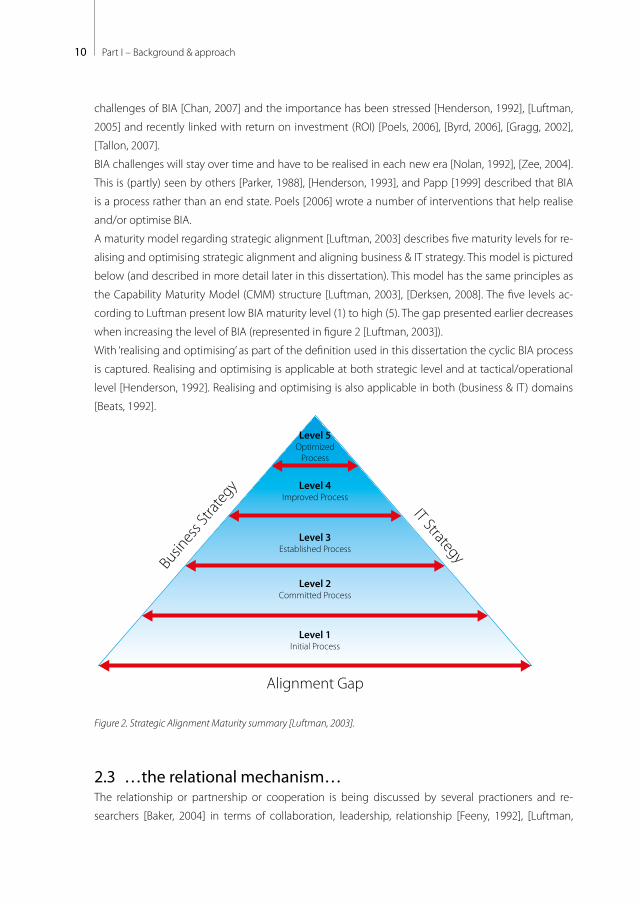
A maturity model regarding strategic alignment [Luftman, 2003] describes five maturity levels for re-
alising and optimising strategic alignment and aligning business & IT strategy. This model is pictured
below (and described in more detail later in this dissertation). This model has the same principles as
the Capability Maturity Model (CMM) structure [Luftman, 2003], [Derksen, 2008]. The five levels ac-
cording to Luftman present low BIA maturity level (1) to high (5). The gap presented earlier decreases
when increasing the level of BIA (represented in figure 2 [Luftman, 2003]).
With ‘realising and optimising’ as part of the definition used in this dissertation the cyclic BIA process
is captured. Realising and optimising is applicable at both strategic level and at tactical/operational
level [Henderson, 1992]. Realising and optimising is also applicable in both (business & IT) domains
[Beats, 1992].
Level 5Optimized
Process
Level 1Initial Process
Level 2Committed Process
Level 3Established Process
Level 4Improved Process
Alignment Gap
IT StrategyBu
sines
s Stra
tegy
Figure 2. Strategic Alignment Maturity summary [Luftman, 2003].
2.3 …the relational mechanism…The relationship or partnership or cooperation is being discussed by several practioners and re-
searchers [Baker, 2004] in terms of collaboration, leadership, relationship [Feeny, 1992], [Luftman,
112 Defining Business & IT alignment
2003]. Most of these researches seem to be oriented on strategic level. In this dissertation the re-
lational mechanism discusses both strategic as well as tactical level in both the supply (IT) as well
as the demand (business) domains [Pols, 2005]. The individual level of alignment [Benbya, 2006] as
well as operational level are not in scope of this dissertation. The relational mechanism is part of the
research (see part III and IV).
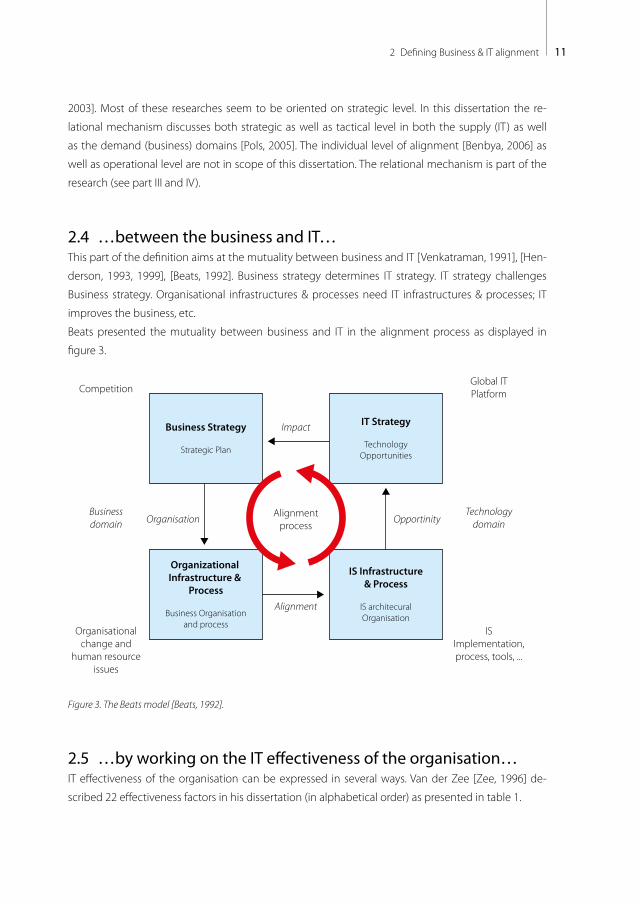
2.4 …between the business and IT…This part of the definition aims at the mutuality between business and IT [Venkatraman, 1991], [Hen-
derson, 1993, 1999], [Beats, 1992]. Business strategy determines IT strategy. IT strategy challenges
Business strategy. Organisational infrastructures & processes need IT infrastructures & processes; IT
improves the business, etc.
Beats presented the mutuality between business and IT in the alignment process as displayed in
figure 3.
Business Strategy
Strategic Plan
IT Strategy
TechnologyOpportunities
Organizational Infrastructure &
Process
Business Organisationand process
IS Infrastructure& Process
IS architecuralOrganisation
Alignmentprocess
Impact
OpportinityTechnology
domain
Global ITPlatform
ISImplementation,process, tools, ...
Businessdomain
Competition
Organisationalchange and
human resourceissues
Organisation
Alignment
Figure 3. The Beats model [Beats, 1992].
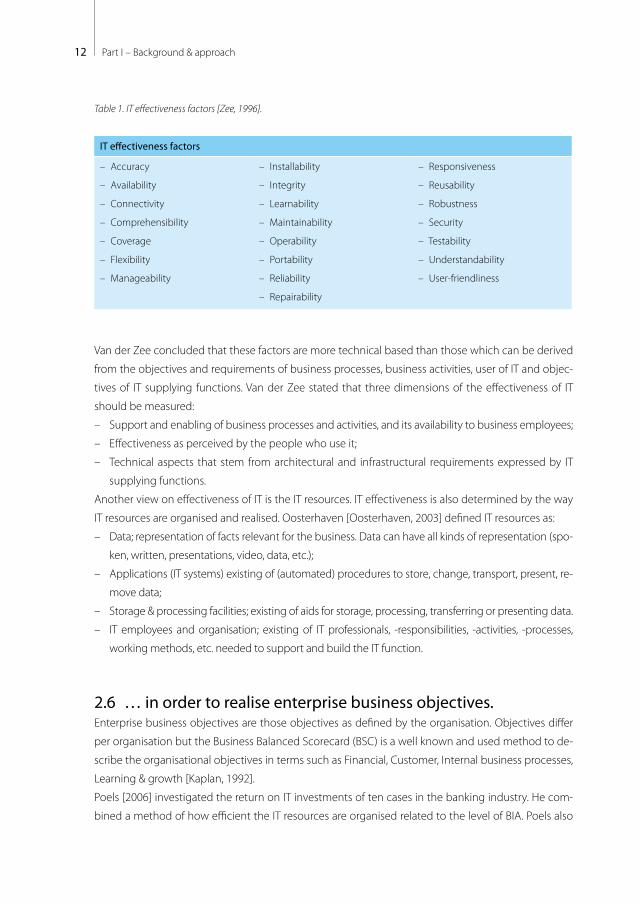
2.5 …by working on the IT effectiveness of the organisation…IT effectiveness of the organisation can be expressed in several ways. Van der Zee [Zee, 1996] de-
scribed 22 effectiveness factors in his dissertation (in alphabetical order) as presented in table 1.
12 Part I – Background & approach
Table 1. IT effectiveness factors [Zee, 1996].
IT effectiveness factors
– Accuracy
– Availability
– Connectivity
– Comprehensibility
– Coverage
– Flexibility
– Manageability
– Installability
– Integrity
– Learnability
– Maintainability
– Operability
– Portability
– Reliability
– Repairability
– Responsiveness
– Reusability
– Robustness
– Security
– Testability
– Understandability
– User-friendliness
Van der Zee concluded that these factors are more technical based than those which can be derived
from the objectives and requirements of business processes, business activities, user of IT and objec-
tives of IT supplying functions. Van der Zee stated that three dimensions of the effectiveness of IT
should be measured:
– Support and enabling of business processes and activities, and its availability to business employees;
– Effectiveness as perceived by the people who use it;
– Technical aspects that stem from architectural and infrastructural requirements expressed by IT
supplying functions.
Another view on effectiveness of IT is the IT resources. IT effectiveness is also determined by the way
IT resources are organised and realised. Oosterhaven [Oosterhaven, 2003] defined IT resources as:
– Data; representation of facts relevant for the business. Data can have all kinds of representation (spo-
ken, written, presentations, video, data, etc.);
– Applications (IT systems) existing of (automated) procedures to store, change, transport, present, re-
move data;
– Storage & processing facilities; existing of aids for storage, processing, transferring or presenting data.
– IT employees and organisation; existing of IT professionals, -responsibilities, -activities, -processes,
working methods, etc. needed to support and build the IT function.
2.6 … in order to realise enterprise business objectives.Enterprise business objectives are those objectives as defined by the organisation. Objectives differ
per organisation but the Business Balanced Scorecard (BSC) is a well known and used method to de-
scribe the organisational objectives in terms such as Financial, Customer, Internal business processes,
Learning & growth [Kaplan, 1992].
Poels [2006] investigated the return on IT investments of ten cases in the banking industry. He com-
bined a method of how efficient the IT resources are organised related to the level of BIA. Poels also
132 Defining Business & IT alignment
added the business value of IT as a variable. Poels found a relationship between the BIA maturity and
the return on IT investments.
There is a positive and significant relation between the level of BIA and ROI.
Some research is related to the assumption that strategic IT alignment leads to increased profits for
an organisation. Chan [2001] found a correlation with the perceived business performance and BIA
that is significant. Chan also added that this link is complex and dependent on business strategy
[Treacy, 1995].
Byrd’s [Byrd, 2006] research resulted in the conclusion that strategic alignment had a direct impact
on performance as a moderator between IT investments and business performance. The real value in
BIA was in leveraging the organisations’ IT investments. Factors such as size of the organisation, the
selected strategy [Treacy, 1995] and industry do influence the performance implications of strategic
alignment [Chan, 2006].

14 Part I – Background & approach
153 Defining IT outsourcing
“Get good – or get out”Best advice received by Peter Drucker (RIP, consultant/guru), source: Fortune
Defining IT outsourcingThis chapter elaborates on some relevant concepts in order to position IT outsourcing (ITO). The defi-
nition of ITO will be described discussing separate elements. Also the relevance of ITO and its chal-
lenges are being discussed. A current trend [Luftman, 2010], [Derksen, 2011] is cloud sourcing. In this
dissertation, cloud sourcing is seen as a mechanism in ITO. At the end of this chapter this is briefly
described.
3.1 ITO can be described…There are several definitions regarding outsourcing. A few of these are:
– Loh & Venkatraman [Loh, 1992]; A process whereby an organisation (1) decides to contract out
or to sell the firms IT assets, people and/or activities to a third party supplier, (2) who in exchange
provides and manages these assets and services for a fee over an agreed period of time.
– Kern & Willcocks [Kern, 1999]; outsourcing is the decision taken by an organisation to (1) contract
out or sell the organisation’s assets, people, processes and/or activities to a third party supplier,
(2) which in exchange provides and manages assets and services for monetary returns over an
agreed period of time.
The several definitions are rather close. Important components of outsourcing are the transfer of as-
sets to a third party and the exchange of services for monetary returns over an agreed period of time.
The difference between the definitions of Loh & Venkatraman versus Kern & Willcocks is that the latter
is not specifically about the outsourcing of IT.
Next to outsourcing, IT can also be sourced within an organisation. Luftman [2003, 2008] uses three
categories: centralized, decentralized and federated. Federated IT sourcing within an organisation has
on average the highest level of BIA [Luftman, 2008]. Secondly, decentralized sourced IT and last is
centralized IT.
3

16 Part I – Background & approach
For ITO, an adjusted definition of Loh & Venkatraman is being used in this dissertation. In this disserta-
tion a broader scope was measured. Based upon the definition of Loh & Venkatraman, the adjusted
definition used in this dissertation is (differences are bold):
IT outsourcing (ITO): is a process whereby an organisation decides to contract out or to sell the
firms IT assets, people and/or activities to a third party supplier, who in exchange provides and pos-
sibly manages these assets, people and/or activities for a fee over an agreed period of time.
Using this definition the focus on third party services is emphasized, in which outsourcing is based
upon contracting third parties for assets, people, processes and / or activities. The third party provides
assets, people and/or activities, but might be managed by the firm.
3.2 … outsource the firms IT assets, people and/or activities…Outsourcing is a process whereby an organisation decides to contract out or to sell the firm’s IT as-
sets, people and/or activities to a third party supplier [Loh, 1992], [Kern, 1999] or sources (parts of ) IT
assets, people and/or activities to an internal or external (out tasking) supplier. Outsourcing is also a
process in which (management) decisions are made to outsource assets, people, processes and/or
activities or to insource it. These sequences of planning, out-/in-sourcing is described as an outsource
process. A more detailed process description can be made on one of these main process steps (e.g.
define outsource strategy, select supplier, transition, etc). A relatively recent dissertation about out-
sourcing has been conducted by Delen [2005]. Delen distinguishes the following possibilities of out-
sourcing, providing a view on the contracting and outsourcing of IT assets, people and/or activities:
– Outsourcing is (1) transfer of certain business processes and the related assets and employees to
an external supplier and consequently (2) receiving back services of the external supplier based
upon the processes including a result obligation for a number of years.
– Outtasking is (1) transfer of certain business processes to an external supplier without the related
assets, employees and consequently (2) receiving back services of the external supplier based
upon the processes including a result obligation for a number of years.
– Insourcing is (1) takeover of certain business processes including the related assets and employ-
ees of a certain company and consequently (2) delivering services to that organisation based
upon the processes including a result obligation for a number of years.
– Intasking is (1) take over certain business processes from an external company without the re-
lated assets and employees of a certain company and consequently (2) delivering services to that
organisation based upon the processes including a result obligation for a number of years.
In this dissertation both outsourcing and outtasking are part of the definition of ITO. Delen also men-
tioned back sourcing, which is making the outsourcing/out tasking undone and follow up outsourc-
ing is outsourcing parts to other suppliers. Delen presented the process of outsourcing as displayed
in figure 4.

173 Defining IT outsourcing
Outsourcingcompany
SupplierA
Services
Follow up-sourcing
Back sourcing
Outsourcing
Outtasking
Inourcing
Intasking
SupplierB
Figure 4. Outsourcing process, source: Delen, 2005.
Allocating business or IT activities to an external organisation is not a new concept. ITO has been
widely used since the mid-twentieth century for a wide spread number of activities (e.g. pay roll ac-
tivities). Initially outsourcing was used for manufacturing of industrial components. According to Hy-
der [2006] the outsourcing of IT started at the end of the 1960s. Outsourcing is a concept to derive
costs and quality benefits. Hyder wrote: “In the 1970s organisations started to outsource parts of their
data processing operations to external service providers in an effort to achieve significant cost savings. The
1980s and 1990s witnessed the establishment of some landmark outsourcing agreements that involved the
shifting of entire IT operations to external service providers.”.
3.3 …who in exchange provides and possibly manages these assets, activities and/or services…
The IT supplier provides and manages the ITO assets, activities and services. The business needs must
still be supported but the assets are managed by the supplier. Silvius [2005] describes that managing
mutual expectations might be more complicated. In the perception of the service supplier, an im-
portant factor is the agreed service levels. Meeting these service levels is an applied success factor in
managing the outsourced assets and services in perspective of the supplier [Delen, 2005].
Silvius also described a number of possible bottlenecks related to assets and service delivery man-
aged at external IT suppliers, versus the demand-expectations with regards to the outsourced assets
and services at the IT customer:
– Business knowledge at the service provider;
– Cost expectations;
– Different service expectations;
– Demand management of service requestor.
18 Part I – Background & approach
In exploring the supply side of ITO, Currie [2001] uses Application Service Provider as means for ITO.
Currie describes four kinds of supplier activities:
1. Enabling technology. Services as application development, deployment & management data-
base, application servers and application management services;
2. Independent Software Vendors. Delivering business application ‘Customization layer’ services;
3. Delivery infrastructure. Software infrastructure partners delivering bandwidth and/or data centre
activities;
4. Application Service Provider. Developing and delivering strategic alliances and partnerships to
provide a wide scale of services.
Currie stated that within the atmosphere between supplier and customer in ITO a number of rela-
tionship issues can be identified: ‘The most common issues managers discussed were co-operation, com-
mitment, control, power and dependency, conflict and trust’.
In addition to delivering according to agreed service levels and contract and managing assets and
services, the atmosphere should also be managed. The identified ITO management issues (coopera-
tion, commitment, control, power and dependency) can be compared with the BIA components as
defined in the previous chapter.
3.4 …for a fee over an agreed period of timeResearch which can be related to ITO started before the definition of outsourcing from Loh &
Venkatraman. The research on ITO started with a focus on the outsourcing decision, trying to un-
derstand why organisations outsource. From a researcher’s perspective, these early studies were
economically based. One method started with Williamson [1979] and his study on Transaction
Costs Economics (TCE) in contractual relationships. Walker [1985] also created the make versus buy
decision. A development which became a trend for Enterprise Resource Planning (ERP) system
decisions as well for system packages. Deciding based upon TCE can be seen as an objective and
rational decision made by business management. Research of Beulen also concludes that TCE is
used to control costs and services delivered. This rational decision process is an assumption made
in the historical view on outsourcing. Ang and Beath [1993] considered transaction related factors
such as environment, uncertainty, assets and others. Loh and Venkatraman, Kern & Willcocks as-
sume that the outsourcing of IT is positive to gain cost advantages where IT suppliers can leverage
the economies of scale and scope. But more recent research from Chabrow [2002] and McDougall
[2002] shows that mostly large firms outsource their IT although it is logical to assume that larger
firms can generate economies of scale and scope internally. Recent ITO / offshoring in the Nether-
ITO is mostly based on economic and/or qualitative reasons. The assumption of cost reduction
when outsourcing as performed by large organisations is based on the economies of scale and
scope, but is questionable due to the internal possibilities of scale and scope.
193 Defining IT outsourcing
lands can also be seen at large firms (e.g. Shell, ABN-AMRO, and ING).
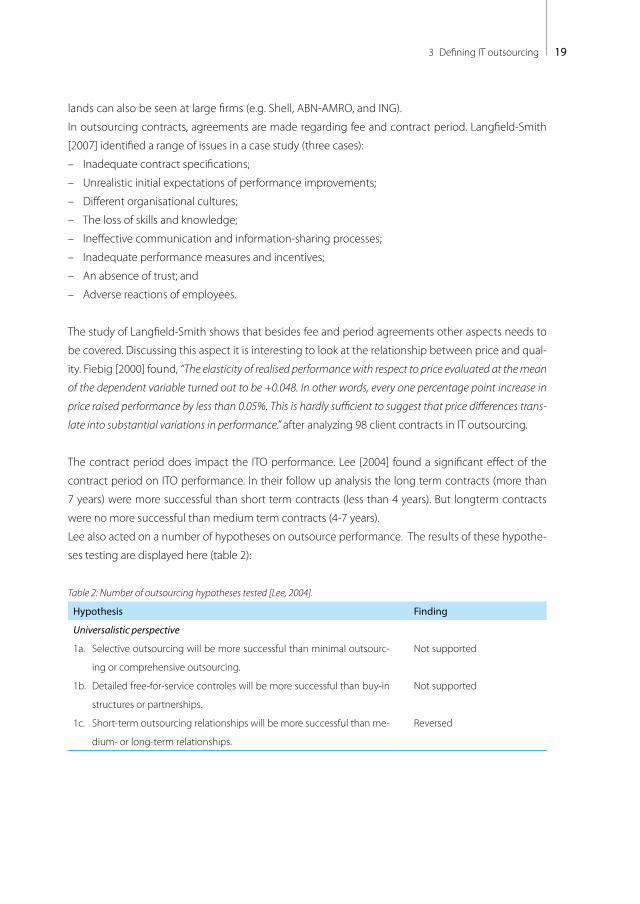
In outsourcing contracts, agreements are made regarding fee and contract period. Langfield-Smith
[2007] identified a range of issues in a case study (three cases):
– Inadequate contract specifications;
– Unrealistic initial expectations of performance improvements;
– Different organisational cultures;
– The loss of skills and knowledge;
– Ineffective communication and information-sharing processes;
– Inadequate performance measures and incentives;
– An absence of trust; and
– Adverse reactions of employees.
The study of Langfield-Smith shows that besides fee and period agreements other aspects needs to
be covered. Discussing this aspect it is interesting to look at the relationship between price and qual-
ity. Fiebig [2000] found, “The elasticity of realised performance with respect to price evaluated at the mean
of the dependent variable turned out to be +0.048. In other words, every one percentage point increase in
price raised performance by less than 0.05%. This is hardly sufficient to suggest that price differences trans-
late into substantial variations in performance.” after analyzing 98 client contracts in IT outsourcing.
The contract period does impact the ITO performance. Lee [2004] found a significant effect of the
contract period on ITO performance. In their follow up analysis the long term contracts (more than
7 years) were more successful than short term contracts (less than 4 years). But longterm contracts
were no more successful than medium term contracts (4-7 years).
Lee also acted on a number of hypotheses on outsource performance. The results of these hypothe-
ses testing are displayed here (table 2):
Table 2: Number of outsourcing hypotheses tested [Lee, 2004].
Hypothesis Finding
Universalistic perspective
1a. Selective outsourcing will be more successful than minimal outsourc-
ing or comprehensive outsourcing.
1b. Detailed free-for-service controles will be more successful than buy-in
structures or partnerships.
1c. Short-term outsourcing relationships will be more successful than me-
dium- or long-term relationships.
Not supported
Not supported
Reversed

20 Part I – Background & approach
Hypothesis Finding
Contingency perspective
2a. Industry type will moderate the effect of IT outsourcing strategy di-
mensions on outsourcing success.
2b. Organisation size will moderate the effects of IT outsourcing strategy
dimensions on outsourcing success.
2c. The size of the IT function will moderate the effects of IT outsourcing
strategy dimensions on outsourcing success.
Partially supported
Not supported
Partially supported
Configurational perspective
3. Gestalts (i.e., feasible sets of internally consistent configurations) will
outperform nongestalts (i.e., incongruent configurations) in regard to
outsourcing success.
4a. Independent gestalts will outperform other gestalts in regard to strate-
gic competence.
4b. Arm’s-length gestalts will outperform other gestalts in regard to cost
efficiency.
4c. Embedded gestalts will outperform other gestalts in regard to tech-
nology catalysis.
Supported
Not supported
Supported
Supported
214 Problem definition
“Have the courage to stick with a tough job” Best advice received by A.G. Lafley (Procter & Gamble), source: Fortune
Problem definitionAs demonstrated earlier, the BIA problem has existed since the 90’s and is currently the number one
IT management problem [Luftman, 2011], [Derksen, 2012]. IT executives recognize this problem and
want to work on this. Working on BIA is an intervention to reduce the gap as described in chapter
one. Another intervention is to outsource IT (ITO). After ITO, the BIA challenge might be in- or de-
creased and/or different in comparison with internal IT; little is known about the BIA in outsourced
situations. Yetton (copied from [Chan, 2007]) concluded that business performance suffers when
business & IT are separated substantially. ITO can separate the business & IT significantly so the conse-
quence of ITO might be that the problem might still be there or even increased, so senior executives
who perceive aligning IT and corporate goals as their most important task (Nolan Norton research
[Starre, 1998]) might be dealing with a changed problem instead of solving one.
4.1 …BIA is a problem of IT and business, every business…Within the top IT management concerns 1980-2011, the BIA challenge has existed for more than two
decades, as one of the top 5 IT management concerns during this measurement period [Luftman,
2005, 2008, 2011, and 2012]. Industry surveys held by CIOnet and CIO.com showed that aligning IT
and business processes was the top management priority in both 2007 and 2008 [CIOnet, 2008],
[Prewitt, 2006], [CIO, 2007], [Derksen, 2012]. Aligning IT initiatives with business goals was also their
number one time consuming activity in both surveys (CIOnet & CIO.com). IT, and with that BIA, is
increasingly important and thus a business & IT issue, not an IT issue alone.
Alignment in business & IT might contribute to better results, both as contribution to the revenues as
well as from a cost perspective. ITO might make it necessary to create other BIA rules.
4
22 Part I – Background & approach
4.2 …being an accurate challenge for over 2 decades…As described in chapter 3, BIA is still a challenge. In the past decades a great deal of material was
published covering the BIA subject. Models have been developed (e.g. Strategic Alignment Maturity
Model [Venkatraman, 1992], [Luftman, 2003], Growth Phase Model of KPMG [Derksen, 2006, 2008]
etc.) and organisations have been working to obliterate the chasm. Unfortunately, the gap or chasm
is still there when looking at recent articles and surveys on BIA:
Recent industry articles on the subject of BIA are:
– Martha Heller [Heller, 2011] used several senior executive examples, demonstrating that the BIA
issue is still a challenge;
– Edwin Tuin [Tuin, 2006] stated in his article that the chasm between business and IT seems to be
an unsolvable issue. He introduces another model to overcome this gap;
– Arno Oosterhaven discussed if the complaining relationship between business & IT might be a
healthy situation [Oosterhaven, 2011].
Recent industry researches on the subject of BIA are:
– In CIOnet magazine [CIOnet, 2008] BIA is a top management priority for CIO’s based on a CIOnet
survey among Benelux CIO’s. The number 1 TOP management priority for CIOnet and CIO.com in
2007 and 2008 is aligning IT and business processes. Aligning IT initiatives with business goals is
the largest time consumer of a CIO, another result from this research. In this article, it is stated that
“An initial important observation is that both Benelux and American CIO’s believe that aligning business
and IT is their absolute top priority, just as they did last year.”
– In a research of Heliview which was presented in ‘IT beheer’ [Westerveld, 2008] the conclusion was
that IT goals are still not based on the business goals and the business does not have a good view
on the IT possibilities. An important conclusion made from this research was: ‘there is a lack of
trust and understanding’.
BIA gap exists for over two decades and is still a main question for organisations.
4.3 …and where ITO might impact the BIA challenge…In September 2008, Gefen & Wyss [Gefen, 2008] concluded that IT outsourcing has become a modus
operandi in many organisations (see also Lacity and Willcocks [Lacity, 1998]). Gefen also mentions: ‘De-
spite this growing popularity, industry surveys claim that only half of all software development outsourcing
(SDO) projects are successful and that about 28 percent of the projects fail to do so because of contractual
management issues’ [McDougall, 2006]. Broadly speaking, the primary risks in SDO are monetary, pro-
ject and technology related. These risks common to software development in general, are exacerbat-
ed in SDO by the fact that it is an external vendor who is developing the software. Gefen & Wyss
argue that knowing the vendor based upon earlier contracts should reduce these exacerbated risks.
234 Problem definition
The main conclusion of Gefen & Wyss is the basis of increased mutual knowledge and trust.
A recent industry survey from Ernst & Young [Verschuur, 2004] about offshore IT-outsourcing (out-
sourcing to other continents) argued that one out of three outsourcing organisations was complete-
ly dissatisfied about the outsource initiative. The satisfaction toward local IT suppliers in relationship
to IT outsourcing was higher in this survey. Most often mentioned reasons were (in order of most
mentioned) cultural differences, communication problems, system(s) does not meet expectations.
Verschuur concluded: “The biggest advantage of offshore-ICT outsourcing is still the cost reduction: the
estimation is about 40% on the Dutch ICT costs. The quality of the offshore ICT outsourcing is poor: one out
of four companies who offshore IT is completely dissatisfied about the quality delivered. The success rate of
offshored ICT projects is relatively low. Main reasons are the cultural differences and communication prob-
lems. Despite these problems it is expected that more activities will be outsourced.
Most expected area’s for offshore ICT outsourcing are software development / ICT solutions and helpdesk /
call centres. Also web design, maintenance, ICT support and IT management are areas for outsourcing. ICT
consultancy is at this moment no area for outsourcing/off shoring.”
Both outsourcing as well as offshore outsourcing are displaying enormous challenges in order to be
successful based upon the paragraphs above. This builds upon the ITO definition relating to the aim
to have IT effectiveness for organisations. Despite these challenges, ITO is a trend due to the assumed
economical and qualitative benefits.
Like BIA, ITO is a subject of interest for both business as well as researchers. In the previous mentioned
researches the combination of BIA and ITO is not described or only partly. This lack of research is the
basis of this research while they both can be seen as interventions to adjust the relationship between
business & IT.
4.4 …with no silver bullet availableThe quote ‘with no silver bullet available’ is copied from Luftman [Luftman, 2002] but emphasises the
difficulty of providing measures to improve BIA. Poels found a number of interventions to improve
the BIA [Poels, 2006]. It is unlikely to expect that this research provides a silver bullet and it is therefore
not the intention of this research. This research describes how BIA in outsourced situations can be
measured and provides findings and clues which can be helpful to improve the BIA in ITO situations
but are out of scope in this research. Combining the results of this research with the interventions of
Poels might help to improve the BIA in ITO situations. Therefore, this research aims to find the impact
of ITO and its elements on BIA rather than developing an improvement method. With the insights,
the improvement methods can be better focused on the key issues in achieving BIA in ITO situations
(BIAS). BIAS is the combination of Business & IT alignment and the usage of IT outsourcing. In this
dissertation IT outsourcing is seen as an element of influence on BIA with an direct impact. BIAS is de
consideration of both BIA and ITO.
In summary the BIA in outSourced situations (BIAS) is an interesting challenge for exploring the simi-
larities and differences in both successful, as well as less successful practices.

24 Part I – Background & approach
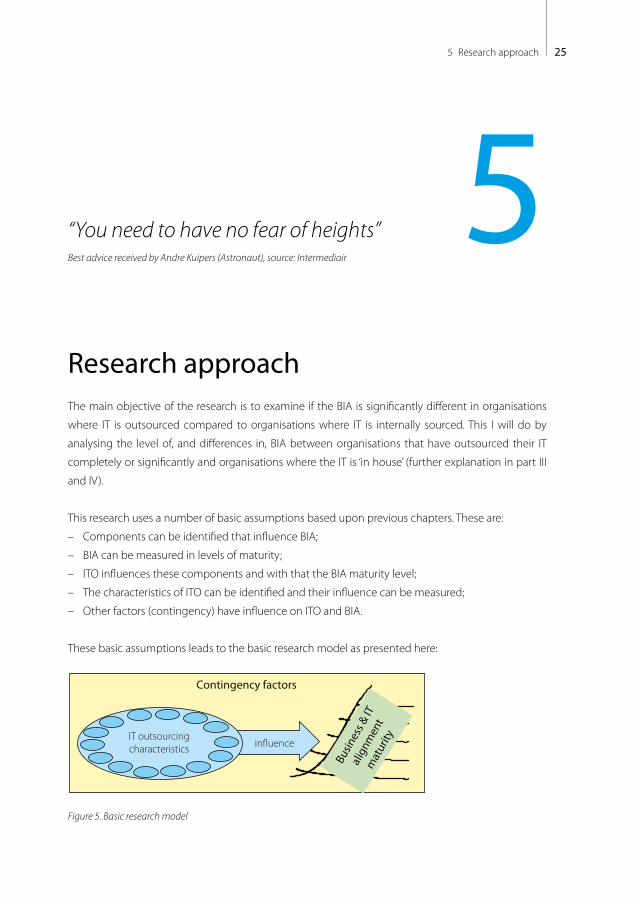
255 Research approach
“You need to have no fear of heights” Best advice received by Andre Kuipers (Astronaut), source: Intermediair
Research approachThe main objective of the research is to examine if the BIA is significantly different in organisations
where IT is outsourced compared to organisations where IT is internally sourced. This I will do by
analysing the level of, and differences in, BIA between organisations that have outsourced their IT
completely or significantly and organisations where the IT is ‘in house’ (further explanation in part III
and IV).
This research uses a number of basic assumptions based upon previous chapters. These are:
– Components can be identified that influence BIA;
– BIA can be measured in levels of maturity;
– ITO influences these components and with that the BIA maturity level;
– The characteristics of ITO can be identified and their influence can be measured;
– Other factors (contingency) have influence on ITO and BIA.
These basic assumptions leads to the basic research model as presented here:
Contingency factors
Busin
ess &
ITal
ignm
ent
mat
urityIT outsourcing
characteristics in�uence
Figure 5. Basic research model
5
26 Part I – Background & approach
5.1 Hypothesis, research objective and questionsBased upon the introduction in previous chapters the following hypothesis is used:
– IT outsourcing (ITO) has a negative impact on Business & IT alignment (BIA).
Also based upon the introduction in previous chapters the following research objective was identified:
– Provide knowledge about the influence of ITO on BIA.
With this knowledge, organisations are better prepared to make a choice with regard to ITO, whether
or not to improve and if so, how to improve the BIA, dependent upon the state of ITO. In order to con-
tribute to this research objective, the following main research questions were identified:
– Does the BIA differ depending on the degree of ITO?
– On which aspects / areas of interest does the BIA differ?
– Does ITO influence the level of BIA? And if so:
– What are the determining characteristics for BIA in ITO situations?
In order to examine the hypothesis an answer is needed on the following sub questions:
– Which components influence BIA?
– Which characteristics differentiate ITO?
– How can we determine the maturity level of BIAS?
– How can ITO influence be measured?
– Which contingency factors influence BIAS possibly?
In figure 6 the research questions are displayed and ordered in the research phases. The research is
divided into three phases:
– literature research;
– field research;
– results & analysis.
5.2 Literature researchPreceding the field research, the last five years of the top Management of Information Systems (MIS)
ranked international journals on the area of IT management and Business Journals have been re-
viewed. These have been reviewed to gain a more complete overview of previous publications of BIA
and ITO. The selection of journals is based on the average rating on MIS journal rankings.
The combined list of journals (MIS and management journals) which were selected is:
1. Management of Information System Quarterly
2. Information Systems Research
3. Organisation Science
4. Strategic Management Journal
5. Journal of Information Technology
6. Journal of Management Information Systems
“You need have no fear of heights” Best advice received by Andre Kuipers (Astronaut), source: Intermediair

275 Research approach
Ranking ofcomponents
for BIA
Answers to the main questions:1. Does the BIA di�er depending on the degree of ITO?2. On which aspects / areas of interest does the BIA di�er?3. Does ITO in�uence the level of BIA? 4. What are the determining characteristics for BIA in ITO situations?
Acceptance or rejection of the hypothesis: IT outsourcing (ITO) has a negative impact on Business & IT alignment (BIA)
Does ITOin�uence the maturity
level of BIA?
What are the determining characteristics for BIA in
ITO situations?
Are there contingency factors which in�uence
BIAS?
Ranking of the ITO
characteristicsidenti�ed for BIA
Displayingorganisations on
maturity levelof BIAS
Showingsimilarities anddi�erences inin�uence of ITO on BIA
Showingsimilarities anddi�erences incontingency
factors
Business & IT alignment outsourcing
Contingency factors
Busin
ess &
ITal
ignm
ent
mat
urityIT outsourcing
characteristics in�uence
Literatureresearch
Whichcomponents
in�uences BIA?
Whichcharacteristics di�erentiate
ITO?
How can we determine the maturity level
of BIAS?
How can ITO
in�uence be measured?
Whichcontingency
factors in�uenceBIAS possibly?
Fieldresearch
What is thein�uence of the
componentsidenti�ed for BIA per organisation?
What is the value of the
ITO characteristicsper organisation?
What is the BIAS maturity
perorganisation?
What is the ITO in�uence
on BIA?
What is value of the
contingencyfactors per
organisation?
Consoli-dated
results &Analysis
Figure 6. Research design for research questions.
Selected journals from the last five years have been reviewed and articles were selected based upon
the key words “Business & IT alignment”, “alignment”, “outsourcing”, “IT outsourcing”. The articles se-
lected from the above mentioned journals are summarised in the paragraphs describing the theory

28 Part I – Background & approach
regarding BIA and ITO in the following parts of this dissertation. A number of articles from other jour-
nals were added based upon the relation with the scope and architecture of my research, as well
as the often mentioned authors (e.g. Venkatraman, Maes and Luftman). In Management Science no
articles were found on BIA and ITO and subsequently are not mentioned in the list above. In Organi-
sation Science, Strategic Management Journal no articles were found on ITO in the scope of my re-
search but a few were found on BIA. Within the scope mentioned above, an annotated bibliography
of Chan was found [2007] in the Journal of Information Technology. This annotated review summa-
rised over 150 articles on the area of BIA. This has been used for testing the literature research on the
BIA related questions (part III).
Next to the selected articles, I used dissertations on ITO and BIA, such as [Beulen, 2000], [Delen, 2005],
[Balaji, 2008], [Poels, 2006] and other research documents such as [Luftman, 2007]. These journals and
literature are the basis of my research. In my years of practice and during my research, I found subject
related articles and literature which I used as well. An overview of the literature used in relation to the
questions in the research design is displayed in the reference list (appendix A). An extensive descrip-
tion of the literature research approach is provided in Part II.
5.3 Field research Based upon the literature study a research model was developed. The field research consists of a
survey research in several industries with an extensive questionnaire, a short survey research in two
industries with a short questionnaire and a case study for in depth analysis of the survey research at
several industries with an extensive questionnaire, interview and workshop. The case research existed
of twenty eight cases, which consists of 454 business & IT professionals, providing a sufficient cross
section of Dutch organisations. The survey research was done within 183 organisations consisting of
270 business & IT professionals. The short survey was conducted within 73 organisations consisting of
163 business & IT representatives, but mainly for the industries ‘housing corporation’ and ‘education’.
An extensive description can be found in the next parts (II, III and IV). The BIA question is important;
it has been a top 10 IT management concern for decades. Not surprisingly, a lot of research has been
done on this and related areas. Also a large number of methods and models have been created deal-
ing with one or more aspects of BIA [Derksen, 2008]. An overview is given in the third part of this dis-
sertation and several models deal with BIA maturity and instruments to gain effectiveness.
What I looked for, and what is currently missing, is the insight in the differences in BIA using ITO
versus internal IT departments and the possible influencing ITO characteristics on (better) BIA. My
research is mainly descriptive and explorative regarding the relationship between ITO and BIA, and
the field research is therefore scoped:
– Geographically scoping: I have used survey, short survey and case study in my research. The sur-
vey, short survey and the case study are primarily Dutch located organisations (If the outsourced
295 Research approach
IT is offshore then it is still a Dutch case study, based upon the business location).
– In the field research, I was oriented on industries in which I am experienced. These are: housing
companies, government-state & local, energy, finance (pension funds / insurance) and education.
The housing companies have been the primary industry for the research cases; secondly the gov-
ernment organisations were added. Other industries were adapted as well but less extensive.
5.4 AnalysisAfter gathering all data from literature and field research the data was ordered, analysed and conclu-
sions were drawn. First the data of the separate variables were analysed in order to answer sub ques-
tions and main questions. Correlations between variables were analysed and conclusions regarding
the main questions were drawn. Finally the hypothesis was tested.
5.5 Expert panelThroughout the phases: literature research, field research and analysis, an expert panel existing of
both scientists as well as industry experts was asked to examine the several temporary products of
the research (e.g. research questions, research model, etc.). The expert panels held, and participants
are mentioned in appendix H.

30 Part I – Background & approach
31Structure of this dissertation
Structure of this dissertationIn the first part of this dissertation the reasoning behind the research has been explained. Secondly
the terms BIA and BIA in ITO situations (BIAS) has been briefly described. In the problem definition,
the added value of this research for organisations is described. The first chapters in this part lead to
the main questions as described in chapter five. Chapter five also provides an explanation on the
research methodology. This research delivers an examination of the questions posed. Based upon
the introduction, the overview of research and dissertation structure is provided in figure 7 (page 32).
In Part II the chosen research design is described more thoroughly.
In Part III the determining components for BIA are described. These components are mainly gath-
ered using literature research. The components are completed with information gathered from field
research. The classification of the BIA components is done on both survey results as well as using the
interviews conducted during the case research.
In Part IV the characteristics of ITO are described.
In Part V the considerations regarding the approach of measuring the level of BIAS is described as well
as the findings of literature and field research of ITO factors and their influence on BIA. In this part the
identification, selection and measuring methodology is described as well.
The investigated contingency factors which possibly influence the level of BIA and/or BIAS are identified
and described in Part VI. In this part the identification and measuring methodology is also described.
Part VII describes the detailed field research results. The survey and short survey results, as well as the
case studies of the participating organisations, are described. Per case (participating organisation) the
6
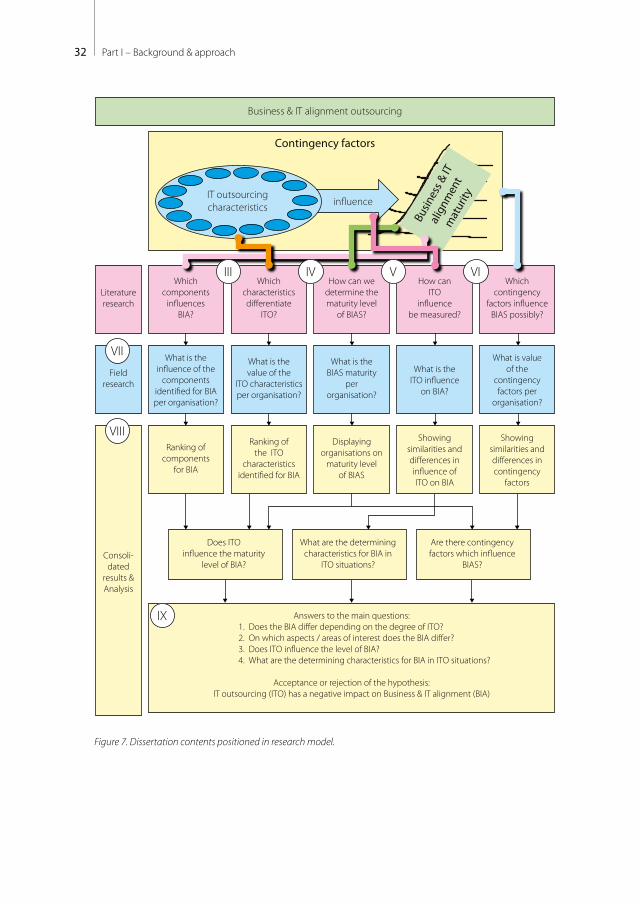
32 Part I – Background & approach
Figure 7. Dissertation contents positioned in research model.
Ranking ofcomponents
for BIA
Answers to the main questions:1. Does the BIA di�er depending on the degree of ITO?2. On which aspects / areas of interest does the BIA di�er?3. Does ITO in�uence the level of BIA? 4. What are the determining characteristics for BIA in ITO situations?
Acceptance or rejection of the hypothesis: IT outsourcing (ITO) has a negative impact on Business & IT alignment (BIA)
Does ITOin�uence the maturity
level of BIA?
What are the determining characteristics for BIA in
ITO situations?
Are there contingency factors which in�uence
BIAS?
Ranking of the ITO
characteristicsidenti�ed for BIA
Displayingorganisations on
maturity levelof BIAS
Showingsimilarities anddi�erences inin�uence of ITO on BIA
Showingsimilarities anddi�erences incontingency
factors
Business & IT alignment outsourcing
Contingency factors
Busin
ess &
ITal
ignm
ent
mat
urityIT outsourcing
characteristics in�uence
Literatureresearch
Whichcomponents
in�uences BIA?
Whichcharacteristics di�erentiate
ITO?
How can we determine the maturity level
of BIAS?
How can ITO
in�uence be measured?
Whichcontingency
factors in�uenceBIAS possibly?
Fieldresearch
What is thein�uence of the
componentsidenti�ed for BIA per organisation?
What is the value of the
ITO characteristicsper organisation?
What is the BIAS maturity
perorganisation?
What is the ITO in�uence
on BIA?
What is value of the
contingencyfactors per
organisation?
III IV V VI
VII
VIII
IX
Consoli-dated
results &Analysis

33Structure of this dissertation
following measuring results are covered:
– Identified and ranked BIA components
– Identified and ranked ITO characteristics
– Identified and ranked contingency factors
– Identified and ranked BIAS level
– Contingency factors
In Part VIII the survey, short survey and case results are consolidated. The consolidated results are
analysed and described.
In part IX the answers to the main questions are provided, contributions to science and businesses
are described and the hypothesis is tested.

34 Part I – Background & approach
Part IIResearch Design

36 Part II – Research Design
37Contents
Contents
1 Chosen research design 391.1 Research design 39
1.1.1 Main research concept used: examining 39
1.1.2 Measurement & observation methods: survey & multi-case study 41
1.1.3 Research architecture summarised 43
2 Literature (desk) research 45
3 Data gathering for field research 493.1 Data gathering for survey and short survey research 49
3.2 Data gathering for case research 50
3.2.1 Summary gathering data 50
3.2.2 Approach per case 51

38 Part II – Research Design
391 Chosen research design
“If you want something, you should do your best for it” Best advice received by Angelique de Vries (Managing director SAP Netherlands),
source: Intermediair
Chosen research designIn this chapter the reasoning behind the chosen research approach is described. First, the research
design is described and secondly the approach followed to gather data.
1.1 Research design‘Research is using a systematic approach to search for answers on questions’ [Leeuw, 2003]. De Leeuw
describes that research exists of two important factors:
1. research delivers (if right) knowledge (answers to questions) and
2. the research process must be systematic or following a method.
Baarda and de Goede [1993] claim that research must fulfil three demands:
1. the research results should be verifiable (repeatable);
2. the research results should be reliable;
3. the research results should be valid.
Baarda [1993] stated that first the purpose of the research should be realistic and feasible. The pur-
pose and definition of the problem is described previously. Based upon the definition of the problem
the request for information has been defined (the research questions) as well as the research purpose
(answering the main questions).
1.1.1 Main research concept used: examining For my research I used the balloon view of research as presented by de Leeuw and completed by
Baarda and de Goede. Other sources will be mentioned when applicable. De Leeuw describes the
approach of research as a group of interconnecting decisions regarding all balloons of the balloon
view as presented in the next figure and discussed hereafter.
The problem definition and research purpose is described in the previous part. An important aspect is
1
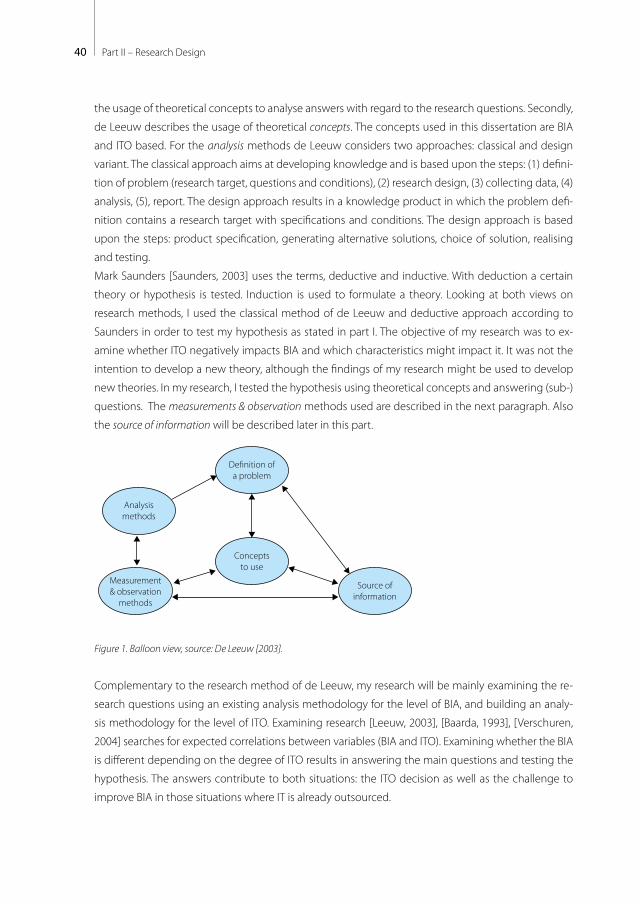
40 Part II – Research Design
the usage of theoretical concepts to analyse answers with regard to the research questions. Secondly,
de Leeuw describes the usage of theoretical concepts. The concepts used in this dissertation are BIA
and ITO based. For the analysis methods de Leeuw considers two approaches: classical and design
variant. The classical approach aims at developing knowledge and is based upon the steps: (1) defini-
tion of problem (research target, questions and conditions), (2) research design, (3) collecting data, (4)
analysis, (5), report. The design approach results in a knowledge product in which the problem defi-
nition contains a research target with specifications and conditions. The design approach is based
upon the steps: product specification, generating alternative solutions, choice of solution, realising
and testing.
Mark Saunders [Saunders, 2003] uses the terms, deductive and inductive. With deduction a certain
theory or hypothesis is tested. Induction is used to formulate a theory. Looking at both views on
research methods, I used the classical method of de Leeuw and deductive approach according to
Saunders in order to test my hypothesis as stated in part I. The objective of my research was to ex-
amine whether ITO negatively impacts BIA and which characteristics might impact it. It was not the
intention to develop a new theory, although the findings of my research might be used to develop
new theories. In my research, I tested the hypothesis using theoretical concepts and answering (sub-)
questions. The measurements & observation methods used are described in the next paragraph. Also
the source of information will be described later in this part.
Analysis methods
De�nition of a problem
Concepts to use
Source of information
Measurement & observation
methods
Figure 1. Balloon view, source: De Leeuw [2003].
Complementary to the research method of de Leeuw, my research will be mainly examining the re-
search questions using an existing analysis methodology for the level of BIA, and building an analy-
sis methodology for the level of ITO. Examining research [Leeuw, 2003], [Baarda, 1993], [Verschuren,
2004] searches for expected correlations between variables (BIA and ITO). Examining whether the BIA
is different depending on the degree of ITO results in answering the main questions and testing the
hypothesis. The answers contribute to both situations: the ITO decision as well as the challenge to
improve BIA in those situations where IT is already outsourced.
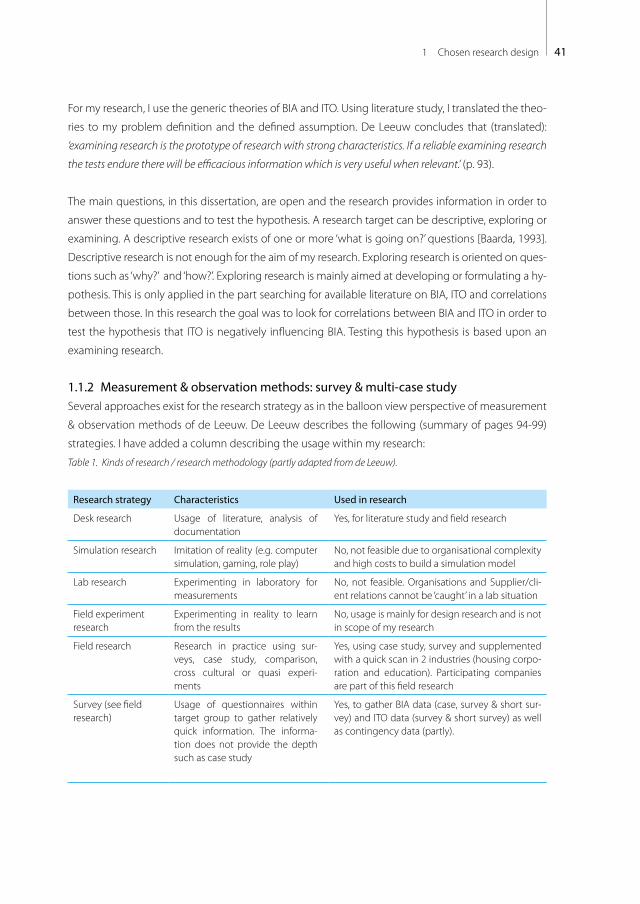
411 Chosen research design
For my research, I use the generic theories of BIA and ITO. Using literature study, I translated the theo-
ries to my problem definition and the defined assumption. De Leeuw concludes that (translated):
‘examining research is the prototype of research with strong characteristics. If a reliable examining research
the tests endure there will be efficacious information which is very useful when relevant.’ (p. 93).
The main questions, in this dissertation, are open and the research provides information in order to
answer these questions and to test the hypothesis. A research target can be descriptive, exploring or
examining. A descriptive research exists of one or more ‘what is going on?’ questions [Baarda, 1993].
Descriptive research is not enough for the aim of my research. Exploring research is oriented on ques-
tions such as ‘why?’ and ‘how?’. Exploring research is mainly aimed at developing or formulating a hy-
pothesis. This is only applied in the part searching for available literature on BIA, ITO and correlations
between those. In this research the goal was to look for correlations between BIA and ITO in order to
test the hypothesis that ITO is negatively influencing BIA. Testing this hypothesis is based upon an
examining research.
1.1.2 Measurement & observation methods: survey & multi-case studySeveral approaches exist for the research strategy as in the balloon view perspective of measurement
& observation methods of de Leeuw. De Leeuw describes the following (summary of pages 94-99)
strategies. I have added a column describing the usage within my research:
Table 1. Kinds of research / research methodology (partly adapted from de Leeuw).
Research strategy Characteristics Used in research
Desk research Usage of literature, analysis of documentation
Yes, for literature study and field research
Simulation research Imitation of reality (e.g. computer simulation, gaming, role play)
No, not feasible due to organisational complexity and high costs to build a simulation model
Lab research Experimenting in laboratory for measurements
No, not feasible. Organisations and Supplier/cli-ent relations cannot be ‘caught’ in a lab situation
Field experiment research
Experimenting in reality to learn from the results
No, usage is mainly for design research and is not in scope of my research
Field research Research in practice using sur-veys, case study, comparison, cross cultural or quasi experi-ments
Yes, using case study, survey and supplemented with a quick scan in 2 industries (housing corpo-ration and education). Participating companies are part of this field research
Survey (see field research)
Usage of questionnaires within target group to gather relatively quick information. The informa-tion does not provide the depth such as case study
Yes, to gather BIA data (case, survey & short sur-vey) and ITO data (survey & short survey) as well as contingency data (partly).

42 Part II – Research Design
Research strategy Characteristics Used in research
Case study (see field research)
Studying cases in depth in order to define general conclusions
Yes, multiple organisations are part of my re-search. Multiple organisations will be studied in depth as case studies. For examining the ques-tions also a survey is being used. This provides a broader and more thorough perspective on the questions explored. The cases are part of the sur-vey study but examined more thoroughly (more respondents and workshop)
Comparison research longitudinal
Following the same empirical situations in time to search for ex-ample the results of interventions
No, although it would be very useful to analyse the BIA before and after ITO, it would take multi-ple years to gather useful data. Secondly, several kinds of ITO are possible as well as several factors in several organisations. Longitudinal research is therefore not applicable
Comparison research cross cut
This research compares multiple situations in the same time pe-riod.
Yes, organisations with (none) ITO are compared in the same timeframe (2009-2012). Organisa-tions which have outsourced completely or sig-nificantly are questioned about BIA with regard to ITO to gather more information
Cross cultural research
Comparison between 2 cases with special attention for cultural aspects
No, cultural research is not an aim of this research
Quasi experimen-tal research
Specific use of gathered data in the field not using experimental situations (observing the field)
No
Participating research
Active participation in case study (contributing to the business situ-ation)
No, the case study will be without participation. A contribution to the business situation based upon the research might be possible, but is not part of this research
Design research Designing a method, methodol-ogy, interventions, etc. and trying out what has been designed
No, the main goal is to examine the hypothesis. Based upon the examination interventions or methods can be defined, but trying out the in-terventions or methods would be a follow up research
Mainly field research Characteristics based upon litera-ture, case and survey research
Examining hypothesis using a deductive approach
Main goal of my research is testing the hypothesis and answering the main questions.
The choices made are also phase dependent (literature research, field research, analysis) based upon
field research and using both case research [Biemans, 1994] and survey research. To examine the cor-
relation between ITO and BIA, desk and case (cross cut) research is being used.
For examining the main questions, multiple case as well as survey research is used. The usage of sur-
vey research next to case research supports the wish to examine the hypothesis.
431 Chosen research design
1.1.3 Research architecture summarisedThe research as described in this dissertation is performed in three main phases existing of:
1. Literature (Desk) research phase;
This phasewas aimed at gathering information using literature research with regards to the re-
search questions:
a. Which components influence BIA?
b. Which characteristics differentiate ITO?
c. How can we determine the maturity level of BIAS?
d. How can ITO influence be measured?
e. Which contingency factors influence BIAS possibly?
2. Field Research phase;
In this phase several measurement & observations methods (see previous paragraph) were used
to determine:
a. What is the influence of the components identified for BIA per organisation?
b. What is the value of the ITO characteristics per organisation?
c. What is the BIAS maturity per organisation?
d. What is the ITO influence on BIA?
e. What is the value of the contingency factors per organisation?
3. Analysis phase;
In this phase the hypothesis that ITO has a negative impact on BIA will be examined.
During the research, three expert panel sessions were held. The expert panels were comprised of
known industry & academic professionals on the subjects of BIA & ITO and were held to discuss the
several steps within my research. The expert panel was involved in testing the results of the first
phase, verification of the research measurement & observation method, as well as testing the first
results of the analysis phase. The research architecture is displayed in figure 7 of part I.

44 Part II – Research Design

452 Literature (desk) research
“Learn” Best advice received by Pierre Rieu
(son of André Rieu and VP Rieu productions B.V.), source: Intermediair
Literature (desk) researchPreceding my field research, I reviewed the last five years of the top Management of Information
Systems (MIS) ranked international journals on the area of IT management and Business Journals on
the area of management to gain a more complete overview of previous publications of BIA and ITO.
The selection of journals is based on the average rating on MIS journal rankings with the purpose of
providing information about evaluations concerning the quality of MIS journals as displayed below
(table 2):
Table 2. Top Management of Information Systems journals (source: www.isworld.org/csaunders/rankings.htm).
MIS Journal Rankings
Journal Code MIS
Q
ISR
CACM
MS
JMIS
AI
DSI
HBR
IEEE
Tran
s
AIM
ag
EJIS
DSS
IEEE
Sw
I&M
ACM
TDS
IEEE
TSE
ACM
Tran
s
Rainer & Miller 2005 (50 Ranked)
1 3 2 4 5 7 6 13 8 11 12 15 20
Lowry et al 2004 (World Ranking, 25 Ranked)
1 2 5 4 3 6 15 8 11 7 9 22 10
Katerattanakul et al 2003 (27 Ranked)
1 2 3 6 9 14 20 15 10 5
Peffers & Tang 2003 (IS, 50 Ranked)
1 2 3 4 7 5
Peffers & Tang 2003 (Overall, 25 Ranked)
2 3 1 7 5 4 8 11 9 18 24
2
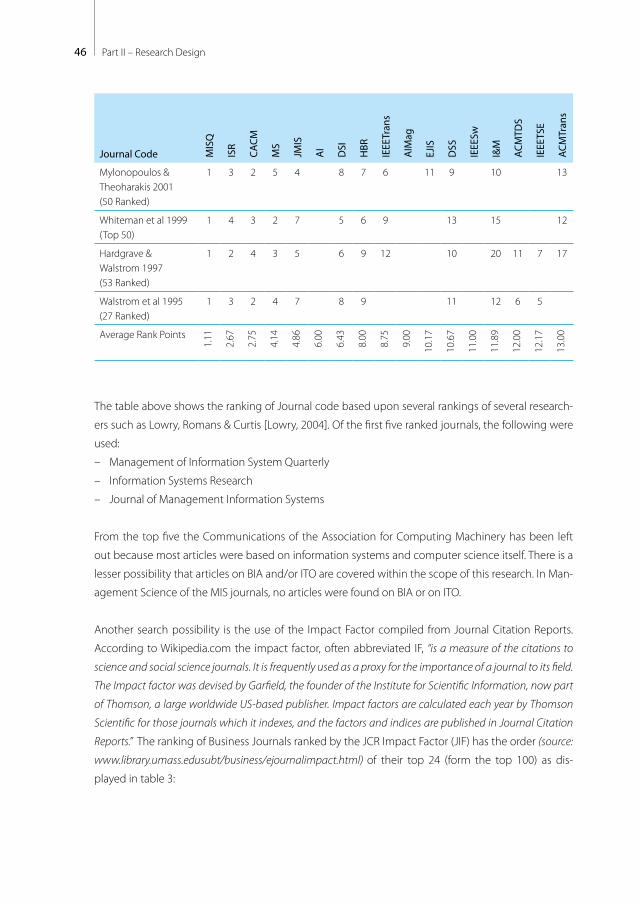
46 Part II – Research Design
Journal Code MIS
Q
ISR
CACM
MS
JMIS
AI
DSI
HBR
IEEE
Tran
s
AIM
ag
EJIS
DSS
IEEE
Sw
I&M
ACM
TDS
IEEE
TSE
ACM
Tran
s
Mylonopoulos & Theoharakis 2001 (50 Ranked)
1 3 2 5 4 8 7 6 11 9 10 13
Whiteman et al 1999 (Top 50)
1 4 3 2 7 5 6 9 13 15 12
Hardgrave & Walstrom 1997 (53 Ranked)
1 2 4 3 5 6 9 12 10 20 11 7 17
Walstrom et al 1995 (27 Ranked)
1 3 2 4 7 8 9 11 12 6 5
Average Rank Points
1.11
2.67
2.75
4.14
4.86
6.00
6.43
8.00
8.75
9.00
10.1
7
10.6
7
11.0
0
11.8
9
12.0
0
12.1
7
13.0
0
The table above shows the ranking of Journal code based upon several rankings of several research-
ers such as Lowry, Romans & Curtis [Lowry, 2004]. Of the first five ranked journals, the following were
used:
– Management of Information System Quarterly
– Information Systems Research
– Journal of Management Information Systems
From the top five the Communications of the Association for Computing Machinery has been left
out because most articles were based on information systems and computer science itself. There is a
lesser possibility that articles on BIA and/or ITO are covered within the scope of this research. In Man-
agement Science of the MIS journals, no articles were found on BIA or on ITO.
Another search possibility is the use of the Impact Factor compiled from Journal Citation Reports.
According to Wikipedia.com the impact factor, often abbreviated IF, “is a measure of the citations to
science and social science journals. It is frequently used as a proxy for the importance of a journal to its field.
The Impact factor was devised by Garfield, the founder of the Institute for Scientific Information, now part
of Thomson, a large worldwide US-based publisher. Impact factors are calculated each year by Thomson
Scientific for those journals which it indexes, and the factors and indices are published in Journal Citation
Reports.” The ranking of Business Journals ranked by the JCR Impact Factor (JIF) has the order (source:
www.library.umass.edusubt/business/ejournalimpact.html) of their top 24 (form the top 100) as dis-
played in table 3:
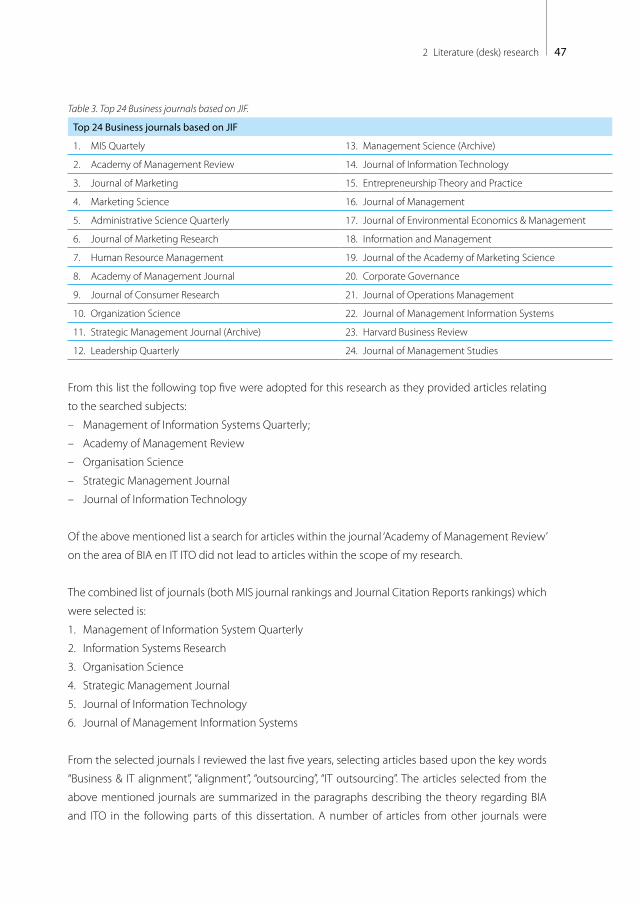
472 Literature (desk) research
Table 3. Top 24 Business journals based on JIF.
Top 24 Business journals based on JIF
1. MIS Quartely 13. Management Science (Archive)
2. Academy of Management Review 14. Journal of Information Technology
3. Journal of Marketing 15. Entrepreneurship Theory and Practice
4. Marketing Science 16. Journal of Management
5. Administrative Science Quarterly 17. Journal of Environmental Economics & Management
6. Journal of Marketing Research 18. Information and Management
7. Human Resource Management 19. Journal of the Academy of Marketing Science
8. Academy of Management Journal 20. Corporate Governance
9. Journal of Consumer Research 21. Journal of Operations Management
10. Organization Science 22. Journal of Management Information Systems
11. Strategic Management Journal (Archive) 23. Harvard Business Review
12. Leadership Quarterly 24. Journal of Management Studies
From this list the following top five were adopted for this research as they provided articles relating
to the searched subjects:
– Management of Information Systems Quarterly;
– Academy of Management Review
– Organisation Science
– Strategic Management Journal
– Journal of Information Technology
Of the above mentioned list a search for articles within the journal ‘Academy of Management Review’
on the area of BIA en IT ITO did not lead to articles within the scope of my research.
The combined list of journals (both MIS journal rankings and Journal Citation Reports rankings) which
were selected is:
1. Management of Information System Quarterly
2. Information Systems Research
3. Organisation Science
4. Strategic Management Journal
5. Journal of Information Technology
6. Journal of Management Information Systems
From the selected journals I reviewed the last five years, selecting articles based upon the key words
“Business & IT alignment”, “alignment”, “outsourcing”, “IT outsourcing”. The articles selected from the
above mentioned journals are summarized in the paragraphs describing the theory regarding BIA
and ITO in the following parts of this dissertation. A number of articles from other journals were

48 Part II – Research Design
added based upon the relation with the scope and architecture of my research, as well as the often
mentioned authors (e.g. Venkatraman, Maes and Luftman). In Organisation Science, Strategic Man-
agement Journal, no articles were found on ITO within the scope of my research but few were found
on BIA. The results combined with the annotated bibliography of Chan [2007] and several recent
dissertations and researches (see Part I) led to the list of literature displayed in the reference list (ap-
pendix A).
493 Data gathering for field research
“Big brains and a small desire will never get far... smaller brains and big desire will get you further” Best advice received by A.G. Lafley (Procter & Gamble), source: Fortune
Data gathering for field research The data gathering for field research uses case research, survey research and short survey research.
For the non longitudinal field research data has been collected on:
– The level of BIA within the measured population
– The degree of ITO within the measured population
– Factors of influence of ITO on BIA
– Contingency factors
To measure the level of BIA(S) several measurement & observation methods are available. Most often
these are available as industry surveys. I chose the Luftman measurement method and added the ITO
factors to complete the research methodology. This choice is described in part III and IV of this disser-
tation. The parts added to the Luftman method with regards to ITO characteristics and contingency
factors were added after literature research and discussion with the expert panel.
3.1 Data gathering for survey and short survey researchData was gathered using survey and short survey research. This difference was made to create the
possibility for a broader perspective. With the survey research a more detailed view can be made. The
short survey was used to gather extra responses during seminars and creates the possibility for fur-
ther comparison. For the survey and short survey research, the targeted population must have good
insights in business and/or IT on several subjects (communication, governance, IT, etc.). Therefore, it
is assumed that higher and middle management has, or at least should have this insight where, on
average, end users don’t. It is also assumed that BIA challenges are less in small organisations where
both business & IT responsibility is limited to only one person or just a few. Therefore, small organisa-
tions (less than 50 employees) are excluded from this research. The results of this category have been
processed for comparison purposes only.
3
50 Part II – Research Design
Concluding: The population for the non longitudinal survey exists of higher/middle management
with business and/or IT responsibility in large and medium sized mainly Dutch based organisations.
The internal IT supplying organisations (managing the applicable outsource parties) as well as their
business ‘clients’ were addressed in the survey; they were identified by introducing questions asking
their function and role with regard to IT.
For the data gathering, an online survey was used, sent to a large group of organisations using the
database of (Dutch based) www.bitti.nl (>8,000 respondents), www.bita-center.com (>10,000 re-
spondents), requests on LinkedIn groups (list of groups in Appendix B) and Twitter (Twitter messages
from @BITTInl). In this approach several risks can be identified. The risks of this approach and the
counter measurements are described in part V of this dissertation.
3.2 Data gathering for case researchThe survey method was used for all attending organisations. Next to this measurement method, a
limited number of these organisations were measured using a case approach. Both measurement
methods are part of the field research. Besides the survey method the case oriented approach col-
lected also (extra) data on:
– ITO characteristics and BIA factors
– Level of BIA and ITO (BIAS)
– Influences of ITO characteristics on BIA
– Contingency factors
The literature research delivered several characteristics of ITO which were found important for the
client/provider relationship and delivery performance (described in part IV). The characteristics found
were transferred into measurement questions and a five point Likert scale was created for most of the
questions.
Due to the complexity of the questions, these were not sent to the organisations. Instead a semi-
structured interview with the IT responsible (CIO / IT manager) was held to obtain the right informa-
tion and to complete the answers, with the help of the contracts and knowledge of the IT responsi-
ble person. Using this approach, the working method was equal for all cases and less dependent on
the knowledge of the respondent (IT responsible).
Based upon the answers a result gathering sheet was filled in and sent to the respondent to test if the
right information was gathered. Responses were analysed and the sheet was updated or not.
The data needed for the contingency factors was partly available via desk research and partly gath-
ered via the organisations using survey, interview and workshop (see chapter 3.2.2). The questions
asked with regard to contingency factors are described in part VI.
3.2.1 Summary gathering dataThe data was gathered via several ways. Figure 2 provides a short summary of the data gathering.
The influences of the BIA factors identified are inventoried using the Luftman measurement method.
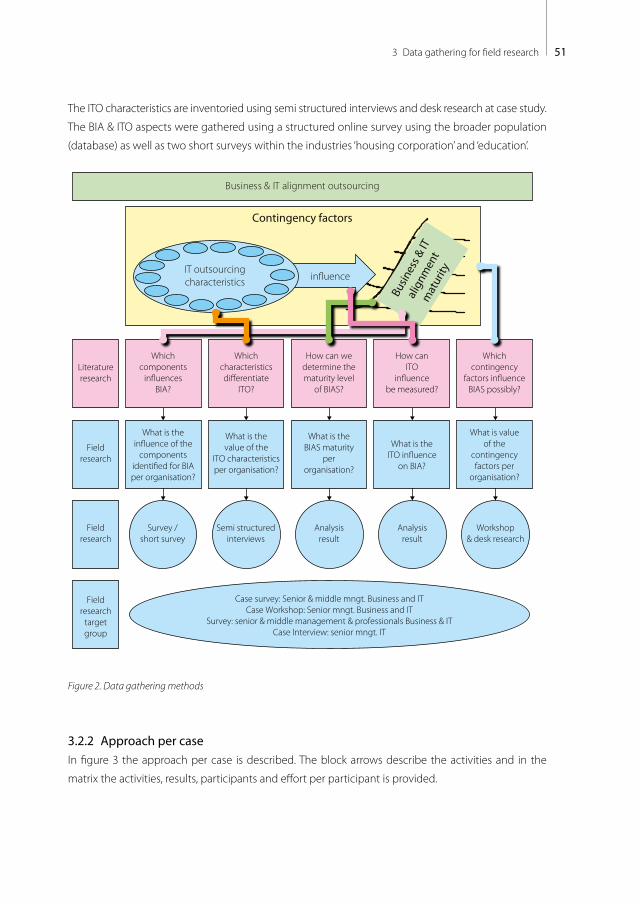
513 Data gathering for field research
The ITO characteristics are inventoried using semi structured interviews and desk research at case study.
The BIA & ITO aspects were gathered using a structured online survey using the broader population
(database) as well as two short surveys within the industries ‘housing corporation’ and ‘education’.
Business & IT alignment outsourcing
Contingency factors
Busin
ess &
ITal
ignm
ent
mat
urityIT outsourcing
characteristics in�uence
Literatureresearch
Whichcomponents
in�uences BIA?
Whichcharacteristics di�erentiate
ITO?
How can we determine the maturity level
of BIAS?
How can ITO
in�uence be measured?
Whichcontingency
factors in�uenceBIAS possibly?
Fieldresearch
Fieldresearch
Fieldresearch
targetgroup
What is thein�uence of the
componentsidenti�ed for BIA per organisation?
What is the value of the
ITO characteristicsper organisation?
What is the BIAS maturity
perorganisation?
What is the ITO in�uence
on BIA?
What is value of the
contingencyfactors per
organisation?
Survey /short survey
Semi structuredinterviews
Analysisresult
Case survey: Senior & middle mngt. Business and ITCase Workshop: Senior mngt. Business and IT
Survey: senior & middle management & professionals Business & ITCase Interview: senior mngt. IT
Analysisresult
Workshop& desk research
Figure 2. Data gathering methods
3.2.2 Approach per caseIn figure 3 the approach per case is described. The block arrows describe the activities and in the
matrix the activities, results, participants and effort per participant is provided.
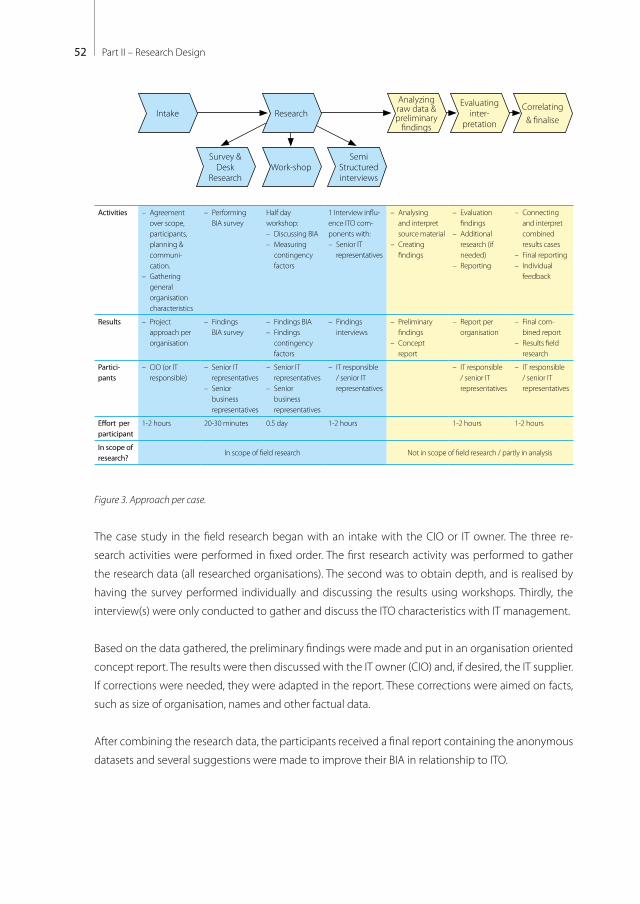
52 Part II – Research Design
Intake Research
Analyzing raw data & preliminary
findings
Evaluatinginter-
pretation
Correlating & finalise
Survey & Desk
ResearchWork-shop
SemiStructured interviews
Activities – Agreement over scope, participants, planning & communi-cation.
– Gathering general organisation characteristics
– Performing BIA survey
Half day workshop:– Discussing BIA– Measuring
contingency factors
1 Interview influ-ence ITO com-ponents with:– Senior IT
representatives
– Analysing and interpret source material
– Creating findings
– Evaluation findings
– Additional research (if needed)
– Reporting
– Connecting and interpret combined results cases
– Final reporting– Individual
feedback
Results – Project approach per organisation
– Findings BIA survey
– Findings BIA– Findings
contingency factors
– Findings interviews
– Preliminary findings
– Concept report
– Report per organisation
– Final com-bined report
– Results field research
Partici-pants
– CIO (or IT responsible)
– Senior IT representatives
– Senior business representatives
– Senior IT representatives
– Senior business representatives
– IT responsible / senior IT representatives
– IT responsible / senior IT representatives
– IT responsible / senior IT representatives
Effort per participant
1-2 hours 20-30 minutes 0.5 day 1-2 hours 1-2 hours 1-2 hours
In scope of research?
In scope of field research Not in scope of field research / partly in analysis
Figure 3. Approach per case.
The case study in the field research began with an intake with the CIO or IT owner. The three re-
search activities were performed in fixed order. The first research activity was performed to gather
the research data (all researched organisations). The second was to obtain depth, and is realised by
having the survey performed individually and discussing the results using workshops. Thirdly, the
interview(s) were only conducted to gather and discuss the ITO characteristics with IT management.
Based on the data gathered, the preliminary findings were made and put in an organisation oriented
concept report. The results were then discussed with the IT owner (CIO) and, if desired, the IT supplier.
If corrections were needed, they were adapted in the report. These corrections were aimed on facts,
such as size of organisation, names and other factual data.
After combining the research data, the participants received a final report containing the anonymous
datasets and several suggestions were made to improve their BIA in relationship to ITO.
Part IIIBusiness &
IT alignment Components
Contingency factors
Busin
ess &
ITal
ignm
ent
mat
urityIT outsourcing
characteristics in�uence

54 Part III – Business & IT alignment Components
55Contents
Contents
1 Introduction 57
2 Introducing framework for identifying BIA components 592.1 BIA adds value 59
2.2 BIA is a fuzzy complex process and changes over time 60
2.3 BIA measurement methods 63
2.4 Identifying BIA components using the Luftman framework 66
3 Identified components within BIA framework 693.1 Communication 69
3.1.1 Literature research 70
3.1.2 Sub components identified 70
3.2 Competency / value measurement 71
3.2.1 Literature research 71
3.2.2 Sub components identified 72
3.3 Governance 73
3.3.1 Literature research 73
3.3.2 Sub components identified 74
3.4 Partnership 75
3.4.1 Literature research 75
3.4.2 Sub components identified 76
3.5 Scope & Architecture 77
3.5.1 Literature research 77
3.5.2 Sub components identified 78
3.6 Skills 78
3.6.1 Literature research 79
3.6.2 Sub components identified 79
4 Summary 81

56 Part III – Business & IT alignment Components

571 Introduction
“Simplify a problem, this way the essence is reached both for content and communication” Best advice received from Carole Thate (managing director Cruyff foundation).
Source Intermediair (3/12/2009)
IntroductionThis part discusses the components impacting BIA. This part is targeted at identifying determining
components for BIA based upon the following research question (see part I): Which components influ-
ence BIA? A definition of BIA was provided in part I.
This part of the dissertation is literature research based. The combined list of journals for BIA which
were selected is provided in part II. From the selected journals articles were selected of the last five
years based upon the key words “Business & IT alignment” and “alignment”. The articles selected are
described in the paragraphs outlining the theory regarding BIA in this part. A number of articles from
other journals were added based upon the relation with the scope and architecture of my research.
Next to the selected articles, I used dissertations on BIA such as [Poels, 2006] and [Tapia, 2009]. These
journals and literature are the basis of my research. In my years of practice and during my research, I
found subject related articles and literature (e.g. [Luftman, 2003], [Hinssen, 2009], etc.) which I used as
well; these are mentioned where applicable.
This part of the dissertation describes the components that influence BIA based upon the literature
research (figure 1). The BIA measurement model of Luftman was chosen, this choice and its underly-
ing components are described in chapter two. In chapter three the components are compared with
the results of the literature research and their usage in the BIAS research is described.
Contingency factors
Busin
ess &
ITal
ignm
ent
mat
urityIT outsourcing
characteristics in�uence
Figure 1 Highlighted is the area as discussed in this part.
1

58 Part III – Business & IT alignment Components
592 Introducing framework for identifying BIA components
“Do you want to be guided by everything coming at you, or are you going to decide what you find important?” Best advice received from Matthijs Bierman (CEO Triodos bank). Source Intermediair)
Introducing framework for identifying BIA components
After introduction of the strategic BIA model by Henderson & Venkatraman [Henderson, 1993], which
stated that it is necessary to choose which BIA perspective is needed, much research has been con-
ducted on BIA [Chan, 2007]. First, the importance of BIA for organisations will be stressed. Secondly,
the reasoning behind the choice for the measurement method of Luftman will be explained. Thirdly,
the broad reach of BIA will be discussed using the Luftman model and the used components will be
discussed more thoroughly as well.
2.1 BIA adds value An important assumption is that improving BIA will add value for organisations and therefore re-
search on this topic might add value. The added value of BIA has been measured for the banking
industry in terms Return on Assets (ROA) [Floyd, 1990] and Return on Investments (ROI), [Poels, 2006].
The added value of BIA is also measured for small & medium manufacturing organisations [Byrd,
2006], [Cragg, 2002], banks [Pollalis, 2003], and overall [Chan, 1997], [Chan, 2006], [Tallon, 2007]. Next
to the perspective of industries also the region and country perspective was subject of research on
added value of BIA. Next to region [Luftman, 2006] the countries US, Canada, NL and Israel [Zviran,
1990] were researched, as well as others. They all stated a positive and significant relationship be-
tween BIA and added value or perceived business performance [Sabherwal, 2001]. Pollalis [2003]
even showing, within the banking industry, that banks with consistent levels of strategic BIA process
and output will perform significantly better than other similar banks.
BIA adds value to organisations!
2

60 Part III – Business & IT alignment Components
Another area of research is about ‘how to achieve BIA?’ with the focus on whether managers should
invest in BIA [Huff, 1999] using the BIA model of Henderson & Venkatraman or the 7-S model [Bra-
dach, 1996] or other. They discuss that BIA is not a one-time activity, but a continuous process [Burn,
1997], [Henderson, 1992], and several interventions, some more successful than others, can be used
to improve BIA [Poels, 2006].
But there are also a few reactions to be found stating that the original thinking in BIA is outdated.
Smaczny [2001] and Hinssen [2008] discuss that the BIA is not the appropriate paradigm for man-
aging IT in organisations today. Due to the increased changes in organisational environment and
increased turbulence the original BIA thinking no longer holds. The world has become more reactive
and responsive. Both authors suggest that fusion, which means IT and business are completely inte-
grated, should be considered. The main mentioned differences, according to the authors is: there are
no longer separate plans for business and IT, but only one strategic plan and one set of operational
plans. Currently there has been no research found that supports this thinking and change. Luftman
[2003] described that “when discussing BIA, terms such as harmony, linkage, fusion, fit, match, and inte-
gration are frequently used synonymously with the term BIA…it does not matter the objective is to ensure
that the organisational strategies adapt harmoniously”.
2.2 BIA is a fuzzy complex process and changes over timeComparable to Luftman’s remark that there is no silver BIA bullet Peppard and Breu [Peppard, 2003]
and Rondinelli et al [2001] view BIA as a fuzzy, complex indeterminate process and a challenge start-
ed two decades ago when looking at the IT issues, at that point in time [Niederman, 1991]. Rockart et
al. [1996] described eight imperatives for the new IT organisation: (1) achieve two-way strategic BIA;
(2) develop effective relationships with line management; (3) deliver and implement new systems; (4)
build and manage infrastructure; (5) re-skill the IT organisation; (6) manage vendor partnerships; (7)
build high performance; and (8) redesign and manage the federal IT organisation. The authors elabo-
rate on two-way strategic BIA as meaning that just as the business strategy should influence the IT,
the IT should influence the business strategy. This influence should go both ways.
A major and known framework on managing IT adequately for organisations was made in the theory
of the Nolan stages [Gibson, 1974], [Nolan, 1992], [Derksen, 2008]. This framework shows that chang-
es in new eras require new methods of managing IT and those changes can influence the BIA, un-
derpinning the statement that BIA is a complex process and needs to be addressed constantly. The
Nolan stages first started in 1973 and have been updated since. The Nolan’s stages theory is possibly
the most well known and well spread model on the orientation of IT organisations in this time period.
There is a link with the BIA question where Henderson & Venkatraman discuss the Strategic BIA; the
Nolan stages discuss the supply and demand perspective of IT already in 1973. Besides this link, direct
related links can be found in changes in organisational structure as part of governance [Luftman,
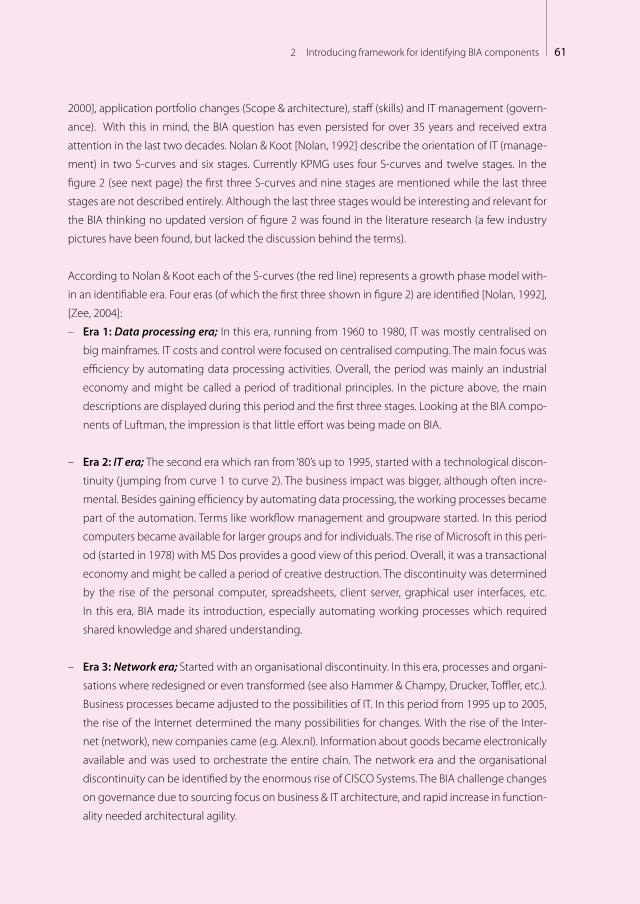
612 Introducing framework for identifying BIA components
2000], application portfolio changes (Scope & architecture), staff (skills) and IT management (govern-
ance). With this in mind, the BIA question has even persisted for over 35 years and received extra
attention in the last two decades. Nolan & Koot [Nolan, 1992] describe the orientation of IT (manage-
ment) in two S-curves and six stages. Currently KPMG uses four S-curves and twelve stages. In the
figure 2 (see next page) the first three S-curves and nine stages are mentioned while the last three
stages are not described entirely. Although the last three stages would be interesting and relevant for
the BIA thinking no updated version of figure 2 was found in the literature research (a few industry
pictures have been found, but lacked the discussion behind the terms).
According to Nolan & Koot each of the S-curves (the red line) represents a growth phase model with-
in an identifiable era. Four eras (of which the first three shown in figure 2) are identified [Nolan, 1992],
[Zee, 2004]:
– Era 1: Data processing era; In this era, running from 1960 to 1980, IT was mostly centralised on
big mainframes. IT costs and control were focused on centralised computing. The main focus was
efficiency by automating data processing activities. Overall, the period was mainly an industrial
economy and might be called a period of traditional principles. In the picture above, the main
descriptions are displayed during this period and the first three stages. Looking at the BIA compo-
nents of Luftman, the impression is that little effort was being made on BIA.
– Era 2: IT era; The second era which ran from ‘80’s up to 1995, started with a technological discon-
tinuity (jumping from curve 1 to curve 2). The business impact was bigger, although often incre-
mental. Besides gaining efficiency by automating data processing, the working processes became
part of the automation. Terms like workflow management and groupware started. In this period
computers became available for larger groups and for individuals. The rise of Microsoft in this peri-
od (started in 1978) with MS Dos provides a good view of this period. Overall, it was a transactional
economy and might be called a period of creative destruction. The discontinuity was determined
by the rise of the personal computer, spreadsheets, client server, graphical user interfaces, etc.
In this era, BIA made its introduction, especially automating working processes which required
shared knowledge and shared understanding.
– Era 3: Network era; Started with an organisational discontinuity. In this era, processes and organi-
sations where redesigned or even transformed (see also Hammer & Champy, Drucker, Toffler, etc.).
Business processes became adjusted to the possibilities of IT. In this period from 1995 up to 2005,
the rise of the Internet determined the many possibilities for changes. With the rise of the Inter-
net (network), new companies came (e.g. Alex.nl). Information about goods became electronically
available and was used to orchestrate the entire chain. The network era and the organisational
discontinuity can be identified by the enormous rise of CISCO Systems. The BIA challenge changes
on governance due to sourcing focus on business & IT architecture, and rapid increase in function-
ality needed architectural agility.
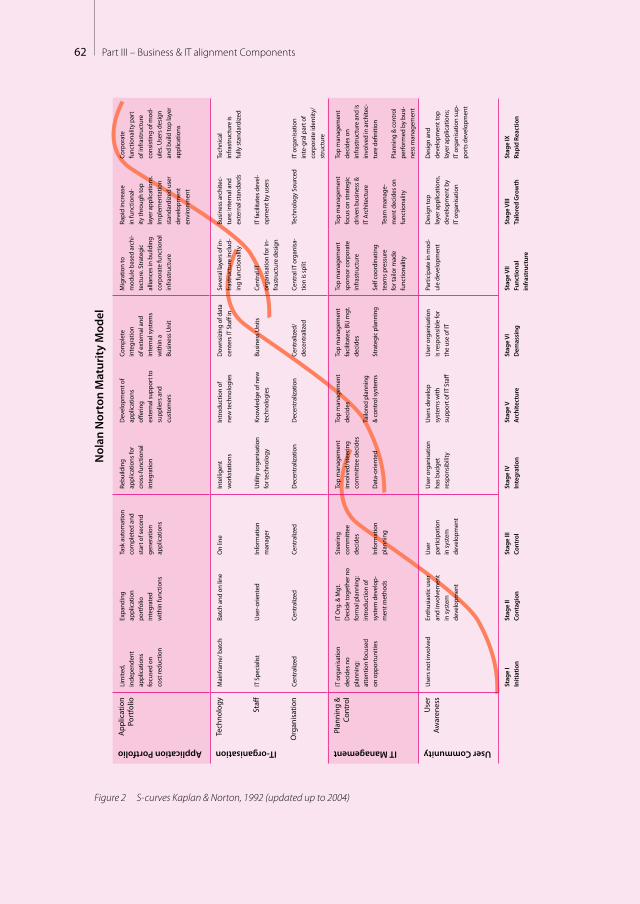
62 Part III – Business & IT alignment Components
Application Portfolio
App
licat
ion
Port
folio
Li
mite
d,in
depe
nden
tap
plic
atio
nsfo
cuse
d on
co
st re
duct
ion
Expa
ndin
gap
plic
atio
npo
rtfo
lioin
tegr
ated
with
in fu
nctio
ns
Task
aut
omat
ion
com
plet
ed a
nd
star
t of s
econ
dge
nera
tion
appl
icat
ions
Rebu
ildin
gap
plic
atio
ns fo
r cr
oss-
func
tiona
lin
tegr
atio
n
Dev
elop
men
t of
appl
icat
ions
off
erin
gex
tern
al su
ppor
t to
supp
liers
and
cu
stom
ers
Com
plet
e in
tegr
atio
nof
ext
erna
l and
in
tern
al sy
stem
s w
ithin
a
Busi
ness
Uni
t
Mig
ratio
n to
m
odul
e ba
sed
arch
i-te
ctur
e. S
trat
egic
al
lianc
es in
bui
ldin
g co
rpor
ate
func
tiona
l in
frast
ruct
ure
Rapi
d in
crea
se
in fu
nctio
nal-
ity th
roug
h to
p la
yer a
pplic
atio
ns.
Impl
emen
tatio
n st
anda
rdiz
ed u
ser
deve
lopm
ent
envi
ronm
ent
Corp
orat
e fu
nctio
nalit
y pa
rt
of in
frast
ruct
ure
cons
istin
g of
mod
-ul
es. U
sers
des
ign
and
build
top
laye
r ap
plic
atio
ns
IT-organisation
Tech
nolo
gy
Staff
Org
anis
atio
n
Mai
nfra
me/
bat
ch
IT S
peci
alis
t
Cent
raliz
ed
Batc
h an
d on
line
Use
r-or
ient
ed
Cent
raliz
ed
On
line
Info
rmat
ion
man
ager
Cent
raliz
ed
Inte
llige
ntw
orks
tatio
ns
Util
ity o
rgan
isat
ion
for t
echn
olog
y
Dec
entr
aliz
atio
n
Intr
oduc
tion
of
new
tech
nolo
gies
Know
ledg
e of
new
te
chno
logi
es
Dec
entr
aliz
atio
n
Dow
nsiz
ing
of d
ata
cent
ers I
T St
aff in
Busi
ness
Uni
ts
Cent
raliz
ed/
dece
ntra
lized
Seve
ral l
ayer
s of i
n-fra
stru
ctur
e in
clud
-in
g fu
nctio
nalit
y
Cent
ral I
T or
gani
satio
n fo
r in-
frast
ruct
ure
desi
gn
Cent
ral I
T or
gani
sa-
tion
is sp
lit
Busi
ness
arc
hite
c-tu
re; i
nter
nal a
nd
exte
rnal
stan
dard
s
IT fa
cilit
ates
dev
el-
opm
ent b
y us
ers
Tech
nolo
gy S
ourc
ed
Tech
nica
l in
frast
ruct
ure
is
fully
stan
dard
ized
IT o
rgan
isat
ion
inte
-gra
l par
t of
corp
orat
e id
entit
y/st
ruct
ure
IT Management
Plan
ning
&
Cont
rol
IT o
rgan
isat
ion
deci
des n
o pl
anni
ng:
atte
ntio
n fo
cuse
d on
opp
ortu
nitie
s
IT O
rg. &
Mgt
.D
ecid
e to
geth
er n
o fo
rmal
pla
nnin
g:
intr
oduc
tion
of
syst
em d
evel
op-
men
t met
hods
Stee
ring
com
mitt
eede
cide
s
Info
rmat
ion
plan
ning
Top
man
agem
ent
invo
lved
/ste
erin
gco
mm
ittee
dec
ides
Dat
a-or
ient
ed
Top
man
agem
ent
deci
des
Tailo
red
plan
ning
&
cont
rol s
yste
ms
Top
man
agem
ent
faci
litat
es; B
U m
gt.
deci
des
Stra
tegi
c pl
anni
ng
Top
man
agem
ent
spon
sor c
orpo
rate
in
frast
ruct
ure
Self
coor
dina
ting
team
s pre
ssur
e fo
r tai
lor m
ade
func
tiona
lity
Top
man
agem
ent
focu
s on
stra
tegi
c dr
iven
bus
ines
s &
IT A
rchi
tect
ure
Team
man
age-
men
t dec
ides
on
func
tiona
lity
Top
man
agem
ent
deci
des o
n in
frast
ruct
ure
and
is
invo
lved
in a
rchi
tec-
ture
defi
nitio
n
Plan
ning
& c
ontr
ol
perf
orm
ed b
y bu
si-
ness
man
agem
ent
User Community
Use
r Aw
aren
ess
Use
rs n
ot in
volv
ed
Enth
usia
stic
use
ran
d in
volv
emen
t in
syst
em
deve
lopm
ent
Use
rpa
rtic
ipat
ion
in sy
stem
deve
lopm
ent
Use
r org
anis
atio
nha
s bud
get
resp
onsi
bilit
y
Use
rs d
evel
opsy
stem
s with
supp
ort o
f IT
Staff
Use
r org
anis
atio
nis
resp
onsi
ble
for
the
use
of IT
Part
icip
ate
in m
od-
ule
deve
lopm
ent
Des
ign
top
laye
r app
licat
ions
, de
velo
pmen
t by
IT o
rgan
isat
ion
Des
ign
and
deve
lopm
ent t
op
laye
r app
licat
ions
;IT
org
anis
atio
n su
p-po
rts d
evel
opm
ent
Stag
e I
Initi
atio
n St
age
IICo
ntag
ion
Stag
e III
Cont
rol
Stag
e IV
Inte
grat
ion
Stag
e V
Arc
hite
ctur
e St
age
VI
Dem
assi
ngSt
age
VII
Func
tiona
l in
fras
truc
ture
Stag
e VI
IITa
ilore
d G
row
th
Stag
e IX
Ra
pid
Reac
tion
Nol
an N
orto
n M
atur
ity
Mod
el
Figure 2 S-curves Kaplan & Norton, 1992 (updated up to 2004)

632 Introducing framework for identifying BIA components
– Era 4: Eco era; Since approximately 2005, technology has adapted in shared infrastructures, sup-
ports economies of expertise, using gaming as a marketing platform (e.g. SecondLife). Mobile
technologies (RFID, IPhone, IPad, Nintendo DS, personal area networks, etc.) are being used for
several purposes. And looking at the US president elections in 2008, it can be said that the use of
internet (email, chat rooms, YouTube, social network sites (Hyves, LinkedIn, Twitter, Plaxo) helped
the elected president Obama tremendously. In summary Obama used the eco era and the current
societal discontinuity. Although the economy was the most important issue in 2008, Obama used
social technology and gained the largest election funding in history despite the poor economy.
During this era, the BIA challenge might shift as well. Long term planning might indeed be based
on one plan instead of Business & IT strategy as separate plans [Smacny, 2001]. The concept of BIA
continues to support the BIA objective: adding value to the business. Underlying sub criteria as
one plan, instead of two, are supporting the statement that BIA is a fuzzy, complex and continu-
ous process.
The current technology era is the eco era where the number possible relations as well as the ways
to communicate increases rapidly leading to new possibilities and new challenges.
BIA questions have existed as long as IT has become part of the economy. Even in the articles of
Nolan [1973] the questions on supply and demand (as part of the BIA) were asked. When looking at
the eras mentioned above, the BIA question might be shifted as well and is therefore persistent. The
current trend “cloud computing” might lead to a new shift or even a new era.
The influencing components of BIA are hereafter described in more detail using the six main criteria
of Luftman.
2.3 BIA measurement methodsIn 1992 Henderson & Venkatraman [1992], [1993] introduced the concept of BIA. Henderson devel-
oped a model called ‘strategic BIA model’. The model developed was aimed at conceptualising BIA
and control strategic management of IT which is pictured in figure 3.

64 Part III – Business & IT alignment Components
Business Strategy
BusinessScope
Business
Inte
rnal
Exte
rnal
ITFunctional Integration
Stra
tegi
c �t
BusinessGovernance
DistinxtiveCompetencies
Business Strategy
TechnologyScope
ITGovernance
SystemicCompetencies
Business Infrastructure and Processes
AdministrativeInfrastructure
SkillsProcesses
IT Infrastructure and Processes
ITInfrastructure
SkillsProcesses
Figure 3 Alignment model, bron: Henderson & Venkatraman 1992
The strategic BIA model of Henderson & Venkatraman uses four perspectives in which BIA can be
realised. These four development perspectives are:
Execution of business strategy
Transformation using technology
Using ICT potential
Optimising ICT services
After the introduction in 1992, BIA has been one of the top 5 IT management concerns [Derksen,
2011], [Luftman, 2011] and is therefore a major area of interest in both industry and science [Chan,
2007]. Research on BIA has been performed by several researchers and practitioners. An annotated
652 Introducing framework for identifying BIA components
bibliography has been performed by Chan & Reich [Chan, 2007].
Multiple measurement models have been developed for assessing BIA. Tapia [2009, p. 62-73] com-
pared the following BIA measurement models:
– Luftman [2003], based upon practical experience and both science & industry research;
– CIO Council’s [2000] guide, an architecture-specific BIA and assessment guide developed by a
consortium of CIOs of US federal executive agencies;
– Duffy [2001], a measurement method having a reliable partnership between business and IT as
fundamental starting point;
– De Koning et al [2002], a ten question measurement mechanism to identify the level of BIA;
– Van der Raadt et al [2005], a multi-dimensional assessment tool for architecture BIA and maturity
based upon the expectation of a correlation between architecture BIA and architecture maturity;
– COBIT [ISACA, 2006], a control framework with explicit support to assess the BIA;
– Van der Zee et al [2001], an assessment tool also based upon expected correlation between archi-
tecture and BIA;
– Sanches Ortiz [2003], an instrument measuring the level of BIA based upon twenty questions.
Related to the research questions as described in part I, main elements for my research are: focus
on BIA, the possibility to measure the level of BIA, the possibility to relate to ITO and identification of
aspects / areas / domains with regard to influence of ITO at BIA.
The BIA measurement models of CIO Council [2000], Duffy [2001], van der Raadt [2005], van der Zee
[2001], although practical, are limited for my research target using architecture or partnership as a prima-
ry area of focus. The BIA measurement tool of De Koning and Van der Marck [2002] would provide limited
data on the research questions with regard to the components of influence on BIA. The tool uses only ten
questions and is more industry based than science based and also relationship oriented (one area focus).
COBIT offers a control framework which is used for linking business goals to IT goals [Derksen, 2008].
This framework exists of 34 IT processes divided in 4 domains. In order to realise organisational goals,
7 quality criteria must be met. The 34 processes consist of 318 detailed control objectives. Although
COBIT also offers a maturity assessment, this detailed approach would be extremely time consuming
within the research objectives. Secondly, COBIT is audit oriented and is primarily IT governance fo-
cussed [Tapia, 2009]. Thirdly, the four identified domains are the major processes rather than domains.
The BIA measurement method of Ortiz [2003] measures the BIA between business and IT strategic
objectives in twenty questions. The BIA measurement method of Ortiz lacks the usage of domains
and does not use levels of maturity like COBIT, van der Zee and others.
Based on the analysis of the several BIA measurement methods as well as comparison possibilities,
the Strategic BIA Model of Luftman [2003] provides an assessment instrument which uses five levels
of BIA maturity and is based upon six domains (discussed hereafter) and provides within the six do-
mains over forty questions with extended descriptions of the needed capabilities in BIA. The earlier
66 Part III – Business & IT alignment Components
discussed focus architecture, as well as relationship (partnership), are two of the six domains. Also
the main focus of COBIT (governance) is one of the six domains. The other ones are communications,
added value measurement and skills. Another more practical reason to choose the measurement
method of Luftman is the possibility to compare the results with an international benchmark devel-
oped by Luftman as well as several science results [Poels, 2006]. Within the chosen research approach,
the strategic BIA measurement method of Luftman has been adapted to measure the level of BIA.
The findings from Chan & Reich [Chan, 2007] about the chosen framework regarding the presented
model in Luftman [2000] were: “This paper develops a method to evaluate the strategic BIA maturity of
an organisation. Mature BIA is achieved when business and other functions (i.e., HR, marketing, etc.) adapt
their strategies with IT. The authors propose five levels of strategic BIA maturity: (1) Initial/Ad Hoc Process;
(2) Committed Process; (3) Established Focused Process; (4) Improved/Managed Process; and (5) Optimized
Process. Each stage is evaluated based on the following criteria: communications maturity, competency/
value measurement maturity, governance maturity, partnership maturity, scope and architecture maturity,
and skills maturity. Each of these criteria is assessed individually and then an overall level of maturity is
given. It is important that this assessment is done in a team of both business and IT executives. The goal of
the maturity assessment is to provide the organisation with areas of improvement. Most organisations are
at level 2 of strategic BIA maturity.”
Chan & Reich stated that the model was primarily conceptual, but also later used in a longitudinal
study within the 500+ organisations [Luftman, 1999].
2.4 Identifying BIA components using the Luftman framework Luftman [1996], [2003] and [2007] created a broad perspective on BIA using several influencing com-
ponents. In the description of the influencing components, other research is adopted.
Luftman [2000] described six main criteria for improving BIA (further description in paragraphs hereafter):
– Communications;
Measures the effectiveness of the exchange of ideas, knowledge and information between IT and
businessorganisations, enabling both to clearly understand and achieve the company’s strategies,
plans, business and IT environments, risks and priorities.
– Competency / Value measurements;
Uses balanced measurements (including metrics for assessing both IT and business. The metrics
should be easy to understand, derived jointly by IT and business stakeholders, and prescribe a
clear direction for improvement) to demonstrate the contributions of information technology and
the IT organisation to the business in terms that both the business and IT understand and accept.
– Governance;
Defines who has the authority to make IT decisions and what processes IT and business managers
use at strategic, tactical, and operational levels to set IT priorities to allocate IT resources.
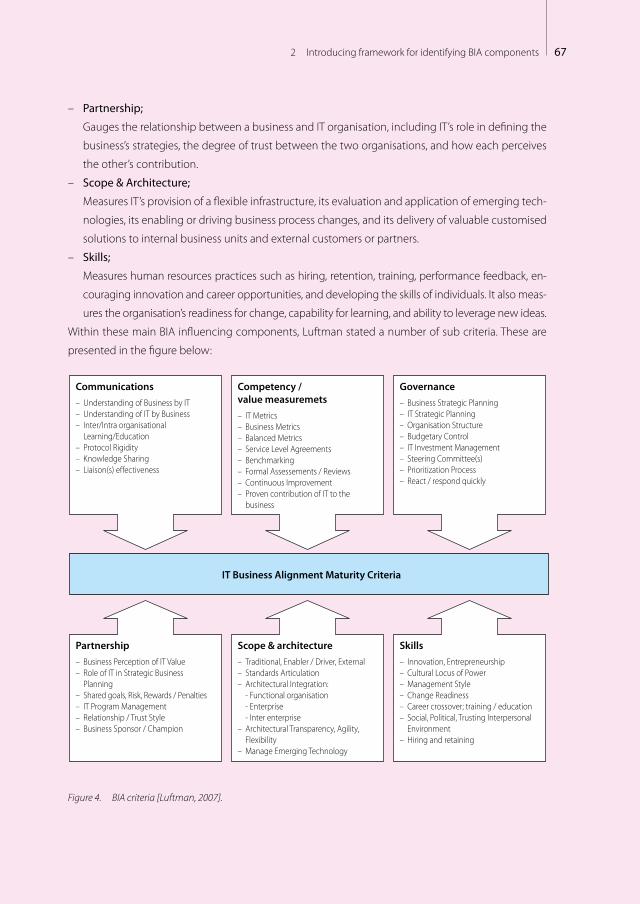
672 Introducing framework for identifying BIA components
– Partnership;
Gauges the relationship between a business and IT organisation, including IT’s role in defining the
business’s strategies, the degree of trust between the two organisations, and how each perceives
the other’s contribution.
– Scope & Architecture;
Measures IT’s provision of a flexible infrastructure, its evaluation and application of emerging tech-
nologies, its enabling or driving business process changes, and its delivery of valuable customised
solutions to internal business units and external customers or partners.
– Skills;
Measures human resources practices such as hiring, retention, training, performance feedback, en-
couraging innovation and career opportunities, and developing the skills of individuals. It also meas-
ures the organisation’s readiness for change, capability for learning, and ability to leverage new ideas.
Within these main BIA influencing components, Luftman stated a number of sub criteria. These are
presented in the figure below:
Communications– Understanding of Business by IT– Understanding of IT by Business– Inter/Intra organisational Learning/Education– Protocol Rigidity– Knowledge Sharing– Liaison(s) e�ectiveness
Competency / value measuremets – IT Metrics– Business Metrics– Balanced Metrics– Service Level Agreements– Benchmarking– Formal Assessements / Reviews– Continuous Improvement– Proven contribution of IT to the business
Governance – Business Strategic Planning– IT Strategic Planning– Organisation Structure– Budgetary Control– IT Investment Management– Steering Committee(s)– Prioritization Process– React / respond quickly
Partnership – Business Perception of IT Value– Role of IT in Strategic Business Planning– Shared goals, Risk, Rewards / Penalties– IT Program Management– Relationship / Trust Style– Business Sponsor / Champion
Scope & architecture – Traditional, Enabler / Driver, External– Standards Articulation– Architectural Integration: - Functional organisation - Enterprise - Inter enterprise– Architectural Transparency, Agility, Flexibility– Manage Emerging Technology
Skills – Innovation, Entrepreneurship– Cultural Locus of Power– Management Style– Change Readiness– Career crossover; training / education– Social, Political, Trusting Interpersonal Environment– Hiring and retaining
IT Business Alignment Maturity Criteria
Figure 4. BIA criteria [Luftman, 2007].

68 Part III – Business & IT alignment Components

693 Identified components within BIA framework
“You should immediately begin where you are good at” Best advice received from Maarten Ducrot
(independent management consultant). Source Intermediair
Identified components within BIA framework
Six main criteria, as defined by Luftman, are used as a basis of the BIA framework looking at the com-
ponents of influence on BIA. These are being used to identify other components and sub compo-
nents from the literature research as described in this chapter.
The sub components identified (figure 3) are addressed in this chapter. Each sub component is test-
ed within the literature research. The results are displayed in tables for each BIA component. The sub
component received a colour based upon the results of the literature research. In the added table
column ‘supporting literature’ a colour coding is added:
– green means outstanding support / substantial evidence found for this sub component during
literature research (multiple references, > 2 references and/or substantial evidence within litera-
ture found);
– yellow means average support (one or two references found for this sub component and / or
average evidence (e.g. mentioned) within literature found);
– red means little to poor support found during literature research (one or no literature reference
with little or no support).
In addition to the colour coding, remarks were made where necessary.
3.1 CommunicationCommunication and shared knowledge (business specific) are positively
related to BIA [Hartung, 2000]. Based upon the Strategic BIA Model (SAM)
Henderson [1992] and Maes [1999] concluded that communication is
important in BIA as the use and sharing of internal and external informa-
3

70 Part III – Business & IT alignment Components
tion is necessary for BIA to occur, especially since most communication in the modern organisation
utilises some form of technology. Maes adjusted the SAM model and added communication to it, as
well as other aspects.
3.1.1 Literature researchUnderstanding of IT by the business (managers), understanding of business by IT using the same
language [Scanlon, 2003] as well as knowledge sharing are important for BIA. Bassellier et al [2003]
found that IT knowledge and IT experience explain 34% of the variance in a manager’s decision to
champion an IT project. Creating managers to champion an IT project means more business involve-
ment in IT (BIA). The importance of a shared domain of knowledge between Business & IT for BIA is
also supported by Reich et al. [2000].
Knowledge sharing might even create a competitive advantage, Kearns [2003]. Result findings indi-
cate that information intensity plays a significant role in the involvement of the planning, leading to
increased knowledge sharing. A shared domain of knowledge should be at micro level while there is
a significant and positive relation in cognitive commonality of business & IT executives and the levels
of BIA [Tan, 2006] using inter/intra organisational learning and education help.
Another important aspect is that realising this influencing component might be not that easy. Camp-
bell [2005] noted that although BIA literature calls for improving communications with (senior) busi-
ness managers, gaining senior management commitment to IT strategies, and increasing business
knowledge of IT managers. For many managers these recommendations/requirements may be total-
ly beyond the bounds of possibility due to the lack of comprehension and the lack of control. Despite
this warning, communications as a component of influence in the level of BIA is highly supported by
previous research and literature.
3.1.2 Sub components identifiedCommunication is an identified BIA component of influence. Luftman uses sub components. These
identified sub components are shortly described below including reference to supporting previous
research and other literature.
Table 1. Sub components of Communications
Sub componentShort description [Luftman, 2003] Supporting literature Remarks
Understanding of Business by IT
To what extent does IT understand the organisation’s business environ-ment (e.g., its customers, competi-tors, processes, partners / alliances)
[Basselier, 2004], [Scan-lon, 2003], [Reich, 2000], [Tan, 2006], [Preston, 2008], [Kearns, 2006]
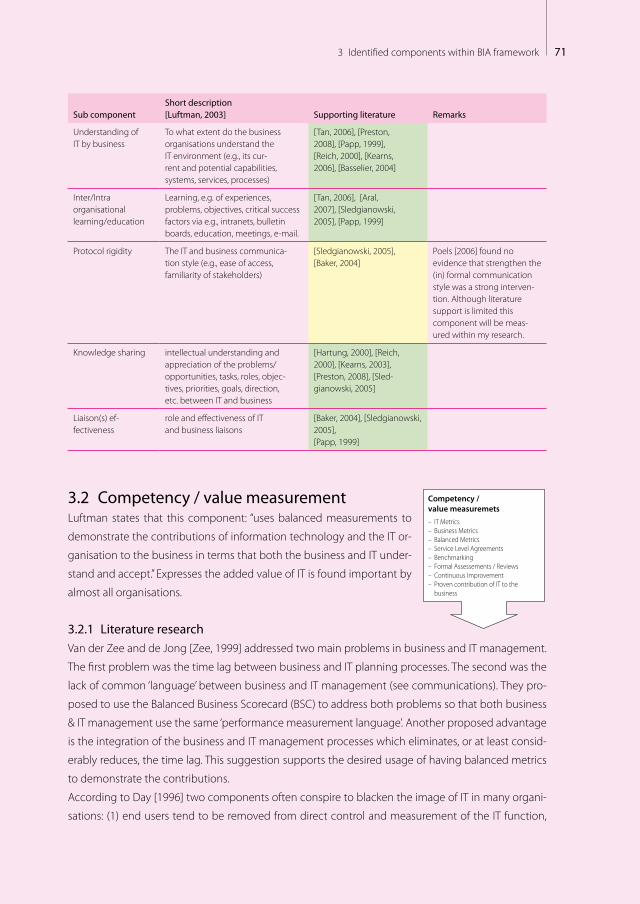
713 Identified components within BIA framework
Sub componentShort description [Luftman, 2003] Supporting literature Remarks
Understanding of IT by business
To what extent do the business organisations understand the IT environment (e.g., its cur-rent and potential capabilities, systems, services, processes)
[Tan, 2006], [Preston, 2008], [Papp, 1999], [Reich, 2000], [Kearns, 2006], [Basselier, 2004]
Inter/Intra organisational learning/education
Learning, e.g. of experiences, problems, objectives, critical success factors via e.g., intranets, bulletin boards, education, meetings, e-mail.
[Tan, 2006], [Aral, 2007], [Sledgianowski, 2005], [Papp, 1999]
Protocol rigidity The IT and business communica-tion style (e.g., ease of access, familiarity of stakeholders)
[Sledgianowski, 2005], [Baker, 2004]
Poels [2006] found no evidence that strengthen the (in) formal communication style was a strong interven-tion. Although literature support is limited this component will be meas-ured within my research.
Knowledge sharing intellectual understanding and appreciation of the problems/opportunities, tasks, roles, objec-tives, priorities, goals, direction, etc. between IT and business
[Hartung, 2000], [Reich, 2000], [Kearns, 2003], [Preston, 2008], [Sled-gianowski, 2005]
Liaison(s) ef-fectiveness
role and effectiveness of IT and business liaisons
[Baker, 2004], [Sledgianowski, 2005], [Papp, 1999]
3.2 Competency / value measurementLuftman states that this component: “uses balanced measurements to
demonstrate the contributions of information technology and the IT or-
ganisation to the business in terms that both the business and IT under-
stand and accept.” Expresses the added value of IT is found important by
almost all organisations.
3.2.1 Literature researchVan der Zee and de Jong [Zee, 1999] addressed two main problems in business and IT management.
The first problem was the time lag between business and IT planning processes. The second was the
lack of common ‘language’ between business and IT management (see communications). They pro-
posed to use the Balanced Business Scorecard (BSC) to address both problems so that both business
& IT management use the same ‘performance measurement language’. Another proposed advantage
is the integration of the business and IT management processes which eliminates, or at least consid-
erably reduces, the time lag. This suggestion supports the desired usage of having balanced metrics
to demonstrate the contributions.
According to Day [1996] two components often conspire to blacken the image of IT in many organi-
sations: (1) end users tend to be removed from direct control and measurement of the IT function,
Competency / value measuremets – IT Metrics– Business Metrics– Balanced Metrics– Service Level Agreements– Benchmarking– Formal Assessements / Reviews– Continuous Improvement– Proven contribution of IT to the
business

72 Part III – Business & IT alignment Components
and (2) they tend to see IT as overhead and administration, an uncontrollable cost with no appreci-
able advantage. Day suggests measurement that falls into three categories:
– Key measurements benchmarking the IT function against industry averages;
– BIA measurements to measure if the IT function is doing the right things and operating effectively
to support the organisational goals;
– Operational measurements that help determine whether specific IT functions are operating ef-
ficiently and doing things right, with tactical effectiveness for the business.
Tallon et al. [2000] defined four types in which corporate goals for IT can be classified: unfocused, op-
erations focused, market focused and dual focused. Their research resulted in confirmation that these
goals are useful indicators of payoffs from IT, in that executives in firms with more focused goals for
IT, perceive greater payoffs from IT across the value chain. Their research also underlined the added
value of BIA investment with regard to higher perceived levels of IT business value.
Papp [1999] states that there is a need to develop some sort of financial measure of BIA. He defined
several financial measurements of BIA and concluded that organisations should “never stop the assess-
ment of BIA within the firm. It is a continuous, dynamic process requiring constant monitoring”.
3.2.2 Sub components identifiedCompetence / value measurement as a component of influence in the level of BIA is highly sup-
ported by previous research and literature. The following sub components were identified:
Table 2. Sub components of Competency / Value measurements
Sub component Short description [Luftman, 2003] Supporting literature Remarks
IT metrics the metrics and processes used to measure IT’s contribution to the business.
[Papp, 1999], [Day, 1996], [Pearl-man, 2004]
Business metrics use of business metrics to measure contribution to the business
[Pearlman, 2004] Within the BIA literature there was no evidence found, but is used with-in my research since it is a good indi-cator of what the business side does.
Balanced metrics
use of integrated IT and busi-ness metrics to measure IT’s contribution to the business
[Papp, 1999], [Zee, 1999], [Day, 1996], [Pearlman, 2004]
Service level agreements
usage of SLA’s on technical and/or relational aspects between business & IT
[Sledgianowski, 2005] Poels [2006] found no evidence that usage of SLA was a strong intervention to improve BIA. The sub component has been used within my research.
Benchmarking informal practices such as informal inter-views, literature searches, company visits, etc., and formal practices such as envi-ronmental scanning, data gathering and analysis, determining best practices, etc
[Day, 1996], [Papp, 1999]

733 Identified components within BIA framework
Formal assess-ments / reviews
assessment and review of IT investments [Sledgianowski, 2005], [Papp, 1999]
Continuous improvement
IT-business continuous improve-ment practices (e.g., quality circles, quality reviews) and effective-ness measures are in place
[Sledgianowski, 2005] See also inter/intra organisational learning at Communications.
Proven contribu-tion of IT to the business
the proven contribution of the IT function to the business
This score is a direct satisfaction score of the organisation towards IT. In the results of the Luft-man measurements this point is significantly higher than the other measuring points. It is adopted for comparison reasons, but seems to be a poor indicator. This indicator is also more a result of good BIA than an influencing component.
3.3 GovernanceGovernance is a favourite research item when reviewing the number
of articles addressing governance with regards to BIA based on Chan
[2007]. According to Luftman governance “defines who has the authority
to make IT decisions and what processes IT and business managers use at
strategic, tactical, and operational levels to set IT priorities to allocate IT re-
sources.” Governance related to IT is both an IT and business issue and
should be linked and include a demand site IT governance [Broadbent,
2005].
3.3.1 Literature researchGovernance choices do influence BIA and even the performance [Leiblein, 2002]. Henderson and
Sifonis [Henderson, 1988] propose three phases for effective IT planning, in order: business strategy
formulation, IT strategy formulation and action planning / resource allocation. They identified the
need for cooperative behaviour in the planning process as well as recognition that this is an iterative
process. The executive involvement of business in business and IT strategic planning is significantly
associated with progressive use of IT [Jarvenpaa, 1991], [Hunt, 1993] and the organisational perfor-
mance [Das, 1991], [Beats, 1996]. Other good practices and pitfalls based upon strategic business & IT
planning has been identified [Louis, 1998], [Kranendonk, 1991].
The ‘fusion’ adapters describe that phase one and two should be integrated [Smaczny, 2001], [Hins-
sen, 2008]. The responsiveness from IT strategy formulation towards business strategy formulation
differs per organisation [Tan, 1995], depending on its product/market area. Jarvenpaa [1990] con-
cluded that the industry leaders make more aggressive use of IT and ex-post IT strategy BIA (aligning
IT strategy after the business strategy has been defined) has been found unsuccessful in the past
[Beats, 1992]. The fusion thought has been processed in the Luftman framework from the beginning
Governance – Business Strategic Planning– IT Strategic Planning– Organisation Structure– Budgetary Control– IT Investment Management– Steering Committee(s)– Prioritization Process– React / respond quickly
74 Part III – Business & IT alignment Components
and cannot be seen as a completely different approach, merely as statements on parts of the BIA
research.
There is a strong relationship between strategic orientation and IT organisational structure, especially
its degree of centralisation according to Tavakolian [1989] who used Miles and Snow’s [1978] typol-
ogy of strategic orientation (defenders have a conservative strategy whereas prospectors have an
aggressive strategy and analyzers have a moderately competitive strategy). User departments in con-
servative (strategy) organisations have less control over their IT functions, whereas user departments
in more aggressive (strategy) organisations have much more control. Depending on the IT function
(e.g. technical management) the IT can be better centralised / decentralised or federative [Brown,
1994].
In the governance related literature, the leadership of the CIO is often addressed as an important
component [Pearlman, 2004]. Within the Luftman model, this is addressed under management style
within the main criteria Skills. Pearlman [2004] provided some practical directions stating that there
are 10 priorities with BIA and more specific governance related points:
1. Lead, don’t just manage.
2. Understand the fundamentals of your environment.
3. Create a vision for how IT will build your organisation’s success. You must have a vision for achiev-
ing your colleagues’ business goals using technology.
4. Shape and inform expectations for an IT-enabled enterprise. You need to work with your col-
leagues to identify the key business needs, strategies and drivers, and then articulate the IT guide-
lines necessary to address those needs.
5. Create clear and appropriate IT governance. Effective governance enables you to weave together
business and IT strategies and to consistently build credibility and trust.
6. Weave business and IT strategy together. IT strategy means developing and actively managing
your IT portfolio to deliver success as measured by your colleagues.
7. Build a new IS (information system) organisation – one that is leaner and better focused.
8. Build and nurture a high-performing team in your IS organisation.
9. Manage the new enterprise and IT risks.
10. Communicate IS performance in business relevant language. You must know and communicate
how IT is contributing to shareholder value and the IT value indicators that are directly linked to
business value measures.
3.3.2 Sub components identifiedGovernance as a component of influence in the level of BIA is highly supported by previous research
and literature. The following sub components were identified:

753 Identified components within BIA framework
Table 3. Sub components of governance
Sub componentShort description [Luftman, 2003] Supporting literature Remarks
Business strategic planning
strategic business plan-ning with IT participation
[Henderson, 1988, 1996], [Jarvenpaa, 1991] [Louis, 1998], [Kranendonk, 1991], [Gupta, 1997], [Das, 1991], [Beats, 1996], [Kearns, 2003], [Bergeron, 2004], [Tallon, 2007]
Supporting literature of first two sub components were merged while these variables are in all cases mentioned in close relationship with each other.
IT strategic planning strategic IT planning with business participation
Organisation structure
organisation structure of the IT function (centralised, decentralised, federated)
[Tavakolian,1989], [Brown, 1994], [Bergeron, 2004], [Luft-man, 2007], [Bergeron, 2004]
In the research of Luft-man, de federated struc-ture was best for BIA
Budgetary control How is IT seen: Cost centre, investment centre, profit centre
[Gupta, 1997], [Poels, 2006],
IT investment management
IT investment decisions on: costs, productivity, process enabler, business effectives or competitive advantage
[Poels, 2006], [Pearl-man, 2004], [Broadbent, 2005], [Kearns, 2006]
Steering committees IT steering committee(s) with senior level IT and business management participation
[Jarvenpaa, 1991], [Sledgianow-ski, 2005], [Broadbent, 2005]
Prioritisation process how IT projects are prioritised [Jarvenpaa, 1991], [Broadbent, 2005]
React/respond quickly
IT’s capability to act upon changing business needs
[Tan, 1995], [Jarvenpaa, 1993]
3.4 PartnershipLuftman introduces partnership as: “the relationship between a business
and IT organisation, including IT’s role in defining the business’s strate-
gies, the degree of trust between the two organisations, and how each
perceives the other’s contribution.”
3.4.1 Literature researchCollaborative culture (norms of behaviour, shared values for all employees at every level aiming to-
gether toward a common goal) and strong leadership (see skills) are, according to 1100 executives, the
ingredients to successful BIA [Baker, 2004]. Johnston [1988] identified five internal components that
support IT strategy: leadership, integration of IT and strategy function, direct contact between IT and
the business, capability in the IT function, and mechanisms available for the line function to influence IT.
The informal organisation is more important than previously thought for achieving BIA. Underlying
culture reinforces the informal organisation [Chan, 2002]. In a study of Kearns et al. [Kearns, 2000]
the result supported the assumption that IT & business plan BIA results in the use of IT resources for
competitive advantage.
Partnership – Business Perception of IT Value– Role of IT in Strategic Business
Planning– Shared goals, Risk, Rewards / Penalties– IT Program Management– Relationship / Trust Style– Business Sponsor / Champion
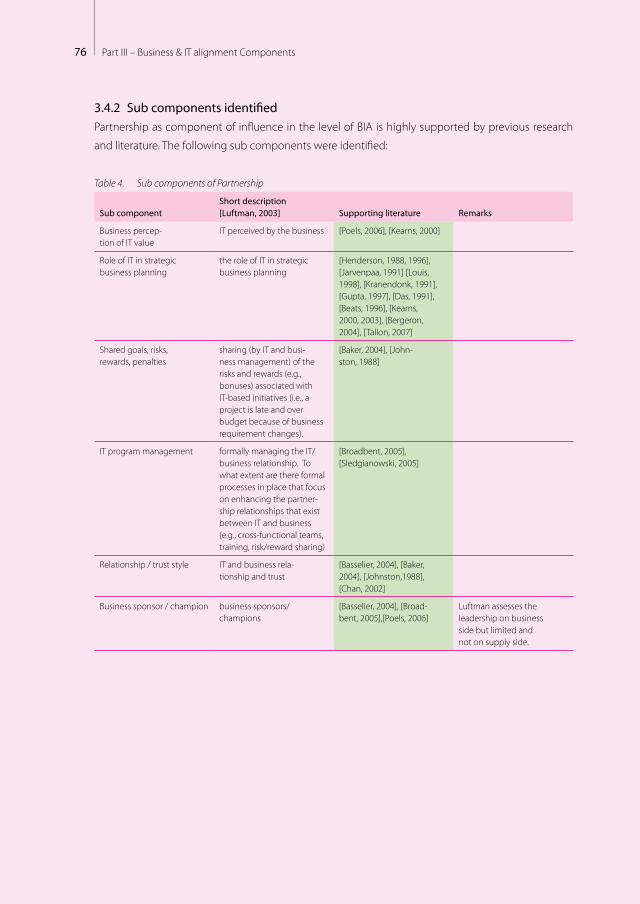
76 Part III – Business & IT alignment Components
3.4.2 Sub components identifiedPartnership as component of influence in the level of BIA is highly supported by previous research
and literature. The following sub components were identified:
Table 4. Sub components of Partnership
Sub componentShort description [Luftman, 2003] Supporting literature Remarks
Business percep-tion of IT value
IT perceived by the business [Poels, 2006], [Kearns, 2000]
Role of IT in strategic business planning
the role of IT in strategic business planning
[Henderson, 1988, 1996], [Jarvenpaa, 1991] [Louis, 1998], [Kranendonk, 1991], [Gupta, 1997], [Das, 1991], [Beats, 1996], [Kearns, 2000, 2003], [Bergeron, 2004], [Tallon, 2007]
Shared goals, risks, rewards, penalties
sharing (by IT and busi-ness management) of the risks and rewards (e.g., bonuses) associated with IT-based initiatives (i.e., a project is late and over budget because of business requirement changes).
[Baker, 2004], [John-ston, 1988]
IT program management formally managing the IT/business relationship. To what extent are there formal processes in place that focus on enhancing the partner-ship relationships that exist between IT and business (e.g., cross-functional teams, training, risk/reward sharing)
[Broadbent, 2005], [Sledgianowski, 2005]
Relationship / trust style IT and business rela-tionship and trust
[Basselier, 2004], [Baker, 2004], [Johnston,1988], [Chan, 2002]
Business sponsor / champion business sponsors/champions
[Basselier, 2004], [Broad-bent, 2005],[Poels, 2006]
Luftman assesses the leadership on business side but limited and not on supply side.
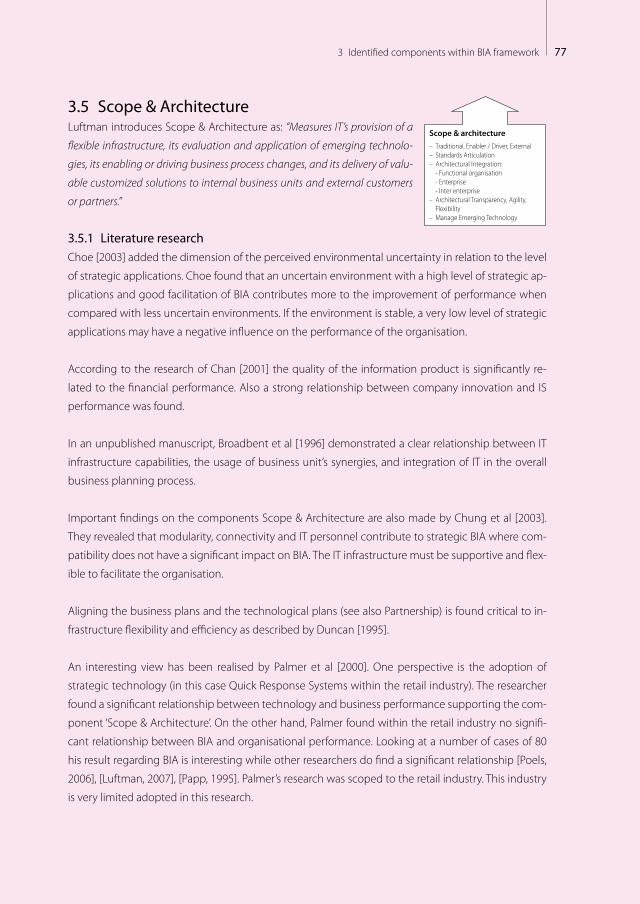
773 Identified components within BIA framework
3.5 Scope & ArchitectureLuftman introduces Scope & Architecture as: “Measures IT’s provision of a
flexible infrastructure, its evaluation and application of emerging technolo-
gies, its enabling or driving business process changes, and its delivery of valu-
able customized solutions to internal business units and external customers
or partners.”
3.5.1 Literature researchChoe [2003] added the dimension of the perceived environmental uncertainty in relation to the level
of strategic applications. Choe found that an uncertain environment with a high level of strategic ap-
plications and good facilitation of BIA contributes more to the improvement of performance when
compared with less uncertain environments. If the environment is stable, a very low level of strategic
applications may have a negative influence on the performance of the organisation.
According to the research of Chan [2001] the quality of the information product is significantly re-
lated to the financial performance. Also a strong relationship between company innovation and IS
performance was found.
In an unpublished manuscript, Broadbent et al [1996] demonstrated a clear relationship between IT
infrastructure capabilities, the usage of business unit’s synergies, and integration of IT in the overall
business planning process.
Important findings on the components Scope & Architecture are also made by Chung et al [2003].
They revealed that modularity, connectivity and IT personnel contribute to strategic BIA where com-
patibility does not have a significant impact on BIA. The IT infrastructure must be supportive and flex-
ible to facilitate the organisation.
Aligning the business plans and the technological plans (see also Partnership) is found critical to in-
frastructure flexibility and efficiency as described by Duncan [1995].
An interesting view has been realised by Palmer et al [2000]. One perspective is the adoption of
strategic technology (in this case Quick Response Systems within the retail industry). The researcher
found a significant relationship between technology and business performance supporting the com-
ponent ‘Scope & Architecture’. On the other hand, Palmer found within the retail industry no signifi-
cant relationship between BIA and organisational performance. Looking at a number of cases of 80
his result regarding BIA is interesting while other researchers do find a significant relationship [Poels,
2006], [Luftman, 2007], [Papp, 1995]. Palmer’s research was scoped to the retail industry. This industry
is very limited adopted in this research.
Scope & architecture – Traditional, Enabler / Driver, External– Standards Articulation– Architectural Integration:
- Functional organisation- Enterprise- Inter enterprise
– Architectural Transparency, Agility,Flexibility
– Manage Emerging Technology

78 Part III – Business & IT alignment Components
Supportive to the importance of the Scope & Architecture component are the findings of Raymond
et al [Raymond, 1995]. They found that IT usage is positively related to performance, relationship busi-
ness/IT management, and sophisticated use of IT. They also found that the environmental aspect of
the organisation is important (contingency component), whereas size of the organisation, as well as
the structure, do not contribute.
3.5.2 Sub components identifiedHaving Scope & Architecture as component of influence in the level of BIA is partly supported by
previous research and literature. The following sub components were identified:
Table 5. Scope & Architecture
Sub componentShort description [Luftman, 2003] Supporting literature Remarks
Traditional / enabler / driver / external
scope of primary IT systems [Sledgianowski, 2005], [Chan, 2001], [Broadbent, 1996], [Chung, 2003], [Palmer, 2000], [Smith, 1998], [Raymond, 1995]
Palmer [2000] described the importance of transactional systems (often traditional).
Standards articulation the articulation of and compliance with IT standards
[Palmer,2000] This aspect is hardly supported and is not expected to contribute but is taken alongside due to possible standards articulation at outsourcing.
Architectural integration the scope of architec-tural integration (functional organisation; enterprise; inter enterprise)
[Sledgianowski, 2005], [Chung, 2003],[Broadbent, 1996]
Architectural transpar-ency, agility, flexibility
the level of disruption caused by business and IT changes (e.g., implementation of a new technology, business process, merger/acquisition).
[Duncan, 1995] Duncan [1995] expresses also the importance of business support.
Manage emerg-ing technology
the scope of IT infrastruc-ture flexibility to business and technology changes
[Choe, 2003], [Chung, 2003], [Duncan, 1995]
Two elements of Scope & Architecture are not outstanding supported by available research.
3.6 Skills Luftman introduces Skills as: “Measures human resources practices, such
as hiring, retention, training, performance feedback, encouraging innova-
tion and career opportunities, and developing the skills of individuals. It also
measures the organisation’s readiness for change, capability for learning, and
ability to leverage new ideas.”
Skills – Innovation, Entrepreneurship– Cultural Locus of Power– Management Style– Change Readiness– Career crossover; training / education– Social, Political, Trusting Interpersonal
Environment– Hiring and retaining
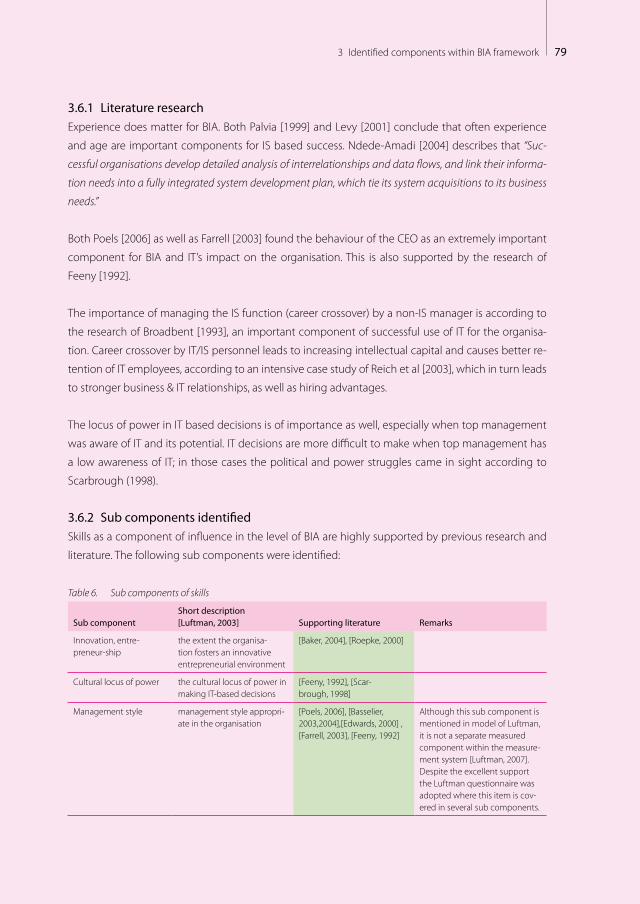
793 Identified components within BIA framework
3.6.1 Literature researchExperience does matter for BIA. Both Palvia [1999] and Levy [2001] conclude that often experience
and age are important components for IS based success. Ndede-Amadi [2004] describes that “Suc-
cessful organisations develop detailed analysis of interrelationships and data flows, and link their informa-
tion needs into a fully integrated system development plan, which tie its system acquisitions to its business
needs.”
Both Poels [2006] as well as Farrell [2003] found the behaviour of the CEO as an extremely important
component for BIA and IT’s impact on the organisation. This is also supported by the research of
Feeny [1992].
The importance of managing the IS function (career crossover) by a non-IS manager is according to
the research of Broadbent [1993], an important component of successful use of IT for the organisa-
tion. Career crossover by IT/IS personnel leads to increasing intellectual capital and causes better re-
tention of IT employees, according to an intensive case study of Reich et al [2003], which in turn leads
to stronger business & IT relationships, as well as hiring advantages.
The locus of power in IT based decisions is of importance as well, especially when top management
was aware of IT and its potential. IT decisions are more difficult to make when top management has
a low awareness of IT; in those cases the political and power struggles came in sight according to
Scarbrough (1998).
3.6.2 Sub components identifiedSkills as a component of influence in the level of BIA are highly supported by previous research and
literature. The following sub components were identified:
Table 6. Sub components of skills
Sub componentShort description [Luftman, 2003] Supporting literature Remarks
Innovation, entre-preneur-ship
the extent the organisa-tion fosters an innovative entrepreneurial environment
[Baker, 2004], [Roepke, 2000]
Cultural locus of power the cultural locus of power in making IT-based decisions
[Feeny, 1992], [Scar-brough, 1998]
Management style management style appropri-ate in the organisation
[Poels, 2006], [Basselier, 2003,2004],[Edwards, 2000] , [Farrell, 2003], [Feeny, 1992]
Although this sub component is mentioned in model of Luftman, it is not a separate measured component within the measure-ment system [Luftman, 2007]. Despite the excellent support the Luftman questionnaire was adopted where this item is cov-ered in several sub components.
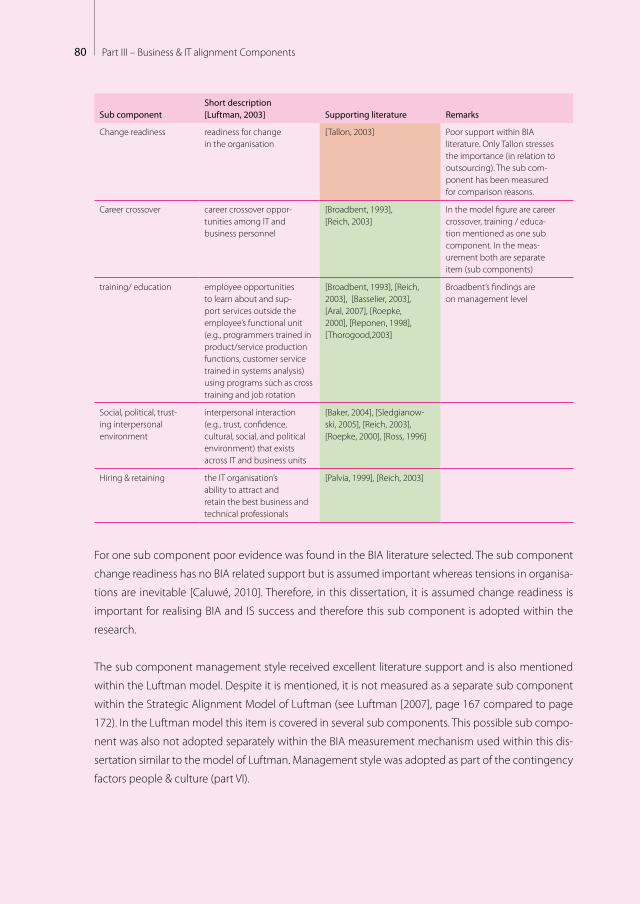
80 Part III – Business & IT alignment Components
Sub componentShort description [Luftman, 2003] Supporting literature Remarks
Change readiness readiness for change in the organisation
[Tallon, 2003] Poor support within BIA literature. Only Tallon stresses the importance (in relation to outsourcing). The sub com-ponent has been measured for comparison reasons.
Career crossover career crossover oppor-tunities among IT and business personnel
[Broadbent, 1993], [Reich, 2003]
In the model figure are career crossover, training / educa-tion mentioned as one sub component. In the meas-urement both are separate item (sub components)
training/ education employee opportunities to learn about and sup-port services outside the employee’s functional unit (e.g., programmers trained in product/service production functions, customer service trained in systems analysis) using programs such as cross training and job rotation
[Broadbent, 1993], [Reich, 2003], [Basselier, 2003], [Aral, 2007], [Roepke, 2000], [Reponen, 1998], [Thorogood,2003]
Broadbent’s findings are on management level
Social, political, trust-ing interpersonal environment
interpersonal interaction (e.g., trust, confidence, cultural, social, and political environment) that exists across IT and business units
[Baker, 2004], [Sledgianow-ski, 2005], [Reich, 2003], [Roepke, 2000], [Ross, 1996]
Hiring & retaining the IT organisation’s ability to attract and retain the best business and technical professionals
[Palvia, 1999], [Reich, 2003]
For one sub component poor evidence was found in the BIA literature selected. The sub component
change readiness has no BIA related support but is assumed important whereas tensions in organisa-
tions are inevitable [Caluwé, 2010]. Therefore, in this dissertation, it is assumed change readiness is
important for realising BIA and IS success and therefore this sub component is adopted within the
research.
The sub component management style received excellent literature support and is also mentioned
within the Luftman model. Despite it is mentioned, it is not measured as a separate sub component
within the Strategic Alignment Model of Luftman (see Luftman [2007], page 167 compared to page
172). In the Luftman model this item is covered in several sub components. This possible sub compo-
nent was also not adopted separately within the BIA measurement mechanism used within this dis-
sertation similar to the model of Luftman. Management style was adopted as part of the contingency
factors people & culture (part VI).
814 Summary
SummaryAfter introduction of a number of BIA measurement methods, the assessment method of Luftman
was chosen. The six components and the forty-one sub components of BIA have been discussed
based upon the literature research.
Seven sub components had poor or average support after performing the literature research. No
new sub components have been found which would be applicable in the BIA measurement method
of Luftman. So no new sub components have been added. Despite the poor (red) or average (yellow)
literature support of some of the sub components in the BIA measurement method of Luftman, all
sub components have been used in the research methodology for comparison reasons.
One sub component (management style) received excellent literature support and is mentioned
within the Luftman assessment method. The sub component is not separately measured within the
Luftman BIA measurement method. In this dissertation the management style is seen as part of the
contingency factor people & culture (part VI).
The linked maturity levels of BIA have not been discussed in this part of the dissertation, but are de-
scribed in part V.
4

82 Part III – Business & IT alignment Components
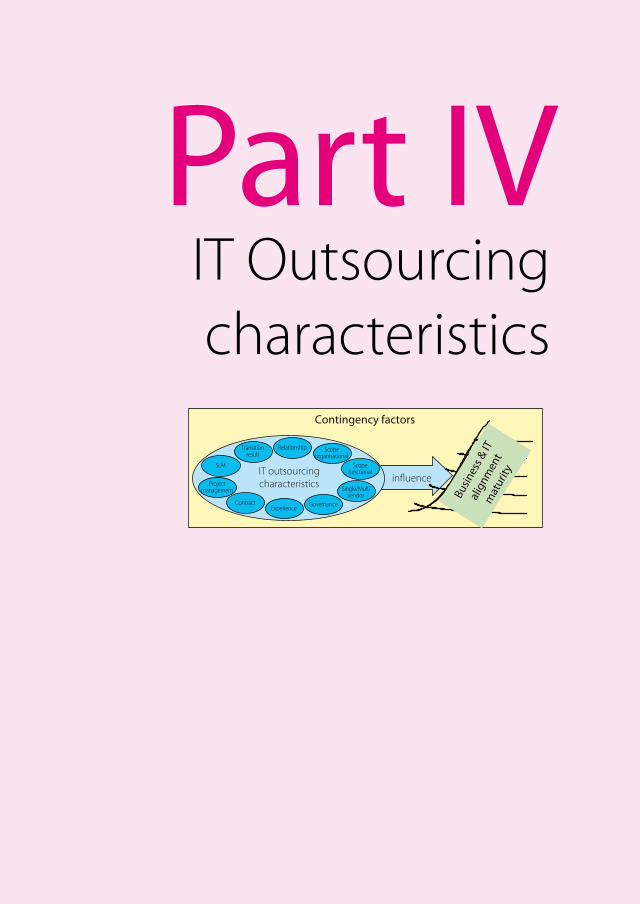
Part IVIT Outsourcing characteristics
Contingency factors
Busin
ess &
ITal
ignm
ent
mat
urityIT outsourcing
characteristics in�uence
Relationship Scopeorganisational
Transitionresult
Scopefunctional
Projectmanagement Single/Multi
vendorGovernanceExperience
Contract
SLM

84 Part IV – IT Outsourcing characteristics
85Contents
Contents
1 Identifying determining factors in ITO 871.1 Literature research 871.2 ITO in historical perspective 88
2 Identified ITO characteristics 912.1 Type of ITO relationship 92
2.1.1 Literature research 922.1.2 ITO characteristic identified 93
2.2 Scope of ITO – organisational 932.2.1 Literature research 932.2.2 ITO characteristic identified 94
2.3 Scope of ITO – functional scope 952.3.1 Literature research 952.3.2 ITO characteristic identified 99
2.4 ITO vendor construction 1002.4.1 Literature research 1002.4.2 ITO characteristic identified 101
2.5 Governance of ITO 1012.5.1 Literature research 1012.5.2 ITO characteristic identified 102
2.6 ITO experience 1032.6.1 Literature research 1032.6.2 ITO characteristic identified 103
2.7 ITO contract 1042.7.1 Literature research 1042.7.2 ITO characteristic identified 105
2.8 ITO project management 1062.8.1 Literature research 1062.8.2 ITO characteristic identified 106
2.9 ITO service (level) management 1072.9.1 Literature research 1072.9.2 ITO characteristic identified 107
2.10 ITO transition result 1082.10.1 Literature research 1082.10.2 ITO characteristic identified 108
3 Summary ITO characteristics 109

86 Part IV – IT Outsourcing characteristics
871 Identifying determining factors in ITO
“Take initiative and responsibility in life itself”
Best advice received from Sabine Uitslag
(member parliament CDA and singer Spinrock). Source Intermediair (17/09/2009)
Identifying determining factors in ITOThis part is targeted at identifying differentiating characteristics of IT Outsourcing (ITO). In order to
reach this, this part aims at answering the following question (see part I):
– Which characteristics differentiate ITO?
1.1 Literature researchWhen performing my research study, I looked for possible factors influencing the BIA in ITO situ-
ations. Findings / factors of influence are described as ITO characteristics and are used in my field
study.
This part of the dissertation is literature research based. The combined list of journals for ITO which
were selected is described in part II. From the selected journals, I reviewed the last five years arti-
cles based upon the key words “IT Outsourcing” and “outsourcing”. The articles selected from the
journals are described in the paragraphs describing the theory regarding ITO below. A number of
articles from other journals were added based upon their relationship with the scope and architec-
ture of my research.
Next to the selected articles, I used dissertations on ITO such as [Beulen, 2000] and [Delen, 2005].
These journals and literature are the basis of my research. In my years of practice and during my re-
search, I found subject related articles and literature (e.g. [Weijers, 2006], [Faas, 2005], [Oosterhaven,
2008], [Gianotten, 2008]) which I used as well; these are mentioned where applicable.
1

88 Part IV – IT Outsourcing characteristics
1.2 ITO in historical perspectiveBeulen [2002] distinguishes four phases in the historical perspective of ITO in the Dutch market:
– Initial;
Up to the mid seventies, most of the IT services were performed by internal IT departments. Char-
acteristics of this phase were: no contracts / service level agreements, central IT budget, IT depart-
ment mostly in the control of the finance director, IT department had an effort obligation (no
result obligation). During this phase there were hardly any attempts to outsource IT.
– Chaos;
During the second phase, starting from the mid seventies, there was a shortage of qualified IT
personnel. The mainframes were (partly) replaced by client server infrastructures or distributed
infrastructures. At the start of this phase, external IT personnel were hired to perform IT services.
These services were covered with short-term contracts and there were no structural relationships
with IT suppliers. The growing need of IT personnel, the growing number of external IT’ers within
an organisation and the large number of projects due to the rapid development of technology
led to increasing costs of IT and sub optimisation within organisations. These developments intro-
duced the next phase.
– Control;
During the nineties, most of the organisations reduced the number of IT suppliers significantly.
Business management made this decision in order to get control of IT and IT costs. The goal was to
get IT more predictable with regard to results and costs. Long term contracts were made with only
one or a few external IT suppliers. For a number of internal IT departments the reason for existence
was part of the discussion. Approximately the following aspects occurred: the internal IT depart-
ment was taken over by an external IT supplier and/or a BIA / cooperation contract was made. Ac-
cording to Beulen, IT is ITO in both situations. Business units became responsible for the IT budget
and information managers reported to business management instead of the financial department.
The IT service supply became more standardised and predictable in both result and costs.
– Market-working;
The number of IT suppliers delivering services to an organisation is growing again in order to stimu-
late competition. This increases the level of quality and decreases the costs. IT services are more
managed as a portfolio. Due to the experience in managing IT suppliers, the fourth phase became
possible. Beulen concluded that for a number of organisations this phase is started; especially for
the larger organisations who already had experience with ITO parts of the IT services in the nineties.
Based on the historical perspective of IT services presented in the previous paragraph and the ITO
challenges, Beulen created a phase model covering the level of control from business management
and the number of IT suppliers delivering the services in order to manage assets and services. This
model is pictured in figure 1.
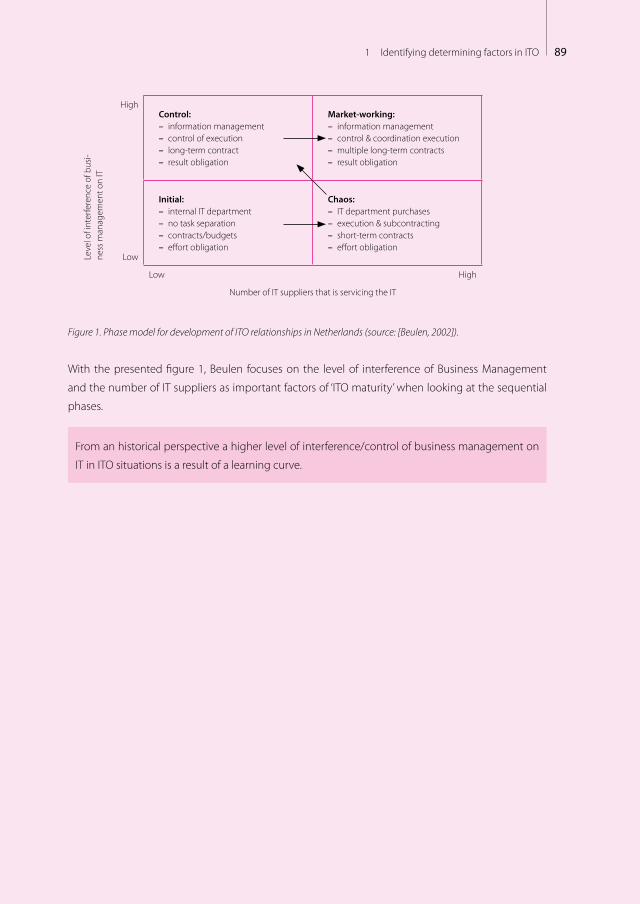
891 Identifying determining factors in ITO
Leve
l of i
nter
fere
nce
of b
usi-
ness
man
agem
ent o
n IT
High
Control: – information management – control of execution – long-term contract – result obligation
Market-working: – information management – control & coordination execution – multiple long-term contracts – result obligation
Low
Initial: – internal IT department – no task separation – contracts/budgets – effort obligation
Chaos: – IT department purchases – execution & subcontracting – short-term contracts – effort obligation
Low High
Number of IT suppliers that is servicing the IT
Figure 1. Phase model for development of ITO relationships in Netherlands (source: [Beulen, 2002]).
With the presented figure 1, Beulen focuses on the level of interference of Business Management
and the number of IT suppliers as important factors of ‘ITO maturity’ when looking at the sequential
phases.
From an historical perspective a higher level of interference/control of business management on
IT in ITO situations is a result of a learning curve.

90 Part IV – IT Outsourcing characteristics
912 Identified ITO characteristics
“How should I know what it costs in Euro’s, determine what is reasonable to you”
Best advice received from Frank Buytendijk (VP Oracle). Source Intermediair
Identified ITO characteristicsIn this chapter the determining ITO characteristics are identified. These characteristics might have an
impact on the BIA based upon the ITO and the business receiving services. In the previous part (Part
III) the BIA components were identified. Reviewing the BIA components and ITO characteristics, an
overlap can be identified. Before identifying single ITO characteristics influencing the BIA and defin-
ing the BIAS measuring instrument for the field study, a number of ITO characteristics are described
in greater detail in this chapter.
As described in part I, the relationship between BIA and ITO is relevant. Separation of business and
IT will influence company performance substantially [Yetton, 1994]. This separation contributes to
a failure of learning from managing IT investments. Organisations need to seek a balance between
centralisation and decentralisation and a focus on costs and corporate standards versus value added
and business driven. So managing ITO in a supplier/client relationship is not an easy task.
The identified ITO characteristics, based upon the literature research, are: Type of ITO relationship,
scope of ITO organisational, scope of ITO functional, experience, contract, project management, ser-
vice (level) management and transition result. These are described in this chapter.
The identified ITO characteristics are not assumed to be of equal importance towards BIA. Part of the
research is to identify which ITO characteristics influence the BIA level. To identify the degree of ITO,
two ITO characteristics are used; these are mentioned in chapter three of this part.
2
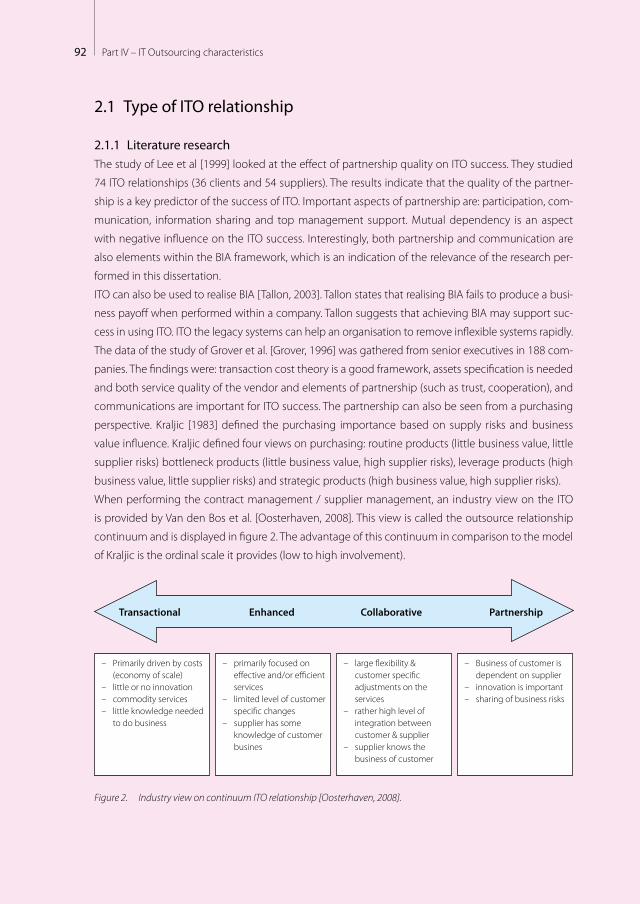
92 Part IV – IT Outsourcing characteristics
2.1 Type of ITO relationship
2.1.1 Literature researchThe study of Lee et al [1999] looked at the effect of partnership quality on ITO success. They studied
74 ITO relationships (36 clients and 54 suppliers). The results indicate that the quality of the partner-
ship is a key predictor of the success of ITO. Important aspects of partnership are: participation, com-
munication, information sharing and top management support. Mutual dependency is an aspect
with negative influence on the ITO success. Interestingly, both partnership and communication are
also elements within the BIA framework, which is an indication of the relevance of the research per-
formed in this dissertation.
ITO can also be used to realise BIA [Tallon, 2003]. Tallon states that realising BIA fails to produce a busi-
ness payoff when performed within a company. Tallon suggests that achieving BIA may support suc-
cess in using ITO. ITO the legacy systems can help an organisation to remove inflexible systems rapidly.
The data of the study of Grover et al. [Grover, 1996] was gathered from senior executives in 188 com-
panies. The findings were: transaction cost theory is a good framework, assets specification is needed
and both service quality of the vendor and elements of partnership (such as trust, cooperation), and
communications are important for ITO success. The partnership can also be seen from a purchasing
perspective. Kraljic [1983] defined the purchasing importance based on supply risks and business
value influence. Kraljic defined four views on purchasing: routine products (little business value, little
supplier risks) bottleneck products (little business value, high supplier risks), leverage products (high
business value, little supplier risks) and strategic products (high business value, high supplier risks).
When performing the contract management / supplier management, an industry view on the ITO
is provided by Van den Bos et al. [Oosterhaven, 2008]. This view is called the outsource relationship
continuum and is displayed in figure 2. The advantage of this continuum in comparison to the model
of Kraljic is the ordinal scale it provides (low to high involvement).
Transactional Enhanced Collaborative Partnership
– Primarily driven by costs (economy of scale)– little or no innovation– commodity services– little knowledge needed
to do business
– primarily focused on e�ective and/or e�cient services
– limited level of customer speci�c changes
– supplier has some knowledge of customer busines
– large �exibility & customer speci�c adjustments on the services
– rather high level of integration between customer & supplier
– supplier knows the business of customer
– Business of customer is dependent on supplier
– innovation is important– sharing of business risks
Figure 2. Industry view on continuum ITO relationship [Oosterhaven, 2008].

932 Identified ITO characteristics
2.1.2 ITO characteristic identifiedTo measure the type of the ITO relationship, I use the continuum ITO relationship [Oosterhaven,
2008]. The ITO characteristic identified is called ‘type of relationship’. The measurement method used
for this ITO characteristic as well as the following ITO characteristics described, will be discussed in
part V of this dissertation.
2.2 Scope of ITO – organisational
2.2.1 Literature researchDifferent scoping of ITO can be identified. The research of Luftman [2002] uses three internal based
sourcing scopes: centralised, decentralised and federated. In the research of Luftman the federated
structure was the most successful structure for a high level BIA and therefore the organisational struc-
ture is an important part of BIAS. Luftman did not compare this with ITO structures, which is a differ-
entiating aspect of this dissertation.
Organisational scope does impact performance. The organisational scope as an element of govern-
ance impacts the performance. Deviation of the optimal governance may impact performance nega-
tively [Leiblein, 2002].
Buijs [2004] also described, in his industry view, mostly internal based organisational structures as dis-
played in figure 3 when discussing Shared Service Centres using an internal perspective: decentral-
ised, centralised, competence centre (comparable to Federated of Luftman) , shared service centre
and (partly) external perspective (ITO) and the service firm.
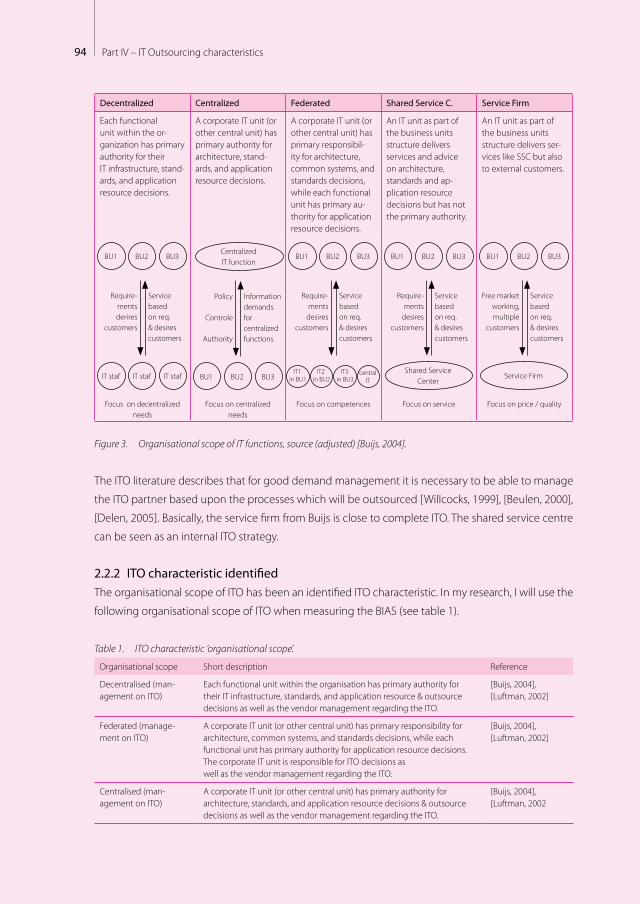
94 Part IV – IT Outsourcing characteristics
Decentralized Centralized Federated Shared Service C. Service Firm
Each functional unit within the or-ganization has primary authority for their IT infrastructure, stand-ards, and application resource decisions.
A corporate IT unit (or other central unit) has primary authority for architecture, stand-ards, and application resource decisions.
A corporate IT unit (or other central unit) has primary responsibil-ity for architecture, common systems, and standards decisions, while each functional unit has primary au-thority for application resource decisions.
An IT unit as part of the business units structure delivers services and advice on architecture, standards and ap-plication resource decisions but has not the primary authority.
An IT unit as part of the business units structure delivers ser-vices like SSC but also to external customers.
BU1 BU2 BU3
Require-ments derires
customers
Service based on req. & desires customers
IT staf IT staf IT staf
CentralizedIT function
Policy
Controle
Authority
Information demands for centralized functions
BU1 BU2 BU3
BU1 BU2 BU3
Require-ments
desires customers
Service based on req. & desires customers
central IT
IT3 in BU3
IT2 in BU2
IT1 in BU1
BU1 BU2 BU3
Require-ments
desires customers
Service based on req. & desires customers
Shared Service Center
BU1 BU2 BU3
Free market working, multiple
customers
Service based on req. & desires customers
Service Firm
Focus on decentralizedneeds
Focus on centralizedneeds
Focus on competences Focus on service Focus on price / quality
Figure 3. Organisational scope of IT functions, source (adjusted) [Buijs, 2004].
The ITO literature describes that for good demand management it is necessary to be able to manage
the ITO partner based upon the processes which will be outsourced [Willcocks, 1999], [Beulen, 2000],
[Delen, 2005]. Basically, the service firm from Buijs is close to complete ITO. The shared service centre
can be seen as an internal ITO strategy.
2.2.2 ITO characteristic identifiedThe organisational scope of ITO has been an identified ITO characteristic. In my research, I will use the
following organisational scope of ITO when measuring the BIAS (see table 1).
Table 1. ITO characteristic ‘organisational scope’.
Organisational scope Short description Reference
Decentralised (man-agement on ITO)
Each functional unit within the organisation has primary authority for their IT infrastructure, standards, and application resource & outsource decisions as well as the vendor management regarding the ITO.
[Buijs, 2004], [Luftman, 2002]
Federated (manage-ment on ITO)
A corporate IT unit (or other central unit) has primary responsibility for architecture, common systems, and standards decisions, while each functional unit has primary authority for application resource decisions.The corporate IT unit is responsible for ITO decisions as well as the vendor management regarding the ITO.
[Buijs, 2004], [Luftman, 2002]
Centralised (man-agement on ITO)
A corporate IT unit (or other central unit) has primary authority for architecture, standards, and application resource decisions & outsource decisions as well as the vendor management regarding the ITO.
[Buijs, 2004], [Luftman, 2002
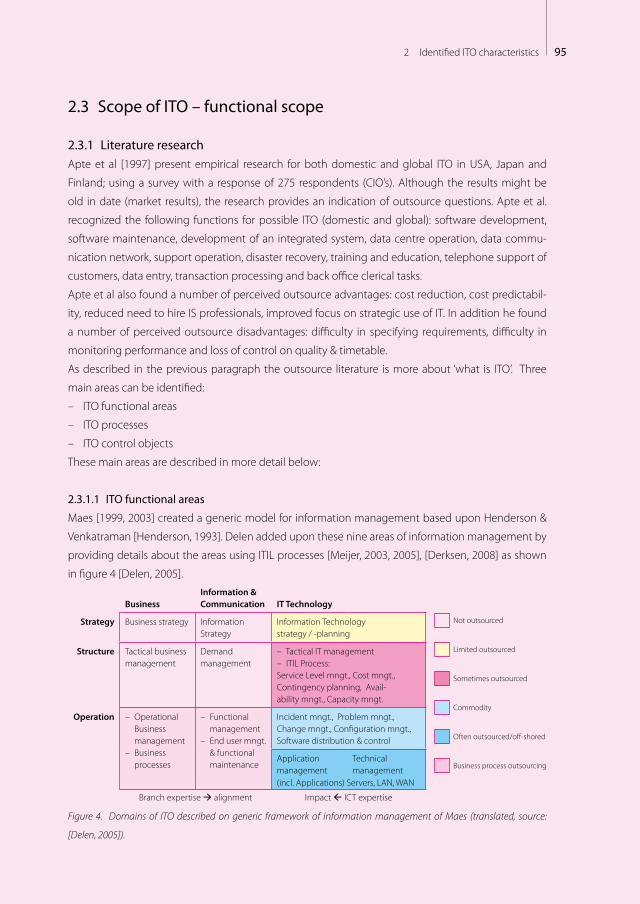
952 Identified ITO characteristics
2.3 Scope of ITO – functional scope
2.3.1 Literature research Apte et al [1997] present empirical research for both domestic and global ITO in USA, Japan and
Finland; using a survey with a response of 275 respondents (CIO’s). Although the results might be
old in date (market results), the research provides an indication of outsource questions. Apte et al.
recognized the following functions for possible ITO (domestic and global): software development,
software maintenance, development of an integrated system, data centre operation, data commu-
nication network, support operation, disaster recovery, training and education, telephone support of
customers, data entry, transaction processing and back office clerical tasks.
Apte et al also found a number of perceived outsource advantages: cost reduction, cost predictabil-
ity, reduced need to hire IS professionals, improved focus on strategic use of IT. In addition he found
a number of perceived outsource disadvantages: difficulty in specifying requirements, difficulty in
monitoring performance and loss of control on quality & timetable.
As described in the previous paragraph the outsource literature is more about ‘what is ITO’. Three
main areas can be identified:
– ITO functional areas
– ITO processes
– ITO control objects
These main areas are described in more detail below:
2.3.1.1 ITO functional areas
Maes [1999, 2003] created a generic model for information management based upon Henderson &
Venkatraman [Henderson, 1993]. Delen added upon these nine areas of information management by
providing details about the areas using ITIL processes [Meijer, 2003, 2005], [Derksen, 2008] as shown
in figure 4 [Delen, 2005].
BusinessInformation & Communication IT Technology
Strategy Business strategy Information Strategy
Information Technology strategy / -planning
Structure Tactical business management
Demand management
– Tactical IT management– ITIL Process:Service Level mngt., Cost mngt., Contingency planning, Avail-ability mngt., Capacity mngt.
Operation – Operational Business management
– Business processes
– Functional management
– End user mngt. & functional maintenance
Incident mngt., Problem mngt., Change mngt., Configuration mngt., Software distribution & control
Application management
Technical management
(incl. Applications) Servers, LAN, WAN
Branch expertise à alignment Impact ß ICT expertise
Figure 4. Domains of ITO described on generic framework of information management of Maes (translated, source:
[Delen, 2005]).
Not outsourced
Limited outsourced
Sometimes outsourced
Commodity
Often outsourced/off-shored
Business process outsourcing
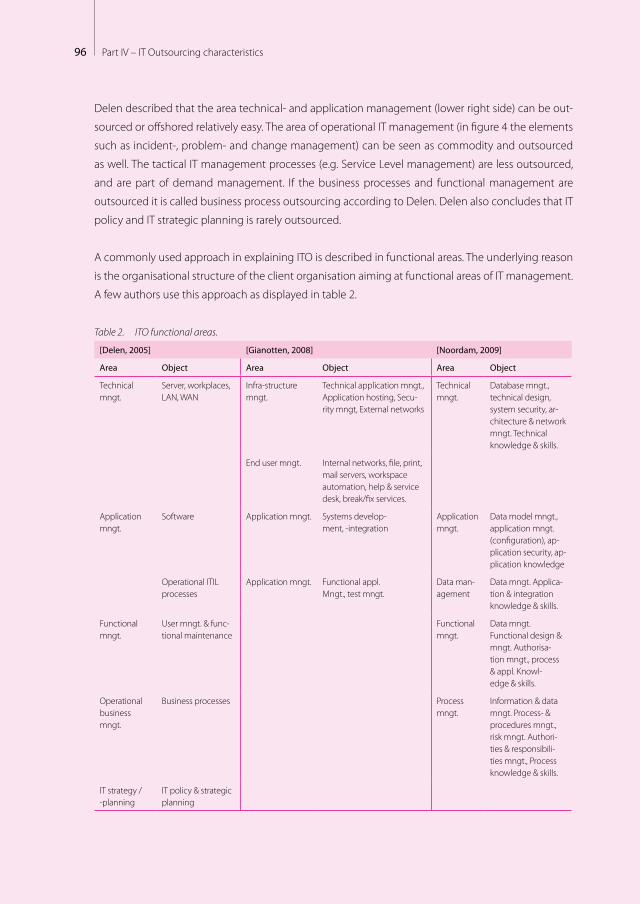
96 Part IV – IT Outsourcing characteristics
Delen described that the area technical- and application management (lower right side) can be out-
sourced or offshored relatively easy. The area of operational IT management (in figure 4 the elements
such as incident-, problem- and change management) can be seen as commodity and outsourced
as well. The tactical IT management processes (e.g. Service Level management) are less outsourced,
and are part of demand management. If the business processes and functional management are
outsourced it is called business process outsourcing according to Delen. Delen also concludes that IT
policy and IT strategic planning is rarely outsourced.
A commonly used approach in explaining ITO is described in functional areas. The underlying reason
is the organisational structure of the client organisation aiming at functional areas of IT management.
A few authors use this approach as displayed in table 2.
Table 2. ITO functional areas.
[Delen, 2005] [Gianotten, 2008] [Noordam, 2009]
Area Object Area Object Area Object
Technical mngt.
Server, workplaces, LAN, WAN
Infra-structure mngt.
Technical application mngt., Application hosting, Secu-rity mngt, External networks
Technical mngt.
Database mngt., technical design, system security, ar-chitecture & network mngt. Technical knowledge & skills.
End user mngt. Internal networks, file, print, mail servers, workspace automation, help & service desk, break/fix services.
Application mngt.
Software Application mngt. Systems develop-ment, -integration
Application mngt.
Data model mngt., application mngt. (configuration), ap-plication security, ap-plication knowledge
Operational ITIL processes
Application mngt. Functional appl. Mngt., test mngt.
Data man-agement
Data mngt. Applica-tion & integration knowledge & skills.
Functional mngt.
User mngt. & func-tional maintenance
Functional mngt.
Data mngt. Functional design & mngt. Authorisa-tion mngt., process & appl. Knowl-edge & skills.
Operational business mngt.
Business processes Process mngt.
Information & data mngt. Process- & procedures mngt., risk mngt. Authori-ties & responsibili-ties mngt., Process knowledge & skills.
IT strategy / -planning
IT policy & strategic planning
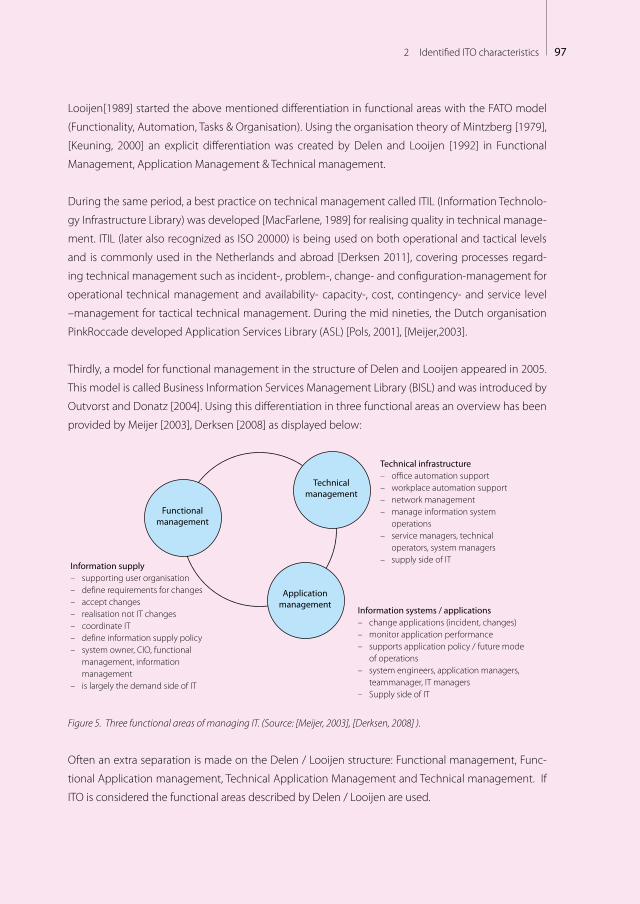
972 Identified ITO characteristics
Looijen[1989] started the above mentioned differentiation in functional areas with the FATO model
(Functionality, Automation, Tasks & Organisation). Using the organisation theory of Mintzberg [1979],
[Keuning, 2000] an explicit differentiation was created by Delen and Looijen [1992] in Functional
Management, Application Management & Technical management.
During the same period, a best practice on technical management called ITIL (Information Technolo-
gy Infrastructure Library) was developed [MacFarlene, 1989] for realising quality in technical manage-
ment. ITIL (later also recognized as ISO 20000) is being used on both operational and tactical levels
and is commonly used in the Netherlands and abroad [Derksen 2011], covering processes regard-
ing technical management such as incident-, problem-, change- and configuration-management for
operational technical management and availability- capacity-, cost, contingency- and service level
–management for tactical technical management. During the mid nineties, the Dutch organisation
PinkRoccade developed Application Services Library (ASL) [Pols, 2001], [Meijer,2003].
Thirdly, a model for functional management in the structure of Delen and Looijen appeared in 2005.
This model is called Business Information Services Management Library (BISL) and was introduced by
Outvorst and Donatz [2004]. Using this differentiation in three functional areas an overview has been
provided by Meijer [2003], Derksen [2008] as displayed below:
Technicalmanagement
Applicationmanagement
Functionalmanagement
Technical infrastructure– o�ce automation support– workplace automation support– network management– manage information system
operations– service managers, technical
operators, system managers– supply side of IT
Information supply– supporting user organisation– define requirements for changes– accept changes– realisation not IT changes– coordinate IT– define information supply policy– system owner, CIO, functional
management, information management
– is largely the demand side of IT
Information systems / applications– change applications (incident, changes)– monitor application performance– supports application policy / future mode
of operations– system engineers, application managers,
teammanager, IT managers– Supply side of IT
Figure 5. Three functional areas of managing IT. (Source: [Meijer, 2003], [Derksen, 2008] ).
Often an extra separation is made on the Delen / Looijen structure: Functional management, Func-
tional Application management, Technical Application Management and Technical management. If
ITO is considered the functional areas described by Delen / Looijen are used.
98 Part IV – IT Outsourcing characteristics
The three layers of IT management according to Delen / Looijen are in the scope of my research and
can be combined with the previous paragraph regarding the organisational scope. This combination
will be discussed later in this chapter.
2.3.1.2 Outsourced processes
A second view on ITO of IT is looking at the processes. Business Process Outsourcing (BPO) is not the
scope of this research as I am looking at the IT processes. In the previous paragraph, I introduced ITIL
[MacFarlene, 1989], ASL [Pols, 2001] and BISL [Outvorst, 2004]. ITIL and ASL have a structure which is
often called process oriented. The processes are mostly on tactical and operational levels. The similar-
ity between ITIL and ASL regarding the naming of the processes is high, but the area (technical or
application management) is different. Both ITIL and ASL have operational processes such as incident
management, change management, configuration management and software control & distribu-
tion. Both have tactical processes such as availability-, capacity-, cost- and service level management,
but there are differences as well.
When IT operations are outsourced it is, in my experience, common to outsource, for example, the
related IT processes such as incident management or change management as well. The help/service
desk is outsourced which uses, as a core process, incident management. Or software development
and maintenance is outsourced which uses, for example, the ASL process ‘change management’.
The view of ITO processes from an ASL and BISL perspective is not used in my research. A reason for
this choice is that most of the internal IT organisations did implement ITIL (almost 70% of the Dutch
organisations use ITIL according to research of Derksen in over 1000 Dutch companies [Derksen,
2008]) but ASL is implemented far less (11% of the Dutch organisations). BISL is at the introduction
stage with about 7%.
2.3.1.3 Objects of control for ITO
Following the structure, as introduced by Delen and Looijen an interesting (industry based) addition
has been presented by Noordam [2008]. Looking at the differentiation as created by Delen and Looi-
jen, Noordam added the view of objects of control. This is displayed below. The addition of Noordam
is interesting as it covers also the questions regarding ITO and BIA such as organisational structure
questions and knowledge & skills, as displayed in part 3 and in previous chapters.
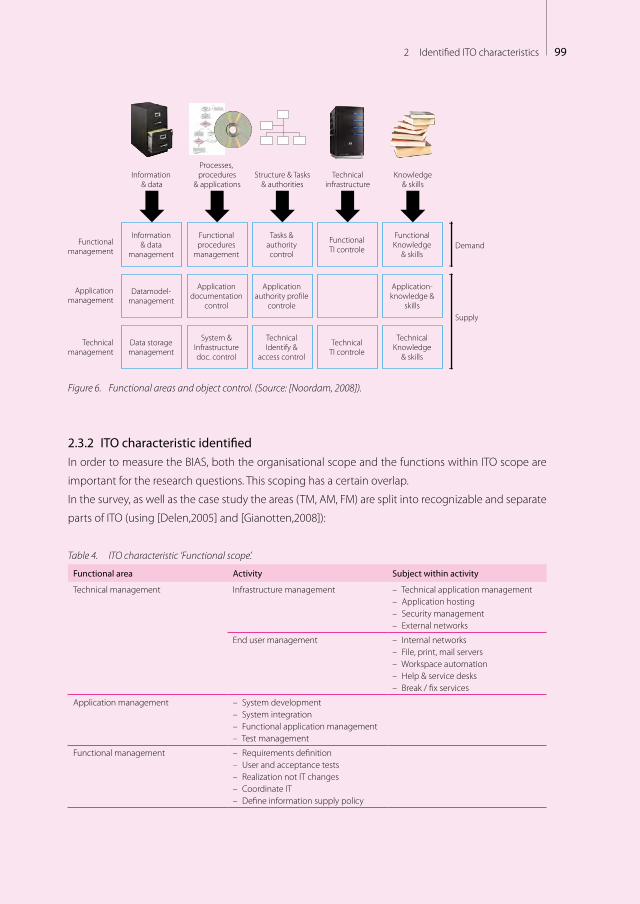
992 Identified ITO characteristics
Information & data
management
Functional procedures
management
Tasks & authority control
Functional TI controle
Functional Knowledge
& skills
Datamodel- management
Application documentation
control
Application authority pro�le
controle
Application- knowledge &
skills
Data storage management
System & Infrastructure doc. control
Technical Identify &
access control
TechnicalTI controle
Technical Knowledge
& skills
Functionalmanagement
Applicationmanagement
Technicalmanagement
Demand
Supply
Information & data
Processes, procedures
& applicationsStructure & Tasks
& authoritiesTechnical
infrastructureKnowledge
& skills
Figure 6. Functional areas and object control. (Source: [Noordam, 2008]).
2.3.2 ITO characteristic identifiedIn order to measure the BIAS, both the organisational scope and the functions within ITO scope are
important for the research questions. This scoping has a certain overlap.
In the survey, as well as the case study the areas (TM, AM, FM) are split into recognizable and separate
parts of ITO (using [Delen,2005] and [Gianotten,2008]):
Table 4. ITO characteristic ‘Functional scope’.
Functional area Activity Subject within activity
Technical management Infrastructure management – Technical application management– Application hosting– Security management– External networks
End user management – Internal networks– File, print, mail servers– Workspace automation– Help & service desks– Break / fix services
Application management – System development– System integration– Functional application management– Test management
Functional management – Requirements definition– User and acceptance tests– Realization not IT changes– Coordinate IT– Define information supply policy
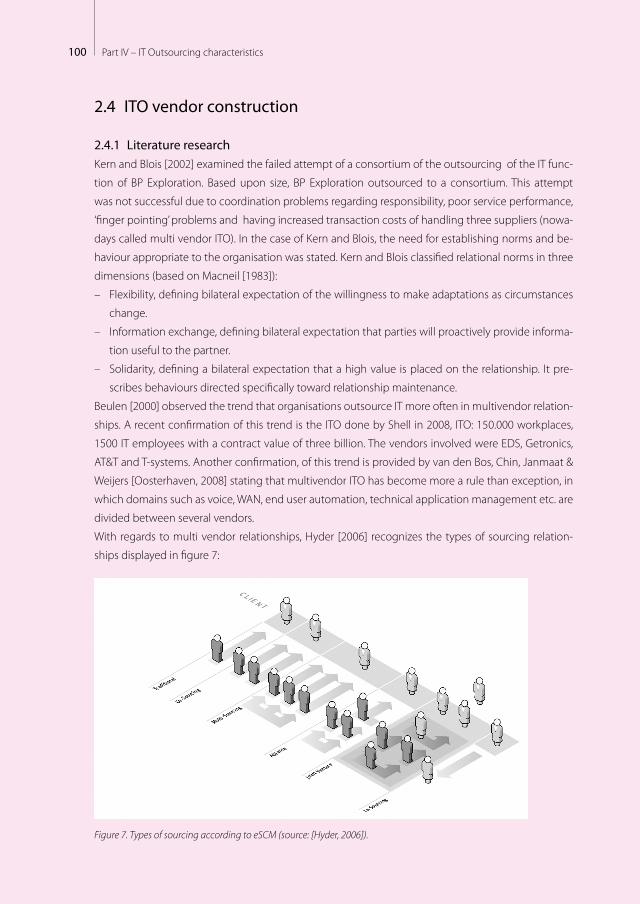
100 Part IV – IT Outsourcing characteristics
2.4 ITO vendor construction
2.4.1 Literature researchKern and Blois [2002] examined the failed attempt of a consortium of the outsourcing of the IT func-
tion of BP Exploration. Based upon size, BP Exploration outsourced to a consortium. This attempt
was not successful due to coordination problems regarding responsibility, poor service performance,
‘finger pointing’ problems and having increased transaction costs of handling three suppliers (nowa-
days called multi vendor ITO). In the case of Kern and Blois, the need for establishing norms and be-
haviour appropriate to the organisation was stated. Kern and Blois classified relational norms in three
dimensions (based on Macneil [1983]):
– Flexibility, defining bilateral expectation of the willingness to make adaptations as circumstances
change.
– Information exchange, defining bilateral expectation that parties will proactively provide informa-
tion useful to the partner.
– Solidarity, defining a bilateral expectation that a high value is placed on the relationship. It pre-
scribes behaviours directed specifically toward relationship maintenance.
Beulen [2000] observed the trend that organisations outsource IT more often in multivendor relation-
ships. A recent confirmation of this trend is the ITO done by Shell in 2008, ITO: 150.000 workplaces,
1500 IT employees with a contract value of three billion. The vendors involved were EDS, Getronics,
AT&T and T-systems. Another confirmation, of this trend is provided by van den Bos, Chin, Janmaat &
Weijers [Oosterhaven, 2008] stating that multivendor ITO has become more a rule than exception, in
which domains such as voice, WAN, end user automation, technical application management etc. are
divided between several vendors.
With regards to multi vendor relationships, Hyder [2006] recognizes the types of sourcing relation-
ships displayed in figure 7:
Figure 7. Types of sourcing according to eSCM (source: [Hyder, 2006]).
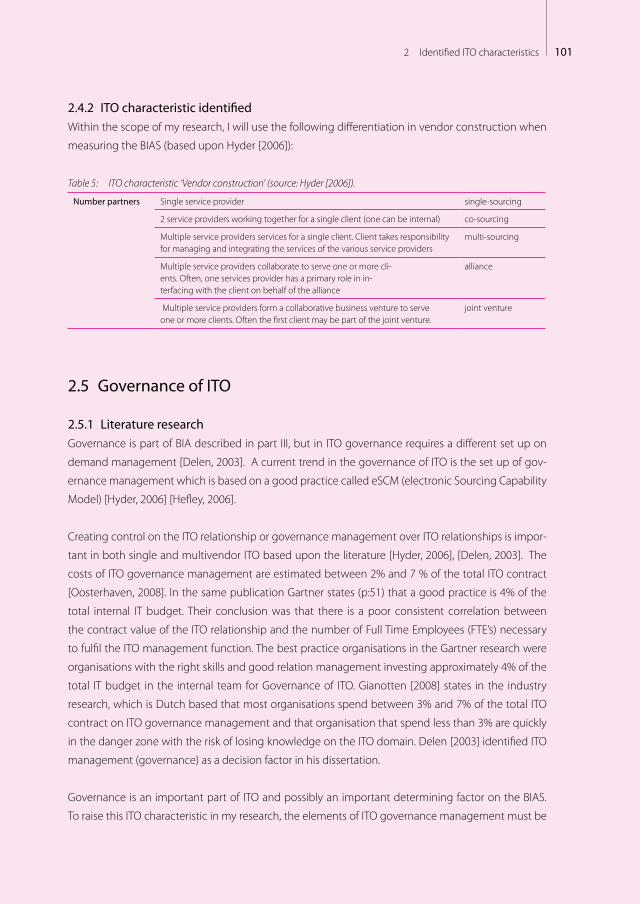
1012 Identified ITO characteristics
2.4.2 ITO characteristic identifiedWithin the scope of my research, I will use the following differentiation in vendor construction when
measuring the BIAS (based upon Hyder [2006]):
Table 5: ITO characteristic ‘Vendor construction’ (source: Hyder [2006]).
Number partners Single service provider single-sourcing
2 service providers working together for a single client (one can be internal) co-sourcing
Multiple service providers services for a single client. Client takes responsibility for managing and integrating the services of the various service providers
multi-sourcing
Multiple service providers collaborate to serve one or more cli-ents. Often, one services provider has a primary role in in-terfacing with the client on behalf of the alliance
alliance
Multiple service providers form a collaborative business venture to serve one or more clients. Often the first client may be part of the joint venture.
joint venture
2.5 Governance of ITO
2.5.1 Literature researchGovernance is part of BIA described in part III, but in ITO governance requires a different set up on
demand management [Delen, 2003]. A current trend in the governance of ITO is the set up of gov-
ernance management which is based on a good practice called eSCM (electronic Sourcing Capability
Model) [Hyder, 2006] [Hefley, 2006].
Creating control on the ITO relationship or governance management over ITO relationships is impor-
tant in both single and multivendor ITO based upon the literature [Hyder, 2006], [Delen, 2003]. The
costs of ITO governance management are estimated between 2% and 7 % of the total ITO contract
[Oosterhaven, 2008]. In the same publication Gartner states (p:51) that a good practice is 4% of the
total internal IT budget. Their conclusion was that there is a poor consistent correlation between
the contract value of the ITO relationship and the number of Full Time Employees (FTE’s) necessary
to fulfil the ITO management function. The best practice organisations in the Gartner research were
organisations with the right skills and good relation management investing approximately 4% of the
total IT budget in the internal team for Governance of ITO. Gianotten [2008] states in the industry
research, which is Dutch based that most organisations spend between 3% and 7% of the total ITO
contract on ITO governance management and that organisation that spend less than 3% are quickly
in the danger zone with the risk of losing knowledge on the ITO domain. Delen [2003] identified ITO
management (governance) as a decision factor in his dissertation.
Governance is an important part of ITO and possibly an important determining factor on the BIAS.
To raise this ITO characteristic in my research, the elements of ITO governance management must be
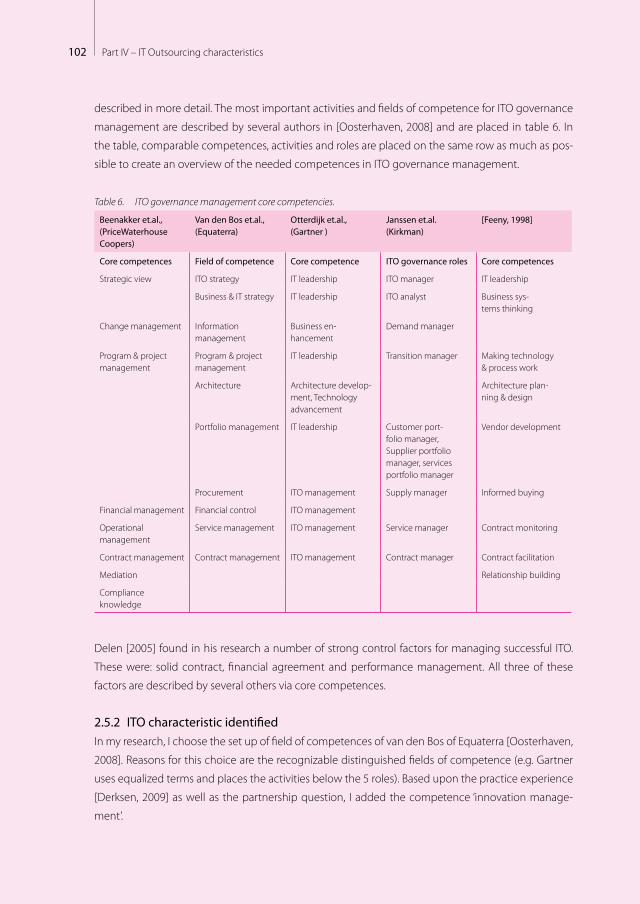
102 Part IV – IT Outsourcing characteristics
described in more detail. The most important activities and fields of competence for ITO governance
management are described by several authors in [Oosterhaven, 2008] and are placed in table 6. In
the table, comparable competences, activities and roles are placed on the same row as much as pos-
sible to create an overview of the needed competences in ITO governance management.
Table 6. ITO governance management core competencies.
Beenakker et.al., (PriceWaterhouse Coopers)
Van den Bos et.al., (Equaterra)
Otterdijk et.al., (Gartner )
Janssen et.al. (Kirkman)
[Feeny, 1998]
Core competences Field of competence Core competence ITO governance roles Core competences
Strategic view ITO strategy IT leadership ITO manager IT leadership
Business & IT strategy IT leadership ITO analyst Business sys-tems thinking
Change management Information management
Business en-hancement
Demand manager
Program & project management
Program & project management
IT leadership Transition manager Making technology & process work
Architecture Architecture develop-ment, Technology advancement
Architecture plan-ning & design
Portfolio management IT leadership Customer port-folio manager, Supplier portfolio manager, services portfolio manager
Vendor development
Procurement ITO management Supply manager Informed buying
Financial management Financial control ITO management
Operational management
Service management ITO management Service manager Contract monitoring
Contract management Contract management ITO management Contract manager Contract facilitation
Mediation Relationship building
Compliance knowledge
Delen [2005] found in his research a number of strong control factors for managing successful ITO.
These were: solid contract, financial agreement and performance management. All three of these
factors are described by several others via core competences.
2.5.2 ITO characteristic identifiedIn my research, I choose the set up of field of competences of van den Bos of Equaterra [Oosterhaven,
2008]. Reasons for this choice are the recognizable distinguished fields of competence (e.g. Gartner
uses equalized terms and places the activities below the 5 roles). Based upon the practice experience
[Derksen, 2009] as well as the partnership question, I added the competence ‘innovation manage-
ment’.
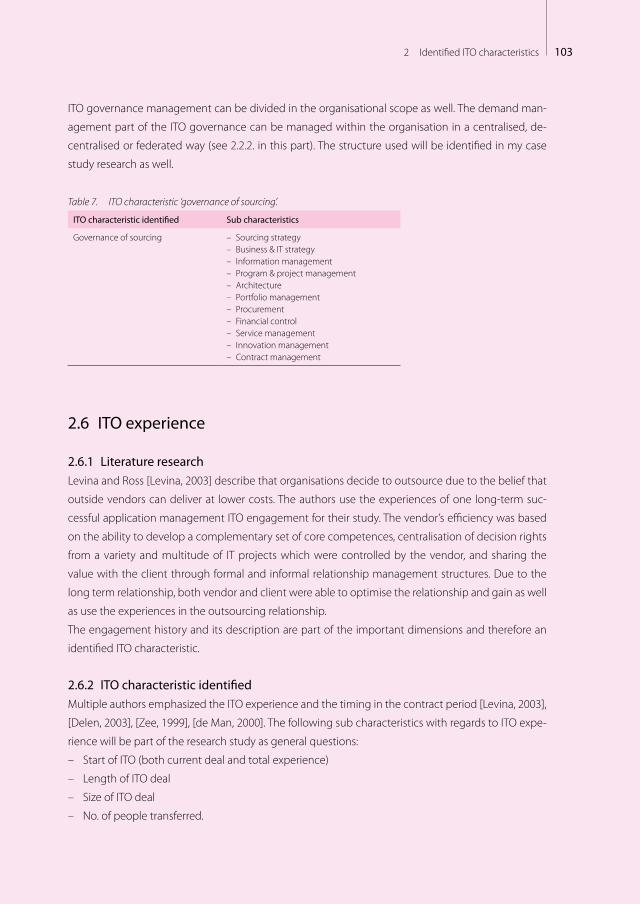
1032 Identified ITO characteristics
ITO governance management can be divided in the organisational scope as well. The demand man-
agement part of the ITO governance can be managed within the organisation in a centralised, de-
centralised or federated way (see 2.2.2. in this part). The structure used will be identified in my case
study research as well.
Table 7. ITO characteristic ‘governance of sourcing’.
ITO characteristic identified Sub characteristics
Governance of sourcing – Sourcing strategy– Business & IT strategy– Information management– Program & project management– Architecture– Portfolio management– Procurement– Financial control– Service management– Innovation management– Contract management
2.6 ITO experience
2.6.1 Literature researchLevina and Ross [Levina, 2003] describe that organisations decide to outsource due to the belief that
outside vendors can deliver at lower costs. The authors use the experiences of one long-term suc-
cessful application management ITO engagement for their study. The vendor’s efficiency was based
on the ability to develop a complementary set of core competences, centralisation of decision rights
from a variety and multitude of IT projects which were controlled by the vendor, and sharing the
value with the client through formal and informal relationship management structures. Due to the
long term relationship, both vendor and client were able to optimise the relationship and gain as well
as use the experiences in the outsourcing relationship.
The engagement history and its description are part of the important dimensions and therefore an
identified ITO characteristic.
2.6.2 ITO characteristic identifiedMultiple authors emphasized the ITO experience and the timing in the contract period [Levina, 2003],
[Delen, 2003], [Zee, 1999], [de Man, 2000]. The following sub characteristics with regards to ITO expe-
rience will be part of the research study as general questions:
– Start of ITO (both current deal and total experience)
– Length of ITO deal
– Size of ITO deal
– No. of people transferred.
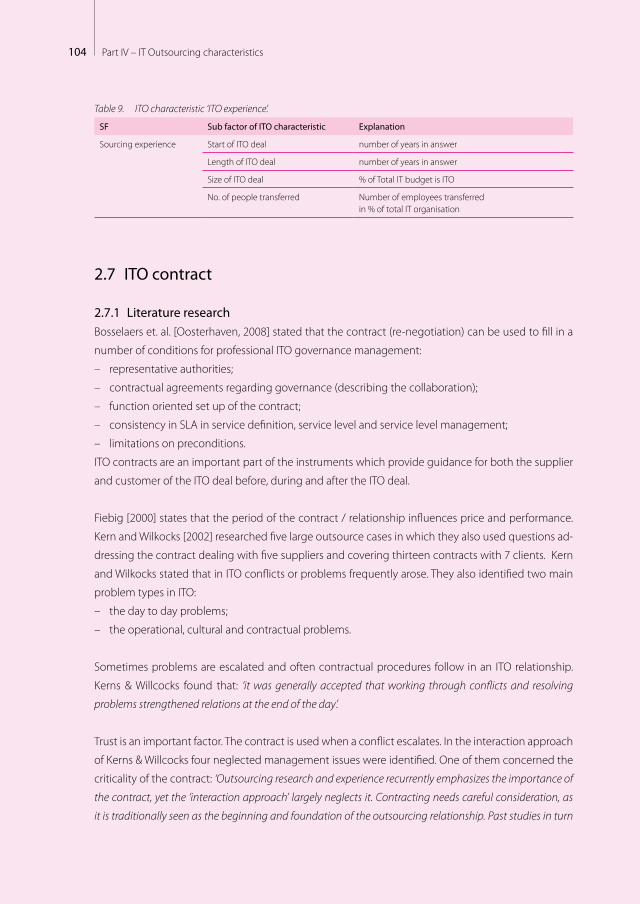
104 Part IV – IT Outsourcing characteristics
Table 9. ITO characteristic ‘ITO experience’.
SF Sub factor of ITO characteristic Explanation
Sourcing experience Start of ITO deal number of years in answer
Length of ITO deal number of years in answer
Size of ITO deal % of Total IT budget is ITO
No. of people transferred Number of employees transferred in % of total IT organisation
2.7 ITO contract
2.7.1 Literature researchBosselaers et. al. [Oosterhaven, 2008] stated that the contract (re-negotiation) can be used to fill in a
number of conditions for professional ITO governance management:
– representative authorities;
– contractual agreements regarding governance (describing the collaboration);
– function oriented set up of the contract;
– consistency in SLA in service definition, service level and service level management;
– limitations on preconditions.
ITO contracts are an important part of the instruments which provide guidance for both the supplier
and customer of the ITO deal before, during and after the ITO deal.
Fiebig [2000] states that the period of the contract / relationship influences price and performance.
Kern and Wilkocks [2002] researched five large outsource cases in which they also used questions ad-
dressing the contract dealing with five suppliers and covering thirteen contracts with 7 clients. Kern
and Wilkocks stated that in ITO conflicts or problems frequently arose. They also identified two main
problem types in ITO:
– the day to day problems;
– the operational, cultural and contractual problems.
Sometimes problems are escalated and often contractual procedures follow in an ITO relationship.
Kerns & Willcocks found that: ‘it was generally accepted that working through conflicts and resolving
problems strengthened relations at the end of the day’.
Trust is an important factor. The contract is used when a conflict escalates. In the interaction approach
of Kerns & Willcocks four neglected management issues were identified. One of them concerned the
criticality of the contract: ‘Outsourcing research and experience recurrently emphasizes the importance of
the contract, yet the ‘interaction approach’ largely neglects it. Contracting needs careful consideration, as
it is traditionally seen as the beginning and foundation of the outsourcing relationship. Past studies in turn
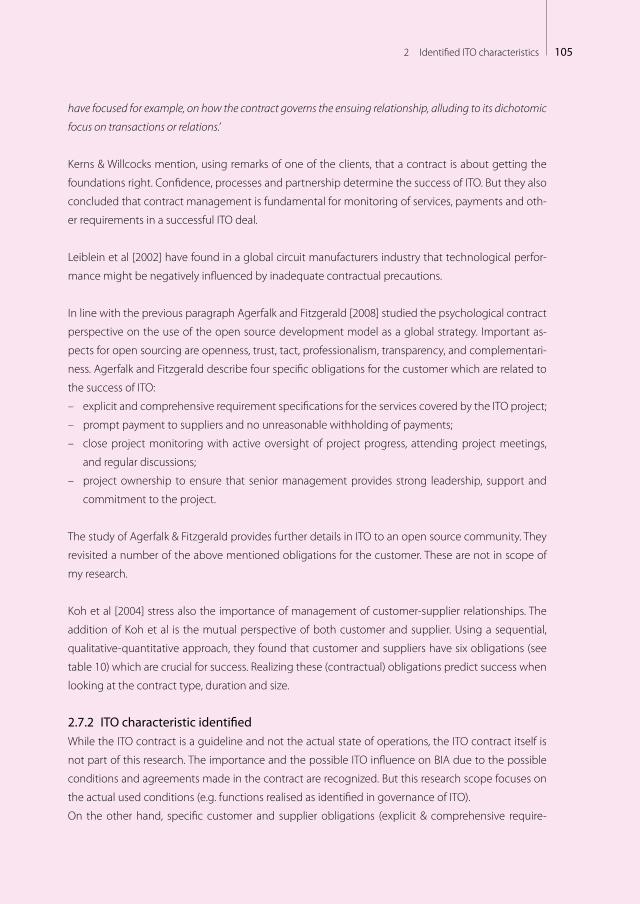
1052 Identified ITO characteristics
have focused for example, on how the contract governs the ensuing relationship, alluding to its dichotomic
focus on transactions or relations.’
Kerns & Willcocks mention, using remarks of one of the clients, that a contract is about getting the
foundations right. Confidence, processes and partnership determine the success of ITO. But they also
concluded that contract management is fundamental for monitoring of services, payments and oth-
er requirements in a successful ITO deal.
Leiblein et al [2002] have found in a global circuit manufacturers industry that technological perfor-
mance might be negatively influenced by inadequate contractual precautions.
In line with the previous paragraph Agerfalk and Fitzgerald [2008] studied the psychological contract
perspective on the use of the open source development model as a global strategy. Important as-
pects for open sourcing are openness, trust, tact, professionalism, transparency, and complementari-
ness. Agerfalk and Fitzgerald describe four specific obligations for the customer which are related to
the success of ITO:
– explicit and comprehensive requirement specifications for the services covered by the ITO project;
– prompt payment to suppliers and no unreasonable withholding of payments;
– close project monitoring with active oversight of project progress, attending project meetings,
and regular discussions;
– project ownership to ensure that senior management provides strong leadership, support and
commitment to the project.
The study of Agerfalk & Fitzgerald provides further details in ITO to an open source community. They
revisited a number of the above mentioned obligations for the customer. These are not in scope of
my research.
Koh et al [2004] stress also the importance of management of customer-supplier relationships. The
addition of Koh et al is the mutual perspective of both customer and supplier. Using a sequential,
qualitative-quantitative approach, they found that customer and suppliers have six obligations (see
table 10) which are crucial for success. Realizing these (contractual) obligations predict success when
looking at the contract type, duration and size.
2.7.2 ITO characteristic identifiedWhile the ITO contract is a guideline and not the actual state of operations, the ITO contract itself is
not part of this research. The importance and the possible ITO influence on BIA due to the possible
conditions and agreements made in the contract are recognized. But this research scope focuses on
the actual used conditions (e.g. functions realised as identified in governance of ITO).
On the other hand, specific customer and supplier obligations (explicit & comprehensive require-
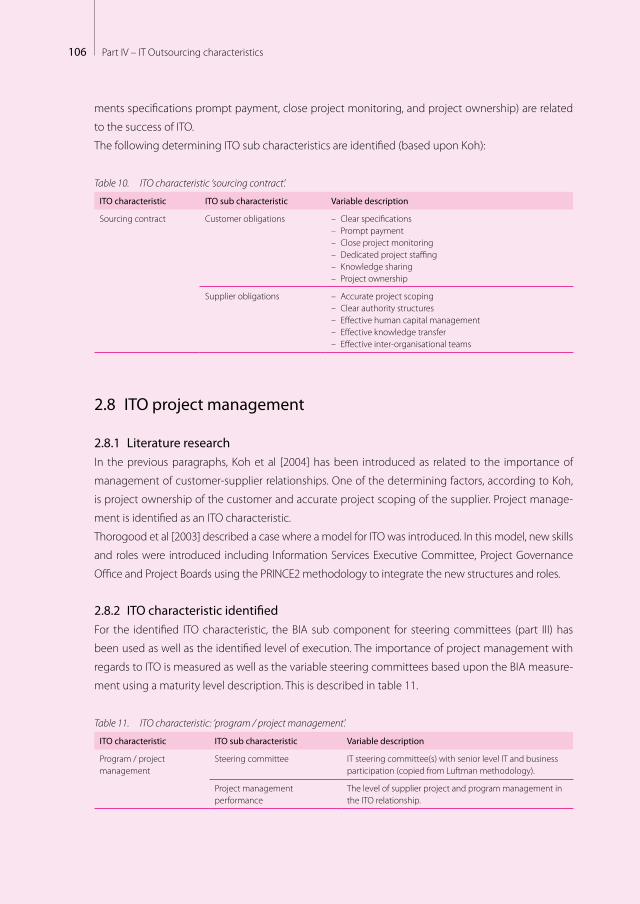
106 Part IV – IT Outsourcing characteristics
ments specifications prompt payment, close project monitoring, and project ownership) are related
to the success of ITO.
The following determining ITO sub characteristics are identified (based upon Koh):
Table 10. ITO characteristic ‘sourcing contract’.
ITO characteristic ITO sub characteristic Variable description
Sourcing contract Customer obligations – Clear specifications– Prompt payment– Close project monitoring– Dedicated project staffing– Knowledge sharing– Project ownership
Supplier obligations – Accurate project scoping– Clear authority structures– Effective human capital management– Effective knowledge transfer– Effective inter-organisational teams
2.8 ITO project management
2.8.1 Literature researchIn the previous paragraphs, Koh et al [2004] has been introduced as related to the importance of
management of customer-supplier relationships. One of the determining factors, according to Koh,
is project ownership of the customer and accurate project scoping of the supplier. Project manage-
ment is identified as an ITO characteristic.
Thorogood et al [2003] described a case where a model for ITO was introduced. In this model, new skills
and roles were introduced including Information Services Executive Committee, Project Governance
Office and Project Boards using the PRINCE2 methodology to integrate the new structures and roles.
2.8.2 ITO characteristic identifiedFor the identified ITO characteristic, the BIA sub component for steering committees (part III) has
been used as well as the identified level of execution. The importance of project management with
regards to ITO is measured as well as the variable steering committees based upon the BIA measure-
ment using a maturity level description. This is described in table 11.
Table 11. ITO characteristic: ‘program / project management’.
ITO characteristic ITO sub characteristic Variable description
Program / project management
Steering committee IT steering committee(s) with senior level IT and business participation (copied from Luftman methodology).
Project management performance
The level of supplier project and program management in the ITO relationship.

1072 Identified ITO characteristics
2.9 ITO service (level) management
2.9.1 Literature research“When the performance quality of an activity is low, managers are often tempted to outsource it. If poor
performance is attributable to factors such as insufficient scale economies or a lack of expertise, IT out-
sourcing makes sense.” [Barthémely, 2003].
In this article, the importance of both the contract, as well as the performance quality in an ITO con-
tract are stressed. It is important to have performance quality (service levels) agreed upon as well as
managing the SLA.
Measuring the service levels is an important aspect of managing the ITO expectations and progres-
sion. What is measured is dependent on the goals of the ITO party. Delen [2003] defined performance
management using service level agreements as an important control factor within his dissertation.
He also defined a number of criteria for good performance management:
– defined Key Performance Indicators for organisational targets;
– defined Service Level Agreements aligned to the Key Performance Indicators including reporting
agreements;
– possible bonus agreements aligned with the Service Level Agreement.
2.9.2 ITO characteristic identifiedThe ITO characteristic identified is the same as in the model of Luftman (added value). The difference
is that the result measured within the BIA part is between business & IT and the ITO characteristic
identified is between the internal IT management questioned and the supplier.
Table 12. ITO characteristic ‘Service Level Management’.
SF level Descriptions per level
ITO Service Level Management maturity
1 The metrics and processes we have in place to measure IT is primarily technical (e.g., system availability, response time).
2 We are equally concerned with technical and cost efficiency measures. We have limited or no formal feedback processes in place to review and take action based on the results of our measures.
3 We formally assess technical and cost efficiency using traditional financial measures, such as return on investment (ROI) and activity-based costing (ABC). We are starting to put formal feedback processes in place to review and take action based on the results of our measures.
4 We formally assess technical, cost efficiency, and cost effectiveness using traditional financial measures (e.g., ROI, ABC). We have formal feedback processes in place to review and take action based on the results of our measures.
5 We use a multi-dimensional approach with appropriate weights given to technical, financial, operational, and human-related measures. We have formal feedback processes in place to review and take action based on the results of our measures. These measures are extended to our external partners (e.g. other vendors, outsourcers, customers).
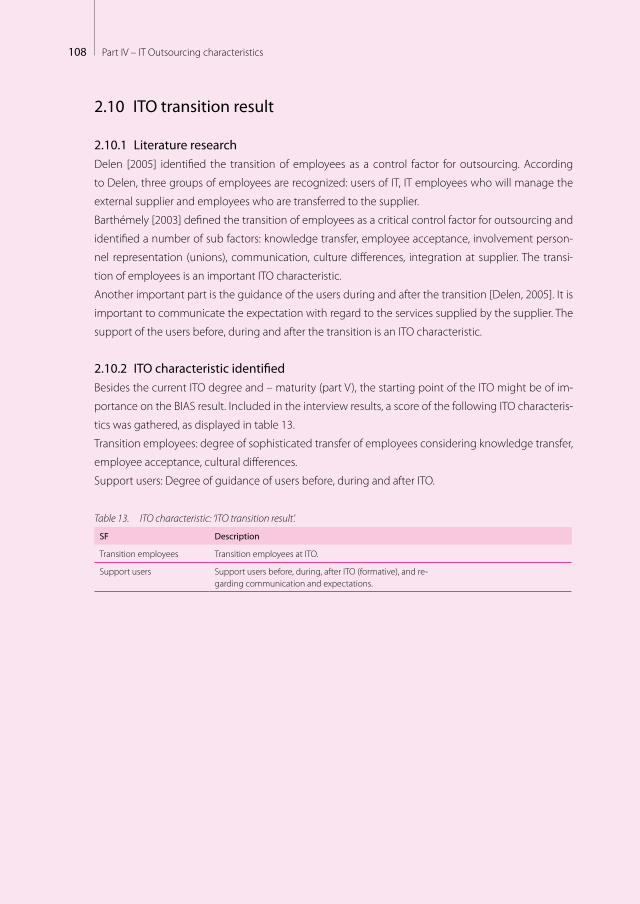
108 Part IV – IT Outsourcing characteristics
2.10 ITO transition result
2.10.1 Literature researchDelen [2005] identified the transition of employees as a control factor for outsourcing. According
to Delen, three groups of employees are recognized: users of IT, IT employees who will manage the
external supplier and employees who are transferred to the supplier.
Barthémely [2003] defined the transition of employees as a critical control factor for outsourcing and
identified a number of sub factors: knowledge transfer, employee acceptance, involvement person-
nel representation (unions), communication, culture differences, integration at supplier. The transi-
tion of employees is an important ITO characteristic.
Another important part is the guidance of the users during and after the transition [Delen, 2005]. It is
important to communicate the expectation with regard to the services supplied by the supplier. The
support of the users before, during and after the transition is an ITO characteristic.
2.10.2 ITO characteristic identifiedBesides the current ITO degree and – maturity (part V), the starting point of the ITO might be of im-
portance on the BIAS result. Included in the interview results, a score of the following ITO characteris-
tics was gathered, as displayed in table 13.
Transition employees: degree of sophisticated transfer of employees considering knowledge transfer,
employee acceptance, cultural differences.
Support users: Degree of guidance of users before, during and after ITO.
Table 13. ITO characteristic: ‘ITO transition result’.
SF Description
Transition employees Transition employees at ITO.
Support users Support users before, during, after ITO (formative), and re-garding communication and expectations.

1093 Summary ITO characteristics
“Exercise in all twelve tonalities. Then, you don’t have to be ashamed if you suddenly must play another key” Best advice received from Benjamin Herman (Saxophonist). Source Intermediair
Summary ITO characteristicsFor measuring BIA, the Luftman method was introduced. In the literature research regarding ITO, no
specific measurement method was found to adequately measure the degree and level of ITO. There-
fore an ITO characteristics model was built. The measurement method developed with regard to ITO
is discussed in part V.
This part discusses the identified characteristics to be measured. The identified ITO characteristics
answer one of the research questions: Which characteristics differentiate ITO?
The characteristics found are often related to BIA. Some of the found characteristics even overlap,
such as service level management and project management. Based on the literature research, the
following characteristics were found to differentiate ITO:
– type of ITO relationship;
– scope op ITO – organisational;
– scope of ITO – functional scope;
– ITO vendor construction;
– governance of ITO;
– ITO experience;
– ITO contract;
– ITO project management;
– ITO service level management;
– ITO transition result.
These ITO characteristics have been identified as relevant characteristics in the literature research.
Based upon the literature research, the research assumption has been made that these are the pos-
3

110 Part IV – IT Outsourcing characteristics
sible differentiating characteristics of ITO which may be influencing the level of BIA (BIA). The above
mentioned identified ITO characteristics are explained in chapter 2.
The measurement methodology of the identified characteristics is described in the following part (V).
Part VMeasuring
BIA maturity and the ITO influence (BIAS)
Informalpervasive
Optimized processes
Improved, managed
processes
Esthablished,focuses
processes
Committedprocesses
Initial or ad hoc
processes
Bonding, uni�ed
Cost e�ective
Some partner-value;
Dashboard managed
Some cost
e�ectiveness; Dashboard
established
IT enables/drives business strategy
IT seen as an asset; Process driver;Con�ict seen as creative
Shared risk & rewards
Emerging value service provider;Balanced tech & business hiring
Relevant process
across the organization
Relevant process
across the organization
Good understanding;
Emerging relaxed
Limited business / IT understanding,
Business / IT lack understanding,
Functional cost e�ciency
Some technical measurements
No formal process,cost center, reactive
priorities
Con�ict; IT a cost of doing
business
Traditional (e.g., acctng, email)
IT takes risk, little reward;
Technical training
Tactical at Functional
level,occasional
responsive
IT emerging as an asset;
Process enabler
Transaction (e.g., ESS, DSS)
Di�ers across functional organizations
Integrated with partners
Integrated across the organization
Extende to external
partners
Integrated across the
org. & partners
Evolve with partners
IT-bunisness co-adaptive
Improvisation-al
Education/careers/rewards across the organization
Communication
ValueGovernance Partnership Scope &
architectureSkills
Contingency factors
Busin
ess &
ITal
ignm
ent
mat
urityIT outsourcing
characteristics in�uence
Relationship Scopeorganisational
Transitionresult
Scopefunctional
Projectmanagement Single/Multi
vendorGovernanceExperience
Contract
SLM
1.57
2.62
Degree ofITO
ITOmaturity

112 Part V – Measuring BIA maturity and the ITO influence (BIAS)
113Contents
Contents
1 Measuring maturity 1151.1 Brief history of maturity assessment 115
1.2 Maturity measurement model Luftman 116
2 Measuring BIA maturity & ITO influence 1192.1 Research approach applied 119
2.2 Overview BIA components and ITO characteristics measured 120
3 Measuring BIA maturity 1233.1 Measuring BIA maturity using Luftman measurement method 123
3.2 Processing the BIA measurement results 125
3.3 Processing the BIA responses statistically 126
3.4 Processing short survey results 127
3.5 Example result (case Bach) 128
3.6 Usage of results at case study 131
4 Measuring the ITO characteristic’s influence 1354.1 Introducing the ITO measurement mechanism 135
4.1.1 Defining degree of ITO 136
4.1.2 Defining ITO maturity 137
4.1.3 Defining other characteristics of ITO 139
4.1.4 Overview ITO measurement mechanism 140
4.2 Measuring degree of ITO (case & survey research) 141
4.3 Measuring ITO maturity (Case research) 142
4.4 Measuring other ITO characteristics (Case research) 144
4.5 Processing the outsourcing responses statistically 145
4.5.1 Degree of ITO (survey & case research) 145
4.5.3 Other ITO characteristics (case research) 146
4.5.4 Processing short survey results 146
4.6 Example result (case Bach) 147
4.6.1 Example degree of ITO 147
4.6.2 Example ITO maturity 147
4.6.3 Example other ITO characteristics (case research) 149

114 Part V – Measuring BIA maturity and the ITO influence (BIAS)
5 Summary 1515.1 Measuring BIA maturity and the ITO influence 151
5.2 Presenting BIAS results for case Bach 151

1151 Measuring maturity
“Live with flying colours, but keep it simple”
Best advice received from Pim van der Feltz
(managing director Google Netherlands). Source Intermediair (10/12/2009)
Measuring maturityIn the previous parts (III & IV) the results of the literature research have been described with regard
to BIA and ITO. Based upon the literature, this part discusses the measuring method used within my
research answering the research questions:
– How can we determine the maturity level of BIAS?
– How can ITO influence be measured?
The contingency factors which might influence the research results will be described in the following
part of this dissertation. For measuring purposes, the maturity levels are being used for BIA as well as
for ITO. In this chapter this is further explained.
First, a brief history on maturity assessment will be provided, followed by an overview of the measure-
ment methods used in relation to the field research performed. Thirdly, the chosen BIA maturity assess-
ment model of Luftman will be described. In the fourth chapter, the ITO characteristic influence method
will be described. This parts ends with the overview of the BIA-ITO (BIAS) model used in this dissertation.
1.1 Brief history of maturity assessmentIn 1972, Greiner [1972] introduced the growth concept for organisations expressing the changes in
functioning of the organisations [Keuning, 2000]. In the IS literature, the maturity model was first
introduced via Gibson and Nolan [Gibson, 1974] introducing four stages of growth based upon the
companies spending for electronic data processing. The four stages described were:
– Stage 1: Initiation
– Stage 2: Expansion
– Stage 3: Formalization
– Stage 4: Maturity
1

116 Part V – Measuring BIA maturity and the ITO influence (BIAS)
Gibson and Nolan stated that: “The basis for this framework of stages is the recent discovery that the EDP
budget for a number of companies, when plotted over time from initial investment to mature operation,
forms an S-shaped curve. (...) The turnings of this curve correspond to the main events – often crisis – in the
life of the EDP function that signal important shifts in the way the computer resource is used and managed.
There are three such turnings, and, consequently, four stages.”
Later Nolan added two stages: integration and data administration. Another maturity model was in-
troduced by Humprey [1989] and is also the basis of the used maturity model of Luftman as well as
in this dissertation. The maturity model of Humprey was called Capability Maturity Model (CMM). This
model recognizes five maturity levels: initial, repeatable, defined, managed and optimizing. Originally,
the five maturity levels were system development oriented. At a later stage, the CMM model was
extended to CMMI (integrated) covering IT support & management [Derksen, 2008].
These first maturity models differ. The Gibson Maturity Model looks at a specific organisational unit
and considers the quality of processes. The CMM model of Humprey is oriented on processes and
addresses so called key practices (themes that should be considered). CMM is a well proven measure-
ment method within the industry and has a track record of numerous followers (certified companies
on the levels 1 to 5) as well as several papers on the added value of this maturity model. With regards
to BIA maturity, several measurement methods are available [Luftman, 2003], [Duffy, 2001], [Koning,
2002], [Raadt, 2005], [ISACA, 2006] and [Zee, 2001] (see also part III, 2.3)
The SAM (Strategic Alignment Model) maturity levels of Luftman is based upon the CMM model and
is used as the measurement methodology for measuring the BIA maturity level in the field research
performed for this dissertation.
1.2 Maturity measurement model LuftmanIn the SAM maturity model, six components of BIA are identified (and described in part III) as: Com-
munication, Value, Governance, Partnership, Scope & Architecture and Skills. The SAM model also de-
scribes five BIA maturity levels [Luftman, 2007].
The descriptions of the five maturity levels as provided by Luftman [2007] (copied from) are:
– Level 1: Initial or ad-hoc processes. Organisations at Level 1 generally have poor communications
between IT and the business and also a poor understanding of the value or contribution the other pro-
vides. Their relationship tends to be formal and rigid, and their metrics are usually technical rather than
business oriented. Service level agreements tend to be sporadic. IT planning or business planning is ad-
hoc. And IT is viewed as a cost centre and considered “the cost of doing business.” The two parties also
have minimal trust and partnership. IT projects rarely have business sponsors or champions. Business
and IT also have little to no career crossovers. Applications focus on traditional back-office support, such
as e-mail, accounting, and HR, with no integration among them. Finally, Level 1 organisations do not
have an aligned IT-business strategy.

1171 Measuring maturity
– Level 2: Committed processes. Organisations at Level 2 have begun enhancing their IT-business rela-
tionship. Alignment tends to focus on functions or departments (e.g., finance, R&D, manufacturing, mar-
keting) or geographical locations (e.g., U.S., Europe, Asia). The business and IT have limited understanding
of each others’ responsibilities and roles. IT metrics and service levels are technical and cost-oriented, and
they are not linked to business metrics. Few continuous improvement programs exist. Management inter-
actions between IT and the business tend to be transaction-based rather than partnership-based, and IT
spending relates to basic operations. Business sponsorship of IT projects is limited. At the functional level,
there is some career crossover between the business and IT. IT management considers technical skills the
most important for IT.
– Level 3: Established, focused processes. In Level 3 organisations, IT assets become more integrated
enterprise-wide. Senior and mid-level IT management understand the business, and the business’s under-
standing of IT is emerging. Service level agreements (SLAs) begin to emerge across the enterprise, although
the results are not always shared or acted upon. Strategic planning tends to be done at the business unit
level, although some inter-organisational planning has begun. IT is increasingly viewed by the business
as an asset, but project prioritisation still usually responds to “the loudest voice.” Formal IT steering com-
mittees emerge and meet regularly. IT spending tends to be controlled by budgets, and IT is still seen as a
cost centre. But awareness of IT’s “investment potential” is emerging. The business is more tolerant of risk
and is willing to share some risk with IT. At the function level, the business sponsors IT projects and career
crossovers between business and IT occur. Both business and technical skills are important to business and
IT managers. Technology standards and architecture have emerged at both the enterprise level and with
key external partners.
– Level 4: Improved, managed processes. Organisations at Level 4 manage the processes they need for
strategic BIA within the enterprise. One of the important attributes of this level is that the gap has closed
between IT understanding the business and the business understanding IT. As a result, Level 4 organisa-
tions have effective decision making and IT provides services that reinforce the concept of IT as a value
centre. Level 4 organisations leverage their IT assets enterprise-wide and they focus applications on en-
hancing business processes for sustainable competitive advantage. SLAs are also enterprise-wide and
benchmarking is a routine practice. Strategic business and IT planning processes are managed across
the enterprise. Formal IT steering committees meet regularly and are effective at the strategic, tactical,
and operational levels. The business views IT as a valued service provider and as an enabler (or driver)
of change. In fact, the business shares risks and rewards with IT by providing effective sponsorship and
championing all IT projects. Overall, change management is highly effective. Career crossovers between
business and IT occur across functions, with business and technical skills recognized as very important
to the business and IT.
– Level 5: Optimised processes. Organisations at Level 5 have optimised strategic IT-business BIA
through rigorous governance processes that integrate strategic business planning and IT planning.
Alignment goes beyond the enterprise by leveraging IT with the company’s business partners, custom-
ers, and clients, as well. IT has extended its reach to encompass the value chains of external customers
and suppliers. Relationships between the business and IT are informal and knowledge is shared with ex-
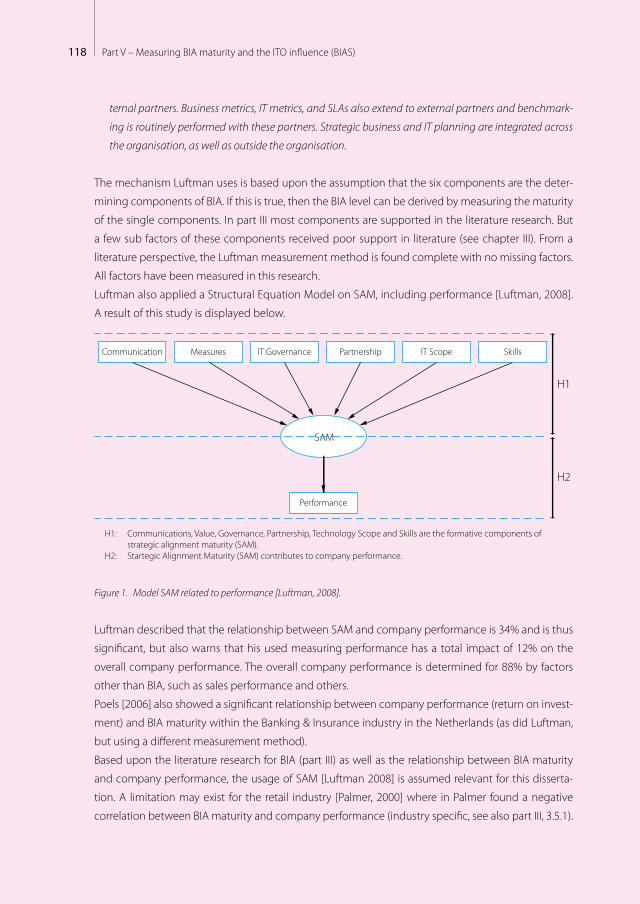
118 Part V – Measuring BIA maturity and the ITO influence (BIAS)
ternal partners. Business metrics, IT metrics, and SLAs also extend to external partners and benchmark-
ing is routinely performed with these partners. Strategic business and IT planning are integrated across
the organisation, as well as outside the organisation.
The mechanism Luftman uses is based upon the assumption that the six components are the deter-
mining components of BIA. If this is true, then the BIA level can be derived by measuring the maturity
of the single components. In part III most components are supported in the literature research. But
a few sub factors of these components received poor support in literature (see chapter III). From a
literature perspective, the Luftman measurement method is found complete with no missing factors.
All factors have been measured in this research.
Luftman also applied a Structural Equation Model on SAM, including performance [Luftman, 2008].
A result of this study is displayed below.
H1
H2
SAM
Communication Measures IT Governance
Performance
Partnership IT Scope Skills
H1: Communications, Value, Governance, Partnership, Technology Scope and Skills are the formative components of strategic alignment maturity (SAM).
H2: Startegic Alignment Maturity (SAM) contributes to company performance.
Figure 1. Model SAM related to performance [Luftman, 2008].
Luftman described that the relationship between SAM and company performance is 34% and is thus
significant, but also warns that his used measuring performance has a total impact of 12% on the
overall company performance. The overall company performance is determined for 88% by factors
other than BIA, such as sales performance and others.
Poels [2006] also showed a significant relationship between company performance (return on invest-
ment) and BIA maturity within the Banking & Insurance industry in the Netherlands (as did Luftman,
but using a different measurement method).
Based upon the literature research for BIA (part III) as well as the relationship between BIA maturity
and company performance, the usage of SAM [Luftman 2008] is assumed relevant for this disserta-
tion. A limitation may exist for the retail industry [Palmer, 2000] where in Palmer found a negative
correlation between BIA maturity and company performance (industry specific, see also part III, 3.5.1).
1192 Measuring BIA maturity & ITO influence
“Follow your own way” Best advice received from Robert-Jan Derksen (professional Golf player).
Source Intermediair (24/09/2009)
Measuring BIA maturity & ITO influenceThe field research performed used case, survey & short survey research. Before describing the used
measurement methods used in detail, an overview will be provided in this chapter.
2.1 Research approach appliedThe applied research strategy (see part II) exists of three measurement methods: case, survey and
short survey. The case research strategy applied is the complete measurement method based upon
the literature research findings. The survey research strategy applied is a subset of the case research
using the same BIA measurement mechanism and the ITO characteristics. Within the survey research
a selection was used of the ITO characteristics containing ‘scope sourcing-functional’ and ‘size of out-
sourcing deal’. This is described in part IV.
Within the multi case study, both business & IT representatives have been involved with a minimum of
four representatives. In most cases, a workshop is performed discussing the BIA score and gathering
contingency data. In few cases, the workshop was replaced using an interview for testing BIA score and
discussing contingency factors (based upon attending organisation conditions). All cases provided ex-
tra data on ITO (see sub factors described in table 1) gathered in cooperation with the IT representative.
Within the short survey and survey research, no workshop and no interviews were held. The data gath-
ered was survey only. The data gathered can be based on one or few respondents of a single company.
The short survey performed was added to obtain an extra perspective at high level and to gain more
information on the average level of BIA and ITO (influence). The short survey is limited to 6 questions
on the BIA measurement and 1 question on ITO.
2
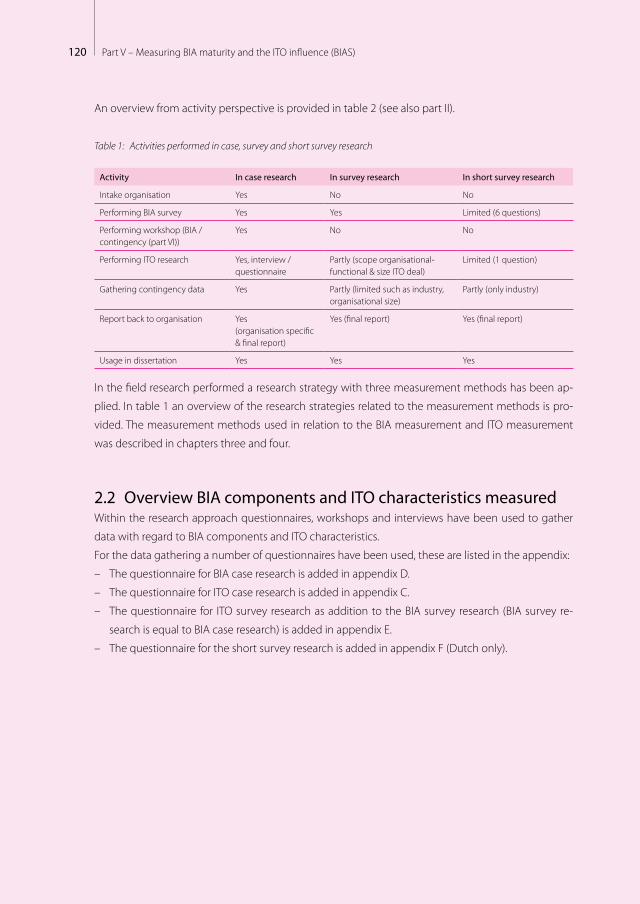
120 Part V – Measuring BIA maturity and the ITO influence (BIAS)
An overview from activity perspective is provided in table 2 (see also part II).
Table 1: Activities performed in case, survey and short survey research
Activity In case research In survey research In short survey research
Intake organisation Yes No No
Performing BIA survey Yes Yes Limited (6 questions)
Performing workshop (BIA / contingency (part VI))
Yes No No
Performing ITO research Yes, interview / questionnaire
Partly (scope organisational- functional & size ITO deal)
Limited (1 question)
Gathering contingency data Yes Partly (limited such as industry, organisational size)
Partly (only industry)
Report back to organisation Yes (organisation specific & final report)
Yes (final report) Yes (final report)
Usage in dissertation Yes Yes Yes
In the field research performed a research strategy with three measurement methods has been ap-
plied. In table 1 an overview of the research strategies related to the measurement methods is pro-
vided. The measurement methods used in relation to the BIA measurement and ITO measurement
was described in chapters three and four.
2.2 Overview BIA components and ITO characteristics measuredWithin the research approach questionnaires, workshops and interviews have been used to gather
data with regard to BIA components and ITO characteristics.
For the data gathering a number of questionnaires have been used, these are listed in the appendix:
– The questionnaire for BIA case research is added in appendix D.
– The questionnaire for ITO case research is added in appendix C.
– The questionnaire for ITO survey research as addition to the BIA survey research (BIA survey re-
search is equal to BIA case research) is added in appendix E.
– The questionnaire for the short survey research is added in appendix F (Dutch only).

1212 Measuring BIA maturity & ITO influence
Table 2. BIA Components and ITO characteristics measured.
met
hod Components /
characteristics identified Case research Survey research
Short survey research remarks
BIA
mea
sure
men
t (su
rvey
) Communication All (6) sub components
All (6) sub components
1 generic question Case & survey research equal
Value Measurements All (8) sub components
All (8) sub components
1 generic question Case & survey research equal
Governance All (7) sub components
All (7) sub components
1 generic question Case & survey research equal
Partnership All (6) sub components
All (6) sub components
1 generic question Case & survey research equal
Scope & architecture All (5) sub components
All (5) sub components
1 generic question Case & survey research equal
Skills All (7) sub components
All (7) sub components
1 generic question Case & survey research equal
exte
rnal
ITO
mea
sure
men
t Type ITO relationship Measured Measured Not measured Case only
Scope ITO organisational
Measured Not measured Not measured Case only
Scope ITO functional Measured (18 sub characteristics)
Measured (18 sub characteristics)
1 generic question Case & survey research equal
Vendor construction Measured Not measured Not measured Case only
Governance of ITO Measured (11 sub characteristics)
Not measured Not measured Case only
ITO experience Measured (4 sub characteristics)
Partly measured (1 sub factor: size of outsourcing deal)
Not measured Case survey research (1 sub factor)
ITO contract Measured Not measured Not measured Case only
ITO Project management
Measured Not measured Not measured Case only
ITO Service level management
Measured Not measured Not measured Case only
ITO Transition result Measured (2 sub characteristics)
Not measured Not measured Case only

122 Part V – Measuring BIA maturity and the ITO influence (BIAS)

1233 Measuring BIA maturity
“Worrying is a waste of time” Best advice received from Hermen Hulst (managing director Guerilla games).
Source Intermediair (14/05/2009))
Measuring BIA maturityThe BIA maturity is measured using the Strategic Alignment Maturity [Luftman, 2003]. For measuring
the BIA maturity, an online questionnaire was used equal for both the case studies and the broader
survey (see chapter 2). In this chapter, the methodology of measuring BIA is described as related to
SAM and part III. The questionnaire used is displayed in English (appendix D). The Dutch question-
naire was used mostly for the Dutch based organisations and is available via www.bitti.nl.
In the first paragraph, the measurement methodology of the Luftman method is described. Second-
ly, the usage of the BIA measurement results is discussed, followed by the statistical approach in the
third paragraph. The fourth paragraph of this chapter is about the short survey results with regard to
BIA. In the last part of this chapter, an example is provided.
3.1 Measuring BIA maturity using Luftman measurement methodFor both the survey, as well as the case study, the Luftman measurement method was used. Within all
organisations, business and IT managers completed an online questionnaire with several questions.
In the table on the next page, the sub components directly related to the six components of the
Luftman measurement method are described. The colour reflects the results of the literature research
(part III).
3

124 Part V – Measuring BIA maturity and the ITO influence (BIAS)
Table 3. Measuring BIA maturity.
Sub componentBrief description sub component including colour support literature (part III) BIA component BIA-score
COM_1 Understanding of Business by IT CommunicationsScore 1-5 (level)
BIA maturityScore 1-5 (level)
COM_2 Understanding of IT by business
COM_3 Inter/Intra organisational learning / education
COM_4 Protocol rigidity
COM_5 Knowledge sharing
COM_6 Liaison(s) effectiveness
VAL_1 IT metrics Value measurementScore 1-5 (level)VAL_2 Business metrics
VAL_3 Balanced metrics
VAL_4 Service level agreements
VAL_5 Benchmarking
VAL_6 Formal assessments / reviews
VAL_7 Continuous improvement
VAL_8 Proven contribution of IT to the business
GOV_1 Business strategic planning Governance Score 1-5 (level)The sub component GOVorg does not measure a maturity level but provide background on organisa-tional structure (e.g. centralized).
GOV _2 IT strategic planning
GOVorg Organisation structure
GOV_3 Budgetary control
GOV_4 IT investment management
GOV_5 Steering committee’s
GOV_6 Prioritisation process
GOV_7 React/respond quickly
PAR_1 Business perception of IT value Partnership Score 1-5 (level)PAR_2 Role of IT in strategic business planning
PAR_3 Shared goals, risks, rewards, penalties
PAR_4 IT program management
PAR_5 Relationship / trust style
PAR_6 Business sponsor / champion
ARC_1 Traditional / enabler / driver / external Scope & Architecture Score 1-5 (level)ARC_2 Standards articulation
ARC_3 Architectural integration
ARC_4 Architectural transparency, agility, flexibility
ARC_5 Manage emerging technology
SKI_1 Innovation, entrepreneurship SkillsScore 1-5 (level)SKI_2 Locus of power
SKI_3 Change readiness
SKI_4 Career crossover
SKI_5 Education, training
SKI_6 Social, political, trusting environment
SKI_7 Hiring & retaining
As described in part III the less supported indicators for BIA have been measured despite only aver-
age or poor literature support. The levels are described in 1.2.
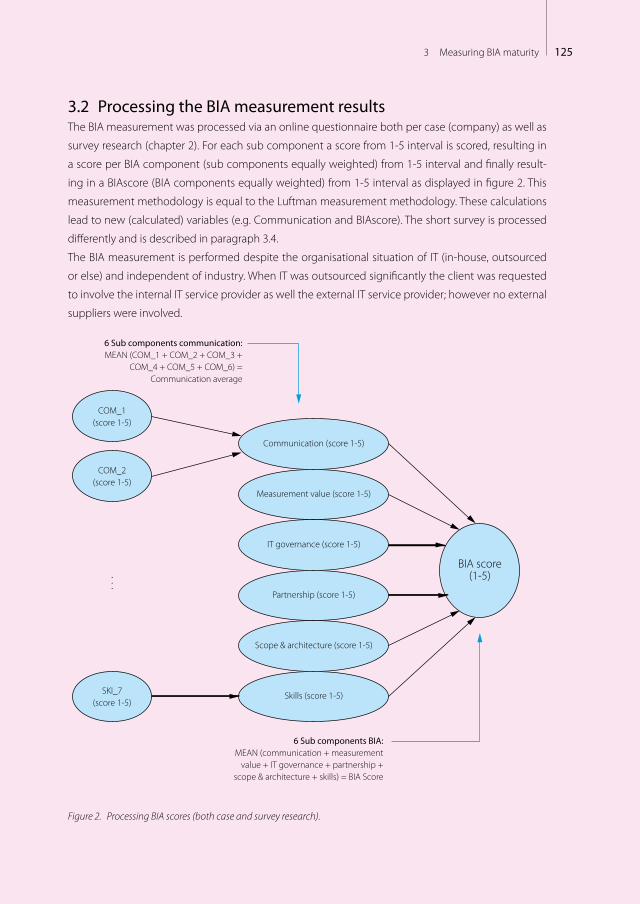
1253 Measuring BIA maturity
3.2 Processing the BIA measurement results The BIA measurement was processed via an online questionnaire both per case (company) as well as
survey research (chapter 2). For each sub component a score from 1-5 interval is scored, resulting in
a score per BIA component (sub components equally weighted) from 1-5 interval and finally result-
ing in a BIAscore (BIA components equally weighted) from 1-5 interval as displayed in figure 2. This
measurement methodology is equal to the Luftman measurement methodology. These calculations
lead to new (calculated) variables (e.g. Communication and BIAscore). The short survey is processed
differently and is described in paragraph 3.4.
The BIA measurement is performed despite the organisational situation of IT (in-house, outsourced
or else) and independent of industry. When IT was outsourced significantly the client was requested
to involve the internal IT service provider as well the external IT service provider; however no external
suppliers were involved.
Communication (score 1-5)
COM_1(score 1-5)
BIA score(1-5)
COM_2(score 1-5)
SKI_7(score 1-5)
Measurement value (score 1-5)
IT governance (score 1-5)
Partnership (score 1-5)
Scope & architecture (score 1-5)
Skills (score 1-5)
6 Sub components BIA:MEAN (communication + measurement
value + IT governance + partnership + scope & architecture + skills) = BIA Score
6 Sub components communication:MEAN (COM_1 + COM_2 + COM_3 +
COM_4 + COM_5 + COM_6) = Communication average
.
.
.
Figure 2. Processing BIA scores (both case and survey research).

126 Part V – Measuring BIA maturity and the ITO influence (BIAS)
3.3 Processing the BIA responses statisticallyIn the previous paragraphs, the measurement method for BIA part has been described. Using survey
research, as well as case study, an equal working method was needed to process the results. All re-
sponses have been processed in a statistical package (SPSS). For the BIA responses the activities were
performed similar for all respondents using techniques described by Baarda [2011] as described in
table 4. With regard to using ordinal/interval scale there has been a continuing controversy in which
the usage of ordinal scale is discussed compared to interval level [Stevens,1946],[Knapp, 1990],[Walk-
er, 1999], [Jamieson, 2004], [Brown, 2011] . In this dissertation five-point Likert scales were used as in-
terval. This choice is based on the statement: “They also appeal to the work of Baker, Hardyk and
Petrinovich, Labovitz, and others who have shown empirically that it matters little if an ordinal scale is
treated as an interval scale.” [Knapp, 1990]. At organisational level the variables are at interval level (cal-
culated means) at respondent level they are at interval level based upon five-point Likert.
The responses within a company have been processed per company based on average scores of the
respondents within the company (total, business respondents, IT respondents).
The actions have been data entry (processing all data in survey); correcting (e.g. removing invalid
response) and creating newly calculated variables (e.g. BIAscore). The new calculated variables were
made per individual respondent and afterwards further calculations were made per organisation or
per perspective (e.g. business and IT) for analysis purposes on an organisational level or otherwise.
Table 4. Actions performed in statistical package (SPSS) for BIA (case & survey).
Activity Description Actions SPSS actions
Data entry Creating SPSS framework for data usage and importing data from survey tool (surveymonkey.com) in SPSS
Defining variablesImporting data
Variable View filled with variable descriptions and scalesData imported
Corrections Corrective actions are needed to realise a useful survey: remove invalid responses, remove double responses, correct data
Removing invalid responses; all answers same. Impossible answers
Select invalid data and clear. Also cases with multiple miss-ing data are omitted (listwise delation).
Removing double responses
Sort data, select double (identical response) data and clear up to one response
Correct data: ‘don’t know’ was score 6 but is not part of ‘scoring’ and had to be changed in ‘no data’ 1
Recode ‘NVT/don’t know’ in a system missing. E.g. for COM2 the original system missing data was 55 and 18 were scored 6 (don’t know) after recoding 73 system missing data were reported (based on 528 valid cases (date: 22/10/2011). This is done for: COM_1 to COM_6, VAL_1 to VAL_7, GOV_1 to GOV_8 (GOVorg is not a level question), PAR_1 to PAR_6, ARC_1 to ARC_5, SKI_1 to SKI_7
Correct data: identifica-tion of respondents within same company & same industry
For variables ‘companyresp’ (companyname respondent) and ‘industry’ (industry) different respondents use different names e.g. ‘housing corporation ABC’ and ‘ABC’. This is changed in the same company name (e.g. ABC). Within industries respondents sometimes choose ‘other’ where a choice would have been applicable (e.g. company name housing corporation ABC = Housing corporation).
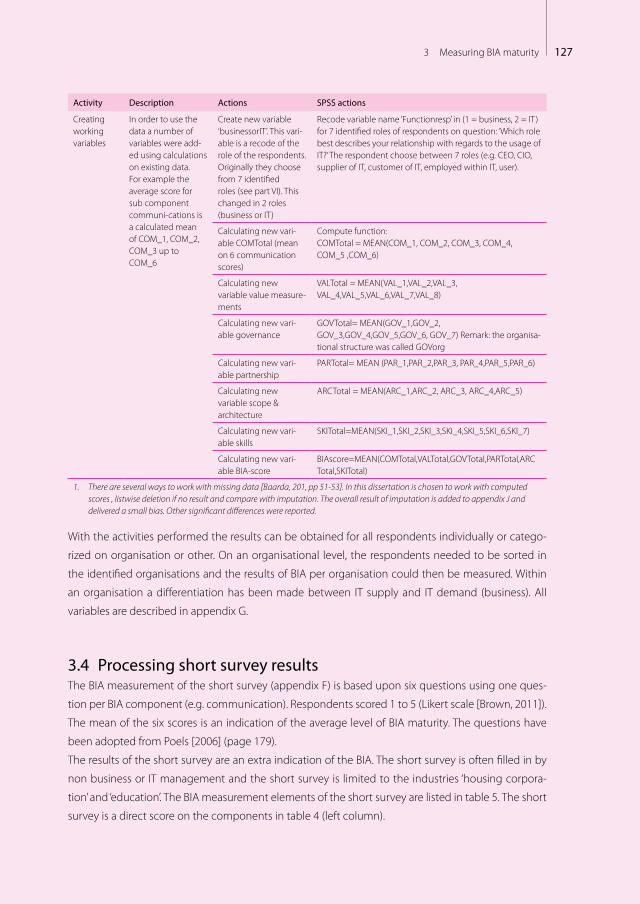
1273 Measuring BIA maturity
Activity Description Actions SPSS actions
Creating working variables
In order to use the data a number of variables were add-ed using calculations on existing data. For example the average score for sub component communi-cations is a calculated mean of COM_1, COM_2, COM_3 up to COM_6
Create new variable ‘businessorIT’. This vari-able is a recode of the role of the respondents. Originally they choose from 7 identified roles (see part VI). This changed in 2 roles (business or IT)
Recode variable name ‘Functionresp’ in (1 = business, 2 = IT) for 7 identified roles of respondents on question: ‘Which role best describes your relationship with regards to the usage of IT?’ The respondent choose between 7 roles (e.g. CEO, CIO, supplier of IT, customer of IT, employed within IT, user).
Calculating new vari-able COMTotal (mean on 6 communication scores)
Compute function: COMTotal = MEAN(COM_1, COM_2, COM_3, COM_4, COM_5 ,COM_6)
Calculating new variable value measure-ments
VALTotal = MEAN(VAL_1,VAL_2,VAL_3, VAL_4,VAL_5,VAL_6,VAL_7,VAL_8)
Calculating new vari-able governance
GOVTotal= MEAN(GOV_1,GOV_2, GOV_3,GOV_4,GOV_5,GOV_6, GOV_7) Remark: the organisa-tional structure was called GOVorg
Calculating new vari-able partnership
PARTotal= MEAN (PAR_1,PAR_2,PAR_3, PAR_4,PAR_5,PAR_6)
Calculating new variable scope & architecture
ARCTotal = MEAN(ARC_1,ARC_2, ARC_3, ARC_4,ARC_5)
Calculating new vari-able skills
SKITotal=MEAN(SKI_1,SKI_2,SKI_3,SKI_4,SKI_5,SKI_6,SKI_7)
Calculating new vari-able BIA-score
BIAscore=MEAN(COMTotal,VALTotal,GOVTotal,PARTotal,ARCTotal,SKITotal)
1. There are several ways to work with missing data [Baarda, 201, pp 51-53]. In this dissertation is chosen to work with computed scores , listwise deletion if no result and compare with imputation. The overall result of imputation is added to appendix J and delivered a small bias. Other significant differences were reported.
With the activities performed the results can be obtained for all respondents individually or catego-
rized on organisation or other. On an organisational level, the respondents needed to be sorted in
the identified organisations and the results of BIA per organisation could then be measured. Within
an organisation a differentiation has been made between IT supply and IT demand (business). All
variables are described in appendix G.
3.4 Processing short survey resultsThe BIA measurement of the short survey (appendix F) is based upon six questions using one ques-
tion per BIA component (e.g. communication). Respondents scored 1 to 5 (Likert scale [Brown, 2011]).
The mean of the six scores is an indication of the average level of BIA maturity. The questions have
been adopted from Poels [2006] (page 179).
The results of the short survey are an extra indication of the BIA. The short survey is often filled in by
non business or IT management and the short survey is limited to the industries ‘housing corpora-
tion’ and ‘education’. The BIA measurement elements of the short survey are listed in table 5. The short
survey is a direct score on the components in table 4 (left column).
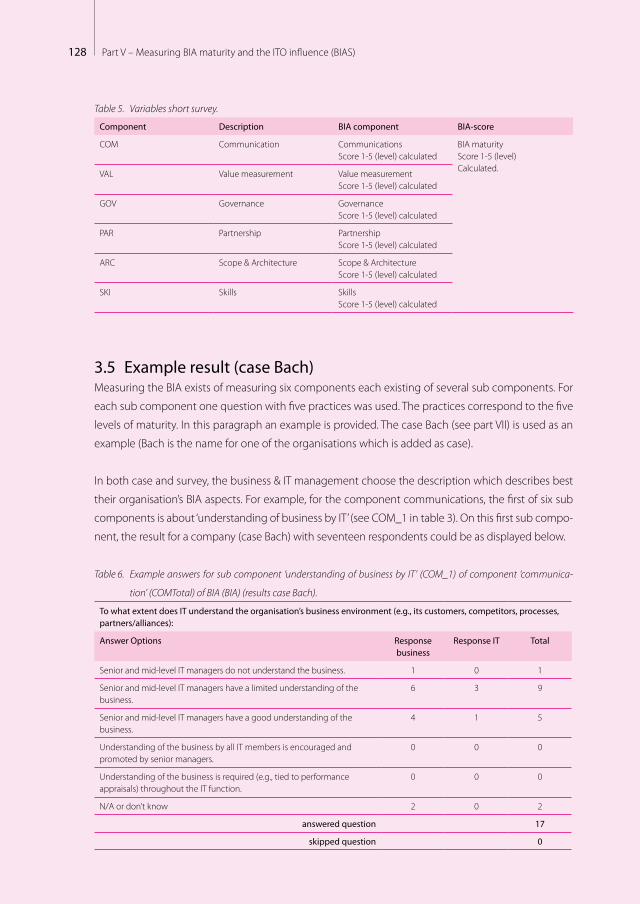
128 Part V – Measuring BIA maturity and the ITO influence (BIAS)
Table 5. Variables short survey.
Component Description BIA component BIA-score
COM Communication CommunicationsScore 1-5 (level) calculated
BIA maturity Score 1-5 (level)Calculated.
VAL Value measurement Value measurement Score 1-5 (level) calculated
GOV Governance Governance Score 1-5 (level) calculated
PAR Partnership Partnership Score 1-5 (level) calculated
ARC Scope & Architecture Scope & Architecture Score 1-5 (level) calculated
SKI Skills Skills Score 1-5 (level) calculated
3.5 Example result (case Bach)Measuring the BIA exists of measuring six components each existing of several sub components. For
each sub component one question with five practices was used. The practices correspond to the five
levels of maturity. In this paragraph an example is provided. The case Bach (see part VII) is used as an
example (Bach is the name for one of the organisations which is added as case).
In both case and survey, the business & IT management choose the description which describes best
their organisation’s BIA aspects. For example, for the component communications, the first of six sub
components is about ‘understanding of business by IT’ (see COM_1 in table 3). On this first sub compo-
nent, the result for a company (case Bach) with seventeen respondents could be as displayed below.
Table 6. Example answers for sub component ‘understanding of business by IT’ (COM_1) of component ‘communica-
tion’ (COMTotal) of BIA (BIA) (results case Bach).
To what extent does IT understand the organisation’s business environment (e.g., its customers, competitors, processes, partners/alliances):
Answer Options Response business
Response IT Total
Senior and mid-level IT managers do not understand the business. 1 0 1
Senior and mid-level IT managers have a limited understanding of the business.
6 3 9
Senior and mid-level IT managers have a good understanding of the business.
4 1 5
Understanding of the business by all IT members is encouraged and promoted by senior managers.
0 0 0
Understanding of the business is required (e.g., tied to performance appraisals) throughout the IT function.
0 0 0
N/A or don’t know 2 0 2
answered question 17
skipped question 0
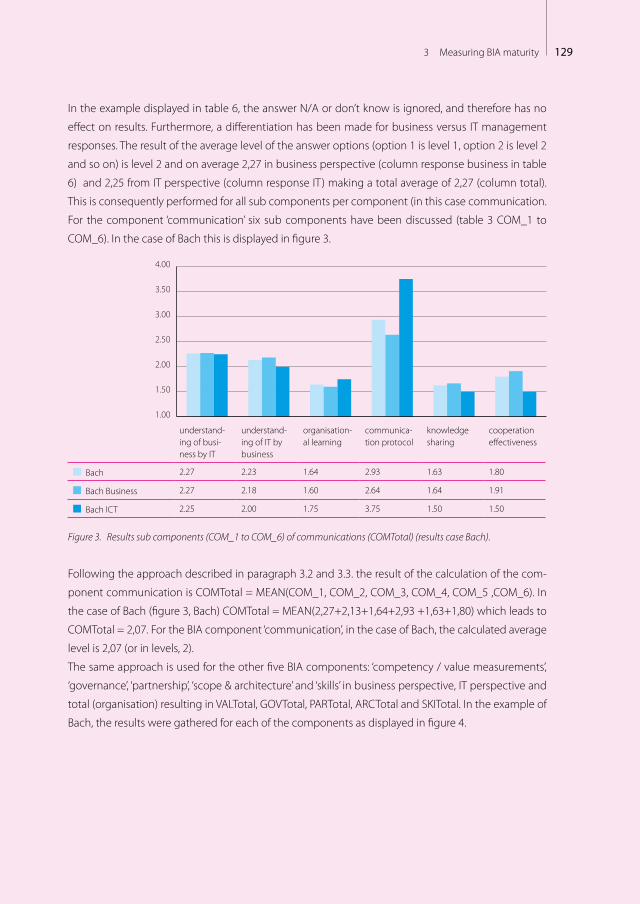
1293 Measuring BIA maturity
In the example displayed in table 6, the answer N/A or don’t know is ignored, and therefore has no
effect on results. Furthermore, a differentiation has been made for business versus IT management
responses. The result of the average level of the answer options (option 1 is level 1, option 2 is level 2
and so on) is level 2 and on average 2,27 in business perspective (column response business in table
6) and 2,25 from IT perspective (column response IT) making a total average of 2,27 (column total).
This is consequently performed for all sub components per component (in this case communication.
For the component ‘communication’ six sub components have been discussed (table 3 COM_1 to
COM_6). In the case of Bach this is displayed in figure 3.
1.00
1.50
2.00
2.50
3.00
3.50
4.00
understand-ing of busi-ness by IT
understand-ing of IT by business
organisation-al learning
communica-tion protocol
knowledge sharing
cooperation effectiveness
Bach 2.27 2.23 1.64 2.93 1.63 1.80
Bach Business 2.27 2.18 1.60 2.64 1.64 1.91
Bach ICT 2.25 2.00 1.75 3.75 1.50 1.50
Figure 3. Results sub components (COM_1 to COM_6) of communications (COMTotal) (results case Bach).
Following the approach described in paragraph 3.2 and 3.3. the result of the calculation of the com-
ponent communication is COMTotal = MEAN(COM_1, COM_2, COM_3, COM_4, COM_5 ,COM_6). In
the case of Bach (figure 3, Bach) COMTotal = MEAN(2,27+2,13+1,64+2,93 +1,63+1,80) which leads to
COMTotal = 2,07. For the BIA component ‘communication’, in the case of Bach, the calculated average
level is 2,07 (or in levels, 2).
The same approach is used for the other five BIA components: ‘competency / value measurements’,
‘governance’, ‘partnership’, ‘scope & architecture’ and ‘skills’ in business perspective, IT perspective and
total (organisation) resulting in VALTotal, GOVTotal, PARTotal, ARCTotal and SKITotal. In the example of
Bach, the results were gathered for each of the components as displayed in figure 4.
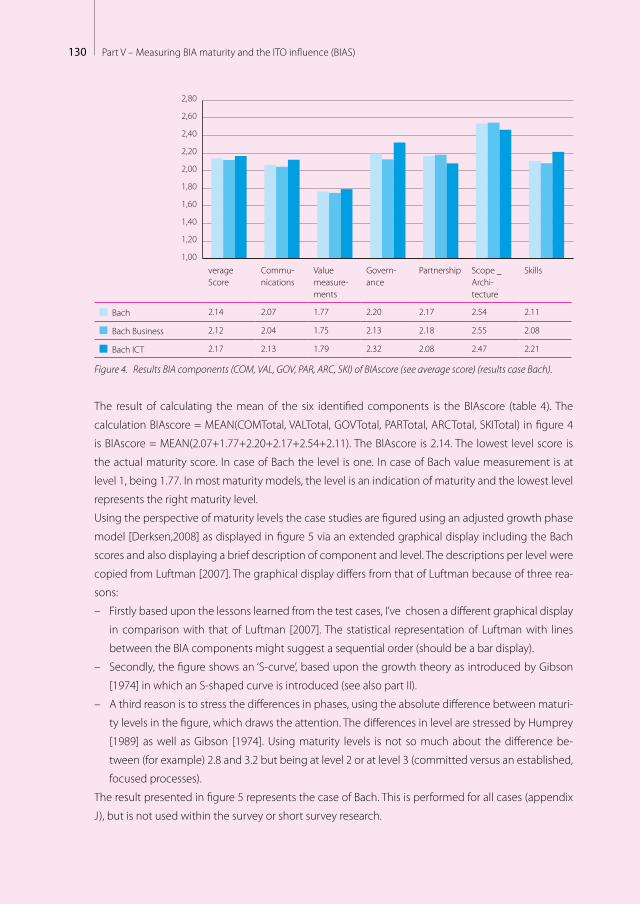
130 Part V – Measuring BIA maturity and the ITO influence (BIAS)
1,00
1,20
1,40
1,60
1,80
2,00
2,20
2,40
2,60
2,80
verage Score
Commu-nications
Value measure-ments
Govern-ance
Partnership Scope _ Archi-tecture
Skills
Bach 2.14 2.07 1.77 2.20 2.17 2.54 2.11
Bach Business 2.12 2.04 1.75 2.13 2.18 2.55 2.08
Bach ICT 2.17 2.13 1.79 2.32 2.08 2.47 2.21
Figure 4. Results BIA components (COM, VAL, GOV, PAR, ARC, SKI) of BIAscore (see average score) (results case Bach).
The result of calculating the mean of the six identified components is the BIAscore (table 4). The
calculation BIAscore = MEAN(COMTotal, VALTotal, GOVTotal, PARTotal, ARCTotal, SKITotal) in figure 4
is BIAscore = MEAN(2.07+1.77+2.20+2.17+2.54+2.11). The BIAscore is 2.14. The lowest level score is
the actual maturity score. In case of Bach the level is one. In case of Bach value measurement is at
level 1, being 1.77. In most maturity models, the level is an indication of maturity and the lowest level
represents the right maturity level.
Using the perspective of maturity levels the case studies are figured using an adjusted growth phase
model [Derksen,2008] as displayed in figure 5 via an extended graphical display including the Bach
scores and also displaying a brief description of component and level. The descriptions per level were
copied from Luftman [2007]. The graphical display differs from that of Luftman because of three rea-
sons:
– Firstly based upon the lessons learned from the test cases, I’ve chosen a different graphical display
in comparison with that of Luftman [2007]. The statistical representation of Luftman with lines
between the BIA components might suggest a sequential order (should be a bar display).
– Secondly, the figure shows an ‘S-curve’, based upon the growth theory as introduced by Gibson
[1974] in which an S-shaped curve is introduced (see also part II).
– A third reason is to stress the differences in phases, using the absolute difference between maturi-
ty levels in the figure, which draws the attention. The differences in level are stressed by Humprey
[1989] as well as Gibson [1974]. Using maturity levels is not so much about the difference be-
tween (for example) 2.8 and 3.2 but being at level 2 or at level 3 (committed versus an established,
focused processes).
The result presented in figure 5 represents the case of Bach. This is performed for all cases (appendix
J), but is not used within the survey or short survey research.

1313 Measuring BIA maturity
Informalpervasive
Optimized processes
Improved, managed
processes
Esthablished,focuses
processes
Committedprocesses
Initial or ad hoc
processes
Bonding, uni�ed
Cost e�ective
Some partner-value;
Dashboard managed
Some cost
e�ectiveness; Dashboard
established
IT enables/drives business strategy
IT seen as an asset; Process driver;Con�ict seen as creative
Shared risk & rewards
Emerging value service provider;Balanced tech & business hiring
Relevant process
across the organisation
Relevant process
across the organisation
Good understanding;
Emerging relaxed
Limited business / IT understanding,
Business / IT lack understanding,
Functional cost e�ciency
Some technical measurements
No formal process,cost center, reactive
priorities
Con�ict; IT a cost of doing
business
Traditional (e.g., acctng, email)
IT takes risk, little reward;
Technical training
Tactical at Functional
level,occasional
responsive
IT emerging as an asset;
Process enabler
Transaction (e.g., ESS, DSS)
Di�ers across functional organisations
Integrated with partners
Integrated across the organisation
Extende to external
partners
Integrated across the
org. & partners
Evolve with partners
IT-bunisness co-adaptive
Improvisation-al
Education/careers/rewards across the organisation
Communication
ValueGovernance Partnership Scope &
architectureSkills
Bach
BIA score from:BusinessICT supply
N : 17Mean BIA: 2.14BIA level: 1 (lowest)
Figure 5: Presenting BIA score in case study only (content copied from Luftman [2007], graphical model copied
[Derksen,2008]). (Case Bach).
3.6 Usage of results at case studyFor measuring the level of BIA the measurement approach of Luftman was used first. Secondly a struc-
tured workshop with the surveyed business & IT senior executives of the organisations was held, for in
depth and control purposes. The structured workshop was held when the case organisation chose to
(most cases did). In a number of cases the organisation did not want to perform the workshop. In those
cases, the results found were tested in discussion with the IT manager (interview). Depending on the
number of responses the case was kept (minimum of four respondents representing both business & IT
management). If the case did not meet this minimum the case was processed as a survey result. Three
perceived cases became survey results due to limitations in response and lacking the workshop results.
Using the Luftman measurement approach and revisiting the results during the workshop gave a
representative view on the organisations’ level of BIA, and the discussions held contributed to a bet-

132 Part V – Measuring BIA maturity and the ITO influence (BIAS)
ter understanding. No changes in the Luftman measurement approach were made during or after
the workshops. The workshops used the following structure:
– presenting summary of BIA measurement results;
– brainstorm with two questions:
– Which of the BIA measurement components determined the results of the BIA measurement
according to the participants?
– What is the relative importance of these components (cause analysis)?
– brainstorm about measured importance of BIA components on maturity level per BIA measure-
ment component with questions:
– Why this result?
– What is the influence of this result?
– determining the contingency components Attitude, Behaviour, Culture (see part VI);
– discussing BIA findings results with causes of ‘score’;
– brainstorm possible interventions [Poels, 2006] for improving BIA (this is not part of the research
but to consult the participating organisation).
The brainstorming parts of the workshop all followed the same structure:
– short introduction of the item on which the brainstorm will focus;
– a limited time of 10 minutes to brainstorm and record the answers to the questions;
– ordering the results against the six Luftman BIA areas in an Ishikawa structure [Ishikawa, 1990] for
both root cause analysis as well as identification of improvement interventions (see figure 6). This
is not part of the research but to support the participating organisation;
– brief discussion about the results and group prioritisation.
A case example of the results of the first brainstorm subject (causes of BIA score) is pictured in figure 6.
Communication Measures IT Governance
Business & ITalignmentscore: 2.56
Partnership IT Scope Skills
Focus internal
Communication is limitedand mostly
from management
Not clear on whichSchubert (department) focus
Failure/wrong experiencedon't deliver proposed product
Co-creation in Architecture
Enterprise architecturenot communicated
Politics
Forced unionization
No clear structure
Partnership onlyat strategic level
Focus on control not ate�ectiveness and added value
Schubert not capable in moving fast
Werkprocessen niet ofgedeeltelijk beschreven
Too much external hiring,feeling with work �eld is missing
Awareness that changesneed be continued
Business caseis not used su�cient
Geographical structure of SchubertMoney is determining factor
Autonomic departments:di�erent stake holders, reward political
Limited to nomeasurements
Complex governanceof Schubert (multiple layers)
Decision-making competence complex
Change readiness is low
Management not always familiar with work processes
Start of standardisationIgnoranceWhat change managementdelivers to products
Business is not in de lead
Bureaucratic
Figure 6. Brainstorm result cause analysis BIA(S) score case Schubert (translated).

1333 Measuring BIA maturity
The working approach of the BIA survey of Luftman and the workshop was tested at the first case
and was afterwards discussed with the expert panel. Based on the responses during the workshop
and discussion with the expert panel, a few questions were added (contingency) and a few were
simplified due to lack of familiarity of a number of questions in the Dutch market. With these ad-
aptations, the first case was adjusted in coordination with the researched organisation. This case is
included in the research.

134 Part V – Measuring BIA maturity and the ITO influence (BIAS)
1354 Measuring the ITO characteristic’s influence
“Make sure you get sufficient sleep” Best advice received from Willem Bouwens (chairman Mensa International).
Source Intermediair (10/9/2009)
Measuring the ITO characteristic’s influenceThe ITO characteristics were measured differently for the survey study, the case research and the
short survey. In the case research, several extra ITO characteristics have been researched where the
survey research was limited in the number of characteristics. In paragraph 4.1 the ITO characteristics,
which were measured equally for survey and case research are described. In paragraph 4.2 the case
research measurement method is provided.
4.1 Introducing the ITO measurement mechanismBased upon the literature research, as described in part IV, a number of ITO characteristics were iden-
tified. These are:
1. type of ITO relationship;
2. scope of ITO – organisational;
3. scope of ITO – functional;
4. vendor construction;
5. governance of ITO;
6. ITO experience;
7. ITO contract;
8. ITO project management;
9. ITO service (level) management;
10. ITO transition result.
4

136 Part V – Measuring BIA maturity and the ITO influence (BIAS)
In the measurement mechanism, three viewpoints were used for measuring the ITO influence and
BIA:
1. degree of ITO. Measuring how much is outsourced and the scope of ITO (what);
2. maturity of ITO. Measuring the maturity of ITO;
3. other characteristics of ITO. Measuring identified ITO characteristics that determine ITO (part IV).
These three viewpoints are described in more detail in paragraphs 4.1.1, 4.1.2. and 4.1.3. In 4.1.4 an
overview of the measured ITO characteristics and the deviation in the three viewpoints of ITO are
presented as well as the reasoning of these variables..
4.1.1 Defining degree of ITOThe degree of ITO indicates how much is being outsourced. In part IV a reference to ‘what is out-
sourced’ was made using Apte et al [1997], Delen [2005] and Gianotten [2008]. The identified ITO
characteristic ‘functional scope’ can provide insight in ‘what is ITO’. For each of the eighteen activi-
ties within the identified ITO characteristic (see table 4 part IV) ‘how much is being outsourced’ was
measured using an five point Likert scale (1-5) for each individual organisation. This measurement is
also performed in the outsourcing performance outlook [Gianotten, 2008].
In this research the degree of ITO is defined as:
“The degree of ITO describes the size (how much) of IT services is outsourced. “
Two ITO characteristics were identified as primary indicators for the degree of ITO based upon the
research of Gianotten [2008]. Another reason for these two characteristics is while these measure
how much is being outsourced (part IV) whereas the other identified characteristics measure other
ITO elements (maturity and ITO structure). These are ‘functional scope’ and ‘sourcing experience – size
of outsourcing deal’.
Within my research I differentiate five degrees of ITO on an Likert (interval) scale (See remarks with
regard to working with Likert / interval scale in chapter 3.3. of this part.):
1. None / not significant ITO / completely internally sourced
2. Limited ITO / largely internally sourced
3. Partly ITO / internally sourced
4. Significantly ITO / limited internally sourced
5. Completely ITO / none/not significant internally sourced
Based on the literature research and my findings, I used the classification of none, limited, partly,
significant or completely described in table 7.
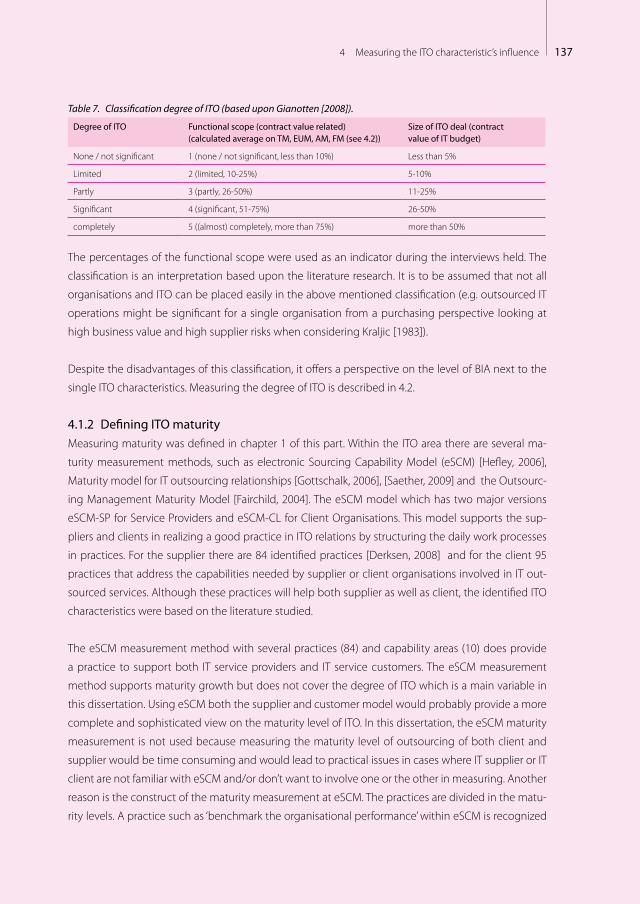
1374 Measuring the ITO characteristic’s influence
Table 7. Classification degree of ITO (based upon Gianotten [2008]).
Degree of ITO Functional scope (contract value related)(calculated average on TM, EUM, AM, FM (see 4.2))
Size of ITO deal (contract value of IT budget)
None / not significant 1 (none / not significant, less than 10%) Less than 5%
Limited 2 (limited, 10-25%) 5-10%
Partly 3 (partly, 26-50%) 11-25%
Significant 4 (significant, 51-75%) 26-50%
completely 5 ((almost) completely, more than 75%) more than 50%
The percentages of the functional scope were used as an indicator during the interviews held. The
classification is an interpretation based upon the literature research. It is to be assumed that not all
organisations and ITO can be placed easily in the above mentioned classification (e.g. outsourced IT
operations might be significant for a single organisation from a purchasing perspective looking at
high business value and high supplier risks when considering Kraljic [1983]).
Despite the disadvantages of this classification, it offers a perspective on the level of BIA next to the
single ITO characteristics. Measuring the degree of ITO is described in 4.2.
4.1.2 Defining ITO maturityMeasuring maturity was defined in chapter 1 of this part. Within the ITO area there are several ma-
turity measurement methods, such as electronic Sourcing Capability Model (eSCM) [Hefley, 2006],
Maturity model for IT outsourcing relationships [Gottschalk, 2006], [Saether, 2009] and the Outsourc-
ing Management Maturity Model [Fairchild, 2004]. The eSCM model which has two major versions
eSCM-SP for Service Providers and eSCM-CL for Client Organisations. This model supports the sup-
pliers and clients in realizing a good practice in ITO relations by structuring the daily work processes
in practices. For the supplier there are 84 identified practices [Derksen, 2008] and for the client 95
practices that address the capabilities needed by supplier or client organisations involved in IT out-
sourced services. Although these practices will help both supplier as well as client, the identified ITO
characteristics were based on the literature studied.
The eSCM measurement method with several practices (84) and capability areas (10) does provide
a practice to support both IT service providers and IT service customers. The eSCM measurement
method supports maturity growth but does not cover the degree of ITO which is a main variable in
this dissertation. Using eSCM both the supplier and customer model would probably provide a more
complete and sophisticated view on the maturity level of ITO. In this dissertation, the eSCM maturity
measurement is not used because measuring the maturity level of outsourcing of both client and
supplier would be time consuming and would lead to practical issues in cases where IT supplier or IT
client are not familiar with eSCM and/or don’t want to involve one or the other in measuring. Another
reason is the construct of the maturity measurement at eSCM. The practices are divided in the matu-
rity levels. A practice such as ‘benchmark the organisational performance’ within eSCM is recognized
138 Part V – Measuring BIA maturity and the ITO influence (BIAS)
as a level 4 practice. This is different from the measurement mechanism as used within the BIA meas-
urement using five levels.
The Maturity Model for ITO relationships (MM-ITO) [Gottschalk, 2006] uses a three stage model for
the evolution of ITO relationships. The three stages are: the cost stage, resource stage and partner-
ship stage. These are based upon eleven stage characteristics: economic benefits, primary transac-
tions, contractual completeness, vendor behaviour control, demarcation of labor, core competence
management, vendor resource exploitation, alliance exploitation, relationship exploitation, social ex-
change exploitation and stakeholder management. In this maturity model an overlap can be found
with the found characteristics as described in part IV. However this model uses three stages instead of
five and focuses on the relationship which is part of partnership in the already used BIA model (part
III).
The third model is the Outsourcing Management Maturity Model (META OMM model) [Fairchild,
2004]. This model was designed by a market consultancy organisation (META). This model uses five
levels (1= Vendor management fundamentals, 2 = Defined service outcome, 3 = Measurement, 4 =
Trust, 5 = Recognized business value). The OMM model is a commercially used model and therefore
the research mechanism could not be adopted. A number of criteria have been adopted in the BIA
model (part III) or ITO characteristics (part IV).
The ITO maturity models (eSCM, MM-ITO and OMM) did not fulfil the need for the BIAS measurement
mechanism. Elements of these models were adopted in part III and IV for measuring ITO maturity.
Based upon these findings and with study of the literature research (part IV), a measurement method
for the maturity of ITO was developed. The ITO characteristics found and used within the research
are described in this part. Adding the developed ITO measurement method, the BIA measurement
method was adjusted (measuring independently the maturity level of BIA and the degree and ma-
turity of ITO). For measuring ITO maturity the following ITO characteristics were used (see part IV for
description):
– governance of ITO;
– ITO experience;
– ITO contract;
– project management;
– service (level) management.
By adjusting the BIA measurement framework, a new framework was developed called BIA & ITO
(BIAS). The acronym BIAS was introduced where BIA and ITO is discussed providing maturity insights
in both BIA and ITO. BIAS is BIA in (partly) outSourced situations.
ITO is measured in an Likert five point scale and using the sub factors displayed in table 8. Five ITO
characteristics were identified (column three (ITO characteristic)) based upon multiple sub character-
istics (column one and two). All individual sub characteristics were measured using an Likert scale 1-5

1394 Measuring the ITO characteristic’s influence
in which level 1 represents a poor / not mature level of maturity and five presents level 5, a strong /
mature level of maturity.
Measuring the maturity of ITO is further described in 4.3.
Table 8. Measuring maturity of ITO.
Variable name Brief description sub char-acteristic (part IV)
ITO characteristic Classification (both sub and calculated ITO characteristics (see also 4.3):
SGOV_1 Sourcing strategy Governance of ITO Score 1-5
1 = level 1 / poor2 = level 2 / weak3 = level 3 / average4 = level 4 / strong5 = level 5 / very strong
SGOV_2 Business & IT strategy
SGOV_3 Information management
SGOV_4 Program & Project management
SGOV_5 Architecture
SGOV_6 Portfolio management
SGOV_7 Procurement
SGOV_8 Financial control
SGOV_9 Service management
SGOV_10 Innovation management
SGOV_11 Contract management
SEXP_1_1 Start of ITO deal – first deal ITO experience Score 1-5
1 = < 1 year 2 = 1 – 2,5 year 3 = 2,5 – 4 year 4 = 4 - 6 year 5 = > 6 year
SEXP_1_2 Start of ITO deal – current deal (most important if more suppliers)
SCOCO1 Clear specifications ITO contract Score 1-5
1 = level 1 / poor2 = level 2 / weak3 = level 3 / average4 = level 4 / strong5 = level 5 / very strong
SCOCO2 Prompt payment
SCOCO3 Close project monitoring
SCOCO4 Dedicated project staffing
SCOCO5 Knowledge sharing
SCOCO6 Project ownership
SCOSO1 Accurate project scoping
SCOSO2 Clear authority structures
SCOSO3 Effective human capital management
SCOSO4 Effective knowledge transfer
SCOSO5 Effective inter-organisational teams
SPR1 Level of maturity steering committee ITO project man-agement Score 1-5
SPR2 Level of project / program management supplier
SSLM Level of Service (level) man-agement supplier
ITO service (level) management Score 1-5
Same classification as VAL_4 but with regards to ITO1 = level 1 2 = level 2 3 = level 3 4 = level 4 5 = level 5

140 Part V – Measuring BIA maturity and the ITO influence (BIAS)
4.1.3 Defining other characteristics of ITO In part IV the ITO characteristics were identified. Besides the usage for ITO maturity and degree of ITO
the characteristics were used for measurement and analysis (part VII and IIX). The ITO characteristics
were all obtained. Below the characteristics (and possible sub characteristics) which were not used
for ITO maturity and/or degree of ITO are mentioned:
– type of ITO relationship;
– scope of ITO – organisational;
– vendor construction;
– ITO experience;
– length of outsourcing contract;
– ITO transition result;
– number of employees transferred in % of total IT organisation;
– careful transition of employees;
– guidance users before, during & after transition.
The sub characteristics and calculations with regards to ITO characteristics are described in paragraph 4.4.
4.1.4 Overview ITO measurement mechanismTwo elements have been identified as indicators for the degree of ITO: size of ITO deal and scope of
ITO – functional. The size of ITO deal is described in part IV as part of ITO experience. The size of ITO
deal proved to be a good indicator of how much is being outsourced. In the measurement method
this sub-indicator is used to identify the degree of ITO together with the scope of ITO-functional.
These two characteristics indicate what and how much is being outsourced.
Other characteristics (paragraph 4.1.2) measured provide insights of the capabilities needed in the
ITO relationship and are indicators of the outsourcing maturity. The characteristics stated in para-
graph 4.1.3 were also measured possibly impacting BIA.
The usage of the ITO characteristics within the measurement method is described in table 9. All char-
acteristics in the table are measured within the case study.
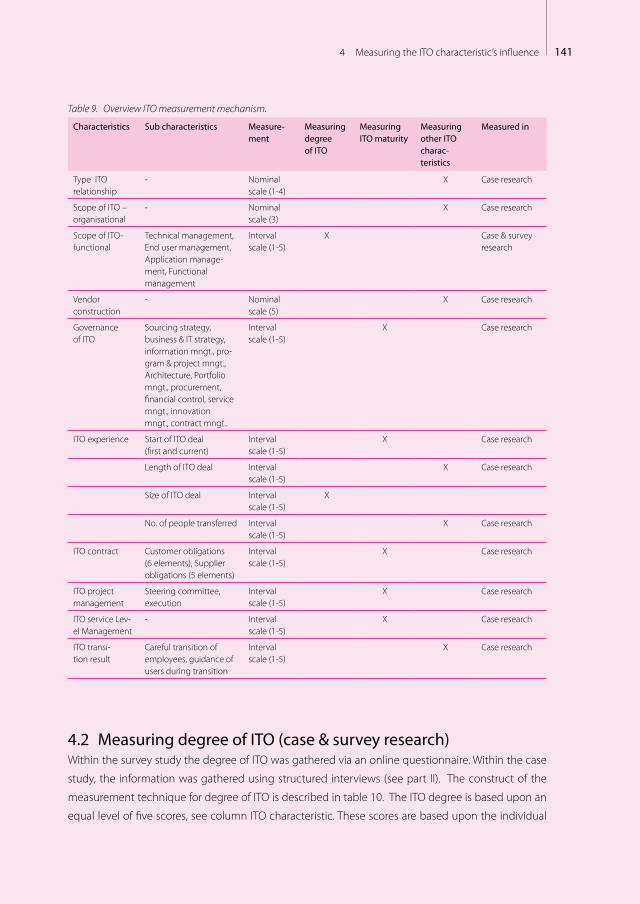
1414 Measuring the ITO characteristic’s influence
Table 9. Overview ITO measurement mechanism.
Characteristics Sub characteristics Measure-ment
Measuring degree of ITO
Measuring ITO maturity
Measuring other ITO charac-teristics
Measured in
Type ITO relationship
- Nominal scale (1-4)
X Case research
Scope of ITO – organisational
- Nominal scale (3)
X Case research
Scope of ITO-functional
Technical management, End user management, Application manage-ment, Functional management
Interval scale (1-5)
X Case & survey research
Vendor construction
- Nominal scale (5)
X Case research
Governance of ITO
Sourcing strategy, business & IT strategy, information mngt., pro-gram & project mngt., Architecture, Portfolio mngt., procurement, financial control, service mngt., innovation mngt., contract mngt..
Interval scale (1-5)
X Case research
ITO experience Start of ITO deal (first and current)
Interval scale (1-5)
X Case research
Length of ITO deal Interval scale (1-5)
X Case research
Size of ITO deal Interval scale (1-5)
X
No. of people transferred Interval scale (1-5)
X Case research
ITO contract Customer obligations (6 elements), Supplier obligations (5 elements)
Interval scale (1-5)
X Case research
ITO project management
Steering committee, execution
Interval scale (1-5)
X Case research
ITO service Lev-el Management
- Interval scale (1-5)
X Case research
ITO transi-tion result
Careful transition of employees, guidance of users during transition
Interval scale (1-5)
X Case research
4.2 Measuring degree of ITO (case & survey research)Within the survey study the degree of ITO was gathered via an online questionnaire. Within the case
study, the information was gathered using structured interviews (see part II). The construct of the
measurement technique for degree of ITO is described in table 10. The ITO degree is based upon an
equal level of five scores, see column ITO characteristic. These scores are based upon the individual

142 Part V – Measuring BIA maturity and the ITO influence (BIAS)
scores described in the third column (brief description sub characteristic (part IV)). The calculation
mechanism is described in table 7.
Table 10. Construct measuring degree of ITO (DegreeITO).
ITO characteristic Sub characteristic Brief description sub char-acteristic (part IV)
ITO characteristic
ITO-score
ITO experience SEXP_1 Size of ITO deal Size ITO deal Score 1-5
Degree ITOScore 1-5
Scope of ITO - functional
SS_2_TM1 Technical application management Technical man-agement Score 1-5
SS_2_TM2 Application hosting management
SS_2_TM3 Security Management
SS_2_TM4 External Networks
SS_2_EU1 Internal Networks End User Management Score 1-5
SS_2_EU2 File, Print, Mail Servers
SS_2_EU3 Workspace Automation
SS_2_EU4 Help & Service desk
SS_2_EU5 Break & fix services
SS_2_AM1 System Development Application Manage-ment Score 1-5
SS_2_AM2 System Integration
SS_2_AM3 Functional Application Integration
SS_2_AM4 Test Management
SS_2_FM1 Requirements Definition Functional manage-ment Score 1-5
SS_2_FM2 User & acceptance testing
SS_2_FM3 Realization not IT changes
SS_2_FM4 Coordinate IT
SS_2_FM5 Define information supply policy
Per sub characteristic, a score from 1-5 (interval scale) is identified, resulting in a score per ITO char-
acteristic (sub characteristics equally weighted) from 1-5 (scale) and finally resulting in a degree of
ITO score (ITO characteristics equally scored) from 1-5 (scale) as displayed below. This is performed
equally for both case and survey research. This approach is equal to the approach followed for the
BIA score.
When IT was outsourced significantly or completely, the client was requested to involve the external
IT service provider as well. In none of the cases the external IT service providers were involved. The
measurement method followed is displayed in figure 7.
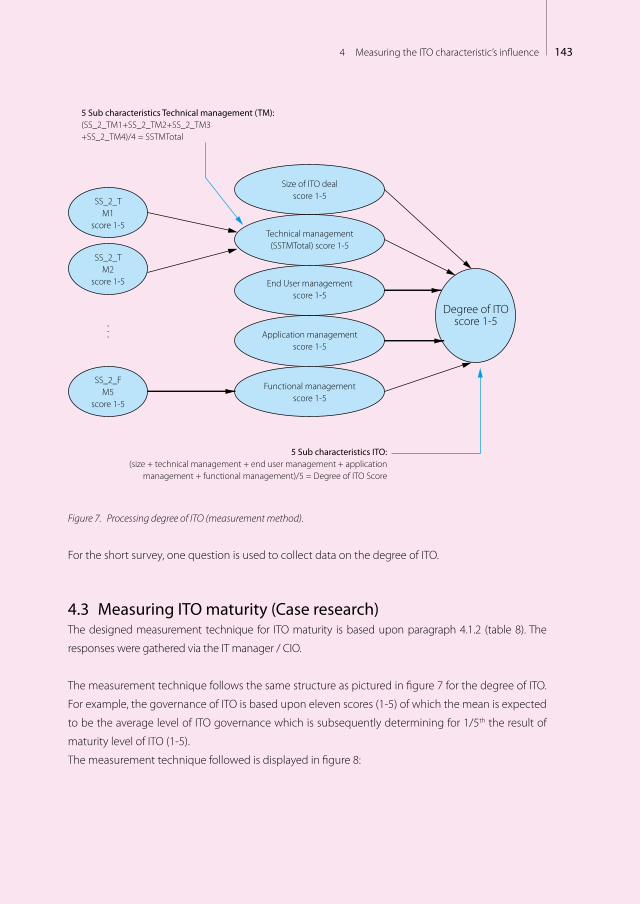
1434 Measuring the ITO characteristic’s influence
Size of ITO dealscore 1-5
Degree of ITOscore 1-5
SS_2_FM5
score 1-5
SS_2_TM2
score 1-5
SS_2_TM1
score 1-5Technical management
(SSTMTotal) score 1-5
End User management score 1-5
Application management score 1-5
Functional management score 1-5
5 Sub characteristics ITO:(size + technical management + end user management + application
management + functional management)/5 = Degree of ITO Score
5 Sub characteristics Technical management (TM):(SS_2_TM1+SS_2_TM2+SS_2_TM3+SS_2_TM4)/4 = SSTMTotal
.
.
.
Figure 7. Processing degree of ITO (measurement method).
For the short survey, one question is used to collect data on the degree of ITO.
4.3 Measuring ITO maturity (Case research)The designed measurement technique for ITO maturity is based upon paragraph 4.1.2 (table 8). The
responses were gathered via the IT manager / CIO.
The measurement technique follows the same structure as pictured in figure 7 for the degree of ITO.
For example, the governance of ITO is based upon eleven scores (1-5) of which the mean is expected
to be the average level of ITO governance which is subsequently determining for 1/5th the result of
maturity level of ITO (1-5).
The measurement technique followed is displayed in figure 8:
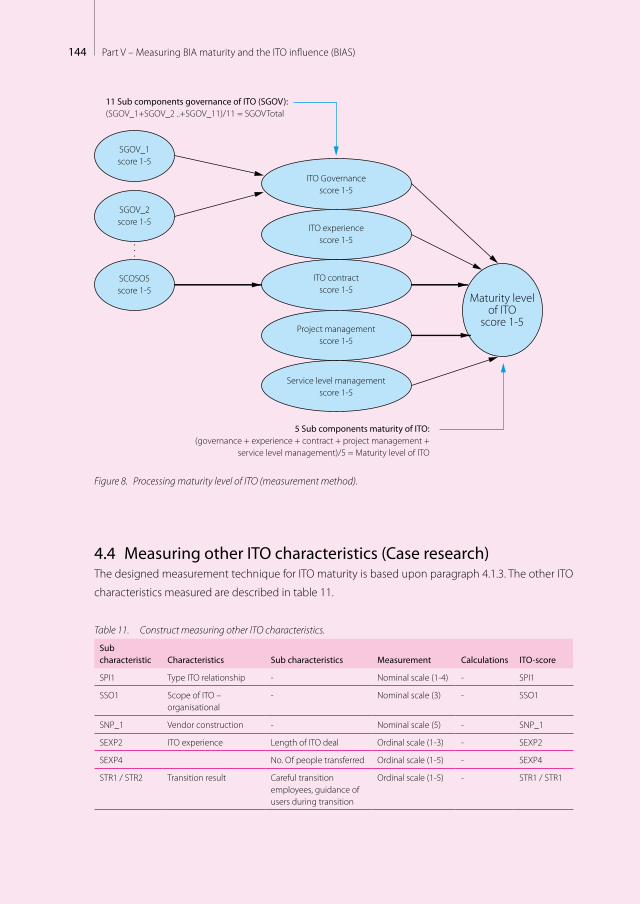
144 Part V – Measuring BIA maturity and the ITO influence (BIAS)
ITO Governancescore 1-5
Maturity level of ITO
score 1-5
SGOV_1score 1-5
SGOV_2score 1-5
SCOSO5score 1-5
ITO experiencescore 1-5
ITO contractscore 1-5
Project managementscore 1-5
Service level managementscore 1-5
5 Sub components maturity of ITO:(governance + experience + contract + project management +
service level management)/5 = Maturity level of ITO
11 Sub components governance of ITO (SGOV):(SGOV_1+SGOV_2 ..+SGOV_11)/11 = SGOVTotal
.
.
.
Figure 8. Processing maturity level of ITO (measurement method).
4.4 Measuring other ITO characteristics (Case research)The designed measurement technique for ITO maturity is based upon paragraph 4.1.3. The other ITO
characteristics measured are described in table 11.
Table 11. Construct measuring other ITO characteristics.
Sub characteristic Characteristics Sub characteristics Measurement Calculations ITO-score
SPI1 Type ITO relationship - Nominal scale (1-4) - SPI1
SSO1 Scope of ITO – organisational
- Nominal scale (3) - SSO1
SNP_1 Vendor construction - Nominal scale (5) - SNP_1
SEXP2 ITO experience Length of ITO deal Ordinal scale (1-3) - SEXP2
SEXP4 No. Of people transferred Ordinal scale (1-5) - SEXP4
STR1 / STR2 Transition result Careful transition employees, guidance of users during transition
Ordinal scale (1-5) - STR1 / STR1
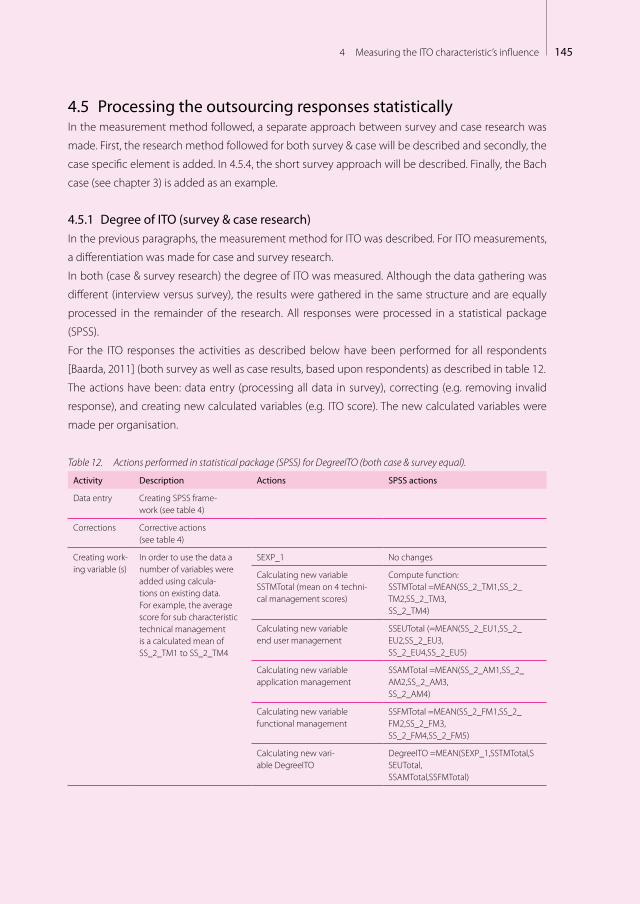
1454 Measuring the ITO characteristic’s influence
4.5 Processing the outsourcing responses statisticallyIn the measurement method followed, a separate approach between survey and case research was
made. First, the research method followed for both survey & case will be described and secondly, the
case specific element is added. In 4.5.4, the short survey approach will be described. Finally, the Bach
case (see chapter 3) is added as an example.
4.5.1 Degree of ITO (survey & case research)In the previous paragraphs, the measurement method for ITO was described. For ITO measurements,
a differentiation was made for case and survey research.
In both (case & survey research) the degree of ITO was measured. Although the data gathering was
different (interview versus survey), the results were gathered in the same structure and are equally
processed in the remainder of the research. All responses were processed in a statistical package
(SPSS).
For the ITO responses the activities as described below have been performed for all respondents
[Baarda, 2011] (both survey as well as case results, based upon respondents) as described in table 12.
The actions have been: data entry (processing all data in survey), correcting (e.g. removing invalid
response), and creating new calculated variables (e.g. ITO score). The new calculated variables were
made per organisation.
Table 12. Actions performed in statistical package (SPSS) for DegreeITO (both case & survey equal).
Activity Description Actions SPSS actions
Data entry Creating SPSS frame-work (see table 4)
Corrections Corrective actions (see table 4)
Creating work-ing variable (s)
In order to use the data a number of variables were added using calcula-tions on existing data. For example, the average score for sub characteristic technical management is a calculated mean of SS_2_TM1 to SS_2_TM4
SEXP_1 No changes
Calculating new variable SSTMTotal (mean on 4 techni-cal management scores)
Compute function: SSTMTotal =MEAN(SS_2_TM1,SS_2_TM2,SS_2_TM3, SS_2_TM4)
Calculating new variable end user management
SSEUTotal (=MEAN(SS_2_EU1,SS_2_EU2,SS_2_EU3, SS_2_EU4,SS_2_EU5)
Calculating new variable application management
SSAMTotal =MEAN(SS_2_AM1,SS_2_AM2,SS_2_AM3, SS_2_AM4)
Calculating new variable functional management
SSFMTotal =MEAN(SS_2_FM1,SS_2_FM2,SS_2_FM3, SS_2_FM4,SS_2_FM5)
Calculating new vari-able DegreeITO
DegreeITO =MEAN(SEXP_1,SSTMTotal,SSEUTotal, SSAMTotal,SSFMTotal)
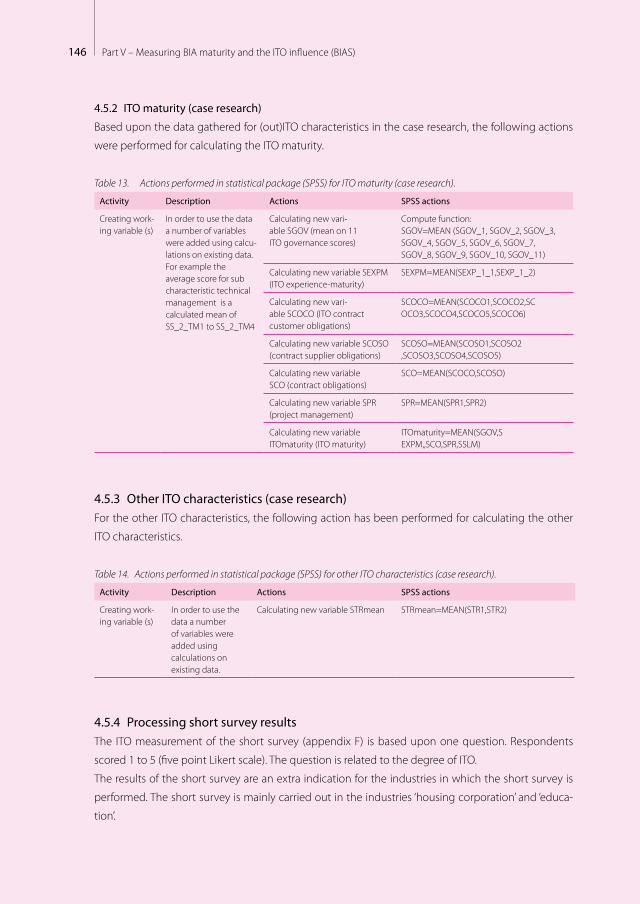
146 Part V – Measuring BIA maturity and the ITO influence (BIAS)
4.5.2 ITO maturity (case research)
Based upon the data gathered for (out)ITO characteristics in the case research, the following actions
were performed for calculating the ITO maturity.
Table 13. Actions performed in statistical package (SPSS) for ITO maturity (case research).
Activity Description Actions SPSS actions
Creating work-ing variable (s)
In order to use the data a number of variables were added using calcu-lations on existing data. For example the average score for sub characteristic technical management is a calculated mean of SS_2_TM1 to SS_2_TM4
Calculating new vari-able SGOV (mean on 11 ITO governance scores)
Compute function: SGOV=MEAN (SGOV_1, SGOV_2, SGOV_3, SGOV_4, SGOV_5, SGOV_6, SGOV_7, SGOV_8, SGOV_9, SGOV_10, SGOV_11)
Calculating new variable SEXPM (ITO experience-maturity)
SEXPM=MEAN(SEXP_1_1,SEXP_1_2)
Calculating new vari-able SCOCO (ITO contract customer obligations)
SCOCO=MEAN(SCOCO1,SCOCO2,SCOCO3,SCOCO4,SCOCO5,SCOCO6)
Calculating new variable SCOSO (contract supplier obligations)
SCOSO=MEAN(SCOSO1,SCOSO2,SCOSO3,SCOSO4,SCOSO5)
Calculating new variable SCO (contract obligations)
SCO=MEAN(SCOCO,SCOSO)
Calculating new variable SPR (project management)
SPR=MEAN(SPR1,SPR2)
Calculating new variable ITOmaturity (ITO maturity)
ITOmaturity=MEAN(SGOV,SEXPM,,SCO,SPR,SSLM)
4.5.3 Other ITO characteristics (case research)For the other ITO characteristics, the following action has been performed for calculating the other
ITO characteristics.
Table 14. Actions performed in statistical package (SPSS) for other ITO characteristics (case research).
Activity Description Actions SPSS actions
Creating work-ing variable (s)
In order to use the data a number of variables were added using calculations on existing data.
Calculating new variable STRmean STRmean=MEAN(STR1,STR2)
4.5.4 Processing short survey resultsThe ITO measurement of the short survey (appendix F) is based upon one question. Respondents
scored 1 to 5 (five point Likert scale). The question is related to the degree of ITO.
The results of the short survey are an extra indication for the industries in which the short survey is
performed. The short survey is mainly carried out in the industries ‘housing corporation’ and ‘educa-
tion’.
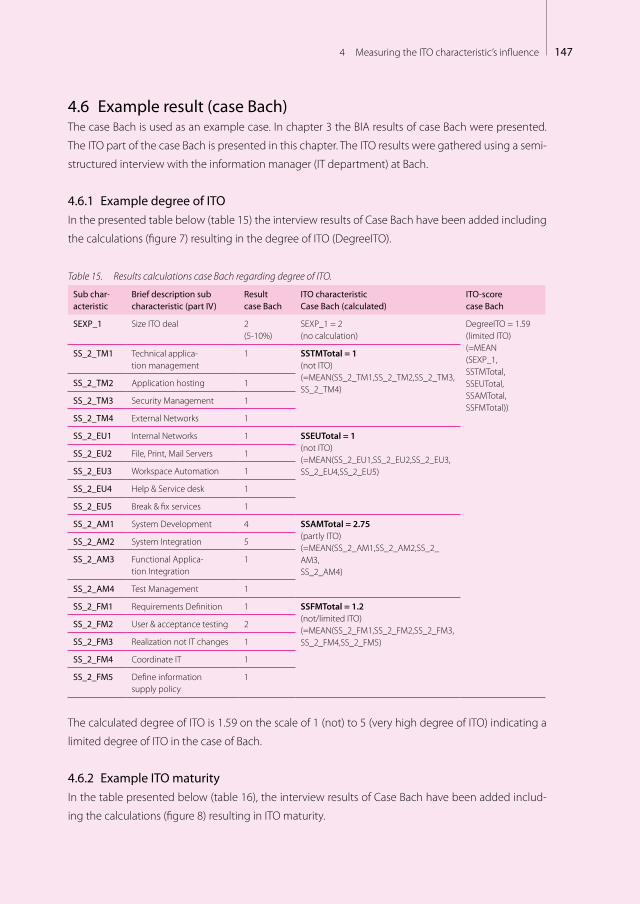
1474 Measuring the ITO characteristic’s influence
4.6 Example result (case Bach)The case Bach is used as an example case. In chapter 3 the BIA results of case Bach were presented.
The ITO part of the case Bach is presented in this chapter. The ITO results were gathered using a semi-
structured interview with the information manager (IT department) at Bach.
4.6.1 Example degree of ITOIn the presented table below (table 15) the interview results of Case Bach have been added including
the calculations (figure 7) resulting in the degree of ITO (DegreeITO).
Table 15. Results calculations case Bach regarding degree of ITO.
Sub char-acteristic
Brief description sub characteristic (part IV)
Result case Bach
ITO characteristic Case Bach (calculated)
ITO-score case Bach
SEXP_1 Size ITO deal 2 (5-10%)
SEXP_1 = 2 (no calculation)
DegreeITO = 1.59 (limited ITO)(=MEAN(SEXP_1,SSTMTotal,SSEUTotal, SSAMTotal,SSFMTotal))
SS_2_TM1 Technical applica-tion management
1 SSTMTotal = 1 (not ITO) (=MEAN(SS_2_TM1,SS_2_TM2,SS_2_TM3, SS_2_TM4)
SS_2_TM2 Application hosting 1
SS_2_TM3 Security Management 1
SS_2_TM4 External Networks 1
SS_2_EU1 Internal Networks 1 SSEUTotal = 1(not ITO)(=MEAN(SS_2_EU1,SS_2_EU2,SS_2_EU3, SS_2_EU4,SS_2_EU5)
SS_2_EU2 File, Print, Mail Servers 1
SS_2_EU3 Workspace Automation 1
SS_2_EU4 Help & Service desk 1
SS_2_EU5 Break & fix services 1
SS_2_AM1 System Development 4 SSAMTotal = 2.75 (partly ITO)(=MEAN(SS_2_AM1,SS_2_AM2,SS_2_AM3, SS_2_AM4)
SS_2_AM2 System Integration 5
SS_2_AM3 Functional Applica-tion Integration
1
SS_2_AM4 Test Management 1
SS_2_FM1 Requirements Definition 1 SSFMTotal = 1.2 (not/limited ITO)(=MEAN(SS_2_FM1,SS_2_FM2,SS_2_FM3, SS_2_FM4,SS_2_FM5)
SS_2_FM2 User & acceptance testing 2
SS_2_FM3 Realization not IT changes 1
SS_2_FM4 Coordinate IT 1
SS_2_FM5 Define information supply policy
1
The calculated degree of ITO is 1.59 on the scale of 1 (not) to 5 (very high degree of ITO) indicating a
limited degree of ITO in the case of Bach.
4.6.2 Example ITO maturityIn the table presented below (table 16), the interview results of Case Bach have been added includ-
ing the calculations (figure 8) resulting in ITO maturity.
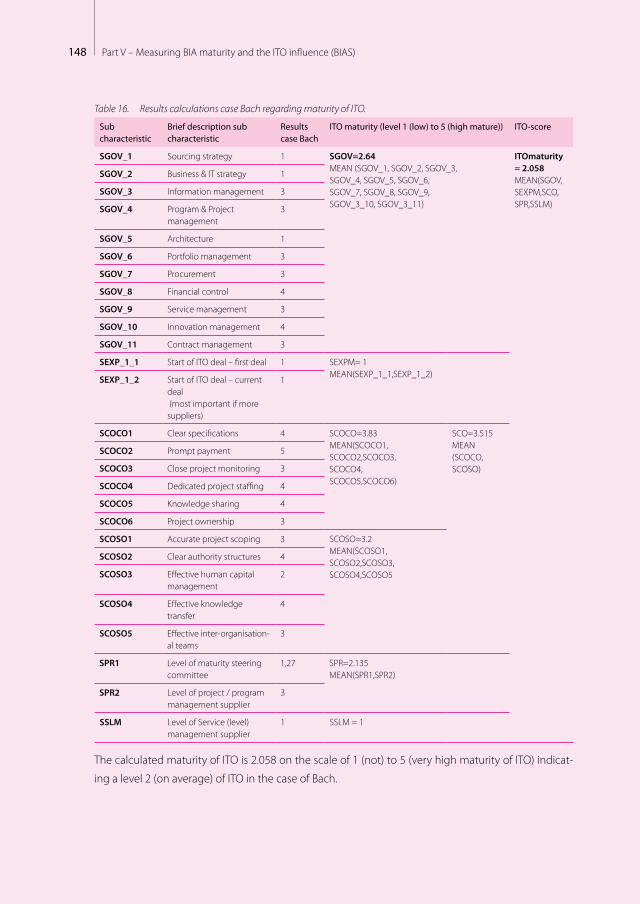
148 Part V – Measuring BIA maturity and the ITO influence (BIAS)
Table 16. Results calculations case Bach regarding maturity of ITO.
Sub characteristic
Brief description sub characteristic
Results case Bach
ITO maturity (level 1 (low) to 5 (high mature)) ITO-score
SGOV_1 Sourcing strategy 1 SGOV=2.64MEAN (SGOV_1, SGOV_2, SGOV_3, SGOV_4, SGOV_5, SGOV_6, SGOV_7, SGOV_8, SGOV_9, SGOV_3_10, SGOV_3_11)
ITOmaturity = 2.058MEAN(SGOV, SEXPM,SCO, SPR,SSLM)
SGOV_2 Business & IT strategy 1
SGOV_3 Information management 3
SGOV_4 Program & Project management
3
SGOV_5 Architecture 1
SGOV_6 Portfolio management 3
SGOV_7 Procurement 3
SGOV_8 Financial control 4
SGOV_9 Service management 3
SGOV_10 Innovation management 4
SGOV_11 Contract management 3
SEXP_1_1 Start of ITO deal – first deal 1 SEXPM= 1MEAN(SEXP_1_1,SEXP_1_2)SEXP_1_2 Start of ITO deal – current
deal (most important if more suppliers)
1
SCOCO1 Clear specifications 4 SCOCO=3.83MEAN(SCOCO1, SCOCO2,SCOCO3, SCOCO4, SCOCO5,SCOCO6)
SCO=3.515MEAN (SCOCO, SCOSO)
SCOCO2 Prompt payment 5
SCOCO3 Close project monitoring 3
SCOCO4 Dedicated project staffing 4
SCOCO5 Knowledge sharing 4
SCOCO6 Project ownership 3
SCOSO1 Accurate project scoping 3 SCOSO=3.2MEAN(SCOSO1, SCOSO2,SCOSO3, SCOSO4,SCOSO5
SCOSO2 Clear authority structures 4
SCOSO3 Effective human capital management
2
SCOSO4 Effective knowledge transfer
4
SCOSO5 Effective inter-organisation-al teams
3
SPR1 Level of maturity steering committee
1,27 SPR=2.135MEAN(SPR1,SPR2)
SPR2 Level of project / program management supplier
3
SSLM Level of Service (level) management supplier
1 SSLM = 1
The calculated maturity of ITO is 2.058 on the scale of 1 (not) to 5 (very high maturity of ITO) indicat-
ing a level 2 (on average) of ITO in the case of Bach.
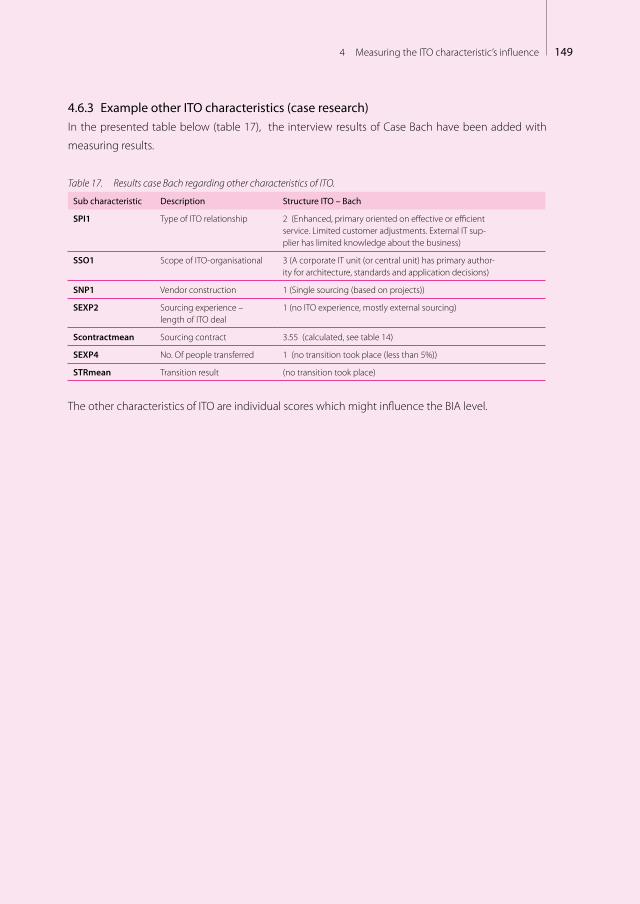
1494 Measuring the ITO characteristic’s influence
4.6.3 Example other ITO characteristics (case research)In the presented table below (table 17), the interview results of Case Bach have been added with
measuring results.
Table 17. Results case Bach regarding other characteristics of ITO.
Sub characteristic Description Structure ITO – Bach
SPI1 Type of ITO relationship 2 (Enhanced, primary oriented on effective or efficient service. Limited customer adjustments. External IT sup-plier has limited knowledge about the business)
SSO1 Scope of ITO-organisational 3 (A corporate IT unit (or central unit) has primary author-ity for architecture, standards and application decisions)
SNP1 Vendor construction 1 (Single sourcing (based on projects))
SEXP2 Sourcing experience – length of ITO deal
1 (no ITO experience, mostly external sourcing)
Scontractmean Sourcing contract 3.55 (calculated, see table 14)
SEXP4 No. Of people transferred 1 (no transition took place (less than 5%))
STRmean Transition result (no transition took place)
The other characteristics of ITO are individual scores which might influence the BIA level.

150 Part V – Measuring BIA maturity and the ITO influence (BIAS)
1515 Summary
“Improve the world, start with yourself” Best advice received from Bert Heemskerk (CEO Rabobank group).
Source Intermediair (3/12/2009)
Summary
5.1 Measuring BIA maturity and the ITO influenceIn this part the following questions were answered:
– How can we determine the maturity level of BIAS?
– How can ITO influence be measured?
Based upon the measuring method as described in this part, three major and independent measured
variables occur: BIA Maturity, ITO maturity and Degree of ITO. Next to these major variables a large
number of sub- and other independent components on BIA and characteristics on ITO can be meas-
ured using this part. All BIA components and a number of the ITO characteristics are used to calculate
new variables. The contingency factors were not discussed in this part the contingency measure-
ments mechanism is described in part VI of this dissertation.
5.2 Presenting BIAS results for case BachWithin the example case Bach, 17 business & IT managers & staff were asked to fill in the BIA ques-
tionnaire and the information manager was interviewed for the ITO characteristics of Bach. The re-
sults of processing the case Bach are displayed in figure 9.
Based on a single case no conclusions can be made with regards to the influence of ITO on BIA. With
regards to the hypothesis, research objectives and questions, more cases are needed.
5
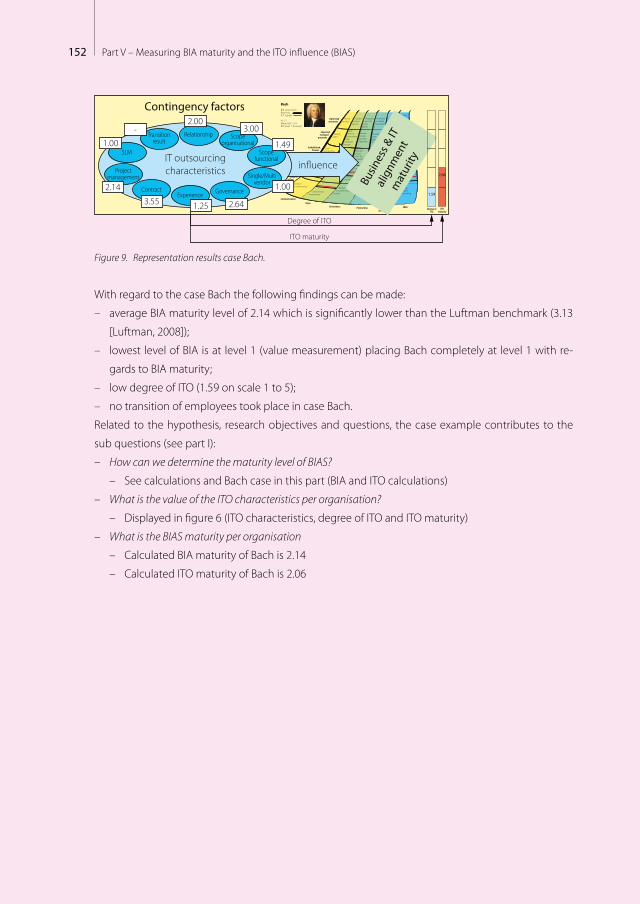
152 Part V – Measuring BIA maturity and the ITO influence (BIAS)
Contingency factorsInformal
pervasiveOptimized
processes
Improved, managed
processes
Esthablished,focuses
processes
Committedprocesses
Initial or ad hoc
processes
Bonding, uni�ed
Cost e�ective
Some partner-value;
Dashboard managed
Some cost
e�ectiveness; Dashboard
established
IT enables/drives business strategy
IT seen as an asset; Process driver;Con�ict seen as creative
Shared risk & rewards
Emerging value service provider;Balanced tech & business hiring
Relevant process
across the organization
Relevant process
across the organization
Good understanding;
Emerging relaxed
Limited business / IT understanding,
Business / IT lack understanding,
Functional cost e�ciency
Some technical measurements
No formal process,cost center, reactive
priorities
Con�ict; IT a cost of doing
business
Traditional (e.g., acctng, email)
IT takes risk, little reward;
Technical training
Tactical at Functional
level,occasional
responsive
IT emerging as an asset;
Process enabler
Transaction (e.g., ESS, DSS)
Di�ers across functional organizations
Integrated with partners
Integrated across the organization
Extende to external
partners
Integrated across the
org. & partners
Evolve with partners
IT-bunisness co-adaptive
Improvisation-al
Education/careers/rewards across the organization
Communication
ValueGovernance Partnership Scope &
architectureSkills
Bach
BIA score from:BusinessICT supply
N : 17Mean BIA: 2,14BIA level: 1 (lowest)
Busin
ess &
ITal
ignm
ent
mat
urityIT outsourcing
characteristics in�uence
Degree of ITO
ITO maturity
Relationship Scopeorganisational
Transitionresult
Scopefunctional
Projectmanagement Single/Multi
vendorGovernanceExperience
Contract
SLM
1.59
2.06
Degree ofITO
ITOmaturity
2.003.00
1.49
1.00
2.641.253.55
2.14
1.00-
Figure 9. Representation results case Bach.
With regard to the case Bach the following findings can be made:
– average BIA maturity level of 2.14 which is significantly lower than the Luftman benchmark (3.13
[Luftman, 2008]);
– lowest level of BIA is at level 1 (value measurement) placing Bach completely at level 1 with re-
gards to BIA maturity;
– low degree of ITO (1.59 on scale 1 to 5);
– no transition of employees took place in case Bach.
Related to the hypothesis, research objectives and questions, the case example contributes to the
sub questions (see part I):
– How can we determine the maturity level of BIAS?
– See calculations and Bach case in this part (BIA and ITO calculations)
– What is the value of the ITO characteristics per organisation?
– Displayed in figure 6 (ITO characteristics, degree of ITO and ITO maturity)
– What is the BIAS maturity per organisation
– Calculated BIA maturity of Bach is 2.14
– Calculated ITO maturity of Bach is 2.06
Part VIRelevant
contingencyfactors
Informalpervasive
Optimized processes
Improved, managed
processes
Esthablished,focuses
processes
Committedprocesses
Initial or ad hoc
processes
Bonding, uni�ed
Cost e�ective
Some partner-value;
Dashboard managed
Some cost
e�ectiveness; Dashboard
established
IT enables/drives business strategy
IT seen as an asset; Process driver;Con�ict seen as creative
Shared risk & rewards
Emerging value service provider;Balanced tech & business hiring
Relevant process
across the organization
Relevant process
across the organization
Good understanding;
Emerging relaxed
Limited business / IT understanding,
Business / IT lack understanding,
Functional cost e�ciency
Some technical measurements
No formal process,cost center, reactive
priorities
Con�ict; IT a cost of doing
business
Traditional (e.g., acctng, email)
IT takes risk, little reward;
Technical training
Tactical at Functional
level,occasional
responsive
IT emerging as an asset;
Process enabler
Transaction (e.g., ESS, DSS)
Di�ers across functional organizations
Integrated with partners
Integrated across the organization
Extende to external
partners
Integrated across the
org. & partners
Evolve with partners
IT-bunisness co-adaptive
Improvisation-al
Education/careers/rewards across the organization
Communication
ValueGovernance Partnership Scope &
architectureSkills
Contingency factors
Busin
ess &
ITal
ignm
ent
mat
urityIT outsourcing
characteristics in�uence
Relationship Scopeorganisational
Transitionresult
Scopefunctional
Projectmanagement Single/Multi
vendorGovernanceExperience
Contract
SLM
1.57
2.62
Degree ofITO
ITOmaturity

154 Part VI – Relevant contingency factors

155Contents
Contents
1 Introduction 157
2 Organisational contingency factors 1592.1 Industry 159
2.2 Size of organisation 161
2.3 Geographical area 161
2.4 Role respondent within organisation 161
2.5 Business & IT proposition 162
3 People & culture contingency factors: Attitude, Behaviour, Culture 1653.1 Literature on Attitude, Behaviour and Culture 165
3.1.1 Attitude 165
3.1.2 Behaviour 166
3.1.3 Culture 166
3.2 Attitude, Behaviour & Culture measurement mechanisms 168
3.3 Addressing and classifying contingency factor Attitude 169
3.3.1 Addressing contingency factor attitude 169
3.3.2 Classifying contingency factor attitude 170
3.4 Addressing and classifying contingency factor behaviour 171
3.4.1 Addressing contingency factor behaviour 171
3.4.2 Classification for behaviour 173
3.5 Addressing and classifying contingency factor culture 173
3.5.1 Addressing contingency factor culture 173
3.5.2 Classifying contingency factor culture 175
3.6 Measuring Attitude, Behaviour & Culture 175
3.6.1 Measuring for case research 175
3.6.2 Measuring for short survey research 177
3.6.3 Measuring the contingency factors Attitude, Behaviour, Culture 177

156 Part VI – Relevant contingency factors

1571 Introduction
“Make ‘bosom enemies’ in every function. Stay in contact with everyone, but seek the tension in discussions. This way new insights will come and ‘bosom enemies’ might become ‘bosom friends’ ” Best advice received from Pamela Bouwmeester (director NS poort). Source Intermediair (15/10/2009)
IntroductionIn the previous parts (III, IV) the results of the literature research were described with regard to Busi-
ness & IT alignment (BIA) and IT Outsourcing (ITO). In part V, measuring BIA and the ITO influence
was described. In this part, the possible contingency factors are described based upon the literature
research. This part aims to answer the research (sub) question:
– Which contingency factors influence BIAS possibly?
Contingency factors are situational dependent factors for the research within the scope of this re-
search. Contingency factors might influence the BIAS relationship. An example is industry specifics.
Based upon the literature research, several contingency factors have been identified and obtained.
The impact of the contingency factors on the BIAS results was tested in the field research. It is difficult
to be complete in obtaining all contingency factors related to the BIAS research. Often the literature
is limited to a few contingency factors. Based upon the alignment research of over 160 articles [Chan,
2007], as well as the ITO literature, a number of contingency factors have been identified. Depending
on the data gathering approach (case, survey and short survey research) the contingency factors were
gathered. Table 1 provides an overview of the gathered contingency factors for case, survey and short
survey research.
1
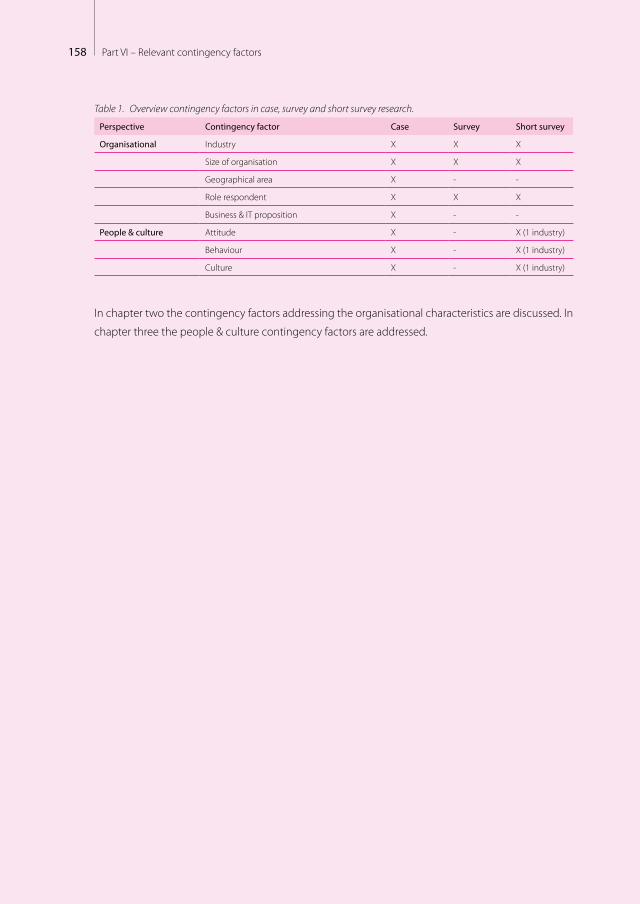
158 Part VI – Relevant contingency factors
Table 1. Overview contingency factors in case, survey and short survey research.
Perspective Contingency factor Case Survey Short survey
Organisational Industry X X X
Size of organisation X X X
Geographical area X - -
Role respondent X X X
Business & IT proposition X - -
People & culture Attitude X - X (1 industry)
Behaviour X - X (1 industry)
Culture X - X (1 industry)
In chapter two the contingency factors addressing the organisational characteristics are discussed. In
chapter three the people & culture contingency factors are addressed.

1592 Organisational contingency factors
“Be careful with what you say, because if it is there, on paper, it is there for always” Best advice received from Margo Reuten (Chef-cook restaurant Davinci).
Source Intermediair (1/10/2009)
Organisational contingency factorsThe organisational characteristics identified are: industry, size (employees), role respondent, locus of
power in IT. The organisational characteristics were gathered using the survey, short survey or within
the case studies.
2.1 IndustryThe industry in which an organisation operates is important for how IT and BIA are viewed. Poels
[2006] stated in his research that alignment and return on IT investments are positively related within
the industry banking & insurance. The average level of alignment within this research was level 3
[Luftman, 2007, 2008].
The industry is taken as a possible contingency factor assuming that the influence of ITO on align-
ment is different depending on the industry specific elements. The following industries have been
recognized within my research based upon earlier survey research [Derksen, 2011]:
1. IT services organisations
2. Construction
3. Central government
4. Chemical / pharmaceutical
5. Financial services (banking / insurance)
6. Healthcare / social services
7. Retail
8. Industry / oil / gas
9. Local government
10. Media / entertainment
11. Utility (energy / water / telecom)
2

160 Part VI – Relevant contingency factors
12. Education
13. Transport / logistics
14. Service companies (e.g. consulting / law firms)
15. Service companies (e.g. employability)
16. Housing Corporation
Several industry differentiations can be made. For analysis purposes, it is interesting to combine a
number of industries related to the number of organisations assessed (e.g. within construction just a
few respondents). No good classification with lesser number of industries was found in the literature.
Based upon several industry classifications and comparable usage of IT, a classification was made.
All such classifications can be discussed on usability; therefore the classification of industries as de-
scribed above was tested as well but no other classification was made. The classification used is
displayed in table 2
Table 2. Industry differentiation aggregated.
Industry Industry description Industry possibilities (list of 16)
1 Manufacturing (2) Construction(4) Chemical / pharmaceutical(8) manufacturing / oil / gas(11) Utility (energy/water/telecom)
2 Financial services (5) Financial Services (banking/insurance)
3 Government (not for profit)
(3) Central government(6) Healthcare / Social services(9) Local government(12) Education
4 Logistics (7) Retail(13) Transport / Logistics
5 Professional services (1) IT services companies(10) Media / entertainment(14) Service companies (e.g. consulting / law firms)(15) Service companies (e.g. employability)
6 Housing corporations (16) Housing corporations
The industry ‘housing corporation’ is a not for profit industry as well, but is kept separately due to the
amount of responses in the (short) survey as well as in the case study.

1612 Organisational contingency factors
2.2 Size of organisationAnother perspective is the organisational size. Next to the research of Poels [2006], Pollalis [2003] stat-
ed that small banks can reach high performance based on alignment. Also Byrd et.al. [2006] found a
positive relation at small and medium manufacturing plants, proposing that strategic alignment has
a direct impact on performance. In my research considering the impact of outsourcing on alignment;
the size might matter. The following scale was used (no further classification was needed):
1. 0-50 employees
2. 51-100 employees
3. 101-250 employees
4. 251-500 employees
5. 501-1,000 employees
6. 1,001-5,000 employees
7. 5,001-10,000 employees
8. Above 10,000 employees
Size of organisation was measured in both case and survey research.
2.3 Geographical areaBesides the above mentioned characteristics, the geographical area in which the organisation op-
erates has also been investigated for the case organisations. Keuning & Epping [Keuning, 2000,
page 226] state that geographical orientation is part of the governance perspective. Watson [1997]
suggests that culture is geographically based. Performing services over a larger geographical area
might make outsourcing & alignment more complex and might have an impact when dealing
with more cultures. The following qualifications have been inventoried (no further classification
was needed):
1. Small (Local / Province)
2. Medium (National)
3. Large (Europe / Global)
The geographical area is the area the investigated organisation, in its scope, is delivering services to.
2.4 Role respondent within organisationBesides the organisational characteristics, the role of the respondent within the organisation might
influence the measurement1. Luftman [2007] found in his research differences in perspective with
regard to alignment. The identified roles were (no further classification was needed):
1. CEO, COO and/or senior management responsible for business strategy, business planning, etc.
1 Within the case research the respondents including the roles needed were identified at the beginning of the case. In the survey and
short survey there is less control on the role of respondent and therefor it is a contingency factor.

162 Part VI – Relevant contingency factors
2. CIO and/or senior management responsible for governance, aligning IT strategy with business
strategy
3. Client of ICT (demand side) responsible for realising organisational goals using IT.
4. Supplier of ICT (supply side) responsible for realisation, maintenance of IT.
5. Employee within (internal) IT organisation/department
6. Employee within external IT supplier
7. User of IT (end user)
2.5 Business & IT propositionIT will fulfil a different role depending on the business proposition [Koning, 2002]. Business goals and
IT organisation goals might differ or not be aligned. Both survey and case research respondents have
been asked to fill in the main business and main IT goals within their organisation using the following
open ended questions:
1. What are the main 3 business goals of the organisation in order of importance?
2. What are the main 3 IT goals of the organisation in order of importance?
Based on the responses a categorization was made using Treacy & Wiersma [1992] who recognize
three focus areas:
1. Operational excellence
2. Product leadership
3. Customer intimacy
The propositions of Treacy & Wiersma are shortly described (copied from [Treacy, 1992]) (no further
classification was needed):
Operational excellenceOperational excellence describes a specific strategic approach to the production and delivery of products
and services. The objective of a company following this strategy is to lead its industry in price and conveni-
ence. Companies pursuing operational excellence are indefatigable in seeking ways to minimise overhead
costs, to eliminate intermediate production steps, to reduce transaction and other ‘friction’ costs, and to
optimise business processes across functional and organisational boundaries. They focus on delivering
their products or services to customers at competitive prices and with minimal inconvenience. Because they
build their entire business around these goals, these organisations do not look or operate like other compa-
nies pursuing other value disciplines.
Best ProductCompanies that pursue product leadership strive to produce a continuous stream of state-of-the-art prod-
ucts and services. Reaching that goal requires them to challenge themselves in three ways. First they must
be creative. More than anything else, being creative means recognising and embracing ideas that usually

1632 Organisational contingency factors
originate outside the company. Second, such innovative companies must commercialise their ideas quick-
ly. To do so, all their business and management processes have to be engineered for speed. Third and most
important, product leaders must relentlessly pursue new solutions to the problems that their own latest
product or service has just solved.
Customer intimacyCustomer intimacy: While companies pursuing operational excellence concentrate on making their opera-
tions lean and efficient, those pursuing a strategy of customer intimacy continually tailor and shape prod-
ucts and services to fit an increasingly fine definition of the customer. This can be expensive, but customer
intimate companies are willing to build customer loyalty for the long term. They typically look at customer’s
lifetime value to the company, not the value of any single transaction.
Based upon the open answers on business & IT goals, two variables were filled: business goal & IT
goal. For both of these, the proposition was filled in (operational excellence, product leadership or
customer intimacy). The scores have been completed based upon the open answers, looking at the
key words of the answers for each company.
Table 3. Contingency factor ‘business & IT proposition’.
Factor Description contingency factor
CFBG Business proposition Main business proposition (nominal) 1 = operational excellence, 2 = best product, 3= customer intimacy
CFIG IT proposition Main IT proposition (nominal) 1 = operational excellence, 2 = best product, 3= customer intimacy

164 Part VI – Relevant contingency factors
1653 People & culture contingency factors
“The truth is also an option” Best advice received from Joanna Kellerman
(member of directors De Nederlandsche Bank). Source Intermediair
People & culture contingency factors: Attitude, Behaviour, CultureThe contingency factors attitude, behaviour and culture are described separately using the results
of the literature research (paragraph 3.1). The working method for my research is described in 3.2.
and following paragraphs. These contingency factors are measured within fifteen cases. The working
method was time consuming for the organisations. Although this was stimulated and proved to add
value, not all organisations chose to perform this part of the research due to the time consumption.
3.1 Literature on Attitude, Behaviour and CultureIn this dissertation, three aspects of people & culture are described: Attitude (2.1.1), Behaviour (2.1.2)
and Culture (2.1.3).
3.1.1 Attitude‘CEO attitude is the most important factor overall’. This was a major finding of the PhD. research of Far-
rell [2003]. He examined five cases using 21 factors which are used to achieve alignment. A similar
finding was made by Poels [2006] in his PhD. research. The CEO type was an important driver. In this
research, the CEO type ‘believer’ was found to have the best fit for pursuing alignment (believer: a
CEO who is convinced that IT can offer strategic advantage. The CEO pursues this belief in his daily
way of working).
Feeny [1992] described that a number of factors relate to the CEO’s attitude, but other factors are
not that obvious. Feeny also described that organisational attributes include the executive style and
the acceptance of the CIO as part of the executive team. Based upon Farrell, Poels and Feeny, the as-
sumption was made that simply stating that the CEO style as being most important is not enough.
3

166 Part VI – Relevant contingency factors
For example, a CEO can become a believer when the CIO provides the possibilities to do so.
Attitude can be defined as ‘a readiness of the psyche to act or react in a certain way’ [Jung, 1921]. Wilkin-
son & Schilt [Wilkinson, 2008] describe attitude: “It is their demeanour and how they react to the world
about them. How they react to a change initiative, a colleague or a customer.” The description provided
by Wilkinson & Schilt is a practical definition directly related to the BIA challenge. In this dissertation,
this practical definition was used.
Caluwé and Vermaak [Caluwé, 2010] conclude that organisations or organisational parts correlate of-
ten to the dominant colours they described (p.379). In this paragraph, these colours will be described
briefly. The colour classification of de Caluwé and Vermaak [Caluwé, 2010] as introduced in table 4 will
be used for addressing attitude (paragraph 3.3.1).
Table 4. Basic attitude of colour classification based on Caluwé and Vermaak [2010].
Colour Ideal
Yellow print People want overarching ideals and effects.
Blue print Everything is doable, manageable and can be planned.
Red print Right fit between people and organisation: Exchange.
Green print Learning organisation and learning intentionally.
White print Spontaneous evolution and self-organisation
3.1.2 Behaviour Edwards [2000] discussed the importance of a number of behaviours needed for strategic alignment.
He concludes that the CEO behaviour is an important catalyst for change although the CEO cannot
be solely responsible for alignment. Behaviour is an aspect of the organisation. Next to Edwards, Jorfi
et.al. [2011] also found significant relationships between strategic behaviours and strategic manage-
ment in relation to IT-business alignment. Behaviour can be seen as an important contingency factor.
Caluwé & Vermaak [Caluwé, 2010] describe that behaviour is not steered by intentions alone but
intentions follow behaviour: based upon the theory of Weick [1969] Caluwé & Vermaak suggest to
make behaviour explicit instead of focus on plans and intentions while the way changes are made
in organisations are often different from the plans and intentions described and more often based
upon the behaviour.
Behaviour can be defined as ‘the way a person behaves towards other people’ [Oxford, 1989]. Wilkinson
[2008] described behaviour as ‘what people do’. The Oxford dictionary definition was used in combina-
tion with that of Wilkinson
3.1.3 Culture One of the most well known descriptions of culture is made by Handy [1988], [Caluwé, 2010]. In the
model of Handy, the four culture descriptions are: Power-, Role-, Person-, Task-oriented culture. Anoth-
er model used to define culture is the organisational cultural inventory of Quinn and Cameron [1999],
[Derksen, 2008]. The cultural description of Quinn and Cameron is based upon two main indicators:

1673 People & culture contingency factors
– internal focus and integration versus external focus and differentiation;
– flexibility and freedom versus stability and control.
Based on these two main indicators, four cultural archetypes are described (family, adhocracies, market
and hierarchy). These cultural descriptions can be used at the organisational level or within groups.
Both cultural descriptions [Handy, 1988], [Quin, 1999] described cultural aspects within an organisa-
tion separately from the business & IT relationship. Watson [1997] suggests that culture is geographi-
cally based. Geographical orientation is a contingency factor in my research (see chapter 2 in this part).
A perceived cultural gap between business & IT is addressed by Galliers et al. [Galliers, 1994]. The sur-
veyed senior IS and non-IS executives within the UK have generally a different view from their col-
leagues in the other group (IS or non-IS). The authors hope that the culture gap between IS and none IS
might diminish over time. Another interesting addition has been made by Chan [2002]. In a case study,
Chan stated that the informal organisational structure is far more important for reaching alignment than
the formal structure. Furthermore, Chan concluded that the informal structure is reinforced by culture.
The used definition of culture is that of Caluwé and Vermaak (translated) [Caluwé, 2010]: ‘The common
values and standards of a group of people and the resultant ways of doing things.’
Related to the business-IT cultural descriptions, Kaarst-Brown [Kaarst, 1999] used five cultural arche-
types based on dragons, such as the caged dragon in which case the IT organisation is extremely
confined and limited in its scope. Kaarst-Brown also described a magic dragon (sitting on a pile of
gold), pet dragon (often in decentralised IT), team dragon (integrated model of IT) and the dead
dragon (fearful of IT). Kaarst-Brown concludes that organisational culture’s impact is complex. The
five archetypes of Kaarst-Brown (copied from [Kaarst, 1999]) are:
1. The dragon on a pile of gold: the revered IT culture. IT enjoys high status, IT is seen as of strategic
importance with significant positive impacts for the organisation but it is not part of the culture to
criticise IT.
2. Caged dragon: the controlled IT culture. It has not only been the interest of capital and the inter-
est of labour that have clashed over the introduction and dispersion of new technologies. IT has
low status, minimally involved in strategic directions lacking business knowledge.
3. Pet dragons: the demystified IT culture. Users know more about IT. IT is demystified. IT is less
involved and business initiates projects themselves. Business is more demanding and knows more
of IT possibilities.
4. Team dragons: the integrated IT culture. This culture is based on partnership, integration, crea-
tive experience shared. Attaining teamwork requires commitments that may be hard to sustain.
When problem-solving processes become mere rituals that join parties with hidden agendas,
teamwork will likely fail.
168 Part VI – Relevant contingency factors
5. Dead dragons: the fearful IT culture. In this archetype, individuals resist automation using a vari-
ety of rationales: the inability of machines to replace human intuition, the inaccuracy of machine
processing, the difficulty of correcting machine errors, and mistrust of system developers.
The archetypes of Kaarst-Brown will be used for measuring the contingency factor culture.
3.2 Attitude, Behaviour & Culture measurement mechanismsTo address the contingency factors attitude, behaviour & culture the ABC (Attitude, Behaviour &
Culture) measurement mechanism of Wilkinson [2008] was used. This mechanism is an industry ap-
proach rather than a scientific approach. Although several scientific approaches to measure attitude,
behaviour and culture do exist [Caluwé, 2010], [Handy, 1988], Quinn and Cameron [1999], [Derks-
en,2008], [Kaarst, 1999], [Volberda, 2004] these measurement mechanisms are comprehensive and
would require extensive measuring time. Using these extensive approaches would not be accepted
at most of the cases.
Secondly, the measurement mechanisms are not directly focused on the main subject of this disserta-
tion BIA and the impact of ITO (except for the results of Kaarst [1999]). The ABC measurement mecha-
nism is created on the BIA question and covers the attitude, behaviour and cultural aspect in one
session (workshop). The ABC game is specifically focused on the business & IT relationship and thus
related to the scope of this research.
The attitude, behaviour, culture (ABC) measurement mechanism proved to be a well used approach
which is supported at ITSMF2 [Wilkinson, 2008]. Wilkinson created a database with over 3800 people
[Derksen, 2011] who attended and contributed to the ABC workshops. Despite this interesting basis
the ABC approach is an industry approach and was not linked with science research results before.
The linkage between the ABC approach and science research in this dissertation is based on the find-
ings of de Caluwé & Vermaak [Caluwé, 2010] for attitude and behaviour, and on the findings of Kaarst
[1999] for culture. This is further explained in the next paragraphs.
The interesting element of the ABC measurement mechanism is that it is based on ‘worst practices’
gathering what people think and feel about what is not done well within their organisation. These
worst practices are displayed and described on playing cards (see example in figure 1) which can
be chosen by the workshop participants. The game is further explained in paragraph 3.6. Using this
approach the CEO, CIO as well as other organisational representatives, generate a more commonly
accepted view on practices that negatively influence the BIA. Using this mechanism, a high level of
recognition was observed with the attending managers from both business & IT.
2 ITSMF is the international IT Service Management Forum (http://www.itsmfi.org/)

1693 People & culture contingency factors
3.3 Addressing and classifying contingency factor Attitude
3.3.1 Addressing contingency factor attitudeWilkinson & Schilt described attitude (as copied from [Wilkinson, 2008]):
“It is their demeanour and how they react to the world about them. How they react to a change initiative, a
colleague or a customer. Examples of attitude are:
– somebody thinking “The users are ALWAYS complaining....just ignore them they will soon go away!”;
– somebody thinking “...I’ll believe that when I see it...” after a manager has just announced 100% commit-
ment to the ITIL program.
Embarking on an IT service management improvement program means to embark upon a program of or-
ganisational change, this means changing people’s attitudes. You need to create buy-in and commitment
for the change. You need to identify and address attitudes that are counter-productive, attitudes that can
lead to negative behaviour and threaten the aims of the change program.
In order to change attitude it is important to first make the attitude, conscious, visible, open. People need to
‘be made aware’. Secondly it is important to relate the relevance of the attitude to the current and desired
behaviour. To get people to change attitude it is important that they feel the negative consequences and
pain in relation to the current behaviour or they see the benefits of newly desired behaviour.“
In figure 1, a view of two of the twelve attitude related worst practices cards with a brief description
(source: [Wilkinson, 2008] is presented. The cards were also used because the attached figure can pre-
sent a recognizable situation for organisations (sometimes a picture says more than a thousand words).
Card Attitude Description Card Attitude
Left: IT thinks it doesn´t need to understand the business to make a business case. This is about what the business problem truly is and about knowing the problem to be solved.
Right: Walking the talk. Poor IT leadership lacking commitment.
Figure 1. Two examples of attitude worst practices [Wilkinson, 2008].
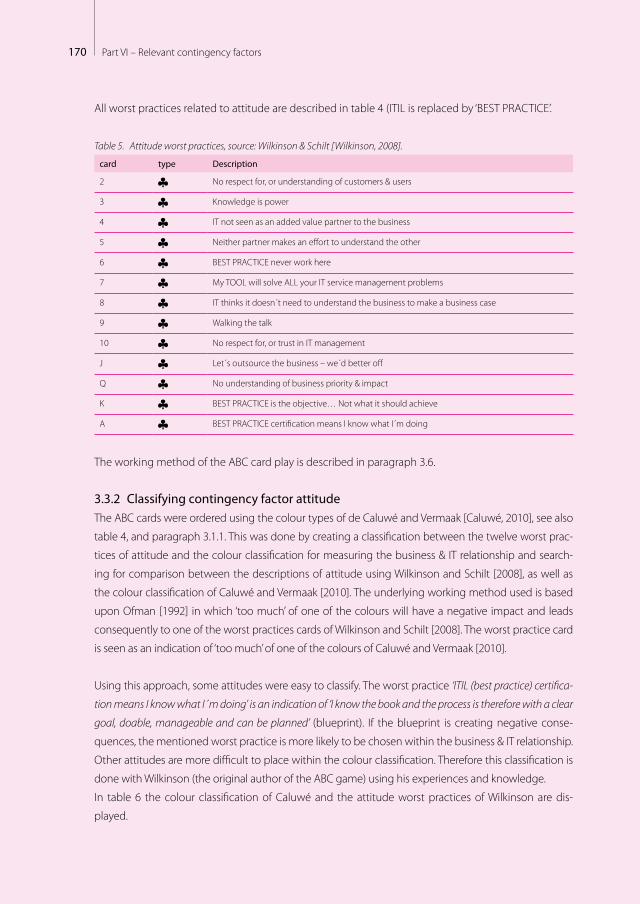
170 Part VI – Relevant contingency factors
All worst practices related to attitude are described in table 4 (ITIL is replaced by ‘BEST PRACTICE’.
Table 5. Attitude worst practices, source: Wilkinson & Schilt [Wilkinson, 2008].
card type Description
2 No respect for, or understanding of customers & users
3 Knowledge is power
4 IT not seen as an added value partner to the business
5 Neither partner makes an effort to understand the other
6 BEST PRACTICE never work here
7 My TOOL will solve ALL your IT service management problems
8 IT thinks it doesn´t need to understand the business to make a business case
9 Walking the talk
10 No respect for, or trust in IT management
J Let´s outsource the business – we´d better off
Q No understanding of business priority & impact
K BEST PRACTICE is the objective… Not what it should achieve
A BEST PRACTICE certification means I know what I´m doing
The working method of the ABC card play is described in paragraph 3.6.
3.3.2 Classifying contingency factor attitudeThe ABC cards were ordered using the colour types of de Caluwé and Vermaak [Caluwé, 2010], see also
table 4, and paragraph 3.1.1. This was done by creating a classification between the twelve worst prac-
tices of attitude and the colour classification for measuring the business & IT relationship and search-
ing for comparison between the descriptions of attitude using Wilkinson and Schilt [2008], as well as
the colour classification of Caluwé and Vermaak [2010]. The underlying working method used is based
upon Ofman [1992] in which ‘too much’ of one of the colours will have a negative impact and leads
consequently to one of the worst practices cards of Wilkinson and Schilt [2008]. The worst practice card
is seen as an indication of ‘too much’ of one of the colours of Caluwé and Vermaak [2010].
Using this approach, some attitudes were easy to classify. The worst practice ‘ITIL (best practice) certifica-
tion means I know what I´m doing’ is an indication of ‘I know the book and the process is therefore with a clear
goal, doable, manageable and can be planned’ (blueprint). If the blueprint is creating negative conse-
quences, the mentioned worst practice is more likely to be chosen within the business & IT relationship.
Other attitudes are more difficult to place within the colour classification. Therefore this classification is
done with Wilkinson (the original author of the ABC game) using his experiences and knowledge.
In table 6 the colour classification of Caluwé and the attitude worst practices of Wilkinson are dis-
played.

1713 People & culture contingency factors
Table 6. Classification of ABC cards in colour classification (based upon [Wilkinson, 2008], [Caluwé, 2010].
Colour classification (when approach does not work [Caluwé, 2010]) Attitude worst practices on BIA
– Weak leaders (undecided, no position). – Only the boss wants it or anyone except the boss.– No pressure or ambition (internal and external). – You get the key figures not with each other in one space.
8 IT thinks it doesn’t need to understand the business to make a business case
9 Walking the talk 10 No respect for, trust in, IT manage-
ment
– Dynamic environment.– Knowledge is not in the organisation and is not available.– Unclear business ownership, conditions and resources.– As irrationality, commissioning plays an important role in change processes.
6 ITIL (best practice) never work here Q No understanding of business priority
& impact A ITIL (best practice) certification
means I know what I’m doing.
– If employees want to take no responsibility.– If no executives can trust (release).– If one wants a puppet-like strategy.– Little ‘together’ and ‘we’.
4 IT not seen as an added value partner to the business
J Let’s outsource the business ...we’d better off.
– Little kinship with and understanding of the change.– Hidden agendas and conflicts.– Non-accepted executives and supervisors.– Much insecurity and little (self-) confidence
K ITIL (best practice) is the objective. Not what it should achieve
3 Knowledge is power 7 My TOOL will solve ALL your ITSM
problems
– Little dynamism and confrontation.– No dare, (self-) confidence and own rate.– Little self-knowledge and relativisation.– Too many dependencies.
2 No respect for, or understanding of customers & users
5 Neither partner makes an effort to understand the other
3.4 Addressing and classifying contingency factor behaviour
3.4.1 Addressing contingency factor behaviourWilkinson [2008] described behaviour as what people do. He defines behaviour as:
“Behaviour is influenced by attitude and by the culture of the organisation. Examples of behaviour are:
– somebody saying they will follow the ITIL procedures but not doing it.
– not registering a solution, or not sharing knowledge to a first line employee even though you know
it would help, and even knowing you should be doing it.
To implement ITSM3 or to improve processes means behaviour must change. As ITSM impacts all levels
within an organisation from operational, to tactical and line management to strategic managers as well as
the User and the business community both IT and Business behaviour will need to change to some degree.
This is a significant realization because as we have said earlier ‘people do not like to change behaviour’, they
will be likely to resist in one way or another until they have bought into the need and the benefits. Until they
have bought into the need and the benefits their attitude will be one of distrust as well as discomfort and
possibly a lack of confidence at having to change the way they do things“
3 ITSM is IT Service Management (see also ITSMF.nl)
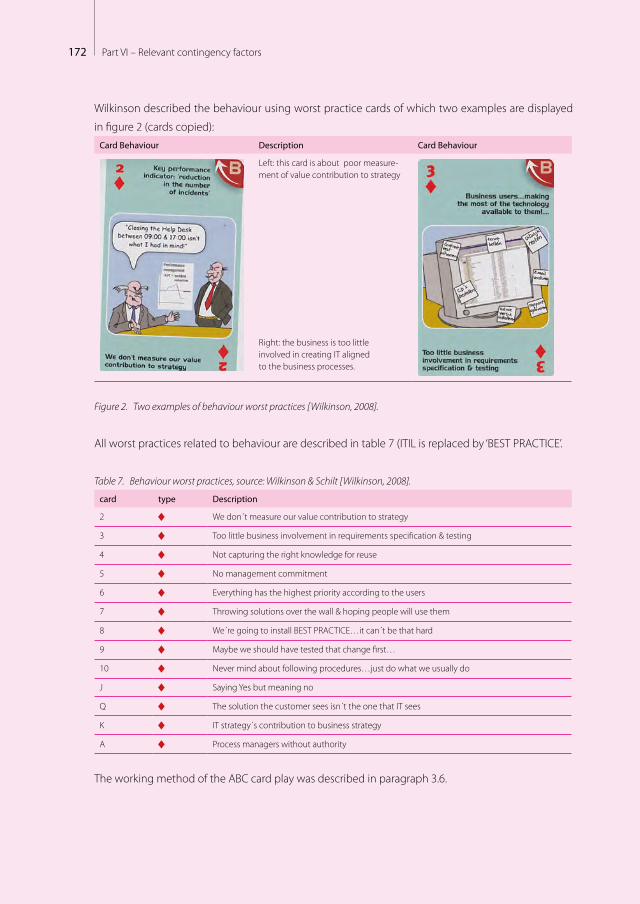
172 Part VI – Relevant contingency factors
Wilkinson described the behaviour using worst practice cards of which two examples are displayed
in figure 2 (cards copied):Card Behaviour Description Card Behaviour
Left: this card is about poor measure-ment of value contribution to strategy
Right: the business is too little involved in creating IT aligned to the business processes.
Figure 2. Two examples of behaviour worst practices [Wilkinson, 2008].
All worst practices related to behaviour are described in table 7 (ITIL is replaced by ‘BEST PRACTICE’.
Table 7. Behaviour worst practices, source: Wilkinson & Schilt [Wilkinson, 2008].
card type Description
2 We don´t measure our value contribution to strategy
3 Too little business involvement in requirements specification & testing
4 Not capturing the right knowledge for reuse
5 No management commitment
6 Everything has the highest priority according to the users
7 Throwing solutions over the wall & hoping people will use them
8 We´re going to install BEST PRACTICE…it can´t be that hard
9 Maybe we should have tested that change first…
10 Never mind about following procedures…just do what we usually do
J Saying Yes but meaning no
Q The solution the customer sees isn´t the one that IT sees
K IT strategy´s contribution to business strategy
A Process managers without authority
The working method of the ABC card play was described in paragraph 3.6.

1733 People & culture contingency factors
3.4.2 Classification for behaviourThe ABC cards were used and ordered via the colour types of de Caluwé and Vermaak [Caluwé, 2010].
This was done by creating a classification between the twelve worst practices of behaviour and the
colour classification for measuring the business & IT relationship and searching for comparison be-
tween the descriptions of attitude using Wilkinson and Schilt [2008], as well as the colour classifica-
tion of Caluwé and Vermaak [2010]. The classification concept is based upon Ofman [1992] in which
‘too much’ of one of the colours will have a negative impact and leads consequently to one of the
worst practices cards of Wilkinson and Schilt [2008]. The worst practice card is seen as an indication
of ‘too much’ of one of the colours of Caluwé and Vermaak [2010]. The result is displayed in table 8.
Table 8. Classification of ABC cards in colour classification (based upon [Wilkinson, 2008], [Caluwé, 2010].
Colour classification (personality [Caluwé, 2010]) Behaviour worst practices on BIA [Wilkinson, 2008]
– Assertive/active – Dutifully – Mindful – Self-control
5 No management commitment J Saying yes but meaning no A Process managers without authority
– Assertive/active – Performance-oriented Order – focused/accurate – Independent
2 We don’t measure our value contribution to strategy 7 Throwing solutions over the wall and hoping people will
use them 8 We’re going to install ITIL (best practice)...it can’t be that
hard Q The solution the customer sees isn’t the one that IT sees
– Careful – Social/caring – Reliable/loyal – Carefully
9 Maybe we should have tested that change first 4 Not capturing the right knowledge for reuse
– Creative/curious – Docile/modest – Sensitive – Altruistic
6 Everything has the highest priority..., according to the users
K IT strategy’s contribution to business strategy
– Fantasy – Self-conscious/Authentic – Vulnerable/ concerned – Straightforward
3 Too little business involvement in requirements specification & testing
10 Never mind about following procedures...just do what we usually do
3.5 Addressing and classifying contingency factor culture
3.5.1 Addressing contingency factor cultureWilkinson [2008] described culture as the accepted ways of working within an organisation. He de-
fines culture as:
“Culture refers to the values and standards that people find normal. Examples of culture are:
– ‘Knowledge is power’, or the ‘hero culture’ in this type of culture people believe that sharing knowledge
diminishes their own value, therefore they want to be the only ones with the expertise and knowledge,
they are the hero’s.
– The blame culture. Everybody points the finger of blame and mistakes are punished.

174 Part VI – Relevant contingency factors
In fact you could say that ‘Attitude’ is individual and comes as a result of personal beliefs and experiences
which influences behaviour. Culture is often difficult to grasp but could be described as the organisational
or corporate attitude. Often employees in an organisation are unaware of the culture and how this influ-
ences their personal attitude and behaviour. This is why culture is one of the most difficult things to change.
It is ‘soft’ you can’t see it, you can’t touch it, you know it’s there, you can get bogged down in it and unable
to move, it can stop a change program in its tracks. It is something to be taken seriously if you want your
change program to succeed… it would seem that the most common approach is to ignore it and hope
that it will go away or change by itself.”
Examples of the Culture worst practice cards are displayed in figure 3 (copied [Wilkinson, 2008]):Card culture description Card culture
Left: this cards could have been based upon Galliers [1994] having a cultural gap between business & IT.
Right: this card expresses a hierarchic culture.
Figure 3. Two examples of cultural worst practices [Wilkinson, 2008].
All worst practices related to culture are described in table 9.
Table 9. Cultural worst practices, source: Wilkinson & Schilt [Wilkinson, 2008].
Card type Description
2 Them and Us culture…opposing & competing forces
3 Hierarchic culture, the boss is always right...even when wrong
4 Internally focused
5 Punishment culture
6 Hero culture
7 9 to 5 culture
8 Plan, do, Stop…no real continual improvement culture
9 Promotion on ability

1753 Measuring BIA maturity
10 The superiority complex ´We know best! ´
J Avoidance culture
Q Not my responsibility
K Empowering people
A Blame culture
The working method of the ABC card play is described in paragraph 3.6.
3.5.2 Classifying contingency factor cultureBased upon the literature research the worst practices have been classified using the culture clas-
sification of Kaarst-Brown [Kaarst, 1999]. In table 10 the culture worst practices will be described cor-
related to the archetypes. The cards express a worst practice which indicates the consequence of an
archetype describing the business & IT relationship (group) in table 10
Table 10. Classification of ABC cards in culture archetypes (based upon [Wilkinson, 2008], [Kaarst, 1999].
Archetypes IT culture [Kaarst, 1999] Culture worst practices on BIA [Wilkinson, 2008]
1. The dragon on a pile of gold: the revered IT culture.
6 Hero culture 10 The superiority complex ‘we know best!’ Q Not my responsibility
2. Caged dragon: the controlled IT culture. 3 Hierarchic culture, The boss is always right…even when the boss is wrong
9 to 5 culture 8 Plan, Do , Stop…no real continual improvement culture
3. Pet dragons: the demystified IT culture. 2 Them and Us culture-opposing and competing forces 4 Internally focused J Avoidance culture
4. Team dragons: the integrated IT culture. 9 Promotion on ability K Empowering people
5. Dead dragons: the fearful IT culture. A Blame culture 5 Punishment culture
3.6 Measuring Attitude, Behaviour & CultureTo address the contingency factors attitude, behaviour & culture the ABC (Attitude, Behaviour & Cul-
ture) measurement mechanism of Wilkinson [2008] was used. In workshops, both the business & IT
representatives attended the ABC card game to identify worst practices on ABC. Globally, the ABC
card game with worst practices has now been played with over 3800 people [Derksen, 2011]. The
same card game has been used within my case and (partly) short survey research. In this paragraph,
the working procedure followed is described for the case survey and short survey research.
3.6.1 Measuring for case researchAfter performing the alignment survey with both business & IT executives within the case organisa-
tion, a workshop of approximately four hours was held with the same people that responded to the

176 Part VI – Relevant contingency factors
alignment survey (or subset of the respondents). The workshop followed the following steps (part of
workshop as described in paragraph 3.6 in part V):
1. Introducing the ABC card game;
2. Performing the ABC card game in two groups: Business & IT separately;
3. Combining the results in top ABC worst practices.
4. Discussing the (group) results of the card game and consequences for cause analysis.
After presenting & discussing the alignment results and having the cause analysis performed, the
ABC card game was played with the case organisations, dividing the delegates into two teams. Busi-
ness team & IT team. The teams were asked to perform the following assignment:
1. Business & IT in their ‘own’ team.
2. Each person selects his/her 3 worst practice cards that are typical for YOUR organisation in YOUR
perspective (if ITIL is mentioned, this could be any other best practice model).
3. Note the 3 worst practice cards on the working paper (see example in figure 4)
a. each person his/her own 3 worst practice cards;
b. a card can be chosen multiple times (in other words, more people can choose the same card);
c. cc. can be 2 of culture and 1 of behaviour or 3 of attitude or... so 3 cards in total (per person)!
4. Describe what is top priority according to your team, based on impact, consequences and poten-
tial business risk. This was not part of my research but added to support alignment improvement
suggestions at the case organisation.
In a few cases, people selected only one or two worst practices.
Based upon the results per case, the following have been determined:
– organisational top 3 worst practices of ABC;
– top Attitude worst practice;
– top Behaviour worst practice;
– top Culture worst practice.
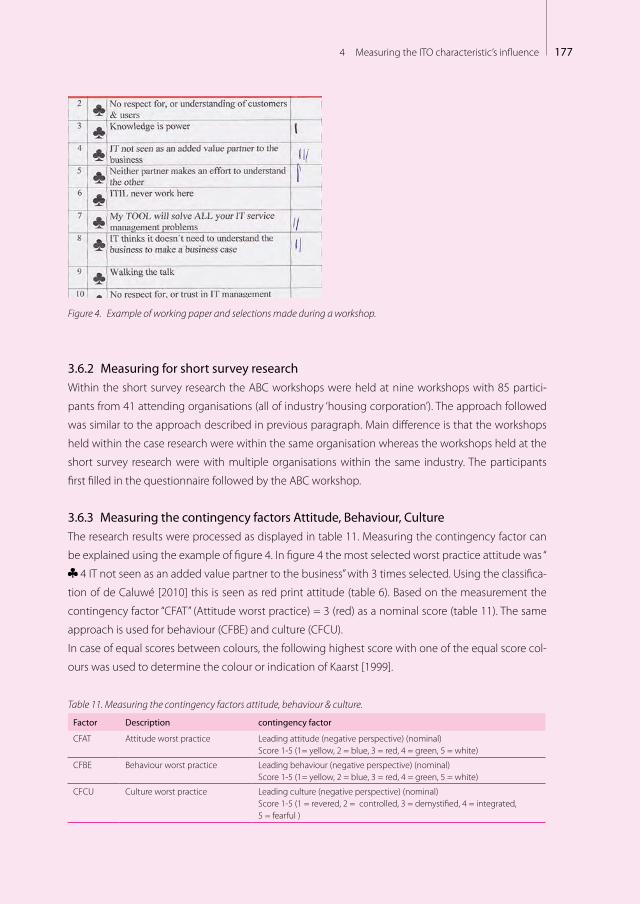
1774 Measuring the ITO characteristic’s influence
Figure 4. Example of working paper and selections made during a workshop.
3.6.2 Measuring for short survey researchWithin the short survey research the ABC workshops were held at nine workshops with 85 partici-
pants from 41 attending organisations (all of industry ‘housing corporation’). The approach followed
was similar to the approach described in previous paragraph. Main difference is that the workshops
held within the case research were within the same organisation whereas the workshops held at the
short survey research were with multiple organisations within the same industry. The participants
first filled in the questionnaire followed by the ABC workshop.
3.6.3 Measuring the contingency factors Attitude, Behaviour, CultureThe research results were processed as displayed in table 11. Measuring the contingency factor can
be explained using the example of figure 4. In figure 4 the most selected worst practice attitude was “
4 IT not seen as an added value partner to the business” with 3 times selected. Using the classifica-
tion of de Caluwé [2010] this is seen as red print attitude (table 6). Based on the measurement the
contingency factor “CFAT” (Attitude worst practice) = 3 (red) as a nominal score (table 11). The same
approach is used for behaviour (CFBE) and culture (CFCU).
In case of equal scores between colours, the following highest score with one of the equal score col-
ours was used to determine the colour or indication of Kaarst [1999].
Table 11. Measuring the contingency factors attitude, behaviour & culture.
Factor Description contingency factor
CFAT Attitude worst practice Leading attitude (negative perspective) (nominal)Score 1-5 (1= yellow, 2 = blue, 3 = red, 4 = green, 5 = white)
CFBE Behaviour worst practice Leading behaviour (negative perspective) (nominal)Score 1-5 (1= yellow, 2 = blue, 3 = red, 4 = green, 5 = white)
CFCU Culture worst practice Leading culture (negative perspective) (nominal)Score 1-5 (1 = revered, 2 = controlled, 3 = demystified, 4 = integrated, 5 = fearful )

178 Part VI – Relevant contingency factors

Part VIIDetailed Results
Informalpervasive
Optimized processes
Improved, managed
processes
Esthablished,focuses
processes
Committedprocesses
Initial or ad hoc
processes
Bonding, uni�ed
Cost e�ective
Some partner-value;
Dashboard managed
Some cost
e�ectiveness; Dashboard
established
IT enables/drives business strategy
IT seen as an asset; Process driver;Con�ict seen as creative
Shared risk & rewards
Emerging value service provider;Balanced tech & business hiring
Relevant process
across the organization
Relevant process
across the organization
Good understanding;
Emerging relaxed
Limited business / IT understanding,
Business / IT lack understanding,
Functional cost e�ciency
Some technical measurements
No formal process,cost center, reactive
priorities
Con�ict; IT a cost of doing
business
Traditional (e.g., acctng, email)
IT takes risk, little reward;
Technical training
Tactical at Functional
level,occasional
responsive
IT emerging as an asset;
Process enabler
Transaction (e.g., ESS, DSS)
Di�ers across functional organizations
Integrated with partners
Integrated across the organization
Extende to external
partners
Integrated across the
org. & partners
Evolve with partners
IT-bunisness co-adaptive
Improvisation-al
Education/careers/rewards across the organization
Communication
ValueGovernance Partnership Scope &
architectureSkills
Contingency factors
Busin
ess &
ITal
ignm
ent
mat
urityIT outsourcing
characteristics in�uence
Relationship Scopeorganisational
Transitionresult
Scopefunctional
Projectmanagement Single/Multi
vendorGovernanceExperience
Contract
SLM
1.57
2.62
Degree ofITO
ITOmaturity
Case research28 organisations454 professionals
Survey research
183 organisations
270 business & IT professionals
Short survey research
183Housing
corporation&
Educationprofessionals

180 Part VII – Detailed Results

181Contents
Contents
1 Introduction 183
2 Result case research 1872.1 Introducing the cases 187
2.2 What is the influence of the components identified for BIA per organisation? 191
2.2.1 Measuring influence of BIA components 191
2.2.2 Calculating the BIA score 191
2.2.3 Calculating the influence of the components per case 192
2.2.4 Correlation coefficient BIA score and BIA components 193
2.3 What is the value of the ITO characteristics per organisation? 196
2.4 What is the BIAS maturity per organisation? 197
2.5 What is the ITO influence on BIA? 199
2.5.1 Correlating Degree ITO and BIA 199
2.5.2 Correlating Degree ITO and BIA from business perspective 201
2.5.3 Correlating Degree ITO and BIA from IT perspective 202
2.5.4 Correlating Degree ITO characteristics and BIA maturity 204
2.5.5 Correlating ITO maturity and BIA maturity 205
2.5.6 Correlating ITO characteristics and BIA maturity 207
2.6 What is the value of the contingency factors per organisation? 208
2.6.1 Correlations organisational factor – industry 208
2.6.2 Correlations organisational factor – size of organisation 209
2.6.3 Correlations organisational factor – geographical area 209
2.6.4 Correlations organisational factor – role respondent 210
2.6.5. Correlations organisational factor – business proposition 212
2.6.6 Correlations organisational factor – IT proposition 213
2.6.7 Correlations people & culture factor 214
Attitude and BIA score, degree ITO and ITO maturity 215
Behaviour and BIA score, degree ITO and ITO maturity 215
Culture and BIA score, degree ITO and ITO maturity 216
3 Result survey research 2173.1 Introducing statistics survey research 217
3.1.1 Responses 218
3.1.2 Industry statistics 218
182 Part VII – Detailed Results
3.1.3 Number of employees statistics 220
3.1.4 Role respondents statistics 221
3.2 What is the influence of the components identified for BIA? 222
3.2.1 Calculating the BIA score 222
3.2.2 Correlation coefficient BIA score and BIA components 222
3.3 What is the value of the ITO characteristics? 225
3.1.1 Scope of ITO – functional 225
3.3.2 ITO experience – size of ITO deal 226
3.3.3 Type of ITO relationship 226
3.4 What is the BIAS maturity? 227
3.5 What is the ITO influence on BIA? 227
3.5.1 Correlating Degree ITO and BIA 228
3.5.2 Correlating Degree ITO and BIA score from business perspective 228
3.5.3 Correlating Degree ITO and BIA from IT perspective 229
3.5.4 Correlating Degree ITO characteristics and BIA maturity 230
3.6 What is the value of the contingency factors? 231
3.6.1 Correlations organisational factor – industry 231
3.6.2 Correlations organisational factor – size of organisation 232
3.6.3 Correlations organisational factor – role respondent 234
4 Result short survey research 2374.1 What is the influence of the components identified for BIA? 238
4.2 What is the value of the ITO characteristics? 238
4.3 What is the BIAS maturity? 239
4.4 What is the ITO influence on BIA? 239
4.5 What is the value of the contingency factors? 240
4.5.1 Correlations organisational factor – industry 240
4.5.2 Correlations organisational factor – size of organisation 241
4.5.3 Correlations organisational factor – role respondent 242
4.5.4 People & culture factor 242

1831 Introduction
“The mirror is your friend and your enemy”
Best advice received from Sadik Hachaoui
(first Dutch officer of justice of Moroccan descent). Source Intermediair (3/12/2009)
IntroductionIn this part the detailed results of the field research are described. The consolidated results will be
discussed in part VIII. The chapters in this part are divided in the three data gathering approaches (see
part II and V): case research, survey research and short survey research. Within the chapters, the para-
graphs follow the structure of the research model as pictured in figure 1 with regard to field research
(blue colour).
1
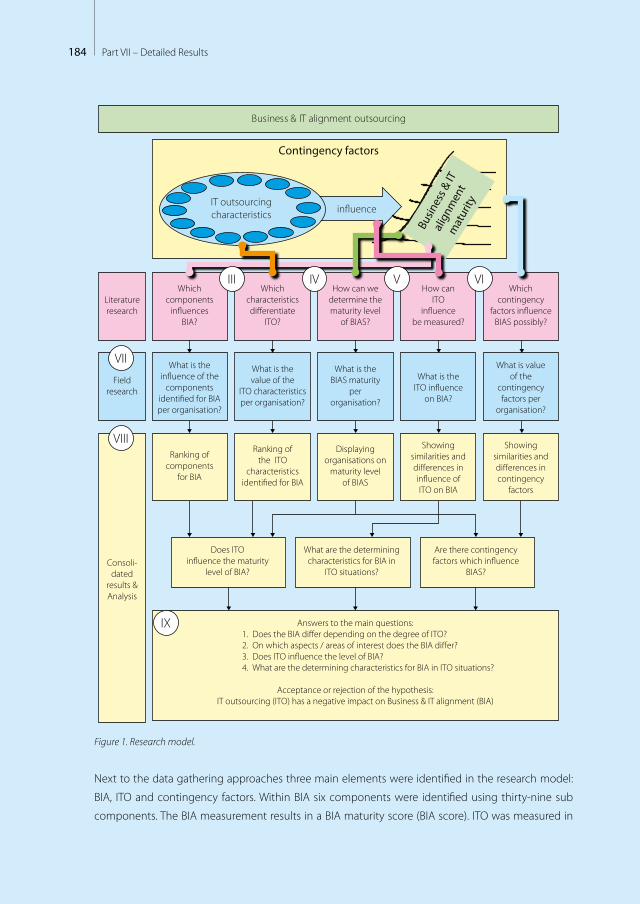
184 Part VII – Detailed Results
Ranking ofcomponents
for BIA
Answers to the main questions:1. Does the BIA di�er depending on the degree of ITO?2. On which aspects / areas of interest does the BIA di�er?3. Does ITO in�uence the level of BIA? 4. What are the determining characteristics for BIA in ITO situations?
Acceptance or rejection of the hypothesis: IT outsourcing (ITO) has a negative impact on Business & IT alignment (BIA)
Does ITOin�uence the maturity
level of BIA?
What are the determining characteristics for BIA in
ITO situations?
Are there contingency factors which in�uence
BIAS?
Ranking of the ITO
characteristicsidenti�ed for BIA
Displayingorganisations on
maturity levelof BIAS
Showingsimilarities anddi�erences inin�uence of ITO on BIA
Showingsimilarities anddi�erences incontingency
factors
Business & IT alignment outsourcing
Contingency factors
Busin
ess &
ITal
ignm
ent
mat
urityIT outsourcing
characteristics in�uence
Literatureresearch
Whichcomponents
in�uences BIA?
Whichcharacteristics di�erentiate
ITO?
How can we determine the maturity level
of BIAS?
How can ITO
in�uence be measured?
Whichcontingency
factors in�uenceBIAS possibly?
Fieldresearch
What is thein�uence of the
componentsidenti�ed for BIA per organisation?
What is the value of the
ITO characteristicsper organisation?
What is the BIAS maturity
perorganisation?
What is the ITO in�uence
on BIA?
What is value of the
contingencyfactors per
organisation?
III IV V VI
VII
VIII
IX
Consoli-dated
results &Analysis
Figure 1. Research model.
Next to the data gathering approaches three main elements were identified in the research model:
BIA, ITO and contingency factors. Within BIA six components were identified using thirty-nine sub
components. The BIA measurement results in a BIA maturity score (BIA score). ITO was measured in

1851 Introduction
ten main characteristics which were based upon fifty-three measuring variables. Both BIA and ITO
measurement mechanism was explained in part V.
Next to BIA and ITO the contingency factors were measured. The measurement mechanism was ex-
plained in part VI. Seven contingency factors were measured. Having this much measuring variables
introduces the need for an overview. This overview is provided in figure 2.
Informalpervasive
Optimized processes
Improved, managed
processes
Esthablished,focuses
processes
Committedprocesses
Initial or ad hoc
processes
Bonding, uni�ed
Cost e�ective
Some partner-value;
Dashboard managed
Some cost
e�ectiveness; Dashboard
established
IT enables/drives business strategy
IT seen as an asset; Process driver;Con�ict seen as creative
Shared risk & rewards
Emerging value service provider;Balanced tech & business hiring
Relevant process
across the organization
Relevant process
across the organization
Good understanding;
Emerging relaxed
Limited business / IT understanding,
Business / IT lack understanding,
Functional cost e�ciency
Some technical measurements
No formal process,cost center, reactive
priorities
Con�ict; IT a cost of doing
business
Traditional (e.g., acctng, email)
IT takes risk, little reward;
Technical training
Tactical at Functional
level,occasional
responsive
IT emerging as an asset;
Process enabler
Transaction (e.g., ESS, DSS)
Di�ers across functional organizations
Integrated with partners
Integrated across the organization
Extende to external
partners
Integrated across the
org. & partners
Evolve with partners
IT-bunisness co-adaptive
Improvisation-al
Education/careers/rewards across the organization
Communication
ValueGovernance Partnership Scope &
architectureSkills
Contingency factors
Busin
ess &
ITal
ignm
ent
mat
urityIT outsourcing
characteristics in�uence
Relationship Scopeorganisational
Transitionresult
Scopefunctional
Projectmanagement Single/Multi
vendorGovernanceExperience
Contract
SLM
1.57
2.62
Degree ofITO
ITOmaturity
Case research Survey research
Short survey research
Businessperspective
Industry Size of organisation
Geographicalarea
Rolerespondent
Businessproposition
IT proposition
People &culture
ITperspective
Businessperspective
ITperspective
Figure 2. Overview research mechanism.
This overview is used in this part in order to identify what is discussed within the detailed results in
this part. Figure 2 can be recognised in an abstract version at the several chapters and paragraphs
in this part providing insight which results are being discussed The consolidated results will be dis-
cussed in part VIII.

186 Part VII – Detailed Results
1872 Result case research
“As long as you are happy, healthy and strong, the obstacles don’t matter”
Best advice received from Lucas Simons, founder ForeFinance, Source Intermediair
Result case researchIn this chapter the research results regarding the case research are described at case level. The results
discuss both the survey results as well as the workshop results. At case level the following structure
is used:
1. What is the influence of the components identified for BIA per organisation?
2. What is the value of the ITO characteristics per organisation?
3. What is the BIAS maturity per organisation?
4. What is the ITO influence on BIA?
5. What is the value of the contingency factors per organisation?
Together with the survey research (chapter 3) and short survey research (chapter 4) the cases are the
baseline for the analyses to follow in part VIII in this dissertation (analysis).
2.1 Introducing the casesTwenty-eight cases were processed. A number of the organisations
processed demanded to remain anonymous in the case description.
The classical composers are often an exemplar of aligning music with
inspiration and have been used to identify the cases. The cases and their
results are described in appendix J. In table 1 a short introduction is pro-
vided.
Case research
2

188 Part VII – Detailed Results
Table 1. Field research case study.
Case nr. Name case (last name will be used) Industry Short description of case
1 Johann Sebastian Bach housing (corporation)
Bach is a housing corporation in the south of the Netherlands. IT is often seen as a cost centre. An information manager was appointed to improve IT usage.
2 Wolfgang Amadeus Mozart construction Mozart provides silicon and automotive products such as sensors. IT is an important part in delivering (new) products.
3 Ludwig van Beethoven finance Beethoven is a large global financial organisation with a wide range of financial products with numerous products and commercial sales channels. IT is seen as a strategic asset.
4 Richard Wagner finance Wagner is a financial organisation oriented at pension funds. IT is an important part in realizing the goals of Wagner.
5 Franz Schubert government Schubert is a large Dutch government organisation with a geographical orientation. IT is used in several ways, which is depending on the organisational department / unit.
6 Robert Schumann government Schumann is a large Dutch government organisation with geographical orientation. IT is a primary part of Schumann’s ‘activities.
7 Frederic Chopin housing Chopin is a housing corporation in the west of the Netherlands. IT is seen as an asset and managed by a member of the senior management.
8 Franz Liszt housing Liszt is a housing corporation in the west of the Netherlands. Liszt was at the start of a huge transformation based on IT possibilities using an ERP solution. Beforehand IT was seen as a cost centre.
9 Johannes Brahms education Brahms provides higher professional education in the west of the Netherlands. IT was seen as a possibility to innovate, but was managed as a facility.
10 Giuseppe Verdi government Verdi is a large Dutch local government organisation. Verdi is organized via services (products). IT is seen as a cost centre, but investments are often business case based.

1892 Result case research
Case nr. Name case (last name will be used) Industry Short description of case
11 Gustav Mahler industry Mahler is a large, global, mainly construction organisation. IT starts to become of more importance.
12 Peter Ilyich Tchaikovsky housing Tchaikovsky is a housing corporation in the west of the Netherlands. Within Tchaikovsky, IT was often seen as a cost centre.
13 Sergei Rachmaninov housing Rachmaninov is a housing corporation in the west of the Netherlands. IT was seen as a cost centre, but did increase in importance.
14 George Frederick Händel education Händel provides higher professional education. Händel is a relatively small but flexible organisation demanding this same flexibility from IT.
15 Franz Joseph Haydn housing Haydn is a housing corporation in the middle of the Netherlands. IT is seen as an asset and managed by a member of the senior management.
16 Antonin Dvorak housing Dvorak is a housing corporation in the east of the Netherlands. IT is seen as a cost centre, but steps are made to increase the IT usage.
17 Igor Stravinsky government Stravinsky is a large Dutch government organisation with a product orientation. IT is seen as a strategic asset.
18 Felix Mendelssohn education Mendelssohn provides professional education in north-east of the Netherlands. IT is seen as an asset.
19 Claude Debussy utility Debussy is a medium large utility supplier (gas & electricity). IT is seen as an asset and investments are made in implementing an ERP system.
20 Hector Berlioz IT service provider
Berlioz is a large IT service provider mainly in Europe. IT is a core business and seen as a strategic asset.
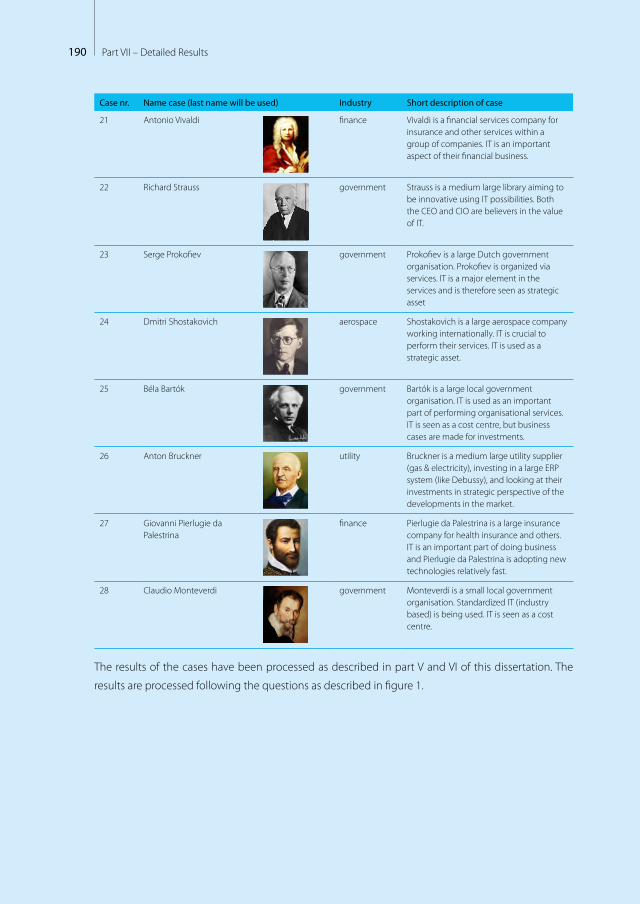
190 Part VII – Detailed Results
Case nr. Name case (last name will be used) Industry Short description of case
21 Antonio Vivaldi finance Vivaldi is a financial services company for insurance and other services within a group of companies. IT is an important aspect of their financial business.
22 Richard Strauss government Strauss is a medium large library aiming to be innovative using IT possibilities. Both the CEO and CIO are believers in the value of IT.
23 Serge Prokofiev government Prokofiev is a large Dutch government organisation. Prokofiev is organized via services. IT is a major element in the services and is therefore seen as strategic asset
24 Dmitri Shostakovich aerospace Shostakovich is a large aerospace company working internationally. IT is crucial to perform their services. IT is used as a strategic asset.
25 Béla Bartók government Bartók is a large local government organisation. IT is used as an important part of performing organisational services. IT is seen as a cost centre, but business cases are made for investments.
26 Anton Bruckner utility Bruckner is a medium large utility supplier (gas & electricity), investing in a large ERP system (like Debussy), and looking at their investments in strategic perspective of the developments in the market.
27 Giovanni Pierlugie da Palestrina
finance Pierlugie da Palestrina is a large insurance company for health insurance and others. IT is an important part of doing business and Pierlugie da Palestrina is adopting new technologies relatively fast.
28 Claudio Monteverdi government Monteverdi is a small local government organisation. Standardized IT (industry based) is being used. IT is seen as a cost centre.
The results of the cases have been processed as described in part V and VI of this dissertation. The
results are processed following the questions as described in figure 1.

1912 Result case research
2.2 What is the influence of the components identified for BIA per organisation?
In part III the components that influence BIA have been described. These components have been
measured for all cases. In part V a methodology for determining the maturity level of BIA is provided.
Based upon the results of part III and V, the influence of the components identified for BIA can be
measured per organisation. These results of the field research are described in this paragraph.
2.2.1 Measuring influence of BIA componentsThirty-nine sub components determine six BIA components leading to
one BIA score (see 3.2 part V). The sub components are of equal impact
on the measured BIA component. The BIA components have conse-
quently an even impact on the BIA score. Measuring the influence of
the BIA components is performed as described below:
– Calculating the BIA components (as described in chapter 3, part V);
– Calculating the BIA score per case (paragraph 3.3, part V);
– Comparing the BIA components to the BIA score (this paragraph).
Comparing the BIA components is looking at the kind of influence the BIA components had on BIA.
For example in the case of Bach (paragraph 3.5 in part V) the BIA component ‘Value measurement’
has a strong negative influence on the BIA score as the only score at level 1. Besides negative influ-
ence from BIA components on the BIA score, the positive influence is also identified.
2.2.2 Calculating the BIA scoreFirst, the BIA components and BIA score were calculated per case. Secondly, the mean and standard
deviation were calculated with regard to the twenty-eight cases. The overall result is presented in
table 2.
Table 2. Results BIA component and BIA score.
Communi-cation
Value Measure-ment
Governance Partnership Architecture & Scope
Skills & Competences
Score maturity BIA
N Valid 28 28 28 28 28 28 28
Missing 0 0 0 0 0 0 0
Mean 2.5670 2.1756 2.7008 2.5904 2.6612 2.3455 2.5068
Std. Deviation .34884 .39403 .37738 .32208 .34036 .29057 .29144
With regard to the influence of the components identified for the 28 cases the following findings can
be made:
Finding 1: BIA component Value measurement contribute negatively to BIA score (mean = 2.1756).
Finding 2: BIA component Governance contribute positively to BIA score (mean = 2.7008).
Finding 3: BIA component Value measurement has the highest standard deviation (s = 0.39403).
Case research
Informalpervasive
Optimized processes
Improved, managed
processes
Esthablished,focuses
processes
Committedprocesses
Initial or ad hoc
processes
Bonding, uni�ed
Cost e�ective
Some partner-value;
Dashboard managed
Some cost
e�ectiveness; Dashboard
established
IT enables/drives business strategy
IT seen as an asset; Process driver;Con�ict seen as creative
Shared risk & rewards
Emerging value service provider;Balanced tech & business hiring
Relevant process
across the organization
Relevant process
across the organization
Good understanding;
Emerging relaxed
Limited business / IT understanding,
Business / IT lack understanding,
Functional cost e�ciency
Some technical measurements
No formal process,cost center, reactive
priorities
Con�ict; IT a cost of doing
business
Traditional (e.g., acctng, email)
IT takes risk, little reward;
Technical training
Tactical at Functional
level,occasional
responsive
IT emerging as an asset;
Process enabler
Transaction (e.g., ESS, DSS)
Di�ers across functional organizations
Integrated with partners
Integrated across the organization
Extende to external
partners
Integrated across the
org. & partners
Evolve with partners
IT-bunisness co-adaptive
Improvisation-al
Education/careers/rewards across the organization
Communication
ValueGovernance Partnership Scope &
architectureSkills
Busin
ess &
ITal
ignm
ent
mat
urity
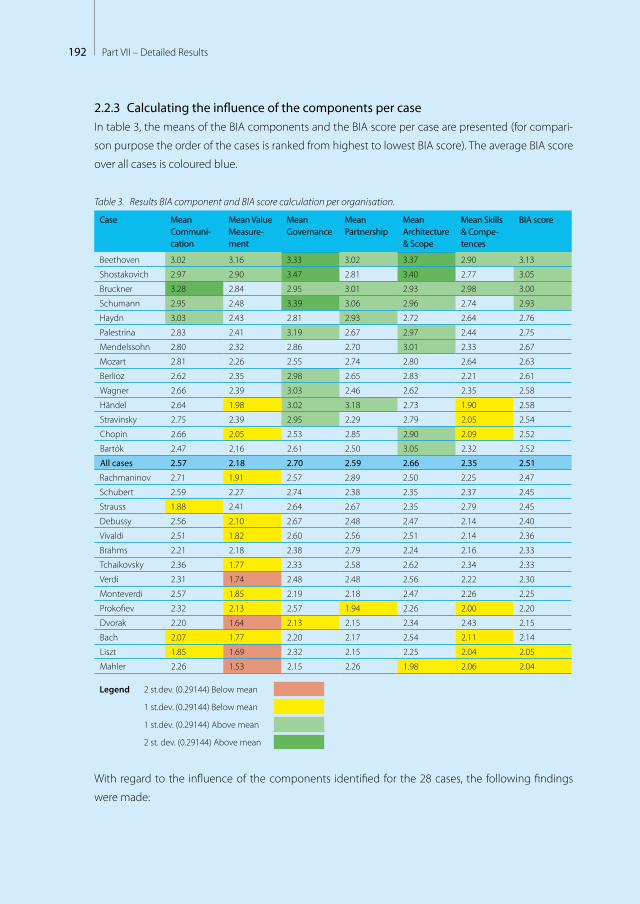
192 Part VII – Detailed Results
2.2.3 Calculating the influence of the components per caseIn table 3, the means of the BIA components and the BIA score per case are presented (for compari-
son purpose the order of the cases is ranked from highest to lowest BIA score). The average BIA score
over all cases is coloured blue.
Table 3. Results BIA component and BIA score calculation per organisation.
Case Mean Communi-cation
Mean Value Measure-ment
Mean Governance
Mean Partnership
Mean Architecture & Scope
Mean Skills & Compe-tences
BIA score
Beethoven 3.02 3.16 3.33 3.02 3.37 2.90 3.13
Shostakovich 2.97 2.90 3.47 2.81 3.40 2.77 3.05
Bruckner 3.28 2.84 2.95 3.01 2.93 2.98 3.00
Schumann 2.95 2.48 3.39 3.06 2.96 2.74 2.93
Haydn 3.03 2.43 2.81 2.93 2.72 2.64 2.76
Palestrina 2.83 2.41 3.19 2.67 2.97 2.44 2.75
Mendelssohn 2.80 2.32 2.86 2.70 3.01 2.33 2.67
Mozart 2.81 2.26 2.55 2.74 2.80 2.64 2.63
Berlioz 2.62 2.35 2.98 2.65 2.83 2.21 2.61
Wagner 2.66 2.39 3.03 2.46 2.62 2.35 2.58
Händel 2.64 1.98 3.02 3.18 2.73 1.90 2.58
Stravinsky 2.75 2.39 2.95 2.29 2.79 2.05 2.54
Chopin 2.66 2.05 2.53 2.85 2.90 2.09 2.52
Bartók 2.47 2.16 2.61 2.50 3.05 2.32 2.52
All cases 2.57 2.18 2.70 2.59 2.66 2.35 2.51
Rachmaninov 2.71 1.91 2.57 2.89 2.50 2.25 2.47
Schubert 2.59 2.27 2.74 2.38 2.35 2.37 2.45
Strauss 1.88 2.41 2.64 2.67 2.35 2.79 2.45
Debussy 2.56 2.10 2.67 2.48 2.47 2.14 2.40
Vivaldi 2.51 1.82 2.60 2.56 2.51 2.14 2.36
Brahms 2.21 2.18 2.38 2.79 2.24 2.16 2.33
Tchaikovsky 2.36 1.77 2.33 2.58 2.62 2.34 2.33
Verdi 2.31 1.74 2.48 2.48 2.56 2.22 2.30
Monteverdi 2.57 1.85 2.19 2.18 2.47 2.26 2.25
Prokofiev 2.32 2.13 2.57 1.94 2.26 2.00 2.20
Dvorak 2.20 1.64 2.13 2.15 2.34 2.43 2.15
Bach 2.07 1.77 2.20 2.17 2.54 2.11 2.14
Liszt 1.85 1.69 2.32 2.15 2.25 2.04 2.05
Mahler 2.26 1.53 2.15 2.26 1.98 2.06 2.04
Legend 2 st.dev. (0.29144) Below mean
1 st.dev. (0.29144) Below mean
1 st.dev. (0.29144) Above mean
2 st. dev. (0.29144) Above mean
With regard to the influence of the components identified for the 28 cases, the following findings
were made:

1932 Result case research
Finding 4: BIA component Value measurement contributes negatively to BIA score for 13 cases
(1 and 2 st.dev. below mean).
Finding 5: BIA component Governance contribute positively to BIA score for 9 cases
(1 and 2 st.dev. above mean).
Finding 6: 4 cases (Beethoven, Schumann, Shostakovich and Bruckner) are significantly above mean.
Finding 7: 4 cases (Liszt, Verdi, Mahler and Dvorak) show a 2 st.dev. (0,29144) below mean, all at BIA
component Value Measurement.
2.2.4 Correlation coefficient BIA score and BIA componentsBased on the question ‘what is the influence of the components identified for BIA?’ it is interesting to
analyse the correlation between BIA score and BIA components. A high level of correlation is to be
expected while the BIA score is a calculated result from the BIA components (see chapter 3, part V).
Interesting to see is which BIA components have a higher correlation with the BIA score based upon
the cases. The correlation is tested using Pearson’s correlation. Pearson’s correlation was used while
the variables are all interval variables (scale within SPSS) in which case the Pearson’s method should
be adopted [Baarda,2011]. This result is displayed in table 4.`
Table 4. Pearson’s correlation – one-tailed BIA score1 and BIA components. M
ean
Com
mun
icat
ion
Mea
n va
lue
Mea
sure
-m
ent
Mea
n G
over
nanc
e
Mea
n Pa
rtne
rshi
p
Mea
n A
rchi
tect
ure
&
scop
e
Mea
n Sk
ills
& C
ompe
-te
nces
Scor
e m
atur
ity B
usin
ess
&
IT a
lignm
ent
Mean Communication Pearson Correlation 1 .699** .714** .633** .728** .515** .855**Sig. (1-tailed) .000 .000 .000 .000 .003 .000
N 28 28 28 28 28 28 28Mean Value Measurement
Pearson Correlation .699** 1 .839** .553** .735** .727** .912**Sig. (1-tailed) .000 .000 .001 .000 .000 .000
N 28 28 28 28 28 28 28Mean Governance Pearson Correlation .714** .839** 1 .616** .762** .494** .891**
Sig. (1-tailed) .000 .000 .000 .000 .004 .000N 28 28 28 28 28 28 28
Mean Partnership Pearson Correlation .633** .553** .616** 1 .596** .489** .765**Sig. (1-tailed) .000 .001 .000 .000 .004 .000
N 28 28 28 28 28 28 28Mean Architecture & Scope
Pearson Correlation .728** .735** .762** .596** 1 .530 .868**Sig. (1-tailed) .000 .000 .000 .000 .002 .000
N 28 28 28 28 28 28 28Mean Skills & Competences
Pearson Correlation .515** .727** .494** .489** .530** 1 .732**Sig. (1-tailed) .003 .000 .004 .004 .002 .000
N 28 28 28 28 28 28 28Score maturity Business & IT alignment
Pearson Correlation .855** .912** .891** .765** .868** .732** 1Sig. (1-tailed) .000 .000 .000 .000 .000 .000
N 28 28 28 28 28 28 28
** Correlation is significant at the 0.01 level (1-tailed).1 one tailed is used in case of a clear expectation with regard to the correlation [Baarda, 2011].
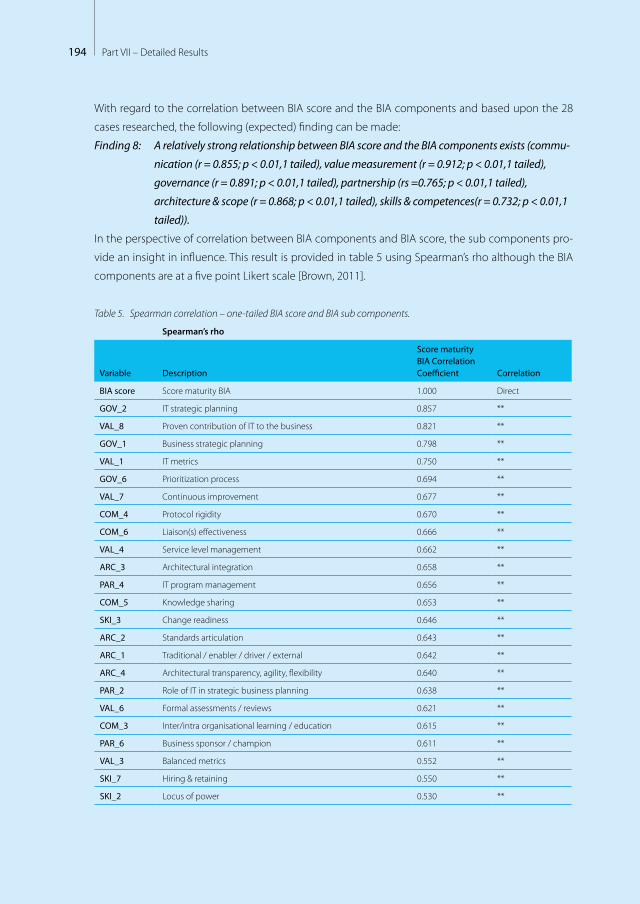
194 Part VII – Detailed Results
With regard to the correlation between BIA score and the BIA components and based upon the 28
cases researched, the following (expected) finding can be made:
Finding 8: A relatively strong relationship between BIA score and the BIA components exists (commu-
nication (r = 0.855; p < 0.01,1 tailed), value measurement (r = 0.912; p < 0.01,1 tailed),
governance (r = 0.891; p < 0.01,1 tailed), partnership (rs =0.765; p < 0.01,1 tailed),
architecture & scope (r = 0.868; p < 0.01,1 tailed), skills & competences(r = 0.732; p < 0.01,1
tailed)).
In the perspective of correlation between BIA components and BIA score, the sub components pro-
vide an insight in influence. This result is provided in table 5 using Spearman’s rho although the BIA
components are at a five point Likert scale [Brown, 2011].
Table 5. Spearman correlation – one-tailed BIA score and BIA sub components.
Spearman’s rho
Variable Description
Score maturity BIA Correlation Coefficient Correlation
BIA score Score maturity BIA 1.000 Direct
GOV_2 IT strategic planning 0.857 **
VAL_8 Proven contribution of IT to the business 0.821 **
GOV_1 Business strategic planning 0.798 **
VAL_1 IT metrics 0.750 **
GOV_6 Prioritization process 0.694 **
VAL_7 Continuous improvement 0.677 **
COM_4 Protocol rigidity 0.670 **
COM_6 Liaison(s) effectiveness 0.666 **
VAL_4 Service level management 0.662 **
ARC_3 Architectural integration 0.658 **
PAR_4 IT program management 0.656 **
COM_5 Knowledge sharing 0.653 **
SKI_3 Change readiness 0.646 **
ARC_2 Standards articulation 0.643 **
ARC_1 Traditional / enabler / driver / external 0.642 **
ARC_4 Architectural transparency, agility, flexibility 0.640 **
PAR_2 Role of IT in strategic business planning 0.638 **
VAL_6 Formal assessments / reviews 0.621 **
COM_3 Inter/intra organisational learning / education 0.615 **
PAR_6 Business sponsor / champion 0.611 **
VAL_3 Balanced metrics 0.552 **
SKI_7 Hiring & retaining 0.550 **
SKI_2 Locus of power 0.530 **
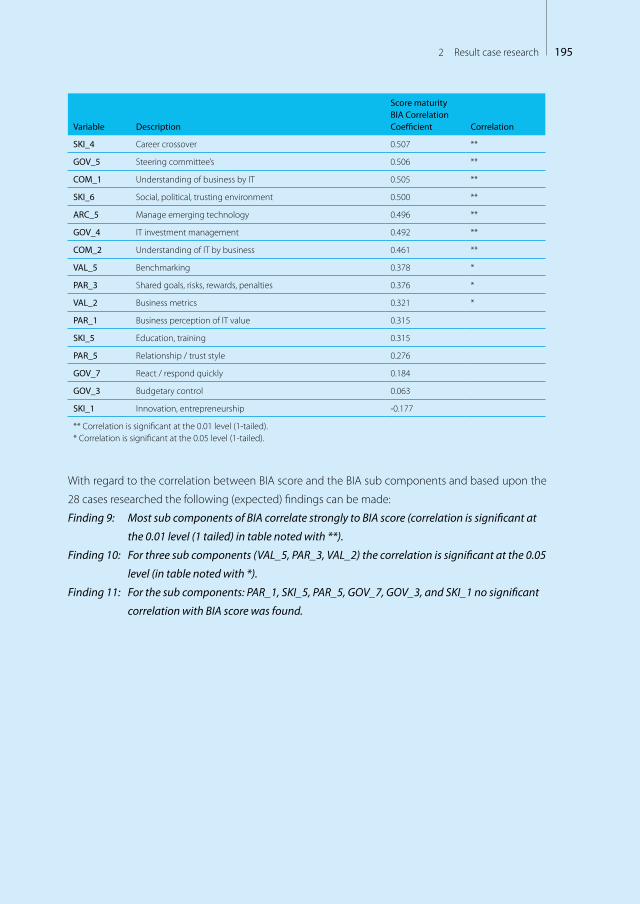
1952 Result case research
Variable Description
Score maturity BIA Correlation Coefficient Correlation
SKI_4 Career crossover 0.507 **
GOV_5 Steering committee’s 0.506 **
COM_1 Understanding of business by IT 0.505 **
SKI_6 Social, political, trusting environment 0.500 **
ARC_5 Manage emerging technology 0.496 **
GOV_4 IT investment management 0.492 **
COM_2 Understanding of IT by business 0.461 **
VAL_5 Benchmarking 0.378 *
PAR_3 Shared goals, risks, rewards, penalties 0.376 *
VAL_2 Business metrics 0.321 *
PAR_1 Business perception of IT value 0.315
SKI_5 Education, training 0.315
PAR_5 Relationship / trust style 0.276
GOV_7 React / respond quickly 0.184
GOV_3 Budgetary control 0.063
SKI_1 Innovation, entrepreneurship -0.177
** Correlation is significant at the 0.01 level (1-tailed).* Correlation is significant at the 0.05 level (1-tailed).
With regard to the correlation between BIA score and the BIA sub components and based upon the
28 cases researched the following (expected) findings can be made:
Finding 9: Most sub components of BIA correlate strongly to BIA score (correlation is significant at
the 0.01 level (1 tailed) in table noted with **).
Finding 10: For three sub components (VAL_5, PAR_3, VAL_2) the correlation is significant at the 0.05
level (in table noted with *).
Finding 11: For the sub components: PAR_1, SKI_5, PAR_5, GOV_7, GOV_3, and SKI_1 no significant
correlation with BIA score was found.
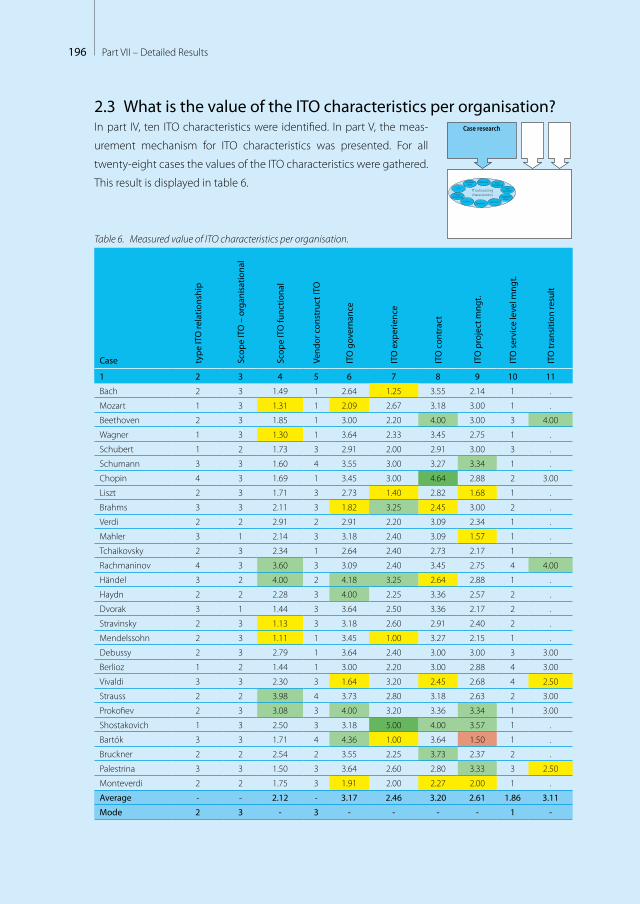
196 Part VII – Detailed Results
2.3 What is the value of the ITO characteristics per organisation? In part IV, ten ITO characteristics were identified. In part V, the meas-
urement mechanism for ITO characteristics was presented. For all
twenty-eight cases the values of the ITO characteristics were gathered.
This result is displayed in table 6.
Table 6. Measured value of ITO characteristics per organisation.
Case type
ITO
rela
tions
hip
Scop
e IT
O –
org
anis
atio
nal
Scop
e IT
O fu
nctio
nal
Vend
or c
onst
ruct
ITO
ITO
gov
erna
nce
ITO
exp
erie
nce
ITO
con
trac
t
ITO
pro
ject
mng
t.
ITO
ser
vice
leve
l mng
t.
ITO
tran
sitio
n re
sult
1 2 3 4 5 6 7 8 9 10 11
Bach 2 3 1.49 1 2.64 1.25 3.55 2.14 1 .
Mozart 1 3 1.31 1 2.09 2.67 3.18 3.00 1 .
Beethoven 2 3 1.85 1 3.00 2.20 4.00 3.00 3 4.00
Wagner 1 3 1.30 1 3.64 2.33 3.45 2.75 1 .
Schubert 1 2 1.73 3 2.91 2.00 2.91 3.00 3 .
Schumann 3 3 1.60 4 3.55 3.00 3.27 3.34 1 .
Chopin 4 3 1.69 1 3.45 3.00 4.64 2.88 2 3.00
Liszt 2 3 1.71 3 2.73 1.40 2.82 1.68 1 .
Brahms 3 3 2.11 3 1.82 3.25 2.45 3.00 2 .
Verdi 2 2 2.91 2 2.91 2.20 3.09 2.34 1 .
Mahler 3 1 2.14 3 3.18 2.40 3.09 1.57 1 .
Tchaikovsky 2 3 2.34 1 2.64 2.40 2.73 2.17 1 .
Rachmaninov 4 3 3.60 3 3.09 2.40 3.45 2.75 4 4.00
Händel 3 2 4.00 2 4.18 3.25 2.64 2.88 1 .
Haydn 2 2 2.28 3 4.00 2.25 3.36 2.57 2 .
Dvorak 3 1 1.44 3 3.64 2.50 3.36 2.17 2 .
Stravinsky 2 3 1.13 3 3.18 2.60 2.91 2.40 2 .
Mendelssohn 2 3 1.11 1 3.45 1.00 3.27 2.15 1 .
Debussy 2 3 2.79 1 3.64 2.40 3.00 3.00 3 3.00
Berlioz 1 2 1.44 1 3.00 2.20 3.00 2.88 4 3.00
Vivaldi 3 3 2.30 3 1.64 3.20 2.45 2.68 4 2.50
Strauss 2 2 3.98 4 3.73 2.80 3.18 2.63 2 3.00
Prokofiev 2 3 3.08 3 4.00 3.20 3.36 3.34 1 3.00
Shostakovich 1 3 2.50 3 3.18 5.00 4.00 3.57 1 .
Bartók 3 3 1.71 4 4.36 1.00 3.64 1.50 1 .
Bruckner 2 2 2.54 2 3.55 2.25 3.73 2.37 2 .
Palestrina 3 3 1.50 3 3.64 2.60 2.80 3.33 3 2.50
Monteverdi 2 2 1.75 3 1.91 2.00 2.27 2.00 1 .
Average - - 2.12 - 3.17 2.46 3.20 2.61 1.86 3.11
Mode 2 3 - 3 - - - - 1 -
Case research
IT outsourcingcharacteristics
Relationship Scopeorganizational
Transitionresult
Scopefunctional
Projectmanagement Single/Multi
vendorGovernanceExperience
Contract
SLM

1972 Result case research
Legend (columns numbers and colour coding per column):1. Case name2. Importance ITO relationship (1= transactional, 2= enhanced,
3= collaborative, 4= partnership)3. Scope ITO organisational (1= decentralized, 2= federated,
3= centralized)4. Scope ITO functional (1 = not outsourced <–> 5 = completely
outsourced)5. Single / multi vendor ITO (1=single sourcing, 2=co-sourcing,
3=multi sourcing, 4=alliance, 5=joint venture)6. ITO governance (1=level 1/poor <-> 5=level 5/strong)7. ITO experience (1=no experience <-> 4.6 =very high
experienced)8. ITO contract (1=level 1/poor <-> 5=level 5/strong)9. ITO project management (1=level 1/poor <-> 5=level 5/strong)10. ITO service level management (1=level 1/poor <-> 5=level 5/
strong)11. ITO transition result (1=level 1/poor <-> 5=level 5/strong)
2 st.dev. Below mean
1 st.dev. Below mean
1 st.dev. Above mean
2 st. dev. Above mean
With regard to the measured value of ITO characteristics per organisation for the 28 cases, the following
findings can be made:
Finding 12: A large number of cases (13) use enhanced sourcing with regard to type ITO relationship.
Finding 13: Most cases (18) use a centralised organisational structure with regard to managing ITO.
Finding 14: On average, the researched cases have a limited functional scope of ITO
(mean = 2.12, std.dev. = 0.81, n = 28).
Finding 15: A large number of cases (13) use multi sourcing with regard to the vendor construct.
Finding 16: On average, the researched cases are at level 3 with regard to governance of ITO
(mean = 3.17, std.dev. 0.70, n = 28).
Finding 17: The average ITO experience is limited experienced (mean = 2.46, std.dev. = 0.80, n = 28).
Finding 18: On average, the researched cases are at level 3 with regard to sourcing contract
(mean = 3.2, std.dev. = 0.52, n = 28).
Finding 19: On average, the level of project management delivered by ITO vendor is at level 2
(mean = 2.61, std.dev. = 0.55, n = 28).
Finding 20: On average, the level of service level management delivered by ITO vendor is at level 1
(mean = 1.86, std.dev. = 1.04, n = 28).
Finding 21: On average, the researched cases are at level 3 of ITO transition
(mean = 3.11, std.dev. = 0.55, n = 28 (17 no transition).
2.4 What is the BIAS maturity per organisation? In part V the measurement mechanism for BIA maturity, ITO maturity
and degree of ITO was described. The results with regard to the 28
researched cases are displayed in table 7 (ordered from high to low
on BIA maturity).
Case research
Informalpervasive
Optimized processes
Improved, managed
processes
Esthablished,focuses
processes
Committedprocesses
Initial or ad hoc
processes
Bonding, uni�ed
Cost e�ective
Some partner-value;
Dashboard managed
Some cost
e�ectiveness; Dashboard
established
IT enables/drives business strategy
IT seen as an asset; Process driver;Con�ict seen as creative
Shared risk & rewards
Emerging value service provider;Balanced tech & business hiring
Relevant process
across the organization
Relevant process
across the organization
Good understanding;
Emerging relaxed
Limited business / IT understanding,
Business / IT lack understanding,
Functional cost e�ciency
Some technical measurements
No formal process,cost center, reactive
priorities
Con�ict; IT a cost of doing
business
Traditional (e.g., acctng, email)
IT takes risk, little reward;
Technical training
Tactical at Functional
level,occasional
responsive
IT emerging as an asset;
Process enabler
Transaction (e.g., ESS, DSS)
Di�ers across functional organizations
Integrated with partners
Integrated across the organization
Extende to external
partners
Integrated across the
org. & partners
Evolve with partners
IT-bunisness co-adaptive
Improvisation-al
Education/careers/rewards across the organization
Communication
ValueGovernance Partnership Scope &
architectureSkills
Busin
ess &
ITal
ignm
ent
mat
urity
1.57
2.62
Degree ofITO
ITOmaturity

198 Part VII – Detailed Results
Table 7. Results BIA maturity, ITO maturity and Degree ITO of case research per organisation.
Case BIA maturity ITO maturity Degree ITO
Beethoven 3.13 3.20 1.68
Shostakovich 3.05 3.35 3.00
Bruckner 3.00 2.72 2.63
Schumann 2.93 2.83 1.88
Haydn 2.76 2.98 2.02
Palestrina 2.75 3.14 1.80
Mendelssohn 2.67 2.47 1.09
Mozart 2.63 2.65 1.65
Berlioz 2.61 3.18 1.55
Wagner 2.58 2.76 1.64
Händel 2.58 2.72 4.20
Stravinsky 2.54 2.59 1.70
Chopin 2.52 3.39 1.95
Bartók 2.52 2.62 1.57
Rachmaninov 2.47 3.05 3.88
Schubert 2.45 2.86 1.78
Strauss 2.45 2.80 4.18
Debussy 2.40 3.03 3.03
Vivaldi 2.36 2.85 2.64
Brahms 2.33 2.65 2.09
Tchaikovsky 2.33 2.20 2.47
Verdi 2.30 2.46 2.93
Monteverdi 2.25 1.80 1.80
Prokofiev 2.20 3.03 3.46
Dvorak 2.15 2.94 2.20
Bach 2.14 2.06 1.59
Liszt 2.05 1.83 1.97
Mahler 2.04 2.37 2.31
Average 2.51 2.73 2.28
Standard deviation 0.29144 0.41063 0.85022
Legend 2 st.dev. Below mean
1 st.dev. Below mean
1 st.dev. Above mean
2 st. dev. Above mean
With regard to BIA maturity, ITO maturity and Degree ITO identified for the 28 cases, the following
findings can be made:

1992 Result case research
Finding 22: 1 case (Beethoven) is 2x st.dev above average BIA score (maturity)
(mean = 2.51, st.dev. = 0.29144, n = 28).
Finding 23: 5 cases (Prokofiev, Dvorak, Bach, Liszt, Mahler) are lower than 1x st.dev on average BIA
score (maturity) (mean = 2.51, st.dev. = 0.29144, n = 28).
Finding 24: 5 cases (Beethoven, Shostakovich, Palestrina, Berlioz and Chopin) are significantly
above mean on ITO maturity (mean = 2.73, st.dev. = 0.41063, n = 28).
Finding 25: 4 cases (Liszt, Monteverdi, Tchaikovsky and Bach) show a 1 or 2 st.dev.(0,41063) below
mean at ITO maturity (mean = 2.73, st.dev. = 0.41063, n = 28).
Finding 26: 2 cases (Mendelssohn and Dvorak) show an above 1 st.dev. on degree of ITO
(mean = 2.28, st.dev. = 0.85022, n = 28).
Finding 27: 4 cases (Händel, Strauss, Rachmaninov and Prokofiev) show a 1 or 2 st.dev. above mean
at degree of ITO (mean = 2.28, st.dev. = 0.85022, n = 28).
2.5 What is the ITO influence on BIA?In this paragraph, the ITO influence on BIA of the 28 cases researched is described from four perspec-
tives: BIA maturity, BIA maturity from business perspective (business representatives only), BIA matu-
rity from IT perspective (IT representatives only) and using Degree ITO characteristics. The degree of
ITO is the calculated variable indicating whether ITO is low or significant.
2.5.1 Correlating Degree ITO and BIAThe correlation between Degree ITO and BIA is tested using both
Spearman’s rho and Pearson’s correlation. Spearman’s rho is used
when the underlying factors can be seen as ordinal scale in which
Spearman’s rho would be best [Baarda,2011]. Pearson’s correlation was
used while the calculated Degree ITO and BIA score are interval vari-
ables (scale within SPSS) in which case the Pearson’s method should
be adopted [Baarda,2011]. The results are displayed in table 8 and 9.
Table 8. Spearman’s ranking correlation BIA score and Degree ITO (n=28).
Score maturity Business & IT
alignment Degree ITO
Spearman’s rho Score maturity Business & IT alignment
Correlation Coefficient 1.000 -.229
Sig. (1-tailed) . .120
N 28 28
Degree ITO Correlation Coefficient -.229 1.000
Sig. (1-tailed) .120 .
N 28 28
Case research
Informalpervasive
Optimized processes
Improved, managed
processes
Esthablished,focuses
processes
Committedprocesses
Initial or ad hoc
processes
Bonding, uni�ed
Cost e�ective
Some partner-value;
Dashboard managed
Some cost
e�ectiveness; Dashboard
established
IT enables/drives business strategy
IT seen as an asset; Process driver;Con�ict seen as creative
Shared risk & rewards
Emerging value service provider;Balanced tech & business hiring
Relevant process
across the organization
Relevant process
across the organization
Good understanding;
Emerging relaxed
Limited business / IT understanding,
Business / IT lack understanding,
Functional cost e�ciency
Some technical measurements
No formal process,cost center, reactive
priorities
Con�ict; IT a cost of doing
business
Traditional (e.g., acctng, email)
IT takes risk, little reward;
Technical training
Tactical at Functional
level,occasional
responsive
IT emerging as an asset;
Process enabler
Transaction (e.g., ESS, DSS)
Di�ers across functional organizations
Integrated with partners
Integrated across the organization
Extende to external
partners
Integrated across the
org. & partners
Evolve with partners
IT-bunisness co-adaptive
Improvisation-al
Education/careers/rewards across the organization
Communication
ValueGovernance Partnership Scope &
architectureSkills
Busin
ess &
ITal
ignm
ent
mat
urityIT outsourcing
characteristics in�uenceScope
functional
Experience 1.57
Degree ofITO
Deg
ree
ITO
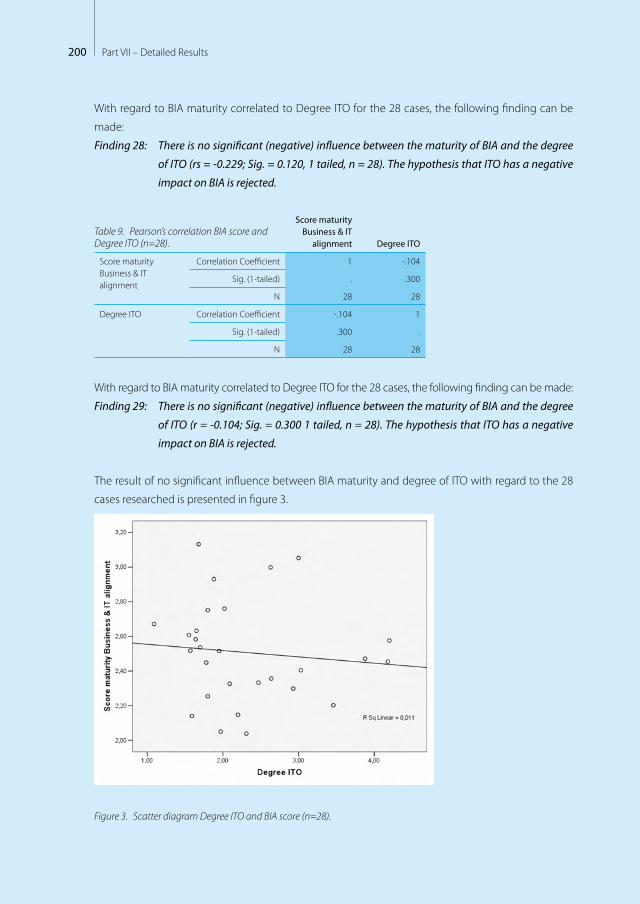
200 Part VII – Detailed Results
With regard to BIA maturity correlated to Degree ITO for the 28 cases, the following finding can be
made:
Finding 28: There is no significant (negative) influence between the maturity of BIA and the degree
of ITO (rs = -0.229; Sig. = 0.120, 1 tailed, n = 28). The hypothesis that ITO has a negative
impact on BIA is rejected.
Table 9. Pearson’s correlation BIA score and Degree ITO (n=28).
Score maturity Business & IT
alignment Degree ITO
Score maturity Business & IT alignment
Correlation Coefficient 1 -.104
Sig. (1-tailed) . .300
N 28 28
Degree ITO Correlation Coefficient -.104 1
Sig. (1-tailed) .300 .
N 28 28
With regard to BIA maturity correlated to Degree ITO for the 28 cases, the following finding can be made:
Finding 29: There is no significant (negative) influence between the maturity of BIA and the degree
of ITO (r = -0.104; Sig. = 0.300 1 tailed, n = 28). The hypothesis that ITO has a negative
impact on BIA is rejected.
The result of no significant influence between BIA maturity and degree of ITO with regard to the 28
cases researched is presented in figure 3.
Figure 3. Scatter diagram Degree ITO and BIA score (n=28).
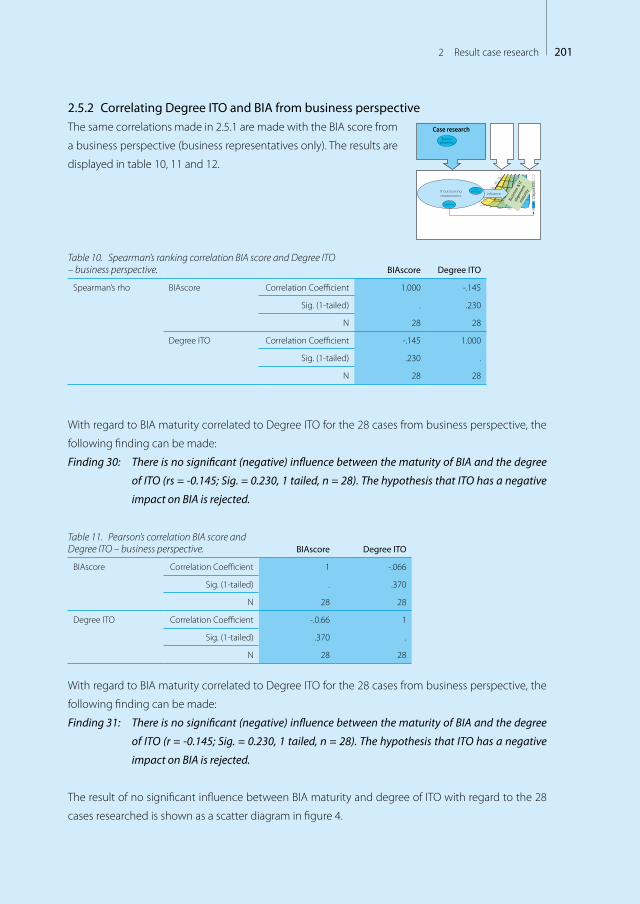
2012 Result case research
2.5.2 Correlating Degree ITO and BIA from business perspectiveThe same correlations made in 2.5.1 are made with the BIA score from
a business perspective (business representatives only). The results are
displayed in table 10, 11 and 12.
Table 10. Spearman’s ranking correlation BIA score and Degree ITO – business perspective. BIAscore Degree ITO
Spearman’s rho BIAscore Correlation Coefficient 1.000 -.145
Sig. (1-tailed) . .230
N 28 28
Degree ITO Correlation Coefficient -.145 1.000
Sig. (1-tailed) .230 .
N 28 28
With regard to BIA maturity correlated to Degree ITO for the 28 cases from business perspective, the
following finding can be made:
Finding 30: There is no significant (negative) influence between the maturity of BIA and the degree
of ITO (rs = -0.145; Sig. = 0.230, 1 tailed, n = 28). The hypothesis that ITO has a negative
impact on BIA is rejected.
Table 11. Pearson’s correlation BIA score and Degree ITO – business perspective. BIAscore Degree ITO
BIAscore Correlation Coefficient 1 -.066
Sig. (1-tailed) . .370
N 28 28
Degree ITO Correlation Coefficient -.0.66 1
Sig. (1-tailed) .370 .
N 28 28
With regard to BIA maturity correlated to Degree ITO for the 28 cases from business perspective, the
following finding can be made:
Finding 31: There is no significant (negative) influence between the maturity of BIA and the degree
of ITO (r = -0.145; Sig. = 0.230, 1 tailed, n = 28). The hypothesis that ITO has a negative
impact on BIA is rejected.
The result of no significant influence between BIA maturity and degree of ITO with regard to the 28
cases researched is shown as a scatter diagram in figure 4.
Case research
Informalpervasive
Optimized processes
Improved, managed
processes
Esthablished,focuses
processes
Committedprocesses
Initial or ad hoc
processes
Bonding, uni�ed
Cost e�ective
Some partner-value;
Dashboard managed
Some cost
e�ectiveness; Dashboard
established
IT enables/drives business strategy
IT seen as an asset; Process driver;Con�ict seen as creative
Shared risk & rewards
Emerging value service provider;Balanced tech & business hiring
Relevant process
across the organization
Relevant process
across the organization
Good understanding;
Emerging relaxed
Limited business / IT understanding,
Business / IT lack understanding,
Functional cost e�ciency
Some technical measurements
No formal process,cost center, reactive
priorities
Con�ict; IT a cost of doing
business
Traditional (e.g., acctng, email)
IT takes risk, little reward;
Technical training
Tactical at Functional
level,occasional
responsive
IT emerging as an asset;
Process enabler
Transaction (e.g., ESS, DSS)
Di�ers across functional organizations
Integrated with partners
Integrated across the organization
Extende to external
partners
Integrated across the
org. & partners
Evolve with partners
IT-bunisness co-adaptive
Improvisation-al
Education/careers/rewards across the organization
Communication
ValueGovernance Partnership Scope &
architectureSkills
Busin
ess &
ITal
ignm
ent
mat
urityIT outsourcing
characteristics in�uenceScope
functional
Experience 1.57
Degree ofITO
Businessperspective
Deg
ree
ITO

202 Part VII – Detailed Results
Figure 4. Scatter diagram Degree ITO and BIA score – business perspective (n=28).
With regard to BIA maturity correlated to Degree ITO for the 28 cases from business perspective com-
pared with figure 2, the following finding can be made:
Finding 32: The BIA score from business perspective (mean = 2.48, st.dev. = 0.3145) is on average
lower than the overall BIA score (mean = 2.51, st.dev = 0.29144).
2.5.3 Correlating Degree ITO and BIA from IT perspectiveThe same correlations made in 2.5.1 are made with BIA score from the
IT perspective (IT representatives only). The results are displayed in ta-
ble 12, 13 and 14.
Table 12. Spearman’s ranking correlation BIA score and Degree ITO – IT perspective. BIAscore Degree ITO
Spearman’s rho BIAscore Correlation Coefficient 1.000 -.086
Sig. (1-tailed) . .332
N 28 28
Degree ITO Correlation Coefficient -.086 1.000
Sig. (1-tailed) .332 .
N 28 28
Case research
Informalpervasive
Optimized processes
Improved, managed
processes
Esthablished,focuses
processes
Committedprocesses
Initial or ad hoc
processes
Bonding, uni�ed
Cost e�ective
Some partner-value;
Dashboard managed
Some cost
e�ectiveness; Dashboard
established
IT enables/drives business strategy
IT seen as an asset; Process driver;Con�ict seen as creative
Shared risk & rewards
Emerging value service provider;Balanced tech & business hiring
Relevant process
across the organization
Relevant process
across the organization
Good understanding;
Emerging relaxed
Limited business / IT understanding,
Business / IT lack understanding,
Functional cost e�ciency
Some technical measurements
No formal process,cost center, reactive
priorities
Con�ict; IT a cost of doing
business
Traditional (e.g., acctng, email)
IT takes risk, little reward;
Technical training
Tactical at Functional
level,occasional
responsive
IT emerging as an asset;
Process enabler
Transaction (e.g., ESS, DSS)
Di�ers across functional organizations
Integrated with partners
Integrated across the organization
Extende to external
partners
Integrated across the
org. & partners
Evolve with partners
IT-bunisness co-adaptive
Improvisation-al
Education/careers/rewards across the organization
Communication
ValueGovernance Partnership Scope &
architectureSkills
Busin
ess &
ITal
ignm
ent
mat
urityIT outsourcing
characteristics in�uenceScope
functional
Experience 1.57
Degree ofITO
Deg
ree
ITO
ITperspective
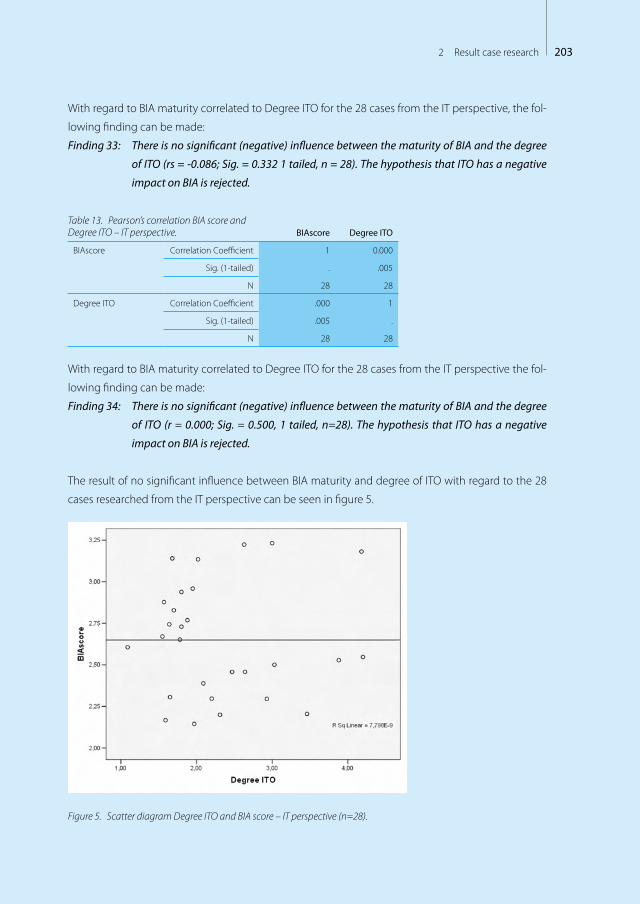
2032 Result case research
With regard to BIA maturity correlated to Degree ITO for the 28 cases from the IT perspective, the fol-
lowing finding can be made:
Finding 33: There is no significant (negative) influence between the maturity of BIA and the degree
of ITO (rs = -0.086; Sig. = 0.332 1 tailed, n = 28). The hypothesis that ITO has a negative
impact on BIA is rejected.
Table 13. Pearson’s correlation BIA score and Degree ITO – IT perspective. BIAscore Degree ITO
BIAscore Correlation Coefficient 1 0.000
Sig. (1-tailed) . .005
N 28 28
Degree ITO Correlation Coefficient .000 1
Sig. (1-tailed) .005 .
N 28 28
With regard to BIA maturity correlated to Degree ITO for the 28 cases from the IT perspective the fol-
lowing finding can be made:
Finding 34: There is no significant (negative) influence between the maturity of BIA and the degree
of ITO (r = 0.000; Sig. = 0.500, 1 tailed, n=28). The hypothesis that ITO has a negative
impact on BIA is rejected.
The result of no significant influence between BIA maturity and degree of ITO with regard to the 28
cases researched from the IT perspective can be seen in figure 5.
Figure 5. Scatter diagram Degree ITO and BIA score – IT perspective (n=28).
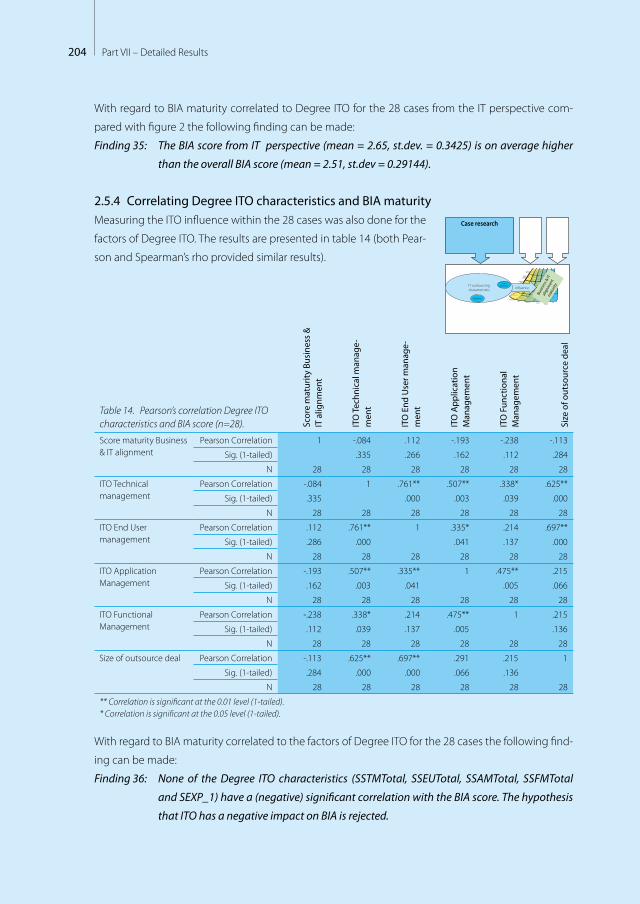
204 Part VII – Detailed Results
With regard to BIA maturity correlated to Degree ITO for the 28 cases from the IT perspective com-
pared with figure 2 the following finding can be made:
Finding 35: The BIA score from IT perspective (mean = 2.65, st.dev. = 0.3425) is on average higher
than the overall BIA score (mean = 2.51, st.dev = 0.29144).
2.5.4 Correlating Degree ITO characteristics and BIA maturityMeasuring the ITO influence within the 28 cases was also done for the
factors of Degree ITO. The results are presented in table 14 (both Pear-
son and Spearman’s rho provided similar results).
Table 14. Pearson’s correlation Degree ITO characteristics and BIA score (n=28). Sc
ore
mat
urity
Bus
ines
s &
IT
alig
nmen
t
ITO
Tech
nica
l man
age-
men
t
ITO
End
Use
r man
age-
men
t
ITO
App
licat
ion
Man
agem
ent
ITO
Fun
ctio
nal
Man
agem
ent
Size
of o
utso
urce
dea
l
Score maturity Business & IT alignment
Pearson Correlation 1 -.084 .112 -.193 -.238 -.113
Sig. (1-tailed) .335 .266 .162 .112 .284
N 28 28 28 28 28 28
ITO Technical management
Pearson Correlation -.084 1 .761** .507** .338* .625**
Sig. (1-tailed) .335 .000 .003 .039 .000
N 28 28 28 28 28 28
ITO End User management
Pearson Correlation .112 .761** 1 .335* .214 .697**
Sig. (1-tailed) .286 .000 .041 .137 .000
N 28 28 28 28 28 28
ITO Application Management
Pearson Correlation -.193 .507** .335** 1 .475** .215
Sig. (1-tailed) .162 .003 .041 .005 .066
N 28 28 28 28 28 28
ITO Functional Management
Pearson Correlation -.238 .338* .214 .475** 1 .215
Sig. (1-tailed) .112 .039 .137 .005 .136
N 28 28 28 28 28 28
Size of outsource deal Pearson Correlation -.113 .625** .697** .291 .215 1
Sig. (1-tailed) .284 .000 .000 .066 .136
N 28 28 28 28 28 28
** Correlation is significant at the 0.01 level (1-tailed).* Correlation is significant at the 0.05 level (1-tailed).
With regard to BIA maturity correlated to the factors of Degree ITO for the 28 cases the following find-
ing can be made:
Finding 36: None of the Degree ITO characteristics (SSTMTotal, SSEUTotal, SSAMTotal, SSFMTotal
and SEXP_1) have a (negative) significant correlation with the BIA score. The hypothesis
that ITO has a negative impact on BIA is rejected.
Case research
Informalpervasive
Optimized processes
Improved, managed
processes
Esthablished,focuses
processes
Committedprocesses
Initial or ad hoc
processes
Bonding, uni�ed
Cost e�ective
Some partner-value;
Dashboard managed
Some cost
e�ectiveness; Dashboard
established
IT enables/drives business strategy
IT seen as an asset; Process driver;Con�ict seen as creative
Shared risk & rewards
Emerging value service provider;Balanced tech & business hiring
Relevant process
across the organization
Relevant process
across the organization
Good understanding;
Emerging relaxed
Limited business / IT understanding,
Business / IT lack understanding,
Functional cost e�ciency
Some technical measurements
No formal process,cost center, reactive
priorities
Con�ict; IT a cost of doing
business
Traditional (e.g., acctng, email)
IT takes risk, little reward;
Technical training
Tactical at Functional
level,occasional
responsive
IT emerging as an asset;
Process enabler
Transaction (e.g., ESS, DSS)
Di�ers across functional organizations
Integrated with partners
Integrated across the organization
Extende to external
partners
Integrated across the
org. & partners
Evolve with partners
IT-bunisness co-adaptive
Improvisation-al
Education/careers/rewards across the organization
Communication
ValueGovernance Partnership Scope &
architectureSkills
Busin
ess &
ITal
ignm
ent
mat
urityIT outsourcing
characteristics in�uenceScope
functional
Experience
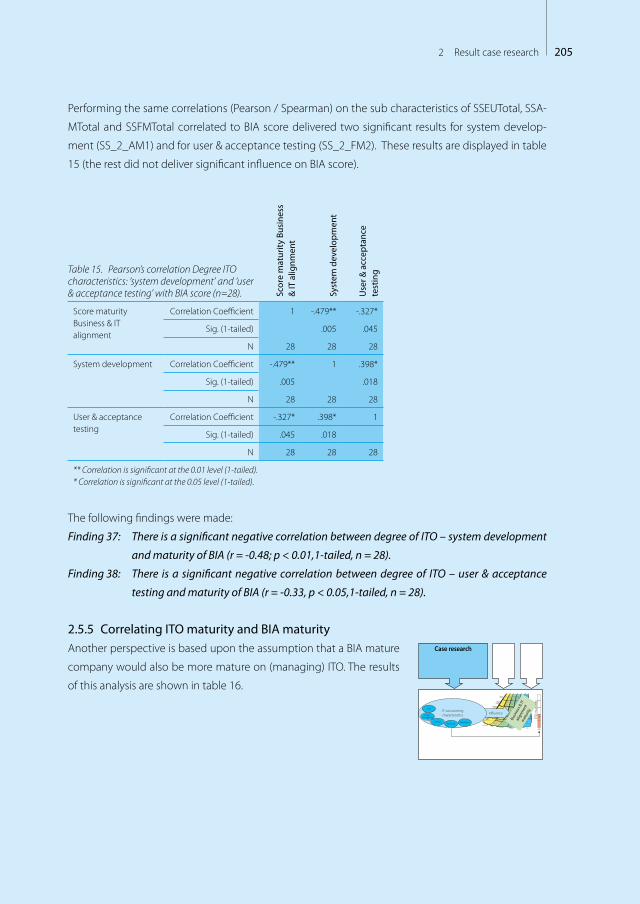
2052 Result case research
Performing the same correlations (Pearson / Spearman) on the sub characteristics of SSEUTotal, SSA-
MTotal and SSFMTotal correlated to BIA score delivered two significant results for system develop-
ment (SS_2_AM1) and for user & acceptance testing (SS_2_FM2). These results are displayed in table
15 (the rest did not deliver significant influence on BIA score).
Table 15. Pearson’s correlation Degree ITO characteristics: ‘system development’ and ‘user & acceptance testing’ with BIA score (n=28). Sc
ore
mat
urity
Bus
ines
s &
IT a
lignm
ent
Syst
em d
evel
opm
ent
Use
r & a
ccep
tanc
e te
stin
g
Score maturity Business & IT alignment
Correlation Coefficient 1 -.479** -.327*
Sig. (1-tailed) .005 .045
N 28 28 28
System development Correlation Coefficient -.479** 1 .398*
Sig. (1-tailed) .005 .018
N 28 28 28
User & acceptance testing
Correlation Coefficient -.327* .398* 1
Sig. (1-tailed) .045 .018
N 28 28 28
** Correlation is significant at the 0.01 level (1-tailed).* Correlation is significant at the 0.05 level (1-tailed).
The following findings were made:
Finding 37: There is a significant negative correlation between degree of ITO – system development
and maturity of BIA (r = -0.48; p < 0.01,1-tailed, n = 28).
Finding 38: There is a significant negative correlation between degree of ITO – user & acceptance
testing and maturity of BIA (r = -0.33, p < 0.05,1-tailed, n = 28).
2.5.5 Correlating ITO maturity and BIA maturityAnother perspective is based upon the assumption that a BIA mature
company would also be more mature on (managing) ITO. The results
of this analysis are shown in table 16.
Case research
Informalpervasive
Optimized processes
Improved, managed
processes
Esthablished,focuses
processes
Committedprocesses
Initial or ad hoc
processes
Bonding, uni�ed
Cost e�ective
Some partner-value;
Dashboard managed
Some cost
e�ectiveness; Dashboard
established
IT enables/drives business strategy
IT seen as an asset; Process driver;Con�ict seen as creative
Shared risk & rewards
Emerging value service provider;Balanced tech & business hiring
Relevant process
across the organization
Relevant process
across the organization
Good understanding;
Emerging relaxed
Limited business / IT understanding,
Business / IT lack understanding,
Functional cost e�ciency
Some technical measurements
No formal process,cost center, reactive
priorities
Con�ict; IT a cost of doing
business
Traditional (e.g., acctng, email)
IT takes risk, little reward;
Technical training
Tactical at Functional
level,occasional
responsive
IT emerging as an asset;
Process enabler
Transaction (e.g., ESS, DSS)
Di�ers across functional organizations
Integrated with partners
Integrated across the organization
Extende to external
partners
Integrated across the
org. & partners
Evolve with partners
IT-bunisness co-adaptive
Improvisation-al
Education/careers/rewards across the organization
Communication
ValueGovernance Partnership Scope &
architectureSkills
Busin
ess &
ITal
ignm
ent
mat
urityIT outsourcing
characteristics in�uenceProject
management
GovernanceExperienceContract
SLM
2.62
ITOmaturity
ITO
mat
urity
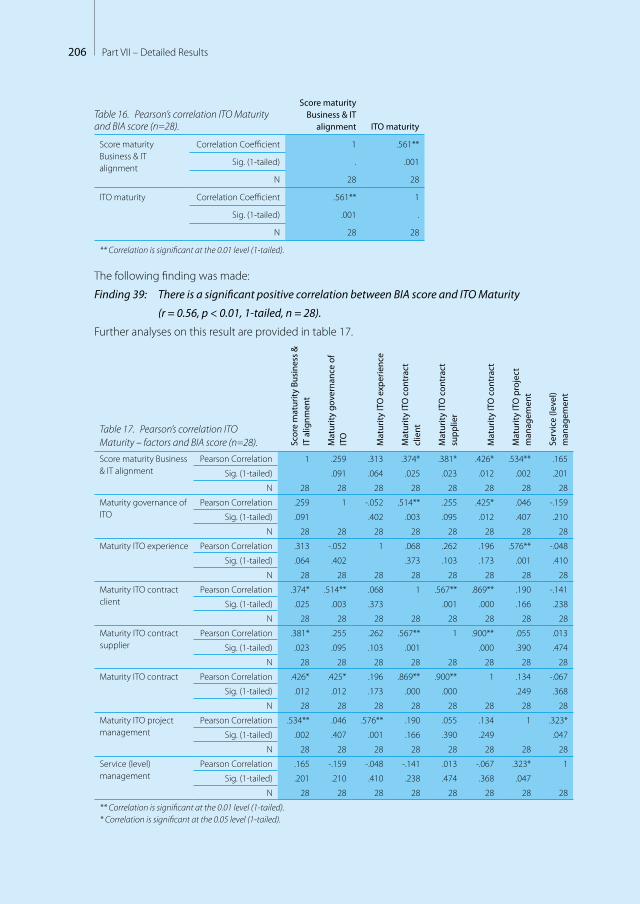
206 Part VII – Detailed Results
Table 16. Pearson’s correlation ITO Maturity and BIA score (n=28).
Score maturity Business & IT
alignment ITO maturity
Score maturity Business & IT alignment
Correlation Coefficient 1 .561**
Sig. (1-tailed) . .001
N 28 28
ITO maturity Correlation Coefficient .561** 1
Sig. (1-tailed) .001 .
N 28 28
** Correlation is significant at the 0.01 level (1-tailed).
The following finding was made:
Finding 39: There is a significant positive correlation between BIA score and ITO Maturity
(r = 0.56, p < 0.01, 1-tailed, n = 28).
Further analyses on this result are provided in table 17.
Table 17. Pearson’s correlation ITO Maturity – factors and BIA score (n=28). Sc
ore
mat
urity
Bus
ines
s &
IT
alig
nmen
t
Mat
urity
gov
erna
nce
of
ITO
Mat
urity
ITO
exp
erie
nce
Mat
urity
ITO
con
trac
t cl
ient
Mat
urity
ITO
con
trac
t su
pplie
r
Mat
urity
ITO
con
trac
t
Mat
urity
ITO
pro
ject
m
anag
emen
t
Serv
ice
(leve
l) m
anag
emen
t
Score maturity Business & IT alignment
Pearson Correlation 1 .259 .313 .374* .381* .426* .534** .165
Sig. (1-tailed) .091 .064 .025 .023 .012 .002 .201
N 28 28 28 28 28 28 28 28
Maturity governance of ITO
Pearson Correlation .259 1 -.052 .514** .255 .425* .046 -.159
Sig. (1-tailed) .091 .402 .003 .095 .012 .407 .210
N 28 28 28 28 28 28 28 28
Maturity ITO experience Pearson Correlation .313 -.052 1 .068 .262 .196 .576** -.048
Sig. (1-tailed) .064 .402 .373 .103 .173 .001 .410
N 28 28 28 28 28 28 28 28
Maturity ITO contract client
Pearson Correlation .374* .514** .068 1 .567** .869** .190 -.141
Sig. (1-tailed) .025 .003 .373 .001 .000 .166 .238
N 28 28 28 28 28 28 28 28
Maturity ITO contract supplier
Pearson Correlation .381* .255 .262 .567** 1 .900** .055 .013
Sig. (1-tailed) .023 .095 .103 .001 .000 .390 .474
N 28 28 28 28 28 28 28 28
Maturity ITO contract Pearson Correlation .426* .425* .196 .869** .900** 1 .134 -.067
Sig. (1-tailed) .012 .012 .173 .000 .000 .249 .368
N 28 28 28 28 28 28 28 28
Maturity ITO project management
Pearson Correlation .534** .046 .576** .190 .055 .134 1 .323*
Sig. (1-tailed) .002 .407 .001 .166 .390 .249 .047
N 28 28 28 28 28 28 28 28
Service (level) management
Pearson Correlation .165 -.159 -.048 -.141 .013 -.067 .323* 1
Sig. (1-tailed) .201 .210 .410 .238 .474 .368 .047
N 28 28 28 28 28 28 28 28
** Correlation is significant at the 0.01 level (1-tailed).* Correlation is significant at the 0.05 level (1-tailed).
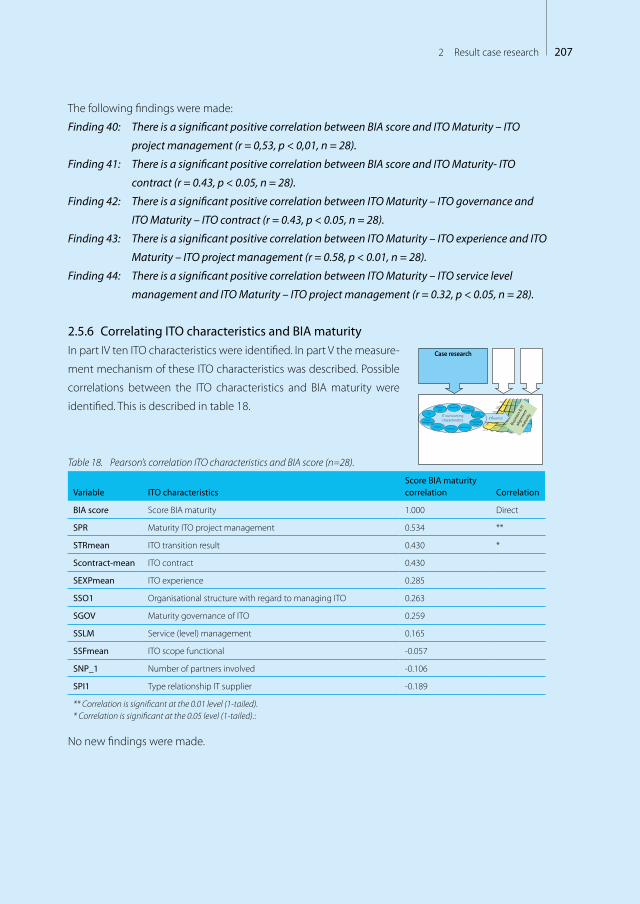
2072 Result case research
The following findings were made:
Finding 40: There is a significant positive correlation between BIA score and ITO Maturity – ITO
project management (r = 0,53, p < 0,01, n = 28).
Finding 41: There is a significant positive correlation between BIA score and ITO Maturity- ITO
contract (r = 0.43, p < 0.05, n = 28).
Finding 42: There is a significant positive correlation between ITO Maturity – ITO governance and
ITO Maturity – ITO contract (r = 0.43, p < 0.05, n = 28).
Finding 43: There is a significant positive correlation between ITO Maturity – ITO experience and ITO
Maturity – ITO project management (r = 0.58, p < 0.01, n = 28).
Finding 44: There is a significant positive correlation between ITO Maturity – ITO service level
management and ITO Maturity – ITO project management (r = 0.32, p < 0.05, n = 28).
2.5.6 Correlating ITO characteristics and BIA maturityIn part IV ten ITO characteristics were identified. In part V the measure-
ment mechanism of these ITO characteristics was described. Possible
correlations between the ITO characteristics and BIA maturity were
identified. This is described in table 18.
Table 18. Pearson’s correlation ITO characteristics and BIA score (n=28).
Variable ITO characteristicsScore BIA maturity correlation Correlation
BIA score Score BIA maturity 1.000 Direct
SPR Maturity ITO project management 0.534 **
STRmean ITO transition result 0.430 *
Scontract-mean ITO contract 0.430
SEXPmean ITO experience 0.285
SSO1 Organisational structure with regard to managing ITO 0.263
SGOV Maturity governance of ITO 0.259
SSLM Service (level) management 0.165
SSFmean ITO scope functional -0.057
SNP_1 Number of partners involved -0.106
SPI1 Type relationship IT supplier -0.189
** Correlation is significant at the 0.01 level (1-tailed).* Correlation is significant at the 0.05 level (1-tailed).:
No new findings were made.
Case research
Informalpervasive
Optimized processes
Improved, managed
processes
Esthablished,focuses
processes
Committedprocesses
Initial or ad hoc
processes
Bonding, uni�ed
Cost e�ective
Some partner-value;
Dashboard managed
Some cost
e�ectiveness; Dashboard
established
IT enables/drives business strategy
IT seen as an asset; Process driver;Con�ict seen as creative
Shared risk & rewards
Emerging value service provider;Balanced tech & business hiring
Relevant process
across the organization
Relevant process
across the organization
Good understanding;
Emerging relaxed
Limited business / IT understanding,
Business / IT lack understanding,
Functional cost e�ciency
Some technical measurements
No formal process,cost center, reactive
priorities
Con�ict; IT a cost of doing
business
Traditional (e.g., acctng, email)
IT takes risk, little reward;
Technical training
Tactical at Functional
level,occasional
responsive
IT emerging as an asset;
Process enabler
Transaction (e.g., ESS, DSS)
Di�ers across functional organizations
Integrated with partners
Integrated across the organization
Extende to external
partners
Integrated across the
org. & partners
Evolve with partners
IT-bunisness co-adaptive
Improvisation-al
Education/careers/rewards across the organization
Communication
ValueGovernance Partnership Scope &
architectureSkills
Busin
ess &
ITal
ignm
ent
mat
urityIT outsourcing
characteristics in�uence
Relationship Scopeorganizational
Transitionresult
Scopefunctional
Projectmanagement Single/Multi
vendorGovernanceExperience
Contract
SLM

208 Part VII – Detailed Results
2.6 What is the value of the contingency factors per organisation?In this paragraph the influence of the contingency factors identified is tested on BIA, as well as on
the degree of ITO. The structure followed is based upon the identified contingency factors in part VI.
2.6.1 Correlations organisational factor – industryThe influence of the contingency factor industry is calculated. For the re-
searched cases, the industry and their BIA score are displayed in figure 6.
Manufacturing 14%BIA score=2.52Degree ITO=2.41
Financial services 14%BIA score=2.71Degree ITO=1.94
Government / not for pro�t 39%BIA score=2.47Degree ITO=2.43
Logistics 4%BIA score=3.05
Degree ITO=3.00
Housing corporation 25%BIA score=2.35
Degree ITO=2.30
Professional services 4%BIA score=2.61
Degree ITO=1.55
Figure 6. Industry, BIA score and Degree ITO (n=28).
Between the identified industry and their average score on BIA score and Degree ITO differences can
be seen. For example, financial services has a relatively high score on BIA score (mean BIA score =2.71
compared with average of 2.51) and on average a low Degree ITO (mean Degree ITO=1.94 compared
with average of 2.28).
The correlation between BIA score and Degree ITO was tested within the following identified indus-
tries: ‘construction all’, ‘financial services’, ‘government /not for profit’ and ‘housing corporation’. The
industries ‘professional services’ and ‘logistics’ did not provide enough comparison possibilities within
the case study (only 1 company).
The industries ‘financial services’ and ‘government/not for profit’ showed a non significant negative
correlation between Degree ITO and BIA score. The industries ‘industry all’ and ‘housing corporation’
showed a non significant positive correlation between Degree ITO and BIA score.
The following findings were made:
Finding 45: Industry is a relevant contingency factor. There are differences in average BIA score and
Degree ITO between industries.
Contingency factors
Case research
Informalpervasive
Optimized processes
Improved, managed
processes
Esthablished,focuses
processes
Committedprocesses
Initial or ad hoc
processes
Bonding, uni�ed
Cost e�ective
Some partner-value;
Dashboard managed
Some cost
e�ectiveness; Dashboard
established
IT enables/drives business strategy
IT seen as an asset; Process driver;Con�ict seen as creative
Shared risk & rewards
Emerging value service provider;Balanced tech & business hiring
Relevant process
across the organization
Relevant process
across the organization
Good understanding;
Emerging relaxed
Limited business / IT understanding,
Business / IT lack understanding,
Functional cost e�ciency
Some technical measurements
No formal process,cost center, reactive
priorities
Con�ict; IT a cost of doing
business
Traditional (e.g., acctng, email)
IT takes risk, little reward;
Technical training
Tactical at Functional
level,occasional
responsive
IT emerging as an asset;
Process enabler
Transaction (e.g., ESS, DSS)
Di�ers across functional organizations
Integrated with partners
Integrated across the organization
Extende to external
partners
Integrated across the
org. & partners
Evolve with partners
IT-bunisness co-adaptive
Improvisation-al
Education/careers/rewards across the organization
Communication
ValueGovernance Partnership Scope &
architectureSkills
Busin
ess &
ITal
ignm
ent
mat
urityIT outsourcing
characteristics in�uence
Busin
ess &
ITal
ignm
ent
mat
urity
1.57
Degree ofITO
Deg
ree
ITO
Industry

2092 Result case research
Finding 46: Within the measured industries (‘construction all’, ‘financial services’, ‘government /not
for profit’ and ‘housing corporation’) there is no significant correlation between BIA
score and Degree ITO.
2.6.2 Correlations organisational factor – size of organisationThe influence of the contingency factor size of organisation (number
of employees) was calculated. For the researched cases, the size of or-
ganisation and their BIA score are displayed in figure 7.
Legend: size of organisation:1. 0-50 employees2. 51-100 employees3. 101-250 employees4. 251-500 employees5. 501-1000 employees6. 1001-5000 employees7. 5001-10.000 employees8. Above 10.000 employees
Figure 7. BIA score and number of employees (n=28).
The following finding was made:
Finding 47: There is no significant correlation between BIA score and size of organisation
(r = 0.29, p = 0.129, 2 tailed, n = 28).
2.6.3 Correlations organisational factor – geographical areaThe influence of the contingency factor geographical area was calcu-
lated using Spearman’s rho (lowest measuring variable (geographical
area) is ordinal) correlated to BIA score and Degree ITO. The result is
displayed in table19.
Contingency factors
Case research
Informalpervasive
Optimized processes
Improved, managed
processes
Esthablished,focuses
processes
Committedprocesses
Initial or ad hoc
processes
Bonding, uni�ed
Cost e�ective
Some partner-value;
Dashboard managed
Some cost
e�ectiveness; Dashboard
established
IT enables/drives business strategy
IT seen as an asset; Process driver;Con�ict seen as creative
Shared risk & rewards
Emerging value service provider;Balanced tech & business hiring
Relevant process
across the organization
Relevant process
across the organization
Good understanding;
Emerging relaxed
Limited business / IT understanding,
Business / IT lack understanding,
Functional cost e�ciency
Some technical measurements
No formal process,cost center, reactive
priorities
Con�ict; IT a cost of doing
business
Traditional (e.g., acctng, email)
IT takes risk, little reward;
Technical training
Tactical at Functional
level,occasional
responsive
IT emerging as an asset;
Process enabler
Transaction (e.g., ESS, DSS)
Di�ers across functional organizations
Integrated with partners
Integrated across the organization
Extende to external
partners
Integrated across the
org. & partners
Evolve with partners
IT-bunisness co-adaptive
Improvisation-al
Education/careers/rewards across the organization
Communication
ValueGovernance Partnership Scope &
architectureSkills
Busin
ess &
ITal
ignm
ent
mat
urityIT outsourcing
characteristics in�uence
Busin
ess &
ITal
ignm
ent
mat
urity
1.57
Degree ofITO
Deg
ree
ITO
Size of organisation
Contingency factors
Case research
Informalpervasive
Optimized processes
Improved, managed
processes
Esthablished,focuses
processes
Committedprocesses
Initial or ad hoc
processes
Bonding, uni�ed
Cost e�ective
Some partner-value;
Dashboard managed
Some cost
e�ectiveness; Dashboard
established
IT enables/drives business strategy
IT seen as an asset; Process driver;Con�ict seen as creative
Shared risk & rewards
Emerging value service provider;Balanced tech & business hiring
Relevant process
across the organization
Relevant process
across the organization
Good understanding;
Emerging relaxed
Limited business / IT understanding,
Business / IT lack understanding,
Functional cost e�ciency
Some technical measurements
No formal process,cost center, reactive
priorities
Con�ict; IT a cost of doing
business
Traditional (e.g., acctng, email)
IT takes risk, little reward;
Technical training
Tactical at Functional
level,occasional
responsive
IT emerging as an asset;
Process enabler
Transaction (e.g., ESS, DSS)
Di�ers across functional organizations
Integrated with partners
Integrated across the organization
Extende to external
partners
Integrated across the
org. & partners
Evolve with partners
IT-bunisness co-adaptive
Improvisation-al
Education/careers/rewards across the organization
Communication
ValueGovernance Partnership Scope &
architectureSkills
Busin
ess &
ITal
ignm
ent
mat
urityIT outsourcing
characteristics in�uence
Busin
ess &
ITal
ignm
ent
mat
urity
1.57
Degree ofITO
Deg
ree
ITO
Geographicalarea
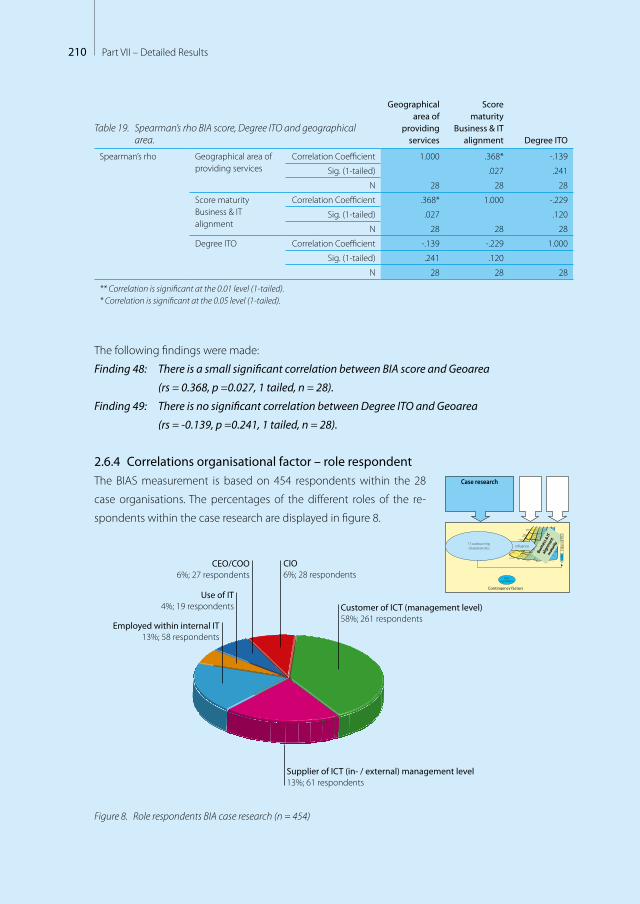
210 Part VII – Detailed Results
Table 19. Spearman’s rho BIA score, Degree ITO and geographical area.
Geographical area of
providing services
Score maturity
Business & IT alignment Degree ITO
Spearman’s rho Geographical area of providing services
Correlation Coefficient 1.000 .368* -.139
Sig. (1-tailed) .027 .241
N 28 28 28
Score maturity Business & IT alignment
Correlation Coefficient .368* 1.000 -.229
Sig. (1-tailed) .027 .120
N 28 28 28
Degree ITO Correlation Coefficient -.139 -.229 1.000
Sig. (1-tailed) .241 .120
N 28 28 28
** Correlation is significant at the 0.01 level (1-tailed).* Correlation is significant at the 0.05 level (1-tailed).
The following findings were made:
Finding 48: There is a small significant correlation between BIA score and Geoarea
(rs = 0.368, p =0.027, 1 tailed, n = 28).
Finding 49: There is no significant correlation between Degree ITO and Geoarea
(rs = -0.139, p =0.241, 1 tailed, n = 28).
2.6.4 Correlations organisational factor – role respondentThe BIAS measurement is based on 454 respondents within the 28
case organisations. The percentages of the different roles of the re-
spondents within the case research are displayed in figure 8.
CIO6%; 28 respondents
Customer of ICT (management level)58%; 261 respondents
Supplier of ICT (in- / external) management level13%; 61 respondents
CEO/COO6%; 27 respondents
Use of IT4%; 19 respondents
Employed within internal IT13%; 58 respondents
Figure 8. Role respondents BIA case research (n = 454)
Contingency factors
Case research
Informalpervasive
Optimized processes
Improved, managed
processes
Esthablished,focuses
processes
Committedprocesses
Initial or ad hoc
processes
Bonding, uni�ed
Cost e�ective
Some partner-value;
Dashboard managed
Some cost
e�ectiveness; Dashboard
established
IT enables/drives business strategy
IT seen as an asset; Process driver;Con�ict seen as creative
Shared risk & rewards
Emerging value service provider;Balanced tech & business hiring
Relevant process
across the organization
Relevant process
across the organization
Good understanding;
Emerging relaxed
Limited business / IT understanding,
Business / IT lack understanding,
Functional cost e�ciency
Some technical measurements
No formal process,cost center, reactive
priorities
Con�ict; IT a cost of doing
business
Traditional (e.g., acctng, email)
IT takes risk, little reward;
Technical training
Tactical at Functional
level,occasional
responsive
IT emerging as an asset;
Process enabler
Transaction (e.g., ESS, DSS)
Di�ers across functional organizations
Integrated with partners
Integrated across the organization
Extende to external
partners
Integrated across the
org. & partners
Evolve with partners
IT-bunisness co-adaptive
Improvisation-al
Education/careers/rewards across the organization
Communication
ValueGovernance Partnership Scope &
architectureSkills
Busin
ess &
ITal
ignm
ent
mat
urityIT outsourcing
characteristics in�uence
Busin
ess &
ITal
ignm
ent
mat
urity
1.57
Degree ofITO
Deg
ree
ITO
Rolerespondent

2112 Result case research
Based on the role of the respondents (figure 8) the BIA score and Degree ITO were compared per role.
First, the BIA score and Degree ITO for the role of CEO/COO were tested using Pearson’s correlations
[Baarda, 2011]. The result is displayed in figure 9.
Figure 9. Overview role CEO/COO for BIA score vs. Degree ITO
The following finding was made:
Finding 50: There is no significant negative correlation between BIA score and Degree ITO from role
perspective CEO/COO or equivalent (r = -0.11, p = 0.3076, 1 tailed, n = 27).
For the other roles the same correlation testing was performed, the findings were:
Finding 51: There is no significant correlation between BIA score and Degree ITO from role
perspective CIO or equivalent (r = 0.21, p = 0.1471, 1 tailed, n = 28).
Finding 52: There is no significant (negative) correlation between BIA score and Degree ITO from
role perspective business management (r = -0.007, p = 0.4563, 1 tailed, n = 261).
Finding 53: There is no significant (negative) correlation between BIA score and Degree ITO from
role perspective IT management (r = -0.12, p = 0.1877, 1 tailed, n = 61).
Finding 54: There is a significant (negative) correlation between BIA score and Degree ITO from role
perspective IT employees (r = -0.23, p = 0.044, 1 tailed, n =58).
The result of finding 54 is displayed in table 20.
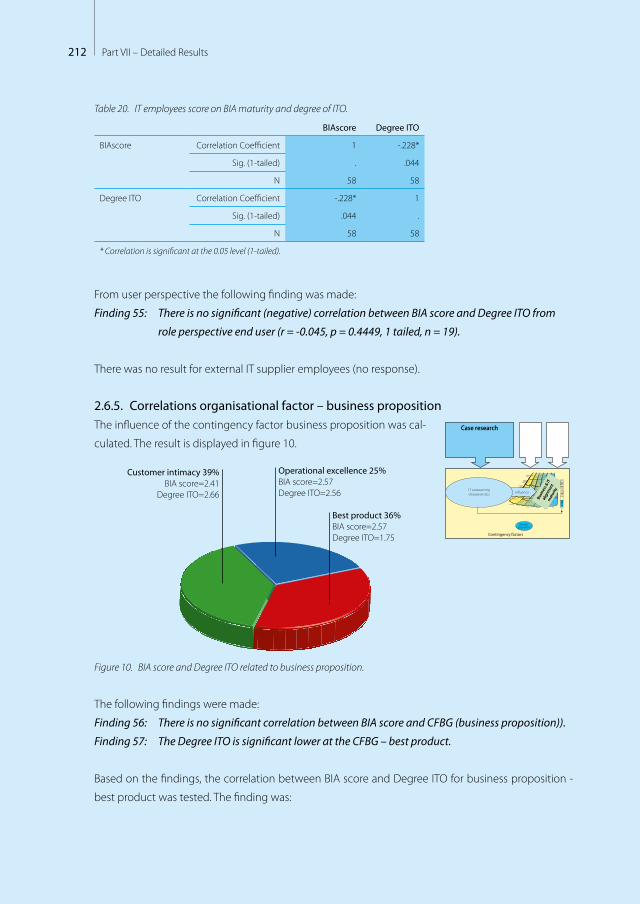
212 Part VII – Detailed Results
Table 20. IT employees score on BIA maturity and degree of ITO.
BIAscore Degree ITO
BIAscore Correlation Coefficient 1 -.228*
Sig. (1-tailed) . .044
N 58 58
Degree ITO Correlation Coefficient -.228* 1
Sig. (1-tailed) .044 .
N 58 58
* Correlation is significant at the 0.05 level (1-tailed).
From user perspective the following finding was made:
Finding 55: There is no significant (negative) correlation between BIA score and Degree ITO from
role perspective end user (r = -0.045, p = 0.4449, 1 tailed, n = 19).
There was no result for external IT supplier employees (no response).
2.6.5. Correlations organisational factor – business propositionThe influence of the contingency factor business proposition was cal-
culated. The result is displayed in figure 10.
Operational excellence 25%BIA score=2.57Degree ITO=2.56
Best product 36%BIA score=2.57Degree ITO=1.75
Customer intimacy 39%BIA score=2.41
Degree ITO=2.66
Figure 10. BIA score and Degree ITO related to business proposition.
The following findings were made:
Finding 56: There is no significant correlation between BIA score and CFBG (business proposition)).
Finding 57: The Degree ITO is significant lower at the CFBG – best product.
Based on the findings, the correlation between BIA score and Degree ITO for business proposition -
best product was tested. The finding was:
Contingency factors
Case research
Informalpervasive
Optimized processes
Improved, managed
processes
Esthablished,focuses
processes
Committedprocesses
Initial or ad hoc
processes
Bonding, uni�ed
Cost e�ective
Some partner-value;
Dashboard managed
Some cost
e�ectiveness; Dashboard
established
IT enables/drives business strategy
IT seen as an asset; Process driver;Con�ict seen as creative
Shared risk & rewards
Emerging value service provider;Balanced tech & business hiring
Relevant process
across the organization
Relevant process
across the organization
Good understanding;
Emerging relaxed
Limited business / IT understanding,
Business / IT lack understanding,
Functional cost e�ciency
Some technical measurements
No formal process,cost center, reactive
priorities
Con�ict; IT a cost of doing
business
Traditional (e.g., acctng, email)
IT takes risk, little reward;
Technical training
Tactical at Functional
level,occasional
responsive
IT emerging as an asset;
Process enabler
Transaction (e.g., ESS, DSS)
Di�ers across functional organizations
Integrated with partners
Integrated across the organization
Extende to external
partners
Integrated across the
org. & partners
Evolve with partners
IT-bunisness co-adaptive
Improvisation-al
Education/careers/rewards across the organization
Communication
ValueGovernance Partnership Scope &
architectureSkills
Busin
ess &
ITal
ignm
ent
mat
urityIT outsourcing
characteristics in�uence
Busin
ess &
ITal
ignm
ent
mat
urity
1.57
Degree ofITO
Deg
ree
ITO
Businessproposition
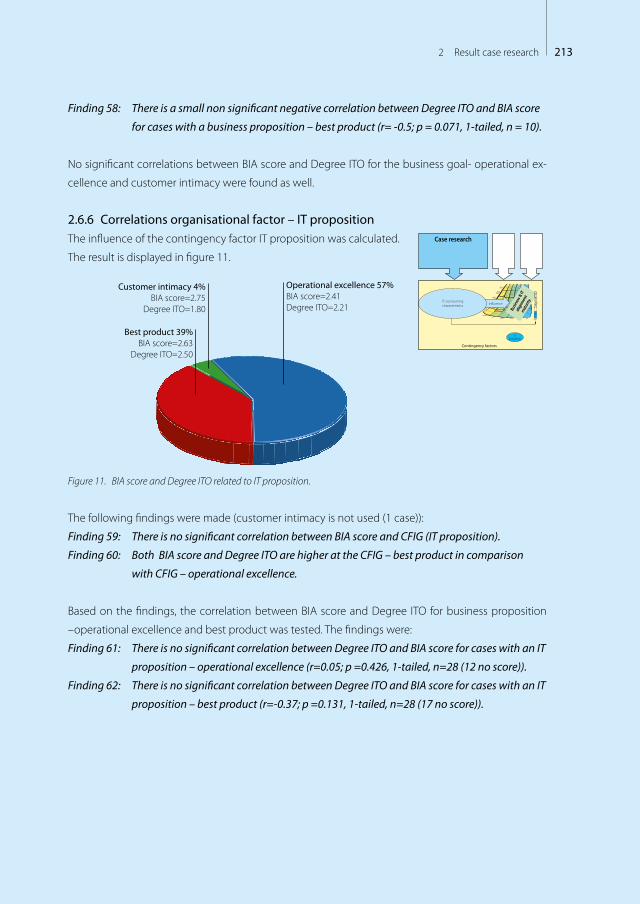
2132 Result case research
Finding 58: There is a small non significant negative correlation between Degree ITO and BIA score
for cases with a business proposition – best product (r= -0.5; p = 0.071, 1-tailed, n = 10).
No significant correlations between BIA score and Degree ITO for the business goal- operational ex-
cellence and customer intimacy were found as well.
2.6.6 Correlations organisational factor – IT propositionThe influence of the contingency factor IT proposition was calculated.
The result is displayed in figure 11.
Operational excellence 57%BIA score=2.41Degree ITO=2.21
Customer intimacy 4%BIA score=2.75
Degree ITO=1.80
Best product 39%BIA score=2.63
Degree ITO=2.50
Figure 11. BIA score and Degree ITO related to IT proposition.
The following findings were made (customer intimacy is not used (1 case)):
Finding 59: There is no significant correlation between BIA score and CFIG (IT proposition).
Finding 60: Both BIA score and Degree ITO are higher at the CFIG – best product in comparison
with CFIG – operational excellence.
Based on the findings, the correlation between BIA score and Degree ITO for business proposition
–operational excellence and best product was tested. The findings were:
Finding 61: There is no significant correlation between Degree ITO and BIA score for cases with an IT
proposition – operational excellence (r=0.05; p =0.426, 1-tailed, n=28 (12 no score)).
Finding 62: There is no significant correlation between Degree ITO and BIA score for cases with an IT
proposition – best product (r=-0.37; p =0.131, 1-tailed, n=28 (17 no score)).
Contingency factors
Case research
Informalpervasive
Optimized processes
Improved, managed
processes
Esthablished,focuses
processes
Committedprocesses
Initial or ad hoc
processes
Bonding, uni�ed
Cost e�ective
Some partner-value;
Dashboard managed
Some cost
e�ectiveness; Dashboard
established
IT enables/drives business strategy
IT seen as an asset; Process driver;Con�ict seen as creative
Shared risk & rewards
Emerging value service provider;Balanced tech & business hiring
Relevant process
across the organization
Relevant process
across the organization
Good understanding;
Emerging relaxed
Limited business / IT understanding,
Business / IT lack understanding,
Functional cost e�ciency
Some technical measurements
No formal process,cost center, reactive
priorities
Con�ict; IT a cost of doing
business
Traditional (e.g., acctng, email)
IT takes risk, little reward;
Technical training
Tactical at Functional
level,occasional
responsive
IT emerging as an asset;
Process enabler
Transaction (e.g., ESS, DSS)
Di�ers across functional organizations
Integrated with partners
Integrated across the organization
Extende to external
partners
Integrated across the
org. & partners
Evolve with partners
IT-bunisness co-adaptive
Improvisation-al
Education/careers/rewards across the organization
Communication
ValueGovernance Partnership Scope &
architectureSkills
Busin
ess &
ITal
ignm
ent
mat
urityIT outsourcing
characteristics in�uence
Busin
ess &
ITal
ignm
ent
mat
urity
1.57
Degree ofITO
Deg
ree
ITO
IT proposition
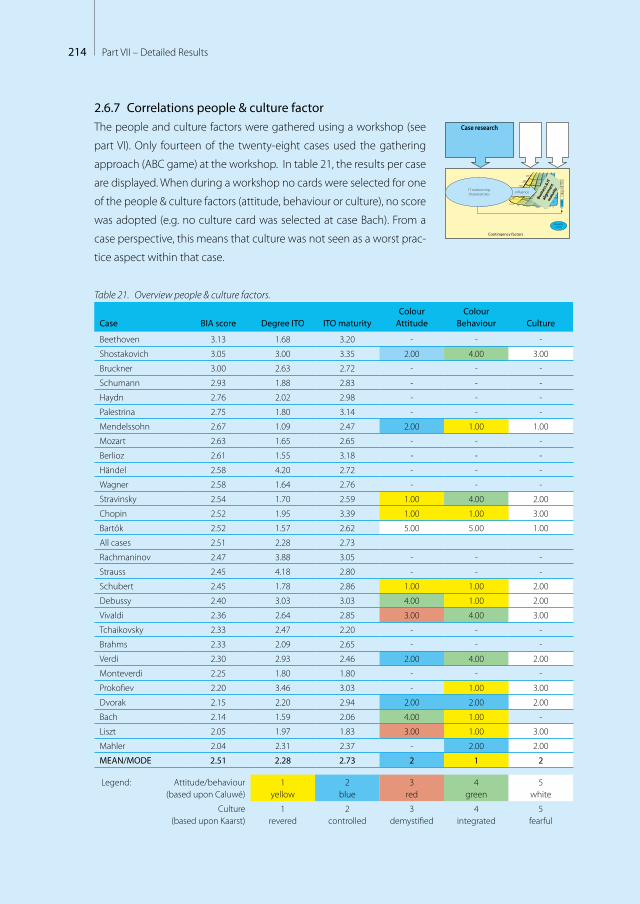
214 Part VII – Detailed Results
2.6.7 Correlations people & culture factorThe people and culture factors were gathered using a workshop (see
part VI). Only fourteen of the twenty-eight cases used the gathering
approach (ABC game) at the workshop. In table 21, the results per case
are displayed. When during a workshop no cards were selected for one
of the people & culture factors (attitude, behaviour or culture), no score
was adopted (e.g. no culture card was selected at case Bach). From a
case perspective, this means that culture was not seen as a worst prac-
tice aspect within that case.
Table 21. Overview people & culture factors.
Case BIA score Degree ITO ITO maturityColour
AttitudeColour
Behaviour Culture
Beethoven 3.13 1.68 3.20 - - -
Shostakovich 3.05 3.00 3.35 2.00 4.00 3.00
Bruckner 3.00 2.63 2.72 - - -
Schumann 2.93 1.88 2.83 - - -
Haydn 2.76 2.02 2.98 - - -
Palestrina 2.75 1.80 3.14 - - -
Mendelssohn 2.67 1.09 2.47 2.00 1.00 1.00
Mozart 2.63 1.65 2.65 - - -
Berlioz 2.61 1.55 3.18 - - -
Händel 2.58 4.20 2.72 - - -
Wagner 2.58 1.64 2.76 - - -
Stravinsky 2.54 1.70 2.59 1.00 4.00 2.00
Chopin 2.52 1.95 3.39 1.00 1.00 3.00
Bartók 2.52 1.57 2.62 5.00 5.00 1.00
All cases 2.51 2.28 2.73
Rachmaninov 2.47 3.88 3.05 - - -
Strauss 2.45 4.18 2.80 - - -
Schubert 2.45 1.78 2.86 1.00 1.00 2.00
Debussy 2.40 3.03 3.03 4.00 1.00 2.00
Vivaldi 2.36 2.64 2.85 3.00 4.00 3.00
Tchaikovsky 2.33 2.47 2.20 - - -
Brahms 2.33 2.09 2.65 - - -
Verdi 2.30 2.93 2.46 2.00 4.00 2.00
Monteverdi 2.25 1.80 1.80 - - -
Prokofiev 2.20 3.46 3.03 - 1.00 3.00
Dvorak 2.15 2.20 2.94 2.00 2.00 2.00
Bach 2.14 1.59 2.06 4.00 1.00 -
Liszt 2.05 1.97 1.83 3.00 1.00 3.00
Mahler 2.04 2.31 2.37 - 2.00 2.00
MEAN/MODE 2.51 2.28 2.73 2 1 2
Legend: Attitude/behaviour (based upon Caluwé)
1 yellow
2 blue
3 red
4 green
5 white
Culture (based upon Kaarst)
1 revered
2 controlled
3 demystified
4 integrated
5 fearful
Contingency factors
Case research
Informalpervasive
Optimized processes
Improved, managed
processes
Esthablished,focuses
processes
Committedprocesses
Initial or ad hoc
processes
Bonding, uni�ed
Cost e�ective
Some partner-value;
Dashboard managed
Some cost
e�ectiveness; Dashboard
established
IT enables/drives business strategy
IT seen as an asset; Process driver;Con�ict seen as creative
Shared risk & rewards
Emerging value service provider;Balanced tech & business hiring
Relevant process
across the organization
Relevant process
across the organization
Good understanding;
Emerging relaxed
Limited business / IT understanding,
Business / IT lack understanding,
Functional cost e�ciency
Some technical measurements
No formal process,cost center, reactive
priorities
Con�ict; IT a cost of doing
business
Traditional (e.g., acctng, email)
IT takes risk, little reward;
Technical training
Tactical at Functional
level,occasional
responsive
IT emerging as an asset;
Process enabler
Transaction (e.g., ESS, DSS)
Di�ers across functional organizations
Integrated with partners
Integrated across the organization
Extende to external
partners
Integrated across the
org. & partners
Evolve with partners
IT-bunisness co-adaptive
Improvisation-al
Education/careers/rewards across the organization
Communication
ValueGovernance Partnership Scope &
architectureSkills
Busin
ess &
ITal
ignm
ent
mat
urityIT outsourcing
characteristics in�uence
Busin
ess &
ITal
ignm
ent
mat
urity
1.57
Degree ofITO
Deg
ree
ITO
People &culture
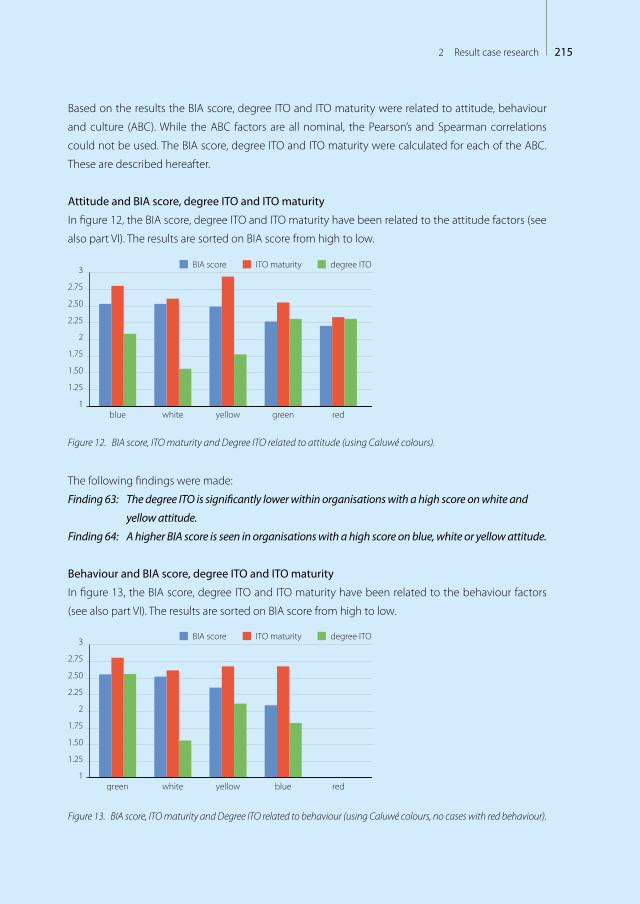
2152 Result case research
Based on the results the BIA score, degree ITO and ITO maturity were related to attitude, behaviour
and culture (ABC). While the ABC factors are all nominal, the Pearson’s and Spearman correlations
could not be used. The BIA score, degree ITO and ITO maturity were calculated for each of the ABC.
These are described hereafter.
Attitude and BIA score, degree ITO and ITO maturity
In figure 12, the BIA score, degree ITO and ITO maturity have been related to the attitude factors (see
also part VI). The results are sorted on BIA score from high to low.
1
1.25
1.50
1.75
2
2.25
2.50
2.75
blue white yellow green red
3 BIA score ITO maturity degree ITO
Figure 12. BIA score, ITO maturity and Degree ITO related to attitude (using Caluwé colours).
The following findings were made:
Finding 63: The degree ITO is significantly lower within organisations with a high score on white and
yellow attitude.
Finding 64: A higher BIA score is seen in organisations with a high score on blue, white or yellow attitude.
Behaviour and BIA score, degree ITO and ITO maturity
In figure 13, the BIA score, degree ITO and ITO maturity have been related to the behaviour factors
(see also part VI). The results are sorted on BIA score from high to low.
1
1.25
1.50
1.75
2
2.25
2.50
2.75
green white yellow blue red
3 BIA score ITO maturity degree ITO
Figure 13. BIA score, ITO maturity and Degree ITO related to behaviour (using Caluwé colours, no cases with red behaviour).
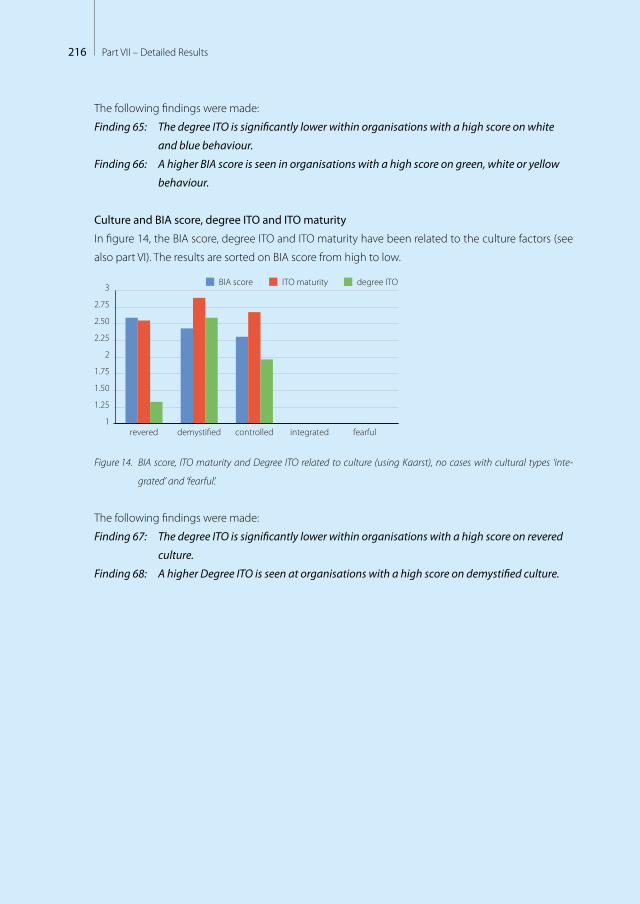
216 Part VII – Detailed Results
The following findings were made:
Finding 65: The degree ITO is significantly lower within organisations with a high score on white
and blue behaviour.
Finding 66: A higher BIA score is seen in organisations with a high score on green, white or yellow
behaviour.
Culture and BIA score, degree ITO and ITO maturity
In figure 14, the BIA score, degree ITO and ITO maturity have been related to the culture factors (see
also part VI). The results are sorted on BIA score from high to low.
1
1.25
1.50
1.75
2
2.25
2.50
2.75
revered demysti�ed controlled integrated fearful
3 BIA score ITO maturity degree ITO
Figure 14. BIA score, ITO maturity and Degree ITO related to culture (using Kaarst), no cases with cultural types ‘inte-
grated’ and ‘fearful’.
The following findings were made:
Finding 67: The degree ITO is significantly lower within organisations with a high score on revered
culture.
Finding 68: A higher Degree ITO is seen at organisations with a high score on demystified culture.
2173 Result survey research
“Stick to yourself” Best advice received from Marnix ten Kortenaar
(Old professional ice-skating champion). Source Intermediair
Result survey researchIn this chapter the results regarding the survey research are described.
In total 211 organisations were adopted (including case organisa-
tions) represented by 724 respondents.
Here also the survey research results excluding the case research re-
sults are discussed. These results represent 183 organisations repre-
sented by 270 respondents.
In addition, this chapter discusses the actual survey research results
for BIA components and ITO characteristics. Within this chapter the following structure is used:
1. What is the influence of the components identified for BIA?
2. What is the value of the ITO characteristics?
3. What is the BIAS maturity?
4. What is the ITO influence on BIA?
5. What is the value of the contingency factors?
Together with the case research (chapter 2) and short survey research (chapter 4) the survey results
are the baseline for part VIII in this dissertation (consolidated results &analysis).
3.1 Introducing statistics survey researchBefore describing the results of the survey research with regard to the research questions described
in the introduction of chapter three, the general statistics of the survey are discussed. The discussed
items are: responses, industry statistics, number of employees and the role of the respondent. This is
done for both all results and the results excluding the cases (chapter 2).
Surveyresearch
3

218 Part VII – Detailed Results
3.1.1 ResponsesAn overview of the response is provided in table 22:
Table 22. Overview response gathered (survey & case research).
resp
onse
Invi
ted
(via
BIT
TI.
nl o
r oth
er)
Star
ted
the
surv
ey
Fini
shed
the
surv
ey
Aft
er c
lean
ing
(SPS
S ac
tions
)
Of w
hich
with
in
case
rese
arch
Of w
hich
with
in
surv
ey re
sear
ch
Number or responses 10.247 1281 853 724 454 270
Percentage 100% 12.50% 8.32% 7.07% 4.43% 2.63%
Number of organisations No count No count 237 211 28 183
The 270 respondents represent 183 organisations. Thirty organisations in the survey research had
multiple respondents (2 or more). For organisations with multiple responses, the BIA was calculated
similar to the case study using the business and IT perspective (see part V). For single respondent
organisations the BIA was calculated without having insight from business or IT perspective. For the
ITO characteristics, the mean was calculated and used.
3.1.2 Industry statisticsWithin the survey research, seventeen industries were identified (figure
15) and afterwards recoded into six categories (respondents) (see part VI
(figure 21)). Automation / system integration43; 6% (respondents)
Construction63; 9%
Central government57; 8%
Chemical / farma5; 1%
Financial services (insurance / banking); 114; 16%
Health care11; 2%
Retail16; 2%
Industry / oil / gas11; 2%
Local government68; 9%
Other17; 2%
Public housing164; 23%
professional services (e.g. employment);
9; 1%
Media / entertainment6; 1%
Energy / water / telecom54; 7%
Education52; 7%
Transport / logistics13; 2%
Professional services (eg. consultancy / lawyer)
21; 3%
Figure 15. All industries (industry, number, percentage) in research (case & survey research, n=724 respondents1)
1 from this point forward n = the actual valid response is used, the missed valid response is mentioned if applicable.
Industry
Surveyresearch
Contingency factors
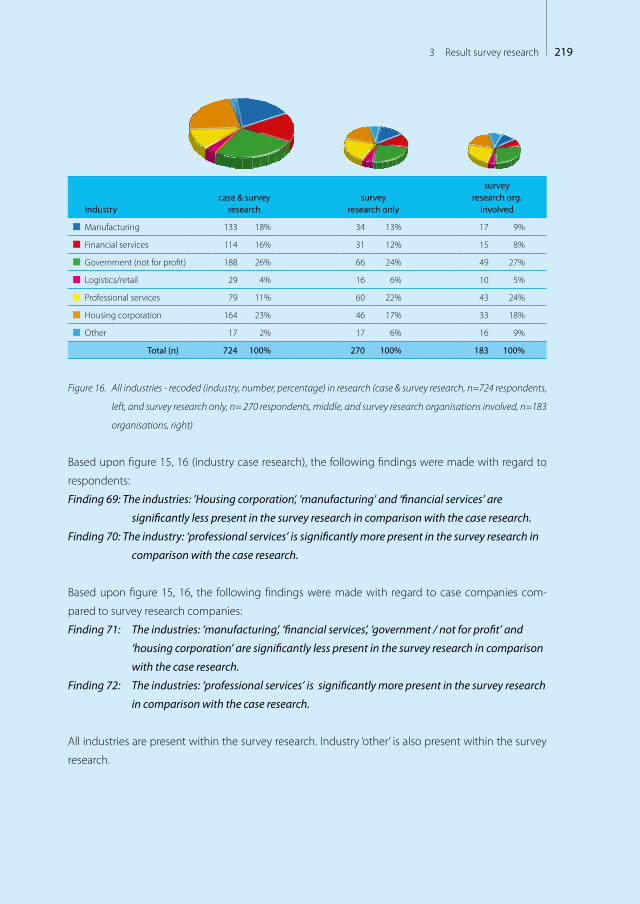
2193 Result survey research
Industrycase & survey
researchsurvey
research only
survey research org.
involved
Manufacturing 133 18% 34 13% 17 9%
Financial services 114 16% 31 12% 15 8%
Government (not for profit) 188 26% 66 24% 49 27%
Logistics/retail 29 4% 16 6% 10 5%
Professional services 79 11% 60 22% 43 24%
Housing corporation 164 23% 46 17% 33 18%
Other 17 2% 17 6% 16 9%
Total (n) 724 100% 270 100% 183 100%
Figure 16. All industries - recoded (industry, number, percentage) in research (case & survey research, n=724 respondents,
left, and survey research only, n= 270 respondents, middle, and survey research organisations involved, n=183
organisations, right)
Based upon figure 15, 16 (industry case research), the following findings were made with regard to
respondents:
Finding 69: The industries: ’Housing corporation’, ‘manufacturing’ and ‘financial services’ are
significantly less present in the survey research in comparison with the case research.
Finding 70: The industry: ‘professional services’ is significantly more present in the survey research in
comparison with the case research.
Based upon figure 15, 16, the following findings were made with regard to case companies com-
pared to survey research companies:
Finding 71: The industries: ‘manufacturing’, ‘financial services’, ‘government / not for profit’ and
‘housing corporation’ are significantly less present in the survey research in comparison
with the case research.
Finding 72: The industries: ‘professional services’ is significantly more present in the survey research
in comparison with the case research.
All industries are present within the survey research. Industry ‘other’ is also present within the survey
research.

220 Part VII – Detailed Results
3.1.3 Number of employees statisticsWithin the survey research eight categories of number of employees
were identified (figure 17). No recode was used (see part VI, paragraph
1.1.2).
Number of employees
Case & survey
research
Survey research
onlyCompanies in
survey research
0 - 50 25 4% 25 9% 21 11%
50 - 100 37 5% 22 8% 16 9%
100 - 250 73 10% 34 12% 27 15%
250 - 500 109 15% 25 9% 20 11%
500 - 1000 80 11% 21 8% 14 8%
1000 - 5000 234 32% 72 27% 47 26%
5000 - 10,000 25 3% 18 7% 8 4%
> 10,000 141 20% 53 20% 30 16%
Total (n) 724 100% 270 100% 183 100%
Figure 17. Number of employees at company (number employees, number responses , percentage) in research (case &
survey research, n = 724 respondents, left and survey research only, n = 270 respondents middle, companies in
survey research, n = 183 right)
Based upon figure 17 and figure 7 (case research), the following findings were made:
Finding 73: The number of Employee’s categories: ’1000-5000 employees’ and ‘250-500 employees’
are significantly less present in the survey research in comparison with the case
research.
Finding 74: The number of employees categories: ‘0-50 employees’ ’50-100 employees’ and ‘100-250
employees’ are significantly more present in the survey research in comparison with the
case research.
Surveyresearch
Size of organisation
Contingency factors

2213 Result survey research
3.1.4 Role respondents statisticsWithin the survey research, seven roles of respondents were identified
(figure 18).
Role respondents
Case & survey
research
Survey research
only
CEO/COO 43 6% 16 6%
CIO 61 8% 33 12%
Customer of ICT 311 43% 50 18%
Supplier of ICT 122 17% 61 23%
Employment within internal IT department 128 18% 70 26%
Employed at external IT supplier 11 1% 11 4%
User of IT 48 7% 29 11%
Total (n) 724 100% 270 100%
Figure 18. Role respondents - (role, number of respondents, percentage) in research
(case & survey research, n=724, left and survey research only, n = 270 right)
Based upon figure 18 and figure 8 (case research), the following findings were made:
Finding 75: The representation of the role: ’customer of ICT’ is significantly less present in the survey
research in comparison with the case research.
Finding 76: The representation of roles: ‘CIO’ ’supplier of ICT’, ‘employed within internal IT depart-
ment’ , ‘employed at external IT department’ and ‘user of IT’ are significantly more
present in the survey research in comparison with the case research.
Surveyresearch
Contingency factors
Rolerespondent
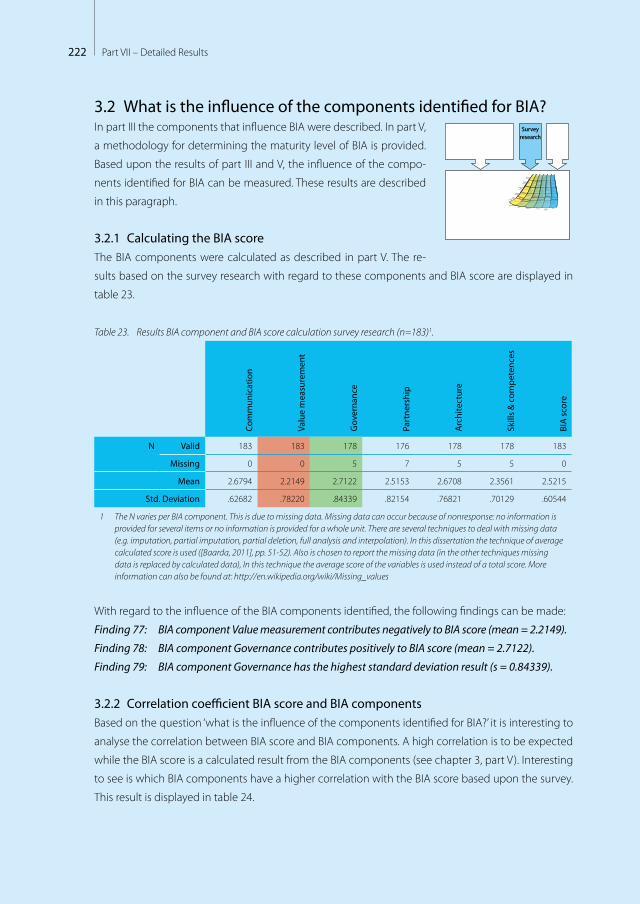
222 Part VII – Detailed Results
3.2 What is the influence of the components identified for BIA?In part III the components that influence BIA were described. In part V,
a methodology for determining the maturity level of BIA is provided.
Based upon the results of part III and V, the influence of the compo-
nents identified for BIA can be measured. These results are described
in this paragraph.
3.2.1 Calculating the BIA scoreThe BIA components were calculated as described in part V. The re-
sults based on the survey research with regard to these components and BIA score are displayed in
table 23.
Table 23. Results BIA component and BIA score calculation survey research (n=183)1.
Com
mun
icat
ion
Valu
e m
easu
rem
ent
Gov
erna
nce
Part
ners
hip
Arc
hite
ctur
e
Skill
s &
com
pete
nces
BIA
sco
re
N
Valid 183 183 178 176 178 178 183
Missing 0 0 5 7 5 5 0
Mean 2.6794 2.2149 2.7122 2.5153 2.6708 2.3561 2.5215
Std. Deviation .62682 .78220 .84339 .82154 .76821 .70129 .60544
1 The N varies per BIA component. This is due to missing data. Missing data can occur because of nonresponse: no information is provided for several items or no information is provided for a whole unit. There are several techniques to deal with missing data (e.g. imputation, partial imputation, partial deletion, full analysis and interpolation). In this dissertation the technique of average calculated score is used ([Baarda, 2011], pp. 51-52). Also is chosen to report the missing data (in the other techniques missing data is replaced by calculated data), In this technique the average score of the variables is used instead of a total score. More information can also be found at: http://en.wikipedia.org/wiki/Missing_values
With regard to the influence of the BIA components identified, the following findings can be made:
Finding 77: BIA component Value measurement contributes negatively to BIA score (mean = 2.2149).
Finding 78: BIA component Governance contributes positively to BIA score (mean = 2.7122).
Finding 79: BIA component Governance has the highest standard deviation result (s = 0.84339).
3.2.2 Correlation coefficient BIA score and BIA componentsBased on the question ‘what is the influence of the components identified for BIA?’ it is interesting to
analyse the correlation between BIA score and BIA components. A high correlation is to be expected
while the BIA score is a calculated result from the BIA components (see chapter 3, part V). Interesting
to see is which BIA components have a higher correlation with the BIA score based upon the survey.
This result is displayed in table 24.
Surveyresearch
Informalpervasive
Optimized processes
Improved, managed
processes
Esthablished,focuses
processes
Committedprocesses
Initial or ad hoc
processes
Bonding, uni�ed
Cost e�ective
Some partner-value;
Dashboard managed
Some cost
e�ectiveness; Dashboard
established
IT enables/drives business strategy
IT seen as an asset; Process driver;Con�ict seen as creative
Shared risk & rewards
Emerging value service provider;Balanced tech & business hiring
Relevant process
across the organization
Relevant process
across the organization
Good understanding;
Emerging relaxed
Limited business / IT understanding,
Business / IT lack understanding,
Functional cost e�ciency
Some technical measurements
No formal process,cost center, reactive
priorities
Con�ict; IT a cost of doing
business
Traditional (e.g., acctng, email)
IT takes risk, little reward;
Technical training
Tactical at Functional
level,occasional
responsive
IT emerging as an asset;
Process enabler
Transaction (e.g., ESS, DSS)
Di�ers across functional organizations
Integrated with partners
Integrated across the organization
Extende to external
partners
Integrated across the
org. & partners
Evolve with partners
IT-bunisness co-adaptive
Improvisation-al
Education/careers/rewards across the organization
Communication
ValueGovernance Partnership Scope &
architectureSkills
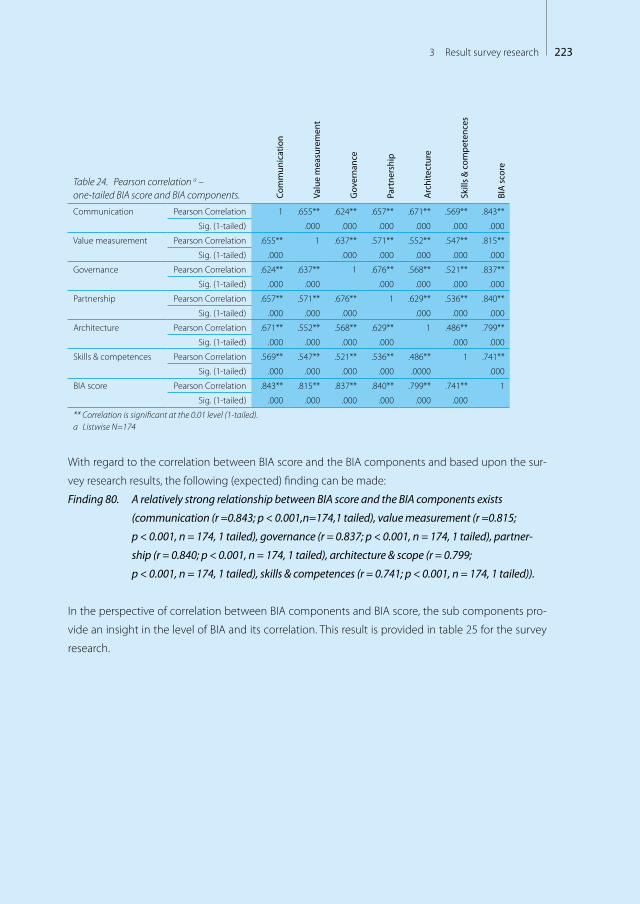
2233 Result survey research
Table 24. Pearson correlation a – one-tailed BIA score and BIA components. Co
mm
unic
atio
n
Valu
e m
easu
rem
ent
Gov
erna
nce
Part
ners
hip
Arc
hite
ctur
e
Skill
s &
com
pete
nces
BIA
sco
re
Communication Pearson Correlation 1 .655** .624** .657** .671** .569** .843**
Sig. (1-tailed) .000 .000 .000 .000 .000 .000
Value measurement Pearson Correlation .655** 1 .637** .571** .552** .547** .815**
Sig. (1-tailed) .000 .000 .000 .000 .000 .000
Governance Pearson Correlation .624** .637** 1 .676** .568** .521** .837**
Sig. (1-tailed) .000 .000 .000 .000 .000 .000
Partnership Pearson Correlation .657** .571** .676** 1 .629** .536** .840**
Sig. (1-tailed) .000 .000 .000 .000 .000 .000
Architecture Pearson Correlation .671** .552** .568** .629** 1 .486** .799**
Sig. (1-tailed) .000 .000 .000 .000 .000 .000
Skills & competences Pearson Correlation .569** .547** .521** .536** .486** 1 .741**
Sig. (1-tailed) .000 .000 .000 .000 .0000 .000
BIA score Pearson Correlation .843** .815** .837** .840** .799** .741** 1
Sig. (1-tailed) .000 .000 .000 .000 .000 .000
** Correlation is significant at the 0.01 level (1-tailed).a Listwise N=174
With regard to the correlation between BIA score and the BIA components and based upon the sur-
vey research results, the following (expected) finding can be made:
Finding 80. A relatively strong relationship between BIA score and the BIA components exists
(communication (r =0.843; p < 0.001,n=174,1 tailed), value measurement (r =0.815;
p < 0.001, n = 174, 1 tailed), governance (r = 0.837; p < 0.001, n = 174, 1 tailed), partner-
ship (r = 0.840; p < 0.001, n = 174, 1 tailed), architecture & scope (r = 0.799;
p < 0.001, n = 174, 1 tailed), skills & competences (r = 0.741; p < 0.001, n = 174, 1 tailed)).
In the perspective of correlation between BIA components and BIA score, the sub components pro-
vide an insight in the level of BIA and its correlation. This result is provided in table 25 for the survey
research.

224 Part VII – Detailed Results
Table 25. Spearman correlation – one-tailed BIA score and BIA sub components.
Spearman’s rho
Variable Description BIA score Correlation Coefficient Significance
BIA score Score maturity BIA 1.0000 Direct
PAR_2 Role of IT in strategic business planning 0.7086 **
COM_1 Understanding of business by IT 0.6847 **
PAR_1 Business perception of IT value 0.6841 **
GOV_5 Steering committee’s 0.6802 **
VAL_7 Continuous improvement 0.6728 **
VAL_6 Formal assessments / reviews 0.6651 **
SKI_3 Change readiness 0.6603 **
GOV_1 Business strategic planning 0.6422 **
COM_6 Liaison(s) effectiveness 0.6392 **
COM_2 Understanding of IT by business 0.6338 **
ARC_5 Manage emerging technology 0.6295 **
GOV_6 Prioritization process 0.6295 **
PAR_5 Relationship / trust style 0.6257 **
VAL_8 Proven contribution of IT to the business 0.6212 **
GOV_2 IT strategic planning 0.6200 **
ARC_1 Traditional / enabler / driver / external 0.6169 **
GOV_7 React / respond quickly 0.6117 **
PAR_4 IT program management 0.6093 **
VAL_2 Business metrics 0.6035 **
GOV_4 IT investment management 0.5989 **
COM_5 Knowledge sharing 0.5987 **
VAL_3 Balanced metrics 0.5974 **
ARC_3 Architectural integration 0.5968 **
SKI_2 Locus of power 0.5959 **
VAL_1 IT metrics 0.5875 **
PAR_6 Business sponsor / champion 0.5819 **
SKI_7 Hiring & retaining 0.5676 **
PAR_3 Shared goals, risks, rewards, penalties 0.5656 **
VAL_4 Service level management 0.5559 **
SKI_6 Social, political, trusting environment 0.5448 **
VAL_5 Benchmarking 0.5402 **
ARC_4 Architectural transparency, agility, flexibility 0.5150 **
SKI_4 Career crossover 0.4592 **
COM_3 Inter/intra organisational learning / education 0.4562 **
SKI_1 Innovation, entrepreneurship 0.4546 **
ARC_2 Standards articulation 0.4483 **
SKI_5 Education, training 0.4319 **
GOV_3 Budgetary control 0.3759 **
COM_4 Protocol rigidity 0.3353 **
** Correlation is significant at the 0.01 level (1-tailed).

2253 Result survey research
With regard to the correlation between BIA score and the BIA sub components and based upon the
survey research, the following (expected) findings can be made:
Finding 81: All sub components of BIA correlate strongly to BIA score (correlation is significant at the
0.01 level (1 tailed) (in table noted with **).
3.3 What is the value of the ITO characteristics?Within the survey research, a limited set of ITO characteristics was
measured. The following characteristics (see part V) were measured:
– Scope of ITO – functional;
– ITO experience – size of ITO deal;
– Type of ITO relationship.
The measured values of the ITO characteristics are described below.
3.1.1 Scope of ITO – functionalThe scope of ITO – functional is based upon the scores within technical management, end user man-
agement, application management and functional management and was calculated as described in
part V. The results within the survey research are displayed in figure 19.
Figure 19. Frequencies Scope of ITO – functional (SSFMean) (n = 168).
With regard to the frequencies of scope of ITO – functional the following finding was made:
Finding 82: The mean value of ITO-functional scope is 2.1486 with a standard deviation of 0.917.
Surveyresearch
IT outsourcingcharacteristics
Relationship
Scopefunctional
Experience

226 Part VII – Detailed Results
3.3.2 ITO experience – size of ITO dealFor the ITO characteristic – size of ITO deal, the survey research results are displayed in figure 20.
Less than 5%42; 28% (organisations)
5 - 10%28; 19%
11 - 25%33; 22%
> 50%26; 18%
25 - 50%20; 13%
Figure 20. ITO – size of ITO deal (n = 149).
With regard to the ITO characteristic – size of ITO deal, the following finding was made:
Finding 83: The mean value of ITO experience -size of ITO deal is 2.73 with a standard deviation of
1.446 (n = 149).
3.3.3 Type of ITO relationshipFor the ITO characteristic – type of ITO relationship deal the survey research results are displayed in
figurer 21.
Transaction oriented64; 40% (organisations)
Enhanced sourcing44; 28%
Partnership11; 7%
Collaborative39; 25%
Figure 21. ITO – type of ITO relationship deal (n = 158).
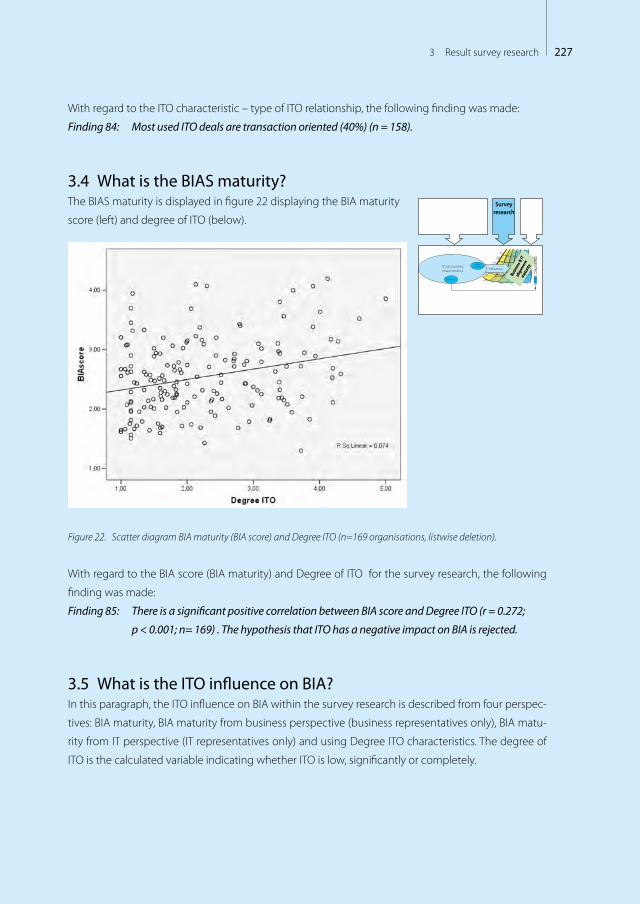
2273 Result survey research
With regard to the ITO characteristic – type of ITO relationship, the following finding was made:
Finding 84: Most used ITO deals are transaction oriented (40%) (n = 158).
3.4 What is the BIAS maturity?The BIAS maturity is displayed in figure 22 displaying the BIA maturity
score (left) and degree of ITO (below).
Figure 22. Scatter diagram BIA maturity (BIA score) and Degree ITO (n=169 organisations, listwise deletion).
With regard to the BIA score (BIA maturity) and Degree of ITO for the survey research, the following
finding was made:
Finding 85: There is a significant positive correlation between BIA score and Degree ITO (r = 0.272;
p < 0.001; n= 169) . The hypothesis that ITO has a negative impact on BIA is rejected.
3.5 What is the ITO influence on BIA?In this paragraph, the ITO influence on BIA within the survey research is described from four perspec-
tives: BIA maturity, BIA maturity from business perspective (business representatives only), BIA matu-
rity from IT perspective (IT representatives only) and using Degree ITO characteristics. The degree of
ITO is the calculated variable indicating whether ITO is low, significantly or completely.
Surveyresearch
Informalpervasive
Optimized processes
Improved, managed
processes
Esthablished,focuses
processes
Committedprocesses
Initial or ad hoc
processes
Bonding, uni�ed
Cost e�ective
Some partner-value;
Dashboard managed
Some cost
e�ectiveness; Dashboard
established
IT enables/drives business strategy
IT seen as an asset; Process driver;Con�ict seen as creative
Shared risk & rewards
Emerging value service provider;Balanced tech & business hiring
Relevant process
across the organization
Relevant process
across the organization
Good understanding;
Emerging relaxed
Limited business / IT understanding,
Business / IT lack understanding,
Functional cost e�ciency
Some technical measurements
No formal process,cost center, reactive
priorities
Con�ict; IT a cost of doing
business
Traditional (e.g., acctng, email)
IT takes risk, little reward;
Technical training
Tactical at Functional
level,occasional
responsive
IT emerging as an asset;
Process enabler
Transaction (e.g., ESS, DSS)
Di�ers across functional organizations
Integrated with partners
Integrated across the organization
Extende to external
partners
Integrated across the
org. & partners
Evolve with partners
IT-bunisness co-adaptive
Improvisation-al
Education/careers/rewards across the organization
Communication
ValueGovernance Partnership Scope &
architectureSkills
Busin
ess &
ITal
ignm
ent
mat
urityIT outsourcing
characteristics in�uenceScope
functional
Experience
Busin
ess &
ITal
ignm
ent
mat
urity
Busin
ess &
ITal
ignm
ent
mat
urity
1.57
Degree ofITO
Deg
ree
ITO
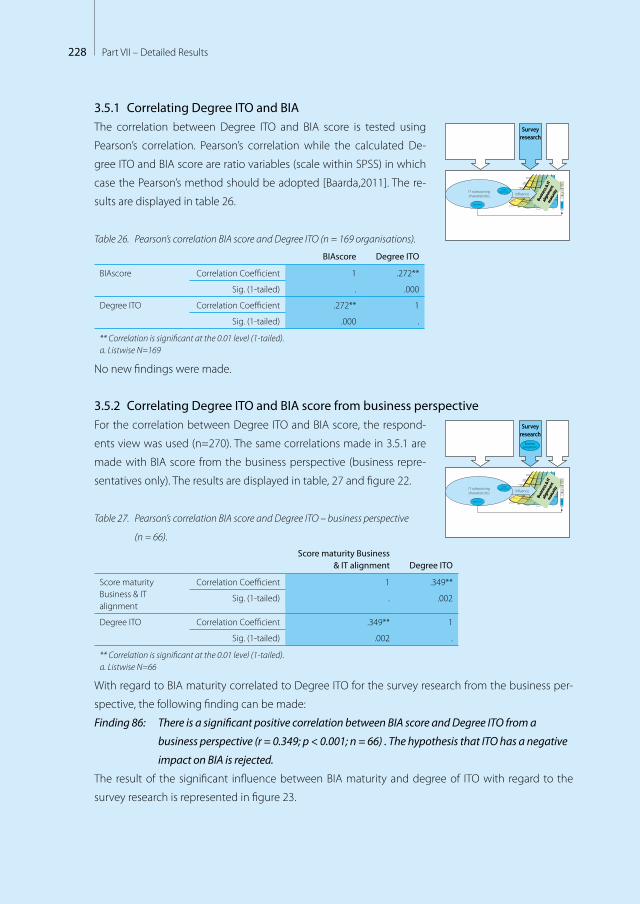
228 Part VII – Detailed Results
3.5.1 Correlating Degree ITO and BIAThe correlation between Degree ITO and BIA score is tested using
Pearson’s correlation. Pearson’s correlation while the calculated De-
gree ITO and BIA score are ratio variables (scale within SPSS) in which
case the Pearson’s method should be adopted [Baarda,2011]. The re-
sults are displayed in table 26.
Table 26. Pearson’s correlation BIA score and Degree ITO (n = 169 organisations).
BIAscore Degree ITO
BIAscore Correlation Coefficient 1 .272**
Sig. (1-tailed) . .000
Degree ITO Correlation Coefficient .272** 1
Sig. (1-tailed) .000 .
** Correlation is significant at the 0.01 level (1-tailed).a. Listwise N=169
No new findings were made.
3.5.2 Correlating Degree ITO and BIA score from business perspectiveFor the correlation between Degree ITO and BIA score, the respond-
ents view was used (n=270). The same correlations made in 3.5.1 are
made with BIA score from the business perspective (business repre-
sentatives only). The results are displayed in table, 27 and figure 22.
Table 27. Pearson’s correlation BIA score and Degree ITO – business perspective
(n = 66).
Score maturity Business & IT alignment Degree ITO
Score maturity Business & IT alignment
Correlation Coefficient 1 .349**
Sig. (1-tailed) . .002
Degree ITO Correlation Coefficient .349** 1
Sig. (1-tailed) .002 .
** Correlation is significant at the 0.01 level (1-tailed).a. Listwise N=66
With regard to BIA maturity correlated to Degree ITO for the survey research from the business per-
spective, the following finding can be made:
Finding 86: There is a significant positive correlation between BIA score and Degree ITO from a
business perspective (r = 0.349; p < 0.001; n = 66) . The hypothesis that ITO has a negative
impact on BIA is rejected.
The result of the significant influence between BIA maturity and degree of ITO with regard to the
survey research is represented in figure 23.
Surveyresearch
Informalpervasive
Optimized processes
Improved, managed
processes
Esthablished,focuses
processes
Committedprocesses
Initial or ad hoc
processes
Bonding, uni�ed
Cost e�ective
Some partner-value;
Dashboard managed
Some cost
e�ectiveness; Dashboard
established
IT enables/drives business strategy
IT seen as an asset; Process driver;Con�ict seen as creative
Shared risk & rewards
Emerging value service provider;Balanced tech & business hiring
Relevant process
across the organization
Relevant process
across the organization
Good understanding;
Emerging relaxed
Limited business / IT understanding,
Business / IT lack understanding,
Functional cost e�ciency
Some technical measurements
No formal process,cost center, reactive
priorities
Con�ict; IT a cost of doing
business
Traditional (e.g., acctng, email)
IT takes risk, little reward;
Technical training
Tactical at Functional
level,occasional
responsive
IT emerging as an asset;
Process enabler
Transaction (e.g., ESS, DSS)
Di�ers across functional organizations
Integrated with partners
Integrated across the organization
Extende to external
partners
Integrated across the
org. & partners
Evolve with partners
IT-bunisness co-adaptive
Improvisation-al
Education/careers/rewards across the organization
Communication
ValueGovernance Partnership Scope &
architectureSkills
Busin
ess &
ITal
ignm
ent
mat
urityIT outsourcing
characteristics in�uenceScope
functional
Experience
Busin
ess &
ITal
ignm
ent
mat
urity
Busin
ess &
ITal
ignm
ent
mat
urity
1.57
Degree ofITO
Deg
ree
ITO
Businessperspective
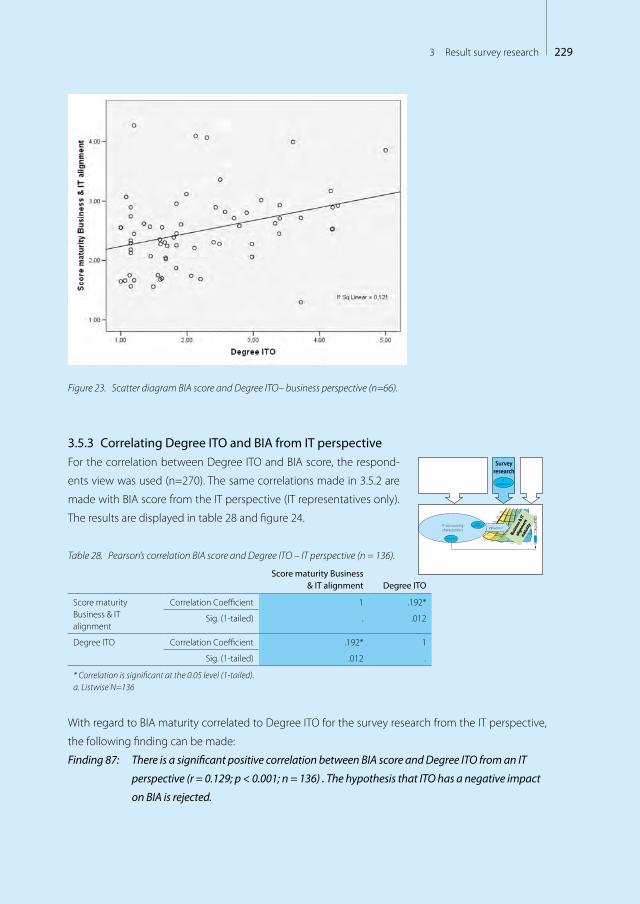
2293 Result survey research
Figure 23. Scatter diagram BIA score and Degree ITO– business perspective (n=66).
3.5.3 Correlating Degree ITO and BIA from IT perspectiveFor the correlation between Degree ITO and BIA score, the respond-
ents view was used (n=270). The same correlations made in 3.5.2 are
made with BIA score from the IT perspective (IT representatives only).
The results are displayed in table 28 and figure 24.
Table 28. Pearson’s correlation BIA score and Degree ITO – IT perspective (n = 136).
Score maturity Business & IT alignment Degree ITO
Score maturity Business & IT alignment
Correlation Coefficient 1 .192*
Sig. (1-tailed) . .012
Degree ITO Correlation Coefficient .192* 1
Sig. (1-tailed) .012 .
* Correlation is significant at the 0.05 level (1-tailed).a. Listwise N=136
With regard to BIA maturity correlated to Degree ITO for the survey research from the IT perspective,
the following finding can be made:
Finding 87: There is a significant positive correlation between BIA score and Degree ITO from an IT
perspective (r = 0.129; p < 0.001; n = 136) . The hypothesis that ITO has a negative impact
on BIA is rejected.
Surveyresearch
Informalpervasive
Optimized processes
Improved, managed
processes
Esthablished,focuses
processes
Committedprocesses
Initial or ad hoc
processes
Bonding, uni�ed
Cost e�ective
Some partner-value;
Dashboard managed
Some cost
e�ectiveness; Dashboard
established
IT enables/drives business strategy
IT seen as an asset; Process driver;Con�ict seen as creative
Shared risk & rewards
Emerging value service provider;Balanced tech & business hiring
Relevant process
across the organization
Relevant process
across the organization
Good understanding;
Emerging relaxed
Limited business / IT understanding,
Business / IT lack understanding,
Functional cost e�ciency
Some technical measurements
No formal process,cost center, reactive
priorities
Con�ict; IT a cost of doing
business
Traditional (e.g., acctng, email)
IT takes risk, little reward;
Technical training
Tactical at Functional
level,occasional
responsive
IT emerging as an asset;
Process enabler
Transaction (e.g., ESS, DSS)
Di�ers across functional organizations
Integrated with partners
Integrated across the organization
Extende to external
partners
Integrated across the
org. & partners
Evolve with partners
IT-bunisness co-adaptive
Improvisation-al
Education/careers/rewards across the organization
Communication
ValueGovernance Partnership Scope &
architectureSkills
Busin
ess &
ITal
ignm
ent
mat
urityIT outsourcing
characteristics in�uenceScope
functional
Experience
Busin
ess &
ITal
ignm
ent
mat
urity
Busin
ess &
ITal
ignm
ent
mat
urity
1.57
Degree ofITO
Deg
ree
ITO
ITperspective

230 Part VII – Detailed Results
Finding 88: The positive correlation between BIA score and Degree ITO is stronger from the business
perspective compared to the IT perspective.
The result of the significant influence between BIA maturity and degree of ITO with regard to the
survey research is showed in figure 24.
Figure 24. Scatter diagram BIA score and Degree ITO – IT perspective (n=136).
3.5.4 Correlating Degree ITO characteristics and BIA maturityIn part IV the ITO characteristics were identified, and the measure-
ment mechanism was described in part V. Possible correlations be-
tween the ITO characteristics and BIA maturity was identified. This is
described in table 29 for the survey research.
Surveyresearch
Informalpervasive
Optimized processes
Improved, managed
processes
Esthablished,focuses
processes
Committedprocesses
Initial or ad hoc
processes
Bonding, uni�ed
Cost e�ective
Some partner-value;
Dashboard managed
Some cost
e�ectiveness; Dashboard
established
IT enables/drives business strategy
IT seen as an asset; Process driver;Con�ict seen as creative
Shared risk & rewards
Emerging value service provider;Balanced tech & business hiring
Relevant process
across the organization
Relevant process
across the organization
Good understanding;
Emerging relaxed
Limited business / IT understanding,
Business / IT lack understanding,
Functional cost e�ciency
Some technical measurements
No formal process,cost center, reactive
priorities
Con�ict; IT a cost of doing
business
Traditional (e.g., acctng, email)
IT takes risk, little reward;
Technical training
Tactical at Functional
level,occasional
responsive
IT emerging as an asset;
Process enabler
Transaction (e.g., ESS, DSS)
Di�ers across functional organizations
Integrated with partners
Integrated across the organization
Extende to external
partners
Integrated across the
org. & partners
Evolve with partners
IT-bunisness co-adaptive
Improvisation-al
Education/careers/rewards across the organization
Communication
ValueGovernance Partnership Scope &
architectureSkills
Busin
ess &
ITal
ignm
ent
mat
urityIT outsourcing
characteristics in�uenceScope
functional
Experience
Busin
ess &
ITal
ignm
ent
mat
urity
Busin
ess &
ITal
ignm
ent
mat
urity

2313 Result survey research
Table 29. Pearson’s correlation ITO characteristics and BIA score (n=183).
Pearson’s correlation
Variable ITO characteristics BIA score correlation Correlation
BIA score Score maturity BIA 1.000 Direct
SEXP_1 ITO experience – size of ITO deal 0.286 **
SPI1 Type of relationship IT supplier 0.276 **
SSFmean ITO scope functional 0.268 **
** Correlation is significant at the 0.01 level (1-tailed).
No new findings were made.
3.6 What is the value of the contingency factors?In this paragraph, the influence of the contingency factors identified is tested. The structure follows
the identified contingency factors outlined in part VI for survey research.
3.6.1 Correlations organisational factor – industryThe influence of the contingency factor industry is calculated. For the
survey research, the industries, their BIA score and degree ITO are dis-
played in figure 25.
Manufacturing - 17; 9% (organisations)BIA score=2.88Degree ITO=2.50
Financial services - 15; 8%BIA score=2.73Degree ITO=2.05
Government / not for pro�t - 49: 27%BIA score=2.31Degree ITO=2.11
Logistics - 10; 5%BIA score=2.43Degree ITO=1.94
Professional services - 43; 24%BIA score=2.60
Degree ITO=2.29
Housing corporation - 33; 18%BIA score=2.50
Degree ITO=2.35
Other - 16; 9%BIA score=2.46
Degree ITO=2.34
Figure 25. Industry and mean BIA and degree ITO (n=183).
Contingency factors
Informalpervasive
Optimized processes
Improved, managed
processes
Esthablished,focuses
processes
Committedprocesses
Initial or ad hoc
processes
Bonding, uni�ed
Cost e�ective
Some partner-value;
Dashboard managed
Some cost
e�ectiveness; Dashboard
established
IT enables/drives business strategy
IT seen as an asset; Process driver;Con�ict seen as creative
Shared risk & rewards
Emerging value service provider;Balanced tech & business hiring
Relevant process
across the organization
Relevant process
across the organization
Good understanding;
Emerging relaxed
Limited business / IT understanding,
Business / IT lack understanding,
Functional cost e�ciency
Some technical measurements
No formal process,cost center, reactive
priorities
Con�ict; IT a cost of doing
business
Traditional (e.g., acctng, email)
IT takes risk, little reward;
Technical training
Tactical at Functional
level,occasional
responsive
IT emerging as an asset;
Process enabler
Transaction (e.g., ESS, DSS)
Di�ers across functional organizations
Integrated with partners
Integrated across the organization
Extende to external
partners
Integrated across the
org. & partners
Evolve with partners
IT-bunisness co-adaptive
Improvisation-al
Education/careers/rewards across the organization
Communication
ValueGovernance Partnership Scope &
architectureSkills
Busin
ess &
ITal
ignm
ent
mat
urityIT outsourcing
characteristics in�uence
Industry
Busin
ess &
ITal
ignm
ent
mat
urity
1.57
Degree ofITO
Deg
ree
ITO
Surveyresearch

232 Part VII – Detailed Results
Between the identified industries and their average score on BIA score and Degree ITO differences
can be seen. For example, manufacturing and financial services have a relatively high score on BIA
score (mean BIA score = 2.88 and 2.71 compared with average of 2.52) whereas manufacturing has
on average a high Degree ITO (mean Degree ITO = 2.88 compared with average of 2.24).
The correlation between BIA score and Degree ITO was tested within the following identified indus-
tries: ‘manufacturing’, ‘financial services’, ‘government /not for profit’, ‘housing corporation’. Different
from the case research is the addition of the industries ‘professional services’ ,‘logistics’, and ‘other’.
Within the case research these industries did not provide enough comparison possibilities with only
1 company. The result is displayed in table 30 (sorted by Pearson’s correlation).
Table 30. Correlations BIA score – Degree ITO from industry perspective.
Industry Pearson’s correlation SIG. (1 tailed) n significant at level
Other 0.556 0.013 16 * (at 0.05 level)
Manufacturing 0.43 0.55 15
Government 0.356 0.009 44 **(at 0.01 level)
OVERALL 0.272 0 169 ** (at 0.01 level)
Housing corporation 0.195 0.143 32
Professional services 0.186 0.126 40
Logistics 0.045 0.458 8
Financial services 0.006 0.492 14
The following findings were made:
Finding 89: Industry is a relevant contingency factor. There are differences in average BIA score and
Degree ITO between industries.
Finding 90: There is a significant correlation between BIA score and Degree ITO for industries
‘government’ (r = 0.356; p < 0.01; n = 44).
3.6.2 Correlations organisational factor – size of organisationThe influence of the contingency factor size of organisation was cal-
culated. An overview of BIA score and Degree ITO per category of the
organisational factor – size of organisations is displayed in figure 26.
Contingency factors
Informalpervasive
Optimized processes
Improved, managed
processes
Esthablished,focuses
processes
Committedprocesses
Initial or ad hoc
processes
Bonding, uni�ed
Cost e�ective
Some partner-value;
Dashboard managed
Some cost
e�ectiveness; Dashboard
established
IT enables/drives business strategy
IT seen as an asset; Process driver;Con�ict seen as creative
Shared risk & rewards
Emerging value service provider;Balanced tech & business hiring
Relevant process
across the organization
Relevant process
across the organization
Good understanding;
Emerging relaxed
Limited business / IT understanding,
Business / IT lack understanding,
Functional cost e�ciency
Some technical measurements
No formal process,cost center, reactive
priorities
Con�ict; IT a cost of doing
business
Traditional (e.g., acctng, email)
IT takes risk, little reward;
Technical training
Tactical at Functional
level,occasional
responsive
IT emerging as an asset;
Process enabler
Transaction (e.g., ESS, DSS)
Di�ers across functional organizations
Integrated with partners
Integrated across the organization
Extende to external
partners
Integrated across the
org. & partners
Evolve with partners
IT-bunisness co-adaptive
Improvisation-al
Education/careers/rewards across the organization
Communication
ValueGovernance Partnership Scope &
architectureSkills
Busin
ess &
ITal
ignm
ent
mat
urityIT outsourcing
characteristics in�uence
Size of organisation
Busin
ess &
ITal
ignm
ent
mat
urity
1.57
Degree ofITO
Deg
ree
ITO
Surveyresearch
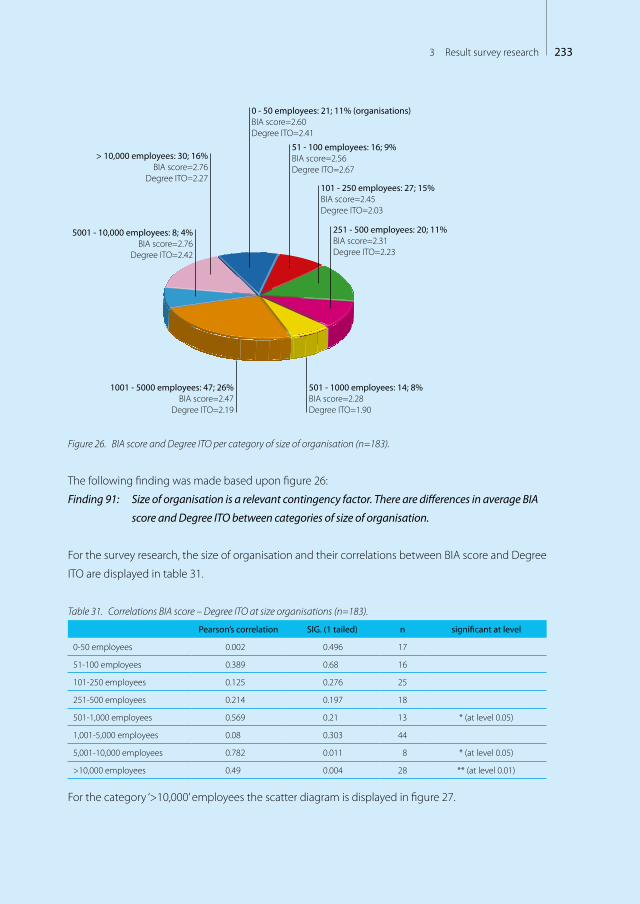
2333 Result survey research
0 - 50 employees: 21; 11% (organisations)BIA score=2.60Degree ITO=2.41
51 - 100 employees: 16; 9%BIA score=2.56Degree ITO=2.67
101 - 250 employees: 27; 15%BIA score=2.45Degree ITO=2.03
251 - 500 employees: 20; 11%BIA score=2.31Degree ITO=2.23
501 - 1000 employees: 14; 8%BIA score=2.28Degree ITO=1.90
1001 - 5000 employees: 47; 26%BIA score=2.47
Degree ITO=2.19
5001 - 10,000 employees: 8; 4%BIA score=2.76
Degree ITO=2.42
> 10,000 employees: 30; 16%BIA score=2.76
Degree ITO=2.27
Figure 26. BIA score and Degree ITO per category of size of organisation (n=183).
The following finding was made based upon figure 26:
Finding 91: Size of organisation is a relevant contingency factor. There are differences in average BIA
score and Degree ITO between categories of size of organisation.
For the survey research, the size of organisation and their correlations between BIA score and Degree
ITO are displayed in table 31.
Table 31. Correlations BIA score – Degree ITO at size organisations (n=183).
Pearson’s correlation SIG. (1 tailed) n significant at level
0-50 employees 0.002 0.496 17
51-100 employees 0.389 0.68 16
101-250 employees 0.125 0.276 25
251-500 employees 0.214 0.197 18
501-1,000 employees 0.569 0.21 13 * (at level 0.05)
1,001-5,000 employees 0.08 0.303 44
5,001-10,000 employees 0.782 0.011 8 * (at level 0.05)
>10,000 employees 0.49 0.004 28 ** (at level 0.01)
For the category ‘>10,000’ employees the scatter diagram is displayed in figure 27.

234 Part VII – Detailed Results
Figure 27. Correlation BIA score and Degree ITO for category ‘>10,000 employees’ (n=28).
The following finding was made:
Finding 92: There is a significant correlation between BIA score and Degree ITO for size of organisa-
tion for the categories ‘501-100 employees’(r = 0.569, p = 0.21, 1 tailed, n = 13), ‘5,001-
10,000 employees’ (r = 0.782, p = 0.011, 1 tailed, n = 8) , ‘>10,000 employees’ (r = 0.49, p =
0.004, 1 tailed, n = 28).
3.6.3 Correlations organisational factor – role respondentThe influence of the contingency factor role respondent was calcu-
lated. An overview of BIA score and Degree ITO per category of the
organisational factor – role respondent is displayed in figure 28.
CEO/COO - 16; 6% (respondents)BIA score=2.87Degree ITO=2.38
CIO - 33; 12%BIA score=2.73Degree ITO=2.64
Customer of ICT - 50; 18%BIA score=2.56Degree ITO=2.21
Supplier of ICT - 61; 23%BIA score=2.58Degree ITO=2.12
Employed within internal IT department - 70; 26%
BIA score=2.51Degree ITO=2.14
Employed at external IT supplier - 11; 4%BIA score=2.69
Degree ITO=2.07
User of ICT - 29; 11%BIA score=2.35
Degree ITO=1.97
Figure 28. BIA score and Degree ITO per category of role respondent (n=270).
Contingency factors
Informalpervasive
Optimized processes
Improved, managed
processes
Esthablished,focuses
processes
Committedprocesses
Initial or ad hoc
processes
Bonding, uni�ed
Cost e�ective
Some partner-value;
Dashboard managed
Some cost
e�ectiveness; Dashboard
established
IT enables/drives business strategy
IT seen as an asset; Process driver;Con�ict seen as creative
Shared risk & rewards
Emerging value service provider;Balanced tech & business hiring
Relevant process
across the organization
Relevant process
across the organization
Good understanding;
Emerging relaxed
Limited business / IT understanding,
Business / IT lack understanding,
Functional cost e�ciency
Some technical measurements
No formal process,cost center, reactive
priorities
Con�ict; IT a cost of doing
business
Traditional (e.g., acctng, email)
IT takes risk, little reward;
Technical training
Tactical at Functional
level,occasional
responsive
IT emerging as an asset;
Process enabler
Transaction (e.g., ESS, DSS)
Di�ers across functional organizations
Integrated with partners
Integrated across the organization
Extende to external
partners
Integrated across the
org. & partners
Evolve with partners
IT-bunisness co-adaptive
Improvisation-al
Education/careers/rewards across the organization
Communication
ValueGovernance Partnership Scope &
architectureSkills
Busin
ess &
ITal
ignm
ent
mat
urityIT outsourcing
characteristics in�uence
Busin
ess &
ITal
ignm
ent
mat
urity
1.57
Degree ofITO
Deg
ree
ITO
Surveyresearch
Rolerespondent
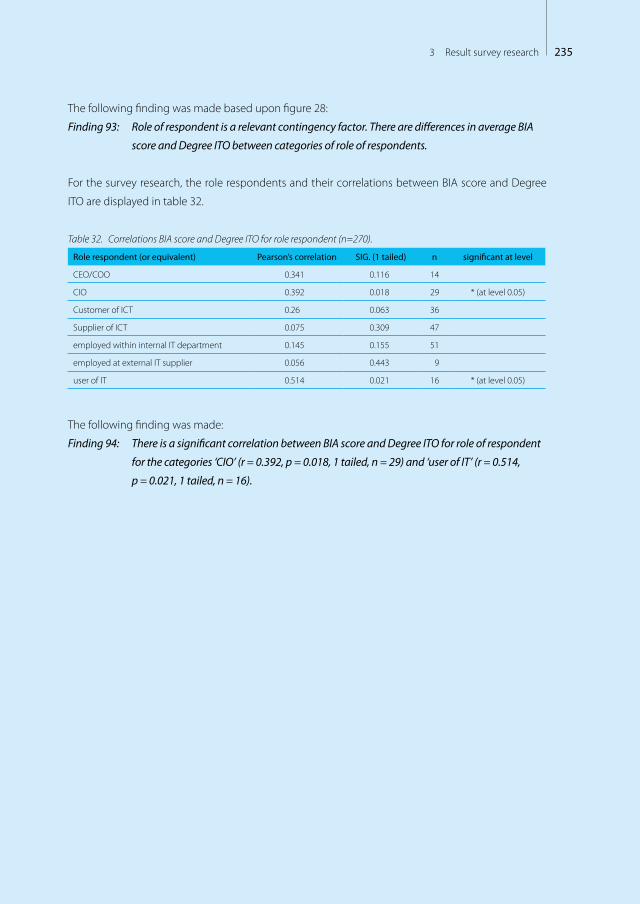
2353 Result survey research
The following finding was made based upon figure 28:
Finding 93: Role of respondent is a relevant contingency factor. There are differences in average BIA
score and Degree ITO between categories of role of respondents.
For the survey research, the role respondents and their correlations between BIA score and Degree
ITO are displayed in table 32.
Table 32. Correlations BIA score and Degree ITO for role respondent (n=270).
Role respondent (or equivalent) Pearson’s correlation SIG. (1 tailed) n significant at level
CEO/COO 0.341 0.116 14
CIO 0.392 0.018 29 * (at level 0.05)
Customer of ICT 0.26 0.063 36
Supplier of ICT 0.075 0.309 47
employed within internal IT department 0.145 0.155 51
employed at external IT supplier 0.056 0.443 9
user of IT 0.514 0.021 16 * (at level 0.05)
The following finding was made:
Finding 94: There is a significant correlation between BIA score and Degree ITO for role of respondent
for the categories ‘CIO’ (r = 0.392, p = 0.018, 1 tailed, n = 29) and ‘user of IT’ (r = 0.514,
p = 0.021, 1 tailed, n = 16).

236 Part VII – Detailed Results
2374 Result short survey research
“Consider first what you make of it and then form an opinion”
Best advice received from Sabien Duetz (Head design office at HEMA).
Source Intermediair
Result short survey researchIn this chapter the results regarding the short survey research are
described at organisational level. A few opportunities were used to
gather the data of the short survey research:
– four industry seminars for the industry housing corporations (n=37
organisations, other than case organisations), also measuring the
contingency factors: Attitude, Behaviour & Culture (n=85 respond-
ents within the mentioned 37 organisations) during nine work-
shops;
– research study for user satisfaction at the industry education (n=149 respondents, other than case
organisations);
In total, 62 organisations were adopted represented by 183 respondents.
Within this chapter the following structure is used:
1. What is the influence of the components identified for BIA?
2. What is the value of the ITO characteristics?
3. What is the BIAS maturity?
4. What is the ITO influence on BIA?
5. What is the value of the contingency factors?
Together with the case research (chapter 2) and survey research (chapter 3) the short survey results
are the baseline for part VIII of this dissertation (analysis).
Shortsurvey
research
4
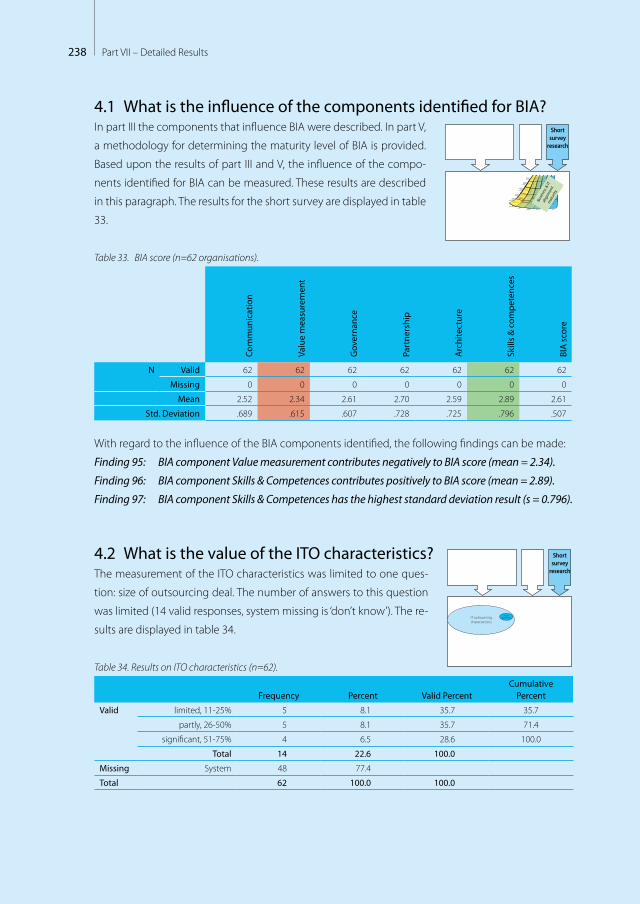
238 Part VII – Detailed Results
4.1 What is the influence of the components identified for BIA?In part III the components that influence BIA were described. In part V,
a methodology for determining the maturity level of BIA is provided.
Based upon the results of part III and V, the influence of the compo-
nents identified for BIA can be measured. These results are described
in this paragraph. The results for the short survey are displayed in table
33.
Table 33. BIA score (n=62 organisations).
Com
mun
icat
ion
Valu
e m
easu
rem
ent
Gov
erna
nce
Part
ners
hip
Arc
hite
ctur
e
Skill
s &
com
pete
nces
BIA
sco
re
N
Valid 62 62 62 62 62 62 62
Missing 0 0 0 0 0 0 0
Mean 2.52 2.34 2.61 2.70 2.59 2.89 2.61
Std. Deviation .689 .615 .607 .728 .725 .796 .507
With regard to the influence of the BIA components identified, the following findings can be made:
Finding 95: BIA component Value measurement contributes negatively to BIA score (mean = 2.34).
Finding 96: BIA component Skills & Competences contributes positively to BIA score (mean = 2.89).
Finding 97: BIA component Skills & Competences has the highest standard deviation result (s = 0.796).
4.2 What is the value of the ITO characteristics?The measurement of the ITO characteristics was limited to one ques-
tion: size of outsourcing deal. The number of answers to this question
was limited (14 valid responses, system missing is ‘don’t know’). The re-
sults are displayed in table 34.
Table 34. Results on ITO characteristics (n=62).
Frequency Percent Valid PercentCumulative
Percent
Valid
limited, 11-25% 5 8.1 35.7 35.7
partly, 26-50% 5 8.1 35.7 71.4
significant, 51-75% 4 6.5 28.6 100.0
Total 14 22.6 100.0
Missing System 48 77.4
Total 62 100.0 100.0
Shortsurvey
research
Informalpervasive
Optimized processes
Improved, managed
processes
Esthablished,focuses
processes
Committedprocesses
Initial or ad hoc
processes
Bonding, uni�ed
Cost e�ective
Some partner-value;
Dashboard managed
Some cost
e�ectiveness; Dashboard
established
IT enables/drives business strategy
IT seen as an asset; Process driver;Con�ict seen as creative
Shared risk & rewards
Emerging value service provider;Balanced tech & business hiring
Relevant process
across the organization
Relevant process
across the organization
Good understanding;
Emerging relaxed
Limited business / IT understanding,
Business / IT lack understanding,
Functional cost e�ciency
Some technical measurements
No formal process,cost center, reactive
priorities
Con�ict; IT a cost of doing
business
Traditional (e.g., acctng, email)
IT takes risk, little reward;
Technical training
Tactical at Functional
level,occasional
responsive
IT emerging as an asset;
Process enabler
Transaction (e.g., ESS, DSS)
Di�ers across functional organizations
Integrated with partners
Integrated across the organization
Extende to external
partners
Integrated across the
org. & partners
Evolve with partners
IT-bunisness co-adaptive
Improvisation-al
Education/careers/rewards across the organization
Communication
ValueGovernance Partnership Scope &
architectureSkills
Busin
ess &
ITal
ignm
ent
mat
urity
Shortsurvey
research
IT outsourcingcharacteristics
Scopefunctional
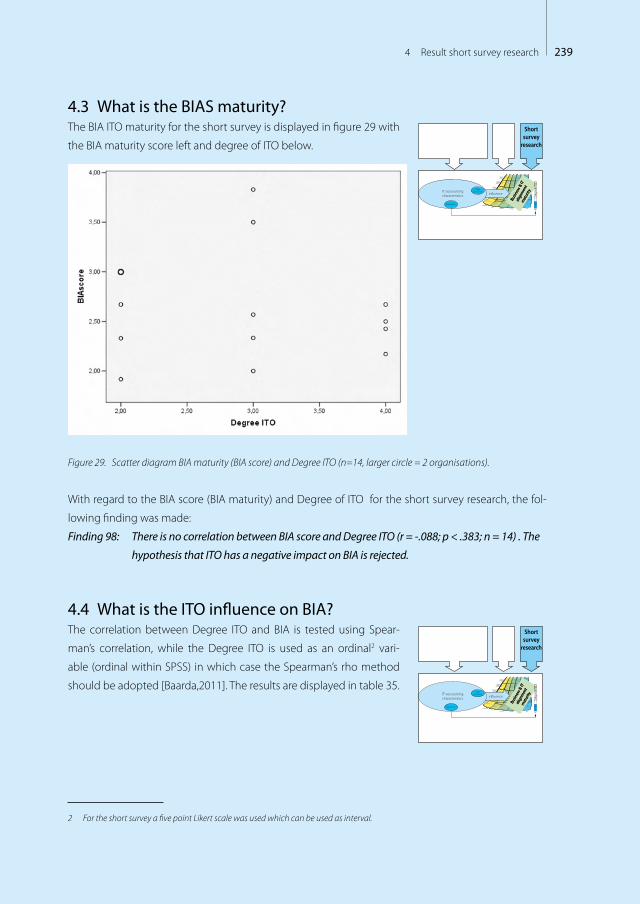
2394 Result short survey research
4.3 What is the BIAS maturity?The BIA ITO maturity for the short survey is displayed in figure 29 with
the BIA maturity score left and degree of ITO below.
Figure 29. Scatter diagram BIA maturity (BIA score) and Degree ITO (n=14, larger circle = 2 organisations).
With regard to the BIA score (BIA maturity) and Degree of ITO for the short survey research, the fol-
lowing finding was made:
Finding 98: There is no correlation between BIA score and Degree ITO (r = -.088; p < .383; n = 14) . The
hypothesis that ITO has a negative impact on BIA is rejected.
4.4 What is the ITO influence on BIA?The correlation between Degree ITO and BIA is tested using Spear-
man’s correlation, while the Degree ITO is used as an ordinal2 vari-
able (ordinal within SPSS) in which case the Spearman’s rho method
should be adopted [Baarda,2011]. The results are displayed in table 35.
2 For the short survey a five point Likert scale was used which can be used as interval.
Shortsurvey
research
Informalpervasive
Optimized processes
Improved, managed
processes
Esthablished,focuses
processes
Committedprocesses
Initial or ad hoc
processes
Bonding, uni�ed
Cost e�ective
Some partner-value;
Dashboard managed
Some cost
e�ectiveness; Dashboard
established
IT enables/drives business strategy
IT seen as an asset; Process driver;Con�ict seen as creative
Shared risk & rewards
Emerging value service provider;Balanced tech & business hiring
Relevant process
across the organization
Relevant process
across the organization
Good understanding;
Emerging relaxed
Limited business / IT understanding,
Business / IT lack understanding,
Functional cost e�ciency
Some technical measurements
No formal process,cost center, reactive
priorities
Con�ict; IT a cost of doing
business
Traditional (e.g., acctng, email)
IT takes risk, little reward;
Technical training
Tactical at Functional
level,occasional
responsive
IT emerging as an asset;
Process enabler
Transaction (e.g., ESS, DSS)
Di�ers across functional organizations
Integrated with partners
Integrated across the organization
Extende to external
partners
Integrated across the
org. & partners
Evolve with partners
IT-bunisness co-adaptive
Improvisation-al
Education/careers/rewards across the organization
Communication
ValueGovernance Partnership Scope &
architectureSkills
Busin
ess &
ITal
ignm
ent
mat
urityIT outsourcing
characteristics in�uenceScope
functional
Experience
Busin
ess &
ITal
ignm
ent
mat
urity
Busin
ess &
ITal
ignm
ent
mat
urity
1.57
Degree ofITO
Deg
ree
ITO

240 Part VII – Detailed Results
Table 35. Spearman’s rho correlation BIA score and Degree ITO, short survey research (n = 14 organisations).
Degree ITO BIAscore
Degree ITO Correlation Coefficient 1.000 -0.88
Sig. (1-tailed) . 0.383
BIAscore Correlation Coefficient .121 1.000
Sig. (1-tailed) 0.383 .
a. Listwise N= 14
Both the finding, and the visual representation of the results were discussed in the previous para-
graph (4.3).
4.5 What is the value of the contingency factors? In this paragraph, the influence of the contingency factors identified is tested on BIA, as well as on
degree of ITO. The followed structure is based upon the identified contingency factors mentioned in
part VI.
4.5.1 Correlations organisational factor – industryThe influence of the contingency factor industry is calculated. For the
short survey research, the industry and their BIA score are displayed
in figure 30.
Government - 148; 81%BIA score=2.49Degree ITO = 2.00
Housing corporation - 31; 17%BIA score=2.49
Degree ITO= 2.94
Professional services - 4: 2%BIA score=2.50
Degree ITO= 3.5
Figure 30. Industry and mean BIA (n = 183 respondents).
Between the identified industries and their average score on BIA score and Degree ITO, differences
can be seen.
The correlation between BIA score and Degree ITO was tested within the identified industries. No
significant correlations have been found.
The following finding was made:
Shortsurvey
research
Contingency factors
Informalpervasive
Optimized processes
Improved, managed
processes
Esthablished,focuses
processes
Committedprocesses
Initial or ad hoc
processes
Bonding, uni�ed
Cost e�ective
Some partner-value;
Dashboard managed
Some cost
e�ectiveness; Dashboard
established
IT enables/drives business strategy
IT seen as an asset; Process driver;Con�ict seen as creative
Shared risk & rewards
Emerging value service provider;Balanced tech & business hiring
Relevant process
across the organization
Relevant process
across the organization
Good understanding;
Emerging relaxed
Limited business / IT understanding,
Business / IT lack understanding,
Functional cost e�ciency
Some technical measurements
No formal process,cost center, reactive
priorities
Con�ict; IT a cost of doing
business
Traditional (e.g., acctng, email)
IT takes risk, little reward;
Technical training
Tactical at Functional
level,occasional
responsive
IT emerging as an asset;
Process enabler
Transaction (e.g., ESS, DSS)
Di�ers across functional organizations
Integrated with partners
Integrated across the organization
Extende to external
partners
Integrated across the
org. & partners
Evolve with partners
IT-bunisness co-adaptive
Improvisation-al
Education/careers/rewards across the organization
Communication
ValueGovernance Partnership Scope &
architectureSkills
Busin
ess &
ITal
ignm
ent
mat
urityIT outsourcing
characteristics in�uence
Industry
Busin
ess &
ITal
ignm
ent
mat
urity
1.57
Degree ofITO
Deg
ree
ITO
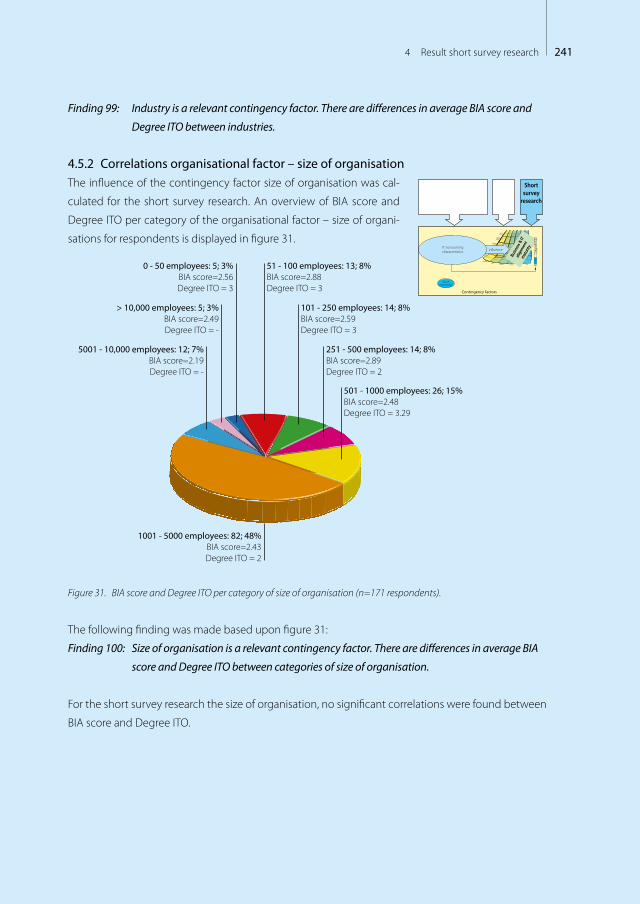
2414 Result short survey research
Finding 99: Industry is a relevant contingency factor. There are differences in average BIA score and
Degree ITO between industries.
4.5.2 Correlations organisational factor – size of organisationThe influence of the contingency factor size of organisation was cal-
culated for the short survey research. An overview of BIA score and
Degree ITO per category of the organisational factor – size of organi-
sations for respondents is displayed in figure 31.
0 - 50 employees: 5; 3%BIA score=2.56Degree ITO = 3
51 - 100 employees: 13; 8%BIA score=2.88Degree ITO = 3
101 - 250 employees: 14; 8%BIA score=2.59Degree ITO = 3
251 - 500 employees: 14; 8%BIA score=2.89Degree ITO = 2
501 - 1000 employees: 26; 15%BIA score=2.48Degree ITO = 3.29
1001 - 5000 employees: 82; 48%BIA score=2.43Degree ITO = 2
5001 - 10,000 employees: 12; 7%BIA score=2.19Degree ITO = -
> 10,000 employees: 5; 3%BIA score=2.49Degree ITO = -
Figure 31. BIA score and Degree ITO per category of size of organisation (n=171 respondents).
The following finding was made based upon figure 31:
Finding 100: Size of organisation is a relevant contingency factor. There are differences in average BIA
score and Degree ITO between categories of size of organisation.
For the short survey research the size of organisation, no significant correlations were found between
BIA score and Degree ITO.
Shortsurvey
research
Contingency factors
Informalpervasive
Optimized processes
Improved, managed
processes
Esthablished,focuses
processes
Committedprocesses
Initial or ad hoc
processes
Bonding, uni�ed
Cost e�ective
Some partner-value;
Dashboard managed
Some cost
e�ectiveness; Dashboard
established
IT enables/drives business strategy
IT seen as an asset; Process driver;Con�ict seen as creative
Shared risk & rewards
Emerging value service provider;Balanced tech & business hiring
Relevant process
across the organization
Relevant process
across the organization
Good understanding;
Emerging relaxed
Limited business / IT understanding,
Business / IT lack understanding,
Functional cost e�ciency
Some technical measurements
No formal process,cost center, reactive
priorities
Con�ict; IT a cost of doing
business
Traditional (e.g., acctng, email)
IT takes risk, little reward;
Technical training
Tactical at Functional
level,occasional
responsive
IT emerging as an asset;
Process enabler
Transaction (e.g., ESS, DSS)
Di�ers across functional organizations
Integrated with partners
Integrated across the organization
Extende to external
partners
Integrated across the
org. & partners
Evolve with partners
IT-bunisness co-adaptive
Improvisation-al
Education/careers/rewards across the organization
Communication
ValueGovernance Partnership Scope &
architectureSkills
Busin
ess &
ITal
ignm
ent
mat
urityIT outsourcing
characteristics in�uence
Busin
ess &
ITal
ignm
ent
mat
urity
1.57
Degree ofITO
Deg
ree
ITO
Size of organisation
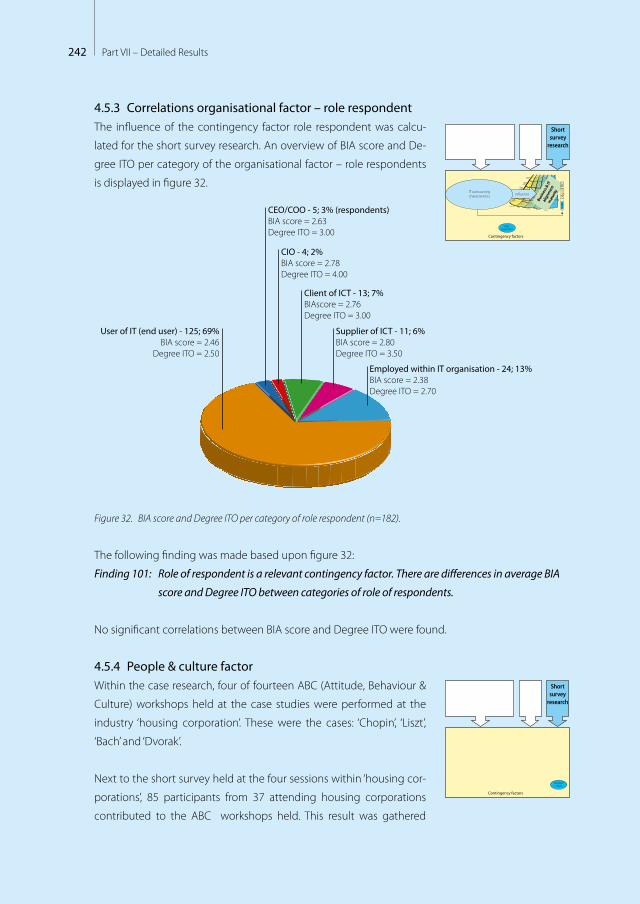
242 Part VII – Detailed Results
4.5.3 Correlations organisational factor – role respondentThe influence of the contingency factor role respondent was calcu-
lated for the short survey research. An overview of BIA score and De-
gree ITO per category of the organisational factor – role respondents
is displayed in figure 32.
CEO/COO - 5; 3% (respondents)BIA score = 2.63Degree ITO = 3.00
CIO - 4; 2%BIA score = 2.78Degree ITO = 4.00
Client of ICT - 13; 7%BIAscore = 2.76Degree ITO = 3.00
Supplier of ICT - 11; 6%BIA score = 2.80Degree ITO = 3.50
Employed within IT organisation - 24; 13%BIA score = 2.38Degree ITO = 2.70
User of IT (end user) - 125; 69%BIA score = 2.46
Degree ITO = 2.50
Figure 32. BIA score and Degree ITO per category of role respondent (n=182).
The following finding was made based upon figure 32:
Finding 101: Role of respondent is a relevant contingency factor. There are differences in average BIA
score and Degree ITO between categories of role of respondents.
No significant correlations between BIA score and Degree ITO were found.
4.5.4 People & culture factorWithin the case research, four of fourteen ABC (Attitude, Behaviour &
Culture) workshops held at the case studies were performed at the
industry ‘housing corporation’. These were the cases: ‘Chopin’, ‘Liszt’,
‘Bach’ and ‘Dvorak’.
Next to the short survey held at the four sessions within ‘housing cor-
porations’, 85 participants from 37 attending housing corporations
contributed to the ABC workshops held. This result was gathered
Shortsurvey
research
Contingency factors
Informalpervasive
Optimized processes
Improved, managed
processes
Esthablished,focuses
processes
Committedprocesses
Initial or ad hoc
processes
Bonding, uni�ed
Cost e�ective
Some partner-value;
Dashboard managed
Some cost
e�ectiveness; Dashboard
established
IT enables/drives business strategy
IT seen as an asset; Process driver;Con�ict seen as creative
Shared risk & rewards
Emerging value service provider;Balanced tech & business hiring
Relevant process
across the organization
Relevant process
across the organization
Good understanding;
Emerging relaxed
Limited business / IT understanding,
Business / IT lack understanding,
Functional cost e�ciency
Some technical measurements
No formal process,cost center, reactive
priorities
Con�ict; IT a cost of doing
business
Traditional (e.g., acctng, email)
IT takes risk, little reward;
Technical training
Tactical at Functional
level,occasional
responsive
IT emerging as an asset;
Process enabler
Transaction (e.g., ESS, DSS)
Di�ers across functional organizations
Integrated with partners
Integrated across the organization
Extende to external
partners
Integrated across the
org. & partners
Evolve with partners
IT-bunisness co-adaptive
Improvisation-al
Education/careers/rewards across the organization
Communication
ValueGovernance Partnership Scope &
architectureSkills
Busin
ess &
ITal
ignm
ent
mat
urityIT outsourcing
characteristics in�uence
Busin
ess &
ITal
ignm
ent
mat
urity
1.57
Degree ofITO
Deg
ree
ITO
Rolerespondent
Shortsurvey
research
Contingency factors
People &culture

2434 Result short survey research
in nine workshops at the four sessions and can be added upon the four ‘housing corporation’cases
mentioned. This result provides an interesting factor when comparing the four ‘housing corporation’
cases with the results from the nine workshops held related to the short survey.
In this paragraph, the results of the nine industry workshops are compared to the four cases. For the
nine industry workshops, the same approach, with regard to the ABC element was used, as described
in part VI. The results are showed in table 36.
Table 36. ABC housing corporation seminars and cases.
card kind description
9 Workshops ‘housing corporation’
4 Cases (# of cards chosen)
Tota
l car
ds
tota
l # c
ards
cho
sen
Lead
ing
elem
ents
(C
aluw
é / K
aars
t)
Chop
in
Lisz
t
Bach
Dvo
rak
6 Everything has the highest priority according to the users
27 4 5 2 10 1 45
8 Plan, do, Stop…no real continual improvement culture
23 2 2 4 29
5 No management commitment 19 1 1 4 24
J Saying Yes but meaning no 13 1 7 20
4 Internally focused 13 3 3 1 3 20
A Process managers without authority 12 1 2 4 2 20
3 Too little business involvement in requirements specification & testing
11 5 1 2 14
4 IT not seen as an added value partner to the business
11 3 3 14
2 Them and Us culture…opposing & competing forces
10 3 1 11
7 9 to 5 culture 10 2 2 1 13
K IT strategy´s contribution to business strategy 9 4 1 10
Q Not my responsibility 9 1 1 10
10 Never mind about following procedures…just do what we usually do
8 5 4 1 13
7 Throwing solutions over the wall & hoping people will use them
8 2 2 1 11
8 IT thinks it doesn´t need to understand the business to make a business case
8 1 3 2 1 14
Q No understanding of business priority & impact 7 2 1 4 1 13
Q The solution the customer sees isn´t the one that IT sees
6 2 6
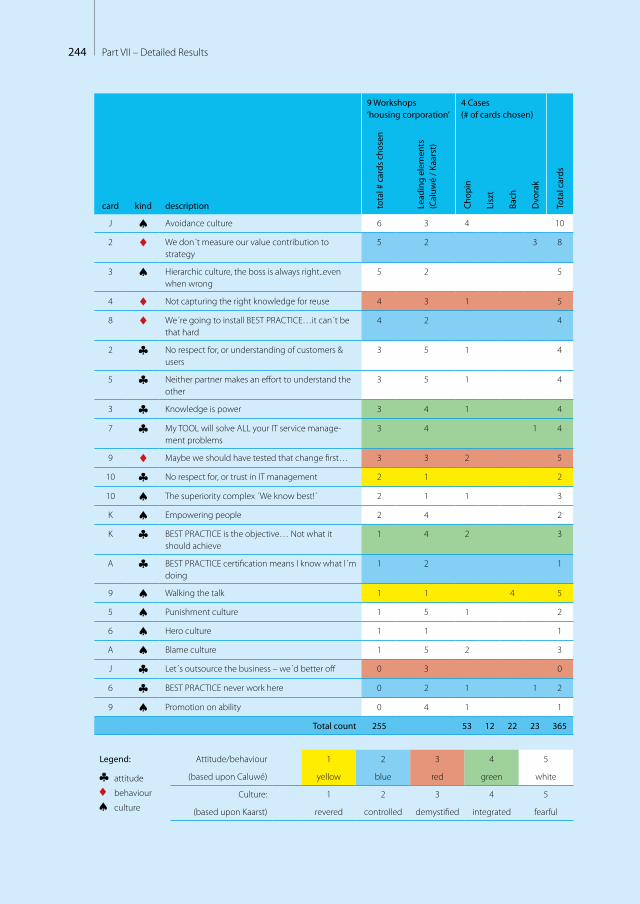
244 Part VII – Detailed Results
card kind description
9 Workshops ‘housing corporation’
4 Cases (# of cards chosen)
Tota
l car
ds
tota
l # c
ards
cho
sen
Lead
ing
elem
ents
(C
aluw
é / K
aars
t)
Chop
in
Lisz
t
Bach
Dvo
rak
J Avoidance culture 6 3 4 10
2 We don´t measure our value contribution to strategy
5 2 3 8
3 Hierarchic culture, the boss is always right..even when wrong
5 2 5
4 Not capturing the right knowledge for reuse 4 3 1 5
8 We´re going to install BEST PRACTICE…it can´t be that hard
4 2 4
2 No respect for, or understanding of customers & users
3 5 1 4
5 Neither partner makes an effort to understand the other
3 5 1 4
3 Knowledge is power 3 4 1 4
7 My TOOL will solve ALL your IT service manage-ment problems
3 4 1 4
9 Maybe we should have tested that change first… 3 3 2 5
10 No respect for, or trust in IT management 2 1 2
10 The superiority complex ´We know best!´ 2 1 1 3
K Empowering people 2 4 2
K BEST PRACTICE is the objective… Not what it should achieve
1 4 2 3
A BEST PRACTICE certification means I know what I´m doing
1 2 1
9 Walking the talk 1 1 4 5
5 Punishment culture 1 5 1 2
6 Hero culture 1 1 1
A Blame culture 1 5 2 3
J Let´s outsource the business – we´d better off 0 3 0
6 BEST PRACTICE never work here 0 2 1 1 2
9 Promotion on ability 0 4 1 1
Total count 255 53 12 22 23 365
Legend: Attitude/behaviour 1 2 3 4 5
attitude
behaviour
culture
(based upon Caluwé) yellow blue red green white
Culture: 1 2 3 4 5
(based upon Kaarst) revered controlled demystified integrated fearful
2454 Result short survey research
The following findings were made based upon the results listed in table 36:
Finding 102: The top behaviour ‘everything has the highest priority according to the users’ is a
behaviour for both case research and seminars in the industry ‘housing corporation’ .
Finding 103: Case Liszt has ‘no management commitment’ as top behaviour, which is also in the top 3
of the industry ‘housing corporation’.
Finding 104: Case Dvorak has ‘Plan, do, stop…no real continual improvement culture’ as a top culture,
which is also in the top 3 in the industry ‘housing corporation’.
Finding 105: The top attitude ‘IT is not seen as an added value partner to the business’ is only selected
at case Liszt.
Finding 106: For Attitude and culture, the ‘housing corporation’ cases within the case research seem to
be comparable with the ‘housing corporation’ industry.

246 Part VII – Detailed Results
Part VIIIConsolidated
results
Ranking ofcomponents
for BIA
Answers to the main questions:1. Does the BIA di�er depending on the degree of ITO?2. On which aspects / areas of interest does the BIA di�er?3. Does ITO in�uence the level of BIA? 4. What are the determining characteristics for BIA in ITO situations?
Acceptance or rejection of the hypothesis: IT outsourcing (ITO) has a negative impact on Business & IT alignment (BIA)
Does ITOin�uence the maturity
level of BIA?
What are the determining characteristics for BIA in
ITO situations?
Are there contingency factors which in�uence
BIAS?
Ranking of the ITO
characteristicsidenti�ed for BIA
Displayingorganisations on
maturity levelof BIAS
Showingsimilarities anddi�erences inin�uence of ITO on BIA
Showingsimilarities anddi�erences incontingency
factors
Consoli-dated
results &Analysis

248 Part VIII – Consolidated Results
249Contents
Contents
1 Introduction 2511.1 Justification of statistical interpretation 253
1.1.1 Quality datasets 253
1.1.2 BIA, Degree ITO and contingency data. 253
1.1.3 Reliability – BIA measurement 254
1.1.4 Reliability – ITO measurement 255
Redefined ITO maturity 256
1.2 Summary justification statistical interpretation 257
2 Ranking of components for BIA 2592.1 Statistically ranking BIA components 259
2.2 Consolidated results and ranking of BIA components 260
2.3 Conclusions 262
3 Ranking of ITO characteristics identified for BIA 2633.1 Statistically ranking of Degree ITO characteristics 263
3.2 Consolidated results and ranking of ITO characteristics 264
3.3 Conclusions 265
4 Displaying organisations on maturity level of BIAS 2674.1 Ordering on BIAS maturity 267
4.2 Conclusions 269
5 Similarities and differences in influence of ITO on BIA 2715.1 Similarities and differences 271
5.2 Conclusions 272
6 Similarities and differences of contingency factors on BIAS 2756.1 Statistically testing the contingency factors 275
6.2 Similarities and differences 276
6.2.1 Similarities and differences – industry 276
6.2.2 Similarities and differences – size of organisation 277
6.2.3 Similarities and differences – role respondent 279
6.3 Conclusions 280

250 Part VIII – Consolidated Results
7 Does ITO influence the maturity level of BIA? 2837.1 Impact of ITO on BIA 283
7.2 Conclusions 283
8 What are the determining characteristics for BIA in ITO situations? 2858.1 Determining characteristics 285
8.2 Conclusions 286
9 Are there contingency factors which influence BIAS? 2899.1 Impact of contingency factors 289
9.2 Conclusions 290
10 Consolidated conclusions 29110.1 BIA differs depending on the degree of ITO 291
10.2 On several aspects / areas of interest the alignment differs 292
10.3 ITO influences the level of BIA 292
10.4 There are determining characteristics for BIA in ITO situations 293
10.5 ITO has a positive impact on BIA 293
11 Summary 295

2511 Introduction
“You trust others, also trust yourself” Best advice received from Hans Ubbink (Artist). Source Intermediair
IntroductionIn this part, the gathered data (part VII) is consolidated for case, survey and short survey research. The
findings made in part VII were analysed and research conclusions were made.
The research result is rich in both quantitative and qualitative data which provides both opportuni-
ties and limitations for further analysis. The limitations are discussed in the first chapter.
In the following chapters, a number of research questions, as described in part I, are answered using
the findings and correlations described in part VII. Subsequently, the conclusions towards the follow-
ing (sub) questions are drawn:
– Does ITO influence the maturity level of BIA?
– What are the determining characteristics for BIA in ITO situations?
– Are there contingency factors which influence BIAS?
In figure 1 the chapter’s 2 to 10 of this part are placed within the research model. In chapter 11 the
research results are compared to the research results of Luftman [2012] and Poels [2006]. In chapter
12 a summary is provided.
In this chapter the justification of statistical interpretation is provided.
The overview structure shown in part VII (figure 2) is used in this part as well. The structure is adapted
in order to identify what is discussed within the consolidated results in this part. Figure 2 from part VII
can be recognised in an abstract version at the several chapters and paragraphs in this part providing
insight which results are being discussed.
1

252 Part VIII – Consolidated Results
Ranking ofcomponents
for BIA
Answers to the main questions:1. Does the BIA di�er depending on the degree of ITO?2. On which aspects / areas of interest does the BIA di�er?3. Does ITO in�uence the level of BIA? 4. What are the determining characteristics for BIA in ITO situations?
Acceptance or rejection of the hypothesis: IT outsourcing (ITO) has a negative impact on Business & IT alignment (BIA)
Does ITOin�uence the maturity
level of BIA?
What are the determining characteristics for BIA in
ITO situations?
Are there contingency factors which in�uence
BIAS?
Ranking of the ITO
characteristicsidenti�ed for BIA
Displayingorganisations on
maturity levelof BIAS
Showingsimilarities anddi�erences inin�uence of ITO on BIA
Showingsimilarities anddi�erences incontingency
factors
Business & IT alignment outsourcing
Contingency factors
Busin
ess &
ITal
ignm
ent
mat
urityIT outsourcing
characteristics in�uence
Literatureresearch
Whichcomponents
in�uences BIA?
Whichcharacteristics di�erentiate
ITO?
How can we determine the maturity level
of BIAS?
How can ITO
in�uence be measured?
Whichcontingency
factors in�uenceBIAS possibly?
Fieldresearch
What is thein�uence of the
componentsidenti�ed for BIA per organisation?
What is the value of the
ITO characteristicsper organisation?
What is the BIAS maturity
perorganisation?
What is the ITO in�uence
on BIA?
What is value of the
contingencyfactors per
organisation?
2
10
7 8 9
3 4 5 6
Consoli-dated
results &Analysis
Figure 1. Chapters part VIII in research model.
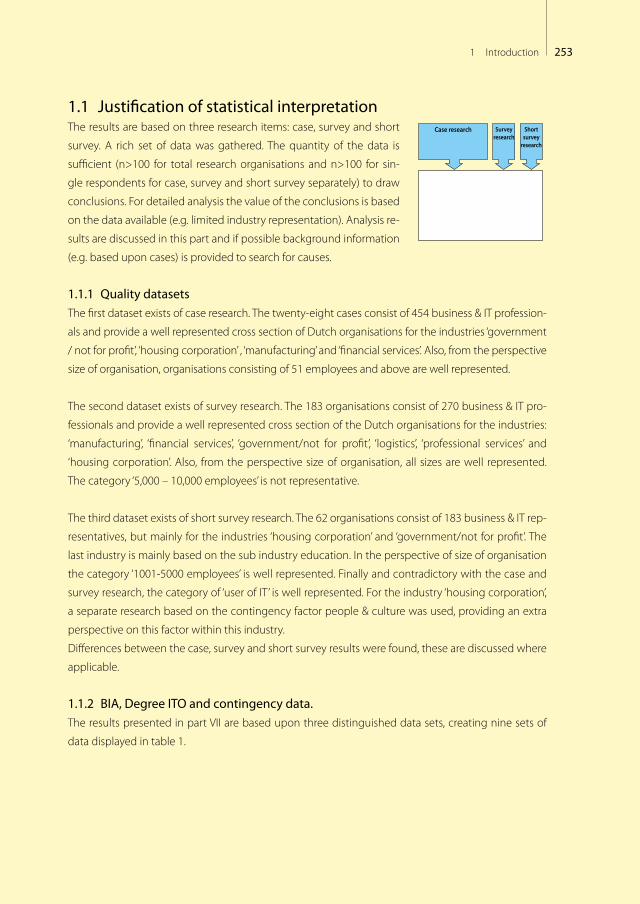
2531 Introduction
1.1 Justification of statistical interpretationThe results are based on three research items: case, survey and short
survey. A rich set of data was gathered. The quantity of the data is
sufficient (n>100 for total research organisations and n>100 for sin-
gle respondents for case, survey and short survey separately) to draw
conclusions. For detailed analysis the value of the conclusions is based
on the data available (e.g. limited industry representation). Analysis re-
sults are discussed in this part and if possible background information
(e.g. based upon cases) is provided to search for causes.
1.1.1 Quality datasetsThe first dataset exists of case research. The twenty-eight cases consist of 454 business & IT profession-
als and provide a well represented cross section of Dutch organisations for the industries ‘government
/ not for profit’, ‘housing corporation’ , ‘manufacturing’ and ‘financial services’. Also, from the perspective
size of organisation, organisations consisting of 51 employees and above are well represented.
The second dataset exists of survey research. The 183 organisations consist of 270 business & IT pro-
fessionals and provide a well represented cross section of the Dutch organisations for the industries:
‘manufacturing’, ‘financial services’, ‘government/not for profit’, ‘logistics’, ‘professional services’ and
‘housing corporation’. Also, from the perspective size of organisation, all sizes are well represented.
The category ‘5,000 – 10,000 employees’ is not representative.
The third dataset exists of short survey research. The 62 organisations consist of 183 business & IT rep-
resentatives, but mainly for the industries ‘housing corporation’ and ‘government/not for profit’. The
last industry is mainly based on the sub industry education. In the perspective of size of organisation
the category ‘1001-5000 employees’ is well represented. Finally and contradictory with the case and
survey research, the category of ‘user of IT’ is well represented. For the industry ‘housing corporation’,
a separate research based on the contingency factor people & culture was used, providing an extra
perspective on this factor within this industry.
Differences between the case, survey and short survey results were found, these are discussed where
applicable.
1.1.2 BIA, Degree ITO and contingency data.The results presented in part VII are based upon three distinguished data sets, creating nine sets of
data displayed in table 1.
Shortsurvey
research
Surveyresearch
Case research
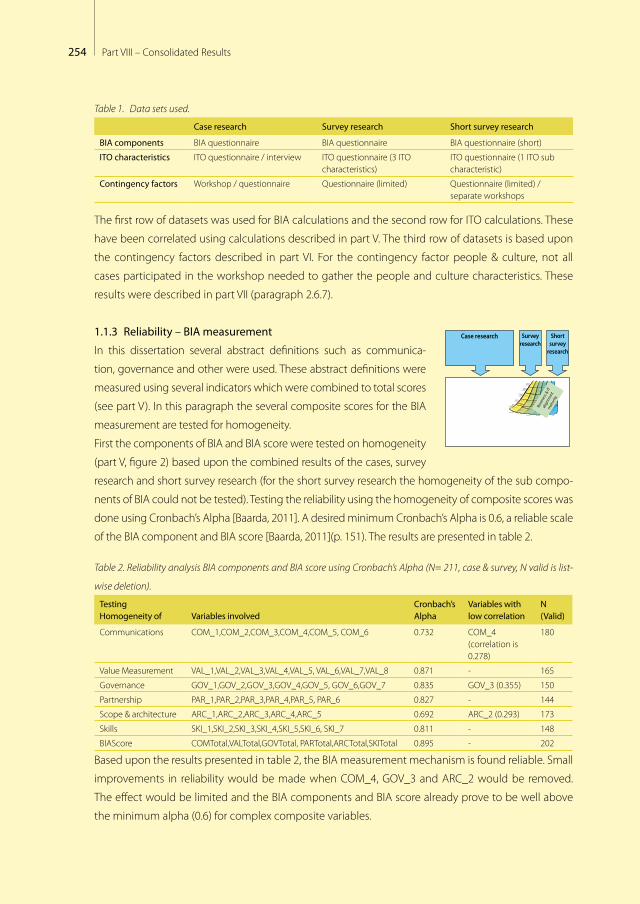
254 Part VIII – Consolidated Results
Table 1. Data sets used.
Case research Survey research Short survey research
BIA components BIA questionnaire BIA questionnaire BIA questionnaire (short)
ITO characteristics ITO questionnaire / interview ITO questionnaire (3 ITO characteristics)
ITO questionnaire (1 ITO sub characteristic)
Contingency factors Workshop / questionnaire Questionnaire (limited) Questionnaire (limited) / separate workshops
The first row of datasets was used for BIA calculations and the second row for ITO calculations. These
have been correlated using calculations described in part V. The third row of datasets is based upon
the contingency factors described in part VI. For the contingency factor people & culture, not all
cases participated in the workshop needed to gather the people and culture characteristics. These
results were described in part VII (paragraph 2.6.7).
1.1.3 Reliability – BIA measurement
In this dissertation several abstract definitions such as communica-
tion, governance and other were used. These abstract definitions were
measured using several indicators which were combined to total scores
(see part V). In this paragraph the several composite scores for the BIA
measurement are tested for homogeneity.
First the components of BIA and BIA score were tested on homogeneity
(part V, figure 2) based upon the combined results of the cases, survey
research and short survey research (for the short survey research the homogeneity of the sub compo-
nents of BIA could not be tested). Testing the reliability using the homogeneity of composite scores was
done using Cronbach’s Alpha [Baarda, 2011]. A desired minimum Cronbach’s Alpha is 0.6, a reliable scale
of the BIA component and BIA score [Baarda, 2011](p. 151). The results are presented in table 2.
Table 2. Reliability analysis BIA components and BIA score using Cronbach’s Alpha (N= 211, case & survey, N valid is list-
wise deletion).
Testing Homogeneity of Variables involved
Cronbach’s Alpha
Variables with low correlation
N (Valid)
Communications COM_1,COM_2,COM_3,COM_4,COM_5, COM_6 0.732 COM_4 (correlation is 0.278)
180
Value Measurement VAL_1,VAL_2,VAL_3,VAL_4,VAL_5, VAL_6,VAL_7,VAL_8 0.871 - 165
Governance GOV_1,GOV_2,GOV_3,GOV_4,GOV_5, GOV_6,GOV_7 0.835 GOV_3 (0.355) 150
Partnership PAR_1,PAR_2,PAR_3,PAR_4,PAR_5, PAR_6 0.827 - 144
Scope & architecture ARC_1,ARC_2,ARC_3,ARC_4,ARC_5 0.692 ARC_2 (0.293) 173
Skills SKI_1,SKI_2,SKI_3,SKI_4,SKI_5,SKI_6, SKI_7 0.811 - 148
BIAScore COMTotal,VALTotal,GOVTotal, PARTotal,ARCTotal,SKITotal 0.895 - 202
Based upon the results presented in table 2, the BIA measurement mechanism is found reliable. Small
improvements in reliability would be made when COM_4, GOV_3 and ARC_2 would be removed.
The effect would be limited and the BIA components and BIA score already prove to be well above
the minimum alpha (0.6) for complex composite variables.
Shortsurvey
research
Surveyresearch
Case research
Informalpervasive
Optimized processes
Improved, managed
processes
Esthablished,focuses
processes
Committedprocesses
Initial or ad hoc
processes
Bonding, uni�ed
Cost e�ective
Some partner-value;
Dashboard managed
Some cost
e�ectiveness; Dashboard
established
IT enables/drives business strategy
IT seen as an asset; Process driver;Con�ict seen as creative
Shared risk & rewards
Emerging value service provider;Balanced tech & business hiring
Relevant process
across the organization
Relevant process
across the organization
Good understanding;
Emerging relaxed
Limited business / IT understanding,
Business / IT lack understanding,
Functional cost e�ciency
Some technical measurements
No formal process,cost center, reactive
priorities
Con�ict; IT a cost of doing
business
Traditional (e.g., acctng, email)
IT takes risk, little reward;
Technical training
Tactical at Functional
level,occasional
responsive
IT emerging as an asset;
Process enabler
Transaction (e.g., ESS, DSS)
Di�ers across functional organizations
Integrated with partners
Integrated across the organization
Extende to external
partners
Integrated across the
org. & partners
Evolve with partners
IT-bunisness co-adaptive
Improvisation-al
Education/careers/rewards across the organization
Communication
ValueGovernance Partnership Scope &
architectureSkills
Busin
ess &
ITal
ignm
ent
mat
urity

2551 Introduction
The Cronbach’s alpha reliability test is a well used method for testing the reliability of measurement
[Baarda, 2011]. There is, however, a statistical better but very complex technique called the Item Re-
sponse Theory [Baarda, 2011], [Wuensch, 2012]. Although this technique would be better, the current
reliability analysis using Cronbach’s alpha showed already the reliability of the model. A first analysis
using the Item Response Theory (factor analysis – Principal Axis Factoring [Wuensch, 2012]) showed a
relatively high reliability as well. Therefore, this technique has not further been applied.
1.1.4 Reliability – ITO measurementThe Cronbach’s alpha reliability test is also used for the ITO measure-
ment (part V, chapter 4) using the combined results of case and sur-
vey research. The results are presented in table 3.
Table 3. Reliability analysis ITO characteristics and Degree ITO using
Cronbach’s Alpha (N= 211, case & survey).
Testing Homogeneity of Variables involved
Cronbach’s Alpha
Variables with low correlation
N (Valid)
SSTMTotal SS_2_TM1, SS_2_TM2,SS_2_TM3, SS_2_TM4 0.849 - 188
SSEUTotal SS_2_EU1, SS_2_EU2,SS_2_EU3, SS_2_EU4, SS_2_EU5 0.962 - 186
SSAMTotal SS_2_AM1, SS_2_AM2, SS_2_AM3, SS_2_AM4 0.851 - 185
SSFMTotal SS_2_FM1, SS_2_FM2, SS_2_FM3, SS_2_FM4, SS_2_FM5 0.878 - 185
DegreeITO SEXP_1, SSTMTotal, SSEUTotal, SSAMTotal, SSFMTotal 0.861 SSFMTotal (0.438)
185
SGOV SGOV_1, SGOV_2, SGOV_3, SGOV_4, SGOV_5, SGOV_6, SGOV_7, SGOV_8, SGOV_9, SGOV_10, SGOV_11
0.898 SGOV_1 (0.292) 28 (case only)
SEXPM SEXP_1_1,SEXP_1_2 0.452 SEXP_1_1 (0.342). SEXP_1_2 (0.342)
23
SCOCO SCOCO1, SCOCO2, SCOCO3, SCOCO4, SCOCO5, SCOCO6 0.838 SCOCO2 (0.402) 28
SCOSO SCOSO1, SCOSO2, SCOSO3, SCOSO4, SCOSO5 0.836 - 28
SCO SCOCO, SCOSO 0.72 - 28
SPR SPR1, SPR2 0.045 SPR1 (0.024). SPR2 (0.024)
28
ITOmaturity SGOV, SEXPM, SCO, SPR, SSLM 0.28 SGOV (0.002). SEXPM (0.2). SCO (0.203). SSLM (-.057)
28
Degree of ITO model is found to be reliable based upon Cronbach’s alpha calculation delivering a
relatively high alpha of 0.861 (minimum 0.6 [Baarda, 2011]). This score could be slightly improved by
removing the item SSFMTotal (Functional management). The result would be limited and the item
is important for measuring Degree ITO, therefore this item is not deleted. The measurement mecha-
nism of Degree of ITO is reliable.
The calculated variable ITO Experience maturity (SEXPM) existing of Start of outsourcing deal (first
Shortsurvey
research
Surveyresearch
Case research
IT outsourcingcharacteristics
Relationship Scopeorganizational
Transitionresult
Scopefunctional
Projectmanagement Single/Multi
vendorGovernanceExperience
Contract
SLM

256 Part VIII – Consolidated Results
deal and current deal) seems to be a poor item within the ITO maturity measurement mechanism
and should be excluded from further analysis. The total statistics of the variables provided a negative
average covariance among items. This violates assumptions about the reliability of the model with
regard to ITO maturity.
The calculated variable SPR (project management and steering committee) seem to be a poor item
within the maturity measurement of ITO. Statistics provided a negative average covariance among
items. This violates assumptions about the reliability of the model with regard to ITO maturity.
Redefined ITO maturity
Based upon the Cronbach’s alpha reliability measurement, the ITO maturity model should be rede-
fined. After deleting the poor items (SEXPM, SPR and SSLM) the ITO maturity exists of SGOV and SCO
(in total 22 sub characteristics of ITO). SCO is based upon SCOCO and SCOSO. The redefined reliabil-
ity analysis provided a still relatively poor Cronbach’s alpha of 0.578 (minimum should be 0.6 [Baarda,
2011]. Considering the number of cases (28), more data would be needed to test the reliability further
(the impact of single cases on the reliability is too high). Using the underlying items SCOCO and SCO-
SO (instead of the consolidated variable SCO) at the same level as SGOV (total of 22 variables) provided
a reliability of the model of 0.69 on Cronbach’s alpha. The redefined ITO maturity for the case research
is based upon SGOV, SCOCO and SCOSO. The new ITO maturity calculation is: ITOmaturityNEW =
MEAN (SGOV, SCOCO, SCOSO). The frequencies calculation of ITOmaturityNEW is presented in figure 2.
Figure 2. Frequency ITOmaturity NEW (n=28).
In this dissertation, during the analysis in this part, both the original calculation ITO maturity as the
redefined ITO maturity is used while the number of cases is limited.

2571 Introduction
1.2 Summary justification statistical interpretationIn this chapter the justification of the statistical interpretation was provided. The datasets are found
to be rich existing of case, survey and short survey research. In part V the measurement model used
was introduced. The reliability of this model was tested. Relatively high reliability, using Cronbach’s
alpha, was found on the major model elements BIA measurement and Degree ITO measurement.
ITO maturity proved to be not a reliable model providing an alpha of 0,28. Redefining the ITO matu-
rity measurement existing of SGOV, SCOCO and SCOSO provided an alpha of 0,69 being above the
minimum alpha for complex definitions. Considering the number of cases (28) with regard to ITO
maturity, more data would be needed to test the reliability further (the impact of single cases on the
reliability is too high).
In conclusion the measurement mechanism is found reliable for the main focus of this dissertation:
Does ITO (Degree ITO) influence the maturity level of Business & IT alignment. For measuring ITO ma-
turity more data would be necessary.

258 Part VIII – Consolidated Results

2592 Ranking of components for BIA
“If you’re doing where your heart lies and you just go for it, you will be happier”
Best advice received from Taco Dibbits (Director collections of the Rijksmuseum).
Source Intermediair
Ranking of components for BIAWithin the field research (case, survey, and short survey) the first re-
search question was: ‘what is the influence of the components identi-
fied for BIA?’. Within the case study this question was measured and
reported per organisation (Part VII, 2.2.3). For the survey and short sur-
vey research influence was calculated as well, but those are reported
at BIA component level (Part VII, 3.2.1 (survey) and 4.1. (short survey)).
The identified findings have been reported and the components or-
dered. In the paragraph below, first the sensitivity analysis was per-
formed. Secondly, the combined overview of the case, survey and short survey research is provided
followed by conclusions based upon the combined overview and findings made in part VII.
2.1 Statistically ranking BIA componentsFor statistically ranking the BIA components the stepwise multiple regression analysis was used [Baar-
da, 2011]. BIA score exists of six BIA components: communication, value measurement, governance,
partnership, scope & architecture and skills & competences. Performing the stepwise multiple regres-
sion provides insight in the prediction of the result (BIA score). The result is displayed in table 4.
Table 4. Model summary stepwise multiple regression analysis BIA components.
Model R R Square Adjusted R Square Std. Error of the Estimate
1 .842(a) .709 .708 .30978
2 .932(b) .869 .867 .20860
3 .959(c) .920 .918 .16372
4 .979(d) .958 .957 .11910
Shortsurvey
research
Surveyresearch
Case research
Informalpervasive
Optimized processes
Improved, managed
processes
Esthablished,focuses
processes
Committedprocesses
Initial or ad hoc
processes
Bonding, uni�ed
Cost e�ective
Some partner-value;
Dashboard managed
Some cost
e�ectiveness; Dashboard
established
IT enables/drives business strategy
IT seen as an asset; Process driver;Con�ict seen as creative
Shared risk & rewards
Emerging value service provider;Balanced tech & business hiring
Relevant process
across the organization
Relevant process
across the organization
Good understanding;
Emerging relaxed
Limited business / IT understanding,
Business / IT lack understanding,
Functional cost e�ciency
Some technical measurements
No formal process,cost center, reactive
priorities
Con�ict; IT a cost of doing
business
Traditional (e.g., acctng, email)
IT takes risk, little reward;
Technical training
Tactical at Functional
level,occasional
responsive
IT emerging as an asset;
Process enabler
Transaction (e.g., ESS, DSS)
Di�ers across functional organizations
Integrated with partners
Integrated across the organization
Extende to external
partners
Integrated across the
org. & partners
Evolve with partners
IT-bunisness co-adaptive
Improvisation-al
Education/careers/rewards across the organization
Communication
ValueGovernance Partnership Scope &
architectureSkills
Busin
ess &
ITal
ignm
ent
mat
urity
2

260 Part VIII – Consolidated Results
Model R R Square Adjusted R Square Std. Error of the Estimate
5 .990(e) .980 .979 .08247
6 1.000(f ) 1.000 1.000 .00000
a Predictors: (Constant), Communicationb Predictors: (Constant), Communication, Governancec Predictors: (Constant), Communication, Governance, Skills & competencesd Predictors: (Constant), Communication, Governance, Skills & competences, Architecturee Predictors: (Constant), Communication, Governance, Skills & competences, Architecture, Value measurementf Predictors: (Constant), Communication, Governance, Skills & competences, Architecture, Value measurement, Partnership
For predicting the BIA score a stepwise multiple regression analysis was performed. The BIA com-
ponent was first predicted using communications delivering a correlation of 0.842 (p < 0.01). In the
second step governance was added delivering a multiple correlation of 0.932 (p < 0.01). Adding the
other BIA components delivered further improvements.
2.2 Consolidated results and ranking of BIA componentsThe ranking of BIA components is displayed in table 5.
Table 5. Ranking BIA components (ordered on case research from high to low)
case surveyshort
survey
Mean (case, survey, short
survey)Mean all organi-
sations Std. Deviation
Mean Governance 2.70 2.71 2.61 2.67 2.69 0.76
Mean Architecture & Scope 2.66 2.67 2.59 2.64 2.65 0.72
Mean Partnership 2.59 2.52 2.59 2.57 2.56 0.77
Mean Communication 2.57 2.68 2.52 2.59 2.63 0.62
Score maturity BIA 2.51 2.52 2.61 2.55 2.54 0.56
Mean Skills & Competences 2.35 2.36 2.89 2.53 2.48 0.73
Mean Value Measurement 2.18 2.21 2.34 2.24 2.24 0.72
N (organisations) 28 183 62
Legend:
2 st.dev. Below mean
1 st.dev. Below mean
1 st.dev. Above mean
2 st. dev. Above mean
The BIA components of both the case and survey research are comparable. The short survey shows
a different result.
The sub BIA components were combined for both the case and survey research (short survey re-
search did not gather sub components data). This is displayed via ranking of BIA sub components in
table 6. In this table the results of the literature research (part III) with regard to the BIA measurement
approach are displayed as well (red = poor literature support, yellow is limited literature support).
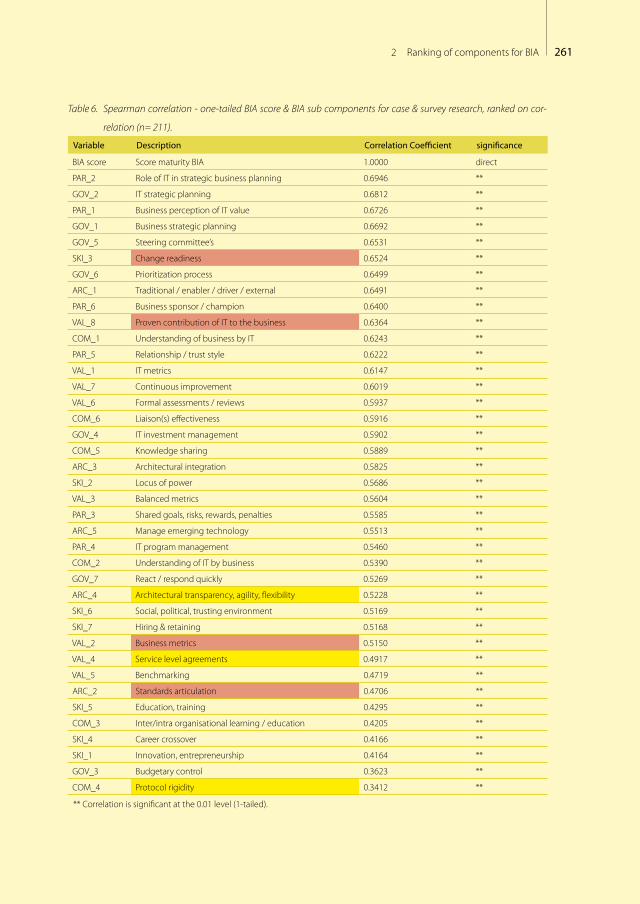
2612 Ranking of components for BIA
Table 6. Spearman correlation - one-tailed BIA score & BIA sub components for case & survey research, ranked on cor-
relation (n= 211).
Variable Description Correlation Coefficient significance
BIA score Score maturity BIA 1.0000 direct
PAR_2 Role of IT in strategic business planning 0.6946 **
GOV_2 IT strategic planning 0.6812 **
PAR_1 Business perception of IT value 0.6726 **
GOV_1 Business strategic planning 0.6692 **
GOV_5 Steering committee’s 0.6531 **
SKI_3 Change readiness 0.6524 **
GOV_6 Prioritization process 0.6499 **
ARC_1 Traditional / enabler / driver / external 0.6491 **
PAR_6 Business sponsor / champion 0.6400 **
VAL_8 Proven contribution of IT to the business 0.6364 **
COM_1 Understanding of business by IT 0.6243 **
PAR_5 Relationship / trust style 0.6222 **
VAL_1 IT metrics 0.6147 **
VAL_7 Continuous improvement 0.6019 **
VAL_6 Formal assessments / reviews 0.5937 **
COM_6 Liaison(s) effectiveness 0.5916 **
GOV_4 IT investment management 0.5902 **
COM_5 Knowledge sharing 0.5889 **
ARC_3 Architectural integration 0.5825 **
SKI_2 Locus of power 0.5686 **
VAL_3 Balanced metrics 0.5604 **
PAR_3 Shared goals, risks, rewards, penalties 0.5585 **
ARC_5 Manage emerging technology 0.5513 **
PAR_4 IT program management 0.5460 **
COM_2 Understanding of IT by business 0.5390 **
GOV_7 React / respond quickly 0.5269 **
ARC_4 Architectural transparency, agility, flexibility 0.5228 **
SKI_6 Social, political, trusting environment 0.5169 **
SKI_7 Hiring & retaining 0.5168 **
VAL_2 Business metrics 0.5150 **
VAL_4 Service level agreements 0.4917 **
VAL_5 Benchmarking 0.4719 **
ARC_2 Standards articulation 0.4706 **
SKI_5 Education, training 0.4295 **
COM_3 Inter/intra organisational learning / education 0.4205 **
SKI_4 Career crossover 0.4166 **
SKI_1 Innovation, entrepreneurship 0.4164 **
GOV_3 Budgetary control 0.3623 **
COM_4 Protocol rigidity 0.3412 **
** Correlation is significant at the 0.01 level (1-tailed).
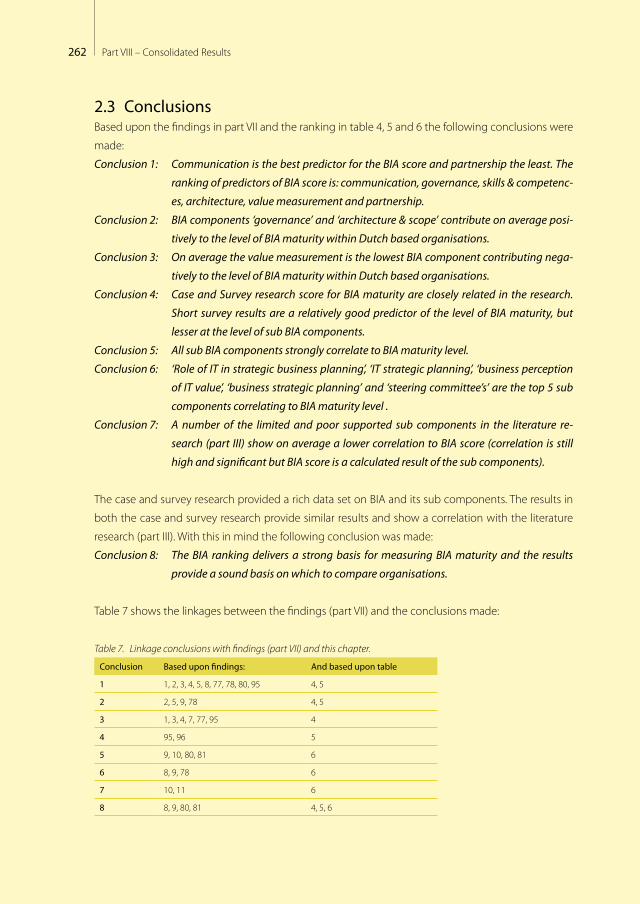
262 Part VIII – Consolidated Results
2.3 ConclusionsBased upon the findings in part VII and the ranking in table 4, 5 and 6 the following conclusions were
made:
Conclusion 1: Communication is the best predictor for the BIA score and partnership the least. The
ranking of predictors of BIA score is: communication, governance, skills & competenc-
es, architecture, value measurement and partnership.
Conclusion 2: BIA components ‘governance’ and ‘architecture & scope’ contribute on average posi-
tively to the level of BIA maturity within Dutch based organisations.
Conclusion 3: On average the value measurement is the lowest BIA component contributing nega-
tively to the level of BIA maturity within Dutch based organisations.
Conclusion 4: Case and Survey research score for BIA maturity are closely related in the research.
Short survey results are a relatively good predictor of the level of BIA maturity, but
lesser at the level of sub BIA components.
Conclusion 5: All sub BIA components strongly correlate to BIA maturity level.
Conclusion 6: ‘Role of IT in strategic business planning’, ‘IT strategic planning’, ‘business perception
of IT value’, ‘business strategic planning’ and ‘steering committee’s’ are the top 5 sub
components correlating to BIA maturity level .
Conclusion 7: A number of the limited and poor supported sub components in the literature re-
search (part III) show on average a lower correlation to BIA score (correlation is still
high and significant but BIA score is a calculated result of the sub components).
The case and survey research provided a rich data set on BIA and its sub components. The results in
both the case and survey research provide similar results and show a correlation with the literature
research (part III). With this in mind the following conclusion was made:
Conclusion 8: The BIA ranking delivers a strong basis for measuring BIA maturity and the results
provide a sound basis on which to compare organisations.
Table 7 shows the linkages between the findings (part VII) and the conclusions made:
Table 7. Linkage conclusions with findings (part VII) and this chapter.
Conclusion Based upon findings: And based upon table
1 1, 2, 3, 4, 5, 8, 77, 78, 80, 95 4, 5
2 2, 5, 9, 78 4, 5
3 1, 3, 4, 7, 77, 95 4
4 95, 96 5
5 9, 10, 80, 81 6
6 8, 9, 78 6
7 10, 11 6
8 8, 9, 80, 81 4, 5, 6
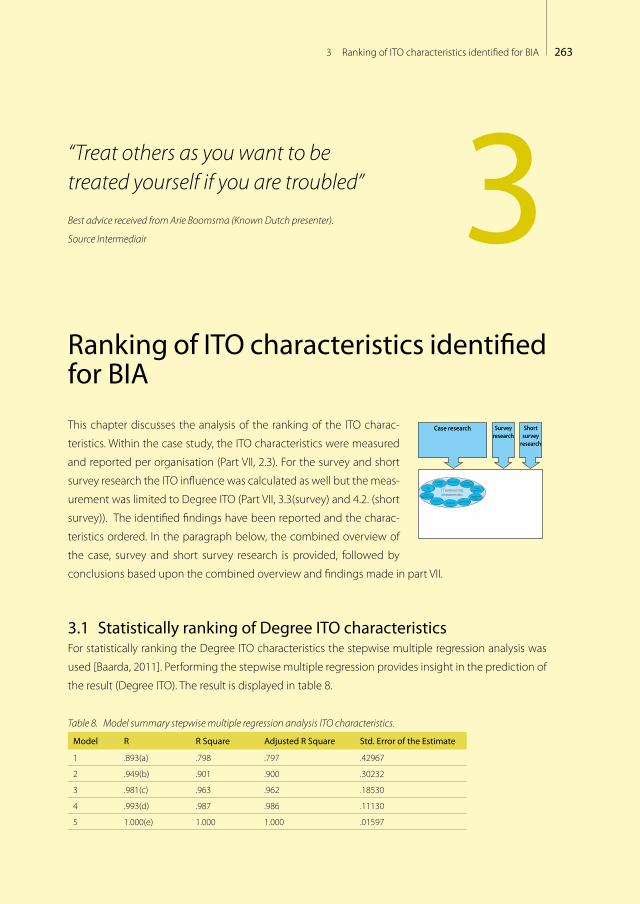
2633 Ranking of ITO characteristics identified for BIA
“Treat others as you want to be treated yourself if you are troubled”
Best advice received from Arie Boomsma (Known Dutch presenter).
Source Intermediair
Ranking of ITO characteristics identified for BIA
This chapter discusses the analysis of the ranking of the ITO charac-
teristics. Within the case study, the ITO characteristics were measured
and reported per organisation (Part VII, 2.3). For the survey and short
survey research the ITO influence was calculated as well but the meas-
urement was limited to Degree ITO (Part VII, 3.3(survey) and 4.2. (short
survey)). The identified findings have been reported and the charac-
teristics ordered. In the paragraph below, the combined overview of
the case, survey and short survey research is provided, followed by
conclusions based upon the combined overview and findings made in part VII.
3.1 Statistically ranking of Degree ITO characteristicsFor statistically ranking the Degree ITO characteristics the stepwise multiple regression analysis was
used [Baarda, 2011]. Performing the stepwise multiple regression provides insight in the prediction of
the result (Degree ITO). The result is displayed in table 8.
Table 8. Model summary stepwise multiple regression analysis ITO characteristics.
Model R R Square Adjusted R Square Std. Error of the Estimate
1 .893(a) .798 .797 .42967
2 .949(b) .901 .900 .30232
3 .981(c) .963 .962 .18530
4 .993(d) .987 .986 .11130
5 1.000(e) 1.000 1.000 .01597
Shortsurvey
research
Surveyresearch
Case research
IT outsourcingcharacteristics
Relationship Scopeorganizational
Transitionresult
Scopefunctional
Projectmanagement Single/Multi
vendorGovernanceExperience
Contract
SLM
3
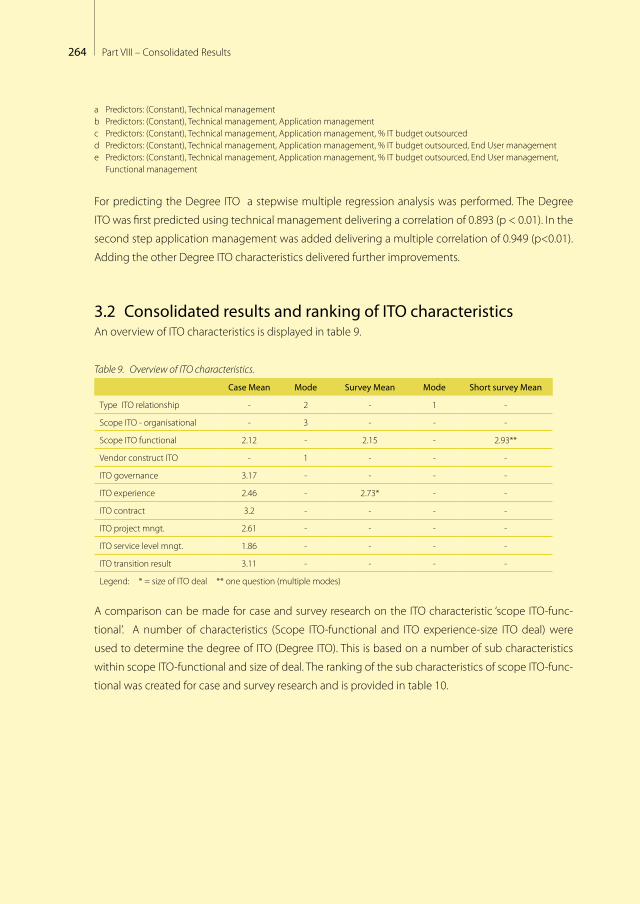
264 Part VIII – Consolidated Results
a Predictors: (Constant), Technical managementb Predictors: (Constant), Technical management, Application managementc Predictors: (Constant), Technical management, Application management, % IT budget outsourcedd Predictors: (Constant), Technical management, Application management, % IT budget outsourced, End User managemente Predictors: (Constant), Technical management, Application management, % IT budget outsourced, End User management,
Functional management
For predicting the Degree ITO a stepwise multiple regression analysis was performed. The Degree
ITO was first predicted using technical management delivering a correlation of 0.893 (p < 0.01). In the
second step application management was added delivering a multiple correlation of 0.949 (p<0.01).
Adding the other Degree ITO characteristics delivered further improvements.
3.2 Consolidated results and ranking of ITO characteristicsAn overview of ITO characteristics is displayed in table 9.
Table 9. Overview of ITO characteristics.
Case Mean Mode Survey Mean Mode Short survey Mean
Type ITO relationship - 2 - 1 -
Scope ITO - organisational - 3 - - -
Scope ITO functional 2.12 - 2.15 - 2.93**
Vendor construct ITO - 1 - - -
ITO governance 3.17 - - - -
ITO experience 2.46 - 2.73* - -
ITO contract 3.2 - - - -
ITO project mngt. 2.61 - - - -
ITO service level mngt. 1.86 - - - -
ITO transition result 3.11 - - - -
Legend: * = size of ITO deal ** one question (multiple modes)
A comparison can be made for case and survey research on the ITO characteristic ‘scope ITO-func-
tional’. A number of characteristics (Scope ITO-functional and ITO experience-size ITO deal) were
used to determine the degree of ITO (Degree ITO). This is based on a number of sub characteristics
within scope ITO-functional and size of deal. The ranking of the sub characteristics of scope ITO-func-
tional was created for case and survey research and is provided in table 10.
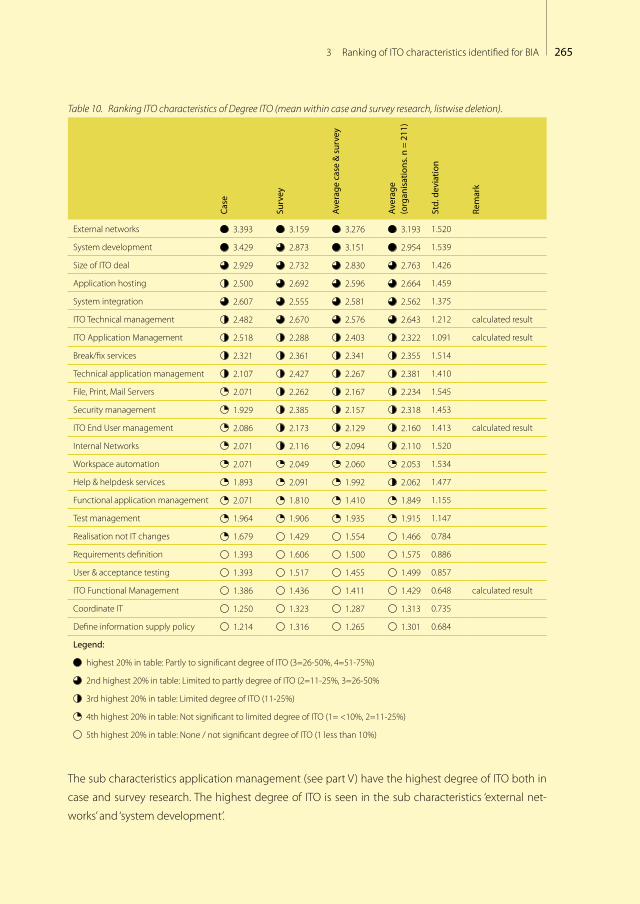
2653 Ranking of ITO characteristics identified for BIA
Table 10. Ranking ITO characteristics of Degree ITO (mean within case and survey research, listwise deletion).
Case
Surv
ey
Aver
age
case
& s
urve
y
Aver
age
(o
rgan
isat
ions
. n =
211
)
Std.
dev
iatio
n
Rem
ark
External networks 3.393 3.159 3.276 3.193 1.520
System development 3.429 2.873 3.151 2.954 1.539
Size of ITO deal 2.929 2.732 2.830 2.763 1.426
Application hosting 2.500 2.692 2.596 2.664 1.459
System integration 2.607 2.555 2.581 2.562 1.375
ITO Technical management 2.482 2.670 2.576 2.643 1.212 calculated result
ITO Application Management 2.518 2.288 2.403 2.322 1.091 calculated result
Break/fix services 2.321 2.361 2.341 2.355 1.514
Technical application management 2.107 2.427 2.267 2.381 1.410
File, Print, Mail Servers 2.071 2.262 2.167 2.234 1.545
Security management 1.929 2.385 2.157 2.318 1.453
ITO End User management 2.086 2.173 2.129 2.160 1.413 calculated result
Internal Networks 2.071 2.116 2.094 2.110 1.520
Workspace automation 2.071 2.049 2.060 2.053 1.534
Help & helpdesk services 1.893 2.091 1.992 2.062 1.477
Functional application management 2.071 1.810 1.410 1.849 1.155
Test management 1.964 1.906 1.935 1.915 1.147
Realisation not IT changes 1.679 1.429 1.554 1.466 0.784
Requirements definition 1.393 1.606 1.500 1.575 0.886
User & acceptance testing 1.393 1.517 1.455 1.499 0.857
ITO Functional Management 1.386 1.436 1.411 1.429 0.648 calculated result
Coordinate IT 1.250 1.323 1.287 1.313 0.735
Define information supply policy 1.214 1.316 1.265 1.301 0.684
Legend:
highest 20% in table: Partly to significant degree of ITO (3=26-50%, 4=51-75%)
2nd highest 20% in table: Limited to partly degree of ITO (2=11-25%, 3=26-50%
3rd highest 20% in table: Limited degree of ITO (11-25%)
4th highest 20% in table: Not significant to limited degree of ITO (1= <10%, 2=11-25%)
5th highest 20% in table: None / not significant degree of ITO (1 less than 10%)
The sub characteristics application management (see part V) have the highest degree of ITO both in
case and survey research. The highest degree of ITO is seen in the sub characteristics ‘external net-
works’ and ‘system development’.
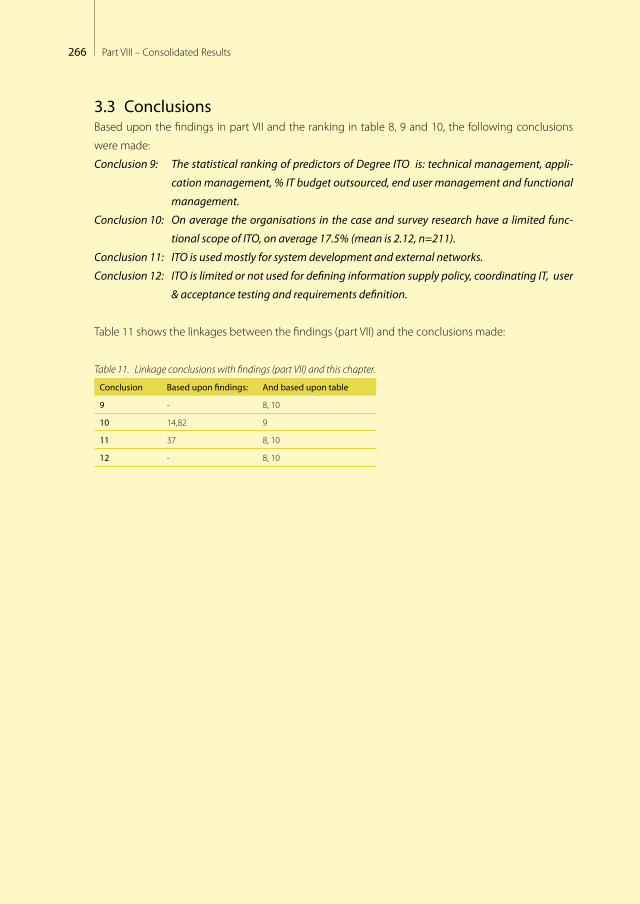
266 Part VIII – Consolidated Results
3.3 ConclusionsBased upon the findings in part VII and the ranking in table 8, 9 and 10, the following conclusions
were made:
Conclusion 9: The statistical ranking of predictors of Degree ITO is: technical management, appli-
cation management, % IT budget outsourced, end user management and functional
management.
Conclusion 10: On average the organisations in the case and survey research have a limited func-
tional scope of ITO, on average 17.5% (mean is 2.12, n=211).
Conclusion 11: ITO is used mostly for system development and external networks.
Conclusion 12: ITO is limited or not used for defining information supply policy, coordinating IT, user
& acceptance testing and requirements definition.
Table 11 shows the linkages between the findings (part VII) and the conclusions made:
Table 11. Linkage conclusions with findings (part VII) and this chapter.
Conclusion Based upon findings: And based upon table
9 - 8, 10
10 14,82 9
11 37 8, 10
12 - 8, 10

2674 Displaying organisations on maturity level of BIAS
“Consider first what you want to say, then you know immediately what you can delete combined with a good view, well reading and then you see the richness of thought, of images, of references, of meanings”
Best advice received from Stine Jensen (Philosopher, literature scientist and writer).
Source Intermediair
Displaying organisations on maturity level of BIASThis chapter displays the organisations researched on the maturity
level of BIAS. Within the case study and survey research, the level of
BIAS was measured and reported per organisation (Part VII, 2.4 and
3.4) . For the short survey research, the level of BIAS was calculated
also (Part VII, 4.3). The identified findings have been reported. In the
paragraph below, the combined overview of the case, survey and
short survey research is provided, followed by conclusions based
upon the combined overview and findings made in part VII.
4.1 Ordering on BIAS maturityThe ordering on BIAS maturity per organisation is described in part VII (2.4). The combined ordering
per organisation for the case, survey and short survey organisations is displayed in figure 3.
Shortsurvey
research
Surveyresearch
Case research
Informalpervasive
Optimized processes
Improved, managed
processes
Esthablished,focuses
processes
Committedprocesses
Initial or ad hoc
processes
Bonding, uni�ed
Cost e�ective
Some partner-value;
Dashboard managed
Some cost
e�ectiveness; Dashboard
established
IT enables/drives business strategy
IT seen as an asset; Process driver;Con�ict seen as creative
Shared risk & rewards
Emerging value service provider;Balanced tech & business hiring
Relevant process
across the organization
Relevant process
across the organization
Good understanding;
Emerging relaxed
Limited business / IT understanding,
Business / IT lack understanding,
Functional cost e�ciency
Some technical measurements
No formal process,cost center, reactive
priorities
Con�ict; IT a cost of doing
business
Traditional (e.g., acctng, email)
IT takes risk, little reward;
Technical training
Tactical at Functional
level,occasional
responsive
IT emerging as an asset;
Process enabler
Transaction (e.g., ESS, DSS)
Di�ers across functional organizations
Integrated with partners
Integrated across the organization
Extende to external
partners
Integrated across the
org. & partners
Evolve with partners
IT-bunisness co-adaptive
Improvisation-al
Education/careers/rewards across the organization
Communication
ValueGovernance Partnership Scope &
architectureSkills
Busin
ess &
ITal
ignm
ent
mat
urityIT outsourcing
characteristics in�uenceScope
functional
Experience
Busin
ess &
ITal
ignm
ent
mat
urity
Busin
ess &
ITal
ignm
ent
mat
urity
1.57
Degree ofITO
Deg
ree
ITO
4
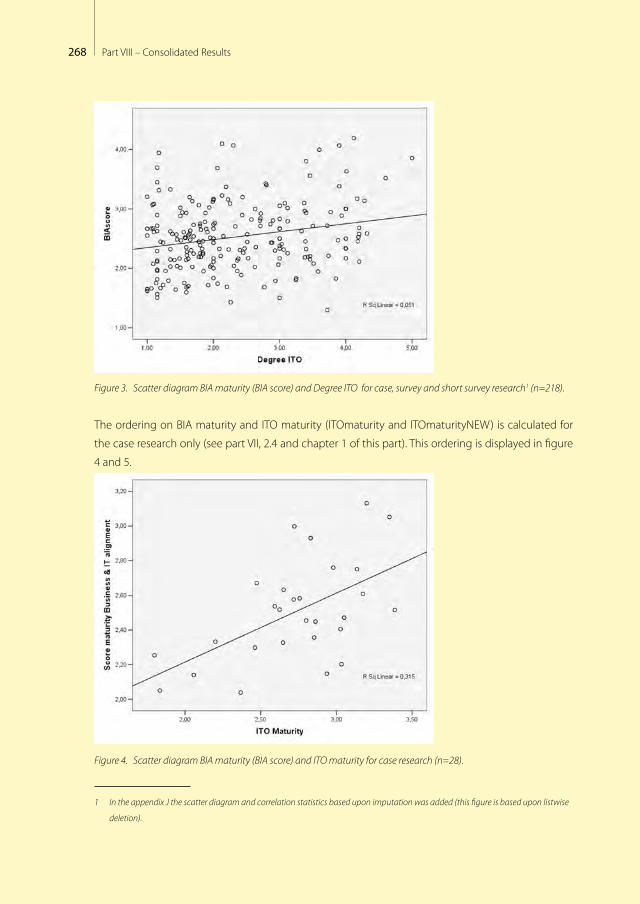
268 Part VIII – Consolidated Results
Figure 3. Scatter diagram BIA maturity (BIA score) and Degree ITO for case, survey and short survey research1 (n=218).
The ordering on BIA maturity and ITO maturity (ITOmaturity and ITOmaturityNEW) is calculated for
the case research only (see part VII, 2.4 and chapter 1 of this part). This ordering is displayed in figure
4 and 5.
Figure 4. Scatter diagram BIA maturity (BIA score) and ITO maturity for case research (n=28).
1 In the appendix J the scatter diagram and correlation statistics based upon imputation was added (this figure is based upon listwise
deletion).
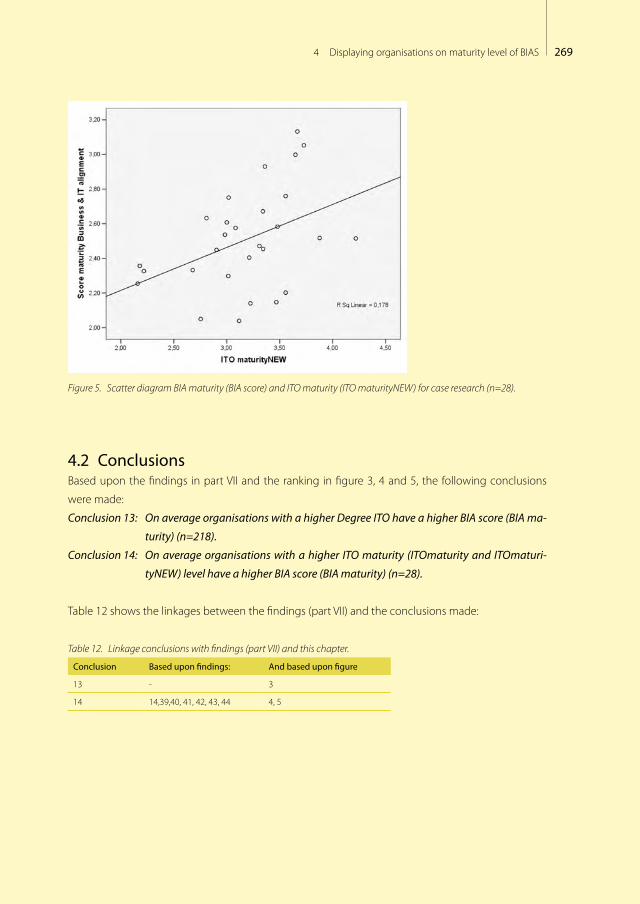
2694 Displaying organisations on maturity level of BIAS
Figure 5. Scatter diagram BIA maturity (BIA score) and ITO maturity (ITO maturityNEW) for case research (n=28).
4.2 ConclusionsBased upon the findings in part VII and the ranking in figure 3, 4 and 5, the following conclusions
were made:
Conclusion 13: On average organisations with a higher Degree ITO have a higher BIA score (BIA ma-
turity) (n=218).
Conclusion 14: On average organisations with a higher ITO maturity (ITOmaturity and ITOmaturi-
tyNEW) level have a higher BIA score (BIA maturity) (n=28).
Table 12 shows the linkages between the findings (part VII) and the conclusions made:
Table 12. Linkage conclusions with findings (part VII) and this chapter.
Conclusion Based upon findings: And based upon figure
13 - 3
14 14,39,40, 41, 42, 43, 44 4, 5

270 Part VIII – Consolidated Results

2715 Similarities and differences in influence of ITO on BIA
“Can you do something about it? Don’t worry about it”
Best advice received from Eugenie van Wiechen (CEO Linkedin).
Source Intermediair
Similarities and differences in influence of ITO on BIAThis chapter discusses the similarities and differences in influence of
ITO on BIA using correlations and remarkable results from part VII.
5.1 Similarities and differences The ITO impact on BIA is measured via case, survey and short survey
research. Both similarities and differences were seen. In table 13 the
similarities and differences are presented for ITO influence on BIA ma-
turity (BIA score).
Table 13. Similarities and differences ITO influence (Degree ITO) on BIA maturity (BIA score).
Aspect Case, n=28 Survey, n=169 Short survey, n=14 Similarities / differences
Correlation BIA score and Degree ITO
r=-0.104; Sig.=0.300 1-tailed
r=0.272 Sig.=0.000 1-tailed
Rs=0.088 Sig.=0.383 1-tailed
The ITO influence on BIA is not significantly negative in the case research. At the survey the result is significant and positive.
BIA score & Degree ITO from business perspective
r=-0.145; Sig.=0.230 1-tailed
r=0.349 Sig.=0.002 1-tailed
r=-0.302 Sig.=0.255 1-tailed
The ITO influence on BIA is not significantly negative in case and short survey research. At the survey research the correlation is significant and positive.
BIA score & Degree ITO from IT perspective
r=-0.086 Sig.=0.332 1-tailed
r=0.192 Sig.=0.012 1-tailed
r=0.392 Sig.=0.083 1-tailed
In case, survey and short survey a positive correlation was found between BIA score and Degree ITO from IT perspective. Only the correlation of the survey research was significant.
Shortsurvey
research
Surveyresearch
Case research
Informalpervasive
Optimized processes
Improved, managed
processes
Esthablished,focuses
processes
Committedprocesses
Initial or ad hoc
processes
Bonding, uni�ed
Cost e�ective
Some partner-value;
Dashboard managed
Some cost
e�ectiveness; Dashboard
established
IT enables/drives business strategy
IT seen as an asset; Process driver;Con�ict seen as creative
Shared risk & rewards
Emerging value service provider;Balanced tech & business hiring
Relevant process
across the organization
Relevant process
across the organization
Good understanding;
Emerging relaxed
Limited business / IT understanding,
Business / IT lack understanding,
Functional cost e�ciency
Some technical measurements
No formal process,cost center, reactive
priorities
Con�ict; IT a cost of doing
business
Traditional (e.g., acctng, email)
IT takes risk, little reward;
Technical training
Tactical at Functional
level,occasional
responsive
IT emerging as an asset;
Process enabler
Transaction (e.g., ESS, DSS)
Di�ers across functional organizations
Integrated with partners
Integrated across the organization
Extende to external
partners
Integrated across the
org. & partners
Evolve with partners
IT-bunisness co-adaptive
Improvisation-al
Education/careers/rewards across the organization
Communication
ValueGovernance Partnership Scope &
architectureSkills
Busin
ess &
ITal
ignm
ent
mat
urityIT outsourcing
characteristics in�uence
Relationship Scopeorganizational
Transitionresult
Scopefunctional
Projectmanagement Single/Multi
vendorGovernanceExperience
Contract
SLM
1.57
2.62
Degree ofITO
ITOmaturity
Businessperspective Business
perspective
ITperspective
ITperspective Business
perspective
ITperspective
5

272 Part VIII – Consolidated Results
Aspect Case, n=28 Survey, n=169 Short survey, n=14 Similarities / differences
Strong significant correlation BIA score & Degree ITO -, sub characteristics of functional scope1
System develop-ment (negative)User & acceptance testing (negative)
Break/fix services. workspace automation. help & service desk (all positive)
n.a. Within the case research, the sub characteristics ‘system development ’and ‘user & acceptance testing’ showed a negative correlation between Degree ITO and BIA score. These sub characteristics showed a lesser significant but still positive correlation within the survey research. A strong positive correlation between Degree ITO and BIA score was found for ‘break/fix services’, ‘workspace automation’ and ‘help & service desk’ within the survey research. Within the case research, no significance correlation was found for these sub characteristics.
Correlating ITO maturity & BIA score
r=0.561 Sig.=0.001 1-tailed
n.a. n.a.. A strong positive correlation was found between BIA maturity and ITO maturity within the case research
Combining the results of the case, survey and short survey results delivers an overall correlation as
shown in table 14.
Table 14. Spearman’s rho correlation BIA score and Degree ITO, case, survey and short survey research (n=218)
BIAscore Degree ITO
BIAscore Correlation Coefficient 1.000 .227**
Sig. (1-tailed) . .000
Degree ITO Correlation Coefficient .227** 1.000
Sig. (1-tailed) .000 .
a. Listwise N=218
Table 14 shows a small, but significant positive influence of Degree ITO on BIA score (Rs = 0.227;
Sig.0.000; 1-tailed; n = 218).
5.2 Conclusions Differences between the case, survey and short survey results were found. The case research showed
overall a non significant negative influence of Degree ITO on BIA score whereas the survey and short
survey results showed a significant positive influence from Degree ITO on BIA score. Based upon the
findings in part VII and the ranking in table 3 and 4, the following conclusions were made:
Conclusion 15: There is a small but significant positive influence of Degree ITO on BIA score. The hy-
pothesis that ITO has a negative impact on BIA is rejected.
2 For survey research the top 3 is mentioned
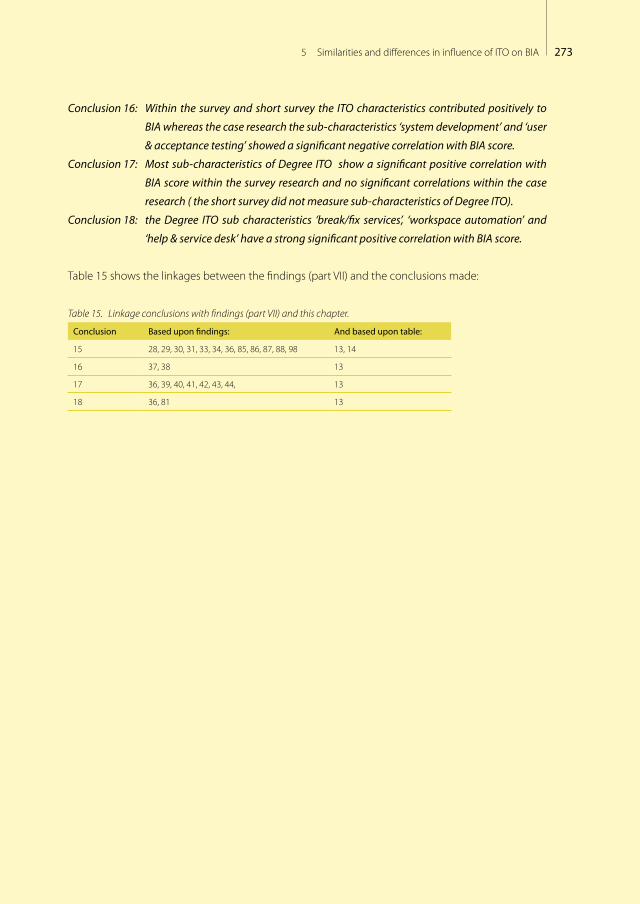
2735 Similarities and differences in influence of ITO on BIA
Conclusion 16: Within the survey and short survey the ITO characteristics contributed positively to
BIA whereas the case research the sub-characteristics ‘system development’ and ‘user
& acceptance testing’ showed a significant negative correlation with BIA score.
Conclusion 17: Most sub-characteristics of Degree ITO show a significant positive correlation with
BIA score within the survey research and no significant correlations within the case
research ( the short survey did not measure sub-characteristics of Degree ITO).
Conclusion 18: the Degree ITO sub characteristics ‘break/fix services’, ‘workspace automation’ and
‘help & service desk’ have a strong significant positive correlation with BIA score.
Table 15 shows the linkages between the findings (part VII) and the conclusions made:
Table 15. Linkage conclusions with findings (part VII) and this chapter.
Conclusion Based upon findings: And based upon table:
15 28, 29, 30, 31, 33, 34, 36, 85, 86, 87, 88, 98 13, 14
16 37, 38 13
17 36, 39, 40, 41, 42, 43, 44, 13
18 36, 81 13

274 Part VIII – Consolidated Results
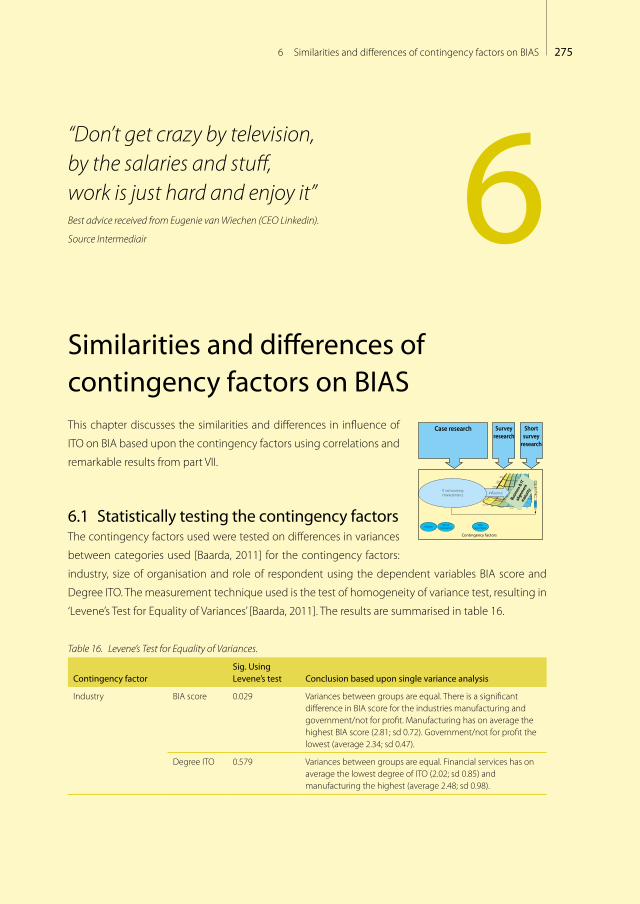
2756 Similarities and differences of contingency factors on BIAS
“Don’t get crazy by television, by the salaries and stuff, work is just hard and enjoy it” Best advice received from Eugenie van Wiechen (CEO Linkedin).
Source Intermediair
Similarities and differences of contingency factors on BIASThis chapter discusses the similarities and differences in influence of
ITO on BIA based upon the contingency factors using correlations and
remarkable results from part VII.
6.1 Statistically testing the contingency factorsThe contingency factors used were tested on differences in variances
between categories used [Baarda, 2011] for the contingency factors:
industry, size of organisation and role of respondent using the dependent variables BIA score and
Degree ITO. The measurement technique used is the test of homogeneity of variance test, resulting in
‘Levene’s Test for Equality of Variances’ [Baarda, 2011]. The results are summarised in table 16.
Table 16. Levene’s Test for Equality of Variances.
Contingency factorSig. Using Levene’s test Conclusion based upon single variance analysis
Industry BIA score 0.029 Variances between groups are equal. There is a significant difference in BIA score for the industries manufacturing and government/not for profit. Manufacturing has on average the highest BIA score (2.81; sd 0.72). Government/not for profit the lowest (average 2.34; sd 0.47).
Degree ITO 0.579 Variances between groups are equal. Financial services has on average the lowest degree of ITO (2.02; sd 0.85) and manufacturing the highest (average 2.48; sd 0.98).
Shortsurvey
research
Surveyresearch
Case research
Contingency factors
Informalpervasive
Optimized processes
Improved, managed
processes
Esthablished,focuses
processes
Committedprocesses
Initial or ad hoc
processes
Bonding, uni�ed
Cost e�ective
Some partner-value;
Dashboard managed
Some cost
e�ectiveness; Dashboard
established
IT enables/drives business strategy
IT seen as an asset; Process driver;Con�ict seen as creative
Shared risk & rewards
Emerging value service provider;Balanced tech & business hiring
Relevant process
across the organization
Relevant process
across the organization
Good understanding;
Emerging relaxed
Limited business / IT understanding,
Business / IT lack understanding,
Functional cost e�ciency
Some technical measurements
No formal process,cost center, reactive
priorities
Con�ict; IT a cost of doing
business
Traditional (e.g., acctng, email)
IT takes risk, little reward;
Technical training
Tactical at Functional
level,occasional
responsive
IT emerging as an asset;
Process enabler
Transaction (e.g., ESS, DSS)
Di�ers across functional organizations
Integrated with partners
Integrated across the organization
Extende to external
partners
Integrated across the
org. & partners
Evolve with partners
IT-bunisness co-adaptive
Improvisation-al
Education/careers/rewards across the organization
Communication
ValueGovernance Partnership Scope &
architectureSkills
Busin
ess &
ITal
ignm
ent
mat
urityIT outsourcing
characteristics in�uence
Busin
ess &
ITal
ignm
ent
mat
urity
1.57
Degree ofITO
Deg
ree
ITO
Industry Size of organisation
Rolerespondent
6
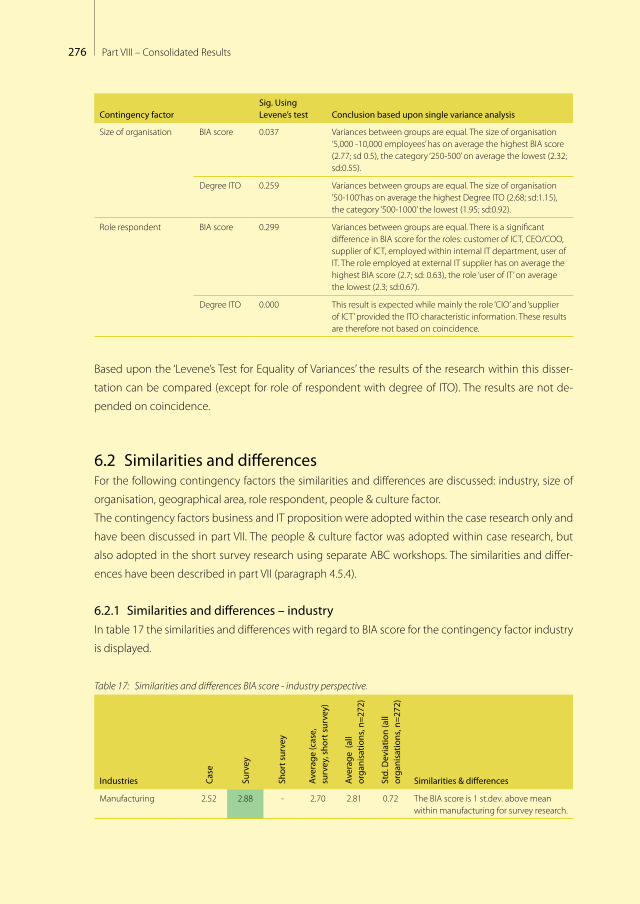
276 Part VIII – Consolidated Results
Contingency factorSig. Using Levene’s test Conclusion based upon single variance analysis
Size of organisation BIA score 0.037 Variances between groups are equal. The size of organisation ‘5,000 -10,000 employees’ has on average the highest BIA score (2.77; sd 0.5), the category ‘250-500’ on average the lowest (2.32; sd:0.55).
Degree ITO 0.259 Variances between groups are equal. The size of organisation ’50-100’has on average the highest Degree ITO (2.68; sd:1.15), the category ‘500-1000’ the lowest (1.95; sd:0.92).
Role respondent BIA score 0.299 Variances between groups are equal. There is a significant difference in BIA score for the roles: customer of ICT, CEO/COO, supplier of ICT, employed within internal IT department, user of IT. The role employed at external IT supplier has on average the highest BIA score (2.7; sd: 0.63), the role ‘user of IT’ on average the lowest (2.3; sd:0.67).
Degree ITO 0.000 This result is expected while mainly the role ‘CIO’ and ‘supplier of ICT’ provided the ITO characteristic information. These results are therefore not based on coincidence.
Based upon the ‘Levene’s Test for Equality of Variances’ the results of the research within this disser-
tation can be compared (except for role of respondent with degree of ITO). The results are not de-
pended on coincidence.
6.2 Similarities and differences For the following contingency factors the similarities and differences are discussed: industry, size of
organisation, geographical area, role respondent, people & culture factor.
The contingency factors business and IT proposition were adopted within the case research only and
have been discussed in part VII. The people & culture factor was adopted within case research, but
also adopted in the short survey research using separate ABC workshops. The similarities and differ-
ences have been described in part VII (paragraph 4.5.4).
6.2.1 Similarities and differences – industryIn table 17 the similarities and differences with regard to BIA score for the contingency factor industry
is displayed.
Table 17: Similarities and differences BIA score - industry perspective.
Industries Case
Surv
ey
Shor
t sur
vey
Aver
age
(cas
e,
surv
ey, s
hort
sur
vey)
Aver
age
(all
orga
nisa
tions
, n=2
72)
Std.
Dev
iatio
n (a
ll or
gani
satio
ns, n
=272
)
Similarities & differences
Manufacturing 2.52 2.88 - 2.70 2.81 0.72 The BIA score is 1 st.dev. above mean within manufacturing for survey research.

2776 Similarities and differences of contingency factors on BIAS
Industries Case
Surv
ey
Shor
t sur
vey
Aver
age
(cas
e,
surv
ey, s
hort
sur
vey)
Aver
age
(all
orga
nisa
tions
, n=2
72)
Std.
Dev
iatio
n (a
ll or
gani
satio
ns, n
=272
)
Similarities & differences
Financial services 2.71 2.73 - 2.72 2.73 0.55 The results for financial services are comparable.
Government / not for profit
2.47 2.31 2.59 2.46 2.44 0.53 The BIA score is 1 st. dev. below mean within government / not for profit (in case research mainly larger organisations, in short survey mainly education).
Logistics 3.05 2.43 - 2.74 2.49 0.58 The BIA score is 2st. dev. above mean in case research (1 case).
Professional services 2.61 2.60 2.54 2.58 2.60 0.66 The results for professional services are comparable.
Housing corporation 2.35 2.50 2.67 2.51 2.54 0.41 The BIA score is 1st.dev. below mean in case research.
Legend:
2 st.dev. Below mean
1 st.dev. Below mean
1 st.dev. Above mean
2 st. dev. Above mean
In table 18 the similarities and differences with regard to Degree ITO for the contingency factor indus-
try is displayed (legend is same as in table 17).
Table 18. Similarities and differences Degree ITO - industry perspective.
Industries Case
Surv
ey
Shor
t sur
vey
Aver
age
(cas
e,
surv
ey, s
hort
sur
vey)
Aver
age
(all
orga
nisa
tions
, n=2
18)
Std.
Dev
iatio
n (a
ll or
gani
satio
ns, n
=218
)
Similarities & differences
Manufacturing 2.41 2.50 - 2.46 2.48 0.98 The degree of ITO is similar within case and survey research.
Financial services 1.94 2.05 - 2.00 2.02 0.85 The degree of ITO is similar within case and survey research.
Government / not for profit
2.43 2.11 3.17 2.57 2.27 1.04 Within the case research the average degree of ITO is higher.
Logistics 3.00 1.94 - 2.47 2.06 0.99 Within the case research the average degree of ITO is higher.
Professional services 1.55 2.29 3.50 2.45 2.29 1.00 Within the short survey the degree of ITO is higher and within case research lower.
Housing corporation 2.30 2.35 2.86 2.46 2.40 0.90 Within the short survey the degree ofITO is higher.
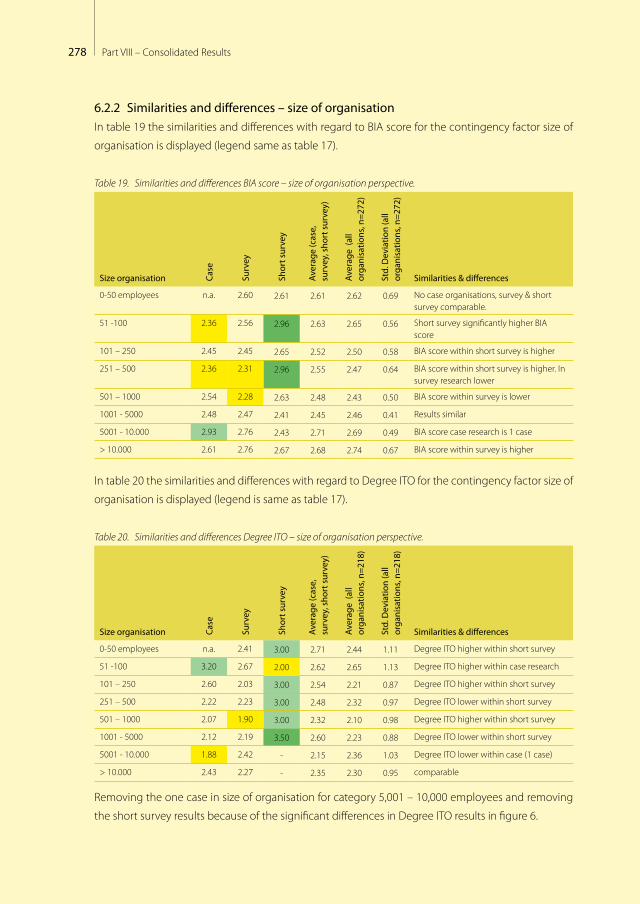
278 Part VIII – Consolidated Results
6.2.2 Similarities and differences – size of organisationIn table 19 the similarities and differences with regard to BIA score for the contingency factor size of
organisation is displayed (legend same as table 17).
Table 19. Similarities and differences BIA score – size of organisation perspective.
Size organisation Case
Surv
ey
Shor
t sur
vey
Aver
age
(cas
e,
surv
ey, s
hort
sur
vey)
Aver
age
(all
orga
nisa
tions
, n=2
72)
Std.
Dev
iatio
n (a
ll or
gani
satio
ns, n
=272
)
Similarities & differences
0-50 employees n.a. 2.60 2.61 2.61 2.62 0.69 No case organisations, survey & short survey comparable.
51 -100 2.36 2.56 2.96 2.63 2.65 0.56 Short survey significantly higher BIA score
101 – 250 2.45 2.45 2.65 2.52 2.50 0.58 BIA score within short survey is higher
251 – 500 2.36 2.31 2.96 2.55 2.47 0.64 BIA score within short survey is higher. In survey research lower
501 – 1000 2.54 2.28 2.63 2.48 2.43 0.50 BIA score within survey is lower
1001 - 5000 2.48 2.47 2.41 2.45 2.46 0.41 Results similar
5001 - 10.000 2.93 2.76 2.43 2.71 2.69 0.49 BIA score case research is 1 case
> 10.000 2.61 2.76 2.67 2.68 2.74 0.67 BIA score within survey is higher
In table 20 the similarities and differences with regard to Degree ITO for the contingency factor size of
organisation is displayed (legend is same as table 17).
Table 20. Similarities and differences Degree ITO – size of organisation perspective.
Size organisation Case
Surv
ey
Shor
t sur
vey
Aver
age
(cas
e,
surv
ey, s
hort
sur
vey)
Aver
age
(all
orga
nisa
tions
, n=2
18)
Std.
Dev
iatio
n (a
ll or
gani
satio
ns, n
=218
)
Similarities & differences
0-50 employees n.a. 2.41 3.00 2.71 2.44 1.11 Degree ITO higher within short survey
51 -100 3.20 2.67 2.00 2.62 2.65 1.13 Degree ITO higher within case research
101 – 250 2.60 2.03 3.00 2.54 2.21 0.87 Degree ITO higher within short survey
251 – 500 2.22 2.23 3.00 2.48 2.32 0.97 Degree ITO lower within short survey
501 – 1000 2.07 1.90 3.00 2.32 2.10 0.98 Degree ITO higher within short survey
1001 - 5000 2.12 2.19 3.50 2.60 2.23 0.88 Degree ITO lower within short survey
5001 - 10.000 1.88 2.42 - 2.15 2.36 1.03 Degree ITO lower within case (1 case)
> 10.000 2.43 2.27 - 2.35 2.30 0.95 comparable
Removing the one case in size of organisation for category 5,001 – 10,000 employees and removing
the short survey results because of the significant differences in Degree ITO results in figure 6.
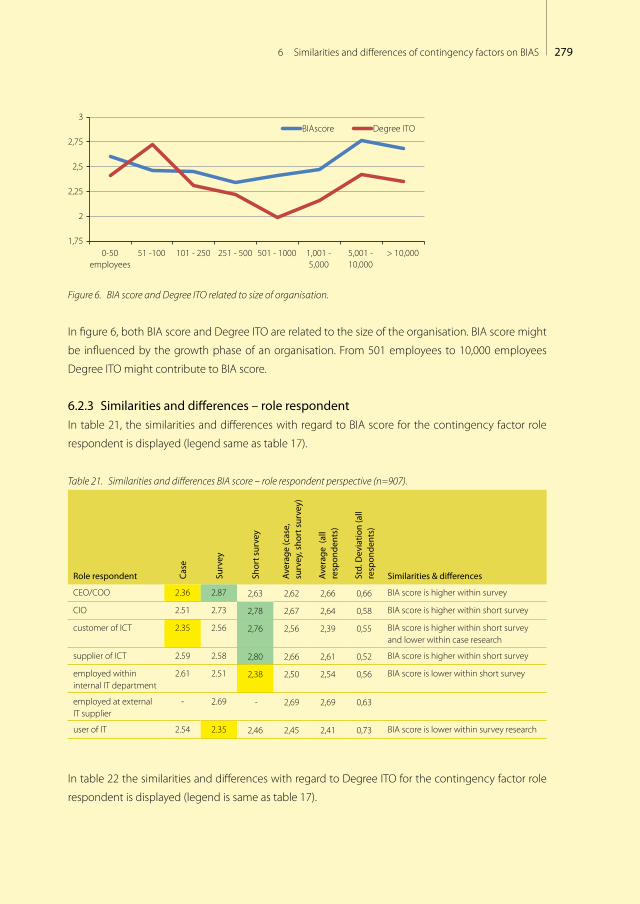
2796 Similarities and differences of contingency factors on BIAS
1,75
2
2,25
2,5
2,75
3
0-50employees
51 -100 101 - 250 251 - 500 501 - 1000 1,001 -5,000
5,001 -10,000
> 10,000
BIAscore Degree ITO
Figure 6. BIA score and Degree ITO related to size of organisation.
In figure 6, both BIA score and Degree ITO are related to the size of the organisation. BIA score might
be influenced by the growth phase of an organisation. From 501 employees to 10,000 employees
Degree ITO might contribute to BIA score.
6.2.3 Similarities and differences – role respondentIn table 21, the similarities and differences with regard to BIA score for the contingency factor role
respondent is displayed (legend same as table 17).
Table 21. Similarities and differences BIA score – role respondent perspective (n=907).
Role respondent Case
Surv
ey
Shor
t sur
vey
Aver
age
(cas
e,
surv
ey, s
hort
sur
vey)
Aver
age
(all
resp
onde
nts)
Std.
Dev
iatio
n (a
ll re
spon
dent
s)
Similarities & differences
CEO/COO 2.36 2.87 2,63 2,62 2,66 0,66 BIA score is higher within survey
CIO 2.51 2.73 2,78 2,67 2,64 0,58 BIA score is higher within short survey
customer of ICT 2.35 2.56 2,76 2,56 2,39 0,55 BIA score is higher within short survey and lower within case research
supplier of ICT 2.59 2.58 2,80 2,66 2,61 0,52 BIA score is higher within short survey
employed within internal IT department
2.61 2.51 2,38 2,50 2,54 0,56 BIA score is lower within short survey
employed at external IT supplier
- 2.69 - 2,69 2,69 0,63
user of IT 2.54 2.35 2,46 2,45 2,41 0,73 BIA score is lower within survey research
In table 22 the similarities and differences with regard to Degree ITO for the contingency factor role
respondent is displayed (legend is same as table 17).
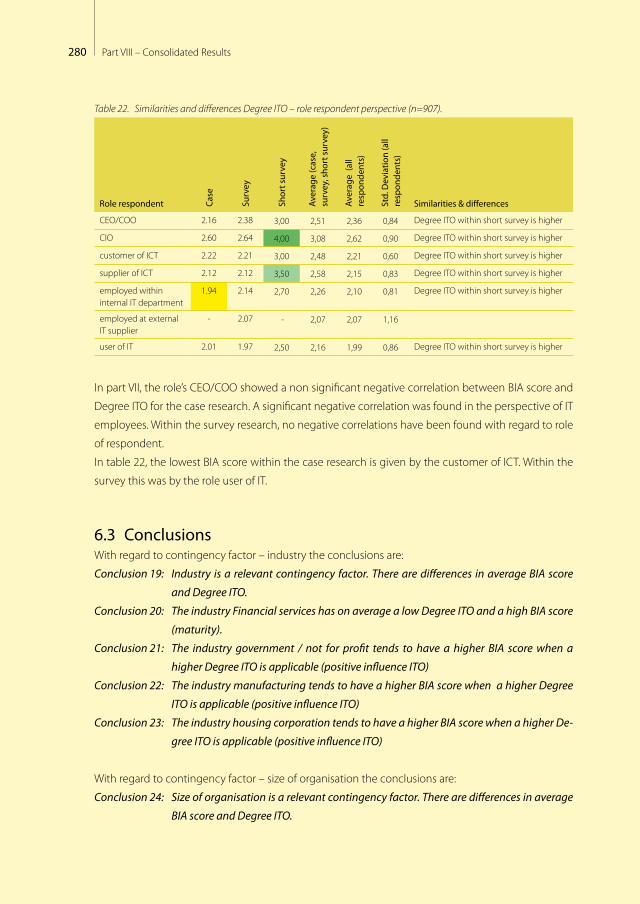
280 Part VIII – Consolidated Results
Table 22. Similarities and differences Degree ITO – role respondent perspective (n=907).
Role respondent Case
Surv
ey
Shor
t sur
vey
Aver
age
(cas
e,
surv
ey, s
hort
sur
vey)
Aver
age
(all
resp
onde
nts)
Std.
Dev
iatio
n (a
ll re
spon
dent
s)
Similarities & differences
CEO/COO 2.16 2.38 3,00 2,51 2,36 0,84 Degree ITO within short survey is higher
CIO 2.60 2.64 4,00 3,08 2,62 0,90 Degree ITO within short survey is higher
customer of ICT 2.22 2.21 3,00 2,48 2,21 0,60 Degree ITO within short survey is higher
supplier of ICT 2.12 2.12 3,50 2,58 2,15 0,83 Degree ITO within short survey is higher
employed within internal IT department
1.94 2.14 2,70 2,26 2,10 0,81 Degree ITO within short survey is higher
employed at external IT supplier
- 2.07 - 2,07 2,07 1,16
user of IT 2.01 1.97 2,50 2,16 1,99 0,86 Degree ITO within short survey is higher
In part VII, the role’s CEO/COO showed a non significant negative correlation between BIA score and
Degree ITO for the case research. A significant negative correlation was found in the perspective of IT
employees. Within the survey research, no negative correlations have been found with regard to role
of respondent.
In table 22, the lowest BIA score within the case research is given by the customer of ICT. Within the
survey this was by the role user of IT.
6.3 Conclusions With regard to contingency factor – industry the conclusions are:
Conclusion 19: Industry is a relevant contingency factor. There are differences in average BIA score
and Degree ITO.
Conclusion 20: The industry Financial services has on average a low Degree ITO and a high BIA score
(maturity).
Conclusion 21: The industry government / not for profit tends to have a higher BIA score when a
higher Degree ITO is applicable (positive influence ITO)
Conclusion 22: The industry manufacturing tends to have a higher BIA score when a higher Degree
ITO is applicable (positive influence ITO)
Conclusion 23: The industry housing corporation tends to have a higher BIA score when a higher De-
gree ITO is applicable (positive influence ITO)
With regard to contingency factor – size of organisation the conclusions are:
Conclusion 24: Size of organisation is a relevant contingency factor. There are differences in average
BIA score and Degree ITO.
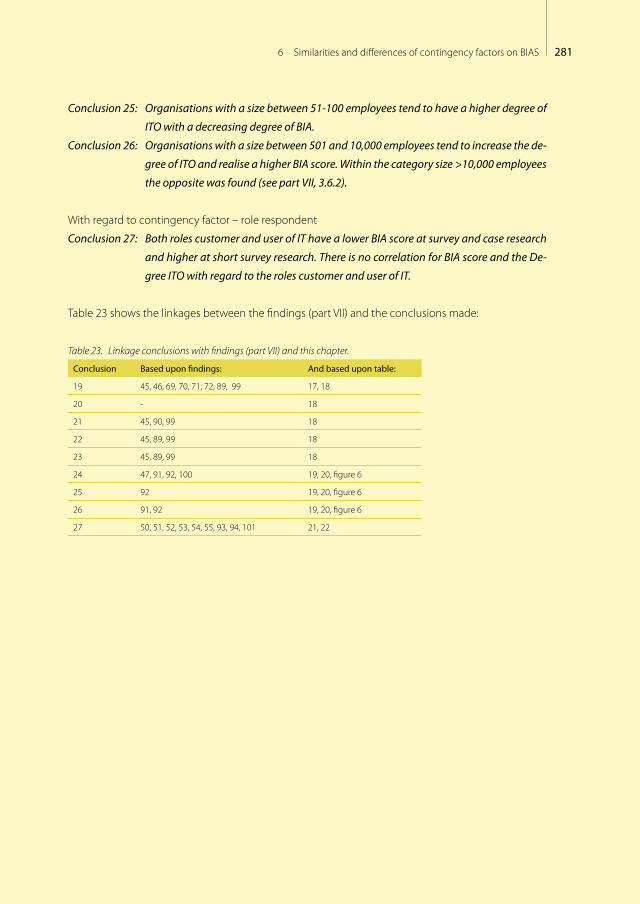
2816 Similarities and differences of contingency factors on BIAS
Conclusion 25: Organisations with a size between 51-100 employees tend to have a higher degree of
ITO with a decreasing degree of BIA.
Conclusion 26: Organisations with a size between 501 and 10,000 employees tend to increase the de-
gree of ITO and realise a higher BIA score. Within the category size >10,000 employees
the opposite was found (see part VII, 3.6.2).
With regard to contingency factor – role respondent
Conclusion 27: Both roles customer and user of IT have a lower BIA score at survey and case research
and higher at short survey research. There is no correlation for BIA score and the De-
gree ITO with regard to the roles customer and user of IT.
Table 23 shows the linkages between the findings (part VII) and the conclusions made:
Table 23. Linkage conclusions with findings (part VII) and this chapter.
Conclusion Based upon findings: And based upon table:
19 45, 46, 69, 70, 71, 72, 89, 99 17, 18
20 - 18
21 45, 90, 99 18
22 45, 89, 99 18
23 45, 89, 99 18
24 47, 91, 92, 100 19, 20, figure 6
25 92 19, 20, figure 6
26 91, 92 19, 20, figure 6
27 50, 51, 52, 53, 54, 55, 93, 94, 101 21, 22

282 Part VIII – Consolidated Results
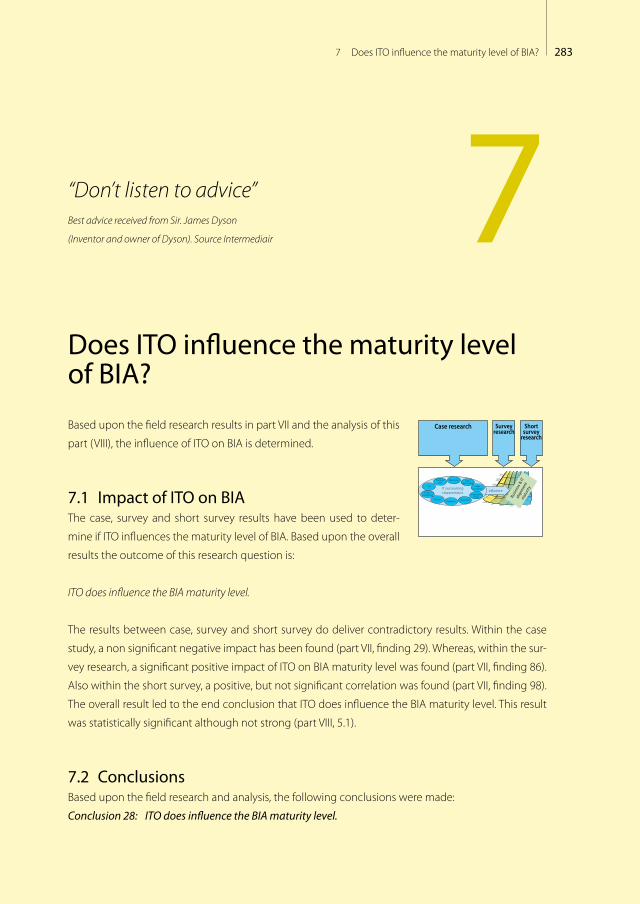
2837 Does ITO influence the maturity level of BIA?
“Don’t listen to advice” Best advice received from Sir. James Dyson
(Inventor and owner of Dyson). Source Intermediair
Does ITO influence the maturity level of BIA?
Based upon the field research results in part VII and the analysis of this
part (VIII), the influence of ITO on BIA is determined.
7.1 Impact of ITO on BIAThe case, survey and short survey results have been used to deter-
mine if ITO influences the maturity level of BIA. Based upon the overall
results the outcome of this research question is:
ITO does influence the BIA maturity level.
The results between case, survey and short survey do deliver contradictory results. Within the case
study, a non significant negative impact has been found (part VII, finding 29). Whereas, within the sur-
vey research, a significant positive impact of ITO on BIA maturity level was found (part VII, finding 86).
Also within the short survey, a positive, but not significant correlation was found (part VII, finding 98).
The overall result led to the end conclusion that ITO does influence the BIA maturity level. This result
was statistically significant although not strong (part VIII, 5.1).
7.2 ConclusionsBased upon the field research and analysis, the following conclusions were made:
Conclusion 28: ITO does influence the BIA maturity level.
Shortsurvey
research
Surveyresearch
Case research
Informalpervasive
Optimized processes
Improved, managed
processes
Esthablished,focuses
processes
Committedprocesses
Initial or ad hoc
processes
Bonding, uni�ed
Cost e�ective
Some partner-value;
Dashboard managed
Some cost
e�ectiveness; Dashboard
established
IT enables/drives business strategy
IT seen as an asset; Process driver;Con�ict seen as creative
Shared risk & rewards
Emerging value service provider;Balanced tech & business hiring
Relevant process
across the organization
Relevant process
across the organization
Good understanding;
Emerging relaxed
Limited business / IT understanding,
Business / IT lack understanding,
Functional cost e�ciency
Some technical measurements
No formal process,cost center, reactive
priorities
Con�ict; IT a cost of doing
business
Traditional (e.g., acctng, email)
IT takes risk, little reward;
Technical training
Tactical at Functional
level,occasional
responsive
IT emerging as an asset;
Process enabler
Transaction (e.g., ESS, DSS)
Di�ers across functional organizations
Integrated with partners
Integrated across the organization
Extende to external
partners
Integrated across the
org. & partners
Evolve with partners
IT-bunisness co-adaptive
Improvisation-al
Education/careers/rewards across the organization
Communication
ValueGovernance Partnership Scope &
architectureSkills
Busin
ess &
ITal
ignm
ent
mat
urityIT outsourcing
characteristics in�uence
Relationship Scopeorganizational
Transitionresult
Scopefunctional
Projectmanagement Single/Multi
vendorGovernanceExperience
Contract
SLM
7
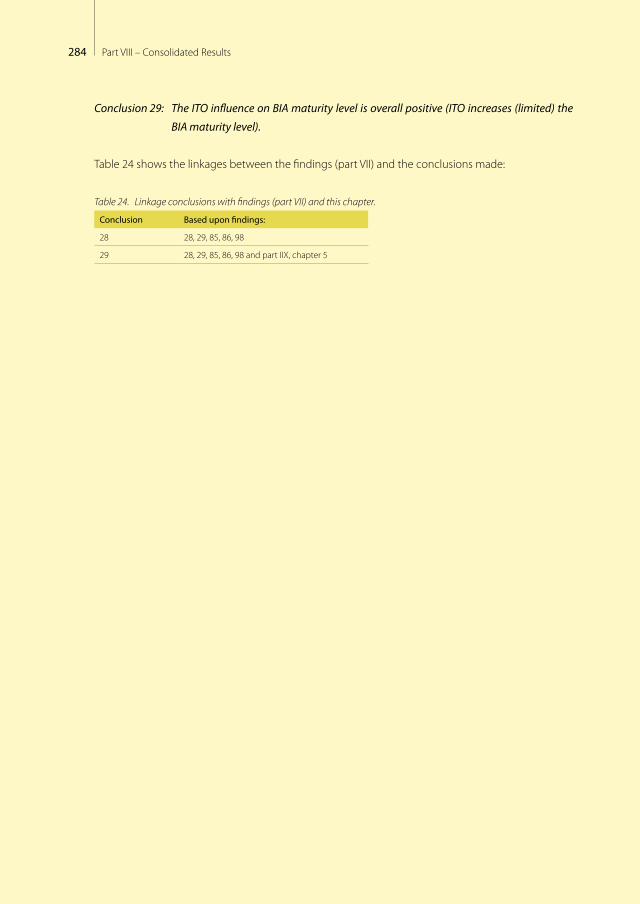
284 Part VIII – Consolidated Results
Conclusion 29: The ITO influence on BIA maturity level is overall positive (ITO increases (limited) the
BIA maturity level).
Table 24 shows the linkages between the findings (part VII) and the conclusions made:
Table 24. Linkage conclusions with findings (part VII) and this chapter.
Conclusion Based upon findings:
28 28, 29, 85, 86, 98
29 28, 29, 85, 86, 98 and part IIX, chapter 5
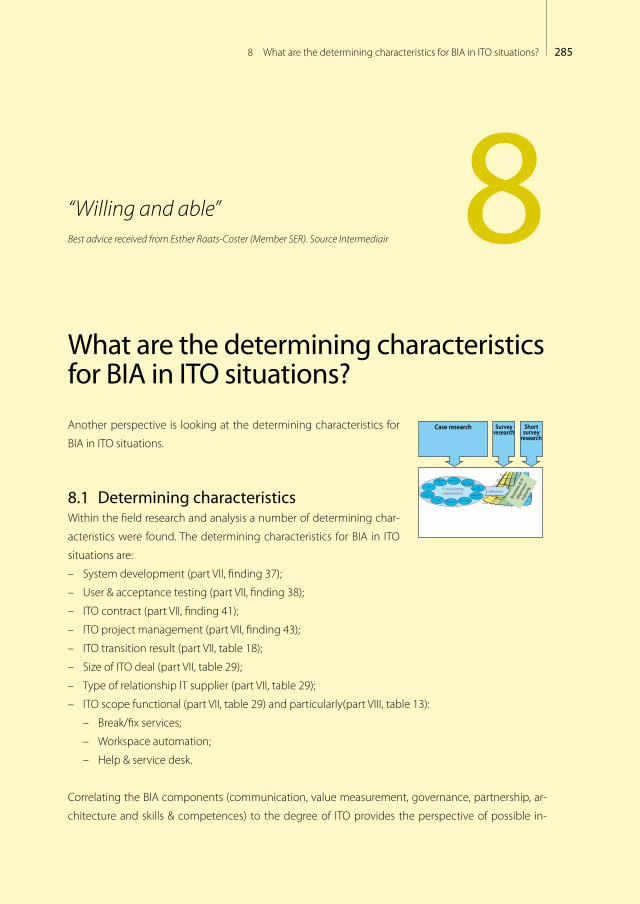
2858 What are the determining characteristics for BIA in ITO situations?
“Willing and able” Best advice received from Esther Raats-Coster (Member SER). Source Intermediair
What are the determining characteristics for BIA in ITO situations?
Another perspective is looking at the determining characteristics for
BIA in ITO situations.
8.1 Determining characteristicsWithin the field research and analysis a number of determining char-
acteristics were found. The determining characteristics for BIA in ITO
situations are:
– System development (part VII, finding 37);
– User & acceptance testing (part VII, finding 38);
– ITO contract (part VII, finding 41);
– ITO project management (part VII, finding 43);
– ITO transition result (part VII, table 18);
– Size of ITO deal (part VII, table 29);
– Type of relationship IT supplier (part VII, table 29);
– ITO scope functional (part VII, table 29) and particularly(part VIII, table 13):
– Break/fix services;
– Workspace automation;
– Help & service desk.
Correlating the BIA components (communication, value measurement, governance, partnership, ar-
chitecture and skills & competences) to the degree of ITO provides the perspective of possible in-
Shortsurvey
research
Surveyresearch
Case research
Informalpervasive
Optimized processes
Improved, managed
processes
Esthablished,focuses
processes
Committedprocesses
Initial or ad hoc
processes
Bonding, uni�ed
Cost e�ective
Some partner-value;
Dashboard managed
Some cost
e�ectiveness; Dashboard
established
IT enables/drives business strategy
IT seen as an asset; Process driver;Con�ict seen as creative
Shared risk & rewards
Emerging value service provider;Balanced tech & business hiring
Relevant process
across the organization
Relevant process
across the organization
Good understanding;
Emerging relaxed
Limited business / IT understanding,
Business / IT lack understanding,
Functional cost e�ciency
Some technical measurements
No formal process,cost center, reactive
priorities
Con�ict; IT a cost of doing
business
Traditional (e.g., acctng, email)
IT takes risk, little reward;
Technical training
Tactical at Functional
level,occasional
responsive
IT emerging as an asset;
Process enabler
Transaction (e.g., ESS, DSS)
Di�ers across functional organizations
Integrated with partners
Integrated across the organization
Extende to external
partners
Integrated across the
org. & partners
Evolve with partners
IT-bunisness co-adaptive
Improvisation-al
Education/careers/rewards across the organization
Communication
ValueGovernance Partnership Scope &
architectureSkills
Busin
ess &
ITal
ignm
ent
mat
urityIT outsourcing
characteristics in�uence
Relationship Scopeorganizational
Transitionresult
Scopefunctional
Projectmanagement Single/Multi
vendorGovernanceExperience
Contract
SLM
8
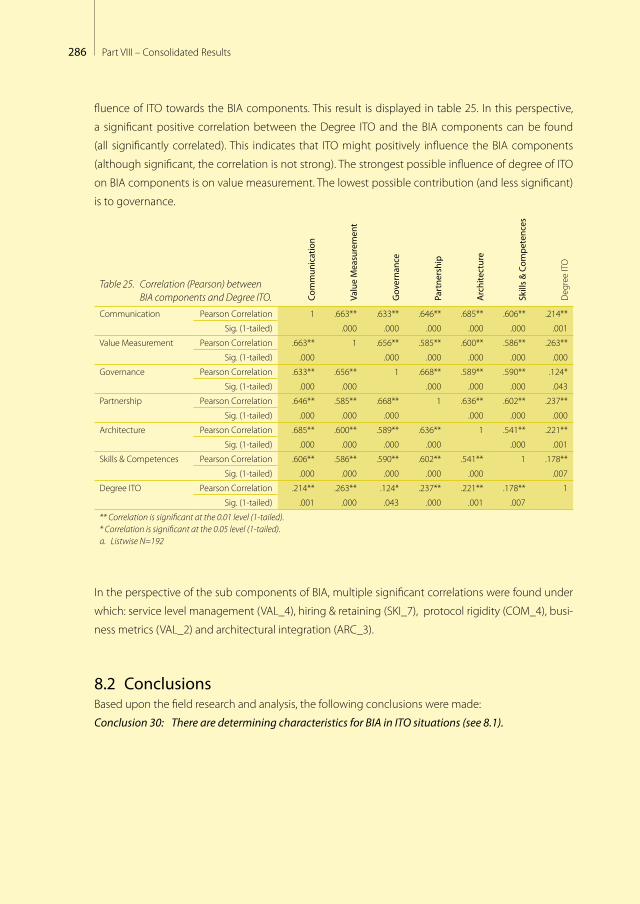
286 Part VIII – Consolidated Results
fluence of ITO towards the BIA components. This result is displayed in table 25. In this perspective,
a significant positive correlation between the Degree ITO and the BIA components can be found
(all significantly correlated). This indicates that ITO might positively influence the BIA components
(although significant, the correlation is not strong). The strongest possible influence of degree of ITO
on BIA components is on value measurement. The lowest possible contribution (and less significant)
is to governance.
Table 25. Correlation (Pearson) between BIA components and Degree ITO. Co
mm
unic
atio
n
Valu
e M
easu
rem
ent
Gov
erna
nce
Part
ners
hip
Arc
hite
ctur
e
Skill
s &
Com
pete
nces
Deg
ree
ITO
Communication Pearson Correlation 1 .663** .633** .646** .685** .606** .214**
Sig. (1-tailed) .000 .000 .000 .000 .000 .001
Value Measurement Pearson Correlation .663** 1 .656** .585** .600** .586** .263**
Sig. (1-tailed) .000 .000 .000 .000 .000 .000
Governance Pearson Correlation .633** .656** 1 .668** .589** .590** .124*
Sig. (1-tailed) .000 .000 .000 .000 .000 .043
Partnership Pearson Correlation .646** .585** .668** 1 .636** .602** .237**
Sig. (1-tailed) .000 .000 .000 .000 .000 .000
Architecture Pearson Correlation .685** .600** .589** .636** 1 .541** .221**
Sig. (1-tailed) .000 .000 .000 .000 .000 .001
Skills & Competences Pearson Correlation .606** .586** .590** .602** .541** 1 .178**
Sig. (1-tailed) .000 .000 .000 .000 .000 .007
Degree ITO Pearson Correlation .214** .263** .124* .237** .221** .178** 1
Sig. (1-tailed) .001 .000 .043 .000 .001 .007
** Correlation is significant at the 0.01 level (1-tailed).* Correlation is significant at the 0.05 level (1-tailed).a. Listwise N=192
In the perspective of the sub components of BIA, multiple significant correlations were found under
which: service level management (VAL_4), hiring & retaining (SKI_7), protocol rigidity (COM_4), busi-
ness metrics (VAL_2) and architectural integration (ARC_3).
8.2 ConclusionsBased upon the field research and analysis, the following conclusions were made:
Conclusion 30: There are determining characteristics for BIA in ITO situations (see 8.1).

2878 What are the determining characteristics for BIA in ITO situations?
Conclusion 31: ITO can positively influence BIA components (in order of influence: value measurement,
architecture, partnership, communication, skills & competences and governance).
Table 26 shows the linkages between the findings (part VII) and the conclusions made:
Table 26. Linkage conclusions with findings (part VII) and this chapter.
Conclusion Based upon findings: And based upon table:
30 39, 40, 41, 42, 43, 44, 81, 85 25
31 39, 40, 41, 42, 43, 44, 81 25

288 Part VIII – Consolidated Results

2899 Are there contingency factors which influence BIAS?
“Leave every networking party with 15 business cards”
Best advice received from Esther Raats-Coster (Member SER). Source Intermediair
Are there contingency factors which influence BIAS?
In this chapter the influence of the contingency factors is discussed.
9.1 Impact of contingency factorsThe case, survey and short survey results have been used to deter-
mine if there are contingency factors that influence the BIAS meas-
urement. Based upon the overall findings the result of this research
question is:
Yes, in the case study an influence of the contingency factors: ‘industry’, ‘role respondent’, ‘business proposi-
tion’, ‘IT proposition’ and ‘people & culture’ was found.
Yes, in the survey research an influence of the contingency factors: ‘industry’, ‘size of organisation’ and ‘role
respondent’ was found.
Yes, in the short survey research an influence of the contingency factors: ‘industry’, ‘size of organisation’ and
‘role respondent’ was found.
Both in the case and survey research, the level of BIA is on average higher in financial services where-
as the degree of ITO is lower (part VII, figure 5 and figure 24). Financial services was not represented
within the short survey research. Within the industry ‘housing corporation’ the average BIA is lower
than within financial services and the average degree of ITO is higher. But similarities and differences
Contingency factors
Industry Size of organisation
Geographicalarea
Rolerespondent
Businessproposition
IT proposition
People &culture
Shortsurvey
research
Surveyresearch
Case research
Informalpervasive
Optimized processes
Improved, managed
processes
Esthablished,focuses
processes
Committedprocesses
Initial or ad hoc
processes
Bonding, uni�ed
Cost e�ective
Some partner-value;
Dashboard managed
Some cost
e�ectiveness; Dashboard
established
IT enables/drives business strategy
IT seen as an asset; Process driver;Con�ict seen as creative
Shared risk & rewards
Emerging value service provider;Balanced tech & business hiring
Relevant process
across the organization
Relevant process
across the organization
Good understanding;
Emerging relaxed
Limited business / IT understanding,
Business / IT lack understanding,
Functional cost e�ciency
Some technical measurements
No formal process,cost center, reactive
priorities
Con�ict; IT a cost of doing
business
Traditional (e.g., acctng, email)
IT takes risk, little reward;
Technical training
Tactical at Functional
level,occasional
responsive
IT emerging as an asset;
Process enabler
Transaction (e.g., ESS, DSS)
Di�ers across functional organizations
Integrated with partners
Integrated across the organization
Extende to external
partners
Integrated across the
org. & partners
Evolve with partners
IT-bunisness co-adaptive
Improvisation-al
Education/careers/rewards across the organization
Communication
ValueGovernance Partnership Scope &
architectureSkills
Busin
ess &
ITal
ignm
ent
mat
urityIT outsourcing
characteristics in�uence
1.57
2.62
Degree ofITO
ITOmaturity
9
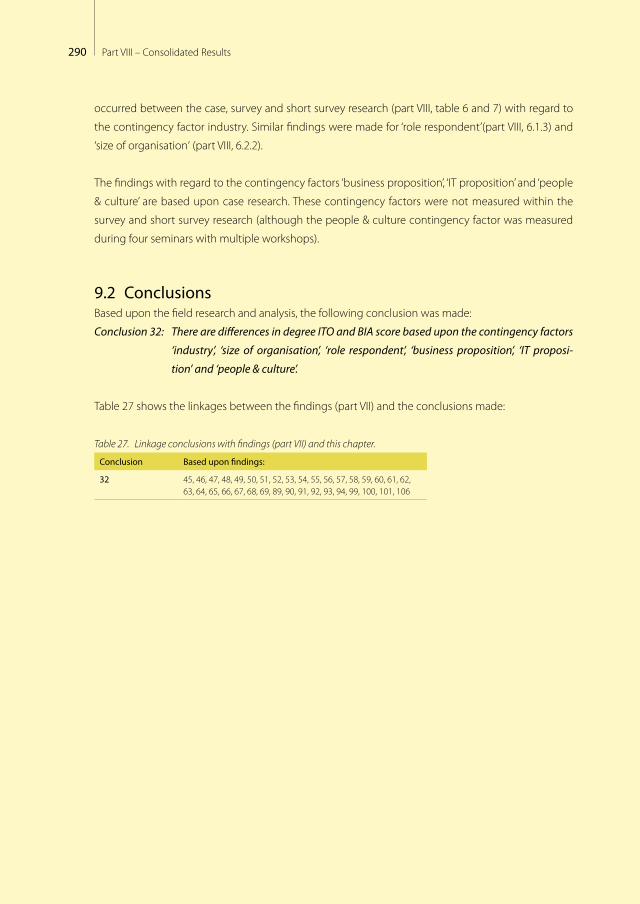
290 Part VIII – Consolidated Results
occurred between the case, survey and short survey research (part VIII, table 6 and 7) with regard to
the contingency factor industry. Similar findings were made for ‘role respondent’(part VIII, 6.1.3) and
‘size of organisation‘ (part VIII, 6.2.2).
The findings with regard to the contingency factors ‘business proposition’, ‘IT proposition’ and ‘people
& culture’ are based upon case research. These contingency factors were not measured within the
survey and short survey research (although the people & culture contingency factor was measured
during four seminars with multiple workshops).
9.2 ConclusionsBased upon the field research and analysis, the following conclusion was made:
Conclusion 32: There are differences in degree ITO and BIA score based upon the contingency factors
‘industry’, ‘size of organisation’, ‘role respondent’, ‘business proposition’, ‘IT proposi-
tion’ and ‘people & culture’.
Table 27 shows the linkages between the findings (part VII) and the conclusions made:
Table 27. Linkage conclusions with findings (part VII) and this chapter.
Conclusion Based upon findings:
32 45, 46, 47, 48, 49, 50, 51, 52, 53, 54, 55, 56, 57, 58, 59, 60, 61, 62, 63, 64, 65, 66, 67, 68, 69, 89, 90, 91, 92, 93, 94, 99, 100, 101, 106
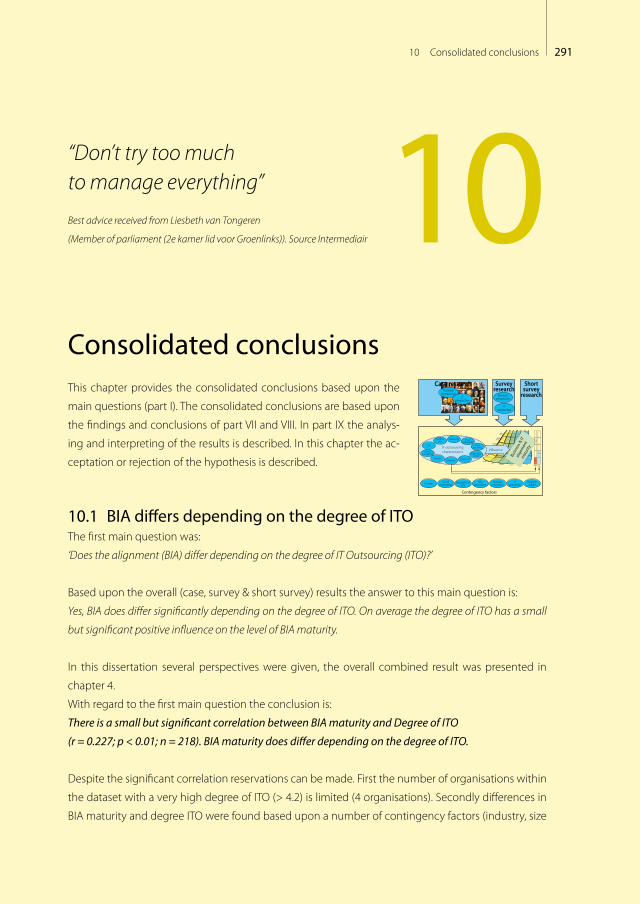
29110 Consolidated conclusions
“Don’t try too much to manage everything”
Best advice received from Liesbeth van Tongeren
(Member of parliament (2e kamer lid voor Groenlinks)). Source Intermediair
Consolidated conclusionsThis chapter provides the consolidated conclusions based upon the
main questions (part I). The consolidated conclusions are based upon
the findings and conclusions of part VII and VIII. In part IX the analys-
ing and interpreting of the results is described. In this chapter the ac-
ceptation or rejection of the hypothesis is described.
10.1 BIA differs depending on the degree of ITOThe first main question was:
‘Does the alignment (BIA) differ depending on the degree of IT Outsourcing (ITO)?’
Based upon the overall (case, survey & short survey) results the answer to this main question is:
Yes, BIA does differ significantly depending on the degree of ITO. On average the degree of ITO has a small
but significant positive influence on the level of BIA maturity.
In this dissertation several perspectives were given, the overall combined result was presented in
chapter 4.
With regard to the first main question the conclusion is:
There is a small but significant correlation between BIA maturity and Degree of ITO
(r = 0.227; p < 0.01; n = 218). BIA maturity does differ depending on the degree of ITO.
Despite the significant correlation reservations can be made. First the number of organisations within
the dataset with a very high degree of ITO (> 4.2) is limited (4 organisations). Secondly differences in
BIA maturity and degree ITO were found based upon a number of contingency factors (industry, size
Informalpervasive
Optimized processes
Improved, managed
processes
Esthablished,focuses
processes
Committedprocesses
Initial or ad hoc
processes
Bonding, uni�ed
Cost e�ective
Some partner-value;
Dashboard managed
Some cost
e�ectiveness; Dashboard
established
IT enables/drives business strategy
IT seen as an asset; Process driver;Con�ict seen as creative
Shared risk & rewards
Emerging value service provider;Balanced tech & business hiring
Relevant process
across the organization
Relevant process
across the organization
Good understanding;
Emerging relaxed
Limited business / IT understanding,
Business / IT lack understanding,
Functional cost e�ciency
Some technical measurements
No formal process,cost center, reactive
priorities
Con�ict; IT a cost of doing
business
Traditional (e.g., acctng, email)
IT takes risk, little reward;
Technical training
Tactical at Functional
level,occasional
responsive
IT emerging as an asset;
Process enabler
Transaction (e.g., ESS, DSS)
Di�ers across functional organizations
Integrated with partners
Integrated across the organization
Extende to external
partners
Integrated across the
org. & partners
Evolve with partners
IT-bunisness co-adaptive
Improvisation-al
Education/careers/rewards across the organization
Communication
ValueGovernance Partnership Scope &
architectureSkills
Contingency factors
Busin
ess &
ITal
ignm
ent
mat
urityIT outsourcing
characteristics in�uence
Relationship Scopeorganizational
Transitionresult
Scopefunctional
Projectmanagement Single/Multi
vendorGovernanceExperience
Contract
SLM
1.57
2.62
Degree ofITO
ITOmaturity
Businessperspective
Industry Size of organisation
Geographicalarea
Rolerespondent
Businessproposition
IT proposition
People &culture
ITperspective
Businessperspective
ITperspective
Shortsurvey
research
Surveyresearch
Case research
10

292 Part VIII – Consolidated Results
of organisation, role respondent, business proposition, IT proposition and people & culture) (chapter
9). Thirdly the case study showed a small non significant negative influence of degree ITO and BIA
maturity. The case study existed of 28 cases but the demand side within the case research is more
represented than in the survey & short survey research (see part VII, paragraph 3.1).
10.2 On several aspects / areas of interest the alignment differsThe second main question was:
‘On which aspects / areas of interest does the alignment differ?’
Based upon the overall (case, survey & short survey) results the answer to this main question would
include a number of aspects / area’s where the alignment differs. These areas of interest are described
by the alignment components of Luftman. The BIA maturity is more or less influenced by ITO for the
six components of alignment (chapter 8).
All components of the BIA maturity are positively (and significantly) influenced by degree of ITO. But
the components ‘value measurement’ and ‘architecture & scope’ are most positively influenced by
degree of ITO. The lowest contribution is found in the component governance.
With regard to the second main question the main conclusion is that there are several aspects / areas
of interest where the alignment differs when discussing ITO.
10.3 ITO influences the level of BIAThe third main question was:
‘Does ITO influence the level of BIA?’
Based upon the overall (case, survey & short survey) results the answer to this main question is:
Yes, ITO characteristics do influence the level of BIA.
The main result that led to this answer was already provided in 2.1., with a significant correlation
between BIA maturity and degree ITO (figure 1 and 2). Although the results of the case research and
survey research are in contradiction, both show influences (part IIX, chapter 5). In the case research,
significant correlations have occurred at the sub characteristics degree ITO for ‘system development’
and ‘user & acceptance testing’(part VII, chapter 2.5.4) as well as contingency factors (part VII, chapter
2.6). In the survey research a significant positive influence of ITO on the level of BIA was found (part
VII, chapter 3.4). Within the short survey a positive but not significant correlation was found.
Analysis results based on the case, survey and short survey results do show a relatively small but
significant impact of degree ITO on the level of BIA. A number of contingency factors are important

29310 Consolidated conclusions
as discussed in chapter 6. Interestingly are the contradictory results indicating that the contribution
of degree ITO towards BIA differ based upon the contingency factors. A number of assumptions can
be made with regard to the causes of the influence of degree ITO, which will be discussed in part IX
10.4 There are determining characteristics for BIA in ITO situationsThe fourth main question was:
‘What are the determining characteristics for BIA in ITO situations’
Based upon the overall (case, survey & short survey) results the answer to this main question is:
The following characteristics do impact BIA in ITO situations (chapter 8)
– System development (part VII, finding 37);
– User & acceptance testing (part VII, finding 38);
– IT outsourcing - contract (part VII, finding 41);
– IT outsourcing - project management (part VII, finding 43);
– IT outsourcing - transition result (part VII, table 18);
– Size of IT outsourcing deal (part VII, table 29);
– Type of relationship IT supplier (part VII, table 29);
– IT outsourcing scope functional (part VII, table 29) and particularly (table 13):
– Break/fix services;
– Workspace automation;
– Help & service desk.
Further the degree ITO and BIA score (maturity) differ based upon the contingency factors. The im-
pacting contingency factors are (chapter 9):’ industry’, ‘role respondent’, ‘size organisation’, ‘business
proposition’, ‘IT proposition’ and ‘people & culture’ factors.
10.5 ITO has a positive impact on BIAFinally the hypothesis is stated in part I:
‘IT Outsourcing (ITO) has a negative impact on Business & IT alignment (BIA)’.
Based upon the overall (case, survey & short survey) results the hypothesis is:
REJECTED, ITO does not have a negative impact on BIA. Organisations using IT outsourcing have, on average, a higher level
of alignment. This difference is relatively small but significant.
This rejected hypothesis is based on the overall result as well as the single results of the case, survey
and short survey research and exists of:
294 Part VIII – Consolidated Results
– Result case research:
There is no significant (negative) influence between the maturity of BIA and the degree of ITO
(r = -0.229; Sig. = 0.120; 1 tailed; n = 28). The hypothesis that ITO has a negative impact on BIA is
rejected (Finding 31, part VII, chapter 2.5.2).
Within the case research there were a few findings which did significantly support the hypothesis,
these are: system development (part VII, chapter 2.5.4., finding 37), acceptance testing (part VII,
chapter 2.5.4), finding 38).
– Result survey research:
There is a significant positive correlation between BIA score and Degree ITO (r = 0.272; p <0.000;
n =169). The hypothesis that ITO has a negative impact on BIA is rejected (Finding 85, part VII,
chapter 3.4 & 3.5).
Within the survey research no findings were made that support the hypothesis.
– Short survey research
There is no correlation between BIA maturity and Degree ITO (r = -0.88; p < 0.383; n = 14) . The hy-
pothesis that ITO has a negative impact on BIA is rejected (Finding 98, part VII, chapter 4.3).
The short survey research did not provide further possibilities to analyse this result on ITO charac-
teristics described in part IV.

29511 Summary
“Just try, you might learn something”
Best advice received from Remco Claassen
(Owner Remco Claassen productions). Source Intermediair
SummaryThe analysis is based upon a rich dataset of case, survey and short survey research. Before the analysis
the justification of statistical interpretation was discussed. Both the results of BIA score and Degree
ITO proved to be reliable. The measurement mechanism of ITO maturity was found not reliable but
has a limited data set (only case research). For ITO maturity both the designed and the redesigned
measurement were adopted.
In this rich dataset several perspectives have been analysed and a number of conclusions were
drawn. Some of the findings within the three research approaches are in contradiction. Sometimes
these can be explained by the contingency factors ‘industry’, ‘role respondent’ and ‘size of organisa-
tion’.
Interesting is the main contradiction whereas the case research showed a small negative but not
significant correlation between BIA score (maturity) and degree of ITO compared to the small but
positive and significant correlation within the survey research. Based upon the results of the case,
survey and short survey research the influence of Degree ITO is small yet positive on BIA score. This
conclusion is also based upon the large number of survey research responses.
In this part, the components for BIA and ITO characteristics were classified as well as the organisations
on maturity level of BIAS. Also, the similarities and differences in ITO influence on BIA and in the con-
tingency factors have been described. Consequently, three questions were answered:
First the question whether or not the ITO does influence the maturity level of BIA was answered posi-
tively. ITO does influence the maturity level of BIA.
11
296 Part VIII – Consolidated Results
Secondly the determining characteristics for BIA in ITO situations were identified.
Thirdly, the question as to whether there are contingency factors that influence BIAS was answered
positively. The contingency factors with influence are: ‘industry’, ‘size of organisation’, ‘role respondent’,
‘business proposition’, ‘IT proposition’ and ‘people & culture’.
In chapter 10 the consolidated conclusions were drawn, these were:
– Alignment does differ significantly depending on the degree of ITO. On average the degree of ITO
has a small but significant positive influence on the level of alignment;
– The alignment does differ on several aspects / areas of interest;
– ITO characteristics do influence the level of BIA;
– There are determining characteristics for BIA in ITO situations.
In chapter 10 the hypothesis stated in part 1 was rejected. ITO does not have a negative impact on BIA.

Part IXAnalysis and
interpretationAnswers to the main questions:
1. Does the BIA di�er depending on the degree of ITO?2. On which aspects / areas of interest does the BIA di�er?3. Does ITO in�uence the level of BIA? 4. What are the determining characteristics for BIA in ITO situations?
Acceptance or rejection of the hypothesis: IT outsourcing (ITO) has a negative impact on Business & IT alignment (BIA)

298 Part IX – Analysis and interpretation
299Contents
Contents
1 Introduction 301
2 Analysing main questions from business perspective 3032.1 Alignment maturity differs depending on the degree of IT outsourcing 303
2.2 On several aspects / areas of interest the alignment differs 305
2.3 IT outsourcing influences the business & IT alignment maturity 306
2.4 There are determining IT outsourcing characteristics for alignment 308
2.5 IT outsourcing contributes to higher alignment maturity 310
3 Comparing results with other research 311
4 Contributions 313
5 Limitations 315
6 Further research suggestions 317
7 Personal endnote 319

300 Part IX – Analysis and interpretation

3011 Introduction
“First, learn a profession. That will contribute to journalism much more”
Best advice received from Wiebe Draijer (Managing partner McKinsey).
Source Intermediair
IntroductionIn part I the background of this research was provided. Further Business & IT alignment was defined
as well as IT outsourcing. The problem definition was described and in the research approach set the
hypothesis and main questions were given.
In part II the research design was explained, where the main research concept was examining. The
usage of survey, short survey and case research was introduced. Secondly the literature research ap-
proach was described as well as the data gathering approach for field research.
The alignment components have been described in part III as well as the used alignment measure-
ment model of Luftman [2003].
The IT outsourcing characteristics have been described in part IV based upon literature research. Ten
IT outsourcing characteristics were identified. Part V described the measurement mechanisms of
alignment and IT outsourcing followed by the contingency factors and its measurement mechanism
in part VI.
The parts I to VI formed the basis for the field research described in part VII. In this part the detailed
research results of the three research approaches (case, survey and short survey) were presented.
In part VIII the consolidated results were presented, combining the results of the case, survey and
short survey results. In this part the hypothesis was rejected and the main questions were answered
based on the results.
In this part (IX) the results from previous parts are used to analyse the conclusions, answers and find-
ings. Also interpretation is made. In the second chapter of this part the research questions are evalu-
ated. The contributions of this research are discussed in chapter three. The fourth chapter of this part
1
302 Part IX – Analysis and interpretation
is written from a business perspective. The analysis and interpretations in this part will be based upon
the research, but also on the discussions with experts, my own field experience and other sources.
The analysis and interpretation is done using the main questions in this dissertation. Comparison
with other research is provided in chapter five. In the sixth chapter the limitations and open issues of
this research will be given. Finally suggestions for further research are made and a personal endnote
finishes this dissertation.
3032 Analysing main questions from business perspective
“Pick your battles” Best advice received from Ritchy Drost (CFO UPC). Source Intermediair
Analysing main questions from business perspective
In part I four main questions were identified. The questions were answered in part VIII. In this chapter
these four main question and the answers are analysed using the research, the discussions with ex-
perts, my own field experience and other sources. New areas for research are discussed.
2.1 Alignment maturity differs depending on the degree of IT outsourcing
The first main question was: ‘Does the level of alignment differ depending on the degree of IT Outsourc-
ing?’.
In part VIII the conclusion was made that alignment indeed differs significantly depending on the de-
gree of IT outsourcing. Interestingly is that the correlation found was, although significant, not strong
(see also part VIII, chapter 4). For businesses several arguments are to be found in favour of IT out-
sourcing (copied from [Beulen, 2006]):
– decreasing the total cost of ownership of the IT services;
– shortening time-to-market for new IT services;
– increasing flexibility of IT services;
– achieving innovativity in IT services;
– facilitating the IT consequences of mergers and disentanglements;
– achieving a ‘technology shift’;
– realizing a strategic focus on central competences;
– rendering the IT services costs variable;
2

304 Part IX – Analysis and interpretation
– improving the company’s financial ratios;
– solving the problem of not being able to recruit qualified IT staff.
These arguments in favour of IT outsourcing challenges businesses whether to outsource or not. But
industry research performed by Gartner [2006] shows that outsourcing of IT services is not always
successful. 50% of the IT outsourcing deals is not successful and 25% of the outsourced IT is trans-
ferred to another supplier or back in-house within two years after the outsourcing deal [Hefley, 2006]
(see part I).
An important element of successful managing IT services is alignment. A positive and significant cor-
relation between return on IT investments (ROI) was found at several researches [Poels, 2006], [Chan,
2001] and [Byrd, 2006].
Both alignment and IT outsourcing are top management concerns [Derksen, 2012]. Alignment was in
this international study number 1 concern whereas IT outsourcing ranked number 18 international.
Within Europe alignment was ranked number 1 and IT outsourcing ranked number 12.
Analysing the results from part VII and VIII IT outsourcing influences the alignment maturity. But look-
ing at the success ratio of IT outsourcing (50%) mentioned by Gartner the assumption can be made
that successful IT outsourcing will contribute to better alignment whereas not successful IT outsourc-
ing will result in lower levels of alignment. This assumption is supported when looking at the correla-
tion of alignment maturity and IT outsourcing maturity, assuming that more mature IT outsourcing
corresponds with a higher success rate in IT outsourcing. The created assumption is: higher IT out-
sourcing maturity → higher IT outsourcing success → higher level of alignment maturity and higher
return on IT investments (see part I).
Subsequently a reasoning can be made that alignment differs depending on the degree of IT out-
sourcing but, the successfulness of the IT outsourcing deal (or IT outsourcing maturity) is of higher
importance than degree of IT outsourcing. The assumption made is that IT outsourcing maturity is an
indicator of IT outsourcing successfulness. The IT outsourcing maturity was measured within the case
research only (28 cases), therefore the assumption with regard to IT outsourcing maturity of higher
importance than degree of IT outsourcing was not adopted in the consolidated results. The correla-
tion between business & IT alignment maturity and IT outsourcing maturity was significantly higher
than the correlation between alignment maturity and degree of IT outsourcing.
The results of this dissertation indicate that improving the business & IT alignment maturity cannot
be an argument in favour for IT outsourcing without considering the alignment components, IT out-
sourcing characteristics and contingency factors discussed in this dissertation.
3052 Analysing main questions from business perspective
2.2 On several aspects / areas of interest the alignment differsThe second main question was: ‘On which aspects / areas of interest does the alignment differ?’.
With regard to the second main question the main conclusion is: there are several aspects / areas of
interest where the alignment differs when discussing IT outsourcing. Based upon the consolidated
results the answer to this main question would include a number of aspects / area’s where the align-
ment differs. These areas of interest were described using the six alignment components of Luft-
man (communication, value measurement, governance, partnership, scope & architecture and skills
& competences). The alignment maturity is more or less influenced by degree of IT outsourcing for
the six components of alignment (see also part VIII, chapter 8).
When analysing the influence, all components of alignment maturity are positively (and significantly)
influenced by degree of IT outsourcing. But the components ‘value measurement’ and ‘architecture &
scope’ are most positively influenced by degree of IT outsourcing. The lowest contribution is found in
the component governance. A business analysis, of the three mentioned components is:
1. Value measurement positively contributes while IT outsourcing suppliers create, based upon the
contracts and service level agreements, measureable performance indicators. They report consist-
ently these performance indicators and the performance reached. Using this reporting structure
they stimulate the IT outsourcing clients to steer via these performance indicators. Doing so, both
the IT outsourcing client and supplier create an improvement cycle with regard to value meas-
urement. This assumption is based on my practice experience. In more detail the subjects ‘ser-
vice level management’ and ‘business metrics’ were more positively influenced than others. Delen
[2005] described service level management as an important element of the IT outsourcing control
factor ‘contract’ (p.84). In my own experience the usage of service level management was first only
at outsourcing deals. Nowadays internal IT organisations start to use service level management as
well. The usage of service level management contributes to higher alignment providing insights
in the desired and specified services of the IT supplier. Delen [2005] also provided another control
factor called performance management and introduced the balanced scorecard of Kaplan and
Norton [Kaplan, 1992]. Part of the balanced scorecard are the business metrics. IT outsourcing in-
fluences the business metrics positively, considering the positive correlation between IT outsourc-
ing and the value measurement sub components such as service level management and busi-
ness metrics, a new assumption can be made. The new assumption would be that the external IT
supplier challenges businesses better at managing IT with usage of key performance indicators
on both business and IT than internal IT suppliers do.
2. With regard to scope & architecture a possible reasoning is that IT architecture (e.g. integration,
new technologies) is the core business of the IT supplier but not that of the IT outsourcing client.
Therefore it is logical to assume that the alignment component scope & architecture is positively
306 Part IX – Analysis and interpretation
influenced by IT outsourcing receiving extra and new knowledge with regard to IT. Another possi-
ble interpretation of the research results is that IT outsourcing is beneficial in reducing and remov-
ing legacy. Often internal IT organisations operate on low budgets and focuses on maintaining
the IT landscape as is. When IT is outsourced parts of the landscape are being outsourced and
challenging the existing infrastructure and architectural integration. In those cases IT outsourcing
might create a need to reconsider the architectural integration resulting in a better manageable IT
infrastructure. Within this research the interpretation made is supported by the positive influence
of degree of IT outsourcing on alignment sub component ‘architectural integration’. The assump-
tion is that the positive influence of degree IT outsourcing at alignment for architectural integra-
tion is based upon a revisited infrastructure and architectural integration. Finally IT outsource
suppliers might require transparency with regard to their role and position in the organisations
IT landscape, the interfaces and overlapping areas. This transparency is needed to manage the IT
landscape within the area of responsibility of the IT supplier. This requirement also stimulates the
IT outsourcing client to create a transparent IT architecture.
3. Next to the positive influence, IT outsourcing also creates new challenges especially for the IT out-
sourcing client. Outsourcing IT creates the need of new governance structure steering and man-
aging the outsourced IT as well as the IT parts left within the company. New working structure,
authority matrices and other governance elements have to be created. This challenge is already
seen in the IT outsourcing market where outsourcing governance and management is an area of
research and business discussions [Oosterhaven, 2008], [Koh, 2004].
An interesting finding is the relatively strong correlation between IT outsourcing and the sub com-
ponent of BIA: ‘hiring & retaining’. The influence of IT outsourcing is found positive at this sub compo-
nent. A possible interpretation of this result is the need of new and other skills in case of outsourced
IT. When IT outsourcing is applicable the internal IT personnel needs to become more business
oriented. In this interpretation several assumptions were made. One of those is that other skills are
needed when using IT outsourcing (see also [Oosterhaven, 2008]). Another assumption is that busi-
nesses are better at attracting and retaining IT personnel with a high business focus. Several possibili-
ties for further research can be mentioned as well. Related to this dissertation the skill set differences
with regard to alignment in cases of IT outsourcing compared to non IT outsourcing is suggested.
2.3 IT outsourcing influences the business & IT alignment maturityThe third main question was: ‘Does IT outsourcing influence the level of Business & IT alignment ma-
turity?’
In part VIII the consolidated result was that IT outsourcing does influence the level of Business & IT
alignment maturity. On average the degree of IT outsourcing has a small but significant positive in-
fluence on the level of alignment. Differences with regard to the influence were found between the
3072 Analysing main questions from business perspective
researches approaches used (case, survey and short survey).
The main result that led to this answer was already provided in 2.1. Although the results of the case
research and survey research are in contradiction, both show influences of degree of IT outsourcing
on alignment maturity (part VIII, chapter 5). In the survey research a small, but significant positive
influence of IT outsourcing on the level of alignment maturity was found (part VII, chapter 3.4). Within
the short survey a positive but not significant correlation was found.
A number of contingency factors are important as discussed in part VIII (chapter 6). Interestingly are
the contradictory results indicating that a number of the contingency factors, show different results
with regard of the contribution of degree IT outsourcing towards alignment maturity. A number of
assumptions can be made with regard to the causes of the influence of degree IT outsourcing. These
are also suggestions for further research. Possible causes of the contradictory results could be:
– Further differentiation in IT outsourcing such as offshore, cloud, on-shore sourcing. The kinds of IT
outsourcing might impact the influence of degree IT outsourcing at alignment maturity. Within
the research these differences were not gathered at the survey and short survey research. Within
the case research a few organisations used one or more of the mentioned differentiations, this
was too little to investigate the impact.
– Alignment maturity differs between industries, interestingly the industry ‘financial services’ scores
high at alignment maturity and low at degree IT outsourcing where ‘housing corporation’ scores
relatively low on the level of alignment maturity and relatively high on degree IT outsourcing. Fur-
ther research within those industries on the correlation between the level of alignment maturity
and degree IT outsourcing is required to explore major differences between industries, their set
up of the business & IT relationship and its impact on the Business & IT Alignment in IT outsourc-
ing situations. A new assumption, which can be made, based upon the results is that the posi-
tive influence of IT outsourcing is higher at (semi)-government organisations compared with non
(semi)-government organisations.
– Dependent on the size of organisation (and possibly the age of organisation), a growing curve
seems to appear (part IIX, figure 5). In this growing curve young small organisations tend to use
IT outsourcing rapidly to a degree (maturity level) of 2.75. Growing further up to 1,000 employees
the organisations tends to follow a strategy of internal sourcing. The alignment maturity tend to
follow the same curve, starting relatively high but declining along the way up to a size of 500
employees. From the size of 1,000 employees the degree IT outsourcing increases as well as the
alignment maturity but a turning point is found at a size of 10,000 employees. Using IT outsourc-
ing partners might positively influence the professionalism of the internal IT organisation, which
would correspond with the results in this dissertation. Further research is needed on this correla-
tion and especially considering the turning points of degree IT outsourcing and alignment matu-
rity.

308 Part IX – Analysis and interpretation
2.4 There are determining IT outsourcing characteristics for alignment
The fourth main question was: ‘What are the determining characteristics for alignment maturity in IT
outsourcing situations?’
In part VIII the following IT outsourcing characteristics impacting the alignment were identified:
1. System development (part VII, finding 37);
2. User & acceptance testing (part VII, finding 38);
3. IT outsourcing - contract (part VII, finding 41);
4. IT outsourcing - project management (part VII, finding 43);
5. IT outsourcing - transition result (part VII, table 18);
6. Size of IT outsourcing deal (part VII, table 29);
7. Type of relationship IT supplier (part VII, table 29);
8. IT outsourcing scope functional (part VII, table 29) and particularly (part VIII, table 13):
– Break/fix services;
– Workspace automation;
– Help & service desk.
These IT outsourcing characteristics are analysed below:
1. System development is ranked second on what’s being outsourced mostly (external networks is
ranked first). Within the research performed in this dissertation the average degree of outsourc-
ing for system development is 3.151 on a five point scale (part VIII, chapter 3). About 47% of the
system development is outsourced at the researched organisations in this dissertation. About
only half of these outsourced system development projects is successful [MCDougall, 2006]. Hav-
ing system development ranked second and considering its impact on alignment maturity raises
questions about the correlation with regard to the influencing factors within system develop-
ment. Possible future research is finding the factors within system development impacting align-
ment maturity.
2. Second, IT outsourcing characteristic impacting the alignment is user & acceptance testing. User
& acceptance testing is not or not significantly outsourced (part VIII, chapter 3). But interpretation
of the correlation result might indicate the importance of cooperation and coordination of user &
acceptance testing when IT outsourcing is applicable.
3. Thirdly the IT outsourcing – contract was found to have an impact on alignment maturity. The
outsourcing contract is an identified control factor by Delen [2005] and should provide security
and flexibility. In this research the contract characteristics measured were based upon customer
and supplier obligations written in the contract. But, there are significant differences in kinds of
contracts when discussing reliability, flexibility, service, volume, contract period, exit clause and
3092 Analysing main questions from business perspective
other. Interesting would be to assess the several contracts and its impact on the IT outsourcing
maturity and alignment maturity. This is a future research possibility.
4. IT outsourcing project management is depending on several elements such as the steering com-
mittees. A well-used framework for project management is PRINCE2 [Thorogood, 2003], [Derk-
sen, 2008]. This framework is relatively complete on the aspect of project management compared
to the two determining sub characteristics used (steering committee and project management
performance) in this dissertation (part IV, chapter 2.8). Further research on project management
related to IT outsourcing and alignment maturity will contribute to further insights.
5. Barthémely [2003] defined the transition of employees as a critical control factor for outsourcing.
Barthémely identified several sub factors of importance (part IV, chapter 2.10). This outsourcing
characteristic was measured at the case research but had a limited set of data. Further research at
cases where employees have been transferred would improve the data set.
6. The size of the outsourcing deal was measured at the case, survey and short survey research. The
size of the outsourcing deal is measured within several researches [Gianotten, 2008], [Derksen,
2012], [Luftman, 2011]. This dissertation uses the same approach as Giarte [Gianotten, 2008]. A first
comparison with the Giarte figures shows a similar result focusing on the size of IT outsourcing
(% of total IT budget outsourced). Another interesting similarity is that in the Giarte figures the
industry financial services have a lower usage of IT outsourcing as well (in % of total IT budget).
Combining the results of Giarte and this dissertation might be interesting for more insights and
new perspectives.
7. The type of relationship with the IT supplier is an often-discussed subject at businesses. The most
common assumption is that the IT supplier wants to be a business partner but the IT client sees the
IT supplier more from an transaction perspective. It is assumed that there are negotiation advan-
tages for the IT client when the IT supplier delivers a substitute product / service. Another perspec-
tive is that IT should be an enabler for realising alignment and business value (part I). A first analysis
showed an higher level of alignment maturity at partnerships in comparison with the other types
of IT outsourcing relationships. But this item was measured at the case research only and is there-
fore limited in data (28 cases). Further research on the subject of type of relationship is suggested.
8. An important aspect of IT outsourcing is the characteristic functional scope of IT outsourcing. This
part of the IT outsourcing is often used to determine what will be outsourced. The several IT activities
applicable were discussed in part IV (chapter 2.3). The sub characteristics which impact alignment
are ‘break-fix services’, ‘workspace automation’ and ‘help & service desk’. From a business perspective
this result is recognisable while these are the items which impact the users (as well as business man-
agers) directly in the day to day operations. An assumption is that these items are more a disqualifier
310 Part IX – Analysis and interpretation
for IT organisations if not done well than a qualifier. Based upon the developments of best practices
such as ISO20.000 (based on the IT Infrastructure Library (ITIL)) most IT organisation (in- and external)
have realised higher levels of maturity on these items. Especially at ‘help & service desk’ (incident
management) IT organisations invested in professionalising the services. Interesting would for fur-
ther analysis would be to correlate user satisfaction and the alignment maturity. First indications at
the case research (not done in this dissertation) show strong correlations.
2.5 IT outsourcing contributes to higher alignment maturityIn part I the hypothesis is stated: ‘IT Outsourcing has a negative impact on Business & IT alignment ma-
turity’.
In part VIII, chapter 10.5 the hypothesis is:
REJECTED, IT outsourcing does not have a negative impact on Business & IT align-ment maturity. Organisations using IT outsourcing have, on average, a
higher level of alignment. This difference is relatively small but significant.
About the rejection of the hypothesis a number of considerations were made in parts VII, VIII and this
part of the dissertation. Although a relatively small yet positive contribution of degree IT outsourcing
was found with regard to alignment maturity the results do not indicate that increasing the degree of
IT outsourcing is the determining factor for realising a higher level of alignment. But there are strong
indications that aspects such as IT outsourcing maturity, type of IT outsourcing relationship, elements
of IT outsourcing-functional scope and other do contribute to higher level of alignment. But this is
also dependent on contingency aspects such as size of organisation and industry.
Strongly stated: degree of IT outsourcing is NOT a silver bullet for realizing higher levels of alignment
maturity. Further research was suggested to find successful mixes (IT outsourcing characteristics and
contingency factors) for using degree IT outsourcing for realising alignment maturity. These mixes
should also consider the impact of the contingency factors.
Finally the results overall also indicate that both internal and external IT organisations are not able
to distinguish significantly from each other in an alignment perspective. Looking at the end results
it is remarkable that both internal and external IT organisations did not significantly differ from each
other (part VIII, chapter 4). Although the number of organisations, which completely outsourced their
IT, is limited the differences between level of alignment maturity are small.
Considering the research performed and the analysis made the conclusion is that IT outsourcing
does not matter (from an alignment perspective). But it might matter when further analysis is per-
formed using the IT outsourcing characteristics and contingency factors. These characteristics and
factors were discussed in this part (IX). Further research is needed to gain better insight and evidence.
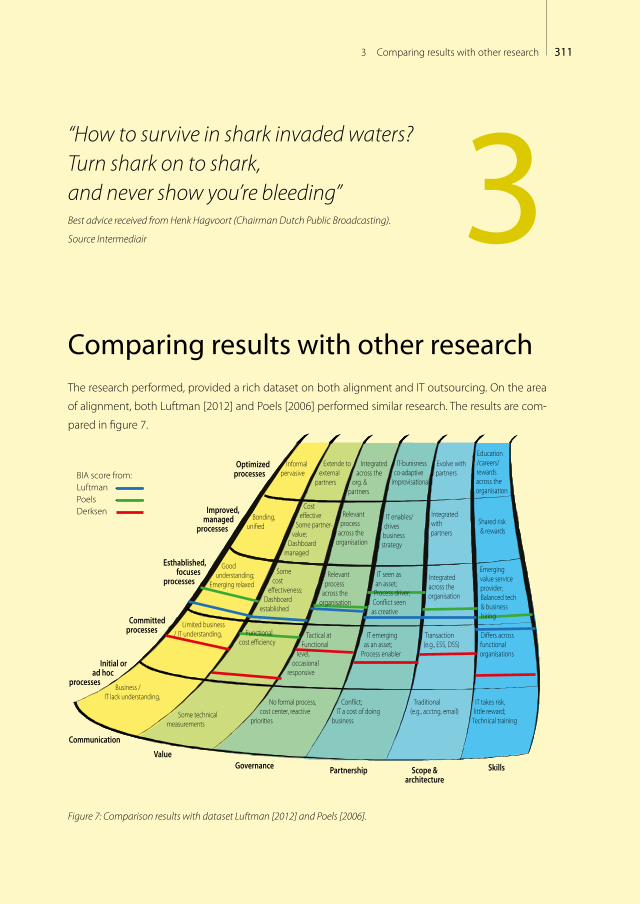
3113 Comparing results with other research
“How to survive in shark invaded waters? Turn shark on to shark, and never show you’re bleeding” Best advice received from Henk Hagvoort (Chairman Dutch Public Broadcasting).
Source Intermediair
Comparing results with other researchThe research performed, provided a rich dataset on both alignment and IT outsourcing. On the area
of alignment, both Luftman [2012] and Poels [2006] performed similar research. The results are com-
pared in figure 7.
Optimized processes
Improved, managed
processes
Esthablished,focuses
processes
Committedprocesses
Initial or ad hoc
processes
Communication
ValueGovernance Partnership Scope &
architectureSkills
BIA score from:LuftmanPoelsDerksen
Informalpervasive
Bonding, uni�ed
Cost e�ective
Some partner-value;
Dashboard managed
Some cost
e�ectiveness; Dashboard
established
IT enables/drives business strategy
IT seen as an asset; Process driver;Con�ict seen as creative
Shared risk & rewards
Emerging value service provider;Balanced tech & business hiring
Relevant process
across the organisation
Relevant process
across the organisation
Good understanding;
Emerging relaxed
Limited business / IT understanding,
Business / IT lack understanding,
Functional cost e�ciency
Some technical measurements
No formal process,cost center, reactive
priorities
Con�ict; IT a cost of doing
business
Traditional (e.g., acctng, email)
IT takes risk, little reward;
Technical training
Tactical at Functional
level,occasional
responsive
IT emerging as an asset;
Process enabler
Transaction (e.g., ESS, DSS)
Di�ers across functional organisations
Integrated with partners
Integrated across the organisation
Extende to external
partners
Integrated across the
org. & partners
Evolve with partners
IT-bunisness co-adaptive
Improvisational
Education/careers/rewards across the organisation
Figure 7: Comparison results with dataset Luftman [2012] and Poels [2006].
3
312 Part IX – Analysis and interpretation
The alginment scores in this dissertation are significantly lower than the results of Luftman [2012] and
Poels [2006]. The following differences with this dissertation are explanatory:
– Luftman’s research is scoped on the global Fortune 1,000 companies. In the research of Luftman,
over 300 organisations were investigated which is different from the scope used in this disserta-
tion. All of Luftman’s investigated companies were of size ‘above 10,000 employees’;
– Geographical differences. The Luftman research is global. His results regarding the organisations
in Europe provide an average alignment score of 2.87, which is less different with the category of
‘above 10,000 employees’ in this dissertation (alignment score 2.62) 36 organisations within this
dissertation research were of size ‘above 10,000 employees’;
– The industry ‘Government’ has on average a lower alignment score within the Luftman research
(2.93- complete dataset) as well as the results of this research (2.31)..
– The research of Poels [2006] used a Dutch scope but was limited to financial services. His average
alignment score of 3.22 (page 406, table 8.9) is significantly higher than the alignment score of
2.72 (see part VIII) in this dissertation for financial services. The likely reasons for this difference are:
– Measurement mechanism of Poels, although based on Luftman, is different. Poels did not use 5
level descriptions, but five rankings (poor, insufficient, sufficient, good, and excellent).
– The category financial services, within the research of Poels, was limited to banks and insurers.
In the research of this dissertation, pension funds were also added to the category financial
services.
– Interestingly, both Poels and this dissertation research found the alignment component ‘value
measurement’ to be the component scoring lowest in the Netherlands.
Based on the comparison of the research results with that of Luftman and Poels, the following con-
clusion was made:
The results in this dissertation compared with the Luftman measurement, as well as the Poels meas-
urement, are significantly different, but these differences might be explained by differences in geogra-
phy, industry, size of organisation and measurement mechanism.

3134 Contributions
“Don’t stick too long in your comfort zone”
Best advice received from Jaska de Bakker (CFO DHV). Source Intermediair
ContributionsThis dissertation makes a number of significant contributions in the area of business & IT alignment in
outsourced situations. The contributions described in this dissertation can be summarised as follows:
1. The first contribution is a set of evaluated alignment components. In part III the several compo-
nents of alignment were discussed and its literature support towards these components. The
evaluation provided an overview of the literature and the supported alignment components. The
contribution is useful for researches to gain insight in alignment components and its literature. It
is also useful for organisations to understand the several components of alignment and its scien-
tifically basis.
2. The second contribution is a set of the IT outsourcing characteristics is provided that should be
considered by organisations in their efforts for improving alignment using IT outsourcing. Ten
characteristics of IT outsourcing were identified which receive literature support.
3. The business & IT alignment in outsourced situations model (called BIAS) measurement mecha-
nism is a contribution which can be used by organisations to assess how well they have align-
ment, IT outsourcing as well as the correlated result organised. With this systematic mechanism a
contribution for assessing organisations was made delivering several insights for improvement of
alignment in correlation with IT outsourcing.
4. A fourth contribution is the differences in business & IT alignment outsourcing based upon con-
tingency factors. Using this valuable information, organisations are able to assess the alignment
and IT outsourcing and compare the results in the several perspectives of importance.
4

314 Part IX – Analysis and interpretation
5. A fifth contribution of this dissertation is the identified differences in the research approaches
(case, survey & short survey research). Differences were found in the results of the research ap-
proaches used. This knowledge is valuable for organisations aiming to improve alignment related
to IT outsourcing whereas many organisations nowadays use so called ‘quick assessments’. An out-
come of alignment assessment based upon only one used research approach is limited in view
and result. An outcome of a quick assessment might result in wrong conclusions.
6. A sixth contribution is the evidence that the impact of IT outsourcing on business & IT alignment
maturity is not negative. The assumption that IT outsourcing will have negative influence on the
alignment maturity is not supported.
7. Another contribution is the set of determining IT outsourcing characteristics with regard to align-
ment maturity. This set can be used by organisation in order to set priorities for improvement
areas aiming for better alignment maturity.
8. Realising an extended set of data provides an eight contribution. The underlying dataset of this
dissertation can be used at organisations to assess and benchmark their alignment maturity re-
lated to the degree of IT outsourcing.
9. The last contribution is the basis for further research (suggestions in this part, chapter 7) and the
possibility to use the relatively extended data set of this dissertation (chapter 8).

3155 Limitations
“Be thoughtful, be open-minded and don’t judge too quickly”
Best advice received from Hetty van Ee (General Director Ormit).
Source Intermediair
LimitationsAlthough the business & IT alignment in outsourced situations model has been tested statistically
and is based upon a large dataset, the model and this research has still some limitations. Some of
these limitations are:
– validation IT outsourcing maturity;
IT outsourcing maturity was measured at case research only. The IT outsourcing maturity modl re-
ceived limited statistical support for reliability. The number of cases (28) might be a cause. Another
aspect is the sub characteristics used to measure IT outsourcing maturity. Further analysis and
improvements of IT outsourcing maturity will improve the business & IT alignment in outsourced
situations research.
– measuring management style;
Although management style is indirectly measured within the alignment maturity model the use-
fulness is limited. Considering the high literature support (see part III) for this sub component of
alignment maturity it is recommended to change the alignment maturity measurement mecha-
nism in order to measure management style as a separate sub component.
– number of organisations with a very high degree of IT outsourcing;
Despite the large data set gathered, the number of organisations with a very high level of IT out-
sourcing is limited in this research. Therefor it is not possible to identify the impact of a very high
degree of IT outsourcing on business & IT alignment maturity.
– differences with other research.
Although the same approach is used with regard to alignment maturity measurement some sig-
5

316 Part IX – Analysis and interpretation
nificant differences were found in previous chapter. It is interesting to further compare and ana-
lyse the results of the Luftman alignment maturity measurement and the results presented in this
dissertation.
3176 Further research suggestions
“Dare to dream, but especially dare to do”
Best advice received from Mark Vogt (Director War-child).
Source Intermediair
Further research suggestionsThis research was extensive. It took over four years and over fifteen years of field experience on this
subject. Having investigated the trends in business & IT industry research for over seventeen years
helped tremendously in gathering the data set as presented in this dissertation. But even having
a database of over 12,000 businesses & IT contacts, it took well over three years to gather the data
presented in this dissertation. In previous chapters of this part several hypotheses were identified for
new research opportunities. But the results of this dissertation can also be used for further analysis
and also raises other new questions in which the presented data is not sufficient. Further research
is suggested on (not limited and possible overlap with earlier defined new research opportunities/
hypotheses in this part):
– further differentiation in kinds of IT outsourcing such as offshore, cloud, on-shore sourcing;
– differences and impact of industries on correlation between degree IT outsourcing and alignment
maturity;
– possible correlation between degree IT outsourcing and alignment maturity depending on size of
organisation in different phases of growth;
– further analysis of the several alignment components, IT outsourcing characteristics and/or con-
tingency factors of the created measurement model; Examples are deeper analysis on the sub IT
outsourcing characteristics such as system development or project management.
– further analysis on IT outsourcing maturity, whereas the model testing on this element proved a
limited reliability. This might be model based but also due to limited dataset (number of cases).
6
318 Part IX – Analysis and interpretation
– further analysis using the same business & IT alignment in outsourced situations – maturity model
outside the geographical scope used in this dissertation; In this dissertation the scope was limited
to Dutch based organisations. In other countries or even continents different results might occur.
These differences might provide further conclusions on the impact of degree IT outsourcing on
alignment maturity.
– further analysis using the same business & IT alignment in outsourced situations - maturity model
at organisations with a very high degree of IT outsourcing; The number of organisations involved
in this research with a very high degree of IT outsourcing was limited to 4 organisations. Having
more organisations with a higher score might impact the results found.
– further analysis on the people & culture contingency factors. The usage of the Attitude, Behaviour
and Culture game during the workshops was found to be of added value in the cases (14 cases).
Within the results (part VII, chapter 2.6.7) the people & culture factor seem to influence the busi-
ness & IT alignment in outsourced situations - maturity. The results presented in this dissertation
stimulate further research in this area.

3197 Personal endnote
“Without setback you will never get to the top”
Best advice received from Peter Blangé (Old international volleyball
player / commercial director Ortec TSS). Source Intermediair
Personal endnoteScientific research is importantDear reader, when I started this dissertation I was convinced that IT outsourcing would have a nega-
tive impact on the business & IT alignment (on average). Besides my own experiences at organisa-
tions where they struggled with the IT outsourcing I also read several papers on failed outsourcing
attempts. I also spoke to several IT managers who told me from their bad experiences with regard to
IT outsourcing. Reading and experiencing also the several alignment initiatives convinced me that
investing in better alignment with internal IT departments could be pound wise whereas outsourc-
ing would be penny wise but pound foolish. Performing this research showed me the importance of
scientific research next to practical, but often limited, experiences. At the other hand it is still difficult
to be completely convinced that IT outsourcing will be helpful in all situations. This is also based on
the research results as written in this dissertation.
Scientific research leads to new insightsPerforming this research and writing this dissertation helped me to see better in which situations IT
outsourcing might be helpful and which not. IT outsourcing might be a measure for professionalising
IT within an organisation, but is depending on a number of factors, such as discussed in this disserta-
tion. Talking to many experts in the field, as well as performing the research did convince me that
further research is needed to look at the critical success factors for realising higher levels of alignment
in combination with IT outsourcing and the depending situational aspects. The situational aspects
are important and lead to new insights.
Scientific research cannot be performed aloneAt last I would like to thank all attending organisations, the contact persons in particular (whose names
I did not mention while a number of organisations choose to be anonymous). Furthermore I want to
7
320 Part IX – Analysis and interpretation
thank all the respondents for their participation. And of course the field experts mentioned in appen-
dix H, who helped me to ask the right questions and to discover the elements of importance. Without
the help of Arno Oosterhaven, Guus Holtgrefe and Jerry Luftman this research would not have been
completed, thanks!
Stimulating further scientific researchI’m grateful to have been in the opportunity to perform a research of this size. I hope, multiple re-
searchers will continue on the subjects mentioned in this dissertation. To support this development
the data of my research (case & survey research database) can be used for further research. This data
(made anonymous) can be requested at [email protected] combined with a research proposal
and a proposal for sharing results (or writing articles together). Another possibility is performing re-
search using the extensive respondents database of the Business & IT Trends Institute. For more infor-
mation the same email address can be used.
Barry Derksen

Appendices
322 Appendices
List of Appendices
A References 323B List of LinkedIn groups addressed for response 334C ITO questionnaire 337D BIA questionnaire (English) 341E ITO Survey research questionnaire 356F Short Survey questionnaire (Dutch) 358G SPSS variable overview 361H Expert panel 365I Case results 366J BIAscore - degree ITO using imputation 447K About the author 448

323Appendix A: References
Appendix AReferences
1. [Agerfalk, 2008], Agerfalk, P.J., Fitzgerald, B., ‘Outsourcing to an unknown workforce: exploring open sourcing as a global strategy’ MIS quarterly, 32(2), pp. 385-409 /June 2008
2. [Anderson, 2006] Anderson, J.C., Narus, J.A., Rossum, W.V., ‘Customer Value Propositions in Business Markets’ Harvard Business Review, (1), pp. 91-99. (2006)
3. [Ang, 1993] Ang, S., Beath, C.M., ‘Hierarchical elements in software contracts’, Journal of organizational computing (3:3), 1993, pp. 329-361.
4. [Apte, 1997], Apte, Sobol, M.G., U.M., Hanaoke, S., Shimada, T., Saarinen, T., Salmela, T., Vepsalainen, A.P.J., ‘IS outsourcing practices in the USA, Japan and Finland: a comparative study’ Journal of Information Technology vol. 12. pp. 289-304, 1997.
5. [Aral, 2007], Aral, S., Weill, P., ‘IT assets, organizational capabilities, and firm performance: how resource allocations and organizational differences explain performance variation’ Organization Science, vol. 18, no.5, September-October 2007, pp. 763-780.
6. [Aubert, 2004] Aubert, B.A., Rivard, S., Patry, M. ‚’A transaction cost model of IS outsourcing’ Information and Management, 41, pp. 921-932.
7. [Avision, 2004] Avison, D., Jones, J., Powell, P. and Wilson, D. ‘Using and Validating the Strategic Alignment Model’, Journal of Strategic Information Systems 13(3): 223–246. (2004)
8. [Baarda, 1993], Baarda, D.B., Goede, M.P.M. de, ‘Basisboek Methoden en technieken, praktische handleiding voor het opzetten en uitvoeren van onderzoek’, Stenfert Kroese, Den Haag, , eerste druk, zevende oplage, 1993, ISBN: 9020719556
9. [Baarda, 2011], Baarda, D.B., Goede, M.P.M. de, Dijkum, C. van de, ‘Basisboek Statistiek met SPSS, Handleiding voor het verwerken en analyseren van en rapporteren over (onderzoeks)gegevens’, Noordhoff Uitgevers B.V., februari 2011
10. [Baets, 1992] Baets, W., ‘Aligning Information Systems with Business Strategy’, IS and Business Strategy Alignment 1(4): 205–213. 1992
11. [Baets, 1996] Baets, W.J., ‘Some Empirical Evidence on IS Strategy’. Alignment in Banking, Information & Management 30(4): 155–177., 1996
12. [Baker, 2004], Baker, E.H., ‘Leading alignment’ CIO insight 1(45) pp 19-20, October 15, 2004.13. [Balaji, 2008] Balaji, S. (2008) ‘IS Outsourcing Effectiveness: Understanding the Effects of Relationship Diversities, Client
Capabilities and Knowledge Capital Gains’ PhD Dissertation, Indiana University, Bloomington. 14. [Barreto, 2004] Barretto, Charito B. (2004), ‘Weekender: Labor & management,’ BusinessWorld. p. 1.15. [Barthélemy, 2003] Barthémely, J., ‘The seven deadly sins of outsourcing’ Academy of Management Executive, pp. 87- 98, [17:2],
200316. [Basselier, 2003], Bassellier, G., Benbasat, I., Reich, B.H., ‘The influence of business managers ‘IT competence on championing IT’
Information Systems Research 14 (4): pp. 317-336. 17. [Basselier, 2004], Bassellier, G., Benbasat, I., ‘ Business competence of information technology professionals: conceptual
development and influence on IT-Business partnerships’ MIS Quarterly vol. 28. no.4, pp 673-694/December 2004. 18. [Batelaan, 1991] Bate!aan, M.V. , P. van Doorn, ‘Informatietechnologie van plateau tot plateau: een strategie voor de
implementatie’, Holland Harvard Review, zomer 1991.19. [Beats, 1992], Beats, W., ‘Aligning information systems with business’ The journal of strategic information systems 1(4), pp 207,
Elsevier, 1992.20. [Beijen, 2001] Beijen, H., Broos, E., Lucas, E., Strategische inzet van IT: Een leidraad voor business-informatiemanagement, Kluwer,
2001.21. [Benbya, 2006], Benbya, H., McKelvey, B., ‘Using co evolutionary and complexity theories to improve IS alignment: a multi level
approach’, Journal of Information Technology, vol. 21.no. 4, pp 284-298.22. [Bent, 2000] Bent, H. van den, Peters, L., ‘ITIL compactreeks deel 1, Ondersteuning van IT-diensten’, Ten Hagen & Stam, Den Haag,
2000.23. [Bergeron, 2004] Bergeron, F., Raymond, L. Rivard, S., ‘Ideal patterns of strategic alignment and business performance’
Information & management. Vol. 41, no. 8, pp 1003-1020, 2004.24. [Berghout, 1999] Berghout, E., T.J.W. Renkema, Investeringsbeoordeling van IT-projecten, Information Management Institute B.V.,
Rotterdam, 1999,25. [Bessems, 1996] Bessems, P, Trends in IT-standaardisatie, Informatie & Informatiebeleid, zomer /14, 1996 N 2, blz 53-5826. [Betz, 1995] Betz, B., J. Roelofs , J. Vrins, Integraal ontwikkelen van organisatie- en informatiesystemen, puzzelen met ontwerp en
324 Appendices
implementatie in een snel veranderende omgeving, Kluwer Bedrijfsinformatie, Deventer, 1995.27. [Beulen, 2000] Beulen, E.P., ‘Beheersen van IT-outsourcingsrelaties’, Proefschrift KU Brabant, Tilburg, 2000.28. [Beulen, 2002] Beulen, E.P., Uitbesteding van IT dienstverlening, ICT bibliotheek, nr. 13, Ten Hagen Stam Uitgevers, 2002.29. [Beulen, 2006], Beulen, E., Ribbers, P., Roos, J., ‘Managing IT outsourcing, Governance in global partnerships’ Routledge Taylor &
Francis Group, ISNB: 0-415-36599-6, 2006.30. [Biemans, 1994], Biemans, W.G., van der Meer-Kooistra, J., ‘Case research voor bedrijfskundig onderzoek 2’, Bedrijfskunde,
jaargang 66, 1994, no. 231. [Bladel, 1997] Bladel, P.J.C. van, , A.M. de Jong, ‘Multimeter stelt alle baten van IT vast’, Informatiemanagement, maart 1997.32. [Bleistein, 2006] Bleistein, S.J., Cox, K., Verner, J. ‘Validating strategic alignment of organizational IT requirements using goal
modeling and problem diagrams’ The Journal of systems and software, 79(3), pp. 362-378, 2006.33. [Bloem, 1998] Bloem, J., Derksen, B., Noordam, P., Vlist, A., ‘Elektronische communicatie domineert IT-innovatie’, Informatie, maart
1998.34. [Bloem, 2004] Bloem J.,Van Doorn M., Realisten aan het roer: Naar een prestatiegerichte governance van IT, Verkenningsinstituut
Nieuwe Technologie (ViNT), 2004.35. [Boersen, 2009] Boersen, D., Dawson, R., Veen, E., ‘Control in sourcing: hoe houd je grip op een risicovol en kostbaar
outsourcingtraject’, TIEM, nr. 33, October 2009, pp. 4-736. [Boot, 2010], Boot, N., Cornelisse, P., Hodges, P., Hopwood, A., Joha, A., Lepak, S., Wijers, G., 2010 Strategic Visions on the Sourcing
Market’, EquaTerra, 2010.37. [Brabander, 1983] Brabander, B., G. de Thiel, ‘Een onderzoek naar factoren die het succes van automatiseringsprojecten
beïnvloeden’, Informatie, december 1983.38. [Bradach, 1996] Bradach, J. (1996). ‘Organizational Alignment: The 7-S Model’ No. 9-497-045), Cambridge, MA: Harvard Business
School Note.39. [Broadbent, 1993] Broadbent, M. and Weill, P. (1993). ‘Improving Business and Information Strategy Alignment: Learning from
the Banking Industry’, IBM Systems Journal 32(1): 162–179.40. [Broadbent, 1996] Broadbent, M., Weill, P., O’Brien, T. and Neo, B. S. (1996) ‘Firm Context and Patterns of IT Infrastructure
Capability’. Unpublished manuscript.41. [Broadbent, 2005], Broadbent, M., Kitzis, E., ‘Interweaving Business-Driven IT strategy and execution: four foundation factors’ Ivey
Business journal, 69(3), pp 1-6., 2005.42. [Brown, 1994] Brown, C.V. and Magill, S.L. (1994). ‘Alignment of the IS Functions with the Enterprise: Toward a model of
antecedents’, MIS Quarterly 18(4): 371–403.43. [Brown, 2011], Brown, J.D., ‘Likert items and scales of measurement’ Shiken: Jalt Testing & evaluation SIG Newsletter. March 2011.
15(1) pp 10-14.44. [Buijs, 2003] Buijs J.J.G., van Doorn V.E.W.M., Noordam P.G., ‘Implementatie van Shared Service Centres’, Management Executive,
jaargang 1 nr. 2, 2003.45. [Buijs, 2004] Buijs, J., Doorn, V. van, Noordam, P. ‘Shared Service Centers, een kwestie van doen’, Controlling in de praktijk, Kluwer,
2004.46. [Burn, 1997], Burn, J.M., ‘A professional balancing act – walking the tightrope of strategic alignment, in C. Sauer and P.W. Yetton
(eds) Steps to the future – Fresh thinking on the management of IT based organizational transformation’ 1st edn., San Fransisco: Jossey-Bass Publishers, pp. 55-88, 1997.
47. [Burn, 2000] Burn, J.M. and Szeto, C. (2000). A Comparison of the Views of Business and IT Management on Success Factors for Strategic Alignment, Information & Management 37(4): 197–216.
48. [Byrd, 2006], Byrd, A., Lewis, B.R., Bryan, R.W., ‘ The leveraging influence of strategic alignment on IT investment: an empirical examination’ Information & management, 43(3), pp. 308-321, 2006.
49. [Caluwé, 2010] Caluwé, L., Vermaak, H., ‘Leren veranderen, een handboek voor de veranderkundige’ second edition, Kluwer 2010.50. [Campbell, 2005] Campbell, B. (2005). ‘Alignment: Resolving Ambiguity within Bounded Choices’. PACIS 2005, Bangkok: Thailand.51. [Carr, 2003] Carr, N.G. , ‘IT doesn’t matter’, Harvard Business Review, May 200352. [Chabrow, 2002] Chabrow, E., ‘The IBM-Amex deal: a Radical change in IT outsourcing’, informationweek, March 4, 2002.53. [Chan, 1997] Chan, Y.E., Huff, S.L., Barclay, D.W. and Copeland, D.G. (1997). ‘Business Strategic Orientation, Information Systems
Strategic Orientation, and Strategic Alignment’, Information Systems Research 8(2): 125–150.54. [Chan, 2001] Chan, Y.E. , ‘Information Systems Strategy, structure and alignment’ in R. Papp (ed.) Strategic information
technology: opportunities for competitive advantage, 1st edn, Hershey, PA: Idea Group Publishing, pp. 56-81.55. [Chan, 2002] Chan, Y.E. (2002). ‘Why Haven’t we Mastered Alignment?: The Importance of the Informal Organization Structure’,
MIS Quarterly Executive 1(2): 97–112.56. [Chan, 2006] Chan, Y.E., Sabherwal, R. and Thatcher, J.B., ‘Antecedents and Outcomes of Strategic IS Alignment: An Empirical
Investigation’, IEEE Transactions on Engineering Management 51(3): 27–47. (2006).57. [Chan, 2007], Chan, Y.E., Reich, B.H. ‘IT alignment: an annotated bibliography ‘Journal of Information Technology, vol. 22, pp 316-
396, 2007.58. [Chan, 2007], Chan, Y.E., Reich, B.H. ‘IT alignment: what have we learned? ‘ Journal of Information Technology, vol. 22, pp. 297-
315, 2007.59. [Choe, 2003] Choe, J. (2003). ‘The Effect of Environmental Uncertainty and Strategic Applications of IS on a Firm’s Performance’,
Information & Management 40(4): 257–268.
325Appendix A: References
60. [Chung, 2003] Chung, S.H., Rainer Jr., R. Kelly and Lewis, B. R. (2003). ‘The Impact of Information Technology Infrastructure Flexibility on Strategic Alignment and Applications Implementations’, Communications of the Association for Information Systems 11(11): 191–206.
61. [CIO council, 2000] Federal Architecture Working Group, ‘Architecture alignment and assessment guide’, The Federal Chief Information Officer Council, 2000.
62. [CIO, 2007] ‘State of the CIO survey’ CIO’s magazine, CXO Media inc. 2007. www.cio.com 63. [CIOnet, 2008]’Views about IT, Benelux CIOs take the lead in change’ CIOnet, vol. 04. pp. 8-9, October 2008.64. [Cragg, 2002] Cragg, P., King, M. and Hassin, H. ‘IT Alignment and Firm Performance in Small Manufacturing Firms’, Strategic
Information Systems 11(2): 109–132. (2002).65. [Cremers, 2000] Cremers, J., Kramer, N., ITIL compactreeeks deel 2, Levering van IT-diensten, Ten Hagen & Stam, Den Haag, 2000.66. [Croteau, 2001] Croteau, A. and Bergeron, F., ‘An Information Technology trilogy: Business Strategy, Technological Deployment
and Organizational Performance’, Journal of Strategic Information Systems 10(2): 77–99. (2001).67. [Currie, 2001] Currie, W.L., Seltsikas, P., ‘Explortng the supply side of IT outsourcing: evaluating the emerging role of application
service providers’ European Journal of Information Systems, pp. 123-134, 2001-10.68. [Das, 1991] Das, S.R., Zohar, S.A. and Barkentine, M.E., ‘Integrating the Content and Process Of Strategic MIS Planning with
Competitive Strategy‘, Decision Sciences 22(2): 953–985. (1991).69. [Day, 1996] Day, J.G. (1996). ‘An Executive’s Guide to Measuring I/S’, Strategy & Leadership 24(5): 39–41.70. [Delen, 1992] Delen, G.P.A.J., Looijen, M., ‘Beheer van informatievoorziening’, SDM reeks, Cap Gemini publishing, Rijswijk, 199271. [Delen, 2003] Delen, G. ‘World Class IT: praktijkgids ICT sourcing’ Uitgeverij Tutein Nolthenius, 2003.72. [Delen, 2005] Delen, G, Decision & Controlfactoren voor sourcing van IT, dissertation, May 2005.73. [Delft, 2003] Delft Westerhof, M. van (red.), ‘De kunst van het concentreren: Shared Services nader toegelicht, 2003.74. [Derksen, 1996]Derksen, B. , P. Noordam, ‘Terugverdientijd IT-nieuwigheden abominabel’, Automatisering Gids, december 1996.75. [Derksen, 1998] Derksen, B., M. Verhoeven, W. Wiggers, ‘Integraal en iteratief ontwikkelen van organisaties en
informatiesystemen’, Praktijkgids De Controller & InformatieManagement, 25 december 1998, p. 01-16.76. [Derksen, 1998] Derksen, B., P. Noordam , A. van der Vlist, ‘De belangrijkste IT-trends als beïnvloedende factor voor
organisatieontwikkeling’, AIV Informatietechnologie, februari 1998.77. [Derksen, 2001] Derksen, B., ‘IT procesdoorlichting’, Financieel en Actueel, Kluwer, IT Assessment, 2001.78. [Derksen, 2002] Derksen, B. , P. Noordam, IT Service Management, best practices. Innovatie moet en ICT kan het vliegwiel zijn,
ITSMF, 2006.79. [Derksen, 2002] Derksen, B., ‘IT Trendwatchers en IT beheerders wisselen stuivertje, Resultaten van een jaarlijks onderzoek van
het IT Trends Institute onder Nederlandse organisaties en de gevolgen voor IT beheer’, IT Beheer Jaarboek, ITSMF, 2002.80. [Derksen, 2003], Derksen, B., ‘ITIL op de pijnbank, Drijft ITIL de IT organisatie op kosten?’, research report for Post doc. Master of
Management Consulting, 2003.81. [Derksen, 2008] Derksen, B. ‘Effectiveness of ICT efforts, Business & IT alignment’, research report Business & IT Trends Institute,
January 200882. [Derksen, 2008] Derksen, B. Noordam, P. ‘Modellen die werken, kwaliteit in bedrijf en informatievoorziening’ 2e druk,
Boekdrukkunst uitgeverij, oktober 2008.83. [Derksen, 2009] Derksen, B., Noordam, P., van der Vlist, A., ‘Trends in IT 2010-2011, Op tijd investeren in de juiste technologie’,11e
druk, Boekdrukkunst uitgeverij, September 2009.84. [Derksen, 2011], Derksen, B., ‘Trends in Business & IT 2012/2013, Richten, Inrichten & verrichten met Business & IT’ Business & IT
Trends Institute, 2011.85. [Derksen, 2012], Derksen, B. Luftman, J.N., Zadeh, H.S., Santana, M., Rigoni, E.H., Huang, Z.D., ‘Key information technology and
management issues 2011-2012: an international study’ Journal of Information Technology, 2012, p.p. 1-15.86. [Drucker, 2000] Drucker, P., ‘Management, uitdagingen in de 21e eeuw’, Business Contact, Amsterdam/Antwerpen, 2000.87. [Duffy, 2001], Duffy, J., ‘Maturity models’ Blueprints for e-volution’., Strategic and Leadership, 29(6): 19-26,200188. [Duncan, 1995] Duncan, N.B. (1995). Capturing Flexibility of Information Technology Infrastructure: A study of resource
characteristics and their measure, Journal of Management Information Systems 12(2): 37–58.89. [Dutta, 1996] Dutta, S. (1996). ‘Linking IT and Business Strategy: The role and responsibility of senior management’, European
Management Journal 14(3): 255–269.90. [Edwards, 2000] Edwards, B.A. (2000). ‘Chief Executive Officer Behaviour: The Catalyst for Strategic Alignment’, International
Journal of Value-Based Management 13(1): 47–54.91. [Faas, 2005] Faas, A., Hendriks, H., ‘Strategische (out)sourcing van ICT, met ISPL’, Academic service, 2005.92. [Fairchild, 2004] Fairchild, A.M., ‘Information Technology Outsourcing (ITO) Governance: An examination of the Outsourcing
Management Maturity Model’, Proceedings of the 37th Hawaii International Conference on System Sciences, 2004.93. [Farrell, 2003], Farrell, I.J. (Aligning IT to Corporate Objectives: Organisational factors in use, Ph.D. thesis, Macquarie University,
Sydney, 2003.94. [Feeny, 1992], Feeny, D.F., Edwards, B.R., Simpson, K.M., ‘Understanding the CEO/CIO relationship’ MIS Quarterly 16(40)., pp. 435-
448, 1992.95. [Feeny, 1998] Feeny, D., Willcocks, L., ‘Core IS skills for exploiting information technology’, volume 39, issue 3, p.9-21, 1998.96. [Fiebig, 2000], Fiebig, D.G., ‘Modelling the prices, performance and contract characteristics of IT outsourcing’ Journal of
Information Technology, 15, pp. 107-118, 2000.
326 Appendices
97. [Floyd, 1990] Floyd, S.W. and Woolridge, B. (1990). ‘Path Analysis of the Relationship Between Competitive Strategy, Information Technology, and Financial Performance’, Journal of Management Information Systems 7(1): 47–64.
98. [Gartner, 2003] Gartner, 2003 ‘IT spending and staffing survey results’, Strategic Analysis Report.99. [Gartner, 2006] Gartner, 2006, ‘Hype cycle for business process outsourcing’, 2006.100. [Gefen, 2008] Geven, D, Wyss, S., Lichtenstein, Y.,. ‘Business familiarity as risk mitigation in software development outsourcing
contracts’ MIS Quarterly vol. 32 no. 3, pp. 531-551, September 2008.101. [Ghosh, 2009] Ghosh, B., and Scott, J.E. (2009) ‘Relational Alignment in Offshore IS Outsourcing,’ MIS Quarterly Executive, (8:1), pp.
19-29. 102. [Gianotten, 2009] Gianotten, M., Riet, S. van de, ‘Outsourcing performance 2009, outlook-strategy-research’, Giarte Media Group
BV, 2008.103. [Gibson, 1974], Gibson, D., Nolan, R.L., ‘Managing the four stages of EDP growth, Harvard Business Review, 52(1), January-
february 1974104. [Gottschalk, 2006] Petter Gottschalk, Hans Solli-Sæther, (2006) “Maturity model for IT outsourcing relationships”, Industrial
Management & Data Systems, Vol. 106 Iss: 2, pp.200 - 212105. [Gragg, 2002] Cragg, P., King, M. and Hassin, H. (2002). ‘IT Alignment and Firm Performance in Small Manufacturing Firms’,
Strategic Information Systems, 11(2): 109–132.106. [Greiner, 1972], Greiner, L.E., ‘Evolution and Revolution as organizations grow’ Harvard Business Review, July-August 1972, pp.
37-46107. [Grover, 1996], Grover, V., Cheon, M.J., Teng, J.T.C., ‘The Effect of Service Quality and Partnership on the Outsourcing of Information
Systems Functions’ Journal of Management Information Systems, Vol. 12 No. 4, Spring 1996 pp. 89 - 116 108. [Gubman, 1998] Gubman Edward L., The Talent Solution, Aligning strategy and people to achieve extraordinary results,
McGraw-Hill, New York, 1998.109. [Gupta, 1997] Gupta, Y.P., Karimi, J. and Somers, T.M. (1997). ‘Alignment of a Firm’s Competitive Strategy and Information
Technology Management Sophistication: The missing link’, IEEE Transactions on Engineering Management 44(4): 399–413.110. [Handy, 1988], Handy, C., ‘Understanding voluntary organizations’ Penguin Books, Hammersworth, 1988.111. [Hartung, 2000] Hartung, S., Reich, B.H. and Benbasat, I. (2000). Information Technology Alignment in the Canadian Forces,
Canadian Journal of Administrative Sciences 17(4): 285–302.112. [Hawk, 2009] Hawk, S., Zheng, W., and Zmud, R.W. (2009) ‘Overcoming Knowledge-Transfer Barriers in Infrastructure
Management Outsourcing: Lessons from a Case Study’, MIS Quarterly Executive, (8:3), pp. 123-139. 113. [Hefley, 2006] Hefley, W.E., Loesche, E.A., ‘The eSCM-CL v1.1: practice details, the eSourcing Capability Model for Client
Organizations (eSCM-CL) v1.1.’ Carnegie Mellon University, 2006.114. [Heller, 2011], Heller, M., ‘De samenwerking tussen business & IT kan nog wel wat smeermiddel gebruiken’, article Computerworld,
15-03-2011 at: http://computerworld.nl/article/12728/business-it-alignment-goed--maar-fout.html 115. [Henderson, 1988] Henderson, J.C. and Sifonis, J.G. (1988). ‘The Value of Strategic IS Planning: Understanding Consistency,
Validity, and IS Markets’, MIS Quarterly 12(2): 187–200.116. [Henderson, 1992] Henderson, J.C., Venkatraman, N., ‘Strategic alignment: A model for organizational transformation through
information technology’, T. Kochan & M.Unseem, eds. Transforming Organisations, Oxford University Press, NY, 1992.117. [Henderson, 1993] Henderson, J.C., Venkatraman, N. (1993), ‘Strategic alignment: leveraging information technology for
transforming organizations’, IBM Systems Journal VOL 32 NO1, pp. 4 t/m 16.118. [Henderson, 1996] Henderson, J.C., Venkatraman, N. and Oldach, S. (1996). Aligning Business and IT Strategies, in J.N. Luftman
(ed.) Competing in the Information Age – Strategic Alignment in Practice’. Oxford: Oxford University Press.119. [Henderson, 1999] Henderson, J.C., Venkatraman, N., ‚Strategic alignment: leveraging information technology for transforming
organizations’ IBM systems journal, vol. 32, no. 1, 1999.120. [Heskett, 1994] Heskett, J.L., Jones, T.O., Loveman, G.W., Sasser Jr. W.E., and Schlesinger, L.A. (1994) ‘Putting the Service-Profit
Chain to Work,’ Harvard Business Review, (72:2), pp. 164-174. 121. [Hinssen, 2009] Hinssen, P., ‘Business/IT fusion, how to move beyond alignment and transform IT in your organization’, Across
technology, 2009.122. [Hirschheim, 2001] Hirschheim, R. and Sabherwal, R. (2001). ‘Detours in the Path Toward Strategic Information Systems
Alignment‘, California Management Review 44(1): 87–108.123. [Huff, 1999] Huff, S.L. and Chan, Y E. (1999). ‘Aligning Information Systems Strategy with Business Strategy, in M. Fleck (ed.)
Managing for Success’, 1st edn., Toronto: HarperCollins Publishers, pp. 43–47.124. [Humprey, 1989], Humprey, W.S., ‘Managing the software process’ Addison-Wesley, Reading Ma, 1989.125. [Hunt, 1993] Hunt, G.E. (1993). ‘Management Challenges for Survival in the 1990 s’, Journal of Information Technology 8(1): 43–
49.126. [Hyder, 2006] Hyder, E.B., Heston, K.M., Paulk, M.C., ‘The eSCM-SPv2.01: model overview, The eSourcing Capability Model for
Service Providers (eSCM-SP) v2.01’, Carnegie Mellon, 2006.127. [ISACA, 2006], Information Systems Audit and Control Association (ISACA) COBIT: 4th edition, 2006 128. [Ishikawa, 1990] Ishikawa, Kaoru (1990); (Translator: J. H. Loftus); Introduction to Quality Control; 448 p; ISBN 4-906224-61-X
OCLC 61341428129. [Jamieson, 2004] Jamieson, S., (2004). ‘Likert scales: how to (ab)use them’, Blackwell Publishing Ltd Medical Education 2004: 38
1212-1218
327Appendix A: References
130. [Jarvanpaa, 1993] Jarvanpaa, S. and Ives, B. (1993). ‘Organizing for Global Competition: The fit of Information Technology’, Decision Sciences 24(3): 547–580.
131. [Jarvenpaa, 1990] Jarvenpaa, S.L. and Ives, B. (1990). ‘Information Technology and Corporate Strategy: A view from the top’, Information Systems Research 1(4): 351–376.
132. [Jarvenpaa, 1991] Jarvenpaa, S.L. and Ives, B. (1991). ‘Executive Involvement and Participation in the Management of Information Technology’, MIS Quarterly 15(2): 205–227.
133. [Jarvenpaa, 2008], Jarvenpaa, S., Mao, J., ‘Operational capabilities development in mediated offshore software service models’, Journal of Information Technology, vol. 23, pp. 3-17, 2008.
134. [Jia, 2008] Jia, R., Reich, B.H., and Pearson, M.J. (2008) ‘IT Service Climate: An Extension to IT Service Quality Research,’ Journal of the Association of Information Systems, (9:5), pp. 294-320.
135. [Johnson, 2004] Johnson, M.D. and Seines, F. (2004) ‘Customer Portfolio Management: Towards a Dynamic Theory of Exchange Relationships,’ Journal of Marketing, (68), p.5.
136. [Johnston, 1998] Johnston, H.R. and Carrico, S.R. (1988). ‘Developing Capabilities to use Information Strategically’, MIS Quarterly 12(1): 37–48.
137. [Jorfi, 2011], Jorfi, H., Jorfi, S., Yaccob, H.F.B., Shah, I.M., ‘Relationships among strategic management, strategic behaviours, emotional intelligence, it-business strategic alignment, motivation, and communication effectiveness’ International Journal of Business and management, vol. 6, no. 9, September 2011.
138. [Jung, 1921], Jung, C.G. ‘Psychological Types’, Collected Works, Volume 6, Princeton, NJ: Princeton University Press. 139. [Kaarst-Brown, 1999] Kaarst-Brown, M.L. and Robey, D. (1999). ‘More on Myth, Magic and Metaphor: Cultural Insights into the
Management of Information Technology’, Organizations, Information Technology & People 12(2): 192–218.140. [Kaplan, 1992] Robert S. Kaplan , David P. Norton, ‘The Balanced Scorecard: Measures That Drive Performance’, Harvard Business
Review, January/February 1992.141. [Kaplan, 1996] Kaplan, R.S. , D.P. Norton, ‘The Balanced Scorecard: Translating Strategy into Action’, 1996.142. [Kearns, 2000] Kearns, G.S. and Lederer, A.L. (2000). ‘The Effect of Strategic Alignment on the use of IS-Based Resources for
Competitive Advantage’, Journal of Strategic Information Systems 9(4): 265–293.143. [Kearns, 2003], Kearns, G.S., Lederer, A.L., ‘A resource-based view on strategic IT alignment: how knowledge sharing creates
competitive advantage ‘Decision Sciences, vol. 34, no. 1, pp 1-29, 2003144. [Kearns,2006], Kearns, G.S., Sabherwal, R., ‘Strategic alignment between business and information technology: a knowledge
based view on behaviours, outcome and consequences’ Journal of Management Information Systems / Winter 2006-7, vol.23, no.3, pp. 129-162, 2007.
145. [Keen, 1991] Keen, P.G. (1991) ‘Shaping the future: Business Design through Information Technology,’ Harvard Business School Press, Boston, MA.
146. [Kerklaan, 1995] Kerklaan, L.A.F.M. e.a., De cockpit van de organisatie, Kluwer Bedrijfswetenschappen, Devnter, 1995, p. 27-40.147. [Kern, 1999] Kern, T. & Willcocks, L.P., Exploring information technology outsourcing relationships, theory and practice,
management report no 61-1999, Erasmus Universiteit, Rotterdam, 1999.148. [Kern, 2002] Kern, T., Blois, K., Norm development in outsourcing relationships’, Journal of Information Technology 17, pp. 33-42,
2002149. [Kern, 2002] Kern, T., Willcocks, L., ‘Exploring relationships in information technology outsourcing: the interaction approach’,
European journal of information systems, II, 3-19, 2002.150. [Kettinger,1994] Kettinger, W.J., and Lee, C.C. (1994) ‘Perceived Service Quality and User Satisfaction with the Information
Services Function,’ Decision Sciences, (25:5), pp. 737-766.151. [Keuning, 2000] Keuning, prof. dr. D. , dr. D.J. Eppink, Management en organisatie, Theorie en toepassing, Educatieve Partners
Nederland BV, Houten, 2000, 2e druk.152. [King, 1984] King, J.L. , K.L. Kraemer, ‘Evolution and Organizational Information Systems: an Assessment of Nolan’s Stage Model’,
Communications of the ACM, May 1984.153. [King, 2008], King, W.R., Torkzadeh, G., ‘Information Systems Offshoring: Research status and issues’ MIS Quarterly 32(2), pp. 205-
225 / June 2008.154. [Kleyn, 1994] Kleyn G.B. , B.M. van Strijen, ‘Risicomanagement bij automatiseringsprojecten’, Samsom Handboek Controlling,
Alphen a/d Rijn, 1994.155. [Knap, 1990], Knapp, T.R., ‘ Treading Ordinal Scales as Interval Scales: An Attempt To Resolve the Controversy’ Nursing Research,
March/April 1990 Vol. 39, No. 2, pp. 122-123156. [Koh, 2004], Koh, C., Ang, S., Straub, D.W., ‘IT outsourcing success: A psychological contract perspective’ Information System
Research, 15(4), pp. 356-373, December 2004. 157. [Koning, 2002], Koning, D. de, Marck, P. van der, ‘IT zonder hoofdpijn: een leidraad voor het verbeteren van de bedrijfsprestaties.’
Prentice Hall 2002.158. [Koot, 1992] Koot, W., ‘Inzicht in beheersing van kosten en baten van IT’, Praktijkgids De Controller & Informatiemanagement,
mei 1992.159. [Koppens, 1993] Koppens, S. , B. Meyberg, Operationeel beheer van informatiesystemen, Kluwer Bedrijfswetenschappen,
Deventer, 1993.160. [Kraljic, 1983] Kraljic, P., ‘Purchasing must become supply management’, Harvard Business Review, 1983.161. [Kranendonk, 1991] Kranendonk, A. , Hopstaken, B., Informatieplanning, puzzelen met beleid en plan, Kluwer

328 Appendices
Bedrijfswetenschappen, Deventer, 1991.162. [La Haye, 1994] La Haye, M., J. Roelofs, ‘Valkuilen en remedies in complete IT-projecten’, Informatie Management, november
1994. 163. [Lacity, 1998] Lacity, M.C., Willcocks, L.P., ‘An empirical investigation of information technology sourcing practices: lessons from
experience’ MIS Quarterly (22:3), pp 363-408.164. [Lambeck, 2003] Lambeck E, J. de Wolf , E. Loen, Beheer kan zich veel beter organiseren, oktober 2003.165. [Langfield-smith, 2007] Langfield-Smith, K., Smith, David, ‘Managing the IS outsourcing relationship’ chapter 10, pp. 163-189.166. [Lee, 2004], Lee, J.N., Miranda, S.M., Kim, Y.M., ‘IT outsourcing strategies: universalistic, contingency and configurational
explanations of success’ Information Systems Research, pp 110-131, vol. 15.no.2, june 2004.167. [Lee,1999]Lee, J.N., Kim, Y.G., ‘Effect of Partnership Quality on IS Outsourcing Success: Conceptual Framework and Empirical
Validation’ Journal of Management Information Systems, Vol. 15 No. 4, Spring 1999 pp. 29 - 62 168. [Leeuw, 2003], Leeuw, A.C.J. de, ‘Bedrijfskundige methodologie, management van onderzoek’, van Gorcum, Assen, 2003, ISBN
90 23231821169. [Leiblein, 2002}Leiblein, M.J., Reuer, J.J., Dalsace, F. ‘ Do make or buy decision matter? The influence of organizational governance
on technological performance ‘ Strategic Management Journal 23(9), pp. 817-833., 2002.170. [Levina,2003], Levina, N., Ross, J.W., From the Vendor’s perspective: exploring the value proposition in information technology
outsourcing’ MIS Quarterly 27(3), pp. 331-364, September 2003. 171. [Levy, 2001] Levy, M., Powell, P. and Yetton, P. (2001). ‘SMEs: Aligning IS and the Strategic Context, Journal of Information
Technology’ 16(1): 133–144.172. [Loh, 1992] Loh, L. & Venkatraman, N. ,’Diffusion of Information Technology Outsourcing, influence sources and the Kodak effect’,
Information Systems Researcy 4 (1992) p 334-358.173. [Looff, 1996] de Looff, L., ‘a model for information systems outsourcing decision making’, proefschrift TU Delft, 1996.174. [Looijen, 1989] Looijen, M., ‘Management en organisatie van automatiseringsmiddelen’, Kluwer, Deventer, 1989175. [Looijen, 1991] Looijen, M., ‘EBM – een beheermethodiek met SDM’, Cap Gemini publishing, Rijswijk, 1991176. [Looijen, 2004] Looijen, M, Beheer van informatiesystemen, Kluwer, 2004.177. [Lowry, 2004] Lowry, P.C. Romans, D, Curtis, A., ‘Global journal prestige and supporting disciplines: a scientometric study of
information systems journals’, Journal of the Association for Informations Systems 5 nr. 2 pp 29-77, 2004.178. [Luftman, 1993] Luftman, J.N., Lewis, P.R. and Oldach, S.H. (1993). ‘Transforming the Enterprise: The Alignment of Business and
Information Technology Strategies’, IBM Systems Journal 32(1): 198–221.179. [Luftman, 1996] Luftman, J.N. (1996). ‘Applying the Strategic Alignment Model, in J.N. Luftman (ed.) Competing in the
Information Age’, 1st edn., New York: Oxford University Press, pp. 43–69.180. [Luftman, 1999] Luftman, J. and Brier, T. (1999). Achieving and Sustaining Business-IT Alignment’, California Management Review
42(1): 109–122181. [Luftman, 1999], Luftman, J.A., Papp, R., Brier, T., ‘Enablers and inhibitors of Business-IT alignment’ Communications of the
Association for Information Systems.182. [Luftman, 2000] Luftman, J. (2000) ‘Assessing business-IT alignment maturity,’ Communications of the Association of
Information Systems, (4:14), pp. 1-50.183. [Luftman, 2003] Luftman, J.N., ‘Competing in the information age, align in the sand’ 2nd edition, Oxford University press, 2003.184. [Luftman, 2003], Luftman, J.N., ‘Assessing IT-business alignment’ Information Systems Management, 20(4):9-15, 2003.185. [Luftman, 2006] Luftman, J., Kempaiah, R. and Nash, E. (2006). Key Issues for IT Executives 2005’, MIS Quarterly Executive 5(2):
81–101.186. [Luftman, 2007], Luftman, J.N., Kempaiah, R., ‘An update on Business-IT alignment: a line has been drawn ‘, MIS Quarterly
Executive vol.6. no. 3., pp. 165-178 /September 2007187. [Luftman, 2008], Luftman, J., Dorociak, J., Kempaiah, R., Rigoni, E.H., ‘Strategic Alignment Maturity: A Structural Equation Model
Validation’ (2008). AMCIS 2008 Proceedings. Paper 53.188. [Luftman, 2008], Luftman, J.N., Presentation BITA Master classes, April 2008.189. [Luftman, 2009] Luftman, J., Balaji, S., Brown, C.V., ‘Customer provider strategic alignment, a maturity model‘, chapter of book to
be printed.190. [Luftman, 2009] Luftman, J., Kempaiah, R, Rigoni, E.(2009) ‘Key Issues for IT Executives 2008,’ MIS Quarterly Executive, (8:3), pp.
151-159.191. [Luftman, 2010] Luftman, J., Ben-Zvi, T. (2010), ‘ Key Issues for IT Executives 2010: Judicious IT Investments Continue Post-
Recession1’192. [Luftman, 2011], Luftman, J., Derksen, B., European key IT & management issues & trends for 2011-2012, Results of an
international study’. CIOnet Europe, 2011.193. [Luftman, 2012], Luftman, J., ‘Direct print result of SAM benchmark Luftman’ received in email from Luftman.194. [Ma, 1998] Ma, Louis C.K. and Burn, J.M. (1998). ‘Managing the Dynamics of Information Systems Strategic Alignment’. IRMA
International Conference, Boston, USA. 240.1988195. [MacDonald, 1991] MacDonald, H. (1991). ‘The Strategic Alignment Process’, in Scott Morton, Michael S. (ed.) The Corporation of
the 1990s: Information Technology and Organizational Transformation. London: Oxford Press.196. [MacFarlene, 1989] MacFarlene, I., ‘ITIL, 50 titels such as incidentmanagement, changemanagement, etc.’, Central Computer and
Telecommunications Agency (CCTA), Norwich, 1989 to 2007.
329Appendix A: References
197. [Macneil, 1983], Macneil, I.R., ‘Values in contract: internal and external’ Northwestern University Law Review, 78(2), pp. 340-418, 1983.
198. [Maes, 1999] Maes, R., ‘A generic framework for information management’, PrimaVera working paper 1999-03, Universiteit van Amterdam
199. [Maes, 2000] Maes, R., Rijsenbrij, D., Truijens, O. and Goedvolk, H. (2000). ‘Redefining Business–IT alignment through A unified framework’. Universiteit van Amsterdam/Cap Gemini White Paper. Unpublished manuscript.
200. [Maes, 2003] Maes, R., ‘Informatiemanagement in kaart gebracht’, Primavera working paper, 2003-02, Universiteit van Amsterdam
201. [Maglio, 2006] Maglio, P.P., Srinivasan, S., Kreulen, J.T., and Spohrer, J. (2006) ‘Service Systems, Service Scientists, SSME, and Innovation,’ Communications of the ACM, (49:7), pp. 81-85.
202. [Mahnke, 2008], Mahnke, V., Wareham, J. Bjorn-Andersen, N., Offshore middlemen: transnational intermediation in technology sourcing’ Journal of Information Technology vol. 23, pp.18-30, 2008.
203. [Man, 2000] Man, A.P. de, Zee, H. van der, Geurts, D., ‘Competing for partners’ Prentice Hall, 2000.204. [March, 1988] March, J. G. (1988) ‘Decisions and Organizations’ Basil Blackwell: New York, NY.205. [Marcolin, 2002] Marcolin, B.L. (2002) ‘Spiraling Effects of IS Outsourcing Contract Interpretations,’ in: Information Systems
Outsourcing: Enduring Themes, Emergent Patterns and Future Directions, R. Hirschheim, A. Heinzl and J. Dibbern (eds.), Springer-Verlag Berlin Heidelberg, pp. 277-311.
206. [Mark, 1995] Paulk, M. C., Weber, C.V., Curtis, B., Chrissis, M.B., ‘The Capability Maturity Model, Guidelines for improving the Software Process’ , Addison Wesley Publishing Company, reading MA, 1995
207. [Markus, 2006] Markus, L.M., Steinfeld, C.W., and Wigand, R.T. (2006) ‘Industry-wide Information Systems Standardization as Collective Action: The Case Study of the U.S. Residential Mortgage Industry,’ MIS Quarterly, 30 Special Issue, pp. 439-465.
208. [McDougall, 2002] McDougall, P., ‘New deals may be start of something big’ Information week, November 18 (available online at http://www.informationweek.com/story/IWK20021115S0027 ).
209. [Mehta, 2009] Mehta, N. and Mehta, A. (2009) ‘Reducing the Client Risks from Human Resource Challenges of Offshore IT Vendors,’ MIS Quarterly Executive, 8:4, forthcoming.
210. [Meijer, 2001] Meijer-Veldman, M. , R. van der Pols, ‘ASL, de volgende generatie applicatiebeheer’, IT Beheer Jaarboek 2001, Ten Hagen & Stam, Den Haag, 2001.
211. [Meijer, 2002] Meijer, M. , J. Meijers, ‘Effectief IT-beheer: samenwerken waar nodig, zelfstandig opereren waar mogelijk’, IT Beheer Jaarboek 2002, Ten Hagen & Stam, Den Haag, 2002.
212. [Meijer, 2003] Meijer, M., ‘ASL en ISO 9001:2000’, Informatie, maart 2003.213. [Meijer, 2003] Meijer, M., ‘ASL grote stap naar INK niveau III’, Informatie, oktober 2003.214. [Meijer, 2004] Meijer, M. , H. Boer, ‘De betekenis van ASL en ITIL AM voor applicatiebeheer’, IT Service Management Best Practices
2004, ITSMF, 2004.215. [Meijer, 2004] Meijer, M. , H. Meijer, ‘Hoe verbeter ik mijn applicatiediensten?: Hoe ASL en CMMI hieraan kunnen bijdragen’, IT
Service Management Best Practices 2004, ITSMF, 2004.216. [Meijer, 2005] Meijer, M., ‘Het ICT modellenboekje: Een beperkte verkenning van het modellenbos’, Getronics PinkRoccade, 2005.217. [Meijer, 2005] Meijer, M., M. Zwaal , S. Koppens, ‘ASL en ITIL, samen sterk’, ‘IT Service Management Best Practices 2005’, ITSMF,
2005.218. [Miles, 1978] Miles, Raymond E. and Snow, Charles C. (1978). ‘Organizational strategy, structure, and process’ New York: McGraw-
Hill Book Co219. [Moody, 2003] , Moody, K.W., ‘New meaning to IT alignment’, Information systems Management 20(4):30-35, 2003.220. [Moore, 2002] Moore, Geoffrey A. in: ‘Crossing the Chasm, Marketing and Selling Disruptive Products to Mainstream Customers’,
2002.221. [Nash, 2005] Nash, E. (2005) ‘Assessing IT as a driver or enabler of transformation in the pharmaceutical industry employing the
strategic alignment maturity model’, PhD. Dissertation, Stevens Institute of Technology. 222. [Ndede-Amadi, 2004] Ndede-Amadi, A.A. (2004). ‘What Strategic Alignment, Process Redesign, Enteprise Resource Planning, and
E-commerce have in Common: Enterprise-Wide Computing’, Business Process Management Journal 10(2): 184–199.223. [Niederman, 1991] Niederman, F., Brancheau, J.C. and Wetherbe, J.C. (1991). Information Systems Issues for the 1990 s, MIS
Quarterly 15(4): 475–500.224. [Nolan, 1979] Nolan, R.L., ‘Managing the Crisis in Data Processing’, Harvard Business Review, March/April 1979.225. [Nolan, 1989] Nolan, R.L. , A.H.J.B. Schotgerrits, ‘Transformatie in organisaties door informatietechnologie’, Informatie, jaargang
1989, nr. 12, p. 901-101.226. [Nolan, 1992] Nolan, R.L, Koot, W.J.D. ‘De actualiteit van de Nolan fasentheorie’ 1992, no. 31, blz. 77 – 88, Holland Management
Review.227. [Nolan, 2005] Nolan, R. and McFarlan, F.W. (2005) ‘Information Technology and the Board of Directors’ Harvard Business Review,
(83:10), pp. 96-106.228. [Noordam, 1999] Noordam, P., J. van den Oever , M. Zimmerman, Performance-verbetering, issues in ondernemen met IT,
TenHagen & Stam, Den Haag, 1999.229. [Noordam, 2001] Noordam, P, van der Vlist, A, Derksen, B, ‘Trends in IT 2001, op tijd investeren in de juiste technologie’,
TenHagenStam, april 2001230. [Noordam, 2005] Noordam, P., Inrichten en optimaliseren van organisaties, IT-gedreven organisatieverbetering, Academic

330 Appendices
Service, Den Haag, 2005.231. [Noordam, 2006] Noordam, Peter, Barry Derksen , Aart van der Vlist, ‘Trends in IT 2006-2007: Op tijd investeren in de juiste
technologie’, TenHagen & Stam, Den Haag, 2006, 11e editie.232. [Noordam, 2008] Noordam, P.G., Derksen, B., ‘IT beheer objecten’, presentatie aan RE / RO opleiding bij Universiteit van
Amsterdam (Amsterdam Business School), 2008.233. [Nuland, 2002] Nuland e.a., ‘Excellent, een handleiding voor de toepassing van het EFQM-Excellence model’, november 2002.234. [Ofman, 1992], Ofman, D., ‘Bezieling en kwaliteit in organisaties’, Servire, Cothen, 1992.235. [Oh, 2007], Oh, W., Pinsonneault, A., ‘On the assessment of the strategic value of information technologies: conceptual and
analytical approaches’ , MIS Quarterly vol. 31 no.2, pp. 239-267/June 2007.236. [Oosterhaven, 2003]. Oosterhaven, J.A., ‘ICT strategie en –organisatie, in theorie en praktijk’ TenHagenStam, Den Haag, 2003.237. [Oosterhaven, 2008] Oosterhaven, A. ‘Regie op outsourcing, grip op uitbestedingsrelaties’, Uitgeverij TIEM, 2008238. [Oosterhaven, 2009] Oosterhaven, J.A., ‘Innovaties in outsourcing, de standaard voorbij’, Uitgeverij TIEM, June 2009.239. [Oosterhaven, 2011], Oosterhaven, J.A., ‘Business-IT alignment, Koesteren die kloof’. Best Practices Quarterly Review, ITSMF-nl
chapter. No. 5. 2011.240. [Ortiz, 2003], Ortiz, A.S., ‘Testing a model of the relationships among organizational performance, IT business alignment, and IT
goevernance’ , PhD thesis, University of North Texas, Denton, Texas, USA, 2003.241. [Outvorst, 2004] Outvorst, F. van, Donatz. R.,’Functioneel beheer bij pakketten (deel II)’, IT service management best practices 1,
red. J. van Bon, pp. 141-154, van Haren Publishing., 2004.242. [Outvorst, 2005] Outvorst, F. van, R. Donatz , R. van der Pols, ‘Introductie BiSL: Een framework voor functioneel beheer en
informatiemanagement’, IT Service Management Best Practices 2005, ITSMF, 2005.243. [Paashuis, 1996], Paashuis, V.J.B.J., Verberk, R.C.G.H., ‘De bedrijfskundige bol, een rondleiding langs de verschillende
onderzoekscycli’, Bedrijfskunde, Jaargang 68, 1996, no. 5244. [Palmer, 2000] Palmer, J.W. and Markus, M.L. (2000). ‘The Performance Impacts of Quick Response and Strategic Alignment in
Specialty Retailing’, Information Systems Research 11(3): 241–259.245. [Papp, 1999], Papp, R. ‘Business-IT alignment: productivity paradox payoff?’ Industrial management + Data systems, 99(8), pp
367-373, 1999.246. [Parasuramn, 1985] Parasuraman, A., Berry, L.L., Zeithaml, V.A. (1985) ‘A Conceptual Model of Service Quality and Its Implications
for Future Research,’ Journal of Marketing, (49:4), pp. 41-50.247. [Parasuramn, 1988] Parasuraman, Zeitharnl , Berry, ‘SERVQUAL, A multiple-item scale for Measuring Consumer Perceptions of
Service Quality’, Journal of Retailing, Vol. 64 (Spring 1988).248. [Parker, 1988], Parker, M.M., Benson, R.J., Trainor, H.E., ‘Information Economics, linking business performance to information
technology’ Englewood Cliffs, NJ: Prentice Hall , 1998.249. [Peak, 2005] Peak, D., Guynes, C.S. and Kroon, V. (2005). ‘Information Technology Alignment Planning – A case study’, Information
& Management 42(5): 635–649.250. [Pearlman, 2004] Pearlman, E., ‘Welcome to the Crossroads’, CIO Insight 1(45) (October 15, 2004).251. [Peppard, 2003] Peppard, J. and Breu, K. (2003)., ‘Beyond Alignment: A coevolutionary view of the information systems strategy
process’. Twenty-Fourth International Conference on Information Systems, Seattle, USA, 743.252. [Poels, 2006] Poels, R. ‘Beïnvloeden en meten van business – IT alignment’ dissertation, September 2006.253. [Pollalis, 2003] Pollalis, Y.A., ‘Patterns of Co-Alignment in Information-Intensive Organizations: Business performance through
integration strategies’, International Journal of Information Management 23(6): 469–492, 2003.254. [Pols, 2001] Pols, R. van der, ASL: Een framework voor applicatiebeheer, TenHagenStam, Den Haag, 2001.255. [Pols, 2005] Pols, R. van der, ‘Strategisch beheer van de informatievoorziening met ASL en BISL’, Academic service, 2005.256. [Poppo, 2002] Poppo, L., and Zenger, T. (2002) ‘Do formal contracts and relational governance function as substitutes or
complements?’ Strategic Management Journal (23:8), pp. 707-725.257. [Pospal, 2003] Pospal, D., ‘Vier ITIL assessments onder de loep, voorkeur voor KPMG-fasenmodel en OGC’s self assessment’, IT
Beheer, februari 2003.258. [Poston, 2009] Poston, R.S., Kettinger, W.J., and Simon, J.C. (2009) ‘Managing the Vendor Set: Achieving Best Pricing and Quality
Service in IT Outsourcing,’ MIS Quarterly Executive, (8:2), pp. 45-58. 259. [Preston, 2008] Preston, D.S., Karahanna, E., ‘Antecedents of IS Strategic Alignment: A Nomological Network’ Information
Systems Research 0: isre.1070.0159v1-10700159. June 5, 2008.260. [Prewit, 2006] Prewitt, E., Ware, L.C., ‘The state of the CIO’06, The survey’ www.cio.com261. [Pruijm, 1990] Pruijm, Ruud, Corporate Strategy and Strategic Information Systems, Samsom BedrijfsInformatie, Alphen a/d Rijn,
1990.262. [Pyburn, 1983] Pyburn, P.J. (1983). ‘Linking the MIS Plan with Corporate Strategy: An Exploratory Study’, MIS Quarterly 7(2): 1–14.263. [Quinn, 1999], Quinn, R.E., Cameron, K.S., ‘Onderzoeken en veranderen van organisatiecultuur’, Academic Service264. [Raadt, 2005], Raadt, B. van der, Hoorn, J.F., Vliet, H. van, ‘Alignment and maturity are siblings in architecture assessment’ In
CAISe ’05: proceedings of the 17th international conference on Advanced Information Systems Engineering, volume 3520/2005 of LNCS, pages 357-371, 2005.
265. [Rai, 2009] Rai, A., Im, G., and Hornyak, R. (2009) ‘How CIOs can Align IT Capabilities for Supply Chain Relationships,’ MIS Quarterly Executive, (8:1), pp. 9-18.
266. [Ramirez, 1999] Ramirez, R. (1999) ‘Value Co-production: Intellectual Origins and Implications for Practice and Research,’ Strategic
331Appendix A: References
Management Journal, (20:1), pp. 49-65. 267. [Ranganathan, 2007] Ranganathan, C., and Balaji, S. (2007) ‘Critical Capabilities for Offshore Outsourcing of Information Systems,’
MIS Quarterly Executive, (6:3), pp. 147-164.268. [Raymond, 1995] Raymond, L., Pare, G. and Bergeron, F. (1995). ‘Matching Information Technology and Organizational Structure:
An empirical study with implications for performance’, Eurorpean Journal of Information Systems 4(1): 3–16.269. [Reich, 1996] Reich, B.H. and Benbasat, I. (1996). ‘Measuring the Linkage Between Business and Information Technology
Objectives‘, MIS Quarterly 20(1): 55–81.270. [Reich, 2000], Reich, B.H., Benbasat, I.‚ ‘Factors that influence the social dimension of alignment between business and
information technology objectives’ MIS Quarterly 24(1), pp. 81-113, 2000.271. [Reich, 2003] Reich, B.H. and Kaarst-Brown, M.L., (2003). ‘Creating Social and Intellectual Capital Through IT Career Transitions‘,
Journal of Strategic Information Systems 12(2): 91–109.272. [Reponen, 1998] Reponen, T. (1998). ‘The Role of Learning in Information Systems Planning and Implementation‘, in R.D. Galliers
and Baets, Walter R.J. (eds.) Information Technology and Organizational Transformation: Innovation for the 21st Century Organization, 2nd edn., Toronto: John Wiley & Sons, pp. 133–149.
273. [Rigoni, 2006] Rigoni, E., Lunardi, G., Brodbeck, A. & Maçada, A. (2006) ‘Validation of quantitative instruments in information systems research - a study of strategic alignment maturity.’ In: Business Association of Latin American Studies (BALAS). Peru: BALAS.
274. [Rivard, 2007], Rivard, S., Aubert, B.A., ‘Information Technology Outsourcing’ in Advances in Management Information Systems, vol. 8. 31 October 2007.
275. [Rockart, 1996] Rockart, J.F., Earl, M.J. and Ross, J.W. (1996). Eight Imperatives for the New IT Organization, Sloan Management Review 38(1): 43–55.
276. [Roepke, 2000], Roepke, R., Agarwal, R. Ferratt, T.W., ‘Aligning the IT human resource with business vision: the leadership initiative a 3M’ MIS Quarterly 24(2), pp. 327-353, 2000.
277. [Rondinelli, 2001] Rondinelli, D., Rosen, B. and Drori, I. (2001). ‘The Struggle for Strategic Alignment in Multinational Corporations: Managing readjustment during global expansion‘, European Management Journal 19(4):404–416.
278. [Ross, 1996] Ross, J., Beath, C. and Vitale, M. (1996). ‘Develop Long-Term Competitiveness Through IT Assets‘, Sloan Management Review 38(1): 31–45.
279. [Rustagi, 2008], Rustagi, S., King, W.R., Kirsch, J., ‘Predictors of formal control usage in IT outsourcing partnerships’ Information Systems Research, 19(2), pp. 126-143 ,June 2008.
280. [Sabherwal, 1994] Sabherwal, R. and Kirs, P. (1994). ‘The Alignment Between Organizational Critical Success Factors and Information Technology Capability in Academic Institutions‘, Decision Sciences 25(2): 301–330.
281. [Sabherwal, 2001] Sabherwal, R. and Chan, Y.E. (2001). ‘Alignment Between Business and IS Strategies: A Study of Prospectors, Analyzers, and Defenders‘, Information Systems Research 12(1): 11–33.
282. [Santé, 2005] Sante, T. van, ‘Wegwijzer voor het gebruik van IT standaarden, IT Management Topics, Van Haren Publishing, 2005.283. [Sauer, 1997] Sauer, C. and Burn, J.M. (1997). ‘The Pathology of Strategic Management‘, in C. Sauer and P.W. Yetton (eds.) Steps to
the Future, 1st edn., San Francisco, CA: Jossey-Bass.284. [Saunders, 2003], Saunders, M., Lewis, P., Thornhill, A., ‘Research methods for Business sudents’, Pearson Higher Eduction, 2003.285. [Scalon, 2003] Scanlon, J. (2003, January 8, 2003). ‘A Capital One Exec Addresses Alignment‘, CIO Insight 1(22)286. [Scarbrough, 1998] Scarbrough, H. (1998). ‘Linking Strategy and IT-Based Innovation: The Importance of the ‘Management of
Expertise’, in R.D. Galliers and Walter R.J. Baets (eds.) Information Technology and Organizational Transformation: Innovation for the 21st Century Organization, 2nd edn., Toronto: John Wiley & Sons, pp. 19–36.
287. [Schotgerrits, 1987] Schotgerrits, AH.J.B. e.a., Ondernemen met Informatie Technologie: Een commerciële strategie voor bedrijven en overheden, Samsom, Alphen a/d Rijn, 1987.
288. [Schotgerrits, 1996] Schotgerrits, T., World Class IT: Maturity Levels of Management Practices, KPMG, februari 1996.289. [Schotgerrits, 2000] Schotgerrits, T., Focus Interprise, Issues in ondernemen met ICT, World Class IT: Van service- naar
businessgericht met uw ICT-organisatie, KPMG, 2000.290. [Silvius, 2005] Silvius, G., ‘Wederzijdse verwachtingen bepalen success outsourcing’ Management Executive, Kluwer
Management, pp. 30- 33, januari 2005.291. [Silvius, 2008] Silvius, G., ‘Kopzorg nummer 1, Business IT alignment’, in Functioneel Beheer magazine, 2008, p16-17.292. [Simhan, 2002] Simhan, Raja. (2002), ‘An inside view of outsourcing,’ Business Line online edition. Retrieved October 22, 2005,
from http://www.thehindubusinessline.com/ew/2002/10/30/stories/2002103000020100.htm293. [Singh, 2001] Singh, K., ‘Concentratietendensen’, Controllers Magazine, mei 2001.294. [Sledgianowski, 2004] Sledgianowski, D. (2004) ‘Identification of factors affecting the maturity of Business-IT strategic alignment,’
PhD. Dissertation, Stevens Institute of Technology.295. [Sledgianowski, 2005], Sledgianowski, D. Luftman, J., ‘IT-business strategic alignment maturity: a case study’, Journal of cases on
information technology, 7(20), pp. 102-120. 2005.296. [Smaczny, 2001] Smaczny, T. (2001). ‘Is An Alignment Between Business and Information Technology the Appropriate Paradigm
to Manage IT in Today’s Organisations? ‘, Management Decision 39(10): 797–802.297. [Smalley, 2004] Smalley, M. , M. Meijer, ‘Beheerkosten en -baten in de greep: Economische aspecten van beheer van applicaties
onder de loep’, IT Beheer Jaarboek 2004, TenHagen & Stam, Den Haag, 2004.298. [Smith, 1998] Smith, J.H. and Heinrichs, W. (1998). ‘Organizational Alignment Through Information Technology: A web-based
332 Appendices
approach to change‘, ACM Conference, Seattle, USA.299. [Smits, 1993] Smits, M.C.J., ‘De Balanced Business Scorecard: Brug tussen visie en uitvoering’, Controllers Vizier, jaargang 1993, nr.
3.300. [Solli, 2009] Solli-Saether, H., Gottschalk, P., ‘Managing IT Outsourcing Performance’, IGI Global, September 2009, ISBN: 978-1-
60566-796-6.301. [Sphorer, 2008] Spohrer, J., Anderson, L., Pass, N., and Ager, T. (2008) ‘Service Science and Service-Dominant Logic,’ Otago Forum 2
– Academic Papers, Retrieved Oct 10, 2009 from http://www.commerce.otago.ac.nz/marketing/events/OtagoForum/Final%20forum%20papers/Otago%20Forum%20Paper%202_Spohrer.pdf
302. [Sphorer, 2009] Spohrer, J., and Kwan, S. K. (2009) ‘Service Science, Management, Engineering, and Design (SSMED): An Emerging Discipline - Outline & References,’ International Journal of Information Systems in the Service Sector, (1:3).
303. [Starre, 1998], Starre, D. De Jong, B., ‘IT governance and management: results of an international study on IT governance and management typologies’, Utrecht 1998
304. [Straetemans, 2004] Straetemans, R., Jacobsma, J.J., Derksen, B., ‘IT-services op afroep en betalen naar gebruik’, Financieel Actueel, Kluwer, 2004.
305. [Stevens, 1946] Stevens, S.S., ‘On the theory of Scales of Measurement’ , Science, New Series, Vol. 103, No. 2684 (Jun. 7, 1946), pp. 677-680
306. [Strijen, 1991] Strijen, B.M. van, ‘Informatiestrategie ondersteunt ondernemingsstrategie’, Bedrijfskundig Vakblad voor Industrie en Dienstverlening (B&id), juni 1991.
307. [Strikwerda, 2002] Strikwerda, H., ‘Over procesmanagement en performance management, met de procesmanager houden we onszelf voor de gek’, Management Consultant Magazine, year 2002, nr. 4.
308. [Strikwerda, 2003] Strikwerda, J., Shared Service Centers: Van kostenbesparing naar waardecreatie, Koninklijke Van Gorcum/ Stichting Management Studies (SMS), 2003.
309. [Swinkels, 2000] Swinkels, G.P.J., Het managen van investeringen in informatie- en communicatietechnologie, Primavera Working Paper 2000-08, Universiteit van Amsterdam.
310. [Tallon, 2003] Tallon, P. (2003, November 15, 2003). ‘The Alignment Paradox‘, CIO Insight 1(47)311. [Tallon, 2007], Tallon, P.P., ‘A Process-oriented perspective on the alignment of information technology and business strategy’
Journal of Management Information Systems / Winter 2007-8 , vol. 24, no.3, pp 227-268.312. [Tan, 1995] Tan, F. B. (1995). ‘The Responsiveness of Information Technology to Business Strategy Formulation: An empirical
study‘. Journal of Information Technology 10(3): 171–178.313. [Tan, 2006] Tan, F.B. and Gallupe, B. (2006). ‘Aligning Business and Information Systems Thinking: A Cognitive Approach‘,
Engineering Management, IEEE Transactions 53(2): 223–237.314. [Tapia, 2009], Tapia, R.G.S. , ‘Assessing business – IT alignment in networked organizations’ PhD. Dissertation, University of
Twente, December 4th 2009.315. [Tavakolian, 1989] Tavakolian, H. (1989). ‘Linking the Information Technology Structure with Organizational Competitive
Strategy: A survey‘, MIS Quarterly 13(3): 309–317.316. [Teo, 1999] Teo, Thompson S.H. and Ang, James S.K. (1999). ‘Critical Success Factors in the Alignment of IS Plans with Business
Plans‘, International Journal of Information Management 19(1): 173–185. ICEX, 1999317. [Thallon, 2000] Tallon, P.P., Kraemer, K.L. and Gurbaxani, V. (2000). ‘Executives’ Perceptions of the Business Value of Information
Technology: A process-oriented approach‘, Journal of Management Information Systems 16(4): 145.318. [Thiadens, 2003] Thiadens, T., Beheer van IT-voorzieningen, Academic Service, Den Haag, 2003.319. [Thorogood, 2003] Thorogood, A., Yetton, P., Vlasic, A. and Spiller, J. (2003). ‘Strategic IT at SA water: A case study in alignment,
outsourcing and governance‘ No. AT-0910-3). Australian Graduate School of Management: Cords/Welsearch Ltd and the Fujitsu Centre for Managing Information Technology in Organisations.
320. [Tiwana, 2007], Tiwana, A., Bush, A.A., ‘A Comparison of Transaction Cost, Agency, and Knowledge-Based Predictors of IT Outsourcing Decisions: A U.S.-Japan Cross-Cultural Field Study’, Journal of Management Information Systems, Vol. 24 (1), pp. 259 – 300, 2007
321. [Treacy, 1992], Treacy, M., Wiersema, F., ‘Customer intimacy and other value disciplines’ Harvard Business Review, 1992.322. [Treacy, 1995], Treacy, M., Wiersema, F., ‘The discipline of market leaders’, Addison-Wesley, 1995.323. [Triest, 1999], Triest, S.P. van, ‘Bedrijfskunde en methodologie’ Bedrijfskunde, jaargang 71, 1999, no. 1.324. [Tuin, 2006], Tuin, E, IT service magazine, ‘Breng IT terug naar de business’ November 2006.325. [Vargo, 2004] Vargo, S.L., and Lusch, R.F. (2004) ‘Evolving to a New Dominant Logic for Marketing,’ Journal of Marketing, (68:1), pp.
1-17. 326. [Venkatraman, 1991], Venkatraman, N., ‘IT induced business reconfiguration’ M.S.Scott Mortaon (ed), The corporation of the
1990’s, Oxford.327. [Venkatraman, 1993] Venkatraman, N., Henderson, J.C. and Oldach, S. (1993). ‘Continuous Strategic Alignment: Exploiting
Information Technology Capabilities for Competitive Success‘, European Management Journal 11(2): 139–149.328. [Verschuren, 2004], Verschuren, P., Doorewaard, H., ‘Het ontwerpen van een onderzoek’ Uitgeverij Lemma, Utrecht, 2004, ISBN:
905189886x329. [Verschuur, 2008] Verschuur, J., ‘Resultaten ICT barometer over ICT uitbesteding aan lagelonenlanden, ICT offshore outsourcing’
ICT barometer, Ernst & Young, 27 november 2008. (available online at: http://www.ict-barometer.nl/rapporten.php)330. [Volberda, 2004], Volberda, H.W., ‘De flexibele onderneming, strategieën voor succesvol concurreren’ Kluwer, Deventer, 2004.
333Appendix A: References
331. [Vosselman, 1996], Vosselman, E.G.J., ’De betekenis van de bedrijfskundige gevalstudie voor theorievorming’, Bedrijfskunde, jaargang 68, 1996, no. 2
332. [Vroom, 2003] Vroom, P. de , G. Hensels, ‘De perversie van ITIL’, Automatisering Gids, 2 mei 2003.333. [Walker, 1985], Walker, G., ‘Strategic sourcing, vertical integration and transaction costs.’, Interfaces, 18(3), pp. 62-73., 1985.334. [Walker, 1999] Walker, J.T., ‘Statistics in Criminal Justice: Analysis and interpretation’, Jones & Bartlett Learning, 1 August 1999, pp
29-30.335. [Watson, 1997] Watson, R.T., Kelly, G.G., Galliers, R.D. and Brancheau, J.C. (1997). ‘Key Issues in Information Systems Management:
An international perspective‘, Journal of Management Information Systems 13(4): 91–115.336. [Weijers, 2006] Weijers, G., Verhoef, D., ‘De RfP voor IT outsourcing, management guide’ , ITSMF-NL, 2006.337. [Wiliamson, 1999] Williamson, O. E. (1999) ‘The Mechanisms of Governance’ Oxford University Press: Oxford, UK. 338. [Wilkinson, 2008] Wilkinson, P., ‘ABC of ICT- card deck’ van Haren publishing, 2008.339. [Wilkinson, 2008], Wilkinson, P., Schilt, J., ABC of ICT - An Introduction to the Attitude, Behavior and Culture of ICT , van Haren
publishing, 2008340. [Willcocks, 1995] L. Willcocks, M. Lacity And G. Fitzgerald, ‘Information Technology Outsourcing in Europe and the
USA’Assessment Issues’ International Journal of Information Management, Vol. 15, No. 5, pp. 333-351, 1995, Elsevier Science Ltd341. [Willcocks, 1998] Willcocks, L.P., and Kern, T. (1998) ‘IT Outsourcing as Strategic Partnering: The Case of the UK Inland Revenue,’
European Journal of Information Systems (7:2), pp. 29-45.342. [Willcoxson, 2004], Willcoxson, L., Chatham, R., ‘Progress in the IT/business relationship: a longitudinal assessment ‘ Journal of
information technology, vol. 19, no. 1, pp. 71-80. March 2004.343. [Williamson, 1979], Williamson, O.E. ‘Transaction Cost Economics: The governance of contractual relation’ Journal of Law &
Economics (22:2), 1979, pp. 232-262.344. [Wuensch, 2012], Wuensch, K., ‘Karl Wuensch’s Statistics lessons’, East Carolina University, Department of Pscychology, http://
core.ecu.edu/psyc/wuenschk/StatsLessons.htm. 345. [Yetton, 1994] Yetton, P.W. (1994). False Prophecies, Successful Practice and Future Directions in IT Management‘, Proceedings
of the IFIP TC8 Open Conference: Business Process Re-Engineering: Information Systems Opportunities and Challenges, Queensland Gold Coast, Australia.
346. [Zee, 1996] van der Zee, H. ‘In search of the value of Information Technology’, PhD. dissertation, May 1996.347. [Zee, 1999] Van Der Zee, J.T.M. and De Jong, B. (1999). Alignment is Not Enough: Integrating business and information
technology management with the balanced business scorecard, Journal of Management Information Systems 16(2): 137–156.348. [Zee, 1999] Zee, H. van der, Wijngaarden, P. van, ‘Strategic Sourcing and partnerships, challenging scenarios for IT alliances in the
network era’, Addison Wesley Longman, 1999. 349. [Zee, 2001], Zee, H. van der, Laagland, P., Hafkenscheid, B., ‘Architectuur als managementinstrument: Beheersing en besturing
van complexiteit in het netwerktijdperk.’ Ten Hagen Stam Uitgevers, 2001.350. [Zee, 2004] Zee, H. van der, Derksen, B. ’10 jarig jubilieum Business & IT Trends Institute’ presentatie 10 jarig jubilieum, Business &
IT Trends Institute.351. [Zeithaml, 1991] Zeithaml, V., Parasuraman, A., and Berry, L. (1991) ‘Refinement and Reassessment of the SERVQUAL Scale’,
Journal of Retailing, (67:4), pp. 420-450.352. [Zviran, 1990] Zviran, M., ‘Relationships Between Organizational and Information Systems Objectives: Some empirical evidence’,
Journal of Management Information Systems 7(1): 65–84. (1990).
Websites
http://home.aisnet.org/associations/7499/files/Index_Markup.cfmhttp://itmarketwatch.com/event.php?id=BITAD3&se=programmehttp://mesharpe.metapress.com http://www.alignjournal.comhttp://www.aslbislfoundation.org/nl/asl/asl_bestpractices.htmhttp://www.bita-center.comhttp://www.bitti.nlhttp://www.cio.com/http://www.cmminews.com/2008/http://www.ict-barometer.nl/rapporten.phphttp://www.informationweek.comhttp://www.itmarketwatch.comhttp://www.library.umass.edu/subject/business/ejournalimpact.htmlhttp://www.managementsite.nl/http://www.simnet.org http://www.software-quality-assurance.org/index.htmhttp://www.isaca.org
334 Appendices
Appendix BLinkedIn groups addressed for response
All LinkedIn groups can be found at http://www.linkedin.com
Academic Service Nederland
alumni Masterclass Institute
Alumni Vrije Universiteit, Information Sciences
Alumnivereniging VUsie
bITa - Business IT Alignment
BITTI Kenniscentrum
Business & IT Network (BITNET) 400+ senior members
Business & Jobs NEDERLAND
Business/IT FUSION
Certified in the Governance of Enterprise Information Technology
Certified in the Governance of Enterprise IT (CGEIT)
Cloud Computing – Microsoft Nederland
Consultants Network
CORA: Bedrijfs- en ICT-referentiearchitectuur woningcorporaties
CorporatieGids
335Appendix B: LinkedIn groups addressed for response
De Week van Kwaliteitsmanagement
Enterprise Architecture Conference Europe
Good Automation Manufacturing Practices COP Benelux
ISACA - IT Governance Professionals
ISACA Group
ISO 38500 for IT Governance
IT Audit & Risk
IT Audit and IT Risk Management NL
IT Business Alignment
IT Executive lezersgroep
IT Governance
IT Governance Institute
ITAG Research Institute
KPMG
Magazine TIEM
Methoden & Technieken
MSc Alumni van DNV-CIBIT-Middlesex University
Nederlandse ICT Managers
NOVI

336 Appendices
Operational Audit netwerk NL
Project & Program Management for Banking and Finance in The Nether-
lands
Rijnlands Organiseren & Veranderen
Risk IT
Saxion Hogescholen Alumni
Solutions on Solar
VIP (met o.a. Léon de Caluwé en Yvonne Burger)
VRI - Vereniging voor Registerinformatici
Vrienden van BNR
VU Connected
WITTEC - IT Trends & Employability
World Class IT practitioners and alumni
Ziekenhuis ICT Management

337Appendic C: IT outsourcing questionnaire
Appendix CIT outsourcing questionnaire
The questionnaire used is translated from Dutch.
Interview results were processed towards the answer possibilities described below.
ITO characteristic Question Answer possibilitiesScore processed in SPSS
Scope ITO organisational
How is IT outsourcing management organised within your company?
each functional unit within the organization has primary authority for their IT infrastructure, standards, and application resource decisions
1
a corporate IT unit (or other central unit) has primary responsibility for architecture, common systems, and standards decisions, while each functional unit has primary authority for application resource decisions
2
a corporate IT unit (or other central unit) has primary authority for architecture, standards, and application resource decisions
3
Scope ITO functional
To what degree are the following elements outsourced?
Technical management:– Technical application management– Application hosting– Security management– External networks
Per sub-item:
1 (none / not significant, less than 10%);
2 (limited, 10-25%);
3 (partly, 26-50%);
4 (significant, 51-75%);
5 (almost) completely, more than 75%).
End user management :– Internal networks– File, print, mail servers– Workspace automation– Help & service desks– Break / fix services
Application management:– System development– System integration– Functional application management– Test management
Functional management :– Requirements definition– User and acceptance tests– Realisation not IT changes– Coordinate IT– Define information supply policy
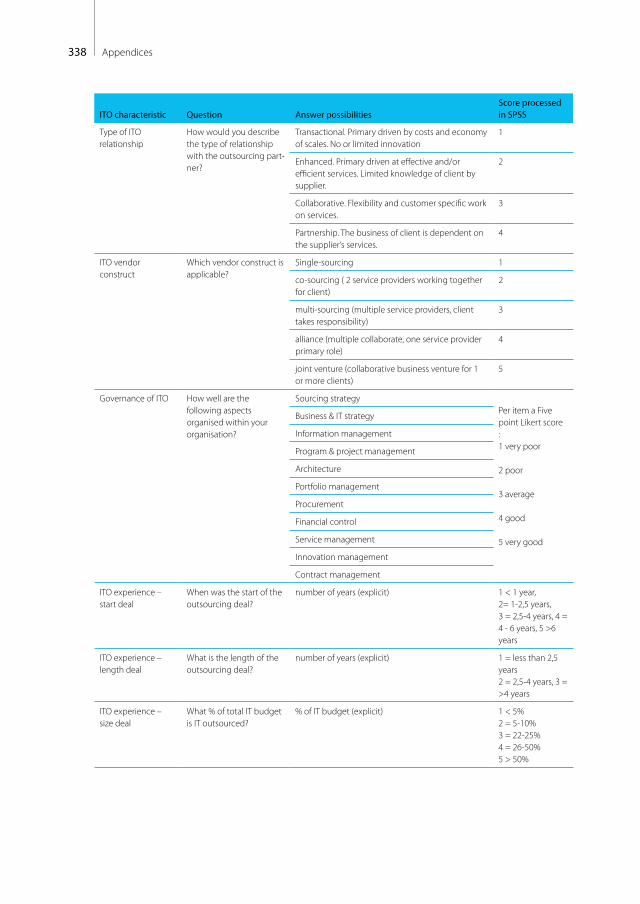
338 Appendices
ITO characteristic Question Answer possibilitiesScore processed in SPSS
Type of ITO relationship
How would you describe the type of relationship with the outsourcing part-ner?
Transactional. Primary driven by costs and economy of scales. No or limited innovation
1
Enhanced. Primary driven at effective and/or efficient services. Limited knowledge of client by supplier.
2
Collaborative. Flexibility and customer specific work on services.
3
Partnership. The business of client is dependent on the supplier’s services.
4
ITO vendor construct
Which vendor construct is applicable?
Single-sourcing 1
co-sourcing ( 2 service providers working together for client)
2
multi-sourcing (multiple service providers, client takes responsibility)
3
alliance (multiple collaborate, one service provider primary role)
4
joint venture (collaborative business venture for 1 or more clients)
5
Governance of ITO How well are the following aspects organised within your organisation?
Sourcing strategyPer item a Five point Likert score :1 very poor
2 poor
3 average
4 good
5 very good
Business & IT strategy
Information management
Program & project management
Architecture
Portfolio management
Procurement
Financial control
Service management
Innovation management
Contract management
ITO experience – start deal
When was the start of the outsourcing deal?
number of years (explicit) 1 < 1 year,2= 1-2,5 years, 3 = 2,5-4 years, 4 = 4 - 6 years, 5 >6 years
ITO experience – length deal
What is the length of the outsourcing deal?
number of years (explicit) 1 = less than 2,5 years2 = 2,5-4 years, 3 = >4 years
ITO experience – size deal
What % of total IT budget is IT outsourced?
% of IT budget (explicit)
1 < 5%2 = 5-10%3 = 22-25%4 = 26-50%5 > 50%
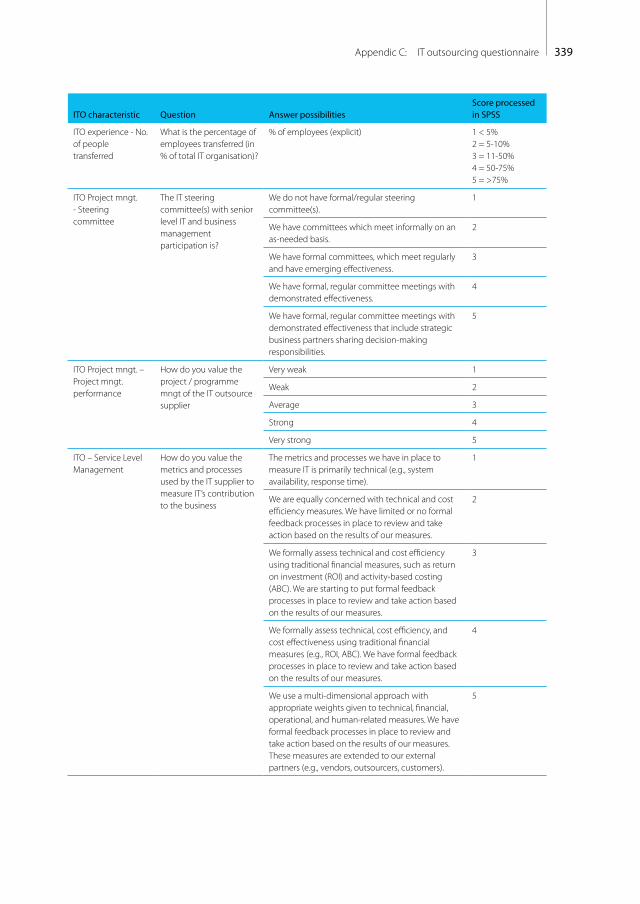
339Appendic C: IT outsourcing questionnaire
ITO characteristic Question Answer possibilitiesScore processed in SPSS
ITO experience - No. of people transferred
What is the percentage of employees transferred (in % of total IT organisation)?
% of employees (explicit) 1 < 5%2 = 5-10%3 = 11-50%4 = 50-75%5 = >75%
ITO Project mngt. - Steering committee
The IT steering committee(s) with senior level IT and business management participation is?
We do not have formal/regular steering committee(s).
1
We have committees which meet informally on an as-needed basis.
2
We have formal committees, which meet regularly and have emerging effectiveness.
3
We have formal, regular committee meetings with demonstrated effectiveness.
4
We have formal, regular committee meetings with demonstrated effectiveness that include strategic business partners sharing decision-making responsibilities.
5
ITO Project mngt. – Project mngt. performance
How do you value the project / programme mngt of the IT outsource supplier
Very weak 1
Weak 2
Average 3
Strong 4
Very strong 5
ITO – Service Level Management
How do you value the metrics and processes used by the IT supplier to measure IT’s contribution to the business
The metrics and processes we have in place to measure IT is primarily technical (e.g., system availability, response time).
1
We are equally concerned with technical and cost efficiency measures. We have limited or no formal feedback processes in place to review and take action based on the results of our measures.
2
We formally assess technical and cost efficiency using traditional financial measures, such as return on investment (ROI) and activity-based costing (ABC). We are starting to put formal feedback processes in place to review and take action based on the results of our measures.
3
We formally assess technical, cost efficiency, and cost effectiveness using traditional financial measures (e.g., ROI, ABC). We have formal feedback processes in place to review and take action based on the results of our measures.
4
We use a multi-dimensional approach with appropriate weights given to technical, financial, operational, and human-related measures. We have formal feedback processes in place to review and take action based on the results of our measures. These measures are extended to our external partners (e.g., vendors, outsourcers, customers).
5
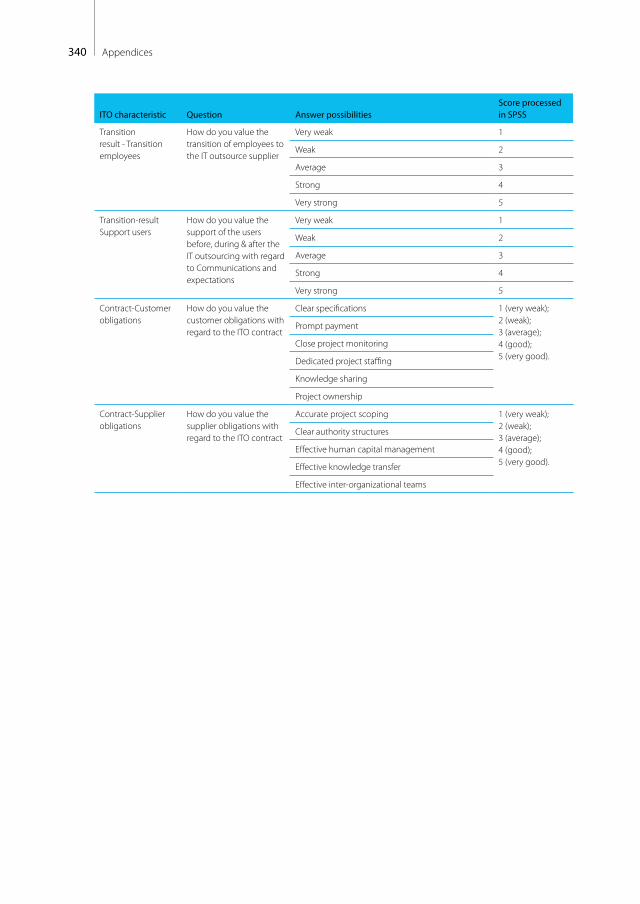
340 Appendices
ITO characteristic Question Answer possibilitiesScore processed in SPSS
Transition result - Transition employees
How do you value the transition of employees to the IT outsource supplier
Very weak 1
Weak 2
Average 3
Strong 4
Very strong 5
Transition-result Support users
How do you value the support of the users before, during & after the IT outsourcing with regard to Communications and expectations
Very weak 1
Weak 2
Average 3
Strong 4
Very strong 5
Contract-Customer obligations
How do you value the customer obligations with regard to the ITO contract
Clear specifications 1 (very weak);2 (weak);3 (average);4 (good);5 (very good).
Prompt payment
Close project monitoring
Dedicated project staffing
Knowledge sharing
Project ownership
Contract-Supplier obligations
How do you value the supplier obligations with regard to the ITO contract
Accurate project scoping 1 (very weak);2 (weak);3 (average);4 (good);5 (very good).
Clear authority structures
Effective human capital management
Effective knowledge transfer
Effective inter-organizational teams

341Appendix D: BIA questionnaire
Appendix DBIA questionnaire
The BIA questionnaire was performed online. If executed for a case organisation the template was ad-
justed in the look and feel of that organisation. Specific data was obtained beforehand (e.g. respond-
ent data). The survey research questionnaire is given in this appendix (English). The questionnaire is
online available via www.bitti.nl . Next to the English version a Dutch version is available at www.bitti.
nl or can be requested (email: [email protected])
Part 1: Organisational specifics
1. Organizational specifics
Organisation _____________________________________
function/role _____________________________________
2. In which industry is your organisation?
IT services organisation
Construction
Central government
Chemical / pharmaceutical
Financial services (banking / insurance)
Healthcare / social services
Retail
Industry / oil / gas
Local government
Media / entertainment
Utility (energy / water / telecom)
Education
Transport / logistics
Service companies (e.g. consulting / law firms)
Service companies (e.g. employability)
Housing Corporation
3. The number of employees of your entire organisation is?
0 - 50 employees
51 - 100
101 - 250

342 Appendices
251 - 500
501 - 1000
1001 - 5000
5001 - 10.000
> 10.000 employees
4. which level of strategic alignment maturity do you believe best represents your organiza-
tion today?
Level1, initial/ad-hoc process (Not professional at all)
Level 2, Committed process (process realised and used)
Level 3, Realised and focussed process (process realised and effectiveness measurements are
performed)
Level 4, Improved and managed process (besides previously called aspects measurements
take place for continuous improvement)
Level 5, Optimised process (process is very effective and efficient)
5. Which role describes best your relationship to the use of IT?
CEO, COO and/ or senior management level responsible for business strategy, business plan-
ning.
CIO and/or senior management level responsible for IT governance, linkage IT strategy and
business strategy
Client of IT (demand side), responsible for realising organisational goals and using IT
Supplier of IT (supply side), responsible for realisation and maintenance of IT services and
products
Employed within (internal) IT organisation
Employed within (external) IT supplier
User of IT (end user)
6. Please, give a short description of the situation (what is the most important role of IT?, Is
IT outsourced?, other important aspects?).
___________________________________________________________________________
___________________________________________________________________________
___________________________________________________________________________
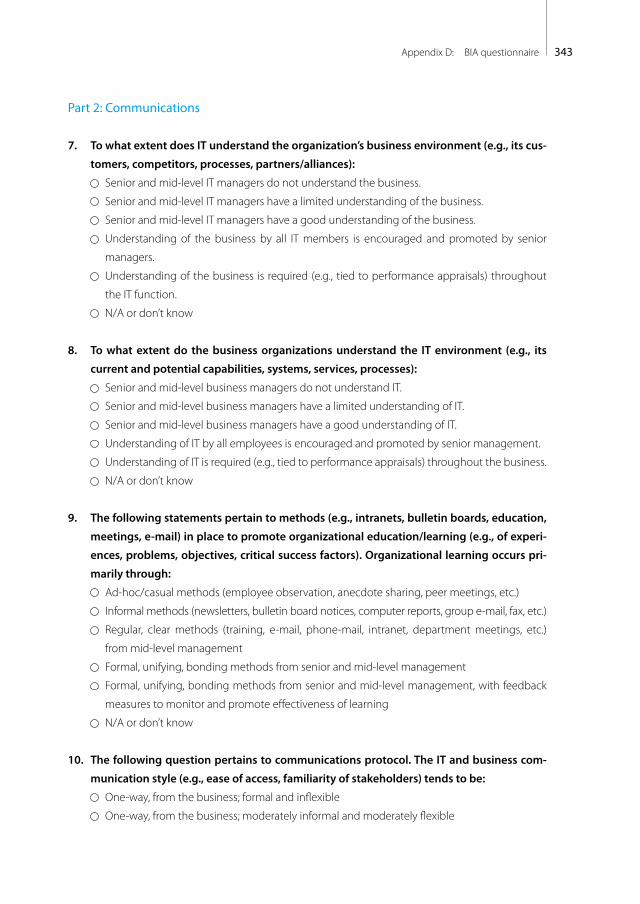
343Appendix D: BIA questionnaire
Part 2: Communications
7. To what extent does IT understand the organization’s business environment (e.g., its cus-
tomers, competitors, processes, partners/alliances):
Senior and mid-level IT managers do not understand the business.
Senior and mid-level IT managers have a limited understanding of the business.
Senior and mid-level IT managers have a good understanding of the business.
Understanding of the business by all IT members is encouraged and promoted by senior
managers.
Understanding of the business is required (e.g., tied to performance appraisals) throughout
the IT function.
N/A or don’t know
8. To what extent do the business organizations understand the IT environment (e.g., its
current and potential capabilities, systems, services, processes):
Senior and mid-level business managers do not understand IT.
Senior and mid-level business managers have a limited understanding of IT.
Senior and mid-level business managers have a good understanding of IT.
Understanding of IT by all employees is encouraged and promoted by senior management.
Understanding of IT is required (e.g., tied to performance appraisals) throughout the business.
N/A or don’t know
9. The following statements pertain to methods (e.g., intranets, bulletin boards, education,
meetings, e-mail) in place to promote organizational education/learning (e.g., of experi-
ences, problems, objectives, critical success factors). Organizational learning occurs pri-
marily through:
Ad-hoc/casual methods (employee observation, anecdote sharing, peer meetings, etc.)
Informal methods (newsletters, bulletin board notices, computer reports, group e-mail, fax, etc.)
Regular, clear methods (training, e-mail, phone-mail, intranet, department meetings, etc.)
from mid-level management
Formal, unifying, bonding methods from senior and mid-level management
Formal, unifying, bonding methods from senior and mid-level management, with feedback
measures to monitor and promote effectiveness of learning
N/A or don’t know
10. The following question pertains to communications protocol. The IT and business com-
munication style (e.g., ease of access, familiarity of stakeholders) tends to be:
One-way, from the business; formal and inflexible
One-way, from the business; moderately informal and moderately flexible

344 Appendices
Two-way; formal and inflexible
Two-way; moderately informal and moderately flexible
Two-way; informal and flexible
N/A or don’t know
11. The following statements pertain to the extent in which there is knowledge sharing (in-
tellectual understanding and appreciation of the problems/opportunities, tasks, roles,
objectives, priorities, goals, direction, etc.) between IT and business:
Knowledge sharing is on an ad-hoc basis.
Knowledge sharing is somewhat structured and/or structure is beginning to be created.
There is structured sharing around key functional unit processes.
There is formal sharing at the functional unit level and at the corporate level.
There is formal sharing at the functional unit level, at the corporate level, and with business
partners/alliances.
N/A or don’t know
12. The following statements pertain to the role and effectiveness of IT and business liaisons:
We do not use liaisons, or if we do, we do so on an ad-hoc, as needed basis.
We regularly use liaisons to transfer IT knowledge to the business and business knowledge to
IT. They are the primary contact point for interactions between IT and the business. Liaisons
are not usually used to facilitate relationship development.
We regularly use liaisons to transfer IT knowledge to the business and business knowledge to
IT. They occasionally facilitate relationship development.
We regularly use liaisons to facilitate the transfer of IT knowledge to the business and busi-
ness knowledge to IT. Their primary objective is to facilitate internal relationship develop-
ment.
We regularly use liaisons to facilitate the transfer of IT knowledge to the business and external
partners and business knowledge to IT. Their primary objective is to facilitate relationship de-
velopment across the business and its external partners.
N/A or don’t know
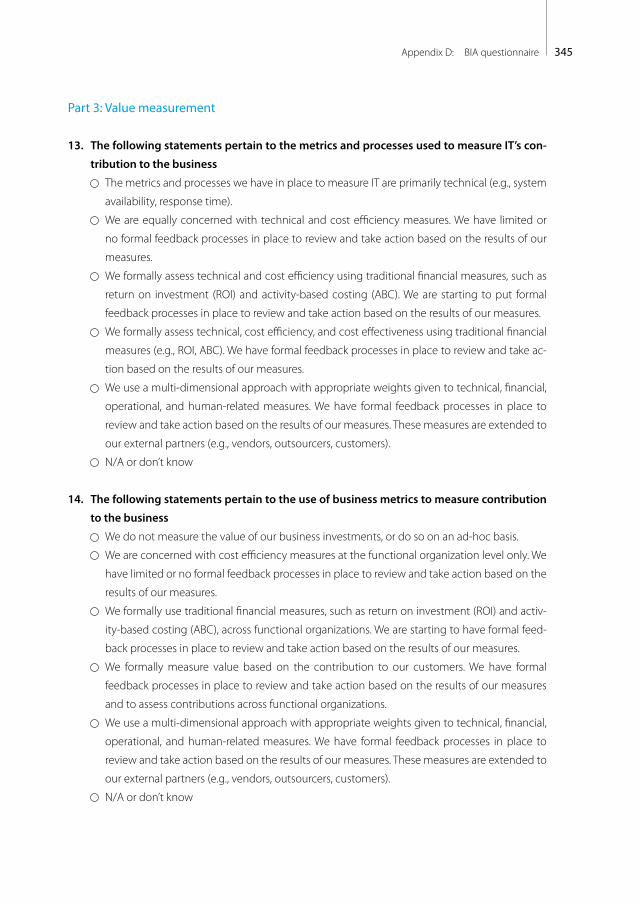
345Appendix D: BIA questionnaire
Part 3: Value measurement
13. The following statements pertain to the metrics and processes used to measure IT’s con-
tribution to the business
The metrics and processes we have in place to measure IT are primarily technical (e.g., system
availability, response time).
We are equally concerned with technical and cost efficiency measures. We have limited or
no formal feedback processes in place to review and take action based on the results of our
measures.
We formally assess technical and cost efficiency using traditional financial measures, such as
return on investment (ROI) and activity-based costing (ABC). We are starting to put formal
feedback processes in place to review and take action based on the results of our measures.
We formally assess technical, cost efficiency, and cost effectiveness using traditional financial
measures (e.g., ROI, ABC). We have formal feedback processes in place to review and take ac-
tion based on the results of our measures.
We use a multi-dimensional approach with appropriate weights given to technical, financial,
operational, and human-related measures. We have formal feedback processes in place to
review and take action based on the results of our measures. These measures are extended to
our external partners (e.g., vendors, outsourcers, customers).
N/A or don’t know
14. The following statements pertain to the use of business metrics to measure contribution
to the business
We do not measure the value of our business investments, or do so on an ad-hoc basis.
We are concerned with cost efficiency measures at the functional organization level only. We
have limited or no formal feedback processes in place to review and take action based on the
results of our measures.
We formally use traditional financial measures, such as return on investment (ROI) and activ-
ity-based costing (ABC), across functional organizations. We are starting to have formal feed-
back processes in place to review and take action based on the results of our measures.
We formally measure value based on the contribution to our customers. We have formal
feedback processes in place to review and take action based on the results of our measures
and to assess contributions across functional organizations.
We use a multi-dimensional approach with appropriate weights given to technical, financial,
operational, and human-related measures. We have formal feedback processes in place to
review and take action based on the results of our measures. These measures are extended to
our external partners (e.g., vendors, outsourcers, customers).
N/A or don’t know

346 Appendices
15. The following statements pertain to the use of integrated IT and business metrics to
measure IT’s contribution to the business
We do not measure the value of our IT business investments, or do so on an ad-hoc basis.
The value measurements for IT and business are not linked. We have limited or no formal
feedback processes in place to review and take action based on the results of our measures.
The value measurements for IT and business are starting to be linked and formalized. We are
also starting to have formal feedback processes in place to review and take action based on
the results of our measures.
We formally link the value measurements of IT and business. We have formal feedback pro-
cesses in place to review and take action based on the results of our measures and to assess
contributions across functional organizations.
We use a multi-dimensional approach with appropriate weight given to IT and business
measures. We have formal feedback processes in place to review and take action based on
the results of our measures. These measures are extended to our external partners (e.g., ven-
dors, outsourcers, customers).
N/A or don’t know
16. The following statements pertain to the use of service level agreements (SLAs):
We do not use SLAs or do so sporadically.
We have SLAs which are primarily technically oriented (response time, length of computer
downtime, etc.), between the IT and functional organizations.
We have SLAs which are both technically oriented and relationship-oriented (user/customer
satisfaction, IT’s commitment to the business, etc.) that are between the IT and functional
organizations and also emerging across the enterprise.
We have SLAs which are both technically-oriented and relationship-oriented, between the IT
and functional organizations as well as enterprise wide.
We have SLAs which are both technically-oriented and relationship-oriented, between the
IT and functional organizations as well as at enterprise wide and with our external partners/
alliances.
N/A or don’t know
17. The following statements pertain to benchmarking practices. Informal practices are such
things as informal interviews, literature searches, company visits, etc., while formal prac-
tices are such things as environmental scanning, data gathering and analysis, determin-
ing best practices, etc.
We seldom or never perform either informal or formal benchmarks.
We occasionally or routinely perform informal benchmarks.
We occasionally perform formal benchmarks and seldom take action based on the findings.
We routinely perform formal benchmarks and usually take action based on the findings.
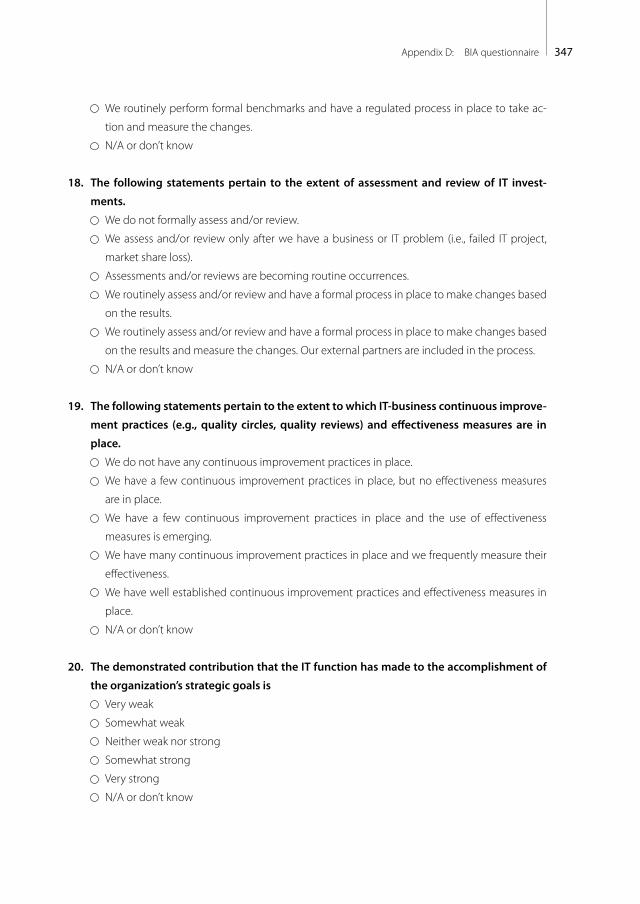
347Appendix D: BIA questionnaire
We routinely perform formal benchmarks and have a regulated process in place to take ac-
tion and measure the changes.
N/A or don’t know
18. The following statements pertain to the extent of assessment and review of IT invest-
ments.
We do not formally assess and/or review.
We assess and/or review only after we have a business or IT problem (i.e., failed IT project,
market share loss).
Assessments and/or reviews are becoming routine occurrences.
We routinely assess and/or review and have a formal process in place to make changes based
on the results.
We routinely assess and/or review and have a formal process in place to make changes based
on the results and measure the changes. Our external partners are included in the process.
N/A or don’t know
19. The following statements pertain to the extent to which IT-business continuous improve-
ment practices (e.g., quality circles, quality reviews) and effectiveness measures are in
place.
We do not have any continuous improvement practices in place.
We have a few continuous improvement practices in place, but no effectiveness measures
are in place.
We have a few continuous improvement practices in place and the use of effectiveness
measures is emerging.
We have many continuous improvement practices in place and we frequently measure their
effectiveness.
We have well established continuous improvement practices and effectiveness measures in
place.
N/A or don’t know
20. The demonstrated contribution that the IT function has made to the accomplishment of
the organization’s strategic goals is
Very weak
Somewhat weak
Neither weak nor strong
Somewhat strong
Very strong
N/A or don’t know

348 Appendices
Part 4: Governance
21. The following statements pertain to strategic business planning with IT participation
We do no formal strategic business planning or, if it is done, it is done on an as-needed basis.
We do formal strategic business planning at the functional unit level with slight IT participation.
We do formal strategic business planning at the functional unit levels with some IT participa-
tion. There is some
inter-organizational planning.
We do formal strategic business planning at the functional unit and across the enterprise
with IT participation.
We do formal strategic business planning at the functional unit, across the enterprise, and
with our business partners/alliances with IT participation.
N/A or don’t know
22. The following statements pertain to strategic IT planning with business participation
We do no formal strategic IT planning or, if it is done, it is done on an as-needed basis.
We do formal strategic IT planning at the functional unit level with slight business participation.
We do formal strategic IT planning at the functional unit levels with some business participa-
tion.
There is some inter-organizational planning.
We do formal strategic IT planning at the functional unit and across the enterprise with the
business.
We do formal strategic business planning at the functional unit, across the enterprise, and with
our business partners/alliances.
N/A or don’t know
23. The following statements pertain to the organization structure of the IT function. Our IT
function is
Centralized, whereby a corporate IT unit (or other central unit) has primary authority for archi-
tecture, standards, and application resource decisions.
Decentralized, whereby each functional unit within the organization has primary authority
for their IT infrastructure, standards, and application resource decisions.
Federated, whereby a corporate IT unit (or other central unit) has primary responsibility for ar-
chitecture, common systems, and standards decisions, while each functional unit has primary
authority for application resource decisions.
N/A or don’t know
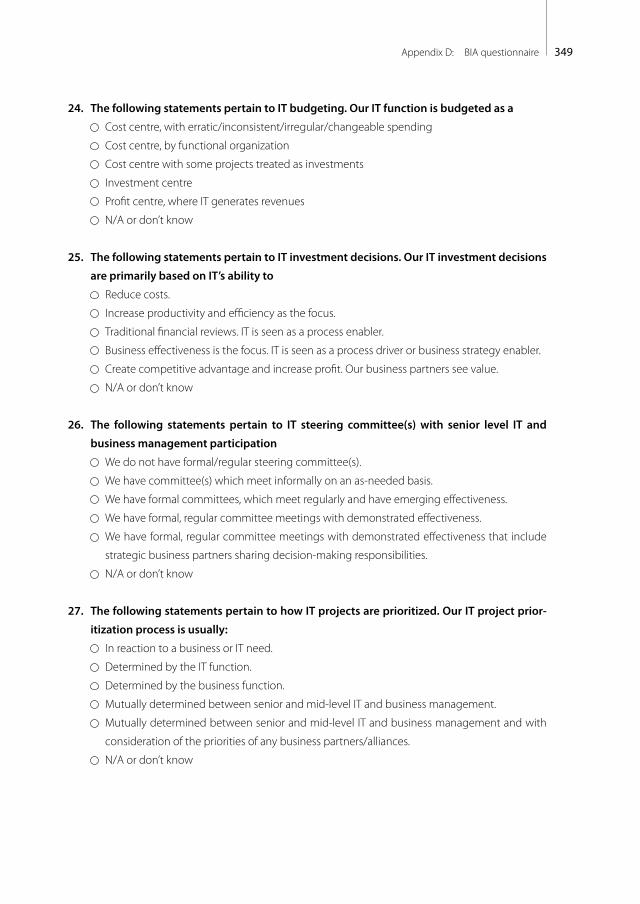
349Appendix D: BIA questionnaire
24. The following statements pertain to IT budgeting. Our IT function is budgeted as a
Cost centre, with erratic/inconsistent/irregular/changeable spending
Cost centre, by functional organization
Cost centre with some projects treated as investments
Investment centre
Profit centre, where IT generates revenues
N/A or don’t know
25. The following statements pertain to IT investment decisions. Our IT investment decisions
are primarily based on IT’s ability to
Reduce costs.
Increase productivity and efficiency as the focus.
Traditional financial reviews. IT is seen as a process enabler.
Business effectiveness is the focus. IT is seen as a process driver or business strategy enabler.
Create competitive advantage and increase profit. Our business partners see value.
N/A or don’t know
26. The following statements pertain to IT steering committee(s) with senior level IT and
business management participation
We do not have formal/regular steering committee(s).
We have committee(s) which meet informally on an as-needed basis.
We have formal committees, which meet regularly and have emerging effectiveness.
We have formal, regular committee meetings with demonstrated effectiveness.
We have formal, regular committee meetings with demonstrated effectiveness that include
strategic business partners sharing decision-making responsibilities.
N/A or don’t know
27. The following statements pertain to how IT projects are prioritized. Our IT project prior-
itization process is usually:
In reaction to a business or IT need.
Determined by the IT function.
Determined by the business function.
Mutually determined between senior and mid-level IT and business management.
Mutually determined between senior and mid-level IT and business management and with
consideration of the priorities of any business partners/alliances.
N/A or don’t know

350 Appendices
28. The ability of the IT function to react/respond quickly to the organization’s changing
business needs is
Very weak
Somewhat weak
Neither weak nor strong
Somewhat strong
Very strong
N/A or don’t know
Part 5: Partnership
29. IT is perceived by the business as
A cost of doing business
Emerging as an asset
A fundamental enabler of future business activity
A fundamental driver of future business activity
A partner with the business that co-adapts/improvises in bringing value to the firm
N/A or don’t know
30. The following statements pertain to the role of IT in strategic business planning
IT does not have a role.
IT is used to enable business processes.
IT is used to drive business processes.
IT is used to enable or drive business strategy.
IT co-adapts with the business to enable/drive strategic objectives.
N/A or don’t know
31. The following statements pertain to the sharing (by IT and business management) of the
risks and rewards (e.g., bonuses) associated with IT-based initiatives (i.e., a project is late
and over budget because of business requirement changes).
IT takes all the risks and does not receive any of the rewards.
IT takes most of the risks with little reward.
Sharing of risks and rewards is emerging.
Risks and rewards are always shared.
Risks and rewards are always shared and we have formal compensation and reward systems
in place that induce managers to take risks.
N/A or don’t know
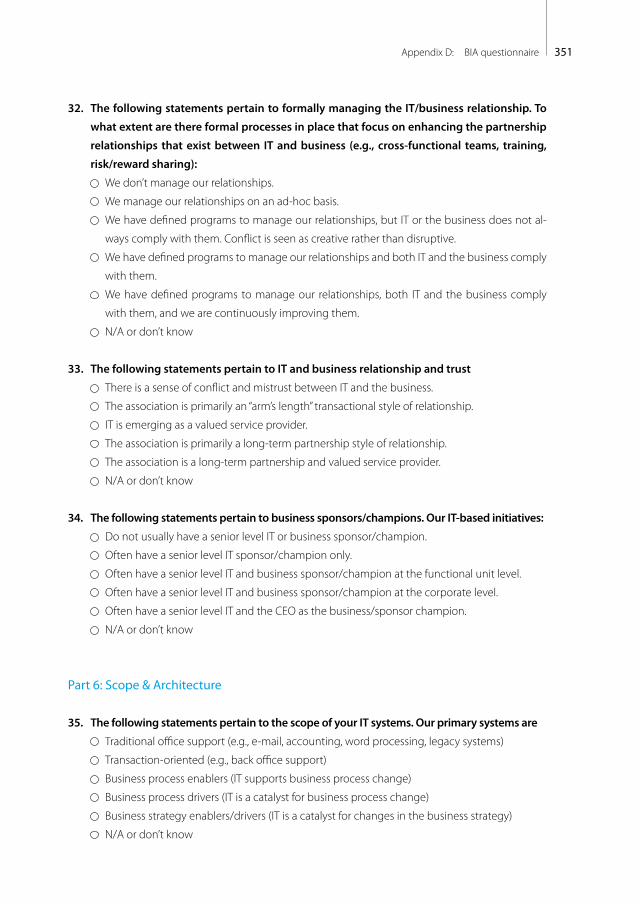
351Appendix D: BIA questionnaire
32. The following statements pertain to formally managing the IT/business relationship. To
what extent are there formal processes in place that focus on enhancing the partnership
relationships that exist between IT and business (e.g., cross-functional teams, training,
risk/reward sharing):
We don’t manage our relationships.
We manage our relationships on an ad-hoc basis.
We have defined programs to manage our relationships, but IT or the business does not al-
ways comply with them. Conflict is seen as creative rather than disruptive.
We have defined programs to manage our relationships and both IT and the business comply
with them.
We have defined programs to manage our relationships, both IT and the business comply
with them, and we are continuously improving them.
N/A or don’t know
33. The following statements pertain to IT and business relationship and trust
There is a sense of conflict and mistrust between IT and the business.
The association is primarily an “arm’s length” transactional style of relationship.
IT is emerging as a valued service provider.
The association is primarily a long-term partnership style of relationship.
The association is a long-term partnership and valued service provider.
N/A or don’t know
34. The following statements pertain to business sponsors/champions. Our IT-based initiatives:
Do not usually have a senior level IT or business sponsor/champion.
Often have a senior level IT sponsor/champion only.
Often have a senior level IT and business sponsor/champion at the functional unit level.
Often have a senior level IT and business sponsor/champion at the corporate level.
Often have a senior level IT and the CEO as the business/sponsor champion.
N/A or don’t know
Part 6: Scope & Architecture
35. The following statements pertain to the scope of your IT systems. Our primary systems are
Traditional office support (e.g., e-mail, accounting, word processing, legacy systems)
Transaction-oriented (e.g., back office support)
Business process enablers (IT supports business process change)
Business process drivers (IT is a catalyst for business process change)
Business strategy enablers/drivers (IT is a catalyst for changes in the business strategy)
N/A or don’t know
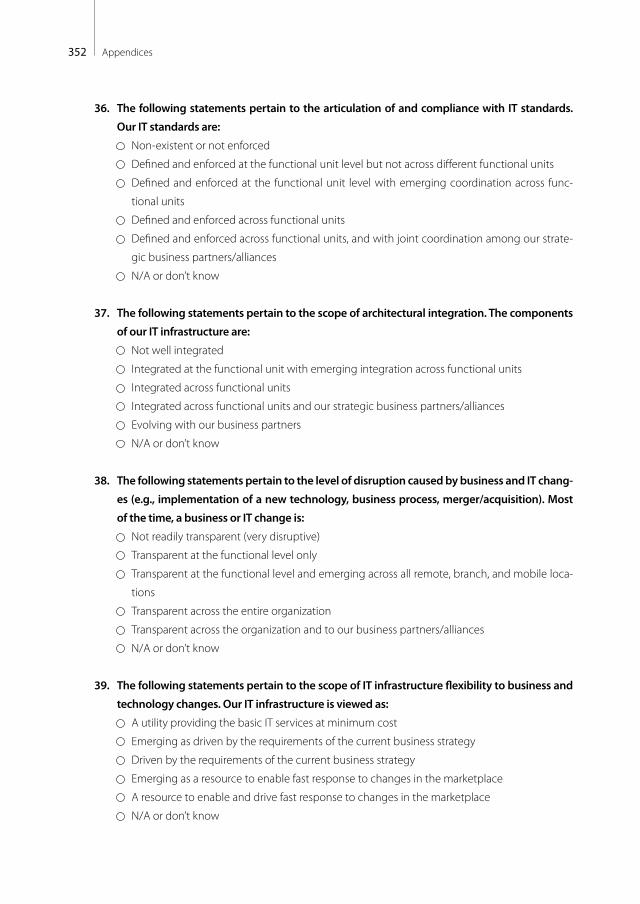
352 Appendices
36. The following statements pertain to the articulation of and compliance with IT standards.
Our IT standards are:
Non-existent or not enforced
Defined and enforced at the functional unit level but not across different functional units
Defined and enforced at the functional unit level with emerging coordination across func-
tional units
Defined and enforced across functional units
Defined and enforced across functional units, and with joint coordination among our strate-
gic business partners/alliances
N/A or don’t know
37. The following statements pertain to the scope of architectural integration. The components
of our IT infrastructure are:
Not well integrated
Integrated at the functional unit with emerging integration across functional units
Integrated across functional units
Integrated across functional units and our strategic business partners/alliances
Evolving with our business partners
N/A or don’t know
38. The following statements pertain to the level of disruption caused by business and IT chang-
es (e.g., implementation of a new technology, business process, merger/acquisition). Most
of the time, a business or IT change is:
Not readily transparent (very disruptive)
Transparent at the functional level only
Transparent at the functional level and emerging across all remote, branch, and mobile loca-
tions
Transparent across the entire organization
Transparent across the organization and to our business partners/alliances
N/A or don’t know
39. The following statements pertain to the scope of IT infrastructure flexibility to business and
technology changes. Our IT infrastructure is viewed as:
A utility providing the basic IT services at minimum cost
Emerging as driven by the requirements of the current business strategy
Driven by the requirements of the current business strategy
Emerging as a resource to enable fast response to changes in the marketplace
A resource to enable and drive fast response to changes in the marketplace
N/A or don’t know
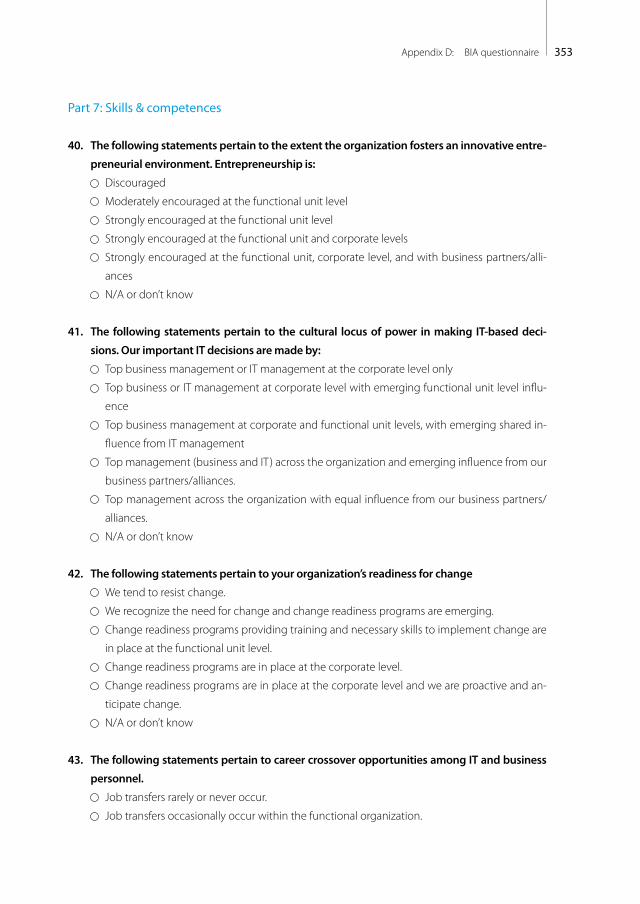
353Appendix D: BIA questionnaire
Part 7: Skills & competences
40. The following statements pertain to the extent the organization fosters an innovative entre-
preneurial environment. Entrepreneurship is:
Discouraged
Moderately encouraged at the functional unit level
Strongly encouraged at the functional unit level
Strongly encouraged at the functional unit and corporate levels
Strongly encouraged at the functional unit, corporate level, and with business partners/alli-
ances
N/A or don’t know
41. The following statements pertain to the cultural locus of power in making IT-based deci-
sions. Our important IT decisions are made by:
Top business management or IT management at the corporate level only
Top business or IT management at corporate level with emerging functional unit level influ-
ence
Top business management at corporate and functional unit levels, with emerging shared in-
fluence from IT management
Top management (business and IT) across the organization and emerging influence from our
business partners/alliances.
Top management across the organization with equal influence from our business partners/
alliances.
N/A or don’t know
42. The following statements pertain to your organization’s readiness for change
We tend to resist change.
We recognize the need for change and change readiness programs are emerging.
Change readiness programs providing training and necessary skills to implement change are
in place at the functional unit level.
Change readiness programs are in place at the corporate level.
Change readiness programs are in place at the corporate level and we are proactive and an-
ticipate change.
N/A or don’t know
43. The following statements pertain to career crossover opportunities among IT and business
personnel.
Job transfers rarely or never occur.
Job transfers occasionally occur within the functional organization.
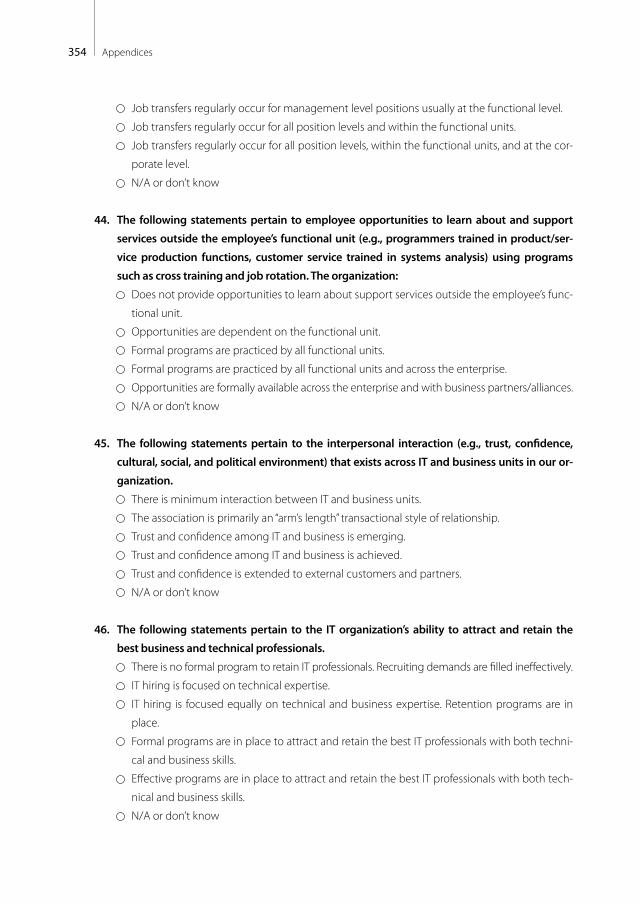
354 Appendices
Job transfers regularly occur for management level positions usually at the functional level.
Job transfers regularly occur for all position levels and within the functional units.
Job transfers regularly occur for all position levels, within the functional units, and at the cor-
porate level.
N/A or don’t know
44. The following statements pertain to employee opportunities to learn about and support
services outside the employee’s functional unit (e.g., programmers trained in product/ser-
vice production functions, customer service trained in systems analysis) using programs
such as cross training and job rotation. The organization:
Does not provide opportunities to learn about support services outside the employee’s func-
tional unit.
Opportunities are dependent on the functional unit.
Formal programs are practiced by all functional units.
Formal programs are practiced by all functional units and across the enterprise.
Opportunities are formally available across the enterprise and with business partners/alliances.
N/A or don’t know
45. The following statements pertain to the interpersonal interaction (e.g., trust, confidence,
cultural, social, and political environment) that exists across IT and business units in our or-
ganization.
There is minimum interaction between IT and business units.
The association is primarily an “arm’s length” transactional style of relationship.
Trust and confidence among IT and business is emerging.
Trust and confidence among IT and business is achieved.
Trust and confidence is extended to external customers and partners.
N/A or don’t know
46. The following statements pertain to the IT organization’s ability to attract and retain the
best business and technical professionals.
There is no formal program to retain IT professionals. Recruiting demands are filled ineffectively.
IT hiring is focused on technical expertise.
IT hiring is focused equally on technical and business expertise. Retention programs are in
place.
Formal programs are in place to attract and retain the best IT professionals with both techni-
cal and business skills.
Effective programs are in place to attract and retain the best IT professionals with both tech-
nical and business skills.
N/A or don’t know

355Appendix D: BIA questionnaire
47. What are the 3 most important IT goals for your organisation in order of importance?
1. ______________________________________________________________
2. ______________________________________________________________
3. ______________________________________________________________
48. What are the 3 most important businessgoals of your organisation in order of importance?
1. ______________________________________________________________
2. ______________________________________________________________
3. ______________________________________________________________
49. Remarks / questions?
_________________________________________________________________
_________________________________________________________________
_________________________________________________________________

356 Appendices
Appendix EITO Survey research questionnaire
The ITO questionnaire as part of the survey research was performed online and was part of the BIA
questionnaire (appendix D). If executed for a case organisation the complete questionnaire for inter-
view was used (appendix C).
1. Which percentage of the total IT budget is outsourced (including hired personal for IT pro-
jects or maintenance)?
less than 5%
5-10%
11-25%
26-50%
over 50%
n.a. / nothing is outsourced & no external usage
2. To what degree is IT technical management outsourced / outtasked?none / not significant,
less than 10%limited, 10-25%
partly, 26-50%
significant, 51-75%
(almost) completely,
> 75%
technical application management
application hosting
security management
external networks
other (please specify)
3. To what degree is end user management outsourced / outtasked?none / not significant,
less than 10%limited, 10-25%
partly, 26-50%
significant, 51-75%
(almost) completely,
> 75%
internal networks
File, Print, Mail Servers
workspace automation
help- & servicedesk services
break/fix services
other (please specify)
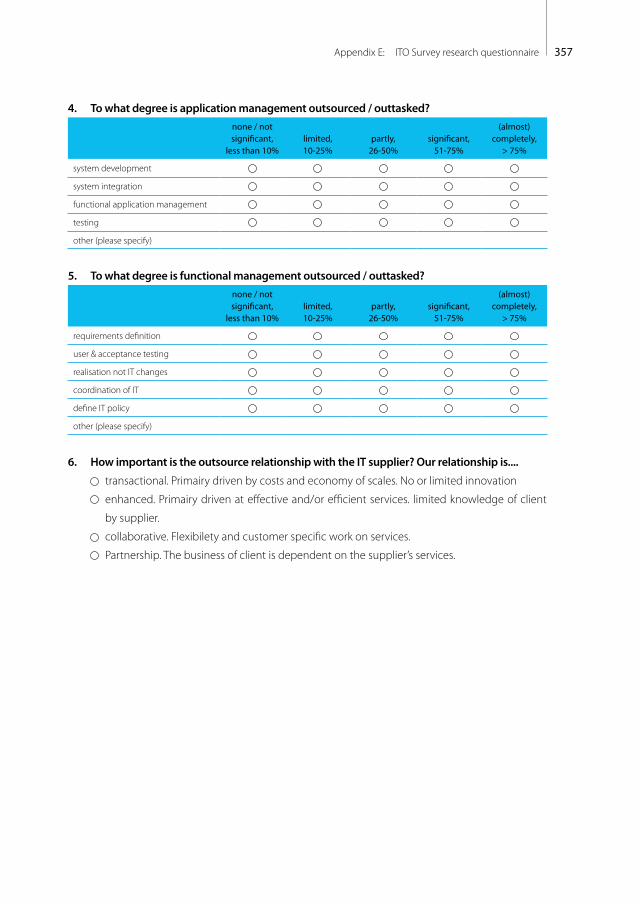
357Appendix E: ITO Survey research questionnaire
4. To what degree is application management outsourced / outtasked?none / not significant,
less than 10%limited, 10-25%
partly, 26-50%
significant, 51-75%
(almost) completely,
> 75%
system development
system integration
functional application management
testing
other (please specify)
5. To what degree is functional management outsourced / outtasked?none / not significant,
less than 10%limited, 10-25%
partly, 26-50%
significant, 51-75%
(almost) completely,
> 75%
requirements definition
user & acceptance testing
realisation not IT changes
coordination of IT
define IT policy
other (please specify)
6. How important is the outsource relationship with the IT supplier? Our relationship is....
transactional. Primairy driven by costs and economy of scales. No or limited innovation
enhanced. Primairy driven at effective and/or efficient services. limited knowledge of client
by supplier.
collaborative. Flexibilety and customer specific work on services.
Partnership. The business of client is dependent on the supplier’s services.
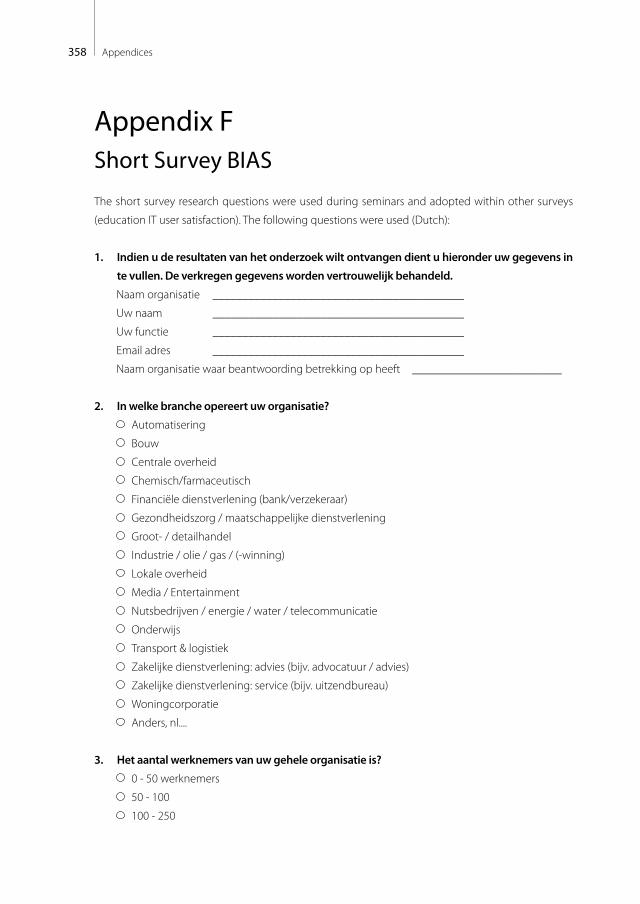
358 Appendices
Appendix FShort Survey BIAS
The short survey research questions were used during seminars and adopted within other surveys
(education IT user satisfaction). The following questions were used (Dutch):
1. Indien u de resultaten van het onderzoek wilt ontvangen dient u hieronder uw gegevens in
te vullen. De verkregen gegevens worden vertrouwelijk behandeld.
Naam organisatie __________________________________________
Uw naam __________________________________________
Uw functie __________________________________________
Email adres __________________________________________
Naam organisatie waar beantwoording betrekking op heeft _________________________
2. In welke branche opereert uw organisatie?
Automatisering
Bouw
Centrale overheid
Chemisch/farmaceutisch
Financiële dienstverlening (bank/verzekeraar)
Gezondheidszorg / maatschappelijke dienstverlening
Groot- / detailhandel
Industrie / olie / gas / (-winning)
Lokale overheid
Media / Entertainment
Nutsbedrijven / energie / water / telecommunicatie
Onderwijs
Transport & logistiek
Zakelijke dienstverlening: advies (bijv. advocatuur / advies)
Zakelijke dienstverlening: service (bijv. uitzendbureau)
Woningcorporatie
Anders, nl....
3. Het aantal werknemers van uw gehele organisatie is?
0 - 50 werknemers
50 - 100
100 - 250
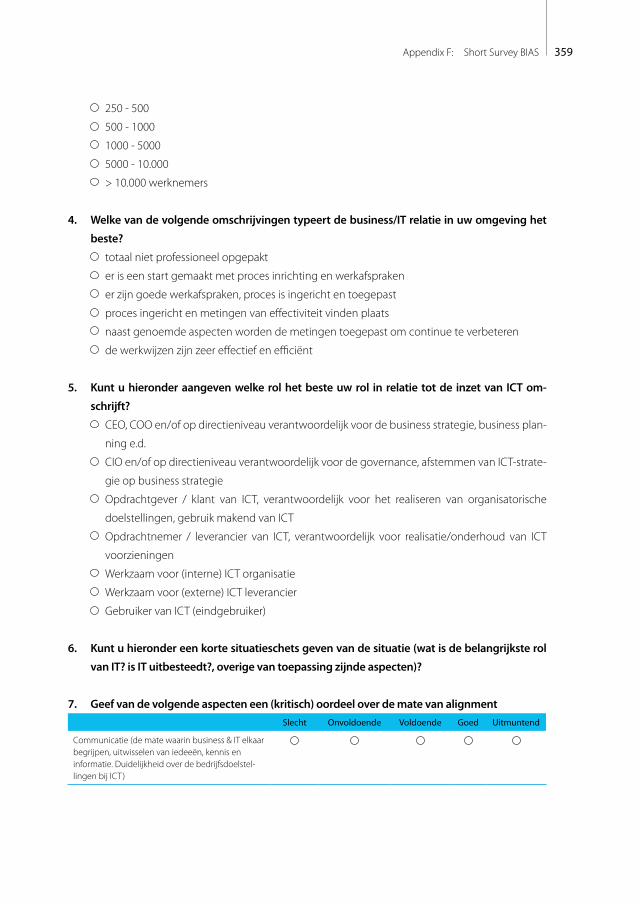
359Appendix F: Short Survey BIAS
250 - 500
500 - 1000
1000 - 5000
5000 - 10.000
> 10.000 werknemers
4. Welke van de volgende omschrijvingen typeert de business/IT relatie in uw omgeving het
beste?
totaal niet professioneel opgepakt
er is een start gemaakt met proces inrichting en werkafspraken
er zijn goede werkafspraken, proces is ingericht en toegepast
proces ingericht en metingen van effectiviteit vinden plaats
naast genoemde aspecten worden de metingen toegepast om continue te verbeteren
de werkwijzen zijn zeer effectief en efficiënt
5. Kunt u hieronder aangeven welke rol het beste uw rol in relatie tot de inzet van ICT om-
schrijft?
CEO, COO en/of op directieniveau verantwoordelijk voor de business strategie, business plan-
ning e.d.
CIO en/of op directieniveau verantwoordelijk voor de governance, afstemmen van ICT-strate-
gie op business strategie
Opdrachtgever / klant van ICT, verantwoordelijk voor het realiseren van organisatorische
doelstellingen, gebruik makend van ICT
Opdrachtnemer / leverancier van ICT, verantwoordelijk voor realisatie/onderhoud van ICT
voorzieningen
Werkzaam voor (interne) ICT organisatie
Werkzaam voor (externe) ICT leverancier
Gebruiker van ICT (eindgebruiker)
6. Kunt u hieronder een korte situatieschets geven van de situatie (wat is de belangrijkste rol
van IT? is IT uitbesteedt?, overige van toepassing zijnde aspecten)?
7. Geef van de volgende aspecten een (kritisch) oordeel over de mate van alignmentSlecht Onvoldoende Voldoende Goed Uitmuntend
Communicatie (de mate waarin business & IT elkaar begrijpen, uitwisselen van iedeeën, kennis en informatie. Duidelijkheid over de bedrijfsdoelstel-lingen bij ICT)
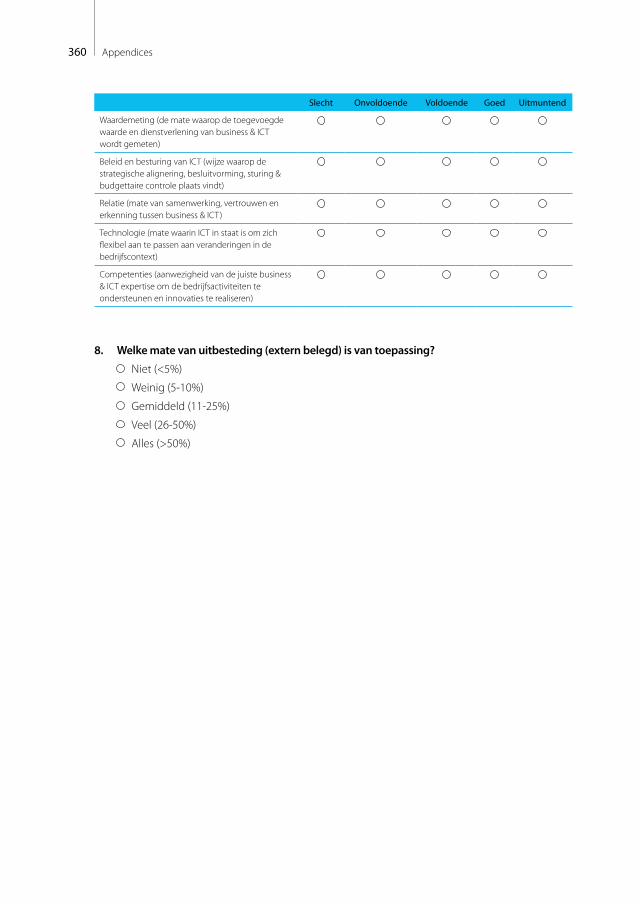
360 Appendices
Slecht Onvoldoende Voldoende Goed Uitmuntend
Waardemeting (de mate waarop de toegevoegde waarde en dienstverlening van business & ICT wordt gemeten)
Beleid en besturing van ICT (wijze waarop de strategische alignering, besluitvorming, sturing & budgettaire controle plaats vindt)
Relatie (mate van samenwerking, vertrouwen en erkenning tussen business & ICT)
Technologie (mate waarin ICT in staat is om zich flexibel aan te passen aan veranderingen in de bedrijfscontext)
Competenties (aanwezigheid van de juiste business & ICT expertise om de bedrijfsactiviteiten te ondersteunen en innovaties te realiseren)
8. Welke mate van uitbesteding (extern belegd) is van toepassing?
Niet (<5%)
Weinig (5-10%)
Gemiddeld (11-25%)
Veel (26-50%)
Alles (>50%)

361Appendix G: SPSS variable view
Appendix GSPSS variable view
The SPSS variable overview provided is that of the case research. This is de most complete set of vari-
ables (survey and short survey are sub sets).
Name Label Measure
Casename Name case (classic composer) Nominal
Industry Industry of company Nominal
numberemployees The total number of employees within the company Ordinal
Geoarea Geographical area of providing services Nominal
COM_1 Understanding of business by IT Scale
COM_2 Understanding of IT by business Scale
COM_3 Inter/intra organisational learning / education Scale
COM_4 Protocol rigidity Scale
COM_5 Knowledge sharing Scale
COM_6 Liaison(s) effectiveness Scale
VAL_1 IT metrics Scale
VAL_2 Business metrics Scale
VAL_3 Balanced metrics Scale
VAL_4 Service level management Scale
VAL_5 Benchmarking Scale
VAL_6 Formal assessments / reviews Scale
VAL_7 Continuous improvement Scale
VAL_8 Proven contribution of IT tot the business Scale
GOV_1 Business strategic planning Scale
GOV_2 IT strategic planning Scale
GOVorg Organization structure Nominal
GOV_3 Budgetary control Scale
GOV_4 IT investment management Scale
GOV_5 Steering committee’s Scale
GOV_6 Prioritization process Scale
GOV_7 React / respond quickly Scale
SEXP_1 Size of outsource deal Scale
SS_2_TM1 Technical application management Scale
SS_2_TM2 Application hosting Scale
SS_2_TM3 Security management Scale
SS_2_TM4 External networks Scale
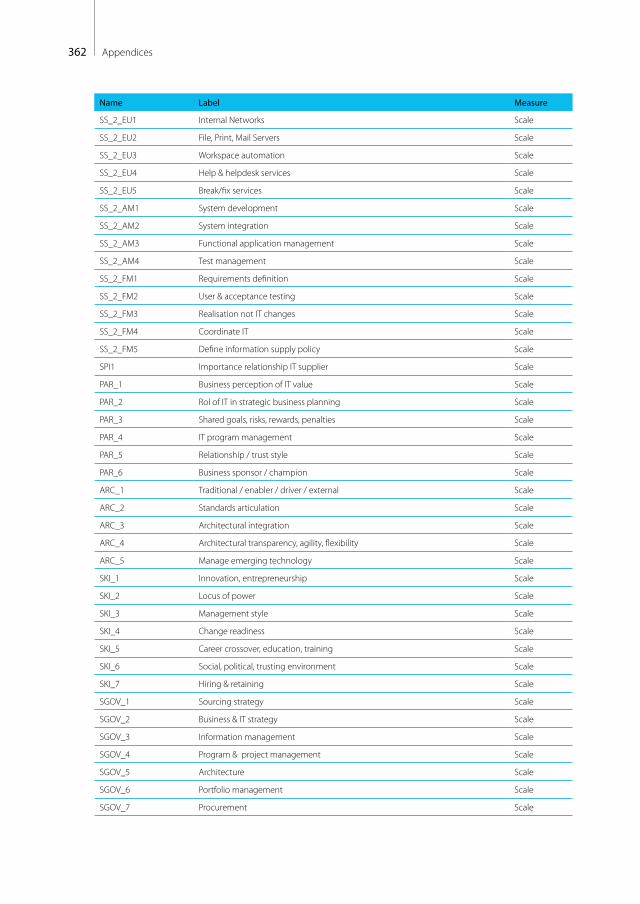
362 Appendices
Name Label Measure
SS_2_EU1 Internal Networks Scale
SS_2_EU2 File, Print, Mail Servers Scale
SS_2_EU3 Workspace automation Scale
SS_2_EU4 Help & helpdesk services Scale
SS_2_EU5 Break/fix services Scale
SS_2_AM1 System development Scale
SS_2_AM2 System integration Scale
SS_2_AM3 Functional application management Scale
SS_2_AM4 Test management Scale
SS_2_FM1 Requirements definition Scale
SS_2_FM2 User & acceptance testing Scale
SS_2_FM3 Realisation not IT changes Scale
SS_2_FM4 Coordinate IT Scale
SS_2_FM5 Define information supply policy Scale
SPI1 Importance relationship IT supplier Scale
PAR_1 Business perception of IT value Scale
PAR_2 Rol of IT in strategic business planning Scale
PAR_3 Shared goals, risks, rewards, penalties Scale
PAR_4 IT program management Scale
PAR_5 Relationship / trust style Scale
PAR_6 Business sponsor / champion Scale
ARC_1 Traditional / enabler / driver / external Scale
ARC_2 Standards articulation Scale
ARC_3 Architectural integration Scale
ARC_4 Architectural transparency, agility, flexibility Scale
ARC_5 Manage emerging technology Scale
SKI_1 Innovation, entrepreneurship Scale
SKI_2 Locus of power Scale
SKI_3 Management style Scale
SKI_4 Change readiness Scale
SKI_5 Career crossover, education, training Scale
SKI_6 Social, political, trusting environment Scale
SKI_7 Hiring & retaining Scale
SGOV_1 Sourcing strategy Scale
SGOV_2 Business & IT strategy Scale
SGOV_3 Information management Scale
SGOV_4 Program & project management Scale
SGOV_5 Architecture Scale
SGOV_6 Portfolio management Scale
SGOV_7 Procurement Scale
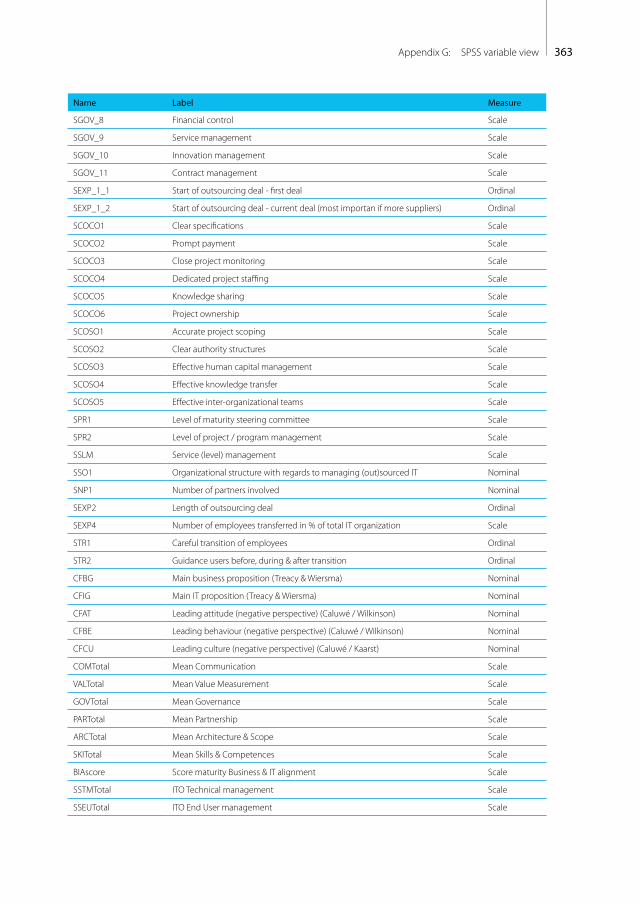
363Appendix G: SPSS variable view
Name Label Measure
SGOV_8 Financial control Scale
SGOV_9 Service management Scale
SGOV_10 Innovation management Scale
SGOV_11 Contract management Scale
SEXP_1_1 Start of outsourcing deal - first deal Ordinal
SEXP_1_2 Start of outsourcing deal - current deal (most importan if more suppliers) Ordinal
SCOCO1 Clear specifications Scale
SCOCO2 Prompt payment Scale
SCOCO3 Close project monitoring Scale
SCOCO4 Dedicated project staffing Scale
SCOCO5 Knowledge sharing Scale
SCOCO6 Project ownership Scale
SCOSO1 Accurate project scoping Scale
SCOSO2 Clear authority structures Scale
SCOSO3 Effective human capital management Scale
SCOSO4 Effective knowledge transfer Scale
SCOSO5 Effective inter-organizational teams Scale
SPR1 Level of maturity steering committee Scale
SPR2 Level of project / program management Scale
SSLM Service (level) management Scale
SSO1 Organizational structure with regards to managing (out)sourced IT Nominal
SNP1 Number of partners involved Nominal
SEXP2 Length of outsourcing deal Ordinal
SEXP4 Number of employees transferred in % of total IT organization Scale
STR1 Careful transition of employees Ordinal
STR2 Guidance users before, during & after transition Ordinal
CFBG Main business proposition (Treacy & Wiersma) Nominal
CFIG Main IT proposition (Treacy & Wiersma) Nominal
CFAT Leading attitude (negative perspective) (Caluwé / Wilkinson) Nominal
CFBE Leading behaviour (negative perspective) (Caluwé / Wilkinson) Nominal
CFCU Leading culture (negative perspective) (Caluwé / Kaarst) Nominal
COMTotal Mean Communication Scale
VALTotal Mean Value Measurement Scale
GOVTotal Mean Governance Scale
PARTotal Mean Partnership Scale
ARCTotal Mean Architecture & Scope Scale
SKITotal Mean Skills & Competences Scale
BIAscore Score maturity Business & IT alignment Scale
SSTMTotal ITO Technical management Scale
SSEUTotal ITO End User management Scale
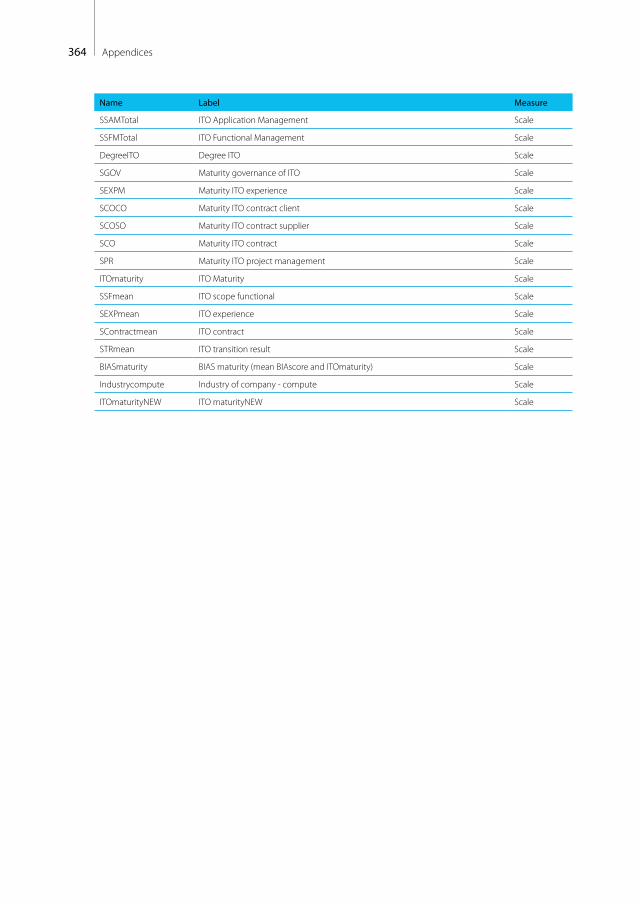
364 Appendices
Name Label Measure
SSAMTotal ITO Application Management Scale
SSFMTotal ITO Functional Management Scale
DegreeITO Degree ITO Scale
SGOV Maturity governance of ITO Scale
SEXPM Maturity ITO experience Scale
SCOCO Maturity ITO contract client Scale
SCOSO Maturity ITO contract supplier Scale
SCO Maturity ITO contract Scale
SPR Maturity ITO project management Scale
ITOmaturity ITO Maturity Scale
SSFmean ITO scope functional Scale
SEXPmean ITO experience Scale
SContractmean ITO contract Scale
STRmean ITO transition result Scale
BIASmaturity BIAS maturity (mean BIAscore and ITOmaturity) Scale
Industrycompute Industry of company - compute Scale
ITOmaturityNEW ITO maturityNEW Scale
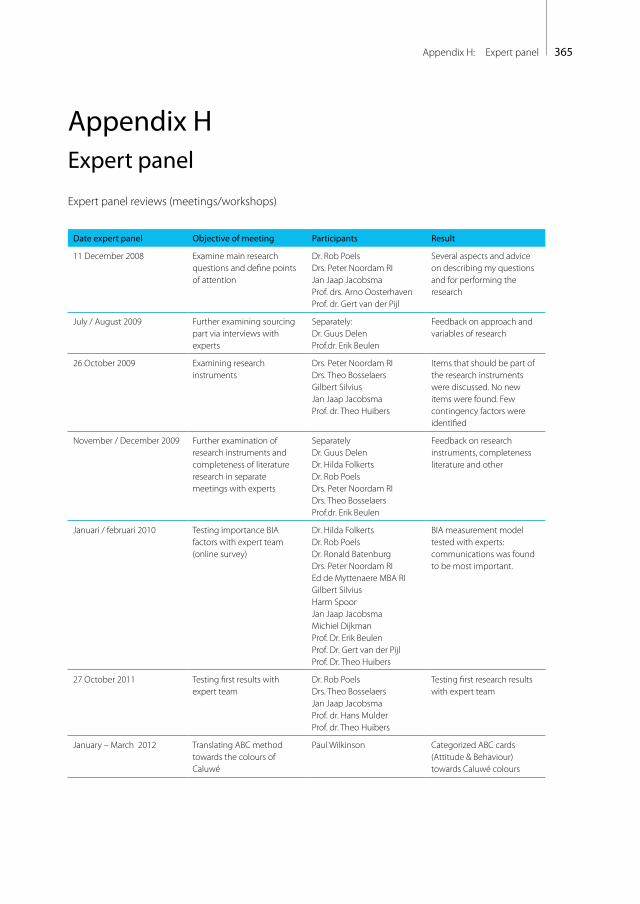
365Appendix H: Expert panel
Appendix HExpert panel
Expert panel reviews (meetings/workshops)
Date expert panel Objective of meeting Participants Result
11 December 2008 Examine main research questions and define points of attention
Dr. Rob PoelsDrs. Peter Noordam RIJan Jaap JacobsmaProf. drs. Arno OosterhavenProf. dr. Gert van der Pijl
Several aspects and advice on describing my questions and for performing the research
July / August 2009 Further examining sourcing part via interviews with experts
Separately:Dr. Guus DelenProf.dr. Erik Beulen
Feedback on approach and variables of research
26 October 2009 Examining research instruments
Drs. Peter Noordam RIDrs. Theo BosselaersGilbert SilviusJan Jaap JacobsmaProf. dr. Theo Huibers
Items that should be part of the research instruments were discussed. No new items were found. Few contingency factors were identified
November / December 2009 Further examination of research instruments and completeness of literature research in separate meetings with experts
SeparatelyDr. Guus DelenDr. Hilda FolkertsDr. Rob PoelsDrs. Peter Noordam RIDrs. Theo BosselaersProf.dr. Erik Beulen
Feedback on research instruments, completeness literature and other
Januari / februari 2010 Testing importance BIA factors with expert team (online survey)
Dr. Hilda FolkertsDr. Rob PoelsDr. Ronald BatenburgDrs. Peter Noordam RIEd de Myttenaere MBA RIGilbert SilviusHarm SpoorJan Jaap JacobsmaMichiel DijkmanProf. Dr. Erik BeulenProf. Dr. Gert van der PijlProf. Dr. Theo Huibers
BIA measurement model tested with experts: communications was found to be most important.
27 October 2011 Testing first results with expert team
Dr. Rob PoelsDrs. Theo BosselaersJan Jaap JacobsmaProf. dr. Hans MulderProf. dr. Theo Huibers
Testing first research results with expert team
January – March 2012 Translating ABC method towards the colours of Caluwé
Paul Wilkinson Categorized ABC cards (Attitude & Behaviour) towards Caluwé colours
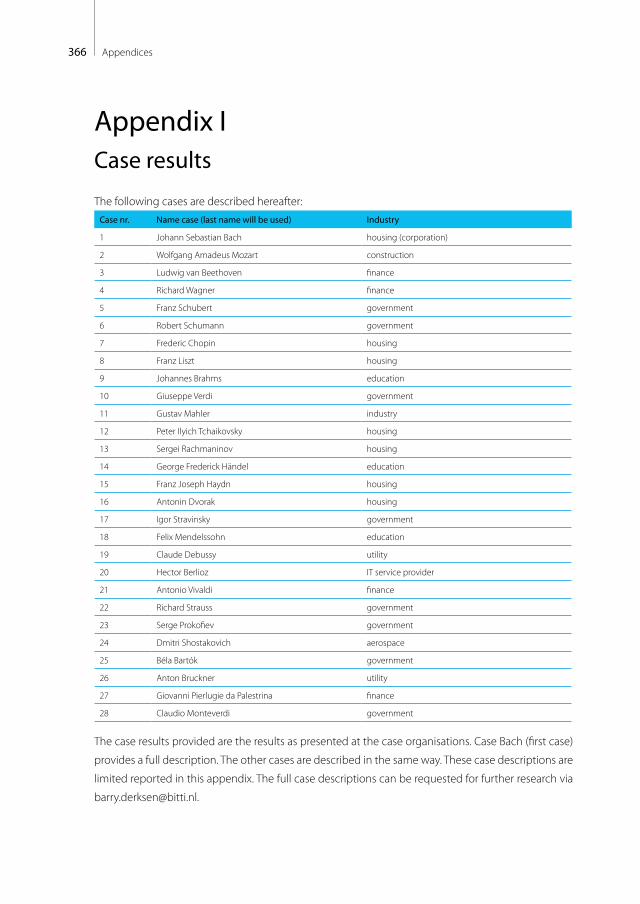
366 Appendices
Appendix ICase results
The following cases are described hereafter:Case nr. Name case (last name will be used) Industry
1 Johann Sebastian Bach housing (corporation)
2 Wolfgang Amadeus Mozart construction
3 Ludwig van Beethoven finance
4 Richard Wagner finance
5 Franz Schubert government
6 Robert Schumann government
7 Frederic Chopin housing
8 Franz Liszt housing
9 Johannes Brahms education
10 Giuseppe Verdi government
11 Gustav Mahler industry
12 Peter Ilyich Tchaikovsky housing
13 Sergei Rachmaninov housing
14 George Frederick Händel education
15 Franz Joseph Haydn housing
16 Antonin Dvorak housing
17 Igor Stravinsky government
18 Felix Mendelssohn education
19 Claude Debussy utility
20 Hector Berlioz IT service provider
21 Antonio Vivaldi finance
22 Richard Strauss government
23 Serge Prokofiev government
24 Dmitri Shostakovich aerospace
25 Béla Bartók government
26 Anton Bruckner utility
27 Giovanni Pierlugie da Palestrina finance
28 Claudio Monteverdi government
The case results provided are the results as presented at the case organisations. Case Bach (first case)
provides a full description. The other cases are described in the same way. These case descriptions are
limited reported in this appendix. The full case descriptions can be requested for further research via
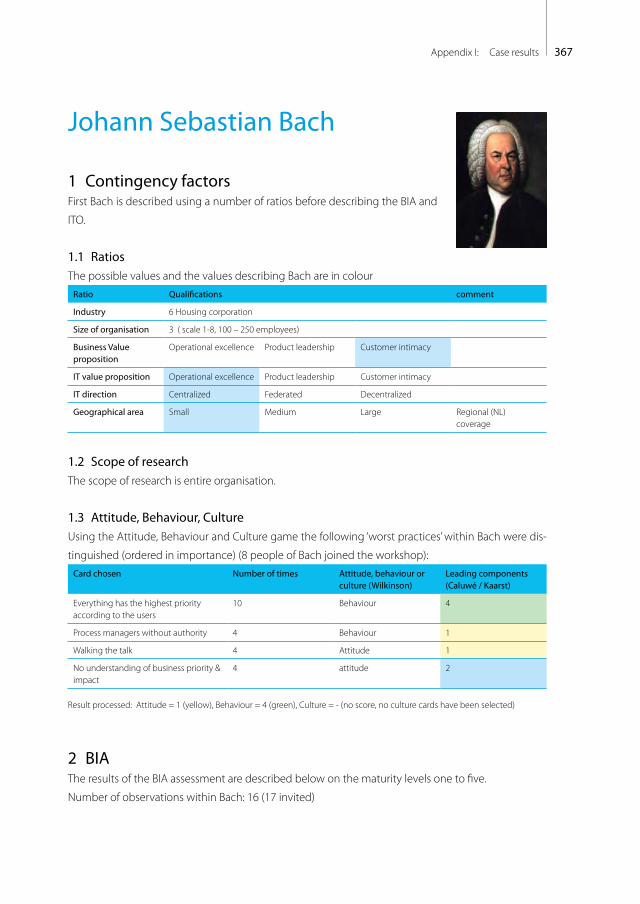
367Appendix I: Case results
Johann Sebastian Bach
1 Contingency factorsFirst Bach is described using a number of ratios before describing the BIA and
ITO.
1.1 RatiosThe possible values and the values describing Bach are in colour
Ratio Qualifications comment
Industry 6 Housing corporation
Size of organisation 3 ( scale 1-8, 100 – 250 employees)
Business Value proposition
Operational excellence Product leadership Customer intimacy
IT value proposition Operational excellence Product leadership Customer intimacy
IT direction Centralized Federated Decentralized
Geographical area Small Medium Large Regional (NL) coverage
1.2 Scope of researchThe scope of research is entire organisation.
1.3 Attitude, Behaviour, CultureUsing the Attitude, Behaviour and Culture game the following ‘worst practices’ within Bach were dis-
tinguished (ordered in importance) (8 people of Bach joined the workshop):Card chosen Number of times Attitude, behaviour or
culture (Wilkinson)Leading components (Caluwé / Kaarst)
Everything has the highest priority according to the users
10 Behaviour 4
Process managers without authority 4 Behaviour 1
Walking the talk 4 Attitude 1
No understanding of business priority & impact
4 attitude 2
Result processed: Attitude = 1 (yellow), Behaviour = 4 (green), Culture = - (no score, no culture cards have been selected)
2 BIAThe results of the BIA assessment are described below on the maturity levels one to five.
Number of observations within Bach: 16 (17 invited)

368 Appendices
1.001.201.401.601.802.002.202.402.602.80
Mat
urity
leve
l
stra
tegi
c al
ignm
ent
Average Score Communica-tions
Value measure-
ments
Governance Partnership Scope & Architecture
Skills
Bach 2.14 2.07 1.77 2.20 2.17 2.54 2.11
Bach Business 2.12 2.04 1.75 2.13 2.18 2.55 2.08
Bach ICT 2.17 2.13 1.79 2.32 2.08 2.47 2.21
Bach maturity level Strategic BIA. The component ‘Value Measurements’ is at level 1.
2.1 Communication
1.00
1.50
2.00
2.50
3.00
3.50
4.00
Understanding of business by IT
understanding of IT by business
Organisational learning
Communication protocol
Knowledge sharing
Coorporation effectiveness
Bach 2.27 2.13 1.64 2.93 1.63 1.80
Bach Business 2.27 2.18 1.60 2.64 1.67 1.91
Bach ICT 2.25 2.00 1.75 3.75 1.50 1.50
The components ‘organisational learning’, ‘knowledge sharing’ and ‘cooperation effectiveness’ are at
level 1. The component ‘communication protocol’ is above average.
2.2 Value Measurements
1.001.201.401.601.802.002.202.402.602.80
IT metrics Business metrics
Balanced metrics
Service Level Agreements
Bench-marking
Assessments / review
Continuous improve-
ment
Demon-strated IT
contribution
Bach 1.40 1.43 1.78 1.58 2.18 1.30 1.92 2.53
Bach Business 1.50 1.50 1.80 1.38 2.00 1.29 1.89 2.64
Bach ICT 1.25 1.25 1.75 2.00 2.50 1.33 2.00 2.25
‘Benchmarking’ and ‘demonstrated IT contribution’ are at level 2.
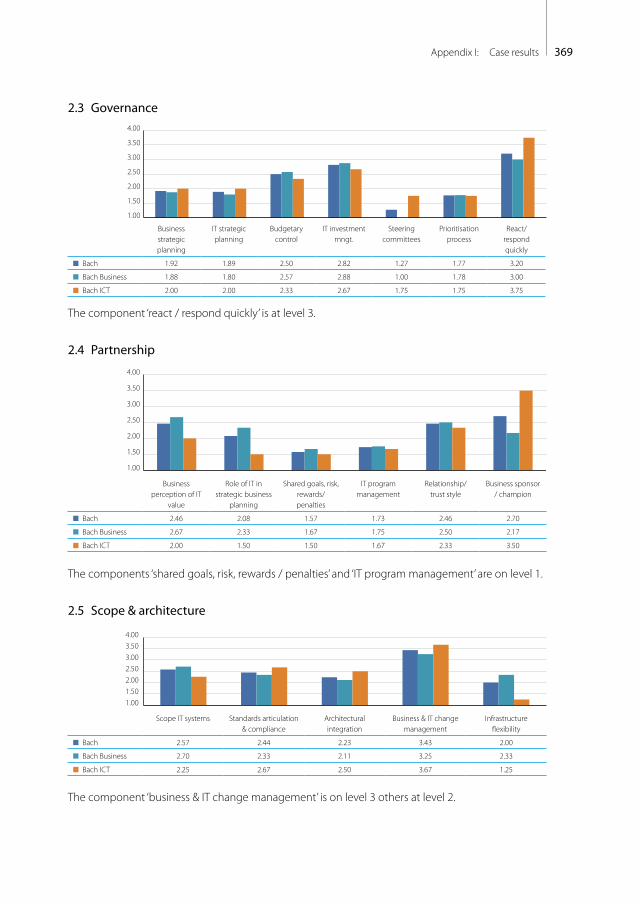
369Appendix I: Case results
2.3 Governance
1.00
1.50
2.00
2.50
3.00
3.50
4.00
Business strategic planning
IT strategic planning
Budgetary control
IT investment mngt.
Steering committees
Prioritisation process
React/ respond quickly
Bach 1.92 1.89 2.50 2.82 1.27 1.77 3.20
Bach Business 1.88 1.80 2.57 2.88 1.00 1.78 3.00
Bach ICT 2.00 2.00 2.33 2.67 1.75 1.75 3.75
The component ‘react / respond quickly’ is at level 3.
2.4 Partnership
1.00
1.50
2.00
2.50
3.00
3.50
4.00
Business perception of IT
value
Role of IT in strategic business
planning
Shared goals, risk, rewards/ penalties
IT program management
Relationship/ trust style
Business sponsor / champion
Bach 2.46 2.08 1.57 1.73 2.46 2.70
Bach Business 2.67 2.33 1.67 1.75 2.50 2.17
Bach ICT 2.00 1.50 1.50 1.67 2.33 3.50
The components ‘shared goals, risk, rewards / penalties’ and ‘IT program management’ are on level 1.
2.5 Scope & architecture
1.001.502.002.503.003.504.00
Scope IT systems Standards articulation & compliance
Architectural integration
Business & IT change management
Infrastructure flexibility
Bach 2.57 2.44 2.23 3.43 2.00
Bach Business 2.70 2.33 2.11 3.25 2.33
Bach ICT 2.25 2.67 2.50 3.67 1.25
The component ‘business & IT change management’ is on level 3 others at level 2.

370 Appendices
2.6 Skills & Competences
1.001.502.002.503.003.504.004.50
Innovation, entrepreneur-
ship
Locus of power
Change readiness
Career crossover
Education, cross-training
Social, political, trust
Attract & retain best
talent
Bach 3.27 2.00 1.93 1.46 1.45 2.79 1.89
Bach Business 2.91 2.00 1.90 1.56 1.43 2.80 2.00
Bach ICT 4.25 2.00 2.00 1.25 1.50 2.75 1.75
The component ‘innovation, entrepreneurship’ is on level 3. Change readiness, career crossover, edu-
cation, cross training and ability to attract & retain best talent are at level 1.
3 ITOThis part describes the ITO of Bach.
3.1 Degree ITOIn the table below the Degree ITO measurement of Bach are displayed on the main outsourcing
factors (see part V of dissertation) based on a scale 1 to 5, 1 being a low degree of ITO and 5 a high
degree of ITO.
Outsourcing aspect Average Score (interview)
Explanation
Technical management (5 sub components) 1 Not externally ( out)sourced
End user management (5 sub components) 1 Not externally (out)sourced
Application management (4 sub components) 2.75 Partly externally (out)sourced
Functional management (5 sub components) 1.2 Not / limited ITO
Size of outsourcing deal 2 scale 1 – 5, 2 = between 5 & 10 % of IT budget is ITO
Average level of degree ITO 1.59 Limited degree ITO
3.2 ITO characteristicsNext to the previous described degree ITO characteristics the following ITO characteristics are meas-
ured.ITO(sub)characteristic Score (interview) Explanation
Scope of ITO organizational 3 A corporate IT unit (or central unit) has primary authority for architecture, standards and application decisions
Type ITO relationship 2 Enhanced, primary oriented on effective or efficient service. Limited customer adjustments. External IT supplier has limited knowledge about the business

371Appendix I: Case results
ITO(sub)characteristic Score (interview) Explanation
Vendor construct 1 Single sourcing (based on projects)
Governance of ITO 2.64 Average level of governance aspects ((e.g. ITO strategy, portfolio mngt)
ITO experience (start) 1 No ITO experience (but over 2 decades in outsourcing application development)
ITO experience (length of deal) 1 No ITO experience except for application development (over 2 decades)
Number of people transferred 1 Less than 5%
Steering committee 1.27 Level 1
Project management 3 Neutral
Service Level Mngt 1 Only based on IT (e.g. system availability)
Quality transition of employees - No score
Quality user support during transition
- No score
Quality customer obligation 3.83 Average to strong on aspects as prompt payment, clear specifica-tions, etc.
Quality supplier obligations 3.2 Based on external application development
4 BIA(S)The measured BIA outSourcing (BIAS) of Bach is summarized below.
Informalpervasive
Optimized processes
Improved, managed
processes
Esthablished,focuses
processes
Committedprocesses
Initial or ad hoc
processes
Bonding, uni�ed
Cost e�ective
Some partner-value;
Dashboard managed
Some cost
e�ectiveness; Dashboard
established
IT enables/drives business strategy
IT seen as an asset; Process driver;Con�ict seen as creative
Shared risk & rewards
Emerging value service provider;Balanced tech & business hiring
Relevant process
across the organisation
Relevant process
across the organisation
Good understanding;
Emerging relaxed
Limited business / IT understanding,
Business / IT lack understanding,
Functional cost e�ciency
Some technical measurements
No formal process,cost center, reactive
priorities
Con�ict; IT a cost of doing
business
Traditional (e.g., acctng, email)
IT takes risk, little reward;
Technical training
Tactical at Functional
level,occasional
responsive
IT emerging as an asset;
Process enabler
Transaction (e.g., ESS, DSS)
Di�ers across functional organisations
Integrated with partners
Integrated across the organisation
Extende to external
partners
Integrated across the
org. & partners
Evolve with partners
IT-bunisness co-adaptive
Improvisation-al
Education/careers/rewards across the organisation
Communication
ValueGovernance Partnership Scope &
architectureSkills
Bach
BIA score from:BusinessICT supply
N : 17Mean BIA: 2.14BIA level: 1 (lowest)Degree ITO: 1.59ITO maturity: 2.06
Degree ofITO
ITOmaturity
1.59
2.06
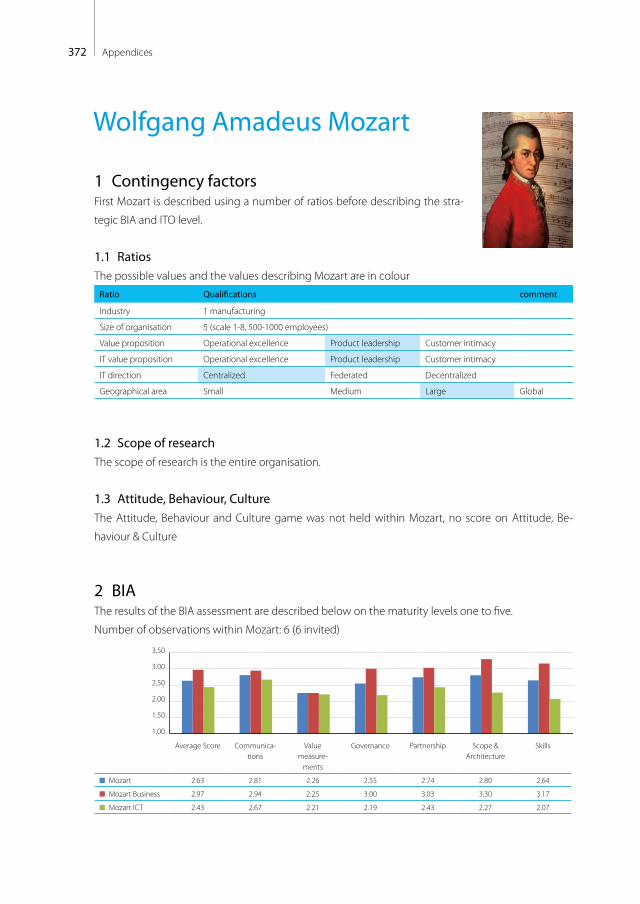
372 Appendices
Wolfgang Amadeus Mozart
1 Contingency factorsFirst Mozart is described using a number of ratios before describing the stra-
tegic BIA and ITO level.
1.1 RatiosThe possible values and the values describing Mozart are in colour
Ratio Qualifications comment
Industry 1 manufacturing
Size of organisation 5 (scale 1-8, 500-1000 employees)
Value proposition Operational excellence Product leadership Customer intimacy
IT value proposition Operational excellence Product leadership Customer intimacy
IT direction Centralized Federated Decentralized
Geographical area Small Medium Large Global
1.2 Scope of researchThe scope of research is the entire organisation.
1.3 Attitude, Behaviour, CultureThe Attitude, Behaviour and Culture game was not held within Mozart, no score on Attitude, Be-
haviour & Culture
2 BIAThe results of the BIA assessment are described below on the maturity levels one to five.
Number of observations within Mozart: 6 (6 invited)
1.00
1.50
2.00
2.50
3.00
3.50
Average Score Communica-tions
Value measure-
ments
Governance Partnership Scope & Architecture
Skills
Mozart 2.63 2.81 2.26 2.55 2.74 2.80 2.64
Mozart Business 2.97 2.94 2.25 3.00 3.03 3.30 3.17
Mozart ICT 2.43 2.67 2.21 2.19 2.43 2.27 2.07

373Appendix I: Case results
3 ITOThis part describes the ITO of Mozart.
3.1 Degree ITOIn the table below the degree of ITO of Mozart is displayed (see part V of dissertation) based on an
scale 1 to 5, 1 being low degree of ITO and 5 high degree of ITO.Degree of ITO Score Explanation
Technical management (4 sub elements) 2 Limited / Partly
End user management (5 sub elements) 1 Not
Application management (4 sub elements) 1.25 Limited
Functional management 1 Not/limited
Size of ITO deal 3 scale 1 – 6 , 3 = between 25-50% of IT budget
Average degree ITO 1.65 Limited degree ITO
3.2 ITO characteristicsITO(sub)characteristic Score Explanation
Scope of ITO organizational 3 A corporate IT unit (or other central unit) has primary responsibility for architecture, common systems and standards decisions and application resource decisions.
Type ITO relationship 1 transactional
Vendor construct 1 single sourcing
Governance of ITO 2.09 Average level of governance aspects ((e.g. sourcing strategy, portfolio mngt)
ITO experience (start) 4
ITO experience (length of deal) 1 Not applicable
Number of people transferred 1 Less than 5% (0)
Steering committee 3 Level 3
Project management 3 Neutral
Service Level Mngt 1 Only based on IT (e.g. system availability)
Quality transition of employees - No score
Quality user support during transition - No score
Quality customer obligation 3.33 Average to strong on aspects as prompt payment, clear specifications, etc.
4 BIASThe measured BIAS of Mozart is summarized below.
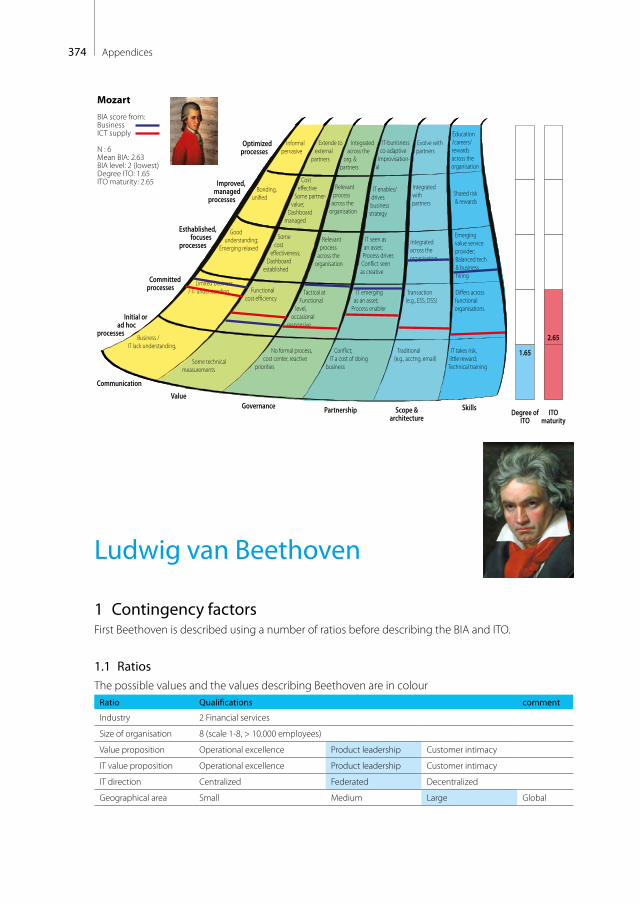
374 Appendices
Informalpervasive
Optimized processes
Improved, managed
processes
Esthablished,focuses
processes
Committedprocesses
Initial or ad hoc
processes
Bonding, uni�ed
Cost e�ective
Some partner-value;
Dashboard managed
Some cost
e�ectiveness; Dashboard
established
IT enables/drives business strategy
IT seen as an asset; Process driver;Con�ict seen as creative
Shared risk & rewards
Emerging value service provider;Balanced tech & business hiring
Relevant process
across the organisation
Relevant process
across the organisation
Good understanding;
Emerging relaxed
Limited business / IT understanding,
Business / IT lack understanding,
Functional cost e�ciency
Some technical measurements
No formal process,cost center, reactive
priorities
Con�ict; IT a cost of doing
business
Traditional (e.g., acctng, email)
IT takes risk, little reward;
Technical training
Tactical at Functional
level,occasional
responsive
IT emerging as an asset;
Process enabler
Transaction (e.g., ESS, DSS)
Di�ers across functional organisations
Integrated with partners
Integrated across the organisation
Extende to external
partners
Integrated across the
org. & partners
Evolve with partners
IT-bunisness co-adaptive
Improvisation-al
Education/careers/rewards across the organisation
Communication
ValueGovernance Partnership Scope &
architectureSkills
Mozart
BIA score from:BusinessICT supply
N : 6Mean BIA: 2.63BIA level: 2 (lowest)Degree ITO: 1.65ITO maturity: 2.65
Degree ofITO
ITOmaturity
1.65
2.65
Ludwig van Beethoven
1 Contingency factorsFirst Beethoven is described using a number of ratios before describing the BIA and ITO.
1.1 RatiosThe possible values and the values describing Beethoven are in colour
Ratio Qualifications comment
Industry 2 Financial services
Size of organisation 8 (scale 1-8, > 10.000 employees)
Value proposition Operational excellence Product leadership Customer intimacy
IT value proposition Operational excellence Product leadership Customer intimacy
IT direction Centralized Federated Decentralized
Geographical area Small Medium Large Global
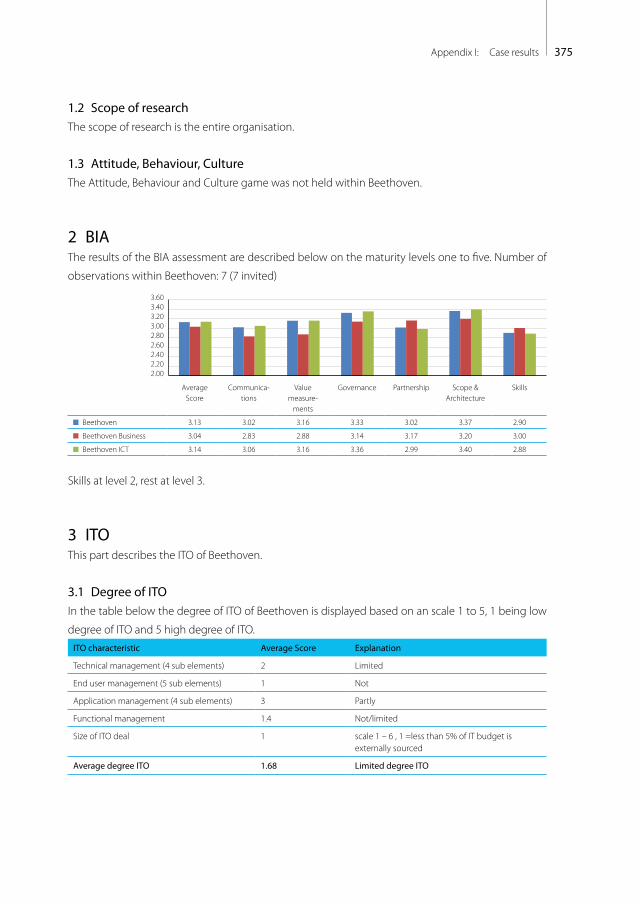
375Appendix I: Case results
1.2 Scope of researchThe scope of research is the entire organisation.
1.3 Attitude, Behaviour, CultureThe Attitude, Behaviour and Culture game was not held within Beethoven.
2 BIAThe results of the BIA assessment are described below on the maturity levels one to five. Number of
observations within Beethoven: 7 (7 invited)
2.002.202.402.602.803.003.203.403.60
Average Score
Communica-tions
Value measure-
ments
Governance Partnership Scope & Architecture
Skills
Beethoven 3.13 3.02 3.16 3.33 3.02 3.37 2.90
Beethoven Business 3.04 2.83 2.88 3.14 3.17 3.20 3.00
Beethoven ICT 3.14 3.06 3.16 3.36 2.99 3.40 2.88
Skills at level 2, rest at level 3.
3 ITOThis part describes the ITO of Beethoven.
3.1 Degree of ITOIn the table below the degree of ITO of Beethoven is displayed based on an scale 1 to 5, 1 being low
degree of ITO and 5 high degree of ITO.ITO characteristic Average Score Explanation
Technical management (4 sub elements) 2 Limited
End user management (5 sub elements) 1 Not
Application management (4 sub elements) 3 Partly
Functional management 1.4 Not/limited
Size of ITO deal 1 scale 1 – 6 , 1 =less than 5% of IT budget is externally sourced
Average degree ITO 1.68 Limited degree ITO
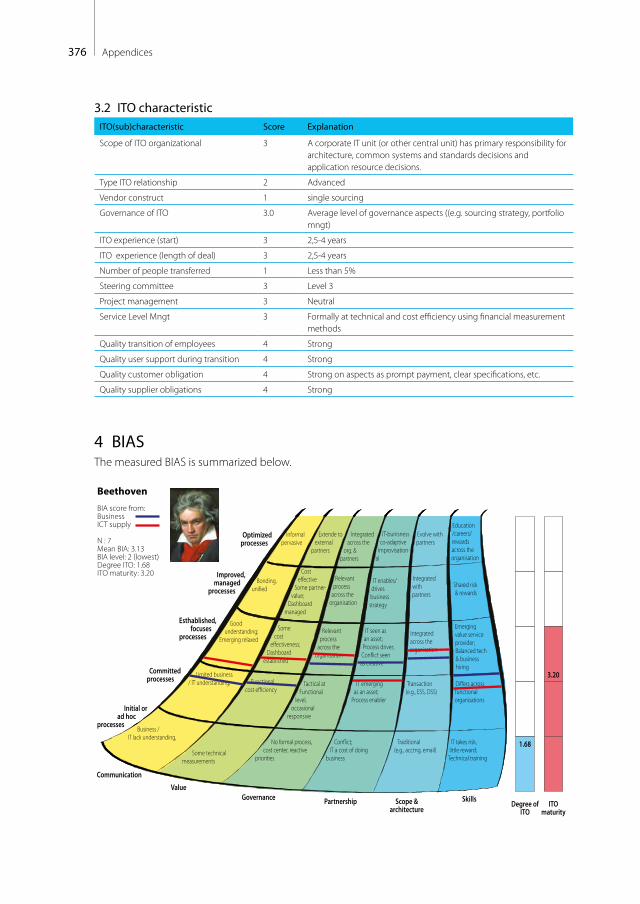
376 Appendices
3.2 ITO characteristicITO(sub)characteristic Score Explanation
Scope of ITO organizational 3 A corporate IT unit (or other central unit) has primary responsibility for architecture, common systems and standards decisions and application resource decisions.
Type ITO relationship 2 Advanced
Vendor construct 1 single sourcing
Governance of ITO 3.0 Average level of governance aspects ((e.g. sourcing strategy, portfolio mngt)
ITO experience (start) 3 2,5-4 years
ITO experience (length of deal) 3 2,5-4 years
Number of people transferred 1 Less than 5%
Steering committee 3 Level 3
Project management 3 Neutral
Service Level Mngt 3 Formally at technical and cost efficiency using financial measurement methods
Quality transition of employees 4 Strong
Quality user support during transition 4 Strong
Quality customer obligation 4 Strong on aspects as prompt payment, clear specifications, etc.
Quality supplier obligations 4 Strong
4 BIASThe measured BIAS is summarized below.
Informalpervasive
Optimized processes
Improved, managed
processes
Esthablished,focuses
processes
Committedprocesses
Initial or ad hoc
processes
Bonding, uni�ed
Cost e�ective
Some partner-value;
Dashboard managed
Some cost
e�ectiveness; Dashboard
established
IT enables/drives business strategy
IT seen as an asset; Process driver;Con�ict seen as creative
Shared risk & rewards
Emerging value service provider;Balanced tech & business hiring
Relevant process
across the organisation
Relevant process
across the organisation
Good understanding;
Emerging relaxed
Limited business / IT understanding,
Business / IT lack understanding,
Functional cost e�ciency
Some technical measurements
No formal process,cost center, reactive
priorities
Con�ict; IT a cost of doing
business
Traditional (e.g., acctng, email)
IT takes risk, little reward;
Technical training
Tactical at Functional
level,occasional
responsive
IT emerging as an asset;
Process enabler
Transaction (e.g., ESS, DSS)
Di�ers across functional organisations
Integrated with partners
Integrated across the organisation
Extende to external
partners
Integrated across the
org. & partners
Evolve with partners
IT-bunisness co-adaptive
Improvisation-al
Education/careers/rewards across the organisation
Communication
ValueGovernance Partnership Scope &
architectureSkills
Beethoven
BIA score from:BusinessICT supply
N : 7Mean BIA: 3.13BIA level: 2 (lowest)Degree ITO: 1.68ITO maturity: 3.20
Degree ofITO
ITOmaturity
1.68
3.20

377Appendix I: Case results
Richard Wagner
1 Contingency factorsFirst Wagner is described using a number of ratios before describing the BIA
and ITO.
1.1 Ratio’sThe possible values and the values describing Wagner are in colour
Ratio Qualifications comment
Industry 2 financial services
Size of organisation 5 (scale 1-8, 500-1000 employees)
Value proposition Operational excellence Product leadership Customer intimacy
IT value proposition Operational excellence Product leadership Customer intimacy
IT direction Centralized Federated Decentralized
Geographical area Small Medium Large NL
1.2 Scope of researchThe scope of research is the entire organisation.
1.3 Attitude, Behaviour, CultureThe Attitude, Behaviour and Culture game was not held within Wagner.
2 BIANumber of observations within Wagner: 30 (42 invited)
1.001.502.002.503.003.50
Mat
urity
leve
l
stra
tegi
c al
ignm
ent
Average Score
Communica-tions
Value measure-
ments
Governance Partnership Scope & Architecture
Skills
Wagner 2.58 2.66 2.39 3.03 2.46 2.62 2.35
Wagner Business 2.39 2.38 2.23 2.87 2.45 2.21 2.18
Wagner ICT 2.74 2.84 2.56 3.17 2.49 2.39 2.47
All elements on level 2 and governance on 3.
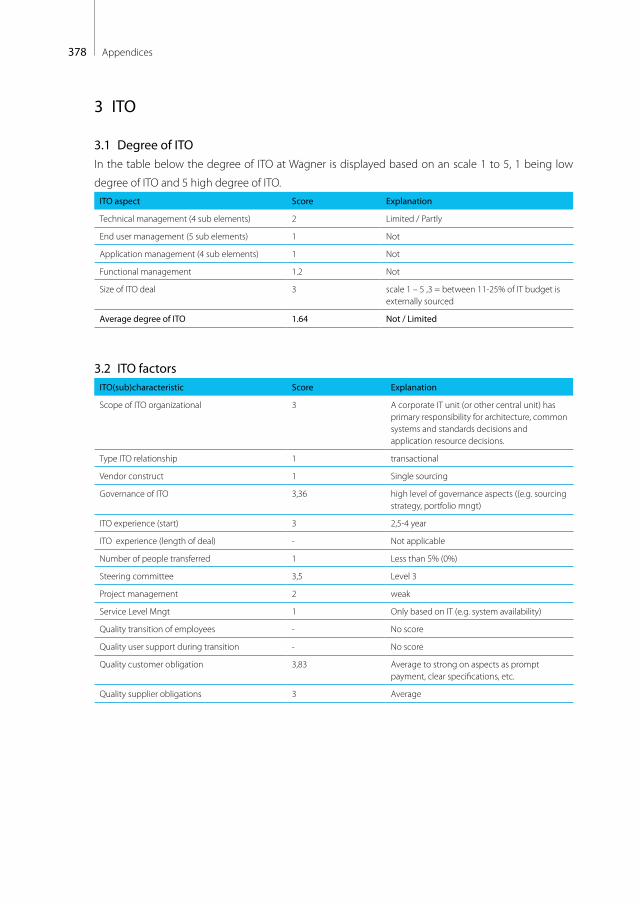
378 Appendices
3 ITO
3.1 Degree of ITOIn the table below the degree of ITO at Wagner is displayed based on an scale 1 to 5, 1 being low
degree of ITO and 5 high degree of ITO.ITO aspect Score Explanation
Technical management (4 sub elements) 2 Limited / Partly
End user management (5 sub elements) 1 Not
Application management (4 sub elements) 1 Not
Functional management 1.2 Not
Size of ITO deal 3 scale 1 – 5 ,3 = between 11-25% of IT budget is externally sourced
Average degree of ITO 1.64 Not / Limited
3.2 ITO factorsITO(sub)characteristic Score Explanation
Scope of ITO organizational 3 A corporate IT unit (or other central unit) has primary responsibility for architecture, common systems and standards decisions and application resource decisions.
Type ITO relationship 1 transactional
Vendor construct 1 Single sourcing
Governance of ITO 3,36 high level of governance aspects ((e.g. sourcing strategy, portfolio mngt)
ITO experience (start) 3 2,5-4 year
ITO experience (length of deal) - Not applicable
Number of people transferred 1 Less than 5% (0%)
Steering committee 3,5 Level 3
Project management 2 weak
Service Level Mngt 1 Only based on IT (e.g. system availability)
Quality transition of employees - No score
Quality user support during transition - No score
Quality customer obligation 3,83 Average to strong on aspects as prompt payment, clear specifications, etc.
Quality supplier obligations 3 Average
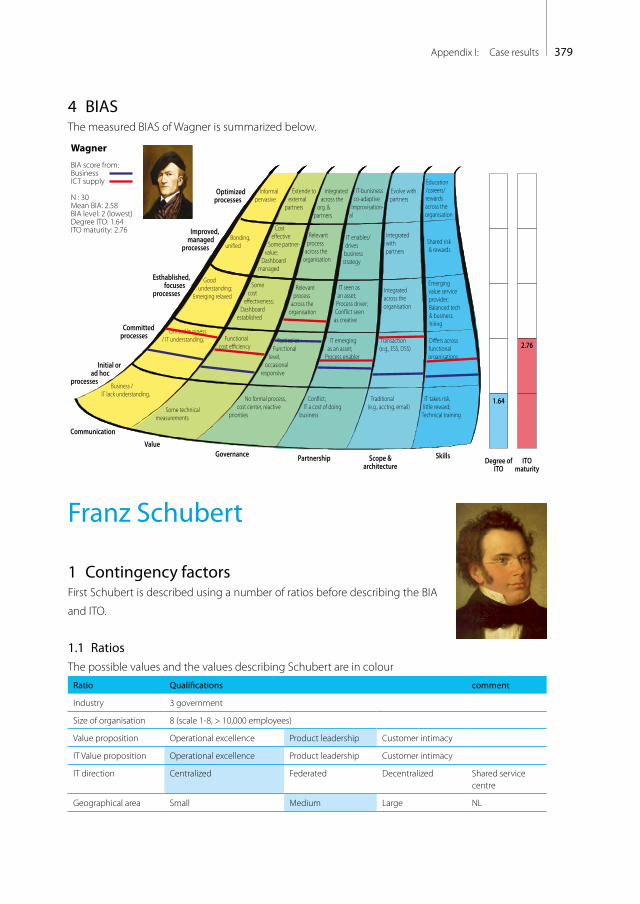
379Appendix I: Case results
4 BIASThe measured BIAS of Wagner is summarized below.
Informalpervasive
Optimized processes
Improved, managed
processes
Esthablished,focuses
processes
Committedprocesses
Initial or ad hoc
processes
Bonding, uni�ed
Cost e�ective
Some partner-value;
Dashboard managed
Some cost
e�ectiveness; Dashboard
established
IT enables/drives business strategy
IT seen as an asset; Process driver;Con�ict seen as creative
Shared risk & rewards
Emerging value service provider;Balanced tech & business hiring
Relevant process
across the organisation
Relevant process
across the organisation
Good understanding;
Emerging relaxed
Limited business / IT understanding,
Business / IT lack understanding,
Functional cost e�ciency
Some technical measurements
No formal process,cost center, reactive
priorities
Con�ict; IT a cost of doing
business
Traditional (e.g., acctng, email)
IT takes risk, little reward;
Technical training
Tactical at Functional
level,occasional
responsive
IT emerging as an asset;
Process enabler
Transaction (e.g., ESS, DSS)
Di�ers across functional organisations
Integrated with partners
Integrated across the organisation
Extende to external
partners
Integrated across the
org. & partners
Evolve with partners
IT-bunisness co-adaptive
Improvisation-al
Education/careers/rewards across the organisation
Communication
ValueGovernance Partnership Scope &
architectureSkills
Wagner
BIA score from:BusinessICT supply
N : 30Mean BIA: 2.58BIA level: 2 (lowest)Degree ITO: 1.64ITO maturity: 2.76
Degree ofITO
ITOmaturity
1.64
2.76
Franz Schubert
1 Contingency factorsFirst Schubert is described using a number of ratios before describing the BIA
and ITO.
1.1 RatiosThe possible values and the values describing Schubert are in colour
Ratio Qualifications comment
Industry 3 government
Size of organisation 8 (scale 1-8, > 10,000 employees)
Value proposition Operational excellence Product leadership Customer intimacy
IT Value proposition Operational excellence Product leadership Customer intimacy
IT direction Centralized Federated Decentralized Shared service centre
Geographical area Small Medium Large NL
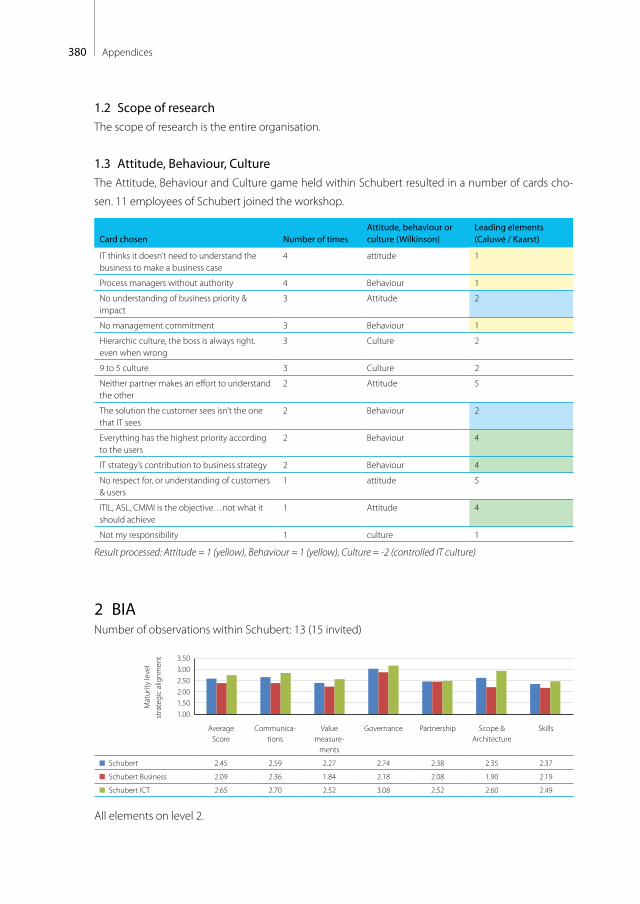
380 Appendices
1.2 Scope of researchThe scope of research is the entire organisation.
1.3 Attitude, Behaviour, CultureThe Attitude, Behaviour and Culture game held within Schubert resulted in a number of cards cho-
sen. 11 employees of Schubert joined the workshop.
Card chosen Number of timesAttitude, behaviour or culture (Wilkinson)
Leading elements (Caluwé / Kaarst)
IT thinks it doesn’t need to understand the business to make a business case
4 attitude 1
Process managers without authority 4 Behaviour 1
No understanding of business priority & impact
3 Attitude 2
No management commitment 3 Behaviour 1
Hierarchic culture, the boss is always right.even when wrong
3 Culture 2
9 to 5 culture 3 Culture 2
Neither partner makes an effort to understand the other
2 Attitude 5
The solution the customer sees isn’t the one that IT sees
2 Behaviour 2
Everything has the highest priority according to the users
2 Behaviour 4
IT strategy’s contribution to business strategy 2 Behaviour 4
No respect for, or understanding of customers & users
1 attitude 5
ITIL, ASL, CMMI is the objective…not what it should achieve
1 Attitude 4
Not my responsibility 1 culture 1
Result processed: Attitude = 1 (yellow), Behaviour = 1 (yellow), Culture = -2 (controlled IT culture)
2 BIANumber of observations within Schubert: 13 (15 invited)
1.001.502.002.503.003.50
Mat
urity
leve
l
stra
tegi
c al
ignm
ent
Average Score
Communica-tions
Value measure-
ments
Governance Partnership Scope & Architecture
Skills
Schubert 2.45 2.59 2.27 2.74 2.38 2.35 2.37
Schubert Business 2.09 2.36 1.84 2.18 2.08 1.90 2.19
Schubert ICT 2.65 2.70 2.52 3.08 2.52 2.60 2.49
All elements on level 2.
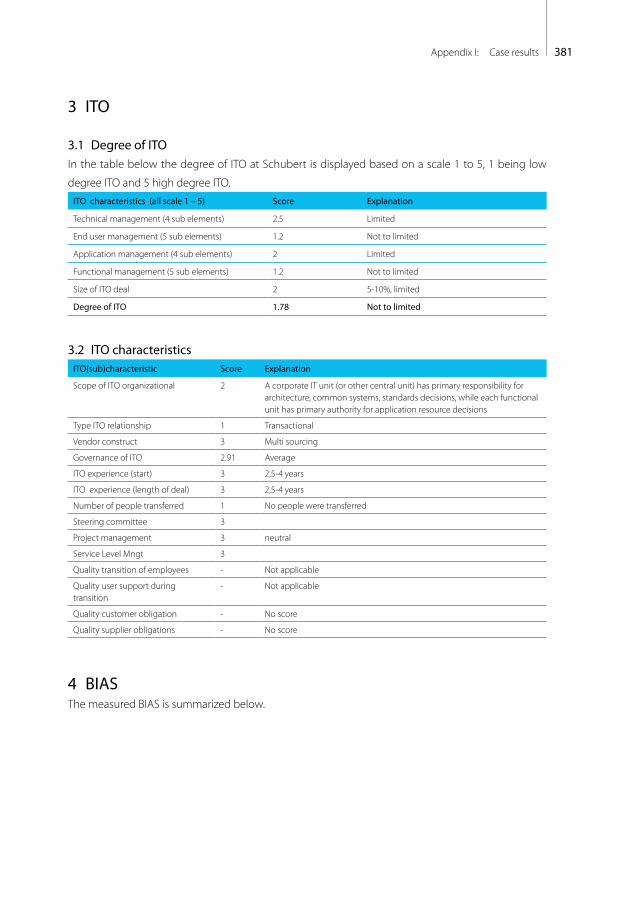
381Appendix I: Case results
3 ITO
3.1 Degree of ITO In the table below the degree of ITO at Schubert is displayed based on a scale 1 to 5, 1 being low
degree ITO and 5 high degree ITO.ITO characteristics (all scale 1 – 5) Score Explanation
Technical management (4 sub elements) 2.5 Limited
End user management (5 sub elements) 1.2 Not to limited
Application management (4 sub elements) 2 Limited
Functional management (5 sub elements) 1.2 Not to limited
Size of ITO deal 2 5-10%, limited
Degree of ITO 1.78 Not to limited
3.2 ITO characteristicsITO(sub)characteristic Score Explanation
Scope of ITO organizational 2 A corporate IT unit (or other central unit) has primary responsibility for architecture, common systems, standards decisions, while each functional unit has primary authority for application resource decisions
Type ITO relationship 1 Transactional
Vendor construct 3 Multi sourcing
Governance of ITO 2.91 Average
ITO experience (start) 3 2,5-4 years
ITO experience (length of deal) 3 2,5-4 years
Number of people transferred 1 No people were transferred
Steering committee 3
Project management 3 neutral
Service Level Mngt 3
Quality transition of employees - Not applicable
Quality user support during transition
- Not applicable
Quality customer obligation - No score
Quality supplier obligations - No score
4 BIASThe measured BIAS is summarized below.

382 Appendices
Informalpervasive
Optimized processes
Improved, managed
processes
Esthablished,focuses
processes
Committedprocesses
Initial or ad hoc
processes
Bonding, uni�ed
Cost e�ective
Some partner-value;
Dashboard managed
Some cost
e�ectiveness; Dashboard
established
IT enables/drives business strategy
IT seen as an asset; Process driver;Con�ict seen as creative
Shared risk & rewards
Emerging value service provider;Balanced tech & business hiring
Relevant process
across the organisation
Relevant process
across the organisation
Good understanding;
Emerging relaxed
Limited business / IT understanding,
Business / IT lack understanding,
Functional cost e�ciency
Some technical measurements
No formal process,cost center, reactive
priorities
Con�ict; IT a cost of doing
business
Traditional (e.g., acctng, email)
IT takes risk, little reward;
Technical training
Tactical at Functional
level,occasional
responsive
IT emerging as an asset;
Process enabler
Transaction (e.g., ESS, DSS)
Di�ers across functional organisations
Integrated with partners
Integrated across the organisation
Extende to external
partners
Integrated across the
org. & partners
Evolve with partners
IT-bunisness co-adaptive
Improvisation-al
Education/careers/rewards across the organisation
Communication
ValueGovernance Partnership Scope &
architectureSkills
Schubert
BIA score from:BusinessICT supply
N : 17Mean BIA: 2.45BIA level: 1 (lowest)Degree ITO: 1.78ITO maturity: 2.86
Degree ofITO
ITOmaturity
1.78
2.86
Robert Schumann
1 Contingency factorsFirst Schumann is described using a number of ratios before describing the
BIA and ITO.
1.1 RatiosThe possible values and the values describing Schumann are in colour
Ratio Qualifications comment
Industry 3 Government
Size of organisation 8 (scale 1-8, > 10,000 employees)
Business Value proposition Operational excellence Product leadership Customer intimacy
IT Value proposition Operational excellence Product leadership Customer intimacy
IT direction Centralized Federated Decentralized Shared service centre
Geographical area Small Medium Large NL
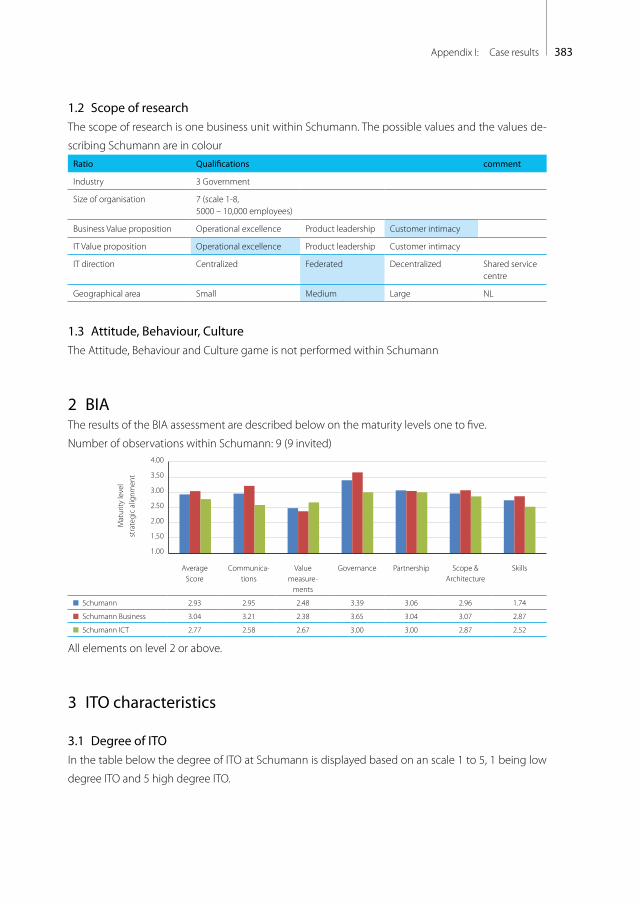
383Appendix I: Case results
1.2 Scope of researchThe scope of research is one business unit within Schumann. The possible values and the values de-
scribing Schumann are in colour Ratio Qualifications comment
Industry 3 Government
Size of organisation 7 (scale 1-8, 5000 – 10,000 employees)
Business Value proposition Operational excellence Product leadership Customer intimacy
IT Value proposition Operational excellence Product leadership Customer intimacy
IT direction Centralized Federated Decentralized Shared service centre
Geographical area Small Medium Large NL
1.3 Attitude, Behaviour, CultureThe Attitude, Behaviour and Culture game is not performed within Schumann
2 BIAThe results of the BIA assessment are described below on the maturity levels one to five.
Number of observations within Schumann: 9 (9 invited)
Mat
urity
leve
lst
rate
gic
alig
nmen
t
1.00
1.50
2.00
2.50
3.00
3.50
4.00
Average Score
Communica-tions
Value measure-
ments
Governance Partnership Scope & Architecture
Skills
Schumann 2.93 2.95 2.48 3.39 3.06 2.96 1.74
Schumann Business 3.04 3.21 2.38 3.65 3.04 3.07 2.87
Schumann ICT 2.77 2.58 2.67 3.00 3.00 2.87 2.52
All elements on level 2 or above.
3 ITO characteristics
3.1 Degree of ITOIn the table below the degree of ITO at Schumann is displayed based on an scale 1 to 5, 1 being low
degree ITO and 5 high degree ITO.

384 Appendices
ITO characteristics (all scale 1 – 5) Score Explanation
Technical management (4 sub elements) 1.75 Limited
End user management (5 sub elements) 1.2 Not to limited
Application management (4 sub elements) 2.25 Limited
Functional management (5 sub elements) 1.2 Not to limited
Size of ITO deal 3 11-25%, partly
Degree of ITO 1.88 limited
3.2 ITO factorsITO(sub)characteristic Score Explanation
Scope of ITO organizational 2 A corporate IT unit (or other central unit) has primary responsibility for architecture, common systems, standards decisions, while each functional unit has primary authority for application resource decisions
Type ITO relationship 3 Customer specific
Vendor construct 4 Alliance (several suppliers work together)
Governance of ITO 3.55 Average to good
ITO experience (start) 3 2,5-4 years
ITO experience (length of deal) 4 4 years
Number of people transferred 1 No people were transferred
Steering committee 3.67
Project management 3 neutral
Service Level Mngt 1
Quality transition of employees - Not applicable
Quality user support during transition - Not applicable
Quality customer obligation 3,33 Average to good
Quality supplier obligations 3,2 Average to good
4 BIASThe measured BIAS is summarized below.
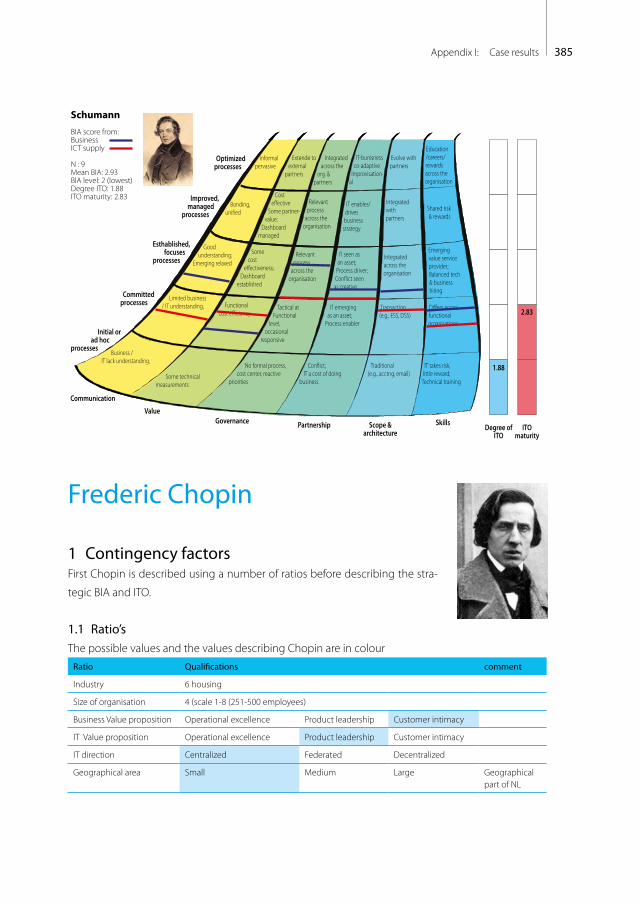
385Appendix I: Case results
Informalpervasive
Optimized processes
Improved, managed
processes
Esthablished,focuses
processes
Committedprocesses
Initial or ad hoc
processes
Bonding, uni�ed
Cost e�ective
Some partner-value;
Dashboard managed
Some cost
e�ectiveness; Dashboard
established
IT enables/drives business strategy
IT seen as an asset; Process driver;Con�ict seen as creative
Shared risk & rewards
Emerging value service provider;Balanced tech & business hiring
Relevant process
across the organisation
Relevant process
across the organisation
Good understanding;
Emerging relaxed
Limited business / IT understanding,
Business / IT lack understanding,
Functional cost e�ciency
Some technical measurements
No formal process,cost center, reactive
priorities
Con�ict; IT a cost of doing
business
Traditional (e.g., acctng, email)
IT takes risk, little reward;
Technical training
Tactical at Functional
level,occasional
responsive
IT emerging as an asset;
Process enabler
Transaction (e.g., ESS, DSS)
Di�ers across functional organisations
Integrated with partners
Integrated across the organisation
Extende to external
partners
Integrated across the
org. & partners
Evolve with partners
IT-bunisness co-adaptive
Improvisation-al
Education/careers/rewards across the organisation
Communication
ValueGovernance Partnership Scope &
architectureSkills
Schumann
BIA score from:BusinessICT supply
N : 9Mean BIA: 2.93BIA level: 2 (lowest)Degree ITO: 1.88ITO maturity: 2.83
Degree ofITO
ITOmaturity
1.88
2.83
Frederic Chopin
1 Contingency factorsFirst Chopin is described using a number of ratios before describing the stra-
tegic BIA and ITO.
1.1 Ratio’sThe possible values and the values describing Chopin are in colour
Ratio Qualifications comment
Industry 6 housing
Size of organisation 4 (scale 1-8 (251-500 employees)
Business Value proposition Operational excellence Product leadership Customer intimacy
IT Value proposition Operational excellence Product leadership Customer intimacy
IT direction Centralized Federated Decentralized
Geographical area Small Medium Large Geographical part of NL
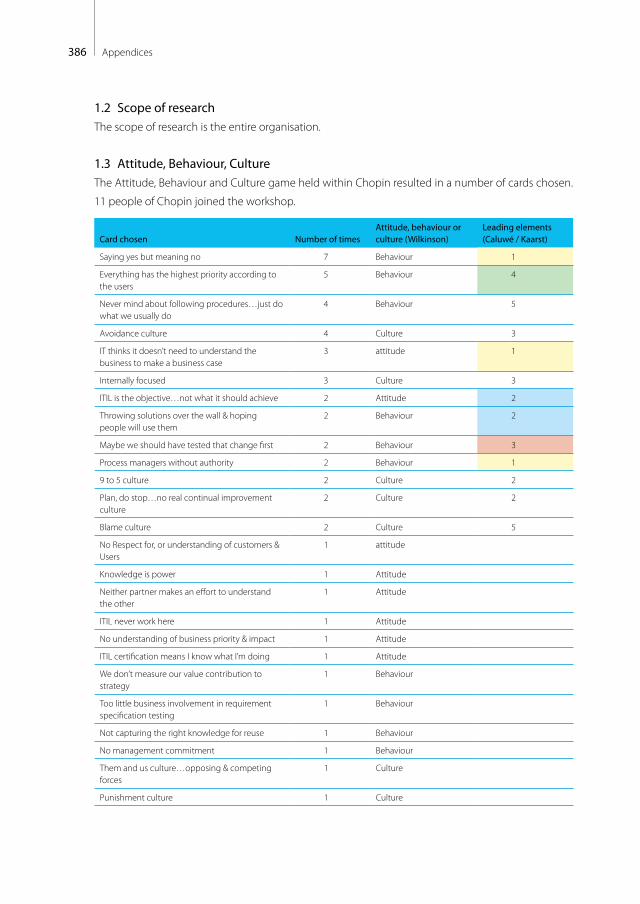
386 Appendices
1.2 Scope of researchThe scope of research is the entire organisation.
1.3 Attitude, Behaviour, CultureThe Attitude, Behaviour and Culture game held within Chopin resulted in a number of cards chosen.
11 people of Chopin joined the workshop.
Card chosen Number of timesAttitude, behaviour or culture (Wilkinson)
Leading elements (Caluwé / Kaarst)
Saying yes but meaning no 7 Behaviour 1
Everything has the highest priority according to the users
5 Behaviour 4
Never mind about following procedures…just do what we usually do
4 Behaviour 5
Avoidance culture 4 Culture 3
IT thinks it doesn’t need to understand the business to make a business case
3 attitude 1
Internally focused 3 Culture 3
ITIL is the objective…not what it should achieve 2 Attitude 2
Throwing solutions over the wall & hoping people will use them
2 Behaviour 2
Maybe we should have tested that change first 2 Behaviour 3
Process managers without authority 2 Behaviour 1
9 to 5 culture 2 Culture 2
Plan, do stop…no real continual improvement culture
2 Culture 2
Blame culture 2 Culture 5
No Respect for, or understanding of customers & Users
1 attitude
Knowledge is power 1 Attitude
Neither partner makes an effort to understand the other
1 Attitude
ITIL never work here 1 Attitude
No understanding of business priority & impact 1 Attitude
ITIL certification means I know what I’m doing 1 Attitude
We don’t measure our value contribution to strategy
1 Behaviour
Too little business involvement in requirement specification testing
1 Behaviour
Not capturing the right knowledge for reuse 1 Behaviour
No management commitment 1 Behaviour
Them and us culture…opposing & competing forces
1 Culture
Punishment culture 1 Culture
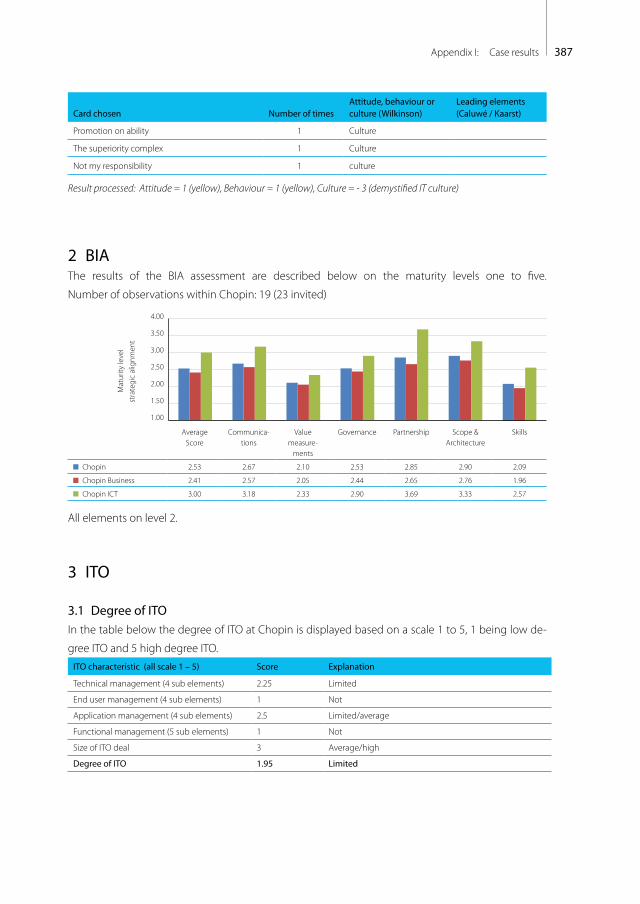
387Appendix I: Case results
Card chosen Number of timesAttitude, behaviour or culture (Wilkinson)
Leading elements (Caluwé / Kaarst)
Promotion on ability 1 Culture
The superiority complex 1 Culture
Not my responsibility 1 culture
Result processed: Attitude = 1 (yellow), Behaviour = 1 (yellow), Culture = - 3 (demystified IT culture)
2 BIAThe results of the BIA assessment are described below on the maturity levels one to five.
Number of observations within Chopin: 19 (23 invited)
Mat
urity
leve
lst
rate
gic
alig
nmen
t
1.00
1.50
2.00
2.50
3.00
3.50
4.00
Average Score
Communica-tions
Value measure-
ments
Governance Partnership Scope & Architecture
Skills
Chopin 2.53 2.67 2.10 2.53 2.85 2.90 2.09
Chopin Business 2.41 2.57 2.05 2.44 2.65 2.76 1.96
Chopin ICT 3.00 3.18 2.33 2.90 3.69 3.33 2.57
All elements on level 2.
3 ITO
3.1 Degree of ITOIn the table below the degree of ITO at Chopin is displayed based on a scale 1 to 5, 1 being low de-
gree ITO and 5 high degree ITO.ITO characteristic (all scale 1 – 5) Score Explanation
Technical management (4 sub elements) 2.25 Limited
End user management (4 sub elements) 1 Not
Application management (4 sub elements) 2.5 Limited/average
Functional management (5 sub elements) 1 Not
Size of ITO deal 3 Average/high
Degree of ITO 1.95 Limited

388 Appendices
3.2 ITO characteristicsITO(sub)characteristic Average Score Explanation
Scope of ITO organizational 3 A corporate IT unit (or other central unit) has primary authority for standards, and application resource decisions
Type ITO relationship 3 Flexibility & customer specific adjustments on services. Reasonable level of integration between customer and supplier. Supplier has limited knowledge of customer.
Vendor construct 1 Single sourcing
Governance of ITO 3.45
ITO experience (start) 5 On projects
ITO experience (length of deal) 2 Average 3 years
Number of people transferred 1 No people transferred
Steering committee 2.75
Project management 3 Most project managers are well, but internal people capacity
Service Level Mngt 1
Quality transition of employees - Not scored
Quality user support during transition - Not scored
Quality customer obligation 5 Very strong on defining and realizing customer obligations
Quality supplier obligations 4.2 Project phase is often taking too long
4 BIASThe measured BIAS is summarized below.
Informalpervasive
Optimized processes
Improved, managed
processes
Esthablished,focuses
processes
Committedprocesses
Initial or ad hoc
processes
Bonding, uni�ed
Cost e�ective
Some partner-value;
Dashboard managed
Some cost
e�ectiveness; Dashboard
established
IT enables/drives business strategy
IT seen as an asset; Process driver;Con�ict seen as creative
Shared risk & rewards
Emerging value service provider;Balanced tech & business hiring
Relevant process
across the organisation
Relevant process
across the organisation
Good understanding;
Emerging relaxed
Limited business / IT understanding,
Business / IT lack understanding,
Functional cost e�ciency
Some technical measurements
No formal process,cost center, reactive
priorities
Con�ict; IT a cost of doing
business
Traditional (e.g., acctng, email)
IT takes risk, little reward;
Technical training
Tactical at Functional
level,occasional
responsive
IT emerging as an asset;
Process enabler
Transaction (e.g., ESS, DSS)
Di�ers across functional organisations
Integrated with partners
Integrated across the organisation
Extende to external
partners
Integrated across the
org. & partners
Evolve with partners
IT-bunisness co-adaptive
Improvisation-al
Education/careers/rewards across the organisation
Communication
ValueGovernance Partnership Scope &
architectureSkills
Chopin
BIA score from:BusinessICT supply
N : 19Mean BIA: 2.53BIA level: 1 (lowest)Degree ITO: 1.95ITO maturity: 3.39
Degree ofITO
ITOmaturity
1.95
3.39

389Appendix I: Case results
Franz Liszt
1 Contingency factorsFirst Liszt is described using a number of ratios before describing the strategic
BIA and ITO level.
1.1 Ratio’sThe possible values and the values describing Liszt are in colour
Ratio Qualifications comment
Industry 6 housing
Size of organisation 6 (1001 -5000 employees)
Business Value proposition Operational excellence Product leadership Customer intimacy
IT Value proposition Operational excellence Product leadership Customer intimacy
IT direction Centralized Federated Decentralized
Geographical area Small Medium Large Geographical part of NL
1.2 Scope of researchThe scope of research is the entire organisation.
1.3 Attitude, Behaviour, CultureThe Attitude, Behaviour and Culture game held within Liszt resulted in a number of cards chosen.
This was discussed with 4 employees.
Card chosen Number of timesAttitude, behaviour or culture (Wilkinson)
Leading elements (Caluwé / Kaarst)
No management commitment 4 Behaviour 1
IT not seen as an added value partner to the business
3 Attitude 3
IT thinks it doesn’t need to understand the business to make a business case
2 Attitude 1
Everything has the highest priority...according to the users
2 Behaviour 4
Internally focused 1 Culture 3
Result processed: Attitude = 3 (red), Behaviour = 1 (yellow), Culture = 3 (demystified)

390 Appendices
2 BIAThe results of the BIA assessment are described below on the maturity levels one to five.
Number of observations within Liszt: 33 (33 invited)M
atur
ity le
vel
stra
tegi
c al
ignm
ent
1.001.201.401.601.802.002.202.402.602.80
Average Score
Communica-tions
Value measure-
ments
Governance Partnership Scope & Architecture
Skills
Liszt 2.03 1.80 1.70 2.30 2.20 2.20 2.00
Liszt Business 1.97 1.70 1.60 2.40 2.10 1.90 2.10
Liszt ICT 2.13 2.00 1.80 2.20 2.20 2.60 2.00
All elements on level 1 or 2.
3 ITO
3.1 Degree of ITOIn the table below the degree of ITO at Liszt is displayed based on an scale 1 to 5, 1 being low degree
ITO and 5 high degree ITO.ITO characteristic (all scale 1 – 5) Score Explanation
Technical management (4 sub elements) 2.0 Limited (External networks)
End user management (4 sub elements) 1 Not
Application management (4 sub elements) 2.25 Limited (System development & system integration)
Functional management (5 sub elements) 1.6 Not/limited (Realization not IT changes)
Size of ITO deal 3 Average
Degree ITO 1.97 Limited
3.2 ITO characteristics
ITO(sub)characteristic Average Score (interview) Explanation
Scope of ITO organisational 3 A corporate IT unit (or other central unit) has primary authority
Type ITO relationship 2 Enhanced
Vendor construct 3 Multi sourcing
Governance of ITO 2.73
ITO experience (start) 1 On projects

391Appendix I: Case results
ITO(sub)characteristic Average Score (interview) Explanation
ITO experience (length of deal) 1 Average 3 years
Number of people transferred 1 No people transferred
Steering committee 2.35
Project management 1 Very weak
Service Level Mngt 1
Quality transition of employees - Not scored
Quality user support during transition - Not scored
Quality customer obligation 3.33 Average
Quality supplier obligations 2.2 Weak
4 BIASThe measured BIAS is summarized below.
Informalpervasive
Optimized processes
Improved, managed
processes
Esthablished,focuses
processes
Committedprocesses
Initial or ad hoc
processes
Bonding, uni�ed
Cost e�ective
Some partner-value;
Dashboard managed
Some cost
e�ectiveness; Dashboard
established
IT enables/drives business strategy
IT seen as an asset; Process driver;Con�ict seen as creative
Shared risk & rewards
Emerging value service provider;Balanced tech & business hiring
Relevant process
across the organisation
Relevant process
across the organisation
Good understanding;
Emerging relaxed
Limited business / IT understanding,
Business / IT lack understanding,
Functional cost e�ciency
Some technical measurements
No formal process,cost center, reactive
priorities
Con�ict; IT a cost of doing
business
Traditional (e.g., acctng, email)
IT takes risk, little reward;
Technical training
Tactical at Functional
level,occasional
responsive
IT emerging as an asset;
Process enabler
Transaction (e.g., ESS, DSS)
Di�ers across functional organisations
Integrated with partners
Integrated across the organisation
Extende to external
partners
Integrated across the
org. & partners
Evolve with partners
IT-bunisness co-adaptive
Improvisation-al
Education/careers/rewards across the organisation
Communication
ValueGovernance Partnership Scope &
architectureSkills
Liszt
BIA score from:BusinessICT supply
N : 33Mean BIA: 2.05BIA level: 1 (lowest)Degree ITO: 1.97ITO maturity: 1.83
Degree ofITO
ITOmaturity
1.97 1.83
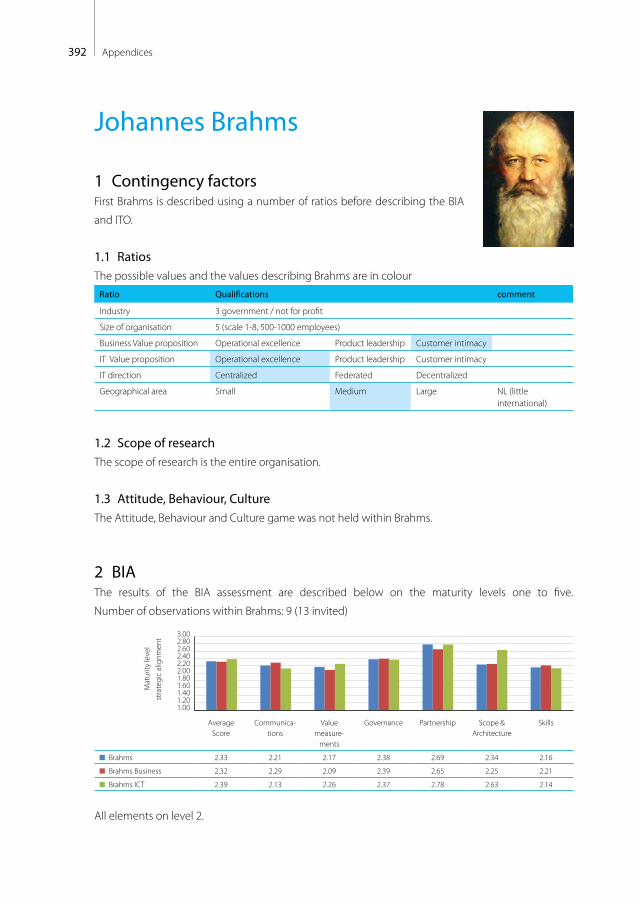
392 Appendices
Johannes Brahms
1 Contingency factorsFirst Brahms is described using a number of ratios before describing the BIA
and ITO.
1.1 RatiosThe possible values and the values describing Brahms are in colour
Ratio Qualifications comment
Industry 3 government / not for profit
Size of organisation 5 (scale 1-8, 500-1000 employees)
Business Value proposition Operational excellence Product leadership Customer intimacy
IT Value proposition Operational excellence Product leadership Customer intimacy
IT direction Centralized Federated Decentralized
Geographical area Small Medium Large NL (little international)
1.2 Scope of researchThe scope of research is the entire organisation.
1.3 Attitude, Behaviour, CultureThe Attitude, Behaviour and Culture game was not held within Brahms.
2 BIAThe results of the BIA assessment are described below on the maturity levels one to five.
Number of observations within Brahms: 9 (13 invited)
Mat
urity
leve
lst
rate
gic
alig
nmen
t
1.001.201.401.601.802.002.202.402.602.803.00
Average Score
Communica-tions
Value measure-
ments
Governance Partnership Scope & Architecture
Skills
Brahms 2.33 2.21 2.17 2.38 2.69 2.34 2.16
Brahms Business 2.32 2.29 2.09 2.39 2.65 2.25 2.21
Brahms ICT 2.39 2.13 2.26 2.37 2.78 2.63 2.14
All elements on level 2.
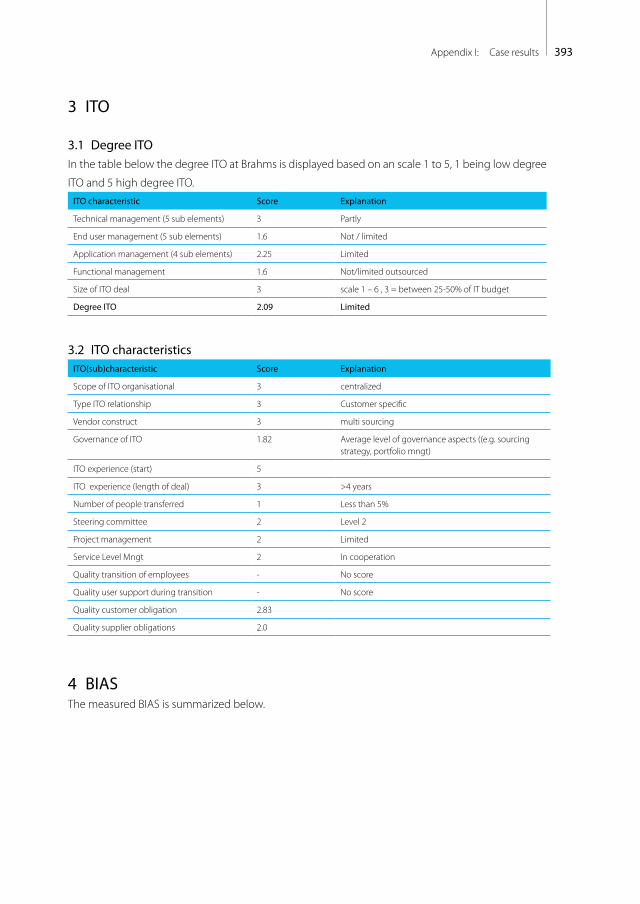
393Appendix I: Case results
3 ITO
3.1 Degree ITOIn the table below the degree ITO at Brahms is displayed based on an scale 1 to 5, 1 being low degree
ITO and 5 high degree ITO.ITO characteristic Score Explanation
Technical management (5 sub elements) 3 Partly
End user management (5 sub elements) 1.6 Not / limited
Application management (4 sub elements) 2.25 Limited
Functional management 1.6 Not/limited outsourced
Size of ITO deal 3 scale 1 – 6 , 3 = between 25-50% of IT budget
Degree ITO 2.09 Limited
3.2 ITO characteristicsITO(sub)characteristic Score Explanation
Scope of ITO organisational 3 centralized
Type ITO relationship 3 Customer specific
Vendor construct 3 multi sourcing
Governance of ITO 1.82 Average level of governance aspects ((e.g. sourcing strategy, portfolio mngt)
ITO experience (start) 5
ITO experience (length of deal) 3 >4 years
Number of people transferred 1 Less than 5%
Steering committee 2 Level 2
Project management 2 Limited
Service Level Mngt 2 In cooperation
Quality transition of employees - No score
Quality user support during transition - No score
Quality customer obligation 2.83
Quality supplier obligations 2.0
4 BIASThe measured BIAS is summarized below.
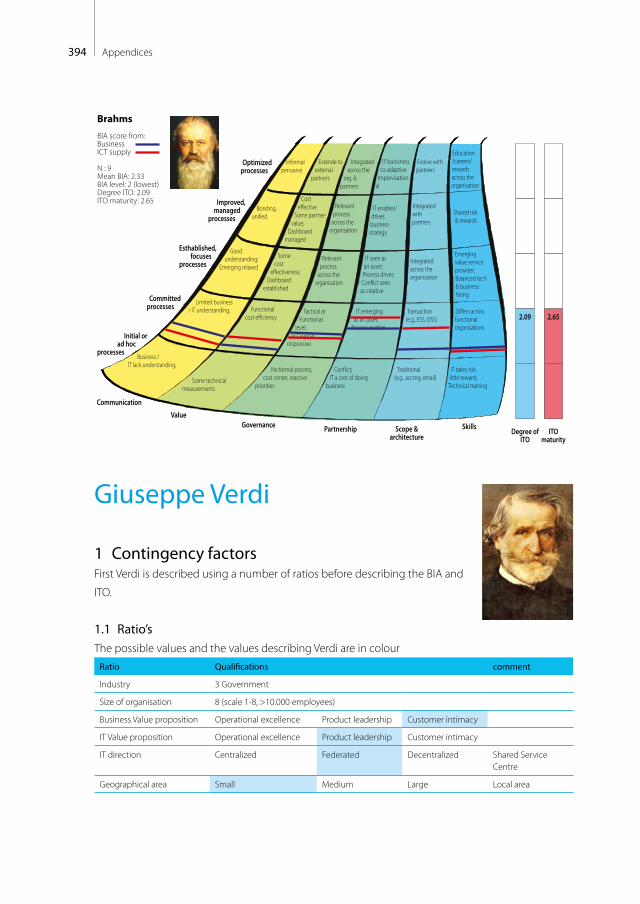
394 Appendices
Informalpervasive
Optimized processes
Improved, managed
processes
Esthablished,focuses
processes
Committedprocesses
Initial or ad hoc
processes
Bonding, uni�ed
Cost e�ective
Some partner-value;
Dashboard managed
Some cost
e�ectiveness; Dashboard
established
IT enables/drives business strategy
IT seen as an asset; Process driver;Con�ict seen as creative
Shared risk & rewards
Emerging value service provider;Balanced tech & business hiring
Relevant process
across the organisation
Relevant process
across the organisation
Good understanding;
Emerging relaxed
Limited business / IT understanding,
Business / IT lack understanding,
Functional cost e�ciency
Some technical measurements
No formal process,cost center, reactive
priorities
Con�ict; IT a cost of doing
business
Traditional (e.g., acctng, email)
IT takes risk, little reward;
Technical training
Tactical at Functional
level,occasional
responsive
IT emerging as an asset;
Process enabler
Transaction (e.g., ESS, DSS)
Di�ers across functional organisations
Integrated with partners
Integrated across the organisation
Extende to external
partners
Integrated across the
org. & partners
Evolve with partners
IT-bunisness co-adaptive
Improvisation-al
Education/careers/rewards across the organisation
Communication
ValueGovernance Partnership Scope &
architectureSkills
Brahms
BIA score from:BusinessICT supply
N : 9Mean BIA: 2.33BIA level: 2 (lowest)Degree ITO: 2.09ITO maturity: 2.65
Degree ofITO
ITOmaturity
2.09 2.65
Giuseppe Verdi
1 Contingency factorsFirst Verdi is described using a number of ratios before describing the BIA and
ITO.
1.1 Ratio’sThe possible values and the values describing Verdi are in colour
Ratio Qualifications comment
Industry 3 Government
Size of organisation 8 (scale 1-8, >10.000 employees)
Business Value proposition Operational excellence Product leadership Customer intimacy
IT Value proposition Operational excellence Product leadership Customer intimacy
IT direction Centralized Federated Decentralized Shared Service Centre
Geographical area Small Medium Large Local area

395Appendix I: Case results
1.2 Scope of researchThe scope of research is entire organisation.
1.3 Attitude, Behaviour, CultureUsing the Attitude, Behaviour and Culture game the following ‘worst practices’ within Verdi were dis-
tinguished in cooperation of 8 employees (ordered in importance):
Card chosenNumber of times
Attitude, behaviour or culture (Wilkinson)
Leading elements (Caluwé / Kaarst)
Everything has the highest priority according to the users
6 Behaviour 4
Plan, do, stop…no real continual improvement 4 Culture 2
Process managers without authority 3 Behaviour 1
Not my responsibility 2 Culture 1
No understanding of business priority & impact 2 Attitude 2
Result processed: Attitude = 2(blue), Behaviour = 4 (green), Culture = - 2 (controlled IT culture)
2 BIAThe results of the BIA assessment are described below on the maturity levels one to five. Number of
observations within Verdi: 41 (51 invited)
Mat
urity
leve
lst
rate
gic
alig
nmen
t
11.21.41.61.8
22.22.42.62.8
Average Score
Communica-tions
Value measure-
ments
Governance Partnership Scope & Architecture
Skills
Verdi 2.32 2.31 1.79 2.61 2.44 2.6 2.25
Verdi Business 2.32 2.25 1.82 2.66 2.41 2.6 2.25
Verdi ICT 2.31 2.32 1.58 2.38 2.54 2.63 2.45
The element ‘Value Measurements’ is on level 1.
3 ITO
3.1 Degree of ITOIn the table below the degree ITO at Verdi is displayed based on an scale 1 to 5, 1 being low degree
ITO and 5 high degree ITO.

396 Appendices
ITO characteristic Score Explanation
Technical management (5 sub elements) 3.5 Partly
End user management (5 sub elements) 3.8 Partly
Application management (4 sub elements) 2.75 Partly
Functional management 1.6 Not / limited
Size of ITO deal 3 scale 1 – 5 ,3 = between 11-50% of IT budget
degree ITO 2.93 Limited/partly
3.2 ITO characteristicsITO(sub)characteristic Average Score Explanation
Scope of ITO organisational 2 A corporate IT unit (or other central unit) has primary responsibility for architecture, common systems and standards decisions, while each functional unit has primary authority for application resource decisions (in this case limited).
Type ITO relationship 2 Enhanced, primary oriented on effective or efficient service. Limited customer adjustments. External IT supplier has limited knowledge about the business
Vendor construct 3 multi sourcing (multiple service providers, client takes responsibility)
Governance of ITO 2.91 Average level of governance aspects ((e.g. sourcing strategy, portfolio mngt)
ITO experience (start) 5 Technical application hosting & management (over 6 years)
ITO experience (length of deal) 2 Length of deal between 2,5 and 4 years
Number of people transferred 1 Less than 5%
Steering committee 2.67 Level 2
Project management 3 Neutral
Service Level Mngt 1 Only based on IT (e.g. system availability)
Quality transition of employees - No score
Quality user support during transition - No score
Quality customer obligation 3.33 Average to strong on aspects as prompt payment, clear specifications, etc.
Quality supplier obligations 2.8 Based on external application hosting / technical management
4 BIASThe measured BIAS is summarized below.
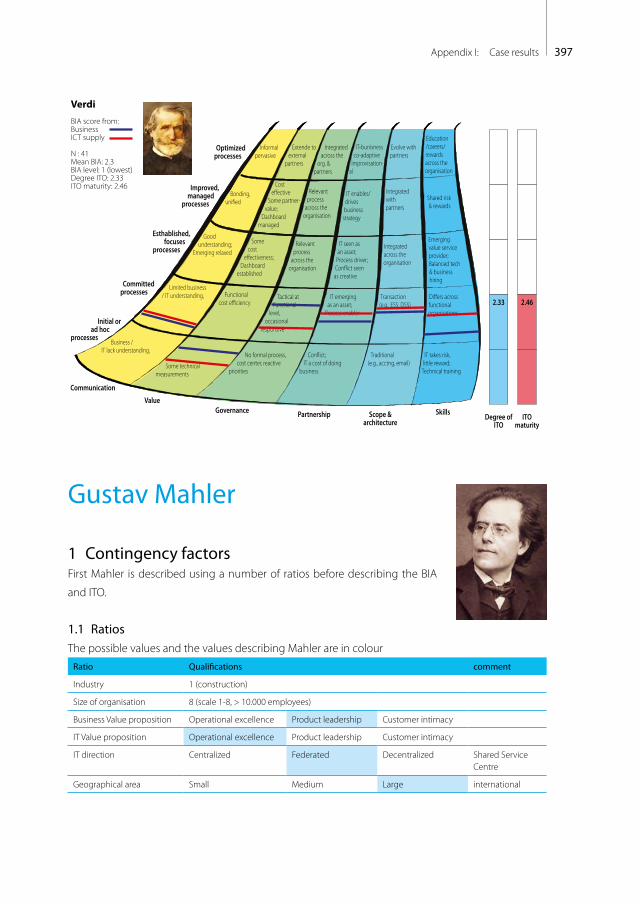
397Appendix I: Case results
Informalpervasive
Optimized processes
Improved, managed
processes
Esthablished,focuses
processes
Committedprocesses
Initial or ad hoc
processes
Bonding, uni�ed
Cost e�ective
Some partner-value;
Dashboard managed
Some cost
e�ectiveness; Dashboard
established
IT enables/drives business strategy
IT seen as an asset; Process driver;Con�ict seen as creative
Shared risk & rewards
Emerging value service provider;Balanced tech & business hiring
Relevant process
across the organisation
Relevant process
across the organisation
Good understanding;
Emerging relaxed
Limited business / IT understanding,
Business / IT lack understanding,
Functional cost e�ciency
Some technical measurements
No formal process,cost center, reactive
priorities
Con�ict; IT a cost of doing
business
Traditional (e.g., acctng, email)
IT takes risk, little reward;
Technical training
Tactical at Functional
level,occasional
responsive
IT emerging as an asset;
Process enabler
Transaction (e.g., ESS, DSS)
Di�ers across functional organisations
Integrated with partners
Integrated across the organisation
Extende to external
partners
Integrated across the
org. & partners
Evolve with partners
IT-bunisness co-adaptive
Improvisation-al
Education/careers/rewards across the organisation
Communication
ValueGovernance Partnership Scope &
architectureSkills
Verdi
BIA score from:BusinessICT supply
N : 41Mean BIA: 2.3BIA level: 1 (lowest)Degree ITO: 2.33ITO maturity: 2.46
Degree ofITO
ITOmaturity
2.33 2.46
Gustav Mahler
1 Contingency factorsFirst Mahler is described using a number of ratios before describing the BIA
and ITO.
1.1 RatiosThe possible values and the values describing Mahler are in colour
Ratio Qualifications comment
Industry 1 (construction)
Size of organisation 8 (scale 1-8, > 10.000 employees)
Business Value proposition Operational excellence Product leadership Customer intimacy
IT Value proposition Operational excellence Product leadership Customer intimacy
IT direction Centralized Federated Decentralized Shared Service Centre
Geographical area Small Medium Large international
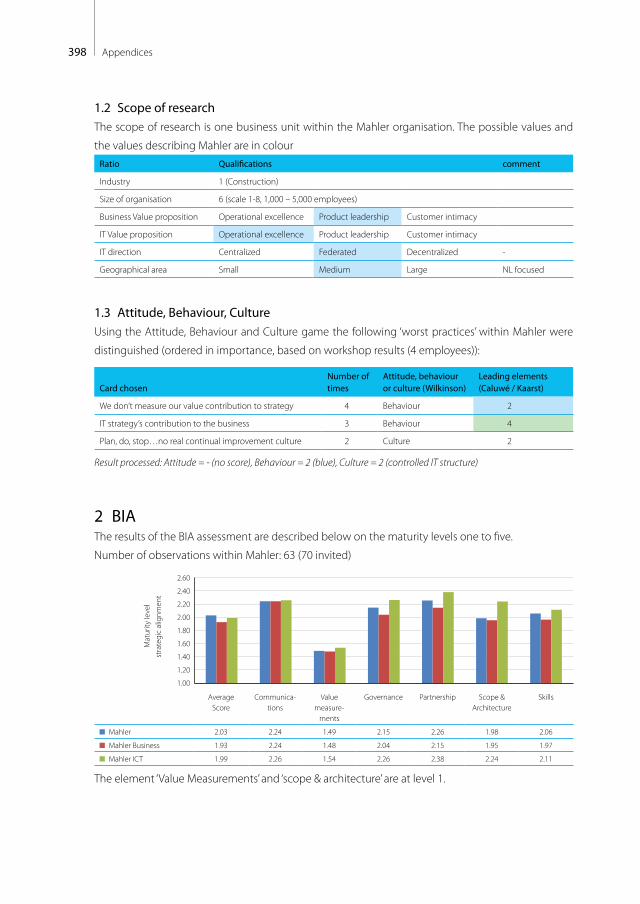
398 Appendices
1.2 Scope of researchThe scope of research is one business unit within the Mahler organisation. The possible values and
the values describing Mahler are in colour Ratio Qualifications comment
Industry 1 (Construction)
Size of organisation 6 (scale 1-8, 1,000 – 5,000 employees)
Business Value proposition Operational excellence Product leadership Customer intimacy
IT Value proposition Operational excellence Product leadership Customer intimacy
IT direction Centralized Federated Decentralized -
Geographical area Small Medium Large NL focused
1.3 Attitude, Behaviour, CultureUsing the Attitude, Behaviour and Culture game the following ‘worst practices’ within Mahler were
distinguished (ordered in importance, based on workshop results (4 employees)):
Card chosenNumber of times
Attitude, behaviour or culture (Wilkinson)
Leading elements (Caluwé / Kaarst)
We don’t measure our value contribution to strategy 4 Behaviour 2
IT strategy’s contribution to the business 3 Behaviour 4
Plan, do, stop…no real continual improvement culture 2 Culture 2
Result processed: Attitude = - (no score), Behaviour = 2 (blue), Culture = 2 (controlled IT structure)
2 BIAThe results of the BIA assessment are described below on the maturity levels one to five.
Number of observations within Mahler: 63 (70 invited)
Mat
urity
leve
lst
rate
gic
alig
nmen
t
1.00
1.20
1.40
1.60
1.80
2.00
2.20
2.40
2.60
Average Score
Communica-tions
Value measure-
ments
Governance Partnership Scope & Architecture
Skills
Mahler 2.03 2.24 1.49 2.15 2.26 1.98 2.06
Mahler Business 1.93 2.24 1.48 2.04 2.15 1.95 1.97
Mahler ICT 1.99 2.26 1.54 2.26 2.38 2.24 2.11
The element ‘Value Measurements’ and ‘scope & architecture’ are at level 1.
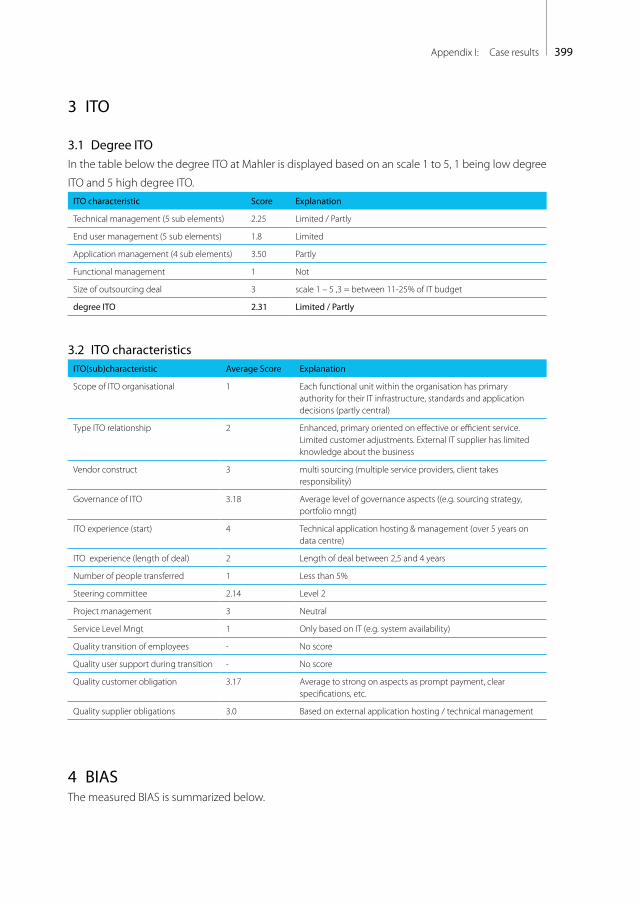
399Appendix I: Case results
3 ITO
3.1 Degree ITOIn the table below the degree ITO at Mahler is displayed based on an scale 1 to 5, 1 being low degree
ITO and 5 high degree ITO.ITO characteristic Score Explanation
Technical management (5 sub elements) 2.25 Limited / Partly
End user management (5 sub elements) 1.8 Limited
Application management (4 sub elements) 3.50 Partly
Functional management 1 Not
Size of outsourcing deal 3 scale 1 – 5 ,3 = between 11-25% of IT budget
degree ITO 2.31 Limited / Partly
3.2 ITO characteristicsITO(sub)characteristic Average Score Explanation
Scope of ITO organisational 1 Each functional unit within the organisation has primary authority for their IT infrastructure, standards and application decisions (partly central)
Type ITO relationship 2 Enhanced, primary oriented on effective or efficient service. Limited customer adjustments. External IT supplier has limited knowledge about the business
Vendor construct 3 multi sourcing (multiple service providers, client takes responsibility)
Governance of ITO 3.18 Average level of governance aspects ((e.g. sourcing strategy, portfolio mngt)
ITO experience (start) 4 Technical application hosting & management (over 5 years on data centre)
ITO experience (length of deal) 2 Length of deal between 2,5 and 4 years
Number of people transferred 1 Less than 5%
Steering committee 2.14 Level 2
Project management 3 Neutral
Service Level Mngt 1 Only based on IT (e.g. system availability)
Quality transition of employees - No score
Quality user support during transition - No score
Quality customer obligation 3.17 Average to strong on aspects as prompt payment, clear specifications, etc.
Quality supplier obligations 3.0 Based on external application hosting / technical management
4 BIASThe measured BIAS is summarized below.
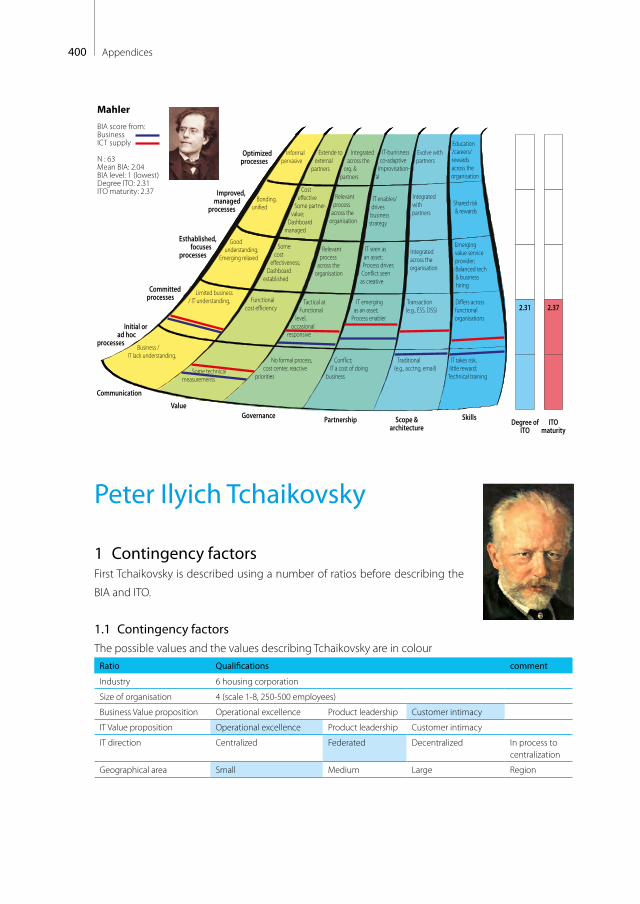
400 Appendices
Informalpervasive
Optimized processes
Improved, managed
processes
Esthablished,focuses
processes
Committedprocesses
Initial or ad hoc
processes
Bonding, uni�ed
Cost e�ective
Some partner-value;
Dashboard managed
Some cost
e�ectiveness; Dashboard
established
IT enables/drives business strategy
IT seen as an asset; Process driver;Con�ict seen as creative
Shared risk & rewards
Emerging value service provider;Balanced tech & business hiring
Relevant process
across the organisation
Relevant process
across the organisation
Good understanding;
Emerging relaxed
Limited business / IT understanding,
Business / IT lack understanding,
Functional cost e�ciency
Some technical measurements
No formal process,cost center, reactive
priorities
Con�ict; IT a cost of doing
business
Traditional (e.g., acctng, email)
IT takes risk, little reward;
Technical training
Tactical at Functional
level,occasional
responsive
IT emerging as an asset;
Process enabler
Transaction (e.g., ESS, DSS)
Di�ers across functional organisations
Integrated with partners
Integrated across the organisation
Extende to external
partners
Integrated across the
org. & partners
Evolve with partners
IT-bunisness co-adaptive
Improvisation-al
Education/careers/rewards across the organisation
Communication
ValueGovernance Partnership Scope &
architectureSkills
Mahler
BIA score from:BusinessICT supply
N : 63Mean BIA: 2.04BIA level: 1 (lowest)Degree ITO: 2.31ITO maturity: 2.37
Degree ofITO
ITOmaturity
2.31 2.37
Peter Ilyich Tchaikovsky
1 Contingency factorsFirst Tchaikovsky is described using a number of ratios before describing the
BIA and ITO.
1.1 Contingency factorsThe possible values and the values describing Tchaikovsky are in colour
Ratio Qualifications comment
Industry 6 housing corporation
Size of organisation 4 (scale 1-8, 250-500 employees)
Business Value proposition Operational excellence Product leadership Customer intimacy
IT Value proposition Operational excellence Product leadership Customer intimacy
IT direction Centralized Federated Decentralized In process to centralization
Geographical area Small Medium Large Region

401Appendix I: Case results
1.2 Scope of researchThe scope of research is the entire organisation.
1.3 Attitude, Behaviour, CultureThe Attitude, Behaviour and Culture game was not held within the organisation.
2 BIAThe results of the BIA assessment are described below on the maturity levels one to five. Number of
observations within Tchaikovsky: 24 (54 invited)
Mat
urity
leve
lst
rate
gic
alig
nmen
t
1.00
1.50
2.00
2.50
3.00
3.50
4.00
Average Score
Communica-tions
Value measure-
ments
Governance Partnership Scope & Architecture
Skills
Tchaikovsky 2.34 2.39 1.80 2.33 2.58 2.62 2.34
Tchaikovsky Business 2.30 2.36 1.82 2.33 2.64 2.53 2.14
Tchaikovsky ICT 2.44 2.56 1.74 2.24 2.56 2.93 2.63
The element ‘Value Measurements’ is at level 1.
3 ITO
3.1 Degree of ITOIn the table below the degree ITO at Tchaikovsky is displayed based on an scale 1 to 5, 1 being low
degree ITO and 5 high degree ITO.ITO characteristic Score Explanation
Technical management (5 sub elements) 2 Limited
End user management (5 sub elements) 1 Not
Application management (4 sub elements) 3.75 Largely
Functional management 2.6 Partly
Size of outsourcing deal 3 scale 1 – 5 ,3 = between 11-25% of IT budget
Degree ITO 2.47 Partly
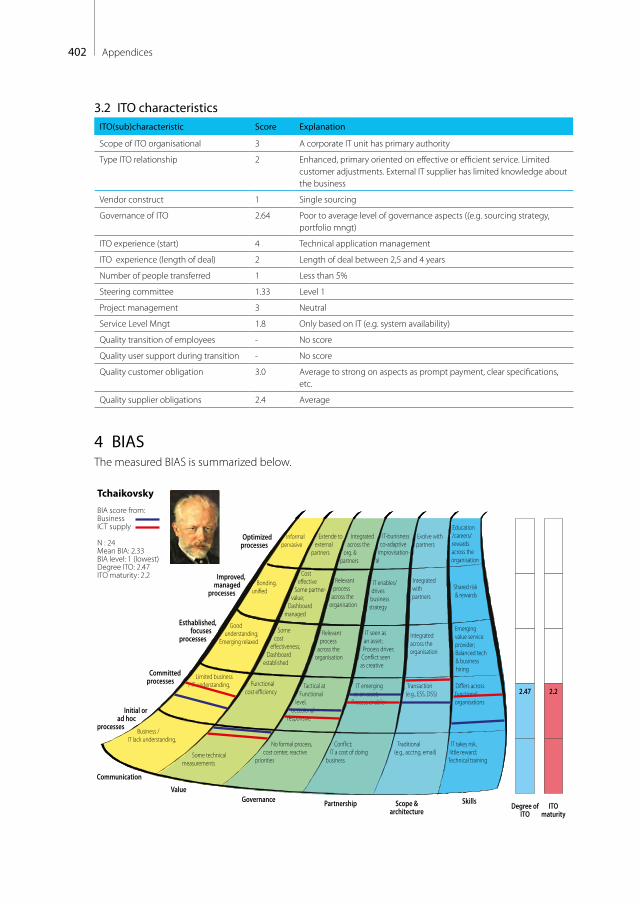
402 Appendices
3.2 ITO characteristicsITO(sub)characteristic Score Explanation
Scope of ITO organisational 3 A corporate IT unit has primary authority
Type ITO relationship 2 Enhanced, primary oriented on effective or efficient service. Limited customer adjustments. External IT supplier has limited knowledge about the business
Vendor construct 1 Single sourcing
Governance of ITO 2.64 Poor to average level of governance aspects ((e.g. sourcing strategy, portfolio mngt)
ITO experience (start) 4 Technical application management
ITO experience (length of deal) 2 Length of deal between 2,5 and 4 years
Number of people transferred 1 Less than 5%
Steering committee 1.33 Level 1
Project management 3 Neutral
Service Level Mngt 1.8 Only based on IT (e.g. system availability)
Quality transition of employees - No score
Quality user support during transition - No score
Quality customer obligation 3.0 Average to strong on aspects as prompt payment, clear specifications, etc.
Quality supplier obligations 2.4 Average
4 BIASThe measured BIAS is summarized below.
Informalpervasive
Optimized processes
Improved, managed
processes
Esthablished,focuses
processes
Committedprocesses
Initial or ad hoc
processes
Bonding, uni�ed
Cost e�ective
Some partner-value;
Dashboard managed
Some cost
e�ectiveness; Dashboard
established
IT enables/drives business strategy
IT seen as an asset; Process driver;Con�ict seen as creative
Shared risk & rewards
Emerging value service provider;Balanced tech & business hiring
Relevant process
across the organisation
Relevant process
across the organisation
Good understanding;
Emerging relaxed
Limited business / IT understanding,
Business / IT lack understanding,
Functional cost e�ciency
Some technical measurements
No formal process,cost center, reactive
priorities
Con�ict; IT a cost of doing
business
Traditional (e.g., acctng, email)
IT takes risk, little reward;
Technical training
Tactical at Functional
level,occasional
responsive
IT emerging as an asset;
Process enabler
Transaction (e.g., ESS, DSS)
Di�ers across functional organisations
Integrated with partners
Integrated across the organisation
Extende to external
partners
Integrated across the
org. & partners
Evolve with partners
IT-bunisness co-adaptive
Improvisation-al
Education/careers/rewards across the organisation
Communication
ValueGovernance Partnership Scope &
architectureSkills
Tchaikovsky
BIA score from:BusinessICT supply
N : 24Mean BIA: 2.33BIA level: 1 (lowest)Degree ITO: 2.47ITO maturity: 2.2
Degree ofITO
ITOmaturity
2.47 2.2
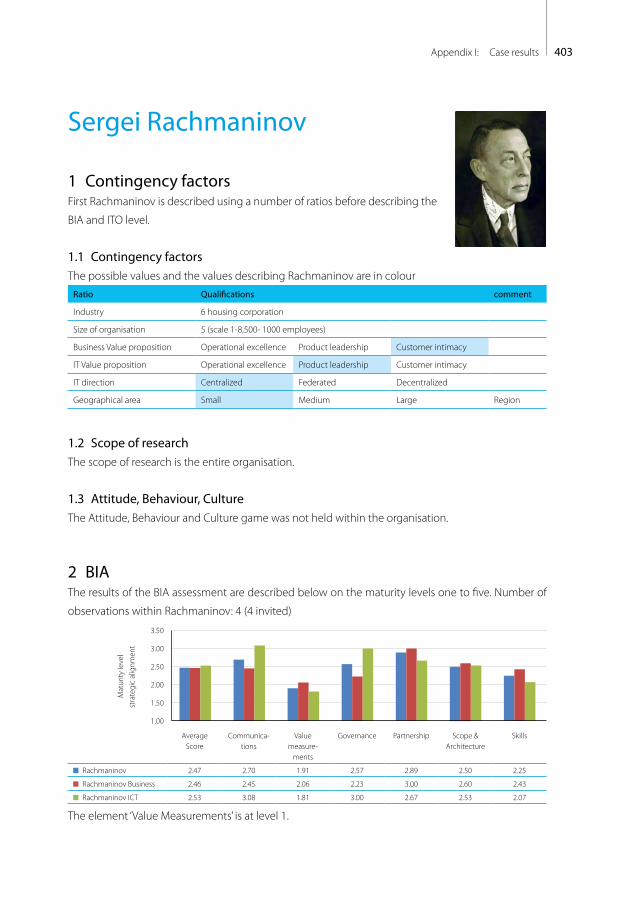
403Appendix I: Case results
Sergei Rachmaninov
1 Contingency factorsFirst Rachmaninov is described using a number of ratios before describing the
BIA and ITO level.
1.1 Contingency factorsThe possible values and the values describing Rachmaninov are in colour
Ratio Qualifications comment
Industry 6 housing corporation
Size of organisation 5 (scale 1-8,500- 1000 employees)
Business Value proposition Operational excellence Product leadership Customer intimacy
IT Value proposition Operational excellence Product leadership Customer intimacy
IT direction Centralized Federated Decentralized
Geographical area Small Medium Large Region
1.2 Scope of researchThe scope of research is the entire organisation.
1.3 Attitude, Behaviour, CultureThe Attitude, Behaviour and Culture game was not held within the organisation.
2 BIAThe results of the BIA assessment are described below on the maturity levels one to five. Number of
observations within Rachmaninov: 4 (4 invited)
Mat
urity
leve
lst
rate
gic
alig
nmen
t
1.00
1.50
2.00
2.50
3.00
3.50
Average Score
Communica-tions
Value measure-
ments
Governance Partnership Scope & Architecture
Skills
Rachmaninov 2.47 2.70 1.91 2.57 2.89 2.50 2.25
Rachmaninov Business 2.46 2.45 2.06 2.23 3.00 2.60 2.43
Rachmaninov ICT 2.53 3.08 1.81 3.00 2.67 2.53 2.07
The element ‘Value Measurements’ is at level 1.
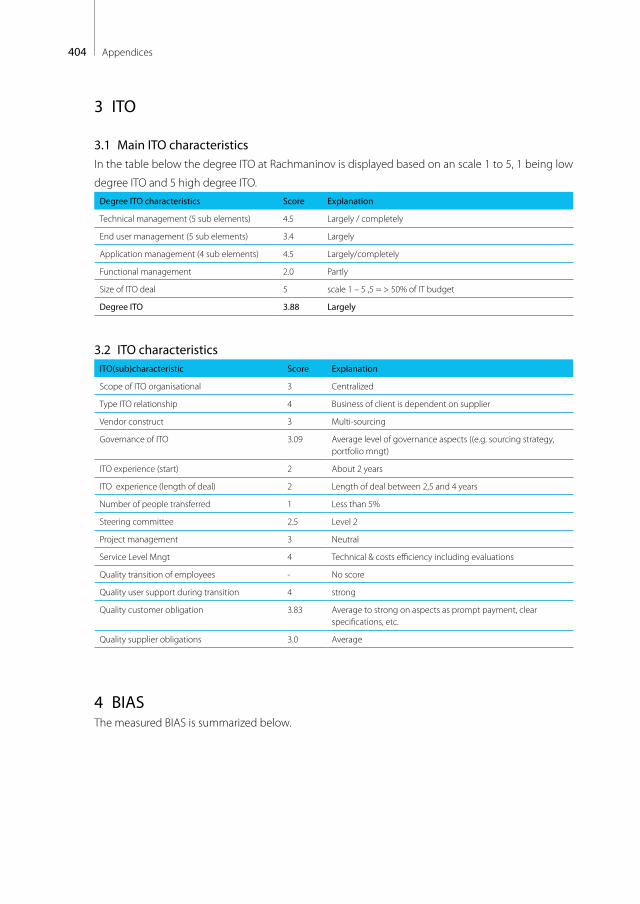
404 Appendices
3 ITO
3.1 Main ITO characteristicsIn the table below the degree ITO at Rachmaninov is displayed based on an scale 1 to 5, 1 being low
degree ITO and 5 high degree ITO.Degree ITO characteristics Score Explanation
Technical management (5 sub elements) 4.5 Largely / completely
End user management (5 sub elements) 3.4 Largely
Application management (4 sub elements) 4.5 Largely/completely
Functional management 2.0 Partly
Size of ITO deal 5 scale 1 – 5 ,5 = > 50% of IT budget
Degree ITO 3.88 Largely
3.2 ITO characteristicsITO(sub)characteristic Score Explanation
Scope of ITO organisational 3 Centralized
Type ITO relationship 4 Business of client is dependent on supplier
Vendor construct 3 Multi-sourcing
Governance of ITO 3.09 Average level of governance aspects ((e.g. sourcing strategy, portfolio mngt)
ITO experience (start) 2 About 2 years
ITO experience (length of deal) 2 Length of deal between 2,5 and 4 years
Number of people transferred 1 Less than 5%
Steering committee 2.5 Level 2
Project management 3 Neutral
Service Level Mngt 4 Technical & costs efficiency including evaluations
Quality transition of employees - No score
Quality user support during transition 4 strong
Quality customer obligation 3.83 Average to strong on aspects as prompt payment, clear specifications, etc.
Quality supplier obligations 3.0 Average
4 BIASThe measured BIAS is summarized below.
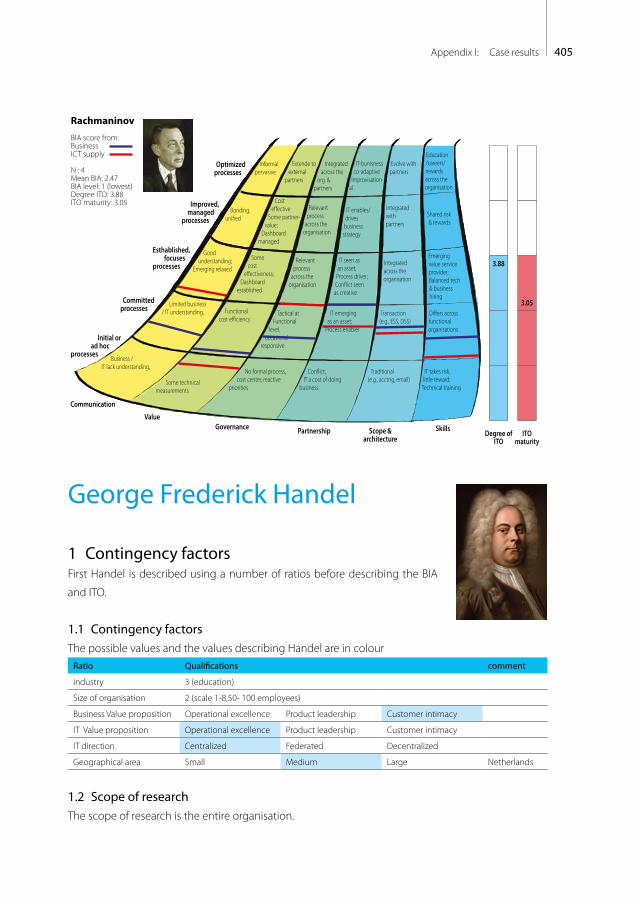
405Appendix I: Case results
Informalpervasive
Optimized processes
Improved, managed
processes
Esthablished,focuses
processes
Committedprocesses
Initial or ad hoc
processes
Bonding, uni�ed
Cost e�ective
Some partner-value;
Dashboard managed
Some cost
e�ectiveness; Dashboard
established
IT enables/drives business strategy
IT seen as an asset; Process driver;Con�ict seen as creative
Shared risk & rewards
Emerging value service provider;Balanced tech & business hiring
Relevant process
across the organisation
Relevant process
across the organisation
Good understanding;
Emerging relaxed
Limited business / IT understanding,
Business / IT lack understanding,
Functional cost e�ciency
Some technical measurements
No formal process,cost center, reactive
priorities
Con�ict; IT a cost of doing
business
Traditional (e.g., acctng, email)
IT takes risk, little reward;
Technical training
Tactical at Functional
level,occasional
responsive
IT emerging as an asset;
Process enabler
Transaction (e.g., ESS, DSS)
Di�ers across functional organisations
Integrated with partners
Integrated across the organisation
Extende to external
partners
Integrated across the
org. & partners
Evolve with partners
IT-bunisness co-adaptive
Improvisation-al
Education/careers/rewards across the organisation
Communication
ValueGovernance Partnership Scope &
architectureSkills
Rachmaninov
BIA score from:BusinessICT supply
N : 4Mean BIA: 2.47BIA level: 1 (lowest)Degree ITO: 3.88ITO maturity: 3.05
Degree ofITO
ITOmaturity
3.88
3.05
George Frederick Handel
1 Contingency factorsFirst Handel is described using a number of ratios before describing the BIA
and ITO.
1.1 Contingency factorsThe possible values and the values describing Handel are in colour
Ratio Qualifications comment
industry 3 (education)
Size of organisation 2 (scale 1-8,50- 100 employees)
Business Value proposition Operational excellence Product leadership Customer intimacy
IT Value proposition Operational excellence Product leadership Customer intimacy
IT direction Centralized Federated Decentralized
Geographical area Small Medium Large Netherlands
1.2 Scope of researchThe scope of research is the entire organisation.
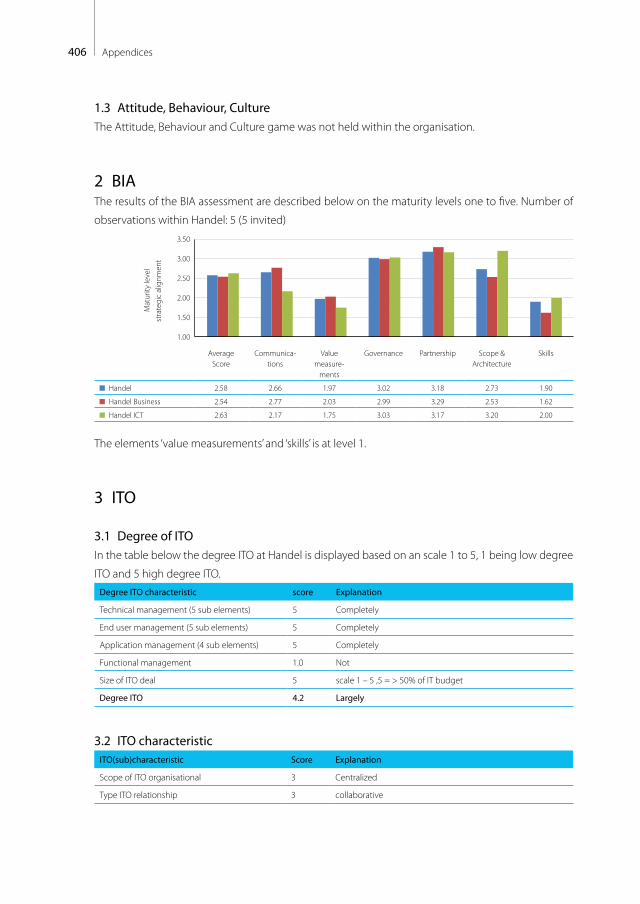
406 Appendices
1.3 Attitude, Behaviour, CultureThe Attitude, Behaviour and Culture game was not held within the organisation.
2 BIAThe results of the BIA assessment are described below on the maturity levels one to five. Number of
observations within Handel: 5 (5 invited)
Mat
urity
leve
lst
rate
gic
alig
nmen
t
1.00
1.50
2.00
2.50
3.00
3.50
Average Score
Communica-tions
Value measure-
ments
Governance Partnership Scope & Architecture
Skills
Handel 2.58 2.66 1.97 3.02 3.18 2.73 1.90
Handel Business 2.54 2.77 2.03 2.99 3.29 2.53 1.62
Handel ICT 2.63 2.17 1.75 3.03 3.17 3.20 2.00
The elements ‘value measurements’ and ‘skills’ is at level 1.
3 ITO
3.1 Degree of ITOIn the table below the degree ITO at Handel is displayed based on an scale 1 to 5, 1 being low degree
ITO and 5 high degree ITO.Degree ITO characteristic score Explanation
Technical management (5 sub elements) 5 Completely
End user management (5 sub elements) 5 Completely
Application management (4 sub elements) 5 Completely
Functional management 1.0 Not
Size of ITO deal 5 scale 1 – 5 ,5 = > 50% of IT budget
Degree ITO 4.2 Largely
3.2 ITO characteristicITO(sub)characteristic Score Explanation
Scope of ITO organisational 3 Centralized
Type ITO relationship 3 collaborative

407Appendix I: Case results
Vendor construct 2 Co-sourcing
Governance of ITO 4.18 good
ITO experience (start) 4 4-6 years
ITO experience (length of deal) 2 Length of deal between 2,5 and 4 years
Number of people transferred 1 Less than 5%
Steering committee 3.75 Level 3
Project management 2 poor
Service Level Mngt 1 Only technical
Quality transition of employees - No score
Quality user support during transition - No score
Quality customer obligation 3.67 Strong on aspects as prompt payment, clear specifications, etc.
Quality supplier obligations 1.4 poor
4 BIASThe measured BIAS is summarized below.
Informalpervasive
Optimized processes
Improved, managed
processes
Esthablished,focuses
processes
Committedprocesses
Initial or ad hoc
processes
Bonding, uni�ed
Cost e�ective
Some partner-value;
Dashboard managed
Some cost
e�ectiveness; Dashboard
established
IT enables/drives business strategy
IT seen as an asset; Process driver;Con�ict seen as creative
Shared risk & rewards
Emerging value service provider;Balanced tech & business hiring
Relevant process
across the organisation
Relevant process
across the organisation
Good understanding;
Emerging relaxed
Limited business / IT understanding,
Business / IT lack understanding,
Functional cost e�ciency
Some technical measurements
No formal process,cost center, reactive
priorities
Con�ict; IT a cost of doing
business
Traditional (e.g., acctng, email)
IT takes risk, little reward;
Technical training
Tactical at Functional
level,occasional
responsive
IT emerging as an asset;
Process enabler
Transaction (e.g., ESS, DSS)
Di�ers across functional organisations
Integrated with partners
Integrated across the organisation
Extende to external
partners
Integrated across the
org. & partners
Evolve with partners
IT-bunisness co-adaptive
Improvisation-al
Education/careers/rewards across the organisation
Communication
ValueGovernance Partnership Scope &
architectureSkills
Handel
BIA score from:BusinessICT supply
N : 5Mean BIA: 2.58BIA level: 1 (lowest)Degree ITO: 4.2ITO maturity: 2.65
Degree ofITO
ITOmaturity
4.2
2.65
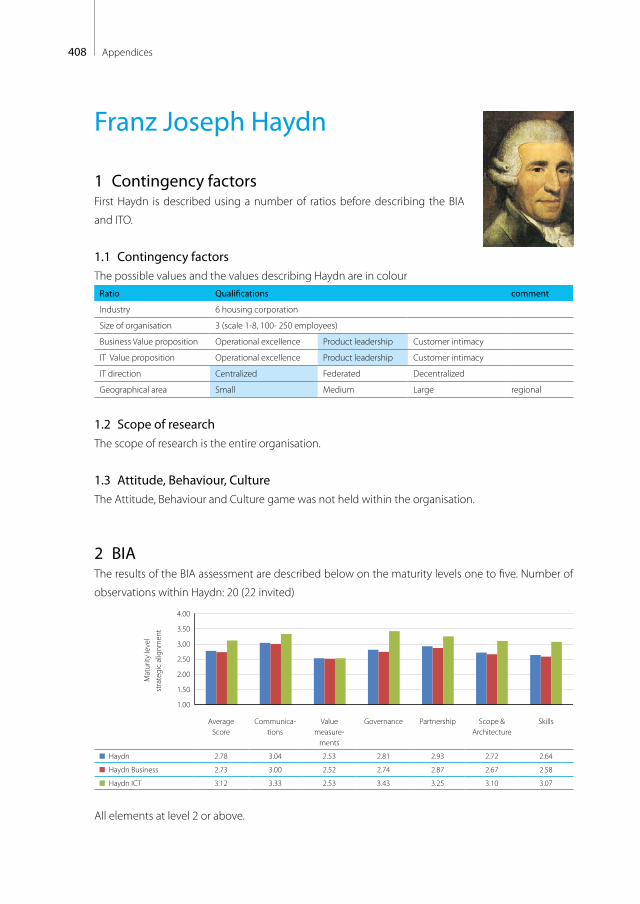
408 Appendices
Franz Joseph Haydn
1 Contingency factorsFirst Haydn is described using a number of ratios before describing the BIA
and ITO.
1.1 Contingency factorsThe possible values and the values describing Haydn are in colour
Ratio Qualifications comment
Industry 6 housing corporation
Size of organisation 3 (scale 1-8, 100- 250 employees)
Business Value proposition Operational excellence Product leadership Customer intimacy
IT Value proposition Operational excellence Product leadership Customer intimacy
IT direction Centralized Federated Decentralized
Geographical area Small Medium Large regional
1.2 Scope of researchThe scope of research is the entire organisation.
1.3 Attitude, Behaviour, CultureThe Attitude, Behaviour and Culture game was not held within the organisation.
2 BIAThe results of the BIA assessment are described below on the maturity levels one to five. Number of
observations within Haydn: 20 (22 invited)
Mat
urity
leve
lst
rate
gic
alig
nmen
t
1.00
1.50
2.00
2.50
3.00
3.50
4.00
Average Score
Communica-tions
Value measure-
ments
Governance Partnership Scope & Architecture
Skills
Haydn 2.78 3.04 2.53 2.81 2.93 2.72 2.64
Haydn Business 2.73 3.00 2.52 2.74 2.87 2.67 2.58
Haydn ICT 3.12 3.33 2.53 3.43 3.25 3.10 3.07
All elements at level 2 or above.
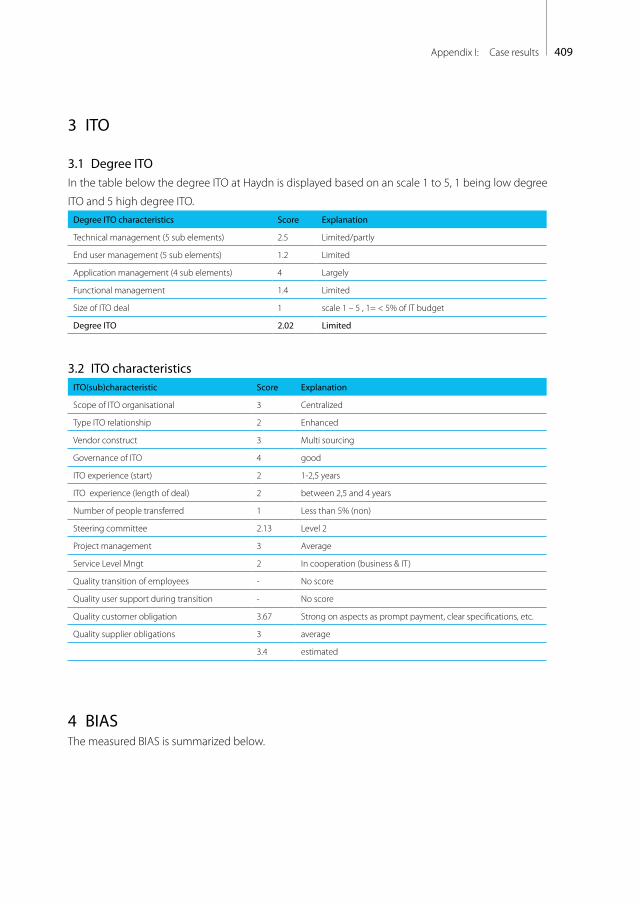
409Appendix I: Case results
3 ITO
3.1 Degree ITOIn the table below the degree ITO at Haydn is displayed based on an scale 1 to 5, 1 being low degree
ITO and 5 high degree ITO.Degree ITO characteristics Score Explanation
Technical management (5 sub elements) 2.5 Limited/partly
End user management (5 sub elements) 1.2 Limited
Application management (4 sub elements) 4 Largely
Functional management 1.4 Limited
Size of ITO deal 1 scale 1 – 5 , 1= < 5% of IT budget
Degree ITO 2.02 Limited
3.2 ITO characteristicsITO(sub)characteristic Score Explanation
Scope of ITO organisational 3 Centralized
Type ITO relationship 2 Enhanced
Vendor construct 3 Multi sourcing
Governance of ITO 4 good
ITO experience (start) 2 1-2,5 years
ITO experience (length of deal) 2 between 2,5 and 4 years
Number of people transferred 1 Less than 5% (non)
Steering committee 2.13 Level 2
Project management 3 Average
Service Level Mngt 2 In cooperation (business & IT)
Quality transition of employees - No score
Quality user support during transition - No score
Quality customer obligation 3.67 Strong on aspects as prompt payment, clear specifications, etc.
Quality supplier obligations 3 average
3.4 estimated
4 BIASThe measured BIAS is summarized below.

410 Appendices
Informalpervasive
Optimized processes
Improved, managed
processes
Esthablished,focuses
processes
Committedprocesses
Initial or ad hoc
processes
Bonding, uni�ed
Cost e�ective
Some partner-value;
Dashboard managed
Some cost
e�ectiveness; Dashboard
established
IT enables/drives business strategy
IT seen as an asset; Process driver;Con�ict seen as creative
Shared risk & rewards
Emerging value service provider;Balanced tech & business hiring
Relevant process
across the organisation
Relevant process
across the organisation
Good understanding;
Emerging relaxed
Limited business / IT understanding,
Business / IT lack understanding,
Functional cost e�ciency
Some technical measurements
No formal process,cost center, reactive
priorities
Con�ict; IT a cost of doing
business
Traditional (e.g., acctng, email)
IT takes risk, little reward;
Technical training
Tactical at Functional
level,occasional
responsive
IT emerging as an asset;
Process enabler
Transaction (e.g., ESS, DSS)
Di�ers across functional organisations
Integrated with partners
Integrated across the organisation
Extende to external
partners
Integrated across the
org. & partners
Evolve with partners
IT-bunisness co-adaptive
Improvisation-al
Education/careers/rewards across the organisation
Communication
ValueGovernance Partnership Scope &
architectureSkills
Haydn
BIA score from:BusinessICT supply
N : 20Mean BIA: 2.76BIA level: 2 (lowest)Degree ITO: 2.02ITO maturity: 2.98
Degree ofITO
ITOmaturity
2.02
2.98
Antonin Dvorak
1 Contingency factorsFirst Dvorak is described using a number of ratios before describing the BIA
and ITO.
1.1 RatiosThe possible values and the values describing Dvorak are in colour
Ratio Qualifications comment
Industry 6 housing
Size of organisation 2 (scale 1-8, 50- 100 employees)
Business Value proposition Operational excellence Product leadership Customer intimacy
IT Value proposition Operational excellence Product leadership Customer intimacy
IT direction Centralized Federated Decentralized
Geographical area Small Medium Large regional
1.2 Scope of researchThe scope of research is the entire organisation.
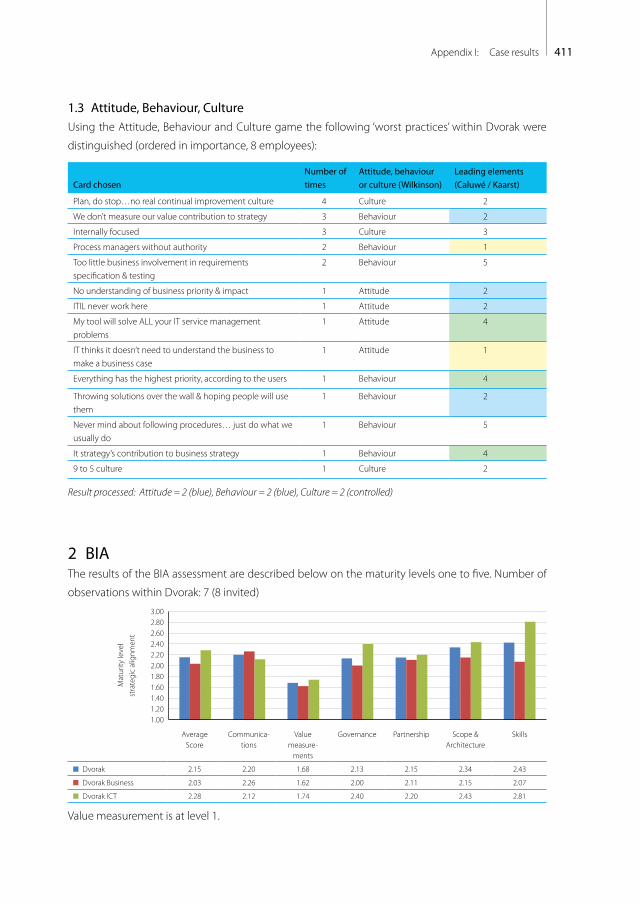
411Appendix I: Case results
1.3 Attitude, Behaviour, CultureUsing the Attitude, Behaviour and Culture game the following ‘worst practices’ within Dvorak were
distinguished (ordered in importance, 8 employees):
Card chosenNumber of times
Attitude, behaviour or culture (Wilkinson)
Leading elements (Caluwé / Kaarst)
Plan, do stop…no real continual improvement culture 4 Culture 2
We don’t measure our value contribution to strategy 3 Behaviour 2
Internally focused 3 Culture 3
Process managers without authority 2 Behaviour 1
Too little business involvement in requirements specification & testing
2 Behaviour 5
No understanding of business priority & impact 1 Attitude 2
ITIL never work here 1 Attitude 2
My tool will solve ALL your IT service management problems
1 Attitude 4
IT thinks it doesn’t need to understand the business to make a business case
1 Attitude 1
Everything has the highest priority, according to the users 1 Behaviour 4
Throwing solutions over the wall & hoping people will use them
1 Behaviour 2
Never mind about following procedures… just do what we usually do
1 Behaviour 5
It strategy’s contribution to business strategy 1 Behaviour 4
9 to 5 culture 1 Culture 2
Result processed: Attitude = 2 (blue), Behaviour = 2 (blue), Culture = 2 (controlled)
2 BIAThe results of the BIA assessment are described below on the maturity levels one to five. Number of
observations within Dvorak: 7 (8 invited)
Mat
urity
leve
lst
rate
gic
alig
nmen
t
1.001.201.401.601.802.002.202.402.602.803.00
Average Score
Communica-tions
Value measure-
ments
Governance Partnership Scope & Architecture
Skills
Dvorak 2.15 2.20 1.68 2.13 2.15 2.34 2.43
Dvorak Business 2.03 2.26 1.62 2.00 2.11 2.15 2.07
Dvorak ICT 2.28 2.12 1.74 2.40 2.20 2.43 2.81
Value measurement is at level 1.

412 Appendices
3 ITO
3.1 Degree of ITOIn the table below the degree ITO at Dvorak is displayed based on an scale 1 to 5, 1 being low degree
ITO and 5 high degree ITO.degree ITO characteristic Score Explanation
Technical management (5 sub elements) 2.5 partly
End user management (5 sub elements) 1.25 Not
Application management (4 sub elements) 2.25 Partly
Functional management 1.0 Not
Size of ITO deal 4 scale 1 – 5 , 4 = 25-50% of IT budget
Degree ITO 2.2 Limited
3.2 ITO characteristicsITO(sub)characteristic Average Score Explanation
Scope of ITO organisational 3 Centralized
Type ITO relationship 3 Customer specific
Vendor construct 3 Multi sourcing
Governance of ITO 3.64 Average to good
ITO experience (start) 5 6 years
ITO experience (length of deal) 2 between 2,5 and 4 years
Number of people transferred 1 Less than 5% (non)
Steering committee 1.33 Level 1
Project management 3 Average
Service Level Mngt 2 In cooperation (business & IT)
Quality transition of employees - No score
Quality user support during transition - No score
Quality customer obligation 3.17 Average
Quality supplier obligations 3.6 average
4 BIASThe measured BIAS is summarized below.
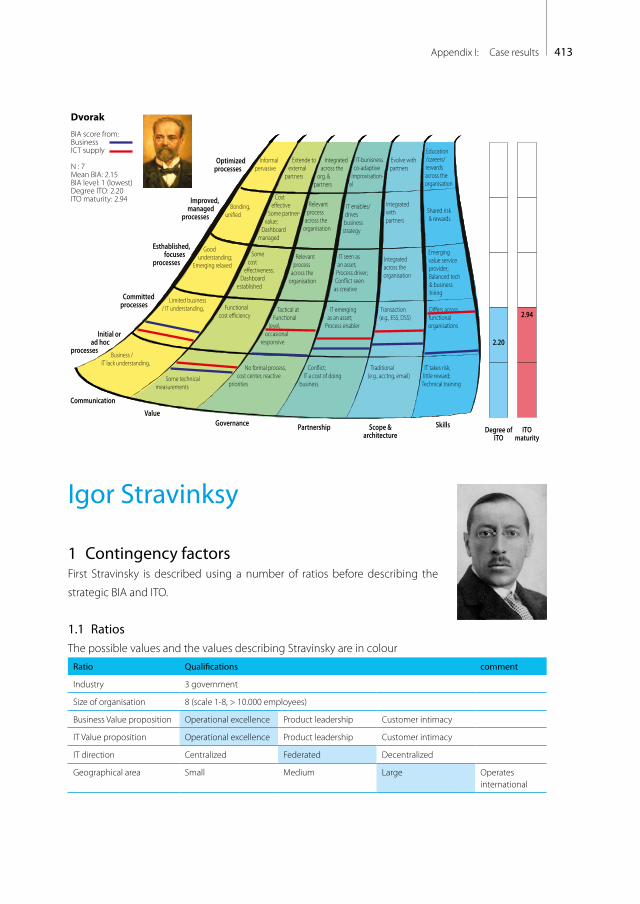
413Appendix I: Case results
Informalpervasive
Optimized processes
Improved, managed
processes
Esthablished,focuses
processes
Committedprocesses
Initial or ad hoc
processes
Bonding, uni�ed
Cost e�ective
Some partner-value;
Dashboard managed
Some cost
e�ectiveness; Dashboard
established
IT enables/drives business strategy
IT seen as an asset; Process driver;Con�ict seen as creative
Shared risk & rewards
Emerging value service provider;Balanced tech & business hiring
Relevant process
across the organisation
Relevant process
across the organisation
Good understanding;
Emerging relaxed
Limited business / IT understanding,
Business / IT lack understanding,
Functional cost e�ciency
Some technical measurements
No formal process,cost center, reactive
priorities
Con�ict; IT a cost of doing
business
Traditional (e.g., acctng, email)
IT takes risk, little reward;
Technical training
Tactical at Functional
level,occasional
responsive
IT emerging as an asset;
Process enabler
Transaction (e.g., ESS, DSS)
Di�ers across functional organisations
Integrated with partners
Integrated across the organisation
Extende to external
partners
Integrated across the
org. & partners
Evolve with partners
IT-bunisness co-adaptive
Improvisation-al
Education/careers/rewards across the organisation
Communication
ValueGovernance Partnership Scope &
architectureSkills
Dvorak
BIA score from:BusinessICT supply
N : 7Mean BIA: 2.15BIA level: 1 (lowest)Degree ITO: 2.20ITO maturity: 2.94
Degree ofITO
ITOmaturity
2.20
2.94
Igor Stravinksy
1 Contingency factorsFirst Stravinsky is described using a number of ratios before describing the
strategic BIA and ITO.
1.1 RatiosThe possible values and the values describing Stravinsky are in colour
Ratio Qualifications comment
Industry 3 government
Size of organisation 8 (scale 1-8, > 10.000 employees)
Business Value proposition Operational excellence Product leadership Customer intimacy
IT Value proposition Operational excellence Product leadership Customer intimacy
IT direction Centralized Federated Decentralized
Geographical area Small Medium Large Operates international
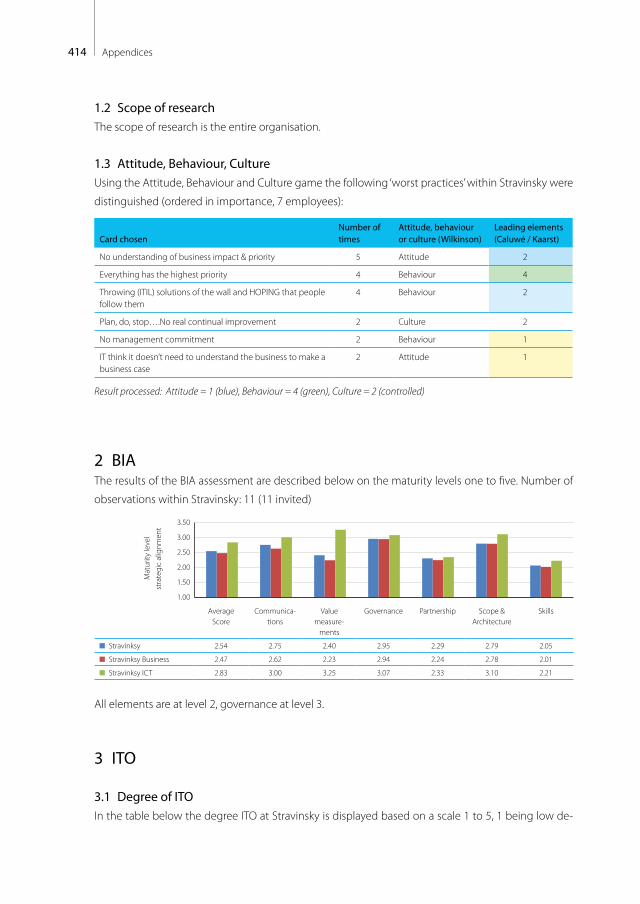
414 Appendices
1.2 Scope of researchThe scope of research is the entire organisation.
1.3 Attitude, Behaviour, CultureUsing the Attitude, Behaviour and Culture game the following ‘worst practices’ within Stravinsky were
distinguished (ordered in importance, 7 employees):
Card chosenNumber of times
Attitude, behaviour or culture (Wilkinson)
Leading elements (Caluwé / Kaarst)
No understanding of business impact & priority 5 Attitude 2
Everything has the highest priority 4 Behaviour 4
Throwing (ITIL) solutions of the wall and HOPING that people follow them
4 Behaviour 2
Plan, do, stop….No real continual improvement 2 Culture 2
No management commitment 2 Behaviour 1
IT think it doesn’t need to understand the business to make a business case
2 Attitude 1
Result processed: Attitude = 1 (blue), Behaviour = 4 (green), Culture = 2 (controlled)
2 BIAThe results of the BIA assessment are described below on the maturity levels one to five. Number of
observations within Stravinsky: 11 (11 invited)
Mat
urity
leve
lst
rate
gic
alig
nmen
t
1.00
1.50
2.00
2.50
3.00
3.50
Average Score
Communica-tions
Value measure-
ments
Governance Partnership Scope & Architecture
Skills
Stravinksy 2.54 2.75 2.40 2.95 2.29 2.79 2.05
Stravinksy Business 2.47 2.62 2.23 2.94 2.24 2.78 2.01
Stravinksy ICT 2.83 3.00 3.25 3.07 2.33 3.10 2.21
All elements are at level 2, governance at level 3.
3 ITO
3.1 Degree of ITOIn the table below the degree ITO at Stravinsky is displayed based on a scale 1 to 5, 1 being low de-

415Appendix I: Case results
gree ITO and 5 high degree ITO.Degree ITO characteristics Score Explanation
Technical management (5 sub elements) 1.0 Not
End user management (5 sub elements) 1.0 Not
Application management (4 sub elements) 1.5 Limited
Functional management 1.0 Not
Size of ITO deal 4 scale 1 – 5 , 4 = 25-50% of IT budget
Degree ITO 1.7 Limited
3.2 ITO characteristicsITO(sub)characteristic Average Score (interview) Explanation
Scope of ITO organisational 3 Centralized
Type ITO relationship 2 Enhanced
Vendor construct 3 Multi sourcing
Governance of ITO 3.18 Average
ITO experience (start) 5 > 6 years
ITO experience (length of deal) 2 between 2,5 and 4 years
Number of people transferred 2 5-10%
Steering committee 2.8 Level 2
Project management 3 Average
Service Level Mngt 2 In cooperation
Quality transition of employees - No score
Quality user support during transition - No score
Quality customer obligation 3.17 Average
Quality supplier obligations 2.6 average
4 BIASThe measured BIAS is summarized below.
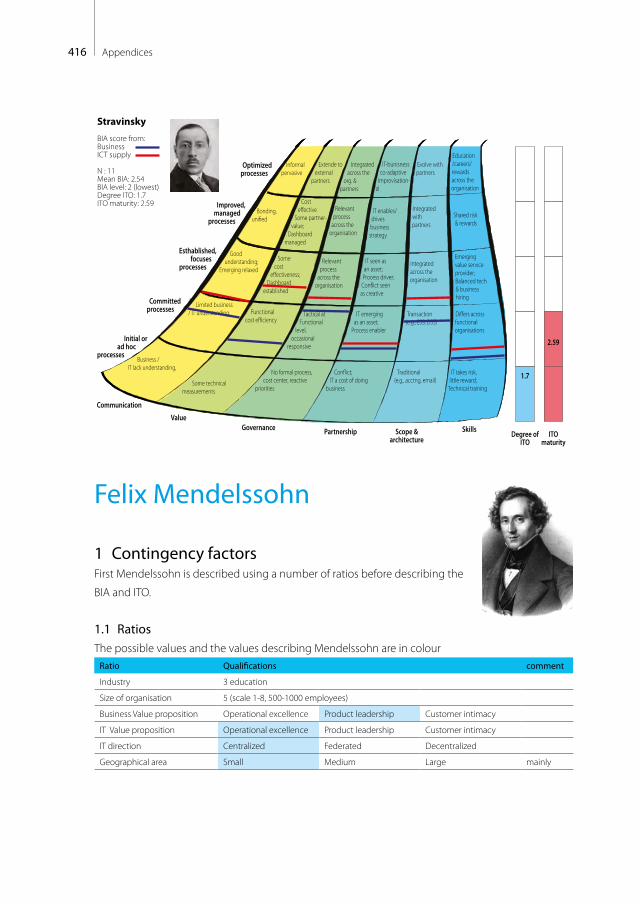
416 Appendices
Informalpervasive
Optimized processes
Improved, managed
processes
Esthablished,focuses
processes
Committedprocesses
Initial or ad hoc
processes
Bonding, uni�ed
Cost e�ective
Some partner-value;
Dashboard managed
Some cost
e�ectiveness; Dashboard
established
IT enables/drives business strategy
IT seen as an asset; Process driver;Con�ict seen as creative
Shared risk & rewards
Emerging value service provider;Balanced tech & business hiring
Relevant process
across the organisation
Relevant process
across the organisation
Good understanding;
Emerging relaxed
Limited business / IT understanding,
Business / IT lack understanding,
Functional cost e�ciency
Some technical measurements
No formal process,cost center, reactive
priorities
Con�ict; IT a cost of doing
business
Traditional (e.g., acctng, email)
IT takes risk, little reward;
Technical training
Tactical at Functional
level,occasional
responsive
IT emerging as an asset;
Process enabler
Transaction (e.g., ESS, DSS)
Di�ers across functional organisations
Integrated with partners
Integrated across the organisation
Extende to external
partners
Integrated across the
org. & partners
Evolve with partners
IT-bunisness co-adaptive
Improvisation-al
Education/careers/rewards across the organisation
Communication
ValueGovernance Partnership Scope &
architectureSkills
Stravinsky
BIA score from:BusinessICT supply
N : 11Mean BIA: 2.54BIA level: 2 (lowest)Degree ITO: 1.7ITO maturity: 2.59
Degree ofITO
ITOmaturity
1.7
2.59
Felix Mendelssohn
1 Contingency factorsFirst Mendelssohn is described using a number of ratios before describing the
BIA and ITO.
1.1 RatiosThe possible values and the values describing Mendelssohn are in colour
Ratio Qualifications comment
Industry 3 education
Size of organisation 5 (scale 1-8, 500-1000 employees)
Business Value proposition Operational excellence Product leadership Customer intimacy
IT Value proposition Operational excellence Product leadership Customer intimacy
IT direction Centralized Federated Decentralized
Geographical area Small Medium Large mainly
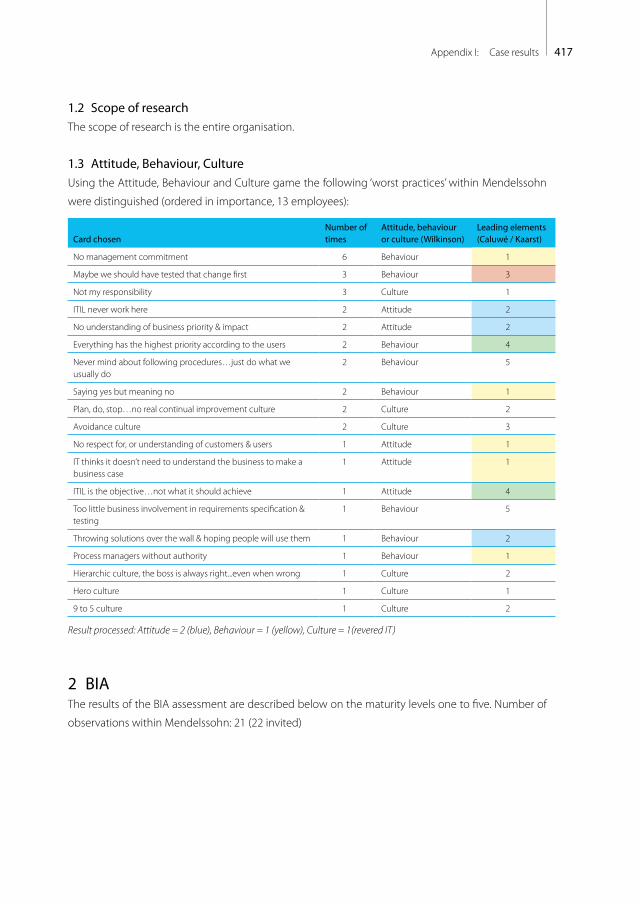
417Appendix I: Case results
1.2 Scope of researchThe scope of research is the entire organisation.
1.3 Attitude, Behaviour, CultureUsing the Attitude, Behaviour and Culture game the following ‘worst practices’ within Mendelssohn
were distinguished (ordered in importance, 13 employees):
Card chosenNumber of times
Attitude, behaviour or culture (Wilkinson)
Leading elements (Caluwé / Kaarst)
No management commitment 6 Behaviour 1
Maybe we should have tested that change first 3 Behaviour 3
Not my responsibility 3 Culture 1
ITIL never work here 2 Attitude 2
No understanding of business priority & impact 2 Attitude 2
Everything has the highest priority according to the users 2 Behaviour 4
Never mind about following procedures…just do what we usually do
2 Behaviour 5
Saying yes but meaning no 2 Behaviour 1
Plan, do, stop…no real continual improvement culture 2 Culture 2
Avoidance culture 2 Culture 3
No respect for, or understanding of customers & users 1 Attitude 1
IT thinks it doesn’t need to understand the business to make a business case
1 Attitude 1
ITIL is the objective…not what it should achieve 1 Attitude 4
Too little business involvement in requirements specification & testing
1 Behaviour 5
Throwing solutions over the wall & hoping people will use them 1 Behaviour 2
Process managers without authority 1 Behaviour 1
Hierarchic culture, the boss is always right...even when wrong 1 Culture 2
Hero culture 1 Culture 1
9 to 5 culture 1 Culture 2
Result processed: Attitude = 2 (blue), Behaviour = 1 (yellow), Culture = 1(revered IT)
2 BIAThe results of the BIA assessment are described below on the maturity levels one to five. Number of
observations within Mendelssohn: 21 (22 invited)
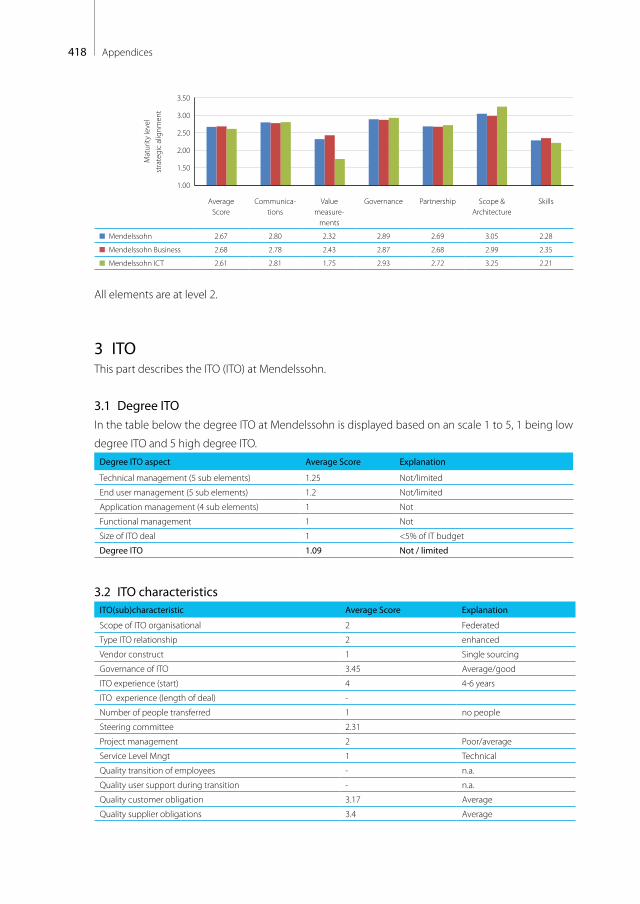
418 Appendices
Mat
urity
leve
lst
rate
gic
alig
nmen
t
1.00
1.50
2.00
2.50
3.00
3.50
Average Score
Communica-tions
Value measure-
ments
Governance Partnership Scope & Architecture
Skills
Mendelssohn 2.67 2.80 2.32 2.89 2.69 3.05 2.28
Mendelssohn Business 2.68 2.78 2.43 2.87 2.68 2.99 2.35
Mendelssohn ICT 2.61 2.81 1.75 2.93 2.72 3.25 2.21
All elements are at level 2.
3 ITOThis part describes the ITO (ITO) at Mendelssohn.
3.1 Degree ITOIn the table below the degree ITO at Mendelssohn is displayed based on an scale 1 to 5, 1 being low
degree ITO and 5 high degree ITO.Degree ITO aspect Average Score Explanation
Technical management (5 sub elements) 1.25 Not/limited
End user management (5 sub elements) 1.2 Not/limited
Application management (4 sub elements) 1 Not
Functional management 1 Not
Size of ITO deal 1 <5% of IT budget
Degree ITO 1.09 Not / limited
3.2 ITO characteristicsITO(sub)characteristic Average Score Explanation
Scope of ITO organisational 2 Federated
Type ITO relationship 2 enhanced
Vendor construct 1 Single sourcing
Governance of ITO 3.45 Average/good
ITO experience (start) 4 4-6 years
ITO experience (length of deal) -
Number of people transferred 1 no people
Steering committee 2.31
Project management 2 Poor/average
Service Level Mngt 1 Technical
Quality transition of employees - n.a.
Quality user support during transition - n.a.
Quality customer obligation 3.17 Average
Quality supplier obligations 3.4 Average
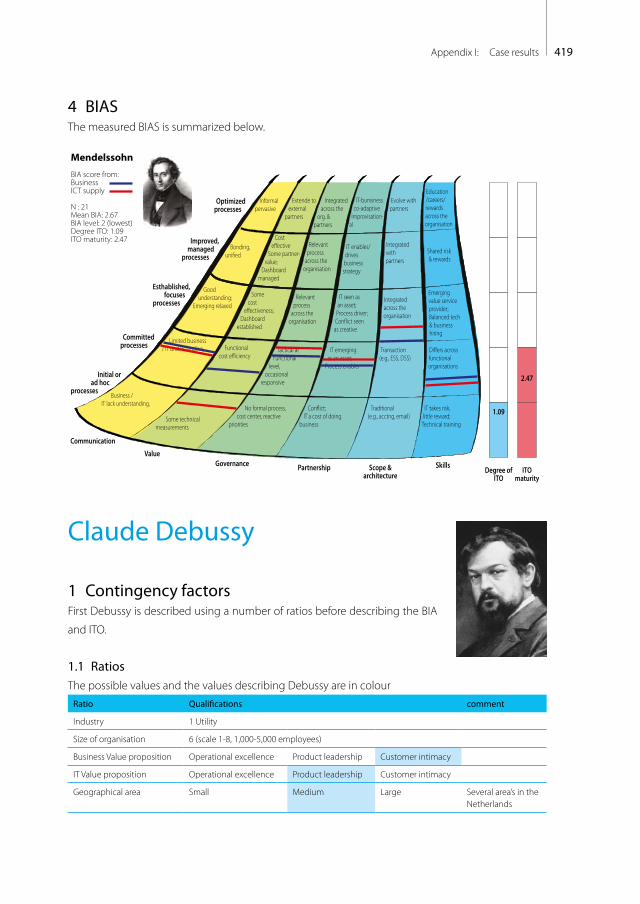
419Appendix I: Case results
4 BIASThe measured BIAS is summarized below.
Informalpervasive
Optimized processes
Improved, managed
processes
Esthablished,focuses
processes
Committedprocesses
Initial or ad hoc
processes
Bonding, uni�ed
Cost e�ective
Some partner-value;
Dashboard managed
Some cost
e�ectiveness; Dashboard
established
IT enables/drives business strategy
IT seen as an asset; Process driver;Con�ict seen as creative
Shared risk & rewards
Emerging value service provider;Balanced tech & business hiring
Relevant process
across the organisation
Relevant process
across the organisation
Good understanding;
Emerging relaxed
Limited business / IT understanding,
Business / IT lack understanding,
Functional cost e�ciency
Some technical measurements
No formal process,cost center, reactive
priorities
Con�ict; IT a cost of doing
business
Traditional (e.g., acctng, email)
IT takes risk, little reward;
Technical training
Tactical at Functional
level,occasional
responsive
IT emerging as an asset;
Process enabler
Transaction (e.g., ESS, DSS)
Di�ers across functional organisations
Integrated with partners
Integrated across the organisation
Extende to external
partners
Integrated across the
org. & partners
Evolve with partners
IT-bunisness co-adaptive
Improvisation-al
Education/careers/rewards across the organisation
Communication
ValueGovernance Partnership Scope &
architectureSkills
Mendelssohn
BIA score from:BusinessICT supply
N : 21Mean BIA: 2.67BIA level: 2 (lowest)Degree ITO: 1.09ITO maturity: 2.47
Degree ofITO
ITOmaturity
1.09
2.47
Claude Debussy
1 Contingency factorsFirst Debussy is described using a number of ratios before describing the BIA
and ITO.
1.1 RatiosThe possible values and the values describing Debussy are in colour
Ratio Qualifications comment
Industry 1 Utility
Size of organisation 6 (scale 1-8, 1,000-5,000 employees)
Business Value proposition Operational excellence Product leadership Customer intimacy
IT Value proposition Operational excellence Product leadership Customer intimacy
Geographical area Small Medium Large Several area’s in the Netherlands
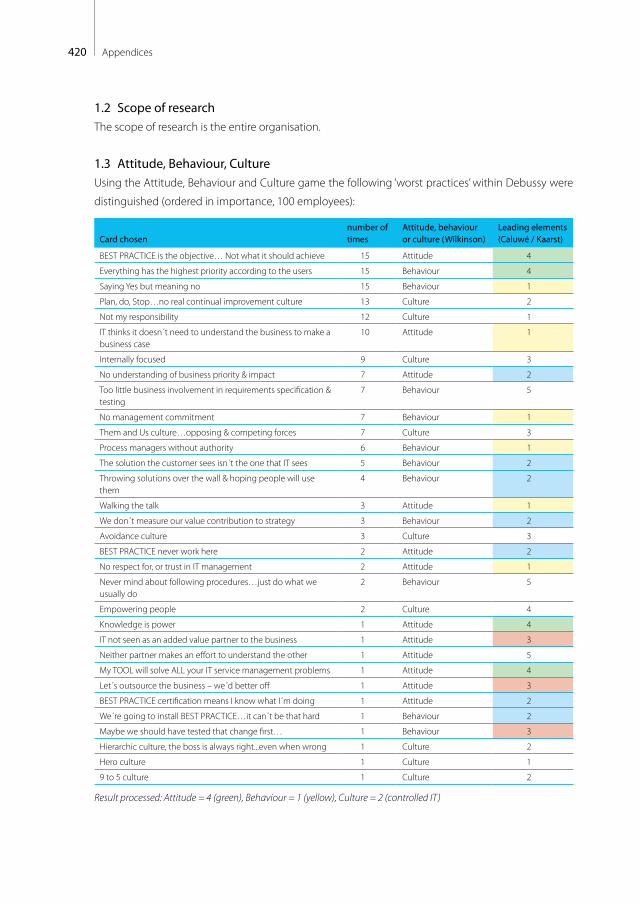
420 Appendices
1.2 Scope of researchThe scope of research is the entire organisation.
1.3 Attitude, Behaviour, CultureUsing the Attitude, Behaviour and Culture game the following ‘worst practices’ within Debussy were
distinguished (ordered in importance, 100 employees):
Card chosennumber of times
Attitude, behaviour or culture (Wilkinson)
Leading elements (Caluwé / Kaarst)
BEST PRACTICE is the objective… Not what it should achieve 15 Attitude 4
Everything has the highest priority according to the users 15 Behaviour 4
Saying Yes but meaning no 15 Behaviour 1
Plan, do, Stop…no real continual improvement culture 13 Culture 2
Not my responsibility 12 Culture 1
IT thinks it doesn´t need to understand the business to make a business case
10 Attitude 1
Internally focused 9 Culture 3
No understanding of business priority & impact 7 Attitude 2
Too little business involvement in requirements specification & testing
7 Behaviour 5
No management commitment 7 Behaviour 1
Them and Us culture…opposing & competing forces 7 Culture 3
Process managers without authority 6 Behaviour 1
The solution the customer sees isn´t the one that IT sees 5 Behaviour 2
Throwing solutions over the wall & hoping people will use them
4 Behaviour 2
Walking the talk 3 Attitude 1
We don´t measure our value contribution to strategy 3 Behaviour 2
Avoidance culture 3 Culture 3
BEST PRACTICE never work here 2 Attitude 2
No respect for, or trust in IT management 2 Attitude 1
Never mind about following procedures…just do what we usually do
2 Behaviour 5
Empowering people 2 Culture 4
Knowledge is power 1 Attitude 4
IT not seen as an added value partner to the business 1 Attitude 3
Neither partner makes an effort to understand the other 1 Attitude 5
My TOOL will solve ALL your IT service management problems 1 Attitude 4
Let´s outsource the business – we´d better off 1 Attitude 3
BEST PRACTICE certification means I know what I´m doing 1 Attitude 2
We´re going to install BEST PRACTICE…it can´t be that hard 1 Behaviour 2
Maybe we should have tested that change first… 1 Behaviour 3
Hierarchic culture, the boss is always right...even when wrong 1 Culture 2
Hero culture 1 Culture 1
9 to 5 culture 1 Culture 2
Result processed: Attitude = 4 (green), Behaviour = 1 (yellow), Culture = 2 (controlled IT)
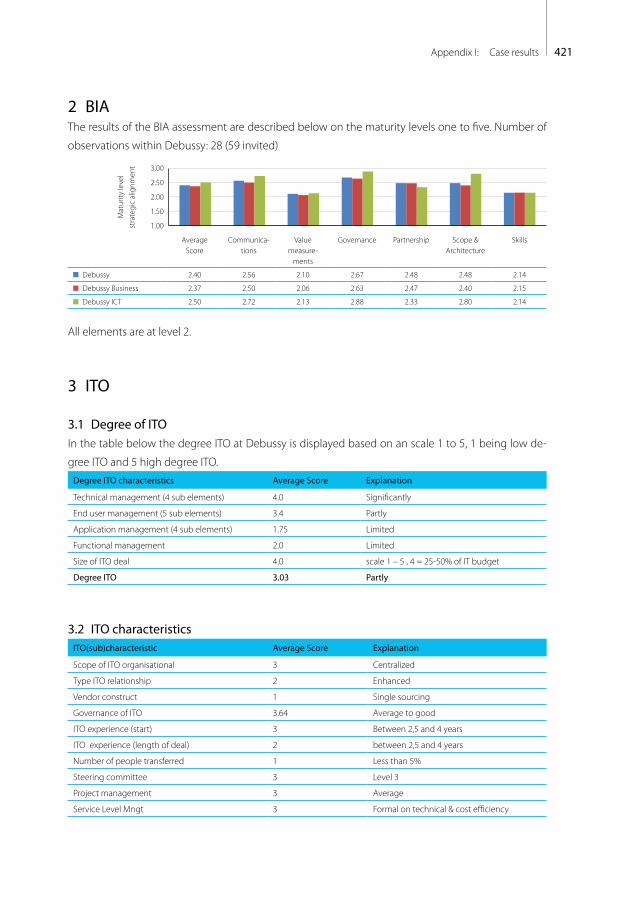
421Appendix I: Case results
2 BIAThe results of the BIA assessment are described below on the maturity levels one to five. Number of
observations within Debussy: 28 (59 invited)
Mat
urity
leve
lst
rate
gic
alig
nmen
t
1.00
1.50
2.00
2.50
3.00
Average Score
Communica-tions
Value measure-
ments
Governance Partnership Scope & Architecture
Skills
Debussy 2.40 2.56 2.10 2.67 2.48 2.48 2.14
Debussy Business 2.37 2.50 2.06 2.63 2.47 2.40 2.15
Debussy ICT 2.50 2.72 2.13 2.88 2.33 2.80 2.14
All elements are at level 2.
3 ITO
3.1 Degree of ITOIn the table below the degree ITO at Debussy is displayed based on an scale 1 to 5, 1 being low de-
gree ITO and 5 high degree ITO.Degree ITO characteristics Average Score Explanation
Technical management (4 sub elements) 4.0 Significantly
End user management (5 sub elements) 3.4 Partly
Application management (4 sub elements) 1.75 Limited
Functional management 2.0 Limited
Size of ITO deal 4.0 scale 1 – 5 , 4 = 25-50% of IT budget
Degree ITO 3.03 Partly
3.2 ITO characteristicsITO(sub)characteristic Average Score Explanation
Scope of ITO organisational 3 Centralized
Type ITO relationship 2 Enhanced
Vendor construct 1 Single sourcing
Governance of ITO 3.64 Average to good
ITO experience (start) 3 Between 2,5 and 4 years
ITO experience (length of deal) 2 between 2,5 and 4 years
Number of people transferred 1 Less than 5%
Steering committee 3 Level 3
Project management 3 Average
Service Level Mngt 3 Formal on technical & cost efficiency
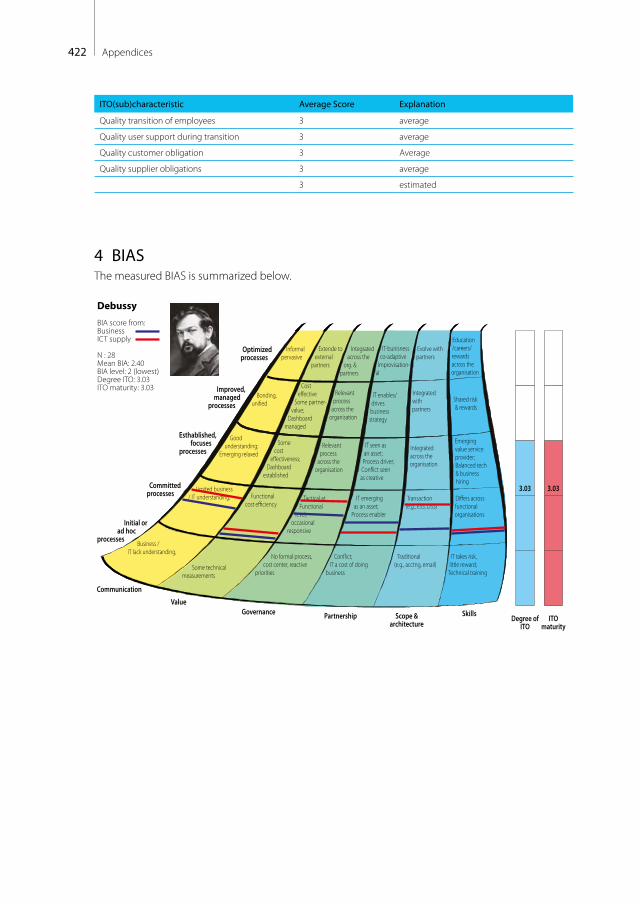
422 Appendices
ITO(sub)characteristic Average Score Explanation
Quality transition of employees 3 average
Quality user support during transition 3 average
Quality customer obligation 3 Average
Quality supplier obligations 3 average
3 estimated
4 BIASThe measured BIAS is summarized below.
Informalpervasive
Optimized processes
Improved, managed
processes
Esthablished,focuses
processes
Committedprocesses
Initial or ad hoc
processes
Bonding, uni�ed
Cost e�ective
Some partner-value;
Dashboard managed
Some cost
e�ectiveness; Dashboard
established
IT enables/drives business strategy
IT seen as an asset; Process driver;Con�ict seen as creative
Shared risk & rewards
Emerging value service provider;Balanced tech & business hiring
Relevant process
across the organisation
Relevant process
across the organisation
Good understanding;
Emerging relaxed
Limited business / IT understanding,
Business / IT lack understanding,
Functional cost e�ciency
Some technical measurements
No formal process,cost center, reactive
priorities
Con�ict; IT a cost of doing
business
Traditional (e.g., acctng, email)
IT takes risk, little reward;
Technical training
Tactical at Functional
level,occasional
responsive
IT emerging as an asset;
Process enabler
Transaction (e.g., ESS, DSS)
Di�ers across functional organisations
Integrated with partners
Integrated across the organisation
Extende to external
partners
Integrated across the
org. & partners
Evolve with partners
IT-bunisness co-adaptive
Improvisation-al
Education/careers/rewards across the organisation
Communication
ValueGovernance Partnership Scope &
architectureSkills
Debussy
BIA score from:BusinessICT supply
N : 28Mean BIA: 2.40BIA level: 2 (lowest)Degree ITO: 3.03ITO maturity: 3.03
Degree ofITO
ITOmaturity
3.03 3.03
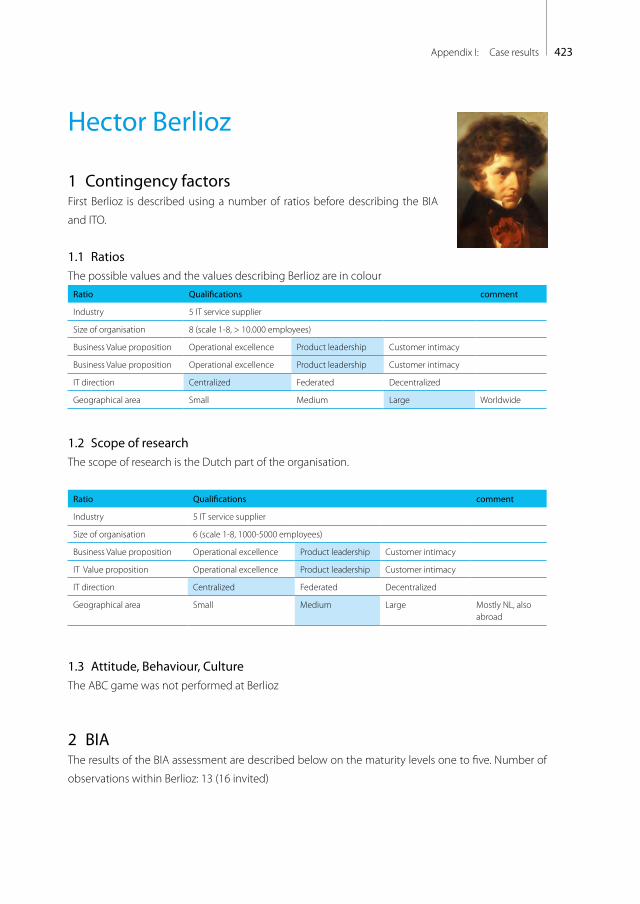
423Appendix I: Case results
Hector Berlioz
1 Contingency factorsFirst Berlioz is described using a number of ratios before describing the BIA
and ITO.
1.1 RatiosThe possible values and the values describing Berlioz are in colour
Ratio Qualifications comment
Industry 5 IT service supplier
Size of organisation 8 (scale 1-8, > 10.000 employees)
Business Value proposition Operational excellence Product leadership Customer intimacy
Business Value proposition Operational excellence Product leadership Customer intimacy
IT direction Centralized Federated Decentralized
Geographical area Small Medium Large Worldwide
1.2 Scope of researchThe scope of research is the Dutch part of the organisation.
Ratio Qualifications comment
Industry 5 IT service supplier
Size of organisation 6 (scale 1-8, 1000-5000 employees)
Business Value proposition Operational excellence Product leadership Customer intimacy
IT Value proposition Operational excellence Product leadership Customer intimacy
IT direction Centralized Federated Decentralized
Geographical area Small Medium Large Mostly NL, also abroad
1.3 Attitude, Behaviour, CultureThe ABC game was not performed at Berlioz
2 BIAThe results of the BIA assessment are described below on the maturity levels one to five. Number of
observations within Berlioz: 13 (16 invited)

424 Appendices
Mat
urity
leve
lst
rate
gic
alig
nmen
t
1.00
1.50
2.00
2.50
3.00
3.50
Average Score
Communica-tions
Value measure-
ments
Governance Partnership Scope & Architecture
Skills
Berlioz 2.60 2.64 2.32 2.96 2.54 2.82 2.31
Berlioz Business 2.49 2.50 2.31 2.83 2.38 2.50 2.45
Berlioz ICT 2.80 2.77 3.11 3.00 2.66 3.03 2.22
All elements are at level 2.
3 ITO
3.1 Degree of ITOIn the table below the degree ITO at Berlioz is displayed based on an scale 1 to 5, 1 being low degree
ITO and 5 high degree ITO.Degree ITO characteristic Average Score Explanation
Technical management (4 sub elements) 1.5 Not / limited
End user management (5 sub elements) 1.8 Not / limited
Application management (4 sub elements) 1.25 Not / limited
Functional management 1.2 Not / limited
Size of ITO deal 2.0 scale 1 – 5 , 2 = 5-10% of IT budget
Degree ITO 1.55 limited
3.2 ITO characteristicsITO(sub)characteristic Average Score Explanation
Scope of ITO organisational 2 federated
Type ITO relationship 1 transactional
Vendor construct 1 Single sourcing
Governance of ITO 3 Average
ITO experience (start) 4 Between 4 and 6 years
ITO experience (length of deal) 2 between 2,5 and 4 years
Number of people transferred - n.a.
Steering committee 2.75 Level 2
Project management 3 Average
Service Level Mngt 4 good
Quality transition of employees 3 average
Quality user support during transition 3 average
Quality customer obligation 3 Average
Quality supplier obligations 3 Average
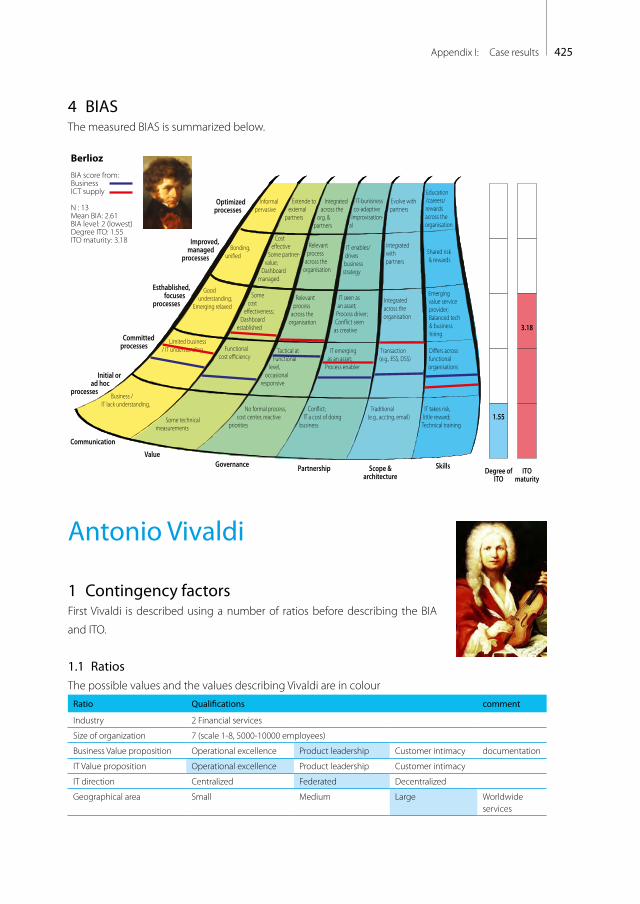
425Appendix I: Case results
4 BIASThe measured BIAS is summarized below.
Informalpervasive
Optimized processes
Improved, managed
processes
Esthablished,focuses
processes
Committedprocesses
Initial or ad hoc
processes
Bonding, uni�ed
Cost e�ective
Some partner-value;
Dashboard managed
Some cost
e�ectiveness; Dashboard
established
IT enables/drives business strategy
IT seen as an asset; Process driver;Con�ict seen as creative
Shared risk & rewards
Emerging value service provider;Balanced tech & business hiring
Relevant process
across the organisation
Relevant process
across the organisation
Good understanding;
Emerging relaxed
Limited business / IT understanding,
Business / IT lack understanding,
Functional cost e�ciency
Some technical measurements
No formal process,cost center, reactive
priorities
Con�ict; IT a cost of doing
business
Traditional (e.g., acctng, email)
IT takes risk, little reward;
Technical training
Tactical at Functional
level,occasional
responsive
IT emerging as an asset;
Process enabler
Transaction (e.g., ESS, DSS)
Di�ers across functional organisations
Integrated with partners
Integrated across the organisation
Extende to external
partners
Integrated across the
org. & partners
Evolve with partners
IT-bunisness co-adaptive
Improvisation-al
Education/careers/rewards across the organisation
Communication
ValueGovernance Partnership Scope &
architectureSkills
Berlioz
BIA score from:BusinessICT supply
N : 13Mean BIA: 2.61BIA level: 2 (lowest)Degree ITO: 1.55ITO maturity: 3.18
Degree ofITO
ITOmaturity
1.55
3.18
Antonio Vivaldi
1 Contingency factorsFirst Vivaldi is described using a number of ratios before describing the BIA
and ITO.
1.1 RatiosThe possible values and the values describing Vivaldi are in colour
Ratio Qualifications comment
Industry 2 Financial services
Size of organization 7 (scale 1-8, 5000-10000 employees)
Business Value proposition Operational excellence Product leadership Customer intimacy documentation
IT Value proposition Operational excellence Product leadership Customer intimacy
IT direction Centralized Federated Decentralized
Geographical area Small Medium Large Worldwide services
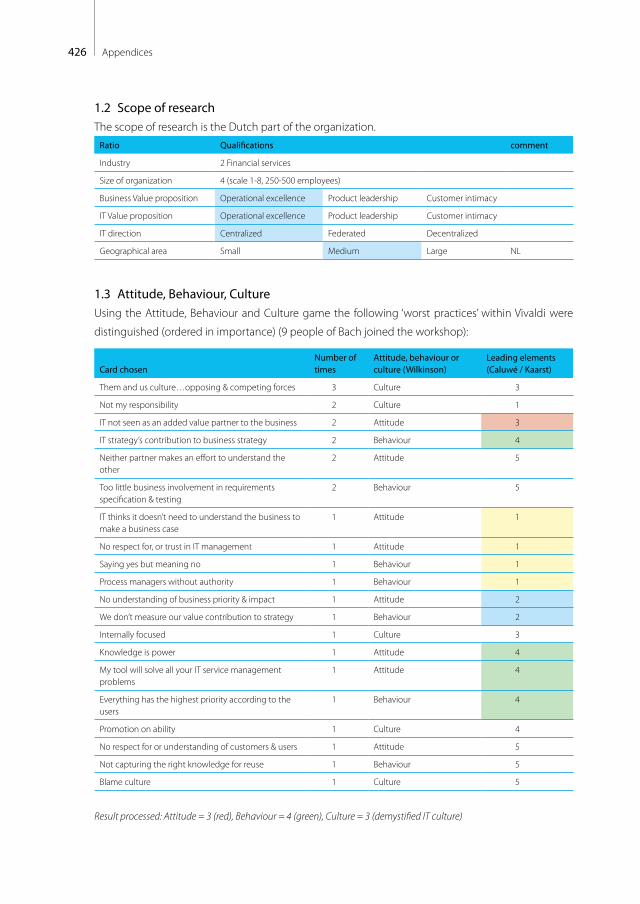
426 Appendices
1.2 Scope of researchThe scope of research is the Dutch part of the organization.
Ratio Qualifications comment
Industry 2 Financial services
Size of organization 4 (scale 1-8, 250-500 employees)
Business Value proposition Operational excellence Product leadership Customer intimacy
IT Value proposition Operational excellence Product leadership Customer intimacy
IT direction Centralized Federated Decentralized
Geographical area Small Medium Large NL
1.3 Attitude, Behaviour, CultureUsing the Attitude, Behaviour and Culture game the following ‘worst practices’ within Vivaldi were
distinguished (ordered in importance) (9 people of Bach joined the workshop):
Card chosenNumber of times
Attitude, behaviour or culture (Wilkinson)
Leading elements (Caluwé / Kaarst)
Them and us culture…opposing & competing forces 3 Culture 3
Not my responsibility 2 Culture 1
IT not seen as an added value partner to the business 2 Attitude 3
IT strategy’s contribution to business strategy 2 Behaviour 4
Neither partner makes an effort to understand the other
2 Attitude 5
Too little business involvement in requirements specification & testing
2 Behaviour 5
IT thinks it doesn’t need to understand the business to make a business case
1 Attitude 1
No respect for, or trust in IT management 1 Attitude 1
Saying yes but meaning no 1 Behaviour 1
Process managers without authority 1 Behaviour 1
No understanding of business priority & impact 1 Attitude 2
We don’t measure our value contribution to strategy 1 Behaviour 2
Internally focused 1 Culture 3
Knowledge is power 1 Attitude 4
My tool will solve all your IT service management problems
1 Attitude 4
Everything has the highest priority according to the users
1 Behaviour 4
Promotion on ability 1 Culture 4
No respect for or understanding of customers & users 1 Attitude 5
Not capturing the right knowledge for reuse 1 Behaviour 5
Blame culture 1 Culture 5
Result processed: Attitude = 3 (red), Behaviour = 4 (green), Culture = 3 (demystified IT culture)

427Appendix I: Case results
2 BIAThe results of the BIA assessment are described below on the maturity levels one to five. Number of
observations within Vivaldi: 44 (51 invited)
Mat
urity
leve
lst
rate
gic
alig
nmen
t
1.001.201.401.601.802.002.202.402.602.803.00
Average Score
Communica-tions
Value measure-
ments
Governance Partnership Scope & Architecture
Skills
Vivaldi 2.36 2.51 1.82 2.60 2.56 2.51 2.14
Vivaldi Business 2.27 2.47 1.61 2.41 2.60 2.50 2.01
Vivaldi ICT 2.46 2.56 2.07 2.78 2.56 2.56 2.22
All elements are at level 2.
3 ITO
3.1 Degree of ITOIn the table below the degree ITO at Vivaldi is displayed based on an scale 1 to 5, 1 being low degree
ITO and 5 high degree ITO.Degree ITO characteristic Score Explanation
Technical management (4 sub elements) 3.5 Significantly
End user management (5 sub elements) 1.6 Limited
Application management (4 sub elements) 2.5 Partly
Functional management 1.6 Limited
Size of ITO deal 4.0 scale 1 – 5 , 4 = 25-50% of IT budget
Degree ITO 2.64 Partly outsourced
3.2 ITO characteristicITO(sub)characteristic Score Explanation
Scope of ITO organisational 3 Centralized
Type ITO relationship 3 Customer specific
Vendor construct 3 Multi sourcing
Governance of ITO 1.64 poor
ITO experience (start) 4 Between 2,5 and 4 years
ITO experience (length of deal) 3 between 2,5 and 4 years
Number of people transferred 2 5-10%
Steering committee 2 Level 2
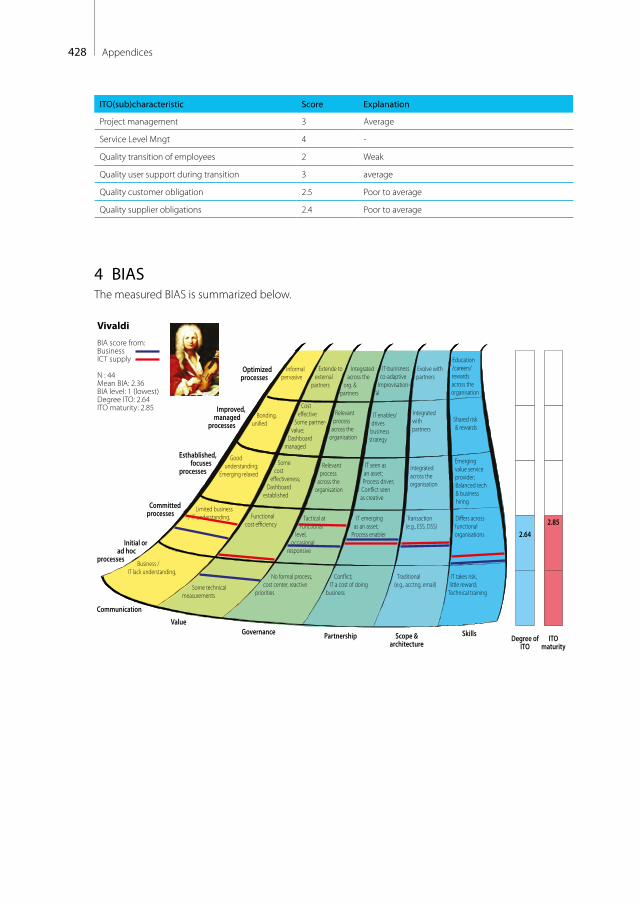
428 Appendices
ITO(sub)characteristic Score Explanation
Project management 3 Average
Service Level Mngt 4 -
Quality transition of employees 2 Weak
Quality user support during transition 3 average
Quality customer obligation 2.5 Poor to average
Quality supplier obligations 2.4 Poor to average
4 BIASThe measured BIAS is summarized below.
Informalpervasive
Optimized processes
Improved, managed
processes
Esthablished,focuses
processes
Committedprocesses
Initial or ad hoc
processes
Bonding, uni�ed
Cost e�ective
Some partner-value;
Dashboard managed
Some cost
e�ectiveness; Dashboard
established
IT enables/drives business strategy
IT seen as an asset; Process driver;Con�ict seen as creative
Shared risk & rewards
Emerging value service provider;Balanced tech & business hiring
Relevant process
across the organisation
Relevant process
across the organisation
Good understanding;
Emerging relaxed
Limited business / IT understanding,
Business / IT lack understanding,
Functional cost e�ciency
Some technical measurements
No formal process,cost center, reactive
priorities
Con�ict; IT a cost of doing
business
Traditional (e.g., acctng, email)
IT takes risk, little reward;
Technical training
Tactical at Functional
level,occasional
responsive
IT emerging as an asset;
Process enabler
Transaction (e.g., ESS, DSS)
Di�ers across functional organisations
Integrated with partners
Integrated across the organisation
Extende to external
partners
Integrated across the
org. & partners
Evolve with partners
IT-bunisness co-adaptive
Improvisation-al
Education/careers/rewards across the organisation
Communication
ValueGovernance Partnership Scope &
architectureSkills
Vivaldi
BIA score from:BusinessICT supply
N : 44Mean BIA: 2.36BIA level: 1 (lowest)Degree ITO: 2.64ITO maturity: 2.85
Degree ofITO
ITOmaturity
2.642.85
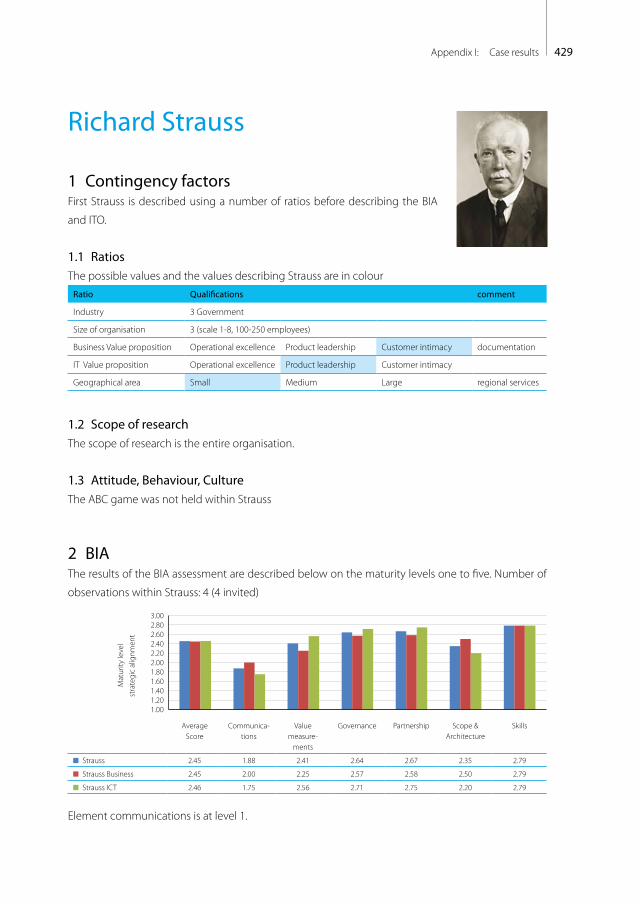
429Appendix I: Case results
Richard Strauss
1 Contingency factorsFirst Strauss is described using a number of ratios before describing the BIA
and ITO.
1.1 RatiosThe possible values and the values describing Strauss are in colour
Ratio Qualifications comment
Industry 3 Government
Size of organisation 3 (scale 1-8, 100-250 employees)
Business Value proposition Operational excellence Product leadership Customer intimacy documentation
IT Value proposition Operational excellence Product leadership Customer intimacy
Geographical area Small Medium Large regional services
1.2 Scope of researchThe scope of research is the entire organisation.
1.3 Attitude, Behaviour, CultureThe ABC game was not held within Strauss
2 BIAThe results of the BIA assessment are described below on the maturity levels one to five. Number of
observations within Strauss: 4 (4 invited)
Mat
urity
leve
lst
rate
gic
alig
nmen
t
1.001.201.401.601.802.002.202.402.602.803.00
Average Score
Communica-tions
Value measure-
ments
Governance Partnership Scope & Architecture
Skills
Strauss 2.45 1.88 2.41 2.64 2.67 2.35 2.79
Strauss Business 2.45 2.00 2.25 2.57 2.58 2.50 2.79
Strauss ICT 2.46 1.75 2.56 2.71 2.75 2.20 2.79
Element communications is at level 1.
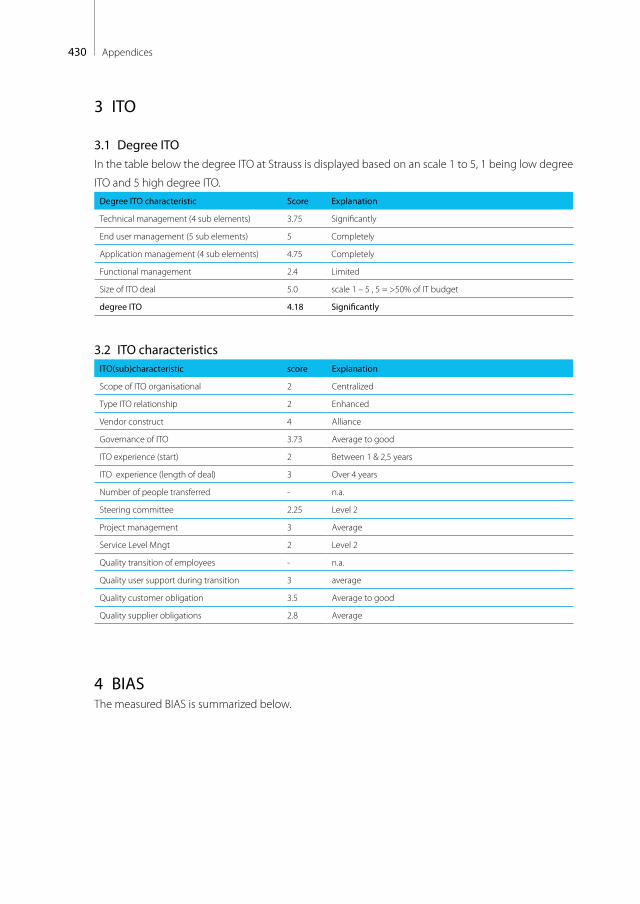
430 Appendices
3 ITO
3.1 Degree ITOIn the table below the degree ITO at Strauss is displayed based on an scale 1 to 5, 1 being low degree
ITO and 5 high degree ITO.Degree ITO characteristic Score Explanation
Technical management (4 sub elements) 3.75 Significantly
End user management (5 sub elements) 5 Completely
Application management (4 sub elements) 4.75 Completely
Functional management 2.4 Limited
Size of ITO deal 5.0 scale 1 – 5 , 5 = >50% of IT budget
degree ITO 4.18 Significantly
3.2 ITO characteristicsITO(sub)characteristic score Explanation
Scope of ITO organisational 2 Centralized
Type ITO relationship 2 Enhanced
Vendor construct 4 Alliance
Governance of ITO 3.73 Average to good
ITO experience (start) 2 Between 1 & 2,5 years
ITO experience (length of deal) 3 Over 4 years
Number of people transferred - n.a.
Steering committee 2.25 Level 2
Project management 3 Average
Service Level Mngt 2 Level 2
Quality transition of employees - n.a.
Quality user support during transition 3 average
Quality customer obligation 3.5 Average to good
Quality supplier obligations 2.8 Average
4 BIASThe measured BIAS is summarized below.
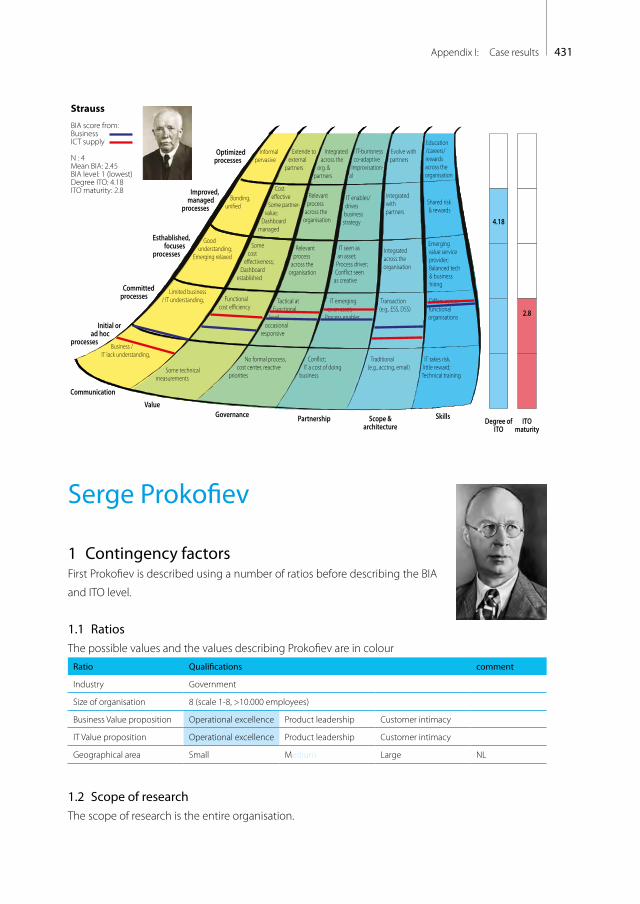
431Appendix I: Case results
Informalpervasive
Optimized processes
Improved, managed
processes
Esthablished,focuses
processes
Committedprocesses
Initial or ad hoc
processes
Bonding, uni�ed
Cost e�ective
Some partner-value;
Dashboard managed
Some cost
e�ectiveness; Dashboard
established
IT enables/drives business strategy
IT seen as an asset; Process driver;Con�ict seen as creative
Shared risk & rewards
Emerging value service provider;Balanced tech & business hiring
Relevant process
across the organisation
Relevant process
across the organisation
Good understanding;
Emerging relaxed
Limited business / IT understanding,
Business / IT lack understanding,
Functional cost e�ciency
Some technical measurements
No formal process,cost center, reactive
priorities
Con�ict; IT a cost of doing
business
Traditional (e.g., acctng, email)
IT takes risk, little reward;
Technical training
Tactical at Functional
level,occasional
responsive
IT emerging as an asset;
Process enabler
Transaction (e.g., ESS, DSS)
Di�ers across functional organisations
Integrated with partners
Integrated across the organisation
Extende to external
partners
Integrated across the
org. & partners
Evolve with partners
IT-bunisness co-adaptive
Improvisation-al
Education/careers/rewards across the organisation
Communication
ValueGovernance Partnership Scope &
architectureSkills
Strauss
BIA score from:BusinessICT supply
N : 4Mean BIA: 2.45BIA level: 1 (lowest)Degree ITO: 4.18ITO maturity: 2.8
Degree ofITO
ITOmaturity
4.18
2.8
Serge Prokofiev
1 Contingency factorsFirst Prokofiev is described using a number of ratios before describing the BIA
and ITO level.
1.1 RatiosThe possible values and the values describing Prokofiev are in colour
Ratio Qualifications comment
Industry Government
Size of organisation 8 (scale 1-8, >10.000 employees)
Business Value proposition Operational excellence Product leadership Customer intimacy
IT Value proposition Operational excellence Product leadership Customer intimacy
Geographical area Small Medium Large NL
1.2 Scope of researchThe scope of research is the entire organisation.

432 Appendices
1.3 Attitude, Behaviour, CultureUsing the Attitude, Behaviour and Culture game the following ‘worst practices’ within Prokofiev were
distinguished (ordered in importance, 9 employees):
Card chosenNumber of times
Attitude, behaviour or culture (Wilkinson)
Leading elements (Caluwé / Kaarst)
Them and us culture, opposing and competing forces 5 Culture 3
Saying YES, but meaning NO 4 Behaviour 1
The solution the customer sees isn’t the one that IT sees 4 Behaviour 2
Everything has the highest priority according to the users 3 Behaviour 4
Plan, do, Stop…no real continual improvement culture 3 Culture 2
Not my responsibility 3 Culture 1
Result processed: Attitude = - (no score), Behaviour = 1 (yellow), Culture = 3 (demystified IT culture)
2 BIAThe results of the BIA assessment are described below on the maturity levels one to five. Number of
observations within Prokofiev: 11 (13 invited)
Mat
urity
leve
lst
rate
gic
alig
nmen
t
1.001.201.401.601.802.002.202.402.602.80
Average Score
Communica-tions
Value measure-
ments
Governance Partnership Scope & Architecture
Skills
Prokofiev 2.20 2.32 2.13 2.57 1.94 2.26 2.00
Prokofiev Business 1.18 2.42 2.13 2.14 1.83 2.40 2.14
Prokofiev ICT 2.20 2.27 2.12 2.61 1.96 2.28 1.99
Element partnership is at level 1.
3 ITO
3.1 Degree of ITOIn the table below the degree ITO at Prokofiev is displayed based on an scale 1 to 5, 1 being low de-
gree ITO and 5 high degree ITO.ITO Score Explanation
Technical management (4 sub elements) 4.0 Significantly
End user management (5 sub elements) 4.4 Significantly
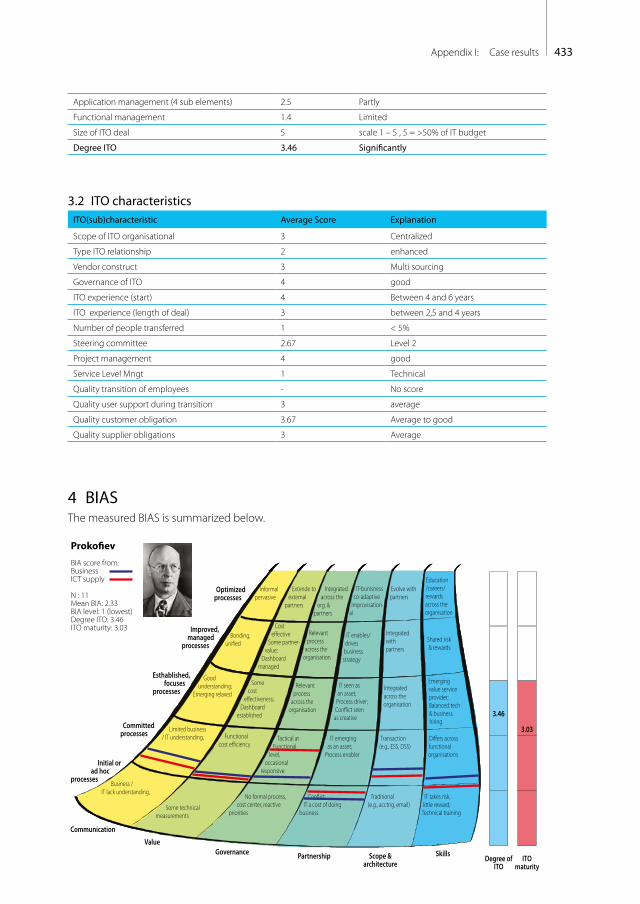
433Appendix I: Case results
Application management (4 sub elements) 2.5 Partly
Functional management 1.4 Limited
Size of ITO deal 5 scale 1 – 5 , 5 = >50% of IT budget
Degree ITO 3.46 Significantly
3.2 ITO characteristicsITO(sub)characteristic Average Score Explanation
Scope of ITO organisational 3 Centralized
Type ITO relationship 2 enhanced
Vendor construct 3 Multi sourcing
Governance of ITO 4 good
ITO experience (start) 4 Between 4 and 6 years
ITO experience (length of deal) 3 between 2,5 and 4 years
Number of people transferred 1 < 5%
Steering committee 2.67 Level 2
Project management 4 good
Service Level Mngt 1 Technical
Quality transition of employees - No score
Quality user support during transition 3 average
Quality customer obligation 3.67 Average to good
Quality supplier obligations 3 Average
4 BIASThe measured BIAS is summarized below.
Informalpervasive
Optimized processes
Improved, managed
processes
Esthablished,focuses
processes
Committedprocesses
Initial or ad hoc
processes
Bonding, uni�ed
Cost e�ective
Some partner-value;
Dashboard managed
Some cost
e�ectiveness; Dashboard
established
IT enables/drives business strategy
IT seen as an asset; Process driver;Con�ict seen as creative
Shared risk & rewards
Emerging value service provider;Balanced tech & business hiring
Relevant process
across the organisation
Relevant process
across the organisation
Good understanding;
Emerging relaxed
Limited business / IT understanding,
Business / IT lack understanding,
Functional cost e�ciency
Some technical measurements
No formal process,cost center, reactive
priorities
Con�ict; IT a cost of doing
business
Traditional (e.g., acctng, email)
IT takes risk, little reward;
Technical training
Tactical at Functional
level,occasional
responsive
IT emerging as an asset;
Process enabler
Transaction (e.g., ESS, DSS)
Di�ers across functional organisations
Integrated with partners
Integrated across the organisation
Extende to external
partners
Integrated across the
org. & partners
Evolve with partners
IT-bunisness co-adaptive
Improvisation-al
Education/careers/rewards across the organisation
Communication
ValueGovernance Partnership Scope &
architectureSkills
Proko�ev
BIA score from:BusinessICT supply
N : 11Mean BIA: 2.33BIA level: 1 (lowest)Degree ITO: 3.46ITO maturity: 3.03
Degree ofITO
ITOmaturity
3.46
3.03
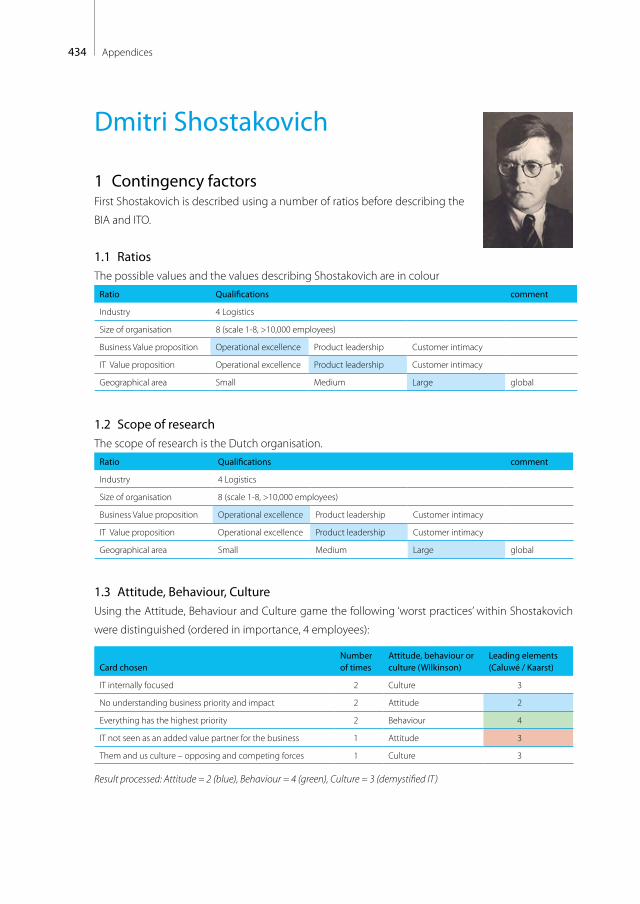
434 Appendices
Dmitri Shostakovich
1 Contingency factorsFirst Shostakovich is described using a number of ratios before describing the
BIA and ITO.
1.1 RatiosThe possible values and the values describing Shostakovich are in colour
Ratio Qualifications comment
Industry 4 Logistics
Size of organisation 8 (scale 1-8, >10,000 employees)
Business Value proposition Operational excellence Product leadership Customer intimacy
IT Value proposition Operational excellence Product leadership Customer intimacy
Geographical area Small Medium Large global
1.2 Scope of researchThe scope of research is the Dutch organisation.
Ratio Qualifications comment
Industry 4 Logistics
Size of organisation 8 (scale 1-8, >10,000 employees)
Business Value proposition Operational excellence Product leadership Customer intimacy
IT Value proposition Operational excellence Product leadership Customer intimacy
Geographical area Small Medium Large global
1.3 Attitude, Behaviour, CultureUsing the Attitude, Behaviour and Culture game the following ‘worst practices’ within Shostakovich
were distinguished (ordered in importance, 4 employees):
Card chosenNumber of times
Attitude, behaviour or culture (Wilkinson)
Leading elements (Caluwé / Kaarst)
IT internally focused 2 Culture 3
No understanding business priority and impact 2 Attitude 2
Everything has the highest priority 2 Behaviour 4
IT not seen as an added value partner for the business 1 Attitude 3
Them and us culture – opposing and competing forces 1 Culture 3
Result processed: Attitude = 2 (blue), Behaviour = 4 (green), Culture = 3 (demystified IT)
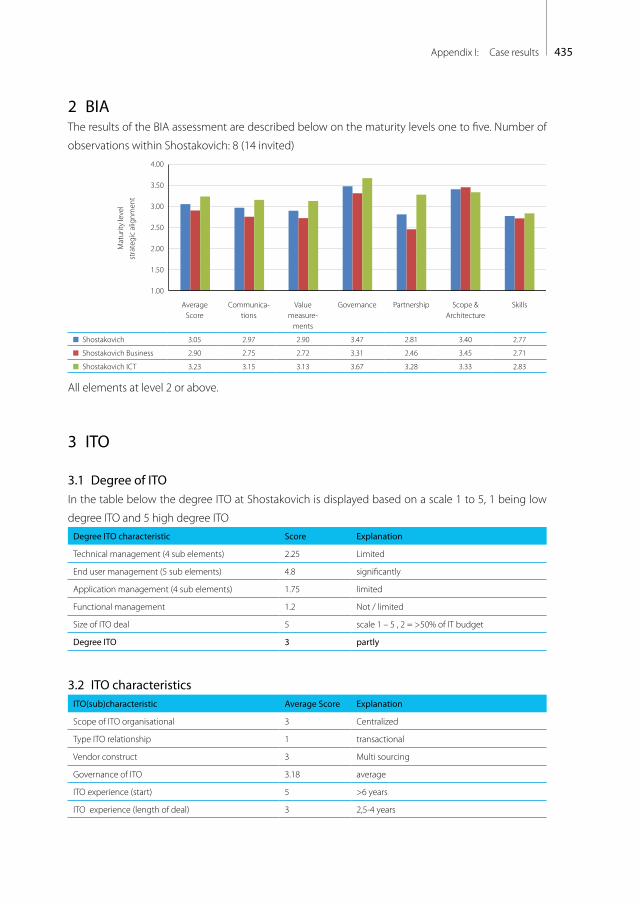
435Appendix I: Case results
2 BIAThe results of the BIA assessment are described below on the maturity levels one to five. Number of
observations within Shostakovich: 8 (14 invited)
Mat
urity
leve
lst
rate
gic
alig
nmen
t
1.00
1.50
2.00
2.50
3.00
3.50
4.00
Average Score
Communica-tions
Value measure-
ments
Governance Partnership Scope & Architecture
Skills
Shostakovich 3.05 2.97 2.90 3.47 2.81 3.40 2.77
Shostakovich Business 2.90 2.75 2.72 3.31 2.46 3.45 2.71
Shostakovich ICT 3.23 3.15 3.13 3.67 3.28 3.33 2.83
All elements at level 2 or above.
3 ITO
3.1 Degree of ITOIn the table below the degree ITO at Shostakovich is displayed based on a scale 1 to 5, 1 being low
degree ITO and 5 high degree ITODegree ITO characteristic Score Explanation
Technical management (4 sub elements) 2.25 Limited
End user management (5 sub elements) 4.8 significantly
Application management (4 sub elements) 1.75 limited
Functional management 1.2 Not / limited
Size of ITO deal 5 scale 1 – 5 , 2 = >50% of IT budget
Degree ITO 3 partly
3.2 ITO characteristicsITO(sub)characteristic Average Score Explanation
Scope of ITO organisational 3 Centralized
Type ITO relationship 1 transactional
Vendor construct 3 Multi sourcing
Governance of ITO 3.18 average
ITO experience (start) 5 >6 years
ITO experience (length of deal) 3 2,5-4 years

436 Appendices
ITO(sub)characteristic Average Score Explanation
Number of people transferred - 0
Steering committee 4.14 Level 4
Project management 3 Average
Service Level Mngt 1 Level 1
Quality transition of employees - No score
Quality user support during transition - No score
Quality customer obligation 4 good
Quality supplier obligations 4 good
4 BIASThe measured BIAS is summarized below.
Informalpervasive
Optimized processes
Improved, managed
processes
Esthablished,focuses
processes
Committedprocesses
Initial or ad hoc
processes
Bonding, uni�ed
Cost e�ective
Some partner-value;
Dashboard managed
Some cost
e�ectiveness; Dashboard
established
IT enables/drives business strategy
IT seen as an asset; Process driver;Con�ict seen as creative
Shared risk & rewards
Emerging value service provider;Balanced tech & business hiring
Relevant process
across the organisation
Relevant process
across the organisation
Good understanding;
Emerging relaxed
Limited business / IT understanding,
Business / IT lack understanding,
Functional cost e�ciency
Some technical measurements
No formal process,cost center, reactive
priorities
Con�ict; IT a cost of doing
business
Traditional (e.g., acctng, email)
IT takes risk, little reward;
Technical training
Tactical at Functional
level,occasional
responsive
IT emerging as an asset;
Process enabler
Transaction (e.g., ESS, DSS)
Di�ers across functional organisations
Integrated with partners
Integrated across the organisation
Extende to external
partners
Integrated across the
org. & partners
Evolve with partners
IT-bunisness co-adaptive
Improvisation-al
Education/careers/rewards across the organisation
Communication
ValueGovernance Partnership Scope &
architectureSkills
Shostakovich
BIA score from:BusinessICT supply
N : 8Mean BIA: 3.05BIA level: 2 (lowest)Degree ITO: 3.0ITO maturity: 3.35
Degree ofITO
ITOmaturity
3.03.35
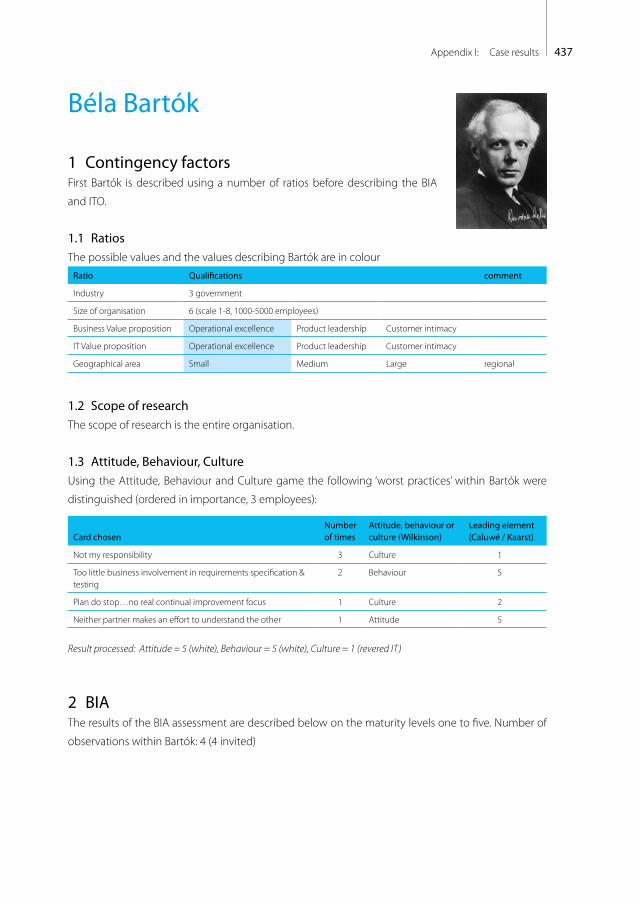
437Appendix I: Case results
Béla Bartók
1 Contingency factorsFirst Bartók is described using a number of ratios before describing the BIA
and ITO.
1.1 RatiosThe possible values and the values describing Bartók are in colour
Ratio Qualifications comment
Industry 3 government
Size of organisation 6 (scale 1-8, 1000-5000 employees)
Business Value proposition Operational excellence Product leadership Customer intimacy
IT Value proposition Operational excellence Product leadership Customer intimacy
Geographical area Small Medium Large regional
1.2 Scope of researchThe scope of research is the entire organisation.
1.3 Attitude, Behaviour, CultureUsing the Attitude, Behaviour and Culture game the following ‘worst practices’ within Bartók were
distinguished (ordered in importance, 3 employees):
Card chosenNumber of times
Attitude, behaviour or culture (Wilkinson)
Leading element (Caluwé / Kaarst)
Not my responsibility 3 Culture 1
Too little business involvement in requirements specification & testing
2 Behaviour 5
Plan do stop…no real continual improvement focus 1 Culture 2
Neither partner makes an effort to understand the other 1 Attitude 5
Result processed: Attitude = 5 (white), Behaviour = 5 (white), Culture = 1 (revered IT)
2 BIAThe results of the BIA assessment are described below on the maturity levels one to five. Number of
observations within Bartók: 4 (4 invited)
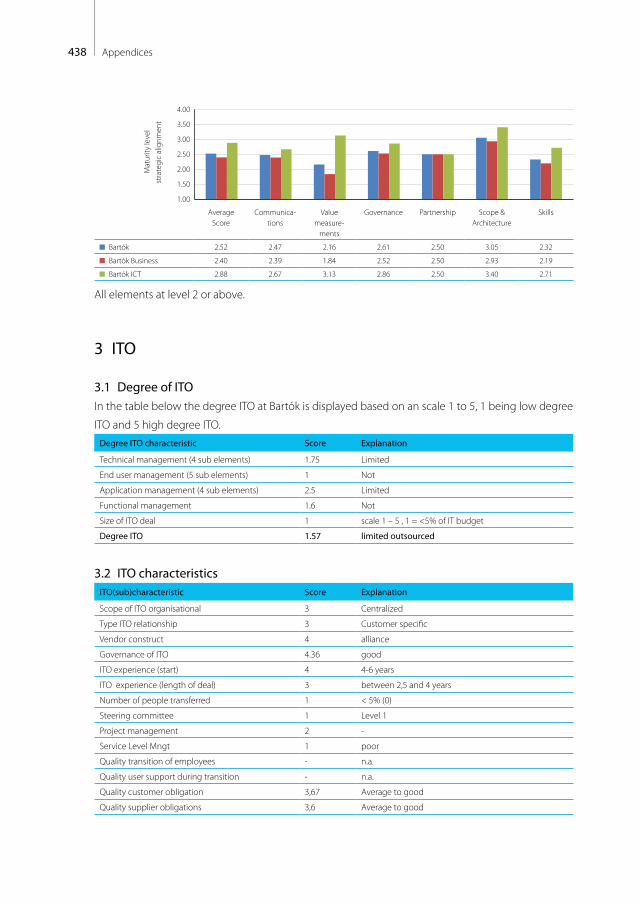
438 Appendices
Mat
urity
leve
lst
rate
gic
alig
nmen
t
1.00
1.50
2.00
2.50
3.00
3.50
4.00
Average Score
Communica-tions
Value measure-
ments
Governance Partnership Scope & Architecture
Skills
Bartók 2.52 2.47 2.16 2.61 2.50 3.05 2.32
Bartók Business 2.40 2.39 1.84 2.52 2.50 2.93 2.19
Bartók ICT 2.88 2.67 3.13 2.86 2.50 3.40 2.71
All elements at level 2 or above.
3 ITO
3.1 Degree of ITOIn the table below the degree ITO at Bartók is displayed based on an scale 1 to 5, 1 being low degree
ITO and 5 high degree ITO.Degree ITO characteristic Score Explanation
Technical management (4 sub elements) 1.75 Limited
End user management (5 sub elements) 1 Not
Application management (4 sub elements) 2.5 Limited
Functional management 1.6 Not
Size of ITO deal 1 scale 1 – 5 , 1 = <5% of IT budget
Degree ITO 1.57 limited outsourced
3.2 ITO characteristicsITO(sub)characteristic Score Explanation
Scope of ITO organisational 3 Centralized
Type ITO relationship 3 Customer specific
Vendor construct 4 alliance
Governance of ITO 4.36 good
ITO experience (start) 4 4-6 years
ITO experience (length of deal) 3 between 2,5 and 4 years
Number of people transferred 1 < 5% (0)
Steering committee 1 Level 1
Project management 2 -
Service Level Mngt 1 poor
Quality transition of employees - n.a.
Quality user support during transition - n.a.
Quality customer obligation 3,67 Average to good
Quality supplier obligations 3,6 Average to good

439Appendix I: Case results
4 BIASThe measured BIAS is summarized below.
Informalpervasive
Optimized processes
Improved, managed
processes
Esthablished,focuses
processes
Committedprocesses
Initial or ad hoc
processes
Bonding, uni�ed
Cost e�ective
Some partner-value;
Dashboard managed
Some cost
e�ectiveness; Dashboard
established
IT enables/drives business strategy
IT seen as an asset; Process driver;Con�ict seen as creative
Shared risk & rewards
Emerging value service provider;Balanced tech & business hiring
Relevant process
across the organisation
Relevant process
across the organisation
Good understanding;
Emerging relaxed
Limited business / IT understanding,
Business / IT lack understanding,
Functional cost e�ciency
Some technical measurements
No formal process,cost center, reactive
priorities
Con�ict; IT a cost of doing
business
Traditional (e.g., acctng, email)
IT takes risk, little reward;
Technical training
Tactical at Functional
level,occasional
responsive
IT emerging as an asset;
Process enabler
Transaction (e.g., ESS, DSS)
Di�ers across functional organisations
Integrated with partners
Integrated across the organisation
Extende to external
partners
Integrated across the
org. & partners
Evolve with partners
IT-bunisness co-adaptive
Improvisation-al
Education/careers/rewards across the organisation
Communication
ValueGovernance Partnership Scope &
architectureSkills
Bartók
BIA score from:BusinessICT supply
N : 4Mean BIA: 2.52BIA level: 1 (lowest)Degree ITO: 1.57ITO maturity: 2.62
Degree ofITO
ITOmaturity
1.57
2.62
Anton Bruckner
1 Contingency factorsFirst Bruckner is described using a number of ratios before describing the stra-
tegic BIA and ITO level.
1.1 RatiosThe possible values and the values describing Bruckner are in colour
Ratio Qualifications comment
Industry 1 manufacturing (utility)
Size of organisation 6 (scale 1-8, 1000-5000 employees)
Business Value proposition Operational excellence Product leadership Customer intimacy
IT Value proposition Operational excellence Product leadership Customer intimacy
Geographical area Small Medium Large Regional / parts
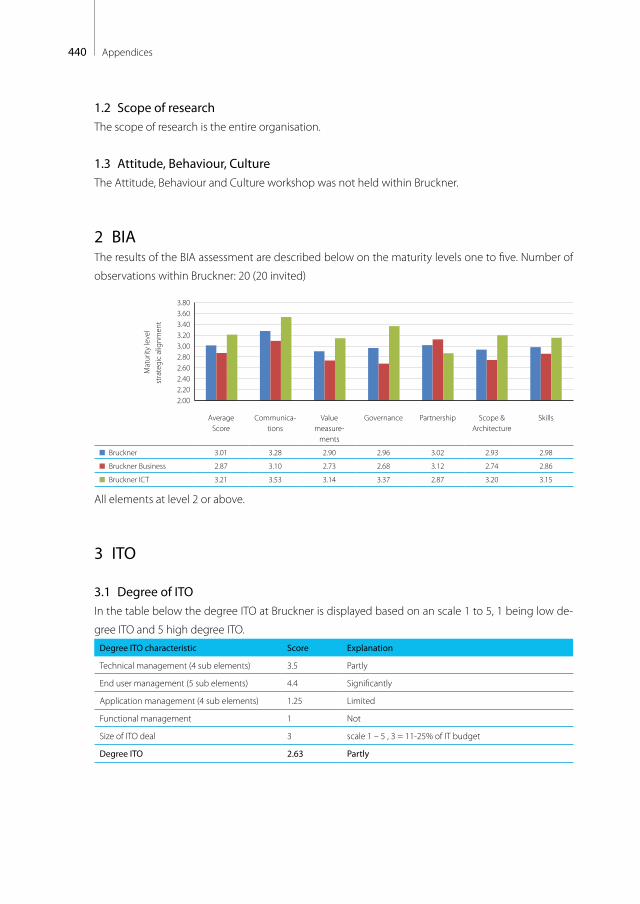
440 Appendices
1.2 Scope of researchThe scope of research is the entire organisation.
1.3 Attitude, Behaviour, CultureThe Attitude, Behaviour and Culture workshop was not held within Bruckner.
2 BIAThe results of the BIA assessment are described below on the maturity levels one to five. Number of
observations within Bruckner: 20 (20 invited)
Mat
urity
leve
lst
rate
gic
alig
nmen
t
2.002.202.402.602.803.003.203.403.603.80
Average Score
Communica-tions
Value measure-
ments
Governance Partnership Scope & Architecture
Skills
Bruckner 3.01 3.28 2.90 2.96 3.02 2.93 2.98
Bruckner Business 2.87 3.10 2.73 2.68 3.12 2.74 2.86
Bruckner ICT 3.21 3.53 3.14 3.37 2.87 3.20 3.15
All elements at level 2 or above.
3 ITO
3.1 Degree of ITOIn the table below the degree ITO at Bruckner is displayed based on an scale 1 to 5, 1 being low de-
gree ITO and 5 high degree ITO.Degree ITO characteristic Score Explanation
Technical management (4 sub elements) 3.5 Partly
End user management (5 sub elements) 4.4 Significantly
Application management (4 sub elements) 1.25 Limited
Functional management 1 Not
Size of ITO deal 3 scale 1 – 5 , 3 = 11-25% of IT budget
Degree ITO 2.63 Partly
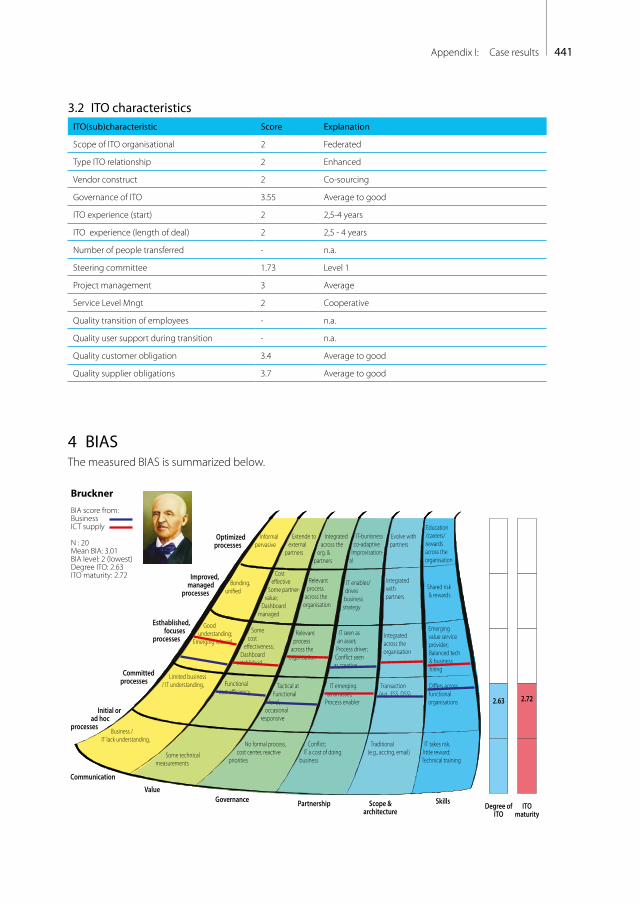
441Appendix I: Case results
3.2 ITO characteristicsITO(sub)characteristic Score Explanation
Scope of ITO organisational 2 Federated
Type ITO relationship 2 Enhanced
Vendor construct 2 Co-sourcing
Governance of ITO 3.55 Average to good
ITO experience (start) 2 2,5-4 years
ITO experience (length of deal) 2 2,5 - 4 years
Number of people transferred - n.a.
Steering committee 1.73 Level 1
Project management 3 Average
Service Level Mngt 2 Cooperative
Quality transition of employees - n.a.
Quality user support during transition - n.a.
Quality customer obligation 3.4 Average to good
Quality supplier obligations 3.7 Average to good
4 BIASThe measured BIAS is summarized below.
Informalpervasive
Optimized processes
Improved, managed
processes
Esthablished,focuses
processes
Committedprocesses
Initial or ad hoc
processes
Bonding, uni�ed
Cost e�ective
Some partner-value;
Dashboard managed
Some cost
e�ectiveness; Dashboard
established
IT enables/drives business strategy
IT seen as an asset; Process driver;Con�ict seen as creative
Shared risk & rewards
Emerging value service provider;Balanced tech & business hiring
Relevant process
across the organisation
Relevant process
across the organisation
Good understanding;
Emerging relaxed
Limited business / IT understanding,
Business / IT lack understanding,
Functional cost e�ciency
Some technical measurements
No formal process,cost center, reactive
priorities
Con�ict; IT a cost of doing
business
Traditional (e.g., acctng, email)
IT takes risk, little reward;
Technical training
Tactical at Functional
level,occasional
responsive
IT emerging as an asset;
Process enabler
Transaction (e.g., ESS, DSS)
Di�ers across functional organisations
Integrated with partners
Integrated across the organisation
Extende to external
partners
Integrated across the
org. & partners
Evolve with partners
IT-bunisness co-adaptive
Improvisation-al
Education/careers/rewards across the organisation
Communication
ValueGovernance Partnership Scope &
architectureSkills
Bruckner
BIA score from:BusinessICT supply
N : 20Mean BIA: 3.01BIA level: 2 (lowest)Degree ITO: 2.63ITO maturity: 2.72
Degree ofITO
ITOmaturity
2.63 2.72
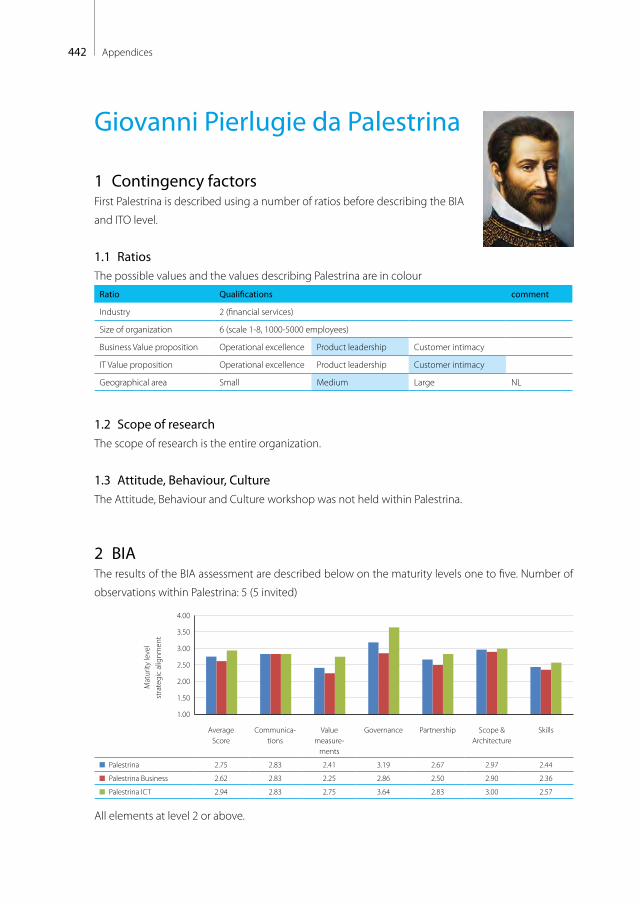
442 Appendices
Giovanni Pierlugie da Palestrina
1 Contingency factorsFirst Palestrina is described using a number of ratios before describing the BIA
and ITO level.
1.1 RatiosThe possible values and the values describing Palestrina are in colour
Ratio Qualifications comment
Industry 2 (financial services)
Size of organization 6 (scale 1-8, 1000-5000 employees)
Business Value proposition Operational excellence Product leadership Customer intimacy
IT Value proposition Operational excellence Product leadership Customer intimacy
Geographical area Small Medium Large NL
1.2 Scope of researchThe scope of research is the entire organization.
1.3 Attitude, Behaviour, CultureThe Attitude, Behaviour and Culture workshop was not held within Palestrina.
2 BIAThe results of the BIA assessment are described below on the maturity levels one to five. Number of
observations within Palestrina: 5 (5 invited)
Mat
urity
leve
lst
rate
gic
alig
nmen
t
1.00
1.50
2.00
2.50
3.00
3.50
4.00
Average Score
Communica-tions
Value measure-
ments
Governance Partnership Scope & Architecture
Skills
Palestrina 2.75 2.83 2.41 3.19 2.67 2.97 2.44
Palestrina Business 2.62 2.83 2.25 2.86 2.50 2.90 2.36
Palestrina ICT 2.94 2.83 2.75 3.64 2.83 3.00 2.57
All elements at level 2 or above.

443Appendix I: Case results
3 ITO
3.1 Degree of ITOIn the table below the degree ITO at Palestrina is displayed based on an scale 1 to 5, 1 being low de-
gree ITO and 5 high degree ITO.Degree ITO characteristic Score Explanation
Technical management (4 sub elements) 1.75 Limited
End user management (5 sub elements) 1 Not
Application management (4 sub elements) 2.25 Limited
Functional management 1 Not
Size of ITO deal 3 scale 1 – 5 , 3 = 11-25% of IT budget
Degree ITO 1.8 limited
3.2 ITO characteristicITO(sub)characteristic Score Explanation
Scope of ITO organisational 3 Centralized
Type ITO relationship 3 Customer
Vendor construct 3 Multi-sourcing
Governance of ITO 3.64 Average to good
ITO experience (start) 4 4-6 years
ITO experience (length of deal) 2 2,5 - 4 years
Number of people transferred 2 5-10%.
Steering committee 3.4 Level 3
Project management 3 Average
Service Level Mngt 3 Technical & cost
Quality transition of employees 3 Average
Quality user support during transition 2 poor
Quality customer obligation 3.17 Average to good
Quality supplier obligations 2.25 Poor to average
4 BIASThe measured BIAS is summarized below.
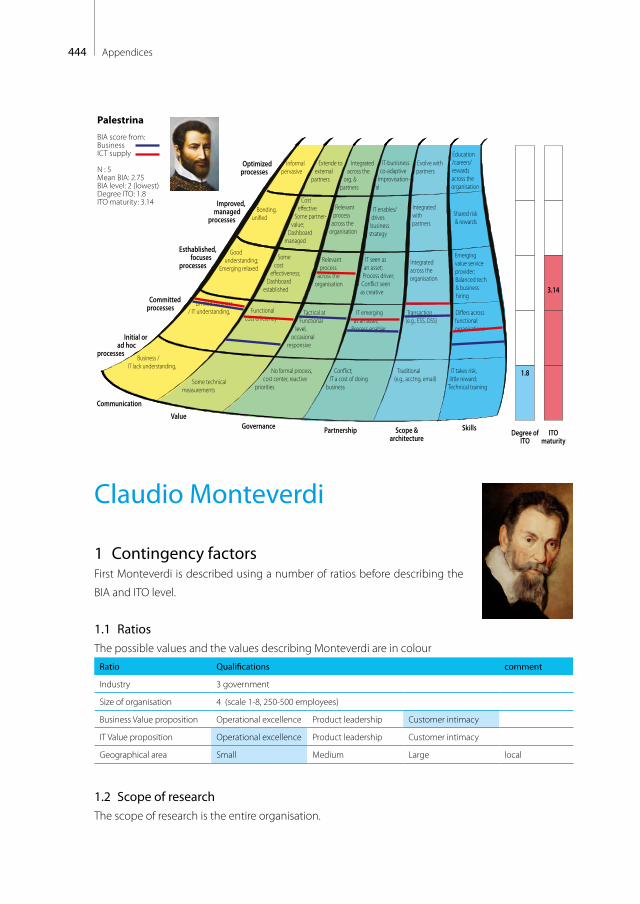
444 Appendices
Informalpervasive
Optimized processes
Improved, managed
processes
Esthablished,focuses
processes
Committedprocesses
Initial or ad hoc
processes
Bonding, uni�ed
Cost e�ective
Some partner-value;
Dashboard managed
Some cost
e�ectiveness; Dashboard
established
IT enables/drives business strategy
IT seen as an asset; Process driver;Con�ict seen as creative
Shared risk & rewards
Emerging value service provider;Balanced tech & business hiring
Relevant process
across the organisation
Relevant process
across the organisation
Good understanding;
Emerging relaxed
Limited business / IT understanding,
Business / IT lack understanding,
Functional cost e�ciency
Some technical measurements
No formal process,cost center, reactive
priorities
Con�ict; IT a cost of doing
business
Traditional (e.g., acctng, email)
IT takes risk, little reward;
Technical training
Tactical at Functional
level,occasional
responsive
IT emerging as an asset;
Process enabler
Transaction (e.g., ESS, DSS)
Di�ers across functional organisations
Integrated with partners
Integrated across the organisation
Extende to external
partners
Integrated across the
org. & partners
Evolve with partners
IT-bunisness co-adaptive
Improvisation-al
Education/careers/rewards across the organisation
Communication
ValueGovernance Partnership Scope &
architectureSkills
Palestrina
BIA score from:BusinessICT supply
N : 5Mean BIA: 2.75BIA level: 2 (lowest)Degree ITO: 1.8ITO maturity: 3.14
Degree ofITO
ITOmaturity
1.8
3.14
Claudio Monteverdi
1 Contingency factorsFirst Monteverdi is described using a number of ratios before describing the
BIA and ITO level.
1.1 RatiosThe possible values and the values describing Monteverdi are in colour
Ratio Qualifications comment
Industry 3 government
Size of organisation 4 (scale 1-8, 250-500 employees)
Business Value proposition Operational excellence Product leadership Customer intimacy
IT Value proposition Operational excellence Product leadership Customer intimacy
Geographical area Small Medium Large local
1.2 Scope of researchThe scope of research is the entire organisation.
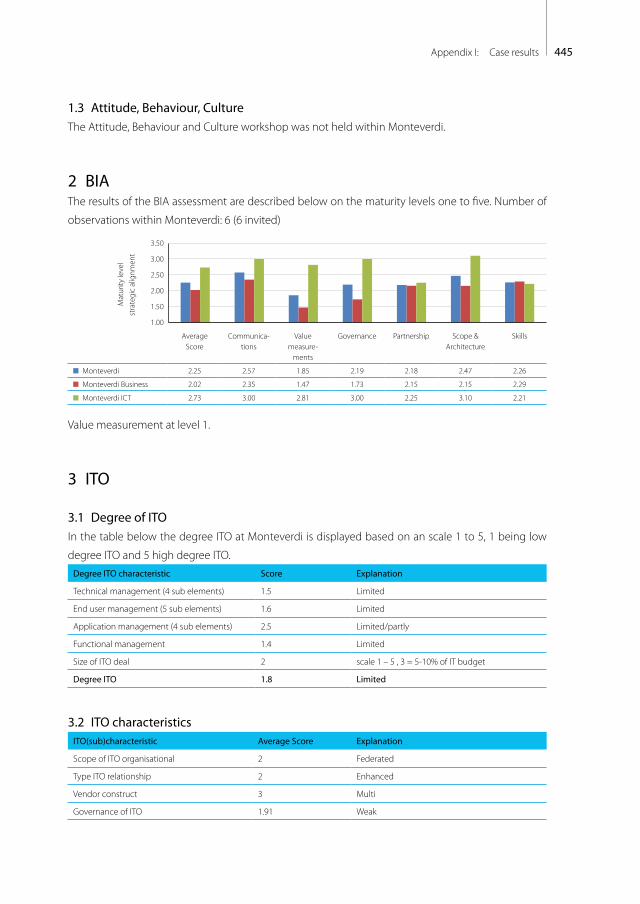
445Appendix I: Case results
1.3 Attitude, Behaviour, CultureThe Attitude, Behaviour and Culture workshop was not held within Monteverdi.
2 BIAThe results of the BIA assessment are described below on the maturity levels one to five. Number of
observations within Monteverdi: 6 (6 invited)
Mat
urity
leve
lst
rate
gic
alig
nmen
t
1.00
1.50
2.00
2.50
3.00
3.50
Average Score
Communica-tions
Value measure-
ments
Governance Partnership Scope & Architecture
Skills
Monteverdi 2.25 2.57 1.85 2.19 2.18 2.47 2.26
Monteverdi Business 2.02 2.35 1.47 1.73 2.15 2.15 2.29
Monteverdi ICT 2.73 3.00 2.81 3.00 2.25 3.10 2.21
Value measurement at level 1.
3 ITO
3.1 Degree of ITOIn the table below the degree ITO at Monteverdi is displayed based on an scale 1 to 5, 1 being low
degree ITO and 5 high degree ITO.Degree ITO characteristic Score Explanation
Technical management (4 sub elements) 1.5 Limited
End user management (5 sub elements) 1.6 Limited
Application management (4 sub elements) 2.5 Limited/partly
Functional management 1.4 Limited
Size of ITO deal 2 scale 1 – 5 , 3 = 5-10% of IT budget
Degree ITO 1.8 Limited
3.2 ITO characteristicsITO(sub)characteristic Average Score Explanation
Scope of ITO organisational 2 Federated
Type ITO relationship 2 Enhanced
Vendor construct 3 Multi
Governance of ITO 1.91 Weak

446 Appendices
ITO(sub)characteristic Average Score Explanation
ITO experience (start) 2 1-2,5 year
ITO experience (length of deal) - n.a.
Number of people transferred - n.a.
Steering committee 2 Level 2
Project management 2 Weak
Service Level Mngt 1 poor
Quality transition of employees - n.a.
Quality user support during transition - n.a.
Quality customer obligation 2.17 Poor to average
Quality supplier obligations 2.4 Poor to average
4 BIASThe measured BIAS is summarized below.
Informalpervasive
Optimized processes
Improved, managed
processes
Esthablished,focuses
processes
Committedprocesses
Initial or ad hoc
processes
Bonding, uni�ed
Cost e�ective
Some partner-value;
Dashboard managed
Some cost
e�ectiveness; Dashboard
established
IT enables/drives business strategy
IT seen as an asset; Process driver;Con�ict seen as creative
Shared risk & rewards
Emerging value service provider;Balanced tech & business hiring
Relevant process
across the organisation
Relevant process
across the organisation
Good understanding;
Emerging relaxed
Limited business / IT understanding,
Business / IT lack understanding,
Functional cost e�ciency
Some technical measurements
No formal process,cost center, reactive
priorities
Con�ict; IT a cost of doing
business
Traditional (e.g., acctng, email)
IT takes risk, little reward;
Technical training
Tactical at Functional
level,occasional
responsive
IT emerging as an asset;
Process enabler
Transaction (e.g., ESS, DSS)
Di�ers across functional organisations
Integrated with partners
Integrated across the organisation
Extende to external
partners
Integrated across the
org. & partners
Evolve with partners
IT-bunisness co-adaptive
Improvisation-al
Education/careers/rewards across the organisation
Communication
ValueGovernance Partnership Scope &
architectureSkills
Monteverdi
BIA score from:BusinessICT supply
N : 6Mean BIA: 2.25BIA level: 1 (lowest)Degree ITO: 1.8ITO maturity: 1.8
Degree ofITO
ITOmaturity
1.8 1.8
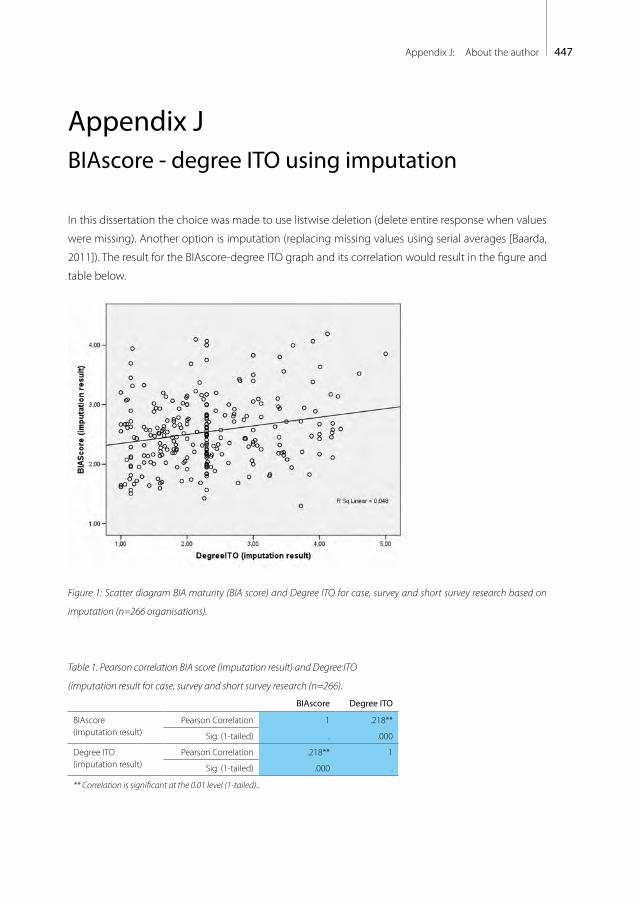
447Appendix J: About the author
Appendix JBIAscore - degree ITO using imputation
In this dissertation the choice was made to use listwise deletion (delete entire response when values
were missing). Another option is imputation (replacing missing values using serial averages [Baarda,
2011]). The result for the BIAscore-degree ITO graph and its correlation would result in the figure and
table below.
Figure 1: Scatter diagram BIA maturity (BIA score) and Degree ITO for case, survey and short survey research based on
imputation (n=266 organisations).
Table 1. Pearson correlation BIA score (imputation result) and Degree ITO
(imputation result for case, survey and short survey research (n=266).
BIAscore Degree ITO
BIAscore(imputation result)
Pearson Correlation 1 .218**
Sig. (1-tailed) . .000
Degree ITO(imputation result)
Pearson Correlation .218** 1
Sig. (1-tailed) .000 .
** Correlation is significant at the 0.01 level (1-tailed)..
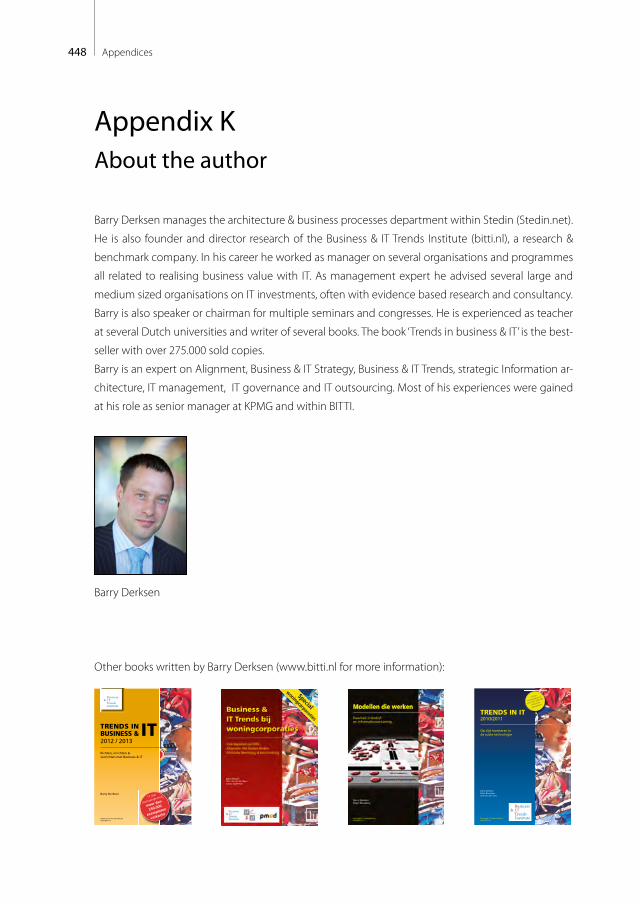
448 Appendices
Appendix KAbout the author
Barry Derksen manages the architecture & business processes department within Stedin (Stedin.net).
He is also founder and director research of the Business & IT Trends Institute (bitti.nl), a research &
benchmark company. In his career he worked as manager on several organisations and programmes
all related to realising business value with IT. As management expert he advised several large and
medium sized organisations on IT investments, often with evidence based research and consultancy.
Barry is also speaker or chairman for multiple seminars and congresses. He is experienced as teacher
at several Dutch universities and writer of several books. The book ‘Trends in business & IT’ is the best-
seller with over 275.000 sold copies.
Barry is an expert on Alignment, Business & IT Strategy, Business & IT Trends, strategic Information ar-
chitecture, IT management, IT governance and IT outsourcing. Most of his experiences were gained
at his role as senior manager at KPMG and within BITTI.
Barry Derksen
Other books written by Barry Derksen (www.bitti.nl for more information):
17 jaar
toonaangevend,
meer dan
250.000
exemplaren
verkochtBusiness & IT Trends Institutewww.BITTI.nl
Barry Derksen MSc MMC CISA CGEIT RIBarry is werkzaam als directeur van het Business & IT Trends Institute, een organisatie die tot doel heeft om voor haar klanten Nederlands meest betekenisvolle benchmark, assessment, audit en adviesbureau te zijn op business & IT vraagstukken. Dit boek is net als andere publicaties hiervan een uiting. Hij is een veel gevraagd spreker op congressen en seminars en verzorgt tevens de Business & IT alignment masterclasses bij bita-center.
Drs. Peter Noordam RI Peter is directeur advies bij Bisnez Management, een middelgroot bureau dat zich richt op advisering en projectmanagement op het raakvlak van organisatie en ICT. Daarnaast doceert Peter onder andere aan de Erasmus Universiteit en UvA voor de postdoctorale IT auditing.
ing. Aart van der Vlist MMC RE is CIO ING Nationale Nederlanden. Hij heeft IT, EDP Auditing en Management gestudeerd aan de Erasmus Universiteit en Vrije Universi-teit. Hij is vijf jaar partner geweest bij KPMG voordat hij overstapte naar een managementfunctie bij ING.
Enkele andere boeken van Barry Derksen (zie www.bitti.nl voor meer informatie):
Barry Derksen
Peter Noordam
Aart van der Vlist
Beste Lezer,Na 17 jaar Trends in IT is het moment daar om ook verder te kijken, vandaar dit boek en nog velen die volgen onder de noemer ‘Trends in…’. De 3 auteurs hebben al die jaren met veel plezier geschreven en zullen u nog regelmatig verrassen, dus let op bitti.nl en onze LinkedIn, Twitter en andere berichten!
2012/2013
Richten, inrichten & verrichten met Business & IT
Na de wereldwijde � nanciële crisis volgde een korte opleving tot in de zomervakan-tie van 2011. Genoten vele beleggers van de eerder gemaakte winst, was deze aan het eind van de vakantie weg en bleven velen achter met een verlies van 30%. Al snel kwam de discussie over het ingrijpen van de politiek en snel gevolgd door het beschouwen van de credit rating agency’s als junkstatus bedrijven (door Amerikaanse politici). 2012 en 2013 zijn de jaren waarin de Europese Unie zichzelf moet bewij-zen…vooral voor de � nanciële markten.
Als we dit doortrekken naar IT- ontwikkelingen zien we vaak dezelfde bewegingen. Vandaag de dag heeft iedereen het ineens over Cloud computing en over de Apps voor de tablets en Smart Phones. Daar hadden we tot voor kort nog nooit over ge-hoord. En naast de vernieuwing van HTML (5) wordt het tijd dat u uw regie� ow van uw Cloud based SOA omgeving op orde krijgt (BPM/BRE) om te voldoen aan de com-pliance vereisten en dat bij voorkeur wel gekoppeld aan de Social Media front of� ce in uw organisatie.
Sommige trends zijn hypes. Anderen zijn blijvertjes. Sommige trends zijn makkelijk te implementeren. Andere trends impliceren fundamentele en grootschalige veranderin-gen van uw bedrijfsvoering.
Dit boek is al zeventien jaar een gids voor managers die zichzelf een beeld willen vor-men over de zin en onzin van business & IT ontwikkelingen. De kern van dit jaarlijks bijgewerkte boek is de ondertitel: ‘Richten, inrichten en verrichten met Business & IT’. In dit boek geven wij diverse praktische handvatten om uw bedrijfsvoering & ICT te richten (roze katern), in te richten (blauwe katern) en te verrichten met Trends in IT (de yellow pages van IT) om er voor te zorgen dat uw bedrijf wendbaar blijft ten op-zichte van bewegelijke IT- ontwikkelingen.
Het roze katern helpt u te richten door wereldwijde ontwikkelingen in een context te plaatsen. Het tweede, blauwe deel biedt praktische handvatten voor de praktijk en het derde gele deel biedt u een actueel overzicht van Trends. In de diverse hoofdstuk-ken leest u de visies en meningen van een serie toonaangevende professionals uit het bedrijfsleven en van universiteiten.
Veel leesplezier en succes bij het richten, inrichten en verrich-ten van een goede Business & IT combinatie!
Barry Derksen
Business & IT Trends Institute
Derksen
ww
w.B
ITTI.nl
TREN
DS IN
BU
SIN
ESS &
IT 2012/2
013
TRENDS IN BUSINESS & IT 2012 / 2013
Richten, inrichten & verrichten met Business & IT
Barry Derksen
Laser Proof
15 jaar
toonaangevend,
meer dan 200.000
verkochte
exemplaren
Business & IT Trends Institutewww.BITTI.nl
Barry Derksen Peter Noordam Aart van der Vlist
Barry Derksen MSc MMC CISA CGEIT RI is directeur van het Business & IT Trends Institute dat zich richt op onderzoek, benchmarking, assessment, auditing & advies op business & IT vraagstukken.Daarvoor was hij senior manager bij KPMG Information & Risk Management. Hij heeft zich gespecialiseerd op de inrichting van de informatie-voorzieningsfunctie, IT governance & strategie, (maturity) benchmarking en Business & IT alignment. Hij is docent bij de Vrije Universiteit te Amsterdam, Hogeschool Leiden en diverse andere postdoc opleidingen op het gebied van IT auditing, IT en bedrijfskunde en is actief in meerdere onderzoek- & beroepscommissies op het snijvlak van business- en IT-ontwikkelingen.
Drs. P.G. (Peter) Noordam RI is Directeur advies bij Bisnez Management, een middelgroot bureau dat zich richt op Advisering en Projectmanagement op het raakvlak van Organisatie en ICT.Hij richt zich in zijn advisering op het raakvlak tussen organisatie en automa-tisering met onderwerpen als Governance, Business Performance Improve-ment, Business en ICT alignment en Process Management. Hij heeft daarnaast verschillende grote ICT projecten gemanaged, onder andere op het gebied van SAP en Datawarehousing. Hij is auteur van onder andere: “Handen en Voeten a/d Administratieve Organisatie”, “Organisatie-inrichting en optimali-sering”, “Operational Excellence”, “Kosten baten en risico’s van IT investerin-gen” en “Project risicomanagement”.
Hij doceert aan de Erasmus Universiteit voor de postdoctorale opleiding Operational Auditing en IT Auditing. Tevens doceert hij aan de UvA voor de postdoctorale opleiding IT auditing en verzorgt hij colleges en leergangen voor het NIVRA. Hij is regelmatig spreker op congressen en conferenties over nieuwe ICT ontwikkelingen en de impact hiervan op organisaties.
ing. Aart van der Vlist MMC RE is directeur ApplicatieManagement bij ING Nationale Nederlanden en verantwoordelijk voor de continuiteit en beheer. Hij heeft IT, EDP Auditing en Management gestudeerd aan de Erasmus Universiteit en Vrije Universiteit. Hij is vijf jaar partner geweest bij KPMG voordat hij overstapte naar een managementfunctie bij ING.
Business & IT Trends Institute
Het Business & IT Trends Institute (www.BITTI.nl) onderzoekt al 15 jaar ontwikkelingen op het snijvlak van business & IT. Hierdoor is een schat van kennis en ervaring opgebouwd op de gebieden trends, benchmarks, advisering, projecten, training en publicaties. Het BITTI is een groeiend netwerk van professionals uit meerdere disciplines en bedrijven.
Het BITTI publiceert zijn bevindingen en ervaringen onder meer in dit boek Trends in IT. Het BITTI stelt zich tot doel nieuwe business-, technologische, innovatieve concepten, buzzwords, trends en hypes nuchter en eenvoudig toegankelijk te maken. Enerzijds is dat het doorprikken van techno- en businessluchtbellen, anderzijds is dat een oprechte poging om de mogelijkheden en waardecreatie van vernieuwing in kaart en uitgenut te krijgen.
De belangrijkste activiteiten van BITTI zijn Business & IT onderzoeken, -assessments en innovatiescans.
Bent u geïnteresseerd of wilt u in contact komen met BITTI bel of mail: Business & IT Trends Institute Barry Derksen, tel. 06-52078861, Peter Noordam, tel. 06-51291638 of [email protected]
TRENDS IN IT 2010/2011
Op tijd investeren in de juiste technologie
In een paar weken tijd gingen eind 2008 en doorzettend in 2009 wereldwijd de beurzen onderuit. Dachten we eerst dat er een geïsoleerd probleem in Noord Amerika was met de huizenprijzen, dat sloeg ineens door naar een wereldwijde � nanciële crisis.
Als we dit doortrekken naar IT-ontwikkelingen zien vaak dezelfde bewegingen. Vandaag de dag heeft iedereen het ineens over PaaS (platform as a service ofwel cloud computing) en Enterprise MashUps. Daar hadden we een half jaar geleden eigenlijk nog nooit over gehoord. En naast de vernieuwing van Web2.0 wordt het tijd dat u uw regie� ow van uw SOA-omgeving op orde krijgt (BPM/BRE).
Sommige trends zijn hypes. Andere zijn blijvertjes. Sommige trends zijn makkelijk te implementeren. Andere trends impliceren fundamentele grootschalige veranderingen van uw bedrijfsvoering.
Dit boek is al vijftien jaar een gids voor managers die zich zelf een beeld willen vormen over de zin en onzin van technologische ontwikkelingen. De kern van dit jaarlijks bijgewerkte boek is de ondertitel ´Op tijd investeren in de juiste technologie’.
In dit boek worden praktische handvaten aangereikt om de ontwikkelingen in uw bedrijfstempo te volgen (de IT trends-antenne) om er voor te zorgen dat uw bedrijf wendbaar blijft ten opzichte van bewegelijke IT-ontwikkelingen.
Het gele deel in het midden van dit boek is een overzicht van allerlei IT-trends die op dit moment actueel zijn. In de hoofdstukken daarvoor wordt u een context gegeven van wereldwijde ontwikkelingen en bedrijfsprocessen. De hoofdstukken achterin het boek geven praktische handvaten voor de praktijk. In het laatste hoofdstuk leest u de visies en meningen van een serie toonaangevende professionals uit het bedrijfsleven en van universiteiten.
Veel leesplezier!
Peter, Barry, Aart
Business & IT Trends InstituteBoekdrukkunst uitgeverij
Derksen
/ No
ord
am / van
der V
list w
ww
.BITTI.n
lTR
EN
DS IN
IT 20
10
/20
11
TRENDS IN IT 2010/2011
Op tijd investeren in de juiste technologie
Barry DerksenPeter NoordamAart van der Vlist
028.000.008 Cover Boek Trends in IT 2010-2011.indd 1 7-10-2011 13:31:09
Informatie BeveiligingRisico management
BenchmarkingICT tevredenheidProfessionaliteitprocesoptimalisatieICT � nanciën
Business & IT alignmentIT governance / -strategieEnterprise Architecture
InvesteringsbeslissingenBusinesscasesConsolidatie / out- & cloudsourcingKwaliteitsmanagement
Business & IT Trends InstituteHet Business & IT Trends Institute (kortweg BIT-TI) heeft tot doel Nederlands meest betekenis-volle benchmark, assessment, audit en advies organisatie te zijn. Wij leveren business & IT gerelateerde inzichten noodzakelijk voor onze klanten om effectieve en ef� ciënte besluiten te nemen. Dit doen wij met experts op vakge-bieden als bedrijfsprocessen, bedrijfsvoering, IT, � nancieel en governance (sturing & beheersing). BITTI levert deze kennis en kunde in de vorm van klantopdrachten, onderzoeken, (in-house) trai-ningen, benchmarks & audits. De BITTI adviseurs, diverse publicaties, lopende onderzoeken en onze producten/diensten vindt u terug op www.bitti.nl.
Enkele voorbeelden van onze dienstverlening (meer informatie op www.bitti.nl) zijn:
Bent u geïnteresseerd of wilt u in contact komen met BITTI bel of mail:
Business & IT Trends Institute,
+31(0)71-8795174
Barry Derksen, +31(0)6-52078861
BITTInl
028.000.012 Cover Boek Trends in IT 2012-2013.indd 1 7-10-2011 13:36:33
Laser Proof
15 jaar
toonaangevend,
meer dan 200.000
verkochte
exemplaren
Business & IT Trends Institutewww.BITTI.nl
Barry Derksen Peter Noordam Aart van der Vlist
Barry Derksen MSc MMC CISA CGEIT RI is directeur van het Business & IT Trends Institute dat zich richt op onderzoek, benchmarking, assessment, auditing & advies op business & IT vraagstukken.Daarvoor was hij senior manager bij KPMG Information & Risk Management. Hij heeft zich gespecialiseerd op de inrichting van de informatie-voorzieningsfunctie, IT governance & strategie, (maturity) benchmarking en Business & IT alignment. Hij is docent bij de Vrije Universiteit te Amsterdam, Hogeschool Leiden en diverse andere postdoc opleidingen op het gebied van IT auditing, IT en bedrijfskunde en is actief in meerdere onderzoek- & beroepscommissies op het snijvlak van business- en IT-ontwikkelingen.
Drs. P.G. (Peter) Noordam RI is Directeur advies bij Bisnez Management, een middelgroot bureau dat zich richt op Advisering en Projectmanagement op het raakvlak van Organisatie en ICT.Hij richt zich in zijn advisering op het raakvlak tussen organisatie en automa-tisering met onderwerpen als Governance, Business Performance Improve-ment, Business en ICT alignment en Process Management. Hij heeft daarnaast verschillende grote ICT projecten gemanaged, onder andere op het gebied van SAP en Datawarehousing. Hij is auteur van onder andere: “Handen en Voeten a/d Administratieve Organisatie”, “Organisatie-inrichting en optimali-sering”, “Operational Excellence”, “Kosten baten en risico’s van IT investerin-gen” en “Project risicomanagement”.
Hij doceert aan de Erasmus Universiteit voor de postdoctorale opleiding Operational Auditing en IT Auditing. Tevens doceert hij aan de UvA voor de postdoctorale opleiding IT auditing en verzorgt hij colleges en leergangen voor het NIVRA. Hij is regelmatig spreker op congressen en conferenties over nieuwe ICT ontwikkelingen en de impact hiervan op organisaties.
ing. Aart van der Vlist MMC RE is directeur ApplicatieManagement bij ING Nationale Nederlanden en verantwoordelijk voor de continuiteit en beheer. Hij heeft IT, EDP Auditing en Management gestudeerd aan de Erasmus Universiteit en Vrije Universiteit. Hij is vijf jaar partner geweest bij KPMG voordat hij overstapte naar een managementfunctie bij ING.
Business & IT Trends Institute
Het Business & IT Trends Institute (www.BITTI.nl) onderzoekt al 15 jaar ontwikkelingen op het snijvlak van business & IT. Hierdoor is een schat van kennis en ervaring opgebouwd op de gebieden trends, benchmarks, advisering, projecten, training en publicaties. Het BITTI is een groeiend netwerk van professionals uit meerdere disciplines en bedrijven.
Het BITTI publiceert zijn bevindingen en ervaringen onder meer in dit boek Trends in IT. Het BITTI stelt zich tot doel nieuwe business-, technologische, innovatieve concepten, buzzwords, trends en hypes nuchter en eenvoudig toegankelijk te maken. Enerzijds is dat het doorprikken van techno- en businessluchtbellen, anderzijds is dat een oprechte poging om de mogelijkheden en waardecreatie van vernieuwing in kaart en uitgenut te krijgen.
De belangrijkste activiteiten van BITTI zijn Business & IT onderzoeken, -assessments en innovatiescans.
Bent u geïnteresseerd of wilt u in contact komen met BITTI bel of mail: Business & IT Trends Institute Barry Derksen, tel. 06-52078861, Peter Noordam, tel. 06-51291638 of [email protected]
TRENDS IN IT 2010/2011
Op tijd investeren in de juiste technologie
In een paar weken tijd gingen eind 2008 en doorzettend in 2009 wereldwijd de beurzen onderuit. Dachten we eerst dat er een geïsoleerd probleem in Noord Amerika was met de huizenprijzen, dat sloeg ineens door naar een wereldwijde � nanciële crisis.
Als we dit doortrekken naar IT-ontwikkelingen zien vaak dezelfde bewegingen. Vandaag de dag heeft iedereen het ineens over PaaS (platform as a service ofwel cloud computing) en Enterprise MashUps. Daar hadden we een half jaar geleden eigenlijk nog nooit over gehoord. En naast de vernieuwing van Web2.0 wordt het tijd dat u uw regie� ow van uw SOA-omgeving op orde krijgt (BPM/BRE).
Sommige trends zijn hypes. Andere zijn blijvertjes. Sommige trends zijn makkelijk te implementeren. Andere trends impliceren fundamentele grootschalige veranderingen van uw bedrijfsvoering.
Dit boek is al vijftien jaar een gids voor managers die zich zelf een beeld willen vormen over de zin en onzin van technologische ontwikkelingen. De kern van dit jaarlijks bijgewerkte boek is de ondertitel ´Op tijd investeren in de juiste technologie’.
In dit boek worden praktische handvaten aangereikt om de ontwikkelingen in uw bedrijfstempo te volgen (de IT trends-antenne) om er voor te zorgen dat uw bedrijf wendbaar blijft ten opzichte van bewegelijke IT-ontwikkelingen.
Het gele deel in het midden van dit boek is een overzicht van allerlei IT-trends die op dit moment actueel zijn. In de hoofdstukken daarvoor wordt u een context gegeven van wereldwijde ontwikkelingen en bedrijfsprocessen. De hoofdstukken achterin het boek geven praktische handvaten voor de praktijk. In het laatste hoofdstuk leest u de visies en meningen van een serie toonaangevende professionals uit het bedrijfsleven en van universiteiten.
Veel leesplezier!
Peter, Barry, Aart
Business & IT Trends InstituteBoekdrukkunst uitgeverij
Derksen
/ No
ord
am / van
der V
list w
ww
.BITTI.n
lTR
EN
DS IN
IT 20
10
/20
11
TRENDS IN IT 2010/2011
Op tijd investeren in de juiste technologie
Barry DerksenPeter NoordamAart van der Vlist
028.000.008 Cover Boek Trends in IT 2010-2011.indd 1 7-10-2011 13:31:09

Impact of IT Outsourcing on Business & IT Alignment
Business & IT alignment (BIA) has been an area of interest in both industry and academic research for over 35
years. It received signi� cant attention from the strategic alignment model article published by Henderson &
Venkatraman in 1992. BIA is about the integration of IT for the business. All businesses focus on opportuni-
ties to grow, constantly aiming to obtain predetermined targets using strategies such as customer intimacy,
operational excellence or best product. It is the expectation that the IT organisation enables and drives this
growth, recognizing that the IT organisation must contend with their own challenges. The development
and implementation of their respective strategies often lead to discrepancies. The result is a gap between
business & IT. BIA is about closing that gap. The assumption is that doing nothing means creating a chasm.
BIA is consistently reported as a key concern of business & IT management as one of the top 3 concerns in
the last decade.
Today, IT outsourcing (ITO), especially with the advent of cloud computing, are key also among the top IT
management concerns. ITO has grown in the past two decades. Organisations decide to outsource due
to the belief that outside vendors can deliver services at lower costs. Many organisations expect to gain a
better price and/or quality of service by using ITO. But industry research performed shows that outsourcing
of IT services is not always successful. Some industry research: 50% of the ITO engagements do not deliver
the objectives. 50% of the ITO engagements have to be renegotiated, and 25% of the outsourced IT is trans-
ferred to another supplier or back in-house within two years after the outsourcing deal. The question arises
whether ITO is increasing the BIA gap or not. Is ITO penny wise but pound foolish or not?
At the end, the goal of both BIA and ITO should be improving the desired e� ectiveness and e� ciency of IT in
meeting business objectives. This book provides business & IT managers, consultants and researchers
several major insights regarding BIA and ITO based on an extensive research represented by 907 business
& IT managers of which 28 case research organisations, 183 survey research organisations and 62 organisa-
tions conducting an abbreviated survey.
Barry Derksen
Barry Derksen
Impact of IT O
utsourcing on Business & IT A
lignment
Impact of IT Outsourcingon Business & IT Alignment
Academic Dissertation
Barry Derksen
Omslag Proefschrift Barry.indd 1 29-10-2012 8:45:48