
Impact of deforestation on climate at Amazon Basin: Simulations using high resolution
13
Theor. Appl. Climatol. 78, 123–135 (2004) DOI 10.1007/s00704-004-0048-5 1 Department of Atmospheric Sciences, Institute of Astronomy, Geophysics and Atmospheric Sciences, University of S~ ao Paulo, S~ ao Paulo, Brazil 2 Department of Meteorology, Federal University of Para ´, Bel em, Brazil Simulation of deforestation in eastern Amazonia using a high-resolution model A. W. Gandu 1 , J. C. P. Cohen 2 , and J. R. S. de Souza 2 With 11 Figures Received December 10, 2002; revised July 8, 2003; accepted October 24, 2003 Published online April 20, 2004 # Springer-Verlag 2004 Summary This work evaluates the impact of deforestation on the climate of the eastern portion of the Amazon basin. This region is primarily an area of native tropical rainforest, but also contains several other natural ecosystems such as mangroves and savanna. It is the most densely populated area in Amazonia, and has been significantly affected by deforestation. In this study, numerical simulations were performed with a high spatial resolution, regional model that allows for consideration of mesoscale aspects such as topography, coastlines and large rivers. To evaluate the present situation and to predict potential future effects of deforestation on the climatic conditions of this region, two, one-year model simulations were made. In the first, ‘‘control simulation’’, an attempt was made to match the existing surface vegetation. The biophysical parameters used were derived from recent studies of similar Amazon- region ecosystems. In the second run, ‘‘deforested simula- tion’’, the forested-area biophysical parameters were replaced by those corresponding to the pasture areas of the region. The higher-resolution regional modelling revealed impor- tant climatic features of the deforestation process, displaying some associated mesoscale effects that are not typically repre- sented in similar Global Circulation Model simulations. Near coastal zones and along large rivers, deforestation resulted in reduced cloud cover and precipitation. However, increased cloud cover and precipitation was predicted over upland areas, especially on slopes facing river valleys. The modelled surface sensible and latent heat fluxes also presented both positive and negative anomalies. The magnitudes of these anomalies were greater during the dry season. Windspeed near the surface was the meteorological variable that presented the most significant change due to deforestation. The reduction in roughness coef- ficient resulting from the shift from forest to pasture produced increased windspeeds near the Atlantic coast. The greater windspeeds diminished local humidity convergence and con- sequently reduced rainfall totals in nearby regions. The results obtained from these higher-resolution simula- tions show that, in general, orography, coastline profile and the distribution of large rivers play important roles in deter- mining anomaly patterns of precipitation, wind, and energy exchange associated with deforestation in eastern Amazonia. 1. Introduction Evaluating the potential impact of Amazonian deforestation on precipitation is critical to under- standing how the local hydrological cycle may change in the future. This type of study can also improve understanding of the remote effects of Amazonian deforestation and precipitation on weather and climate in other regions of the world (Eltahir, 1996; Werth and Avissar, 2002). One of the most active areas of deforestation is eastern Amazonia. This region is complex and comprises various ecosystem types, such as native and regrowth forests, mangroves, savannas, natural fields, pasture fields and agricultural areas. The region is characterised by proximity to the
-
Upload
independent -
Category
Documents
-
view
3 -
download
0
Transcript of Impact of deforestation on climate at Amazon Basin: Simulations using high resolution

Theor. Appl. Climatol. 78, 123–135 (2004)DOI 10.1007/s00704-004-0048-5
1 Department of Atmospheric Sciences, Institute of Astronomy, Geophysics and Atmospheric Sciences,University of S~aao Paulo, S~aao Paulo, Brazil
2 Department of Meteorology, Federal University of Para, Bel�eem, Brazil
Simulation of deforestation in eastern Amazoniausing a high-resolution model
A. W. Gandu1, J. C. P. Cohen2, and J. R. S. de Souza2
With 11 Figures
Received December 10, 2002; revised July 8, 2003; accepted October 24, 2003Published online April 20, 2004 # Springer-Verlag 2004
Summary
This work evaluates the impact of deforestation on theclimate of the eastern portion of the Amazon basin. Thisregion is primarily an area of native tropical rainforest, butalso contains several other natural ecosystems such asmangroves and savanna. It is the most densely populatedarea in Amazonia, and has been significantly affected bydeforestation. In this study, numerical simulations wereperformed with a high spatial resolution, regional modelthat allows for consideration of mesoscale aspects such astopography, coastlines and large rivers.
To evaluate the present situation and to predict potentialfuture effects of deforestation on the climatic conditions ofthis region, two, one-year model simulations were made. Inthe first, ‘‘control simulation’’, an attempt was made to matchthe existing surface vegetation. The biophysical parametersused were derived from recent studies of similar Amazon-region ecosystems. In the second run, ‘‘deforested simula-tion’’, the forested-area biophysical parameters were replacedby those corresponding to the pasture areas of the region.
The higher-resolution regional modelling revealed impor-tant climatic features of the deforestation process, displayingsome associated mesoscale effects that are not typically repre-sented in similar Global Circulation Model simulations. Nearcoastal zones and along large rivers, deforestation resulted inreduced cloud cover and precipitation. However, increasedcloud cover and precipitation was predicted over upland areas,especially on slopes facing river valleys. The modelled surfacesensible and latent heat fluxes also presented both positive andnegative anomalies. The magnitudes of these anomalies weregreater during the dry season. Windspeed near the surface was
the meteorological variable that presented the most significantchange due to deforestation. The reduction in roughness coef-ficient resulting from the shift from forest to pasture producedincreased windspeeds near the Atlantic coast. The greaterwindspeeds diminished local humidity convergence and con-sequently reduced rainfall totals in nearby regions.
The results obtained from these higher-resolution simula-tions show that, in general, orography, coastline profile andthe distribution of large rivers play important roles in deter-mining anomaly patterns of precipitation, wind, and energyexchange associated with deforestation in eastern Amazonia.
1. Introduction
Evaluating the potential impact of Amazoniandeforestation on precipitation is critical to under-standing how the local hydrological cycle maychange in the future. This type of study can alsoimprove understanding of the remote effects ofAmazonian deforestation and precipitation onweather and climate in other regions of the world(Eltahir, 1996; Werth and Avissar, 2002). One ofthe most active areas of deforestation is easternAmazonia. This region is complex and comprisesvarious ecosystem types, such as native andregrowth forests, mangroves, savannas, naturalfields, pasture fields and agricultural areas. Theregion is characterised by proximity to the
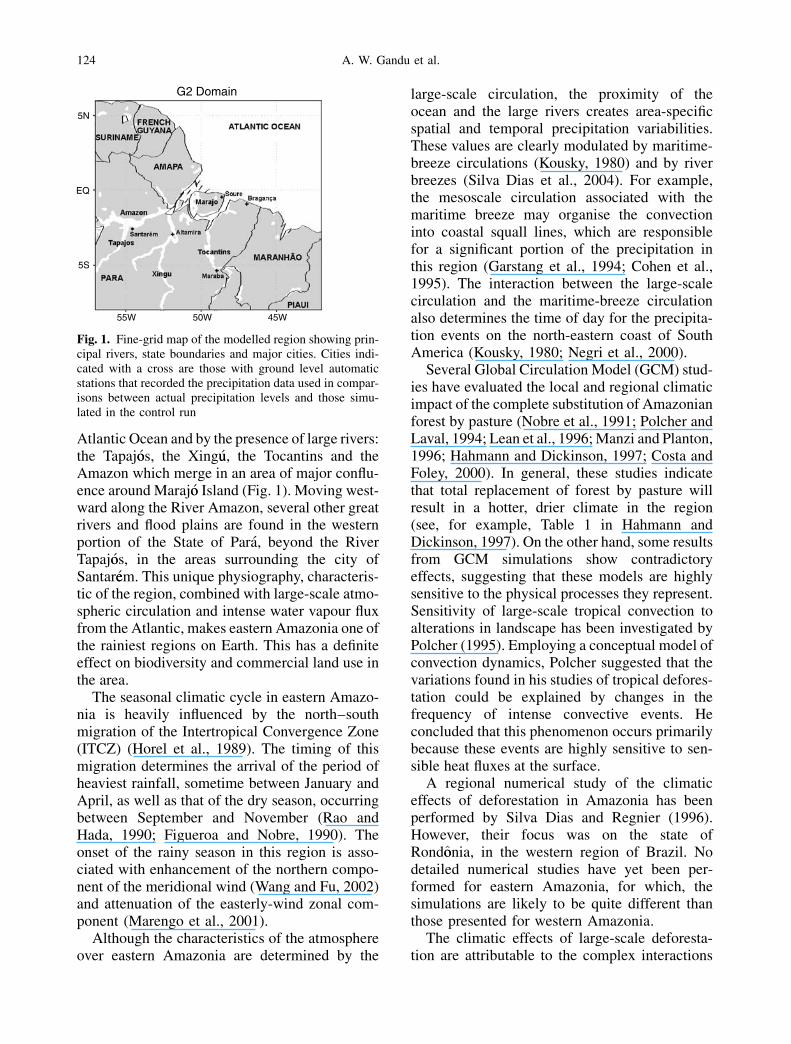
Atlantic Ocean and by the presence of large rivers:the Tapaj�oos, the Xing�uu, the Tocantins and theAmazon which merge in an area of major conflu-ence around Maraj�oo Island (Fig. 1). Moving west-ward along the River Amazon, several other greatrivers and flood plains are found in the westernportion of the State of Para, beyond the RiverTapaj�oos, in the areas surrounding the city ofSantar�eem. This unique physiography, characteris-tic of the region, combined with large-scale atmo-spheric circulation and intense water vapour fluxfrom the Atlantic, makes eastern Amazonia one ofthe rainiest regions on Earth. This has a definiteeffect on biodiversity and commercial land use inthe area.
The seasonal climatic cycle in eastern Amazo-nia is heavily influenced by the north–southmigration of the Intertropical Convergence Zone(ITCZ) (Horel et al., 1989). The timing of thismigration determines the arrival of the period ofheaviest rainfall, sometime between January andApril, as well as that of the dry season, occurringbetween September and November (Rao andHada, 1990; Figueroa and Nobre, 1990). Theonset of the rainy season in this region is asso-ciated with enhancement of the northern compo-nent of the meridional wind (Wang and Fu, 2002)and attenuation of the easterly-wind zonal com-ponent (Marengo et al., 2001).
Although the characteristics of the atmosphereover eastern Amazonia are determined by the
large-scale circulation, the proximity of theocean and the large rivers creates area-specificspatial and temporal precipitation variabilities.These values are clearly modulated by maritime-breeze circulations (Kousky, 1980) and by riverbreezes (Silva Dias et al., 2004). For example,the mesoscale circulation associated with themaritime breeze may organise the convectioninto coastal squall lines, which are responsiblefor a significant portion of the precipitation inthis region (Garstang et al., 1994; Cohen et al.,1995). The interaction between the large-scalecirculation and the maritime-breeze circulationalso determines the time of day for the precipita-tion events on the north-eastern coast of SouthAmerica (Kousky, 1980; Negri et al., 2000).
Several Global Circulation Model (GCM) stud-ies have evaluated the local and regional climaticimpact of the complete substitution of Amazonianforest by pasture (Nobre et al., 1991; Polcher andLaval, 1994; Lean et al., 1996; Manzi and Planton,1996; Hahmann and Dickinson, 1997; Costa andFoley, 2000). In general, these studies indicatethat total replacement of forest by pasture willresult in a hotter, drier climate in the region(see, for example, Table 1 in Hahmann andDickinson, 1997). On the other hand, some resultsfrom GCM simulations show contradictoryeffects, suggesting that these models are highlysensitive to the physical processes they represent.Sensitivity of large-scale tropical convection toalterations in landscape has been investigated byPolcher (1995). Employing a conceptual model ofconvection dynamics, Polcher suggested that thevariations found in his studies of tropical defores-tation could be explained by changes in thefrequency of intense convective events. Heconcluded that this phenomenon occurs primarilybecause these events are highly sensitive to sen-sible heat fluxes at the surface.
A regional numerical study of the climaticeffects of deforestation in Amazonia has beenperformed by Silva Dias and Regnier (1996).However, their focus was on the state ofRondoonia, in the western region of Brazil. Nodetailed numerical studies have yet been per-formed for eastern Amazonia, for which, thesimulations are likely to be quite different thanthose presented for western Amazonia.
The climatic effects of large-scale deforesta-tion are attributable to the complex interactions
Fig. 1. Fine-grid map of the modelled region showing prin-cipal rivers, state boundaries and major cities. Cities indi-cated with a cross are those with ground level automaticstations that recorded the precipitation data used in compar-isons between actual precipitation levels and those simu-lated in the control run
124 A. W. Gandu et al.
of soil and vegetation, energy and waterexchanges, cloud formation and general atmo-spheric circulation. On a smaller scale, signifi-cant orography and local circulation caused bythe proximity of the ocean and of large riversmay also contribute to the local characteristicsof temperature, energy fluxes and surface distri-bution of precipitation. Predictions of the poten-tial effects of further deforestation, derived fromnumerical simulations, are highly dependentupon the model used, as well as upon the radia-tion balance, precipitation, air temperature, dif-fusivity and other physical parameters adopted(Manzi and Planton, 1996).
The objective of this study was to simulate theatmospheric effects of total substitution of forestby pastureland in the eastern region of Amazonia.In order to achieve higher spatial resolution, theRegional Atmospheric Modelling System (RAMS)model was used. The general characteristics andconfigurations of the version of the RAMS modelchosen are presented in Section 2 of this paper. Inaddition, the initial conditions, lateral conditionsand surface boundary conditions selected for ‘‘con-trol’’ and ‘‘deforested’’ simulations are specified.The simulated results, in which surface variablesare analysed in terms of annual averages andseasonal-scale, specified-period averages, are pre-sented in Section 3. The final summary and theconclusions are found in Section 4.
2. Experimental design
The RAMS model employed is a comprehensivenumerical model of the atmosphere and includesprognostic equations for temperature, water
vapour, liquid water (cloud and rain), three windcomponents and five species of ice forms (Tripoliand Cotton, 1982; Tremback, 1990; Walko et al.,1995). The RAMS model has been widely usedto simulate relatively short-term (hours to severaldays) atmospheric and land-surface processes(Pielke et al., 1992), and, more recently, to simu-late climate (Liston and Pielke, 2001; Lu et al.,2001). The model version used in this work wasVersion 4.4. An overview of the model character-istics is given by Cotton et al. (2003).
In this study, the model was configured withtwo grids. The first had 22 east–west points and17 north–south points (horizontal interval be-tween points: 200 km) and encompassed anarea from latitude 14� S to 14� N and from longi-tude 26� W to 64� W. The second grid, nestedwithin the first, had 38 east–west points and 34north–south points (horizontal interval betweenpoints: 50 km). This second grid covered theregion which includes the countries of Surinameand French Guyana and the Brazilian states ofAmapa and Para, Maranh~aao (in large part),Tocantins (northern portion) and Piauı (westernportion) (Fig. 1). Both grids had 25 verticallayers, the first of which encompassed the initial100 m of atmosphere. Each successive layerincreased by a factor of 1.2 until attaining adimension of 1000 m. Continuing up to themodel top (22.6 km), all subsequent layers were1000 m thick. The model uses physical variablesof 12 soil layers, with the bottom of each layer atthe following levels (in metres): 0.01, 0.03, 0.05,0.10, 0.15, 0.20, 0.30, 0.50, 1.0, 2.0, 3.0, and 4.0.
The model topography was defined using theglobal, 30 arc-second, latitude–longitude dataset
Table 1. Biophysical parameters for each category of vegetation used
Parameter Forest Pasture Cerrado�
Albedo 0.13(1) 0.18(1) 0.18(2)
Emissivity 0.95 0.96 0.97Leaf area index (LAI) 5.2(1) 2.7(1) 1.0(2)
LAI seasonal variation 1.0 2.0 0.8Vegetation fraction coverage (Vfrac) 0.98(3) 0.85(3) 0.50Vfrac seasonal variation 0.05 0.10 0.30Roughness length, zo (m) 2.35(1) 0.05(1) 1.20(2)
Zero plane displacement (m) 28.4(1) 0.3(1) 10.0(2)
Root depth (m) 4.0(1) 1.0 2.0Stomatal conductance (mm s�1) 0.0035(4) 0.0010(4) 0.0020(4)
� Savanna-like vegetationSuperscripts refer to the source references as follows: (1) Wright et al., 1996; (2) Miranda et al., 1996; (3) Silva Dias andRegnier, 1996; and (4) Freitas, 1999
Simulation of deforestation in eastern Amazonia using a high-resolution model 125
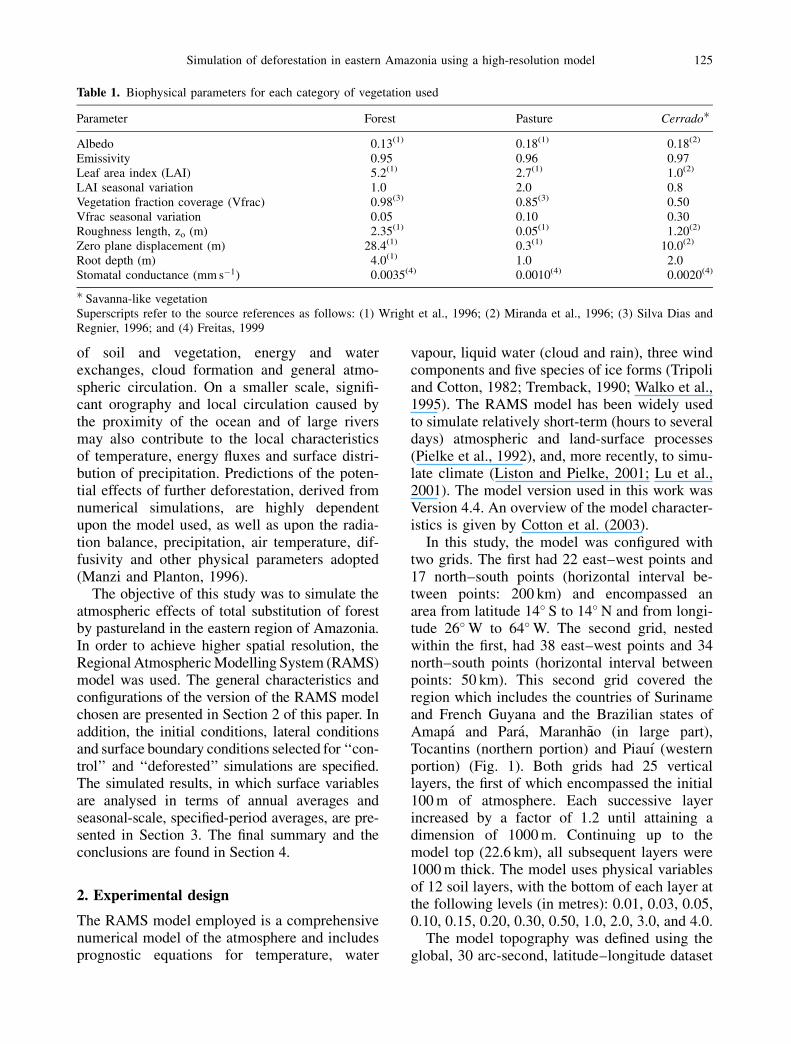
available through the United States GeologicalSurvey’s (USGS) Earth Resources ObservationSystem (EROS). The topographic distributionfor the fine grid is shown in Fig. 2a. Within thegrid, there were some important areas of higherelevation such as the Tumucumaque mountainchain (in north-western Para, west of Amapaand south of French Guyana and Suriname), theBrazilian central plateau (in southern Para)and the Mangabeiras high flats (in southernMaranh~aao). The topography in the central por-tion of the fine grid is dominated by lowlandsthat begin on Maraj�oo Island on the Atlantic coastand follow the Amazon valley to the western andsouth-western sectors.
The RAMS sub-model that simulates interac-tions between soil, vegetation and atmosphereuses the land-to-water area ratio in each gridcell of the model to compute the sensible andlatent heat fluxes (Walko et al., 2000). In thisstudy, the land-water fraction used was derivedfrom the ‘‘vegetation types’’ data files producedby the Centro de Previs~aao de Tempo e EstudosClimaticos (CPTEC) of the Instituto Nacional dePesquisas Espaciais (INPE) (Sestini et al., 2002).
The vegetation-cover distribution data usedfor the fine grid were also taken from theCPTEC=INPE data files and are shown in Fig.2b. The region presents a great variety of vegeta-tion types and, in order to simplify this study, thedifferent types of vegetation in this domain were
classified as either ‘‘forest’’, ‘‘pasture’’ or ‘‘cer-rado’’ (a type of savanna). According to this clas-sification, the major portion of the continentalregion within the modelled domain is coveredby forest. The cerrado types of vegetationare found mainly in the southern areas ofMaranh~aao and Piauı, on the eastern side ofMaraj�oo Island, along the eastern coast of Amapaand in some spots along the Amazon. The areasalready deforested are more significant in south-eastern Para and in the central region ofMaranh~aao. A smaller area representative of thistype of vegetation is also found on the north-east-ern coast of Para, on the eastern side of Maraj�ooIsland.
The original RAMS biophysical parametersfor each type of vegetation were replaced (Table1) by either locally observed values (Wrightet al., 1996; Miranda et al., 1996) or by thoseadopted in previous studies of Amazonia (SilvaDias and Regnier, 1996; Freitas, 1999). Valuesnot indicated by the index in Table 1 wereassumed in accordance with a personal commu-nication from Humberto da Rocha.
Two simulation runs were performed. In thefirst (CONTROL), each vegetation class withinthe modelled domain was given its proper bio-physical parameters, according to Table 1. In thesecond simulation (DEFORESTED or NOFOR),the vegetation biophysical parameters of the‘‘forest’’ classification were replaced by the
Fig. 2. (a) Fine-grid topographical map of the modelled area, showing the principal upland regions. Contour intervals are50 m, with a minimum altitude of 100 m and shaded after 200 m. (b) Fine-grid map of vegetation distribution. Dark, mediumand light shading correspond to ‘‘pasture’’, ‘‘forest’’ and ‘‘cerrado’’ areas, respectively
126 A. W. Gandu et al.

respective biophysical parameters of the ‘‘pas-ture’’ classification.
Both simulations were initialised with geopo-tential, temperature, relative humidity and hori-zontal wind components obtained from theNational Centers for Environmental Prediction(NCEP) global model analysis. Analysis was atstandard pressure levels, using a grid of 2.5� lati-tude by 2.5� longitude. The lateral boundary con-ditions for the coarse grid were also provided bythe NCEP model analysis and were assimilatedat each grid limit point, with a nudging time of900 seconds. Sea surface temperature (SST) wasdefined on a 1� global grid according to theNational Oceanic and Atmospheric Administra-tion (NOAA) weekly analysis and was interpo-lated to find the SST values for this RAMSmodel simulation.
In setting initial conditions for temperature inall soil layers, it was assumed that values were6 �C higher than those established at the firstlevel of the atmospheric model. This soil temper-ature=air temperature differential is the medianfor the month of August in this region (Souzaet al., 2002). The initial conditions for the hori-zontally non-homogeneous soil moisture con-tents were derived from climatology data forthe month of August (Rossato et al., 2002).
The model runs spanned a 13-month period,starting at 00 h UTC on 1 August 2000 and end-ing at 00 h UTC on 1 September 2001. The
results shown and discussed relate to regionalaverages of one-year periods and three-monthperiods. The three-month averages correspondto the periods of heaviest rainfall (February toApril) and least rainfall (June to August)observed over the course of this study.
3. Results
Several previous studies have documented theannual variation and spatial distribution of rain-fall in the Amazon basin (Figueroa and Nobre,1990; Marengo, 1992; Rao et al., 1996). Therelationship between precipitation and large-scale circulation has also been investigated(Horel et al., 1989; Hastenrath, 1997). EasternAmazonia has one of the highest annual rainfallrates in the world. The Amapa coast and Amazondelta receive more than 3000 mm of precipitationper year. Interior regions, such as the central andwestern portions of the state of Para, receiveapproximately 2000 mm annually. The greaterpart of this precipitation falls during the periodbetween January and April, due to the southwardmovement of the ITCZ.
In Fig. 3, both actual and simulated monthlyprecipitation averages are shown for the periodof September 2000 to August 2001. Measure-ments of actual precipitation were taken at auto-matic meteorological stations, two on the coast(at Soure and Braganc�a) and two in the interior
Fig. 3. Comparison of monthly precipitation (mm) collected between September 2000 and August 2001 at the ground levelautomatic stations (indicated in Fig. 1) with that simulated in the control run for the same period
Simulation of deforestation in eastern Amazonia using a high-resolution model 127
(at Altamira and Maraba). The simulatedmonthly averages shown are those from controlruns for the same stations. Disregarding a fewanomalous months, comparison of observed pre-cipitation and simulated precipitation shows thatthe control run simulation was able to capture theannual precipitation cycles in the region rela-tively well. Taking eastern Amazonia and theadjacent Atlantic coastal waters as a whole,the control run also succeeded in simulating theannual north–south movement of the ITCZ (Fig.not shown.).
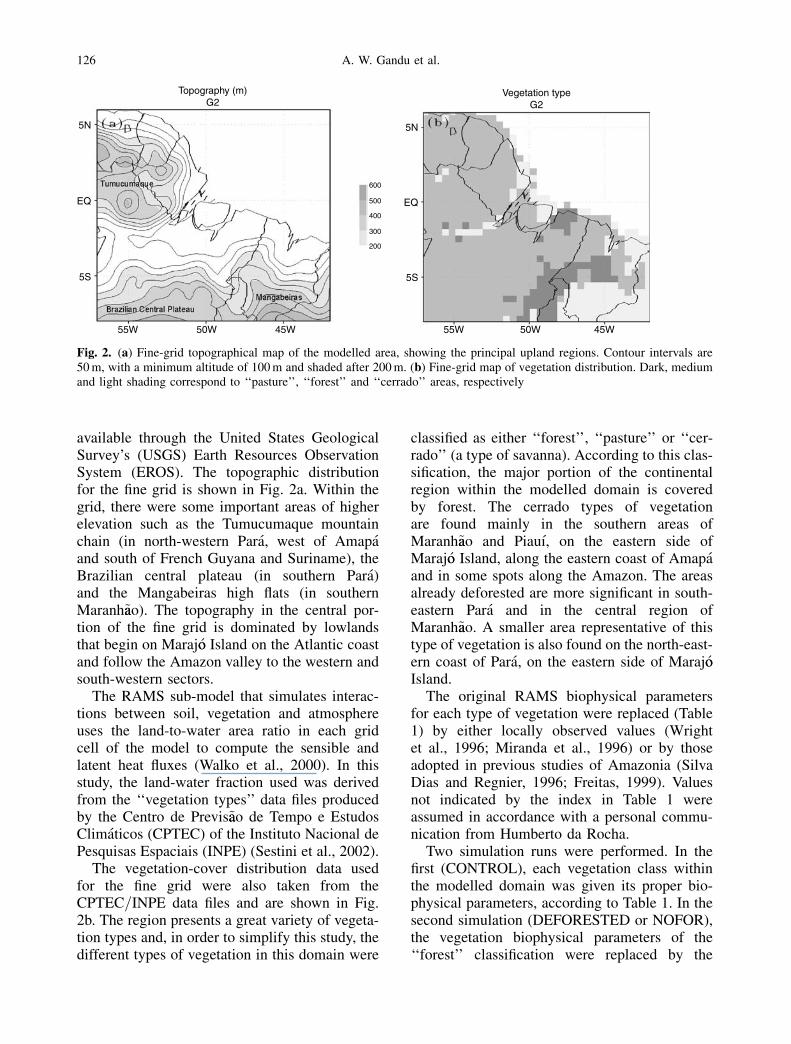
Control-run precipitation totals accumulatedduring the 12 months, September 2000 toAugust 2001, are shown in Fig. 4a. Despitethe apparent agreement between the observedand simulated distribution patterns, it is impor-tant to note that simulated precipitation valueswere overestimated. There is a large area ofmaximum precipitation encompassing thecoastal area of Amapa, the Amazon delta, thenorthern part of Maraj�oo Island and a portionof the adjoining coastal waters. Precipitationvalues in RAMS simulations were arrived atby summing precipitation values generated bythe microphysics RAMS module (commonlyknown as ‘‘explicit microphysics precipitation’’or ‘‘totpcp’’) and those generated by Kuo cumu-lus parameterisations (known as ‘‘convectiveprecipitation’’ or ‘‘acccon’’). Precipitation distri-bution patterns simulated by the control runwere primarily determined by the microphysics
module, accounting for 85% of all simulatedprecipitation.
The total precipitation field shown in Fig. 4adisplays a smaller but significant area of maxi-mum precipitation along the Amazon valley. Thehigher precipitation values for this area, espe-cially the rainy-season values, can also be attrib-uted to the microphysics module.
The anomalies in annual accumulated precipi-tation totals resulting from the NOFOR simula-tion minus the CONTROL values are shown inFig. 4b. The data shown indicate that, if the forestwere replaced by pasture, there would be a defi-nite precipitation reduction in certain areas. Acoastal area stretching from Amapa to the easternportion of Maraj�oo Island, as well as an east–weststrip of the Atlantic, would suffer an approximate16% reduction in precipitation. The coastal areaof negative precipitation anomaly may be attrib-uted to a reduction in water vapour convergencenear the ocean, owing to the changes in vege-tation. As the surface roughness coefficientdecreased, there would be an increase in wind-speed over those areas, with the attendant reduc-tion in humidity convergence.
Another area, in and around the River Amazoncity of Santar�eem, would see precipitation totalsdecrease by approximately 10% after the substi-tution of forest by pasture. This reduction wasalmost entirely generated by the microphysicsmodule (Fig. 5a) and would be observed in bothdry and rainy seasons.
Fig. 4. Total (convective plus microphysics) accumulated precipitation fields (mm) for: a) 12-month control run and b)anomaly (deforested minus control). Contour intervals are 500 mm (a), and 200 mm (b). Solid contours for positive values (b)
128 A. W. Gandu et al.

Contrary to most previous studies, whichused GCM atmospheric simulations, the pre-cipitation field anomalies in the present sim-ulations also showed areas of enhancedprecipitation, constituting positive anomaliesof some 10 to 16% (Fig. 4b). As can be seen,these anomalies were primarily on the slopesof the uplands to the north and south of theRiver Amazon. Both microphysics (Fig. 5a)and parameterised convective rainfall (Fig. 5b)contributed to the calculation of these precipi-tation increases. At higher altitudes, the latterpredominated.
Consistent with the precipitation behaviour,cloud cover over the coastal areas of Amapaand along the River Amazon reduces by approxi-mately 5% after deforestation (Fig. 6). In thisregion, the reduction in cloud cover is more evi-dent during the dry season (Fig. 6b). Conversely,an increase in cloud cover was observed over theupland slopes of the region, both during the rainyperiod (Fig. 6a) and during the dry period(Fig. 6b).
The annual anomalies in sensible heat flux dis-tribution (Fig. 7a) present only a few differencesbetween the CONTROL and NOFOR runs for
Fig. 5. Annual precipitation anomaly (deforested minus control), in mm, for: a) explicit microphysics precipitation and; b)parameterised convective precipitation. Shading intervals are 200 mm (a), and 50 mm (b). Solid contours for positive values
Fig. 6. The cloud-cover anomaly (deforested minus control), in %, for: a) February to April 2001 and; b) June to August2001. Shading intervals of 2%. Solid contours for positive values
Simulation of deforestation in eastern Amazonia using a high-resolution model 129

the coastal area extending from Amapa andMaraj�oo Island to north-eastern Para and north-western Maranh~aao. Nevertheless, over more con-tinental areas, the substitution of forest bypasture produced an attenuation of approxi-mately 10% in sensible heat flux values, consis-tent with findings from previous studies (Manziand Planton, 1996). In the simulated dry months,this attenuation was more pronounced (Fig. 8a).In the southern and south-eastern sections of themodelled domain, an increase in sensible heatflux can be seen within an area dominated bycerrado-type vegetation.
The latent heat flux anomaly distribution (Fig.7b) indicates an attenuation of nearly 6% in thecentral, southern and north-eastern regions ofPara. There is a more intense negative anomalynucleus in north-eastern Maranh~aao, extendinginto the state of Piaui. In contrast, the samesubstitution of forest by pasture resulted in anenhancement of latent heat fluxes over the uplandregion north of the equator (Fig. 8b). During thedry period in the modelled domain, both positiveand negative latent heat flux anomalies occur.The absolute values of these anomalies are com-parable to those estimated by previous studies
Fig. 7. Annual anomaly (deforested minus control) of: a) surface sensible heat flux (W m�2); and b) surface latent heat(W m�2). Shading intervals are 2 W m�2 (a), and 5 W m�2 (b). Solid contours for positive values
Fig. 8. The dry quarter (June to August 2001) average anomaly (deforested minus control) of: a) surface sensible heat flux(W m�2) and; b) surface latent heat flux (W m�2). Shading intervals are 5 W m�2. Solid contours for positive values
130 A. W. Gandu et al.
(Manzi and Planton, 1996; Hahmann andDickinson, 1997).
It is of note that replacement of forest by pas-ture over the continent leads to an approximate6% increase in latent heat fluxes over the ocean,near the Amapa and Maranh~aao coasts (Figs. 7band 8b). This increase occurs as a result ofincreased windspeed at the ocean-continent inter-face, due to the difference in roughness coeffi-cient between forest and pasture values. In thismodel, evaporation over the ocean depends onSST and windspeed. The same SST was adoptedin the two model runs and the model had nocoupled ocean module capable of changing theSST according to vertical mixing. Therefore, theincrease in windspeed inevitably led to higherlocal latent heat fluxes.
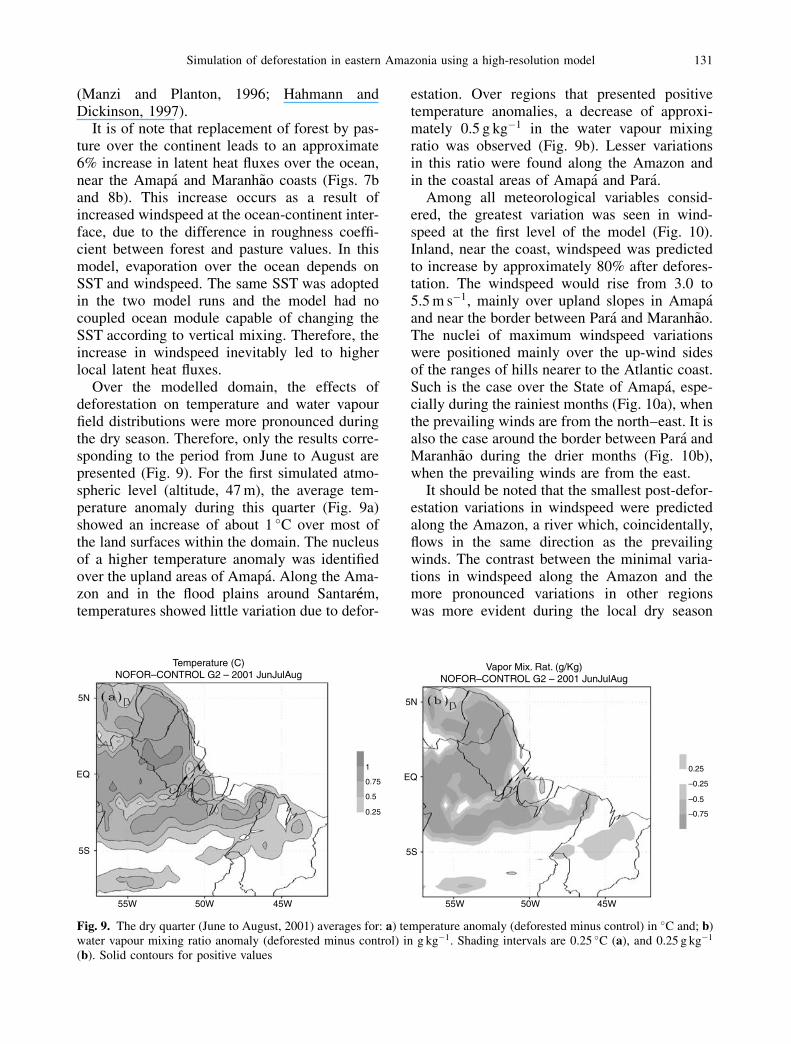
Over the modelled domain, the effects ofdeforestation on temperature and water vapourfield distributions were more pronounced duringthe dry season. Therefore, only the results corre-sponding to the period from June to August arepresented (Fig. 9). For the first simulated atmo-spheric level (altitude, 47 m), the average tem-perature anomaly during this quarter (Fig. 9a)showed an increase of about 1 �C over most ofthe land surfaces within the domain. The nucleusof a higher temperature anomaly was identifiedover the upland areas of Amapa. Along the Ama-zon and in the flood plains around Santar�eem,temperatures showed little variation due to defor-
estation. Over regions that presented positivetemperature anomalies, a decrease of approxi-mately 0.5 g kg�1 in the water vapour mixingratio was observed (Fig. 9b). Lesser variationsin this ratio were found along the Amazon andin the coastal areas of Amapa and Para.
Among all meteorological variables consid-ered, the greatest variation was seen in wind-speed at the first level of the model (Fig. 10).Inland, near the coast, windspeed was predictedto increase by approximately 80% after defores-tation. The windspeed would rise from 3.0 to5.5 m s�1, mainly over upland slopes in Amapaand near the border between Para and Maranh~aao.The nuclei of maximum windspeed variationswere positioned mainly over the up-wind sidesof the ranges of hills nearer to the Atlantic coast.Such is the case over the State of Amapa, espe-cially during the rainiest months (Fig. 10a), whenthe prevailing winds are from the north–east. It isalso the case around the border between Para andMaranh~aao during the drier months (Fig. 10b),when the prevailing winds are from the east.
It should be noted that the smallest post-defor-estation variations in windspeed were predictedalong the Amazon, a river which, coincidentally,flows in the same direction as the prevailingwinds. The contrast between the minimal varia-tions in windspeed along the Amazon and themore pronounced variations in other regionswas more evident during the local dry season
Fig. 9. The dry quarter (June to August, 2001) averages for: a) temperature anomaly (deforested minus control) in �C and; b)water vapour mixing ratio anomaly (deforested minus control) in g kg�1. Shading intervals are 0.25 �C (a), and 0.25 g kg�1
(b). Solid contours for positive values
Simulation of deforestation in eastern Amazonia using a high-resolution model 131

(Fig. 10b). Because of the increased windspeedsnear the surface, there was an anomalous humid-ity divergence along the coastline and increasinghumidity convergence towards the interior of thecontinent (Fig. 11).
4. Summary and conclusions
Multiple effects of the eventual substitution ofthe forest by pasture over the eastern sub-regionof Amazonia were predicted through the RAMS-model simulations. This mesoscale regionalmodel incorporates a comprehensive physical
representation of the radiative, convective, cloudmicrophysics, and surface-atmosphere interac-tion processes. Therefore, it is appropriate forstudying the atmospheric responses to local var-iations in surface vegetation combined with theinfluence of the existing topography, land-oceaninterfaces and large rivers of the region.
The results of this study, as with all othernumerical modelling simulations, are highly de-pendent on the performance and limitationsof the chosen model. These particular deforesta-tion simulations revealed important effects thathave not been previously investigated. For this
Fig. 10. The average windspeed anomaly (deforested minus control), in m s�1, for: a) rainy months (February to April 2001)and; b) dry months (June to August 2001). Shading intervals are 0.5 m s�1. Solid contours for positive values
Fig. 11. The average humidity-divergence anomaly (�106 g kg�1 s�1) for: a) rainy months (February to April 2001) and; b)dry months (June to August 2001). Shading intervals are 50� 106 g kg�1 s�1. Solid contours for positive values
132 A. W. Gandu et al.
area, GCM studies have not simulated effectssuch as the influence of the large rivers in theregion. Contrary to most large-scale model stud-ies, the RAMS-model simulation predicted thatthe deforestation of eastern Amazonia would notproduce a generalised reduction of precipitationover the region.
The present simulations indicated that defores-tation would result in reduced cloud cover andprecipitation over certain areas, such as theAmapa coast, the eastern part of Marajo Islandand along the large rivers of this region. Thiswould be particularly pronounced along theAmazon, near the city of Santar�eem. However,over the mountain slopes in central-southernPara, as well as those north of the Amazon,increased cloud cover and precipitation werepredicted. It should be mentioned that GCMsimulations of South American upland regionsproduced a similar result (Manzi and Planton,1996). In contrast, Hahmann and Dickinson(1997) showed that variations in humidity con-vergence and precipitation during the rainy sea-son in Amazonia presented a shift in the area ofmaximum precipitation, rather than a generaliseddecrease over the deforested area.
The main contribution to the simulated pre-cipitation values came from the RAMS explicitmicrophysics precipitation sub-module. Thistype of modelled precipitation dominates theanomaly field computed between the deforestedrun and the control run. Considering only theKuo-type convective parameterisation of themodel, comparison of the deforested and controlruns revealed that there was a generalised in-crease in precipitation. The only exception wasover a narrow coastal strip, where the biophysicalparameters for vegetation were identical in thetwo simulations. Since Kuo-type convectiveparameterisation is dependent on the degree ofthermodynamic instability of the atmosphere,this finding indicates that deforestation of Ama-zonia would result in an increase in the numberof deep convective events, primarily over uplandareas.
The sensible and latent heat fluxes also pre-sented negative and positive anomaly regionsresulting from deforestation. The magnitudes ofthese anomalies would be greater during the dryseason. Qualitatively similar results have pre-viously been simulated using GCMs (Nobre
et al., 1991; Manzi and Planton, 1996). Overthe deforested area south of the equator, adecrease in surface latent heat fluxes was pre-dicted. However, over the upland areas of westernAmapa and north-eastern Para (correspondingto the regions of increased precipitation anoma-lies), deforestation would produce an increase inlatent heat fluxes.
The results indicate that deforestation shouldproduce a generalised increase in temperaturesand a generalised decrease in the water vapourmixing ratio. The exception in both cases was thearea along the Amazon, over the flood plainsnear Santar�eem. With the exception of the meso-scale spatial details, the amplitude variationsin RAMS-simulated temperature increases andwater vapour mixing ratio decreases are compa-rable to those obtained through GCM simulations(Nobre et al., 1991; Manzi and Planton, 1996).
Windspeed near the surface is the meteorolog-ical variable that undergoes the greatest positivevariation attributable to deforestation. These var-iations are even more significant over the up-wind side of the hills near the Atlantic coastline.The shift from forest to pasture reduces the sur-face roughness coefficient, which in turn allowswindspeeds to increase and lessens humidityconvergence over the ocean-land interface. Con-sequently, rainfall decreases in the area. It shouldbe pointed out that the deforested simulation didnot predict a significant increase in windspeedsover the Amazon flood plains surroundingSantar�eem.
In general, the high-resolution simulations ofdeforestation employed in this study reveal thattopography, coastline profile and large rivers allplay important roles in the anomalous patterns ofprecipitation, wind, and energy exchange in theeastern region of Amazonia.
Acknowledgements
This work was supported by the Brazilian Tropical ForestsProtection Program (PPG7=FINEP=MCT – Grant No.64.99.0425.00), by the Ministry of Science and Technology(MCT) and by the CNPq=PADCT Millennium InstitutesInitiative (Project number 62.0056=01-0, and Project number62.0065=01-0). The authors would like to thank Tiago Correaand Zilurdes Lopes for their help with, respectively, computa-tion and text processing. We also thank the Centro de Previs~aaodo Tempo e Estudos Climaticos (CPTEC) of the InstitutoNacional de Pesquisas Espaciais (INPE) for furnishing the
Simulation of deforestation in eastern Amazonia using a high-resolution model 133
data from the automatic stations at Altamira and Maraba.Special thanks to the staff of the MASTER Laboratory ofthe Institute for Astronomy, Geophysics and AtmosphericSciences of the University of S~aao Paulo for their computa-tional support for the RAMS model and for the meteorologicaldata provided. The authors also wish to extend thanks toDr. Regina Celia S. Alvala who allowed access to theCPTEC=INPE data file on soil moisture content and vegeta-tion used in this study. Finally, we express our gratitude for theconstant encouragement provided by Dr. Carlos A. Nobre.
References
Cohen JCP, Silva Dias MAF, Nobre CA (1995) Environ-mental conditions associated with Amazonian squalllines: A case study. Mon Wea Rev 123: 3163–3174
Costa MR, Foley JA (2000) Combined effects of deforesta-tion and doubled atmospheric CO2 concentrations on theclimate of Amazonia. J Climate 13: 18–34
Cotton WR, Pielke RA Sr, Walko RL, Liston GE, TrembackCJ, Jiang H, McAnelly RL, Harrington JY, Nicholls ME,Carrio GG, McFadden LP (2003) RAMS 2001: CurrentStatus and future directions. Meteorol Atmos Phys 82:5–29
Eltahir EAB (1996) Role of vegetation in sustaining large-scale atmospheric circulations in the tropics. J GeophysRes 101(D2): 4255–4268
Figueroa SN, Nobre CA (1990) Precipitation distributionover central and western tropical South America.Climanalise 5: 36–44
Freitas SR (1999) Numerical Modeling of the transport andemissions from biomass burning on South Americatropical forest and savanna. Ph.D. Thesis – Institute ofPhysics, University of Sao Paulo, 204 pp (In Portuguese)
Garstang M, Massier HL Jr, Halverson J, Greco S, Scala J(1994) Amazon coastal squall lines, part I: Structure andkinematics. Mon Wea Rev 122: 608–622
Hahmann NA, Dickinson RE (1997) RCCM2-BATS Modelover tropical South America: Applications to tropicaldeforestation. J Climate 10: 1944–1964
Hastenrath S (1997) Annual cycle of upper air circulationand convective activity over the tropical Americas.J Geophys Res 102(D4): 4267–4274
Horel JD, Hahmann NA, Geisler JE (1989) An investigationof the annual cycles of convective activity over thetropical South America. J Climate 2: 1388–1403
Kousky VE (1980) Diurnal rainfall variation in NortheastBrazil. Mon Wea Rev 108: 488–498
Lean J, Bunton CB, Nobre CA, Rowntree RL (1996) Thesimulated impact of Amazonian deforestation on climateusing measured ABRACOS vegetation characteristics. In:Gash JHC, Nobre CA, Roberts JM, Victoria RL (eds)Amazonian deforestation and climate. Chichester: Wiley,pp 549–576
Liston GE, Pielke RA Sr (2001) A climate version of theregional atmospheric modeling system. Theor Appl Cli-matol 68: 155–173
Lu LX, Pielke RA, Liston GE, Parton WJ, Ojima D, HartmanM (2001) Implementation of a two-way interactive atmo-
spheric and ecological model and its application to thecentral United States. J Climate 14: 900–919
Manzi AO, Planton S (1996) A simulation of Amazoniandeforestation using a GCM calibrated with ABRACOSand ARME data. In: Gash JHC, Nobre CA, Roberts JM,Victoria RL (eds) Amazonian deforestation and climate.Chichester: Wiley, pp 505–529
Marengo JA (1992) Interannual variability of surface climatein the Amazon basin. Int J Climatol 12: 853–863
Marengo JA, Liebmann B, Kousky VE, Filizola NP, WaierIC (2001) Onset and end of the rainy season in theBrazilian Amazon Basin. J Climate 14: 833–852
Miranda AC, Miranda HS, Lloyd J, Grace J, McIntyre JA,Meir P, Riggan P, Lockwood R, Brass J (1996) Carbondioxide fluxes over a cerrado sensu stricto in centralBrazil. In: Gash JHC, Nobre CA, Roberts JM, VictoriaRL (eds) Amazonian deforestation and climate. Chich-ester: Wiley, pp 353–363
Negri AJ, Anagnostou EN, Adler RF (2000) A 10-yrclimatology of Amazonian rainfall derived frompassive microwave satellite observation. J Appl Meteor39: 42–56
Nobre CA, Sellers PJ, Shukla J (1991) Amazonian defor-estation and regional climate change. J Climate 4:957–988
Pielke RA, Cotton WR, Walko RL, Tremback CJ, LyonsWA, Grasso LD, Nicholls ME, Moran MD, Wesley DA,Lee TJ, Copeland JH (1992) A comprehensive meteo-rological modeling system – RAMS. Meteorol AtmosPhys 49: 69–91
Polcher J (1995) Sensitivity of tropical convection to landsurface processes. J Atmos Sci 52: 3143–3161
Polcher J, Laval K (1994) A statistical study of the regionalimpact of deforestation on climate in the LMD GCM.Climate Dynamics 10: 205–219
Rao VB, Hada K (1990) Characteristics of rainfall overBrazil: annual variations and connections with the South-ern Oscillation. Theor Appl Climatol 42: 81–91
Rao VB, Cavalcanti IFA, Hada K (1996) Annual variationsof rainfall over Brazil and water vapor characteristics ofSouth America. J Geophys Res 101(D21): 26539–26551
Rossato L, Alvala RCS, Tomasella J (2002) Climatology ofsoil humidity in Brazil. Pre-prints, 12th Brazilian Con-gress of Meteorology, Foz do Iguac�u, Parana, SBMET,4–9 August, 1910–1915. (In Portuguese)
Sestini MF, Alvala RCS, Mello EMK, Valeriano DM, ChanCS, Nobre CA, Paiva JAC, Reimwe ES (2002) Vegetationmaps development for use in meteorological and hydro-logical models. Instituto Nacional de Pesquisas Espaciais,Publicac�~aao INPE-8972-RPQ=730, S~aao Jos�ee dos Campos,74 pp. (In Portuguese)
Silva Dias MAF, Silva Dias PL, Longo M, Fitzjarrald DR,Denning AS (2004) River breeze circulation in easternAmazonia: observations and modelling results. TheorAppl Climatol (this issue)
Silva Dias MAF, Regnier P (1996) Simulation of mesoscalecirculations in a deforested area of Rondoonia in dryseason. In: Gash JHC, Nobre CA, Roberts JM, VictoriaRL (eds) Amazonian deforestation and climate. Chich-ester: Wiley, pp 531–547
134 A. W. Gandu et al.
Souza JRS, Lopes ZF, Cohen JCP, Costa ACL (2002) Vari-ability of temperature and soil humidity in forests, pastureand mangroves in eastern Amazonia. Pre-prints, 12th Bra-zilian Congress of Meteorology, Foz do Iguac�u, Parana,SBMET, 4–9 August, 2522–2528. (In Portuguese)
Tremback CJ (1990) Numerical simulation of a mesoscaleconvective complex: Model development and numericalresults. Ph.D. dissertation, Atmosphere Science PaperNo. 465, Department of Atmospheric Science, ColoradoState University, 247 pp
Tripoli GJ, Cotton WR (1982) The Colorado State Univer-sity three-dimensional cloud=mesoscale model – 1982,Part I: General theoretical framework and sensitivityexperiments. J Rech Atmos 16: 185–220
Walko RL, Band LE, Baron J, Kittel TGE, Lammers R, LeeTJ, Ojima D, Pielke RA, Taylor C, Tague C, TrembackCJ, Vidale PL (2000) Coupled atmosphere-biophysics-hydrology models for environmental modeling. J ApplMeteor 39: 931–944
Walko RL, Cotton WR, Meyers MP, Harrington JH (1995)New RAMS cloud microphysics parameterization, Part I:the single-moment scheme. Atmos Res 38: 29–62
Wang H, Fu R (2002) Cross-equatorial flow and seasonalcycle of precipitation over South America. J Climate 15:1591–1608
Werth D, Avissar R (2002) The local and global effects ofAmazon deforestation. J Geophys Res 107(D20): art no.8087
Wright IR, Nobre CA, Tomasella J, da Rocha HR,Roberts JM, Vertamatti E, Culf AD, Alvala RCS,Hodnett MG, Ubarana VN (1996) Towards a GCMsurface parameterization for Amazonia. In: Gash JHC,Nobre CA, Roberts JM, Victoria RL (eds) Amazoniandeforestation and climate. Chichester: Wiley, pp474–504
Authors’ addresses: Dr. Adilson Wagner Gandu (e-mail:[email protected]), Institute of Astronomy, Geo-physics and Atmospheric Sciences, University of S~aao Paulo,Rua do Mat~aao, 1226 – Cid. Universitaria, 05508-090 S~aaoPaulo, SP, Brazil; Julia C. P. Cohen, Jos�ee Ricardo S. deSouza, Department of Meteorology, Federal University ofPara, Bel�eem, Brazil.
Simulation of deforestation in eastern Amazonia using a high-resolution model 135