Impact of access to Safe Water and PHASE Promotion on child and Maternal health in Kawempe Division,...
44
Impact of access to Safe Water and PHASE Promotion on child and Maternal health in Kawempe Division, Kampala,Uganda Brenda Achiro 1, Denis Kaffoko 1 , Mtwalib Walude 2 , Morrish Ojok 3, Susan Wandera 4 1 African Medical and Research Foundation (AMREF), Uganda Country Office & Corresponding author Brenda Achiro, African Medical and Research Foundation (AMREF), Uganda Country Office, Email: [email protected]
-
Upload
independent -
Category
Documents
-
view
3 -
download
0
Transcript of Impact of access to Safe Water and PHASE Promotion on child and Maternal health in Kawempe Division,...

Impact of access to Safe Water and PHASE Promotion
on child and Maternal health in Kawempe Division,
Kampala,Uganda
Brenda Achiro1, Denis Kaffoko1, Mtwalib Walude 2, Morrish Ojok 3,
Susan Wandera 4
1African Medical and Research Foundation (AMREF), Uganda Country
Office
& Corresponding author
Brenda Achiro, African Medical and Research Foundation (AMREF),
Uganda Country Office,
Email: [email protected]

Abstract
Over view: The Authors are Brenda Achiro, Denis Kaffoko, Susan
Wandera, Morrish Ojok and Mtwalib Walude, Evaluation was
affiliated to African Medical and Research Foundation Uganda.
Brenda Achiro ([email protected]) will be the corresponding
Author.
Title: Impact of access to Safe Water and PHASE Promotion on
child and Maternal health in Kawempe Division, Kampala, Uganda.
Background
AMREF Uganda secured funding from the Swedish Broadcasting
Corporation to implement a one-year project, this aimed at
reducing vulnerability to water and sanitation-related diseases.
The objectives were to improve personal hygiene and sanitation
practices at all levels; improve water infrastructure in schools;
increase awareness and action of the community stakeholders to
promote good practices and document best practices and lessons
learned.
Method
The end line survey was descriptive and cross sectional in
nature. Quantitative and qualitative methods of data collection
were used. School and household KAP survey in the 6 schools and
parishes was conducted. 576 respondents were sampled and data was
collected using semi structured tools.
Results
Malaria was the commonest disease 78.2% followed by cough 33.4%,
21.6%- 46.3% got water from Rain Water Harvesting Tanks. 97.7% of

the pupils’ home boiled water at end line compared to 96% at
baseline. 45.6%- 52.1% had fallen sick and missed school. Piped
water 82.3% was major water source followed by protected spring
at 12.5%. 91.3% of households used 5 twenty litre jerry cans in
a day, 94.8% paid for water used. 34.5%-37.7% disposed waste
water in drainage channels and 0.3% dispose waste water in soak
pits.
Conclusion
There was a decrease in the prevalence of all WASH related
diseases, increased water provision, significant reduction in
pupil-stance ratios, increased hand washing and reduced
consumption of unsafe water.
Key Words; Water, pupils, schools, community, Hygiene, diseases, increase, decrease
BACKGROUND
Water Sanitation and Hygiene (WASH) highly impacts on the health
status of the population. Consumption and use of unsafe water
leads to acquisition of diseases which can be classified as water
related. Lack of access to safe water and sanitation services,
coupled with poor hygiene practices, kills and sickens thousands
of children every day, and leads to impoverishment and diminished
opportunities for thousands more. The major water related
diseases that are prevalent in the urban slums of Kampala include
cholera, typhoid, dysentery, diarrhoea and hookworm among others.
ii

Poor sanitation, unsafe water and unhygienic practices contribute
to millions of children morbidity and mortality especially in the
developing world. Water and sanitation-related disease, despite
being preventable, remains one of the most significant child
health problems worldwide (UNICEF, 2010)1.
Poor sanitation, water and hygiene have many other serious
repercussions. Children and particularly girls are denied their
right to education because their schools lack private and decent
sanitation facilities. Women are forced to spend large parts of
their day fetching water. Poor farmers and wage earners are less
productive due to illness, health systems are overwhelmed and
national economies suffer. Without WASH (water, sanitation and
hygiene), sustainable development is impossible.
Project introduction and background
AMREF Uganda secured funding from the Swedish Broadcasting
Corporation (SBC), through AMREF Sweden, to implement a one-year
project “Improving Access to Safe Water and PHASE Promotion in Schools and
Communities in the Slums of Kawempe Division in Kampala City, Uganda”. The
project was expected to commence in September, 2011 and end in
August 2012. The project was designed to cover three (03)
government and three (03) private schools in three (03) parishes
of Kawempe Division in Kampala City, Uganda, namely Kanyanya,
Kawempe I and Mulago II parishes. The baseline survey was
1
iii

conducted in those areas and based on the results of the survey
implementation was done in those areas
The project aimed at reducing vulnerability to water and
sanitation-related diseases among in-school children in Kawempe
Division of Kampala Capital City in Uganda. Through members of
school health clubs (pupils), the project reached out to fellow
pupils in school, their families and the community at large
through education and promotion of good practices in personal
hygiene and sanitation. The project also aimed at enhancing the
capacity of school and community support structures, including
Parents and Teachers Associations (PTAs), School Management
Committees (SMC) and Zone/ Village Health Team (VHT) to practice
and advocate for improved water and sanitation facilities in
schools and their respective communities.
iv

The project goal was to contribute to reduced diseases due to
poor sanitation and unsafe water in Kawempe Division of
Kampala City in Uganda. Project purpose, to strengthen the
capacity of schools in Kawempe Division to prevent water and
sanitation related diseases, Project Objectives Improved
personal hygiene and sanitation practices at school and
community levels using the PHASE and SHC Models, Improved
water infrastructure in six 06 schools in Kawempe Division,
Increased awareness and action of the community stakeholders
to promote good practices in personal hygiene, water and
sanitation in Kawempe Division, Documentation of best
practices and lessons learned from implementation of the
PHASE and SHC models in an urban environment.
METHODS
The evaluation was conducted in three (03) parishes of Kawempe
Division in Kampala City, Uganda, namely Kanyanya, Kawempe I and
Mulago II parishes where the six selected schools three (03)
government and three (03) private are located.
The target population was pupils in the primary school where the
project was being implemented, household heads in the parishes of
v

Kanyanya, Kawempe I and Mulago II. The other target population
was the head teachers/ WASH club patrons, VHTs and Local Council
leaders involved in the project implementation.
End line survey design
This end line survey was descriptive and cross sectional in
nature. It employed both quantitative and qualitative methods of
data collection.
Quantitative data mainly comprised of the knowledge, attitudes
and practices related to Water, Sanitation and Hygiene as
gathered from the respondents. The qualitative data was mainly
from key informants and focus groups discussions.
KAP Survey
A school and household KAP survey in the six target intervention
schools and parishes in Kawempe division, Kampala district was
conducted. The purpose was to assess the level of comprehensive
knowledge, attitudes and practices related to water, sanitation
and hygiene.
Sample Size
The sample size for the KAP survey was determined to enable
computation of population prevalence of knowledge, attitudes and
practices related to water, sanitation and hygiene for each of 6
parishes. It was determined therefore based on the formula for
vi

cross-sectional studies in which the primary outcome is a
proportion. The formula is: [(Z2PQ) D/δ2], where Z is the
standard normal deviate at 95% confidence, P is the estimated
proportion of the surveyed population that has comprehensive
knowledge about water, sanitation and hygiene (estimated at 50 %
based on urban slum sanitation assessment in Kikulu and Basiima
Kikooza slums survey), and δ being the desired precision (at 5%
for this survey). D is the design effect, which is estimated at
1.5, because the sampling was conducted at 2 levels before
reaching the definitive respondent: The computed sample size was
therefore 576 respondents.
Sampling procedures and selection of the respondents
A total of 576 respondents were interviewed. The total sample
size was equally distributed between the two major populations
which implied that there were 288 pupils and 288 household
respondents.
This implies that within each selected school there were 48
pupils sampled and in each school host community, there were 48
respondents.
In each primary school selected for this evaluation, respondents
(pupils) were selected randomly from P.4 – P.6. Respondents from
the host communities were randomly selected from each host
parish.
vii

Data collection procedures
Research assistants and consultant, field coordinator
administered a structured questionnaire to the household level
respondents and the pupils upon seeking consent from the
respondents for the households and teachers for the pupils.
WASH facility assessment
WASH facilities in the schools and communities were assessed.
These included water sources, water purification (Solvatten
technology), sanitary facilities, hand washing facilities and
waste disposal facilities. These were assessed using the
observational checklist.
Data collection method
Observational checklists were used to capture the current state
of the various WASH facilities. The observations were done by the
research assistants .
Process issues analysis
A wide range of issues related to the implementation of the
project were analyzed like criteria of selection of
beneficiaries, strategies and approaches used among others.
viii

Key informants interviews
A total of at least 12 key informants were interviewed in this
end line evaluation survey in both the schools and communities
including:-Head teachers (03), WASH club patrons (03), VHT
members who were part of project implementation (03), PTA/SMC
Chair person (03).
Focus Group Discussions
Four FGDs were conducted. These included 2 in school (consist of
members of the WASH clubs) and two in the community comprising of
VHT and PDCs who were involved in implementation of WASH related
project in Kawempe division.
WASH –related diseases trends analysis
A tool was designed to capture prevalence data from the HMIS
forms from the health facilities that provide health care to the
communities and pupils. The diseases whose data was captured
included:-Cholera, Dysentery, Diarrhea, Eye conditions,
Intestinal worms, Malaria, Skin diseases and Typhoid fever.
Desk document/reports/literature review
This was done to clearly bring out WASH in school context
analysis in relation to the project goal and objectives. It
further looked at:- Current statistics related to WASH (in
general and in schools),Different approaches of WASH promotion
ix

relative to the project approaches ,Factors influencing School
WASH promotion among others.
Data collection tools
Data was collected using semi structured tools that were
developed in consultation with AMREF. These were similar with the
tools that were used at the baseline survey with only relevant
adjustments. These tools include: KAP respondents’ questionnaire,
Key informants discussion guide (Specific to specific
categories), Focus group discussion guide (pupils and Community),
Observational checklist, Desk review guide.
Data Management
For the KAP survey, data entry interfaces were created using Epi-
data Version 3.2 and exported to SPSS version 17 for analysis.
Data was entered by 2 data entry clerks, after which it was
cleaned. A simple analysis of frequencies to derive key target
output indicators was conducted. Using the frequencies generated
the tables, graphs and pie charts were generated. Cross
tabulation was also done and the data was presented in tabular
format. Analysis for any significant relationships between
utilization of the water and sanitation facilities and the
independent variables such socio demographic characteristic of
the respondents, type of water source, and type of sanitary
facility was done. Qualitative data captured from the Key
informants and observational checklists and group discussions was
x
analyzed and incorporated into the report. This data was
thematically arranged in a master sheet in line with the specific
objectives. The qualitative data mostly backed up the
quantitative findings.
Results
The results showed a big decrease in the prevalence of all the
diseases related to WASH in Kawempe and Malaria was the commonest
disease 78.2% followed by cough 33.4% as compared to malaria and
diarrhea by 7.9% and 0.4% respectively at baseline.
A total of 259 pupils were involved in the endline survey
compared to 227 at baseline from the six schools where the SBC
project was implemented. 42.5% of the pupils were from Primary
xi

six, considering the fact that these pupils would be able to
articulate issues and respond to the questions accordingly. This
number was also representative and adequate to allow for
generalization of generated proportions, trends and
distributions.
61.4% of the pupils were females, 56.8% in the age bracket of 11
- 13 years. Majority 73.7% were Baganda. Over a quarter of the
pupils 27.8% were Muslim. Almost equal proportions of the pupils
49.4% and 40.0% said their parents owned and rented the houses
they lived in respectively. A small proportion 16.2% of the
pupils said they stayed in single roomed houses.
Most pupils 89.9% (up from 83.3% at baseline) from all the six
schools mentioned their schools got water from taps. There was a
decrease in the percentage of pupils who said they got water from
boreholes (from 7.9% at baseline to 6.9% at endline) and well
(from 21.6% at baseline to 12.4% at endline). There was an
increase in the percentage of children who said they got their
water from Rain Water Harvesting Tanks (RWHTs) (from 21.6% at
baseline to 46.3% at endline). The increase in the use of RWHTs
was attributed to the provision of RWHTs in these schools by
AMREF.
It was clear that tap stands was the main water source mentioned
by most pupils in the six schools followed by springs and RWHTs.
xii

Compared with the baseline, increase in tap stand use was
observed in Good Times Infant P/S (83% to 93%), Uganda Martyrs
P/S (67.3% to 89.8%), and Kawempe COU P/S (76.5% to 91.9%). There
was a decrease in the number of pupils who said they got water
from wells significantly from Uganda Martyrs P/S (14.3% to 0%),
St. Charles Lwanga P/S (80.6% to 12.4%), St. Martin Mulago P/S
(11.8% to 0%), and Kawempe COU P/S (35.6% to 2.6%). However there
was an increase in use of wells in Good Times Infant P/S (0% to
4.7%), and Kawempe Mbogo Muslim P/S (14.7% to 51%). Kawempe Mbogo
Muslim P/S also had reduced used of RWHTs (24.5% to 18.4%). This
is an indication that despite the intervention, Kawempe Mbogo
Muslim P/S still had a lot of challenges with regard to provision
of safe water. In the other five primary schools, there was
increased use of RWHTs as a water source mainly attributed to the
provision of the RWHTs.
Of all the pupils involved in the end line evaluation, 87.3%
(226/259) said they drunk water at school during school hours
while only 12.7% (33/259) said they never took water at school.
Over half of the pupils (56.2%) from the six schools mentioned
Solvattens as the source of drinking water. There was a
significant decrease in the number of pupils who said they got
their drinking water from the tank (from 25.6% at baseline to
6.2%) and carrying from home (from 25.6% at baseline to 3.1%). In
Kawempe COU P/S, none of the pupils mentioned Solvatten as a
xiii

source of drinking water which could suggest that this school was
not provided with this technology.
It was established that the drinking water was stored in jerry
cans. These jerry cans were provided by AMREF to the schools
alongside the Solvatten units. Two 60 litre jerry cans with
covers were provided in each school for drinking water storage
after boiling using the Solvatten units. In terms of adequacy,
the storage facilities were noted to be inadequate considering
high school populations.
Almost all the children mentioned that they used a cup to draw
water from the jerry can where the water was stored. It was
highlighted from the KIIs that AMREF provided cups (about 60 to
each school) for the children to use for drinking water. The
pupils were guided by the person in charge of the Solvatten
technology to pour water in the cup and drink then return the
cup. This implies that after 60 pupils have taken water in these
cups, they are supposed to be washed and dried before use by the
next 60 pupils.
Over two thirds of the pupils (67.3%) said they stored their
drinking water in Jerry cans at home compared to 60.4% at
baseline. There was also a reduction in the percentage of pupils
who said they stored their drinking water in pots (from 31.7% to
xiv

26.8%). This is an indication if increased water safety as a
result of better storage.
Majority of the storage facilities (95.6%) at endline were
covered compared to 86.8% at baseline. Covering of water storage
facilities is important in reducing the risk of contamination
after boiling. This increase in the proportion of children who
said their water storage facilities were covered is an indication
of increased water safety at household level.
Over two thirds of the pupils (71%) said they sometimes took
unboiled water down from 85.9% at baseline. The greatest
improvement was seen in Kawempe COU P/S (from 100% to 64.7%),
Good Times Infant P/S (from 91.5% to 67.4%), St. Martin Mulago PS
(from 88.2% to 79.2%), and Uganda Martyrs P/S (from 95.9% to
63.3%). Sensitization in these schools targeted promotion of safe
water consumption
Majority of the households got water from tap water systems
thought the percentage of the pupils who mentioned it dropped by
4 points (from 74%). On the other hand, there was an increase in
the proportion of pupils who mentioned the other sources of water
like springs (+1.1%), and RWHTs (+1.8%). Continuous emphasis on
the need to use clean water for all household activities should
be made as it reduces the risk of contracting poor WASH related
illnesses.
xv
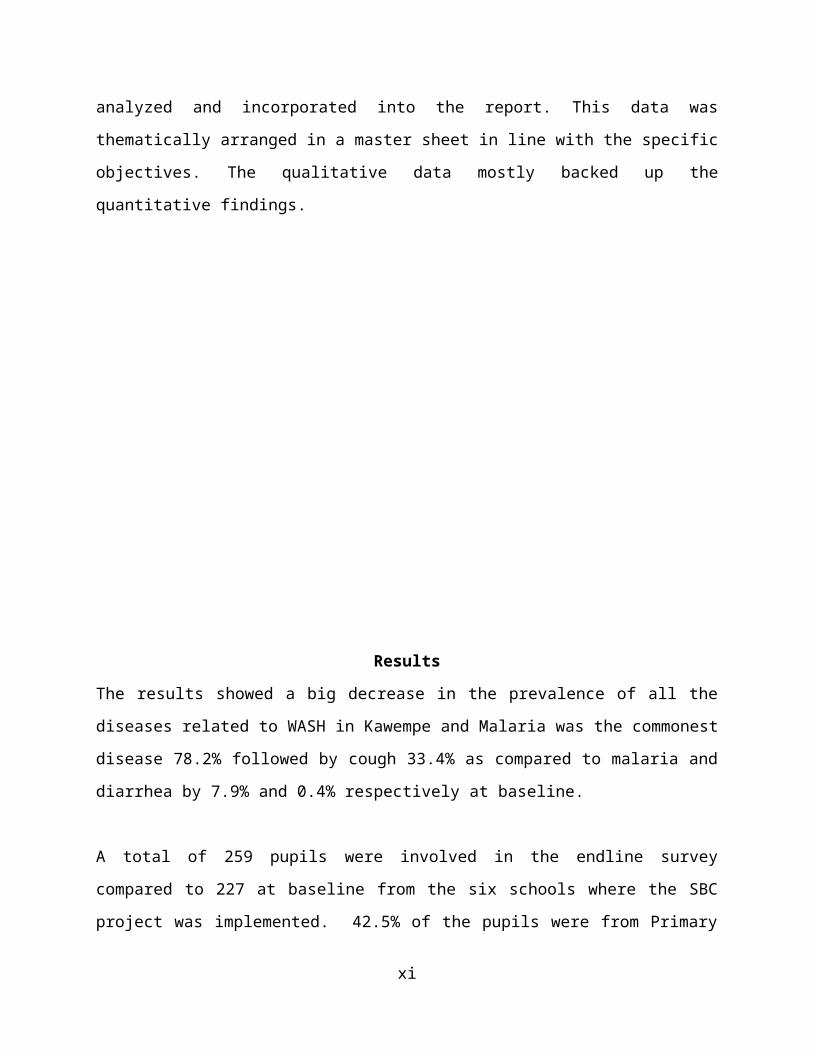
4/6 primary school still had pupil stance ratios above the
recommended 40:1 though margins of variation are generally lower.
Some of the changes in variation are due to addition of sanitary
facilities like in St. Martin Mulago P/S and Uganda Martyrs P/S.
However for others like in Kawempe CoU P/S, the changes may be
attributed to changes in pupils’ population since there was no
new facility provided.
Almost all the pupils (99.2%) said they had latrines at home.
Only two pupils (1 from Good Times Infant P/S and 1 from St.
Charles Lwanga P/S) said they never had latrines in their homes.
Both of them said they used their neighbors’ latrine.
More than half of the pupils (54.3%) said they used Ordinary pit
latrines while 40.3% said VIP latrines and only 5.4% said flush
toilets. this is a reflection of the affordability of the
ordinary pit latrines as compared to the VIP and Flush toilets.
Over half of the pupils (53.1%) said their households shared the
latrine they used with their neighbors, a higher proportion than
that registered at baseline (44.1%). This therefore implies that
while sensitizing the communities on issues of hygiene and
sanitation, the whole community should be involved otherwise a
failure in one household to maintain good hygiene and sanitation
may cost other household which share the same facility.
xvi

In the six schools, two movable hand washing facilities were
provided under this AMREF project, one for boys and the other for
girls. In the health talks by the health clubs, hand washing was
highly emphasized though there still some challenges with the
pupils fully taking up the practice of hand washing.
(82.5%) of pupils said they disposed of rubbish in rubbish pits
while 16.7% said they disposed of rubbish in dustbins. This is
not far from the baseline data that showed that 81.3% and 17.4%
disposed of their rubbish in rubbish pits and dustbins
respectively. This suggests that no intervention was directly
linked to waste management in schools.
98.8% (256/259) said they knew the importance of washing hands.
This is only +0.6% from the baseline findings an indication that
the level of awareness among the pupils about the importance of
hand washing was and is high.
Cholera (87.3%), diarrhea (75.7%) and typhoid (52.1%) were the
most known WASH related mentioned by the pupils. Compared to the
baseline data, there are changes in the proportion of pupil who
mentioned cholera (+5.4%), diarrhea (+1.7%), and typhoid (-4.7%).
The average level of awareness for the three commonly known WASH
related diseases (cholera, diarrhea, and typhoid) was 71.7%
compared to 70.9% at baseline. This is a simple measure of
comprehensive knowledge which shows a slight increase.
xvii

The anal cleansing materials used by the pupils at school biggest
proportion of the pupils (66.7%) mentioned that they used toilet
paper this is a significant increment from 53.7% at baseline.
However, toilet paper use in Uganda Martyrs P/S was still very
low (38.3%) with a simple majority of the pupils, 40.4% using
papers from books. This therefore calls for more provision of
toilet paper.
91.6% at baseline said they wash hands after visiting the
latrine. This is a great improvement that is mainly attributed to
the rigorous sensitization and facility provision in these
schools under the AMREF project.
Less than half 45.6%, the pupils down from 52.1% at baseline said
they had fallen sick and missed school in the past term. Malaria
was the commonest illness responsible for pupils’ absenteeism.
Compared with the baseline findings, there was a reduction in the
proportion of pupils who mentioned malaria and diarrhea by 7.9%
and 0.4% respectively.
Over two thirds of the pupils 67.2% of pupils up from 56.2% at
baseline said they talked to their parents and other people at
home about hygiene and sanitation issues they learnt as school.
There was a general increase in the proportion of the pupils who
xviii

said they talked to their parents about hygiene and sanitation
from Good Times Infant P/S, St. Martin Mulago P/S and Kawempe COU
P/S. on the other hand, there was a decrease in the proportions
from Uganda Martyrs P/S and St. Charles Lwanga P/S though the
proportions remained high (above 50%). However just like at
baseline, the proportion of the pupils who talked to their
parents and other people at home remained significantly low in
Kawempe Mbogo Muslim P/S. Children talking to their parents and
other people in their homes about hygiene and sanitation issues
is a form of knowledge diffusion and one of the ways children can
act as change agents.
There was low pupils’ membership in health clubs in Kawempe COU
P/S, Kawempe Mbogo Muslim P/S, and Good Times Infant P/S. On the
other hand, the was high pupil’s membership in Uganda Martyrs
P/S, St. Martin Mulago P/S, and St. Charles Lwanga P/S which
suggested that these clubs were highly promoted among the pupils.
A total of 288 households were involved in this SBC baseline
survey from Kawempe division and their distribution by parish,
these were selected on the basis of the number of schools hosted
by the parish. For example, Kawempe I hosted two schools while
Mulago II hosted only one school.
67.7% of the respondents were females; over two thirds of the
respondents (68.1%) were married. Majority, (64.9%) of the
xix

respondents was Christians while 34.4% were Muslims. Only 3.1% of
the respondents mentioned they had no education. Over a quarter
of the respondents (28.7%) mentioned they had lived in the
village for over five years.
81.9% of the household heads (HH) were male adult. Majority of
the HHs were Christians (67.1%) while 32.4% were Muslims. Only
6.1% of the HHs had no education. Piped water (82.3%) followed
by protected spring (12.5%). These findings indicate an increase
(by 12.6%) of the proportion of households getting water from the
piped water system from the baseline survey with not of the
respondents citing unprotected well as at baseline. Protected
springs were only cited in Kanyanya and Kawempe I parishes.
Compared with the baseline data, there was an increase in the
proportion of households that got water from piped water system
(Kanyanya +8%, Kawempe I +2.6%, and Mulago II +29.1%); this
represents a significant shift to a safer water source option
within the community. With regard to the safety of the water
sources, it was noted that the tap water source was generally
safe as the water had chlorine smell, an indication it was
treated before distribution to the communities by the National
Water and sewerage cooperation.
Over 90% of the households (91.3%) said that they used 5 jerry
cans or less of water in a day. However compared with baseline
data, there was an increase in the proportion of households that
xx

said they used more than five jerry cans of water in a day(from
7% at baseline to 8.7% at endline survey), suggesting an increase
in general household water consumption which would create more
need for water that may lead to increased demand.
Almost all the respondents (94.8%) said that they paid for water
they used in their homes. The as is this expected as most of the
respondents as noted early got their water from tap water systems
that must be paid for. Majority of the respondents (82.1%) said
they paid 200/=. Compared with the baseline data where only 25%
of the respondents then said they paid 200/= for a 20L jerry can
of water, it is clear that there cost of water has become higher.
This is more reason that the communities need to be sensitized on
ways of avoiding water wastage alongside the safe water chain.
Female spouses (mothers) were the ones who used most water in the
household followed by female children. This is again anticipated
as they are the ones who are usually responsible for household
activities like cooking; cleaning and washing that require water.
Compared with baseline findings, the proportion of those who
mentioned female spouse and males spouse had increased (13.1% and
6.6% respectively). Whereas this may suggest increased male
involvement in households WASH related activities, it is
inconclusive.
xxi

About a third of the respondents (33.1%) said both male and
female children were responsible for collection of water in their
households. This therefore implies that the children are the ones
who get more in contact with the water at the water source. This
is almost similar to the baseline survey findings with only a 1%
increment. Over a third of the respondents (34.5%) said female
spouses were responsible for collection of water in their
households compared to the 29.6% at baseline.
Almost two thirds of the respondents (65.3%) said they got their
drinking water from the tap water system, representing a 1.2%
increase from the baseline finding. However, there was a
significant decrease in the proportion of respondents who said
they got their drinking water from household taps.
98.3% (283/288) said they boiled their drinking water while the
rest said they treated chemically with water guard. Since none
of the respondents said they did nothing as was noted by three
respondents at baseline survey. Majority of the household’s
stored their drinking water in plastic jerry cans with covers
91.6% up from 70.4% at baseline survey. There was a decrease in
the proportion of the respondents who mentioned pots and plastic
jerry cans without covers.
Almost two thirds of the respondents (63.6%) said they cleaned
their drinking water storage facility at least twice a week,
xxii

there was an improvement in the methods of cleaning the different
drinking water storage facilities compared to the baseline
findings in that there was more scrubbing and rinsing without
soap.
34.5% of the respondents down from 37.7% at baseline survey said
they disposed their wastewater in drainage channels while only
0.3% dispose their waste water in soak pits. The percentage of
respodents who disposed off their waste water on the road
increased by 5%.
There was a reduction in the proportion of the respondents who
said they poured wastewater on the road in Kanyanya parish while
similar proportions in Kawempe I and Mulago II parishes. Also
there were no soak pits mentioned in Kanyanya and Kawempe I
parishes. The biggest proportion of the respondents (83.3%) used
bathrooms that were located outside the house where they slept.
This is slightly higher than the proportion at baseline survey.
There was no respondent who said their household lacks a bathroom
compared to the 2.1% at baseline survey. For households that said
they had outside bathrooms thus share, over half of the
respondents (53.3%) mentioned children as the ones who took care
of the solid waste disposal in the households.
It is clear that households in Kanyanya parish pay for refuse
collection while a few and none of the households in Kawempe I
xxiii

and Mulago II parishes paid for their solid waste collection and
disposal. This indicates that in Kanyanya there was more private
sector involvement in solid waste collection and disposal while
in Mulago it was purely KCCA.
Majority of the respondents in Kanyanya parish who paid said they
paid less than 1000/= per week for solid waste collection and
disposal while majority of these respondents said they paid more
than 1000/= per week for solid waste collection and disposal from
their homes. This may explain why a smaller proportion of
respondents (15.9%) in Kawempe I parish said they paid for solid
waste collection and disposal compared to the 53.7% from Kanyanya
parish. Half of the respondents (50%) mentioned they dispose
their rubbish at least once every week. This is lower though not
far from the baseline’s 52.7%. However in Mulago II parish, 58.3%
said they disposed of their rubbish every two weeks compared to
the 43.4% and 38.6% in Kanyanya and Kawempe I parish
respectively.
Almost all the respondents (95.1%) said they shared sanitary
facilities with other household. Over half of the respondents in
Kanyanya and Kawempe I parishes share sanitary facilities with 1
– 5 households while over half of respondents from Mulago II
parish shared with more than five households. These are similar
proportion to those seen at baseline survey, an indication that
there had been no improvements over the past one year.
xxiv

Almost all respondents (99.3%) compared to 96.5% at baseline said
they washed their hands after visiting a sanitary facility while
only two respondents (one from Kawempe I and one from Mulago II)
said they did not wash their hands after using a latrine. further
still, 98.6% noted that they washed hands every time they visited
a latrine. compared with baseline survey findings, there was an
increase in the proportions that said they washed their hands
every time they visited a latrine.
Less than half of the respondents 49.3% (Kanyanya 47.4%, Kawempe
I 52.4% and Mulago II 43.8%) said that they had at least one
child in their household studying in a primary school. Of all
the respondents who mentioned that they had at least a child
studying in a primary school, over two thirds, 71.8% said their
children missed school because of some illnesses. This is higher
than the findings at baseline survey where 66.7% of the
respondents who had at least a child in a primary school
indicated that the children had missed school because of some
illness.
Most of the respondents (73.6%) got their treatment from private
clincs while less than a third (26.4%%) got their treatment from
government health centre. Compared with baseline findings, the
proportion of the respondents who sought medical treatment from
private clinics increased from 64.5%.
xxv

More than half of the respondents 51.7% and 52.1% from Kawempe I
and Mulago II respectively said that children talked to their
parents about WASH compared to the 38.9% from Kanyanya parish.
Discussion
The results showed a big decrease in the prevalence of all the
diseases related to WASH in Kawempe and Malaria was the commonest
disease 78.2% followed by cough 33.4% as compared to malaria and
diarrhea by 7.9% and 0.4% respectively at baseline. This was
attributed to increased hygiene education within schools and the
community by several stakeholders in both the private and public
sectors. Cholera (87.3%), diarrhea (75.7%) and typhoid (52.1%)
were the most known WASH related mentioned by the pupils.
xxvi

Compared to the baseline data, there are changes in the
proportion of pupil who mentioned cholera (+5.4%), diarrhea
(+1.7%), and typhoid (-4.7%). The average level of awareness for
the three commonly known WASH related diseases (cholera,
diarrhea, and typhoid) was 71.7% compared to 70.9% at baseline.
Most pupils from all the six schools mentioned their schools got
water from taps. There was a decrease in the percentage of pupils
who said they got water from boreholes and wells also there was
an increase in the percentage of children who said they got their
water from Rain Water Harvesting Tanks (RWHTs) and the use of
RWHTs was attributed to the provision of RWHTs in these schools
by AMREF. It was clear that tap stands was the main water source
mentioned by most pupils in the six schools followed by springs
and RWHTs.
4/6 primary school still had pupil stance ratios above the
recommended 40:1 though margins of variation are generally lower.
Some of the changes in variation are due to addition of sanitary
facilities; the changes may be attributed to changes in pupils’
population since there was no new facility provided. More than
half of the pupils (54.3%) said they used Ordinary pit latrines
while 40.3% said VIP latrines and only 5.4% said flush toilets.
this is a reflection of the affordability of the ordinary pit
latrines as compared to the VIP and Flush toilets.
xxvii

In the six schools, two movable hand washing facilities were
provided under this AMREF project, one for boys and the other for
girls. In the health talks by the health clubs, hand washing was
highly emphasized though there still some challenges with the
pupils fully taking up the practice of hand washing. 98.8%
(256/259) said they knew the importance of washing hands. This is
only +0.6% from the baseline findings an indication that the
level of awareness among the pupils about the importance of hand
washing was and is high. Less than half 45.6%, the pupils down
from 52.1% at baseline said they had fallen sick and missed
school in the past term.
Over two thirds of the pupils 67.2% of pupils up from 56.2% at
baseline said they talked to their parents and other people at
home about hygiene and sanitation issues they learnt as school.
Children talking to their parents and other people in their homes
about hygiene and sanitation issues are a form of knowledge
diffusion and one of the ways children can act as change agents.
Over 90% of the households (91.3%) said that they used 5 jerry
cans or less of water in a day. However compared with baseline
data, there was an increase in the proportion of households that
said they used more than five jerry cans of water in a day(from
7% at baseline to 8.7% at endline survey), suggesting an increase
in general household water consumption which would create more
need for water that may lead to increased demand.Almost all the
xxviii

respondents (94.8%) said that they paid for water they used in
their homes. Majority of the respondents (82.1%) said they paid
200/=. Compared with the baseline data where only 25% of the
respondents then said they paid 200/= for a 20L jerry can of
water, it is clear that there cost of water has become higher.
This is more reason that the communities need to be sensitized on
ways of avoiding water wastage alongside the safe water chain.
98.3% (283/288) said they boiled their drinking water while the
rest said they treated chemically with water guard. Since none
of the respondents said they did nothing as was noted by three
respondents at baseline survey. This also indicates that there
is a remarkable level of awareness about the dangers associated
with consumption of unsafe water.
34.5% of the respondents down from 37.7% at baseline survey said
they disposed their wastewater in drainage channels while only
0.3% dispose their waste water in soak pits. The percentage of
respodents who disposed off their waste water on the road
increased by 5%. This indicated that over the past one year,
there has not been any iprovement in waste water management
practices at community level.
Half of the respondents (50%) mentioned they dispose their
rubbish at least once every week. This is lower though not far
from the baseline’s 52.7%. However in Mulago II parish, 58.3%
xxix

said they disposed of their rubbish every two weeks compared to
the 43.4% and 38.6% in Kanyanya and Kawempe I parish
respectively. This discrepancy presents a clear difference
between places where there is private sector involvement and
where it is lacking.
Almost all the respondents (95.1%) said they shared sanitary
facilities with other household. Over half of the respondents in
Kanyanya and Kawempe I parishes share sanitary facilities with 1
– 5 households while over half of respondents from Mulago II
parish shared with more than five households. These are similar
proportion to those seen at baseline survey, an indication that
there had been no improvements over the past one year.
Most of the respondents (73.6%) got their treatment from private
clincs while less than a third (26.4%%) got their treatment from
government health centre. Compared with baseline findings, the
proportion of the respondents who sought medical treatment from
private clinics increased from 64.5%. This presents a challenge
of under reporting prevalence of such diseases since data from
small clinics is not captured in the HMIS forms that are filled
in by Goernment Health Facilities and big private health
facilties.
xxx

CONCLUSIONS
Poor WASH related disease prevalence and trends in Kawempe
division
In line with the project goal of reducing the prevalence of
WASH related diseases, there was a decrease in the
prevalence of the all the diseases related to WASH in
Kawempe division from 2010/2011 and 2011/2012 as reflected
in the finding. However this decrease cannot be solely
attributed to only this project as the project
implementation period was very short and targeted mainly the
primary schools rather than the communities.
Water sources, safety and the current water infrastructure.
There was increased water access/provision as a result of
construction of a RWHT in each school thus 6 RWHTs in the
six schools.
There is increased access and consumption of safe drinking
water as a result of AMREF’s distribution of 10 Solvatten
water purification containers in each school, drinking water
storage facilities and drinking cups. However these are
still inadequate. The increased consumption of consumption
of safe water is also attributed to the continuous health
education by the SHCs.
Proportion of sanitation facilities (hand-washing stations, dish
drying racks, rubbish pits)
xxxi

There was a significant reduction in pupil-stance ratios in
5/6 schools much as there was no provision of sanitary
facilities under the AMREF project. This is attributed to
the other School WASH stakeholders who provided sanitary
facilities in some schools in this same period. Despite this
decrease in the pupil-stance ratios, sanitary facilities are
still inadequate in most schools as they still had high
pupils-stance ratios above the recommended 40:1 ratio.
Nature and extent of proper waste (solid and liquid) disposal
practices
There was general improvement in cleanliness of the schools.
This is mainly attributed to the good leadership of the SHCs
in the different schools. Other stakeholder intervention
like KCCA’s provision of rubbish collection containers in
some schools contributed to the improved management of solid
waste in the schools.
Awareness levels of schools in matters of hygiene, water and
sanitation
Pupils’ level of awareness of matters related to WASH was
very high mainly due to the health education and
sensitization interventions by the SHCs.
Behavior patterns regarding water habits, proper personal hygiene
and sanitation.
There was increased hand washing practices that is
attributed to AMREF’s provision of HWFs to the schools.
xxxii

There was increased school provision of water and soap to
promote hand washing after latrine use. This is also
attributed to the continuous health education and
sensitization by SHCs
There was increased provision of anal cleansing materials
much as sustainability is still a challenge
There was increased pupils’ sharing of WASH issues learnt a
school with family members. This is an indication that
indeed children can be targeted as change agents within
their homes and the community.
Water sources, safety and the current water infrastructure.
Piped water was still the main source of water in the
community followed by protected spring
There was reduced consumption of water from unsafe water
sourced like unprotected springs.
Water consumption at HH level was high since more than two
thirds of respondents said they used more than 3 jerry cans
of water in a day.
Proportion of sanitation facilities
Shared ordinary pit latrines were the most commonly used
type of sanitary facility in the community.
Behavior patterns regarding water habits, proper personal hygiene
and sanitation
xxxiii

Boiling water is highly embraced in the community. This is
attributed to sensitization of communities about WASH
related issues by HAs
Prevalence of poor WASH related diseases in selected parishes
Malaria was still the commonest disease affecting the
community followed by cough.
Households took their children for treatment at a health
facility when they fell sick and private clinics were
preferred over government facilities.
Acknowledgments
AMREF Uganda is greatly indebted to all the people who made this
paper a success and the almighty God for giving them life and
courage to complete this piece of work.
Competing interests
The authors declare no competing interests.
Authors’ contributions
All the authors have contributed to this manuscript in ways that
comply to the ICMJE authorship criteria. All the authors have
read and approved the final version of the manuscript.
References
xxxiv

1. Government of Uganda: National Development Plan
2010/2011 – 2014/2015
2. UNICEF (2010) Raising Clean Hands, Advancing
Learning, Health and Participation Through WASH in
Schools. Joint Call to Action 2010. Contributed to
by CARE, Dubai Cares, Emory University Center for
Global Safe Water, IRC International Water and
Sanitation Centre, Save the Children, UNICEF, Water
Advocate, Water AID, Water for People, WHO.
xxxv

3. Figure 3.1: Trends in number of cases registered in Public health facilities
from January - December 2011
Figure 3.2: Trends in number of cases registered in Public health facilities from
December 2011 – November 2012
xxxvi

Table 3.4: Distribution of respondents from the six schools
School Name Class of pupil Total
Freq(%age)P. 4 P 5 P 6
Good Times Infant P/S 16(6.2%) 13(5.0%) 14(5.4%) 43(16.6%)
Kawempe Mbogo Muslim
P/S
8(3.1%) 17(6.6%) 24(9.3%) 49(18.9%)
Uganda Martyrs P/S 14(5.4%) 13(5.0%) 22(8.5%) 49(18.9%)
St. Charles Lwanga P/S 15(5.8%) 7(2.7%) 10(3.9%) 32(12.4%)
St. Martin Mulago 12(4.6%) 11(4.2%) 25(9.7%) 48(18.5%)
Kawempe COU P/S 10(3.9%) 13(5.0%) 15(5.8%) 38(14.7%)
Total 75(29.0%
)
74(28.6%
)
110(42.5%) 259(100.0%)
Table 3.22: Pupils using what they learnt about Hygiene and
Sanitation
Pupil using what they learnt
at school
Total
Name of the school Yes NoGood Times Infant P/S 33(100.0%) 0(0.0%) 33(100.0%)Kawempe Mbogo Muslim
P/S
48(100.0%) 0(0.0%) 48(100.0%)
Uganda Martyrs P/S 46(97.9%) 1(2.1%) 47(100.0%)St. Charles Lwanga P/S 32(100.0%) 0(0.0%) 32(100.0%)St. Martin Mulago P/S 46(97.9%) 1(2.1%) 47(100.0%)Kawempe CoU P/S 35(97.2%) 1(2.8%) 36(100.0%)Total 240(98.8%) 3(1.2%) 243(100.0%)
xxxvii

Table 3.7: Sources of drinking water in different schools
Source of
drinking
water
Name of school TotalGood
Times
Infant
P/S
Kawempe
Mbogo
Muslim
P/S
Uganda
Martyrs
P/S
St.
Charles
Lwanga
P/S
St.
Martin
Mulago
P/S
Kawempe
COU P/S
Rain water
tank
3(7.0%) 0(0.0%) 9(23.7%
)
0(0.0%) 2(4.9%) 0(0.0%) 14(6.2%)
Carry from
home
0(0.0%) 0(0.0%) 1(2.6%) 0(0.0%) 3(7.3%) 3(12.5%
)
7(3.1%)
Tap 0(0.0%) 0(0.0%) 1(2.6%) 0(0.0%) 2(4.9%) 2(8.3%) 5(2.2%)Well 0(0.0%) 0(0.0%) 0(0.0%) 0(0.0%) 0(0.0%) 4(16.7%
)
4(1.8%)
Solvatten 39(90.7
%)
49100%) 25(65.8
%)
3(9.7%) 11(26.8
%)
0(0.0%) 127(56.2
%)Teacher 0(0.0%) 0(0.0%) 2(5.3%) 1(3.2%) 10(24.4
%)
12(50.0
%)
25(11.1%
)Others(buy) 0(0.0%) 0(0.0%) 0(0.0%) 27(87.1
%)
12(29.3
%)
3(12.5%
)
42(18.6%
)Total 43(100% 49(100% 38(100% 31(100% 41(100% 24(100% 226(100%
xxxviii

) ) ) ) ) ) )
Table 3.8: Boiling drinking water at home
Name of school Boiling drinking water TotalBoil Do not boil
Good Times Infant P/S 42(97.7%) 1(2.3%) 43(100.0%)Kawempe Mbogo Muslim P/S 48(98.0%) 1(2.0%) 49(100.0%)Uganda Martyrs P/S 49(100.0%) 0(0.0%) 49(100.0%)St. Charles Lwanga P/S 31(96.9%) 1(3.1%) 32(100.0%)St. Martin Mulago 47(97.9%) 1(2.1%) 48(100.0%)Kawempe COU P/S 35(94.6%) 2(5.4%) 37(100.0%)Total 252(97.7%) 6(2.3%) 258(100.0%)
Table 3.9: Drinking water storage facilities at home
Name of school Drinking water storage facility Total Pot Jerry
can
Bucke
t
Plasti
c
Bottle
Jug Others
4(9.3%) 34(79.1%
)
0(0.0
%)
0(0.0%
)
5(11.6
%)
0(0.0%
)
43(100%
)Kawempe Mbogo
Muslim P/S
8(16.3%
)
40(81.6%
)
1(2.0
%)
0(0.0%
)
0(0.0%
)
0(0.0%
)
49(100%
)Uganda Martyrs
P/S
14(28.6
%)
33(67.3%
)
0(0.0
%)
0(0.0%
)
1(2.0%
)
1(2.0%
)
49(100%
)St. Charles
Lwanga P/S
12(37.5
%)
20(62.5%
)
0(0.0
%)
0(0.0%
)
0(0.0%
)
0(0.0%
)
32(100%
)
xxxix

St. Martin
Mulago P/S
4(8.3%) 38(79.2%
)
4(8.3
%)
1(2.1%
)
1(2.1%
)
0(0.0%
)
48(100%
)Kawempe COU P/S 27(75.0
%)
8(22.2%) 1(2.8
%)
0(0.0%
)
0(0.0%
)
0(0.0%
)
36(100%
)Total 69(26.8
%)
173(67.3
%)
6(2.3
%)
1(0.4%
)
7(2.7%
)
1(0.4%
)
257(100
%)
Table 3.10: Presence of covers on drinking water storage facilities
Drinking
water
storage
facility
Water container having
cover
Total
Had cover No cover
Pot 63(98.4%) 1(1.6%) 64(100.0%)Jerry can 163(94.2%) 10(5.8%) 173(100.0%)Bucket 6(100.0%) 0(0.0%) 6(100.0%)Plastic
Bottle
1(100.0%) 0(0.0%) 1(100.0%)
Jug 7(100.0%) 0(0.0%) 7(100.0%)Others 1(100.0%) 0(0.0%) 1(100.0%)Total 241(95.6%) 11(4.4%) 252(100.0%)
Figure 3.5: Sources of water for households use (bathing and
cleaning)
xl

Table 3.11: Observations of the sanitary facilities in the six schools Primary School Type of
latrine
Number of
stances
Comments
Boys GirlsUganda Martyrs P/S Ventilate
d
Improved
Pit
Latrine
8 7 The sanitary facilities were
clean
Hand washing facilities were
available containing water
mixed with liquid soapSt. Charles Lwanga
P/S
Ordinary
Pit
Latrine
4 4 Latrines were clean and dry,
toilet paper was available,
hand washing facility was
stationed near the latrineGood Times Infant
P/S
Ventilate
d
Improved
Pit
Latrine
2 4 Wet with urine, there was hand
washing facility near the
latrine containing water mixed
with liquid soap for hand
washing St. Martin Mulago
P/S
Ventilate
d
Improved
Pit
6 9 Latrines were clean but
smelling, empty hand washing
facility was available, the
latrines are extremely smelly
xli

LatrineKawempe COU P/S Ventilate
d
Improved
Pit
Latrine
6 7 Both boys and girls latrine
blocks were smelly with minimal
soiling
Construction of new latrines
was underwayKawempe Mbogo Muslim
P/S
Ventilate
d
Improved
Pit
Latrine
8 8 Latrine generally in better
state than at baseline.
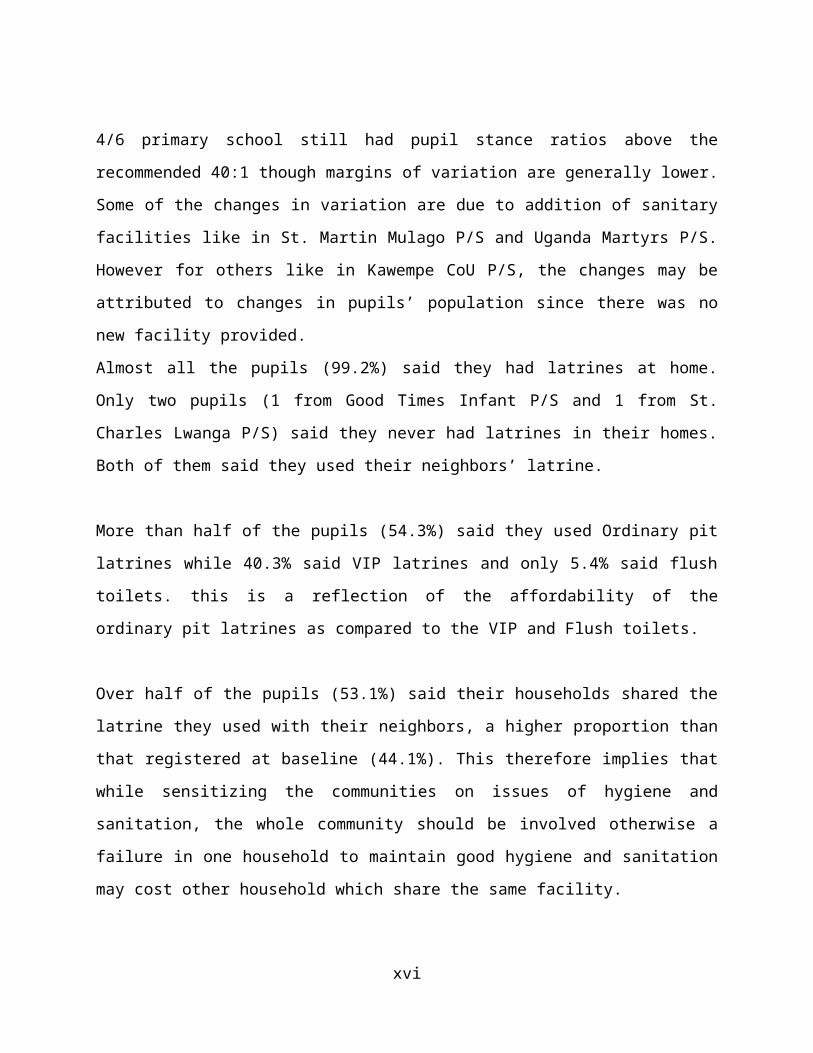
Table 3.12: Pupil stance ratio in the six Schools Primary
School
Type of
latrine
Number of
stances
Enrolment 2012 Stance ratio Change
Boys Girl
s
Boys Girl
s
Tota
l
Boys Girl
s
Tota
l
(End
line
)
Tota
l
(Bas
elin
e)
Uganda
Martyrs
P/S
Ventila
ted
Improve
d Pit
Latrine
8 7 343 387 730 42.9 55.
3
48.7 +8.
6
+50.3
St.
Charles
Lwanga
P/S
ordinar
y Pit
Latrine
4 4 90 210 300 22.5 52.5 37.5 -2.3 +1.3
Good
Times
Ventila
ted
2 4 188 207 395 94 51.8 65.8 +25.
7
+34.3
xlii
Infant
P/S
Improve
d Pit
LatrineSt.
Martin
Mulago
P/S
Ventila
ted
Improve
d Pit
Latrine
6 9 471 545 1016 78.5 60.5 67.7 +27.
7
+27.2
Kawempe
COU P/S
Ventila
ted
Improve
d Pit
Latrine
6 7 380 320 700 63.3 45.7 53.8 +13.
8
+18.2
Kawempe
Mbogo
Muslim
P/S
Ventila
ted
Improve
d Pit
Latrine
8 8 328 299 627 41 37.4 39.2 -0.8 +3.8
xliii