text mining dedicated to technical translation - ACL Anthology
Upload
independentCategory
view
1download
0
Papers
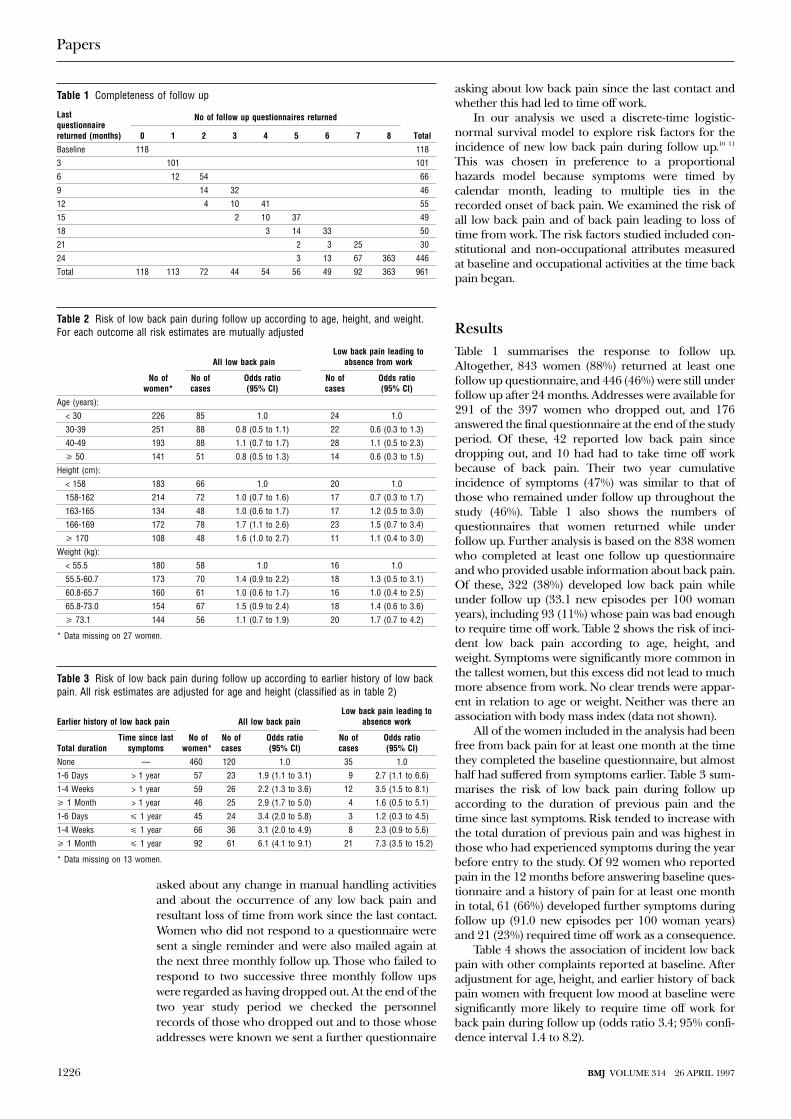
Prospective cohort study of predictors of incident lowback pain in nursesJulia Smedley, Peter Egger, Cyrus Cooper, David Coggon
AbstractObjective: To assess the impact of handling patientsand indicators of individual susceptibility on risk oflow back pain in nurses.Design: Prospective cohort study with follow up byrepeated self administered questionnaires every threemonths over two years.Setting: NHS university hospitals trust.Subjects: 961 female nurses who had been free fromlow back pain for at least one month at the time ofcompleting a baseline questionnaire.Main outcome measures: Incidence of new low backpain during follow up and of pain leading to absencefrom work.Results: Of 838 women who provided data suitablefor analysis, 322 (38%) developed low back painduring follow up (mean 18.6 months), including 93(11%) whose pain led to absence from work. Thestrongest predictor of new low back pain was earlierhistory of the symptom, and risk was particularly highif previous pain had lasted for over a month in totaland had occurred within the 12 months before entryto the study (incidence during follow up 66%).Frequent low mood at baseline was stronglyassociated with subsequent absence from work forback pain (odds ratio 3.4; 95% confidence interval 1.4to 8.2). After adjustment for earlier history of backpain and other potential confounders, risk was higherin nurses who reported frequent manual transfer ofpatients between bed and chair, manual repositioningof patients on the bed, and lifting patients in or out ofthe bath with a hoist.Conclusions: Of the indicators of individualsusceptibility that were examined, only history of backtrouble was sufficiently predictive to justify selectiveexclusion of some applicants for nursing posts. Themain route to prevention of back disorders amongnurses is likely to lie in improved ergonomics.
IntroductionLow back pain is common in the general population,affecting more than 60% of people at some time intheir lives and often causing appreciable disability.1 2 Itis particularly common in nurses. In a recent survey10% of 1616 female nurses employed by a large NHStrust reported having lost more than a month in totalfrom work because of back problems.3 This high
incidence is not only a burden on the many nurses whodevelop back pain but also a substantial cost toemploying hospitals in lost efficiency, lost time, wastedtraining, and claims for industrial injuries.
The high rate of back disorders in nurses is associ-ated with heavy physical workload,4 particularly in lift-ing and moving patients,5-7 and with adversepostures.8 9 One approach to prevention, therefore, isthrough improvements in ergonomics and training,with avoidance or modification of the tasks that carrythe highest risks. In addition, exclusion of people whoare specially vulnerable to back injury from the mosthazardous jobs may be justified. To optimise preventivestrategies, however, more information is needed aboutthe levels of risk associated with specific nursing activi-ties and about the influence of individual susceptibilityon risk. To examine these questions we carried out atwo year longitudinal study of back pain in a cohort ofnurses working in hospitals.
Subjects and methodsIn 1993 we sent a baseline questionnaire to the 2405hospital based nurses employed by Southampton Uni-versity Hospitals Trust. The trust provides inpatientfacilities in most clinical specialties other than psychia-try. The questionnaire asked about various non-occupational risk factors for back pain, including age,height, and weight; about activities in the nurse’scurrent job; and about past and recent low back painand other symptoms. Throughout the study low backpain was defined as pain in an area (illustrated in a dia-gram) between the 12th ribs and the gluteal folds thatlasted for longer than a day and occurred other than inassociation with pregnancy, menstruation, or febrile ill-ness. The results of a cross sectional analysis of this ini-tial survey have already been published.3
Of 1616 women who completed the baseline ques-tionnaire, 1336 (83%) agreed to take part in the longi-tudinal phase of the study. This paper presents resultsfor the subset of 961 women who had not had any lowback pain in the month before they completed thebaseline questionnaire. Their ages ranged from 19 to64 years with a mean of 38 years. Three hundred andforty seven were auxiliary or enrolled nurses, 573 werestaff nurses or sisters, and 41 worked in administrativeor specialist posts.
Each woman was sent a short follow upquestionnaire every three months for two years. This
MRCEnvironmentalEpidemiology Unit,University ofSouthampton,SouthamptonGeneral Hospital,SouthamptonS016 6YDJulia Smedley,consultantoccupationalphysicianPeter Egger,medical statisticianCyrus Cooper,reader inrheumatologyDavid Coggon,reader in occupationaland environmentalmedicine
Correspondence to:Dr Coggon.
BMJ 1997;314:1225–8
1225BMJ VOLUME 314 26 APRIL 1997
asked about any change in manual handling activitiesand about the occurrence of any low back pain andresultant loss of time from work since the last contact.Women who did not respond to a questionnaire weresent a single reminder and were also mailed again atthe next three monthly follow up. Those who failed torespond to two successive three monthly follow upswere regarded as having dropped out. At the end of thetwo year study period we checked the personnelrecords of those who dropped out and to those whoseaddresses were known we sent a further questionnaire
asking about low back pain since the last contact andwhether this had led to time off work.
In our analysis we used a discrete-time logistic-normal survival model to explore risk factors for theincidence of new low back pain during follow up.10 11
This was chosen in preference to a proportionalhazards model because symptoms were timed bycalendar month, leading to multiple ties in therecorded onset of back pain. We examined the risk ofall low back pain and of back pain leading to loss oftime from work. The risk factors studied included con-stitutional and non-occupational attributes measuredat baseline and occupational activities at the time backpain began.
ResultsTable 1 summarises the response to follow up.Altogether, 843 women (88%) returned at least onefollow up questionnaire, and 446 (46%) were still underfollow up after 24 months. Addresses were available for291 of the 397 women who dropped out, and 176answered the final questionnaire at the end of the studyperiod. Of these, 42 reported low back pain sincedropping out, and 10 had had to take time off workbecause of back pain. Their two year cumulativeincidence of symptoms (47%) was similar to that ofthose who remained under follow up throughout thestudy (46%). Table 1 also shows the numbers ofquestionnaires that women returned while underfollow up. Further analysis is based on the 838 womenwho completed at least one follow up questionnaireand who provided usable information about back pain.Of these, 322 (38%) developed low back pain whileunder follow up (33.1 new episodes per 100 womanyears), including 93 (11%) whose pain was bad enoughto require time off work. Table 2 shows the risk of inci-dent low back pain according to age, height, andweight. Symptoms were significantly more common inthe tallest women, but this excess did not lead to muchmore absence from work. No clear trends were appar-ent in relation to age or weight. Neither was there anassociation with body mass index (data not shown).
All of the women included in the analysis had beenfree from back pain for at least one month at the timethey completed the baseline questionnaire, but almosthalf had suffered from symptoms earlier. Table 3 sum-marises the risk of low back pain during follow upaccording to the duration of previous pain and thetime since last symptoms. Risk tended to increase withthe total duration of previous pain and was highest inthose who had experienced symptoms during the yearbefore entry to the study. Of 92 women who reportedpain in the 12 months before answering baseline ques-tionnaire and a history of pain for at least one monthin total, 61 (66%) developed further symptoms duringfollow up (91.0 new episodes per 100 woman years)and 21 (23%) required time off work as a consequence.
Table 4 shows the association of incident low backpain with other complaints reported at baseline. Afteradjustment for age, height, and earlier history of backpain women with frequent low mood at baseline weresignificantly more likely to require time off work forback pain during follow up (odds ratio 3.4; 95% confi-dence interval 1.4 to 8.2).
Table 1 Completeness of follow up
Lastquestionnairereturned (months)
No of follow up questionnaires returned
Total0 1 2 3 4 5 6 7 8
Baseline 118 118
3 101 101
6 12 54 66
9 14 32 46
12 4 10 41 55
15 2 10 37 49
18 3 14 33 50
21 2 3 25 30
24 3 13 67 363 446
Total 118 113 72 44 54 56 49 92 363 961
Table 2 Risk of low back pain during follow up according to age, height, and weight.For each outcome all risk estimates are mutually adjusted
No ofwomen*
All low back painLow back pain leading to
absence from work
No ofcases
Odds ratio(95% CI)
No ofcases
Odds ratio(95% CI)
Age (years):
< 30 226 85 1.0 24 1.0
30-39 251 88 0.8 (0.5 to 1.1) 22 0.6 (0.3 to 1.3)
40-49 193 88 1.1 (0.7 to 1.7) 28 1.1 (0.5 to 2.3)
> 50 141 51 0.8 (0.5 to 1.3) 14 0.6 (0.3 to 1.5)
Height (cm):
< 158 183 66 1.0 20 1.0
158-162 214 72 1.0 (0.7 to 1.6) 17 0.7 (0.3 to 1.7)
163-165 134 48 1.0 (0.6 to 1.7) 17 1.2 (0.5 to 3.0)
166-169 172 78 1.7 (1.1 to 2.6) 23 1.5 (0.7 to 3.4)
> 170 108 48 1.6 (1.0 to 2.7) 11 1.1 (0.4 to 3.0)
Weight (kg):
< 55.5 180 58 1.0 16 1.0
55.5-60.7 173 70 1.4 (0.9 to 2.2) 18 1.3 (0.5 to 3.1)
60.8-65.7 160 61 1.0 (0.6 to 1.7) 16 1.0 (0.4 to 2.5)
65.8-73.0 154 67 1.5 (0.9 to 2.4) 18 1.4 (0.6 to 3.6)
> 73.1 144 56 1.1 (0.7 to 1.9) 20 1.7 (0.7 to 4.2)
* Data missing on 27 women.
Table 3 Risk of low back pain during follow up according to earlier history of low backpain. All risk estimates are adjusted for age and height (classified as in table 2)
Earlier history of low back pain
No ofwomen*
All low back painLow back pain leading to
absence work
Total durationTime since last
symptomsNo ofcases
Odds ratio(95% CI)
No ofcases
Odds ratio(95% CI)
None — 460 120 1.0 35 1.0
1-6 Days > 1 year 57 23 1.9 (1.1 to 3.1) 9 2.7 (1.1 to 6.6)
1-4 Weeks > 1 year 59 26 2.2 (1.3 to 3.6) 12 3.5 (1.5 to 8.1)
> 1 Month > 1 year 46 25 2.9 (1.7 to 5.0) 4 1.6 (0.5 to 5.1)
1-6 Days < 1 year 45 24 3.4 (2.0 to 5.8) 3 1.2 (0.3 to 4.5)
1-4 Weeks < 1 year 66 36 3.1 (2.0 to 4.9) 8 2.3 (0.9 to 5.6)
> 1 Month < 1 year 92 61 6.1 (4.1 to 9.1) 21 7.3 (3.5 to 15.2)
* Data missing on 13 women.
Papers
1226 BMJ VOLUME 314 26 APRIL 1997
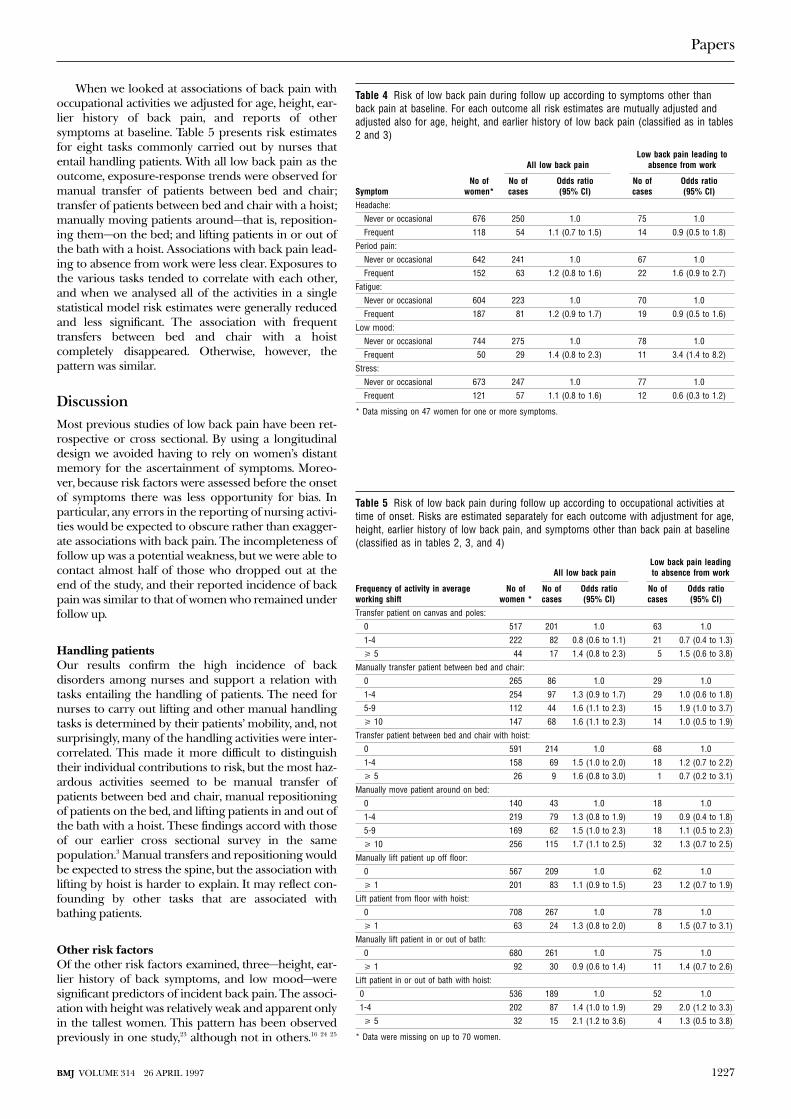
When we looked at associations of back pain withoccupational activities we adjusted for age, height, ear-lier history of back pain, and reports of othersymptoms at baseline. Table 5 presents risk estimatesfor eight tasks commonly carried out by nurses thatentail handling patients. With all low back pain as theoutcome, exposure-response trends were observed formanual transfer of patients between bed and chair;transfer of patients between bed and chair with a hoist;manually moving patients around—that is, reposition-ing them—on the bed; and lifting patients in or out ofthe bath with a hoist. Associations with back pain lead-ing to absence from work were less clear. Exposures tothe various tasks tended to correlate with each other,and when we analysed all of the activities in a singlestatistical model risk estimates were generally reducedand less significant. The association with frequenttransfers between bed and chair with a hoistcompletely disappeared. Otherwise, however, thepattern was similar.
DiscussionMost previous studies of low back pain have been ret-rospective or cross sectional. By using a longitudinaldesign we avoided having to rely on women’s distantmemory for the ascertainment of symptoms. Moreo-ver, because risk factors were assessed before the onsetof symptoms there was less opportunity for bias. Inparticular, any errors in the reporting of nursing activi-ties would be expected to obscure rather than exagger-ate associations with back pain. The incompleteness offollow up was a potential weakness, but we were able tocontact almost half of those who dropped out at theend of the study, and their reported incidence of backpain was similar to that of women who remained underfollow up.
Handling patientsOur results confirm the high incidence of backdisorders among nurses and support a relation withtasks entailing the handling of patients. The need fornurses to carry out lifting and other manual handlingtasks is determined by their patients’ mobility, and, notsurprisingly, many of the handling activities were inter-correlated. This made it more difficult to distinguishtheir individual contributions to risk, but the most haz-ardous activities seemed to be manual transfer ofpatients between bed and chair, manual repositioningof patients on the bed, and lifting patients in and out ofthe bath with a hoist. These findings accord with thoseof our earlier cross sectional survey in the samepopulation.3 Manual transfers and repositioning wouldbe expected to stress the spine, but the association withlifting by hoist is harder to explain. It may reflect con-founding by other tasks that are associated withbathing patients.
Other risk factorsOf the other risk factors examined, three—height, ear-lier history of back symptoms, and low mood—weresignificant predictors of incident back pain. The associ-ation with height was relatively weak and apparent onlyin the tallest women. This pattern has been observedpreviously in one study,23 although not in others.16 24 25
Table 4 Risk of low back pain during follow up according to symptoms other thanback pain at baseline. For each outcome all risk estimates are mutually adjusted andadjusted also for age, height, and earlier history of low back pain (classified as in tables2 and 3)
SymptomNo of
women*
All low back painLow back pain leading to
absence from work
No ofcases
Odds ratio(95% CI)
No ofcases
Odds ratio(95% CI)
Headache:
Never or occasional 676 250 1.0 75 1.0
Frequent 118 54 1.1 (0.7 to 1.5) 14 0.9 (0.5 to 1.8)
Period pain:
Never or occasional 642 241 1.0 67 1.0
Frequent 152 63 1.2 (0.8 to 1.6) 22 1.6 (0.9 to 2.7)
Fatigue:
Never or occasional 604 223 1.0 70 1.0
Frequent 187 81 1.2 (0.9 to 1.7) 19 0.9 (0.5 to 1.6)
Low mood:
Never or occasional 744 275 1.0 78 1.0
Frequent 50 29 1.4 (0.8 to 2.3) 11 3.4 (1.4 to 8.2)
Stress:
Never or occasional 673 247 1.0 77 1.0
Frequent 121 57 1.1 (0.8 to 1.6) 12 0.6 (0.3 to 1.2)
* Data missing on 47 women for one or more symptoms.
Table 5 Risk of low back pain during follow up according to occupational activities attime of onset. Risks are estimated separately for each outcome with adjustment for age,height, earlier history of low back pain, and symptoms other than back pain at baseline(classified as in tables 2, 3, and 4)
Frequency of activity in averageworking shift
No ofwomen *
All low back painLow back pain leadingto absence from work
No ofcases
Odds ratio(95% CI)
No ofcases
Odds ratio(95% CI)
Transfer patient on canvas and poles:
0 517 201 1.0 63 1.0
1-4 222 82 0.8 (0.6 to 1.1) 21 0.7 (0.4 to 1.3)
> 5 44 17 1.4 (0.8 to 2.3) 5 1.5 (0.6 to 3.8)
Manually transfer patient between bed and chair:
0 265 86 1.0 29 1.0
1-4 254 97 1.3 (0.9 to 1.7) 29 1.0 (0.6 to 1.8)
5-9 112 44 1.6 (1.1 to 2.3) 15 1.9 (1.0 to 3.7)
> 10 147 68 1.6 (1.1 to 2.3) 14 1.0 (0.5 to 1.9)
Transfer patient between bed and chair with hoist:
0 591 214 1.0 68 1.0
1-4 158 69 1.5 (1.0 to 2.0) 18 1.2 (0.7 to 2.2)
> 5 26 9 1.6 (0.8 to 3.0) 1 0.7 (0.2 to 3.1)
Manually move patient around on bed:
0 140 43 1.0 18 1.0
1-4 219 79 1.3 (0.8 to 1.9) 19 0.9 (0.4 to 1.8)
5-9 169 62 1.5 (1.0 to 2.3) 18 1.1 (0.5 to 2.3)
> 10 256 115 1.7 (1.1 to 2.5) 32 1.3 (0.7 to 2.5)
Manually lift patient up off floor:
0 567 209 1.0 62 1.0
> 1 201 83 1.1 (0.9 to 1.5) 23 1.2 (0.7 to 1.9)
Lift patient from floor with hoist:
0 708 267 1.0 78 1.0
> 1 63 24 1.3 (0.8 to 2.0) 8 1.5 (0.7 to 3.1)
Manually lift patient in or out of bath:
0 680 261 1.0 75 1.0
> 1 92 30 0.9 (0.6 to 1.4) 11 1.4 (0.7 to 2.6)
Lift patient in or out of bath with hoist:
0 536 189 1.0 52 1.0
1-4 202 87 1.4 (1.0 to 1.9) 29 2.0 (1.2 to 3.3)
> 5 32 15 2.1 (1.2 to 3.6) 4 1.3 (0.5 to 3.8)
* Data were missing on up to 70 women.
Papers
1227BMJ VOLUME 314 26 APRIL 1997
Earlier history of back trouble was by far thestrongest predictor of new symptoms. This is notsurprising given the chronicity and recurrent nature ofback disorders, but our data illustrate clearly how riskincreases with both the duration and recency of previ-ous symptoms. Other studies have also found that riskof back pain is increased in people with previous backtrouble,12 27-29 although the finding has not beenuniversal.21 Few have examined the influence of earlierhistory in more detail, but in Denmark Biering-Sørensen found that the probability of developing fur-ther pain within the next year fell from 76% in peoplewith back pain in the past week to 28% in those wholast had back pain more than five years earlier.12
Several previous studies have linked back com-plaints with low mood, stress, and jobdissatisfaction.9 13 30-34 Most, however, have been crosssectional, and it is unclear to what extent thepsychological complaints were secondary to the backproblem rather than antecedent. Our analysis, whichwas restricted to women who were free from pain atbaseline and which adjusted for earlier history of backcomplaints, indicates that low mood does predictfuture back problems. It is notable that the associationwas particularly with back pain leading to loss of timefrom work. This might reflect an influence particularlyon more severe disease or an effect on women’s abilityto cope when symptoms occurred.
Implications for preventionOur findings have important implications for the pre-vention of occupational back pain, especially in nurses.One approach to prevention is through screeningbefore employment and selective recruitment of staffwho are at lower risk. Some hospitals have rejectedapplicants for nursing posts because they were obese,but we found no increase in risk of back disorders withweight or body mass index. Neither were the risks intaller women sufficient to warrant selective exclusionfrom employment. There may be justification forexcluding women with a history of prolonged andrecent back pain from the most physically demandingnursing jobs, but this would eliminate only a smallproportion of cases.
Thus, the main route to preventing back disordersamong nurses is likely to lie in improved ergonomics.In the past three years many NHS trusts have investedsubstantially in aids for handling patients, such as slid-ing sheets and hoists, but the outcome has yet to beproperly assessed. Our findings point to nursing tasksthat might most usefully be eliminated or modified.
There is now an urgent need to evaluate suchergonomic interventions in a controlled trial.
We thank Graham Wield, who carried out the computing; themanagement of Southampton University Hospitals trust; andthe nurses who participated in the investigation.
Funding: This study was funded in part by a grant fromWessex Regional Health Authority.
Conflict of interest: None.
1 Walsh K, Cruddas M, Coggon D. Low-back pain in eight areas of Britain.J Epidemiol Community Health 1992;46:227-30.
2 Clinical Standards Advisory Group. Epidemiology review: the epidemiologyand cost of back pain. London: HMSO, 1994.
3 Smedley J, Egger P, Cooper C, Coggon D. Manual handling activities andrisk of low back pain in nurses. Occup Environ Med 1995;52:160-3.
4 Videman T, Nurminen T, Tda S, Kuorinka I, Vanharanta H, Troup JDG.Low-back pain in nurses and some loading factors of work. Spine1984;9:400-3.
5 Harber P, Billet E, Gutowski M, SooHoo K, Lew M, Roman A.Occupational low back pain in nurses. J Occup Med 1985;27:518-24.
6 Yassi A, Khokar J, Tate R, Cooper J, Snow C, Vallentyne S. The epidemiol-ogy of back injuries in nurses at a large Canadian tertiary care hospital:implications for prevention. Occup Med 1995;45:215-20.
7 Venning PJ, Walter SD, Stitt LW. Personal and job-related factors as deter-minants of incidence of back injuries among nursing personnel. J OccupMed 1987;29:820-5.
8 Baty D, Stubbs DA. Postural stress in geriatric nursing. Int J Nurs Stud1987;24:239-44.
9 Frymoyer JW, Pope MH, Constanza MC, Rosen JC, Goggin JE, WilderDG. Epidemiologic studies of low back pain. Spine 1980;5:419-23.
10 Allison PD. Introducing a disturbance into logit and probit regressionmodels. Sociol Methods Res 1988;15:355-74.
11 Egger P. Event history analysis: discrete-time models including unobservedheterogeneity, with applications to birth history data. Southampton: Universityof Southampton, 1992. (PhD thesis.)
12 Biering-Sørensen F. A prospective study of low back pain in a generalpopulation. I. Occurrence, recurrence and aetiology. Scand J Rehab Med1983;15:71-9.
13 Croft P, Ferry S, Papageorgiou A, Jayson M, Silman A. Depression andback pain in the general population. Br J Rheumatol 1994;33(suppl 1):105.
14 Hult L. Cervical, dorsal and lumbar spine syndromes. Acta Orthop Scand1954;suppl 17:1-102.
15 Horal J. The clinical appearance of low back disorders in the city ofGothenburg, Sweden. Acta Orthop Scand 1969;118:1-109.
16 Walsh K, Cruddas M, Coggon D. Interaction of height and mechanicalloading of the spine in the development of low back pain. Scand J WorkEnviron Health 1991;17:420-4.
17 Zwerling C, Ryan J, Schoutman M. A case-control study of risk factors forindustrial low back injury. Spine 1993;18:1242-7.
18 Suadicani P, Hansen K, Fenger A-M, Gyntelberg F. Low back pain in steelplant workers. Occup Med 1994;44:217-21.
19 Bergquist-Ullman M, Larsson U. Acute low back pain in industry. ActaOrthop Scand 1977;170(suppl):1-117.
20 Magora A. Investigation of the relation between low back pain and occu-pation. IV. Physical requirements: bending, rotation, reaching and suddenmaximal effort. Scand J Rehab Med 1973;5:186-90.
21 Punnett L, Fine LJ, Keyserling WM, Herrin GD. Back disorders and non-neutral trunk postures of automobile assembly workers. Scand J WorkEnviron Health 1991;17:337-46.
22 Burdorf A, Govaert G, Elders L. Postural load and back pain of workersin the manufacturing of prefabricated concrete elements. Ergonomics1991;34:909-18.
23 Kuh DJL, Coggon D, Mann S, Cooper C, Yusuf E. Height, occupation andback pain in a national prospective study. Br J Rheumatol 1993;32:911-6.
24 Biering-Sørensen F. Physical measurements as risk indicators for lowback trouble over a one year period. Spine 1984;9:106-19.
25 Hirsch C, Jonsson B, Lewin T. Low-back symptoms in a Swedish femalepopulation. Clin Orthop 1969;63:171-6.
26 Undeutsch K, Gartner KH, Luopajarvi T, Küpper R, Karvonen M,Löwenthal I, et al. Back complaints and findings in transport workers per-forming physically heavy work. Scand J Work Environ Health 1982;suppl1:92-6.
27 Gyntelberg F. One year incidence of low back pain among male residentsof Copenhagen aged 40-59. Dan Med Bull 1974;21:109-13.
28 Dillane JB, Fry J, Kalton G. Acute back syndrome—a study from generalpractice. BMJ 1966;ii:82-4.
29 Lloyd DCEF, Troup JDG. Recurrent back pain and its prediction. J SocOccup Med 1983;33:66-74.
30 Nagi SZ, Riley LE, Newby LG. A social epidemiology of back pain in ageneral population. J Chronic Dis 1973;26:769-79.
31 Astrand N-E. Medical, psychological and social factors associated withback abnormalities and self-reported back pain: a cross-sectional study ofmale employees in a Swedish pulp and paper industry. Br J Ind Med1987;44:327-36.
32 Magora A. Investigation of the relation between low back pain and occu-pation. V. Psychological aspects. Scand J Rehabil Med 1973;5:191-6.
33 Svensson H-O, Andersson GBJ. The relationship of low back pain, workhistory, work environment and stress; a retrospective cross-sectionalstudy of 38-64 year old women. Spine 1989;14:517-22.
34 Bigos SJ, Battie MC, Spengler DM, Fisher LD, Fordyce WE, Hansson TJ.A prospective study of work perceptions and psychosocial factors affect-ing the report of back injury. Spine 1991;16:1-6.
35 Disability Discrimination Act 1995. London: HMSO, 1995.(Accepted 24 January 1997)
Key messages
+ A history of back trouble, particularly if recent and prolonged, ishighly predictive of new episodes of back pain
+ There are grounds for excluding nurses with recent and prolongedback pain from the most physically demanding jobs
+ Age, height, and weight are not sufficiently discriminatory for riskof back pain to influence selection and appointment of nurses
+ Back pain is more common in nurses who lift and move patientsfrequently without the use of mechanical aids
+ Controlled trials are needed to assess the benefits of ergonomicintervention aimed at prevention of back pain in nurses
Papers
1228 BMJ VOLUME 314 26 APRIL 1997
Association of mutations in mannose bindingprotein gene with childhood infection in consecutivehospital seriesJohn A Summerfield, Michiko Sumiya, Michael Levin, Malcolm W Turner
AbstractObjective: To determine the extent to whichmutations in the mannose binding protein genepredispose to childhood infection.Design: Clinical details and genotype of mannosebinding protein determined in consecutive childrenattending a paediatric department.Setting: Inner city hospital paediatric service inLondon.Subjects: 617 children attending hospital betweenOctober 1993 and August 1995.Main outcome measure: Infection as the cause forattendance or admission in relation to mutations inthe mannose binding protein gene.Results: The prevalence of mutations in the mannosebinding protein gene in children with infection(146/345) was about twice that in children withoutinfection (64/272) (P < 0.0001). Increasedsusceptibility to infection was found in bothheterozygotic and homozygotic children. 13 out of 17children homozygotic for variant alleles presentedwith strikingly severe infections, including 6 withsepticaemia.Conclusions: The findings suggest that mutations inthe mannose binding protein gene are an importantrisk factor for infections in children. Screening forsuch mutations should be included in theinvestigation of severe or frequent infections.
IntroductionMannose binding protein is a calcium dependent lectinthat plays an important part in innate immunity.1 Acommon opsonic defect, associated with low serumconcentrations of mannose binding protein,2 is causedby mutations in codons 54 and 57 of the collagendomain that impair assembly of mannose binding pro-tein homopolymer.3-5 A third, less common, mutationhas been identified in codon 52.6 Repeated bacterialand fungal infections associated with these mutationshave been reported.3 7 8 Both these mutations andchildhood infections are common, but there are nodata on the extent to which such mutations predisposeto childhood infectious disease. We examined aconsecutiveseriesofchildrenattendingahospitalpaedi-atric service to determine whether mutations in thegenes for mannose binding protein are an importantrisk factor for infection.
MethodsPatients and methods—Blood samples were obtained
from consecutive children attending St Mary’s Hospi-tal. All were venesected for clinical reasons and surplusblood was spotted on to blotting paper (Guthrie cards).Samples were collected between October 1993 and
August 1995. Diagnoses were confirmed from thenotes and the clinical diagnostic codes after discharge.The children were classified, without reference to themannose binding protein genotyping, as to whetherthe presenting illness was an infection according to theInternational Classification of Diseases, ninth revision.The study was approved by the ethics committee ofParkside Health Authority. Guthrie cards wereautoclaved at 120°C for 7 minutes and stored at roomtemperature. Genotypes were determined by sequencespecific oligonucleotide hybridisation.9 Homozygositywas confirmed by DNA sequencing.
Statistical analysis—Calculations before the studyshowed that 150 children per group would enable us todetect a difference of 20% in the infected group with apower of 95% and significance of 5%. Prevalences ofthe mutations were determined by using the Hardy-Weinberg equation. Differences were evaluated withthe ÷2 test, odds ratios, and 95% confidence intervals.
ResultsA total of 345 children were admitted with infection;272 children, who acted as controls, were admittedwith various other diagnoses (table 1). Six hundredand ninety blood samples were collected. Data from617 children (89%) were complete (table 2). Agesranged from 0 to 18 years, and 58% (357) were male.The expected prevalence of the codon 52 mutation(0.04) was observed. The prevalences of codon 54 (0.1)
Table 1 Diagnoses in 272 control children without infections
Diagnosis No of children
Accidental injury 3
Failure to thrive 3
Haematuria 3
Heart disease 3
Rickets 3
Nut allergy 4
Uveitis 4
Headache 5
Joint effusions 5
Malignancy 5
Purpura, allergic 6
Systemic lupus erythematosus 6
Nephrotic syndrome 7
Neonatal jaundice 9
Epilepsy or convulsions 12
Chronic fatigue syndrome 12
Asthma 13
Surgery, various 14
Anaemia, various 17
Congenital abnormality 19
Pains, various sites 19
Prematurity 32
Miscellaneous* 68
*Diagnoses affecting fewer than three children.
Papers
Imperial CollegeSchool of Medicineat St Mary’s,LondonW2 1NYJohn ASummerfield,professor, departmentof medicineMichiko Sumiya,lecturer, department ofmedicineMichael Levin,professor, departmentof paediatrics
ImmunobiologyUnit, Institute ofChild Health,LondonWC1N 1EHMalcolm W Turner,professor
Correspondence to:ProfessorSummerfield.
BMJ 1997;314:1229–32
1229BMJ VOLUME 314 26 APRIL 1997
and codon 57 (0.05) mutations were lower thanexpected, but when we corrected for the ethniccomposition of the sample (African and Caribbean21%; white, Asian, and Oriental 79%) the expectedprevalences for codon 54 in the Eurasian group (0.12)and for codon 57 in Afro-Caribbeans (0.22) wereobtained. One child was homozygotic for codon 57mutation. Three were homozygotic for codon 54mutation, whereas the Hardy-Weinberg equation pre-dicted that the number would be six. Fourteen werephenotypically homozygotic, having combinations ofmutant 52, 54, or 57 alleles. Thus 17 (3%) werehomozygotic for mutations in the mannose bindingprotein gene.
We examined the association of mutant gene alle-les for mannose binding protein with infection. Of the272 children without infections (controls), 64 carriedvariant alleles and 208 carried normal genes (wildtype). In contrast, of the 345 children with infections,
146 carried variant alleles and 199 were wild type(table 2). The increased prevalence of variant alleles ininfected children was highly significant (odds ratio 2.4;95% confidence interval 1.7 to 3.4; P < 0.0001). Theethnic composition of the infected and control groupswas similar. When the ethnic groups were analysedseparately a significant excess of variant alleles ininfected children remained (data not shown). Table 3gives details of the infections in heterozygoticchildren.
We examined whether variant alleles increased sus-ceptibility to infection in both heterozygotic andhomozygotic children (table 2): 60 controls wereheterozygotic for variant alleles and 208 were wildtype, whereas 133 with infection were heterozygotic forvariant alleles and 199 were wild type (2.3; 1.6 to 3.4;P < 0.0001). An increased prevalence of infection inheterozygotic children was observed when mutationdata for codon 52 (3.0; 1.4 to 6.3; P = 0.002), codon 54(2.2; 1.4 to 3.5; P = 0.0009), and codon 57 (2.1; 1.1 to4.2; P = 0.04) were analysed separately. The number ofhomozygotic children was smaller, but a significant dif-ference was observed. Four controls were homozygoticfor variant alleles compared with 13 children in theinfection group (3.4; 1.0 to 11.4; P = 0.048). Childrenhomozygotic for the mutation presented with strik-ingly severe infections, including six with septicaemia(table 4).
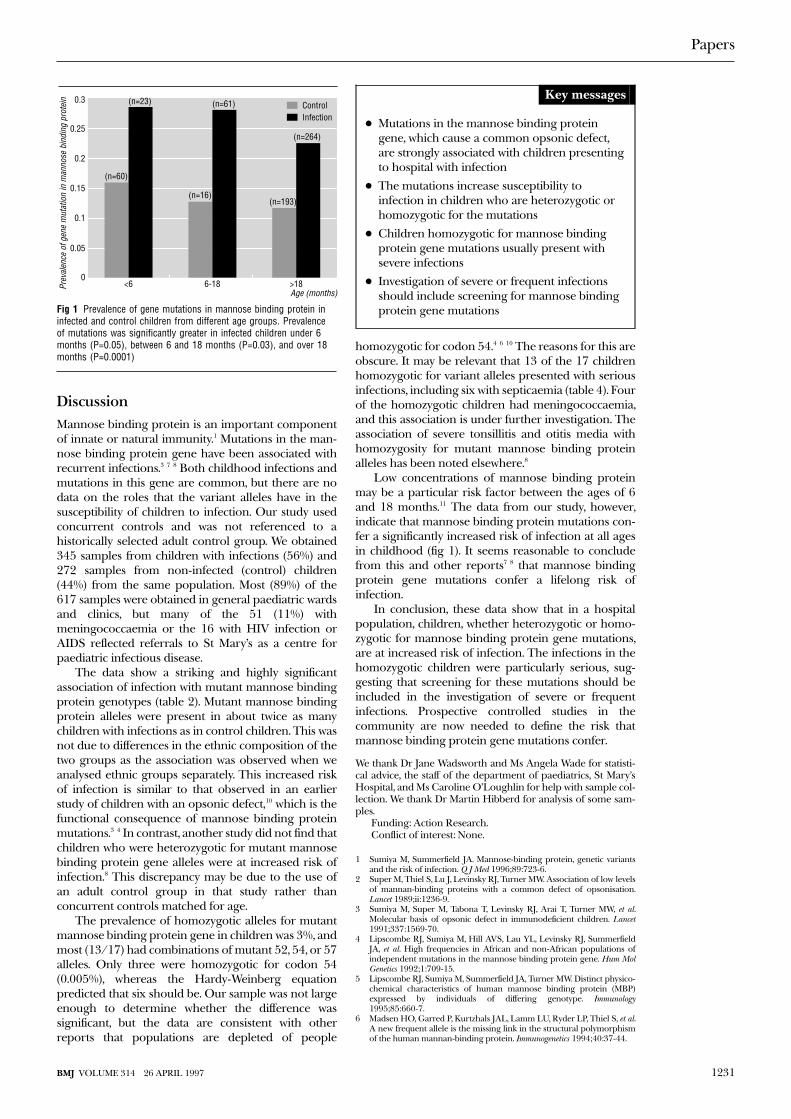
We examined whether the risk of infectionconferred by variant alleles was related to age. Variantalleles conferred significant susceptibility to infectionin children aged less than 6 months (3.0; 1.0 to 9.0;P = 0.05), in those aged 6-18 months (4.0; 1.0 to 17.0;P = 0.03), and those aged over 18 months (2.4; 1.5 to3.7: P = 0.0001) (fig 1).
Table 2 Details of genotypes for mutations in mannose binding protein gene in children presenting with infections and those without infections
No ofchildren
No withnormalgenes
Heterozygotic (codon) Homozygotic (codon) Total Nowith
mutations
Gene prevalence (codon)
52 54 57 All 52 54 57 52+54 52+57 54+57 All 52 54 57 All
Controls 272 208 11 34 15 60* 0 0 1 1 1 1 4† 64 0.02 0.07 0.04 0.13
Children with infection 345 199 32 71 30 133* 0 3 0 4 4 2 13† 146 0.06 0.12 0.05 0.23
Total 617 407 43 105 45 193 0 3 1 5 5 3 17 210 0.04 0.10 0.05 0.18
*P<0.0001 for children with infection being heterozygotic.†P=0.048 for children with infection being homozygotic.
Table 3 Infections in 133 children heterozygotic for mutations inmannose binding protein gene
Diagnosis No of children
Osteomyelitis 3
Otitis media 4
Streptococcal infection 4
Urinary tract infection 4
Gastroenteritis 5
Cellulitis and abscess 8
HIV infection 8
Fever of unknown origin 14
Tonsillitis 14
Meningococcaemia 17
Chest infection 23
Miscellaneous* 29
*Infections affecting fewer than three heterozygotic children.
Table 4 Clinical details of children homozygotic for mutations in mannose binding protein gene
Genotype Sex Age (months) Clinical detail
Codon 52 + 54 M 106 Recurrent cellulitis and boils, surgical drainage; father and maternal uncle had boils
Codon 52 + 54 M 74 Recurrent, serious chest infections, persistent cough, low IgG3 and 4
Codon 52 + 54 F 94 Tetralogy of Fallot, cleft palate and lip, congenital ptosis
Codon 52 + 54 F 136 Transfusion associated HIV infection, pneumocystis, herpes zoster, recurrent chest infections
Codon 54 homozygote M 10 Meningococcal sepsis
Codon 54 homozygote F 79 Meningococcal sepsis
Codon 54 homozygote F 26 Severe meningococcal sepsis
Codon 54 + 57 M 63 Severe meningococcal sepsis, skin grafting, avascular necrosis of hip
Codon 57 homozygote M 27 Abdominal pain, sickle trait
Codon 54 + 57 M 0 Premature (born at 25 weeks’ gestation); died
Codon 52 + 57 M 0 Premature; respiratory distress syndrome
Codon 52 + 57 F 53 Haemophilus influenzae septicaemia, recurrent tonsillitis
Codon 52 + 57 M 15 Pneumococcal septicaemia, sickle trait
Codon 52 + 57 M 12 Streptococcal infection, otitis media; born prematurely, growth retarded
Codon 52 + 54 F 28 Recurrent tonsillitis, bilateral chronic mucoid otitis media
Codon 54 + 57 M 81 Recurrent tonsillitis (six times a year for four years), bilateral otitis media, tonsillectomy
Codon 52 + 57 F 150 Recurrent tonsillitis (four times a year), tonsillectomy
Papers
1230 BMJ VOLUME 314 26 APRIL 1997
DiscussionMannose binding protein is an important componentof innate or natural immunity.1 Mutations in the man-nose binding protein gene have been associated withrecurrent infections.3 7 8 Both childhood infections andmutations in this gene are common, but there are nodata on the roles that the variant alleles have in thesusceptibility of children to infection. Our study usedconcurrent controls and was not referenced to ahistorically selected adult control group. We obtained345 samples from children with infections (56%) and272 samples from non-infected (control) children(44%) from the same population. Most (89%) of the617 samples were obtained in general paediatric wardsand clinics, but many of the 51 (11%) withmeningococcaemia or the 16 with HIV infection orAIDS reflected referrals to St Mary’s as a centre forpaediatric infectious disease.
The data show a striking and highly significantassociation of infection with mutant mannose bindingprotein genotypes (table 2). Mutant mannose bindingprotein alleles were present in about twice as manychildren with infections as in control children. This wasnot due to differences in the ethnic composition of thetwo groups as the association was observed when weanalysed ethnic groups separately. This increased riskof infection is similar to that observed in an earlierstudy of children with an opsonic defect,10 which is thefunctional consequence of mannose binding proteinmutations.3 4 In contrast, another study did not find thatchildren who were heterozygotic for mutant mannosebinding protein gene alleles were at increased risk ofinfection.8 This discrepancy may be due to the use ofan adult control group in that study rather thanconcurrent controls matched for age.
The prevalence of homozygotic alleles for mutantmannose binding protein gene in children was 3%, andmost (13/17) had combinations of mutant 52, 54, or 57alleles. Only three were homozygotic for codon 54(0.005%), whereas the Hardy-Weinberg equationpredicted that six should be. Our sample was not largeenough to determine whether the difference wassignificant, but the data are consistent with otherreports that populations are depleted of people
homozygotic for codon 54.4 6 10 The reasons for this areobscure. It may be relevant that 13 of the 17 childrenhomozygotic for variant alleles presented with seriousinfections, including six with septicaemia (table 4). Fourof the homozygotic children had meningococcaemia,and this association is under further investigation. Theassociation of severe tonsillitis and otitis media withhomozygosity for mutant mannose binding proteinalleles has been noted elsewhere.8
Low concentrations of mannose binding proteinmay be a particular risk factor between the ages of 6and 18 months.11 The data from our study, however,indicate that mannose binding protein mutations con-fer a significantly increased risk of infection at all agesin childhood (fig 1). It seems reasonable to concludefrom this and other reports7 8 that mannose bindingprotein gene mutations confer a lifelong risk ofinfection.
In conclusion, these data show that in a hospitalpopulation, children, whether heterozygotic or homo-zygotic for mannose binding protein gene mutations,are at increased risk of infection. The infections in thehomozygotic children were particularly serious, sug-gesting that screening for these mutations should beincluded in the investigation of severe or frequentinfections. Prospective controlled studies in thecommunity are now needed to define the risk thatmannose binding protein gene mutations confer.
We thank Dr Jane Wadsworth and Ms Angela Wade for statisti-cal advice, the staff of the department of paediatrics, St Mary’sHospital, and Ms Caroline O’Loughlin for help with sample col-lection. We thank Dr Martin Hibberd for analysis of some sam-ples.
Funding: Action Research.Conflict of interest: None.
1 Sumiya M, Summerfield JA. Mannose-binding protein, genetic variantsand the risk of infection. Q J Med 1996;89:723-6.
2 Super M, Thiel S, Lu J, Levinsky RJ, Turner MW. Association of low levelsof mannan-binding proteins with a common defect of opsonisation.Lancet 1989;ii:1236-9.
3 Sumiya M, Super M, Tabona T, Levinsky RJ, Arai T, Turner MW, et al.Molecular basis of opsonic defect in immunodeficient children. Lancet1991;337:1569-70.
4 Lipscombe RJ, Sumiya M, Hill AVS, Lau YL, Levinsky RJ, SummerfieldJA, et al. High frequencies in African and non-African populations ofindependent mutations in the mannose binding protein gene. Hum MolGenetics 1992;1:709-15.
5 Lipscombe RJ, Sumiya M, Summerfield JA, Turner MW. Distinct physico-chemical characteristics of human mannose binding protein (MBP)expressed by individuals of differing genotype. Immunology1995;85:660-7.
6 Madsen HO, Garred P, Kurtzhals JAL, Lamm LU, Ryder LP, Thiel S, et al.A new frequent allele is the missing link in the structural polymorphismof the human mannan-binding protein. Immunogenetics 1994;40:37-44.
Age (months)
Prev
alen
ce o
f gen
e m
utat
ion
in m
anno
se b
indi
ng p
rote
in
0<6
(n=60)
(n=23)
(n=16)
(n=61)
(n=193)
(n=264)
ControlInfection
6-18 >18
0.1
0.15
0.2
0.25
0.3
0.05
Fig 1 Prevalence of gene mutations in mannose binding protein ininfected and control children from different age groups. Prevalenceof mutations was significantly greater in infected children under 6months (P=0.05), between 6 and 18 months (P=0.03), and over 18months (P=0.0001)
Key messages
+ Mutations in the mannose binding proteingene, which cause a common opsonic defect,are strongly associated with children presentingto hospital with infection
+ The mutations increase susceptibility toinfection in children who are heterozygotic orhomozygotic for the mutations
+ Children homozygotic for mannose bindingprotein gene mutations usually present withsevere infections
+ Investigation of severe or frequent infectionsshould include screening for mannose bindingprotein gene mutations
Papers
1231BMJ VOLUME 314 26 APRIL 1997
7 Summerfield JA, Ryder S, Sumiya M, Thursz M, Gorchein A, Monteil MA,et al. Mannose binding protein gene mutations associated with unusualand severe infections in adults. Lancet 1995;345:886-9.
8 Garred P, Madsen HO, Hofmann B, Svejgaard A. Increased frequency ofhomozygosity of abnormal mannan binding protein alleles in patientswith suspected immunodeficiency. Lancet 1995;346:941-3.
9 Lipscombe RJ, Beatty DW, Ganczakowski M, Goddard EA, Jenkins T,Lau YL, et al. Mutations in the human mannose-binding protein gene:frequencies in several population groups. Eur J Hum Genet 1996;4:13-9.
10 Richardson VF, Larcher VF, Price JF. A common congenital immunode-ficiency predisposing to infection and atopy in infancy. Arch Dis Child1983;58:799-802.
11 Turner MW, Super M, Singh S, Levinsky RJ. Molecular basis of opsonicdefect in immunodeficient children. Clin Exp Allergy. 1991;21(suppl1):182-8.
(Accepted 24 January 1997)
Is the clinical course of HIV-1 changing? Cohort studyA Sinicco, R Fora, R Raiteri, M Sciandra, G Bechis, M M Calvo, P Gioannini
AbstractObjective: To assess whether the clinical course ofHIV infection has changed from 1985 to 1995.Design: Cohort study.Setting: Infectious diseases clinic.Subjects: 285 patients recruited from September1985 to January 1995 with <12 months between thedates of their last seronegative and first seropositivetest result and with first follow up visit in the sixmonths after seroconversion and at least 12 months’follow up. Patients were grouped according to thedate of seroconversion.Main outcome measures: Time to CD4 cell count of< 500, 400, and 200 × 106 cells/l and clinical outcomedefining AIDS; variation in cell count per day betweenconsecutive visits, and ratio between this variation andtime from estimated date of seroconversion at eachvisit.Results: The groups were similar in age, number withacute primary HIV infection, CD4 cell count at intake,and cell count at the beginning of antiretroviraltreatment; they differed in sex ratio, risk factors forHIV, probability of CD4 cell decline to < 500, 400,and 200 × 106 cells/l, and risk of developing AIDS.Acute infection, seroconversion after December 1989,and serum â2 microglobulin > 296 nmol/l wereindependent predictors of poor clinical course. Thespeed of CD4 cell decline, expressed as cell variationdivided by the number of days between consecutivevisits, increased with more recent seroconversion(P = 0.02). Ratio between the speed of CD4 celldecline and time from estimated date ofseroconversion at each visit was also higher in thepatients who seroconverted after December 1989.Conclusions: The faster disease progression and thehigher speed of CD4 cell decline at early stages in thepatients with recently acquired HIV infection suggestchanges in the clinical course of HIV infection.
IntroductionIncreasing interest has recently focused on possiblesecular changes in the course of HIV infection.1-7 Inparticular, researchers are interested in whether thecalendar year of HIV seroconversion is associated witha specific pattern of CD4 cell trends and clinical evolu-tion.
Some authors have found no change.4 5 Findings inmilitary staff with HIV infection have shown a rapid fall
in CD4 cell count soon after seroconversion but noclear trend for changes in cell count by fixed time afterseroconversion.2 3 Similarly, a study of patients whoseroconverted between 1984 and 1991 showed neitherchange in the course of infection nor an associationbetween calendar year of seroconversion and time toCD4 cell count of < 500 × 106 cells/l.4
There are, however, several limitations in thesestudies. Firstly, the study period was limited andincluded only the early 1990s. Consequently, recentchanges in the course of HIV disease were notexamined. Secondly, the study population usuallycomprised homosexual or bisexual men, with little orno information on other risk groups; analysis restrictedto only one transmission category could lead to biasedconclusions. Thirdly, most investigations have beenbased on CD4 cell counts determined in differentlaboratories. Hence, despite the improvementsobtained by adjustment, interlaboratory variationsmight be responsible for measurement bias. Finally, lit-tle is known about CD4 cell counts before seroconver-sion and CD4 counts at the start of antiretroviraltreatment. Several factors may complicate the estimateof the impact of the treatment interventions in patientsinfected with HIV (for instance, use of different drugsand regimens, use of associated treatments, dissimilarduration of treatment), but analytical approaches thatdo not consider the CD4 cell count relative to the ini-tiation of antiretroviral treatment might lead to biasedresults concerning the progression of HIV disease.
Because changes in the course of HIV infectioncould affect clinical management of newly infectedpatients, as well as having repercussions on the globalepidemiology of HIV infection and on healthcareresources, we examined whether the course of HIVdisease has changed in recent years. We divided our 10year cohort of 285 patients positive for HIV antibodywith known date of seroconversion into four groupsaccording to the calendar date of their seroconversion,and we then compared the probabilities of CD4lymphocyte count of < 500, 400, and 200 × 106 cells/l,progression to AIDS, and the speed of decline of CD4cell count.
Patients and methodsRecruitment and inclusion criteriaFrom September 1985 to January 1996, 4134 patientsat risk for hepatitis, sexually transmitted diseases, andHIV infection were tested for antibody to HIV at the
Papers
Department ofMedical andSurgical Sciences,Section ofInfectious Diseases,University of Turin,Amedeo di SavoiaHospital, 10149Turin, ItalyA Sinicco,senior lecturer ininfectious diseasesR Fora,registrarR Raiteri,research statisticianM Sciandra,research statisticianG Bechis,registrarM M Calvo,registrarP Gioannini,director
Correspondence to:Dr Sinicco.
BMJ 1997;314:1232–7
1232 BMJ VOLUME 314 26 APRIL 1997

clinic of infectious diseases, University of Turin. Thosewith positive test results who had had negative resultsat some time in the previous 12 months were enrolledin a prospective study to evaluate the course of HIVinfection. Additional criteria for inclusion were a firstCD4 cell count within six months of the first positivetest results and a follow up of at least 12 months afterentry. The 285 cohort members were divided into fourgroups according to their date of seroconversion: 75subjects seroconverted between September 1985 andDecember 1987, 60 between January 1988 andDecember 1989, 69 between January 1990 andDecember 1991, and 81 between January 1992 andJanuary 1995.
Definitions and study outcomesIn patients who had no symptoms at conversion weassumed the date of entry (estimated date of serocon-version) to be the midpoint between the dates of thelast negative and the first confirmed positive testresults. In the patients with acute primary HIVinfection the entry was considered as the date of thebeginning of the symptoms.
The end points were the dates of the firstconfirmed CD4 count of < 500, 400, and 200 × 106
cells/l and the date of the first clinical outcome defin-ing AIDS. Confirmed decline of CD4 cell count wasdefined as a decrease to below the relevant cell countdetermined in three consecutive samples. AIDSpatients recorded in this report fulfilled the revisedAIDS case definition.8 To implement the analysis andto limit time lag effects we performed a cross checkwith the national AIDS registry.
Laboratory analysisAntibody to HIV was assessed by enzyme immu-noassay, with confirmation by western blot. HIVantigen (p24) was detected by commercially availableenzyme immunoassay. CD4 lymphocyte subsets weremeasured by flow cytometry in a laboratory that usedidentical analytic procedures.
Statistical analysisTo assess differences between the four groups positivefor HIV we used Kruskal-Wallis one way analysis ofvariance for the continuous variables and ÷2 tests forthe categorical variables. Results for continuousvariables are expressed as median (range). To estimatethe progression rates we used the Kaplan-Meiersurvival method, and comparison between progressioncurves was tested for significance with log rank test fortwo sample comparison and with Gehan’s test or Bres-
low’s test for multiple sample comparison.9 Amultivariate analysis was carried out to identify theindependent cofactors of disease progression by usingCox’s proportional hazards model to calculate the haz-ard ratio of reaching the end points. The variablesincluded in the hazards analysis were sex, age,education, occupation, transmission category, smokingstatus, drinking status, life style, annual income, use ofminor tranquillisers, duration of injecting drug use,history of sexually transmitted diseases, history ofprimary acute HIV infection, calendar time ofseroconversion to HIV, baseline laboratory measure-ments (CD4 and CD8 cell count, serum IgA, â2microglobulin and 5’-neopterin concentrations, andHIV p24 concentration). A backward stepwise selec-tion of the covariates was used in constructing themodel. The statistical criterion used to select the bestmodel was the partial likelihood ratio test. The variable“calendar time of seroconversion” was divided intofour dummy variables representing the four studyperiods of seroconversion. As a preliminary step, onlythe resulting four groups were included in the Cox’sproportional hazards analysis, and we tested threegroups against the reference group. Afterwards weincluded all the study variables in the analysis, usingthe September 1985 to December 1987 group as thereference group. Data were processed with statisticaversion 5.010 and spss version 6.0.11
Table 1 Baseline characteristics of the four groups of patients with HIV infectionaccording to different time of seroconversion. Values are numbers (percentages) ofpatients unless stated otherwise
Sept 1985-Dec 1987
Jan 1988-Dec 1989
Jan 1990-Dec 1991
Jan 1992-Jan 1995
No who seroconverted 75 (26.3) 60 (21.0) 69 (24.2) 81 (28.4)
Sex ratio (men:women) 5.8 1.6 2.6 2.4
Median (range) age at entry(years)
27 (18-58) 26.5 (19-58) 27 (19-52) 27 (17-61)
Injecting drug users 45 (60.0) 30 (50.0) 52 (75.4) 36 (44.4)
Homosexual contacts 23 (30.7) 10 (16.7) 11 (15.9) 20 (24.7)
Heterosexual contacts 6 (8.0) 19 (31.7) 6 (8.7) 25 (30.9)
Other risk 1 (1.3) 1 (1.7) 0 0
Acute primary HIV infection 12 (16.0) 9 (15.0) 12 (17.4) 18 (22.2)
Median (range) time betweennegative and positive results(days)
217 (28-337) 214 (26-327) 184 (31-321) 192 (21-329)
Median (range) CD4 count(× 106 cells/l)
639 (117-1317) 548 (134-1715) 663 (123-1696) 530 (109-1325)
Patients with p24 antigenaemia> 10 ng/l
16 (21.3) 10 (16.7) 16 (23.2) 12 (14.8)
Median (range) CD4 count (× 106
cells/l) at start of treatment286 (167-377) 289 (149-368) 247 (234-346) 257 (168-349)
Table 2 Cumulative estimates of decline in CD4 cell count and progression to AIDS in four groups of patients with HIV infectionaccording to time of seroconversion.* Values are percentages of patients
Time sinceconversion(years)
<500×106 cells/l <400×106 cells/l <200×106 cells/l AIDS
Group1
Group2
Group3
Group4
Group1
Group2
Group3
Group4
Group1
Group2
Group3
Group4
Group1
Group2
Group3
Group4
1 12.2 17.1 13.8 49.4 12.3 15.5 4.7 39.9 4.1 — 1.6 3.1 — — — 2.0
2 19.2 29.6 36.9 66.9 15.0 26.1 19.4 55.7 5.5 3.6 4.9 24.4 2.8 1.9 1.7 6.0
3 22.0 44.4 50.5 — 19.3 40.9 37.8 — 8.4 11.0 13.4 33.4 4.2 7.4 5.1 10.5
4 34.8 61.0 68.1 — 29.3 48.3 56.6 — 14.2 16.7 28.0 — 9.9 9.3 12.6 —
5 49.0 64.8 — — 40.5 54.6 68.2 — 21.5 24.8 46.6 — 15.6 11.4 27.2 —
6 66.5 71.4 — — 52.1 57.2 — — 27.5 30.2 — — 23.0 22.6 — —
*Group 1, September 1985-December 1987; group 2, January 1988-December 1989; group 3, January 1990-December 1991; group 4, January 1992-January 1995.
Papers
1233BMJ VOLUME 314 26 APRIL 1997
ResultsFrom September 1985 to January 1995, 285 patientswere included in the study. The median age at serocon-version was 27 (range 17-61) years; 208 (73%) weremen. According to the risk factors 163 (57%) wereinjecting drug users, 64 (22%) male homosexuals, 56(20%) heterosexuals, and 2 (1%) had other risk factors.Fifty one patients (18%) had acute primary HIV infec-tion. The median time in days was 182 (range 21-337)between the last negative and the first positive testresult; 1710 (363-3672) for length of follow up; 91(1-168) between the first positive test result and firstfollow up visit; and 83 (36-182) for the interval betweenvisits, which was similar in the different risk groups.
Table 1 shows the baseline characteristics of thefour groups of patients divided according to their dateof seroconversion date. When we compared thebaseline characteristics of the four groups we founddifferences in sex and in transmission by injecting druguse and by heterosexual contacts (P = 0.019,P = 0.0010, and P = 0.00003 respectively). HIV infec-tion through drug addiction and heterosexual sex weresymmetrically distributed throughout the study period.In the mid-1980s most of those who seroconvertedwere men, but the number of subjects infected hetero-sexually and the number of women, particularly thoseinfected heterosexually, increased progressively. At thefirst visit, 54 patients (19%) had circulating HIV p24antigen > 10 ng/l. The groups did not differ in theintervals between the last negative and the first positive
test result or in the temporary loss to follow up or insocioeconomic, lifestyle, and laboratory measure-ments. Overall, 110 (60%) patients began a course ofantiretroviral treatment at some time during follow up.The four groups did not differ in CD4 cell count at thestart of antiretroviral treatment, and all subjects usednebulised pentamidine as prophylaxis against Pneumo-cystis carinii pneumonia when the CD4 count fell to< 200 × 106 cells/l. CD4 cell counts from before sero-conversion were available in 53 patients (19%), and thegroups did not differ in the CD4 cell count beforeseroconversion. Thirty patients (46%) who serocon-verted between September 1985 and December 1987,14 (22%) between January 1988 and December 1989,17 (26%) between January 1990 and December 1991,and 4 (6%) between January 1992 and January 1995developed AIDS.
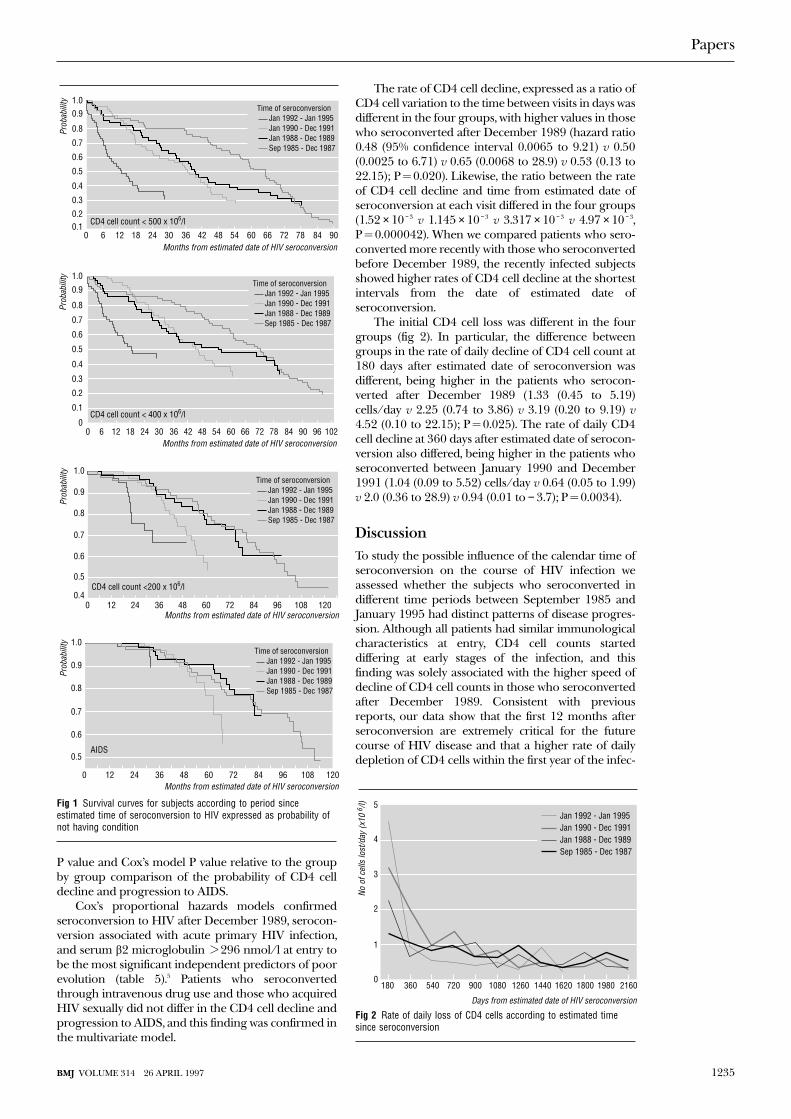
When we compared the probability curves of CD4lymphocyte count falling to < 500, 400, and 200 × 106
cells/l and AIDS progression, patients who serocon-verted after December 1989 showed earlier declinesand faster progression than did those who serocon-verted before (P < 0.0001, P = 0.0001, P = 0.0037, andP = 0.19, respectively). Figure 1 shows the probabilitycurves of CD4 lymphocyte count falling to < 500, 400,and 200 × 106 cells/l and AIDS progression in the fourgroups. Table 2 shows the cumulative estimates of thecell count falling to the end points and the progressionto AIDS by time intervals from the seroconversion inthe four groups. Tables 3 and 4 show the log rank test
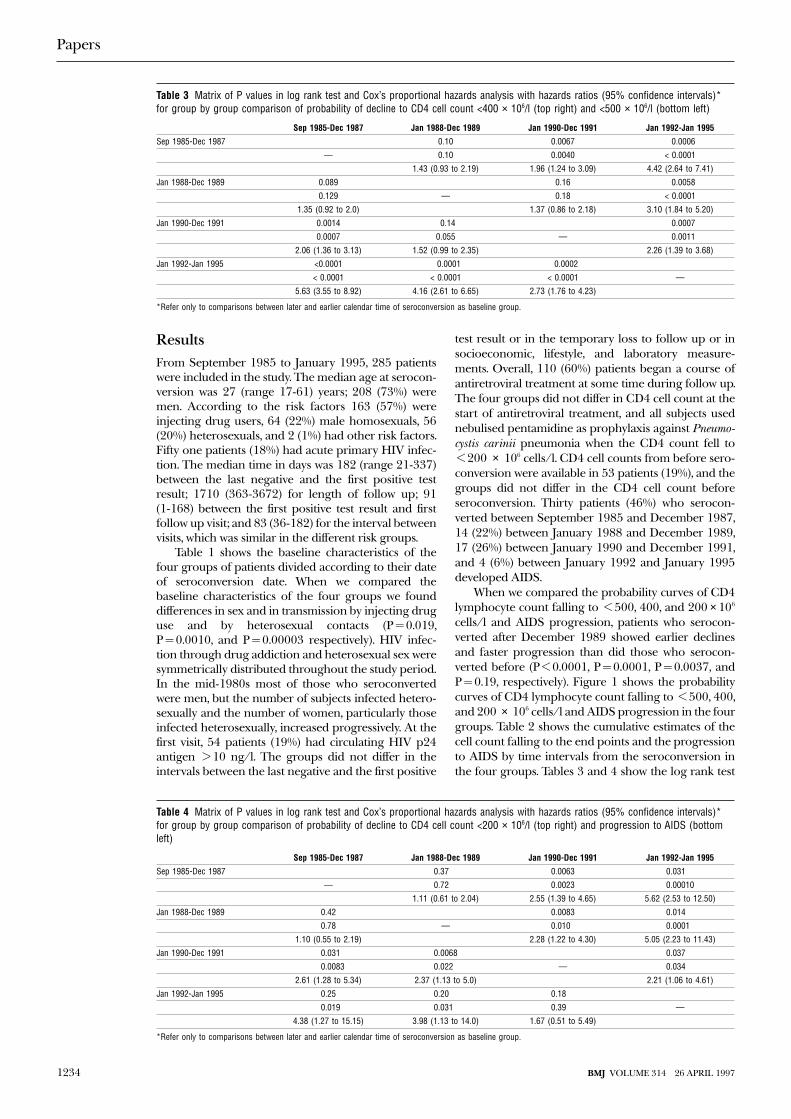
Table 3 Matrix of P values in log rank test and Cox’s proportional hazards analysis with hazards ratios (95% confidence intervals)*for group by group comparison of probability of decline to CD4 cell count <400 × 106/l (top right) and <500 × 106/l (bottom left)
Sep 1985-Dec 1987 Jan 1988-Dec 1989 Jan 1990-Dec 1991 Jan 1992-Jan 1995
Sep 1985-Dec 1987 0.10 0.0067 0.0006
— 0.10 0.0040 < 0.0001
1.43 (0.93 to 2.19) 1.96 (1.24 to 3.09) 4.42 (2.64 to 7.41)
Jan 1988-Dec 1989 0.089 0.16 0.0058
0.129 — 0.18 < 0.0001
1.35 (0.92 to 2.0) 1.37 (0.86 to 2.18) 3.10 (1.84 to 5.20)
Jan 1990-Dec 1991 0.0014 0.14 0.0007
0.0007 0.055 — 0.0011
2.06 (1.36 to 3.13) 1.52 (0.99 to 2.35) 2.26 (1.39 to 3.68)
Jan 1992-Jan 1995 <0.0001 0.0001 0.0002
< 0.0001 < 0.0001 < 0.0001 —
5.63 (3.55 to 8.92) 4.16 (2.61 to 6.65) 2.73 (1.76 to 4.23)
*Refer only to comparisons between later and earlier calendar time of seroconversion as baseline group.
Table 4 Matrix of P values in log rank test and Cox’s proportional hazards analysis with hazards ratios (95% confidence intervals)*for group by group comparison of probability of decline to CD4 cell count <200 × 106/l (top right) and progression to AIDS (bottomleft)
Sep 1985-Dec 1987 Jan 1988-Dec 1989 Jan 1990-Dec 1991 Jan 1992-Jan 1995
Sep 1985-Dec 1987 0.37 0.0063 0.031
— 0.72 0.0023 0.00010
1.11 (0.61 to 2.04) 2.55 (1.39 to 4.65) 5.62 (2.53 to 12.50)
Jan 1988-Dec 1989 0.42 0.0083 0.014
0.78 — 0.010 0.0001
1.10 (0.55 to 2.19) 2.28 (1.22 to 4.30) 5.05 (2.23 to 11.43)
Jan 1990-Dec 1991 0.031 0.0068 0.037
0.0083 0.022 — 0.034
2.61 (1.28 to 5.34) 2.37 (1.13 to 5.0) 2.21 (1.06 to 4.61)
Jan 1992-Jan 1995 0.25 0.20 0.18
0.019 0.031 0.39 —
4.38 (1.27 to 15.15) 3.98 (1.13 to 14.0) 1.67 (0.51 to 5.49)
*Refer only to comparisons between later and earlier calendar time of seroconversion as baseline group.
Papers
1234 BMJ VOLUME 314 26 APRIL 1997
P value and Cox’s model P value relative to the groupby group comparison of the probability of CD4 celldecline and progression to AIDS.
Cox’s proportional hazards models confirmedseroconversion to HIV after December 1989, serocon-version associated with acute primary HIV infection,and serum â2 microglobulin > 296 nmol/l at entry tobe the most significant independent predictors of poorevolution (table 5).5 Patients who seroconvertedthrough intravenous drug use and those who acquiredHIV sexually did not differ in the CD4 cell decline andprogression to AIDS, and this finding was confirmed inthe multivariate model.
The rate of CD4 cell decline, expressed as a ratio ofCD4 cell variation to the time between visits in days wasdifferent in the four groups, with higher values in thosewho seroconverted after December 1989 (hazard ratio0.48 (95% confidence interval 0.0065 to 9.21) v 0.50(0.0025 to 6.71) v 0.65 (0.0068 to 28.9) v 0.53 (0.13 to22.15); P = 0.020). Likewise, the ratio between the rateof CD4 cell decline and time from estimated date ofseroconversion at each visit differed in the four groups(1.52 × 10 − 3 v 1.145 × 10 − 3 v 3.317 × 10 − 3 v 4.97 × 10 − 3,P = 0.000042). When we compared patients who sero-converted more recently with those who seroconvertedbefore December 1989, the recently infected subjectsshowed higher rates of CD4 cell decline at the shortestintervals from the date of estimated date ofseroconversion.
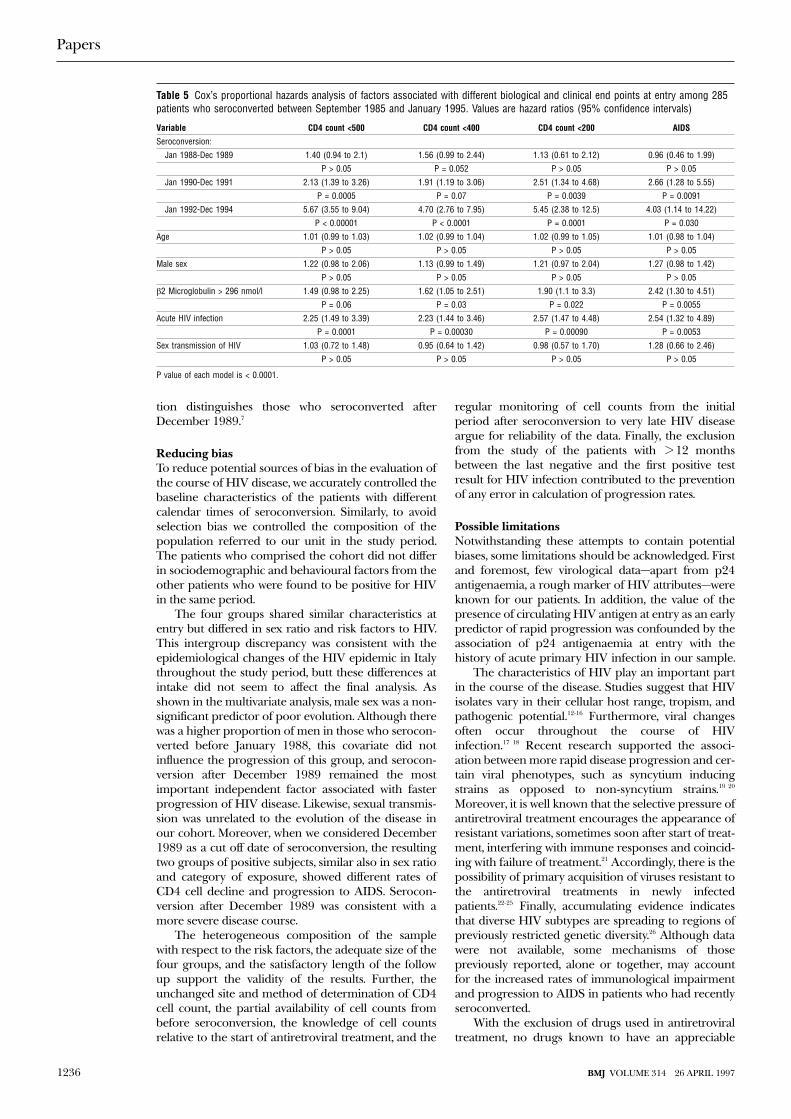
The initial CD4 cell loss was different in the fourgroups (fig 2). In particular, the difference betweengroups in the rate of daily decline of CD4 cell count at180 days after estimated date of seroconversion wasdifferent, being higher in the patients who serocon-verted after December 1989 (1.33 (0.45 to 5.19)cells/day v 2.25 (0.74 to 3.86) v 3.19 (0.20 to 9.19) v4.52 (0.10 to 22.15); P = 0.025). The rate of daily CD4cell decline at 360 days after estimated date of serocon-version also differed, being higher in the patients whoseroconverted between January 1990 and December1991 (1.04 (0.09 to 5.52) cells/day v 0.64 (0.05 to 1.99)v 2.0 (0.36 to 28.9) v 0.94 (0.01 to − 3.7); P = 0.0034).
DiscussionTo study the possible influence of the calendar time ofseroconversion on the course of HIV infection weassessed whether the subjects who seroconverted indifferent time periods between September 1985 andJanuary 1995 had distinct patterns of disease progres-sion. Although all patients had similar immunologicalcharacteristics at entry, CD4 cell counts starteddiffering at early stages of the infection, and thisfinding was solely associated with the higher speed ofdecline of CD4 cell counts in those who seroconvertedafter December 1989. Consistent with previousreports, our data show that the first 12 months afterseroconversion are extremely critical for the futurecourse of HIV disease and that a higher rate of dailydepletion of CD4 cells within the first year of the infec-
Months from estimated date of HIV seroconversion
Prob
abili
ty
48362412 5442301860
0.3
0.4
0.5
0.6
0.7
0.8
0.91.0
0.20.1
847260 907866
CD4 cell count < 500 x 106/l
Time of seroconversion Jan 1992 - Jan 1995 Jan 1990 - Dec 1991 Jan 1988 - Dec 1989 Sep 1985 - Dec 1987
Months from estimated date of HIV seroconversion
Prob
abili
ty
48362412 5442301860
0.3
0.4
0.5
0.6
0.7
0.8
0.9
1.0
0.2
0.1
096847260 102907866
CD4 cell count < 400 x 106/l
Time of seroconversion Jan 1992 - Jan 1995 Jan 1990 - Dec 1991 Jan 1988 - Dec 1989 Sep 1985 - Dec 1987
Months from estimated date of HIV seroconversion
Prob
abili
ty
483624120
0.6
0.7
0.8
0.9
1.0
0.5
0.4847260 12010896
CD4 cell count <200 x 106/l
Time of seroconversion Jan 1992 - Jan 1995 Jan 1990 - Dec 1991 Jan 1988 - Dec 1989 Sep 1985 - Dec 1987
Months from estimated date of HIV seroconversion
Prob
abili
ty
483624120
0.6
0.7
0.8
0.9
1.0
0.5
847260 12010896
AIDS
Time of seroconversion Jan 1992 - Jan 1995 Jan 1990 - Dec 1991 Jan 1988 - Dec 1989 Sep 1985 - Dec 1987
Fig 1 Survival curves for subjects according to period sinceestimated time of seroconversion to HIV expressed as probability ofnot having condition
5
4
3
2
1
0180 360 540 720 900 1080 1260 1440 1620 1800 1980 2160
Days from estimated date of HIV seroconversion
No o
f cel
ls lo
st/d
ay (x
10 6 /
l)
Jan 1992 - Jan 1995Jan 1990 - Dec 1991Jan 1988 - Dec 1989Sep 1985 - Dec 1987
Fig 2 Rate of daily loss of CD4 cells according to estimated timesince seroconversion
Papers
1235BMJ VOLUME 314 26 APRIL 1997
tion distinguishes those who seroconverted afterDecember 1989.7
Reducing biasTo reduce potential sources of bias in the evaluation ofthe course of HIV disease, we accurately controlled thebaseline characteristics of the patients with differentcalendar times of seroconversion. Similarly, to avoidselection bias we controlled the composition of thepopulation referred to our unit in the study period.The patients who comprised the cohort did not differin sociodemographic and behavioural factors from theother patients who were found to be positive for HIVin the same period.
The four groups shared similar characteristics atentry but differed in sex ratio and risk factors to HIV.This intergroup discrepancy was consistent with theepidemiological changes of the HIV epidemic in Italythroughout the study period, butt these differences atintake did not seem to affect the final analysis. Asshown in the multivariate analysis, male sex was a non-significant predictor of poor evolution. Although therewas a higher proportion of men in those who serocon-verted before January 1988, this covariate did notinfluence the progression of this group, and serocon-version after December 1989 remained the mostimportant independent factor associated with fasterprogression of HIV disease. Likewise, sexual transmis-sion was unrelated to the evolution of the disease inour cohort. Moreover, when we considered December1989 as a cut off date of seroconversion, the resultingtwo groups of positive subjects, similar also in sex ratioand category of exposure, showed different rates ofCD4 cell decline and progression to AIDS. Serocon-version after December 1989 was consistent with amore severe disease course.
The heterogeneous composition of the samplewith respect to the risk factors, the adequate size of thefour groups, and the satisfactory length of the followup support the validity of the results. Further, theunchanged site and method of determination of CD4cell count, the partial availability of cell counts frombefore seroconversion, the knowledge of cell countsrelative to the start of antiretroviral treatment, and the
regular monitoring of cell counts from the initialperiod after seroconversion to very late HIV diseaseargue for reliability of the data. Finally, the exclusionfrom the study of the patients with > 12 monthsbetween the last negative and the first positive testresult for HIV infection contributed to the preventionof any error in calculation of progression rates.
Possible limitationsNotwithstanding these attempts to contain potentialbiases, some limitations should be acknowledged. Firstand foremost, few virological data—apart from p24antigenaemia, a rough marker of HIV attributes—wereknown for our patients. In addition, the value of thepresence of circulating HIV antigen at entry as an earlypredictor of rapid progression was confounded by theassociation of p24 antigenaemia at entry with thehistory of acute primary HIV infection in our sample.
The characteristics of HIV play an important partin the course of the disease. Studies suggest that HIVisolates vary in their cellular host range, tropism, andpathogenic potential.12-16 Furthermore, viral changesoften occur throughout the course of HIVinfection.17 18 Recent research supported the associ-ation between more rapid disease progression and cer-tain viral phenotypes, such as syncytium inducingstrains as opposed to non-syncytium strains.19 20
Moreover, it is well known that the selective pressure ofantiretroviral treatment encourages the appearance ofresistant variations, sometimes soon after start of treat-ment, interfering with immune responses and coincid-ing with failure of treatment.21 Accordingly, there is thepossibility of primary acquisition of viruses resistant tothe antiretroviral treatments in newly infectedpatients.22-25 Finally, accumulating evidence indicatesthat diverse HIV subtypes are spreading to regions ofpreviously restricted genetic diversity.26 Although datawere not available, some mechanisms of thosepreviously reported, alone or together, may accountfor the increased rates of immunological impairmentand progression to AIDS in patients who had recentlyseroconverted.
With the exclusion of drugs used in antiretroviraltreatment, no drugs known to have an appreciable
Table 5 Cox’s proportional hazards analysis of factors associated with different biological and clinical end points at entry among 285patients who seroconverted between September 1985 and January 1995. Values are hazard ratios (95% confidence intervals)
Variable CD4 count <500 CD4 count <400 CD4 count <200 AIDS
Seroconversion:
Jan 1988-Dec 1989 1.40 (0.94 to 2.1) 1.56 (0.99 to 2.44) 1.13 (0.61 to 2.12) 0.96 (0.46 to 1.99)
P > 0.05 P = 0.052 P > 0.05 P > 0.05
Jan 1990-Dec 1991 2.13 (1.39 to 3.26) 1.91 (1.19 to 3.06) 2.51 (1.34 to 4.68) 2.66 (1.28 to 5.55)
P = 0.0005 P = 0.07 P = 0.0039 P = 0.0091
Jan 1992-Dec 1994 5.67 (3.55 to 9.04) 4.70 (2.76 to 7.95) 5.45 (2.38 to 12.5) 4.03 (1.14 to 14.22)
P < 0.00001 P < 0.0001 P = 0.0001 P = 0.030
Age 1.01 (0.99 to 1.03) 1.02 (0.99 to 1.04) 1.02 (0.99 to 1.05) 1.01 (0.98 to 1.04)
P > 0.05 P > 0.05 P > 0.05 P > 0.05
Male sex 1.22 (0.98 to 2.06) 1.13 (0.99 to 1.49) 1.21 (0.97 to 2.04) 1.27 (0.98 to 1.42)
P > 0.05 P > 0.05 P > 0.05 P > 0.05
â2 Microglobulin > 296 nmol/l 1.49 (0.98 to 2.25) 1.62 (1.05 to 2.51) 1.90 (1.1 to 3.3) 2.42 (1.30 to 4.51)
P = 0.06 P = 0.03 P = 0.022 P = 0.0055
Acute HIV infection 2.25 (1.49 to 3.39) 2.23 (1.44 to 3.46) 2.57 (1.47 to 4.48) 2.54 (1.32 to 4.89)
P = 0.0001 P = 0.00030 P = 0.00090 P = 0.0053
Sex transmission of HIV 1.03 (0.72 to 1.48) 0.95 (0.64 to 1.42) 0.98 (0.57 to 1.70) 1.28 (0.66 to 2.46)
P > 0.05 P > 0.05 P > 0.05 P > 0.05
P value of each model is < 0.0001.
Papers
1236 BMJ VOLUME 314 26 APRIL 1997
impact on CD4 cells were extensively used in the studypopulation, but we do not know whether methadonetreatment affects HIV disease.27 28 This potential biascould be important for the final analysis because of thelarge proportion of injecting drug users in our cohort;however, it would have been minimised by the fact thatthose who seroconverted had the same access tomethadone treatment as those who did not.
Thirdly, another confounder could be laboratorydrift of the CD4 cell determinations over time.29-31
Within the laboratory, however, CD4 measurements atsix month intervals in a healthy control group showedno variations, and CD4 cell counts remainedunchanged among subjects acting as controls.
In the multivariate model, seroconversion afterDecember 1989 and acute primary HIV infection wereconfirmed as the most important independent factorsof disease progression.32 In the Italian seroconversionstudy, older age at seroconversion was associated with afaster progression to AIDS.33 This discrepancy with ourdata could be explained by the different compositionof our cohort.
ConclusionsThe emergence of more virulent strains due tomultiple biological mechanisms may be responsiblefor more aggressive course of HIV disease in patientswho have recently seroconverted. Our findings suggestpossible changes in the course of HIV epidemic in the1990s and raise intriguing issues on the course of HIVinfection. If our data are confirmed, therapeuticapproaches to the infection will need to be reviewed. Inparticular, if HIV disease has become more aggressive,more frequent screening would be essential to identifypatients who have just seroconverted and could benefitfrom early antiretroviral treatment.
Funding: No external funding.Conflict of interest: None.
1 Taylor JMG, Kuo JM, Detels R. Is the incubation period of AIDS length-ening? J AIDS 1991;4:69-75.
2 Weiss PJ, Brodine SK, Goforth RR, Kennedy CA, Wallace MR, Olson PE,et al. Initial low CD4 + lymphocyte counts in recent human immunode-ficiency virus infection and lack of association with identified coinfections.J Infect Dis 1992;166:1149-53.
3 Gorham ED, Garland FC, Mayer DL, Goforth RR, Brodine SK, Weiss PJ,et al. CD4 lymphocyte counts within 24 months of human immunodefi-ciency virus seroconversion. Arch Intern Med 1993;153:869-76.
4 O’Brien TR, Hoover DH, Rosemberg PS, Chen B, Detels R, Kingsley LA,et al. Evaluation of secular trends in CD4 + lymphocytes loss amonghuman immunodeficiency virus type 1 (HIV-1)-infected men with knowndates of seroconversion. Am J Epidemiol 1995;142:636-42.
5 Homberg SD, Conley LJ, Luby SP, Cohn S, Wong LC, Vlahov D. Recentinfection with human immunodeficiency virus and possible rapid loss ofCD4 T lymphocytes. J AIDS 1995;9:291-6.
6 Schwarcz SK, Kellog TA, Kohn RP, Mitchell HK, Lemp GF, Bolan GA.Temporal trends in human immunodeficiency seroprevalence and sexualbehavior at the San Francisco municipal sexually transmitted diseaseclinic. Am J Epidemiol 1995;142:314-22.
7 Galai N, Cozzi-Lepri A, Vlahov D, Pezzotti P, Sinicco A, Rezza G. Tempo-ral trends of initial CD4 cell counts following human immunodeficiencyvirus seroconversion in Italy, 1985-1992. Am J Epidemiol 1996;143(2):278-83.
8 Centers for Diseases Control. Revision of the CDC surveillance case defi-nition for acquired immunodeficiency syndrome. MMWR 1987;36(suppl1S):3-15S.
9 Cox DR, Oakes D. Analysis of survival data. New York: Chapman Hall,1984.
10 Statsoft. Statistica 5.0. Tulsa: Statsoft, 1995.11 SPSS. Statistical package for the social sciences. Version 6.0. Chicago: 1993.12 Cheng-Mayer C, Seto D, Tateno M, Levy JA. Biologic features of HIV-1
that correlate with virulence in the host. Science 1988;240:80-2.13 Schuitemaker H, Koot M, Kootstra NA, Dercksen MW, De Goede REY,
Van Steenwijk RP, et al. Biological phenotype of human immunodefi-ciency virus type 1 clones at different stages of infection: progression ofdisease is associated with a shift from monocytotropic to T-cell-tropicvirus population. J Virol 1992;66:1354-60.
14 Connor RI, Mohri H, Cao Y, Ho DD. Increased viral burden andcytopathicity correlate temporally with CD4 + T-lymphocyte decline andclinical progression in humanimmunodeficiency virus type 1-infectedindividuals. J Virol 1993;67:1772-7.
15 Fenyö EM, Morfeldt-Månsson L, Chiodi F, Lind B, Von Gegerfeld A,Albert J, et al. Distinct replicative and cyopathic characteristics of humanimmunodeficiency virus isolates. J Virol 1992;66:4414-9.
16 Cloyd MW, Moore BE. Spectrum of biologic properties of human immu-nodeficiency virus isolates. Virology 1990;174:103-16.
17 Saag MS, Hahn BH, Gibbons J, Li Y, Parks ES, Parks WP, et al. Extensivevariation of human immunodeficiency virus type 1 in vivo. Nature1988;334:440-4.
18 Lee TH, Sheppard HW, Reis M, Dondero D, Osmond D, Osmond D, et al.Circulating HIV-infected cell burden from seroconversion to AIDS:importance of postseroconversion viral load on disease course. J AIDS1994;7:381-9.
19 Richman DD, Bozzette SA. The impact of the syncytium-inducingphenotype of human immunodeficiency virus on disease progression. JInfect Dis 1994;169:968-74.
20 St Clair MH, Hartigan PM, Andrews JC, Vavro CL, Simberkoff MS, Ham-ilton JD and the VA Cooperative Study Group. Zidovudine resistance,syncytium-inducing phenotype, and HIV disease progression in acase-control study. J AIDS 1993;6:891-7.
21 Heagy W, Crumpacker C, Lopez PA, Finberg RW. Inhibition of immunefunctions by antiretroviral drugs. J Clin Invest 1991;87:1916-24.
22 Erice A, Mayers DL, Strike DG, Sannerud KJ, McCutchan FE, Henry K, etal. Brief report: primary infection with zidovudine resistant humanimmunodeficiency virus type 1. N Engl J Med 1993;328:1163-5.
23 Siegrist CA, Yerly S, Kaiser L, Wyler CA, Perrin L. Mother to child trans-mission of zidovudine resistant HIV-1. Lancet 1994;344:1771-2.
24 Loveday C, Kaye S, Tenant-Flowers M, Semple M, Ayliffe U, Weller IVD, etal. HIV-1 RNA serum load and resistant viral genotypes during earlyzidovudine therapy. Lancet 1995;345:820-4.
25 Larder BA, Kemp SD. Multiple mutations in HIV-1 reverse transcriptaseconfer high level resistance to zidovudine (AZT). Science 1989;246:1155-8.
26 Hu DJ, Dondero TJ, Rayfield MA, George JR, Schochetman G, Jaffe HW,et al. Theemerging genetic diversity of HIV. JAMA 1996;275:210-6.
27 Lowinson JH, Ruiz P, MillmanRB. Comprehensive textbook of substance abuse.2nd ed. New York: Williams and Wilkins, 1992.
28 Ball JC, Ross A. The effectiveness of methadone maintenance treatment. NewYork: Springer-Verlag, 1991.
29 Malone JL, Simms TE, Gray GC, Wagner KF, Burge JR, Burke DS.Sources of variability in repeated T-helper lymphocyte counts fromhuman immunodeficiency virus type 1-infected patients: total lym-phocyte count fluctuations and diurnal cycle are important. J AIDS1990;3:144-51.
30 Giorgi JV, Cheng HL, Margolick JB, Bauer KD, Ferbas J, Waxdal M, et al.Quality control in the flow cytometric measurements of T-lymphocytesubsets: the multicenter AIDS cohort study experience. Clin ImmunolImmunopathol 1990;55:173-86.
31 Adleman LM, Wofsy D. T-cell homeostasis: implications in HIV infection.J AIDS 1993;6:144-52.
32 Sinicco A, Fora R, Sciandra M, Lucchini A, Caramello P, Gioannini P. Riskof developing AIDS after primary acute HIV-1 infection. J AIDS1993;6:575-81.
33 Rezza G, Dorrucci M, Pezzotti P, Lazzarin, Angarano, Sinicco A, et al. Theseroconversion study on the natural history of HIV infection. In: NicolosiA, ed. HIV epidemiology: models and methods. New York: Raven Press,1994:279-91.
(Accepted 23 January 1997)
Key messages
x Interest in possible changes in the course of HIV infection hasrecently increased
x Previous research has shown no clear trend for changes in CD4 cellcount by interval after HIV seroconversion
x Results from a large and heterogeneous cohort of patients whoseroconverted between September 1985 and January 1995 showedthat the patients who seroconverted after December 1989 had ahigher probability of decline in CD4 cell count and progression toAIDS than did patients who had seroconverted before this date
x The overall rate of decline in CD4 cell count was higher in patientswho seroconverted after December 1989; 180 days afterseroconversion the rate was highest in those who seroconvertedafter December 1989, and 360 days after seroconversion it washighest in those who seroconverted after December 1989 andbefore January 1991
x Repeated monitoring within the first months after HIVseroconversion is needed to identify those patients who couldbenefit from early antiretroviral treatment
Papers
1237BMJ VOLUME 314 26 APRIL 1997
Meta-analysis of prophylactic or empirical antifungaltreatment versus placebo or no treatment in patients withcancer complicated by neutropeniaPeter C Gøtzsche, Helle Krogh Johansen
AbstractObjective: To determine whether antifungal agentsgiven prophylactically or empirically decreasemorbidity and mortality in patients with cancercomplicated by neutropenia.Design: Meta-analysis of randomised trials ofamphotericin B, various lipid soluble formulations ofamphotericin B (for example, AmBisome),fluconazole, ketoconazole, miconazole, or itraconazolecompared with placebo or no treatment.Setting: Trials conducted anywhere in the world.Subjects: Patients with cancer complicated byneutropenia.Main outcome measures: Mortality, invasive fungalinfection (defined as positive blood culture,oesophageal candidiasis, or lung or deep tissueinfection), and colonisation.Results: 24 trials with 2758 randomised patients werereviewed; the total number of deaths was 434.Prophylactic or empirical treatment with antifungalsas a group had no effect on mortality (odds ratio 0.92;95% confidence interval 0.74 to 1.14). AmphotericinB decreased mortality significantly (0.58; 0.37 to 0.93)but the studies were small and the difference innumber of deaths was only 15. Antifungal treatmentdecreased the incidence of invasive fungal infection(0.47; 0.35 to 0.64) and fungal colonisation (0.45; 0.30to 0.69). For every 73 patients treated (95%confidence interval 48 to 158) one case of fungalinvasion was prevented in surviving patients.Conclusions: There seems to be no survival benefit ofantifungal agents given prophylactically or empiricallyto patients with cancer complicated by neutropenia.These agents should be restricted to patients withproved infection and those in randomised trials. Alarge, definitive placebo controlled trial ofamphotericin B is needed.
IntroductionBacterial infections are a major cause of death inpatients with cancer,1 particularly when they haveneutropenia.2 Disseminated fungal infection, mostoften caused by Candida and Aspergillus species,3 is alsoconsidered to be an important cause of morbidity andmortality.4 5 The death rate in patients with candidasepsis or deep tissue infection is around 75%,4 5 and apositive blood culture or histological evidence of inva-sion was found before death in 37% of patients in oneseries.2
Antifungal agents are often given prophylacticallyin conjunction with chemotherapy or bone marrowtransplantation or empirically to patients withoutdocumented fungal infection but with persistent feverdespite antibiotics. The rationale is to start treatmentbefore it is too late—that is, before death is inevit-
able—as it is difficult to diagnose an invasive fungalinfection with certainty.4 6 Studies with historicalcontrols have shown a positive effect of antifungalagents on mortality,3 7 but such non-randomised com-parisons substantially overestimate the effect of cancertreatments.8 Randomised studies have yielded varyingresults, and the power of most of them has been verylow. We conducted a meta-analysis of trials in which acommonly used antifungal agent was compared withnon-treatment in a control group.
MethodsThe primary aim was to determine whether commonlyused antifungal agents decrease mortality. Secondaryvariables were the effect on invasive fungal infectionand colonisation.
Search strategyAll randomised trials, irrespective of language, ofamphotericin B, various lipid soluble formulations ofamphotericin B (for example, AmBisome), fluconazole,ketoconazole, miconazole, or itraconazole comparedwith placebo or no treatment in patients with cancercomplicated by neutropenia were eligible. We excludedstudies which solely concerned treatment or preven-tion of oral candidiasis. A Medline search from 1966on SilverPlatter was developed iteratively. The finalstrategy could retrieve all relevant trials from whateversource if they were registered in Medline. The searchwas most recently updated in February 1996.
One or more of random*, control*, blind*, clinical-trialin pt, clinical-trials/all subheadings, placebo*, andtg=comparative-study were combined with one or moreof amphotericin, AmBisome, fluconazol*, itraconazol*,ketoconazol*, and miconazol* and with one or more ofbone?marrow*, transplant*, cancer*, fungemia, h?emato-logic*, malignanc*, neoplas*, neutropeni*, granulocytopeni*,leuk?emi*, lymphom*, sepsis, septic*, intensive-care/allsubheadings, intensive care, and immunodeficiency. Infor-mation about trials not registered in Medline,including unpublished trials, were located by contact-ing the pharmaceutical industry and the authors andby scanning reference lists of articles and reviews. Wealso scanned selected conference proceedings—namely, the interscience conference of antimicrobialagents and chemotherapy, 1990-5; the general meetingof the American Society for Microbiology, 1990-5; andthe seventh European congress of clinical microbiol-ogy and infectious diseases, 1995.
Data extractionDecisions on which trials to include and whichvariables to use when more options were available forthe same outcome were based on the methods sectionsof the trials only. Details on diagnosis, drug, dose, rules
Papers
The NordicCochrane Centre,Rigshospitalet,Department 7112,DK-2200Copenhagen N,DenmarkPeter C Gøtzsche,directorHelle KroghJohansen,senior researcher
Correspondence to:Dr Gøtzsche.
BMJ 1997;314:1238–44
1238 BMJ VOLUME 314 26 APRIL 1997
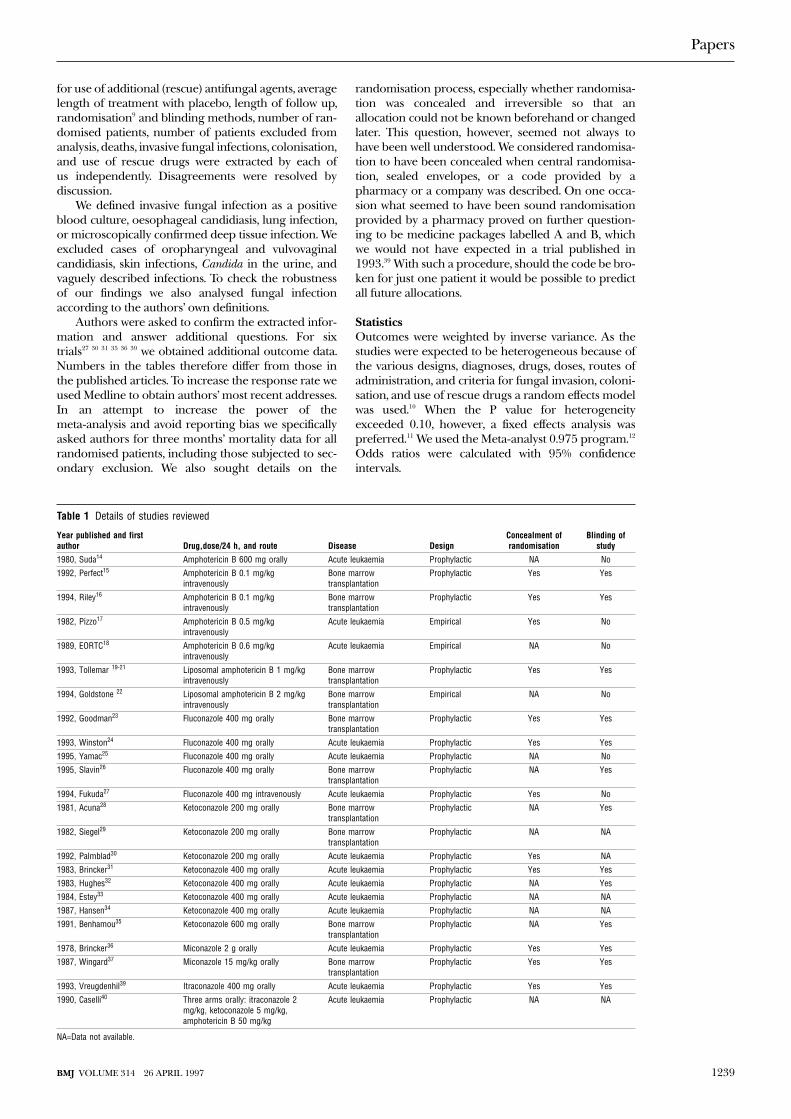
for use of additional (rescue) antifungal agents, averagelength of treatment with placebo, length of follow up,randomisation9 and blinding methods, number of ran-domised patients, number of patients excluded fromanalysis, deaths, invasive fungal infections, colonisation,and use of rescue drugs were extracted by each ofus independently. Disagreements were resolved bydiscussion.
We defined invasive fungal infection as a positiveblood culture, oesophageal candidiasis, lung infection,or microscopically confirmed deep tissue infection. Weexcluded cases of oropharyngeal and vulvovaginalcandidiasis, skin infections, Candida in the urine, andvaguely described infections. To check the robustnessof our findings we also analysed fungal infectionaccording to the authors’ own definitions.
Authors were asked to confirm the extracted infor-mation and answer additional questions. For sixtrials27 30 31 35 36 39 we obtained additional outcome data.Numbers in the tables therefore differ from those inthe published articles. To increase the response rate weused Medline to obtain authors’ most recent addresses.In an attempt to increase the power of themeta-analysis and avoid reporting bias we specificallyasked authors for three months’ mortality data for allrandomised patients, including those subjected to sec-ondary exclusion. We also sought details on the
randomisation process, especially whether randomisa-tion was concealed and irreversible so that anallocation could not be known beforehand or changedlater. This question, however, seemed not always tohave been well understood. We considered randomisa-tion to have been concealed when central randomisa-tion, sealed envelopes, or a code provided by apharmacy or a company was described. On one occa-sion what seemed to have been sound randomisationprovided by a pharmacy proved on further question-ing to be medicine packages labelled A and B, whichwe would not have expected in a trial published in1993.39 With such a procedure, should the code be bro-ken for just one patient it would be possible to predictall future allocations.
StatisticsOutcomes were weighted by inverse variance. As thestudies were expected to be heterogeneous because ofthe various designs, diagnoses, drugs, doses, routes ofadministration, and criteria for fungal invasion, coloni-sation, and use of rescue drugs a random effects modelwas used.10 When the P value for heterogeneityexceeded 0.10, however, a fixed effects analysis waspreferred.11 We used the Meta-analyst 0.975 program.12
Odds ratios were calculated with 95% confidenceintervals.
Table 1 Details of studies reviewed
Year published and firstauthor Drug,dose/24 h, and route Disease Design
Concealment ofrandomisation
Blinding ofstudy
1980, Suda14 Amphotericin B 600 mg orally Acute leukaemia Prophylactic NA No
1992, Perfect15 Amphotericin B 0.1 mg/kgintravenously
Bone marrowtransplantation
Prophylactic Yes Yes
1994, Riley16 Amphotericin B 0.1 mg/kgintravenously
Bone marrowtransplantation
Prophylactic Yes Yes
1982, Pizzo17 Amphotericin B 0.5 mg/kgintravenously
Acute leukaemia Empirical Yes No
1989, EORTC18 Amphotericin B 0.6 mg/kgintravenously
Acute leukaemia Empirical NA No
1993, Tollemar 19-21 Liposomal amphotericin B 1 mg/kgintravenously
Bone marrowtransplantation
Prophylactic Yes Yes
1994, Goldstone 22 Liposomal amphotericin B 2 mg/kgintravenously
Bone marrowtransplantation
Empirical NA No
1992, Goodman23 Fluconazole 400 mg orally Bone marrowtransplantation
Prophylactic Yes Yes
1993, Winston24 Fluconazole 400 mg orally Acute leukaemia Prophylactic Yes Yes
1995, Yamac25 Fluconazole 400 mg orally Acute leukaemia Prophylactic NA No
1995, Slavin26 Fluconazole 400 mg orally Bone marrowtransplantation
Prophylactic NA Yes
1994, Fukuda27 Fluconazole 400 mg intravenously Acute leukaemia Prophylactic Yes No
1981, Acuna28 Ketoconazole 200 mg orally Bone marrowtransplantation
Prophylactic NA Yes
1982, Siegel29 Ketoconazole 200 mg orally Bone marrowtransplantation
Prophylactic NA NA
1992, Palmblad30 Ketoconazole 200 mg orally Acute leukaemia Prophylactic Yes NA
1983, Brincker31 Ketoconazole 400 mg orally Acute leukaemia Prophylactic Yes Yes
1983, Hughes32 Ketoconazole 400 mg orally Acute leukaemia Prophylactic NA Yes
1984, Estey33 Ketoconazole 400 mg orally Acute leukaemia Prophylactic NA NA
1987, Hansen34 Ketoconazole 400 mg orally Acute leukaemia Prophylactic NA NA
1991, Benhamou35 Ketoconazole 600 mg orally Bone marrowtransplantation
Prophylactic NA Yes
1978, Brincker36 Miconazole 2 g orally Acute leukaemia Prophylactic Yes Yes
1987, Wingard37 Miconazole 15 mg/kg orally Bone marrowtransplantation
Prophylactic Yes Yes
1993, Vreugdenhil39 Itraconazole 400 mg orally Acute leukaemia Prophylactic Yes Yes
1990, Caselli40 Three arms orally: itraconazole 2mg/kg, ketoconazole 5 mg/kg,amphotericin B 50 mg/kg
Acute leukaemia Prophylactic NA NA
NA=Data not available.
Papers
1239BMJ VOLUME 314 26 APRIL 1997
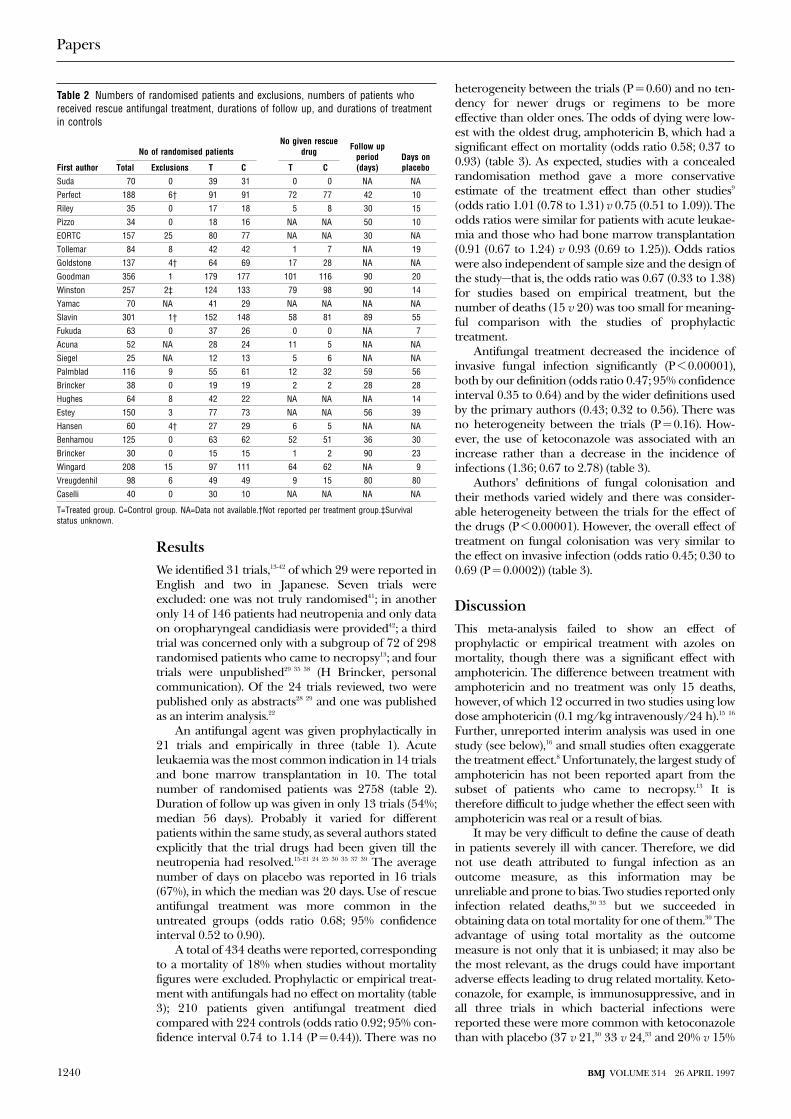
ResultsWe identified 31 trials,13-42 of which 29 were reported inEnglish and two in Japanese. Seven trials wereexcluded: one was not truly randomised41; in anotheronly 14 of 146 patients had neutropenia and only dataon oropharyngeal candidiasis were provided42; a thirdtrial was concerned only with a subgroup of 72 of 298randomised patients who came to necropsy13; and fourtrials were unpublished29 35 38 (H Brincker, personalcommunication). Of the 24 trials reviewed, two werepublished only as abstracts28 29 and one was publishedas an interim analysis.22
An antifungal agent was given prophylactically in21 trials and empirically in three (table 1). Acuteleukaemia was the most common indication in 14 trialsand bone marrow transplantation in 10. The totalnumber of randomised patients was 2758 (table 2).Duration of follow up was given in only 13 trials (54%;median 56 days). Probably it varied for differentpatients within the same study, as several authors statedexplicitly that the trial drugs had been given till theneutropenia had resolved.15-21 24 25 30 35 37 39 The averagenumber of days on placebo was reported in 16 trials(67%), in which the median was 20 days. Use of rescueantifungal treatment was more common in theuntreated groups (odds ratio 0.68; 95% confidenceinterval 0.52 to 0.90).
A total of 434 deaths were reported, correspondingto a mortality of 18% when studies without mortalityfigures were excluded. Prophylactic or empirical treat-ment with antifungals had no effect on mortality (table3); 210 patients given antifungal treatment diedcompared with 224 controls (odds ratio 0.92; 95% con-fidence interval 0.74 to 1.14 (P = 0.44)). There was no
heterogeneity between the trials (P = 0.60) and no ten-dency for newer drugs or regimens to be moreeffective than older ones. The odds of dying were low-est with the oldest drug, amphotericin B, which had asignificant effect on mortality (odds ratio 0.58; 0.37 to0.93) (table 3). As expected, studies with a concealedrandomisation method gave a more conservativeestimate of the treatment effect than other studies9
(odds ratio 1.01 (0.78 to 1.31) v 0.75 (0.51 to 1.09)). Theodds ratios were similar for patients with acute leukae-mia and those who had bone marrow transplantation(0.91 (0.67 to 1.24) v 0.93 (0.69 to 1.25)). Odds ratioswere also independent of sample size and the design ofthe study—that is, the odds ratio was 0.67 (0.33 to 1.38)for studies based on empirical treatment, but thenumber of deaths (15 v 20) was too small for meaning-ful comparison with the studies of prophylactictreatment.
Antifungal treatment decreased the incidence ofinvasive fungal infection significantly (P < 0.00001),both by our definition (odds ratio 0.47; 95% confidenceinterval 0.35 to 0.64) and by the wider definitions usedby the primary authors (0.43; 0.32 to 0.56). There wasno heterogeneity between the trials (P = 0.16). How-ever, the use of ketoconazole was associated with anincrease rather than a decrease in the incidence ofinfections (1.36; 0.67 to 2.78) (table 3).
Authors’ definitions of fungal colonisation andtheir methods varied widely and there was consider-able heterogeneity between the trials for the effect ofthe drugs (P < 0.00001). However, the overall effect oftreatment on fungal colonisation was very similar tothe effect on invasive infection (odds ratio 0.45; 0.30 to0.69 (P = 0.0002)) (table 3).
DiscussionThis meta-analysis failed to show an effect ofprophylactic or empirical treatment with azoles onmortality, though there was a significant effect withamphotericin. The difference between treatment withamphotericin and no treatment was only 15 deaths,however, of which 12 occurred in two studies using lowdose amphotericin (0.1 mg/kg intravenously/24 h).15 16
Further, unreported interim analysis was used in onestudy (see below),16 and small studies often exaggeratethe treatment effect.8 Unfortunately, the largest study ofamphotericin has not been reported apart from thesubset of patients who came to necropsy.13 It istherefore difficult to judge whether the effect seen withamphotericin was real or a result of bias.
It may be very difficult to define the cause of deathin patients severely ill with cancer. Therefore, we didnot use death attributed to fungal infection as anoutcome measure, as this information may beunreliable and prone to bias. Two studies reported onlyinfection related deaths,30 33 but we succeeded inobtaining data on total mortality for one of them.30 Theadvantage of using total mortality as the outcomemeasure is not only that it is unbiased; it may also bethe most relevant, as the drugs could have importantadverse effects leading to drug related mortality. Keto-conazole, for example, is immunosuppressive, and inall three trials in which bacterial infections werereported these were more common with ketoconazolethan with placebo (37 v 21,30 33 v 24,33 and 20% v 15%
Table 2 Numbers of randomised patients and exclusions, numbers of patients whoreceived rescue antifungal treatment, durations of follow up, and durations of treatmentin controls
First author
No of randomised patientsNo given rescue
drug Follow upperiod(days)
Days onplaceboTotal Exclusions T C T C
Suda 70 0 39 31 0 0 NA NA
Perfect 188 6† 91 91 72 77 42 10
Riley 35 0 17 18 5 8 30 15
Pizzo 34 0 18 16 NA NA 50 10
EORTC 157 25 80 77 NA NA 30 NA
Tollemar 84 8 42 42 1 7 NA 19
Goldstone 137 4† 64 69 17 28 NA NA
Goodman 356 1 179 177 101 116 90 20
Winston 257 2‡ 124 133 79 98 90 14
Yamac 70 NA 41 29 NA NA NA NA
Slavin 301 1† 152 148 58 81 89 55
Fukuda 63 0 37 26 0 0 NA 7
Acuna 52 NA 28 24 11 5 NA NA
Siegel 25 NA 12 13 5 6 NA NA
Palmblad 116 9 55 61 12 32 59 56
Brincker 38 0 19 19 2 2 28 28
Hughes 64 8 42 22 NA NA NA 14
Estey 150 3 77 73 NA NA 56 39
Hansen 60 4† 27 29 6 5 NA NA
Benhamou 125 0 63 62 52 51 36 30
Brincker 30 0 15 15 1 2 90 23
Wingard 208 15 97 111 64 62 NA 9
Vreugdenhil 98 6 49 49 9 15 80 80
Caselli 40 0 30 10 NA NA NA NA
T=Treated group. C=Control group. NA=Data not available.†Not reported per treatment group.‡Survivalstatus unknown.
Papers
1240 BMJ VOLUME 314 26 APRIL 1997
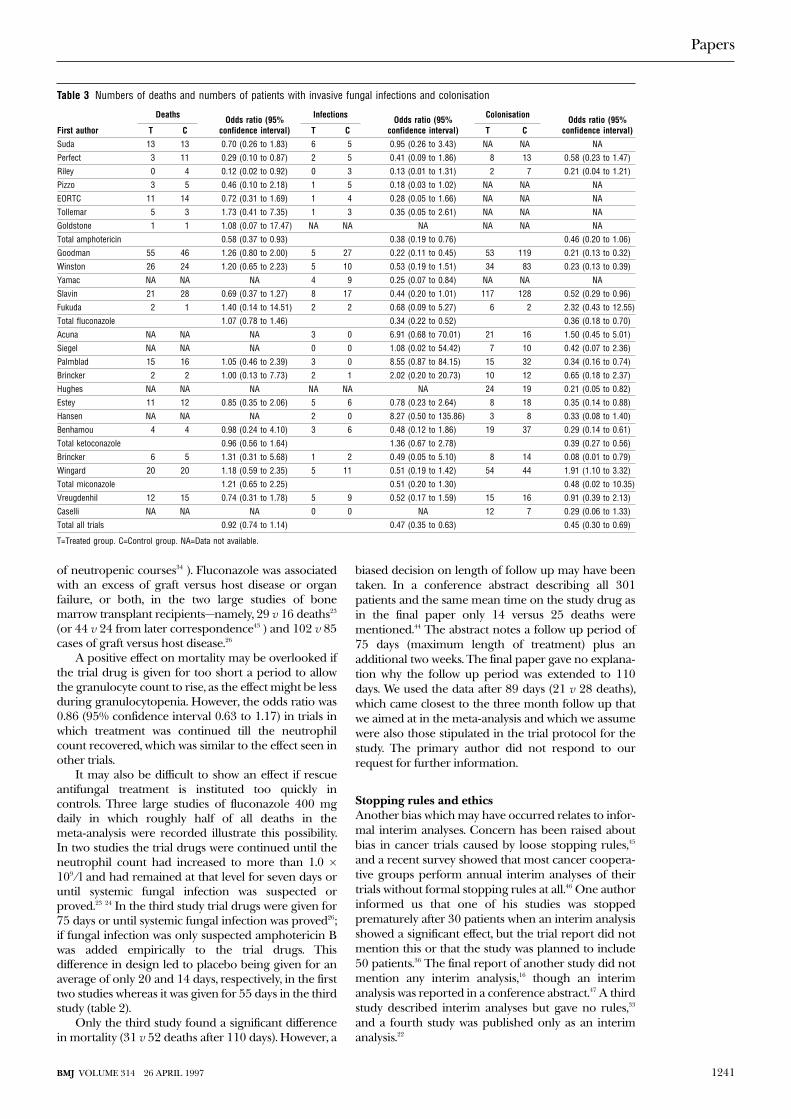
of neutropenic courses34 ). Fluconazole was associatedwith an excess of graft versus host disease or organfailure, or both, in the two large studies of bonemarrow transplant recipients—namely, 29 v 16 deaths23
(or 44 v 24 from later correspondence43 ) and 102 v 85cases of graft versus host disease.26
A positive effect on mortality may be overlooked ifthe trial drug is given for too short a period to allowthe granulocyte count to rise, as the effect might be lessduring granulocytopenia. However, the odds ratio was0.86 (95% confidence interval 0.63 to 1.17) in trials inwhich treatment was continued till the neutrophilcount recovered, which was similar to the effect seen inother trials.
It may also be difficult to show an effect if rescueantifungal treatment is instituted too quickly incontrols. Three large studies of fluconazole 400 mgdaily in which roughly half of all deaths in themeta-analysis were recorded illustrate this possibility.In two studies the trial drugs were continued until theneutrophil count had increased to more than 1.0 ×10⁹/l and had remained at that level for seven days oruntil systemic fungal infection was suspected orproved.23 24 In the third study trial drugs were given for75 days or until systemic fungal infection was proved26;if fungal infection was only suspected amphotericin Bwas added empirically to the trial drugs. Thisdifference in design led to placebo being given for anaverage of only 20 and 14 days, respectively, in the firsttwo studies whereas it was given for 55 days in the thirdstudy (table 2).
Only the third study found a significant differencein mortality (31 v 52 deaths after 110 days). However, a
biased decision on length of follow up may have beentaken. In a conference abstract describing all 301patients and the same mean time on the study drug asin the final paper only 14 versus 25 deaths werementioned.44 The abstract notes a follow up period of75 days (maximum length of treatment) plus anadditional two weeks. The final paper gave no explana-tion why the follow up period was extended to 110days. We used the data after 89 days (21 v 28 deaths),which came closest to the three month follow up thatwe aimed at in the meta-analysis and which we assumewere also those stipulated in the trial protocol for thestudy. The primary author did not respond to ourrequest for further information.
Stopping rules and ethicsAnother bias which may have occurred relates to infor-mal interim analyses. Concern has been raised aboutbias in cancer trials caused by loose stopping rules,45
and a recent survey showed that most cancer coopera-tive groups perform annual interim analyses of theirtrials without formal stopping rules at all.46 One authorinformed us that one of his studies was stoppedprematurely after 30 patients when an interim analysisshowed a significant effect, but the trial report did notmention this or that the study was planned to include50 patients.36 The final report of another study did notmention any interim analysis,16 though an interimanalysis was reported in a conference abstract.47 A thirdstudy described interim analyses but gave no rules,33
and a fourth study was published only as an interimanalysis.22
Table 3 Numbers of deaths and numbers of patients with invasive fungal infections and colonisation
First author
Deaths Odds ratio (95%confidence interval)
Infections Odds ratio (95%confidence interval)
Colonisation Odds ratio (95%confidence interval)T C T C T C
Suda 13 13 0.70 (0.26 to 1.83) 6 5 0.95 (0.26 to 3.43) NA NA NA
Perfect 3 11 0.29 (0.10 to 0.87) 2 5 0.41 (0.09 to 1.86) 8 13 0.58 (0.23 to 1.47)
Riley 0 4 0.12 (0.02 to 0.92) 0 3 0.13 (0.01 to 1.31) 2 7 0.21 (0.04 to 1.21)
Pizzo 3 5 0.46 (0.10 to 2.18) 1 5 0.18 (0.03 to 1.02) NA NA NA
EORTC 11 14 0.72 (0.31 to 1.69) 1 4 0.28 (0.05 to 1.66) NA NA NA
Tollemar 5 3 1.73 (0.41 to 7.35) 1 3 0.35 (0.05 to 2.61) NA NA NA
Goldstone 1 1 1.08 (0.07 to 17.47) NA NA NA NA NA NA
Total amphotericin 0.58 (0.37 to 0.93) 0.38 (0.19 to 0.76) 0.46 (0.20 to 1.06)
Goodman 55 46 1.26 (0.80 to 2.00) 5 27 0.22 (0.11 to 0.45) 53 119 0.21 (0.13 to 0.32)
Winston 26 24 1.20 (0.65 to 2.23) 5 10 0.53 (0.19 to 1.51) 34 83 0.23 (0.13 to 0.39)
Yamac NA NA NA 4 9 0.25 (0.07 to 0.84) NA NA NA
Slavin 21 28 0.69 (0.37 to 1.27) 8 17 0.44 (0.20 to 1.01) 117 128 0.52 (0.29 to 0.96)
Fukuda 2 1 1.40 (0.14 to 14.51) 2 2 0.68 (0.09 to 5.27) 6 2 2.32 (0.43 to 12.55)
Total fluconazole 1.07 (0.78 to 1.46) 0.34 (0.22 to 0.52) 0.36 (0.18 to 0.70)
Acuna NA NA NA 3 0 6.91 (0.68 to 70.01) 21 16 1.50 (0.45 to 5.01)
Siegel NA NA NA 0 0 1.08 (0.02 to 54.42) 7 10 0.42 (0.07 to 2.36)
Palmblad 15 16 1.05 (0.46 to 2.39) 3 0 8.55 (0.87 to 84.15) 15 32 0.34 (0.16 to 0.74)
Brincker 2 2 1.00 (0.13 to 7.73) 2 1 2.02 (0.20 to 20.73) 10 12 0.65 (0.18 to 2.37)
Hughes NA NA NA NA NA NA 24 19 0.21 (0.05 to 0.82)
Estey 11 12 0.85 (0.35 to 2.06) 5 6 0.78 (0.23 to 2.64) 8 18 0.35 (0.14 to 0.88)
Hansen NA NA NA 2 0 8.27 (0.50 to 135.86) 3 8 0.33 (0.08 to 1.40)
Benhamou 4 4 0.98 (0.24 to 4.10) 3 6 0.48 (0.12 to 1.86) 19 37 0.29 (0.14 to 0.61)
Total ketoconazole 0.96 (0.56 to 1.64) 1.36 (0.67 to 2.78) 0.39 (0.27 to 0.56)
Brincker 6 5 1.31 (0.31 to 5.68) 1 2 0.49 (0.05 to 5.10) 8 14 0.08 (0.01 to 0.79)
Wingard 20 20 1.18 (0.59 to 2.35) 5 11 0.51 (0.19 to 1.42) 54 44 1.91 (1.10 to 3.32)
Total miconazole 1.21 (0.65 to 2.25) 0.51 (0.20 to 1.30) 0.48 (0.02 to 10.35)
Vreugdenhil 12 15 0.74 (0.31 to 1.78) 5 9 0.52 (0.17 to 1.59) 15 16 0.91 (0.39 to 2.13)
Caselli NA NA NA 0 0 NA 12 7 0.29 (0.06 to 1.33)
Total all trials 0.92 (0.74 to 1.14) 0.47 (0.35 to 0.63) 0.45 (0.30 to 0.69)
T=Treated group. C=Control group. NA=Data not available.
Papers
1241BMJ VOLUME 314 26 APRIL 1997
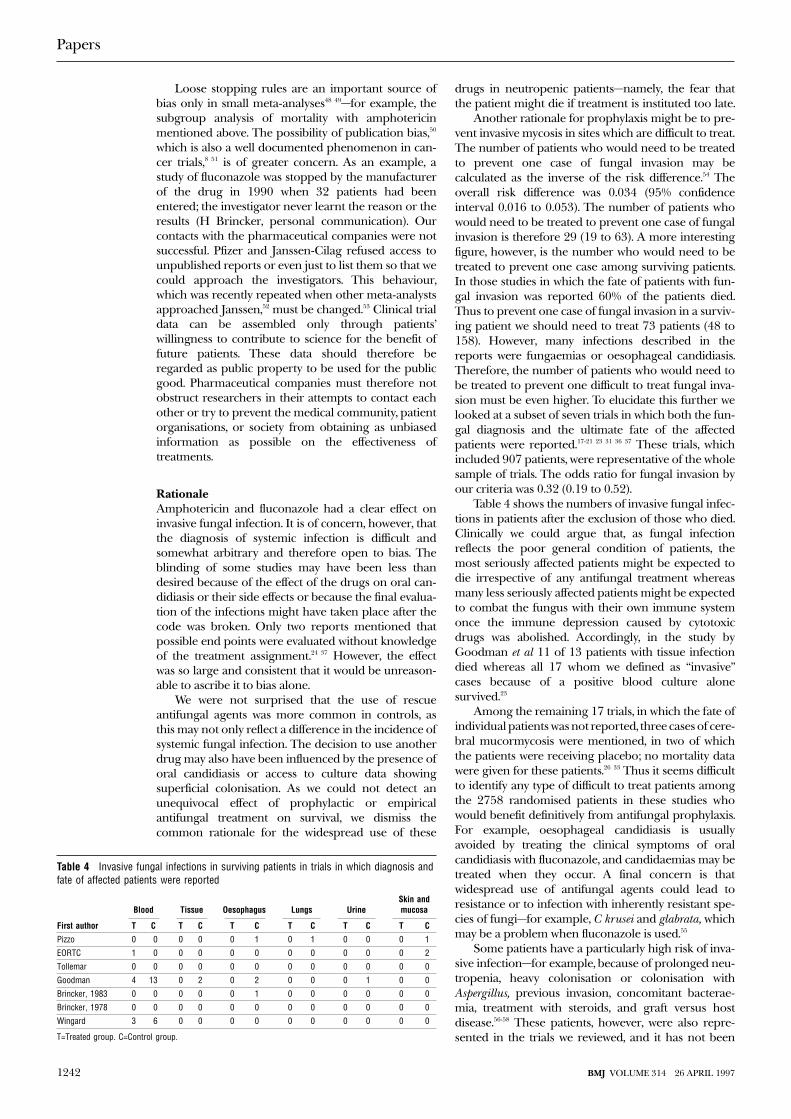
Loose stopping rules are an important source ofbias only in small meta-analyses48 49—for example, thesubgroup analysis of mortality with amphotericinmentioned above. The possibility of publication bias,50
which is also a well documented phenomenon in can-cer trials,8 51 is of greater concern. As an example, astudy of fluconazole was stopped by the manufacturerof the drug in 1990 when 32 patients had beenentered; the investigator never learnt the reason or theresults (H Brincker, personal communication). Ourcontacts with the pharmaceutical companies were notsuccessful. Pfizer and Janssen-Cilag refused access tounpublished reports or even just to list them so that wecould approach the investigators. This behaviour,which was recently repeated when other meta-analystsapproached Janssen,52 must be changed.53 Clinical trialdata can be assembled only through patients’willingness to contribute to science for the benefit offuture patients. These data should therefore beregarded as public property to be used for the publicgood. Pharmaceutical companies must therefore notobstruct researchers in their attempts to contact eachother or try to prevent the medical community, patientorganisations, or society from obtaining as unbiasedinformation as possible on the effectiveness oftreatments.
RationaleAmphotericin and fluconazole had a clear effect oninvasive fungal infection. It is of concern, however, thatthe diagnosis of systemic infection is difficult andsomewhat arbitrary and therefore open to bias. Theblinding of some studies may have been less thandesired because of the effect of the drugs on oral can-didiasis or their side effects or because the final evalua-tion of the infections might have taken place after thecode was broken. Only two reports mentioned thatpossible end points were evaluated without knowledgeof the treatment assignment.24 37 However, the effectwas so large and consistent that it would be unreason-able to ascribe it to bias alone.
We were not surprised that the use of rescueantifungal agents was more common in controls, asthis may not only reflect a difference in the incidence ofsystemic fungal infection. The decision to use anotherdrug may also have been influenced by the presence oforal candidiasis or access to culture data showingsuperficial colonisation. As we could not detect anunequivocal effect of prophylactic or empiricalantifungal treatment on survival, we dismiss thecommon rationale for the widespread use of these
drugs in neutropenic patients—namely, the fear thatthe patient might die if treatment is instituted too late.
Another rationale for prophylaxis might be to pre-vent invasive mycosis in sites which are difficult to treat.The number of patients who would need to be treatedto prevent one case of fungal invasion may becalculated as the inverse of the risk difference.54 Theoverall risk difference was 0.034 (95% confidenceinterval 0.016 to 0.053). The number of patients whowould need to be treated to prevent one case of fungalinvasion is therefore 29 (19 to 63). A more interestingfigure, however, is the number who would need to betreated to prevent one case among surviving patients.In those studies in which the fate of patients with fun-gal invasion was reported 60% of the patients died.Thus to prevent one case of fungal invasion in a surviv-ing patient we should need to treat 73 patients (48 to158). However, many infections described in thereports were fungaemias or oesophageal candidiasis.Therefore, the number of patients who would need tobe treated to prevent one difficult to treat fungal inva-sion must be even higher. To elucidate this further welooked at a subset of seven trials in which both the fun-gal diagnosis and the ultimate fate of the affectedpatients were reported.17-21 23 31 36 37 These trials, whichincluded 907 patients, were representative of the wholesample of trials. The odds ratio for fungal invasion byour criteria was 0.32 (0.19 to 0.52).
Table 4 shows the numbers of invasive fungal infec-tions in patients after the exclusion of those who died.Clinically we could argue that, as fungal infectionreflects the poor general condition of patients, themost seriously affected patients might be expected todie irrespective of any antifungal treatment whereasmany less seriously affected patients might be expectedto combat the fungus with their own immune systemonce the immune depression caused by cytotoxicdrugs was abolished. Accordingly, in the study byGoodman et al 11 of 13 patients with tissue infectiondied whereas all 17 whom we defined as “invasive”cases because of a positive blood culture alonesurvived.23
Among the remaining 17 trials, in which the fate ofindividual patients was not reported, three cases of cere-bral mucormycosis were mentioned, in two of whichthe patients were receiving placebo; no mortality datawere given for these patients.26 33 Thus it seems difficultto identify any type of difficult to treat patients amongthe 2758 randomised patients in these studies whowould benefit definitively from antifungal prophylaxis.For example, oesophageal candidiasis is usuallyavoided by treating the clinical symptoms of oralcandidiasis with fluconazole, and candidaemias may betreated when they occur. A final concern is thatwidespread use of antifungal agents could lead toresistance or to infection with inherently resistant spe-cies of fungi—for example, C krusei and glabrata, whichmay be a problem when fluconazole is used.55
Some patients have a particularly high risk of inva-sive infection—for example, because of prolonged neu-tropenia, heavy colonisation or colonisation withAspergillus, previous invasion, concomitant bacterae-mia, treatment with steroids, and graft versus hostdisease.56-58 These patients, however, were also repre-sented in the trials we reviewed, and it has not been
Table 4 Invasive fungal infections in surviving patients in trials in which diagnosis andfate of affected patients were reported
First author
Blood Tissue Oesophagus Lungs UrineSkin andmucosa
T C T C T C T C T C T C
Pizzo 0 0 0 0 0 1 0 1 0 0 0 1
EORTC 1 0 0 0 0 0 0 0 0 0 0 2
Tollemar 0 0 0 0 0 0 0 0 0 0 0 0
Goodman 4 13 0 2 0 2 0 0 0 1 0 0
Brincker, 1983 0 0 0 0 0 1 0 0 0 0 0 0
Brincker, 1978 0 0 0 0 0 0 0 0 0 0 0 0
Wingard 3 6 0 0 0 0 0 0 0 0 0 0
T=Treated group. C=Control group.
Papers
1242 BMJ VOLUME 314 26 APRIL 1997
shown that it would be worthwhile to treat thissubgroup prophylactically or empirically.
We therefore question the current widespreadpractice of routinely giving either prophylactic orempirical treatment with antifungal agents to patientswith cancer complicated by neutropenia. We suggestthat these drugs should be restricted to patients withproved infections and to patients participating inrandomised trials. As a beneficial effect of amphoter-icin on mortality was suggested by the meta-analysis alarge, definitive placebo controlled trial of this drugshould be performed. Further, the effect of empiricaltreatment, for which the data were very sparse, couldbe addressed in future studies. The studies shouldinclude data on length of hospital stay and similarmeasures which will allow cost-benefit analyses to beperformed. Our review will be published in theCochrane Database of Systematic Reviews, where it willbe updated when new trials appear.59
We thank the following investigators for additional informationon their trials: Dr Ellen Benhamou, Dr Hans Brincker, Dr Masa-taka Fukuda, Dr Jesse L Goodman, Dr Richard M Hansen, DrJan Palmblad, Dr John R Perfect, Professor Philip A Pizzo, DrAndrew T Pavia, Dr Jan Tollemar, Dr Ben E de Pauw, ProfessorGérard Schaison, Professor John R Wingard, and Dr Drew JWinston. Dr Hiroto Takada translated the Japanese reports. Wealso thank Bristol-Myers Squibb and Janssen-Cilag forsupplementary literature searches, the Cochrane Infectious Dis-eases Group for useful comments on the meta-analysis protocol,Dr Hans Brincker for useful discussion, and Professor PeterSkinhøj for comments on the manuscript.
Funding: Research grant from Rigshospitalet.Conflict of interest: None.
1 Inagaki J, Rodriguez V, Bodey G. Causes of death in cancer patients. Can-cer 1974;33:568-73.
2 Estey EH, Keating MJ, McCredie KB, Bodey GP, Freireich EJ. Causes ofinitial remission induction failure in acute myelogenous leukemia. Blood1982;60:309-15.
3 Walsh TJ, Lee J, Lecciones J, Rubin M, Butler K, Francis P, et al. Empirictherapy with amphotericin B in febrile granulocytopenic patients. RevInfect Dis 1991;13:496-503.
4 Verfaillie C, Weisdorf D, Haake R, Hostetter M, Ramsay N, McGlave P.Candida infections in bone marrow transplant recipients. Bone MarrowTransplant 1991;8:177-84.
5 Meyers JD. Fungal infections in bone marrow transplant patients. SeminOncol 1990;17:10-3.
6 Walsh TJ. Role of surveillance cultures in prevention and treatment offungal infections. Natl Cancer Inst Monogr 1990;9:43-5.
7 Stein RS, Greer JP, Ferrin W, Lenox R, Baer MR, Flexner JM. Clinicalexperience with amphotericin B in acute myelogenous leukemia. SouthMed J 1986;79:863-70.
8 Berlin JA, Begg CB, Louis TA. An assessment of publication bias using asample of published clinical trials. J Am Stat Assoc 1989;84:381-92.
9 Schulz KF, Chalmers I, Hayes RJ, Altman DG. Empirical evidence of bias,dimension of methodological quality associated with estimates oftreatment effects in controlled trials. JAMA 1995;273:408-12.
10 DerSimonian R, Laird N. Meta-analysis in clinical trials. Controlled ClinTrials 1986;7:177-88.
11 Yusuf S, Peto R, Lewis J, Collins R, Sleight P. Beta blockade during andafter myocardial infarction: an overview of the randomized trials. ProgCardiovasc Dis 1985;27:335-71.
12 Lau J, Chalmers TC. Meta-analyst 0.975 program. Boston: 1994.13 Ezdinli EZ, O’Sullivan DD, Wasser LP, Kim U, Stutzman L. Oral ampho-
tericin for candidiasis in patients with hematologic neoplasms. Anautopsy study. JAMA 1979;242:258-60.
14 Suda T, Omine M, Tsuchiya J, Maekawa T, Muto Y, Mizoguchi H, et al. Acooperative study of prophylaxis against fungal infection in patients withhematological diseases: prophylactic effect of oral amphotericin B. RinshoKetsueki 1980;21:195-9. [In Japanese.]
15 Perfect JR, Klotman ME, Gilbert CC, Crawford DD, Rosner GL, WrightKA, et al. Prophylactic intravenous amphotericin B in neutropenicautologous bone marrow transplant recipients. J Infect Dis1992;165:891-7.
16 Riley DK, Pavia AT, Beatty PG, Petersen FB, Spruance JL, Stokes R, et al.The prophylactic use of low-dose amphotericin B in bone marrow trans-plant patients. Am J Med 1994;97:509-14.
17 Pizzo PA, Robichaud KJ, Gill FA, Witebsky FG. Empiric antibiotic andantifungal therapy for cancer patients with prolonged fever and granulo-cytopenia. Am J Med 1982;72:101-11.
18 EORTC International Antimicrobial Therapy Cooperative Group.Empiric antifungal therapy in febrile granulocytopenic patients. Am J Med1989;86:668-72.
19 Tollemar J, Hockerstedt K, Ericzon BG, Sundberg B, Ringden O. Fungalprophylaxis with AmBisome in liver and bone marrow transplant recipi-ents: results of two randomized double-blind studies. Transplant Proc1994;26:1833.
20 Tollemar J, Ringden O, Andersson S, Sundberg B, Ljungman P, SparrelidE, et al. Prophylactic use of liposomal amphotericin B (AmBisome)against fungal infections: a randomized trial in bone marrow transplantrecipients. Transplant Proc 1993;25(1 pt 2):1495-7.
21 Tollemar J, Ringden O, Andersson S, Sundberg B, Ljungman P, Tyden G.Randomized double-blind study of liposomal amphotericin B (AmBi-some) prophylaxis of invasive fungal infections in bone marrowtransplant recipients. Bone Marrow Transplant 1993;12:577-82.
22 Goldstone AH, O’Driscoll A. Early AmBisome in febrile neutropenia inpatients with haematological disorders. Bone Marrow Transplant1994;14(suppl 5):S15-7.
23 Goodman JL, Winston DJ, Greenfield RA, Chandrasekar PH, Fox B, Kai-zer H, et al. A controlled trial of fluconazole to prevent fungal infectionsin patients undergoing bone marrow transplantation. N Engl J Med1992;326:845-51.
24 Winston DJ, Chandrasekar PH, Lazarus HM, Goodman JL, Silber JL,Horowitz H, et al. Fluconazole prophylaxis of fungal infections in patientswith acute leukemia. Results of a randomized placebo-controlled,double-blind, multicenter trial. Ann Intern Med 1993;118:495-503.
25 Yamac K, Senol E, Haznedar R. Prophylactic use of fluconazole inneutropenic cancer patients. Postgrad Med J 1995;71:284-6.
26 Slavin MA, Osborne B, Adams R, Levenstein M, Schoch HG, FeldmanAR, et al. Efficacy and safety of fluconazole prophylaxis for fungalinfections after marrow transplantation--a prospective, randomized,double-blind study. J Infect Dis 1995;171:1545-52.
27 Fukuda M, Hirashima K, Kurane R, Abe T, Sampi K, Tominaga K, et al.Empiric therapy with fluconazole in granulocytopenic patients with car-cinoma or leukemia. Jpn J Antibiot 1994;47:1065-70. [In Japanese.]
28 Acuna G, Winston DJ, Young LS. Ketoconazole prophylaxis of fungalinfections in the granulocytopenic patient: a double-blind, randomizedcontrolled trial. Paper presented at 22nd interscience conference on anti-microbial agents and chemotherapy, American Society for Microbiology,1981. Abstract 852.
29 Siegel M, Murphy M, Counts GW, Meyers JD. Prophylactic ketoconazolefor the prevention of fungal infection in bone marrow transplantpatients. Paper presented at 23rd interscience conference on antimicro-bial agents and chemotherapy, American Society for Microbiology, 1982.Abstract 166.
30 Palmblad J, Lönnqvist B, Carlsson B, Grimfors G, Järnmark M, Lerner R,et al. Oral ketoconazole prophylaxis for candida infections during induc-tion therapy for acute leukaemia in adults: more bacteraemias. J InternMed 1992;231:363-70.
31 Brincker H. Prevention of mycosis in granulocytopenic patients withprophylactic ketoconazole treatment. Mykosen 1983;26:242-7.
32 Hughes WT, Bartley DL, Patterson GG, Tufenkeji H. Ketoconazole andcandidiasis: a controlled study. J Infect Dis 1983;147:1060-3.
33 Estey E, Maksymiuk A, Smith T, Fainstein V, Keating M, McCredie KB, etal. Infection prophylaxis in acute leukemia. Comparative effectiveness ofsulfamethoxazole and trimethoprim, ketoconazole, and a combination ofthe two. Arch Intern Med 1984;144:1562-8.
34 Hansen RM, Reinerio N, Sohnle PG, Abrams RA, Ritch PS, Libnoch JA,et al. Ketoconazole in the prevention of candidiasis in patients with can-cer. A prospective, randomized, controlled, double-blind study. Arch InternMed 1987;147:710-2.
35 Benhamou E, Hartmann O, Nogues C, Maraninchi D, Valteau D, LemerleJ. Does ketoconazole prevent fungal infection in children treated withhigh dose chemotherapy and bone marrow transplantation? Results of arandomized placebo-controlled trial. Bone Marrow Transplant1991;7:127-31.
36 Brincker H. Prophylactic treatment with miconazole in patients highlypredisposed to fungal infection. A placebo-controlled double-blind study.Acta Med Scand 1978;204:123-8.
Key messages
x Prophylactic or empirical treatment withantifungal agents is often recommended forpatients with cancer complicated byneutropenia for fear that they might die iftreatment is delayed
x A meta-analysis has failed to show a convincingsurvival benefit of antifungal agents in patientswith cancer complicated by neutropenia
x Amphotericin B and fluconazole decrease theincidence of invasive fungal infections
x Seventy three patients need to be treated toprevent one case of fungal invasion in survivingpatients
x The use of antifungal agents should berestricted to patients with proved infections
Papers
1243BMJ VOLUME 314 26 APRIL 1997
37 Wingard JR, Vaughan WP, Braine HG, Merz WG, Saral R. Prevention offungal sepsis in patients with prolonged neutropenia: a randomized,double-blind, placebo-controlled trial of intravenous miconazole. Am JMed 1987;83:1103-10.
38 Prentice AG, Bradford GR. Prophylaxis of fungal infections withitraconazole during remission-induction therapy. Mycoses 1989;32(suppl1):96-102.
39 Vreugdenhil G, Van Dijke BJ, Donnelly JP, Novakova IRO, RaemaekersJMM, Hoogkamp-Korstanje MAA, et al. Efficacy of itraconazole in theprevention of fungal infections among neutropenic patients with hema-tologic malignancies and intensive chemotherapy. A double blind,placebo controlled study. Leuk Lymphoma 1993;11:353-8.
40 Caselli D, Arico M, Michelone G, Cavanna C, Nespoli L, Burgio GR. Anti-fungal chemoprophylaxis in cancer children: a prospective randomizedcontrolled study. Microbiologica 1990;13:347-51.
41 Schaison G, Baruchel A, Arlet G. Prevention of Gram-positive and Can-dida albicans infections using teicoplanin and fluconazole: a randomizedstudy in neutropenic children. Br J Haematol 1990;76(suppl 2):24-6.
42 Bodey GP, Samonis G, Rolston K. Prophylaxis of candidiasis in cancerpatients. Semin Oncol 1990;17(suppl 6):24-8.
43 Goodman JL, Greenfield R, Buell D. Prophylactic fluconazole andmarrow transplantation. N Engl J Med 1992;327:645.
44 Slavin M, Bowden R, Osborne B, Adams R, Levenstein M, Feldman A, etal. Fluconazole prophylaxis in marrow transplant recipients: arandomized placebo controlled double blind study. Paper presented at32nd interscience conference on antimicrobial agents and chemo-therapy, American Society for Microbiology, 1992. Abstract 623.
45 Pocock SJ. Size of cancer clinical trials and stopping rules. Br J Cancer1978;38:757-66.
46 Buyse M. Interim analyses, stopping rules and data monitoring in clinicaltrials in Europe. Stat Med 1993;12:509-20.
47 Riley D, Beatty P, Pavia A, Evans TG. Prophylactic use of low-doseamphotericin B (AMB) in bone marrow transplant (BMT) patients. Paperpresented at 32nd interscience conference on antimicrobial agents andchemotherapy, American Society for Microbiology, 1992. Abstract 620.
48 Green SJ, Fleming TR, Emerson S. Effects of overviews of early stoppingrules for clinical trials. Stat Med 1987;6:361-7.
49 Hughes MD, Freedman LS, Pocock SJ. The impact of stopping rules onheterogeneity of results in overviews of clinical trials. Biometrics1992;48:41-53.
50 Simes RJ, Stern J, Ghersi D. The importance of prospectively registeringtrials: evidence of publication bias from a cohort study of research proto-cols. 3rd Annual Cochrane colloquium, Oslo, 4-8 October 1995.
51 Simes RJ. Publication bias: the case for an international registry of clini-cal trials. J Clin Oncol 1986;4:1529-41.
52 Huston P, Moher D. Pharmaceutical company trials and the integrity ofmedical research. Lancet 1996;347:1628.
53 Chalmers I. Underreporting research is scientific misconduct. JAMA1990;263:1405-8.
54 Laupacis A, Sackett DL, Roberts RS. An assessment of clinically usefulmeasures of the consequences of treatment. N Engl J Med 1988;318:1728-33.
55 Working Party of the British Society for Antimicrobial Chemotherapy.Antifungal drug susceptibility testing. J Antimicrobial Chemother1995;36:899-909.
56 Fraser IS, Denning DW. Empiric amphotericin B therapy: the need for areappraisal. Blood Rev 1993;7:208-14.
57 Guiot HFL, Fibbe WE, van’t Wout JW. Risk factors for fungal infection inpatients with malignant hematologic disorders: implications forempirical therapy and prophylaxis. Clin Infect Dis 1994;18:525-32.
58 Walsh TJ, Hiemenz J, Pizzo PA. Editorial response: evolving risk factorsfor invasive fungal infections--all neutropenic patients are not the same.Clin Infect Dis 1994;18:793-8.
59 Gøtzsche PC, Johansen HK. Antifungal prophylactic or empiric therapyvs placebo or no treatment in cancer patients with neutropenia. In: Gar-ner P, Gelband H, Olliaro P, Salinas R, eds. Infectious diseases module of theCochrane database of systemic reviews. The Cochrane library. Issue 2. Oxford:Update Software, 1997.
(Accepted 24 January 1997)
Impact of a dedicated service for male mentallydisordered remand prisoners in north west London:retrospective studyTim Weaver, Fiona Taylor, Barbara Cunningham, Shane Kavanagh, Anthony Maden, Sian Rees,Adrian Renton
Government policy has encouraged speedy transfer ofmentally ill prisoners to NHS care,1 2 but arrangementshave often proved slow and ineffective.3 4 The BenthamUnit was set up in February 1994 to provide rapidassessment and (where appropriate) transfer for malementally disordered remand prisoners in the formerNorth West Thames Regional Health Authority. Theunit provides regular outreach assessment sessions atWormwood Scrubs and other prisons and is based in a14 bed locked ward to which patients may be admittedbefore court disposal and determination of final place-ment.
Subjects, methods, and resultsWe retrospectively identified all prisoners referred forNHS psychiatric assessment who had been remandedto prisons within the area covered by North WestThames Regional Health Authority (WormwoodScrubs, Brixton, Pentonville, Wandsworth, andFeltham) between 1 April and 31 August 1994 anddetermined those who were assessed and admitted bythe Bentham Unit. We measured the intervals betweenremand, assessment, and transfer and compared thesemeasures between subgroups subject to differentplacements. Similar comparisons were made with
those referred from Wormwood Scrubs during thesame months in 1993 (before the unit opened).
During the 1994 study period, 158 remand prison-ers in North West Thames region were referred. TheBentham Unit assessed 62 (39%) of these. For 71patients subsequently admitted to NHS inpatient care,the median interval between remand and final transferto NHS hospital was 36 days (table 1). Admission to aremand bed at the Bentham Unit or the similar localRiverside Forensic Service5 was associated with ashorter length of stay in prison but a significantlylonger total interval between remand and final transfer(median 85 days v 55 days, P = 0.015).
Of the 158 referrals, 58 were prisoners remandedto Wormwood Scrubs. Comparison with referrals fromWormwood Scrubs during the same months in 1993showed a significant increase in the proportion of theremand population referred (4% v 8%) and a doublingin the proportion finally admitted to NHS hospital(14 (2%) in 1993 v 29 (4%) in 1994). During the 1994period 21 of 29 patients were temporarily admitted tothe Bentham Unit.
For all Wormwood Scrubs patients subsequentlytransferred to NHS inpatient care, there were large andsignificant reductions between the 1993 and 1994study periods in the median intervals between remandand first assessment by a NHS psychiatrist (median 27
Papers
Department ofEpidemiology andPublic Health,Imperial CollegeSchool of Medicineat St Mary’s,London W2 IPGTim Weaver,research fellowFiona Taylor,research associateBarbaraCunningham,research associateAdrian Renton,senior lecturer inpublic health medicine
Personal SocialServices ResearchUnit, University ofKent at Canterbury,CanterburyCT2 7NFShane Kavanagh,research fellow
BMJ 1997;314:1244–5
continued over
1244 BMJ VOLUME 314 26 APRIL 1997
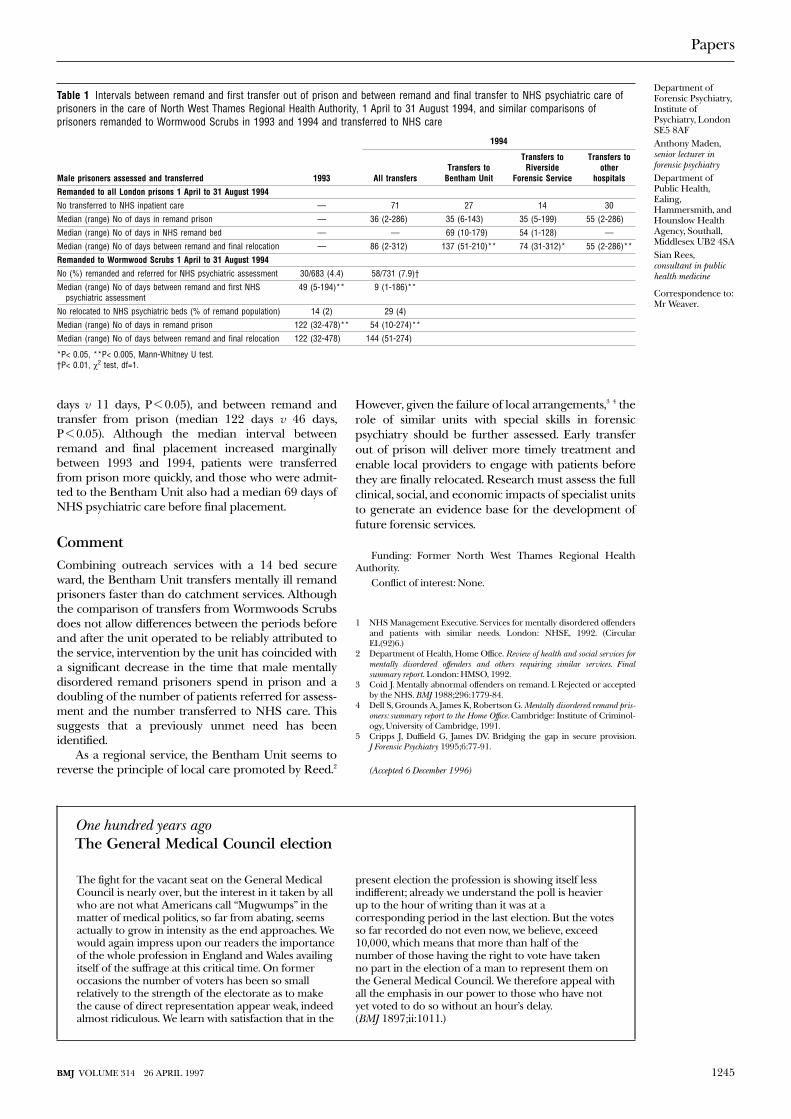
days v 11 days, P < 0.05), and between remand andtransfer from prison (median 122 days v 46 days,P < 0.05). Although the median interval betweenremand and final placement increased marginallybetween 1993 and 1994, patients were transferredfrom prison more quickly, and those who were admit-ted to the Bentham Unit also had a median 69 days ofNHS psychiatric care before final placement.
CommentCombining outreach services with a 14 bed secureward, the Bentham Unit transfers mentally ill remandprisoners faster than do catchment services. Althoughthe comparison of transfers from Wormwoods Scrubsdoes not allow differences between the periods beforeand after the unit operated to be reliably attributed tothe service, intervention by the unit has coincided witha significant decrease in the time that male mentallydisordered remand prisoners spend in prison and adoubling of the number of patients referred for assess-ment and the number transferred to NHS care. Thissuggests that a previously unmet need has beenidentified.
As a regional service, the Bentham Unit seems toreverse the principle of local care promoted by Reed.2
However, given the failure of local arrangements,3 4 therole of similar units with special skills in forensicpsychiatry should be further assessed. Early transferout of prison will deliver more timely treatment andenable local providers to engage with patients beforethey are finally relocated. Research must assess the fullclinical, social, and economic impacts of specialist unitsto generate an evidence base for the development offuture forensic services.
Funding: Former North West Thames Regional HealthAuthority.
Conflict of interest: None.
1 NHS Management Executive. Services for mentally disordered offendersand patients with similar needs. London: NHSE, 1992. (CircularEL(92)6.)
2 Department of Health, Home Office. Review of health and social services formentally disordered offenders and others requiring similar services. Finalsummary report. London: HMSO, 1992.
3 Coid J. Mentally abnormal offenders on remand. I. Rejected or acceptedby the NHS. BMJ 1988;296:1779-84.
4 Dell S, Grounds A, James K, Robertson G. Mentally disordered remand pris-oners: summary report to the Home Office. Cambridge: Institute of Criminol-ogy, University of Cambridge, 1991.
5 Cripps J, Duffield G, James DV. Bridging the gap in secure provision.J Forensic Psychiatry 1995;6:77-91.
(Accepted 6 December 1996)
Table 1 Intervals between remand and first transfer out of prison and between remand and final transfer to NHS psychiatric care ofprisoners in the care of North West Thames Regional Health Authority, 1 April to 31 August 1994, and similar comparisons ofprisoners remanded to Wormwood Scrubs in 1993 and 1994 and transferred to NHS care
Male prisoners assessed and transferred 1993
1994
All transfersTransfers to
Bentham Unit
Transfers toRiverside
Forensic Service
Transfers toother
hospitals
Remanded to all London prisons 1 April to 31 August 1994
No transferred to NHS inpatient care — 71 27 14 30
Median (range) No of days in remand prison — 36 (2-286) 35 (6-143) 35 (5-199) 55 (2-286)
Median (range) No of days in NHS remand bed — — 69 (10-179) 54 (1-128) —
Median (range) No of days between remand and final relocation — 86 (2-312) 137 (51-210)** 74 (31-312)* 55 (2-286)**
Remanded to Wormwood Scrubs 1 April to 31 August 1994
No (%) remanded and referred for NHS psychiatric assessment 30/683 (4.4) 58/731 (7.9)†
Median (range) No of days between remand and first NHSpsychiatric assessment
49 (5-194)** 9 (1-186)**
No relocated to NHS psychiatric beds (% of remand population) 14 (2) 29 (4)
Median (range) No of days in remand prison 122 (32-478)** 54 (10-274)**
Median (range) No of days between remand and final relocation 122 (32-478) 144 (51-274)
*P< 0.05, **P< 0.005, Mann-Whitney U test.†P< 0.01, ÷2 test, df=1.
One hundred years agoThe General Medical Council election
The fight for the vacant seat on the General MedicalCouncil is nearly over, but the interest in it taken by allwho are not what Americans call “Mugwumps” in thematter of medical politics, so far from abating, seemsactually to grow in intensity as the end approaches. Wewould again impress upon our readers the importanceof the whole profession in England and Wales availingitself of the suffrage at this critical time. On formeroccasions the number of voters has been so smallrelatively to the strength of the electorate as to makethe cause of direct representation appear weak, indeedalmost ridiculous. We learn with satisfaction that in the
present election the profession is showing itself lessindifferent; already we understand the poll is heavierup to the hour of writing than it was at acorresponding period in the last election. But the votesso far recorded do not even now, we believe, exceed10,000, which means that more than half of thenumber of those having the right to vote have takenno part in the election of a man to represent them onthe General Medical Council. We therefore appeal withall the emphasis in our power to those who have notyet voted to do so without an hour’s delay.(BMJ 1897;ii:1011.)
Papers
Department ofForensic Psychiatry,Institute ofPsychiatry, LondonSE5 8AFAnthony Maden,senior lecturer inforensic psychiatryDepartment ofPublic Health,Ealing,Hammersmith, andHounslow HealthAgency, Southall,Middlesex UB2 4SASian Rees,consultant in publichealth medicine
Correspondence to:Mr Weaver.
1245BMJ VOLUME 314 26 APRIL 1997
Copyright © 2022 FDOKUMEN