Impact Evaluation of the 2015–2016 Existing Buildings Program
95
Impact Evaluation of the 2015–2016 Existing Buildings Program Energy Trust of Oregon Date: 6/25/2018
-
Upload
khangminh22 -
Category
Documents
-
view
0 -
download
0
Transcript of Impact Evaluation of the 2015–2016 Existing Buildings Program

Impact Evaluation of the 2015–2016 Existing Buildings Program Energy Trust of Oregon
Date: 6/25/2018

DNV GL - Energy – www.dnvgl.com/energy

DNV GL – www.dnvgl.com 6/25/2018 Page i
Table of contents
0 EXECUTIVE SUMMARY ..................................................................................................... 1
1 BACKGROUND ................................................................................................................ 8
2 EVALUATION OVERVIEW................................................................................................ 10
3 LIGHTING TRACK EVALUATION ...................................................................................... 13
4 STANDARD TRACK NON-LIGHTING EVALUATION .............................................................. 26
5 CUSTOM TRACK EVALUATION ........................................................................................ 38
6 STRATEGIC ENERGY MANAGEMENT EVALUATION ............................................................. 45
APPENDIX A. EVALUATION SAMPLE DESIGN MEMO ..................................................................... 51
APPENDIX B. TLED INTERVIEW GUIDE ....................................................................................... 59
APPENDIX C. SEM ANALYSIS METHODOLOGY ............................................................................. 70
APPENDIX D. CUSTOM MEASURE RESULTS ................................................................................. 76
APPENDIX E. STANDARD MEASURE RESULTS ............................................................................. 77
List of figures
Figure 1: Historic Non-SEM program electric savings and realization rates ............................................... 3 Figure 2: Historic Non-SEM program gas savings and realization rates ..................................................... 3 Figure 3: Historic SEM program electric savings and realization rates ...................................................... 4 Figure 4: Historic SEM program gas savings and realization rates ........................................................... 4 Figure 5. Impact evaluation process steps .......................................................................................... 10 Figure 6. TLED control strategies ...................................................................................................... 22 Figure 7. Motivations for purchasing TLEDs by TLED type ..................................................................... 23 Figure 8. Example of advanced power strip participant receipt block from program application ................ 30
DNV GL – www.dnvgl.com 6/25/2018 Page ii
List of tables Table 1: Claimed energy savings, by year, fuel, and track ...................................................................... 1 Table 2: Evaluated energy savings, by year, fuel, and track ................................................................... 2 Table 3: Program realization rates, by year, fuel, and track .................................................................... 2 Table 4: Historic program performance, excluding SEM ......................................................................... 3 Table 5: Historic SEM program performance ......................................................................................... 4 Table 6: Sample summary ............................................................................................................... 10 Table 7: Reported lighting track energy savings by delivery and program year ....................................... 13 Table 8: Lighting track sample design ............................................................................................... 14 Table 9: Final lighting track sample summary ..................................................................................... 17 Table 10: Lighting track electric impact evaluation results by program year ........................................... 18 Table 11: Lighting track electric impact evaluation results by technology ............................................... 18 Table 12: Lighting measures variance summary by building type .......................................................... 18 Table 13: TLED types ...................................................................................................................... 19 Table 14. TLED research topics and survey questions .......................................................................... 19 Table 15. TLED survey participation by type and year .......................................................................... 20 Table 16: Reported standard track energy savings by program year...................................................... 26 Table 17: Standard track sample design ............................................................................................ 27 Table 18: Standard track sample design by entity code ....................................................................... 28 Table 19: Final standard track sample summary ................................................................................. 31 Table 20: Standard track electric impact evaluation results by program year .......................................... 32 Table 21: Standard track natural gas impact evaluation results by program year .................................... 32 Table 22: Reported custom track energy savings by delivery and program year...................................... 38 Table 23: Custom track sample design .............................................................................................. 38 Table 24: Final standard track sample summary ................................................................................. 40 Table 25: Custom track electric impact evaluation results by program year ............................................ 40 Table 26: Custom track natural gas impact evaluation results by program year ...................................... 40 Table 27: Reported SEM track energy savings by delivery and program year .......................................... 45 Table 28: SEM track sample design ................................................................................................... 46 Table 29: Final SEM track sample summary ....................................................................................... 48 Table 30: SEM track electric impact evaluation results by program year ................................................ 49 Table 31: SEM track natural gas impact evaluation results by program year ........................................... 49 Table 32: Sample summary ............................................................................................................. 51 Table 33: Sample frame summary by year and fuel ............................................................................ 52 Table 34: Sample frame summary by mmbtu and year ........................................................................ 53 Table 35: Stratification summary ...................................................................................................... 55 Table 36: Assumed error ratios......................................................................................................... 57 Table 37: Expected mmBtu Precision by Track .................................................................................... 57 Table 38: Expected Precision Summary, by program code .................................................................... 58 Table 39: TLED sample summary ...................................................................................................... 58 Table 40: Selected evaluation model types ........................................................................................ 72 Table 41: Program year assignment schedule for sites added after kick-off meeting ................................ 73 Table 42: SEM program year assignment, standard cohort schedule ...................................................... 75 Table 43: Custom track evaluation results by measure Category........................................................... 76

DNV GL – www.dnvgl.com 6/25/2018 Page 1
0 EXECUTIVE SUMMARY
Energy Trust of Oregon (Energy Trust) hired DNV GL to complete an impact evaluation of Energy Trust’s
2015–2016 Existing Buildings Program. This report presents the methods, results, and findings of the
evaluation. The goal of the evaluation was to improve savings estimates and enhance the Existing Buildings
Program’s effectiveness in delivering savings to customers. In addition, the report also provides insights
regarding strategic energy management (SEM) and current market penetration of tubular light-emitting
diode (TLED) lamps.
0.1 Program overview
The Existing Buildings program began in March 2004 and is implemented by a program management
contractor. ICF International has been the PMC since January 1, 2013. The program has four main tracks:
Custom, Lighting (including standard, direct-install, and street lighting measures), Standard (prescriptive),
and Strategic Energy Management (SEM). This program acquired 24% of the electric energy savings1 and
25% of the gas savings2,3 acquired by all Energy Trust efficiency programs.
▪ In 2018, this program is expected to provide 26% of all electricity savings and 24% of all gas savings
acquired by Energy Trust in the program year.4
0.2 Savings claimed
Table 1 shows the gross claimed program savings by track, years, and fuel included in the program tracking
data provided to DNV GL. The values shown are the site-level “working” savings listed in the data provided.
These savings do not include adjustments for prior realization rates, net-to-gross, or transmission and
distribution.
Table 1: Claimed energy savings, by year, fuel, and track
Data Lines Electricity Savings
(kWh) Gas Savings
(therms)
Program Track 2015 2016 2015 2016 2015 2016
Custom 263 252 26,045,331 25,840,900 789,124 654,306
Standard Lighting 7,976 7,268 66,159,552 77,678,006 0 0
Standard Non-Lighting 1,393 1,461 6,515,821 10,590,409 559,703 753,615
Capital Measures Only 9,632 8,981 98,720,704 114,109,315 1,348,827 1,407,921
Strategic Energy
Management 114 168 10,330,780 9,806,709 539,194 481,771
Grand Total 9,746 9,149 109,051,484 123,916,024 1,888,021 1,889,692
1 Evergreen Economics, Report to Legislative Assembly on Public Purpose Expenditures, January 2015 – December 2016, FINAL 2 Year Report
May 25, 2017. https://www.energytrust.org/wp-content/uploads/2017/08/2017_2-Year-PPC-Report_Final_Revised_05-25-17.pdf 2 2015 Annual Report to the Oregon Public Utility Commission & Energy Trust Board of Directors, ENERGY TRUST OF OREGON
APRIL 15, 2016, UPDATED OCTOBER 24, 2016 https://www.energytrust.org/wp-
content/uploads/2016/12/2015.Annual.Report.OPUC_.with_.NEEA_.pdf 3 2016 Annual Report to the Oregon Public Utility Commission & Energy Trust Board of Directors, ENERGY TRUST OF OREGON
APRIL 14, 2017, UPDATED DECEMBER 15, 2017 https://www.energytrust.org/wp-
content/uploads/2017/04/Energy.Trust_.2016.Annual.Report.OPUC_.pdf 4 Excludes “Existing Multifamily”. Energy Trust 2018 Budget and Action Plan. https://www.energytrust.org/wp-
content/uploads/2017/12/APPROVED_Budget_and_Action_Plan_2018_web.pdf

DNV GL – www.dnvgl.com 6/25/2018 Page 2
0.3 Evaluation results
Table 2 shows the evaluated savings by track and program year. Table 3 provides the final program and
track level realization rates achieved.
Table 2: Evaluated energy savings, by year, fuel, and track
Electricity Savings
(kWh) Gas Savings
(therms)
Program Track 2015 2016 2015 2016
Custom 24,525,378 22,222,244 637,221 678,824
Standard Lighting 65,497,956 73,017,326 N/A N/A
Standard Non-Lighting 4,980,109 10,032,315 423,695 572,747
Capital Measures Only 94,618,760 104,828,006 1,061,256 1,224,990
Strategic Energy Management 9,216,657 9,038,775 446,946 546,458
Grand Total 103,823,011 113,872,754 1,506,080 1,790,532
Table 3: Program realization rates, by year, fuel, and track
Electricity
Realization Rates Gas
Realization Rates
tracks 2015 2016 Total 2015 2016 Total
Custom 94% 86% 90% 81% 104% 91%
Standard Lighting 99% 94% 96% N/A N/A N/A
Standard Non-Lighting 76% 95% 88% 76% 76% 76%
Capital Measures Only 96% 92% 94% 79% 87% 83%
Strategic Energy Management 89% 92% 91% 83% 113% 100%
Existing Buildings Program 95% 92% 93% 80% 95% 88%
DNV GL – www.dnvgl.com 6/25/2018 Page 3
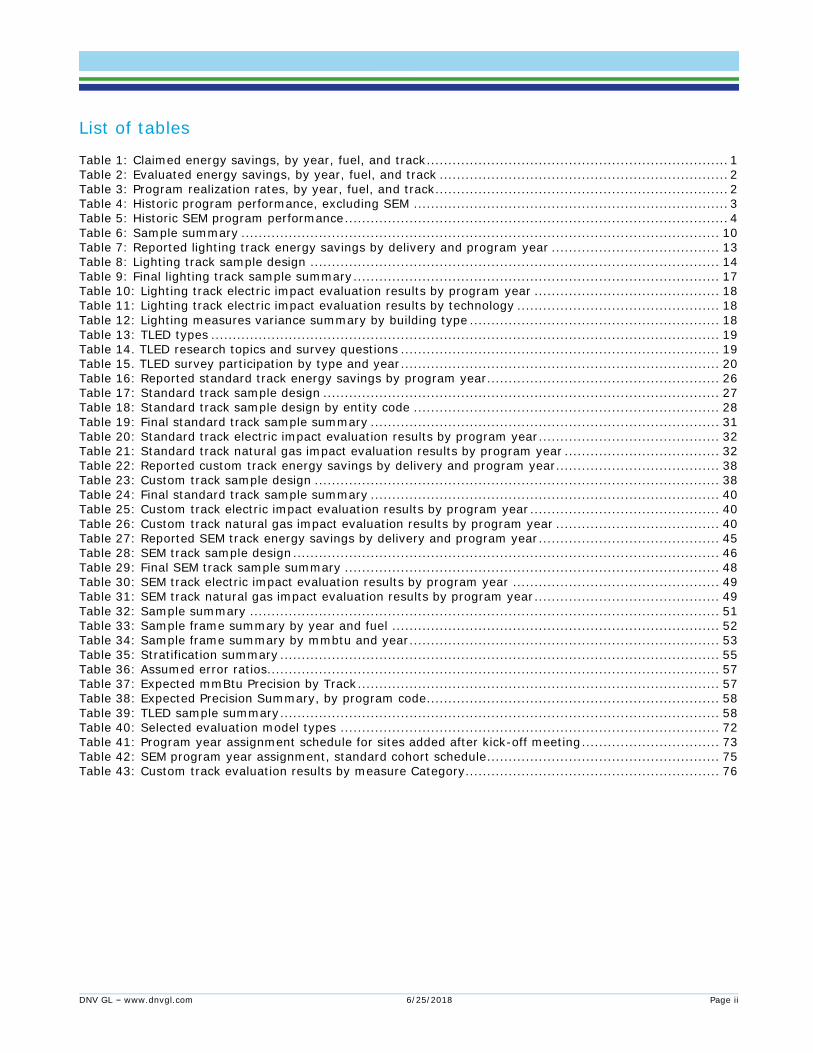
0.4 Historic capital measure performance
Table 4 and the charts on the following page show historic program performance. The table and charts do
not include the SEM track which was added to the Existing Buildings program in 2015.
Table 4: Historic program performance, excluding SEM
Program Year
Verified Electric Savings (MWh)
Electric Realization Rate
Verified Gas Savings (therms)
Gas Realization Rate
2008 41,887 99% 746,564 87%
2009 63,537 85% 705,644 75%
2010 91,884 107% 1,486,729 86%
2011 98,776 91% 2,148,020 101%
2012 86,911 95% 1,174,676 79%
2013 79,612 88% 911,922 67%
2014 82,699 81% 973,143 72%
2015 94,992 96% 1,061,316 79%
2016 104,962 92% 1,228,416 87%
Figure 1: Historic Non-SEM program electric savings and realization rates
Figure 2: Historic Non-SEM program gas savings and realization rates

DNV GL – www.dnvgl.com 6/25/2018 Page 4
0.5 Historic SEM performance
Table 5 and the charts that follow show historic SEM performance over time.
Table 5: Historic SEM program performance
Program
Year
Verified Electric
Savings (MWh)
Electric
Realization Rate
Verified Gas
Savings (therms)
Gas Realization
Rate
2012 7,351 139% -18,452 -15%
2013 8,988 103% 174,390 47%
2014 11,514 89% 690,639 160%
2015 9,217 89% 446,946 83%
2016 9,039 92% 546,458 113%
Figure 3: Historic SEM program electric savings and realization rates
Figure 4: Historic SEM program gas savings and realization rates

DNV GL – www.dnvgl.com 6/25/2018 Page 5
0.6 Evaluation findings and recommendations
0.6.1 Lighting recommendations
▪ Finding – In a limited number of cases, the evaluation estimated significantly different savings from
the program, at retail buildings more often than other building types. The difference in savings was due
primarily to differences in the annual hours of use estimated by the evaluation and those estimated by
the program.
- Recommendation – Given the frequency of over- and under-estimating operating hours, program
staff should emphasize the importance of accurate estimates of operating hours during training for
trade allies. DNV GL does not recommend any structural program change to address this. Any
change would likely increase program complexity with no assurance that it would improve estimates
of savings.
▪ Finding – The Existing Buildings program did not account for the effect of reduced lighting power on
building HVAC systems. This has the potential to result in an overestimation of the societal value
delivered by the program. The conclusions of the previous evaluation report5 are supported by DNV GL.
Across the projects evaluated, DNV GL estimates that interactive effects reduce interior lighting
electricity savings by 1% (approximately 146,000 kWh) and increase gas consumption at a rate of 2.5
therms per MWh of lighting energy saved (approximately 36,400 therms).
- Recommendation – Energy Trust should include estimates of interactive effects when calculating
the societal value of this program. Energy Trust should consider changes to its savings calculation
workbook, but weigh the changes against the added workbook complexity required. Future impact
evaluations should continue to estimate the impact of lighting projects on all building systems.
0.6.2 TLED lighting specific recommendations
▪ Finding – General satisfaction with TLEDs is high and performance issues are minimal. Out of 44
survey participants, 43 gave their TLEDs a 4 out of 5 rating; one participant gave a 3 rating. There was
only one report of buzzing and flickering (which started after a fire at a local substation caused a power
surge) and one report of ballast failure. Over 90% have not removed any lamps or fixtures since the
retrofit, another indication of satisfaction with lighting system performance.
- Recommendation – Continue supporting the installation of TLEDs. No systematic concerns were
identified that require a program change to address.
0.6.3 Measure Approval Documents recommendations
▪ Finding – The measure approval documents (MADs) reviewed do not provide sufficient transparency
and traceability to support reliable savings estimates. Energy Trust has been updating the format and
content of these documents over time and the documents reviewed for this evaluation cover multiple
stages of development.
- Recommendation – DNV GL discusses this finding further and provides multiple recommendations
to address it within the standard track evaluation section. The recommendations focus on increasing
transparency and traceability within the documents. Additionally, DNV GL recommends that Energy
Trust develop and implement a plan to transition from a system with supporting documentation
5 Energy Trust of Oregon, Impact Evaluation of the 2013-2014 Existing Buildings Program, Prepared by ADM Associates Inc., 02/09/17. Available at:
https://www.energytrust.org/wp-content/uploads/2017/02/EB_Impact_Evaluation_2013_2014.pdf

DNV GL – www.dnvgl.com 6/25/2018 Page 6
stored on internal servers to one that makes the methodologies, assumptions, and values used
readily available to the public on the Energy Trust website.
0.6.4 Standard measure recommendations
▪ Finding – DNV GL identified multiple opportunities to improve the accuracy and reliability of savings
estimates for multiple standard measures. DNV GL discusses these findings further and provides multiple
recommendations to address them within the standard track evaluation section. Below is a summary of
the reccommendations.
- Power Strips – Energy Trust should adjust the assumptions for leave-behind power strips and
initiate research on purchased power strips. Leave behind power strip savings are unreliable.
- ENERGY STAR – Energy Trust should consider using the ENERGY STAR calculators more directly
and reduce use of program-specific assumptions. The assumptions used by the program are not
sufficiently documented.
- Refrigeration – Energy Trust should review the assumptions and methods used to estimate
refrigeration measure savings. Energy Trust should confirm that the correct savings are used in the
tracking database for the measures installed.
- Food Equipment – Energy Trust should assume the standard gas fryer vat size instead of the large
fryer vat size when estimating savings. Additionally, Energy Trust should consider standard practice
research to document the current baseline for lost opportunity kitchen equipment purchases.
- Boilers – Energy Trust should update the savings assumptions for condensing boilers to account for
back-up capacity that is installed, but rarely operated. Energy Trust should consider future research
to assess the efficiency of lost opportunity baseline equipment.
0.6.5 Custom recommendations
▪ Finding – DNV GL found the models developed by the program to be robust. DNV GL did not identify
any systemic errors in the energy savings analysis, but errors did exist in the projects reviewed.
- Recommendation – Final reported savings based on eQuest simulation models should use
parametric runs to estimate the impact of measure combinations. Final reported savings based on
Trane Trace simulation models should use a modelling alternative that includes all measures
installed. DNV GL recommends using standard weather files and providing the weather files along
with the energy model files.
- Recommendation – DNV GL believes the following adjustments will improve Energy Trust’s
program: increase documentation of changes to building controls, avoid overly complex calculations,
and avoid non-live calculations.
0.6.6 Strategic Energy Management recommendations
▪ Finding – Participants value energy coaches and peer-to-peer learning. Participants cite benefits from
the insights provided by working closely with energy coaches to identify and execute operational and
capital improvement opportunities.
- Recommendation – Energy Trust should continue to identify program improvements that allow
energy coaches to spend more time working with participant staff to support energy conservation
opportunities. Additionally, DNV GL recommends that Energy Trust looks to further support
interorganizational learning opportunities, such as is provided by the peer-to-peer learning sessions.

DNV GL – www.dnvgl.com 6/25/2018 Page 7
▪ Finding - Energy Champions & Executive Leadership are key. DNV GL finds that the participant’s level
of program engagement corresponds to the organization’s level of buy-in by executive leadership and
level of continuity of energy champion staff.
- Recommendation – Based on this finding, DNV GL recommends to Energy Trust that participants
exhibiting low engagement be classified under an inactive status, and the program not report
savings from those participants. Reclassification as an active program participant could occur when
the entity demonstrates their willingness to actively engage and support fully participating in the
process.
▪ Finding - Many model baselines have or will soon expire. DNV GL observes that many enrolled facilities
have baseline measurement periods that have already or will soon elapse the five-year baseline term
stated in the program guidelines. Additionally, many facilities are using non-standard ‘baseline
adjustments.’
- Recommendation - The evaluation team recommends updating expired baseline measurement
periods ahead of the 2019 program year, if this is not already being performed. This will have the
added benefit of reducing the quantity of older models that do not conform to the current modeling
guidelines (e.g. do not use degree days) as well as eliminate complication from legacy capital
projects.
▪ Finding - Measurement periods are inconsistent. The evaluation team observes inconsistency in
measurement periods across participating facilities. While the measurement periods generally span from
the Fall to the following Fall, the initial and final measurement months are not consistent across the
program. This creates complications and uncertainty in assessing annual savings values for both the
program and the evaluation teams.
- Recommendation - To address this issue, DNV GL recommends that Energy Trust create a
measurement schedule for current and future participants that defines when each year’s period will
start and stop, use this schedule across the program, and thoroughly document justifications for any
deviations from the schedule that are deemed necessary.

421 SW Oak St., Suite 300 Portland, OR 97204 1.866.368.7878 energytrust.org
MEMO To: Board of Directors From: Jay Olson, Sr. Program Manager – Commercial
Kathleen Belkhayat, Program Manager – Commercial Energy Performance Management Sarah Castor, Evaluation Sr. Project Manager
Date: June 28, 2018 Re: Staff Response to the Impact Evaluation of the 2015-2016 Existing Buildings
Program
The evaluation of Energy Trust of Oregon’s Existing Buildings program savings in 2015 and 2016, conducted by DNV GL, determined that the program saved substantial amounts of electricity and natural gas. The achieved savings are also very close to what the program estimated it would save, reinforcing the reliability of program savings estimates.
The Existing Buildings program continually strives to improve the accuracy of its savings estimates. As such, staff agree with the evaluation’s recommendations to review standard measures for foodservice equipment, refrigeration and boilers to assess whether improvements of the savings estimates are possible. The program will also work with Allied Technical Assistance Contractors to ensure high quality, thorough energy simulation models and to implement parametric runs when applicable.
Given the newness of tubular light emitting diode (TLED) technology, staff is pleased to see a high level of satisfaction among participants installing the lighting measure. The positive experiences and reliable performance of TLEDs support their retention and expanded adoption in a variety of commercial building applications. Energy Trust will continue to monitor customer experience with TLEDs in the 2017 Existing Buildings impact evaluation.
The commercial Strategic Energy Management offering continues to demonstrate high value for both energy savings and customer engagement and education. The program is in the process of updating a large number of models to conform with program guidelines and reflect adjusted baseline periods. Staff expect this effort to improve the consistency and accuracy of models, as well as the ease of evaluating energy savings.

DNV GL – www.dnvgl.com 6/25/2018 Page 8
1 BACKGROUND
Energy Trust performs evaluations of its programs on a regular basis. DNV GL was selected to conduct an
impact evaluation of Energy Trust’s Existing Buildings program offering. This program offering is designed to
deliver comprehensive energy efficiency options and services to commercial customers with existing
buildings. The program offers incentives and technical support for the installation and operation of cost
effective energy efficiency measures for all major building end uses. This evaluation covers program years
2015 through 2016. The goals of this evaluation are to:
▪ Develop estimates of Existing Buildings program gas and electric savings to establish realization rates
for the 2015 and 2016 program years individually. Information will be used for future program savings
projections and budget developments and will be incorporated into Energy Trust’s annual true-up of
program savings.
▪ Report observations from the evaluation and make recommendations to help Energy Trust understand
substantial deviations from claimed savings and to improve ex ante savings estimates and the
effectiveness of future engineering studies and impact evaluations of Existing Buildings projects.
1.1 Energy Trust background
Energy Trust is an independent nonprofit organization, selected and overseen by the Oregon Public Utility
Commission, to lead Oregon utility customers in benefiting from saving energy and generating renewable
power. The services, cash incentives and solutions have helped participating customers of Portland General
Electric, Pacific Power, NW Natural, Cascade Natural Gas, and Avista save more than $2.3 billion on their
energy bills since 2002. The cumulative impact of their programs since 2002 has been a contributing factor
in the region’s low energy costs and in building a sustainable energy future. More information about Energy
Trust’s background, funding sources, strategic and action plans, policies and programs are available on their
website at www.energytrust.org/about.
1.2 Program description
The Existing Buildings (EB) program began in March 2004 and is implemented by a program management
contractor (PMC). ICF International has been the PMC since January 1, 2013. The program has four main
tracks: Custom, Lighting (including standard, direct-install, and street lighting measures), Standard
(prescriptive), and Strategic Energy Management (SEM). The program also maintains a few other tracks and
pilots, which represent a small portion of program participants and savings, and are excluded from this
evaluation. Custom track projects have their savings estimated through energy studies conducted by Allied
Technical Assistance Contractors (ATACs). These studies may involve engineering calculations or energy
simulation modeling. Standard Lighting track measures are installed directly by trade allies, while direct-
install lighting measures are installed by a trade ally subcontractor to SmartWatt, under subcontract to the
PMC. Standard track measures use savings estimates from reliable sources (including the Regional Technical
Forum, ENERGY STAR, and others), as documented in Energy Trust measure approval documents (MADs).
SEM savings are estimated based on a top-down analysis of building-level energy use and do not include
savings from capital measures completed at the site through other program tracks during the SEM
engagement. After completing a first year of SEM, participants have the option of participating in Continuous
SEM, where they can claim additional savings and incentives for furthering their SEM activities.

DNV GL – www.dnvgl.com 6/25/2018 Page 9
1.3 Evaluation objectives
This evaluation was designed and completed to achieve the following primary objectives:
▪ Estimate the gas and electric savings achieved by program years 2015 (PY2015) and 2016 (PY2016).
▪ Calculate gas and electric realization rates for PY2015 and PY2016.
▪ Provide savings and realization rates separately for SEM and non-SEM measures by program year and
fuel type.
▪ Provide realization rates to serve future program savings projections and budget developments.
▪ Report observations from the evaluation regarding program implementation and documentation, and
compare assumptions regarding measure performance to actual performance.
▪ Provide recommendations to:
- Understand substantial deviations from reported savings
- Improve reported savings estimates
- Improve effectiveness of future engineering studies and impact evaluations

DNV GL – www.dnvgl.com 6/25/2018 Page 10
2 EVALUATION OVERVIEW
This section provides an overview of DNV GL’s technical approach for the impact evaluation of this program.
This section only describes the tasks used to determine the evaluated savings. Track-specific evaluation
sections are provided following the overview. The track specific sections discuss the actual activities and
results for the program tracks.
2.1 Program database review
DNV GL reviewed the program tracking data provided by Energy Trust. This task helped DNV GL understand
the measures and projects completed during the two program years and begin to plan for the impact
evaluation.
During this task, DNV GL and Energy Trust identified the measure codes that should be considered TLED
codes during this evaluation.
2.2 Sample design
DNV GL utilized stratified random sampling with certainty selection across 82 unique strata to identify the
sample for this impact evaluation. Table 6 summarizes the final sample design implemented and the
associated expected relative precision of the results. The full sample design is discussed in Appendix A. The
design for each track is discussed in the track specific sections.
Table 6: Sample summary
Measure
Type Fuel
2015 2016
% of
Reported
Savings in
Draft
Sample
N n Relative
Precision % of
Reported
Savings
in Draft
Sample
N n Relative
Precision
Frame Sample (90%
CI) Frame Sample
(90%
CI)
Capital
(Non-SEM)
Electric 21% 3,851 124 10% 19% 4,455 128 9%
Gas 23% 676 52 14% 28% 727 59 12%
SEM Electric 28% 89 20 17% 45% 135 28 20%
Gas 23% 50 15 19% 22% 69 17 18%
ALL
(Capital +
SEM)
Electric 22% 3,940 144 9% 21% 4,590 156 9%
Gas 23% 726 67 11% 26% 796 76 10%
2.3 Site specific evaluation
Site specific impact evaluation was initiated after the final primary sample was identified. The site specific
impact evaluation process steps used for this project is illustrated in Figure 5.
Figure 5. Impact evaluation process steps
Program Documentation
Review
Project File
ReviewPlanning
Data Collection
Analysis Reporting
DNV GL – www.dnvgl.com 6/25/2018 Page 11
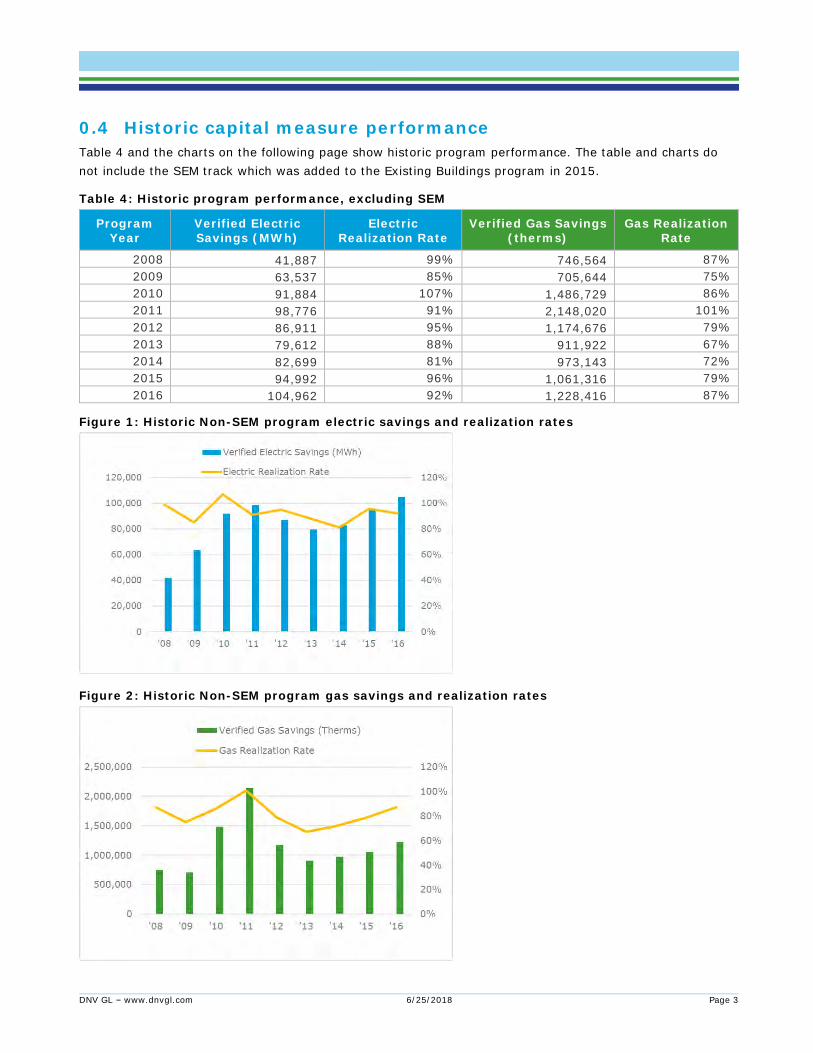
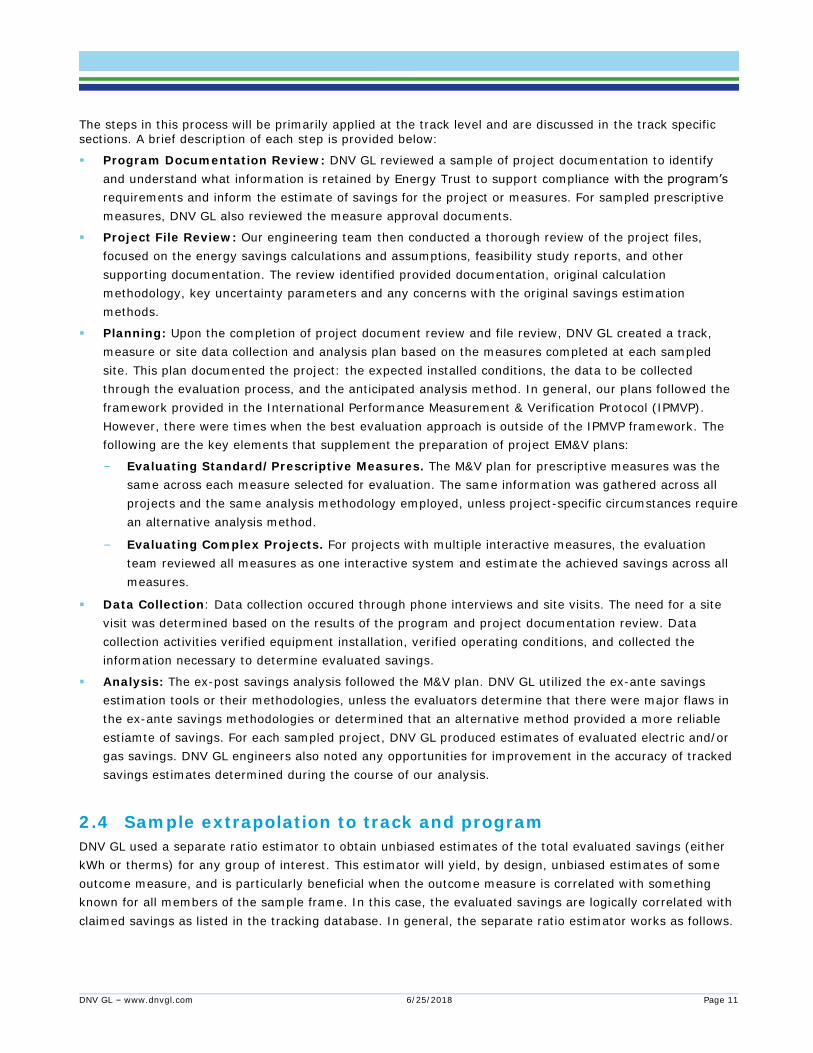
The steps in this process will be primarily applied at the track level and are discussed in the track specific sections. A brief description of each step is provided below:
▪ Program Documentation Review: DNV GL reviewed a sample of project documentation to identify
and understand what information is retained by Energy Trust to support compliance with the program’s
requirements and inform the estimate of savings for the project or measures. For sampled prescriptive
measures, DNV GL also reviewed the measure approval documents.
▪ Project File Review: Our engineering team then conducted a thorough review of the project files,
focused on the energy savings calculations and assumptions, feasibility study reports, and other
supporting documentation. The review identified provided documentation, original calculation
methodology, key uncertainty parameters and any concerns with the original savings estimation
methods.
▪ Planning: Upon the completion of project document review and file review, DNV GL created a track,
measure or site data collection and analysis plan based on the measures completed at each sampled
site. This plan documented the project: the expected installed conditions, the data to be collected
through the evaluation process, and the anticipated analysis method. In general, our plans followed the
framework provided in the International Performance Measurement & Verification Protocol (IPMVP).
However, there were times when the best evaluation approach is outside of the IPMVP framework. The
following are the key elements that supplement the preparation of project EM&V plans:
- Evaluating Standard/Prescriptive Measures. The M&V plan for prescriptive measures was the
same across each measure selected for evaluation. The same information was gathered across all
projects and the same analysis methodology employed, unless project-specific circumstances require
an alternative analysis method.
- Evaluating Complex Projects. For projects with multiple interactive measures, the evaluation
team reviewed all measures as one interactive system and estimate the achieved savings across all
measures.
▪ Data Collection: Data collection occured through phone interviews and site visits. The need for a site
visit was determined based on the results of the program and project documentation review. Data
collection activities verified equipment installation, verified operating conditions, and collected the
information necessary to determine evaluated savings.
▪ Analysis: The ex-post savings analysis followed the M&V plan. DNV GL utilized the ex-ante savings
estimation tools or their methodologies, unless the evaluators determine that there were major flaws in
the ex-ante savings methodologies or determined that an alternative method provided a more reliable
estiamte of savings. For each sampled project, DNV GL produced estimates of evaluated electric and/or
gas savings. DNV GL engineers also noted any opportunities for improvement in the accuracy of tracked
savings estimates determined during the course of our analysis.
2.4 Sample extrapolation to track and program
DNV GL used a separate ratio estimator to obtain unbiased estimates of the total evaluated savings (either
kWh or therms) for any group of interest. This estimator will yield, by design, unbiased estimates of some
outcome measure, and is particularly beneficial when the outcome measure is correlated with something
known for all members of the sample frame. In this case, the evaluated savings are logically correlated with
claimed savings as listed in the tracking database. In general, the separate ratio estimator works as follows.
DNV GL – www.dnvgl.com 6/25/2018 Page 12
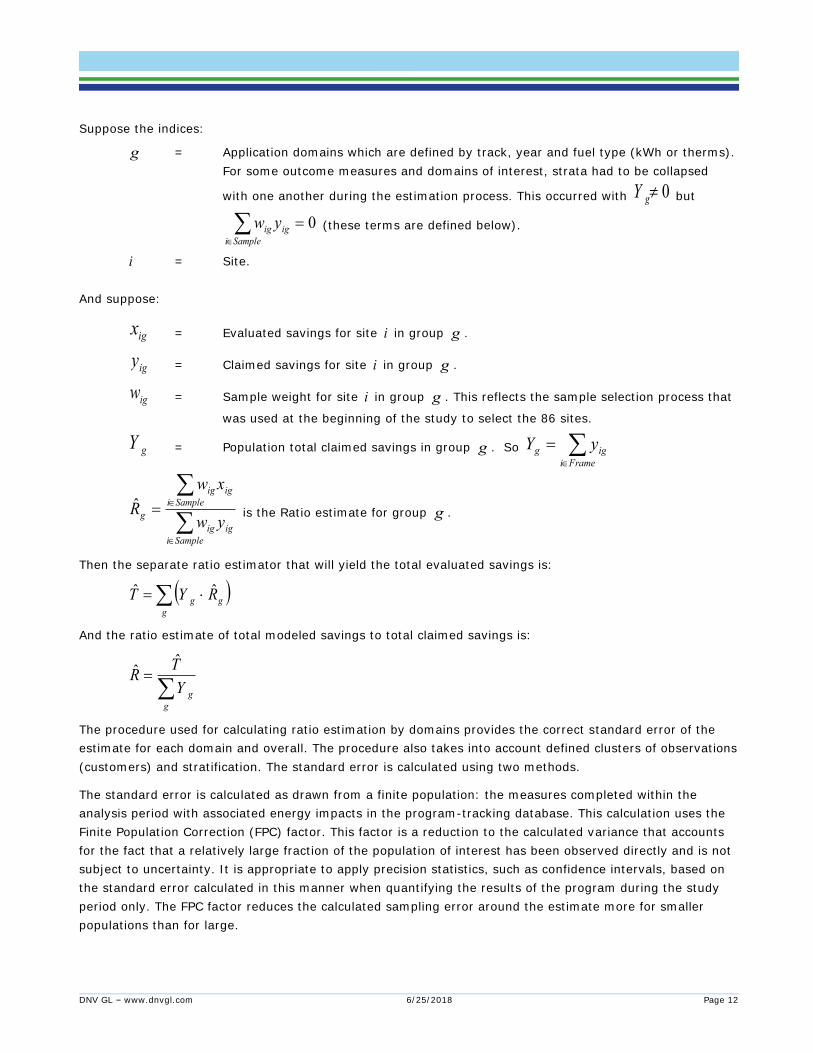
Suppose the indices:
g = Application domains which are defined by track, year and fuel type (kWh or therms).
For some outcome measures and domains of interest, strata had to be collapsed
with one another during the estimation process. This occurred with 0gY but
Samplei
igig yw 0 (these terms are defined below).
i = Site.
And suppose:
igx = Evaluated savings for site i in group g .
igy = Claimed savings for site i in group g .
igw = Sample weight for site i in group g . This reflects the sample selection process that
was used at the beginning of the study to select the 86 sites.
gY = Population total claimed savings in group g . So
Framei
igg yY
Sampleiigig
Sampleiigig
g yw
xwR̂ is the Ratio estimate for group g .
Then the separate ratio estimator that will yield the total evaluated savings is:
g
gg RYT ˆˆ
And the ratio estimate of total modeled savings to total claimed savings is:
ggY
TRˆˆ
The procedure used for calculating ratio estimation by domains provides the correct standard error of the
estimate for each domain and overall. The procedure also takes into account defined clusters of observations
(customers) and stratification. The standard error is calculated using two methods.
The standard error is calculated as drawn from a finite population: the measures completed within the
analysis period with associated energy impacts in the program-tracking database. This calculation uses the
Finite Population Correction (FPC) factor. This factor is a reduction to the calculated variance that accounts
for the fact that a relatively large fraction of the population of interest has been observed directly and is not
subject to uncertainty. It is appropriate to apply precision statistics, such as confidence intervals, based on
the standard error calculated in this manner when quantifying the results of the program during the study
period only. The FPC factor reduces the calculated sampling error around the estimate more for smaller
populations than for large.
DNV GL – www.dnvgl.com 6/25/2018 Page 13
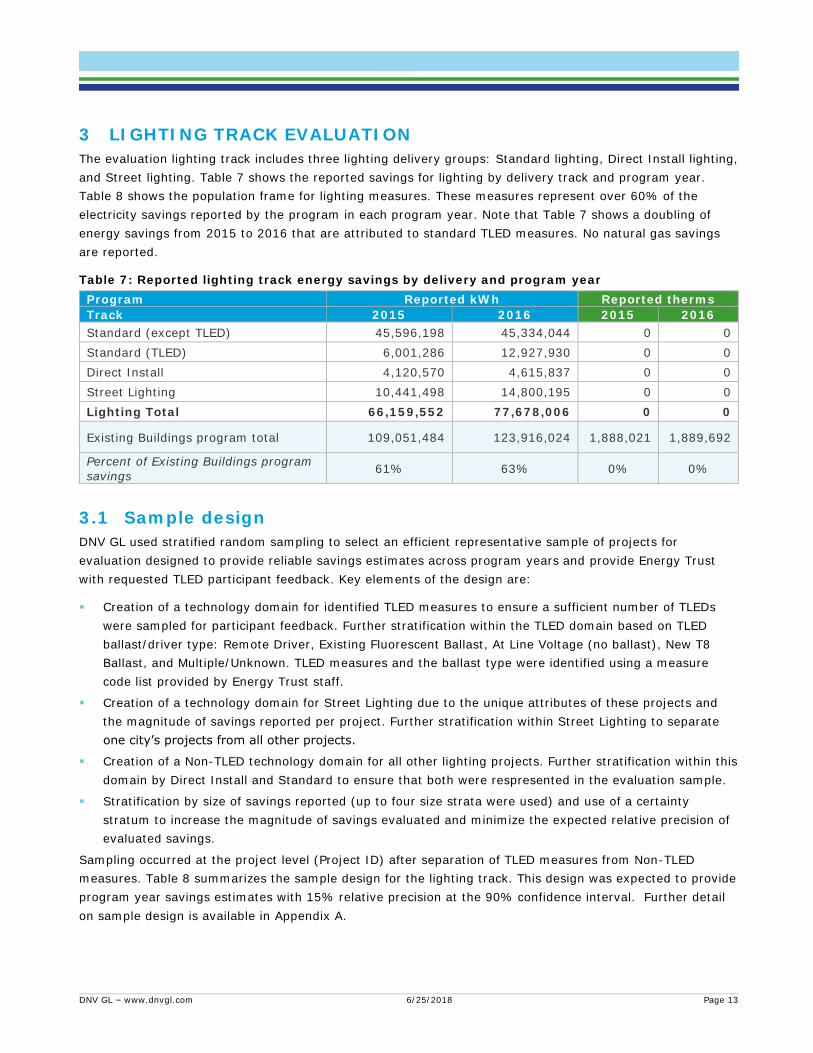
3 LIGHTING TRACK EVALUATION
The evaluation lighting track includes three lighting delivery groups: Standard lighting, Direct Install lighting,
and Street lighting. Table 7 shows the reported savings for lighting by delivery track and program year.
Table 8 shows the population frame for lighting measures. These measures represent over 60% of the
electricity savings reported by the program in each program year. Note that Table 7 shows a doubling of
energy savings from 2015 to 2016 that are attributed to standard TLED measures. No natural gas savings
are reported.
Table 7: Reported lighting track energy savings by delivery and program year
Program Reported kWh Reported therms
Track 2015 2016 2015 2016
Standard (except TLED) 45,596,198 45,334,044 0 0
Standard (TLED) 6,001,286 12,927,930 0 0
Direct Install 4,120,570 4,615,837 0 0
Street Lighting 10,441,498 14,800,195 0 0
Lighting Total 66,159,552 77,678,006 0 0
Existing Buildings program total 109,051,484 123,916,024 1,888,021 1,889,692
Percent of Existing Buildings program
savings 61% 63% 0% 0%
3.1 Sample design
DNV GL used stratified random sampling to select an efficient representative sample of projects for
evaluation designed to provide reliable savings estimates across program years and provide Energy Trust
with requested TLED participant feedback. Key elements of the design are:
▪ Creation of a technology domain for identified TLED measures to ensure a sufficient number of TLEDs
were sampled for participant feedback. Further stratification within the TLED domain based on TLED
ballast/driver type: Remote Driver, Existing Fluorescent Ballast, At Line Voltage (no ballast), New T8
Ballast, and Multiple/Unknown. TLED measures and the ballast type were identified using a measure
code list provided by Energy Trust staff.
▪ Creation of a technology domain for Street Lighting due to the unique attributes of these projects and
the magnitude of savings reported per project. Further stratification within Street Lighting to separate
one city’s projects from all other projects.
▪ Creation of a Non-TLED technology domain for all other lighting projects. Further stratification within this
domain by Direct Install and Standard to ensure that both were respresented in the evaluation sample.
▪ Stratification by size of savings reported (up to four size strata were used) and use of a certainty
stratum to increase the magnitude of savings evaluated and minimize the expected relative precision of
evaluated savings.
Sampling occurred at the project level (Project ID) after separation of TLED measures from Non-TLED
measures. Table 8 summarizes the sample design for the lighting track. This design was expected to provide
program year savings estimates with 15% relative precision at the 90% confidence interval. Further detail
on sample design is available in Appendix A.
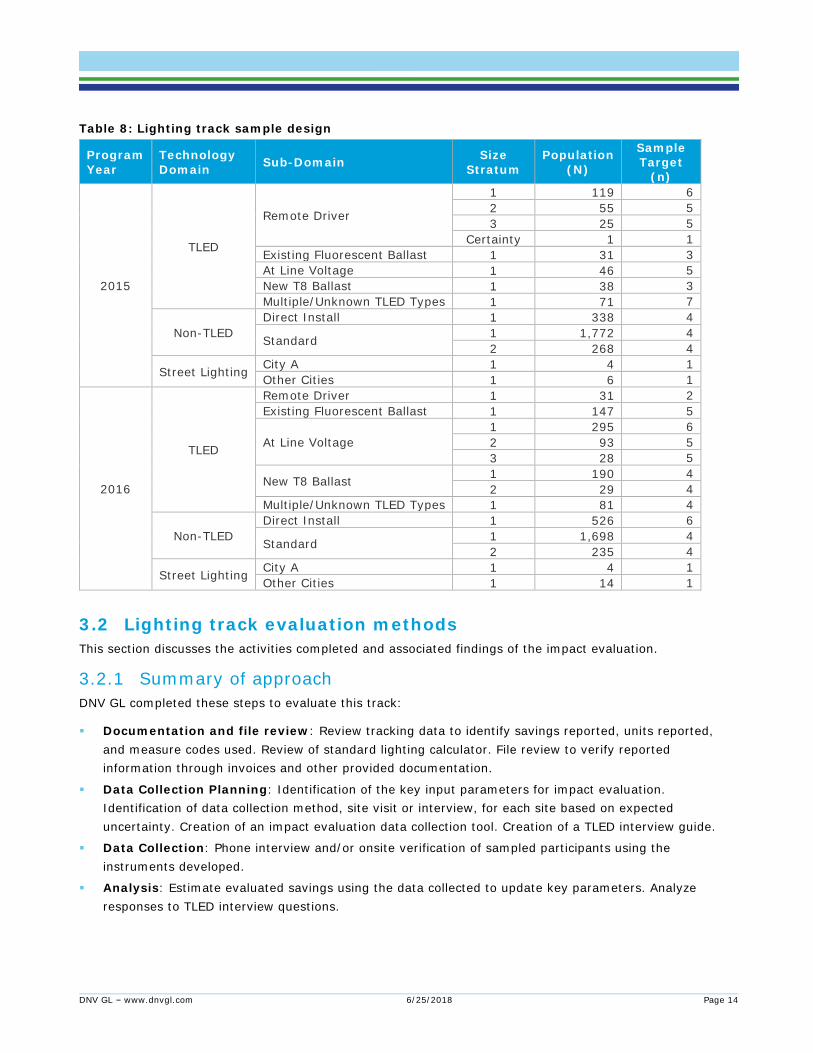
DNV GL – www.dnvgl.com 6/25/2018 Page 14
Table 8: Lighting track sample design
Program
Year
Technology
Domain Sub-Domain
Size
Stratum
Population
(N)
Sample Target
(n)
2015
TLED
Remote Driver
1 119 6
2 55 5
3 25 5
Certainty 1 1
Existing Fluorescent Ballast 1 31 3
At Line Voltage 1 46 5
New T8 Ballast 1 38 3
Multiple/Unknown TLED Types 1 71 7
Non-TLED
Direct Install 1 338 4
Standard 1 1,772 4
2 268 4
Street Lighting City A 1 4 1
Other Cities 1 6 1
2016
TLED
Remote Driver 1 31 2
Existing Fluorescent Ballast 1 147 5
At Line Voltage
1 295 6
2 93 5
3 28 5
New T8 Ballast 1 190 4
2 29 4
Multiple/Unknown TLED Types 1 81 4
Non-TLED
Direct Install 1 526 6
Standard 1 1,698 4
2 235 4
Street Lighting City A 1 4 1
Other Cities 1 14 1
3.2 Lighting track evaluation methods
This section discusses the activities completed and associated findings of the impact evaluation.
3.2.1 Summary of approach
DNV GL completed these steps to evaluate this track:
▪ Documentation and file review: Review tracking data to identify savings reported, units reported,
and measure codes used. Review of standard lighting calculator. File review to verify reported
information through invoices and other provided documentation.
▪ Data Collection Planning: Identification of the key input parameters for impact evaluation.
Identification of data collection method, site visit or interview, for each site based on expected
uncertainty. Creation of an impact evaluation data collection tool. Creation of a TLED interview guide.
▪ Data Collection: Phone interview and/or onsite verification of sampled participants using the
instruments developed.
▪ Analysis: Estimate evaluated savings using the data collected to update key parameters. Analyze
responses to TLED interview questions.
DNV GL – www.dnvgl.com 6/25/2018 Page 15
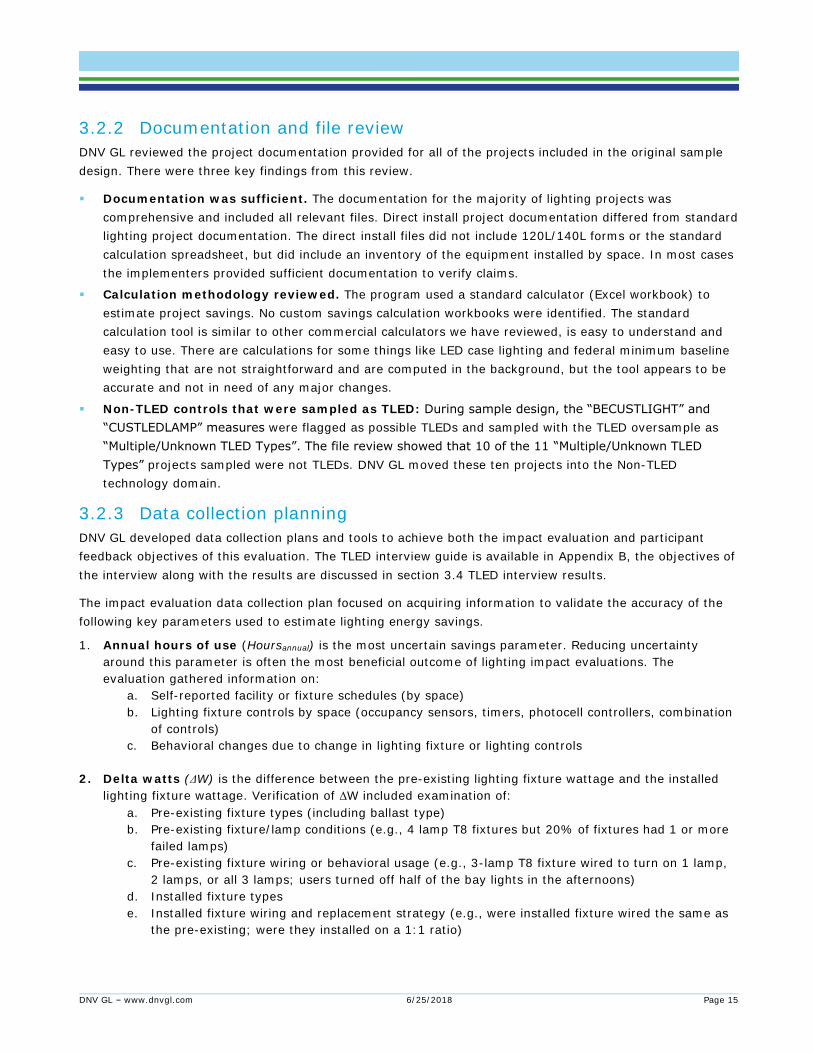
3.2.2 Documentation and file review
DNV GL reviewed the project documentation provided for all of the projects included in the original sample
design. There were three key findings from this review.
▪ Documentation was sufficient. The documentation for the majority of lighting projects was
comprehensive and included all relevant files. Direct install project documentation differed from standard
lighting project documentation. The direct install files did not include 120L/140L forms or the standard
calculation spreadsheet, but did include an inventory of the equipment installed by space. In most cases
the implementers provided sufficient documentation to verify claims.
▪ Calculation methodology reviewed. The program used a standard calculator (Excel workbook) to
estimate project savings. No custom savings calculation workbooks were identified. The standard
calculation tool is similar to other commercial calculators we have reviewed, is easy to understand and
easy to use. There are calculations for some things like LED case lighting and federal minimum baseline
weighting that are not straightforward and are computed in the background, but the tool appears to be
accurate and not in need of any major changes.
▪ Non-TLED controls that were sampled as TLED: During sample design, the “BECUSTLIGHT” and
“CUSTLEDLAMP” measures were flagged as possible TLEDs and sampled with the TLED oversample as
“Multiple/Unknown TLED Types”. The file review showed that 10 of the 11 “Multiple/Unknown TLED
Types” projects sampled were not TLEDs. DNV GL moved these ten projects into the Non-TLED
technology domain.
3.2.3 Data collection planning
DNV GL developed data collection plans and tools to achieve both the impact evaluation and participant
feedback objectives of this evaluation. The TLED interview guide is available in Appendix B, the objectives of
the interview along with the results are discussed in section 3.4 TLED interview results.
The impact evaluation data collection plan focused on acquiring information to validate the accuracy of the
following key parameters used to estimate lighting energy savings.
1. Annual hours of use (Hoursannual) is the most uncertain savings parameter. Reducing uncertainty
around this parameter is often the most beneficial outcome of lighting impact evaluations. The
evaluation gathered information on:
a. Self-reported facility or fixture schedules (by space)
b. Lighting fixture controls by space (occupancy sensors, timers, photocell controllers, combination
of controls)
c. Behavioral changes due to change in lighting fixture or lighting controls
2. Delta watts (ΔW) is the difference between the pre-existing lighting fixture wattage and the installed
lighting fixture wattage. Verification of ΔW included examination of:
a. Pre-existing fixture types (including ballast type)
b. Pre-existing fixture/lamp conditions (e.g., 4 lamp T8 fixtures but 20% of fixtures had 1 or more
failed lamps)
c. Pre-existing fixture wiring or behavioral usage (e.g., 3-lamp T8 fixture wired to turn on 1 lamp,
2 lamps, or all 3 lamps; users turned off half of the bay lights in the afternoons)
d. Installed fixture types
e. Installed fixture wiring and replacement strategy (e.g., were installed fixture wired the same as
the pre-existing; were they installed on a 1:1 ratio)

DNV GL – www.dnvgl.com 6/25/2018 Page 16
3. Quantity
a. Pre-existing fixture quantities (by space and/or fixture type)
b. Installed fixture quantities (by space and/or fixture type)
c. Quantity of fixtures added or removed since the original install date
Interactive effects: Current Energy Trust policy does not account for heating and cooling interactive
effects on lighting measures.6 DNV GL agrees with previous program evaluators7 that interactive effects
should be included to accurately estimate the value of the program. For this study, DNV GL collected high-
level HVAC system information, what locations they serve, and the locations of claimed fixture retrofits. The
evaluation estimated the impact of lighting measures on HVAC consumption using the collected information
and Regional Technical Forum-based interactive factors.8
3.2.4 Data collection
Lighting data collection occurred primarily via telephone interview. DNV GL engineers spoke with facility
owners or operators to collect the identified key parameter information. During the file reviews and initial
recruitment, DNV GL flagged participants for possible site visits based on combinations of the following:
▪ Site contact, tenant, or ownership change. If the recruitment effort determined that the facility had
changed owner or tenant, and the contact was not familiar with the incentivized project, the site might
have been flagged for a site visit;
▪ The site was a high-priority data point for the stratum;
▪ Major renovation occurred or occupancy type changed; and
▪ Complex or custom lighting project that involved multiple measures or multiple space types.
Interviews, either on-site or via telephone, with TLED measure participants included additional questions
specific to TLEDs. The TLED interview guide developed for this evaluation is available in Appendix B.
3.2.5 Project level analysis
DNV GL developed a savings calculation workbook template that follows the methodology (flow and
function) of Energy Trust’s standard savings tool (Tab: Form 103L) used in the lighting program. Savings
that were claimed by Energy Trust and sampled by the evaluation were first re-created in the savings
calculation workbook. Evaluated energy savings were calculated in the same workbook by adjusting the key
savings parameters. The values used were determined from the most valid data source available.
Key Savings Parameters - The key savings parameters researched were:
- Annual hours of use (Hoursannual)
- Delta wattage (difference between pre-existing lighting fixture wattage and the installed lighting
fixture wattage, ΔW)
- Quantity
Using these key savings parameters, direct annual energy (kWh) savings are very generally described as:
6 Heat is a byproduct of lighting. As lighting efficiency increases, the heat it gives off tends to decrease. This has an interactive effect on HVAC costs.
During heating months, HVAC typically has to work harder to make up the heat that used to be generated by the lighting. In cooling months,
the HVAC typically consumes less energy. 7 Energy Trust of Oregon, Impact Evaluation of the 2013-2014 Existing Buildings Program, Prepared by ADM Associates Inc., 02/09/17. Available at:
https://www.energytrust.org/wp-content/uploads/2017/02/EB_Impact_Evaluation_2013_2014.pdf 8 STANDARD PROTOCOL FOR ESTIMATING ENERGY SAVINGS OF NON-RESIDENTIAL LIGHTING RETROFITS V2.4, REGIONAL TECHNICAL FORUM,
Release date: December 6, 2016. Available at: https://rtf.nwcouncil.org/standard-protocol/non-residential-lighting-retrofits
DNV GL – www.dnvgl.com 6/25/2018 Page 17
𝑘𝑊ℎ𝑠𝑎𝑣𝑖𝑛𝑔𝑠 = ∑ ∆𝑊 × 𝐻𝑜𝑢𝑟𝑠 𝑎𝑛𝑛𝑢𝑎𝑙 × 𝑄𝑢𝑎𝑛𝑡𝑖𝑡𝑦
𝑚𝑒𝑎𝑠𝑢𝑟𝑒𝑠
As described in Section 3.2.3, we also included an interactive factor to estimate total evaluated savings for
each project.
3.3 Lighting track evaluation results
This section presents the results of DNV GL’s impact evaluation for this track.
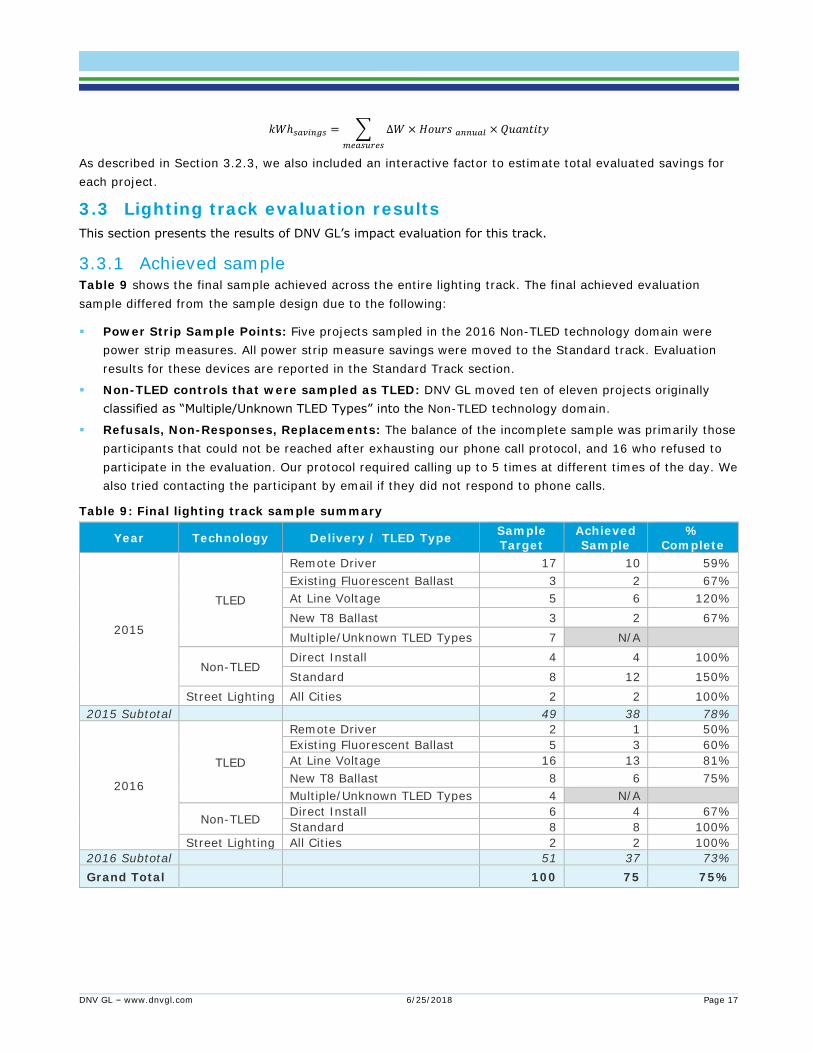
3.3.1 Achieved sample Table 9 shows the final sample achieved across the entire lighting track. The final achieved evaluation
sample differed from the sample design due to the following:
▪ Power Strip Sample Points: Five projects sampled in the 2016 Non-TLED technology domain were
power strip measures. All power strip measure savings were moved to the Standard track. Evaluation
results for these devices are reported in the Standard Track section.
▪ Non-TLED controls that were sampled as TLED: DNV GL moved ten of eleven projects originally
classified as “Multiple/Unknown TLED Types” into the Non-TLED technology domain.
▪ Refusals, Non-Responses, Replacements: The balance of the incomplete sample was primarily those
participants that could not be reached after exhausting our phone call protocol, and 16 who refused to
participate in the evaluation. Our protocol required calling up to 5 times at different times of the day. We
also tried contacting the participant by email if they did not respond to phone calls.
Table 9: Final lighting track sample summary
Year Technology Delivery / TLED Type Sample Target
Achieved Sample
% Complete
2015
TLED
Remote Driver 17 10 59%
Existing Fluorescent Ballast 3 2 67%
At Line Voltage 5 6 120%
New T8 Ballast 3 2 67%
Multiple/Unknown TLED Types 7 N/A
Non-TLED Direct Install 4 4 100%
Standard 8 12 150%
Street Lighting All Cities 2 2 100%
2015 Subtotal 49 38 78%
2016
TLED
Remote Driver 2 1 50%
Existing Fluorescent Ballast 5 3 60%
At Line Voltage 16 13 81%
New T8 Ballast 8 6 75%
Multiple/Unknown TLED Types 4 N/A
Non-TLED Direct Install 6 4 67%
Standard 8 8 100%
Street Lighting All Cities 2 2 100%
2016 Subtotal 51 37 73%
Grand Total 100 75 75%
DNV GL – www.dnvgl.com 6/25/2018 Page 18
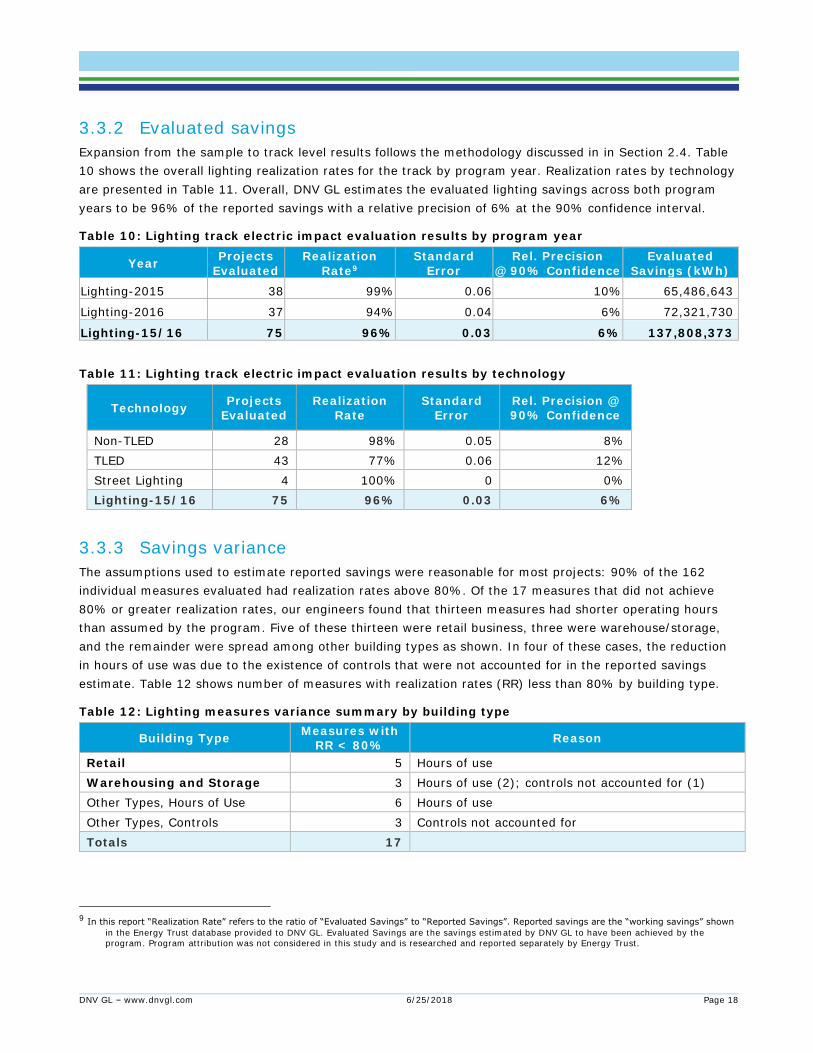
3.3.2 Evaluated savings
Expansion from the sample to track level results follows the methodology discussed in in Section 2.4. Table
10 shows the overall lighting realization rates for the track by program year. Realization rates by technology
are presented in Table 11. Overall, DNV GL estimates the evaluated lighting savings across both program
years to be 96% of the reported savings with a relative precision of 6% at the 90% confidence interval.
Table 10: Lighting track electric impact evaluation results by program year
Year Projects
Evaluated
Realization
Rate9
Standard
Error
Rel. Precision
@ 90% Confidence
Evaluated
Savings (kWh)
Lighting-2015 38 99% 0.06 10% 65,486,643
Lighting-2016 37 94% 0.04 6% 72,321,730
Lighting-15/16 75 96% 0.03 6% 137,808,373
Table 11: Lighting track electric impact evaluation results by technology
Technology Projects
Evaluated Realization
Rate Standard
Error Rel. Precision @ 90% Confidence
Non-TLED 28 98% 0.05 8%
TLED 43 77% 0.06 12%
Street Lighting 4 100% 0 0%
Lighting-15/16 75 96% 0.03 6%
3.3.3 Savings variance
The assumptions used to estimate reported savings were reasonable for most projects: 90% of the 162
individual measures evaluated had realization rates above 80%. Of the 17 measures that did not achieve
80% or greater realization rates, our engineers found that thirteen measures had shorter operating hours
than assumed by the program. Five of these thirteen were retail business, three were warehouse/storage,
and the remainder were spread among other building types as shown. In four of these cases, the reduction
in hours of use was due to the existence of controls that were not accounted for in the reported savings
estimate. Table 12 shows number of measures with realization rates (RR) less than 80% by building type.
Table 12: Lighting measures variance summary by building type
Building Type Measures with
RR < 80% Reason
Retail 5 Hours of use
Warehousing and Storage 3 Hours of use (2); controls not accounted for (1)
Other Types, Hours of Use 6 Hours of use
Other Types, Controls 3 Controls not accounted for
Totals 17
9 In this report “Realization Rate” refers to the ratio of “Evaluated Savings” to “Reported Savings”. Reported savings are the “working savings” shown
in the Energy Trust database provided to DNV GL. Evaluated Savings are the savings estimated by DNV GL to have been achieved by the
program. Program attribution was not considered in this study and is researched and reported separately by Energy Trust.
DNV GL – www.dnvgl.com 6/25/2018 Page 19
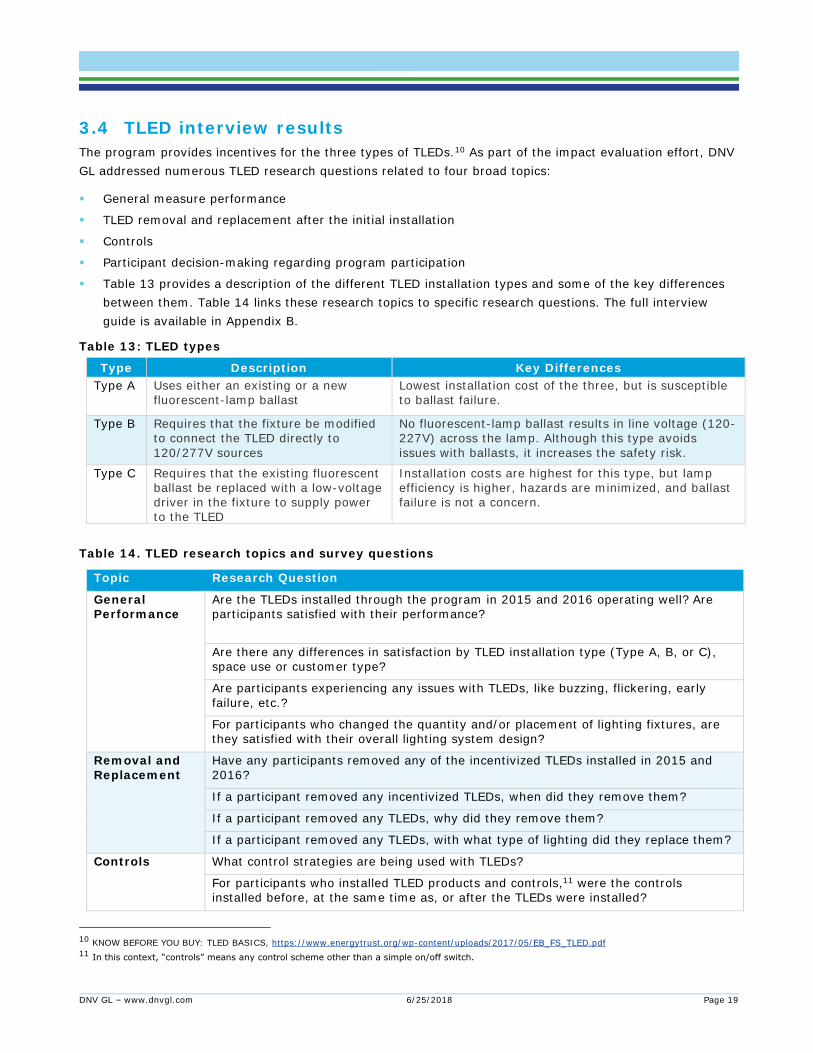
3.4 TLED interview results
The program provides incentives for the three types of TLEDs.10 As part of the impact evaluation effort, DNV
GL addressed numerous TLED research questions related to four broad topics:
▪ General measure performance
▪ TLED removal and replacement after the initial installation
▪ Controls
▪ Participant decision-making regarding program participation
▪ Table 13 provides a description of the different TLED installation types and some of the key differences
between them. Table 14 links these research topics to specific research questions. The full interview
guide is available in Appendix B.
Table 13: TLED types
Type Description Key Differences
Type A Uses either an existing or a new fluorescent-lamp ballast
Lowest installation cost of the three, but is susceptible to ballast failure.
Type B Requires that the fixture be modified to connect the TLED directly to
120/277V sources
No fluorescent-lamp ballast results in line voltage (120-227V) across the lamp. Although this type avoids
issues with ballasts, it increases the safety risk.
Type C Requires that the existing fluorescent ballast be replaced with a low-voltage driver in the fixture to supply power to the TLED
Installation costs are highest for this type, but lamp efficiency is higher, hazards are minimized, and ballast failure is not a concern.
Table 14. TLED research topics and survey questions
Topic Research Question
General Performance
Are the TLEDs installed through the program in 2015 and 2016 operating well? Are participants satisfied with their performance?
Are there any differences in satisfaction by TLED installation type (Type A, B, or C), space use or customer type?
Are participants experiencing any issues with TLEDs, like buzzing, flickering, early
failure, etc.?
For participants who changed the quantity and/or placement of lighting fixtures, are they satisfied with their overall lighting system design?
Removal and
Replacement
Have any participants removed any of the incentivized TLEDs installed in 2015 and
2016?
If a participant removed any incentivized TLEDs, when did they remove them?
If a participant removed any TLEDs, why did they remove them?
If a participant removed any TLEDs, with what type of lighting did they replace them?
Controls
What control strategies are being used with TLEDs?
For participants who installed TLED products and controls,11 were the controls installed before, at the same time as, or after the TLEDs were installed?
10 KNOW BEFORE YOU BUY: TLED BASICS, https://www.energytrust.org/wp-content/uploads/2017/05/EB_FS_TLED.pdf
11 In this context, “controls” means any control scheme other than a simple on/off switch.
DNV GL – www.dnvgl.com 6/25/2018 Page 20
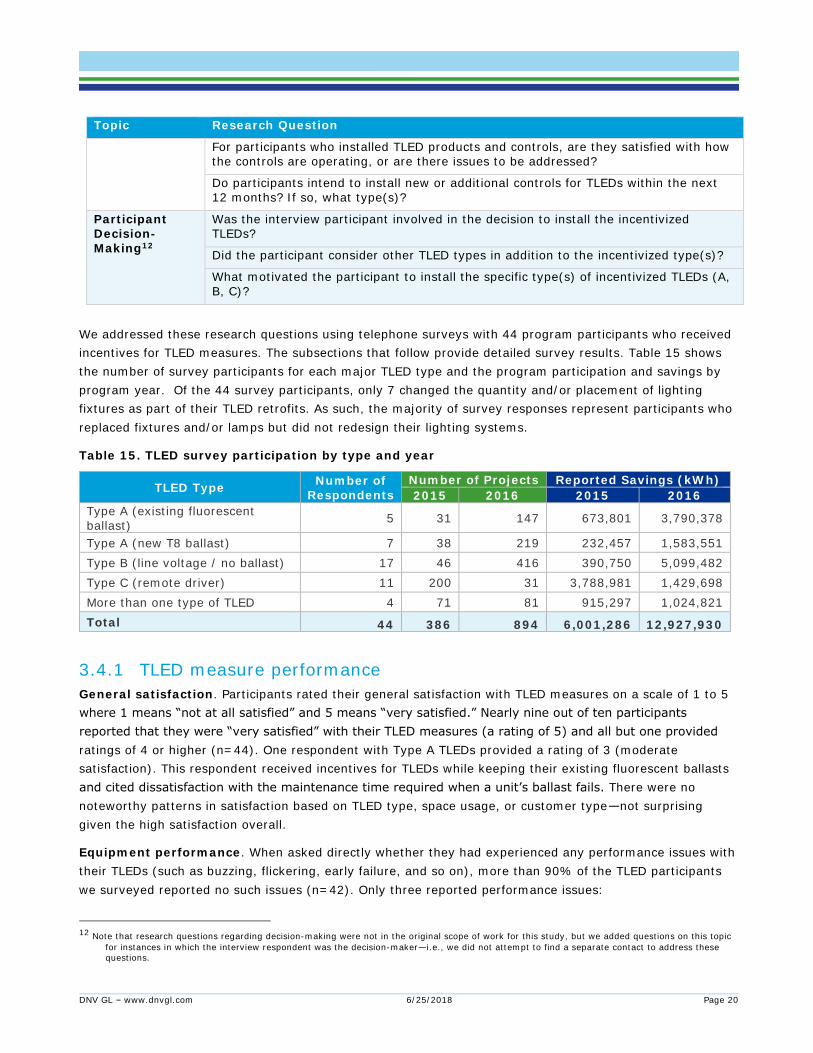
Topic Research Question
For participants who installed TLED products and controls, are they satisfied with how the controls are operating, or are there issues to be addressed?
Do participants intend to install new or additional controls for TLEDs within the next 12 months? If so, what type(s)?
Participant Decision-Making12
Was the interview participant involved in the decision to install the incentivized TLEDs?
Did the participant consider other TLED types in addition to the incentivized type(s)?
What motivated the participant to install the specific type(s) of incentivized TLEDs (A, B, C)?
We addressed these research questions using telephone surveys with 44 program participants who received
incentives for TLED measures. The subsections that follow provide detailed survey results. Table 15 shows
the number of survey participants for each major TLED type and the program participation and savings by
program year. Of the 44 survey participants, only 7 changed the quantity and/or placement of lighting
fixtures as part of their TLED retrofits. As such, the majority of survey responses represent participants who
replaced fixtures and/or lamps but did not redesign their lighting systems.
Table 15. TLED survey participation by type and year
TLED Type Number of
Respondents
Number of Projects Reported Savings (kWh)
2015 2016 2015 2016
Type A (existing fluorescent ballast)
5 31 147 673,801 3,790,378
Type A (new T8 ballast) 7 38 219 232,457 1,583,551
Type B (line voltage / no ballast) 17 46 416 390,750 5,099,482
Type C (remote driver) 11 200 31 3,788,981 1,429,698
More than one type of TLED 4 71 81 915,297 1,024,821
Total 44 386 894 6,001,286 12,927,930
3.4.1 TLED measure performance
General satisfaction. Participants rated their general satisfaction with TLED measures on a scale of 1 to 5
where 1 means “not at all satisfied” and 5 means “very satisfied.” Nearly nine out of ten participants
reported that they were “very satisfied” with their TLED measures (a rating of 5) and all but one provided
ratings of 4 or higher (n=44). One respondent with Type A TLEDs provided a rating of 3 (moderate
satisfaction). This respondent received incentives for TLEDs while keeping their existing fluorescent ballasts
and cited dissatisfaction with the maintenance time required when a unit’s ballast fails. There were no
noteworthy patterns in satisfaction based on TLED type, space usage, or customer type—not surprising
given the high satisfaction overall.
Equipment performance. When asked directly whether they had experienced any performance issues with
their TLEDs (such as buzzing, flickering, early failure, and so on), more than 90% of the TLED participants
we surveyed reported no such issues (n=42). Only three reported performance issues:
12 Note that research questions regarding decision-making were not in the original scope of work for this study, but we added questions on this topic
for instances in which the interview respondent was the decision-maker—i.e., we did not attempt to find a separate contact to address these
questions.
DNV GL – www.dnvgl.com 6/25/2018 Page 21
▪ One received incentives for TLEDs replacing existing fluorescent ballasts and reported “buzzing” and
“flickering” of the units and noted that they had already replaced the offending fixtures as a result.
▪ One received incentives for TLEDs with remote drivers and reported “burning out and physical smoking
of fixtures.” This respondent reported that an electrician or contractor inspected the relevant TLED
fixtures’ ballasts and replaced them.
▪ The third respondent who reported performance issues did not provide specifics regarding the issues
experienced.
Type B TLEDs. Of the 44 TLED survey participants, 17 received incentives for Type B TLEDs. Type B TLEDs
require installers to remove ballasts and directly wire sockets to line voltage. Our concern with Type B TLED
measures is that if someone were to replace a TLED with a fluorescent lamp, the fluorescent tube would not
light due to the lack of ballast-provided strike voltage. Maintenance staff is not exposed to any increased
risk, but ensuring they are aware of the difference between a ballasted fixture and a Type B fixture could
improve program satisfaction.
3.4.2 TLED removal and replacement
Interviewers asked TLED survey participants whether they removed any of the incentivized TLED fixtures or
lamps since participating in the program. Of the 41 survey respondents who answered the question, nearly 9
out of 10 reported that they had not removed any incentivized TLED fixtures or bulbs (36 respondents).
These results underscore the high levels of satisfaction with program-incentivized TLED measures among
participants.
Of the five survey respondents who reported having removed program-incentivized TLED measures, three
reported having removed fixtures and two reported having removed lamps.
▪ The respondents who removed fixtures did not comment on why they did so.
▪ The two who removed lamps each gave a different reason: one because of issues with flickering, and
one stated the lamps were too bright. One of these respondents reported replacing the TLED lamps they
removed with other TLED lamps.
3.4.3 TLED controls
Interviewers read TLED participants a list of control types and asked which types they used. Of the 38 TLED
survey participants who answered the question, nearly three-quarters reported that they controlled their
TLEDs with on/off switches (27 survey participants; see Figure 6).
▪ Seven survey participants reported that they control their TLEDs with occupancy sensors.
▪ Only a handful of respondents mentioned using energy management systems or building management
systems; dimmer switches; photosensors or photocells; or timers to control their TLEDs.
▪ Five of the seven TLED survey participants who reported controlling their program-incentivized TLEDs
with occupancy sensors reported that they received incentives for the sensors through the Existing
Buildings program. The participants who received incentives both for TLEDs and occupancy sensors
represented the full range of TLED types (A, B, and C).

DNV GL – www.dnvgl.com 6/25/2018 Page 22
Figure 6. TLED control strategies
* Note: Survey question allowed multiple responses from each participant.
Installation timing and satisfaction. Of the eleven TLED survey respondents who reported that they
used control strategies other than on/off switches, we asked:
▪ How satisfied they are with the performance their TLED controls (on a scale of 1 to 5 where 1 means
“not at all satisfied” and 5 means “very satisfied”)
▪ Whether they installed the controls before, during or after they installed the TLEDs
Ten of the eleven respondents who used control strategies other than on/off switches reported that they
were “very satisfied” with their controls’ performance (ratings of 5), and the eleventh reported a rating of 4
(satisfied). Five reported that they installed the controls before installing the TLEDs, four reported that they
installed the controls at the same time, and one reported installing the controls after installing the TLEDs
(the eleventh was not sure of the timing). All four of the respondents who reported that they installed the
TLED controls at the same time as the TLEDs were among the five who received Existing Buildings program
incentives for occupancy sensors in addition to their TLEDs.
Installation plans. We asked TLED survey participants whether they plan to install any new or additional
controls for their TLEDs within the next 12 months. Of the 38 who answered the question, only one planned
to install additional controls. This participant reported planning to install photosensors or photocells.
3.4.4 TLED participant decision-making
Thirty-three of the TLED survey participants reported that they were involved in the decision to install the
TLEDs for which they received incentives through the Existing Buildings program (n=44). We asked these
participants:
▪ Whether they considered other TLED types in addition to the type(s) they installed
▪ What motivated them to install the specific type(s) they installed (A, B, C)
Only three of the survey participants who were involved in the decision to install the TLEDs for which they
received program incentives reported that they considered other TLED types in addition to the type or types
they installed. Two of these participants installed Type C TLEDs. The third installed more than one type of
TLED. None of these respondents were able to identify the other TLED types they considered in addition to
the ones for which they ultimately received Existing Buildings program incentives.
Thirty-three TLED survey participants reported that they were involved in the decision to install program
TLEDs. We asked them what motivated them to select the type or types of TLEDs they selected, “don’t
27
73 2 1 1
0
5
10
15
20
25
30
On/off switch Occupancy
sensor
Energy
Management
System
Dimmer
switch
Photosensor
or photocell
Timer
Nu
mb
er o
f S
urvey
Parti
cip
an
ts (
n=
38
)
DNV GL – www.dnvgl.com 6/25/2018 Page 23
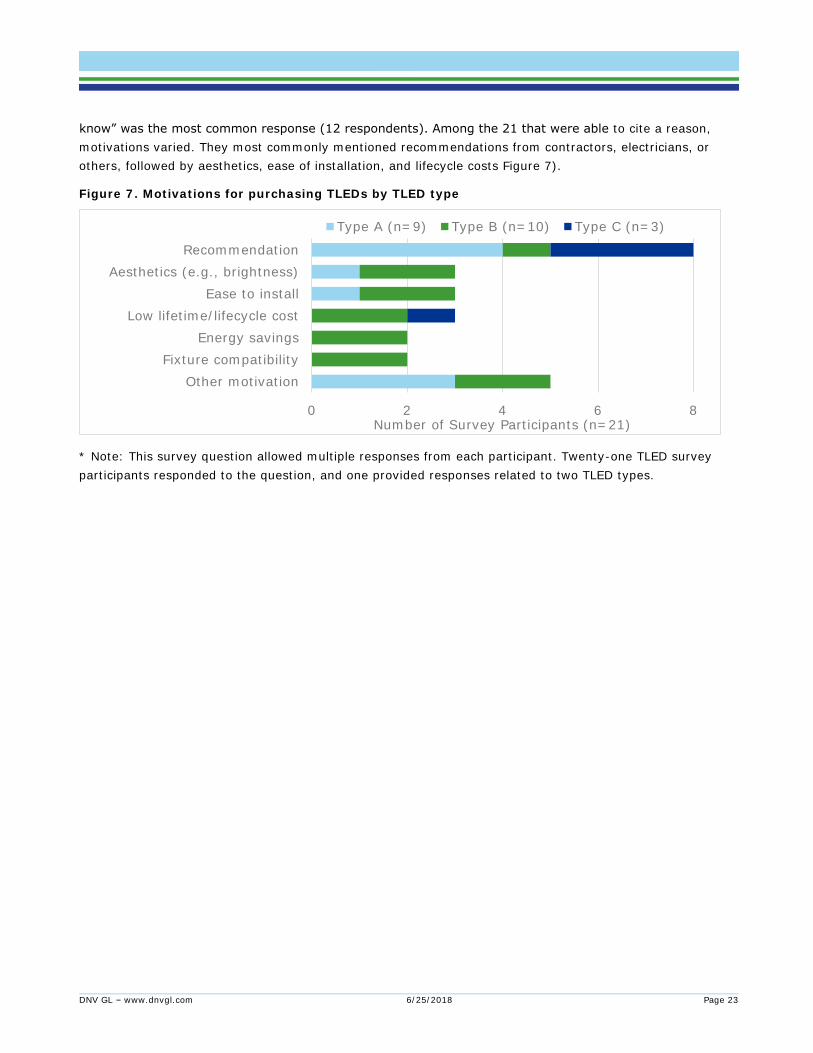
know” was the most common response (12 respondents). Among the 21 that were able to cite a reason,
motivations varied. They most commonly mentioned recommendations from contractors, electricians, or
others, followed by aesthetics, ease of installation, and lifecycle costs Figure 7).
Figure 7. Motivations for purchasing TLEDs by TLED type
* Note: This survey question allowed multiple responses from each participant. Twenty-one TLED survey
participants responded to the question, and one provided responses related to two TLED types.
0 2 4 6 8
Other motivation
Fixture compatibility
Energy savings
Low lifetime/lifecycle cost
Ease to install
Aesthetics (e.g., brightness)
Recommendation
Number of Survey Participants (n=21)
Type A (n=9) Type B (n=10) Type C (n=3)
DNV GL – www.dnvgl.com 6/25/2018 Page 24
3.5 Lighting track findings and recommendations
Our evaluation findings and recommendations specific to the lighting track are presented in this section.
3.5.1 Track recommendations
▪ Finding – In a limited number of cases, the evaluation estimated significantly different savings from
the program, at retail buildings more often than other builing types. The difference in savings was due
primarily to differences in the annual hours of use estimated by the evaluation and those estimated by
the program.
- Recommendation – Given the frequency of over- and under-estimating operating hours, program
staff should emphasize the importance of accurate estimates of operating hours during training for
trade allies. DNV GL does not recommend any structural program change to address this. Any
change would likely increase program complexity with no assurance that it would improve estimates
of savings.
▪ Finding – The Existing Buildings program did not account for the effect of reduced lighting power on
building HVAC systems. This has the potential to result in an overestimation of the societal value
delivered by the program. The conclusions of the previous evaluation report13 are supported by DNV GL.
Across the projects evaluated, DNV GL estimates that interactive effects reduce interior lighting
electricity savings by 1% (approximately 146,000 kWh) and increase gas consumption at a rate of 2.5
therms per MWh of lighting energy saved (approximately 36,400 therms). There was anecdotal evidence
that the removal of fluorescent ballasts from high rise buildings significantly reduced the return air
temperature.
- Recommendation – Energy Trust should include estimates of interactive effects when calculating
the societal value of this program. Energy Trust should consider changes to its savings calculation
workbook, but weigh the changes against the added workbook complexity required. Future impact
evaluations should continue to estimate the impact of lighting projects on all building systems.
3.5.2 TLED specific recommendations
▪ Finding – General satisfaction with TLEDs is high and performance issues are minimal. Out of 44
survey participants, 43 gave their TLEDs a 4 out of 5 rating; one participant gave a 3 rating. There was
only one report of buzzing and flickering (which started after a fire at a local substation caused a power
surge) and one report of ballast failure. Over 90% have not removed any lamps or fixtures since the
retrofit, another indication of satisfaction with lighting system performance.
- Recommendation – Continue supporting the installation of TLEDs. No systematic concerns were
identified that require a program change to address.
▪ Finding – One Type A TLED site using existing fluorescent ballasts reported “burning out and physical
smoking of fixtures”, potentially resulting from a ballast compatibility issue. Compatibility with installed
ballasts varies depending on manufacturers and models.
- Recommendation – Review Type A measure participation and consider eliminating program
support for Type A lamps that rely on existing ballasts or limiting support to those with
manufacturer-recommended lamp/ballast combinations.
13 Energy Trust of Oregon, Impact Evaluation of the 2013-2014 Existing Buildings Program, Prepared by ADM Associates Inc., 02/09/17. Available at:
https://www.energytrust.org/wp-content/uploads/2017/02/EB_Impact_Evaluation_2013_2014.pdf

DNV GL – www.dnvgl.com 6/25/2018 Page 25
▪ Finding – Facility staff knowledge of Type B lamp operation may be an issue. Our surveys showed that
only about a third of customers installing Type B lamps remember that their contractor warned them not
to replace these lamps with flourescent tubes. (Our field staff did observe warning labels inside Type B
fixtures at sites visted.)
- Recommendation – Review and enhance Type B communication. Even if contractors are trying to
communicate the risks, those warnings may not be understood. The program could adopt existing
handouts or develop their own, providing them to trade allies to pass on to their clients. Stickers on
fixtures containing Type B lamps warning that fluorescent replacements will not operate should be a
requirement (if they’re not already).
▪ Finding – “Recommendation from another user” was the leading reason participants selected the TLED
type they installed.
- Recommendation – The program should prioritize contractor education and communication if
changes to measure mix are desired. For example, if the program would like a higher percentage of
projects to be TLED Type C, educating contractors to make this recommendation will be required.
-

DNV GL – www.dnvgl.com 6/25/2018 Page 26
4 STANDARD TRACK NON-LIGHTING EVALUATION
This section documents DNV GL’s impact evaluation of non-lighting savings acquired through the standard
non-lighting track (standard track). The standard track offered non-lighting prescriptive incentives for a
large variety of electric and natural gas energy efficiency measures including refrigeration, cooking, HVAC,
building shell, and office equipment.
The standard track also included occupancy-sensor controlled power strips, referred to as Power Strips or
Smart Strips, which were typically “left-behind” with participants by the implementer rather than purchased
by the participant.
The program estimates measure energy savings in this track using per-unit energy savings (UES) values
that were either stipulated values, or calculated values using a standard formula and equipment or site-
specific measure characteristics. The standard track measures accounted for about 7% of the 2015-2016
Existing Buildings program’s reported electricity savings and 35% of the reported gas savings. Table 16
presents the energy use for the standard track measures and the overall Existing Buildings program by
program year. The 2016 program year savings are significantly higher in 2016 than 2015; 2016 electric
savings are about 60% higher than 2015, and 2016 gas savings are about 35% higher than 2015.
Table 16: Reported standard track energy savings by program year
Program Track
Reported Electric Savings (kWh)
Reported Gas Savings (therms)
2015 2016 2015 2016
Standard Non-Lighting 6,515,821 10,590,409 559,703 753,615
Existing Buildings program total 109,051,484 123,916,024 1,888,021 1,889,692
Percent of Existing Buildings program savings
6% 9% 30% 40%
4.1 Sample design
DNV GL used stratified random sampling to select an efficient representative sample of projects for
evaluation designed to provide reliable savings estimates across program years and program fuels. DNV GL
sampled at the measure level, using unique Measure IDs in the data. The sample design target included 142
points, consisting of 72 food service equipment projects and 70 non-food service equipment projects. The
evaluation divided the track into food service and non-food service measure groups to ensure representation
across both food and non-food measures in the track. Additional strata used include program year, primary
fuel type, and size of savings claim (up to three size strata were used). The final sample design included 23
unique strata and selected 15 different food service equipment measures and 30 different non-food service
measures for evaluation. This design was expected to provide program year savings estimates with 15%
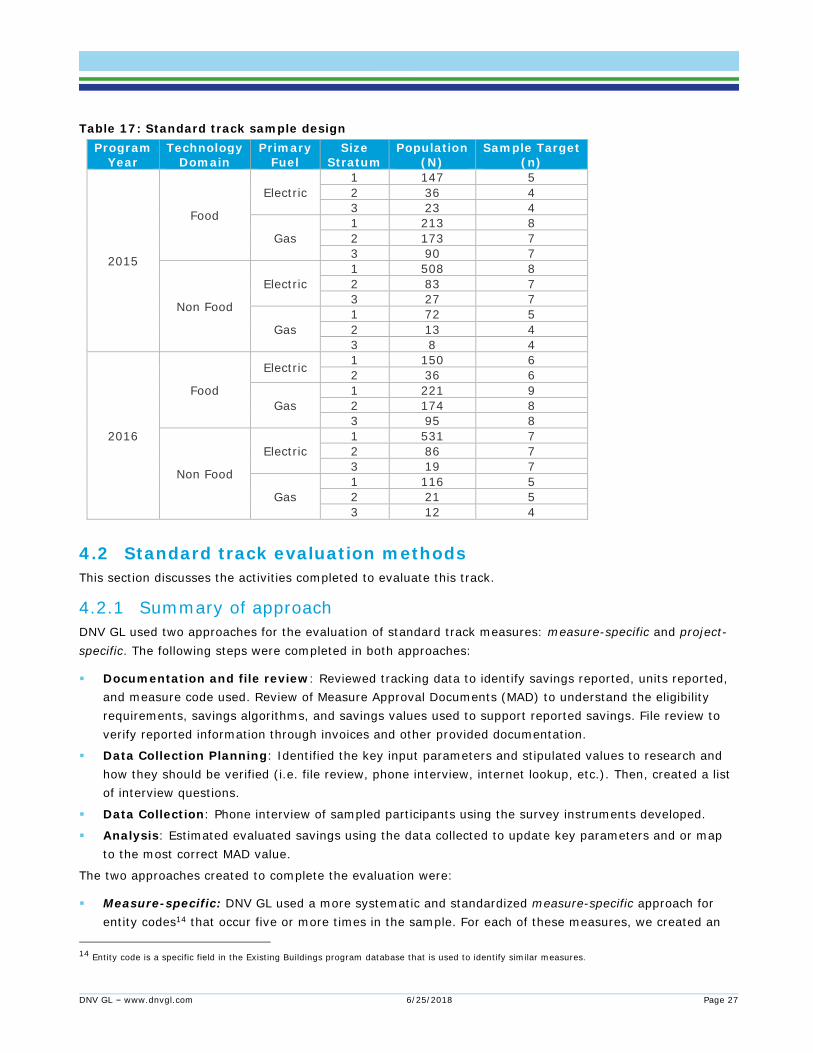
relative precision at the 90% confidence interval. Table 17 summarizes the sample design. Further detail on
sample design is available in Appendix A.
DNV GL – www.dnvgl.com 6/25/2018 Page 27
Table 17: Standard track sample design
Program Year
Technology Domain
Primary Fuel
Size Stratum
Population (N)
Sample Target (n)
2015
Food
Electric
1 147 5
2 36 4
3 23 4
Gas
1 213 8
2 173 7
3 90 7
Non Food
Electric
1 508 8
2 83 7
3 27 7
Gas
1 72 5
2 13 4
3 8 4
2016
Food
Electric 1 150 6
2 36 6
Gas
1 221 9
2 174 8
3 95 8
Non Food
Electric
1 531 7
2 86 7
3 19 7
Gas
1 116 5
2 21 5
3 12 4
4.2 Standard track evaluation methods
This section discusses the activities completed to evaluate this track.
4.2.1 Summary of approach
DNV GL used two approaches for the evaluation of standard track measures: measure-specific and project-
specific. The following steps were completed in both approaches:
▪ Documentation and file review: Reviewed tracking data to identify savings reported, units reported,
and measure code used. Review of Measure Approval Documents (MAD) to understand the eligibility
requirements, savings algorithms, and savings values used to support reported savings. File review to
verify reported information through invoices and other provided documentation.
▪ Data Collection Planning: Identified the key input parameters and stipulated values to research and
how they should be verified (i.e. file review, phone interview, internet lookup, etc.). Then, created a list
of interview questions.
▪ Data Collection: Phone interview of sampled participants using the survey instruments developed.
▪ Analysis: Estimated evaluated savings using the data collected to update key parameters and or map
to the most correct MAD value.
The two approaches created to complete the evaluation were:
▪ Measure-specific: DNV GL used a more systematic and standardized measure-specific approach for
entity codes14 that occur five or more times in the sample. For each of these measures, we created an
14 Entity code is a specific field in the Existing Buildings program database that is used to identify similar measures.
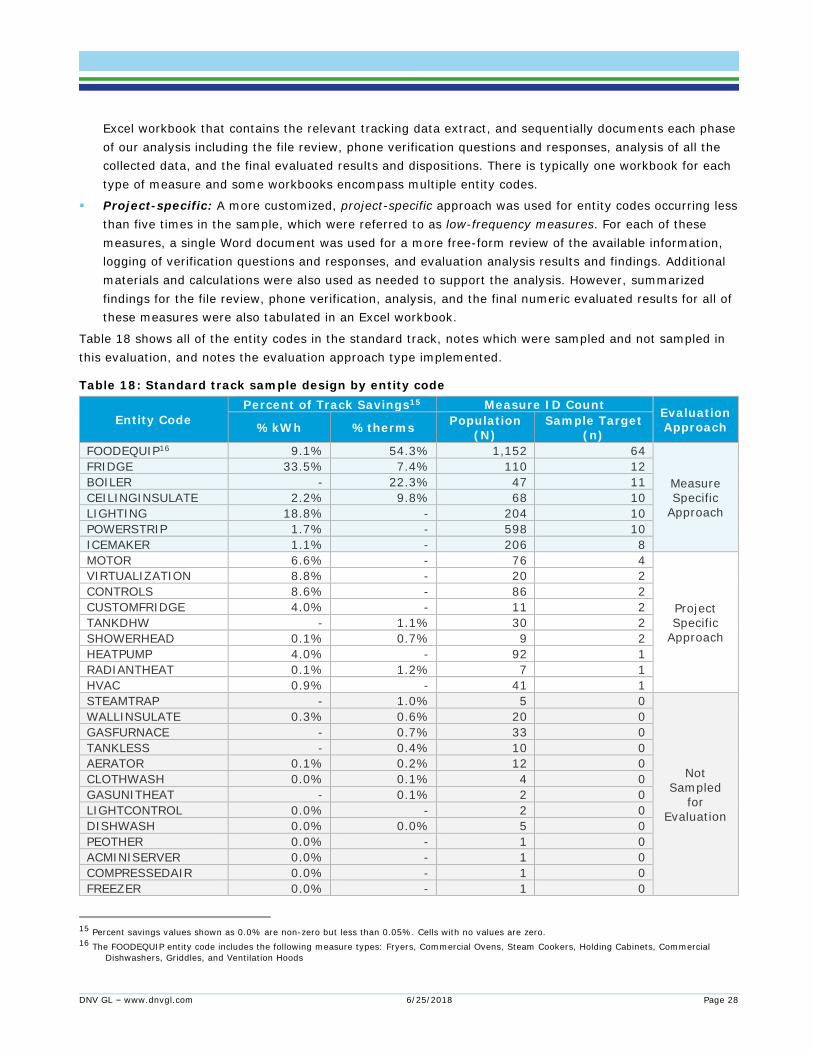
DNV GL – www.dnvgl.com 6/25/2018 Page 28
Excel workbook that contains the relevant tracking data extract, and sequentially documents each phase
of our analysis including the file review, phone verification questions and responses, analysis of all the
collected data, and the final evaluated results and dispositions. There is typically one workbook for each
type of measure and some workbooks encompass multiple entity codes.
▪ Project-specific: A more customized, project-specific approach was used for entity codes occurring less
than five times in the sample, which were referred to as low-frequency measures. For each of these
measures, a single Word document was used for a more free-form review of the available information,
logging of verification questions and responses, and evaluation analysis results and findings. Additional
materials and calculations were also used as needed to support the analysis. However, summarized
findings for the file review, phone verification, analysis, and the final numeric evaluated results for all of
these measures were also tabulated in an Excel workbook.
Table 18 shows all of the entity codes in the standard track, notes which were sampled and not sampled in
this evaluation, and notes the evaluation approach type implemented.
Table 18: Standard track sample design by entity code
Entity Code
Percent of Track Savings15 Measure ID Count Evaluation Approach %kWh %therms
Population (N)
Sample Target (n)
FOODEQUIP16 9.1% 54.3% 1,152 64
Measure Specific
Approach
FRIDGE 33.5% 7.4% 110 12
BOILER - 22.3% 47 11
CEILINGINSULATE 2.2% 9.8% 68 10
LIGHTING 18.8% - 204 10
POWERSTRIP 1.7% - 598 10
ICEMAKER 1.1% - 206 8
MOTOR 6.6% - 76 4
Project Specific
Approach
VIRTUALIZATION 8.8% - 20 2
CONTROLS 8.6% - 86 2
CUSTOMFRIDGE 4.0% - 11 2
TANKDHW - 1.1% 30 2
SHOWERHEAD 0.1% 0.7% 9 2
HEATPUMP 4.0% - 92 1
RADIANTHEAT 0.1% 1.2% 7 1
HVAC 0.9% - 41 1
STEAMTRAP - 1.0% 5 0
Not
Sampled for
Evaluation
WALLINSULATE 0.3% 0.6% 20 0
GASFURNACE - 0.7% 33 0
TANKLESS - 0.4% 10 0
AERATOR 0.1% 0.2% 12 0
CLOTHWASH 0.0% 0.1% 4 0
GASUNITHEAT - 0.1% 2 0
LIGHTCONTROL 0.0% - 2 0
DISHWASH 0.0% 0.0% 5 0
PEOTHER 0.0% - 1 0
ACMINISERVER 0.0% - 1 0
COMPRESSEDAIR 0.0% - 1 0
FREEZER 0.0% - 1 0
15 Percent savings values shown as 0.0% are non-zero but less than 0.05%. Cells with no values are zero.
16 The FOODEQUIP entity code includes the following measure types: Fryers, Commercial Ovens, Steam Cookers, Holding Cabinets, Commercial
Dishwashers, Griddles, and Ventilation Hoods
DNV GL – www.dnvgl.com 6/25/2018 Page 29
4.2.2 Documentation and file review
DNV GL reviewed the applicable Measure Approval Documents (MAD), as well as site-specific project file
documentation for all of the sampled measures. This section discusses the results of our review.
4.2.2.1 Measure Approval Documents
For Standard track measures, savings approaches and values are provided in the MAD files. We received and
reviewed MADs for all sampled measures. We were provided with one to three MAD files for each measure,
due to the revision cycle of each measure. We also reviewed any additional files, such as calculators or
calculation workbooks that were provided as supporting savings documentation. However, for many of the
MAD docs, the supporting documentation was only available from links to an internal drive that could not be
accessed by DNV GL. The following documents DNV GL’s review process and findings:
▪ File identification: DNV GL typically identified the corresponding MAD file for each measure by the file
name, since we were not provided with a direct link from measures to MAD file, and there was no such
link in the tracking data. Most MAD filenames corresponded to the measures discussed within, however,
some file names did not contain the measure name. For example, the MAD file for fryers was “food
service cooking” and contained multiple food service measures.
▪ File structure: The structure and format for presentation of the information in the MADs varied across
the measures, which sometimes made it difficult to review the measures and identify the key
assumptions. Some of the MADs were copies of emails with a long narrative. However, even though the
MAD structure across measures was inconsistent, we were able to identify the key parameters and
assumptions and line up the tracking data values with MAD values. Most of the MADs did identify the
responsible engineers so that they could be contacted should any questions about the approach and
references arise.
▪ Assumption sources: Sources for assumptions and savings were discussed in the MAD files, but often
without proper and complete citation. There was often no way for the evaluation to validate the
references used to generate the savings shown in the MAD. However, the scope of this effort was
primarily to make sure that the MAD assumptions were being applied correctly, and to evaluate the
assumed values versus actual participant operation.
▪ Measure identification: The measure names used within each MAD generally differed from the
measure names used in the tracking data. We identified the correct measure by looking at the unit
energy savings (UES) values. However, because the UES values are not recorded in the tracking data –
only total kWh, total therms, and “quantity” are provided – we reverse engineered the UES values from
the tracking data, and for some measures we also needed supplemental information from the site-
specific project files.
▪ Measure baseline condition: The measure baseline condition is either Common Practice17 or Pre-
Conditions18. The assumed baseline condition was not clearly identified in the MAD and evaluators need
to understand the assumed baseline condition in order to assess the reliability of measure savings.
▪ Measure units: The unit basis for for each measure is the denominator for each UES value. For
example, boiler savings are expressed as kBtu saved per kBtuh of boiler heating capacity, and LED case
lighting is kWh per linear foot of case. The unit basis was not clearly identified in the MAD and
17 Cost-Effectiveness Policy and General Methodology for Energy Trust of Oregon, December 16, 2011, https://www.energytrust.org/wp-
content/uploads/2016/11/4.06.000.pdf 18ROADMAP FOR THE ASSESSMENT OF ENERGY EFFICIENCY MEASURES REGIONAL TECHNICAL FORUM, Release Date: December 8, 2015,
https://nwcouncil.app.box.com/v/20151208CompleteGuidelines
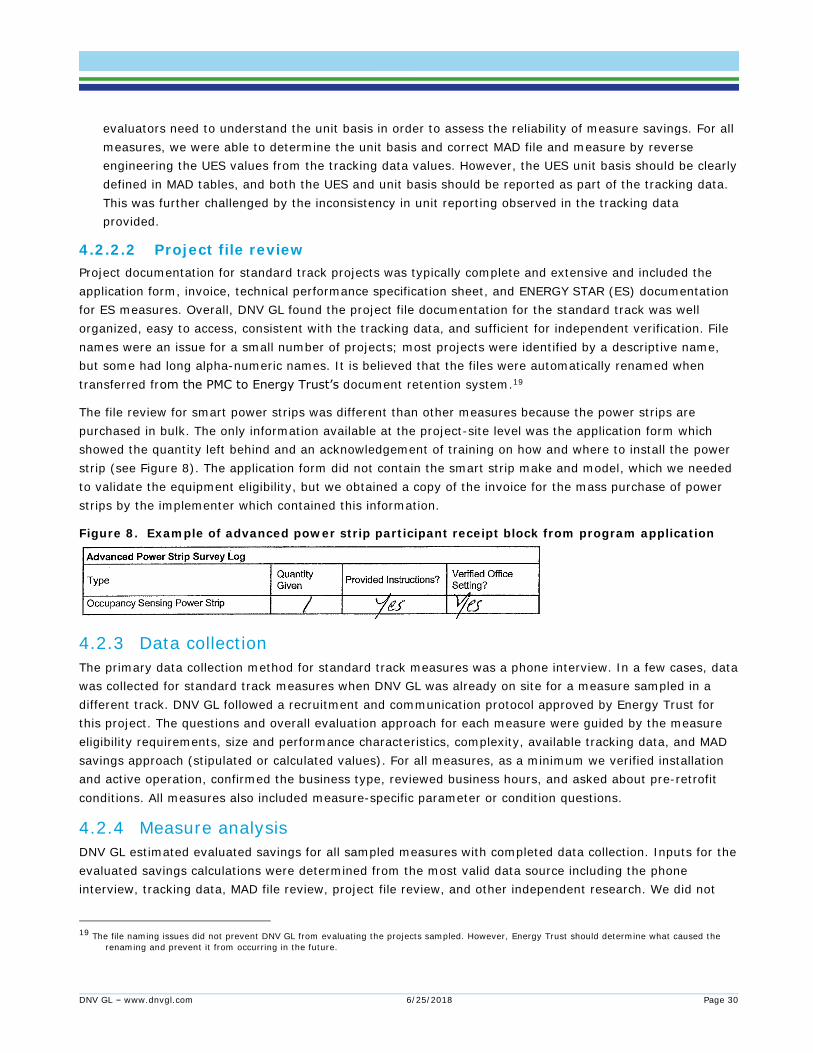
DNV GL – www.dnvgl.com 6/25/2018 Page 30
evaluators need to understand the unit basis in order to assess the reliability of measure savings. For all
measures, we were able to determine the unit basis and correct MAD file and measure by reverse
engineering the UES values from the tracking data values. However, the UES unit basis should be clearly
defined in MAD tables, and both the UES and unit basis should be reported as part of the tracking data.
This was further challenged by the inconsistency in unit reporting observed in the tracking data
provided.
4.2.2.2 Project file review
Project documentation for standard track projects was typically complete and extensive and included the
application form, invoice, technical performance specification sheet, and ENERGY STAR (ES) documentation
for ES measures. Overall, DNV GL found the project file documentation for the standard track was well
organized, easy to access, consistent with the tracking data, and sufficient for independent verification. File
names were an issue for a small number of projects; most projects were identified by a descriptive name,
but some had long alpha-numeric names. It is believed that the files were automatically renamed when
transferred from the PMC to Energy Trust’s document retention system.19
The file review for smart power strips was different than other measures because the power strips are
purchased in bulk. The only information available at the project-site level was the application form which
showed the quantity left behind and an acknowledgement of training on how and where to install the power
strip (see Figure 8). The application form did not contain the smart strip make and model, which we needed
to validate the equipment eligibility, but we obtained a copy of the invoice for the mass purchase of power
strips by the implementer which contained this information.
Figure 8. Example of advanced power strip participant receipt block from program application
4.2.3 Data collection
The primary data collection method for standard track measures was a phone interview. In a few cases, data
was collected for standard track measures when DNV GL was already on site for a measure sampled in a
different track. DNV GL followed a recruitment and communication protocol approved by Energy Trust for
this project. The questions and overall evaluation approach for each measure were guided by the measure
eligibility requirements, size and performance characteristics, complexity, available tracking data, and MAD
savings approach (stipulated or calculated values). For all measures, as a minimum we verified installation
and active operation, confirmed the business type, reviewed business hours, and asked about pre-retrofit
conditions. All measures also included measure-specific parameter or condition questions.
4.2.4 Measure analysis
DNV GL estimated evaluated savings for all sampled measures with completed data collection. Inputs for the
evaluated savings calculations were determined from the most valid data source including the phone
interview, tracking data, MAD file review, project file review, and other independent research. We did not
19 The file naming issues did not prevent DNV GL from evaluating the projects sampled. However, Energy Trust should determine what caused the
renaming and prevent it from occurring in the future.

DNV GL – www.dnvgl.com 6/25/2018 Page 31
typically revise the MAD algorithms, but would use the collected data to either calculate a revised value or
more typically, map to a more correct MAD value. For ENERGY STAR equipment, we used the latest version
of the ENERGY STAR appliance calculator and combined that with our primary data. Excel workbooks were
used to process and document the analysis and evaluated savings results and assumptions. Measure results
are presented in Appendix C.
4.3 Standard track evaluation results
This section presents the track-level results of DNV GL’s impact evaluation of this track.
4.3.1 Achieved sample
Table 19 shows the final sample achieved across the entire standard track. DNV GL estimated evaluated
savings for 84% of the measures sampled. Participants associated with 6 food measures (10% of food
measures completed) were confirmed to be out of business. These were considered a completion. The final
achieved evaluation sample differed from the sample design due to the following.
▪ Power Strips: During file review, we discovered that the POWERSTRIP entity code measures were also
distributed under the Lighting track. To ensure a consistent evaluation approach for this measure, the
five sampled projects from the Lighting track were added to the Standard track evaluation effort,
bringing the total POWERSTRIP target quota to 15. The evaluation also created a new technology
category for these measures. Based on the typical delivery method for this measure, DNV GL concluded
that the evaluation results for this measure should not effect other standard measures.
▪ Refusals and Non-Responses: The balance of the incomplete sample was primarily those participants
that could not be reached after exhausting our phone call protocol, and a small number who refused to
participate in the call. Our protocol required calling up to 5 times at different times of the day. We also
tried contacting the participant by email if they did not respond to phone calls.
Table 19: Final standard track sample summary
Program Year Technology Sample Target
Achieved Sample
% Complete
2015
Power Strip 5 3 60%
Food 35 27 77%
Non-Food 30 26 87%
2016
Power Strip 10 10 100%
Food 37 34 92%
Non-Food 30 23 77%
Total Overall 147 123 84%
4.3.2 Evaluated savings
Expansion from the sample to track-level results follows the methodology discussed in Section 2.4. Table 20
shows the overall electric standard track realization rates for the track by program year. The electric
realization rates are driven primarily by the evaluation results for refrigeration measures. Refrigeration
measures account for 71% of the total standard track measure savings and therefore are a large part of the
sample. However, there is a difference for the two years: for 2015 the realization rate is driven by results
for the LED refrigerated case lighting measure, and for 2016 the realization rate is driven by results for the

DNV GL – www.dnvgl.com 6/25/2018 Page 32
measure to add doors to open refrigerated cases. The overall realization rate is closer to the 2016 value
because the 2016 electric savings were significantly higher than 2015 savings.
Table 20: Standard track electric impact evaluation results by program year
Tracks by Year
Completed Sample
Realization Rate
Standard Error
Relative Precision
at 90 % Confidence
Evaluated Savings (kWh)
Smart Strip-2015
3 47% 0.38 131% 109,684
Smart Strip-
2016 10 20% 0.13 109% 18,868
Standard Non-Lighting-2015
32 78% 0.06 13% 4,870,431
Standard Non-
Lighting-2016 28 95% 0.08 15% 10,041,281
Overall 73 88% 0.03 5% 15,040,264
Table 21 shows the overall gas standard track realization rates for the track by program year. The gas
realization rates are driven primarily by the evaluation results for gas fryer, space heating boiler, and
roof/attic insulation measures.
Table 21: Standard track natural gas impact evaluation results by program year
Tracks by Year
Completed Sample
Realization Rate
Standard Error
Relative Precision at 90 % Confidence
Evaluated Savings
(therms)
Standard Non-
Lighting-2015 28 76% 0.15 33% 424,095
Standard Non-Lighting-2016
34 76% 0.07 16% 572,927
Overall 62 76% 0.07 16% 997,022
4.4 Standard track findings and recommendations
Our evaluation findings and recommendations specific to the standard track are presented in two sections,
one to address overarching tracking data and MAD file review and the other to address measure-specific
findings.
4.4.1 Measure Approval Document (MAD) and tracking data recommendations
Findings and recommendations for the tracking data and MAD files are discussed in this section. We also
address a key research question from the RFP in regards to the MAD files.
Do the measure approval documents used by the program include sufficient information to
estimate reliable savings, and if not, what specific changes should be made to improve them?
DNV GL – www.dnvgl.com 6/25/2018 Page 33
Evaluation Response: Overall, the measure approval documents (MADs) reviewed do not provide
sufficient transparency and traceability to support reliable savings estimates. Energy Trust has been
updating the format and content of these documents over time and the documents reviewed for this
evaluation cover multiple stages of development.
DNV GL understands that creating, maintaining, and updating prescriptive measure assumption
documentation is a time-consuming process with no perfect solution. No measure database, technical
reference manual, or work paper library solution created has proven to be the best for all program
administrators. DNV GL finds the Energy Trust’s library of MADs to be confusing and lacking sufficient
information. DNV GL recommends that Energy Trust explore opportunities to improve the transparency,
content, and application of its prescriptive measure supporting documentation system. Below are our
thoughts on what should exist in each MAD to ensure sufficient information for reliable savings estimation.
Some of these exist in the MADs reviewed.
The MAD should clearly specify the unit basis for the unit energy savings (UES). For example, boiler savings
are expressed as kBtu saved per kBtuh of boiler heating capacity. Similarly, LED case lighting is kWh per
linear foot of case. For all measures, we were typically able to determine this by review and reverse
engineering the UES values from the tracking data values (total savings and quantity). However, the UES
unit basis clearly defined in MAD tables and should be reported as part of the tracking data.
▪ Whenever possible, the MADs should show the method and/or assumptions used to estimate savings in
a simplified form, such as a one-line calculation or table. In cases when inputs vary by application, the
one line calculation should name the parameters, such as “pounds of food per day”. In cases when
simulations are used and combined, key inputs and outputs to the simulations should be provided. If
possible, a one-line calculation should be provided showing the average values or range of values
calculated. When the input assumption varies based on application, the MAD should include the look-up
table used. If including the tables or assumptions in the document is deemed too difficult, then an Excel
file should be embedded in the Word file (as is currently done in some cases).
▪ The MAD should clearly specify the baseline condition for the measure, either pre-existing conditions
(retrofit measures) or current practice (lost opportunity measures). The MAD should then provide the
assumed efficiency of the baseline and the basis for the assumption.
▪ In all cases, the MAD should document what research supports the assumptions used or document what
industry standards support the assumed value. This applies to both inputs to savings calculations, the
baseline and installed equipment assumed, the measure life, and measure costs (cost does not impact
reliability).
▪ When possible, the MAD or referenced supporting documentation should document the confidence
interval and relative precision of the input assumption or savings estimation used. These values provide
a clear indication of savings reliability.
Below are additional findings based on this evaluation:
▪ Finding – There is no direct link to the MAD file used for each measure in the tracking data, nor to the
measure names used in the MAD file. To identify the correct MAD file was a multistage effort, first
finding the files with a similar measure name, then calculating the unit energy savings (UES) values
from the tracking data from the total kWh or therms and the quantity, then finding the best match in the
MAD doc to the tracking data measure name and the calculated UES value.

DNV GL – www.dnvgl.com 6/25/2018 Page 34
- Recommendation A – Create consistent and traceable file names. The MAD file and tracking data
should use the same measure names and/or use unique measure codes so that there is direct
traceability to the source of the savings approach and UES values for every measure in the tracking
data. If new measure codes are created, then the MAD should be updated.
- Recommendation B – Create a way to directly identify the applicable MAD file used for each
measure. This options we have thought of are a mapping table of Measure Code to MAD file name,
or a MAD file name field could be added to the tracking data.
- Recommendation C – Include program years and programs that the savings documented in the file
are approved to be used in. Include a measure history table similar to the table in policy documents
that shows the last revision date, revisions made, and date of next review. Do not update the
measure savings within a program year unless absolutely necessary. These changes should improve
the transparency of the MAD update process and traceability of savings claims to supporting
documentation.
- Recommendation D – Include the UES value, the units according to the unit basis for the measure,
and the physical count of units installed in the tracking data. Future impact evaluation should
research the accuracy of these values in the tracking data.
▪ Finding – Many of the MAD savings estimation approaches for food service measures were based on the
ENERGY STAR calculators, but did not use the calculators directly, and modified many of the
assumptions.
- Recommendation – Use the ENERGY STAR calculators and default assumptions as-is, but use
realistic estimates of business and equipment operation for participants. The best approach would be
to use the ES calculator with parameters for the actual installed equipment and operation for the
business receiving the incentive.
▪ Finding – For many MAD files, the supplemental-supporting references for assumed values and
approaches were not properly referenced (title, author, date) and only a link to an internal server
location for the studies was provided.
- Recommendation – For supplemental-supporting documents, studies, reports or calculators,
consider embedding those files in the Word doc, attaching to a created PDF file, and/or provide a
proper and complete reference so that wherever possible an internal or web search can easily find
the reference. Reference sources should ideally be publicly and readily available, and the savings
values and methods used in the MAD files should be traceable and transparent.
▪ Finding – The MAD files use a variety of structures and formats, including some that appear to be long
narratives from emails. The variety of formats used makes it difficult to ensure that the information for a
measure is completely and consistently documented across measures.
- Recommendation – Create a template with the structure that can encompass all the measures and
all the information needed to characterize a prescriptive measure, then phase that template in as
measures are updated (targeting high-impact measures) or complete a separate project to update
all MAD files.
▪ Finding – The savings methodologies and assumptions are not easily available to the public and should
be. In February 2018, Oregon is ranked 5th in states rankings and Portland, OR is ranked 4th in city
rankings by the American Council for an Energy-Efficient Economy (ACEEE).20 Of the 11 states ranked in
20 American Council for an Energy-Efficient Economy (ACEEE), State Rankings: https://database.aceee.org/state-scorecard-rank, City Rankings:
https://database.aceee.org/city-scorecard-rank
DNV GL – www.dnvgl.com 6/25/2018 Page 35
the top 10, only two do not have readily available measure databases or reference manuals: Oregon and
Washington (7th). In Washington, the measures and protocols approved by the Regional Technical Forum
are readily available and often applied. A public reference manual, measure database, or work paper
library improves the transparency program assumptions, methods, and savings estimations.
- Recommendation – Energy Trust should develop and implement a plan to transition from a system
with supporting documentation stored on internal servers to one that makes the methodologies,
assumptions, and values used readily available to the public on the Energy Trust website.
4.4.2 Measure-level recommendations
Findings and recommendations for the measures with the largest impact on the overall electric and gas
realization rates are listed below. Findings and recommendations for all measures reviewed under the
measure-type approach are provided in Appendix EAppendix A.
▪ Finding – Smart Power Strips. Findings for all sites are uncertain due to reliability of remote smart strip
verificiation, especially use of the motion sensor feature. For 10 of 13 sites, the savings were zeroed out
because participants could not recall receiving it or did not receive it, were unsure it was being used,
received it but had not installed it, or the unit was not functional. Even for the confirmed users, one
indicated the motion sensor was not used, and another used it at home. In a separate but related retail-
focused delivery effort, large quantities of smart strips were purchased at retail by some participants
who intended to install them, but those participants were not sampled in this evaluation.
- Recommendation – Leave the smart strips behind as a participant reward, but do not claim
savings as there is too much uncertainty in their actual use. Also, do not require the participant to
sign an agreement to install and use as that does not guarantee use. Finally, consider doing a
follow-up study or survey of all participants who received incentives for purchasing large quantities
of smart strips to verify the installation rate and active use.
▪ Finding – ENERGY STAR measures. The ENERGY STAR calculators are readily available, relatively easy
to use and defaults are very transparent, citable, and version controlled. For many of the measures,
Energy Trust uses the basic ENERGY STAR algorithms, but makes adjustments to some of the
parameters that reference sources that could not always be validated. In addition, some of the
assumptions were found to be incorrect, for example a “Large” fryer vat is assumed, but all but one of
the verified units were “Standard” size vats.
- Recommendation A – Consider using the ENERGY STAR calculator directly and as part of the MAD
documentation. Furthermore, consider using the ENERGY STAR calculator for every participant, but
use realistic operating hours to reflect each business. One alternative to consider is the creation of a
measure for non-restaurant business types that incorporates lower usage. If created, the measure
should be tested for cost-effectiveness.
- Recommendation B – Review the measure-level results in the Appendix C and consider revising
key assumptions like the fryer vat size, or collecting that information for the incentivized equipment,
to provide more accurate savings estimates.
- Recommendation C – Conduct research on current practice to validate the baseline assumptions
for incentivized equipment in Oregon.
▪ Finding – Refrigerated case LED lighting. There were several issues for this measure. The verified
projects were predominantly retrofit projects, though the measure is also applicable for new cases. One
of the verified sites had motion sensor control which was not reported for the project. The quantity unit
DNV GL – www.dnvgl.com 6/25/2018 Page 36
basis is supposed to be linear feet of case, but half of the sample had a reported quantity of one in the
database (total savings was correct). DNV GL believes this is due to who entered the information or
when the information was entered. Finally, three vintages of MAD were available for this measure –
2010, 2015, and 2016 – but the savings values and measure descriptions in the tracking data appeared
to line up best with the 2010 vintage MAD file.
- Recommendation A – Update or review program processes to ensure that correct measure units
are added to the database for all standard measures. Future evaluations should report on reliability
of this field.
- Recommendation B - Review the MAD files for this measure and decide which one is the most
recent and valid, then review program processes to ensure that current program is using the valid
MAD-supported savings.
▪ Finding – Refrigerated case LED lighting. There were a few cooler case lighting projects that had
multiple fixture replacements of various types. The application only shows the total linear feet replaced;
ideally, an itemized list of fixture types and quantities should be available. We had to dig into invoices,
drawings/prints of the cases, etc. to try to make sense of things. This is not ideal as invoices don’t
always show things in a consistent way and the linear footage of existing fixtures do not always match
1-to-1 with the new fixtures.
- Recommendation – Project documentation should include a detailed matrix and sketch that
directly maps the invoice information and case lengths to MAD measures.
▪ Finding – New cooler cases w/multiple individual measures. There were a few projects that appear to
claim multiple measures (glass doors on open cases and LED case lighting) for new cooler cases, and
most refrigerated case measures allow both a retrofit or new case configuration. However, a majority of
the verified measures were retrofit situations, and the baseline should be significantly different for a
retrofit versus a new case. Interactive HVAC savings are claimed for gas heating systems but not for
electric heating systems, and the reported HVAC system was incorrect for three of the seven verified
sites.
- Recommendation A – Review measure requirements and determine if new cases can receive
incentives for this measure. If not, update measure eligibility requirements in the MAD. If so, a new
measure should be developed for new cases that include all energy efficiency features, and the
existing measure should only be used for retrofit situations. The baseline for new measures should
be current practice.
- Recommendation B - Improve identification of the space heating system type, adjust the electric
savings for electric space heating systems, or consider dropping the interactive gas savings and only
claiming the direct kWh savings. DNV GL believes the full benefits and costs of the measure should
be considered, but recognizes that tracking interactive effects adds complexity. At minimum,
interactive effects should be accounted for consistently across the Existing Buildings program.
▪ Finding – Gas Fryers. There is an ENERGY STAR calculator for this measure. Energy Trust did not use
the calculator directly, it used the calculation approach, some of the defaults, and some revised
parameters. DNV GL used the current ES calculator for the evaluation of all ENERGY STAR measures.
The MAD for fryers assumed a large vat but almost all of the verfied sites were standard vat, and this is
a key feature for the savings estimate. Phone response values for verified pounds of food and hours of
fryer operation tended to be lower than assumed in Energy Trust’s calculations. Four sites were out of
business, and one did not use fryers at all.
DNV GL – www.dnvgl.com 6/25/2018 Page 37
- Recommendation – Use the ENERGY STAR calculator for traceability and transparency. Assume
standard vat size instead of large for the calculations. Review and consider revising the assumed
pounds of food and fryer hours per day; using participant estimates would be best. Consider
stopping incentives to fast-food chains or other 7/24/365 sites where ENERGY STAR equipment is
already common practice.
▪ Finding – Space Heating Boilers and Boiler Controls. A realization rate less than one was primarily due
to adjusted savings for sites where one of the installed boilers was reported as being used for backup.
For one site, the savings was zeroed out completely because the new unit replaced an existing
condensing boiler; the MAD file savings are based on a standard efficiency boiler baseline and we
presumed that condensing boilers were standard practice for this site. One site had a database reported
“quantity” of one, but should have been the total boiler capacity in kBtuh. The unit basis for quantity is
kBtu saved per kBtuh of boiler capacity, so only the total boiler capacity is tracked.
- Recommendation A – Update program tracking and reporting to account for boilers installed as
backups. Consider identifying the quantity of incentivized boilers that will be primary versus backup
on the application. Add a field to the tracking data to capture the physical quantity of boilers. The
MAD already states that backup boilers should not be counted in the incentive, so a mechanism is
needed to ensure this requirement. Regarding the baseline, the eligibility criteria should clearly state
the baseline condition for existing buildings. Energy Trust should not support the installation of high
efficiency equipment that replaces existing high efficiency equipment.
- Recommendation B – Consider completing research on current practice for space heating boilers in
Oregon. DNV GL believes that the current practice baseline efficiency for boilers is higher than the
80% assumed in the MAD. Recent research completed by our Massachusetts C&I evaluation team
recommended increasing the assumed baseline for lost opportunity measures based on market
activity in Massachusetts and recent Department of Energy rulemaking.21,22
- Recommendation C – Consider completing a whole building degree day regression analysis (similar
to the Strategic Energy Management analysis) on recent or current boiler measure participants to
identify the gas usage sensitive to changes in temperature. The results of this analysis and outputs
from the simulation models referenced in the MAD could be used to more accurately estimate
savings for this measure.
21 Gas Boiler Market Characterization Study Phase II - Final Report, Massachusetts Program Administrators and Energy Efficiency Advisory Council,
March 1, 2017. http://ma-eeac.org/wordpress/wp-content/uploads/Gas-Boiler-Market-Characterization-Study-Phase-II-Final-Report.pdf 22 Department of Energy, Commercial Packaged Boilers, final rule: https://energy.gov/sites/prod/files/2016/12/f34/CPB_ECS_Final_Rule.pdf
CPB webpage: https://www1.eere.energy.gov/buildings/appliance_standards/standards.aspx?productid=8

DNV GL – www.dnvgl.com 6/25/2018 Page 38
5 CUSTOM TRACK EVALUATION
The custom track reported 515 unique measures providing 51,886,231 kWh and 1,443,430 therms in annual
energy savings across the two program years. These savings account for 22% of the program’s reported
electricity savings and 38% of the program’s reported gas savings. Table 22 shows the reported savings for
custom by program year. Table 23 shows the population frame for custom.
Table 22: Reported custom track energy savings by delivery and program year
Program Reported kWh Reported therms
Track 2015 2016 2015 2016
Custom 26,045,331 25,840,900 789,124 654,306
Existing Buildings program total 109,051,484 123,916,024 1,888,021 1,889,692
Percent of Existing Buildings program savings
24% 21% 42% 35%
5.1 Sample design
DNV GL used stratified random sampling to select an efficient representative sample of projects for
evaluation designed to provide reliable savings estimates across program years. Key design elements were:
▪ Creation of domains based on the primary fuel saved, electricity or gas. This helped ensure sufficient
results for both fuels.
▪ Stratification by size of savings reported (up to four size strata were used) and use of a certainty
stratum to increase the magnitude of savings evaluated and minimize the expected relative precision of
evaluated savings.
Sampling occurred at the project level (Project ID). DNV GL sample design included 80 custom projects at
79 sites that include 110 unique measures. Table 23 summarizes the sample design for the custom track.
This design was expected to provide program year savings estimates with 15% relative precision at the 90%
confidence interval. Further detail on sample design is available in Appendix A.
Table 23: Custom track sample design
Program Year Fuel
Stratum
Size
Stratum
Population
(Projects)
Sample
Target
2015
Electric
1 103 9
2 24 8
3 11 8
Certainty 5 5
Gas 1 71 5
2 15 5
2016
Electric
1 120 9
2 21 9
3 13 9
Certainty 3 3
Gas
1 45 5
2 10 4
Certainty 1 1
2015 Subtotal 229 40
2016 Subtotal 213 40
EVALUATION TOTAL 442 80
Percent of Reported kWh in sample 54%
Percent of Reported therms in sample 34%

DNV GL – www.dnvgl.com 6/25/2018 Page 39
5.2 Custom track evaluation methods
5.2.1 Summary of approach
DNV GL completed the following steps for the custom track impact evaluation:
▪ Project file review: Review of project files provided by Energy Trust.
▪ Data collection planning: Creation of project-specific measurement and verification plans.
▪ Data collection: Sites visits and phone interviews with sampled participants.
▪ Analysis: Estimated evaluated savings using the data collected to update key input parameters.
5.2.2 Project file review
DNV GL reviewed each sampled project file for sufficient documentation, program savings methodology, and
accurate savings reporting. This review included:
▪ Verification of the existence of signed application or end-user agreement
▪ Identification of the Building Type
▪ Determination if the file folder contained enough information for evaluation
▪ Verification of the existence of engineering calculations and/or energy simulation models with outputs
that match the reported savings
▪ Assessment of the completeness of documentation
5.2.3 Measurement and verification planning
DNV GL created project-specific M&V plans to guide the onsite data collection effort. These site-level M&V
plans were created for each sampled site using DNV GL’s project-specific M&V Plan template. These plans
focused on the collection of information specific to the key research parameters identified. The study did not
collect information on all drivers of end-use energy consumption.
5.2.4 Data collection
The evaluation team made onsite verification at 45 project sites and conducted interviews by phone with the
facility personnel at 23 project sites. Seven sites were dropped because of no response received from the
facility contact or the facilities did not have a suitable person who could answer the evaluator’s queries. For
the remaining five sites that were completely identical to one of the verified or interviewed sites, the
evaluator utilized the data collected from the identical site to evaluate the measure savings.
5.2.5 Project analysis
DNV GL estimated evaluated savings for 73 of the 80 projects originally sampled. DNV GL used the same
calculation tool used by the program to estimate savings with revised inputs where necessary. Inputs for the
evaluated savings calculations were determined from the most valid data source including participant
interviews, site observations, site EMS data, schedules, or setpoints, program project files, and utility meter
data. Typically, adjustments were made to the post installation analysis in order to model the conditions
observed by the evaluation. However, in some cases the evaluation did adjust the pre-existing or baseline
inputs based on interviews with the participants. Project specific results were provided to Energy Trust
separately.
DNV GL – www.dnvgl.com 6/25/2018 Page 40
5.3 Custom track evaluation results
5.3.1 Achieved sample
Table 24 shows the final sample achieved across the entire standard track. DNV GL estimated evaluated
savings for 91% of the projects sampled. The final achieved evaluation sample differed from the sample
design due to the following.
▪ Refusals and Non-Responses: The incomplete sample was primarily those participants that could not
be reached after exhausting our phone call protocol, and a small number who refused to participate in
the call. Our protocol required calling up to five times at different times of the day. We also tried
contacting the participant by email if they did not respond to phone calls.
Table 24: Final standard track sample summary
Program Year
Primary Fuel
Sample Target
Achieved Sample
% Complete
2015 Electric 30 28 93%
Gas 10 9 90%
2016 Electric 30 27 90%
Gas 10 9 90%
Total Overall 80 73 91%
5.3.2 Evaluated savings
Expansion from the sample to track-level results follows the methodology discussed in Section 2.4. Table 25
shows the overall electric standard track realization rates for the track by program year. The electric
realization rates are driven by numerous factors, including changes to building operation or use, errors in
the program analysis, and adjustments to simulation inputs. DNV GL captures our findings and
recommendations in the sections that follow.
Table 25: Custom track electric impact evaluation results by program year
Tracks by
Year
Completed
Sample
Realization
Rate
Standard
Error
Relative Precision at
90 % Confidence
Evaluated Savings (kWh)
Custom-2015 34 94% 0.11 19% 24,525,378
Custom-2016 33 86% 0.07 12% 22,222,244
Overall 67 90% 0.06 11% 46,715,664
Table 26 shows the overall gas standard track realization rates for the track by program year. The gas
realization rates are driven by numerous factors, including changes to building operation or use, errors in
the program analysis, and adjustments to simulation inputs. DNV GL captures our findings and
recommendations in the sections that follow.
Table 26: Custom track natural gas impact evaluation results by program year
Tracks by
Year
Completed
Sample
Realization
Rate
Standard
Error
Relative Precision
at 90 % Confidence
Evaluated
Savings
(therms)
Custom-2015 14 81% 0.12 25% 637,221
Custom-2016 18 104% 0.12 19% 655,489
Overall 32 91% 0.09 17% 1,292,548

DNV GL – www.dnvgl.com 6/25/2018 Page 41
5.3.3 Custom track findings and recommendations
Our evaluation findings and recommendations specific to the custom track are presented in two sections,
one to address key research questions and the other to address track-specific findings.
5.3.3.1 Energy Trust questions
This section provides responses to Energy Trust’s custom track research questions.
Are there any aspects of the models used in the energy savings analyses by the PMC or program
allies that may be of concern to Energy Trust?
Evaluation Response: Overall, the evaluation found the models developed by the program to be robust.
We identified the following opportunities for improvement in model development that should increase the
accuracy of individual project estimates.
▪ Final reported savings based on eQuest simulation models should use parametric runs to estimate the
impact of measure combinations. The evaluation found that most program eQuest models used
individual measure runs and did not utilize the parametric modelling option. In some cases, lack of
parametric modeling inflated the reported savings estimate.
▪ Final reported savings based on Trane Trace simulation models should use a modeling alternative that
includes all measures installed. This alternative will estimate the annual consumption of the final
proposed case and can be subtracted from the baseline model output to estiamate annual savings. There
were multiple cases when savings estimates for each measure were provided, but it was unclear how the
final reported savings estimate for measures installed was determined.
▪ DNV GL recommends using standard weather files and to provide the weather files along with the energy
model files. The program models did not follow any uniform guideline for consistent use of weather file,
such as TMY2 or TMY3. Some project used TMY2 or TMY3 while few models used custom weather files.
Are there any obvious errors in any of the assumptions used in energy savings analyses, either in
the original savings estimates or in verification of energy savings?
Evaluation Response: DNV GL did not identify any systemic errors in the energy savings analysis, but
errors did exist in the projects reviewed.
▪ One project incorrectly assumed that elevator motors would run 8,760 hours per year fully loaded. The
hours of operation and load on elevator motors is highly variable throughout the year.
▪ One project incorrectly calibrated a simulation model to two utility meters, when only one of the meters
serves the building.
▪ Two projects included significantly overestimated compressor annual operating hours.
▪ One project used two unique simulation runs to estimate savings for what really was one measure. By
dividing the measure into two pieces, the simulation model overestimated savings.
What factors result in large variances in measures savings (assumptions too conservative,
incorrect hours of operation, loads differ from expectations, etc.)?
Evaluation Response: The errors listed above all resulted in large variances in measures savings. DNV GL
also identified the following common parameters that resulted large savings variances:
DNV GL – www.dnvgl.com 6/25/2018 Page 42
▪ Changes in operating schedule: The evaluation updated building operating schedules based on data
gathered during the evaluation. In many cases, these schedules differed from the operating schedules
used in the reported savings analysis. The source of the operating schedules used to estimate reported
savings are unknown as the program files or TAS do not report the sources of these schedules.
▪ Changes in operating setpoints: The majority of the ex post revisions made were related to the control
setpoints used in simulation models. The evaluation updated setpoints based on the data gathered
during the evaluation. Most of the changes were related to: occupied/un-occupied cooling setpoints,
occupied/un-occupied heating setpoints, economizer high limit setpoint, chilled water and HHW plant
operating setpoints and reset range, cooling and heating supply air temperature setpoints and reset
range, and cooling and heating lock-out temperatures. The source of the original setpoints assumed was
typically unknown. The evaluation cannot therefore conclude if the setpoints were changed since the
project was completed.
▪ Capacity Expansion or Reduction: There were two instances, one project at a data center and one
project at a research facility, where the evaluation found that the capacity or the system load played the
major determinant for the estimated savings. The ex post savings were decided based on the as-found
facility load and that either increased or decreased the project savings drastically.
▪ Significant drop of IT load: The evaluation found three data center and telecom facilities where the ex
post IT load changed significantly from what was used in the reported analysis. In one such instance,
the ex post facility IT load was found to be almost one fourth of its reporting period load. However, it
was not clear to the evaluator if the reported IT loads were based on the observed data or were based
on the design IT loads. However, it is usual to see IT load variation in such facilities. Thus, the
unpredictability exists with the reported energy savings because of load changes.
How can Energy Trust most effectively evaluate projects that involve multiple phases or
commissioning that takes place over multiple years?
Evaluation Response: DNV GL suggests the following procedures be adopted for large projects with
multiple phases and commissioning:
▪ Evaluation Timing: DNV GL recommends waiting to estimate evaluated savings of phased projects
until the projects are complete. Phased projects often involve multiple interactive measures and any
attempt to estimate savings from a single phase of the project would introduce unnecessary error and
accounting challenges. However, Energy Trust should also include an independent review of the project
plan and savings estimation at the start of the project. This independent review would improve the
evaluation’s effectiveness and mitigate the evaluation savings risk.
▪ Baseline Documentation: Effective evaluation requires a thorough understanding of the baseline
condition and assumptions. Given the length of these projects, it is essential to fully document facility
operation before the project begins as there are many risks to losing this information as the project
develops. For projects that involve control setpoint or sequence modification, collect the baseline system
performance data and document them to establish the baseline condition. These can include either
collecting the EMS screenshots or by creating plots from the baseline trends to show the baseline
setpoints, their variation over the baseline period. Furthermore, the project documentation should
include the baseline operation details, such as the system parameters information collected, the period
of data collection, interval along with the final observation baseline operating conditions.
DNV GL – www.dnvgl.com 6/25/2018 Page 43
▪ Post-project Documentation: DNV GL recommends that all phased projects include post-project
commissioning reports that document the final measures installed and adjust the reported energy
savings if necessary. The documentation should also capture the final post installation operation,
including the list of operating parameters revised and their validation either through the facility EMS
screenshots or plots of operating trends.
Do you have any recommendations regarding energy savings analysis approaches and
assumptions, or customer behavior or decision-making that would be helpful to Energy Trust in
designing, implementing or evaluating its programs in the future?
Evaluation Response: DNV GL believes the following adjustments will improve Energy Trust’s program:
▪ Increase documentation of changes to building controls: For many control upgrade or modification
measures, the evaluation team found little or no information available to support the measure changes
and the inputs used in simulation modeling. DNV GL recommends that pre- and post-project control
setpoints be documented either through facility EMS screenshots, plots of EMS trends, or a text
narrative.
▪ Avoid overly complex calculations: The evaluation team found that some of the reported calculations
were very complex and involved a large number of spreadsheet tabs along with hundreds of variables.
Even though there are no technical issues associated with these complex calculations, the evaluator
believes that for the calculations could have been made simpler given the commonly found measures.
DNV GL recommends that Energy Trust either avoid complex calculations that are difficult to trace,
require contractors to provide additional documentation of the calculation completed and key
parameters, or increase the budget available to evaluate them.
▪ Avoid non-live calculations: The evaluation team came across many instances where the reported
spreadsheet calculations were not live, meaning that at some point a macro is run. One of the possible
reasons for this can be the proprietary nature of these savings calculations. However, the use of these
calculators does not improve the reliability of the program since independent verification of savings is
both prohibitively time consuming and often introduces additional error due to the use of a different
calculation methodology.
5.3.3.2 Additional Custom Track Recommendations
This section provides additional findings and recommendations from the custom track evaluation.
▪ Finding – Multple eQuest models were generated for each implemented measures and baseline instead
of using eQuest “parametric run” option. This required additional time to verify that each successive
measure is built on preceding measure to avoid double counting of savings.
- Recommendation – Use “parametric run” option when multiple measures were modeled using
eQuest. This gives the opportunity to the customer and implementer to either select or deselect any
given measure based on measure feasibility, its preference or its ranking in overall cost-benefit
analysis. Similarly, when the measures are modeled using the eQuest “parametric run” option, it
gives opportunity to the evaluator to deselect any given measure if any specific measure was found
not working or not implemented. This reduces the evaluation time significantly and ensures that the
measure interactive effects have been captured.

DNV GL – www.dnvgl.com 6/25/2018 Page 44
▪ Finding – Many Trace 700 models were not complete and were not consistent with TAS reported
savings. Even though the final reported savings were based the combined effect of proposed measures,
the program Trace models provided did contain the the final alternatives.
- Recommendation – The ATAC should prepare Trace alternatives to represent the baseline, the
individual measures and the final alternative that represents the actual measures implemented. The
project documentation should provide the annual energy consumption estimated by each model and
the reported energy savings should be the difference between the consumption of the baseline and
final alternatives. The PMC should confirm that they have received a model that contains the
baseline and final alternatives. These models should be stored to be available to Energy Trust should
the project be evaluated. Additionally, model output screenshots should be included in an appendix
to the TAS besides documenting the baseline and measure parameter values.
▪ Finding – Some of the reported savings calculations used baseline assumptions that were not
documented and beyond engineering judgement. One such example was assuming the baseline chiller
efficiency at 1.8 kw/ton, given the baseline chillers were water cooled. These undocumented
assumptions resulted in inflated baseline energy consumption and overestimates of energy savings.
- Recommendation – Prepare adequate baseline documentation that can be used in the evaluation
analysis. Since the evaluation team does not get the opportunity to verify the baseline operation
onsite (except what the facility personnel can recall), it is essential to document the baseline
operation.
▪ Finding – Demand control ventilation measure savings were estimated through Trace 700 model
without any documenation on the space occupancy density details, actual CO2 concentration observed
or design condition, and CO2 setpoints. While the DCV systems were found to be installed and recording
CO2 levels, many were not generating savings due to the setpoints in place and occupancy patterns.
- Recommendation – The program should only support DCV installations in spaces where the
conditions are right, such as: the HVAC ventilation system is designed for high density occupancy
and the occupancy level in the space is variable. Gymnasiums that require significant ventilation
during events are a perfect candidate for this measure. However, there are many instances in which
no savings will be achieved. The program should ensure that projects with proposed DCV measures
are good candidates for the application and that the setpoints used are appropriate for the space.

DNV GL – www.dnvgl.com 6/25/2018 Page 45
6 STRATEGIC ENERGY MANAGEMENT EVALUATION
The SEM track reported 280 unique measures providing 20,137,489 kWh and 1,020,965 therms in annual
energy savings across the two program years. These savings account for 17% of the program’s reported
electricity savings and 54% of the program’s reported gas savings. Table 27 shows the reported savings for
SEM by program year.
Table 27: Reported SEM track energy savings by delivery and program year
Program Reported kWh Reported therms
Track 2015 2016 2015 2016
SEM 10,330,780 9,806,709 539,194 481,771
Existing Buildings program total 109,051,484 123,916,024 1,888,021 1,889,692
Percent of Existing Buildings program savings
9% 8% 29% 25%
6.1 Sample design
DNV GL used stratified random sampling to select an efficient representative sample of projects for
evaluation designed to provide reliable savings estimates across program years. Key design elements were:
▪ Temporal stratification of sample points based on the year of initial program engagement, providing
sufficient coverage of both early (Continuing) and later (2015 or 2016 Year 1) program participants.
▪ Creation of domains based on the primarily fuel saved, electricity or gas. This helped ensure sufficient
results for both fuels.
▪ Stratification by size of savings reported (up to two size strata were used) and use of a certainty
stratum to increase the magnitude of savings evaluated and minimize the expected relative precision of
evaluated savings.
Sampling occurred at the site level (CRM site number). DNV GL’s sample design included 63 unique
measures. Table 28 summarizes the sample design for the SEM track. This design was expected to provide
program year savings estimates with 20% relative precision at the 90% confidence interval. Further detail
on sample design is available in Appendix A.
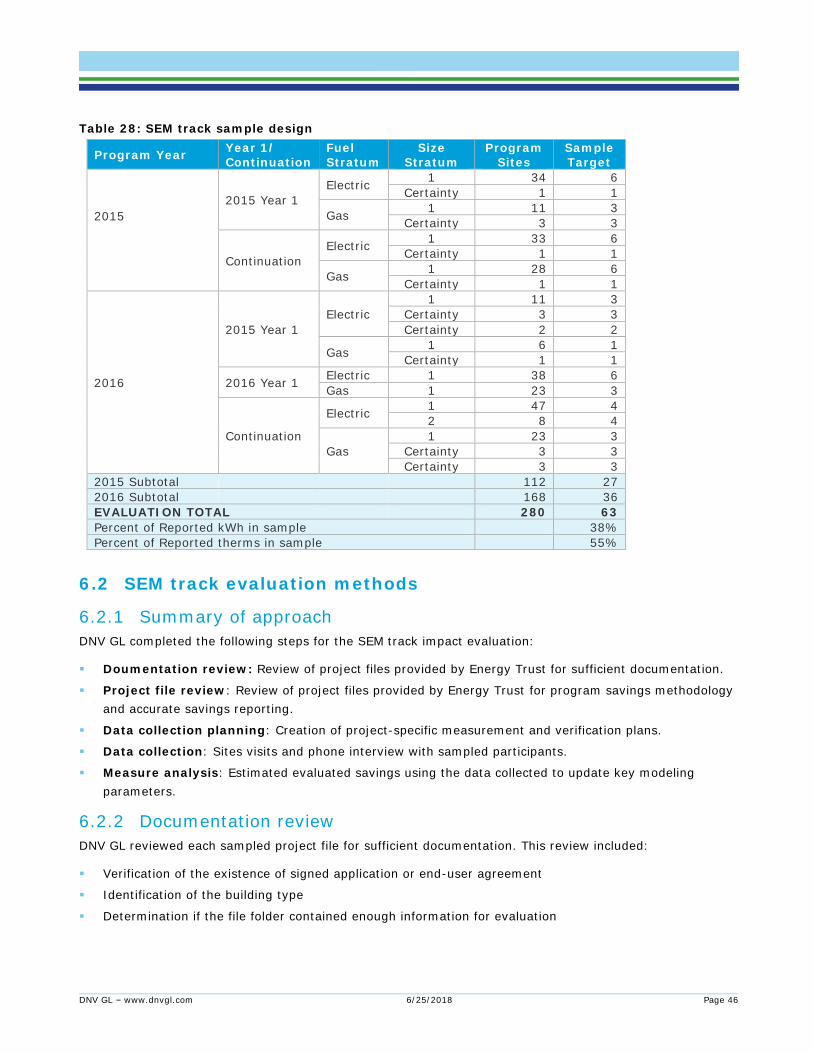
DNV GL – www.dnvgl.com 6/25/2018 Page 46
Table 28: SEM track sample design
Program Year Year 1/ Continuation
Fuel Stratum
Size Stratum
Program Sites
Sample Target
2015
2015 Year 1
Electric 1 34 6
Certainty 1 1
Gas 1 11 3
Certainty 3 3
Continuation
Electric 1 33 6
Certainty 1 1
Gas 1 28 6
Certainty 1 1
2016
2015 Year 1
Electric
1 11 3
Certainty 3 3
Certainty 2 2
Gas 1 6 1
Certainty 1 1
2016 Year 1 Electric 1 38 6
Gas 1 23 3
Continuation
Electric 1 47 4
2 8 4
Gas
1 23 3
Certainty 3 3
Certainty 3 3
2015 Subtotal 112 27
2016 Subtotal 168 36
EVALUATION TOTAL 280 63
Percent of Reported kWh in sample 38%
Percent of Reported therms in sample 55%
6.2 SEM track evaluation methods
6.2.1 Summary of approach
DNV GL completed the following steps for the SEM track impact evaluation:
▪ Doumentation review: Review of project files provided by Energy Trust for sufficient documentation.
▪ Project file review: Review of project files provided by Energy Trust for program savings methodology
and accurate savings reporting.
▪ Data collection planning: Creation of project-specific measurement and verification plans.
▪ Data collection: Sites visits and phone interview with sampled participants.
▪ Measure analysis: Estimated evaluated savings using the data collected to update key modeling
parameters.
6.2.2 Documentation review
DNV GL reviewed each sampled project file for sufficient documentation. This review included:
▪ Verification of the existence of signed application or end-user agreement
▪ Identification of the building type
▪ Determination if the file folder contained enough information for evaluation

DNV GL – www.dnvgl.com 6/25/2018 Page 47
▪ Verification of the existence of engineering calculations and/or energy simulation models with outputs
that match the reported savings
▪ Assessment of the completeness of documentation
6.2.3 Project file review DNV GL reviewed each sampled project file for program savings methodology and accurate savings
reporting. This review included the following steps:
▪ Verifying stated meter numbers and/or account numbers.
▪ Identifying how many years the site has participated in the program.
▪ Identifying if the site was previously evaluated or reviewed.
▪ Identifying use of non-weather variables, polynomials, or multiple degree-day variables.
▪ Identifying what, if any, capital projects were completed during the program years.
▪ Determining if the energy savings reported in the database is supported by a single or multiple
regression models.
▪ Extraction of the monthly utility consumption data, and non-weather independent variables (if used) for
each facility and identify if additional data is needed from Energy Trust.
▪ Extraction of the independent variables used in the facility regression model, HDD, CDD, OAT, etc.
▪ Determining if any baseline adjustments occur in the model.
▪ Identifying what capital projects are included in the model and extract the associated savings values
applicable to the sampled fuel and program year.
6.2.4 Measurement and verification planning
Project specific M&V plans were created using a DNV GL SEM M&V Plan template. M&V Plans focused on
documenting the facility being evaluated, its consumption, reported SEM actions, and identified capital
projects. The plans were then used as part of the data collection interview process.
6.2.5 Data collection
Data collection was executed per the site M&V plan through an in-depth interview completed on-site or via
telephone. The evaluation team completed interviews onsite at 22 project sites and performed phone
interviews with the facility personnel at 31 project sites. Eleven sites were dropped because of no response
received from the facility contact or the facilities did not have a suitable person who could answer the
evaluator’s queries. Through the in-depth interview, DNV GL staff captured information to:
▪ Verify participation in the program during the sampled program year.
▪ Verify the actions taken during the sampled program year to reduce energy consumption.
▪ Determine if the standard modeling approach is sufficient for the site and what changes are required if
not.
▪ Determine what capital improvements or non-SEM activities impacted energy consumption during the
sampled program year.
▪ Identify any operating conditions or changes to the facility that may have affected the energy savings or
the validity of the MT&R model. This includes capital projects installed during SEM engagement.
▪ Identify known seasonal changes in facility use that might prevent modeling using weather only.
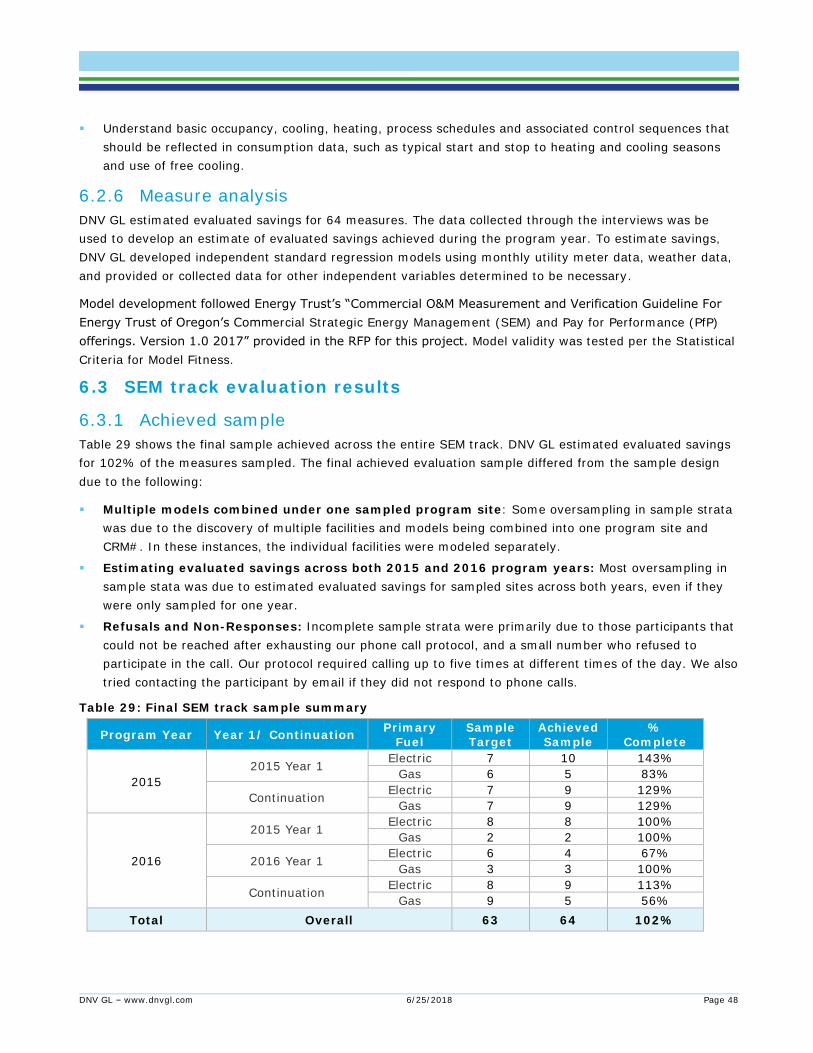
DNV GL – www.dnvgl.com 6/25/2018 Page 48
▪ Understand basic occupancy, cooling, heating, process schedules and associated control sequences that
should be reflected in consumption data, such as typical start and stop to heating and cooling seasons
and use of free cooling.
6.2.6 Measure analysis
DNV GL estimated evaluated savings for 64 measures. The data collected through the interviews was be
used to develop an estimate of evaluated savings achieved during the program year. To estimate savings,
DNV GL developed independent standard regression models using monthly utility meter data, weather data,
and provided or collected data for other independent variables determined to be necessary.
Model development followed Energy Trust’s “Commercial O&M Measurement and Verification Guideline For
Energy Trust of Oregon’s Commercial Strategic Energy Management (SEM) and Pay for Performance (PfP)
offerings. Version 1.0 2017” provided in the RFP for this project. Model validity was tested per the Statistical
Criteria for Model Fitness.
6.3 SEM track evaluation results
6.3.1 Achieved sample
Table 29 shows the final sample achieved across the entire SEM track. DNV GL estimated evaluated savings
for 102% of the measures sampled. The final achieved evaluation sample differed from the sample design
due to the following:
▪ Multiple models combined under one sampled program site: Some oversampling in sample strata
was due to the discovery of multiple facilities and models being combined into one program site and
CRM#. In these instances, the individual facilities were modeled separately.
▪ Estimating evaluated savings across both 2015 and 2016 program years: Most oversampling in
sample stata was due to estimated evaluated savings for sampled sites across both years, even if they
were only sampled for one year.
▪ Refusals and Non-Responses: Incomplete sample strata were primarily due to those participants that
could not be reached after exhausting our phone call protocol, and a small number who refused to
participate in the call. Our protocol required calling up to five times at different times of the day. We also
tried contacting the participant by email if they did not respond to phone calls.
Table 29: Final SEM track sample summary
Program Year Year 1/ Continuation Primary
Fuel Sample Target
Achieved Sample
% Complete
2015
2015 Year 1 Electric 7 10 143%
Gas 6 5 83%
Continuation Electric 7 9 129%
Gas 7 9 129%
2016
2015 Year 1 Electric 8 8 100%
Gas 2 2 100%
2016 Year 1 Electric 6 4 67%
Gas 3 3 100%
Continuation Electric 8 9 113%
Gas 9 5 56%
Total Overall 63 64 102%

DNV GL – www.dnvgl.com 6/25/2018 Page 49
6.3.2 Evaluated savings
Expansion from the sample to track-level results follows the methodology discussed in Section 2.4. Table 30
shows the overall electric SEM track realization rates by program year. The electric realization rates are
driven primarily by the change to baseline models that comply with the modeling guidance document. It is
also likely that some of the savings variance is due to the program’s use of measurement periods less than
12 months long to estimate annual savings compared to the evaluations program year assignment schedule.
Table 30: SEM track electric impact evaluation results by program year
Tracks by
Year
Completed
Sample
Gross Realization
Rate
Standard
Error
Relative Precision
at 90 % Confidence
Evaluated Savings (kWh)
SEM-2015 17 89% 0.11 20% 9,216,657
SEM-2016 18 92% 0.24 43% 9,038,775
Overall 35 91% 0.14 25% 18,280,470
Table 31 shows the overall gas SEM track realization rates by program year. The gas realization rates are
driven primarily by the same reasons given above for electric savings.
Table 31: SEM track natural gas impact evaluation results by program year
Tracks by
Year
Completed
Sample
Gross
Realization
Rate
Standard
Error
Relative Precision
at 90 % Confidence
Evaluated
Savings
(therms)
SEM-2015 17 83% 0.21 42% 446,946
SEM-2016 14 113% 0.11 16% 546,458
Overall 31 100% 0.11 18% 1,023,282
6.4 SEM track findings and recommendations
Our evaluation findings and recommendations specific to the SEM track are presented in this section.
▪ Finding – Participants value energy coaches and peer-to-peer learning. Participants cite benefits from
the insights provided by working closely with energy coaches to identify and execute operational and
capital improvement opportunities. Participants also commented on perceiving value from the peer-to-
peer information exchanges with participants of a similar facility type. These learning exchanges provide
participants with practical ‘case study’ examples to draw upon, as well as benchmarking and competitive
motivation across organizations with similar facilities.
- Recommendation – DNV GL recommends that Energy Trust continue to identify program
improvements that allow energy coaches to spend more time working with participant staff to
support energy conservation opportunities. Additionally, DNV GL recommends that Energy Trust
looks to further support interorganizational learning opportunities, such as is provided by the peer-
to-peer learning sessions.
▪ Finding - Energy Champions & Executive Leadership are key. DNV GL finds that the participant’s level
of program engagement corresponds to the organizations level of buy-in by executive leadership and
level of continuity of energy champion staff. Program participants with lower engagement levels typically
have experienced a personnel transition or lack significant authorization and support from their
leadership. The corollary is that participants with staff continuity and strong leadership support
demonstrate high levels of program engagement. DNV GL finds it challenging to attribute calculated

DNV GL – www.dnvgl.com 6/25/2018 Page 50
savings to the influence of the program for participants with low engagement as they generally lacked
evidence of significant activity that would drive savings.
- Recommendation – Based on this finding, DNV GL recommends to Energy Trust that participants
exhibiting low engagement be classified under an inactive status, and the program not report
savings from those participants. Reclassification as an active program participant could occur when
the entity demonstrates their willingness to actively engage and support fully participating in the
process.
▪ Finding - The level of activity documentation varies broadly across participants in the program. Through
the documentation review and data collection process, DNV GL observes a broad variation in the level of
activity documentation in the tracking tool provided by the program. Some participants frequently
document activities performed in the tracking tool, while others lack any considerable documentation of
SEM-related activities.
- Recommendation – To address this inconsistency, DNV GL recommends to Energy Trust the
following:
• Consider updating program documentation requirements to necessitate a minimum level of
tracked activity to receive incentive payments or continued program enrollment
• Update documentation requirements to include greater details of activity, especially one-time
activities and capital projects
• Exclude repetitive entries of O&M activities once they have been initiated, instead listing them
as an expected ongoing activity unless otherwise noted.
▪ Finding - Portfolio operators have a large burden. The evaluation team finds that participants with
multiple facilities enrolled in the program find updating the MTRs to be a significant time burden, unless
each facility update is assigned to a specific team member, which appears uncommon.
- Recommendation – To reduce this obstacle, DNV GL suggests Energy Trust help facilitate
identification of opportunities to track activities at the participant level, instead of only at the
individual facility level.
▪ Finding - Many model baselines have or will soon expire. DNV GL observes that many enrolled facilities
have baseline measurement periods that have already or will soon elapse the five-year baseline term
stated in the program guidelines. Additionally, many facilities are using non-standard ‘baseline
adjustments.’
- Recommendation - The evaluation team recommends updating expired baseline measurement
periods ahead of the 2019 program year, if this is not already being performed. This will have the
added benefit of reducing the quantity of older models that do not conform to the current modeling
guidelines (e.g. do not use degree days) as well as eliminate complication from legacy capital
projects.
▪ Finding - Measurement periods are inconsistent. The evaluation team observes inconsistency in
measurement periods across participating facilities. While the measurement periods generally span from
the Fall to the following Fall, the initial and final measurement months are not consistent across the
program. This creates complications and uncertainty in assessing annual savings values for both the
program and the evaluation teams.
- Recommendation - To address this issue, DNV GL recommends that Energy Trust creates a
measurement schedule for current and future participants that defines when each year’s period will
start and stop, use this schedule across the program, and thoroughly document justifications for any
deviations from the schedule that are deemed necessary.

DNV GL – www.dnvgl.com 6/25/2018 51
APPENDIX A. EVALUATION SAMPLE DESIGN MEMO
Memo to: Memo No.: 002
Sarah Castor, Energy Trust of Oregon From: Andrew Wood, DNV GL
Date: 6/25/2018
Copied to:
Jennifer Barnes, DNV GL
Prep. by: Andrew Wood, DNV GL
Ben Jones, DNV GL
Commercial Existing Buildings Impact Evaluation Sampling Plan
This memorandum summarizes DNV GL’s proposed sampling plan for the impact evaluation of the Energy
Trust of Oregon’s Commercial Existing Buildings program.
Evaluation objectives
Existing buildings program actions may target a site’s electricity consumption, natural gas consumption, or
both. The objectives of this evaluation considered in the development of this sampling plan are:
▪ Estimate achieved gas and electric savings for PY2015 and PY2016
▪ Develop separate gas and electric realization rates for PY2015 and PY2016 to be used for program true-
up.
▪ Develop separate gas and electric realization rates for PY2015 and PY2016 SEM savings
▪ Develop separate gas and electric realization rates for PY2015 and PY2016 Non-SEM savings
▪ Develop separate gas and electric realization rates for future program planning.
▪ Provide Energy Trust with feedback on participants’ experience with installed Tubular LEDs (TLED).
Sample Summary
This proposed sample is summarized in the two tables below. DNV GL believes the proposed sample and
expected relative precision values are reasonable for this program and the results will achieve the study’s
objectives. In general, 20% - 25% of the savings installed will be directly evaluated based on this sample.
The expected relative precision values are based on error ratios determined in previous Energy Trust studies
of the same program.
Table 32: Sample summary
Measure
Type Fuel
2015 2016
% of
Reported
Savings in
Draft
Sample
N n Relative
Precision
% of
Reported
Savings in
Draft
Sample
N n Relative
Precision
Frame Sample (@ 90% CI) Frame Sample (@ 90% CI)
Capital
(Non-SEM)
Electric 21% 3851 124 10% 19% 4455 128 9%
Gas 23% 676 52 14% 28% 727 59 12%
SEM Electric 28% 89 20 17% 45% 135 28 20%
Gas 23% 50 15 19% 22% 69 17 18%
ALL
(Capital +
SEM)
Electric 22% 3940 144 9% 21% 4590 156 9%
Gas 23% 726 67 11% 26% 796 76 10%
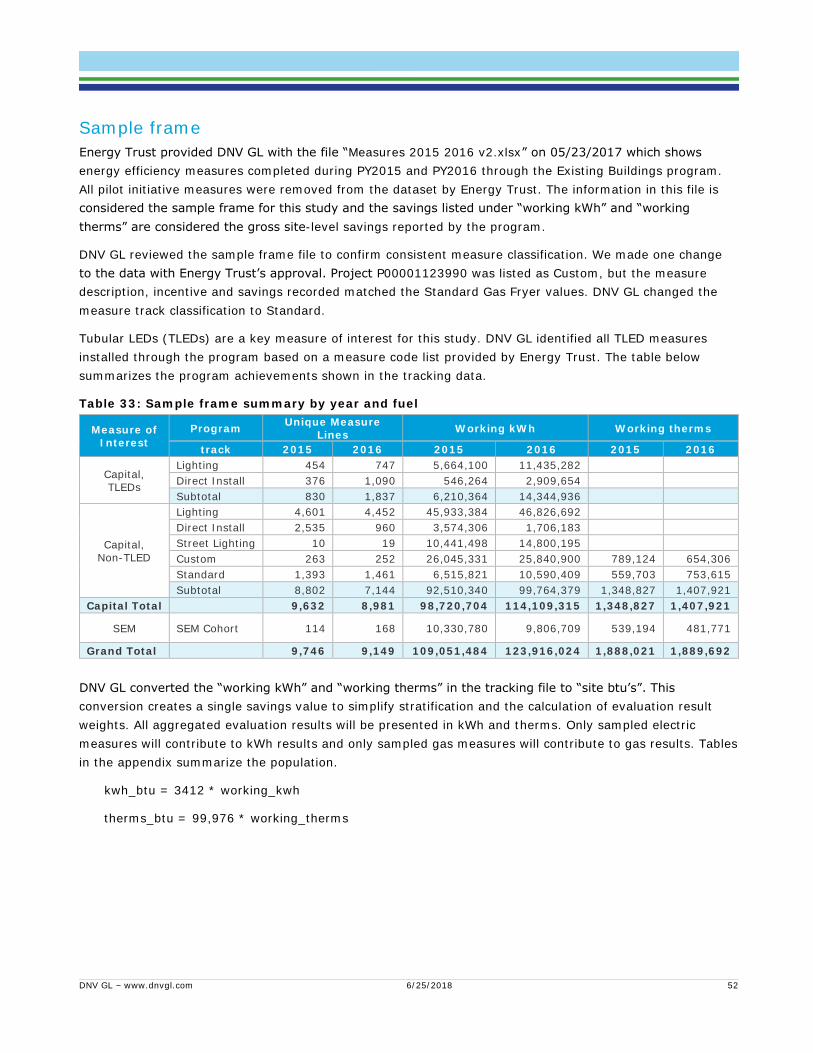
DNV GL – www.dnvgl.com 6/25/2018 52
Sample frame
Energy Trust provided DNV GL with the file “Measures 2015 2016 v2.xlsx” on 05/23/2017 which shows
energy efficiency measures completed during PY2015 and PY2016 through the Existing Buildings program.
All pilot initiative measures were removed from the dataset by Energy Trust. The information in this file is
considered the sample frame for this study and the savings listed under “working kWh” and “working
therms” are considered the gross site-level savings reported by the program.
DNV GL reviewed the sample frame file to confirm consistent measure classification. We made one change
to the data with Energy Trust’s approval. Project P00001123990 was listed as Custom, but the measure
description, incentive and savings recorded matched the Standard Gas Fryer values. DNV GL changed the
measure track classification to Standard.
Tubular LEDs (TLEDs) are a key measure of interest for this study. DNV GL identified all TLED measures
installed through the program based on a measure code list provided by Energy Trust. The table below
summarizes the program achievements shown in the tracking data.
Table 33: Sample frame summary by year and fuel
Measure of Interest
Program Unique Measure
Lines Working kWh Working therms
track 2015 2016 2015 2016 2015 2016
Capital, TLEDs
Lighting 454 747 5,664,100 11,435,282
Direct Install 376 1,090 546,264 2,909,654
Subtotal 830 1,837 6,210,364 14,344,936
Capital, Non-TLED
Lighting 4,601 4,452 45,933,384 46,826,692
Direct Install 2,535 960 3,574,306 1,706,183
Street Lighting 10 19 10,441,498 14,800,195
Custom 263 252 26,045,331 25,840,900 789,124 654,306
Standard 1,393 1,461 6,515,821 10,590,409 559,703 753,615
Subtotal 8,802 7,144 92,510,340 99,764,379 1,348,827 1,407,921
Capital Total 9,632 8,981 98,720,704 114,109,315 1,348,827 1,407,921
SEM SEM Cohort 114 168 10,330,780 9,806,709 539,194 481,771
Grand Total 9,746 9,149 109,051,484 123,916,024 1,888,021 1,889,692
DNV GL converted the “working kWh” and “working therms” in the tracking file to “site btu’s”. This
conversion creates a single savings value to simplify stratification and the calculation of evaluation result
weights. All aggregated evaluation results will be presented in kWh and therms. Only sampled electric
measures will contribute to kWh results and only sampled gas measures will contribute to gas results. Tables
in the appendix summarize the population.
kwh_btu = 3412 * working_kwh
therms_btu = 99,976 * working_therms
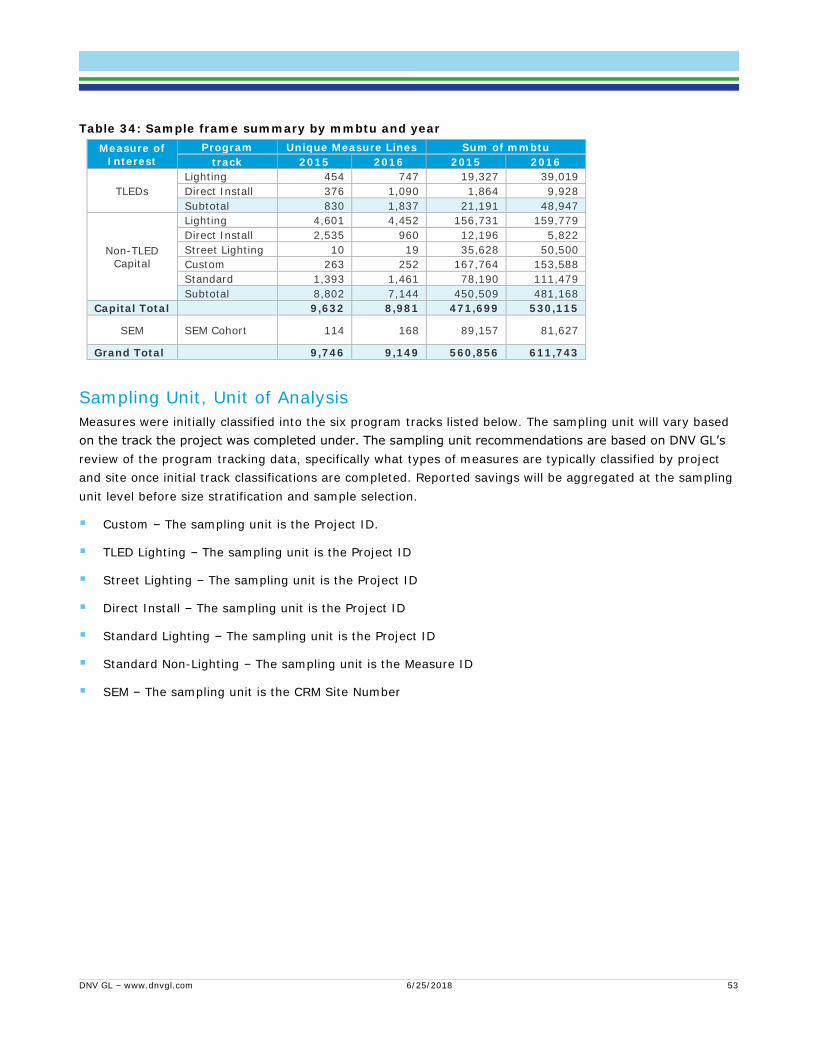
DNV GL – www.dnvgl.com 6/25/2018 53
Table 34: Sample frame summary by mmbtu and year
Measure of
Interest
Program Unique Measure Lines Sum of mmbtu
track 2015 2016 2015 2016
TLEDs
Lighting 454 747 19,327 39,019
Direct Install 376 1,090 1,864 9,928
Subtotal 830 1,837 21,191 48,947
Non-TLED Capital
Lighting 4,601 4,452 156,731 159,779
Direct Install 2,535 960 12,196 5,822
Street Lighting 10 19 35,628 50,500
Custom 263 252 167,764 153,588
Standard 1,393 1,461 78,190 111,479
Subtotal 8,802 7,144 450,509 481,168
Capital Total 9,632 8,981 471,699 530,115
SEM SEM Cohort 114 168 89,157 81,627
Grand Total 9,746 9,149 560,856 611,743
Sampling Unit, Unit of Analysis
Measures were initially classified into the six program tracks listed below. The sampling unit will vary based
on the track the project was completed under. The sampling unit recommendations are based on DNV GL’s
review of the program tracking data, specifically what types of measures are typically classified by project
and site once initial track classifications are completed. Reported savings will be aggregated at the sampling
unit level before size stratification and sample selection.
▪ Custom – The sampling unit is the Project ID.
▪ TLED Lighting – The sampling unit is the Project ID
▪ Street Lighting – The sampling unit is the Project ID
▪ Direct Install – The sampling unit is the Project ID
▪ Standard Lighting – The sampling unit is the Project ID
▪ Standard Non-Lighting – The sampling unit is the Measure ID
▪ SEM – The sampling unit is the CRM Site Number

DNV GL – www.dnvgl.com 6/25/2018 54
Stratification
Stratification is an important and commonly used design feature in most data collection efforts.
Stratification refers to the process of partitioning the sample frame into distinct domains (or strata) and
sampling is done independently within each domain. Stratification is often used to (1) improve precision of
the final estimates and (2) control the sample size by subgroups of interest during the analysis. Precision is
improved if strata are formed so that the population is relatively homogeneous within each stratum and
relatively heterogeneous between strata.
Studies that involve analyzing data that could be highly variable between units often benefit by creating
what is referred to as a certainty stratum. In this case projects or measures with the highest savings
were placed in this stratum. This stratum is referred to as “certainty” because all frame units are selected
for the data collection effort from this stratum. So the sampling variance associated with estimates created
from this stratum is zero (since a census is being taken). A certainty stratum is suggested for this study.
For this study, the sample will be selected independently within domains defined by the following:
▪ Program Year: 2015 and 2016.
▪ Fuel: Electric and Gas classifications were used throughout the design. If an aggregated sampling unit
saved both electric and gas, then the fuel classification was based on which fuel provided the majority of
the site btu savings.
▪ Measure of Interest: Capital TLED Measures, Capital non-TLED Measures, SEM Measures
▪ Program Track: Custom, Lighting, Standard Non-Lighting, and SEM.
▪ Program Sub-Category: Additional categorization was used within tracks.
- Within lighting, the following sub-categories were used: Street Lighting, Direct Install, Standard
Lighting .
- Standard Non-Lighting was further categorized into Food Equipment and Non-Food Equipment.
- SEM was further categorized into SEM Year 1 and SEM Continuation.
▪ Measure Type or Project Savings: Additional fuel specific, measure specific, location, and size
stratification was used within each track to minimize the expected relative precision, ensure sample
representation, and align with the evaluation’s objectives.
▪ Certainty: 26 projects were selected at certainty.
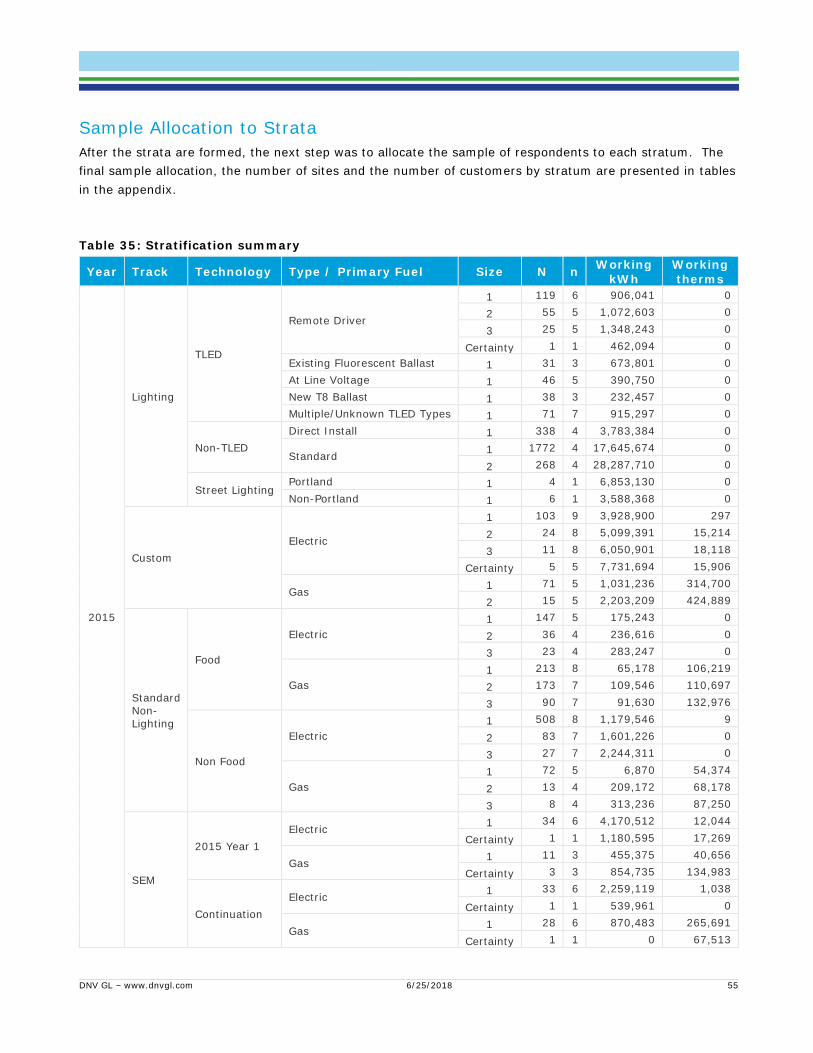
DNV GL – www.dnvgl.com 6/25/2018 55
Sample Allocation to Strata
After the strata are formed, the next step was to allocate the sample of respondents to each stratum. The
final sample allocation, the number of sites and the number of customers by stratum are presented in tables
in the appendix.
Table 35: Stratification summary
Year Track Technology Type / Primary Fuel Size N n Working
kWh Working therms
2015
Lighting
TLED
Remote Driver
1 119 6 906,041 0
2 55 5 1,072,603 0
3 25 5 1,348,243 0
Certainty 1 1 462,094 0
Existing Fluorescent Ballast 1 31 3 673,801 0
At Line Voltage 1 46 5 390,750 0
New T8 Ballast 1 38 3 232,457 0
Multiple/Unknown TLED Types 1 71 7 915,297 0
Non-TLED
Direct Install 1 338 4 3,783,384 0
Standard 1 1772 4 17,645,674 0
2 268 4 28,287,710 0
Street Lighting Portland 1 4 1 6,853,130 0
Non-Portland 1 6 1 3,588,368 0
Custom
Electric
1 103 9 3,928,900 297
2 24 8 5,099,391 15,214
3 11 8 6,050,901 18,118
Certainty 5 5 7,731,694 15,906
Gas 1 71 5 1,031,236 314,700
2 15 5 2,203,209 424,889
Standard Non-Lighting
Food
Electric
1 147 5 175,243 0
2 36 4 236,616 0
3 23 4 283,247 0
Gas
1 213 8 65,178 106,219
2 173 7 109,546 110,697
3 90 7 91,630 132,976
Non Food
Electric
1 508 8 1,179,546 9
2 83 7 1,601,226 0
3 27 7 2,244,311 0
Gas
1 72 5 6,870 54,374
2 13 4 209,172 68,178
3 8 4 313,236 87,250
SEM
2015 Year 1
Electric 1 34 6 4,170,512 12,044
Certainty 1 1 1,180,595 17,269
Gas 1 11 3 455,375 40,656
Certainty 3 3 854,735 134,983
Continuation
Electric 1 33 6 2,259,119 1,038
Certainty 1 1 539,961 0
Gas 1 28 6 870,483 265,691
Certainty 1 1 0 67,513
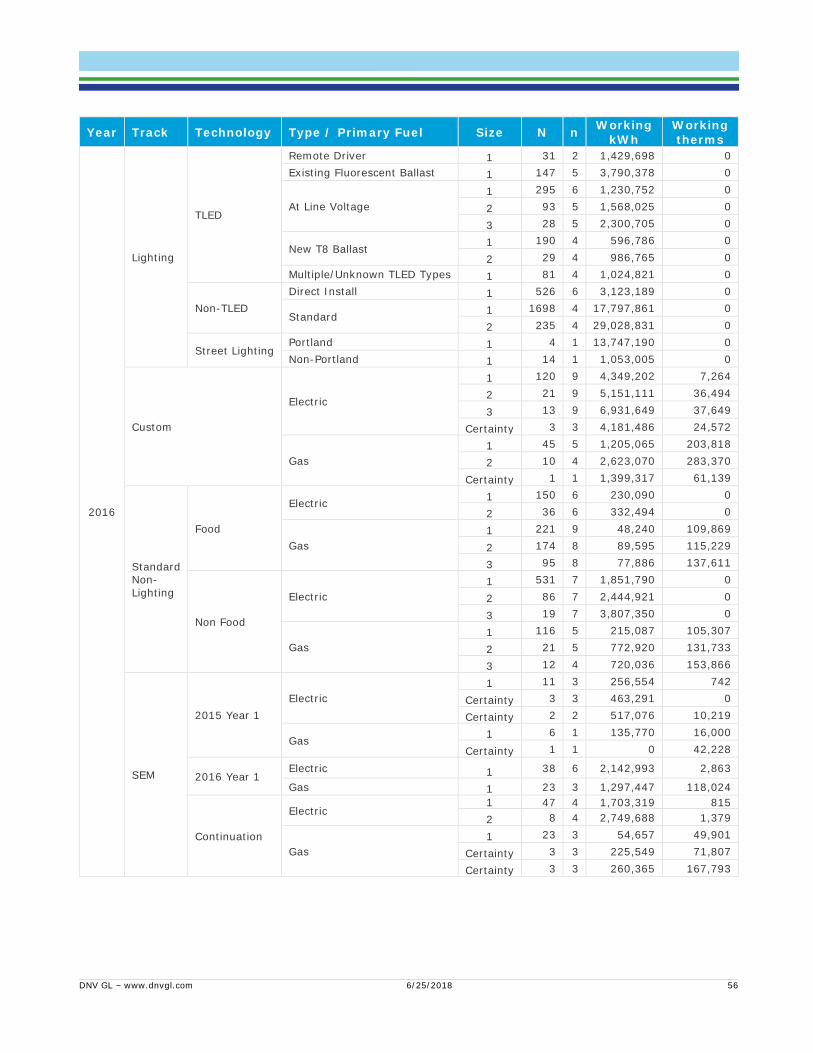
DNV GL – www.dnvgl.com 6/25/2018 56
Year Track Technology Type / Primary Fuel Size N n Working
kWh Working therms
2016
Lighting
TLED
Remote Driver 1 31 2 1,429,698 0
Existing Fluorescent Ballast 1 147 5 3,790,378 0
At Line Voltage
1 295 6 1,230,752 0
2 93 5 1,568,025 0
3 28 5 2,300,705 0
New T8 Ballast 1 190 4 596,786 0
2 29 4 986,765 0
Multiple/Unknown TLED Types 1 81 4 1,024,821 0
Non-TLED
Direct Install 1 526 6 3,123,189 0
Standard 1 1698 4 17,797,861 0
2 235 4 29,028,831 0
Street Lighting Portland 1 4 1 13,747,190 0
Non-Portland 1 14 1 1,053,005 0
Custom
Electric
1 120 9 4,349,202 7,264
2 21 9 5,151,111 36,494
3 13 9 6,931,649 37,649
Certainty 3 3 4,181,486 24,572
Gas
1 45 5 1,205,065 203,818
2 10 4 2,623,070 283,370
Certainty 1 1 1,399,317 61,139
Standard Non-
Lighting
Food
Electric 1 150 6 230,090 0
2 36 6 332,494 0
Gas
1 221 9 48,240 109,869
2 174 8 89,595 115,229
3 95 8 77,886 137,611
Non Food
Electric
1 531 7 1,851,790 0
2 86 7 2,444,921 0
3 19 7 3,807,350 0
Gas
1 116 5 215,087 105,307
2 21 5 772,920 131,733
3 12 4 720,036 153,866
SEM
2015 Year 1
Electric
1 11 3 256,554 742
Certainty 3 3 463,291 0
Certainty 2 2 517,076 10,219
Gas 1 6 1 135,770 16,000
Certainty 1 1 0 42,228
2016 Year 1 Electric 1 38 6 2,142,993 2,863
Gas 1 23 3 1,297,447 118,024
Continuation
Electric 1 47 4 1,703,319 815
2 8 4 2,749,688 1,379
Gas
1 23 3 54,657 49,901
Certainty 3 3 225,549 71,807
Certainty 3 3 260,365 167,793

DNV GL – www.dnvgl.com 6/25/2018 57
Sample Selection
Within each non-certainty strata, the measures or projects included in the evaluation were selected at
random by assigning a random number to the sampling unit and sorting each strata by this random number.
Back-up sample points were also selected using these sorted lists.
Expected Precision
DNV GL used the error ratios reported in the recent 2013/14 Existing Buildings and SEM evaluations with
small adjustments.23 Table 36 shows the error ratios assumed.
Table 36: Assumed error ratios
Track Groups ER Assumed
Lighting
TLED 0.45
Non-TLED 0.29
Street Lighting 0.10
Custom 0.55
Standard 0.56
SEM
0.44
Table 37 and Table 38 summarize the sample design and expected relative precision for various groups of
interest. The anticipated relative precision estimates are based on error ratios and results reported in the
recent 2013/14 Existing Buildings and SEM evaluations and the distribution of savings within each stratum.
All “N” and “n” values are counts of the unique sampling units within each group. Note, of the 70 TLED
projects sampled, 13 are Direct Install and 57 are Standard. The total number of Direct Installed projects
proposed to be evaluated is 23 when TLED and Non-TLED projects are combined.
Table 37: Expected mmBtu Precision by Track
Program Track
2015 2016
MMBTU N
n
Relative Precision
MMBTU N
n
Relative Precision
(@ 90% CI) (@ 90% CI)
Lighting - Street Lighting 35,626 10 2 15% 50,498 18 2 14%
Lighting - TLED 20,476 386 35 17% 44,110 894 35 25%
Lighting - Non-TLED 169,634 2378 12 20% 170,429 2459 14 20%
Lighting - Total 225,736 2774 49 15% 265,037 3371 51 14%
Custom - Total 167,760 229 40 14% 153,584 213 40 13%
Standard Non-Lighting - Food 38,261 682 35 20% 38,918 676 37 19%
Standard Non-Lighting - Non-Food
39,928 711 35 18% 72,560 785 35 19%
Standard Non-Lighting - Total 78,189 1393 70 13% 111,478 1461 72 14%
SEM - Total 89,155 112 27 16% 81,626 168 36 14%
Grand Total 560,840 4508 186 8% 611,725 5213 199 8%
23 We increased the TLED error ratio above that of other standard lighting (to 0.45, from 0.35) to reflect a higher uncertainty for the newer
technologies and reduced the gas ER for the Standard track (to 0.60 from 0.70) as the ER found was higher than we have seen elsewhere and was
based on a unusual small sample size (n=5).

DNV GL – www.dnvgl.com 6/25/2018 58
Table 38: Expected Precision Summary, by program code
Measure Type
Fuel
2015 2016
% of Reported Savings in Draft Sample
N n
Relative Precision
% of Reported Savings in Draft Sample
N n
Relative Precision
(@ 90% CI) (@ 90% CI)
Capital (Non-SEM)
Electric 21% 3851 124 10% 19% 4455 128 9%
Gas 23% 676 52 14% 28% 727 59 12%
SEM Electric 28% 89 20 17% 45% 135 28 20%
Gas 23% 50 15 19% 22% 69 17 18%
ALL Electric 22% 3940 144 9% 21% 4590 156 9%
Gas 23% 726 67 11% 26% 796 76 10%
TLEDs
Unique sampling domains were created for the different types of TLEDs being installed through the program.
Creation of these domains ensures that feedback is collected on all technology types. If the program data
showed that a project installed multiple TLED types or if the TLED is unknown, then the project was
classified into the Multiple/Unknown category. This category ensures that all TLED projects have a potential
for selection. The table below shows the reported savings, population (N), and sampled size (n) by year and
TLED type. The table also shows the TLED sample by the two program tracks installing this technology.
Table 39: TLED sample summary
TLED TYPE
2015 2016
Working kWh
N n Working
kWh N n
Remote Driver 3,788,981 200 17 1,429,698 31 2
New T8 Ballast 232,457 38 3 1,583,551 219 8
Existing Fluorescent Ballast
673,801 31 3 3,790,378 147 5
At Line Voltage 390,750 46 5 5,099,482 416 16
Multiple/Unknown TLED Types
915,297 71 7 1,024,821 81 4
Grand Total 6,001,286 386 35 12,927,930 894 35
Direct Install TLED 337,186 34 3 1,492,648 176 10
Standard Lighting TLED
5,664,100 333 32 11,435,282 610 25

DNV GL – www.dnvgl.com 6/25/2018 59
APPENDIX B. TLED INTERVIEW GUIDE Energy Trust of Oregon 2017 Tubular LEDs (TLED) Telephone Interview
Final:10/9/2017
Key Research Questions
The interview will capture information on participants’ operations, controls, and satisfaction with
rebated TLED products. The table below links the key research questions for this effort to the
specific interview questions that address them.
Topic Research Question Relevant Interview Question(s)
General Performance
Are the TLEDs installed through the program in 2015 and 2016 operating well? Are participants satisfied with their performance?
P1, P1A, W1, W1A
Are there any differences in satisfaction by TLED installation type (at line voltage, with existing or new ballast, etc.), space use or customer type?
N/A1
Are participants experiencing any issues with TLEDs, like buzzing, flickering, early failure, etc.?
P2, P2A, P3, P4, P4A, P4B, P5, P5A, P5B, P6, P6A, P7, P8
[For participants who changed the quantity and/or placement of lighting fixtures] Are participants satisfied with their overall lighting system design?
P9, P9A, P9B, P10, P10A
Removal and Replacement
Have any participants removed any of the rebated TLEDs installed in 2015 and 2016?
R1, R2
[If participant removed any rebated TLEDs] When did participants remove the rebated TLEDs?
R3
[If participant removed any TLEDs] Why did they remove the rebated TLEDs?
R4A, R4B
[If participant removed any TLEDs] With what type of lighting did participants replace the rebated TLEDs?
R5, R5A
Controls
What control strategies are being used with TLEDs? C1
[For participants who installed TLED products and controls2] Did these controls receive incentives from the EB program? If not, why not?
C2, C2A
[For participants who installed TLED products and controls2] Were the controls installed before, at the same time as, or after the TLEDs were installed?
C3
[For participants who installed TLED products and controls2] Are participants satisfied with how the controls are operating, or are there issues to be addressed?
C4, C4A
Do participants intend to install new or additional controls for their TLEDs within the next 12 months? If so, what type(s)?
C5, C5A
Decision-making3
Was interview participant involved in decision to install the rebated TLEDs?
D1
Did participant consider other TLED types in addition to the rebated type(s)?
D2, D2A
What motivated participant to install the specific type(s) of rebated TLEDs (A, B, C)?
D3A, D3B, D3C
1 Installation type and customer type are tracking data variables, and the verification interview will determine space usage. DNV GL will compare interview results regarding satisfaction by each of these variables. 2 Note that “controls” in this context refers to any control type other than an on/off switch. 3 Note that research questions regarding decision-making are not in the original scope of work for this study, but we added questions on this topic for instances in which the interview respondent is the decision-maker—i.e., we will not attempt to find a separate contact to address these questions.
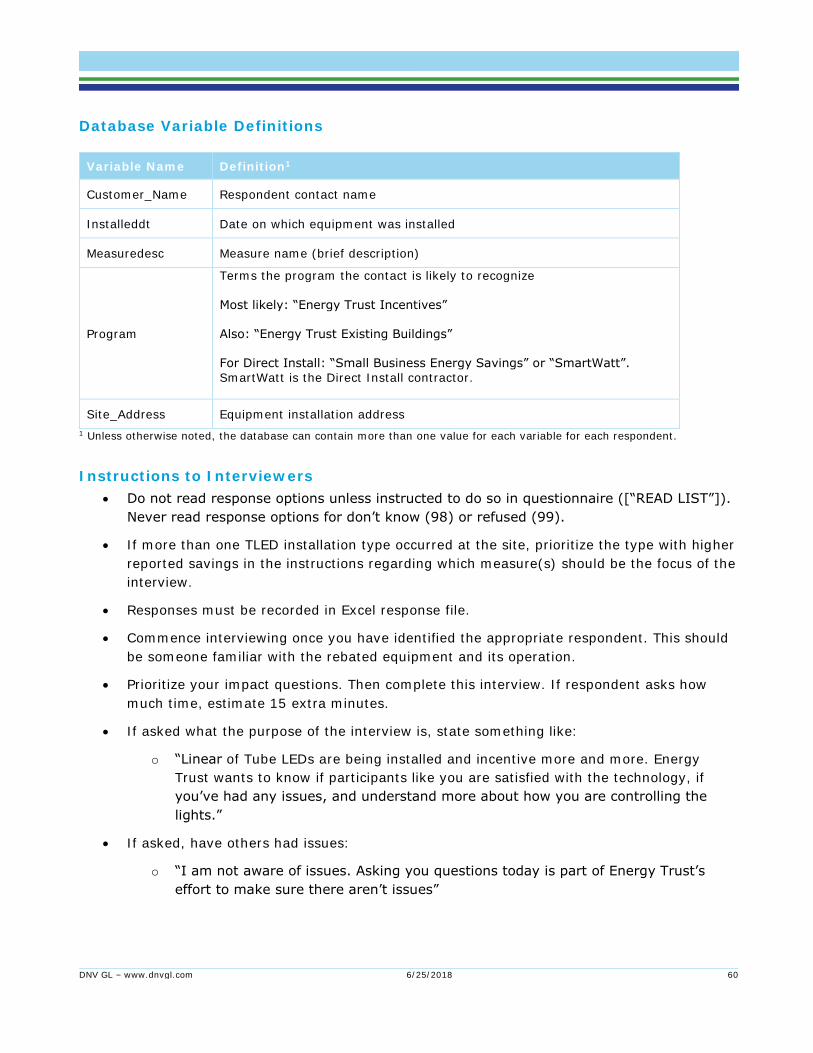
DNV GL – www.dnvgl.com 6/25/2018 60
Database Variable Definitions
Variable Name Definition1
Customer_Name Respondent contact name
Installeddt Date on which equipment was installed
Measuredesc Measure name (brief description)
Program
Terms the program the contact is likely to recognize
Most likely: “Energy Trust Incentives”
Also: “Energy Trust Existing Buildings” For Direct Install: “Small Business Energy Savings” or “SmartWatt”.
SmartWatt is the Direct Install contractor.
Site_Address Equipment installation address
1 Unless otherwise noted, the database can contain more than one value for each variable for each respondent.
Instructions to Interviewers
• Do not read response options unless instructed to do so in questionnaire ([“READ LIST”]).
Never read response options for don’t know (98) or refused (99).
• If more than one TLED installation type occurred at the site, prioritize the type with higher
reported savings in the instructions regarding which measure(s) should be the focus of the
interview.
• Responses must be recorded in Excel response file.
• Commence interviewing once you have identified the appropriate respondent. This should
be someone familiar with the rebated equipment and its operation.
• Prioritize your impact questions. Then complete this interview. If respondent asks how
much time, estimate 15 extra minutes.
• If asked what the purpose of the interview is, state something like:
o “Linear of Tube LEDs are being installed and incentive more and more. Energy
Trust wants to know if participants like you are satisfied with the technology, if
you’ve had any issues, and understand more about how you are controlling the
lights.”
• If asked, have others had issues:
o “I am not aware of issues. Asking you questions today is part of Energy Trust’s
effort to make sure there aren’t issues”

DNV GL – www.dnvgl.com 6/25/2018 61
Technology Information for Interviewers
Name Definition
TLEDS
Drivers
Tubular (or Troffer) Light Emitting Diode (TLED)s
A “driver” is used when the FL lamp and ballast are removed (type C lamps)
TLED Type A lamp
Retrofitted to existing fixtures. These types of tubes replace T12, T8, and T5 lamps and operate using an internal driver that is powered directly from an existing linear fluorescent ballast. Type A installations do not require any modifications to the existing fixture and many people refer to this type of lamp as ‘plug-and-play.’ Type A tubes have reduced efficiency due to power loss from the existing ballast and limited dimming and
controllability capabilities.
TLED Type B lamp
Wired directly to the line voltage. These types of tubes operate using an internal driver and are powered directly from the main voltage that is supplying the fixture. The existing fixture must be modified for these tubes, fixture, which has led to calling this type of lamp as ‘ballast bypass.’ These lamps require
installation by a certified electrician and have limited dimming and controllability capabilities.
TLED
Type C
lamp
Supplied with dedicated LED drivers. These types of tubes operate using a remote driver, which replaces the existing fixture’s ballast. These types of tubes require modifying the existing fixture, but the power being directed to the sockets are low-voltage, not AC Mains. Type C tubes are more efficient than
the other types.
Links
for
more
info:
http://cltc.ucdavis.edu/sites/default/files/files/publication/LED_Retrofit_Options_Linear_Fluore
scent_FINAL.pdf
https://www.energytrust.org/wp-content/uploads/2017/05/EB_FS_TLED.pdf
http://www.lutron.com/TechnicalDocumentLibrary/TLED_Lighting_Scenarios_for_Retro_App_
Whitepaper.pdf
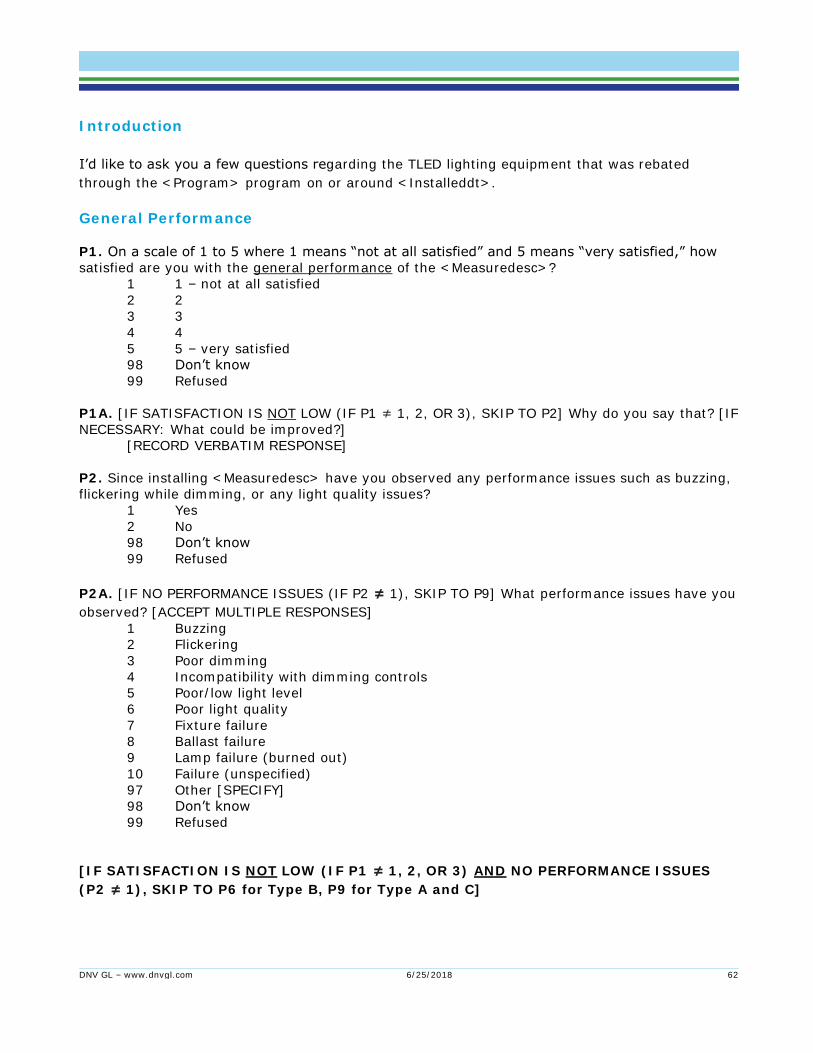
DNV GL – www.dnvgl.com 6/25/2018 62
Introduction
I’d like to ask you a few questions regarding the TLED lighting equipment that was rebated
through the <Program> program on or around <Installeddt>.
General Performance
P1. On a scale of 1 to 5 where 1 means “not at all satisfied” and 5 means “very satisfied,” how
satisfied are you with the general performance of the <Measuredesc>?
1 1 – not at all satisfied
2 2
3 3
4 4
5 5 – very satisfied
98 Don’t know
99 Refused
P1A. [IF SATISFACTION IS NOT LOW (IF P1 ≠ 1, 2, OR 3), SKIP TO P2] Why do you say that? [IF
NECESSARY: What could be improved?]
[RECORD VERBATIM RESPONSE]
P2. Since installing <Measuredesc> have you observed any performance issues such as buzzing,
flickering while dimming, or any light quality issues?
1 Yes
2 No
98 Don’t know
99 Refused
P2A. [IF NO PERFORMANCE ISSUES (IF P2 ≠ 1), SKIP TO P9] What performance issues have you
observed? [ACCEPT MULTIPLE RESPONSES]
1 Buzzing
2 Flickering
3 Poor dimming
4 Incompatibility with dimming controls
5 Poor/low light level
6 Poor light quality
7 Fixture failure
8 Ballast failure
9 Lamp failure (burned out)
10 Failure (unspecified)
97 Other [SPECIFY]
98 Don’t know
99 Refused
[IF SATISFACTION IS NOT LOW (IF P1 ≠ 1, 2, OR 3) AND NO PERFORMANCE ISSUES
(P2 ≠ 1), SKIP TO P6 for Type B, P9 for Type A and C]

DNV GL – www.dnvgl.com 6/25/2018 63
[IF <Measuredesc> ≠ TYPE A FIXTURE, SKIP TO P6 for Type B, P9 for Type A and C]]
Type A Questions Only
P3. Did an electrician or contractor inspect any of the ballasts for any of the rebated TLED
fixtures where your satisfaction was low or you experienced poor performance?
1 Yes
2 No
98 Don’t know
99 Refused
P4. Did an electrician or contractor replace any of the ballasts for any of the rebated TLED
fixtures where your satisfaction was low or you experienced poor performance?
1 Yes
2 No
98 Don’t know
99 Refused
P4A. [IF ELECTRICIAN OR CONTRACTOR DID NOT REPLACE BALLASTS (P4 ≠ 1) SKIP TO P5] Did
replacing the ballast(s) correct the performance issues?
1 Yes
2 No
98 Don’t know
99 Refused
P4B. [IF BALLAST REPLACEMENT FIXED THE ISSUE (P4A = 1), SKIP TO P5] What was the
problem after the electrician or contractor replaced the ballast(s)?
[RECORD VERBATIM RESPONSE]
P5. Did your electrician or contractor tell you anything regarding what to expect about ballast
performance?
1 Yes
2 No
98 Don’t know
99 Refused
P5A. [IF ELECTRICIAN OR CONTRACTOR DID NOT SAY ANYTHING ABOUT BALLAST
PERFORMANCE (P5 ≠ 1) SKIP TO P5B] What did the electrician or contractor say about ballast
performance?
[RECORD VERBATIM RESPONSE]
P5B. [IF P5A RESPONSE MENTIONS EARLY FAILURE, SKIP TO P6] Did your electrician or
contractor tell you that the ballasts may fail before the lamps fail or burn out?
1 Yes
2 No
98 Don’t know
99 Refused
99 Refused
[IF <Measuredesc> ≠ TYPE B, SKIP TO P9]

DNV GL – www.dnvgl.com 6/25/2018 64
Type B Questions Only
P6. Did your electrician or contractor mention anything about safety when he or she installed the
rebated TLEDs? [IF NECESSARY, SPECIFY TYPE B TLED]
1 Yes
2 No
98 Don’t know
99 Refused
P6A. [IF ELECTRICIAN OR CONTRACTOR DID NOT MENTION SAFETY (P6 ≠ 1), SKIP TO P7] What
did your electrician or contractor mention about safety?
[RECORD VERBATIM RESPONSE]
P7. [IF P6A RESPONSE DOES NOT MENTION HIGH VOLTAGE WIRING] Did your electrician or
contractor mention the potential shock hazard that may exist with the type of rebated TLEDs you
installed? [IF NECESSARY, SPECIFY TYPE B TLED]
1 Yes
2 No
98 Don’t know
99 Refused
P8. Are there any safety labels on the rebated TLED fixtures?
1 Yes
2 No
98 Don’t know
If respondent is unaware of safety concerns, shock hazard, or does not have safety labels, notify Data
Collection Lead and Project Manager after the interview. Inform respondent that we will notify Energy Trust so they can follow up.
All Types Questions
P9. When the rebated <Measuredesc> were installed, did you change the quantity or placement
of the lighting fixtures?
1 Yes, changed quantity of fixtures
2 Yes, changed placement of fixtures
3 Yes, changed quantity and placement of fixtures
4 No
98 Don’t know
99 Refused
P10. [IF NO CHANGE TO QUANTITY/PLACEMENT (P9 ≠ 1, 2, or 3), SKIP TO R1] On a scale of 1
to 5 where 1 means “not at all satisfied” and 5 means “very satisfied,” how satisfied are you with
the overall design of your new lighting system?
1 1 – not at all satisfied
2 2
3 3
4 4
5 5 – very satisfied
98 Don’t know
99 Refused

DNV GL – www.dnvgl.com 6/25/2018 65
P10A. [IF SATISFACTION IS NOT LOW (P10 ≠ 1, 2, or 3), SKIP TO R1] Why do you say that? [IF
NECESSARY: What could be improved?]
[RECORD VERBATIM RESPONSE]
Since Installation, Removal and Replacement (All Types)
R1. Since installing the TLED lighting equipment, have you removed any of the rebated TLED
fixtures or bulbs?
1 Yes, removed bulbs
2 Yes, removed fixtures
3 Yes, removed fixtures and bulbs
4 No
98 Don’t know
99 Refused
R2. [IF DID NOT REMOVE ANY TLEDs (R1 ≠ 1, 2, OR 3), SKIP TO C1] In total, how many did you
remove?
[RECORD QUANTITY OF PROGRAM-DISCOUNTED FIXTURES]
[RECORD TOTAL QUANTITY OF PROGRAM-DISCOUNTED BULBS]
R3. In what month and year did you remove them?
[RECORD MONTH AND YEAR FOR FIXTURES]
[RECORD MONTH AND YEAR FOR BULBS]
R4A. [IF DID NOT REMOVE ANY FIXTURES (R1 ≠ 2 OR 3), SKIP TO R4B] Why did you remove
the rebated fixtures?
1 Flickering
2 Poor dimming
3 Incompatibility with dimming controls
4 Poor/low light level
5 Poor light quality
6 Fixture failure
7 Ballast failure
97 Other [SPECIFY]
98 Don’t know
99 Refused
R4B. [IF DID NOT REMOVE ANY BULBS (R1 ≠ 1 OR 3), SKIP TO R5] Why did you remove the
rebated bulbs?
0 Because I removed the fixtures
1 Flickering
2 Poor dimming
3 Incompatibility with dimming controls
4 Poor/low light level
5 Poor light quality
6 Fixture failure
7 Ballast failure
8 Lamp failure (burned out)

DNV GL – www.dnvgl.com 6/25/2018 66
97 Other [SPECIFY]
98 Don’t know
99 Refused
R5. Did you replace the rebated TLED lighting you removed?
1 Yes
2 No
98 Don’t know
99 Refused
R5a. [IF DID NOT REPLACE (R5 ≠ 1), SKIP TO C1] What type of lighting did you use to replace
the rebated TLEDs? [ACCEPT MULTIPLE RESPONSES]
1 New/different TLEDs
2 LEDs
3 Linear fluorescent
4 Compact fluorescent
5 Incandescent
6 Halogen
97 Other [SPECIFY]
98 Don’t know
99 Refused
Controls (All Types)
Next I would like to ask a few questions about the lighting controls you use for the for the TLED
fixtures in your facility. I’d like to talk about ALL the controls you have associated with TLEDs in
your facility, not just the rebated TLEDs.
C1. I’d like to read you a short list of control types. Can you tell me which of these you use to
control the TLED fixtures in your facility? If you’re not familiar with something I mention, it’s no
problem. [READ LIST]
1 On/off switch
2 Dimmer switch
3 Photosensor or photocell
4 Occupancy sensor
5 Daylighting controls
6 Energy Management System
7 Timer
97 Something else? [SPECIFY]
98 [DO NOT READ] Don’t know
99 [DO NOT READ] Refused
C2. [IF ONLY CONTROL IS ON/OFF SWITCH (C1 = 1 ONLY), SKIP TO C5] Did you receive
incentives for these TLED controls through <Program>?
1 Yes
2 No
98 Don’t know
99 Refused
C2A. [IF YES, D/K, or Refused, SKIP TO C3] Why did you not receive an incentive?
[RECORD VERBATIM RESPONSE]

DNV GL – www.dnvgl.com 6/25/2018 67
C3. Did you install the TLED controls before, at the same time as, or after you installed the
rebated TLEDs?
1 Before
2 Same time
3 After
98 Don’t know
99 Refused
C4. On a scale of 1 to 5 where 1 means “not at all satisfied” and 5 means “very satisfied,” how
satisfied are you with the performance of your controls for the TLEDs?
1 1 – not at all satisfied
2 2
3 3
4 4
5 5 – very satisfied
98 Don’t know
99 Refused
C4A. [IF SATISFACTION IS NOT LOW (IF C4 ≠ 1, 2, OR 3), SKIP TO C5] Why do you say that?
[IF NECESSARY: What could be improved?]
[RECORD VERBATIM RESPONSE]
C5.
1 Yes
2 No
98 Don’t know
99 Refused
C5A. [IF NO PLANS TO INSTALL CONTROLS (IF C5 ≠ 1), SKIP TO D1] What type(s) of controls do
you plan to install [within the next 12 months to control your TLEDs]?
1 On/off switch
2 Dimmer switch
3 Photosensor or photocell
4 Occupancy sensor
5 Daylighting controls
6 Energy Management System
7 Timer
97 Other [SPECIFY]
98 Don’t know
99 Refused

DNV GL – www.dnvgl.com 6/25/2018 68
Decision-Making
D1. Did you have any role in the decision to install the rebated TLEDs?
1 Yes
2 No
98 Don’t know
99 Refused
[IF NO ROLE IN DECISION (IF D1 ≠ 1), SKIP TO D3A]
[IF INSTALLED MULTIPLE TYPES OF TLEDS (TYPE A, B, C), SKIP TO D3A]
D2. Did you consider any other types of TLEDs in addition to the rebated TLEDs?
1 Yes
2 No
98 Don’t know
99 Refused
D2A. [IF DID NOT CONSIDER OTHERS (IF D1 ≠ 1), SKIP TO D3A] What type or types did you
consider? [ACCEPT MULTIPLE RESPONSES]
1 Type A
2 Type B
3 Type C
97 Other [SPECIFY]
98 Don’t know
99 Refused
D3A. [IF <Measuredesc> ≠ TYPE A, SKIP TO D3B] What motivated you to select Type A TLEDs?
[ACCEPT MULTIPLE RESPONSES]
1 Recommendation from electrician or contractor/electrician or contractor
2 Low first cost
3 Low lifetime/lifecycle cost
4 Ease to install
5 Building limitations/requirements
6 Compatibility with existing light fixtures
7 Compatibility with existing lighting controls
97 Other [SPECIFY]
98 Don’t know
99 Refused
D3B. [IF <Measuredesc> ≠ TYPE B, SKIP TO D3C] What motivated you to select Type B TLEDs?
[ACCEPT MULTIPLE RESPONSES]
1 Recommendation from electrician or contractor/electrician or contractor
2 Low first cost
3 Low lifetime/lifecycle cost
4 Ease to install
5 Building limitations/requirements
6 Compatibility with existing light fixtures
7 Compatibility with existing lighting controls
97 Other [SPECIFY]
98 Don’t know
99 Refused

DNV GL – www.dnvgl.com 6/25/2018 69
D3C. [IF <Measuredesc> ≠ TYPE C, SKIP TO W1] What motivated you to select Type C TLEDs?
[ACCEPT MULTIPLE RESPONSES]
1 Recommendation from electrician or contractor/electrician or contractor
2 Low first cost
3 Low lifetime/lifecycle cost
4 Ease to install
5 Building limitations/requirements
6 Compatibility with existing light fixtures
7 Compatibility with existing lighting controls
97 Other [SPECIFY]
98 Don’t know
99 Refused
Wrap-Up
W1. On a scale of 1 to 5 where 1 means “not at all likely” and 5 means “very likely,” how likely
would you be to recommend TLEDs like the ones you received rebates for to another business
owner?
1 1 – not at all likely
2 2
3 3
4 4
5 5 – very likely
98 Don’t know
99 Refused
W1A. [IF LIKELIHOOD IS NOT LOW (IF W1 ≠ 1, 2, OR 3), SKIP TO W2] Why do you say that? [IF
NECESSARY: Why would you be unlikely to recommend TLEDs to another business owner?]
[RECORD VERBATIM RESPONSE]
W2. Energy Trust is currently working on new web based tools to help businesses in the state.
Can Energy Trust contact you directly to get feedback on the tools they are developing?
1 Yes
2 No
98 Don’t know
99 Refused
Those are all the question I have for you today. Thank you for your time.
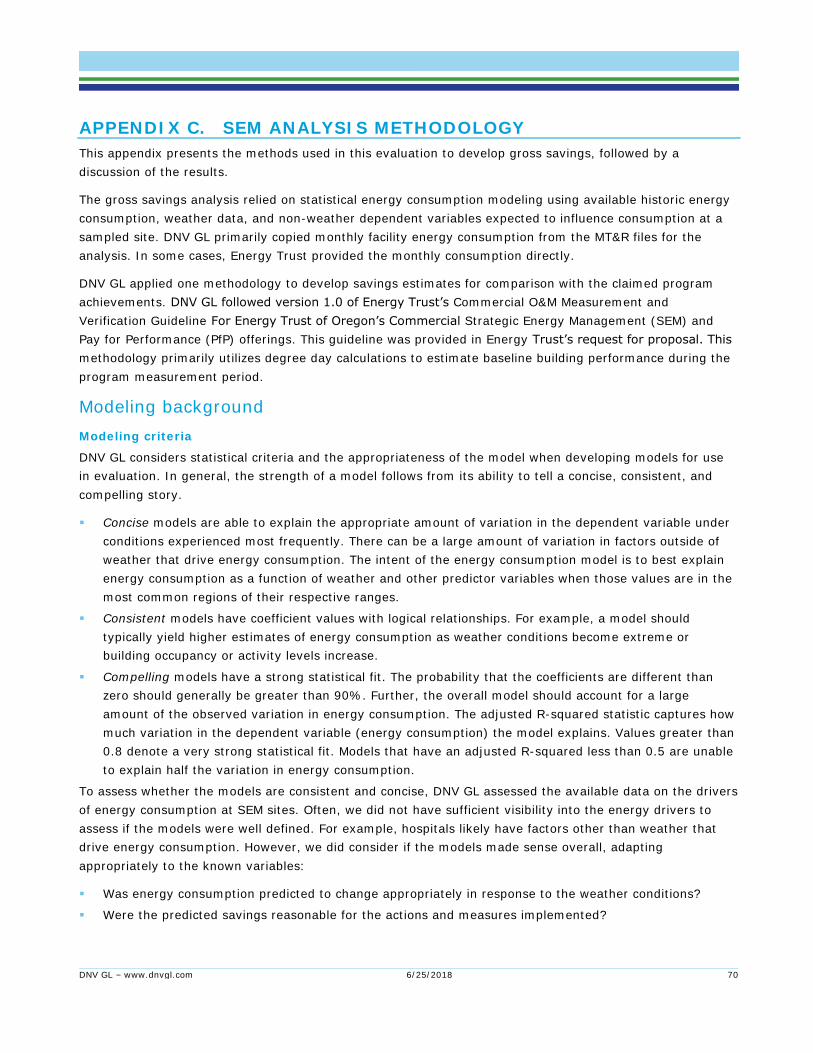
DNV GL – www.dnvgl.com 6/25/2018 70
APPENDIX C. SEM ANALYSIS METHODOLOGY
This appendix presents the methods used in this evaluation to develop gross savings, followed by a
discussion of the results.
The gross savings analysis relied on statistical energy consumption modeling using available historic energy
consumption, weather data, and non-weather dependent variables expected to influence consumption at a
sampled site. DNV GL primarily copied monthly facility energy consumption from the MT&R files for the
analysis. In some cases, Energy Trust provided the monthly consumption directly.
DNV GL applied one methodology to develop savings estimates for comparison with the claimed program
achievements. DNV GL followed version 1.0 of Energy Trust’s Commercial O&M Measurement and
Verification Guideline For Energy Trust of Oregon’s Commercial Strategic Energy Management (SEM) and
Pay for Performance (PfP) offerings. This guideline was provided in Energy Trust’s request for proposal. This
methodology primarily utilizes degree day calculations to estimate baseline building performance during the
program measurement period.
Modeling background
Modeling criteria
DNV GL considers statistical criteria and the appropriateness of the model when developing models for use
in evaluation. In general, the strength of a model follows from its ability to tell a concise, consistent, and
compelling story.
▪ Concise models are able to explain the appropriate amount of variation in the dependent variable under
conditions experienced most frequently. There can be a large amount of variation in factors outside of
weather that drive energy consumption. The intent of the energy consumption model is to best explain
energy consumption as a function of weather and other predictor variables when those values are in the
most common regions of their respective ranges.
▪ Consistent models have coefficient values with logical relationships. For example, a model should
typically yield higher estimates of energy consumption as weather conditions become extreme or
building occupancy or activity levels increase.
▪ Compelling models have a strong statistical fit. The probability that the coefficients are different than
zero should generally be greater than 90%. Further, the overall model should account for a large
amount of the observed variation in energy consumption. The adjusted R-squared statistic captures how
much variation in the dependent variable (energy consumption) the model explains. Values greater than
0.8 denote a very strong statistical fit. Models that have an adjusted R-squared less than 0.5 are unable
to explain half the variation in energy consumption.
To assess whether the models are consistent and concise, DNV GL assessed the available data on the drivers
of energy consumption at SEM sites. Often, we did not have sufficient visibility into the energy drivers to
assess if the models were well defined. For example, hospitals likely have factors other than weather that
drive energy consumption. However, we did consider if the models made sense overall, adapting
appropriately to the known variables:
▪ Was energy consumption predicted to change appropriately in response to the weather conditions?
▪ Were the predicted savings reasonable for the actions and measures implemented?
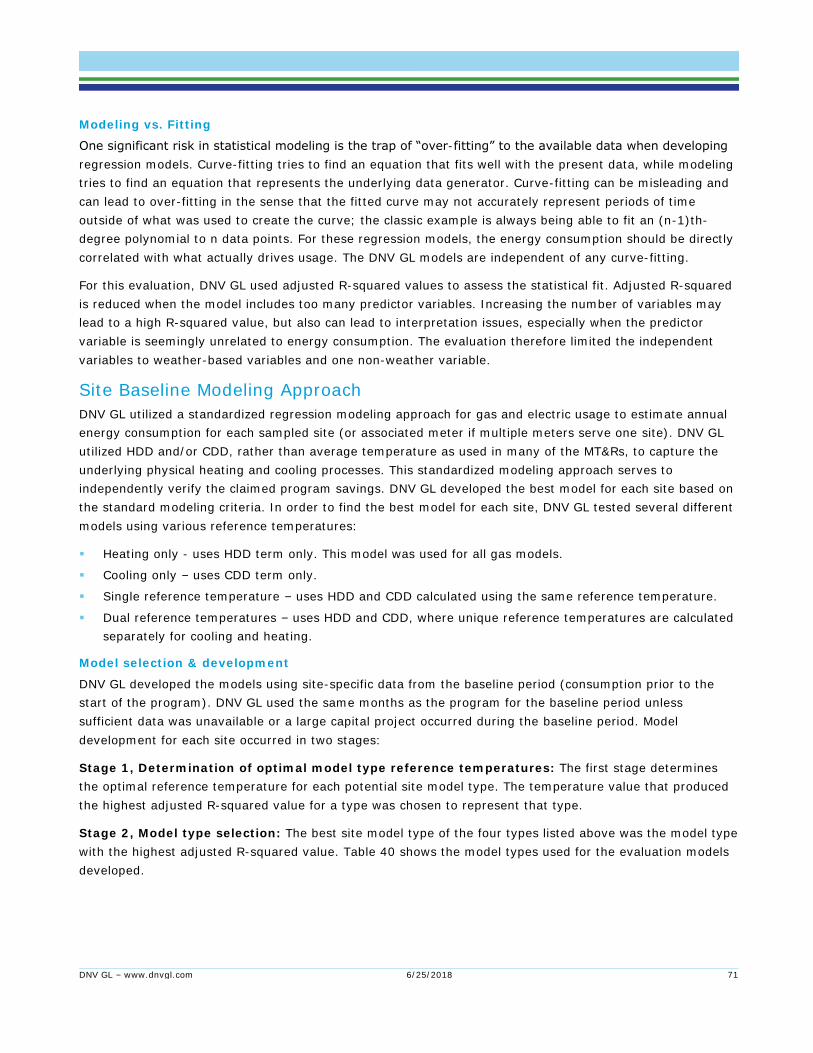
DNV GL – www.dnvgl.com 6/25/2018 71
Modeling vs. Fitting
One significant risk in statistical modeling is the trap of “over-fitting” to the available data when developing
regression models. Curve-fitting tries to find an equation that fits well with the present data, while modeling
tries to find an equation that represents the underlying data generator. Curve-fitting can be misleading and
can lead to over-fitting in the sense that the fitted curve may not accurately represent periods of time
outside of what was used to create the curve; the classic example is always being able to fit an (n-1)th-
degree polynomial to n data points. For these regression models, the energy consumption should be directly
correlated with what actually drives usage. The DNV GL models are independent of any curve-fitting.
For this evaluation, DNV GL used adjusted R-squared values to assess the statistical fit. Adjusted R-squared
is reduced when the model includes too many predictor variables. Increasing the number of variables may
lead to a high R-squared value, but also can lead to interpretation issues, especially when the predictor
variable is seemingly unrelated to energy consumption. The evaluation therefore limited the independent
variables to weather-based variables and one non-weather variable.
Site Baseline Modeling Approach
DNV GL utilized a standardized regression modeling approach for gas and electric usage to estimate annual
energy consumption for each sampled site (or associated meter if multiple meters serve one site). DNV GL
utilized HDD and/or CDD, rather than average temperature as used in many of the MT&Rs, to capture the
underlying physical heating and cooling processes. This standardized modeling approach serves to
independently verify the claimed program savings. DNV GL developed the best model for each site based on
the standard modeling criteria. In order to find the best model for each site, DNV GL tested several different
models using various reference temperatures:
▪ Heating only - uses HDD term only. This model was used for all gas models.
▪ Cooling only – uses CDD term only.
▪ Single reference temperature – uses HDD and CDD calculated using the same reference temperature.
▪ Dual reference temperatures – uses HDD and CDD, where unique reference temperatures are calculated
separately for cooling and heating.
Model selection & development
DNV GL developed the models using site-specific data from the baseline period (consumption prior to the
start of the program). DNV GL used the same months as the program for the baseline period unless
sufficient data was unavailable or a large capital project occurred during the baseline period. Model
development for each site occurred in two stages:
Stage 1, Determination of optimal model type reference temperatures: The first stage determines
the optimal reference temperature for each potential site model type. The temperature value that produced
the highest adjusted R-squared value for a type was chosen to represent that type.
Stage 2, Model type selection: The best site model type of the four types listed above was the model type
with the highest adjusted R-squared value. Table 40 shows the model types used for the evaluation models
developed.

DNV GL – www.dnvgl.com 6/25/2018 72
Table 40: Selected evaluation model types
Fuel Temperature Response Model Type Model
Count
Electric CDD Only 10
Electric CDD & HDD, Single Reference Temperature 17
Electric CDD & HDD, Dual Reference Temperature 2
Electric HDD Only 8
Electric Subtotal
Gas HDD Only 30
All Total
Monthly Residuals
Energy savings for each month during the program are estimated as the difference between the modeled
baseline energy and the actual energy consumption. This is referred to as the “monthly residual”. This value
is an estimate of the energy use avoided during the month due to all changes at the site. If the project
installed a capital project after the baseline period, then any savings due to the capital project are included
in the monthly residual.
Program Year Savings
This section discusses how incremental program year savings are determined from monthly residuals.
Program Year Assignment
Total program year energy savings are based on the sum of monthly residuals during the program year.
Prior to 2016, the SEM program would often estimate annual first-year savings from a measurement period
less than 12 months. The second-year energy savings (or first continuation year) would then “true-up”
savings by measuring 12-months starting from the end of the previous measurement period. DNV GL
created a program year assignment schedule to determine which program year each monthly residual
should be assigned to. The cohort schedule is based on the date of the participant’s original cohort kick-off
meeting. For each cohort analysis schedule, where applicable, the following logic was applied to generate
the schedule:
▪ SEM Year 1 – This is the first year for a participating facility and it contains 12 reads starting with the
month following the Cohort Kick-Off workshop.
▪ SEM Year 2 – This is the second year for a participating facility and starts after Year 1 and ends after
the following October. In most cases, this period contains less than 12 monthly reads.
▪ SEM Year 3+ or “Standard Year” – The Standard year contains the 12 reads from November –
October. Every year except Year 1 and Year 2 is on the Standard Year schedule.
The standard eight analysis schedules are shown in Table 34 at the end of this appendix. If participant
enrolled additional sites in the program after the date of the kick-off meeting, the additional sites are
assigned to a later cohort analysis schedule based on their enrollment date. The assignments are selected to
most closely aligned with their program participation and ensure the kick-off meeting occurred after the
facility initiated program participation. Table 41 shows the cohort to which the additional sites were typically
assigned, based on the participant’s original cohort.

DNV GL – www.dnvgl.com 6/25/2018 73
Table 41: Program year assignment schedule for sites added after kick-off meeting
Original Participant Cohort
Cohort for program year assignment
1 2
2 3
3 5
4 5
5 7
6 7
Five sampled facilities have baseline and measurement periods that do not fit well into any of the standard
eight analysis schedules. These sample points are assessed using schedules specific to their program
involvement.
Program year capital project savings
Individual capital measures associated with a sampled facility and fuel combination installed during the
baseline or program year periods are included in this analysis. Concurrent capital project measure savings
are accounted for by prorating the annual savings value per the measure installation date and cohort
analysis schedule. For the program year under which the measure was initially installed, the measure
savings are prorated by the number of days between the measure installation date and the end date for that
program year, relative to 365 days for the full annual savings. For subsequent program years, the measure
savings are prorated based on the number of days between the program year start and end dates, relative
to 365 days for the full annual savings. Individual capital measure savings are then aggregated together for
each facility to produce facility-level capital measures savings by program year and fuel type.
▪ If the capital project occurred during PY15 or PY16, then DNV GL independently estimated an evaluated
annual savings for the project and subtracted the prorated savings from the modeled SEM savings.
Program year SEM savings
Capital measure saving values are subtracted from the program year summation of monthly model residual
savings values to arrive at the total SEM program savings achieved by program year and fuel type. Following
the program’s guidelines, incremental savings are calculated as any SEM program savings that are greater
than the SEM program savings claimed in previous years of program participation.
Savings calculation summary
The following is a summary of the steps taken to estimate evaluated program year SEM savings:
1. Monthly Residuals: DNV GL calculated meter-level monthly energy savings as the difference between the
estimated baseline consumption (using the regression model) and actual meter consumption. All
calculations used monthly utility meter reads and daily weather data aggregated to each utility meter
read period.
2. Program Year Assignment: DNV GL assigned each monthly residual to a program year based on
schedules created for this evaluation.
3. Total Program Year Savings: DNV GL calculated the total savings achieved at each site by program year
as the sum of monthly residuals assigned to each program year.

DNV GL – www.dnvgl.com 6/25/2018 74
4. Program Year Capital Project Savings: DNV GL calculated program year capital savings based on the
evaluation’s estimate of annual capital project savings and the number of days in the assigned program
year that the measure was installed.
5. Total Program Year SEM Savings: DNV GL calculated the total SEM savings achieved in a program year
as the difference between the Total Program Year Savings and the Program Year Capital Project Savings.
6. Incremental Program Year SEM Savings: DNV GL calculated Incremental Program Year SEM Savings as
the difference between the Total Program Year SEM Savings for the program year and the maximum
Total Program Year SEM Savings estimated for a previous program year.
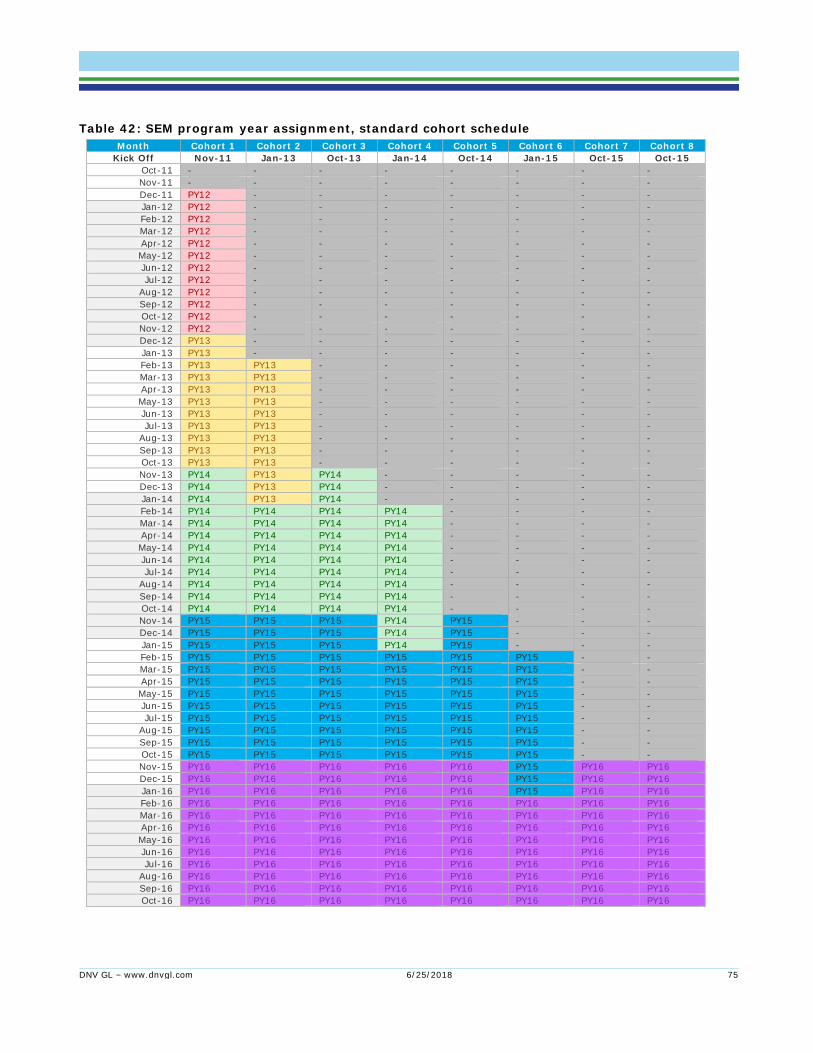
DNV GL – www.dnvgl.com 6/25/2018 75
Table 42: SEM program year assignment, standard cohort schedule
Month Cohort 1 Cohort 2 Cohort 3 Cohort 4 Cohort 5 Cohort 6 Cohort 7 Cohort 8
Kick Off Nov-11 Jan-13 Oct-13 Jan-14 Oct-14 Jan-15 Oct-15 Oct-15
Oct-11 - - - - - - - -
Nov-11 - - - - - - - -
Dec-11 PY12 - - - - - - -
Jan-12 PY12 - - - - - - -
Feb-12 PY12 - - - - - - -
Mar-12 PY12 - - - - - - -
Apr-12 PY12 - - - - - - -
May-12 PY12 - - - - - - -
Jun-12 PY12 - - - - - - -
Jul-12 PY12 - - - - - - -
Aug-12 PY12 - - - - - - -
Sep-12 PY12 - - - - - - -
Oct-12 PY12 - - - - - - -
Nov-12 PY12 - - - - - - -
Dec-12 PY13 - - - - - - -
Jan-13 PY13 - - - - - - -
Feb-13 PY13 PY13 - - - - - -
Mar-13 PY13 PY13 - - - - - -
Apr-13 PY13 PY13 - - - - - -
May-13 PY13 PY13 - - - - - -
Jun-13 PY13 PY13 - - - - - -
Jul-13 PY13 PY13 - - - - - -
Aug-13 PY13 PY13 - - - - - -
Sep-13 PY13 PY13 - - - - - -
Oct-13 PY13 PY13 - - - - - -
Nov-13 PY14 PY13 PY14 - - - - -
Dec-13 PY14 PY13 PY14 - - - - -
Jan-14 PY14 PY13 PY14 - - - - -
Feb-14 PY14 PY14 PY14 PY14 - - - -
Mar-14 PY14 PY14 PY14 PY14 - - - -
Apr-14 PY14 PY14 PY14 PY14 - - - -
May-14 PY14 PY14 PY14 PY14 - - - -
Jun-14 PY14 PY14 PY14 PY14 - - - -
Jul-14 PY14 PY14 PY14 PY14 - - - -
Aug-14 PY14 PY14 PY14 PY14 - - - -
Sep-14 PY14 PY14 PY14 PY14 - - - -
Oct-14 PY14 PY14 PY14 PY14 - - - -
Nov-14 PY15 PY15 PY15 PY14 PY15 - - -
Dec-14 PY15 PY15 PY15 PY14 PY15 - - -
Jan-15 PY15 PY15 PY15 PY14 PY15 - - -
Feb-15 PY15 PY15 PY15 PY15 PY15 PY15 - -
Mar-15 PY15 PY15 PY15 PY15 PY15 PY15 - -
Apr-15 PY15 PY15 PY15 PY15 PY15 PY15 - -
May-15 PY15 PY15 PY15 PY15 PY15 PY15 - -
Jun-15 PY15 PY15 PY15 PY15 PY15 PY15 - -
Jul-15 PY15 PY15 PY15 PY15 PY15 PY15 - -
Aug-15 PY15 PY15 PY15 PY15 PY15 PY15 - -
Sep-15 PY15 PY15 PY15 PY15 PY15 PY15 - -
Oct-15 PY15 PY15 PY15 PY15 PY15 PY15 - -
Nov-15 PY16 PY16 PY16 PY16 PY16 PY15 PY16 PY16
Dec-15 PY16 PY16 PY16 PY16 PY16 PY15 PY16 PY16
Jan-16 PY16 PY16 PY16 PY16 PY16 PY15 PY16 PY16
Feb-16 PY16 PY16 PY16 PY16 PY16 PY16 PY16 PY16
Mar-16 PY16 PY16 PY16 PY16 PY16 PY16 PY16 PY16
Apr-16 PY16 PY16 PY16 PY16 PY16 PY16 PY16 PY16
May-16 PY16 PY16 PY16 PY16 PY16 PY16 PY16 PY16
Jun-16 PY16 PY16 PY16 PY16 PY16 PY16 PY16 PY16
Jul-16 PY16 PY16 PY16 PY16 PY16 PY16 PY16 PY16
Aug-16 PY16 PY16 PY16 PY16 PY16 PY16 PY16 PY16
Sep-16 PY16 PY16 PY16 PY16 PY16 PY16 PY16 PY16
Oct-16 PY16 PY16 PY16 PY16 PY16 PY16 PY16 PY16

DNV GL – www.dnvgl.com 6/25/2018 76
APPENDIX D. CUSTOM MEASURE RESULTS
This appendix provides summaries of the custom track evaluation results by measure category. Realization
rates shown are unweighted simple averages of unique measure results. DNV GL provided measure specific
results to Energy Trust separately.
Table 43: Custom track evaluation results by measure Category
Custom Evaluation Category & Measure Description
# Evaluated
Electric Measures
# Evaluated
Gas Measures
Unweighted, Average
Electric GRR (%)
Unweighted, Average
Gas GRR (%)
Controls Custom Building Controls 33 21 81% 71%
Custom EMS 1 100%
EMS for BPTaC 2 100%
Controls Total 36 21 83% 71%
HVAC Custom Boiler 1 2 100% 98%
Custom Chillers 8 1 127% 109%
Custom Demand Control Ventilation 1 1 7% 269%
Custom Economizers 2 87%
Custom HVAC 17 7 83% 74%
HVAC Total 29 11 93% 99%
Miscellaneous - Custom Custom Other 7 5 81% 130%
Miscellaneous - Custom Total 7 5 81% 130%
Motor Custom VFD Pump 3 58%
Custom VFDs 12 1 69% 1,201%
Motor Total 15 1 67% 1,201%
Grand Total 87 38 83% 116%

DNV GL – www.dnvgl.com 6/25/2018 77
APPENDIX E. STANDARD MEASURE RESULTS
This appendix provides summaries of the standard track evaluation results by measure.
Measure specific approach: The initial pages contain tables summarizing the evaluation activities and documenting recommendations associated with specific measures sampled for evaluation. Project specific approach: A single table follows the measure specific tables for the project specific approach measures. These are measures with 4 or less measures sampled for evaluation.
DNV GL Measure Description Smart (Motion Sensor) Power Strips
Track: Entity Code Standard: POWERSTRIP
Measure Code(s) OCCPLUGSTRIPSI24, OCCPLUGSTRIP
The smart strip was a TrickleStar 183SS-US-8XX Motion Sensor
Power Strip. Key evaluation parameters were the installation and operation of the power strip plus the use of the motion sensing
feature of the equipment.
RR: Avg. (Min-Max) 38%
Sample Target 15
Survey Completes 13
Measure Information
Program Data Review: 2,673 units were claimed across 807 installations for 325,896 kWh in savings.
Measure quantities of 1 through 9 per project were most common, but 8 sites had quantities ranging from 15 to 80 per site. For two Department of Corrections locations (an office and a prison), a total of 60 smart
strips were left at the two sites.
Program Delivery: These devices were "left behind" with the customers along with a signed agreement
that they install them in office spaces.
Evaluation Summary
▪ The evaluation sample included 15 sites for verification: 10 were from the Standard track, and 5 sites
came from the DI-Lighting track25.
▪ Telephone interviews were completed for data collection: Findings were generally indefinite and
uncertain because it was difficult to remotely verify both deployment and use of the motion sensor
feature.
▪ Site-level realization rates were either 0% or 100%.
- Savings were zeroed out for 10 of 13 completed surveys because customers could not recall
receiving the smart strips, reported that they did not receive them, were unsure they were being
used, received but had not installed them, or they were received but not functional.
- For the customers who confirmed receipt and installation, only one indicated they were being used
as designed; one indicated the motion sensor function was not used, and one used it at home.
Evaluation Recommendations
Measure installation and use is highly uncertain. Savings are non-existent or unreliable. Specific recommendations include:
24 Only the OCCPLUGSTRIPSI measure code was sampled
25 Smart strips were also left behind at some Lighting track participant sites, and a sample of these was
drawn. The phone verification for the Lighting track sample was conducted as part of the Standard track evaluation effort.

DNV GL – www.dnvgl.com 6/25/2018 78
▪ Discontinue measure if savings is the primary reason for distribution.
▪ Do not claim savings for these devices.
▪ If distribution continues and savings are claimed:
- Only leave behind if at least one actual installation can be done (to demonstrate functionality).
- Do not make customers sign an agreement about how and where they will use the device. Signing
an agreement does not guarantee the smart strips will be installed, nor installed correctly.
- Do not provide large quantities without an installation verification plan in place.
- Complete additional research to determine the installation rate for this measure.
Adjustment to evaluation plan
DNV GL concluded that the power strip measure’s evaluated savings compared to claims is unique in the
program and should not represent the results of other non-sampled standard measures. We therefore made
the following adjustments.
▪ Created two strata for all power strips installed through the program, one in the Standard track and one
in Lighting. Power strips were originally sampled in:
- 2016LightingNon-TLEDDirect Install Non-TLEDElectricSize1
- 2015StandardNon Food EquipmentAllElectricSize1
- 2016StandardNon Food EquipmentAllElectricSize1
▪ The sample of power strips reviewed for this evaluation served as the sample for these new strata.
▪ DNV GL adjusted the weighting in the original Lighting and Standard track samples to account for the
change in sample. Power strips were selected in three strata. Standard: DNV GL combined the Size1
and Size2 strata in each year to create one stratum. Lighting: DNV GL re-weighted the
2016LightingNon-TLEDDirect Install Non-TLEDElectricSize1 stratum.
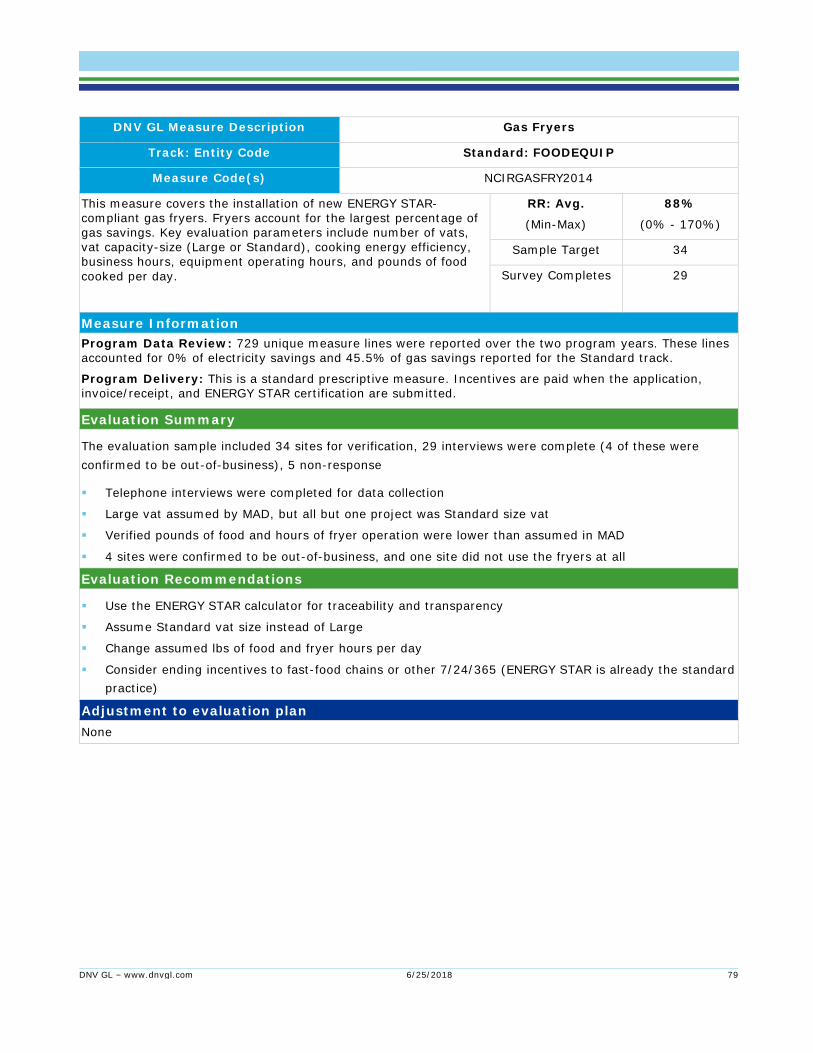
DNV GL – www.dnvgl.com 6/25/2018 79
DNV GL Measure Description Gas Fryers
Track: Entity Code Standard: FOODEQUIP
Measure Code(s) NCIRGASFRY2014
This measure covers the installation of new ENERGY STAR-compliant gas fryers. Fryers account for the largest percentage of gas savings. Key evaluation parameters include number of vats, vat capacity-size (Large or Standard), cooking energy efficiency, business hours, equipment operating hours, and pounds of food
cooked per day.
RR: Avg.
(Min-Max)
88%
(0% - 170%)
Sample Target 34
Survey Completes 29
Measure Information
Program Data Review: 729 unique measure lines were reported over the two program years. These lines accounted for 0% of electricity savings and 45.5% of gas savings reported for the Standard track.
Program Delivery: This is a standard prescriptive measure. Incentives are paid when the application, invoice/receipt, and ENERGY STAR certification are submitted.
Evaluation Summary
The evaluation sample included 34 sites for verification, 29 interviews were complete (4 of these were
confirmed to be out-of-business), 5 non-response
▪ Telephone interviews were completed for data collection
▪ Large vat assumed by MAD, but all but one project was Standard size vat
▪ Verified pounds of food and hours of fryer operation were lower than assumed in MAD
▪ 4 sites were confirmed to be out-of-business, and one site did not use the fryers at all
Evaluation Recommendations
▪ Use the ENERGY STAR calculator for traceability and transparency
▪ Assume Standard vat size instead of Large
▪ Change assumed lbs of food and fryer hours per day
▪ Consider ending incentives to fast-food chains or other 7/24/365 (ENERGY STAR is already the standard
practice)
Adjustment to evaluation plan
None

DNV GL – www.dnvgl.com 6/25/2018 80
DNV GL Measure Description Dishwashers
Track: Entity Code Standard: FOODEQUIP
Measure Code(s) UCHITEMPELE, STDRUPLOTEMPELE, UCHITEMPGAS, STCONHITEMPGPE, STDRUPLOTEMPGAS, STDRUPHITEMPELE
This measure covers the installation of dishwashers in restaurant spaces. Key evaluation parameters include ENERGY STAR dishwasher type (high temp/low temp, Under Counter, Stationary Single Tank Door, Single Tank Conveyor, or Multi-Tank Conveyor),
Racks washed per day, building hot water fuel type, annual operating days and operating hours.
RR: Avg.
(Min-Max)
23% (elec.)
19% (gas)
(0% - 132%, elec.)
(0% - 13%, gas)
Sample Target 16
Survey Completes 13
Measure Information
Program Data Review: 133 unique measure lines were reported over the two program years. These lines accounted for 3.88% of electricity savings and 2.01% of gas savings reported for the standard track.
Program Delivery: Standard
Evaluation Summary
The evaluation sample included 16 sites for verification. 13 interviews were complete, 3 sites were non-
responsive.
Telephone interviews were completed for data collection. Measure Information:
▪ Low RR mostly due to overestimation of racks washed per day. Some lower rates are due to actual
operating hours varying from assumed hours.
▪ MAD assumes a constant number of racks washed per day based on dishwasher type, and appears to
assume high-activity restaurants.
Evaluation Recommendations
Use the ENERGY STAR calculator for traceability and transparency.
Perform additional studies to update the assumed number of racks washed per day and hours per day of
operation.
Adjustment to evaluation plan
None

DNV GL – www.dnvgl.com 6/25/2018 81
DNV GL Measure Description Convection Oven (Electric and Gas)
Track: Entity Code Standard: FOODEQUIP
Measure Code(s) NCCONVOVEN, ELECONVOVFULL
This measure covers convection ovens in restaurants and other commercial/institutional spaces. Full-size convection ovens can be either single deck or double deck. Key evaluation parameters include oven production capacity, cooking energy efficiency, idle energy rate, business/operating hours and average pounds of food
cooked per day.
RR: Avg.
(Min-Max)
69% (Elec. Only 1 site)
70% (Gas)
(13% - 144%)
Sample Target 9
Survey Completes 7
Measure Information
Program Data Review: 148 unique measure lines were reported over the two program years. These lines accounted for 0.73 % of electricity savings and 3.17 % of gas savings reported for the standard track.
Program Delivery: Standard
Evaluation Summary
The evaluation sample included 9 sites for verification. 7 interviews were completed; there were 2 non-
responsive sites.
Telephone interviews were completed for data collection. Measure Information:
▪ Low RR due to actual operating hours which vary considerably by business type
▪ MAD appears to assume high-activity/constant operation restaurants
▪ Half of verified sites were non-restaurants (community center, hospital, caterer) with lower or more
sporadic operating hours
▪ MAD did not use the ENERGY STAR calculator but used the calculation approach
Evaluation Recommendations
▪ Use the ENERGY STAR calculator for traceability and transparency.
▪ Add a low-use measure to address non-restaurant business types.
Perform additional studies to update the assumed number of pounds of food cooked per day and hours per
day of operation.
Adjustment to evaluation plan
None
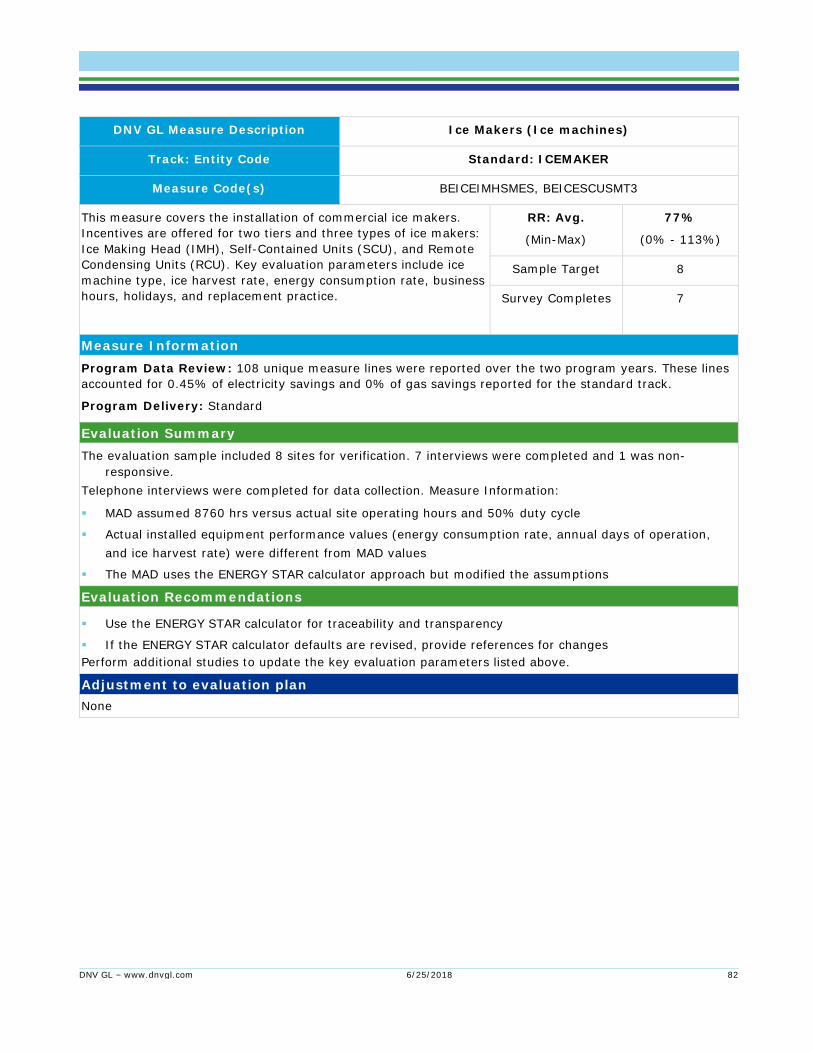
DNV GL – www.dnvgl.com 6/25/2018 82
DNV GL Measure Description Ice Makers (Ice machines)
Track: Entity Code Standard: ICEMAKER
Measure Code(s) BEICEIMHSMES, BEICESCUSMT3
This measure covers the installation of commercial ice makers.
Incentives are offered for two tiers and three types of ice makers:
Ice Making Head (IMH), Self-Contained Units (SCU), and Remote
Condensing Units (RCU). Key evaluation parameters include ice
machine type, ice harvest rate, energy consumption rate, business
hours, holidays, and replacement practice.
RR: Avg.
(Min-Max)
77%
(0% - 113%)
Sample Target 8
Survey Completes 7
Measure Information
Program Data Review: 108 unique measure lines were reported over the two program years. These lines
accounted for 0.45% of electricity savings and 0% of gas savings reported for the standard track.
Program Delivery: Standard
Evaluation Summary
The evaluation sample included 8 sites for verification. 7 interviews were completed and 1 was non-
responsive.
Telephone interviews were completed for data collection. Measure Information:
▪ MAD assumed 8760 hrs versus actual site operating hours and 50% duty cycle
▪ Actual installed equipment performance values (energy consumption rate, annual days of operation,
and ice harvest rate) were different from MAD values
▪ The MAD uses the ENERGY STAR calculator approach but modified the assumptions
Evaluation Recommendations
▪ Use the ENERGY STAR calculator for traceability and transparency
▪ If the ENERGY STAR calculator defaults are revised, provide references for changes
Perform additional studies to update the key evaluation parameters listed above.
Adjustment to evaluation plan
None

DNV GL – www.dnvgl.com 6/25/2018 83
DNV GL Measure Description Space Heating Boilers & Controls
Track: Entity Code Standard: BOILER
Measure Code(s) GFBOIL2500, GFBOIL3002500, MODBOILBURN
This measure covers the installation of space heating boilers and
controls. These measures account for a large percent of HVAC measure gas savings. Three different measure codes were verified. Key evaluation parameters include boiler specifications, standard replacement practice, boiler end-uses, boiler mode during operation (condensing or others), and primary/backup information.
RR: Avg.
(Min-Max)
77%
(0% - 132%)
Sample Target 11
Survey Completes 9
Measure Information
Program Data Review: 47 unique measure lines were reported over the two program years. These lines accounted for 0% of electricity savings and 22% of gas savings reported for the standard track.
Program Delivery: Standard
Evaluation Summary
The evaluation sample included 11 sites for verification. 9 interviews were completed and 2 sites were non-
responsive.
Telephone interviews were completed for data collection. Measure Information:
▪ 0 savings at 1 site because the new unit replaced an existing condensing boiler
▪ One site had 132% RR due to update to 2015 MAD estimate
▪ Majority of sites had 2-3 boilers incentivized, many had 1 for backup
▪ 1 site reported “quantity” as 1 but should be total boiler capacity in kBtuh
- Unit basis for quantity is kBtu saved per kBtuh of boiler capacity
Evaluation Recommendations
▪ Identify quantity of incentivized boilers that will be used primarily for backup
▪ Add a field to the tracking data to capture the physical quantity of boilers
▪ Consider a way to adjust savings to account for backup boilers
▪ Consider researching the standard market practice for condensing boilers
Adjustment to evaluation plan
None
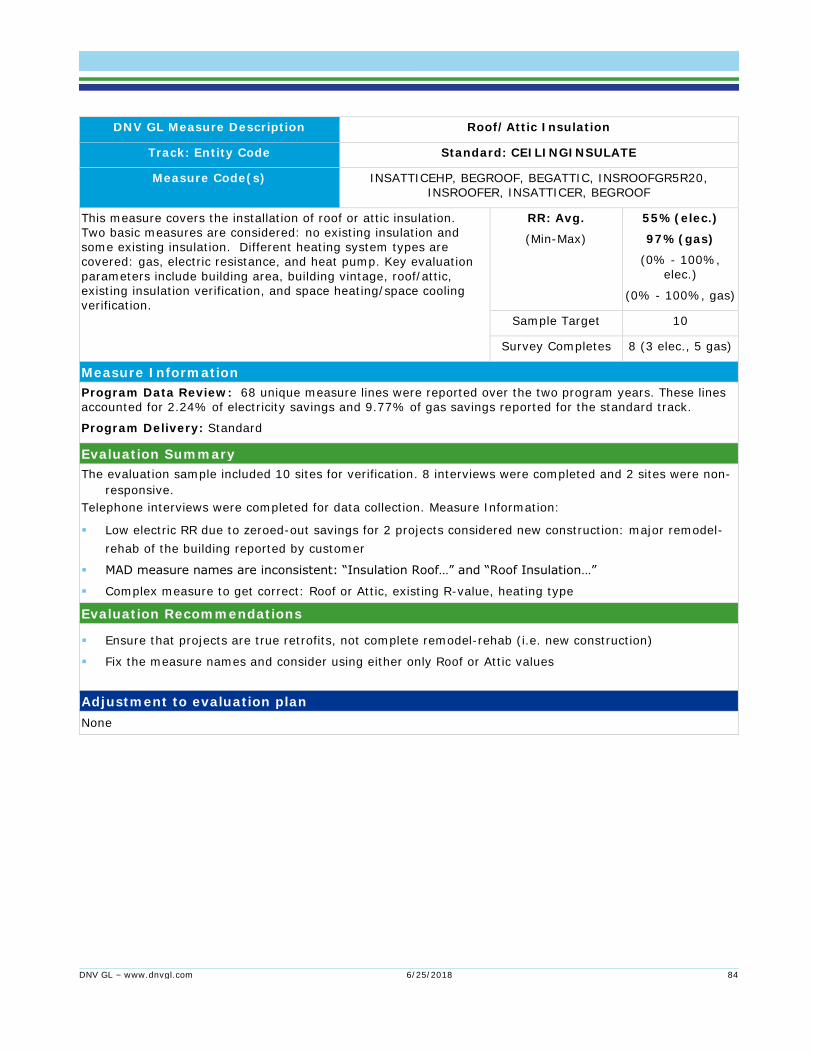
DNV GL – www.dnvgl.com 6/25/2018 84
DNV GL Measure Description Roof/Attic Insulation
Track: Entity Code Standard: CEILINGINSULATE
Measure Code(s) INSATTICEHP, BEGROOF, BEGATTIC, INSROOFGR5R20, INSROOFER, INSATTICER, BEGROOF
This measure covers the installation of roof or attic insulation. Two basic measures are considered: no existing insulation and some existing insulation. Different heating system types are covered: gas, electric resistance, and heat pump. Key evaluation
parameters include building area, building vintage, roof/attic, existing insulation verification, and space heating/space cooling verification.
RR: Avg.
(Min-Max)
55%(elec.)
97%(gas)
(0% - 100%, elec.)
(0% - 100%, gas)
Sample Target 10
Survey Completes 8 (3 elec., 5 gas)
Measure Information
Program Data Review: 68 unique measure lines were reported over the two program years. These lines accounted for 2.24% of electricity savings and 9.77% of gas savings reported for the standard track.
Program Delivery: Standard
Evaluation Summary
The evaluation sample included 10 sites for verification. 8 interviews were completed and 2 sites were non-
responsive.
Telephone interviews were completed for data collection. Measure Information:
▪ Low electric RR due to zeroed-out savings for 2 projects considered new construction: major remodel-
rehab of the building reported by customer
▪ MAD measure names are inconsistent: “Insulation Roof…” and “Roof Insulation…”
▪ Complex measure to get correct: Roof or Attic, existing R-value, heating type
Evaluation Recommendations
▪ Ensure that projects are true retrofits, not complete remodel-rehab (i.e. new construction)
▪ Fix the measure names and consider using either only Roof or Attic values
Adjustment to evaluation plan
None

DNV GL – www.dnvgl.com 6/25/2018 85
DNV GL Measure Description LED Case Lighting (Retrofit or New Case)
Track: Entity Code Standard: LIGHTING
Measure Code(s) LEDCLT84W, LEDCLT84W75W, LEDCLT124W, LEDCLTNEW4W, LEDCLT124W75W
This measure covers the retrofit of existing refrigerator cases to, or purchase of new refrigerated cases that have, LED case lighting. Key evaluation parameters include linear feet of casing, baseline fixture type/wattage, new fixture type/wattage, and installed
quantity.
RR: Avg.
(Min-Max)
75%
(41% - 100%)
Sample Target 10
Survey Completes 9
Measure Information
Program Data Review: 137 unique measure lines were reported over the two program years. These lines accounted for 12.19% of electricity savings and 0% of gas savings reported for the standard track.
Program Delivery: Standard
Evaluation Summary
The evaluation sample included 10 sites for verification. 9 interviews were completed and 1 was non-
responsive.
Telephone interviews were completed for data collection. Measure Information:
▪ Predominantly retrofit projects, but 3 projects were new cases
▪ Majority of projects verified as reported but with 2010 MAD savings
▪ Three sites had a low RR due to motion sensor, incorrect quantity, retrofit instead of new case
▪ Incorrect quantity (=1) entered for almost ½ the sample
▪ Includes gas savings due to HVAC interactive effects (for gas heating)
Evaluation Recommendations
▪ Clean up the MAD docs: 3 different versions were provided but most cases used the oldest
▪ Add unit basis (linear feet of case) to clarify quantity units
▪ Use tracking data measure names (or IDs) that match MAD
▪ Drop the interactive gas heating savings to simplify approach
Adjustment to evaluation plan
None

DNV GL – www.dnvgl.com 6/25/2018 86
DNV GL Measure Description Cooler Doors (Add doors to open cases)
Track: Entity Code Standard: FRIDGE
Measure Code(s) COOLDRETFIT, COOLDRETFITE
This measure covers the retrofit of open refrigerated cases to include doors or the replacement of open cases with closed door cases. The measure has electric & gas (interactive HVAC) savings. Key evaluation parameters include number of doors, linear feet of casing, retrofit type, and HVAC heating and cooling type.
RR: Avg.
(Min-Max)
100% (elec.), 92.5% (gas).
(gas: 0% - 100%)
Sample Target 8
Survey Completes 7
Measure Information
Program Data Review: 38 unique measure lines were reported over the two program years. These lines accounted for 29.94% of electricity savings and 7.44% of gas savings reported for the standard track.
Program Delivery: Standard
Evaluation Summary
The evaluation sample included 8 sites for verification. 7 interviews were completed and one site was 1
non-responsive
▪ Telephone interviews were completed for data collection
▪ Predominantly retrofit projects, only one new case project
▪ Interactive HVAC savings were claimed for gas but not for electric space heating
▪ Reported HVAC heating system type was incorrect for 3 of 7 projects
▪ Only one set of savings was used for both retrofit and new cases
Evaluation Recommendations
▪ Drop interactive HVAC gas savings or revise for electric space heating
▪ Improve identification of HVAC heating system type
▪ Limit measure to retrofit: New cases are likely installed only when old units fail
▪ Best way to truly verify installed lengths is with onsite inspection
Adjustment to evaluation plan
None

DNV GL – www.dnvgl.com 6/25/2018 87
DNV GL Measure Description Strip Curtains
Track: Entity Code Standard: FRIDGE
Measure Code(s) STRIPCURTLTWFS
This measure covers the retrofit/replacement of strip curtains for walk-in freezers. Key evaluation parameters include square-feet verification, replacement/add-on verification, replacement practices, and average daily operating hours.
RR: Avg.
(Min-Max)
52%
(0% - 100%)
Sample Target 4
Survey Completes 2
Measure Information
Program Data Review: 19 unique measure lines were reported over the two program years. These lines
accounted for 2.14% of electricity savings and 0% of gas savings reported for the standard track.
Program Delivery: Standard
Evaluation Summary
The evaluation sample included 4 sites for verification. 2 interviews were completed and 2 were non-
responsive
Telephone interviews were completed for data collection. Measure Information:
▪ Almost all sampled sites involved the changing of ownership, therefore it was difficult to gather useful
information about the installed strip curtains, as new owners have no knowledge of them
▪ Only able to confirm 1 site with strip curtains intact. The other site indicated worn-out curtains without
confirming fully intact curtains
▪ MAD categorizes savings only based on building type and freezer/cooler install
Evaluation Recommendations
▪ Add a parameter to indicate free-riders (i.e. grocery stores that do this regardless)
▪ Use a calculator to verify savings for more traceability and transparency
Adjustment to evaluation plan
None
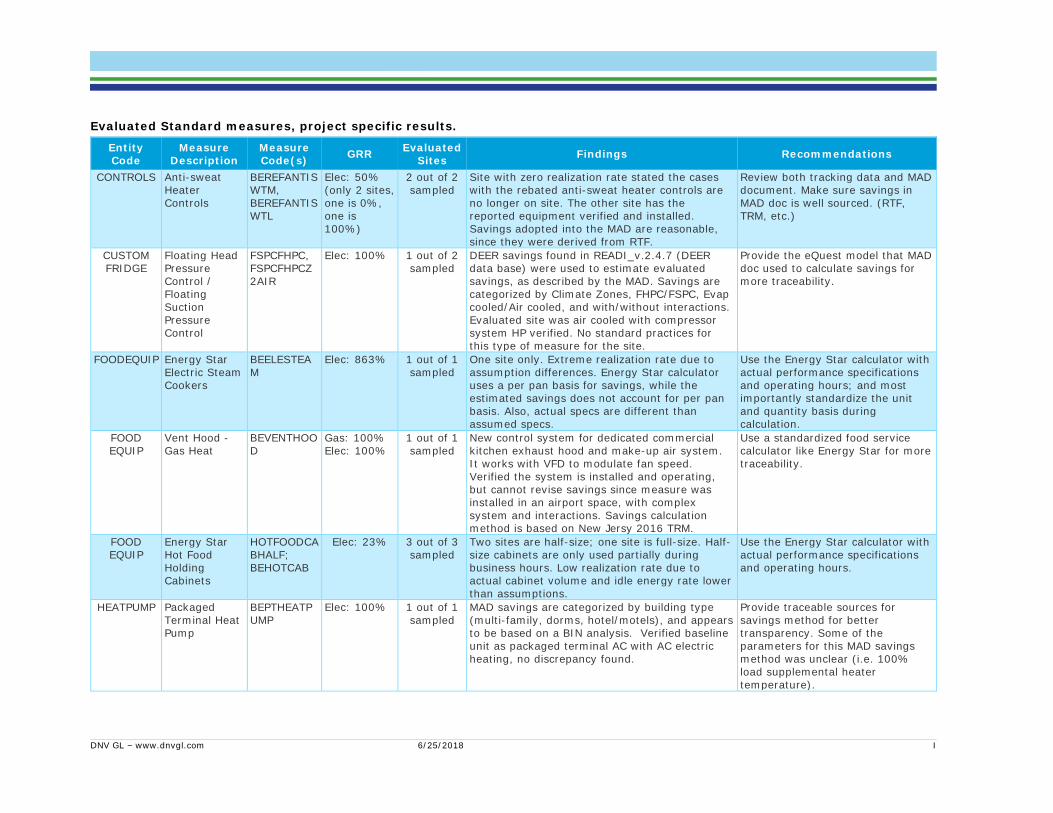
DNV GL – www.dnvgl.com 6/25/2018 I
Evaluated Standard measures, project specific results.
Entity Code
Measure Description
Measure Code(s)
GRR Evaluated
Sites Findings Recommendations
CONTROLS Anti-sweat Heater Controls
BEREFANTISWTM, BEREFANTISWTL
Elec: 50% (only 2 sites, one is 0%, one is 100%)
2 out of 2 sampled
Site with zero realization rate stated the cases with the rebated anti-sweat heater controls are no longer on site. The other site has the reported equipment verified and installed. Savings adopted into the MAD are reasonable, since they were derived from RTF.
Review both tracking data and MAD document. Make sure savings in MAD doc is well sourced. (RTF, TRM, etc.)
CUSTOM FRIDGE
Floating Head Pressure Control / Floating Suction Pressure Control
FSPCFHPC, FSPCFHPCZ2AIR
Elec: 100% 1 out of 2 sampled
DEER savings found in READI_v.2.4.7 (DEER data base) were used to estimate evaluated savings, as described by the MAD. Savings are categorized by Climate Zones, FHPC/FSPC, Evap cooled/Air cooled, and with/without interactions. Evaluated site was air cooled with compressor system HP verified. No standard practices for this type of measure for the site.
Provide the eQuest model that MAD doc used to calculate savings for more traceability.
FOODEQUIP Energy Star Electric Steam Cookers
BEELESTEAM
Elec: 863% 1 out of 1 sampled
One site only. Extreme realization rate due to assumption differences. Energy Star calculator uses a per pan basis for savings, while the estimated savings does not account for per pan basis. Also, actual specs are different than assumed specs.
Use the Energy Star calculator with actual performance specifications and operating hours; and most importantly standardize the unit and quantity basis during calculation.
FOOD EQUIP
Vent Hood - Gas Heat
BEVENTHOOD
Gas: 100% Elec: 100%
1 out of 1 sampled
New control system for dedicated commercial kitchen exhaust hood and make-up air system. It works with VFD to modulate fan speed. Verified the system is installed and operating, but cannot revise savings since measure was installed in an airport space, with complex system and interactions. Savings calculation method is based on New Jersy 2016 TRM.
Use a standardized food service calculator like Energy Star for more traceability.
FOOD EQUIP
Energy Star Hot Food Holding Cabinets
HOTFOODCABHALF; BEHOTCAB
Elec: 23% 3 out of 3 sampled
Two sites are half-size; one site is full-size. Half-size cabinets are only used partially during business hours. Low realization rate due to actual cabinet volume and idle energy rate lower than assumptions.
Use the Energy Star calculator with actual performance specifications and operating hours.
HEATPUMP Packaged Terminal Heat Pump
BEPTHEATPUMP
Elec: 100% 1 out of 1 sampled
MAD savings are categorized by building type (multi-family, dorms, hotel/motels), and appears to be based on a BIN analysis. Verified baseline unit as packaged terminal AC with AC electric heating, no discrepancy found.
Provide traceable sources for savings method for better transparency. Some of the parameters for this MAD savings method was unclear (i.e. 100% load supplemental heater temperature).

DNV GL – www.dnvgl.com 6/25/2018 II
Entity Code
Measure Description
Measure Code(s)
GRR Evaluated
Sites Findings Recommendations
HVAC HVAC In-room Cooling Sensor
BEHVACINROOM
Elec: 147% 1 out of 1 sampled
Measure savings is estimated per room basis, and only include electric cooling savings. Savings from MAD is based on High realization rate due to higher occupancy rate of the evaluated hotel site: 88% verified, 60% assumed by MAD, with ratio adjustments for savings per room.
Measure savings should be varied based on room size, cooling/heating setpoints, climate zones, efficiencies, occupancy type, and building type. MAD savings should address all of these factors.
MOTOR ECM Motors BEMOTREF, ECMWIU
Elec: 100% 4 out of 4 sampled
All are ECMs retrofit to very old cooler/freezer units. For building type, 3 sites are supermarkets, 1 site is restaurant. Savings are evaluated with MAD document's prescriptive savings, depending on whether if the measure is new install/retrofit, as well as reach-in/walk-in cooler and freezers. The savings method is from
an RTF, which uses reasonable inputs and assumptions
None
RADIANT HEAT
Radiant Infrared Heater
RADHEATMOD
Gas: 100% Elec: 100%
1 out of 1 sampled
Measure is installed in a mostly open auto-repair garage/service bay. Techincally this measure is applicable for high bay space as specified by the measure definition, but the application is okay (replaced gas furnace), so MAD savings is used.
Provide MAD savings analysis to allow for better evaluation of details behind the measure savings estimate.
SHOWER- HEAD
Low-Flow Showerheads
SHRHDG15 Gas: 48% Elec:51%
2 out of 2 sampled
We used the unit energy savings (elec and gas) from the MAD doc provided to us, but these values are significantly different from the reported values, which do not even appear in the 2016 MAD doc. Water-energy savings are also claimed, so even gas WH shows electric savings (unusual). Both sites used gas water heating.
Review the tracking data and MAD doc and determine if there is an issue as values do not line up. Make the use of water-energy savings more visible in the MAD doc, consider listing it separately: Claiming kWh savings for a gas water heating measure could look like an error when reviewing the tracking data.
TANKDHW Condensing Storage Water Heater
NCDHWCOND
Gas: 100% 1 out of 2 sampled
Used MAD unit energy savings to verify based on building type. For the evaluated site, verified building type, occupancy rate, condensing water heater quantity.
MAD document need to describe the baseline water heating system and its efficiency used for the savings analysis.
VIRTUAL- IZATION
Data Virtualization
BEVIRTUAL Elec: 46% 1 out of 2 sampled
2 sites sampled, only 1 interview was completed. Low realization rate due to observed consolidation ratio (# of old servers/# of new servers for VMs) is much less than assumed value for reported savings. Reported UES was higher than values in the MAD doc. This measure has been discontinued.
Double check number of servers before and after based on invoices. Verify consolidation ratio with MAD doc. Consider using standardized calculator to be more traceable. Require customer to provide disposal document and Virtual software invoices as a standard practice.

ABOUT DNV GL Driven by our purpose of safeguarding life, property and the environment, DNV GL enables organizations to advance the safety and sustainability of their business. We provide classification and technical assurance along with software and independent expert advisory services to the maritime, oil and gas, and energy industries. We also provide certification services to customers across a wide range of industries. Operating in more than 100 countries, our 16,000 professionals are dedicated to helping our customers make the world safer, smarter and greener.