Hardened concrete properties and durability assessment of ...

Journal of Personality and Social Psychology Copyright 1998 by the American Psychological Association, Inc. 1998, Vol. 75, No. 3, 617-638 0022-3514/98/$3.00
Immune Neglect: A Source of Durability
Daniel T. Gilbert Harvard University
Bias in Affective Forecasting
Elizabeth C. Pinel University of Texas at Austin
Timothy D. Wilson University of Virginia
Stephen J. Blumberg University of Texas at Austin
Thalia P. Wheatley University of Virginia
People are generally unaware of the operation of the system of cognitive mechanisms that ameliorate their experience of negative affect (the psychological immune system), and thus they tend to overesti- mate the duration of their affective reactions to negative events. This tendency was demonstrated in 6 studies in which participants overestimated the duration of their affective reactions to the dissolution of a romantic relationship, the failure to achieve tenure, an electoral defeat, negative personality feedback, an account of a child's death, and rejection by a prospective employer. Participants failed to distinguish between situations in which their psychological immune systems would and would not be likely to operate and mistakenly predicted overly and equally enduring affective reactions in both instances. The present experiments suggest that people neglect the psychological immune system when making affective forecasts.
I am the happiest man alive. I have that in me that can convert poverty into riches, adversity into prosperity, and I am more invul- nerable than Achilles; fortune hath not one place to hit me.
- -S i r Thomas Browne, Religio Medici
Imagine that one morning your telephone rings and you find yourself speaking with the king of Sweden, who informs you in surprisingly good English that you have been selected as this year 's recipient of a Nobel prize. How would you feel, and how long would you feel that way? Although some things are better than instant celebrity and a significant bank deposit, most people
Daniel T. Gilbert, Department of Psychology, Harvard University; Elizabeth C. Pinel and Stephen J. Blumberg, Department of Psychology, University of Texas at Austin; Timothy D. Wilson and Thalia P. Wheatley, Department of Psychology, University of Virginia.
We gratefully acknowledge the support of Research Grant RO1- MH56075 from the National Institute of Mental Health. We wish to express our thanks to Waiter Cordaro, Heidi Mumford, Michael Soder- strom, Jennifer Vick, and Gregory Wells for their capable assistance with the execution of these studies; to Dorothea Adams and the Office of the Vice President for Business Affairs at the University of Texas at Austin for helping us gain access to the tenure reports used in Study 2; to Jane Jenkins and Bob Rosenthal for their expert statistical advice; to Sissela Bok, Jonathon Cummings, Ralph Erber, Tony Greenwald, Darrin Lehman, and George Loewenstein for helpful comments on an earlier version of this article; and to members of our lab groups at the University of Texas at Austin, the University of Virginia, and Harvard University for their enduring intellectual contributions to this work.
Correspondence concerning this article should be addressed to Daniel T. Gilbert, Department of Psychology, William James Hall, 33 Kirkland Street, Harvard University, Cambridge, Massachusetts 02138. Electronic mail may be sent to [email protected].
617
would be hard pressed to name three, and thus most people would probably expect this news to create a sharp and lasting upturn in their emotional lives. Now imagine that the telephone call is from your college president, who regrets to inform you (in surprisingly good English) that the Board of Regents has dissolved your department, revoked your appointment, and stored your books in little cardboard boxes in the hallway. How would you feel, and how long would you feel that way? Losing one 's livelihood has all of the hallmarks of a major catastrophe, and most people would probably expect this news to have an enduring negative impact on their emotional lives.
Such expectations are often important and often wrong. They are important because people 's actions are based, in large mea- sure, on their implicit and explicit predictions of the emotional consequences of future events. A decision to marry or divorce, to become a lawyer rather than a coronet player, or to pass up the twinkie at the convenience store in favor of a croissant from the inconvenient bakery is ordinarily predicted on the belief that one of these events will bring greater emotional rewards than the other. Indeed, affective forecasts are among the guiding stars by which people chart their life courses and steer themselves into the future (Baron, 1992; Herrnstein, 1990; Kahneman & Snell, 1990; Loewenstein & Frederick, 1997; Totterdell, Parkin- son, Briner, & Reynolds, 1997). But are these forecasts correct? In some ways they undoubtedly are. For example, most people recognize that a weekend in Paris would be more enjoyable than gallbladder surgery, and few people fear chocolate or tingle in anticipation of next year's telephone directory. But even if people can estimate with some accuracy the valence and inten- sity of the affect that future events will evoke, they may be less adept at estimating the duration of that affect, and it is often the prediction of duration that shapes an individual's decisions.

618 GILBERT, PINEL, WILSON, BLUMBERG, AND WHEATLEY
FOr instance, most people realize that divorce is anguishing and marriage is joyous, but the decision to commit oneself to either course is predicated not merely on one's beliefs about the va- lence and intensity of these emotional responses but also on one's beliefs about how long each response is likely to last. People invest in monogamous relationships, stick to sensible diets, pay for vaccinations, raise children, invest in stocks, and eschew narcotics because they recognize that maximizing their happiness requires that they consider not only how an event will make them feel at first but, more important, how long those feelings can be expected to endure (see Ainslie, 1992; Mischel, Cantor, & Feldman, 1996).
The Durabi l i ty Bias
How long can feelings be expected to endure? Although the telephone calls from Sweden and the administration building would leave most professors respectively delirious or disconso- late, research suggests that regardless of which call they re- ceived, their general level of happiness would return to baseline in relatively short order. Common events typically influence peo- ple 's subjective well-being for little more than a few months (Suh, Diener, & Fujita, 1996; Wortman & Silver, 1989), and even uncommon events--such as losing a child in a car accident, being diagnosed with cancer, becoming paralyzed, or being sent to a concentration camp- - seem to have less impact on long- term happiness than one might naively expect (e.g., Affleck & Tennen, 1996; Brickman, Coates, & Janoff-Bulman, 1978; Col- lins, Taylor, & Skokan, 1990; Diener, 1994; Helmreich, 1992; Kahana, Kahona, Harel, & Rosner, 1988; Lehman et al., 1993; Suedfeld, 1997; Taylor, 1983; Taylor & Armor, 1996; Wort- man & Silver, 1987). The causes of the remarkable stability of subjective well-being are not fully understood (McCrae & Costa, 1994), but the consequences seem clear: Most people are reasonably happy most of the time, and most events do little to change that for long.
If these findings are surprising, it is only because they violate the intuition that powerful events must have enduring emotional consequences. We believe that such intuitions are profoundly mistaken and that people often tend to overestimate the duration of their affective responses to future events. There are at least six distinct reasons why such a durability bias might arise in affective forecasting. We briefly describe five of them and then concentrate on the sixth.
Misconstrual
It is understandably difficult to forecast one's reactions to events that one has never experienced because it is difficult to know precisely what those events will entail. Although most people feel certain that they would not enjoy going blind, phrases such as "going blind" actually describe a wide range of events (e.g., slowly losing one's eyesight as a result of a congenital defect or suddenly losing one's eyesight during a heroic attempt to rescue a child from a burning house), and these events may have an equally wide range of emotional conse- quences. Research suggests that when people think about an event, they often fail to consider the possibility that their particu- lar, momentary conceptualization of the event is only one of
many ways in which they might have conceptualized it and that the event they are imagining may thus be quite different from the event that actually comes to pass (Dunning, Griffin, Miloj- kovic, & Ross, 1990; Griffin, Dunning, & Ross, 1990; Griffin & Ross, 1991). When forecasters misconstrue an event and imag- ine it as more powerful than it actually turns out to be, they will naturally overestimate the duration of their affective responses.
Inaccurate Theories
It may be difficult to forecast one's affective reactions to events about which one knows little, but it can be just as difficult to forecast one's affective reactions to events about which one knows a lot. Both culture and experience provide people with detailed, domain-specific knowledge about how particular events are likely to make them feel ( " A bris is a happy occasion as long as it isn't mine" ), and some of that knowledge is bound to be wrong. For instance, Ross (1989) has shown that North Americans vastly overestimate the strength and frequency of the emotional distress that women experience before menstruation. One might expect that experience with such ordinary events would cure misconceptions about them, but the ability to re- member one's emotional experiences accurately is so prone to error and distortion that inaccurate theories about the affective consequences of ordinary events may persist indefinitely (Fred- rickson & Kahneman, 1993; Mitchell & Thompson, 1994). Be- cause some of one's acquired wisdom about the emotional con- sequences of common events is undoubtedly wrong ("Getting rich is the key to permanent happiness" ), the affective forecasts that this wisdom generates ( " I f I win the lottery, I ' l l live happily ever after") will undoubtedly be wrong too.
Motivated Distortions
Affective forecasts do more than merely guide people into the future. They also comfort, inspire, and frighten people in the present (Elster & Loewenstein, 1992). So, for example, people may overestimate the duration of their affective responses to the positive events they anticipate ("After Joel and I get married, life will be wonderful" ) because the mere act of mak- ing that forecast induces positive affect ("Just thinking about the wedding makes me smile!") . Similarly, people may overes- timate the duration of their negative affective responses as a form of "defensive pessimism" that braces them against the consequences of a negative event and thus leaves them pleasantly surprised when those consequences turn out to be less enduring than they had predicted (Norem & Cantor, 1986; Rachman, 1994). People may even use dire affective forecasts to motivate themselves to expend effort in the pursuit of desirable ends (Mischel et al., 1996). For example, just as parents often exag- gerate the negative consequences of certain behaviors to control their children's actions ( " I f you let go of my hand in the store and get lost, why don't we just plan to meet over by the Child Eating Monster?"), people may exaggerate the negative af- fective consequences of certain outcomes to motivate themselves to pursue one course of action over another ( " I f I flunk the algebra test tomorrow, I will be doomed to a life of poverty, disease, and despair. So I 'd better skip the party and hit the library" ). In short, affective forecasts have immediate affective

IMMUNE NEGLECT 619
consequences, and thus it is only natural that they should some- times be made in service of their immediate effects. The durabil- ity bias may be the result of that service.
Undercorrection
When people attempt to predict the duration of their affective responses ( "How would I feel a week after getting f i red?") , they may first imagine their initial affective response ( " A s soon as I saw the pink slip I 'd crawl under my desk and weep") and then correct for the passage of time ("But I guess I 'd get up eventually, go home, and make popcorn"; Gilbert, Gill, & Wil- son, 1998). Experiments in a variety of domains indicate that when judgments are made in this fashion, they tend to suffer from undercorrection (Gilbert, 1991; Tversky & Kahneman, 1974), and people seem especially susceptible to this problem when correcting their predictions for the passage of time (Kahne- man & Snell, 1992; Prelec & Loewenstein, 1997; Read & Loewenstein, 1995). Because affective reactions are generally most intense at the onset, the tendency to undercorrect a predic- tion of one's initial reaction will typically produce a durability bias.
Focalism
When people attempt to predict their affective reactions to a particular event, they naturally focus on that event to the exclu- sion of others. So, for example, when a mother is asked to imagine how she would feel 7 years after the death of her youngest child, she is likely to focus exclusively on that tragedy and fail to consider the many other events that will inevitably unfold over that time period, capture her attention, require her participation, and hence influence her general affective state. Indeed, it would be truly perverse for a mother to pause and consider how much this sort of heartache might be assuaged by her other child's portrayal of the dancing banana in the school play, an important new project at work, or the taste of an espe- cially gooey caramel on a cloudless summer day. But the fact of the matter is that trauma does not take place in a vacuum: Life goes on, and nonfocal events do happen and do have affective consequences. As such, perverse or not, accurate affective fore- casts must somehow take those consequences into account. Be- cause nonfocal events are likely to absorb attention and thus neutralize affective responses to focal events (Erber & Tesser, 1992), the failure to consider them should generally cause peo- ple to overestimate the duration of their affective responses (Wilson, Wheatley, Meyers, Gilbert, & Axsom, 1998). t
All five of the foregoing mechanisms may cause the durability bias, all five are important, and all five require careful empirical analysis (see Gilbert & Wilson, in press). Nonetheless, in this article we concentrate on a sixth cause of the durability bias.
Immune Neglect
In the quotation that opened this article, Sir Thomas Browne claimed to have something inside him that could convert adver- sity into prosperity, thus allowing him to claim the title of happi- est man alive. Whatever that thing was, most ordinary people seem to have it too. In science, literature, and folklore, people
are famous for making the best of bad situations, remembering their successes and overlooking their excesses, trumpeting their triumphs and excusing their mistakes, milking their glories and rationalizing their fa i lures--a l l of which allows them to remain relatively pleased with themselves despite all good evidence to the contrary. Psychologists from Freud to Festinger have de- scribed the artful methods by which the human mind ignores, augments, transforms, and rearranges information in its unend- ing battle against the affective consequences of negative events (e.g., Festinger, 1957; Freud, 1936; Greenwald, 1980; Kunda, 1990; Steele, 1988; Taylor, 1983, 1991; Taylor & Armor, 1996; Taylor & Brown, 1988). Some of these methods are quite simple (e.g., dismissing as a rule all remarks that begin with "You drooling imbeci le") , and some are more complicated (e.g., finding four good reasons why one didn't really want to win the lottery in the first place); taken in sum, however, they seem to constitute a psychological immune system that:serves to pro- tect the individual from an overdose of gloom. As Vaillant ( 1993, p. 11 ) noted: "Defense mechanisms are for the mind what the immune system is for the body." Ego defense, rationalization, dissonance reduction, motivated reasoning, positive illusions, self-serving attribution, self-deception, self-enhancement, self- affirmation, and self-justification are just some of the terms that psychologists have used to describe the various strategies, mechanisms, tactics, and maneuvers of the psychological im- mune system.
One of the hallmarks of the psychological immune system is that it seems to work best when no one is watching, and when its operations are explicitly scrutinized, it may cease functioning altogether. People may convince themselves that they never re- ally loved the ex-spouse who left them for another, but when a friend reminds them of the 47 love sonnets that they conve- niently failed to remember writing, the jig is up, the fix is spoiled, and they shuffle off sheepishly to nurse old wounds (and find new friends). The mental machinery that transforms adversity into prosperity must work quietly if it is to work at all, and successful rationalization typically requires that ratio- nalizers not regard themselves as such (Gur & Sackheim, 1979). People, then, may be generally unaware of the influence that their psychological immune system has on their emotional well- being (Loewenstein & Adler, 1995; Snell, Gibbs, & Varey, 1995), and it is easy to imagine how this tendency--which we call immune neglect--might give rise to the durability bias. If people fail to recognize that their negative affect will not merely subside but will be actively antagonized by powerful psychologi- cal mechanisms that are specifically dedicated to its ameliora- tion, then they will naturally tend to overestimate the longevity of those emotional reactions (see Loewenstein & Frederick, 1997).
Of the six mechanisms that can cause the durability bias, immune neglect is unique in an important way. Although five of these mechanisms--misconstrual, inaccurate theories, moti- vated distortion, and focal ism--may lead people to overesti- mate the duration of both their positive and negative affective reactions, immune neglect should lead people to overestimate
1 Schkade and Kahneman (1997) and Loewenstein and Schkade (in press) have independently developed a very similar analysis of a phe- nomenon they call the focusing illusion.

620 GILBERT, PINEL, WILSON, BLUMBERG, AND WHEATLEY
the duration of their negative affective reactions only. As Taylor (1991, p. 67) observed, "Once the threat of the negative event has subsided, counteracting processes are initiated that reverse, minimize, or undo the responses elicited at the initial stage of responding," and "this pattern seems to distinguish negative events from positive or neutral ones." Indeed, evidence suggests that although people do actively work to neutralize or transform their negative affect ( "Ph i l was never really right for me, and I was able to see that much more clearly the moment he took back the engagement r ing" ), they generally do not actively work to augment their positive affect because active psychological work has the paradoxical consequence of neutralizing positive affect (Erber & Tesser, 1992; Erber, Wegner, & Therriault, 1996; Isen, 1987; Parrott, 1993; cf. Wegener & Petty, 1994). In short, the immune system works to repair one, not to improve one, and this suggests that immune neglect should cause a nega t ive - - but not a posi t ive--durabil i ty bias.
The Present Resea rch
Do affective forecasts suffer from a durability bias, and, if so, can this bias be caused by immune neglect? In Studies 1, 2, and 3, we sought to answer the first part of the question by searching for the durability bias in a variety of natural settings that we hoped would document its occurrence and highlight its ubiquity. In Studies 4, 5, and 6, we sought to answer the second part of the question by returning to the laboratory for a more precise look at the mechanisms that might give rise to the dura- bility bias. Because any single scientific approach has unique strengths and weaknesses, we used a full spectrum of ap- proaches that would, we hoped, converge on a single result. Our studies included more than a thousand people from all walks of life, took place in the field and in the laboratory, ranged from questionnaires to surveys and experiments, and varied from cross-sectional to longitudinal and fully randomized designs. But they shared a common logic. In each study we asked people to estimate the duration of their affective reactions to an event, and in each study we measured the duration of people' s affective reactions to that event. We expected to find that, across a variety of natural and artificial circumstances, forecasters would overes- timate the duration of their affective reactions and that this durability bias would occur in part because forecasters would fail to recognize that negative affective reactions are ameliorated by psychological processes.
In our initial trio of studies, we asked forecasters to predict their affective reactions both to negative and to positive events. Our goal in these studies was to establish the existence of the durability bias by observing it in consequential, realistic set- tings, without special regard for the mechanisms that might be causing it. We assumed that any or all of the six mechanisms previously discussed might play a causal role in these studies. However, because each of these six mechanisms was capable of causing a negative durability bias and only five were capable of causing a positive durability bias, we suspected that the former phenomenon might prove more robust and reliable than the latter. Indeed, the more immune neglect played a causal role in the production of the durability bias, the more profound we expected this asymmetry to be. We looked for this asymmetry within each study, by measuring forecasts and experiences of
both positive and negative events, and across the studies, by performing a meta-analysis (which we report after describing the results of Studies 1 - 3 ) .
S tudy 1: L o o k i n g D o w n L o n e l y St ree t
Method
Overview
Participants reported their general happiness. Participants then re- ported whether they were currently involved in a romantic relationship and whether they had experienced the dissolution of a romantic relation- ship. Those participants who had not experienced the dissolution of a romantic relationship ("luckies") were asked to predict how happy they would be 2 months after experiencing such a dissolution. We ex- pected luckies to predict that the dissolution of a romantic relationship would leave them considerably less happy 2 months later than those who had actually experienced such an event 2 months earlier ( "leftovers" ) reported being. Those participants who were not currently involved in a romantic relationship ("loners") were asked to predict how happy they would be 6 months after becoming involved in such a relationship. We expected loners to predict that the initiation of a romantic relation- ship would leave them just about as happy 6 months later as those who had actually experienced such an event 6 months earlier ("lovers") reported being.
Participants
Participants were 571 students in an introductory psychology course at the University of Texas at Austin who completed a series of question- naires at the beginning of the semester. Of the 363 participants who indicated their gender, 122 (34%) were male and 241 (66%) were female.
Procedure
At the beginning of the fall semester, participants completed a series of questionnaires, one of which asked them to report their general happi- ness ( "In general, how happy would you say you are these days?" ) on a 7-point scale ranging from not happy (1) to very happy (7). This measure was almost identical to the measure used by the Gallup Organi- zation (see Andrews & Robinson, 1991). One-item measures of general happiness are convenient, have adequate psychometric properties, and explain a reasonable portion of the variance in more elaborate measures (Fordyce, 1988). As Diener (1984, p. 544) noted, "The validity and reliability of these [ single-item] scales suggests that they are adequate if a very brief measure of global well-being is required."
Lovers and loners. Participants were asked whether they were cur- rently involved in a close romantic relationship, which was defined as an exclusive, monogamous relationship that both partners expected would endure for a significant period. Those participants who indicated that they were currently involved in such a relationship ("lovers") then reported how long they had been in the relationship. Those participants who indicated that they were not involved in a close romantic relation- ship ( "loners" ) predicted how happy in general they thought they would be 6 months after becoming involved in such a relationship. Participants were largely 1st-year undergraduate students, and we suspected that many of the lovers would be involved in relationships that had been initiated before they entered college (perhaps during their senior years of high school). Because the study was conducted in the first months of the fall semester, we estimated that the modal duration of the relation- ships reported by lovers would be about 6 months, and thus we asked loners to make forecasts for that time period.
Luckies and leftovers. Participants were asked whether they had

IMMUNE NEGLECT 621
ever experienced the breakup of a close romantic relationship. Those participants who indicated that they had experienced such a breakup ("leftovers") then reported how long ago the breakup had occurred. Those participants who indicated that they had not experienced such a breakup ( "luckies" ) predicted how happy in general they thought they would be 2 months after experiencing such a breakup. Because partici- pants were largely lst-year undergraduate students, we suspected that many of the leftovers would have experienced the breakup of a high school relationship in the summer before entering college. Because the study was conducted in the first months of the fall semester, we estimated that the modal time since the breakups reported by leftovers would be about 2 months, and thus we asked luckies to make forecasts for that time period.
Table 1 Affective Forecasts and Experiences of Lovers and Loners in Study 1
Experiences
Value Young lovers Old lovers Loners Forecasts (Loners)
M 5.91 5.71 5.17 5.79 SD 1.12 1.02 1.31 1.19 n 57 141 334 334
Note. Greater values indicate greater actual or predicted happiness.
Results and Discussion
Classification o f Participants
Omissions of data. Of the 571 participants who completed the questionnaire, 39 had incomplete data. The data from these participants were removed, leaving 532 participants in the data set. The exclusion of these data had no significant impact on any of the analyses reported here.
Lovers and loners. Of the 532 participants, 334 (62.8%) reported that they were not currently involved in a close roman- tic relationship and were thus classified as loners, 141 partici- pants (26.5%) reported that they had been in such a relationship for more than 6 months and were thus classified as "o ld lovers," and 57 participants (10.7%) reported that they had been in such a relationship for 6 months or less and were thus classified as "young lovers."
Luckies and leftovers. Of the 532 participants, 194 (36.5%) reported that they had not experienced a breakup and were thus classified as luckies, 302 participants (56.8%) reported that they had experienced a breakup more than 2 months earlier and were thus classified as "o ld leftovers," and 36 participants (6.8%) reported that they had experienced a breakup 2 months earlier or even more recently and were thus classified as "young leftovers."
Affective Forecasts and Experiences
Lovers and loners. The design of Study 1 enabled us to a s k three questions. First, what were the actual effects of becoming involved in a close romantic relationship (i.e., Were lovers cur- rently happier than loners)? Second, what were the predicted effects of becoming involved in a close romantic relationship (i.e., Did loners expect to be happier after becoming lovers themselves) ? Third, was there a difference between the actual and predicted effects (i.e., Were lovers happier than loners ex- pected to be after becoming lovers themselves)?
Were lovers actually happier than loners? To answer this ques- tion, we compared the experiences of loners with the experi- ences of young lovers and old lovers by performing a pair of focused contrasts that used the error term from a one-way analy- sis of variance (ANOVA; old lovers' experiences, young lovers' experiences, and loners' experiences).2 As Table 1 shows, loners were indeed less happy than either young lovers, F ( 1 , 5 2 9 ) = 18.92, p < .001, or old lovers, F ( 1 , 5 2 9 ) = 29.16, p < .001, which suggests that being involved in a close romantic relation- ship may indeed increase one 's happiness. Did loners predict
that they would be happier if they were lovers? To answer this question, we compared the forecasts and experiences of loners. As Table 1 shows, loners predicted that, 6 months after falling in love, they would be significantly happier than they currently were, F ( 1 , 3 3 3 ) = 42.27, p < .001. Finally, were the loners' forecasts accurate? To answer this question, we performed a pair of focused contrasts that used the error term from a one- way ANOVA (old lovers' experiences, young lovers' experi- ences, and loners' forecasts). Loners' forecasts of how much happier they would be 6 months after becoming lovers were indeed accurate inasmuch as their forecasts did not differ from the experiences of young lovers, F ( 1 , 5 2 9 ) = 0.64, p = .42, or from the experiences of old lovers, F ( 1 , 5 2 9 ) = 0.53, p = .47.
In short, lovers were happier than loners, loners expected that becoming involved in a close romantic relationship would increase their happiness, and loners correctly predicted that i f they were to become lovers, they would be just about as happy as old and young lovers actually turned out to be. It is worth noting that there were no differences between the forecasts of those loners who had never experienced a romantic breakup (M = 5.80, SD = 1.28, n = 128) and those loners who had experi- enced a romantic breakup (M = 5.78, SD = 1.14, n = 206), F ( 1 , 3 3 2 ) = 0.04, p = .84.
Luckies and leftovers. Again, the study design enabled us to ask three questions. First, what were the actual effects of experiencing the breakup of a close romantic relationship (i.e., Were luckies currently happier than leftovers)? Second, what were the predicted effects of experiencing the breakup of a close romantic relationship (i.e., Did luckies expect to be less happy after becoming leftovers themselves) ? Third, was there a differ- ence between the actual and predicted effects (i.e., Were left- overs happier than luckies expected to be after becoming left- overs themselves) ?
Were luckies actually happier than leftovers? To answer this
2 By and large, the theoretically derived predictions in our studies were most appropriately tested with focused contrasts that use error terms from an ANOVA (Rosenthal & Rosnow, 1985). Thus, in addition to reporting the results of these contrasts, we describe the ANOVAs that generated the error terms and, when theoretically meaningful, report the ANOVA results as well. It is nonetheless important to remember that significant ANOVA results are not a precondition for performing focused contrasts. As Rosnow and Rosenthal ( 1995, p. 4) explained: "The analy- sis of group means is not a 'Simon says' game in which one must first ask permission of the p value for an interaction F whether it is all right to proceed."
622 GILBERT, PINEL, WILSON, BLUMBERG, AND WHEATLEY
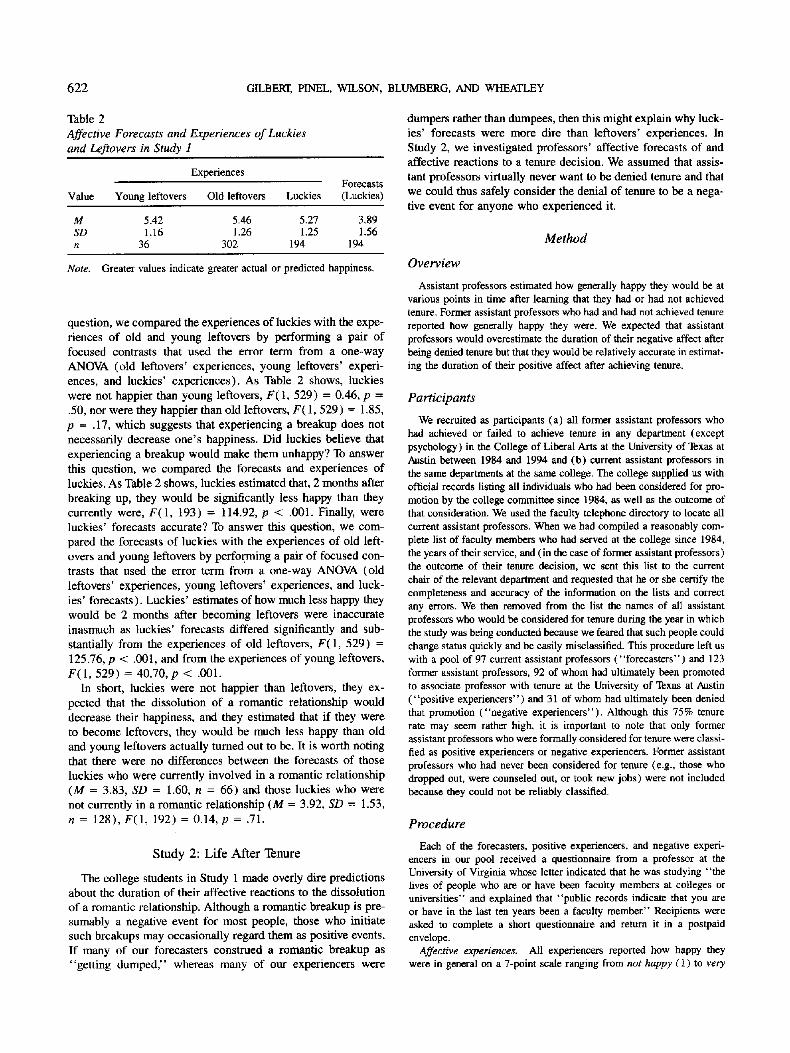
Table 2 Affective Forecasts and Experiences of Luckies and Leftovers in Study 1
Experiences Forecasts
Value Young leftovers Old leftovers Luckies (Luckles)
M 5.42 5.46 5.27 3.89 SD 1.16 1.26 1.25 1.56 n 36 302 194 194
Note. Greater values indicate greater actual or predicted happiness.
question, we compared the experiences of luckies with the expe- riences of old and young leftovers by performing a pair of focused contrasts that used the error term from a one-way ANOVA (old leftovers ' experiences, young leftovers ' experi- ences, and luckies ' experiences) . As Table 2 shows, luckies were not happier than young leftovers, F ( 1 , 5 2 9 ) = 0.46, p = .50, nor were they happier than old leftovers, F ( 1 , 5 2 9 ) = 1.85, p = .17, which suggests that experiencing a breakup does not necessarily decrease one ' s happiness. Did luckies believe that experiencing a breakup would make them unhappy? To answer this question, we compared the forecasts and experiences of luckies. As Table 2 shows, luckies estimated that, 2 months after breaking up, they would be significantly less happy than they currently were, F ( 1 , 193) = 114.92, p < .001. Finally, were luckies ' forecasts accurate? To answer this question, we com- pared the forecasts of luckies with the experiences of old left- overs and young leftovers by performing a pair of focused con- trasts that used the error term from a one-way ANOVA (old leftovers ' experiences, young leftovers' experiences, and luck- ies' forecasts) . Luckies ' estimates of how much less happy they would be 2 months after becoming leftovers were inaccurate inasmuch as luckies' forecasts differed significantly and sub- stantiaily f rom the experiences of old leftovers, F (1 , 529) = 125.76, p < .001, and f rom the experiences of young leftovers, F ( 1 , 5 2 9 ) = 40.70, p < .001.
In short, luckies were not happier than leftovers, they ex- pected that the dissolution of a romantic relationship would decrease their happiness, and they estimated that i f they were to become leftovers, they would be much less happy than old and young leftovers actually turned out to be. It is worth noting that there were no differences between the forecasts of those luckies who were currently involved in a romantic relationship ( M = 3.83, SD = 1.60, n = 66) and those luckies who were not currently in a romantic relationship ( M = 3.92, SD = 1.53, n = 128), F (1 , 192) = 0.14, p = .71.
S t u d y 2: L i f e A f t e r Tenure
The college students in Study 1 made overly dire predictions about the duration of their affective reactions to the dissolution of a romantic relationship. Although a romantic breakup is pre- sumably a negative event for most people, those who initiate such breakups may occasionally regard them as positive events. If many of our forecasters construed a romantic breakup as "get t ing dumped," whereas many of our experiencers were
dumpers rather than dumpees, then this might explain why luck- ies' forecasts were more dire than leftovers ' experiences. In Study 2, we investigated professors ' affective forecasts of and affective reactions to a tenure decision. We assumed that assis- tant professors virtually never want to be denied tenure and that we could thus safely consider the denial of tenure to be a nega- tive event for anyone who experienced it.
M e ~ o d
Overview
Assistant professors estimated how generally happy they would be at various points in time after learning that they had or had not achieved tenure. Former assistant professors who had and had not achieved tenure reported how generally happy they were. We expected that assistant professors would overestimate the duration of their negative affect after being denied tenure but that they would be relatively accurate in estimat- ing the duration of their positive affect after achieving tenure.
Participants
We recruited as participants (a) all former assistant professors who had achieved or failed to achieve tenure in any department (except psychology) in the College of Liberal Arts at the University of Texas at Austin between 1984 and 1994 and (b) current assistant professors in the same departments at the same college. The college supplied us with official records listing all individuals who had been considered for pro- motion by the college committee since 1984, as well as the outcome of that consideration. We used the faculty telephone directory to locate all current assistant professors. When we had compiled a reasonably com- plete list of faculty members who had served at the college since 1984, the years of their service, and (in the case of former assistant professors ) the outcome of their tenure decision, we sent this list to the current chair of the relevant department and requested that he or she certify the completeness and accuracy of the information on the lists and correct any errors. We then removed from the list the names of all assistant professors who would be considered for tenure during the year in which the study was being conducted because we feared that such people could change status quickly and be easily misclassified. This procedure left us with a pool of 97 current assistant professors ("forecasters") and 123 former assistant professors, 92 of whom had ultimately been promoted to associate professor with tenure at the University of Texas at Austin ("positive experiencers") and 31 of whom had ultimately been denied that promotion ("negative experiencers" ). Although this 75% tenure rate may seem rather high, it is important to note that only former assistant professors who were formally considered for tenure were classi- fied as positive experiencers or negative experiencers. Former assistant professors who had never been considered for tenure (e.g., those who dropped out, were counseled out, or took new jobs) were not included because they could not be reliably classified.
Procedure
Each of the forecasters, positive experiencers, and negative experi- encers in our pool received a questionnaire from a professor at the University of Virginia whose letter indicated that he was studying "the lives of people who are or have been faculty members at colleges or universities" and explained that "public records indicate that you are or have in the last ten years been a faculty member." Recipients were asked to complete a short questionnaire and return it in a postpaid envelope.
Affective experiences. All experiencers reported how happy they were in general on a 7-point scale ranging from not happy ( 1 ) to very

IMMUNE NEGLECT 623
happy (7). Next, all experiencers completed 13 items that assessed their satisfaction with their lives. Eight of these items were taken from Kammann and Flett's (1983) Affectometer 2, and the remaining 5 items were taken from Diener, Emmons, Larsen, and Griffin's (1985) Satisfac- tion With Life Scale. Experiencers reported their agreement with items such as "If I could live my life over, I would change almost nothing" and "My life seems stuck in a rut." Ratings were made on a 7-point scale ranging from strongly disagree (1) to strongly agree (7).
Affective forecasts. Forecasters reported how happy they were in general on a 7-point scale ranging from not happy (1) to very happy (7). Next, forecasters completed the same 13 items described earlier, and then estimated how happy they would be in general at various points in time after being awarded or denied tenure. Specifically, forecasters estimated how happy they would be at the time they learned of each possible decision, and so on up to 10 years. These estimates were made on a 7-point scale ranging from not happy (1) to very happy (7).
Results and Discussion
Response Rates
We received complete responses from 33 (34.02%) of the forecasters, 47 (51.10%) of the positive experiencers, and 20 (64.50%) of the negative experiencers.
Relations Between Measures
Across all participants, scores on the single-item happiness measure were strongly correlated with the average of the items excerpted from Diener et al.'s (1985) Satisfaction With Life Scale, r (98) = .86, p < .001, and with the average of the items excerpted from Kammann and Flett 's (1983) Affectometer 2, r (97) = .83, p < . 0 0 1 . 3 We administered these more elaborate measures so that we could be sure that the single-item measure used in the foregoing (and subsequent) studies was both valid and reliable. Clearly it was, and, as such, only the single-item measure was submitted to further analysis.
Classification of Respondents
For the purposes of analysis, we divided positive experiencers and negative experiencers into two classes: those whose tenure decisions had been made within the previous 5 years (" recent positive experiencers" and "recent negative experiencers") and those whose tenure decisions had been made between 6 and 10 years in the past ( "ancient positive experiencers" and "ancient negative experiencers"). The aggregation of respondents into recent and ancient classes was necessary because there were not enough experiencers whose tenure decisions had occurred at each of the 10 points in time to allow us to make statistically meaningful comparisons between forecasts and experiences at every one of those points (e.g., only 1 negative experiencer failed to achieve tenure precisely 4 years earlier). On average, recent positive experiencers (n = 25) and recent negative experi- encers (n = 7) experienced their tenure decisions 2.6 years before completing the questionnaire, whereas ancient positive experiencers (n = 22) and ancient negative experiencers (n = 13) experienced their tenure decisions 8.5 years before complet- ing the questionnaire.
Strategies for Analysis
We averaged the forecasters' estimates of their happiness in the 1st through 5th years after a positive or negative tenure decision and computed a recent positive forecast index and a recent negative forecast index. Similarly, we averaged the fore- casters' estimates of their happiness in the 6th through 10th years after a positive or negative tenure decision and computed an ancient positive forecast index and an ancient negative fore- cast index. Because forecasts were measured within subjects and experiences were measured between subjects, two analysis strategies were followed. First, we sought to examine how the outcome of the tenure decision and the passage of time influ- enced the forecasters' predictions (predicted effects) and then how these same variables influenced the positive experiencers' and negative experiencers' experiences (actual effects). Toward this end, we submitted the forecasters' predictions to a 2 (pre- dicted outcome: positive vs. negative) × 2 (time: recent vs. ancient) within-subject ANOVA, and we submitted the experi- encers' reports to a 2 (experienced outcome: positive vs. nega- tive) x 2 (time: ancient vs. recent) between-subjects ANOVA. Second, we sought to examine the accuracy of the forecasters' predictions by performing a series of focused between-subjects contrasts that directly tested the difference between forecasts and experiences in each condition.
Effects of Outcome and 7~me
Forecasts. Did assistant professors expect to be happier after achieving tenure than after failing to achieve tenure, and did they expect those reactions to change with the passage of time? Forecasters' predictions were submitted to a 2 (predicted outcome: positive vs. negative) x 2 (time: recent vs. ancient) within-subject ANOVA that revealed a main effect of predicted outcome, F(1 , 32) = 26.64, p < .001, and a main effect of time, F ( 1, 32) = 27.56, p < .001, both of which were qualified by a Predicted Outcome x Time interaction, F ( 1, 32) = 67.14, p < .001. As Table 3 shows, forecasters estimated that they would be happier in the first 5 years after achieving tenure than after not achieving tenure, F ( 1, 32) = 34.81, p < .001, but that this difference would dissipate such that they would be equally happy in the fi)llowing 5 years, F(1 , 32) = 2.62, p = .12. 4
Experiences. Were former assistant professors who achieved tenure happier than those who did not achieve tenure, and did those reactions change with the passage of time? The experiencers' reports were submitted to a 2 (experienced out- come: positive vs. negative) x 2 (time: recent vs. ancient) be- tween-subjects ANOVA that revealed no significant main effects of experienced outcome, F (1 , 63) = 2.07, p = .155, or time, F (1 , 63) = 2.00, p = .16, and no Experienced Outcome x Time interaction, F ( 1, 63) = 0.01, p = .94. As Table 3 shows, positive experiencers were not significantly happier than nega-
3 Because a few respondents did not complete every item on each scale, these two correlations were based on slightly different degrees of freedom.
4 An entirely within-subject 2 x 2 ANOVA produces three different error terms. The error term associated with the main effect of experience was used in these contrasts.
624 GILBERT, PINEL, WILSON, BLUMBERG, AND WHEATLEY
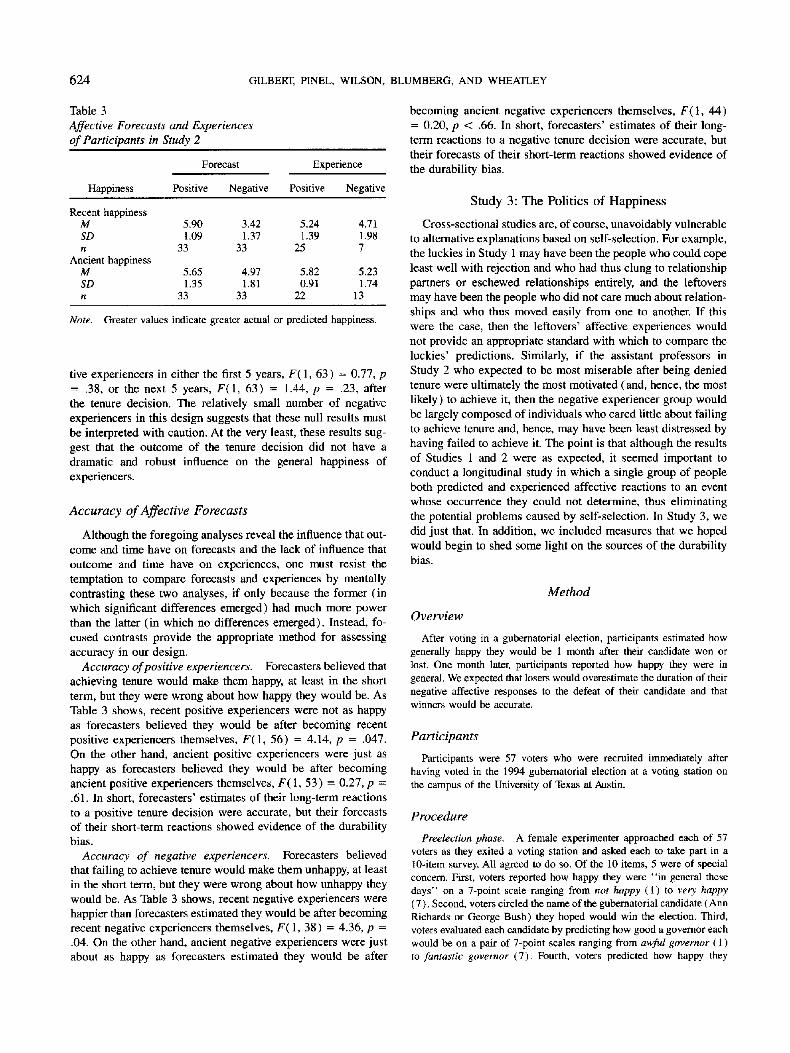
Table 3 Affective Forecasts and Experiences of Participants in Study 2
Forecast Experience
Happiness Positive Negative Positive Negative
Recent happiness M 5.90 3.42 5.24 4.71 SD 1.09 1.37 1.39 1.98 n 33 33 25 7
Ancient happiness M 5.65 4.97 5.82 5.23 SD 1.35 1.81 0.91 1.74 n 33 33 22 13
Note. Greater values indicate greater actual or predicted happiness.
tive experiencers in either the first 5 years, F ( 1, 63) = 0.77, p = .38, or the next 5 years, F (1 , 63) = 1.44, p = .23, after the tenure decision. The relatively small number of negative experiencers in this design suggests that these null results must be interpreted with caution. At the very least, these results sug- gest that the outcome of the tenure decision did not have a dramatic and robust influence on the general happiness of experiencers.
Accuracy o f Affective Forecasts
Although the foregoing analyses reveal the influence that out- come and time have on forecasts and the lack of influence that outcome and time have on experiences, one must resist the temptation to compare forecasts and experiences by mentally contrasting these two analyses, if only because the former (in which significant differences emerged) had much more power than the latter (in which no differences emerged). Instead, fo- cused contrasts provide the appropriate method for assessing accuracy in our design.
Accuracy of positive experiencers. Forecasters believed that achieving tenure would make them happy, at least in the short term, but they were wrong about how happy they would be. As Table 3 shows, recent positive experiencers were not as happy as forecasters believed they would be after becoming recent positive experiencers themselves, F ( 1, 56) = 4.14, p = .047. On the other hand, ancient positive experiencers were just as happy as forecasters believed they would be after becoming ancient positive experiencers themselves, F ( 1, 53) = 0.27, p = .61. In short, forecasters' estimates of their long-term reactions to a positive tenure decision were accurate, but their forecasts of their short-term reactions showed evidence of the durability bias.
Accuracy of negative experiencers. Forecasters believed that falling to achieve tenure would make them unhappy, at least in the short term, but they were wrong about how unhappy they would be. As Table 3 shows, recent negative experiencers were happier than forecasters estimated they would be after becoming recent negative experiencers themselves, F ( 1, 38) = 4.36, p = .04. On the other hand, ancient negative experiencers were just about as happy as forecasters estimated they would be after
becoming ancient negative experiencers themselves, F ( 1, 44) = 0.20, p < .66. In short, forecasters' estimates of their long- term reactions to a negative tenure decision were accurate, but their forecasts of their short-term reactions showed evidence of the durability bias.
S tudy 3: The Pol i t ics o f Happ ines s
Cross-sectional studies are, of course, unavoidably vulnerable to alternative explanations based on self-selection. For example, the luckies in Study 1 may have been the people who could cope least well with rejection and who had thus clung to relationship partners or eschewed relationships entirely, and the leftovers may have been the people who did not care much about relation- ships and who thus moved easily from one to another. If this were the case, then the leftovers' affective experiences would not provide an appropriate standard with which to compare the luckies' predictions. Similarly, if the assistant professors in Study 2 who expected to be most miserable after being denied tenure were ultimately the most motivated (and, hence, the most likely) to achieve it, then the negative experiencer group would be largely composed of individuals who cared little about failing to achieve tenure and, hence, may have been least distressed by having failed to achieve it. The point is that although the results of Studies 1 and 2 were as expected, it seemed important to conduct a longitudinal study in which a single group of people both predicted and experienced affective reactions to an event whose occurrence they could not determine, thus eliminating the potential problems caused by self-selection. In Study 3, we did just that. In addition, we included measures that we hoped would begin to shed some light on the sources of the durability bias.
Method
Overview
After voting in a gubernatorial election, participants estimated how generally happy they would be 1 month after their candidate won or lost. One month later, participants reported how happy they were in general. We expected that losers would overestimate the duration of their negative affective responses to the defeat of their candidate and that winners would be accurate.
Participants
Participants were 57 voters who were recruited immediately after having voted in the 1994 gubernatorial election at a voting station on the campus of the University of Texas at Austin.
Procedure
Preelection phase. A female experimenter approached each of 57 voters as they exited a voting station and asked each to take part in a 10-item survey. All agreed to do so. Of the 10 items, 5 were of special concern. First, voters reported how happy they were "in general these days" on a 7-point scale ranging from not happy (1) to very happy ( 7 ). Second, voters circled the name of the gubernatorial candidate (Ann Richards or George Bush) they hoped would win the election. Third, voters evaluated each candidate by predicting how good a governor each would be on a pair of 7-point scales ranging from awful governor ( 1 ) to fantastic governor (7). Fourth, voters predicted how happy they

IMMUNE NEGLECT 625
would be in general 1 month after the election (a) if their candidate won and (b) if their candidate lost. These estimates were made on a pair of 7-point scales ranging from not happy (1) to very happy (7). Finally, voters estimated how they would be likely to evaluate the two candidates 1 month after the election (a) if Bush were to win and (b) if Richards were to win. These estimates were made on two pairs of 7- point scales ranging from awful governor ( 1 ) to fantastic governor (7).
Postelection phase. Approximately 1 month after the gubernatorial election, a female experimenter telephoned each of the voters and, to those whom she reached, identified herself as a psychology graduate student who was administering a survey. She made no reference to the first phase of the study, and none of the voters inquired about it. Voters were asked to report how happy they were in general, the extent to which they now thought about the election, and their current evaluations of the gubernatorial candidates. All responses were made orally and recorded on scales identical to those used in the preelection phase. At the end of the conversation, voters were thanked, and the nature of the study was explained.
Results and Discussion
Response Rates
Of the 57 voters, 39 (68%) indicated that they hoped Ann Richards would win the election, and 18 (32%) hoped that George Bush would win. Bush won the election, and thus Bush supporters were classified as "winners" and Richards support- ers were classified as " losers ." Approximately 1 month after the election, 25 of the 57 voters (15 men and 10 women) were successfully contacted by telephone, and all agreed to complete a telephone survey. The remaining voters had either moved or were continuously unreachable by telephone. Of the 25 partici- pants who were contacted by telephone, 10 were losers and 15 were winners. All subsequent analyses were performed on the data from these 25 participants.
Happiness Measures
Before the election, voters reported their current happiness and estimated how happy they would be 1 month after Bush won. One month after the election, voters reported their current happiness. As in our previous studies, this design enabled us to ask three questions. First, what were the actual effects of the election (i.e., were voters happier or less happy after the election than they were before)? Second, what were the predicted effects of the election (i.e., did voters expect to be happier or less happy after the election than they were before)? Third, was there a difference between the actual and predicted effects (i.e., were voters happier or less happy after the election than they predicted they would be )?
Experiences. Were voters happier or less happy 1 month after the election of Bush than they were before the election? A 2 (group: winners vs. losers) x 2 (measure: preelection happiness vs. postelection happiness) ANOVA revealed only a main effect of group, F( 1, 23) = 4.74, p = .04. As the upper portion of Table 4 shows, losers were happier than winners both before and after the election, which apparently had no effect on the voters' general happiness. 5
Forecasts. Did voters believe they would be happier or less happy 1 month after the election of Bush than they were before the election? A 2 (group: winners vs. losers) x 2 (measure:
Table 4 Affective Forecasts and Experiences of Participants in Study 3
Dependent variable Preelection Forecast Postelection
Happiness Losers
M 5.00 4.07 5.33 SD 1.20 1.58 0.98 n 15 15 15
Winners M 4.10 4.90 4.40 SD 1.45 0.57 1.58 n 10 10 10
Evaluation of Bush Losers
M 2.93 2.93 3.60 SD 1.03 0.96 0.74 n 15 15 15
Winners M 5.20 5.40 5.00 SD 0.63 0.70 0.47 n 10 10 10
Note. Greater values indicate greater actual or predicted happiness or more positive actual or predicted evaluation.
preelection happiness vs. forecast happiness)ANOVA revealed only the predicted Group x Time interaction, F ( 1, 23) = 7.60, p < .02. As the upper portion of Table 4 shows, winners did not think that a win would influence their happiness, F ( 1, 23) = 2.66, p = . 12, but losers thought that a loss would significantly decrease their happiness, F ( 1, 23) = 5.43, p < .03.
Accuracy. Were voters' forecasts accurate? A 2 (group: winners vs. losers) x 2 (measure: forecast happiness vs. post- election happiness) ANOVA revealed only the predicted Group x Measure interaction, F ( 1, 23) = 6.03, p = .022. As the upper portion of Table 4 shows, 1 month after the election, winners were about as happy as they had expected to be, F ( 1, 23) = 0.77, p = .39, but losers were significantly happier than they had expected to be, F (1 , 23) = 7.84, p < .02.
Evaluation Measures
Why did losers overestimate the duration of their affective reactions? Our hypothesis suggests that losers' psychological immune systems transformed their negative affect in ways they could not foresee, and the data provide some preliminary sup- port for that suggestion. Before the election, voters reported their evaluation of Bush and estimated how they would evaluate Bush 1 month after he won. One month after the election, voters reported their current evaluation of Bush. This design allowed us to answer three familiar questions.
Experiences. Did voters evaluate Bush more positively or more negatively 1 month after the election than they had before? A 2 (group: winners vs. losers) x 2 (measure: preelection
5 Although the phrase "losers were happier than winners" may ini- tially seem counterintuitive, it is worth remembering that, in this case, this phrase is functionally equivalent to the much more intuitive phrase "Democrats were happier than Republicans."

626 GILBERT, P1NEL, WILSON, BLUMBERG, AND WHEATLEY
evaluation vs. postelection evaluation) ANOVA revealed a main effect of group, F(1, 23) = 47.17,p < .001, that was qualified by a Group × Measure interaction, F( 1, 23) = 6.12, p = .02. As the lower portion of Table 3 suggests, winners evaluated Bush after the election precisely as they had evaluated him before the election, F(1, 23) = 0.51, p = .48. Losers, on the other hand, changed their minds. Specifically, losers evaluated Bush more positively after the election than they had before, F(1, 23) = 11.22, p < .01.
Forecasts. Did voters expect their evaluations of Bush to become more positive or more negative after he was elected than they had been before? A 2 (group: winners vs. losers) × 2 (measure: preelection evaluation vs. forecast evaluation) ANOVA revealed only a main effect of group, F( 1, 23 ) = 49.76, p < .01. Before the election, winners evaluated Bush more positively than did losers, and neither winners nor losers ex- pected their evaluations of Bush to change after he won the election.
Accuracy. Were voters' forecasts accurate? A 2 (group: winners vs. losers) × 2 (measure: forecast evaluation vs. post- election evaluation) ANOVA revealed a main effect of group, F(1, 23) = 64.21, p < .001, that was qualified by a Group × Measure interaction, F( 1, 23) = 7.22, p = .013. After the elec- tion, losers felt better about their new governor than they had expected to feel, F( 1, 23) = 7.79, p < .02, whereas winners felt just as positively as they had anticipated, F( 1, 23) = 1.56, p = .22. In other words, losers underestimated their ability to grow quite quickly fond of a governor with whom they were, quite frankly, stuck. It is worth noting that new governors do not take office 1 month after an election, and thus the governor- elect's official actions could not have been responsible for any changes in citizens' evaluations of him.
In summary, voters correctly estimated how happy they would be 1 month after their candidate won an election but overesti- mated how unhappy they would be 1 month after their candidate lost an election. In addition, losers failed to realize that their evaluations of the winning candidate would improve after the election.
Brief Interlude
Looking Backward: Meta-Analysis of Studies 1-3
In Studies 1-3, participants overestimated the duration of their negative affect, and they seemed to do so more dramatically and consistently than they overestimated the duration of their positive affect. A meta-analysis confirmed this observation. The average effect size (r) of the negative durability bias was quite healthy across these three studies, with estimates ranging from .38 to .41, depending on the method of calculation. On the other hand, the average effect size of the positive durability bias was truly anemic, ranging from .02 to .12. Taken as a whole, then, Studies 1-3 provide evidence for a much more robust negative than positive durability bias.
What might have caused this asymmetry? One possibility is that immune neglect played an important role in the production of the durability bias in these studies. As we noted earlier, an asymmetry of this sort is a signature of immune neglect, because the immune system is specifically designed to ameliorate nega-
tive affect. But there are other possibilities as well. For instance, participants may have felt that the negative events were further from the psychological neutral point than were the positive events (i.e., the bad events were "badder" than the good events were good). Although winning and losing an election, for exam- ple, might seem to be a perfectly balanced pair of outcomes, research suggests that losses are generally experienced as larger than gains when the two are equated on an objective scale (Kahneman & Tversky, 1979). If participants considered the loss of a lover, a job, or an elected office to be a more powerful emotional event than the corresponding acquisition of these same things, then it would have made sense for them to predict that the loss would have a more enduring emotional impact. In short, although the positive-negative asymmetry is consistent with the notion that immune neglect was a source of the durabil- ity bias observed in Studies 1-3, it is merely suggestive, and more direct evidence is clearly required.
Looking Forward: The Logic of Studies 4-6
Our theorizing suggests that the durability bias will occur when people fail to consider the palliative influence that their psychological immune systems will have on their negative af- fective states. To test this notion, we staged a series of negative events in the laboratory. In each study, we arranged the negative event so that, in one experimental condition, the psychological immune system would easily ameliorate the experiencer's nega- tive affect and, in the other experimental condition, it would not. We reasoned that if forecasters do indeed consider the oper- ation of the psychological immune system when making af- fective forecasts, then they should correctly expect to experience more enduring negative affect in the latter than in the former experimental condition. On the other hand, if forecasters suffer from immune neglect, they should incorrectly expect to have similar reactions in these two experimental conditions.
Studies 4 - 6 served another purpose as well. It is in the nature of prediction that people are focused on the particular future event about which they are making estimates, and it is in the nature of experience that people often are not focused on the particular event long after it has transpired. Naturally, then, the questions we asked forecasters in Studies 1-3 (e.g., "How happy will you be in general some time after the negative event?" ) required that they consider the negative event, whereas the questions we asked experiencers (e.g., "How happy are you in general?") did not. Might the difference between these questions provide an artifactual explanation for the appearance of the durability bias in our studies? We do not believe so, because we do not consider this explanation to be either arti- factual or necessary. Recall that we asked forecasters to predict how they would feel in general at some future time after an event had occurred rather than how they would feel when asked about the event at some future time. If forecasters overestimated the duration of their affective reactions because they failed to realize that they might not be thinking about the event at the future time, then their failure can be thought of as an instance of focalism. In other words, a forecaster's failure to consider how much less salient an event will be long after it has passed is most certainly not an artifact of the questions a psychologist asks but is, instead, an interesting phenomenon that reflects a

IMMUNE NEGLECT 627
natural feature of prediction and that is accounted for quite nicely by our explanatory framework (Wilson et al., 1998).
More important, though this interesting phenomenon may be a sufficient cause of the durability bias, we do not believe that it is a necessary cause. Rather, we suspect that even when experi- encers are, in fact, thinking about a negative event that happened in the past, the work performed by the psychological immune system often ensures that they will not feel as unhappy as fore- casters expected them to feel. To verify this suspicion, we asked forecasters in Studies 4 - 6 to make predictions about how un- happy they would feel a very short time after a salient negative event had taken place. We assumed that college students in a laboratory situation could be relied on to remember a salient negative event just a few minutes after it happened and that such an event might even be more salient for those who had actually experienced it than for those who had merely made predictions about it. If the durability bias were observed under these condi- tions, it would be difficult to explain it by claiming that our questions had artificially focused forecasters on a negative event about which experiencers had long since forgotten.
S tudy 4: The Hur t ing M a c h i n e
The psychological immune system functions when two condi- tions are met. First, the person mast experience a sufficient amount of negative affect to activate the system. If a failure has no sting ( "Sorry, but you didn't win the Best Tied Shoes Award this year" ), then one is unlikely to engage in an elaborate round of rationalization, denial, and defense ( "The contest was fixed! Someone switched laces with me! I didn' t hear the starter's p i s to l !" ) . Second, if an event does evoke a sufficient amount of negative affect ("Sorry , but the committee felt that your colleague deserved the Pulitzer Prize more than you d id" ), then features of the event may determine whether the immune system does its job easily ( " A s you may know, the committee is chaired by the other applicant's mother" ) or with great difficulty ( " O f course, the submissions were judged b l indly") . In short, the experience of negative affect should activate the immune system, and features of the event should determine whether the immune system's work is successful. In Study 4, we sought to show that experiencers will experience more enduring affective responses when the immune system's job is difficult rather than easy but that forecasters do not realize this and will thus predict equally enduring affective responses in these two different situations.
In Study 4, we gave participants relatively negative feedback about their personalities. We reasoned that some participants (i.e., those who held positive self-views) would feel bad and would be highly motivated to dismiss the feedback and that other participants (i.e., those who held negative self-views) would not. Sometimes the feedback was quite easy to dismiss (i.e., it came from a relatively fallible source), and sometimes it was not (i.e., it came from a relatively infallible source). We asked forecasters to predict their affective responses to the re- ceipt of the negative feedback, and we asked experiencers to report their affective responses after receiving the negative feed- back. Our hypothesis led to two predictions. First, we expected that the fallibility of the source of the feedback would not influ- ence participants' estimates of their affective reactions. In other words, because we expected that forecasters would fail to con-
sider the relative ease or difficulty with which their psychologi- cal immune systems would later dispel their negative affect, we predicted that they would not distinguish between situations that tend to facilitate or inhibit the immune system's operations. Second, we expected that the fallibility of the source of the feedback would influence the affective experiences of partici- pants who held positive self-views such that their negative affect would be more readily vanquished by the immune system when the feedback was from a fallible source than when it was from an infallible source. On the other hand, we expected that the fallibility of the source of the feedback would not influence the affective experiences of participants with negative self-views, who would not find the feedback particularly aversive in the first place and would therefore not be particularly motivated to consider the fallibility of the source, even in retrospect.
Me~od
Overview
Forecasters with positive and negative self-views were told that a computer program (fallible source) or a team of highly skilled clinicians (infallible source) had classified them as one of three personality types, and they were then asked to estimate how happy they would expect to feel a short while after learning that they had been classified as the worst personality type. Experiencers with positive and negative self- views were told that they had been classified as the worst type and were then told that the classification had been made either by a computer program or by a team of highly skilled clinicians. A short while later, experiencers were asked to report how happy they felt.
Participants
Seventy-three students at the University of Texas at Austin participated in exchange for credit in their introductory psychology course. Only those students who had completed Tafarodi and Swann's (1995) Self- Liking/Competence Scale (SLCS) during a pretesting session at the beginning of the semester were eligible to participate in the study. Thirty- one of the participants were male, and 35 were female. As a result of a procedural error, the gender of the remaining 7 participants was not recorded.
Procedure
Participants arrived at the laboratory individually and were greeted by a male or female experimenter who explained that he or she was studying how people with different personalities judge each other. Parti- cipants were told that, on the basis of their responses to questionnaires administered during the pretesting session at the beginning of the semes- ter, they had been classified as one of three personality types--alpha, phi, or psi--and that soon they would be asked to make judgments about another person. Participants were told that before they made any judgments, they would be allowed to familiarize themselves with these three personality types by reading a profile of each.
Participants read a mundane profile, a good profile, and an extraordi- nary profile describing the general characteristics of the alpha, phi, and psi types, respectively. For example, a section of the alpha (mundane) profile read as follows:
These people are fairly competent and well-adjusted, but have few qualities that distinguish them from others. They are generally well- liked, partly because they do not pose a threat to the competencies of others . . . . These people tend to have a realistic picture of both

628 GILBERT, PINEL, WILSON, BLUMBERG, AND WHEATLEY
their talents and their limitations and thus tend to structure their tasks quite appropriately.
The same section of the phi (good) profile read:
These people are particularly competent and well-adjusted, and although they are average in many respects, they almost always have one or more remarkable qualities such as an artistic or athletic talent, high intelligence, or good social skills . . . . On some occa- sions, these people overestimate their own ability and may take on more than they can handle, but they tend to deal with stress well and tend not to repeat the same mistake twice.
The same section of the psi (extraordinary) profile read:
In addition to being extraordinarily well-rounded, these people have exceptional qualities that often lead others to refer to them as gifted• • . . These people tend to have a realistic picture of their own talents, though they occasionally underestimate themselves and may be capable of even greater achievements than they realize.
After reading the three profiles, half of the participants were randomly assigned the role of forecaster and the remaining participants were as- signed the role of experiencer.
Forecasters. After reading the three profiles, forecasters were as- signed to one of two conditions. Forecasters in the fallible source condi- tion were told that a computer program had been used to analyze their responses to the pretesting questionnaires and that the program had classified them as an alpha, phi, or psi. We assumed that a computer program would be viewed as a fallible source whose feedback could be readily discounted. The remaining forecasters were assigned to the infallible source condition, and these forecasters were told that two experienced clinicians had analyzed their responses, discussed their anal- ysis, and agreed to classify them as an alpha, phi, or psi. We assumed that a team of experienced clinicians who reached consensus would be viewed as a relatively infallible source whose feedback could not be easily discounted. Forecasters then completed a questionnaire that asked them whether they expected to be classified as an alpha, phi, or psi; these ratings were made on three 7-point scales ranging from not at all (1) to extremely (7). The questionnaire also asked how happy they would expect to feel 5 min after being classified as an alpha, as a phi, and, finally, as a psi; these ratings were made on three 7-point scales ranging from very happy ( 1 ) to very unhappy (7). After forecasters had completed these measures, they completed some exploratory measures and were fully debriefed, thanked, and dismissed.
Experiencers. After reading the profiles, experiencers were given an envelope containing a slip of paper on which was written the experi- encer's Social Security number and personality classification. The exper- imenter left the room so that participants could view their classification privately. The slip of paper informed the experiencers that they had been classified as an alpha (mundane). The experimenter returned approxi- mately 30 s later and explained that he had forgotten to provide them with a form describing the method by which they had been classified. As with the forecasters, half of the experiencers were randomly assigned to the fallible source condition and were told that a computer had classi- fied them, whereas the remaining experiencers were assigned to the infallible source condition and were told that two experienced clinicians had classified them.
The experimenter then left the participant alone in the laboratory room for 5 rain (under the pretense of checking on another participant). When the experimenter returned, he gave experiencers a questionnaire that asked them to report their current happiness on the same scale used by forecasters. Participants then answered a variety of other questions and were debriefed, thanked, and dismissed.
Results and Discussion
Omissions of Data
One of the 73 participants expressed suspicion about the procedures, and 2 were ineligible to participate because they had not completed the SLCS. The data f rom these 3 participants were not analyzed.
Classification of Participants
All participants completed Tafarodi and Swann ' s (1995) SLCS at the beginning of the semester. This scale has a theoreti- cal range of 0 to 80. We classified forecasters as having positive or negative self-views by conducting a median split on the distri- bution of their SLCS scores (positive self-view, M = 71.40, SD = 3.91; negative self-view, M = 51.50, SD = 11.64), which left 16 forecasters with positive self-views and 16 forecasters with negative self-views. We also classified experiencers as hav- ing positive or negative self-views by conducting a median split on the distribution of their SLCS scores (positive self-view, M = 69.90, SD = 4.30; negative self-view, M = 52.50, SD = 11.97), which left 18 experiencers with positive self-views and 20 experiencers with negative self-views. It is reassuring to note that the SLCS scores of experiencers and forecasters with positive self-views did not differ, F = 1, and that the SLCS scores of experiencers and forecasters with negative self-views did not differ, F < 1.
Subjective Likelihood of the Event
Forecasters reported the extent to which they expected to be classified as each of the three personality types. We expected that forecasters who held negative self-views would be more likely than forecasters who held positive self-views to expect to be classified as an alpha (mundane) rather than a phi (good) or psi (extraordinary) . We created a subjective likelihood index by subtracting the average of the forecaster 's ratings of the subjective likelihood of being classified as a phi (good) and a psi (extraordinary) f rom the forecaster 's rating of the subjective likelihood of being classified as an alpha (mundane) . This index was submitted to a 2 (source: fallible vs. infal l ible) x 2 (self- view: positive vs. negative) ANOVA that revealed only a main effect of self-view such that forecasters with negative self-views ( M = 0.97, SD = 2.38) were more likely than forecasters with positive self-views ( M = - 0 . 8 1 , SD = 2.17) to expect to be classified as an alpha (mundane) rather than as a phi (good) or a psi (ext raordinary) , F (1 , 28) = 5.10, p < .03. This finding is commensurate with our assumption that forecasters who held negative self-views would not be particularly alarmed by nega- tive personality feedback because they expected to receive it.
Affective Forecasts and Experiences
Forecasters estimated how happy they would be 5 min after being classified as an alpha, and experiencers reported how happy they were 5 rain after being classified as an alpha. We expected that the fallibility of the source of that classification would not influence the predictions of forecasters but that it would influence the reports of some experiencers, namely, those
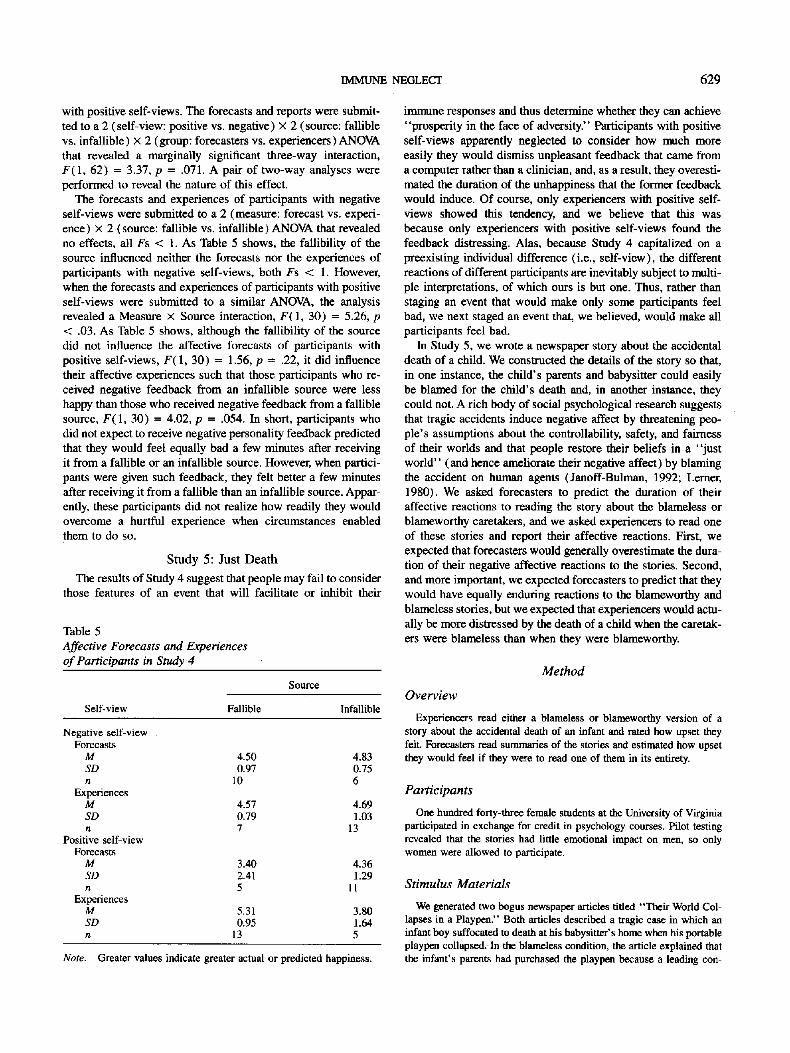
IMMUNE NEGLECT 629
with positive self-views. The forecasts and reports were submit- ted to a 2 (self-view: positive vs. negative) × 2 (source: fallible vs. infallible) × 2 (group: forecasters vs. experiencers)ANOVA that revealed a marginally significant three-way interaction, F (1 , 62) = 3.37, p = .071. A pair of two-way analyses were performed to reveal the nature of this effect.
The forecasts and experiences of participants with negative self-views were submitted to a 2 (measure: forecast vs. experi- ence) × 2 (source: fallible vs. infallible) ANOVA that revealed no effects, all Fs < 1. As Table 5 shows, the fallibility of the source influenced neither the forecasts nor the experiences of participants with negative self-views, both Fs < 1. However, when the forecasts and experiences of participants with positive self-views were submitted to a similar ANOVA, the analysis revealed a Measure × Source interaction, F(1 , 30) = 5.26, p < .03. As Table 5 shows, although the fallibility of the source did not influence the affective forecasts of participants with positive self-views, F(1 , 30) = 1.56, p = .22, it did influence their affective experiences such that those participants who re- ceived negative feedback from an infallible source were less happy than those who received negative feedback from a fallible source, F(1 , 30) = 4.02, p = .054. In short, participants who did not expect to receive negative personality feedback predicted that they would feel equally bad a few minutes after receiving it from a fallible or an infallible source. However, when partici- pants were given such feedback, they felt better a few minutes after receiving it from a fallible than an infallible source. Appar- ently, these participants did not realize how readily they would overcome a hurtful experience when circumstances enabled them to do so.
S tudy 5: Just Dea th
The results of Study 4 suggest that people may fail to consider those features of an event that will facilitate or inhibit their
Table 5 Affective Forecasts and Experiences of Participants in Study 4
Source
Self-view Fallible Infallible
Negative self-view Forecasts
M 4.50 4.83 SD 0.97 0.75 n 10 6
Experiences M 4.57 4.69 SD 0.79 1.03 n 7 13
Positive self-view Forecasts
M 3.40 4.36 SD 2.41 1.29 n 5 11
Experiences M 5.31 3.80 SD 0.95 1.64 n 13 5
Note. Greater values indicate greater actual or predicted happiness.
immune responses and thus determine whether they can achieve "prosperity in the face of adversity." Participants with positive self-views apparently neglected to consider how much more easily they would dismiss unpleasant feedback that came from a computer rather than a clinician, and, as a result, they overesti- mated the duration of the unhappiness that the former feedback would induce. Of course, only experiencers with positive self- views showed this tendency, and we believe that this was because only experiencers with positive self-views found the feedback distressing. Alas, because Study 4 capitalized on a preexisting individual difference (i.e., self-view), the different reactions of different participants are inevitably subject to multi- ple interpretations, of which ours is but one. Thus, rather than staging an event that would make only some participants feel bad, we next staged an event that, we believed, would make all participants feel bad.
In Study 5, we wrote a newspaper story about the accidental death of a child. We constructed the details of the story so that, in one instance, the child's parents and babysitter could easily be blamed for the child's death and, in another instance, they could not. A rich body of social psychological research suggests that tragic accidents induce negative affect by threatening peo- ple 's assumptions about the controllability, safety, and fairness of their worlds and that people restore their beliefs in a "just world" (and hence ameliorate their negative affect) by blaming the accident on human agents (Janoff-Bulman, 1992; Lerner, 1980). We asked forecasters to predict the duration of their affective reactions to reading the story about the blameless or blameworthy caretakers, and we asked experiencers to read one of these stories and report their affective reactions. First, we expected that forecasters would generally overestimate the dura- tion of their negative affective reactions to the stories. Second, and more important, we expected forecasters to predict that they would have equally enduring reactions to the blameworthy and blameless stories, but we expected that experiencers would actu- ally be more distressed by the death of a child when the caretak- ers were blameless than when they were blameworthy.
Method
Overview
Experiencers read either a blameless or blameworthy version of a story about the accidental death of an infant and rated how upset they felt. Forecasters read summaries of the stories and estimated how upset they would feel if they were to read one of them in its entirety.
Participants
One hundred forty-three female students at the University of Virginia participated in exchange for credit in psychology courses. Pilot testing revealed that the stories had little emotional impact on men, so only women were allowed to participate.
Stimulus Materials
We generated two bogus newspaper articles rifled "Their World Col- lapses in a Playpen." Both articles described a tragic case in which an infant boy suffocated to death at his babysitter's home when his portable playpen collapsed. In the blameless condition, the article explained that the infant's parents had purchased the playpen because a leading con-
630 GILBERT, PINEL, WILSON, BLUMBERG, AND WHEATLEY
sumer magazine had described it as an especially safe brand. Further- more, the babysitter was said to have properly engaged the safety mecha- nism on the playpen and to have left the infant alone in the playpen for just 2 min while she tended to other children. Finally, the infant was described as normal and healthy, and the infant's parents were described as an upper-middle-class couple who lived in northern Virginia. In the blameworthy condition, the article explained that the infant's parents had purchased the playpen for a dollar at a garage sale. Furthermore, the babysitter was said to have forgotten to engage the safety mechanism and had left the infant alone in the playpen for an hour while she watched soap operas. Finally, the infant himself was described as suffering from a rare birth defect that had left him severely brain damaged and with a life expectancy of only 2 to 3 years. The infant's parents were described as a lower-middle-class couple who lived in a trailer in Mississippi.
Procedure
As part of a study that was ostensibly about "consumer beliefs," participants were told that they would read newspaper articles about various products and then make some ratings. Participants first answered some filler questions (e.g., "How many magazines do you read each month?") and then rated how fearful, worried, uneasy, and happy they felt at that moment. These baseline ratings were made on 9-point scales ranging from not at all (1) to extremely (9). Experiencers then read either the blameworthy or blameless story, answered two filler questions about it ("How well-written was the story?" and "To what extent did the story keep your attention?" ), and then reported their feelings on the same scales used to measure their baseline affect. 6 Next, experiencers read a humorous story to ensure that they were in a good mood when they left the experiment. Finally, as a manipulation check, experiencers reported the extent to which they thought the babysitter was responsible for the infant's death, the extent to which they thought the parents were responsible for the infant's death, and how avoidable the infant's death was. These ratings were made on 9-point scales. Scales for the first two items ranged from not at all responsible (1) to extremely responsible (9), whereas the scale for the last item ranged from completely unavoid- able ( 1 ) to completely avoidable (9).
Additional participants were recruited from the same population and were assigned to play the role of forecaster. Forecasters received the same instructions as did experiencers, completed the same baseline mea- sures of affect, and then read brief summaries of the blameworthy and blameless articles. The blameworthy summary read as follows:
This article describes a case in Mississippi in which a severely brain-damaged infant was placed in a portable playpen that later collapsed, cutting off the child's breath. The infant had been born with a rare birth defect that meant he had a life expectancy of two to three years and would never learn to walk or talk. His parents, a lower middle-class couple living in a trailer park, had left him with their regular sitter. The playpen, which the child's parents had purchased at a garage sale, may not have been set up properly (the sitter apparently forgot to check whether the locking mechanism on the playpen was engaged and then left the child alone for an hour).
The blameless summary read:
This article describes a case in a northern Virginia suburb in which a healthy infant was placed in a portable playpen that later collapsed, cutting off the child's breath. The parents, an upper-middle class couple, had left him with their regular sitter. The parents had pur- chased the playpen new because, according to a leading consumer magazine, it was an especially safe brand. The sitter checked to make sure that the locking mechanism was engaged and then left the room for no more than two minutes.
After reading the summaries, forecasters predicted how they would feel if they were to read one of the stories in its entirety. These predictions were made on the same scales used to measure their baseline affect.
Results and Discussion
Manipulat ion Checks
The three manipulation check items were highly intercorre- lated ( a = .85) and were thus averaged to form a blame index. As expected, experiencers considered the infant 's parents and babysitter more blameworthy (and the infant 's death more avoidable) in the blameworthy condition (M = 4.21, SD = 1.95) than in the blameless condition (M = 2.73, SD = 1.36), t (27) = 2.40, p < .05.
Negat ive Af fec t Index
Preliminary analyses revealed that participants' ratings of their fearfulness and worry were highly correlated ( r = .91). The reliability of this index was decreased by the addition of either or both of the other items (uneasiness and unhappiness) , and thus only the ratings of fearfulness and worry were averaged to create a negative affect index.
Baseline Af fect
Measures of baseline affect on the negative affect index were submitted to a 2 (role: forecaster vs. experiencer) x 2 (story: blameless vs. blameworthy) ANOVA that revealed a marginally significant main effect of role, F (1 , 139) = 3.04, p = .083, such that forecasters (M = 2.74, SD = 1.55) may have felt somewhat worse than experiencers (M = 2.16, SD = 1.42) at the outset. There was neither a main effect of story, F (1 , 139) = 1.34, p = .25, nor a Role x Story interaction, F < 1. Because baseline affect varied across conditions, we analyzed changes in affect over time. Specifically, we measured experiencers' re- actions to the newspaper article by subtracting their baseline ratings on the affect index from the ratings they made on the affect index after reading the newspaper article. Similarly, we measured forecasters' predicted reactions to the newspaper arti- cle by subtracting their baseline ratings on the affect index from the predictive ratings they made on the affect index after reading the brief summaries.
Affect ive Forecasts and Experiences
Both the component scores and the change scores on the negative affect index are shown in Table 6. The change scores were submitted to a 2 (role: forecaster vs. experiencer) x 2 (story: blameless vs. blameworthy) ANOVA that revealed a sig- nificant main effect of role, F ( 1, 139) = 12.74, p < .001. As Table 6 shows, forecasters expected to become more upset by the stories than experiencers actually became. The Role x Story
6 Some experiencers were randomly assigned to read the blameworthy or blameless story, and others were allowed to choose which story to read after reading a summary of both stories. Because this manipulation had no effect on any of the analyses reported, we collapsed the data across levels of this independent variable, which is not discussed further.

IMMUNE NEGLECT 631
Table 6 Affective Forecasts and Experiences of Participants in Study 5
Measure
Role Baseline Experimental Change
Forecasters Blameworthy story (n = 55)
M 2.80 5.01 2.21 SD 1.50 2.33 2.23
Blameless story (n = 59) M 2.69 5.10 2.42 SD 1.50 2.33 2.26
Experiencers Blameworthy story (n = 16)
M 2.50 2.62 0.12 SD 1.83 1.73 1.32
Blameless story (n = 13) M 1.88 3.22 1.34 SD 0.96 1.57 1.64
Note. Greater values indicate greater actual or predicted negative af- fect.
interaction was not significant, F ( 1, 139) = 1.33, p = .25, but a focused contrast analysis provided support for our hypotheses. As we expected, forecasters believed that they would become equally upset after reading the blameworthy and the blameless stories, F < 1, but experiencers who read the blameworthy story became less upset than did experiencers who read the blameless story, F (1 , 139) = 3.84, p = .05.
S tudy 6: Fai lure , Inc.
In Studies 4 and 5, we predicted that participants would feel bad after experiencing a negative event, that this emotional expe- rience would activate their psychological immune systems, and that, whenever possible, the participants' psychological immune systems would work to reduce their negative affect. Although this is a reasonable interpretation of the results, in both of these studies we measured participants' emotional reactions at just one point in time, and thus we cannot be certain that the partici- pants who " recovered" ever really felt bad at all. In Study 6, we asked participants to report their affective reactions immediately after a negative event (before the immune system had time to do its work) and then again 10 min later (after the immune system had time to do its work).
In Study 6, we asked participants to forecast their immediate and subsequent affective reactions to a negative event (being rejected by a prospective employer), and then we had these same participants experience the negative event and report their immediate and subsequent affective reactions. Sometimes a fea- ture of the negative event made it easy for the immune system to do its job (i.e., the hiring decision was made by one relatively uninformed individual), and sometimes a feature of the event made it difficult for the immune system to do its job (i.e., the hiring decision was made by a team of relatively informed individuals). Our theorizing led to two predictions. First, we expected that participants would fall to consider the impact of their psychological immune systems, and hence both their
immediate and delayed forecasts would be uninfluenced by the ease with which the immune system could later do its job. Second, we expected that, after the event actually occurred, all participants would feel equally b a d - - a t f i r s t - -bu t that 10 min later, participants whose immune systems had an easy job would feel better than participants whose immune systems had a diffi- cult job.
Method
Overview
Participants made a presentation with the hope of being chosen for a desirable job. Some participants believed that the hiring decision would be made by a single individual on the basis of little relevant information (unfair decision condition), and others believed that the decision would be made by a group of individuals on the basis of ample relevant infor- marion (fair decision condition). Participants estimated how they would feel immediately and 10 min after being told that they had and had not been chosen for the job. Participants were then told that they had not been chosen, and they reported their feelings immediately and 10 min later. As a means of determining whether the act of making forecasts had contaminated participants' reports of their experiences, a separate group of participants made no forecasts, were told they had not been chosen for the job, and reported their feelings immediately and 10 min later.
Participants
Ninety-one female students at the University of Texas at Austin partici- pated in exchange for credit in their introductory psychology course.
Procedure
Participants arrived at the laboratory individually and were greeted by a male or female experimenter Who explained that the Psychology Department required that all participants complete a brief questionnaire assessing their attitudes toward experiments before they could take part in an experiment. Participants completed a brief questionnaire that, among other things, asked them to report bow happy they were at that moment on a lO-point scale ranging from not very happy (1) to very happy (10).
Next, the experimenter explained that several local businesses had provided samples of their products and advertisements and that the cur- rent study required that participants try these products or view these advertisements and then report their opinions about them. Participants were told that university regulations required that anyone who partici- pated in research that could benefit an extramural corporation must be paid $25, in addition to receiving experimental credit, but that because research funds were in short supply, the participant would have to un- dergo a brief screening procedure to determine whether she was suitable for the job.
Participants were told that the screening procedure involved answer- ing a series of questions by speaking into a microphone that was ostensi- bly connected to a speaker in an adjoining room. Participants were told that the persons in the adjoining room were MBA students who would listen to the participant's answers and then make a decision to hire or not to hire the participant. The experimenter explained that the MBA students were being kept in another room so that the participant's appear- ance, race, and mannerisms would not play a role in their decision. Participants were given a list of 15 questions that they would be required to answer during the screening procedure and were given ample time to study this list and prepare their answers.
Manipulating fairness. Half of the participants were randomly as-

6 3 2 GILBERT, PINEL, WILSON, BLUMBERG, AND WHEATLEY
signed to the unfair decision condition. In this condition, participants were told that their answers would be heard by (and the hiring decision made by) a singl e MBA student who had the sole authority to hire or reject them. In addition, the questions shown to participants in this condition appeared to be only modestly relevant to the hiring decision (e.g., "Why did you pick your major?" ). The remaining participants were assigned to the fair decision condition. In this condition, partici- pants were told that their answers would be heard by (and the hiring decision made by) a team of three MBA students who would reject an applicant only if they independently and unanimously concluded that she was unfit for the job. Furthermore, each of the questions shown to participants in this condition included a few sentences that explained the relevance of the question for the hiring decision. So, for example, participants in the fair condition read the following: "We are looking to hire people who will be able to explain their thoughts and feelings on the products. These people generally can articulate clear reasons for their feelings and actions. Why did you pick your major?"
Measuring forecasts. When participants had finished preparing their answers to the 15 questions, they read those answers into the microphone. Next, some participants ("forecasters") were asked to predict their affective reactions to being chosen or not chosen for the job, and the remaining participants ( "nonforecasters" ) were not asked to make these forecasts. Specifically, forecasters predicted how happy they would feel (a) immediately after learning that they had been chosen for the job, (b) immediately after learning that they had not been chosen for the job, (c) 10 min after learning that they had been chosen for the job, and (d) 10 min after learning that they had not been chosen for the job. These forecasts were made on 10-point scales ranging from not very happy (1) to very happy (10).
Measuring experiences. Next, all participants were given a letter from the MBA student (s) informing them that they had not been selected for the job. All participants then completed a short questionnaire that, among other things, asked them to report their current happiness on a scale identical to those used earlier. The experimenter then explained that he or she needed to make some photocopies of the next questionnaire and would return in a few minutes. Ten minutes later, the experimenter returned with another questionnaire that, among other things, asked parti- cipants to report their current happiness once again on a scale identical to those used earlier. Finally, all participants were debriefed, thanked, and dismissed.
Results and Discussion
Omission of Data
Twelve participants (5 forecasters in the unfair condition, 2 forecasters in the fair condition, 1 nonforecaster in the unfair condition, and 4 nonforecasters in the fair condi t ion) expressed suspicion about the procedures, and 1 participant experienced a procedural error. The data f rom these participants were excluded from all analyses.
Baseline Affect
Participants reported their happiness when they first arrived at the experiment. A 2 (decision: fair vs. unfair) x 2 (role: forecaster vs. nonforecaster) ANOVA revealed that baseline af- fect was equivalent across all conditions (all Fs < 1). As in Study 5, we measured forecasts and experiences by subtracting part icipants ' reports of their baseline happiness f rom their later reports. As such, negative values indicated (a ) that experiencers were less happy than they were when the experiment began or
( b ) that forecasters believed they would be less happy than they were when the experiment began.
Analysis of Affective Experiences
Because Study 6 had both a between-subjects component ( two different groups of participants reported their experiences ) and a within-subject component (one group of participants both made forecasts and reported their experiences) , we used two strategies for data analysis. First, we analyzed the between- subjects component by subjecting the reports of forecasters and nonforecasters to a 2 (time: immediate vs. delayed) x 2 (deci- sion: fair vs. unfair) x 2 (role: forecaster vs. nonforecaster) ANOVA in which time was a within-subject variable. The analy- sis revealed a significant main effect of decision, F ( 1, 74) = 8.35, p < .01, that was qualified by a marginally significant Time x Decision interaction, F ( 1, 74) = 3.09, p = .083. As shown in Table 7, the fairness of the decision had a greater impact after a delay, F ( 1, 76) = 9.81, p = .002, than it did immediately, F (1 , 76) = 3.09, p = .08. It is important to note that role had no main or interactive effects in this analysis, indicating that the act of making a forecast did not influence the part icipants ' subsequent reports of their experiences. To be certain of this conclusion, we compared the experiences of fore- casters and nonforecasters in each condition, and none of these contrasts were significant, all Fs < 1.
Accuracy of Affective Forecasts
Study 6 also had a within-subject component (one group of participants both made forecasts and reported their experi- ences) , and analysis of that component allowed us to examine the accuracy of the forecasts made by "dua l - ro l e " participants.
Table 7
Affective Forecasts and Experiences of Participants in Study 6
Experiences Forecasts
Time Nonforecasters Forecasters (forecasters)
Immediate Fair decision
M -1.00 -0.68 -2.11 SD 1.29 1.34 1.94 n 19 19 19
Unfair decision M -0.35 -0.40 -2.10 SD 0.88 1.19 1.68 n 20 20 20
Delayed Fair decision
M -0.84 - 1.26 -2.00 SD 1.54 1.97 1.45 n 19 19 19
Unfair decision M -0.10 0.00 - 1.90 SD 0.85 1.12 2.02 n 20 20 20
Note. Measures are changes from baseline. Smaller values indicate greater actual or predicted decreases in happiness.
IMMUNE NEGLECT 633
The forecasts and experiences of the dual-role participants were submitted to a 2 (time: immediate vs. delayed) × 2 (decision: fair vs. unfair) × 2 (measure: experience vs. forecast) ANOVA in which time and measure were within-subject variables. The analysis revealed only a main effect of measure, F(1, 37) = 22.24, p < .001, such that all dual-role participants were happier than they thought they would be. Although the three-way inter- action was not significant (p = . 181 ), a series of planned con- trasts revealed the predicted pattern of results. As shown in Table 6, dual-role participants in the fair and unfair decision conditions made similar predictions about how they would feel immediately after hearing the bad news, F < 1, and they made similar predictions about how they would feel 10 min later, F < 1. In other words, dual-role participants' predictions were unaffected by the fairness of the upcoming decision. As also shown in Table 7, dual-role participants in the fair and unfair decision conditions felt the same immediately after hearing the bad news, F < 1, but felt differently 10 min later. Specifically, after 10 min, dual-role participants in the unfair condition felt better than did dual-role participants in the fair condition, F( 1, 37) = 6.14, p = .018.
In summary, participants in Study 6 predicted that they would feel equally bad if they were rejected for a job on the basis of a fair or an unfair decision, but, contrary to their predictions, participants felt better after having been rejected on the basis of an unfair than a fair decision, and this difference was much more pronounced 10 min after the rejection than immediately after the rejection. Apparently, participants did not realize how the basis of the decision would, over time, change their affective reaction to it.
General Discussion
The foregoing studies offer evidence for the existence of a durability bias in affective forecasting. In our studies, students, professors, voters, newspaper readers, test takers, and job seek- ers overestimated the duration of their affective reactions to romantic disappointments, career difficulties, political defeats, distressing news, clinical devaluations, and personal rejections. Furthermore, on some occasions, these overestimates seemed to occur because participants did not consider how readily they would "explain away" setbacks, tragedies, and failures once they happened. Although these studies demonstrate the existence of the durability bias and suggest one of its underlying causes, they raise many questions. We consider five of these questions particularly worthy of discussion.
What Mechanisms Cause the Durability Bias?
All six of our studies revealed a durability bias in affective forecasts for negative events. Although the asymmetry between the positive and negative durability bias suggests that immune neglect may have played a role in producing the durability bias in the first three studies, other factors were undoubtedly at work in these studies too. For example, numerous events transpire in the month that follows an election, and the failure to consider those events when making affective forecasts (focalism) may well have played a role in voters' mispredictions in Study 3 (see Wilson et al., 1998). Similarly, the romantic breakup that
an inexperienced person imagines is probably different in many respects from the romantic breakup that an experienced person remembers (misconstrual), and that difference may have played an important role in students' mispredictions in Study 1. In other words, because so many mechanisms were operating at once--and because we did not include design features that would uniquely implicate any one of them--the first three stud- ies established the durability bias as a phenomenon without isolating its causes.
However, the last three studies did isolate causal mechanisms, and it is worth considering just what kinds of conclusions their results support. First, each of these studies was carefully de- signed to preclude the operation of misconstrual and focalism. We precluded misconstrual by making sure that forecasters could imagine every detail of the event correctly. We provided them with complete copies of the feedback they would receive (Study 4), we showed them detailed summaries of the stories they would read (Study 5), and we manufactured a simple loss whose details were well known and unambiguous (Study 6). If forecasters failed to predict how they would feel some time after these events occurred, it was not because they failed to understand what the events entailed. Similarly, we precluded focalism by asking forecasters to predict how they would feel a very short time after a focal event took place, and we made sure that no significant nonfocal events happened in the interim. If forecasters failed to predict how they would feel a few minutes after an event occurred, it was not because experiencers forgot about the focal event or because something unexpected hap- pened in the interval between the focal event and the experi- encers' reports. These features of our experimental designs allow us to state with confidence that the durability bias does not require that people misunderstand the nature of the events about which they are making forecasts, nor that people fail to consider the nonfocal events that transpire after the focal event. Misconstrual and focalism may be sufficient, but they are not necessary, causes of the durability bias.
But what of the other mechanisms? We did not attempt to preclude undercorrection, inaccurate theories, and motivational distortion, and thus any or all of these mechanisms may have played a role in producing the durability bias in Studies 4-6 . None, however, can account for the pattern of data that uniquely implicates immune neglect. People may fail to correct their inferences about their initial reactions by taking into account the effects of the passage of time (undercorrection), they may motivate themselves to work harder by making overly dire pre- dictions about the emotional consequences of failure (motivated distortion), or they may simply have inappropriate ideas about how much certain things hurt (inaccurate theories). Any one of these facts might explain why participants overestimated the duration of their negative affect, but only immune neglect ex- plains why forecasters failed to distinguish between events that, according to experiencers' reports, facilitated or inhibited the immune system. In short, several causal mechanisms may have been operating in Studies 4-6 , but immune neglect certainly was operating. We do not wish to claim that the durability bias was caused solely by immune neglect in any of our studies; rather, we merely wish to claim that immune neglect was clearly a causal factor in Studies 4-6 .
634 GILBERT, PINEL, WILSON, BLUMBERG, AND WHEATLEY
Are Experiencers Really Happy?
Participants reported being happier than they expected to be, and one may wonder whether they were telling the truth. It is possible, for example, that participants experienced and recog- nized their unhappiness ( " I can't believe I didn't get the job!" ) but deliberately concealed it to save face ("I'11 never let them see me cry" ). For several reasons, we consider "false bravado" to be an unlikely explanation of our results. First, in some of our studies (e.g., Study 6), such a face-saving maneuver would have required participants to contradict their own predictions, and admitting that one could not foresee one's own emotional reactions to failure is surely no less embarrassing than admitting that one feels bad after failure. Second, if participants felt com- pelled to display false bravado, then why were forecasters per- fectly willing to predict that they would feel bad after receiving mundane personality feedback, reading a tragic story, or failing to get a job? Such predictions hardly smack of machismo. Third, if experiencers were reluctant to confess their negative affective states, then why did we not observe similar reluctance among participants with positive self-views who received negative feed- back from a team of clinicians in Study 4, participants who read the blameless story in Study 5, or participants who reported their affective states immediately after being rejected for a job in Study 6? All of this suggests that participants in our studies were indeed telling the truth as they knew it.
But did they know it? One might argue that those participants who claimed to be happy after a negative event were not really happy, even if they believed they were. Arguments such as these bring One face to face with one of philosophy' s enduring conun- drums; Can people be wrong about their own internal experi- ences? On the one hand, psychologists have amassed consider- able evidence to suggest that people can indeed be mistaken about how they feel toward an object (e.g., Greenwald & Banaji, 1995; Nisbett & Wilson, 1977; Quattrone, 1985; Wilson, 1985), and, as such, their overt behaviors often provide better evidence of their internal states than do their verbal reports. As Rorty (1970, p. 400) argued:
If I say that I believe that p, or desire X, or am afraid, or am intending to do A, what I go on to do may lead others to say that I couldn't really have believed p, or desired X, or been afraid, or intended to do A. Statements about beliefs, desires, emotions, and intentions axe implicit predictions of future behavior, predictions which may be falsified.
On the other hand, some theorists have suggested that candid self-reports of subjective experience are, by definition, correct. As Dennett (1981, p. 218) explained:
Suppose someone is given the post-hypnotic suggestion that upon awakening he will have a pain in his wrist. If the hypnosis works, is it a case of pain, hypnotically induced, or merely a case of a person who has been induced to believe he has a pain? If one answers that the hypnosis has induced real pain, suppose the post- hypnotic suggestion had been: "On awakening you will believe you have a pain in the wrist." If this suggestion works, is the circumstance just like the previous one? Isn't believing you axe in pain tantamount to being in pain?
Can people be wrong about how they feel? We think it depends
on what one means by feel When people are asked how they feel about something in particular ( "Do you like rutabaga farm- ers?" ), the word feel is being used in a dispositional rather than an occurrent sense (Ryle, 1949), and thus an individual's most candid reply may be inaccurate. For example, people may have a variety of conflicting beliefs about a single object ( " I often think of myself as a friend to farmers" and "Rutabagas are the cause of our nation's growing malaise" ), and unless all of these beliefs are recalled at once, their verbal report of their attitude toward the object may be biased in the direction of those beliefs that come most quickly to mind. On the other hand, when people are asked how they feel in general--and not how they feel about something--then the word feel is being used in an oc- current rather than a dispositional sense, and they are being asked to say what it is like to be them at that moment. If they are candid and articulate, then one can make the case that their verbal reports are unimpeachable.
The take-home point is this: Verbal reports of relatively endur- ing tendencies can be distinguished from verbal reports of sub- jective experience, and psychologists may question the validity of the former while accepting the integrity of the latter, We believe that our experiencers believed that they were happier than our forecasters predicted they would be. Whether the expe- riencers' beliefs were right or wrong is a question to which no one--experiencer, philosopher, or psychologist--can, at pres- ent, offer a definitive answer.
Why Do People Neglect the Immune System ?
People are quick to notice the immune responses of their friends and neighbors ( " I sn ' t it interesting that just moments after learning his SAT score, Herb suddenly remembered that standardized tests are biased?" ), and most will reluctantly con- fess that they too have a modest talent for reasoning after the fact. If people know in the abstract that they have such talents, then why do they fail to consider those talents when attempting to forecast their own affective reactions? Although our studies did not address these issues directly, we can think of at least three reasons why forecasters might consider it unwise to be- come too wise about their psychological immunity.
First, most events that are potentially aversive are also poten- tially appetitive, and if one allows oneself to think about how easily an undesired outcome can be explained away ( "This job is a dime a dozen, and if I don't get it, I can get one just like i t") , one may find that one has inadvertently explained away the desired outcome as well ("Which means that if I do get it, there's really not much to celebrate"). Although some of the rationalizations that the immune system produces can abrogate failure and accentuate success ("The umpire hates me and my family" ), others have the unfortunate consequence of neutraliz- ing both outcomes ("The umpire is blind"). Because the at- tempt to minimize defeat may sometimes minimize victory as well, it may not behoove people to consider such matters too carefully before the fact. Second, forecasters may not "look ahead" and consider how their psychological immune systems will respond to a negative event because acute awareness of one's immune system may have the paradoxical effect of sup- pressing it. When people catch themselves in the act of bending the truth or shading the facts, the act may fail. Third, and finally,

IMMUNE NEGLECT 635
if people were aware of how readily their affective reactions to failure, misfortune, or bad news could be mentally undone, they might not be motivated to take the actions required to preclude those outcomes. As we noted earlier, the durability bias may be part of a self-regulatory scheme by which people use forecasts of the future to control their behavior in the present (Ainslie, 1992; Elster, 1977; Mischel et al., 1996; ScheUing, 1984), and such schemes would be undermined if people recognized in prospect how easily they could deal in retrospect with undesired outcomes. In somewhat more clinical language, if people real- ized how capable they were of emotion-focused coping (i.e., dealing psychologically with negative affect), they might not engage in problem-focused coping (i.e., dealing physically with the environmental sources of their negative affect; see Lazarus, 1985). An organism aware of its ability to construct its own satisfaction might well lose its preferences for one outcome over another and become happily extinct.
Do People Learn From Their Forecasting Errors?
Several theorists have noted that people tend to focus on different kinds of information when they are pondering a deci- sion, making a decision, implementing a decision, and retro- specting about a decision (Gollwitzer, 1993; Gollwitzer, Heck- hausen, & Steller, 1990; Jones & Gerard, 1967). Rachman and his colleagues (Rachman, 1994; Rachman & Bichard, 1988; Taylor & Rachman, 1994) have applied this insight to the predic- tion of fear. For example, people with claustrophobia tend to believe that they will be more frightened by a small enclosure than they actually are, and Rachman et al. have suggested that this happens because people focus on "fear cues" when antici- pating an encounter ( "Oh my, that closet looks so dark and cramped!") , but, once the encounter begins, they shift their focus to "safety cues" that enable them to tolerate or terminate the encounter ("The door knob is here by my left hand, and the light switch is here by my right hand"; see also Telch, Valentiner, & Bolte, 1994). People with claustrophobia overpre- dict their fear because they do not realize that their attentional focus will shift once the closet door is closed. Normally this leads people with claustrophobia to avoid coffins, closets, and laundry hampers; if forced to predict and then experience their fear in the laboratory, however, they learn to make more accurate predictions in just a few trials (see Rachman, Levitt, & Lopatka, 1988).
Our studies similarly suggest that people focus on one kind of information when making affective forecasts about an event ( "Oh my, that personality feedback looks so embarrassing and demoralizing" ) and on another kind of information when expe- riencing the event ("So, on the one hand, the feedback was from a computer, and on the other hand, who cares?" ). If people do not realize in the present how things will look in the future, then it might be expected that when the future arrives they will recognize their forecasting errors and learn from them. Yet, in our studies, the durability bias appeared in several contexts that ought to have been generally familiar to our participants. Surely participants in Study 4 had received negative feedback in the course of their lives, surely participants in Study 5 had read tragic accounts in the newspaper, and surely participants in Study 6 had not gotten everything they had ever striven for.
So why did these participants mispredict the duration of their affective reactions to ordinary traumas that were at least similar to those they had probably experienced before?
One possibility is that people ordinarily learn less from their forecasting errors than laboratory research would suggest. For example, when people experience less enduring outcomes than they initially predicted, they may not always realize that they initially mispredicted them. It is the unusual situation that re- quires an individual to make an explicit affective forecast ("After much internal debate, I 've decided that I ' l l be happier with a BMW than a Miata") , and even when people do make such explicit forecasts, these forecasts are rarely so precise ( " I thought the BMW would give me 5.3 units of happiness" ) that they can be unequivocally disconfirmed by subsequent experi- ence ( " S o how come I only got 5.1 units?" ). Furthermore, even the most explicit and precise forecast must be accurately recalled if it is to be explicitly and precisely disconfirmed, and research suggests that the ability to remember one's own beliefs, attitudes, and expectations is far from perfect (Loewenstein & Adler, 1995; Ross, 1989). For all of these reasons, then, it seems likely that when errors of affective forecasting are disconfirmed by experience, those disconfirmations may still often go unno- ticed. As such, the evidence that might alert people to the opera- tion of the psychological immune system may be especially hard for them to come by.
Even when people do recognize that they have mispredicted their affective reactions ("Gee , the roller coaster ride wasn't as terrible as I thought it would be" ), the lessons they take away from these mispredictions may be specific ( " I guess I can deal with speed better than I realized" ) rather than general ( " I guess I can deal with everything better than I realized" ). People may find it easier to blame their mispredictions on misconstruals of the event ("Well , it looked a lot higher from the ground than it actually was") than on their failure to consider their ability to internally regulate their affective states ( " I failed to recognize that once I was strapped in, I would suddenly see that it was fruitless to worry" ). In short, many factors may prevent people from noticing that they have made affective forecasting errors, and many more factors may keep them from realizing that the errors they do notice were brought about by immune neglect.
What Are the Limits of the Durability Bias?
In our studies, we found the durability bias wherever we looked, but, of course, we looked where we thought we would find it. The durability bias may well be a pervasive phenomenon, but surely it is just as important to know its limits as it is to know its reach. One possible limit has to do with the valence of the event about which the affective forecast is made. In half of our studies, we examined forecasts and experiences of positive affect, and across those studies we found no significant evidence of a positive durability bias. And yet, everyone knows that peo- ple occasionally overestimate the duration of their positive expe- riences, and we have found reliable evidence for such a bias in some of our own studies (Wilson et al., 1998). Nonetheless, the relative ease and difficulty with which these two biases are produced suggests that one may be more robust than the other. Why should that be the case?
One possibility is the one we noted at the outset: The psycho-

636 GILBERT, PINEL, WILSON, BLUMBERG, AND WHEATLEY
logical immune system ameliorates negative affect but does not augment positive affect, and hence immune neglect produces only a negative durability bias. Thus, in any complex situation in which numerous mechanisms are simultaneously at work, there will be more mechanisms conspiring to produce a negative than a positive durability bias. Another possible explanation for the weakness of the positive durability bias has to do with the way in which affective forecasts guide behavior. People natu- rally avoid those events that they believe will produce negative affective consequences ("No, I 'd prefer not to eat snails, thank you" ) and, hence, may fail to learn that such beliefs are some- times mistaken (e.g., Herrnstein, 1969; Seligman, 1975). Con- versely, people may seek those events that they believe will produce positive affective consequences ("But yes, a few more vodka tonics, please" ), and thus they may have ample opportu- nity to learn that such beliefs are sometimes mistaken. If people consistently act on their forecasts, they will inevitably experi- ence fewer disconfirmations of their overly pessimistic predic- tions than of their overly optimistic predictions, and thus experi- ence may cure the positive durability bias more quickly than the negative durability bias. Indeed, old age may be characterized by a loss of idealism in part because people may learn that the things they once thought would make them permanently happy did not actually do so; because they avoided the things that they believed would make them permanently unhappy, however, they may have failed to learn that those beliefs were equally untrue.
If the valence of an affective forecast describes one limit on the durability bias, then the direction of misprediction describes another. Simply put, people may underpredict as well as overpre- dict the duration of their affective reactions. For example, people may be surprised to find that the death of a great uncle pains them for much longer than they would have thought possible, that a new sports car gives them greater daily pleasure than they could have imagined, or that a decision to forgo a job offer or marriage proposal led to years of unanticipated regret (Gilo- vich & Medvec, 1995). Although instances such as these surely do occur, our analysis suggests two reasons why overprediction of affective duration is probably more common than underpre- diction. First, some of the mechanisms we have identified (such as misconstrual, incorrect theories, motivational distortion, and focalism) can produce both underestimation and overestimation, but others (such as undercorrection and immune neglect) can produce overestimation only. We know of no mechanism that would produce underestimation only. Second, underpredictions may be more likely to be remedied by experience than are overpredictions. For example, Rachman and his colleagues have shown that people frequently overpredict their fear and anxiety and that these overpredictions are slowly reduced over many experimental trials in which the person makes explicit predic- tions and then, moments later, makes an explicit experiential report that contradicts that prediction (see Rachman, 1994). However, when people occasionally underpredict their fear or anxiety, this mistake is usually eliminated in just one trial. And it is not difficult to see why: One may touch a stove gingerly several times before coming to believe that it is indeed cooler than anticipated, but it requires just one good scorching to rem- edy the opposite misapprehension. If underpredictions of nega- tive affect are met with unexpected punishment, whereas over- predictions yield pleasant surprises (when they are noted at all),
then one might well expect that, over time, the overpredictions will become more common than underpredictions.
Although we see little evidence of underestimation in either our lives or our laboratories, it is certainly possible that such evidence is simply waiting to be found. For now, we will place a public bet on the predominance of the durability bias, fully confident that should our faith prove misplaced, we will not be embarrassed for long.
References
Affleck, G., & Tennen, H. (1996). Construing benefits from adversity: Adaptational significance and dispositional underpinnings. Journal of Personality, 64, 899-922.
Ainslie, G. (1992). Picoeconomics: The strategic interaction of succes- sive motivational states within the person. Cambridge, England: Cam- bridge University Press.
Andrews, E M., & Robinson, J. P. ( 1991 ). Measures of subjective well- being. In J. P. Robinson, P.R. Shaver, & L. S. Wrightsman (Eds.), Measures of personality and social psychological attitudes (Vol. 1, pp. 61-114). San Diego, CA: Academic Press.
Baron, J. (1992). The effect of normative beliefs on anticipated emo- tions. Journal of Personality and Social Psychology, 63, 320-330.
Brickman, P., Coates, D., & Janoff-Bulman, R. J. (1978). Lottery win- ners and accident victims: Is happiness relative? Journal of Personal- ity and Social Psychology, 36, 917-927.
Collins, R. L., Taylor, S. E., & Skokan, L. A. (1990). A better world or a shattered vision? Changes in life perspectives following victimization. Social Cognition, 8, 263-285.
Dennett, D. C. ( 1981 ). Brainstorms: Philosophical essays on mind and psychology. Cambridge, MA: Bradford/MIT Press.
Diener, E. (1984). Subjective well-being. Psychological Bulletin, 95, 542-575.
Diener, E. (1994). Assessing subjective well-being: Progress and oppor- tunities. Social Indicators Research, 31, 103-157.
Diener, E., Emmons, R.A., Larsen, R.J., & Griffin, S. (1985). The Satisfaction With Life Scale. Journal of Personality Assessment, 49, 71-75.
Dunning, D., Griffin, D.W., Milojkovic, J., & Ross, L. (1990). The overconfidence effect in social prediction. Journal of Personality and Social Psychology, 58, 568-581.
Elster, J. (1977). Ulysses and the sirens. Cambridge, England: Cam- bridge University Press.
Elster, J., & Loewenstein, G. (1992). Utility from memory and anticipa- tion. In G. Loewenstein & J. Elster (Eds.), Choice over time (pp. 213-234). New York: Russell Sage Foundation.
Erber, R., & Tesser, A. (1992). Task effort and the regulation of mood: The absorption hypothesis. Journal of Experimental Social Psychol- ogy, 28, 339-359.
Erber, R., Wegner, D. M., & Therriault, N. (1996). On being cool and collected: Mood regulation in anticipation of social interaction. Jour- nal of Personality and Social Psychology, 70, 757-766.
Festinger, L. (1957). A theory of cognitive dissonance. Stanford, CA: Stanford University Press.
Fordyce, M. W. (1988). A review of research on the happiness measures: A sixty second index of happiness and mental health. Social Indicators Research, 20, 355-381.
Fredrickson, B. L., & Kahneman, D. (1993). Duration neglect in retro- spective evaluations of affective episodes. Journal of Personality and Social Psychology, 65, 45-55.
Freud, A. (1936). Ego and the mechanisms of defense (rev. ed., C. Baines, Trans.). New York: International Universities Press.
Gilbert, D. T. ( 1991 ). How mental systems believe. American Psycholo- gist, 46, 107-119.
IMMUNE NEGLECT 637
Gilbert, D.T., Gill, M.J., & Wilson, T D. (1998). How do we know what we will like? The informational basis of affective forecasting. Unpublished manuscript, Harvard University, Cambridge, MA.
Gilbert, D. T, & Wilson, T D. (in press). Miswanting. In J. Forgas (Ed.), Thinking and feeling: The role of affect in social cognition. Cambridge, England: Cambridge University Press.
Gilovich, T, & Medvec, V. H. (1995). The experience of regret: What, when, and why. Psychological Review, 102, 379-395.
Gollwitzer, E M. (1993). Goal achievement: The role of intentions. In W. Stroebe & M. Hewstone (Eds.), European review of social psy- chology (Vol. 4, pp. 141-185). London: Wiley.
Gollwitzer, E M., Heckhausen, H., & Steller, B. (1990). Deliberative and implementat mind-sets: Cognitive tuning toward congruous thoughts and information. Journal of Personality and Social Psychol- ogy, 59, 1119-1127.
Greenwald, A. G. (1980). The totalitarian ego: Fabrication and revision of personal history. American Psychologist, 35, 603-618.
Greenwald, A. G., & Banaji, M.R. (1995). Implicit social cognition: Attitudes, self-esteem, and stereotypes. Psychological Review, 102, 4-27.
Griffin, D. W., Dunning, D., & Ross, L. (1990). The role of construal processes in overconfident predictions about the self and others. Jour- nal of Personality and Social Psychology, 59, 1128-1139.
Griffin, D. W., & Ross, L. ( 1991 ). Subjective cons~ual, social inference, and human misunderstanding. In M. Zanna (Ed.), Advances in experi- mental social psychology (Vol. 24, pp. 319-356). New York: Aca- demic Press.
Gur, R. C., & Sackheim, H.A. (1979). Self-deception: A concept in search of a phenomenon. Journal of Personality and Social Psychol- ogy, 37, 147-169.
Helmreich, W. B. (1992). Against all odds: Holocaust survivors and the successful lives they made in America. New York: Simon & Schuster.
Herrnstein, R. J. (1969). Method and theory in the study of avoidance. Psychological Review, 76, 49-69.
Herrnstein, R. J. (1990). Rational choice theory. American Psychologist, 45, 356-367.
Isen, A. M. (1987). Positive affect, cognitive processes, and social be- havior. In L. Berkowitz (Ed.), Advances in experimental social psy- chology (Vol. 20, pp. 203-253). San Diego, CA: Academic Press.
Janoff-Bulman, R. (1992). Shattered assumptions: Towards a new psy- chology of trauma. New York: Free Press.
Jones, E. E., & Gerard, H. B. (1967). Foundations ofsocial psychology. New York: Wiley.
Kahana, E., Kahana, B., Harel, Z., & Rosner, T. (1988). Coping with extreme trauma. In J. P. Wilson, Z. Harel, & B. Kahana (Eds.), Human adaptation to extreme stress: From the Holocaust to Vietnam (pp. 55-79). New York: Plenum.
Kahneman, D., & Snell, J. (1990). Predicting utility. In R. Hogarth (Ed.), Insights' in decision making (pp. 295-310). Chicago: Univer- sity of Chicago Press.
Kahneman, D., & Snell, J. (1992). Predicting a change in taste: Do people know what they will like? Journal of Behavioral Decision Making, 5, 187-200.
Kahneman, D., & Tversky, A. (1979). Prospect theory: An analysis of decision under risk. Econometrica, 47, 263-291.
Kammann, R., & Flea, R. (1983). Affectometer 2: A scale to measure current level of general happiness. Australian Journal of Psychology, 35, 257-265.
Kunda, Z. (1990). The case for motivated reasoning. Psychological Bulletin, 108, 480-498.
Lazarus, R. S. (1985). The costs and benefits of denial. In A. Monat & R. S. Lazarus (Eds.), Stress and coping: An anthology (2nd ed., pp. 154-173). New York: Columbia University Press.
Lehman, D. R., Davis, C. G., Delongis, A., Wortman, C. B., Bluck, S.,
Mandel, D.R., & Ellard, J.H. (1993). Positive and negative life changes following bereavement and their relations to adjustment. Journal of Social and Clinical Psychology, 12, 90-112.
Leaner, M. J. ( 1980 ). The belief in a just world: A fundamental delusion. New York: Plenum.
Loewenstein, G., & Adler, D. (1995). A bias in the prediction of tastes. Economic Journal, 105, 929-937.
Loewenstein, G., & Frederick, S. (1997). Predicting reactions to envi- ronmental change, In M.H. Bazerman, D.M. Messick, A.E. Ten- brunsel, & K. A. Wade-Benzoni (Eds.), Environment, ethics, and be- havior (pp. 52-72). San Francisco: New Lexington Press.
Loewenstein, G., & Schkade, D. (in press). Wouldn't it be nice?: Pre- dicting future feelings. In E. Diener, N. Schwartz, & D. Kahneman (Eds.), Hedonic psychology: Scientific approaches to enjoyment, suf- fering, and well-being. New York: Russell Sage Foundation.
McCrae, R. R., & Costa, P. T., Jr. (1994). The stability of personality: Observations and evaluations. Current Directions in Psychological Science, 6, 173-175.
Mischel, W., Cantor, N., & Feldman, S. (1996). Principles of self- regulation: The nature of willpower and self-control. In E.T. Hig- gins & A. W. Krnglanski (Eds.), Social psychology: Handbook of basic principles (pp. 329-360). New York: Guilford Press.
Mitchell, T. R., & Thompson, L. (1994). A theory of temporal adjust- ments of the evaluation of events: Rosy prediction and rosy retrospec- tion. Advances in Managerial Cognition and Organizational Informa- tion Processes, 5, 85-114.
Nisbett, R. E., & Wilson, T. D. (1977). Telling more than we can know: Verbal reports on mental processes. Psychological Review, 84, 231- 259.
Norem, J. K., & Cantor, N. (1986). Defensive pessimism: Harnessing anxiety as motivation. Journal of Personality and Social Psychology, 51, 1208-1217.
Parrott, W. G. (1993). Beyond hedonism: Motives for inhibiting good moods and for maintaining bad moods. In D.M. Wegner & J. W. Pennebaker (Eds.), Handbook of mental control (pp. 278-305). En- glewood Cliffs, NJ: Prentice Hall.
Prelec, D., & Loewenstein, G. (1997). Beyond time discounting. Mar- keting Letters, 8, 97-108.
Quattrone, G. A. (1985). On the congruity between internal states and action. Psychological Bulletin, 98, 3-40.
Rachman, S. (1994). The overprediction of fear: A review. Behavior Research and Therapy, 32, 683-690.
Rachman, S., & Bichard, S. (1988). The overprediction of fear. Clinical Psychology Review, 8, 303-312.
Rachman, S., Levitt, K., & Lopatka, C. (1988). Experimental analyses of panic: Claustrophobic subjects. Behavior Research and Therapy, 26, 41-52.
Read, D., & Loewenstein, G. (1995). Diversification bias: Explaining the discrepancy in variet~ seeking between combined and separated choices. Journal of Experimental Psychology: Applied, 1, 34-49.
Rorty, R. (1970). Incorrigibility as the mark of the mental. Journal of Philosophy, 67, 399-424.
Rosenthal, R., & Rosnow, R. L. (1985). Content analyses: Forced com- parisons in the analysis of variance. Cambridge, England: Cambridge University Press.
Rosnow, R. L., & Rosenthal, R. (1995). Some things you learn aren't so: Cohen's paradox, Asch's paradigm, and the interpretation of inter- action. Psychological Science, 6, 3-9.
Ross, M. (1989). Relation of implicit theories to the construction of personal histories. Psychological Review, 96, 341-357.
Ryle, G. (1949). The concept of mind. London: Hutchinson. Schelling, T. (1984). Self-command in practice, in policy, and in theory
of rational choice. American Economic Review, 74, 1 - 11. Schkade, D. A., & Kahneman, D. (1997). Would you be happy if you

638 GILBERT, PINEL, WILSON, BLUMBERG, AND WHEATLEY
lived in California? A focusing illusion in judgments of weU-being. Unpublished manuscript, University of Texas, Austin.
Seligman, M. E. P. (1975). Helplessness: On depression, development, and death. San Francisco: Freeman.
Snell, J., Gibbs, B. J., & Varey, C. (1995). Intuitive hedonics: Consumer beliefs about the dynamics of liking. Journal of Consumer Psychol- ogy, 4, 33-60.
Steele, C. (1988). The psychology of self-affirmation: Sustaining the integrity of the self. In M. Zanna (Ed.), Advances in experimental social psychology (Vol. 21, pp. 261-303). New York: Academic Press.
Suedfeld, P. (1997). Reactions to societal trauma: Distress and/or eu- stress. Political Psychology, 18, 849-861.
Suh, E., Diener, E., & Fujita, E (1996). Events and subjective well- being: Only recent events matter. Journal of Personality and Social Psychology, 70, 1091-1102.
Tafarodi, R. W., &Swann, W. B., Jr. (1995). Self-liking and self-compe- tence as dimensions of global self-esteem: Initial validation of a mea- sure. Journal of Personality Assessment, 65, 322-342.
Taylor, S.E. (1983). Adjustment to threatening events: A theory of cognitive adaptation. American Psychologist, 38, 1161 - 1174.
Taylor, S.E. (1991). Asymmetrical effects of positive and negative events: The mobilization-minimization hypothesis. Psychological Bul- letin, 110, 67-85.
Taylor, S. E., & Armor, D. A. (1996). Positive illusions and coping with adversity. Journal of Personality, 64, 873-898.
Taylor, S.E., & Brown, J. (1988). Illusion and well-being: A social psychological perspective on mental health. Psychological Bulletin, 103, 193-210.
Taylor, S., & Rachman, S. J. (1994). Stimulus estimation and the over-
prediction of fear. British Journal of Clinical Psychology, 33, 173- 181.
Telch, M. J., Valentiner, D., & Bolte, M. (1994). Proximity to safety and its effects in fear prediction bias. Behavior Research and Therapy, 32, 747-751.
Totterdell, P., Parkinson, B., Briner, R. B., & Reynolds, S. (1997). Fore- casting feelings: The accuracy and effects of self-predictions of mood. Journal of Social Behavior and Personality, 12, 631-650.
Tversky, A., & Kahneman, D. (1974). Judgment under uncertainty: Heuristics and biases. Science, 185, 1124-1131.
Vaillant, G. (1993). The wisdom of the ego. Cambridge, MA: Harvard University Press.
Wegener, D.T., & Petty, R.E. (1994). Mood management across af- fective states: The hedonic contingency hypothesis. Journal of Person- ality and Social Psychology, 66, 1034-1048.
Wilson, T. D. (1985). Strangers to ourselves: The origins and accuracy of beliefs about one's own mental states. In J. H. Harvey & G. Weary (Eds.), Attribution: Basic issues and applications (pp. 9-36) . Or- lando, FL: Academic Press.
Wilson, T.D., Wheatley, T., Meyers, J., Gilbert, D.T., & Axsom, D. (1998). Focalism: A source of durability bias in affective forecasting. Unpublished manuscript, University of Virginia, Charlottesville.
Wortman, C. B., & Silver, R. C. (1987). Coping with irrevocable loss. In G. R. VandenBos & B. K. Bryant (Eds.), Cataclysms, crises, and catastrophes: Psychology in action (pp. 185-235 ). Washington, DC: American Psychological Association.
Wortman, C. B., & Silver, R. C. (1989). The myths of coping with loss. Journal of Consulting and Clinical Psychology, 57, 349-357.
Received April 11, 1997 Revision received March 17, 1998
Accepted March 21, 1998 •
Copyright © 2022 FDOKUMEN