Image Processing of Artificial Targets for Automatic Evaluation of Spray Quality
12
Transactions of the ASABE Vol. 51(3): 811-821 E 2008 American Society of Agricultural and Biological Engineers ISSN 0001-2351 811 IMAGE PROCESSING OF ARTIFICIAL T ARGETS FOR AUTOMATIC EVALUATION OF SPRAY QUALITY A. R. S. Marçal, M. Cunha ABSTRACT. A fully automatic methodology based on image processing is proposed to evaluate the quality of spray application sampled by water‐sensitive papers (WSP). The methods proposed permit a computation of the fraction of spray coverage, an evaluation of the homogeneity of the spray spatial spread at various scales and directions, and extraction of stain and droplet size range and distribution. This allows the number of droplets per unit area and the standard droplet size spectra factors to be computed. The methods were tested with a number of test samples scanned at different resolutions, proving to be effective in situations where there is high spray coverage in the WSP, thus with considerable overlap between stains. The most suitable scanning resolution was found to be 600 dpi. The results obtained by the image processing methods were successfully compared with a manual (visual) counting of stains in a test sample. Keywords. Homogeneity indices, Image processing, Spot size, Spray coverage, Water‐sensitive paper. esticides and many fertilizers are often applied as liquid solutions, emulsions, and suspensions sprayed onto plant foliage or onto the soil. A proper adjustment of the sprayer improves the accuracy and the efficiency, resulting in a more uniform and targeted spray deposit, which contributes to preventing inadequate pest con‐ trol or plant response; induction of resistance; economical loss of product, time and labor; and environmental pollution. It is therefore important to monitor the spray quality and quantity reaching target and off‐target areas in order to im‐ prove pesticide spray application efficiency and to reduce en‐ vironmental contamination. Many field techniques have been developed for evaluat‐ ing spray deposits and coverage, such as passive samplers (e.g., water‐sensitive paper), active samplers (e.g., air sam‐ ples and rotorods), and digital devices. Reviews of some of these techniques have been published, as well as the limiting factors for measurements (Turner and Huntington, 1970; Bateman, 1993; Fox et al., 1998; Panneton, 2002; Fox et al., 2003; Giles and Downey, 2003; Hoffman, 2003; Crowe et al., 2005 and Zhu et al. 2005). Water‐sensitive papers (WSP) have been used for more than 30 years (Turner and Huntington, 1970), being the most popular artificial targets for evaluation of spray coverage and deposit (Holownicki et al., 2002). Since water in spray stains the WSP and the spot size can be observed or measured, WSP can be used to evaluate the number of stains per unit area and Submitted for review in April 2007 as manuscript number PM 6967; approved for publication by Power & Machinery Division of ASABE in May 2008. The authors are André R. S. Marçal, Assistant Professor, Faculdade de Ciências, Universidade do Porto, Portugal; and Mário Cunha, Assistant Professor, Secção Autónoma de Engenharia das Ciências Agrárias, Faculdade de Ciências, Universidade do Porto, Campus Agrário de Vairão, Portugal. Corresponding author: André R. S. Marçal, Faculdade de Ciências, Universidade do Porto, DMA, Rua do Campo Alegre 687, 4169‐007 Porto, Portugal, phone: +351‐220402273; fax: +351‐ 220402209; e‐mail: [email protected]. to measure the percent area covered (Syngenta, 2002). Drop‐ let sizing is also possible when a proper spread factor or cal‐ ibration equation has been developed for specific image processing systems to convert droplet WSP stains to their ac‐ tual size (Syngenta, 2002, Giles and Downey, 2003; Hof‐ fman, 2003). The WSP can be evaluated by visual estimate (Syngenta, 2002; Fox, et al., 2003), by counting the stains un‐ der a lens, or by automatic image analysis (e.g., Panneton, 2002; Fox et al., 2003). There are different software applica‐ tions that produce indicators related to the spray quality based on image processing of scanned WSP, such as Optomax (Syngenta, 2002), DropletScan (Wolf, 2003), AgroScan (2008), and UTHSCSA ImageTool (2002). However, most of these software tools have not been specifically developed for this application and are therefore unable to properly evaluate the WSP. This is particularly noticed in situations where the volume of application is not sufficiently low to avoid consid‐ erable overlap between stain (Bateman, 1993; Fox et al., 1998; Salyani and Fox, 1999; Holownicki et al., 2002; Panne‐ ton, 2002; Fox et al., 2003). The current image‐based analy‐ sis systems are neither effective nor accurate for measuring spot density in WSP when coverage is greater than about 30% to 40% (Holownicki et al., 2002; Fox et al., 2003). The WSP are available in different sizes and can be ex‐ tremely useful when visualizing droplet sizes from different type of nozzles, droplet densities, spray distributions, and spray widths as well as penetration of spray into the crop can‐ opy from aerial and ground spray applications. Droplet size spectra factors can be used to compare the behavior of differ‐ ent nozzles and as inputs for computer models to predict, for example, the dispersion and deposition of aerially released spray material in spray application experiments. However, WSP have a limited value for quantitative assessment of droplet size measurement of high spray application rates. Manual droplet counting using lenses is limited to a maxi‐ mum of around 200 droplets per cm 2 , the equivalent of me‐ dium to coarse sprays (Syngenta, 2002), in which case there is minimal overlap of stains. In situations of high spray cover‐ age with overlapping spots, the contrast between the stained P
-
Upload
independent -
Category
Documents
-
view
1 -
download
0
Transcript of Image Processing of Artificial Targets for Automatic Evaluation of Spray Quality

Transactions of the ASABE
Vol. 51(3): 811-821 � 2008 American Society of Agricultural and Biological Engineers ISSN 0001-2351 811
IMAGE PROCESSING OF ARTIFICIAL TARGETS FOR
AUTOMATIC EVALUATION OF SPRAY QUALITY
A. R. S. Marçal, M. Cunha
ABSTRACT. A fully automatic methodology based on image processing is proposed to evaluate the quality of spray applicationsampled by water‐sensitive papers (WSP). The methods proposed permit a computation of the fraction of spray coverage, anevaluation of the homogeneity of the spray spatial spread at various scales and directions, and extraction of stain and dropletsize range and distribution. This allows the number of droplets per unit area and the standard droplet size spectra factors tobe computed. The methods were tested with a number of test samples scanned at different resolutions, proving to be effectivein situations where there is high spray coverage in the WSP, thus with considerable overlap between stains. The most suitablescanning resolution was found to be 600 dpi. The results obtained by the image processing methods were successfullycompared with a manual (visual) counting of stains in a test sample.
Keywords. Homogeneity indices, Image processing, Spot size, Spray coverage, Water‐sensitive paper.
esticides and many fertilizers are often applied asliquid solutions, emulsions, and suspensionssprayed onto plant foliage or onto the soil. A properadjustment of the sprayer improves the accuracy and
the efficiency, resulting in a more uniform and targeted spraydeposit, which contributes to preventing inadequate pest con‐trol or plant response; induction of resistance; economicalloss of product, time and labor; and environmental pollution.It is therefore important to monitor the spray quality andquantity reaching target and off‐target areas in order to im‐prove pesticide spray application efficiency and to reduce en‐vironmental contamination.
Many field techniques have been developed for evaluat‐ing spray deposits and coverage, such as passive samplers(e.g., water‐sensitive paper), active samplers (e.g., air sam‐ples and rotorods), and digital devices. Reviews of some ofthese techniques have been published, as well as the limitingfactors for measurements (Turner and Huntington, 1970;Bateman, 1993; Fox et al., 1998; Panneton, 2002; Fox et al.,2003; Giles and Downey, 2003; Hoffman, 2003; Crowe et al.,2005 and Zhu et al. 2005).
Water‐sensitive papers (WSP) have been used for morethan 30 years (Turner and Huntington, 1970), being the mostpopular artificial targets for evaluation of spray coverage anddeposit (Holownicki et al., 2002). Since water in spray stainsthe WSP and the spot size can be observed or measured, WSPcan be used to evaluate the number of stains per unit area and
Submitted for review in April 2007 as manuscript number PM 6967;approved for publication by Power & Machinery Division of ASABE inMay 2008.
The authors are André R. S. Marçal, Assistant Professor, Faculdade deCiências, Universidade do Porto, Portugal; and Mário Cunha, AssistantProfessor, Secção Autónoma de Engenharia das Ciências Agrárias,Faculdade de Ciências, Universidade do Porto, Campus Agrário de Vairão,Portugal. Corresponding author: André R. S. Marçal, Faculdade deCiências, Universidade do Porto, DMA, Rua do Campo Alegre 687,4169‐007 Porto, Portugal, phone: +351‐220402273; fax: +351‐220402209; e‐mail: [email protected].
to measure the percent area covered (Syngenta, 2002). Drop‐let sizing is also possible when a proper spread factor or cal‐ibration equation has been developed for specific imageprocessing systems to convert droplet WSP stains to their ac‐tual size (Syngenta, 2002, Giles and Downey, 2003; Hof‐fman, 2003). The WSP can be evaluated by visual estimate(Syngenta, 2002; Fox, et al., 2003), by counting the stains un‐der a lens, or by automatic image analysis (e.g., Panneton,2002; Fox et al., 2003). There are different software applica‐tions that produce indicators related to the spray qualitybased on image processing of scanned WSP, such as Optomax(Syngenta, 2002), DropletScan (Wolf, 2003), AgroScan(2008), and UTHSCSA ImageTool (2002). However, most ofthese software tools have not been specifically developed forthis application and are therefore unable to properly evaluatethe WSP. This is particularly noticed in situations where thevolume of application is not sufficiently low to avoid consid‐erable overlap between stain (Bateman, 1993; Fox et al.,1998; Salyani and Fox, 1999; Holownicki et al., 2002; Panne‐ton, 2002; Fox et al., 2003). The current image‐based analy‐sis systems are neither effective nor accurate for measuringspot density in WSP when coverage is greater than about 30%to 40% (Holownicki et al., 2002; Fox et al., 2003).
The WSP are available in different sizes and can be ex‐tremely useful when visualizing droplet sizes from differenttype of nozzles, droplet densities, spray distributions, andspray widths as well as penetration of spray into the crop can‐opy from aerial and ground spray applications. Droplet sizespectra factors can be used to compare the behavior of differ‐ent nozzles and as inputs for computer models to predict, forexample, the dispersion and deposition of aerially releasedspray material in spray application experiments. However,WSP have a limited value for quantitative assessment ofdroplet size measurement of high spray application rates.Manual droplet counting using lenses is limited to a maxi‐mum of around 200 droplets per cm2, the equivalent of me‐dium to coarse sprays (Syngenta, 2002), in which case thereis minimal overlap of stains. In situations of high spray cover‐age with overlapping spots, the contrast between the stained
P

812 TRANSACTIONS OF THE ASABE
(blue) and unstained area is not strong, and thus visual evalu‐ation becomes difficult (Panneton, 2002; Fox et al., 2003;Holownicki et al., 2002). In these situations, the percent ofarea covered is the most reliable parameter that can be ex‐tracted (Salyani and Fox, 1999), and WSP can only be usedfor rough visual assessment of spray distribution and/or croppenetration.
The advance of digital imaging technology has increasedthe resolution capabilities for spray particle sizing and dis‐tribution analysis from different passive samplers. However,there are still difficulties in the evaluation of homogeneity onthe card and for samples with droplet overlap. Image process‐ing techniques based on mathematical morphology havebeen used for granulometry studies (Dougherty and Sand,1995) and can be modified according to the specific require‐ments of the research described here.
The objective of this work is to present a fully automaticmethodology based on image processing to evaluate the qual‐ity of spray application sampled by WSP. A set of algorithmsand methods were developed for two distinct purposes: (1) toevaluate the homogeneity of the spray spatial spread, and(2)�to estimate the stain size range and distribution in situa‐tions of low stain density and high spray coverage with over‐lap between stains.
MATERIAL AND METHODSWATER‐SENSITIVE PAPERS
The water‐sensitive paper (WSP) targets used in this study(76 × 26 mm, TeeJet, Spraying Systems Co., Wheaton, Ill.)were collected as part of a sprayer evaluation study within a
vineyard. These papers are yellow, and the surface turns darkblue when water droplets make contact and spread. Applica‐tions with water were made at 250 to 1000 L ha -1 volumerates. These rates were obtained by using `Red' and `Blue'Albuz ATR cone nozzles (Ceramiques TechniquesDesmarquest, Evreux, France).
Three representative samples of spot density andhomogeneity distribution along the card were used, as wellas a blank WSP. The four WSP test samples (S0, S1, S2, andS3) were digitized in a photographic scanner (EPSONPerfection 4990 Photo). Four different scanning resolutionswere used, resulting in 24‐bit color images of 590 ×396�pixels (200 dots per inch, dpi), 885 × 594 pixels(300�dpi), 1770 × 1189 pixels (600 dpi), and 3541 × 2379pixels (1200�dpi). The four test samples at 200 dpi arepresented in figure 1 (top) as gray‐scale versions of theoriginal RGB color images obtained from the scanner.
IMAGE SEGMENTATIONThe RGB (red green blue) color images were initially
converted to binary images, where the stains appeared as 1(white) and the background as 0 (black). This was done by animage classification / segmentation process. Initially, the red,green, and blue components were filtered individually, usinga 3 × 3 median filter. The filtered RGB image was convertedto the HSI (hue saturation intensity) color model, where thecolor component was decoupled from the intensity(Gonzalez and Woods, 2002). The Otsu thresholding methodwas then applied to the hue component, splitting the imagein two sections. The maximum hue from each section wasused to characterize the background and foreground by
Figure 1. Gray‐scale version of the original 24 bit RGB color test images (top row) and the corresponding binary images produced by the segmentationstage (bottom row).
813Vol. 51(3): 811-821
Figure 2. Example of division of an image into n strips, vertically (left) andhorizontally (center), and into n2 sectors (right), for n = 3.
computing an average RGB vector for the background(RGBb) and foreground (RGBf). The RGB image wasbinarized using the Euclidian distance to the reference RGBvectors. Pixels with RGB values closer to RGBf wereconsidered as foreground (stain) and those closer to RGBb asbackground. This process was tested with 100 WSP, with asuccess rate of 94%. The six cases where the method failedwere when the WSP was very heavily saturated. The resultingbinary images for the four test samples are presented infigure�1 (bottom).
HOMOGENEITY INDICES
Direct counting of the foreground or spot pixels in thebinary images (pixels with value 1, or ON) provides anestimation of the overall coverage of liquid in the WSP. It isalso possible to evaluate the spatial homogeneity of the liquidon spread. This can be achieved using a new methodestablished within this work, which is denoted ashomogeneity indices, HV
n, HHn, and HS
n. The superscripts V,H, or S represent vertical, horizontal, or sector, while thesubscript n represents a scale parameter (an integer notsmaller than 2). The original image is divided into sub‐images by a factor of n. For example, for n = 3, the image isdivided into 3 vertical strips, 3 horizontal strips, and 9(3�times 3) sectors, all of equal size, as illustrated in figure 2.
Let B be a binary image and Bkl a sub‐image of B. Theunion of all n2 sub‐images Bkl of B results in image B itself,as stated in equation 1:
kl
n
k
n
l
BB UU1 1= =
= (1)
A vertical strip is the union of the n sub‐images Bkl withthe same value of k (eq. 2), while a horizontal strip is theunion of the n sub‐images Bkl with the same value of l (eq.�3):
kl
n
l
kV BB U
1=
= (2)
kl
n
k
lH BB U
1=
= (3)
For each sector and strip (horizontal and vertical), thenumber of foreground pixels is counted. The maximum andminimum values are registered for vertical strips (VSmax,VSmin), horizontal strips (HSmax, HSmin), and for individualsub‐images or sectors (Smax, Smin). The vertical homogeneityindex (HV
n) is computed using equation 4, the horizontal
homogeneity index (HHn) with equation 5, and the sector
homogeneity index (HSn) with equation 6. These indices vary
between 0 and 100, with lower values corresponding tohomogeneous cases. Values of 0 will occur when all strips orsectors have exactly the same number of foreground pixels,and values of 100 will occur when there is a void strip orsector, which is more likely to happen for large values of n:
100minmaxminmax ×
+= −
VSVSVSVSH n
V (4)
100minmaxminmax ×
+= −
HSHSHSHSH n
H (5)
100minmaxminmax ×
+= −
SSSSH n
S (6)
The values of the homogeneity indices vary with the scaleparameter n. An average homogeneity index <HHVS
n> can becomputed (for H, V, or S), using the n - 1 individual indices(2 to n), as indicated in equation 7. This is a weightedaverage, with the lower values of n contributing more to theaverage index:
∑
∑
=
=>=<n
k
n
k
kHVS
nHVS
k
Hk
H
2
2
1
1
(7)
SPOT SIZE SPECTRA
The spot size range and distribution can be computed fromthe binary images using image processing mathematicalmorphology. There are generally two possible approaches:(1) to use the standard grain counting method, which assumesthat there is no overlap between drops, or (2) to use anoverlapping model that accounts for multiple overlapbetween circular‐shaped grains or droplets. Both methodsuse the elementary morphological operators dilation (⊕) anderosion (∅ ). The erosion and dilation operators use astructuring element E (for example, a disk), which is usuallyof much smaller size than the image I. The dilation of I by Eis EI ⊕ , and the erosion of I by E is EI∅ . The morphologicaloperator opening (�) (of I by E) is defined as an erosionfollowed by a dilation, while the operator closing (�) (of Iby�E) is defined as a dilation followed by an erosion(Gonzalez and Woods, 2002).
Standard MethodMorphological granulometries are performed by opening
an image with increasing structuring elements in order tosuccessively diminish the image (Dougherty and Sand,1995). During granulometry, the image is successivelysieved with a family of homothetic disks of increasingdiameters (Prodanov et al., 2006). The process works byproducing a set of images Ii = I � Ei, where the structuringelement Ei is a disk of radius i. The object (or foreground)area is computed for each binary image Ii. The difference inobject area between images Ii +1 and Ii indicates the decreasein isolated objects of a similar size to the structuring elementEi. Dividing the area decrease by the area of the structuringelement Ei provides an estimate of the number of objects withthe shape and size of Ei. This approach is effective for non‐overlapping grains, but when two grains overlap, there is a

814 TRANSACTIONS OF THE ASABE
decrease in overall area, which is reflected in an incorrectevaluation of the number of grains and their sizes.
Overlapping MethodInstead of counting the decrease in area after each opening
operation, the overlapping method uses an alternativeapproach. The original image I is also subjected tomorphological operations using structuring elements Ei inthe form of disks with radius i. However, the morphologicoperation erosion is used instead of opening, resulting inimages ii EII ∅= . For each of these images, the number of4‐connected objects is computed, using the Matlabimplementation (Mathworks, 2002) of the general proceduredescribed by Haralick and Shapiro (1992). All pixels of eachobject identified by this procedure are linked to each other bya 4‐neighborhood (top, bottom, left, right). The number ofobjects in each image Ii +1 is compared with the number ofobjects in image Ii, and the difference is assumed to be thenumber of circular objects of the size of the structuringelement Ei. The process is repeated for circular structuringelements of increased size until there is no area left in theimage. This method was validated with good results usingsynthetic images of various characteristics.
Droplet Data AnalysisThe percentage of the image area covered with spots, the
number of spots per target, and droplet size spectra factorswere calculated for each WSP for different imageresolutions, using the standard and overlapping methods.
The droplet spread on the WSP varies with physicalproperties such as surface tension, direction (angle), andenergy of impact on the cards. The spread factors used toconvert droplet stains on the WSP to actual droplet size,which cause the stain, are presented in table 1 (Syngenta,2002). Using the spread factor conversion, it is possible todetermine the diameter and volume of the original dropletthat splashed on the WSP. A spread factor of 1.7 was used forstains of 100 �m diameter or less, a spread factor of 2.1 forstains with diameter of 500 �m or more, and a linearinterpolation between the values presented in table 1 wasused for stains with diameter between 100 and 500 �m.
Droplet size spectra factors corresponding to 10% (Dv0.1),50% (Dv0.5), and 90% (Dv0.9) of the cumulative spray liquidvolume contained in the droplets up to the indicated diameter(ASAE Standards, 1997) are generally used to describedroplet spectra (Agüera et al., 2006). The ASAE standarddroplet size spectra factors can be calculated once the dropletsize spectra are obtained by the image processing techniquesproposed.
Table 1. Spread factor values used to convertstain to droplet sizes (Syngenta, 2002).
Stain Diameterof Drops (μm)
SpreadFactor[a]
DropletDiameter (μm)
100 1.7 58.8200 1.8 111.1300 1.9 157.9400 2.0 200.0500 2.1 238.1
[a] Assessed by the magnesium oxide and the silicon‐oil‐method at 20°C,relative humidity of about 40% and the droplets reaching the WSP atsedimentation velocity.
Manual ValidationA manual counting of the number and size of stains was
performed for sample S1 by visual inspection. The imageobtained at 1200 dpi was printed in a plotter and magnifiedby a factor of 10, resulting in an image poster of 51.22 ×74.95 cm. Each stain was measured with a ruler and labeledaccording to its size. The minimum diameter considered inthe printed image was 1 mm, corresponding to a stain radiusof 0.05 mm in the original WSP. Linear regressions wereestablished between manual and automatic counting data.
RESULTSThe algorithms and methods described in the previous
section were applied to the three test samples (S1, S2, and S3)presented in figure 1. Image S0 was only used for validationpurposes, and thus the results for that sample are onlypresented when they are thought to be relevant.
COVERED AREA
Once the color digital images are converted to binaryimages, the calculation of the area covered by spray isstraightforward. The fraction of spray coverage for each ofthe test samples and scanning resolutions are presented intable 2. As it can be seen in the table, there is very littlevariability in the fraction of spray coverage counted with thescanning resolution.
HOMOGENEITY INDICES
The homogeneity indices were computed for the testsamples for various values of the scale parameter n. Theresults are presented in table 3 for samples S1, S2, and S3.The homogeneity indices were computed for all imageresolutions, but the results presented in this section only referto the images at 600 dpi, as the variability of the homogeneityindices with the scanning resolution was found to be ratherlow (less than 5%).
The homogeneity indices HVn, HH
n, and HSn, presented in
table 3 for values of n between 2 and 7 permit an evaluationof the spatial homogeneity of the liquid spread on the testsamples. S3 is the most homogeneous sample overall, whileS2 has the highest values of HV
n, HHn, and HS
n and thus showsless homogeneity horizontally, vertically, and in sectors.S1�is more homogeneous in the vertical than in the horizontaldirection, and the opposite happens for S2 and S3. The valuesof HV
n are quite high for S2, which means that the amount ofliquid spread varies considerably vertically. This can beeasily confirmed by a visual inspection of the image (fig. 1).The average homogeneity indices for n = 10, n = 20, and n =50 are also presented in table 3 and show the weighting effectwhere the lower n values contribute more to the average valuereported.
An alternative way to analyze the homogeneity of asample using the proposed homogeneity indices is to produce
Table 2. Fraction of spray coverage for test samples S0, S1, S2, and S3.dpi S0 (%) S1 (%) S2 (%) S3 (%)
200 0.0 6.8 44.4 49.0300 0.0 7.3 44.6 49.8600 0.0 7.5 44.5 50.0
1200 0.0 7.5 44.6 50.4
815Vol. 51(3): 811-821
Table 3. Homogeneity indices for samples S1, S2, and S3 (at 600 dpi).
n
S1 S2 S3
H V S H V S H V S
2 12.14 0.23 18.91 16.27 29.31 45.74 0.18 1.02 8.913 15.81 8.34 27.96 19.43 38.50 53.14 5.57 11.51 23.814 18.95 3.75 37.02 23.31 44.97 66.47 7.01 12.98 32.985 22.84 16.85 54.88 24.55 48.33 74.38 8.71 15.32 36.256 23.42 14.73 61.84 26.97 49.33 80.97 10.54 16.21 40.487 25.69 17.91 72.98 24.98 53.82 84.87 9.16 16.55 41.54
<H10> 19.58 10.38 45.88 21.95 43.69 65.65 6.17 11.33 29.24<H20> 25.04 17.27 59.54 25.11 48.99 72.96 8.22 14.78 40.61<H50> 31.85 30.15 69.96 28.72 53.72 79.93 10.75 18.84 54.28
Figure 3. Homogeneity indices (horizontal, vertical, and sector) versus normalized scaling parameter n′.
a plot of HVn, HH
n, and HSn as a function of the scaling
parameter n. Perhaps a more effective way to compare theresults from the sector homogeneity index and the otherindices is to use a normalization factor n′, which ensures thatboth sectors and strips have the same area. For the sectorindices, a value of n = 2 will correspond to n′ = 4, n = 3 to n′=9, and so forth (n′ = n2), while for the strip indices n′ = n. Sucha plot is presented in figure 3 for the three test samples. Asexpected, there is a general tendency for the homogeneityindices to increase with n′.
The homogeneity index data presented in figure 3 clearlyreveal the much higher homogeneity of S3, which remainslow as the scaling parameter increases (low index valuescorrespond to homogeneous cases). S1 is also homogeneousfor low values of n′, but the indices for S1 increase ratherrapidly with increasing n′. For S2 there are generally highervalues than for the other samples, except for the horizontalhomogeneity that remains reasonably low, even for largevalues of n′.
STAIN SIZE SPECTRA
The stain size range and distribution were computed for alltest samples and resolutions using both the standard and the
overlapping methods. The results for the 600 dpi images arepresented in figure 4 for the standard method and in figure 5for the overlapping method. The plots produced by the twomethods are very different, particularly regarding the numberof small‐sized stains. The plot for S3 produced using thestandard method is not fully represented in figure 4, as itpeaks at 1126 stains for radius 0.042 mm.
The results produced from the standard and overlappingmethods are presented together in figure 6 for sample 1 dataobtained at 300, 600, and 1200 dpi. Again, it is clear fromthese combined plots that the differences between the twomethods are mostly noticeable for stains with small radius.This is due to the fact that the standard method does notaccount for overlap between stains. For example, when twoequal‐sized stains overlap, the morphological operationopening with a small‐sized disk will result in a reduction ofthe covered area. This will be wrongly counted as a numberof small‐sized stains, which in fact are not present in theimage. The result is an overestimation of the number of smallstains when the standard method is used in an overlappingscenario.

816 TRANSACTIONS OF THE ASABE
Figure 4. Stain size spectra for the four test samples at 600 dpi using the standard model.
Figure 5. Stain size spectra for the four test samples at 600 dpi using the overlapping model.
Evaluation of the Scanning Resolution EffectAn evaluation of the effect of the scanning resolution on
the computation of the stain size range and distribution wascarried out. Equivalent plots were produced for each sampleand scanning resolution (200, 300, 600, and 1200 dpi) usingthe data obtained from the four different scanning resolutionsinterpolated or down‐sampled to the reference resolution. Anexample of this analysis is presented in figure 7 for test image
S1 and reference scanning resolution of 600 dpi. The stainsize range and distribution profiles obtained from the 200 and300 dpi data were linearly interpolated to the referenceresolution, and the profile obtained from the 1200 dpi datawas down‐sampled to 600 dpi, by averaging every twosampled values. The plot indicates that there is a sharperevaluation of the stain size using the higher resolution data,particularly for small‐sized stains. The various curves tend to

817Vol. 51(3): 811-821
Figure 6. Stain size spectra plots for sample S1 obtained using the standard (ST) and overlapping (OV) methods at 300, 600, and 1200 dpi.
Figure 7. Stain size spectra for test sample S1 obtained from data of 200, 300, 600, and 1200 dpi, all normalized to 600 dpi.
follow a similar trend for large radius values. The profiles for200 and 300 dpi are smoother, as 1/3 and 1/2 of the points inthese plots were obtained by linear interpolation. The 600 dpiresolution seems to be the most suitable choice, as the stainprofiles are very close to the 1200 dpi profiles but thecomputational load is much lower. Furthermore, very highscanning resolution rates tend to introduce unwantedartifacts.
Number of Droplets Per Unit AreaThe number of droplets per unit area (cm2) was computed
for each sample and scanning resolution tested. The resultsare presented in table 4 using the overlapping model. Thenumber of droplets per unit area computed using the standardmethod is less reliable, as this method tends to largelyoverestimate the number of small‐sized droplets. The valuescomputed for each sample increase with the scanningresolution, as there is an increase of the number of dropletscounted, particularly for small‐sized droplets.
818 TRANSACTIONS OF THE ASABE
Table 4. Number of droplets per unit area(cm2) for test samples S0, S1, S2, and S3.
dpi S0 S1 S2 S3
200 0.05 10.59 12.45 25.42300 0.08 12.35 16.69 36.99600 0.16 12.92 22.38 56.16
1200 0.50 13.67 28.22 72.23
Droplet Size Spectra FactorsThe droplet size spectra were computed from the stain size
spectra using the spread factors presented in table 1(Syngenta, 2002). The values of the ASAE standard dropletsize spectra factors were computed for all test samples andresolutions using the overlapping model. The values of theASAE standard droplet size spectra factors were alsocomputed using the standard method, but only for 600 dpi.The values of Dv0.1, Dv0.5, and Dv0.9 are presented in table 5.The pixel size and minimum stain and droplet diameters thatcan be evaluated for each scanning resolution are alsopresented in table 5.
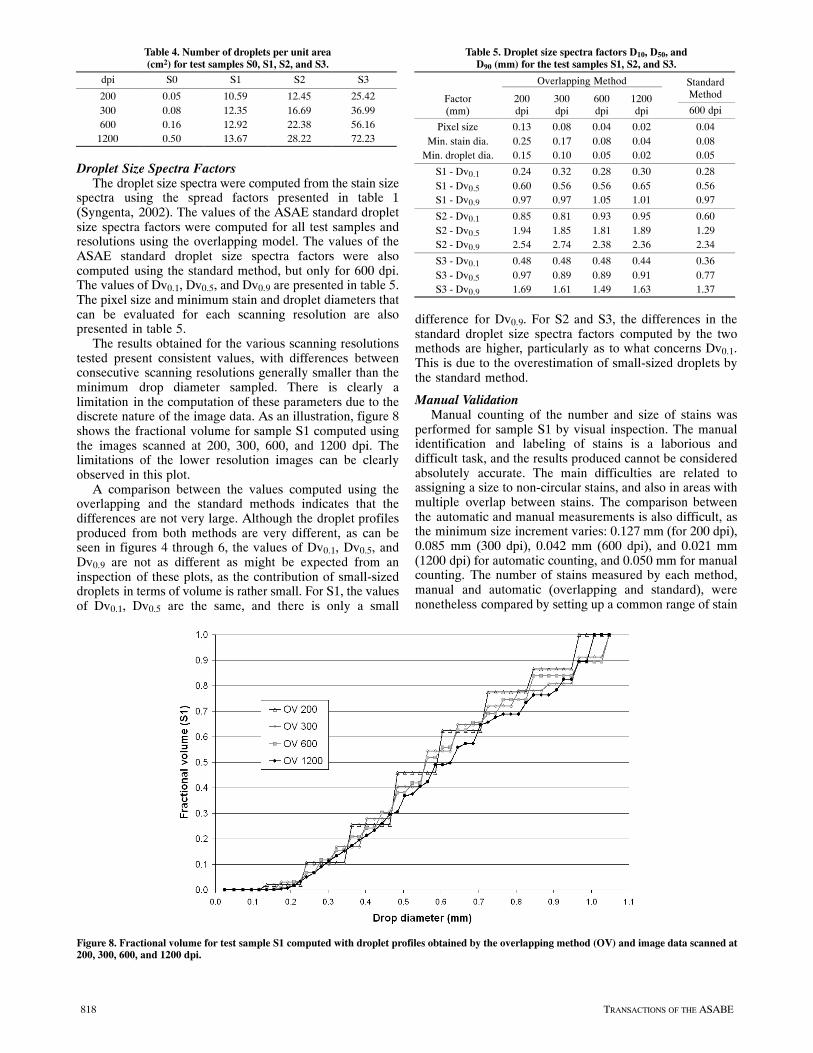
The results obtained for the various scanning resolutionstested present consistent values, with differences betweenconsecutive scanning resolutions generally smaller than theminimum drop diameter sampled. There is clearly alimitation in the computation of these parameters due to thediscrete nature of the image data. As an illustration, figure 8shows the fractional volume for sample S1 computed usingthe images scanned at 200, 300, 600, and 1200 dpi. Thelimitations of the lower resolution images can be clearlyobserved in this plot.
A comparison between the values computed using theoverlapping and the standard methods indicates that thedifferences are not very large. Although the droplet profilesproduced from both methods are very different, as can beseen in figures 4 through 6, the values of Dv0.1, Dv0.5, andDv0.9 are not as different as might be expected from aninspection of these plots, as the contribution of small‐sizeddroplets in terms of volume is rather small. For S1, the valuesof Dv0.1, Dv0.5 are the same, and there is only a small
Table 5. Droplet size spectra factors D10, D50, andD90 (mm) for the test samples S1, S2, and S3.
Factor(mm)
Overlapping Method StandardMethod200
dpi300dpi
600dpi
1200dpi 600 dpi
Pixel size 0.13 0.08 0.04 0.02 0.04Min. stain dia. 0.25 0.17 0.08 0.04 0.08
Min. droplet dia. 0.15 0.10 0.05 0.02 0.05
S1 ‐ Dv0.1 0.24 0.32 0.28 0.30 0.28S1 ‐ Dv0.5 0.60 0.56 0.56 0.65 0.56S1 ‐ Dv0.9 0.97 0.97 1.05 1.01 0.97
S2 ‐ Dv0.1 0.85 0.81 0.93 0.95 0.60S2 ‐ Dv0.5 1.94 1.85 1.81 1.89 1.29S2 ‐ Dv0.9 2.54 2.74 2.38 2.36 2.34
S3 ‐ Dv0.1 0.48 0.48 0.48 0.44 0.36S3 ‐ Dv0.5 0.97 0.89 0.89 0.91 0.77S3 ‐ Dv0.9 1.69 1.61 1.49 1.63 1.37
difference for Dv0.9. For S2 and S3, the differences in thestandard droplet size spectra factors computed by the twomethods are higher, particularly as to what concerns Dv0.1.This is due to the overestimation of small‐sized droplets bythe standard method.
Manual ValidationManual counting of the number and size of stains was
performed for sample S1 by visual inspection. The manualidentification and labeling of stains is a laborious anddifficult task, and the results produced cannot be consideredabsolutely accurate. The main difficulties are related toassigning a size to non‐circular stains, and also in areas withmultiple overlap between stains. The comparison betweenthe automatic and manual measurements is also difficult, asthe minimum size increment varies: 0.127 mm (for 200 dpi),0.085 mm (300 dpi), 0.042 mm (600 dpi), and 0.021 mm(1200 dpi) for automatic counting, and 0.050 mm for manualcounting. The number of stains measured by each method,manual and automatic (overlapping and standard), werenonetheless compared by setting up a common range of stain
Figure 8. Fractional volume for test sample S1 computed with droplet profiles obtained by the overlapping method (OV) and image data scanned at200, 300, 600, and 1200 dpi.

819Vol. 51(3): 811-821
Table 6. Number of stains counted manually and by the automatic methods (ST and OV) for sampleS1, and summary of regression results: coefficient of determination (R2) and statistical significance.
Stain Radius(μm)
ManualCounting
Overlapping Method Standard Method
OV300 OV600 OV1200 ST300 ST600 ST1200
<176 25 175 66 47 329.7 243.6 295.0176 to 275 199 129 161 197 117.1 176.3 245.5276 to 375 153 53 110 114 55.0 108.1 122.5376 to 475 66 44 76 66 44.1 83.3 78.8476 to 575 47 29 31 45 30.9 36.8 49.8576 to 675 21 20 24 18 19.9 23.1 24.5676 to 775 12 15 14 20 14.7 13.8 14.1776 to 875 4 3 4 6 3.0 2.4 6.6876 to 975 6 1 5 5 2.2 5.4 2.4
>975 9 5 5 7 4.0 4.2 3.3
Total 766 778 723 769 1067.4 1120.9 1383.0R2 0.266 0.910 0.958 0.050 0.335 0.368
Significance ns 0.000 0.000 ns ns 0.048
Figure 9. Number of stains counted manually and by the standard method (at 300, 600, and 1200 dpi) for test sample S1.
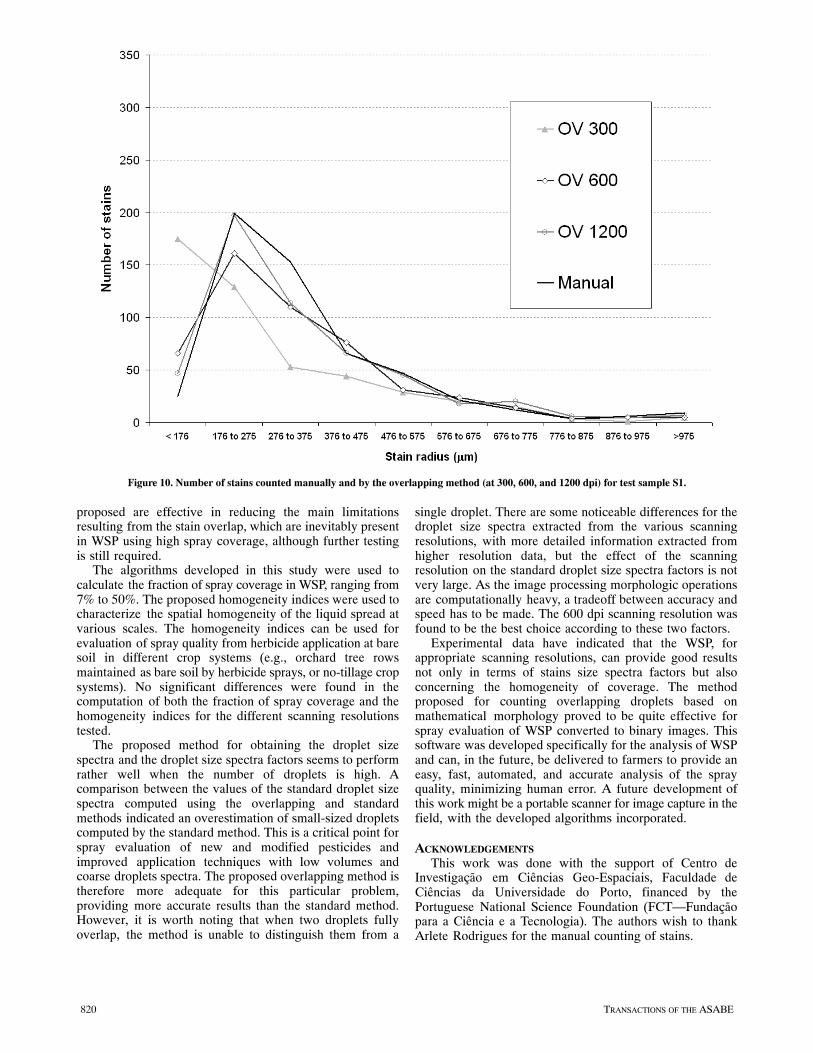
radius. The results are presented in table 6 and in figures 9 and10. The total number of stains counted manually and by theproposed overlapping method are reasonably close, althoughthe size distribution does not exactly match. Theperformance of the standard method is much worse becausethe total number of stains is largely overestimated, mainlydue to the excessive number of small stains that were wronglycounted.
Linear regressions were established between the manualand automatic counting data. The coefficient of determin-ation (R2) for the linear regression and the statisticalsignificance are presented in table 6. The values of R2 arehigh for the overlapping methods at 600 and 1200 dpi (0.910and 0.958, respectively).
The stain sizes counted manually were converted todroplet sizes using the spread factors proposed by Syngenta(2002). The resulting droplet profiles were used to compute
the droplet size spectra factors corresponding to 10% (Dv0.1),50% (Dv0.5), and 90% (Dv0.9) of the cumulative spray liquidvolume. The results obtained were: Dv0.1 = 0.29, Dv0.5 =0.62, and Dv0.9 = 1.09. These values are very close to thoseobtained using the automatic methods presented in table 5,particularly for the overlapping method using 600 and 1200dpi images.
DISCUSSION AND CONCLUSIONThe fully automatic methodology proposed, based on
image processing of scanned WSP, provides a number ofparameters to characterize the spray: (1) fraction of spraycoverage, (2) homogeneity parameters, (3) stain and dropletnumber and size distribution profiles, and (4) standarddroplet size spectra factors. The algorithms and methods
820 TRANSACTIONS OF THE ASABE
Figure 10. Number of stains counted manually and by the overlapping method (at 300, 600, and 1200 dpi) for test sample S1.
proposed are effective in reducing the main limitationsresulting from the stain overlap, which are inevitably presentin WSP using high spray coverage, although further testingis still required.
The algorithms developed in this study were used tocalculate the fraction of spray coverage in WSP, ranging from7% to 50%. The proposed homogeneity indices were used tocharacterize the spatial homogeneity of the liquid spread atvarious scales. The homogeneity indices can be used forevaluation of spray quality from herbicide application at baresoil in different crop systems (e.g., orchard tree rowsmaintained as bare soil by herbicide sprays, or no‐tillage cropsystems). No significant differences were found in thecomputation of both the fraction of spray coverage and thehomogeneity indices for the different scanning resolutionstested.
The proposed method for obtaining the droplet sizespectra and the droplet size spectra factors seems to performrather well when the number of droplets is high. Acomparison between the values of the standard droplet sizespectra computed using the overlapping and standardmethods indicated an overestimation of small‐sized dropletscomputed by the standard method. This is a critical point forspray evaluation of new and modified pesticides andimproved application techniques with low volumes andcoarse droplets spectra. The proposed overlapping method istherefore more adequate for this particular problem,providing more accurate results than the standard method.However, it is worth noting that when two droplets fullyoverlap, the method is unable to distinguish them from a
single droplet. There are some noticeable differences for thedroplet size spectra extracted from the various scanningresolutions, with more detailed information extracted fromhigher resolution data, but the effect of the scanningresolution on the standard droplet size spectra factors is notvery large. As the image processing morphologic operationsare computationally heavy, a tradeoff between accuracy andspeed has to be made. The 600 dpi scanning resolution wasfound to be the best choice according to these two factors.
Experimental data have indicated that the WSP, forappropriate scanning resolutions, can provide good resultsnot only in terms of stains size spectra factors but alsoconcerning the homogeneity of coverage. The methodproposed for counting overlapping droplets based onmathematical morphology proved to be quite effective forspray evaluation of WSP converted to binary images. Thissoftware was developed specifically for the analysis of WSPand can, in the future, be delivered to farmers to provide aneasy, fast, automated, and accurate analysis of the sprayquality, minimizing human error. A future development ofthis work might be a portable scanner for image capture in thefield, with the developed algorithms incorporated.
ACKNOWLEDGEMENTS
This work was done with the support of Centro deInvestigação em Ciências Geo‐Espaciais, Faculdade deCiências da Universidade do Porto, financed by thePortuguese National Science Foundation (FCT—Fundaçãopara a Ciência e a Tecnologia). The authors wish to thankArlete Rodrigues for the manual counting of stains.

821Vol. 51(3): 811-821
REFERENCESAgroScan. 2008. Análise de gotas em pulverizações agrícolas
utilizando digitalização de imagens. Pelotas, Brazil: Agrotec.Available at: www.agrotec.etc.br/produtos/agroscan. Accessed13 March 2008.
Agüera, F., F. J. Aguilar, M. A. Aguilar, and F. Carvajal. 2006.Atomization characteristics of hydraulic nozzles using fractalgeometry. Trans. ASAE 49(3): 581‐587.
ASAE Standards. 1997. S.327.2: Terminology and definitions foragricultural chemical application. St. Joseph, Mich. ASAE.
Bateman, R. 1993. Simple, standardized methods for recordingdroplet measurements and estimation of deposits from controlleddroplet applications. Crop Protection 12(3): 201‐206.
Crowe, T. G., D. Downey, and D. K. Giles. 2005. Digital device andtechnique for sensing distribution of spray deposition. Trans.ASAE 48(6): 2085‐2093.
Dougherty, E. R., and F. Sand. 1995. Representation of lineargranulometric moments for deterministic and random binaryEuclidean images. J. Visual Comm. Image Rep. 6(1): 69‐79.
Fox, R. D., R. C. Derksen, H. E. Ozkan, and R. D. Brazee. 1998.Methods and techniques in determining spray quality. In Proc.Conf. on Measurement and Management of Agrochemical SprayQuality, 123‐138. Taichung, Taiwan: Taiwan AgriculturalResearch Institute.
Fox, R. D., R. C. Derksen, J. A. Cooper, C. R. Krause, and H. E.Ozkan. 2003. Visual and image system measurement of spraydeposits using water‐sensitive paper. Applied Eng. in Agric.19(5): 549‐552.
Giles, D. K., and D. Downey. 2003. Quality control verification andmapping for chemical application. Precision Agric. 4(1):103‐124.
Gonzalez, R. C., and R. E. Woods. 2002. Digital Image Processing.Englewood Cliffs, N.J.: Prentice Hall.
Haralick, R. M., and L. G. Shapiro. 1992. Computer and RobotVision, 28‐48. Vol. I. Boston, Mass.: Addison‐Wesley.
Hoffman, W. C. 2003. Field swath and drift analyses techniques.ASAE Paper No. AA03‐007. St. Joseph, Mich.: ASAE.
Holownicki, R., G. Doruchowski, W. Swiechowski, and P. Jaeken.2002. Methods of evaluation of spray deposit and coverage onartificial targets. Electronic J. Polish Agric. Universities 5(1):1‐9.
Mathworks. 2002. Using Matlab. Ver 6.5. Natick, Mass.: TheMathWorks, Inc.
Panneton, B. 2002. Image analysis of water‐sensitive cards for spraycoverage experiments. Applied Eng. in Agric. 18(2): 179‐182.
Prodanov, D., J. Heeroma, and E. Marani. 2006. Automaticmorphometry of synaptic boutons of cultured cells usinggranulometric analysis of digital images. J. NeuroscienceMethods 151(2): 168‐177.
Salyani, M., and R. D. Fox. 1999. Evaluation of spray quality byoil‐ and water‐sensitive papers. Trans. ASAE 42(1): 37‐43.
Syngenta. 2002. Water‐sensitive paper for monitoring spraydistributions. CH‐4002. Basle, Switzerland: Syngenta CropProtection.
Turner, C., and K. Huntington. 1970. The use of water‐sensitive dyefor the detection and assessment of small spray droplets. J.Agric. Eng. Res. 15(4): 385‐387.
Wolf, R. E. 2003. Assessing the ability of DropletScan to analyzespray droplets from a ground operated sprayer. Applied Eng. inAgric. 19(5): 525‐530.
UTHSCSA ImageTool. 2002. UTHSCSA ImageTool for Windows.Version 3.0. University of Texas Health Science Center SanAntónio (UTHSCSA). Available at:http://ddsdx.uthscsa.edu/dig/itdesc.html. Accessed 13 March2008.
Zhu, H., R. C. Derksen, C. R. Krause, R. D. Fox, R. D. Brazee, andH. E. Ozkan. 2005. Fluorescent intensity of dye solutions underdifferent pH conditions. J. ASTM Intl. 2(6): 2‐7.

822 TRANSACTIONS OF THE ASABE