
IJMMR - International Journal of Management and Marketing ...
104
CONTENTS The Relationship between Psychological Strain Self-Regulation, and Informal Accountability for others 1 M. Todd Royle, Gavin Fox The Influence of Socialization Agents and Demographic Profiles on Brand Consciousness 19 Zaharah Ghazali Work and Family Conflict: A Comparison between American and Mexican Women 31 Alicia Cavazos-Garza Development of Marketing Orientation in Small and Medium-Sized Enterprises Evidence from Eastern Europe 49 Andrzej Kobylanski, Radoslaw Szulc Product Innovation by Small and Medium-Sized Firms through Outsourcing and Collaboration 61 Arup K. Sen, Kushnood Haq Mobile Advertising Engine for Centralized Mobile Coupon Delivery 75 Jeffrey Wray, Daniel Plante An Assessment of Visitor Satisfaction with Nature-Based Tourism Attractions 87 Perunjodi Naidoo, Prabha Ramseook-Munhurrun, Premita Seegoolam VOLUME 4 2011 NUMBER 1 International Journal of Management and Marketing Research IJMMR
-
Upload
khangminh22 -
Category
Documents
-
view
0 -
download
0
Transcript of IJMMR - International Journal of Management and Marketing ...

CONTENTS
The Relationship between Psychological Strain Self-Regulation, and Informal Accountability for others 1M. Todd Royle, Gavin Fox
The Influence of Socialization Agents and Demographic Profiles on Brand Consciousness 19Zaharah Ghazali
Work and Family Conflict: A Comparison between American and Mexican Women 31Alicia Cavazos-Garza
Development of Marketing Orientation in Small and Medium-Sized Enterprises Evidence from Eastern Europe 49Andrzej Kobylanski, Radoslaw Szulc
Product Innovation by Small and Medium-Sized Firms through Outsourcing and Collaboration 61Arup K. Sen, Kushnood Haq
Mobile Advertising Engine for Centralized Mobile Coupon Delivery 75Jeffrey Wray, Daniel Plante
An Assessment of Visitor Satisfaction with Nature-Based Tourism Attractions 87Perunjodi Naidoo, Prabha Ramseook-Munhurrun, Premita Seegoolam
VOLUME 4 2011NUMBER 1
International Journal of Management and Marketing ResearchIJMMR


INTERNATIONAL JOURNAL OF MANAGEMENT AND MARKETING RESEARCH ♦Volume 4 ♦ Number 1 ♦ 2011
THE RELATIONSHIP BETWEEN PSYCHOLOGICAL STRAIN SELF-REGULATION, AND INFORMAL
ACCOUNTABILITY FOR OTHERS M. Todd Royle, Valdosta State University
Gavin Fox, Texas Tech University
ABSTRACT This research examines the relationship between psychological strain, self-regulation, and informal accountability for others (IAFO). Our study attempts to enhance organizational research by demonstrating the moderating effect of self-regulation, a form of attention control, on the strain and IAFO relationship. We test hypotheses using data collected in an organizational sample of 105 working adults. Findings indicate that self-regulation moderates the strain – IAFO relationship for those who are not able to focus well on specific job tasks. The paper concludes with a discussion of managerial implications, the study’s relevant strengths, limitations and directions for future research. JEL: M12, M14
KEYWORDS: stress, control, informal accountability for others
INTRODUCTION
s we come to the end of the first decade of the 21st century, considerable economic uncertainty exists. Along with this seeming chaos comes, for many individuals, unfortunate attendant strains. As the global economy worsens, many are facing increased sources of stress. As many as 80% of Americans reported recently that the economy is a significant source of stress, up from 66% a
year earlier (Wilbert & Chang, 2008). These macroeconomic findings only compound the difficulties individuals face in daily organizational life. These conditions are taking a toll on individuals’ health and overall senses of well-being. More people are reporting stress-related physical and emotional reactions, and nearly half of adult respondents indicate their stress is increasing as the economy worsens (Wilbert & Chang, 2008). In addition, more individuals reported stress-related burnout (53% vs. 51%), feelings of irritability or anger (60% vs. 50%), and insomnia (52% vs. 48%) since the onset of the sub-prime mortgage market meltdown and the attendant decline in markets worldwide. The top stressors for Americans according to Wilbert and Chang (2008) and surveys administered by the American Psychological Association (APA) are: money (81%), the economy (80%), work (67%), and health problems affecting workers and their families (67%). In times of economic downturn, researchers consistently note increases in joblessness, layoffs, downsizing and concomitant erosions in traditional notions of job security (Baruch, 2004). These conditions, thus, bolster employee cynicism, anxiety, resentment, retribution and underperformance (Astrachan, 1995; Brockner, 1992; O’Neill & Lenn, 1995). Given the apparent ubiquitous nature of these circumstances and the desire of individuals to avoid involuntary separation, we consider what actions individuals (currently employed) take to alleviate these feelings of strain. Specifically, this paper examines whether or not being informally accountable for others (IAFO), when individuals have some sense of control, helps reduce strain. Our paper will proceed as follows: we will review contemporary research, state our research hypotheses, discuss our data and methodology, demonstrate the results and make concluding comments. Our
A
1
M. T. Royle, G. Fox | IJMMR ♦ Vol. 4 ♦ No. 1 ♦ 2011
discussion will include contributions to research as well as managerial implications. Furthermore, we will discuss the study’s relative strengths, limitation and directions for future research. LITERATURE REVIEW Informal Accountability for Others Our conceptualization of informal accountability reflects views previously conceptualized and demonstrated by others as well as existing but nascent research on the subject (e.g., Royle, Fox, & Hochwarter, 2009). For example, we borrow from the work of Morrison and Phelps’s (1999) who note that individuals generally believe they are personally obligated to bring about constructive change, which either directly or indirectly affects (ostensibly benefits) both themselves and others. Another element of the construct comes from Lerner and Tetlock (1999) who contended that accountability is the implicit or explicit expectation that one may be called on to justify one’s beliefs, feelings, or actions to others. Still other aspects come from Ferris, Mitchell, Canavan, Frink, and Hopper (1995), who considered accountability to be a function of how much a person is observed and evaluated by powerful others who have reward or sanctioning power, and the extent to which valued rewards (or feared sanctions) are consistent with these evaluations. Though informative in their own rights, these definitions fail to tap the entire spectrum of informal accountability for others. In fact, the notion that others are the focus of accountability is missing altogether. As such, we define informal accountability for others as follows:
Informal accountability for others is a public demonstration that one is willing to answer for the attitudes and behaviors of individuals in an organization regardless of formal position within the firm, rank, or mandate by the organization. The Phenomenological View of Accountability Lerner and Tetlock (1999) defined accountability as the implicit or explicit expectation that one may be called on to justify one’s beliefs, feelings and actions to others. Although the determination of accountability is most obvious when a breach of conduct occurs (Cummings & Anton, 1990), it is possible that individuals are held accountable and rewarded for their due diligence absent any wrongdoing. However, accountability generally implies that those who do not provide acceptable justifications for their actions will be sanctioned with a broad spectrum of possible consequences ranging from mere scorn, to loss of pay and employment, to incarceration at the extreme (Stenning, 1995). On the other hand, individuals who provide sufficient justification for their behaviors experience positive consequences ranging from minor rewards to the total mitigation of individual culpability for wrongdoing. Although these alternatives seem straightforward, the ways individuals feel when accountable, and the elements that they perceive, make studying accountability complicated due to its possibly subjective nature. At its core, this kind of subjective interpretation is phenomenological. The phenomenological view of accountability is rooted in Tetlock’s (1985, 1992) social contingency model. It includes several empirically distinguishable sub-components. These include (a) the mere presence of others (individuals expect that another will observe their performance (Zajonc, 1965; Zajonc & Sales 1966); (b) identifiability (individuals believe that what they say or do will be linked to them personally) (Price, 1987; Zimbardo, 1970); (c) evaluation (participants expect that their performance will be assessed by another according to normative standards that carry implied consequences) (Geen, 1991); and (d) reason-
2

INTERNATIONAL JOURNAL OF MANAGEMENT AND MARKETING RESEARCH ♦Volume 4 ♦ Number 1 ♦ 2011
giving (individuals expect that they must give reasons for their attitudes or behaviors) (Simonson & Nowlis, 2000). Despite the prevalence of the phenomenological view, a subtle incongruity exists in most scholarly investigations of accountability. For instance, the social contingency model (e.g., Tetlock, 1992) considers accountability to be largely internal and subjective. However, most empirical research on accountability treated it as an objective, external condition (Frink & Klimoski, 1998, 2004; Lerner & Tetlock, 1999). Notwithstanding, objectively verifiable facets of the accountability environment are necessary, but they are not sufficient to wholly describe the situation because we cannot assume that all individuals react uniformly. This oversight potentially leads many researchers to overlook many facets of informal accountability for others, leaving the construct in need of further development. Furthermore, greater consideration should be given to determining what contributes to making people feel accountable for those who may not be their formal subordinates. Uncertainty as an Underpinning No matter what individuals do, there always will be aspects of the future and environment that can neither be predicted nor controlled. However, this does not mean that individuals do not desire to do so. Individuals often engage in behaviors designed to reduce future uncertainty and help offset their associated fears. Epstein (1999) defined uncertainty aversion as a large class of preferences, wherein information about the future is too imprecise to be conceptualized in terms of a probability of occurrence, but which individuals, nonetheless, conceive of as an eventuality. According to Epstein (1999), all individuals experience some aversion to uncertainty. Furthermore, they wish to reduce these uncertainties and the potential for corresponding negative consequences. In order to avoid semantic misunderstandings, Epstein (1999) noted that the related notion of risk is similar to uncertainty, but differs in that risk intones that individuals have a more precise idea of the probability of some future event (e.g., a 50% chance that one’s stocks will increase in value). In this paper, we use these two terms interchangeably. In terms of this research, we assume that individuals are not likely aware of any discrete probabilities of undesirable organizational outcomes (e.g., the odds of being downsized, demoted, or furloughed), but they are still cognizant that it could happen to them. Expectancies play a central role in the creation of uncertainty. O’Driscoll and Beehr (1994) contended that uncertainty contributes to work related affect and precipitates strain. Specifically, they noted that the amount of uncertainty that one feels is related to unpredictability about the consequences of role performance. Further, they also noted that ambiguous situations are generally dissatisfying. Along those lines, Beehr and Bhagat (1985) extended expectancy theory (e.g., Vroom, 1964; Porter & Lawler, 1968), and applied it to conditions of uncertainty. They suggested that two potentially important types of uncertainty exist with respect to expectancies: (1) effort-to-performance (E-P) and (2) performance-to-outcome (P-O) uncertainty. In other words, people become uneasy when they do not know if their work-related efforts will achieve acceptable standards. Furthermore, anxiety is heightened when they do not know if what they do will be valued by important members of the organization (P-O). O’Driscoll and Beehr (1994), working on the assumption that employees seek social approval, noted that the way a supervisor reacts to a subordinate affects their willingness to stay in an organization. Along with E-P and P-O expectancies, not knowing whether a supervisor accepts the individual is an integral part of uncertainty. In other words, not knowing if one is liked or approved of by a superior contributes to dissatisfaction and turnover intentions. Individuals often will seek informal accountability conditions if they feel that their gestures will be noticed (E-P) and that they can achieve an increase in status. Further, if these overtures are well received, individuals will be perceived as informally answerable for others, which makes them appear cooperative (P-O) and commendable.
3

M. T. Royle, G. Fox | IJMMR ♦ Vol. 4 ♦ No. 1 ♦ 2011
We contend that individuals, especially those employed in organizations experiencing macroeconomic difficulties and uncertainties, would choose IAFO in order to cope with organizational volatility. Additionally, they might seek IAFO to reduce future uncertainty because they believe, as O’Driscoll and Beehr (1994) suggested, it makes them appear to be more valuable as employees and, thus, less likely to be terminated should the economic environment continue to sour. Roles and exchanges also create uncertainties. Role theory (Kahn, Wolfe, Quinn, & Snoek, 1964; Katz & Kahn, 1978) suggests that subordinates (e.g., role takers) are attuned to expectations communicated by superiors (e.g., role senders). Concomitantly, role takers typically use these perceived expectations to shape their attitudes and actions. Again, many of these resulting behaviors are aimed at reducing uncertainty. For example, when individuals perceive that being a proactive problem solver is expected (e.g., Morrison & Phelps, 1994), they may seek informal accountability for others as a means to both exemplify this virtue and correct a performance deficiency in others for whom they answer. Role senders’ expectations are communicated in many ways: sometimes formally, as when individuals instruct others in the requirements of their jobs; often informally, as when a colleague expresses admiration or disappointment in a particular behavior (Kahn et al., 1964). Given the unceremonious nature of informal accountability for others, it is unlikely that role expectations are entirely articulated in a job description. Rather, individuals are likely to pursue informal accountability for others because they see that it exemplifies virtues that leaders publicly laud (e.g., the desirability of being a good team player). Clearly, individuals often behave in ways perceived to lead others to form favorable opinions (e.g., Leary & Kowalski, 1990). This is done because individuals typically are aware that impressions make a difference in terms of how well members are liked, respected, or perhaps feared (Leary, 1996). Self-focused tactics of impression management are intended to enhance one’s standing with those to whom one feels answerable (Leary, 1996). Those who are successful in this respect are thought to be diligent, and cooperative, if not model employees (Zivnuska, Kacmar, Witt, Carlson, & Bratton, 2004). Demonstrating informal accountability for others (e.g., speaking up for another or mentoring) constitutes a self-focused impression management tactic because it enhances image, thus increasing affect and respect. The benefits accrued by such actions are prominently featured in theories of leader-member exchange (LMX). These benefits include enhanced training opportunities, pay raises, better organizational mobility and ultimately, less uncertainty (Dienesch & Liden, 1986; Graen & Uhl-Bien, 1995). Although IAFO is ostensibly a personal and altruistic act, it is nonetheless a kind of exchange. Prominent in exchange perspectives is the concept of unspecified obligations. That is, when one party does a favor for another, there is the expectation of some future return, although exactly when that favor needs to be returned and in what form is often unclear (Kaufman, Stamper, & Tesluk, 2001; Wayne, Shore, & Liden, 1997). Much of the research on reciprocity involves informal rules related to the exchange of gifts (Blau, 1964, 1977). Although gifts, in theory, are ostensibly given voluntarily, they are in fact proffered and repaid under obligation. The currency of this exchange is not simply material goods, but also services, favors, and assistance (Mauss, 1954; Blau, 1977). In this case, the “gift” is sticking one’s neck out for another, a risky but necessary byproduct of IAFO. Individuals who fail to comply with expectations of reciprocity are likely to be distrusted and socially castigated (Gouldner, 1960). The implications of informal accountability for others are clear. Those who willingly answer for others expect something in return. Namely, the party that is answerable expects some compliance to demands and goal directed effort to be reciprocated, thus, augmenting the reputations of both parties.
4

INTERNATIONAL JOURNAL OF MANAGEMENT AND MARKETING RESEARCH ♦Volume 4 ♦ Number 1 ♦ 2011
The prospect of success, with respect to appearing informally accountable for others, is primarily affected by the same social exchange factors used in making attributions (Blau, 1964). In other words, in order for individuals to expect that being viewed as informally accountable for others will lead to desired outcomes, others for whom they are accountable must interact with them appropriately, believe that their best interests are being protected, and not feel overtly manipulated. If the informally accountable individual can achieve this, social exchange theory (Blau, 1964) predicts the creation of a lasting relationship marked by trust and mutual reciprocity. Such recurrent interactions tend to reduce opportunism and minimize uncertainty. Additionally, informally accountable individuals expect others to direct their efforts toward organizational and work specific goals that make both the answerable party and themselves look better. Stress, Strain and Tension Essentially, the stress literature identifies two basic forms of coping; emotion focused coping, directed toward regulating the emotions aroused by stressors, and problem-focused coping, where individuals attempt to manage or change the problems giving rise to strain – the subjective, negative, feelings associated with stressors (e.g., Folkman & Lazarus, 1980). Several different researchers (e.g., Kahn et al., 1964; Mechanic, 1962) have discussed the difference between these two forms of coping. Emotion-focused coping occurs when an appraisal about the source of strain is made and individuals subsequently believe that nothing can be done to modify their harmful, threatening or challenging environmental conditions (Folkman & Lazarus, 1985). Such reactions include avoidance, minimization, distancing from a situation, selective attention, inflated comparisons to others and looking for positive aspects of negative events (Bunce & West, 1996). Additionally, individuals might also cognitively reappraise situations and deem them to be less harmful, threatening, or challenging (Bunce & West, 1996). We contend that individuals seek IAFO in order to make the seemingly unchangeable and threatening environment appear less onerous. Folkman and Lazarus (1985) argued that problem-focused coping occurs when individuals believe that the environment is amenable to change. According to Moos and Billings (1982) this form of coping involves modifying the source of strain, dealing with tangible consequences of problems, and/or changing oneself to create a more satisfactory situation (e.g., learning new skills or, as posited here, co-opting the productive efforts of others). Lazarus and Folkman (1984) drew a parallel between problem-focused strategies and problem solving. In this case, it is plausible that individuals seek IAFO because they need assistance in facing threatening situations, but believe there is nothing they can do about the broader problems (e.g., economic recession and layoffs). Nonetheless, they believe that IAFO is adaptive because it allows them to garner support from those for whom they answer and apply this aid to specific aspects of their jobs, thus, enhancing the quality of work and the likelihood of obtaining positive appraisals from superiors. Control Karasek's (1979) job demand-decision latitude model proposed that psychological strain arises from the combined effects of the demands of a particular work situation and the number of possible decisions available to an individual to face those demands. It is intuitively plausible that those with high levels of control (i.e., defined by Karasek as the autonomy to decide how and when to do things) possess a valuable resource for managing stressors at work. However, even those who do not have high degrees of formal authority or discretion over time management still possess some degree of control. This is salient to our discussion of IAFO. With respect to direction over ourselves and our restraining of impulses, theories of self-regulation are important predictors of whether individuals seek to informally answer for others or not. We anticipate that those who have little control over their impulses are likely to feel strain
5

M. T. Royle, G. Fox | IJMMR ♦ Vol. 4 ♦ No. 1 ♦ 2011
from their environments (both macroeconomic and organizationally specific) and may not wish to tie their fates to those of others. Self-regulation theory is helpful in understanding aspects of control. Actions that involve conscious, deliberate and controlled responses are considered disproportionately important to health, success and happiness (Baumeister, Brataslavsky, Muraven, & Tice, 1998). Much of what researchers (e.g., Baumeister et al., 1993; Carver, 2004; Carver & Scheier, 1982) consider to be within the domain of self-regulation is rooted in research on self-awareness. For instance, Vohs and Baumeister (2004) contended that self-regulation is a conscious effort to align behaviors with established and preferred standards of conduct. Fundamentally, this involves directing behaviors toward the achievement of goals set out in advance (Baumeister et al., 1998). They further contended that individuals practice self-regulation in order to reduce current and future uncertainty. Theories of self-regulation offer important insights into the decision to become informally accountability for others. Because individuals can be accountable to multiple constituencies, many of whom have different needs (Carnevale, 1985; Green, Visser, & Tetlock, 2000), disparity in pressure to conform often arises. This discrepancy requires individuals to spend part of their finite stores of energy. There is, nonetheless, a need for individuals to align their behaviors and embrace informal accountability for others because it is an organizationally desired behavior and it offers personal benefits. In order to obtain positive responses across constituencies, individuals must regulate their behaviors in order to curb ego depletion (Baumeister et al., 1998), which is described as the exhaustion of self-generated resources (i.e., energy, effort, attention and stamina). Positive and proactive reactions to accountability might include cognitively complex attempts (e.g., integrative decision making) (Lerner & Tetlock, 1999) to secure positive evaluations (Green et al., 2000). It is highly likely that seeking IAFO demands the dedication of more resources than does avoiding it. Of course, avoiding IAFO precludes individuals from using it as a springboard to more authority, the potential for promotion, and ultimately, from reducing future uncertainty.
Unfortunately, energy resources are usually depleted more rapidly than they are replenished (Baumeister et al., 1998). Furthermore, accountability conditions (i.e., both formal and informal accountability for oneself and others) do not always allow individuals to pause to restore resources, but instead, can keep them continuously scrutinized. Consequently, resource-accumulating activities (e.g., securing control over decision-making) that are self-generated help ensure that ego-depletion does not bring the individual below a threshold necessary for adequate functioning. We posit that seeking IAFO is attractive to people because it constitutes a source of resource regeneration when others reciprocate their efforts. We acknowledge that, in addition to environmental features (e.g., a poor economy and downsizing), IAFO itself may strain individuals, thus depleting ego reserves. However, individuals will offset this loss by regulating themselves. For example, if individuals are able to effectively prioritize how they accomplish tasks, they become more efficient. The more efficient individuals become, the more slack time they build into their schedules. Further, if they are able to secure time for themselves they can make time for others and can, thus, pass along important information to them. Individuals who seek informal accountability for others, and possess adequate amounts of control, are not likely to feel overly strained or depleted because they are simultaneously engaged in resource accumulation that offsets such losses. In addition, the possible coalitions they build with those for whom they are informally accountable become additionally useful. For instance, employees who are members of strong coalitions are able to undermine some attempts at unwanted, uncertainty evoking changes devised by leaders (Deluga, 1988). Of course, one such attempt would be organizational “de-layering” and a subsequent reduction in the workforce. Thus, strain, control and informal accountability for other are integrally linked.
6

INTERNATIONAL JOURNAL OF MANAGEMENT AND MARKETING RESEARCH ♦Volume 4 ♦ Number 1 ♦ 2011
Figure 1: The Moderating Effect of Control on the Job-Induced Tension and Informal Accountability for Others Relationship
This is the model of stress, control and IAFO tested in this research. The driving force for this academic inquiry is the contention that those experiencing strain on the job are inclined to seek conditions of informal accountability for others in order to receive help from them. However, the magnitude of IAFO is moderated by the degree to which they are able to effectively utilize and direct their impulses. To summarize, the following are the testable hypothesis that drive this research: Hypothesis 1: Control, in the form of self-regulation, moderates the relationship between job- induced tension and informal accountability for others, such that those who are in stressful circumstances, but who possess more control, are likely to seek IAFO. Hypothesis 2: Control, in the form of self-regulation, moderates the relationship between job-induced tension and informal accountability for others, such that those who are in stressful circumstances, but lack control, avoid IAFO. DATA AND METHODOLOGY The data presented in this paper were collected from respondents in a single organization. Although admittedly a convenience sample, this set of responses from one organization is still desirable. Culling information from a single, real, organization helps alleviate the potentially contaminating effects of comparing multiple organizational contexts and cultures (Schwab, 1999). Participants and Procedures Data for this sample came from employees of a recreational facility at a large university in the Southeast United States. The employees in this facility were mostly younger people, including many students. Respondents were employed in various clerical, consulting and custodial positions. The data are driven by a dyadic research design in which employees responded to questionnaires coded to match their supervisor evaluations. Hence, two surveys were distributed. The supervisor survey paired data for each employee who completed the employee questionnaire. In fact, the supervisors completed a survey for each of their employees regardless of whether that individual also submitted one. Supervisors and employees completed their surveys either at home or at work during break times. Supervisors distributed surveys to employees in sealed envelopes. The employee could either return the survey in the mail (free of charge to the respondent) or, as was most often the case, could place it in a collection box in a sealed return envelope, which the researchers later collected in person. The supervisors maintained files that contained all completed surveys for their subordinates. These were also collected in person. Each of the four participating supervisors completed an average of 26 surveys for employees, all of whom they had known for at least three months. In our analyses, in order to better avoid social desirability bias (Arnold & Feldman, 1981) - the tendency of respondents to inflate opinions
Informal Accountability for Other Job-induced Tension
Control
7

M. T. Royle, G. Fox | IJMMR ♦ Vol. 4 ♦ No. 1 ♦ 2011
of their performances and/or appearances in order to make themselves look better, we used supervisor responses (matched exactly to their subordinates) on informal accountability for others. Supervisors distributed 125 surveys; one for each supervised employee. Of the 125 surveys administered, a total of 105 were completed and returned. This constitutes a response rate of 84%. The average age of respondents was 21 and the average organizational tenure was 1.3 years. The sample included 54 females (51%). Measures Prior to using any measures, irrespective of their prevalence in existing literature, we subjected the scales to confirmatory factor analysis (CFA) in order to affirm their dimensionality. We used principal component analysis with an orthogonal (Varimax) rotation, assuming, conservatively, that none of these constructs are correlated (Pallant, 2004). Applying Kaiser’s Rule (i.e., retaining factors with eigenvalues over one), we examined the amount of variance extracted in the construct by the first factor relative to others (Pallant, 2004; Kaiser, 1974). The expected factor structures emerged, thus, no items were deleted in any scales in the analyses. Noted below, along with the variable descriptions and example questions, are the scales’ calculated coefficient alpha values, the eigenvalues of the first extracted factor, and the proportion of cumulative variance in the construct described by that factor. Table 1 consolidates and presents all of this information, as well as noting the scales’ original authors. Table 1: Scales, Sources, Reliabilities, and Factor Analyses
Variable Name Scale Author Coefficient α
Eigenvalue of the 1st factor
Variance explained by 1st factor
Informal Accountability for Others
Royle et al., (2008)
.81
2.86
.57
Job-induced tension
House & Rizzo (1972)
.84
3.47
.58
Self-regulation
Luszcznska et al., (2004)
.80 3.31 .47
This table contains information about the study’s variables and the creators of the scales used to measure them. I n addition, it reports coefficient alpha values for each scale, the Eigenvalue of the first extracted factor and the amount of variance it explains. All scales employed a five-point Likert –type response format anchored by “strongly disagree” and “strongly agree
Control variables. Spurious effects are possible if controls are not added. Age, gender and organizational tenure are, thus, included as control variables given their previously demonstrated influence (Sheridan & Vredenburgh, 1978). The inclusion of tenure might be particularly important given the potential association between seniority and IAFO. In other words, it is insightful to move beyond simply believing that “older employees stick up for younger ones” when considering IAFO and its hypothesized relationship to strain. Data Analysis and Results Table 2 provides the means, standard deviations and correlations between study variables. The single largest correlation between variables in the sample is between tension and informal accountability for others (r = .48, p < .01). Other correlations among study variables were consistent with those reported in prior research. None of the correlations between study variables strongly indicates problems of multicollinearity. Specifically, none exceeds the established .60 benchmark for concern (Cohen, Cohen, West, & Aiken, 2003). This research employed hierarchical moderated regression analysis to examine the hypothesized strain-self-regulation-IAFO relationship. In the first step, age, race, gender and organizational tenure were
8

INTERNATIONAL JOURNAL OF MANAGEMENT AND MARKETING RESEARCH ♦Volume 4 ♦ Number 1 ♦ 2011
included to control for their potentially spurious effects. The strain and attentional control main effect terms were entered in the second step, followed by the interactive term in the third step.
Table 2: Means, Standard Deviations, and Intercorrelations among Study Variables
Variable M SD 1 2 3 4 5 6 7 1. Age 20.97 1.71 --- 2. Gender --- --- -.20*** --- 3. Tenure 01.28 0.76 -.36*** -.16* --- 4. Race --- --- -.17*** -.05* .05 --- 5. Tension 02.46 0.82 -.12*** -.01* .13 .48** --- 6. Self-regulation 03.94 0.48 -.23*** -.16* -.04 -.15** -.19** --- 7. IAFO 03.54 0.73 -.26*** .21* .00 .36** .48** -.27** ---
N = 105 Significance levels are indicated as follows:*p < .10, **p < .05, ***p < .01. These numbers measure the relative degree of association, both positive and negative, between the study variables.
The following hierarchical moderated regression equation is used to estimate the determinants of informal accountability for others: IAFO = β1(Age) + β2(Gender) + β3(Org. tenure) + β4(Race) + β5(tension) + β6(self-regulation) + β7 (self regulation x tension) Table 3 provides the stepwise regression results. The results indicate that the job tension x attentional control interaction term predict IAFO (b = 1.59, p < .05; ∆R2 = .05). This amount of explained variance by a moderator term is both significant and worthy of further discussion (Champoux & Peters, 1987). Table 3: Hierarchical Moderated Regression for Testing the Effects of Independent Variables on Informal Accountability for Others
Step and Variable β ∆R2 R2
Step 1: Age -.26** Gender .16* Organizational Tenure .10 Race -.03 .14 .14 Step 2: Job-induced tension -1.72*** Self-regulation -.75*** .03 .17 Step 3:
Self-reg. x tension 1.59** .05 .22
N = 105 Significance levels are indicated as follows: *p < .10, **p < .05, ***p < .01. All results include age, gender, and organizational tenure as control variables. The regression equation is estimated as follows: IAFO = β1(Age) + β2(Gender) + β3(Org. tenure) + β4(Race) + β5(tension) + β6(self-regulation) + β7 (self- regulation x tension) *Note- All beta weights are standardized In keeping with Stone and Hollenbeck’s (1989) suggestion, we plotted high and low levels (i.e., levels one standard deviation above and below the mean) of attention control across the range of tension scores. The paper illustrates the significant interactive relationship hypothesized in this research (i.e., control and tension) in Figure 2. Surprisingly, the slope of the high self-regulators was not significant (t = .66, p>.51 = N/S). However, the slope for those low in self-regulation was significant (t = -2.98, p<.01). These slopes force us to reject Hypothesis 1, but support Hypothesis 2.
9

M. T. Royle, G. Fox | IJMMR ♦ Vol. 4 ♦ No. 1 ♦ 2011
Figure 2: Graph of the Interaction between Tension, Strain, and IAFO
In keeping with Stone and Hollenbeck’s (1989) suggestion, plotted above are high and low levels (i.e., levels one standard deviation above and below the mean) of attentional control across the range of tension scores. This analysis is performed to assess the significance of the slopes of the moderating conditions. *Inacoth = abbreviation for Informal accountability for others. DISCUSSION Our research partially corroborates the influence of strain and self-regulatory control on informal accountability for others. Self-regulation, the ability to attend to only relevant cues in an organizational context, is demonstrated to moderate the strain-IAFO relationship, specifically in the case of low control. These findings help augment several bodies of literature. For example, understanding that low self-control individuals are inclined to seek IAFO as a means of impression management and/or to augment their own perceived performance weaknesses enhances both the body of research in accountability and organizational politics. Heretofore, little research examined the extent to which individuals’ abilities to ignore extemporaneous social information impacts the degree to which they feel answerable to others for the behaviors of their peers. Consequently, accountability research is extended by awareness that self-regulation can moderate how those under stressful conditions speak up (or do not) on behalf of others in organizations. By examining the influence of strain and employee responses to it (as determined by supervisors), it becomes apparent that dimensions relevant to informal accountability for others are effectively tapped in this research. Contributions to Theory and Practice Ferris, Mitchell, Canavan, Frink, and Hopper (1995), contended that accountability is a function of how a person is observed and evaluated by powerful others in an organization who possess reward or sanctioning power, and the extent to which those individuals either fear or value these outcomes. It is clear from our findings, that valued outcomes are important to those seeking IAFO. Additionally, as
4
4.2
4.4
4.6
4.8
5
5.2
5.4
5.6
0 1 2 3 4 5
Tension & Self-Regulation
Tension
Inac
oth
High Self-Regulation
Low Self-Regulation
10
INTERNATIONAL JOURNAL OF MANAGEMENT AND MARKETING RESEARCH ♦Volume 4 ♦ Number 1 ♦ 2011
Lerner and Tetlock (1999) noted, accountability is both the implicit or explicit expectations that individuals must justify their beliefs or actions to others, which can cause strain. Thus, it is conceivable that individuals might find being accountable for others either desirable or stressful. These data indicate that those seeking accountability conditions as a means to enhance image and hedge unpleasant uncertainties are likely to be those who lack task-relevant focus, yet already feel strained. Consistent with extant research, this study’s results support the contention that those low in self-control, in the form of self-regulation, find stressful conditions most unattractive (Aspinwall, 2001; Hobfoll & Shirom, 2001) and are, thus, inclined to seek the aid of others by signaling their informal accountability for them. Our research also helps further Hockey’s (1993) energetic-control framework, which suggested that individuals’ senses of well-being are better ensured when they mobilize their cognitive/attention resources. Admittedly, however, these data indicate that individuals are most likely focusing their energies on themselves and not answering for others when under great stress, provided they can control their impulses. In other words, internally directed respondents (i.e., those with high levels of self-regulation) preferred to “hole up” in order to ensure their well-being (e.g., incomes and jobs).
Hockey (1997) also noted that managing efforts allows individuals to control the effectiveness of their task behavior relative to competing goals, evolving demands and current energy stores. Responses from employees in this sample indicated that those low in self-regulation lack necessarily attentional and cognitive resources and are, therefore, inclined to try to co-opt them from others in the organization to try to make up the difference. Implications for organizations from our findings are noteworthy. Specifically, Greenhaus, Callahan, and Godshalk (2000) noted that to better understand and compete in contemporary careers, individuals must not only possess adequate skills, but also extend their work involvement, build their images/reputations, develop supportive alliances, and successfully manage organizational politics. Successfully signaling informal accountability for others is an example of extending work involvement as well as being a means to enhance reputation. Thus, if sincere and competently managed, IAFO can enhance one’s career, particularly for those feeling strained or worried that they cannot easily succeed without the help of others. A practical further managerial implication of these findings involves the evolution of organizational structures. Employees understand that benefits accrue by cooperative relationships that reflect identification with the firm itself (Organ, 1997). This idea is pivotal in pursuing informal accountability for others. Noting the flattening of organizational structures (i.e., fewer bureaucratic levels) and increasing spans of control (Cascio, 1995), IAFO potentially increases in importance given fewer political checks and balances. Furthermore, if organizations continue to reduce levels, as with “de-layering”, downsizing, outsourcing, or off-shoring, accountability becomes even more desirable due to a lack of centralized authority and a reduction in position power and the numbers of employees who possess it (Cascio, 1995). Considering that accountability can enhance the quality of decisions and the levels, directions, and persistence of work related efforts (Tetlock, 1985, 1992) organizations actively encourage highly focused individuals (i.e., those high in self-regulation) to pursue IAFO as an informal mechanism of corporate governance and potential for enhanced performance, as opposed to allowing them to entrench and wait for things to get better. This aids in establishing better informal mechanisms of corporate governance as well as extending employee involvement. Strengths and Limitations There are both strengths and limitations in this research that warrant attention. An important strength of this study is its potential to generalize findings on IAFO. Common criticisms of prior accountability
11

M. T. Royle, G. Fox | IJMMR ♦ Vol. 4 ♦ No. 1 ♦ 2011
studies are often of research design. Much of the work in accountability is done using laboratory experiments. This type of scientific inquiry is specifically criticized for a lack of realism, thus, raising concerns about the external validity of findings (Frink & Klimoski, 1998, 2004). Further, prior research generally did not use real employees in authentic work situations (Frink & Klimoski, 1998, 2004). Our data help obviate this problem by focusing on working adults in an actual organization. Another strength of this study relates to the level of respondent participation, a common concern in organizational research. In this case, our study was aided by employees’ willingness to give of their time and carefully consider their answers. Prior studies on response rates suggest that only about 30% of potential subjects complete and return surveys (Dillman, 2000). The response rate in this study was 84%. Such a high level of involvement is attractive because it bolsters our case that the beliefs of employees, as a whole, are being adequately represented. However, we recognize that non-response bias (the potential that respondents differ in motivation and ability from non-respondents) cannot be entirely ruled out because not all employees completed their surveys (Schwab, 1999). There are, of course, limitations to our findings that must be addressed. A possible limitation in our work involves the choice of organizations. As discussed, the organization used in the current study might differ from other samples. Most of the employees were young (21 years of age on average) relative to the general population. This might affect the nature and time frame of the job, and thus, differentially affect decisions to seek informal accountability for others (Somers, 1995). Additionally, the ratio of employees to supervisors is low. On average, each supervisor evaluated 26 employees. Generally, it is desirable for supervisors to evaluate a small number of employees in order to avoid potentially biased results due to an obscuring of differences between employees. However, such actions are likely to dampen effects rather than enhance them, thus offering more conservative estimates in our study. This study is also potentially limited by its reliance on cross-sectional data. A frequent lament of organizational researchers is the lack of longitudinal research design in field studies. Specifically, cross-sectional studies are purported to diminish the ability to make more definitive statements of causality (Schwab, 1999). While we offer a valuable first step toward understanding antecedents to IAFO, longitudinal tracking of employee strain (whether caused by either external factors like the macro-economy or internal dimensions related to personality and job demands) could help better determine how much strain is too much and at what point high self-regulators actively avoid IAFO. Future research might attempt to build in time-series designs for studying the strain, control and informal accountability for others relationship. Another limitation to our study exits because of our reliance on supervisors. Although, in general, the dyadic research design helps reduce bias in ratings (e.g., social desirability bias), we cannot entirely rule out the possibility that it exists in this research. Supervisors might show bias. For example, they might not all read the IAFO items and believe that they mean exactly the same things. They might not also treat every employees the same when they evaluate them (e.g., evaluations could show halo effects or central tendency errors). However, we cannot break our sample into smaller portions based on employees’ supervisors due to size. According to Hu and Bentler (1999), in order to run an analysis of this type with the number of variables present in our study using structural equation modeling (SEM - a preferred option which could confirm or refute the existence of supervisor response bias in our findings) we would need a sample of over 200 pairs of matched supervisor/subordinate dyads. Unfortunately, we only have 105 responses. Splitting the respondent set into three different categories based on supervisors in order to run regression models would cause statistical power and effect size to fall below conventional benchmarks (Cohen et al., 2003).
12

INTERNATIONAL JOURNAL OF MANAGEMENT AND MARKETING RESEARCH ♦Volume 4 ♦ Number 1 ♦ 2011
Directions for Future Research Future research might consider the influence of culture on the strain-IAFO relationship. Specifically, many of Hofstede’s (1980, 2001) cultural dimensions may shed light on the relative desirability of seeking informal accountability for others. These dimensions may differentially predict IAFO. For example, individualistic cultures may be more likely to seek IAFO to reduce stress than collectivist cultures that embrace IAFO as a matter of cultural disposition. Collectivistic and feminine cultures tend to value the overall good of the group, quality of life, and the maintenance of positive, mutually beneficial interpersonal relationships (Hofstede, 1980, 2001). Shankar, Ansari, and Saxena (1994) noted that in collectivist societies participative climates are common and ingratiatory behaviors are desirable. Future research might address whether these preconditions are sufficient to induce employees, whether high or low in self-regulation, to seek IAFO, thus, extending desired organizational involvement. Future research might also compare this empirical relationship in terms of time orientation (Bond, 1986; Hofstede, 1980). Specifically, the extent to which individuals who prefer thrift and persistence (i.e., long-term orientation) to immediate results (i.e., short-term orientation) may incline them to differentially seek informal accountability for others. For example, it is a possible that those who are culturally disposed to thrift and persistence (i.e., long-term orientation) seek informal accountability for others because they are accustomed to the notion that interactions between coworkers are evolving relationships rather than a series of discrete transactions (Francesco & Gold, 2005). Similarly, as noted by Baruch (2004) this long-term view fosters expectations of lifetime employment (whether idealized or realistic) and this might make seeking IAFO more realistic for those high in self-regulation because they likely do not feel the need for individualized, highly directed efforts in order to contend with strain. In fact, we might expect that the overall level of strain is lower in such organizations. CONCLUSION Heretofore, research largely contended that strain is an outcome of accountability because of the evaluative judgments individuals believe they incur with the presence of a rewarding or punishing audience (Ferris et al., 1995; Tetlock, 1985, 1992). Although this is certainly plausible, there may be alternate conceptualizations of this relationship when considering the notion of being informally answerable for others (particularly when these others are not formal subordinates). This idea lies at the crux of informal accountability for others. In this paper, we set out to demonstrate the relationship between stress, control (i.e., self-regulation), and informal accountability for others. We sampled employees at a recreational facility and matched their perceptions of how informally accountable they felt about their coworkers to their supervisors’ ratings. We hypothesized that those who had high levels of self-control would be more likely to seek IAFO when they felt strained at work. Alternatively, we hypothesized that those low in self-control would avoid IAFO. We tested these hypotheses with using hierarchical moderated regression (Champoux & Peters, 1987) and then tested the significance of the slopes of the corresponding regression lines (Stone & Hollenbeck, 1989). Our findings indicated that the strain individuals feel in their jobs might incline them to seek accountability for others in order to help alleviate future uncertainties. Data suggested that this is specifically the case for those who find it difficult to regulate their impulses and focus on their job-related demands when in stressful conditions. Alternately, those high in control avoided IAFO when stressed. Naturally, our findings are limited owing to a reliance on cross-sectional data, a marginal sample size and relatively young respondents. Future research should attempt to constructively replicate these findings as well as consider additional cultural conditions, which might affect the strain-control-IAFO relationship.
13

M. T. Royle, G. Fox | IJMMR ♦ Vol. 4 ♦ No. 1 ♦ 2011
REFERENCES Arnold, H. J., and Feldman, D. C. (1981), Social desirability bias in self-report choice situations. Academy of Management Journal, 24, 377-385. Aspinwall, L. (2001), Dealing with adversity: Self-regulation, coping, adaptation, and health. In A. Tesser and N. Schwarz (Eds.), Blackwell Handbook of Social Psychology: Intra-individual Processes, (pp. 591-614). Malden, MA: Blackwell Publishers. Astrachan, J. H. (1995), Organizational departures: The impact of separation anxiety as studied in mergers and acquisitions simulation. Journal of Applied Behavioral Sciences, 31, 31-50. Baruch, Y. (2004), Managing Careers: Theory and practice. New York: Prentice Hall. Baumeister, R. F., Brataslavsky, E., Muraven, M., and Tice, D. M. (1998), Ego depletion: Is the self a limited resource? Journal of Personality and Social Psychology, 74, 1252-1265. Beehr, T. A., and Bhagat, R. (1985), Introduction to human stress and cognition in organizations. In T. Beehr and R. Bhagat (Eds.), Human stress and cognition in organizations. (pp. 3-19). New York: Wiley. Blau, P. (1964), Exchange and power in social life. New York: Wiley. Blau, P. (1977), Inequality and heterogeneity. New York: Free Press. Bond, M. H. (1986), The psychology of the Chinese people. Hong Kong: Oxford University Press. Brockner, J. (1992), Managing the effects of layoffs on survivors. California Management Review, 34, 9-28. Bunce, D., and West, M. A. (1996), Stress management and interventions at work. Human Relations, 49, 209-232. Carnevale, P. J. D. (1985), Accountability of group representatives and intergroup relations. In E. J. Lawler (Ed.), Advances in group processes (Vol. 2, pp. 227-248). Greenwich, CT: JAI Press. Carver, C. S. (2004), Self-regulation of action and affect. In R. Baumeister and K. Vohs (Eds.), Handbook of self-regulation: Research, theory and applications (pp. 13-39). New York: Guilford. Carver, C. S., and Scheier, M. F. (1982), Control theory: A useful conceptual framework for personality social, clinical, and health psychology. Psychological Review, 92, 111-135. Cascio, W. F. (1995). Whither industrial and organizational psychology in a changing world of work? American Psychologist, 50, 928-939. Champoux, J., and Peters, W. (1987), Form, effect size, and power in moderated regression analysis. Journal of Occupational Psychology, 60, 243-255. Cohen, J., Cohen, P., West, S. G., and Aiken, L. S. (2003), Applied multiple regression for the behavioral sciences (2nd ed). Mahwah, NJ: Lawrence Erlbaum. Cummings, L. L., and Anton, R. J. (1990), The logical and appreciative dimensions of accountability. I
14

INTERNATIONAL JOURNAL OF MANAGEMENT AND MARKETING RESEARCH ♦Volume 4 ♦ Number 1 ♦ 2011
S. Sivastva, D. Cooperrider, and Associates (Eds.), Appreciative management and leadership (pp. 257-286). San Francisco: Jossey-Bass. Deluga, R. J. (1988), The politics of leadership: The relationship between task-people leadership and subordinate influence. Journal of Organizational Behavior, 9, 359-366. Dienesch, R. M., and Liden, R. C. (1986), Leader-member exchange model of leadership: A critique and further development. Academy of Management Review, 11, 618-634. Dillman, D. A. (2000). Mail and Internet surveys--The tailored design method. New York : John Wiley & Sons, Inc. Epstein, L. G. (1999), A definition of uncertainty aversion. The Review of Economic Studies, 66, 579-608. Ferris, G. R., Mitchell, T. R., Canavan, P. J., Frink, D. D., and Hopper, H. (1995), Accountability in human resource systems. In G. R. Ferris, S. D. Rosen, and D. T. Barnum (Eds.), Handbook of human resource management (pp.175-196). Oxford, U.K.: Blackwell Publishers. Folkman, S., and Lazarus, R. S. (1985), If it changes it must be a process: A study of emotion and coping during three stages of a college examination. Journal of Personality and Social Psychology, 4, 150-170. Francesco, A. M., and Gold, B. A. (2005), International Organizational Behavior. Upper Saddle River, NJ: Prentice Hall. Frink, D. D., and Klimoski, R. J. (1998), Toward a theory of accountability in organizations and human resource management. In G. R. Ferris (Ed.), Research in personnel and human resource management (Vol. 16, pp. 1-51). Stamford, CT: JAI Press. Frink, D. D., and Klimoski, R. J. (2004), Advancing accountability theory and practice: Introduction to the human resource management review special addition. Human Resource Management Review, 14, 1-17. Geen, R. G. (1991), Social motivation. Annual Review of Psychology, 42, 377-399. Gouldner, A. W. (1960), The norm of reciprocity: A preliminary statement, American Sociological Review, 25, 161-178. Graen, G. B., and Uhl-Bien, M. (1995), Relationship-based approach to leadership development of leader member exchange (LMX) theory of leadership over 25 years: Applying a multi-domain perspective. Leadership Quarterly, 6, 219-247. Green, M. C., Visser, P. S., and Tetlock, P. E. (2000), Coping with accountability cross-pressures: Low effort evasive tactics and high-effort quests for complex compromises. Personality and Social Psychology Bulletin, 11, 1380-1391. Greenhaus, J. H., Callahan, G. A., and Godshalk, V. M. (2000), Career Management (3rd ed.). Fort Worth, TX: Dryden Press. Hobfoll, S. E., and Shriom, A. (2001), The influence culture, community, and the nested self in the stress
15

M. T. Royle, G. Fox | IJMMR ♦ Vol. 4 ♦ No. 1 ♦ 2011
process: Advancing conservation of resources theory. In R. T. Golembiewski (Ed.), Handbook organizational behavior (pp. 57-80). New York: Marcel Dekker. Hockey, G. (1993), Cognitive-energetical control mechanisms in the management of work demands and psychological health. In A. D. Baddeley, and L. Weiskrantz, (Eds.), Attention, selection, awareness and control: A tribute to Donald Broadbent (pp. 328-345). Oxford, UK: Oxford University Press. Hockey, G. (1997), Compensatory control in the regulation of human performance under stress and high workload: A cognitive-energetic framework. Biological Psychology, 45, 73-93. Hofstede, G. (1980), Culture’s consequences: International differences in work-related values. Beverly Hills, CA: Sage. Hofstede, G. (2001), Culture’s consequences: Comparing values, behaviors, institutions, and organizations. Thousand Oaks, CA: Sage. Hu, L. T., and Bentler, P. M. (1999), Cutoff criteria in fix indexes in covariance structure analysis: Conventional criteria versus new alternatives. Structural Equation Modeling, 6, 1-55. Kahn, R. L, Wolfe, D. M, Quinn, R. P., Snoek, J. D., and Rosenthal, R. A. (1964), Organizational stress: Studies in role conflict and ambiguity. New York: Wiley. Kaiser, H. (1974), An index of factorial simplicity. Psychometrika, 39, 31-36. Karasek, R. (1979). Job demands, job decision latitude and mental strain: Implications for job redesign. Administrative Science Quarterly, 24, 285-306. Katz, D., and Kahn, R. L. (1978), The social psychology of organizations. New York: John Wiley. Kaufman, J. D., Stamper, C. L., and Tesluk, P. E. (2001), Do supportive organizations make for good corporate citizens? Journal of Managerial Issues, 13, 436-449. Lazarus, R. S., and Folkman, S. (1984), Stress appraisal and coping. New York: Springer. Leary, M. R. (1996), Self-presentation: Impression management and interpersonal behavior. Boulder, CO: Westview Press. Leary, M. R., and Kowalski, R. M. (1990), Impression management: A literature review and two component model. Psychological Bulletin, 107, 34-47. Lerner, J. S., and Tetlock, P. E. (1999), Accounting for the effects of accountability. Psychological Bulletin, 125, 255-275. Mauss, M. (1954), The gift. New York: Free Press. Mechanic, D. (1962), Students under stress: A study in the social psychology of adaptation. New York: Free Press. Moos, R. H., and Billings, A. G. (1982), Conceptualizing and measuring coping resources and processes. In L. Goldberger and S. Breznetz (Eds.), Handbook of stress: Theoretical and clinical aspects. New York: Free Press.
16

INTERNATIONAL JOURNAL OF MANAGEMENT AND MARKETING RESEARCH ♦Volume 4 ♦ Number 1 ♦ 2011
Morrison, E. W., and Phelps, C. C. (1994), Taking charge at work: Extra-role efforts to initiate workplace change. Academy of Management Journal, 42, 403-419. O’Driscoll, M. P., and Beehr, T. A. (1994), Supervisor behaviors, role stressors and uncertainty as predictors of personal outcomes for subordinates. Journal of Organizational Behavior, 15, 141-155. O’Neill, H. M., and Lenn, D. J. (1995), Voices of survivors: Words that downsizing CEOs should here. Academy of Management Executive, 9, 23-34. Organ, D. W. (1997), Organizational citizenship behavior: It’s construct clean-up time. Human Performance, 10, 85-97. Pallant, J. (2004), SPSS survival manual: A step-by-step guide to using SPSS. New York: McGraw-Hill. Porter, L. W., and Lawler, E. E. (1968), Managerial attitudes and performance. Homewood, IL: Dorsey Press. Price, K. H. (1987), Decision responsibility, task responsibility, identifiability, and social loafing. Organizational Behavior and Human Decision Processes, 40, 330-345. Royle, M. T., Fox, G. L., and Hochwarter, W. A. (2009), The Relationships between Select Situational and Dispositional Constructs and Informal Accountability for Others. International Journal of
Management and Marketing Research, 2, 113-133. Royle, M. T., Hochwarter, W. A., and Hall (2008), The mediating effect of informal accountability for others. International Journal of Management and Marketing Research, 1, 1-22. Schwab, D. P. (1999), Research methods for organizational studies. Mahwah, NJ: Lawrence Erlbaum Associates. Shankar, A., Ansari, M. A., and Saxena, S. (1994), Organizational context and ingratiatory behavior in organizations, 134, 641-647. Sheridan, J. E., and Vredenburgh, D. J. (1978), Usefulness of leader behavior and social power variables in predicting job tension, performance, and turnover of nursing employees. Journal of Applied Psychology, 63, 89-95. Simonson, I., and Nowlis, S. (2000), The role of explanations and the need for uniqueness in consumer decision-making: Unconventional choices based on reasons. Journal of Consumer Research, 27, 49-68. Somers, M. (1995). Organizational Commitment, turnover, and absenteeism: An examination of direct and indirect effects. Journal of Organizational Behavior, 16, 49-58. Stenning, P. C. (1995), Accountability for criminal justice. Toronto: University of Toronto Press. Stone, E. F., and Hollenbeck, J. R. (1989), Clarifying some controversial issues surrounding statistica procedures for detecting moderator variables: Empirical evidence and related matters. Journal of Applied Psychology, 74, 3-10. Tetlock, P. E. (1985), Accountability: The neglected social context of judgment and choice. In L. L.
17

M. T. Royle, G. Fox | IJMMR ♦ Vol. 4 ♦ No. 1 ♦ 2011
Cummings and B. M. Staw (Eds.), Research in organizational behavior (Vol. 7, pp. 297-332). Greenwich, CT: JAI Press. Tetlock, P. E. (1992), The impact of accountability on judgment and choice: Toward a social contingency model. In M. Zanna (Ed.), Advances in experimental social psychology (pp. 331-377). New York: Academic Press. Vohs, K., and Baumeister, R. F. (2004), Understanding self-regulation. In R. Baumeister and K. Vohs (Eds.), Handbook of self-regulation: Research, theory and application (pp. 1-9). New York: Guilford Press. Vroom, V. H. (1964), Work and motivation. New York: Wiley. Wayne, S. J., Shore, L. M., and Liden, R. C. (1997), Perceived organizational support and Leader Member Exchange: A social exchange perspective. Academy of Management Journal, 40, 82-111. Wilbert, C., and Chang, L. (2008, October 8), “As economy worsens, so does stress: 80% of Americans stressed about economy”. WebMD Health News. Zajonc, R. B. (1965), Social facilitation. Science, 149, 296-274. Zajonc, R. B., and Sales, S. M. (1966), Social facilitation of dominant and subordinate responses. Journal of Experimental Social Psychology, 2, 160-168. Zimbardo, P. G. (1970), The human choice: Individuation, reason, and order versus deindividuation, impulse, and chaos. In W. J. Arnold and D. Levine, (Eds.), Nebraska Symposium on Motivation, (pp. 237-307). Lincoln: University of Nebraska Press. Zivnuska, S., Witt, L. A., Carlson, D. S., Kacmar, K. M., and Bratton, V. K. (2004), Impression Management as a Moderator of the Politics-Performance Relationship. Journal of Organizational Behavior, 25, 627-640. BIOGRAPHY M. Todd Royle (Ph.D. Florida State University) is an assistant professor of management at Valdosta State University. He teaches courses in organizational behavior, international business, human resource management and career development. His main research interests relate to accountability, culture and organizational politics. Please address correspondence to M. Todd Royle, Department of Management, Valdosta State University, Valdosta, GA 31698-10076, (229) 245-3875 (Office), [email protected] Please address correspondence to M. Todd Royle, Department of Management, Valdosta State University, Valdosta, GA 31698-10076, (229) 245-3875 (Office), [email protected] Gavin L. Fox (Ph.D. Florida State University) is an assistant professor of marketing at Texas Tech University. He specializes in strategic marketing issues such as the impact of human capital and inter-firm relationships on firm performance. Dr. Fox also focuses heavily on service issues such as the impact of failures on customer retention and the interplay between service workers and customers.
18

INTERNATIONAL JOURNAL OF MANAGEMENT AND MARKETING RESEARCH ♦Volume 4 ♦ Number 1 ♦ 2011
THE INFLUENCE OF SOCIALIZATION AGENTS AND DEMOGRAPHIC PROFILES ON BRAND
CONSCIOUSNESS Zaharah Ghazali, Universiti Sultan Zainal Abidin
ABSTRACT
The objective of this study was to investigate how socialization agents—media, parents, and peers—influence on students’ brand consciousness in apparel and influences differ according to students demographic characteristics. Participants were 230 students in second semester, who undertaking Bachelor of Business Administration in Universiti Utara Malaysia. Overall, peers exert the greatest influence. The results by using Pearson correlation coefficients analyses suggested that, the students’ brand consciousness is, significantly correlated to each socialization factor. However, of the media related analysis, only movie viewing shows a significant correlation. The other two have significant correlation with parental influence and peer influence. Moreover, significant differences were found for socializations agents and brand consciousness across gender and ethnicity. Family and consumer educators should consider findings of this study as a guide to give better education to students as consumers. JEL: M3 KEYWORDS: Brand consciousness, socializations agents, young customer, apparel INTRODUCTION
any consumers are interested in brand names when they buy products. Sproles and Kendall (1986) define brand consciousness as the need or desire to purchase well-known national brands, higher priced brands and/or the most advertised brands. In fact, well-known brand
names often make a social statement about an individual’s status, such as Rolex watches, BMW vehicles, Sony electronics, and GUCCI textiles (Wanke, Bohner, & Jurkowitsch, 1997). This belief may or may not be accurate or realistic; however, it reflects a specific decision-making outcome for the consumers that purchase these items. This outcome consists partially of the positive perceptions of others about the consumer of expensive brand items; therefore, brand consciousness plays an important part in society, and breeds the belief that higher prices mean higher quality. Apart from this, it is widely believed that the teenage stage in which an individual’s consumption leverage increases very rapidly in terms of financial resources and decision-making discretion (Shim & Gehrt, 1996). Youth in Malaysia have rapidly come to represent one of the most lucrative market segments as this population shows a positive indication in recent decades. During the Eighth Malaysia’s Plan period, the youth population, comprising those in the 15-24 age-group had been estimated to increase by 2.6 per cent per annum, from 4.37 million in 2000 to 4.98 million in 2005 (Economic Planning Unit, 2001). Yet, as the standard of living among Malaysians has improved significantly, further stimulated by changing lifestyles, teenagers today are granted freedom from their parents to make their own shopping and consumption decisions. As a result, teenagers’ buying power has increased rapidly as more of them enter the marketplace. This is not surprising when considering that shopping has become one of the leisure activities most often participated in by young Malaysians (Othman & Sim, 1993).
M
19

Z. Ghazali | IJMMR ♦ Vol. 4 ♦ No. 1 ♦ 2011
In this study, the more appropriate term is young adults, reflecting that ‘youth’ is relevant in the West, where 18-year-old people are stylemakers and are very provocative and pro-active. Whereas in Asia, according to Wee (2002), due to the culture, and in Singapore, things like NS (National Service), it slows things down. She stated, “When you’re 18 in the West, you leave home, live on your own and are independent,” (Wee, Feb 2002). Wee’s report furthered as follows: These people are very marketing-savvy. This generation of young adults is very brand conscious. Rather than go for the brand that everyone is going for, they’d rather choose different things. They are more selective about what they do. They are just choosing which mediums to go for, which ads to enjoy. (p. 1) The marketing literature provided evidence of relationships between demographic characteristics such as age, gender, ethnicity, for example, and brand consciousness (Nelson & McLeod, 2005). Researchers also have identified three main sources of influence on young people’s consumer socialization. They are: peers, parents, and the mass media (Moschis, 1987; Ward, 1974). Rarely have these socialization agents been examined simultaneously, especially in the context of clothing behavior (Mascarenhas & Higby, 1993; Wilson & MacGillivray, 1998). Hence, with an expanding young population and the strong marketing impact that they have created, marketers and consumer researchers have become increasingly interested in exploring the shopping approach on decision-making of teenagers. However, little research has been conducted in this area in Malaysia and no research at all in brand consciousness among college students. This study is intended to know how potential buyers are conscious of a brand name in apparel among students of the Universiti Utara Malaysia (UUM). If a shopping center management is considering whether brand name’s outlets of apparel should be added to the center, the opinions of customers and potential customers will be desired. This paper provides a brief review on brand consciousness in apparel and socialization agents, followed by the data and methodology and main results of the study. Finally discussion and conclusions are outlined. LITERATURE REVIEW Brand Consciousness in Apparel A brand serves to add dimensions to a product to differentiate it in some way from other products designed to satisfy the same need (Keller, 1998). The strength of brands is measured by the price differential consumers are willing to pay over other products in the same category (Grassl, 1999). For many young people, it is not buying a pair of jeans, but buying GAP or Tommy Hilfiger or Levis. This “barrage of brand names offers the irresistible promise of instant cool,” particularly for teenagers (Wechsler, 1997, p. 64). Huddleston and Cassill (1990) noted that, as clothing expenditures increased, consumers were more likely to be brand oriented. Lee and Burns (1993), in a comparison of Korean and U.S. college students, found that Southeast Asian students placed greater importance on apparel brand identity than did American students. More recently Moses (2000) observed that 62 per cent of Indonesian teens stated that there were products that they would not wear or use if they were not the ‘right’ brand. This figure represented the highest percentage in a comparison of 44 nations. Johnson, Schofield and Yurchisin (2002) conducted research on the psychological aspect of apparel. They studied if and how people use the appearance and dress of others to gather information about them. The purpose of the research was to determine what impression research subjects formed of others and what cues they used to form those impressions. The subjects were 39 women gathered by placing an
20
INTERNATIONAL JOURNAL OF MANAGEMENT AND MARKETING RESEARCH ♦Volume 4 ♦ Number 1 ♦ 2011
advertisement in a newspaper. Thomas, Cassill and Forsythe (1991) studied apparel involvement dimensions in consumer purchase decisions. Examining the 177 useable responses from female apparel consumers in malls in the southern U.S., it was found that apparel involvement has two dimensions, “dress to express personality,” which describes women who use their apparel to communicate who they are, and “dress as a signaling device,” which describes women who determine how others see them based on their apparel. Socialization Agents Since the consumer socialization concept was adopted into the field of consumer behavior, research has identified three major sources of teens’ influences: parents, peers, and mass media (Moschis & Churchil, 1987; Moschis & Moore, 1983; Shim & Koh, 1997). Parents played an important role for young consumers’ purchasing behaviors (Shim & Koh, 1997). Parents influenced children and adolescents by letting them observe and imitate their consuming behaviors, by interacting with them in their consumption, and by providing them with opportunities for guided consumption. Children learn the basic knowledge of consumer behaviors by interacting with parents. Moschis and Churchill (1987) found that the greater the communication between teens and their parents about consuming behaviors, the more economically prudent the young people's consumer choices will be. Although some studies reported parental influence was found to decrease when children grow, studies found that parental influences still important on teens’ purchasing behavior (Mascarenhas & Higby, 1993; Moschis & Moore, 1983). Likewise, because people want to interact with people who have similar ideas, attitudes, and knowledge, peer groups play a significant role in consumer socialization throughout an individual’s life cycle (Moschis, 1987). Like other socialization agents, peers may directly and indirectly affect young consumers’ socialization. Researchers suggest that young people learn the symbolic meaning of goods and consumption from their peers and their influence significantly increases during the teens (Bearden & Randall, 1990). Moreover, while many studies reported that parents and peers are the primary socialization agent of young consumers, mass media has received the significant attention from researchers. Moschis (1987, p. 121) stated, “… no other agent of consumer socialization has received more attention than the mass media (television).” Television advertising provides young consumers knowledge and insights in their products and behavior as consumers. Through the interaction with mass media (television) young consumers may develop perceptions toward products and brands (Moschis, 1987; Moschis & Moore, 1983). Besides, many researchers found that among the individual’s unique situation variables, life cycle position (age) and social structure (gender) provide significant impacts on socialization agents’ influence on consumer behavior (Moschis, 1987; Shim, 1996). Because socialization is a life-time process, people continuously learn different things from different sources at different stages in their lives and a different cluster of variables will dominate each life cycle stage (Moschis & Moore, 1983). Although information sources differ between products, in general, the parental influence is the greatest during the childhood and early teens, peer influence increases with age, and mass media influence remains constant. Many advertising researchers are concerned with the impact of gender differences on consumers’ selection of information sources for purchasing products (Kempf & Palan, 1997). Female teens tend to talk with their peers and parents about consumption matters, such as information search, purchase decisions, and brand preference, more frequently than do male teens (Moschis, 1987).
21

Z. Ghazali | IJMMR ♦ Vol. 4 ♦ No. 1 ♦ 2011
DATA AND METHODOLOGY This study used quantitative research approach and surveyed the student’s brand consciousness and their socialization, to compare individual differences among college-aged consumers. The participants in this study were all undergraduate students from the Department of Business Administration, second semester. Simple random sampling was used in selecting respondents from this group. From the 260 questionnaires distributed, the researcher managed to get a return of 230. This yielded a response rate of 88%. The questionnaire constitutes two sections. The first section was designed to collect demographics data, pertaining to gender and ethnicity. The second section consisted of 30 questions on all the independent and dependent variables namely, media exposure, parental influence, peer influence, and brand consciousness. All the 30 questions set were derived from previous surveys. RESULTS The sample was composed of a dissimilar proportion of females and males (see Table 1). The usable sample of participants included 167 females (72.6%) and 63 males (27.4%). For December 2005/2006 session, the entire first-year, in second semester BBAs was 74.3% (n = 571) female and 25.6% (n = 197) male students (Department of Academic Affair, 2006), which was rather similar in percentages to the current sample. Table 1: Frequency Distribution and Percentage of Gender
Gender Frequency Percent (%) Male 63 27.4 Female 167 72.6 Total 230 100
This table shows the frequency counts and percentages of male/female participation. These data indicate that more females than males participate in this study. Table 2 shows the frequency distribution and percentage of the ethnicity in this study. Within the usable sample, the largest number was Malay at 112 (48.7%), followed by Chinese at 61 (26.5%). Only 38 students (16.5%) were Indian and the smallest number of students from of other ethnic groups (Siamese, Singaporean, Indonesian, Other) was represented at 19 (8.3%). Table 2: Frequency Distribution and Percentage of Ethnicity
Ethnicity Frequency Percent (%) Malay 112 48.7 Chinese 61 26.5 Indian 38 16.5 Of other 19 8.3 Total 230 100
This table shows the frequency and percentage in the ethnicity sample. The highest recorded frequency/percentage is Malay. Reliability Analyses of the Measurement Scales The reliability test for the first variable, media exposure, was not carried out because this item consists of only one. The second variable labeled as familial/parental influence, consisted of ten items. The coefficient alpha for this scale is 0.81. The reliability for third variable as measured by Cronbach’s coefficient alpha is also 0.81 with 10 items, and was labeled as irrational social influence/peer influence. Finally, for fourth variable, the coefficient alpha obtained is 0.82 which consists of six items, which is consistent with those reported by the authors of the scale (Nelson & McLeod, 2005). It was labeled as brand consciousness.
22

INTERNATIONAL JOURNAL OF MANAGEMENT AND MARKETING RESEARCH ♦Volume 4 ♦ Number 1 ♦ 2011
Differences of Demographic Factors on Socialization Agents Results showed that influence from peers revealed the most significant differences by gender: females were more likely to be influenced by peers (t = -4.278, p = 0.000), as shown in Table 4. Other significant differences were noted for parental influence: females were more likely to be influenced by parents (t = -2.729, p = 0.007). Results of media exposure analyses revealed females were more likely to watch TV (t = -2.192, p = 0.029), listen to music (radio, CDs) (t = -2.459, p = 0.015), and spend time online (t = -3.092, p = 0.002) than were males. Table 3: Mean Values of Media Exposure, Parents, and Peers Variables by Gender
Media exposure Parents Peers TV Radio Online Movies Male 3.16* 3.52* 3.22** 2.95 3.01** 2.98** Female 3.53* 3.92* 3.72** 2.86 3.22** 3.33**
**p < 0.01, *p < 0.05. This table shows the mean values of socialization agents by gender. The highest mean score to each agent was recorded by female. Table 4: Results of Independent Sample t-Test by Gender Differences on Socialization Agents
df t Significant Watching TV 228 -2.192 0.029 Listening to radio/CDs 228 -2.459 0.015 Spending time online 228 -3.092 0.002 At the movies 228 0.534 0.594 Parental influence 228 -2.729 0.007 Peer influence 228 -4.278 0.000
This table shows the t-test results of the gender on socialization agents. There are significant differences between male and female on each agent (‘watching TV’, ‘listening to radio/CDs’, ‘spending time online’, ‘parental influence’ and ‘peer influence’) with the exception of ‘at the movies’. Results of media exposure analyses revealed that across ethnicity the most significant differences were listening to radio/CDs. Table 6 indicates that Malays were more likely to listen to music (F = 8.806, p = 0.000) than Chinese, Indian, and other ethnic groups (Siamese, Singaporean, Indonesian, Other). Other significant differences were shown in terms of spending time online. Malays were more likely to spend time online (F = 3.187, p = 0.025) than others. For influence from parents and peers, no significant differences were found among these variables across ethnicity. Table 5: Mean Values of Media Exposure, Parents, and Peers Variables by Ethnicity
Media exposure Parents Peers TV Radio Online Movies Malay 3.43 4.05** 3.76* 2.97 3.22 3.24 Chinese 3.61 3.80** 3.23* 2.92 3.06 3.12 Indian 3.32 3.66** 3.66* 2.74 3.22 3.27 Of other 3.11 2.74** 3.53* 2.53 3.06 3.43
**p < 0.01, *p < 0.05. This table shows the mean values of socialization agents by ethnicity. The highest mean score was recorded by Malay on listening to radio/CDs. Table 6: Results of One-Way ANOVA by Ethnicity Differences on Socialization Agents
df F Significant Watching TV 3 1.084 0.357 Listening to radio/CDs 3 8.806 0.000 Spending time online 3 3.187 0.025 At the movies 3 0.952 0.416 Parental influence 3 1.506 0.214 Peer influence 3 1.598 0.191
This table shows the ANOVA results of the ethnicity on socialization agents. There are significant differences across ethnicity on ‘listening to radio/CDs’ and ‘spending time online’. The other agents (‘watching TV’, ‘at the movies’, ‘parental influence’ and ‘peer influence’) were not significant.
23

Z. Ghazali | IJMMR ♦ Vol. 4 ♦ No. 1 ♦ 2011
Differences of Demographic Factors on Brand Consciousness As would be expected, significant differences was found for brand consciousness across gender (t = -2.495, p = 0.013). This indicates that females were more likely to be highly brand-conscious than were males. Table 7: Results of Independent Sample t-Test by Gender Differences on Brand Consciousness
Mean df t Significant Male 2.98* Female 3.24* 228 -2.495 0.013
*p < 0.05 This table shows the mean values and the t-test results of brand consciousness by gender. The highest mean score was recorded by female. The data also reveals a significant difference between male and female on brand consciousness. A significant difference was found for brand consciousness across ethnicity (F = 8.732, p = 0.000). This indicates that students of other ethnic groups (Siamese, Singaporean, Indonesian, Other) are more likely to be highly brand-conscious than were Malay, Chinese, and Indian. Table 8: Results of One-Way ANOVA by Ethnicity Differences on Brand Consciousness
Mean df F Significant Malay 3.09** Chinese 3.10** Indian 3.13** Of other 3.95** 3 8.732 0.000
**p < 0.01 This table shows the mean values and the ANOVA results of brand consciousness by ethnicity. The highest mean score was recorded by ‘of other’. The data also reveals a significant difference across ethnicity on brand consciousness. Socialization Influences on Brand Consciousness The test for correlation was done for every independent variable components with brand consciousness. The results are shown in Table 9. Table 9: Pearson Correlation Coefficient Matrix of Seven Variables
N TV Radio Online Movies Parents Peers Brand TV 230 1 Radio 230 0.249** 1 Online 230 0.157* 0.474** 1 Movies 230 0.252** -0.065 0.067 1 Parents 230 0.015 0.251** 0.143* -0.366** 1 Peers 230 0.017 0.109 0.254** -0.315** 0.368** 1 Brand 230 -0.081 -0.020 0.067 -0.369** 0.134* 0.486** 1
**p < 0.01, *p < 0.05 This table shows the correlations between socialization agents and brand consciousness. There are significant relationships between seven variables. The most significant was recorded by relationship between ‘peer’ or ‘movies’ and brand consciousness. Results show that the students’ brand consciousness is significantly correlated to each socialization factor (media socialization, parents, peers). However, the extent of media influence differs on the specific medium. Movie viewing (r = -0.369, p < 0.01) showed a negative relationship. The other two showed positive relationship, that is, parental influence (r = 0.134, p < 0.05) and peer influence (r = 0.486, p < 0.01).
24

INTERNATIONAL JOURNAL OF MANAGEMENT AND MARKETING RESEARCH ♦Volume 4 ♦ Number 1 ♦ 2011
DISCUSSION Differences of Demographic Factors on Socialization Agents The most revealing finding of demographic factors (gender, ethnicity) on socialization agents in this study is that gender exerts a strong influence on the interaction process between UUM students and their socialization agents. The findings suggest that the influence of socialization agents on college students vary across gender. However, it should be kept in mind that demographic characteristics other than those examined in this study might also affect college students’ socialization process. Peers emerged as the most important agents of consumer socialization. This study revealed that female students are more likely to interact with their peers when purchasing branded apparel. This finding is consistent with previous studies (i.e. Lachance, Beaudoin, & Robitaille, 2003). Female teens tend to talk with their parents about consumption matters, such as information search, purchase decisions, and brand preferences more frequently than do males (Moschis & Mitchell, 1986). On the relationship between college students and socialization agents’ influence on teens apparel purchasing, parental influences were not much and peer influences emerged as a primary source to college student-age. This finding is consistent with previous studies (i.e. Lachance, Beaudoin, & Robitaille, 2003). James (1997) stated that parents’ influences may play a primary role during early stages of life, and once a child makes the transition to a social network such as school, the influence of parents may decline and peers emerge as a significant agent. Researchers found that because young teens tend to talk more with their parents, they provide the most significant influence on consumption, however, as they grow the significant agent moves to peers (Lachance, Beaudoin, & Robitaille, 2003). Females were more susceptible to peer influence than males for product purchasing because female teens are more sensible on their physical appearance and their behaviors are affected by peer conformity. Compared to male teens, female teens frequently use peers as a primary reference and often would not buy products that peers do not approve of. Moschis, Moore, and Stanley (1984) led to a similar conclusion that male teens had the greater independence in purchasing most teen products compared to their female counterparts. Although young people do not like to think that they are influenced by parents, it is interesting to note that in some regards, they still are. The latter result reflects the vast influence of peers on teenagers’ behaviors, particularly those related to appearance at that age. Differences of Demographic Factors on Brand Consciousness The results of this study revealed that male and female college students were found to be significantly different on brand consciousness. Female college students demonstrated a higher preponderance than male in relation to brand consciousness. According to Best and Williams (1997), gender differences are based on social roles. The diversity in male and female roles demonstrates that different circumstances between genders are the result of environment (Nisbett, 1990). It has been argued, however, that men and women are much more biologically and psychologically similar than different (Best & Williams, 1997). With respects to the ethnicity differences to socialization agents’ influence on teens apparel purchasing, students of other ethnic groups (Siamese, Singaporean, Indonesian, Other) were more likely to be highly brand-conscious than were Malay, Chinese, and Indian. Up to this point, there were significantly different shopping characteristics found. According to previous researches (Best & Williams, 1997; Darley & Smith, 1995), the differences between genders and nationalities were affected by culture, sex roles, economic situations, and environments. Therefore,
25

Z. Ghazali | IJMMR ♦ Vol. 4 ♦ No. 1 ♦ 2011
apparel companies should more carefully study cultural backgrounds, gender characteristics, and environmental differences before developing marketing strategies. Socialization Influences on Brand Consciousness How media influence and socialize children, adolescents, and adults is an important consideration for marketers and public policy makers, and one that is gaining increased attention in the academic literature. This area of study is of particular interest today as commercial exposure is increasing beyond traditional advertising. Brands are creeping into media content and product placements are now commonplace in electronic games, movies, television shows, songs, and even textbooks. How these commercial messages influence young people may be gauged by linking media consumption to consumer-oriented values and attitudes. This study corroborates findings from other studies that have demonstrated that increased commercial media exposure is related to consumer-oriented values and attitudes demonstrated among Malaysians (Kamaruddin & Mokhlis, 2003) and French-Canadian (Lachance, Beaudoin, & Robitaille, 2003) teenagers. Although critics lament the growing commercialization among all media, only exposure to movies was related to brand consciousness in current study. Surprisingly, but similar to what was noted among French-Canadian teenagers, this study did not find a relationship between television viewing and brand consciousness. Given the varied and changing patterns of teen media consumption, perhaps television alone is no longer the primary media influencer. Besides media, the perceived brand consciousness of parents and peers also contributed to the teenagers’ assessments of their own brand consciousness. The former finding is related to results for teenage French-Canadian girls and their perceptions of fathers’ brand consciousness. It is also related to studies that show parental influence on children’s materialism and other consumption-related attitudes and behaviors (Meyer & Anderson, 2000; Moschis, 1987). Lower interaction with parents and independence from their family create more opportunities for teens to interact with peers and use them as a reference about consumption matters. In fact, teens shop more often for clothes with friends than with other people. CONCLUSIONS The general purpose of this study is to explore brand consciousness based on a sample of college students. As noted in the procedural problem, the study linked selected personal characteristics (gender, ethnicity) and socialization agents (mass media, parents, peers) to brand consciousness. This study was conducted at Universiti Utara Malaysia in December 2005/2006 session on second semester full time students, enroled in Bachelor of Business Administration program and living on campus. The statistical methods used were similar to some of the methods employed in the previous studies, such as Pearson correlation coefficient, independent sample t-test, and one-way ANOVA. In sum, this study suggests exposure to movies and perceived influence from parents and peers were positively related to brand consciousness. Once socio-interactions are controled, it is not surprising that there exists an important influence from socialization agents, suggesting that brand consciousness is the result of interactions with the social environment. However, the development of this socialization appears to be mostly influenced by peers. There are some limitations in this study that need to be acknowledged. Besides the small sample size, they were drawn from only one geographical region. Therefore, it is recommended for future studies to have more samples that cover wider geographical distribution to provide more generalized findings. Additionally, demographic characteristics other than those examined in this study, such as family
26

INTERNATIONAL JOURNAL OF MANAGEMENT AND MARKETING RESEARCH ♦Volume 4 ♦ Number 1 ♦ 2011
economic level and living locations (rural or urban areas), should be considered. Different demographic characteristics may have a significant impact on students' consumption behavior, because they might also affect socialization agents’ influence on their brand consciousness. This study examined only parents, peers, and mass media as socialization agents. It would be interesting to investigate how teens interact with other socialization agents, such as salespeople, school, and other media. With regards to the online media used, this study found no specific types of online usage. It may be expected that some types of behaviors (e.g., web browsing, online game-playing) offer more brand-related material than others (chatrooms, email). Future research should assess these specific behaviors to gauge any relationships to brand orientations. On the other hand, the relationships between these media variables and brand consciousness are not known. Does brand consciousness lead to greater commercial media consumption (as a way to learn about the newest brands, fashions)? Or, does increased media consumption lead to increased brand consciousness (exposure to brands leads to increased awareness and desire for them)? In all likelihood, the two concepts are deeply interwoven, and mutually coexist and reinforce one another. Future research might delve deeper into these concepts with a range of methods, such as in-depth interviews to gauge motivations for and effects of media consumption. REFERENCES Bearden, W. O. & Randall, L. R. (1990). “Attention to social comparison information: An individual differences factor affecting consumer conformity,” Journal of Consumer Research, 16(4), p. 461-471 Best, D. L. & Williams, J. E. (1997). “Sex, gender, and culture,” In J. W. Berry, M. H. Segall & C. Kagitcibasi (2nd Eds), Handbook of Cross-Cultural Psychology, Viacom Company, Needham Heights, 3 Darley, W. K. & Smith, R. E. (1995). “Gender differences in information procession strategies: An empirical test of the selective model in advertising response,” Journal of Advertising, 24(1), p. 41-56 Economic Planning Unit (2001). Eighth Malaysian Plan, 2000-2005, Prime Minister’s Department, Kuala Lumpur Grassl, W. (1999). “The reality of brands: Towards an ontology of marketing,” American Journal of Economics and Sociology, 58(2), p. 313-360 Huddleston, P. & Cassill, N. (1990). “Female consumer’s brand orientation: The influence of quality and demographics,” Home Economics Research Journal, 18(3), p. 255-262 James, J. D. (1997). “Becoming a sports fan: Understanding cognitive development and socialization in the development of fan loyalty,” Presented in Partial Fulfilment of the Requirements for the degree of Philosophy in the Graduate School of the Ohio State University, 302 pages Johnson, K. K. P., Schofield, N. A. & Yurchisin, J. (2002). “Appearance and dress as a source of information: A qualitative approach to data collection,” Clothing and Textiles Research Journal, 20, p. 125-137 Kamaruddin, A. R. & Mokhlis, S. (2003). “Consumer socialization, social structural factors and decision-making styles: A case study of adolescents in Malaysia,” International Journal of Consumer Studies, 27, p. 145-156
27

Z. Ghazali | IJMMR ♦ Vol. 4 ♦ No. 1 ♦ 2011
Keller, K. L. (1998). Strategic Brand Management, New Jersey; Prentice-Hall Kempf, D. S. & Palan, K. M. (1997). “Gender differences in information processing confidence in an advertising context: A preliminary study,” Advances in Consumer Research, 24(1), p. 443-449 Lachance, M. J., Beaudoin, P. & Robitaille, J. (2003). “Adolescents’ brand sensitivity in apparel: Influence of the three socialization agents,” International Journal of Consumer Studies, 27, p. 47-57 Lee, M. & Burns, L. D. (1993). “Self-consciousness and clothing purchase criteria of Korean and United States college women,” Clothing and Textiles Research Journal, 11(4), p. 32-40 Mascarenhas, O. A. J. & Higby, M. A. (1993). “Peer, parent and media influences in teen apparel shopping,” Journal of the Academy of Marketing Service, 21(1), p. 53-58 Meyer, D. J. C. & Anderson, H. C. (2000). “Preadolescents and apparel purchasing: Conformity to parents and peers in the consumer socialization process,” Journal of Social Behavior and Personality, 15, p. 243-257 Moschis, G. P. (1987). Consumer Socialization: A Life-Cycle Perspective, Lexington; Lexington Books Moschis, G. P. & Churchill, G. A. Jr. (1987). “Consumer socialization: A theoretical and empirical analysis,” Journal of Marketing Research, 15, p. 599-609 Moschis, G. P. & Mitchell, L. G. (1986). “Television advertising and interpersonal influences on teenagers’ participation in family consumer decision,” Advances in Consumer research, 13(1), p. 181-186 Moschis, G. P. & Moore, R. L. (1983). “Purchasing behavior of adolescent consumers,” Proceedings of the American Marketing Association, 45, p. 89-92 Moschis, G. P., Moore, R. L. & Stanley, T. J. (1984). “An exploratory study of brand loyalty development,” Advances in Consumer Research, 11, p. 314-319 Moses, E. (2000). The $100 Allowance, New York; John Wiley & Son, Inc Nelson, M. R. & McLeod, L. E. (2005). “Adolescent brand consciousness and product placements: Awareness, liking and perceived effects on self and others,” International Journal of Consumer Studies, 29(6), p. 515-528 Nisbett, R. E. (1990). “Evaluation psychology, biology, and cultural evaluation,” Motivation and Emotion, 14, p. 255-263 Othman, M. N. & Sim, F. O. (1993). “Leisure activities of young, urban, Malaysian adults: Implications for marketers,” Malaysian Management Review, 28(3), p. 33-35 Shim, S. (1996). “Adolescent consumer decision-making styles: The consumer socialization perspective,” Psychology & Marketing, 13(6), p. 547-569 Shim, S. & Gehrt, K. C. (1996). “Hispanic and Native American adolescents: An exploratory study of their approach to shopping,” Journal of Retailing, 72(3), p. 307-324
28

INTERNATIONAL JOURNAL OF MANAGEMENT AND MARKETING RESEARCH ♦Volume 4 ♦ Number 1 ♦ 2011
Shim, S. & Koh, A. (1997). “Profiling adolescent consumer decision-making styles: Effects of socialization agents and social-structure variables,” Clothing and Textiles Research Journal, 15(2), p. 50-59 Sproles, G. B. & Kendall, E. L. (1986). “A methodology for profiling consumer’s decision-making styles,” Journal of Consumer Affairs, 20(2), 267-279 Thomas, J. B., Cassill, N. L. & Forsythe, S. M. (1991). “Underlying dimensions of apparel involvement in consumers’ purchase decisions,” Clothing and Textiles Research Journal, 9, p. 45-48 Wanke, M., Bohner, G. & Jurkowitsch, A. (1997). “There are many reasons to drive a BMW: Does imagined ease of argument generation influence attitudes?” Journal of Consumer Research, 24(2), p. 170-177 Ward, S. (1974). “Consumer socialization,” Journal of Consumer Research, 1, p. 1-14 Wechsler, P. (1997). “Hey, kid, buy this!” Business Week, No. June 30, p. 62-67 Wee, M. (Feb, 2002). Youth vs. young adults, Retrieved December 20, 2005, from http://www.thefiltergroup.comad_voice2.php.htm Wilson, J. D. & MacGillivray, M. S. (1998). “Self-perceived influence of family, friends and media on adolescents clothing choice,” Family and Consumer Sciences Research Journal, 26(7), p. 425-444 ACKNOWLEDGEMENT The author wish to thank the anonymous reviewers for their excellent comments, resulting in a significant improvement in the quality of this paper. BIOGRAPHY Zaharah Ghazali is a lecturer of Business Management at Universiti Sultan Zainal Abidin, She can be contacted at Department of Management and Accountancy, Faculty of Business Management and Accountancy, Universiti Sultan Zainal Abidin, Gong Badak Campus, 21300 Kuala Terengganu, Terengganu, Malaysia. Email: [email protected]
29


INTERNATIONAL JOURNAL OF MANAGEMENT AND MARKETING RESEARCH ♦Volume 4 ♦ Number 1 ♦ 2011
WORK AND FAMILY CONFLICT: A COMPARISON BETWEEN AMERICAN AND MEXICAN WOMEN
Alicia Cavazos-Garza, Texas A&M University-Kingsville
ABSTRACT
Although many believe that work and family conflict (WFC) is a social issue, its scope is ample due to its causes and consequences. In the organizational ground, WFC has been found to affect important outcomes such as job satisfaction, commitment, and turnover. Additionally, there is a need to validate the structures that have been proposed and assess their validity in other settings. This study proposed a model where both dimensions of work and family conflict--work interfering with family and family interfering with work--mediated the effect of four life roles (i.e. career, parent, marital, and homecare) in three organizational outcomes (satisfaction, turnover intention, and commitment). The findings in this study give support to the relationship between the parental role and family interfering with work for the Mexican sample. In addition, homecare role was found to be related with family interfering with work (FIW) conflict in the U.S. sample. I also found support in the relationship between work interfering with family (WIF) and both turnover intention and commitment. On the other hand, the relationship between FIW and job satisfaction as well as turnover intention was supported in the Mexican sample. JEL: M12, M14, M15, M54 KEYWORDS: work and family conflicts, organizational behavior, cross-cultural studies INTRODUCTION
emographic changes in the workforce, as well as greater family involvement by men have increased interest in employees’ quality of life (Pleck, Lamb, &Levine, 1986). Specifically, and according to the Bureau of Labor Statistics (BLS), the participation of United States (U.S.)
women in the labor force increased from 43.3% in 1970 to 63.1% in 2006. Similarly, more Mexican women have also been entering the workforce, with an increase in participation from 17.6% in 1970 to 37.5% in 2004 (e-mexico, 2008). This change translates into more employees having family responsibilities, not only women who enter the workforce, but also men who now share these responsibilities. In light of these recent changes and their importance for both family and work life, there has been a great deal of research devoted to work to family conflict (WFC) (Zedeck & Mosier, 1990; Eby, Casper, Lockwood, Bordeaux, & Brinley, 2005). Role conflict is a very important issue as it relates to individual productivity, job satisfaction, commitment, and employee turnover. These, in turn, directly and indirectly affect the productivity of organizations (Harter, Schmidt, & Hayes, 2002). While the majority of the research in work and family conflict has been conducted in the United States, globalization and the increasing diversity of the workforce reinforce the importance of considering cultural differences in the WFC model (Aryee, Fields, & Luk., 1999; Hill, Chongming, Alan, & Maria, 2004; Posthuma, Joplin, & Maertz, 2005). It is particularly worthwhile to study the WFC model in the U.S. and Mexico not only because of their geographical proximity, but also because they are members of the same trading bloc, and there are significant Foreign Direct Investment (FDI) interests between these two countries. In addition, even though the U.S. and Mexico are close in the feminism/masculinsm dimension (Hofstede, 2001); there is evidence to support the idea that differences in the workplace between these two countries may be strong (Segrest, Romero, & Domke-Damonte, 2003).
D
31

A. Cavazos-Garza | IJMMR ♦ Vol. 4 ♦ No. 1 ♦ 2011
According to Eby et al. (2005), “gender is deeply [ingrained] in [work and family] relationships” (p. 181). Research has shown that not only gender differences but also gender role issues are fundamental for a full understanding of WFC. The latter includes variables such as gender identity, sex role attitudes, and role salience (Lobel and St. Claire, 1992). Moreover, gender role issues underline the finding that women have the primary responsibility for childcare and household tasks (Lundberg and Frankenhaeuser, 1999), even when in dual-earning marriages (Lewis and Cooper, 1987). Furthermore, women are much more prone than men to adjust their work in order to satisfy family demands (Karambayya and Reilly, 1992). The purpose of this research is to understand the differences in role salience between the U.S. and Mexico, specifically between women in the U.S. and women in Mexico. In addition, an important part of this research is to understand whether national differences exist in the WFC model. This may lead to human resources (HR) policies that incorporate such differences in international business. In the following section, I will review the literature that is relevant to this topic. The third section of this research is devoted to the methodology. In the final section in this paper, I will present my conclusions to the results of the analysis of the data. Each of the hypothesized relationships will be explored and assessed according to the statistical methods proposed in the methodology section. These results will be discussed in the final section, which will provide a conclusion as well as limitations and future research. LITERATURE REVIEW The concept of work and family conflict (WFC) has been of interest to a variety of academic disciplines including the health, sociology, psychology, social psychology, management, organizational behavior, and industrial organization disciplines (Eby et al, 2005). In the following sections, the basic concepts and research that are relevant to this study will be introduced. I begin by defining roles, role conflict, and then specifically work and family conflict. The significance of this study will be highlighted by explaining the outcomes of WFC. The causes or antecedents of WFC will be explained in order to understand how WFC is created. On the same line, a review of the influence that culture has in the model of WFC will be offered. Several definitions have been used for the term ‘role’. For the purpose of this study, I will use the definition proposed by Robbins and Judge: “A set of expected behavior patterns attributed to someone occupying a given position in a social unit” (2007, p. 304). According to Robbins and Judge, life would be easy if we could choose and play only one role (2007). However, people play a variety of roles in life: man-woman, son-daughter, friend, parent, spouse, student, professional, or a member of any type of organization. The disparity in role expectation as well as the conflict in timing may create role conflict (Robbins and Judge, 2007; Amatea, Cross, Clark, and Bobby, 1986; Eby et al., 2005). This brings us to the definition of role conflict. Role conflict is defined by Robins and Judge (2007) as “a situation in which an individual is confronted by divergent role expectations” (p. 307). Initially, WFC was conceptualized as a unidimensional construct or global measure (Kopelman, Greenhaus, & Connolly, 1983; Bedeian, Bruke and Moffet, 1988). However, more recent studies have found a better fit when the conflict is divided in two separate constructs: work interfering with family conflict (WIF) and family interfering with work conflict (FIW) (Netemeyer, Boles, & McMurrian, 1996; Carlson & Perrewe, 1999; Eby et al. 2005). Netemeyer et al. (1996) based their research on the premise that WIF and FIW are “distinct but related forms of interrole conflict” (p.401). According to Netemeyer et al. (1996), “the general demands of a role refer to the responsibilities, requirements, expectations, duties, and commitments associated with a given role” (p.401). The authors define WIF (WFC) as “ a form of interrole conflict in which the general demands of time devoted to, and strain created by the job interfere with performing family-related
32

INTERNATIONAL JOURNAL OF MANAGEMENT AND MARKETING RESEARCH ♦Volume 4 ♦ Number 1 ♦ 2011
responsibilities” (p.401). In other words, the responsibilities of the career role get in the way of fulfilling the responsibilities of the roles at home. FIW (FWC) on the other hand is “a form of interrole conflict in which the general demands of, time devoted to, and strain created by the family interfere with performing work-related responsibilities” (p.401). This means that the roles at home are hindering the accomplishment of the tasks at work. Outcomes The outcomes or consequences of WFC are an important subject for different fields (e.g. psychology, sociology, health, business, etc); hence, each of these disciplines has contributed to this topic. However, for management research, a stronger focus should be taken on the outcomes that affect directly and indirectly the performance of the organizations such as turnover, commitment, absenteeism, productivity, job satisfaction, and deviant workplace behavior (Robbins & Judge, 2007). This research will concentrate in job satisfaction, commitment, and turnover intention. The importance of job satisfaction is highlighted by its influence on a number of outcomes such as job performance, productivity, turnover, and organizational involvement and commitment among other things (Kossek and Ozeki, 1998; Baltes, Briggs, Huff, Wright, & Neuman, 1999). All of these factors significantly affect the performance of organizations (Boyar, Maertz, Mosley, & Carr, 2008, Huselid, 1993, Harter et al., 2002). According to Allen, Herst, Bruck, & Sutton (2000) review, and to the literature review from Eby et al. (2005), job satisfaction has been the most studied criteria within work attitudes (about 36% of the studies in WFC). The majority of the studies surveyed have found a negative relationship between these two factors. That is, when WFC is more intense, job satisfaction decreases (Netemeyer et al., 1996; Kossek and Ozeki, 1998; Rice, Frone, & McFarlin, 1992; Parasuraman, Greenhaus, Rabinowitz, Bedeian, &Mossholder, 1989). Organizational commitment has been a major focus of research (Meyer, Stanley, Herscovitch, & Topolnytsky et al., 2002). Low organizational commitment has been found to have a strong relationship with other organizational outcomes such as turnover, absenteeism, and decreased work effort (Joiner and Bakalis, 2006). Netemeyer et al. (1996) found a negative relationship between WFC and organizational commitment. This means that as WFC increases organizational commitment decreases. Moreover, Lyness and Thompson (1997) examined three different dimensions of commitment and found that WFC was negatively related to affective commitment, positively related to continuance commitment, and not related to normative commitment. The previous two outcomes (i.e. job satisfaction and commitment) may cause an employee to leave the workforce. Each time a firm loses an experienced worker, male or female, its performance, and stability may be affected (Cascio, 1991). Allen et al. (2000) found a positive relationship between turnover and WFC and that this relationship is twice as strong as the relationship between Job Satisfaction and WFC. In a later study, Nissly (2004) also found that employees with high WFC would stay for shorter amounts of time, and/or leave the organization. Moreover, Carr, Boyar, & Gregory (2008) used a survival analysis in order to gauge the relationship between WFC and retention. The findings from Carr et al. (2008) revealed that “with decreasing work–family centrality, WIF has a very strong effect on organizational retention, reducing retention almost 200%. However, when work–family centrality is higher, the effect of increases in WIF on organizational retention is lower (1%)” (p. 256-257). Antecedents/Predictors Research has also explored the antecedents also called predictors of WFC (Eby et al., 2005). These are factors that cause, increase, or decrease WFC. Furthermore, predictors can be classified as being either internal or external predictors. Internal predictors are those factors that are inherent in the individual,
33

A. Cavazos-Garza | IJMMR ♦ Vol. 4 ♦ No. 1 ♦ 2011
whereas external predictors are factors in the environment such as cultural, economic, and political factors. Eby et al. catalogued 966 predictors. Among the predictors that have been studied in the work domain are unpredictability in work routine (Fox and Dwyer, 1999), number of hours worked (Carlson and Perrewe, 1999; Greenhaus , Bedeian, and Mossholder, 1987) and frequency of working weekends or rotating shifts (Shamir, 1983); all these were found to have a positive relationship with WFC. In regard to the family domain, the number of children (Behson, 2002, Carlson, 1999), concern about child care (Buffardi and Erdwins, 1997; Fox and Dwyer, 1999), tension with family or spouse (Carlson and Perrewe, 1999; Fox and Dwyer, 1999), high involvement in family- salient family role (Carlson and Perrewe, 1999; Williams and Alliger, 1994) , and lack of family support (Carlson and Perrewe, 1999) have all been found to have a positive relation with WFC. Relievers On the other hand, there are factors that are considered relievers, since they diminish work conflict by reducing the effects of the conflict (e.g. personal strategies), family demands (e.g. family support, organizational support, delegating), and professional demands (e.g. organizational support, supervisor support, delegating). Life Role Salience Scale Eby et al. (2005) suggest that in order to understand WFC, there is a need to go beyond analyzing simple role membership, and look at richer constructs such as role salience (e.g. Matsui, Tsuzuki, & Onglatco, 1999; Amatea et al., 1986), role involvement (Carlson and Perrewe, 1999; Williams and Alliger, 1994) and life role values (Carlson and Kacmar, 2000; Amatea et al., 1986). According to Reitzes and Mutran (1994), individuals define who and what they are depending on the roles they play. Moreover, Noor (2004) posits that individuals can play a variety of roles and hold various identities, although not all at the same salience level. “Role salience or importance-also known as role centrality (Martire, Stephens, & Townsend, 2000), role commitment (Brown, Bifulco, & Harris, 1987), and personal involvement (Frone, Russell, & Cooper, 1995)-is said to provide individuals with meaning, self-worth, and purpose” (Noor, 2004, p.391). As mentioned earlier, the more roles and the less compatible they are, the higher the level of role conflict (Robbins and Judge, 2007). Hence, we need to measure how many roles the individual is actually involved in. Culture Culture as defined by Hofstede (1994) is “the collective programming of the mind which distinguishes the members of one category of people from another” (p.1). According to Hofstede (1994), these categories go from “nation, region, or ethnic group…women versus men (gender culture), a social class, profession or occupation (occupational culture), a type of business, a work organization or part of it (organizational culture) or even family.” (p.1) The most cited study on cultural differences is that of Hofstede (1980) (Munro-Smith, 2003; Ali and Alshawi, 2004). Hofstede collected over 116,000 questionnaires from IBM employees in 40 different countries from 1967 to 1971. Hofstede found four cultural dimensions: masculinity, power distance, collectivism, and uncertainty avoidance. These dimensions have been used to explain differences in strategy as well as the behaviors of workers. For definitions on these dimensions, please refer to Hofstede (2001).
34

INTERNATIONAL JOURNAL OF MANAGEMENT AND MARKETING RESEARCH ♦Volume 4 ♦ Number 1 ♦ 2011
There has not been much research on the influence of culture on role expectations. Most of the published research has focused on specific countries and has used samples from the US, Europe, and Asia. Very few studies have undertaken a cross-cultural testing of the role conflict model (Eby et al., 2005; Allen et al., 2000). One of the first studies to test the differences in work interfering with family conflict (WIF) and family interfering with work conflict (FIW) in two different cultures was that of Aryee et al. (1999). Aryee et al. used the model of Frone et al. (1992) and tested it in Hong Kong. The authors explained the differences in the model with the cultural differences in family centrality. In Confucianism societies, family is considered the fundamental unit of society. Specifically, while the reciprocal paths between WIF and FIW are the same for the U.S. employees, for the Hong Kong employees, the path from WIF to FIW is significantly stronger than the other way around. This may be because the interference of work on family may threaten the well-being of the family identity. In addition, because of the importance of the family, family issues may not be perceived to interfere with work responsibilities. This finding is in agreement with research done by Yang, Chen, Choi, and Zou, Y. (2000) who showed the differences in perceived family demands in American and Chinese employees: the former showing a higher perception than the latter. Additionally, for Chinese workers, work demands had a stronger effect on WFC. Hill et al. (2004) is another one of those few studies to undertake a cross-cultural test of the role conflict model. Hill et al. adapted the model of Frone et al. (1992) and studied 48 countries using the IBM 2001 Global Work and Life Issues Survey. The main purpose of Hill et al. was to prove that the model was generalizable to different cultures. Differences among the cultures were mentioned but not discussed. Gender differences were also explored, but only at large, in the global perspective, and not specifically by country group. Segrest, Romero, and Domke-Damonte (2003) studied the differences in U.S. and Mexican culture focusing on gender discrimination. This study is particularly relevant to my research since it describes gender difference beyond the masculinity dimension. The difference between Mexico and the U.S. in the masculinity dimension is not very significant. However, once the influences from the other dimensions are considered regarding gender roles, the difference is magnified. Structural Model and Hypotheses Based on the previously reviewed literature, this study proposes the following hypotheses (refer to the model in Figure1). The first four hypotheses are proposed according the definitions proposed by Netemeyer et al. (1996). Hypotheses three to eight are proposed in accordance to the previous studies presented in the literature review. Due to the differences between the U.S. and Mexico, exposed in the culture arena, I expect that nationality will have an effect on the value and commitment of career role as well as the different family roles. Although the WIF model has been proven generalizable across nations (Netemeyer et al., 2004; Hill et al., 2004), I also expect that the relationship between both WIF and FIW will behave different according to the nationality.
Hypothesis 1 Career role is positively and significantly related with WIF, but not with FIW. Hypothesis 2a Parental role salience will be positive and significantly related with FIW. Hypothesis 2b Marital role salience will be positive and significantly related with FIW. Hypothesis 2c Homecare role salience will be positive and significantly related with FIW. Hypothesis 3 WIF will be negative and significantly related with Job Satisfaction. Hypothesis 4 FIW will be negative and significantly related with Job Satisfaction. Hypothesis 5 WIF will be positive and significantly related with Turnover Intention. Hypothesis 6 FIW will be positive and significantly related with Turnover Intention. Hypothesis 7 WIF will be negative and significantly related with Commitment.
35
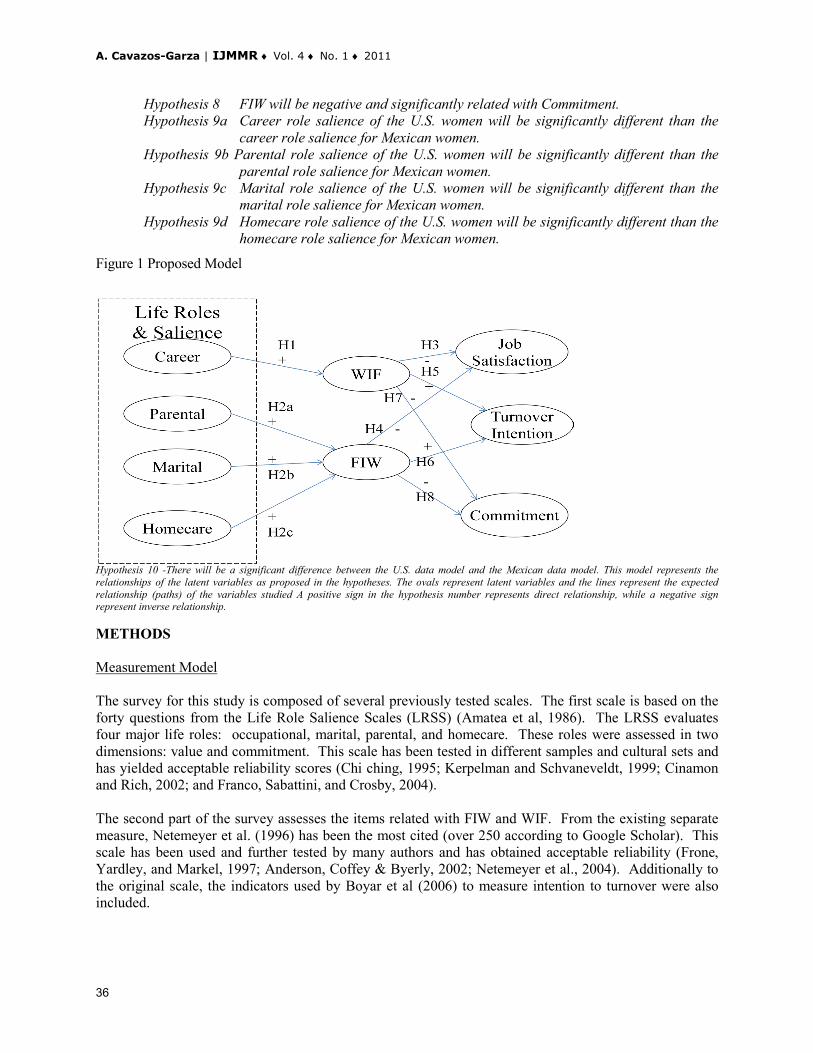
A. Cavazos-Garza | IJMMR ♦ Vol. 4 ♦ No. 1 ♦ 2011
Hypothesis 8 FIW will be negative and significantly related with Commitment. Hypothesis 9a Career role salience of the U.S. women will be significantly different than the
career role salience for Mexican women. Hypothesis 9b Parental role salience of the U.S. women will be significantly different than the
parental role salience for Mexican women. Hypothesis 9c Marital role salience of the U.S. women will be significantly different than the
marital role salience for Mexican women. Hypothesis 9d Homecare role salience of the U.S. women will be significantly different than the
homecare role salience for Mexican women.
Figure 1 Proposed Model
Hypothesis 10 -There will be a significant difference between the U.S. data model and the Mexican data model. This model represents the relationships of the latent variables as proposed in the hypotheses. The ovals represent latent variables and the lines represent the expected relationship (paths) of the variables studied A positive sign in the hypothesis number represents direct relationship, while a negative sign represent inverse relationship. METHODS Measurement Model The survey for this study is composed of several previously tested scales. The first scale is based on the forty questions from the Life Role Salience Scales (LRSS) (Amatea et al, 1986). The LRSS evaluates four major life roles: occupational, marital, parental, and homecare. These roles were assessed in two dimensions: value and commitment. This scale has been tested in different samples and cultural sets and has yielded acceptable reliability scores (Chi ching, 1995; Kerpelman and Schvaneveldt, 1999; Cinamon and Rich, 2002; and Franco, Sabattini, and Crosby, 2004). The second part of the survey assesses the items related with FIW and WIF. From the existing separate measure, Netemeyer et al. (1996) has been the most cited (over 250 according to Google Scholar). This scale has been used and further tested by many authors and has obtained acceptable reliability (Frone, Yardley, and Markel, 1997; Anderson, Coffey & Byerly, 2002; Netemeyer et al., 2004). Additionally to the original scale, the indicators used by Boyar et al (2006) to measure intention to turnover were also included.
36

INTERNATIONAL JOURNAL OF MANAGEMENT AND MARKETING RESEARCH ♦Volume 4 ♦ Number 1 ♦ 2011
The next section assesses affective commitment from Allen and Meyer (1990). This scale has also been used with reliable results by other authors (Lyness and Thompson, 1997, Meyer, Stanley, Herscovitch, and Topolnytsky 2002; Chen and Francesco, 2003; Dunham, Grube, & Castañeda, 1994). The fourth section surveys different aspects of satisfaction. For this study, I will use Quinn and Shepard’s (1974) general measure as well as Oshagbemi’s (1999) proposed multi-item measure. The final part of this instrument consists of various demographic data as well as education level and experience from the subjects surveyed. Additionally to the studied latent constructs. I will be using four control variables. I will use the number of hours worked per week as a control variable for work interfering with family conflict as this variable has been found to be significantly related to work and family conflict (Carlson & Perrewe, 1999; Eby et al., 2005). Marital status and number of children will be used as control variables for family interfering with work conflict. Both these variables have been found to have a strong influence in the perception level of work and family conflict (Carlson and Perrewe, 1999; Behson, 2002; Eby et al., 2005). Another important variable is responsibility help. This variable has been found to reduce the perception of conflict in work and family conflict (Zahrly and Tosi, 1989; Carlson and Perrewe, 1999; Eby et al., 2005). This last variable will be used as a control variable for both WIF and FIW. To assure equivalence of the measures in the Spanish and the English versions, a standard translation and back-translation procedure will be performed (Brislin, 1980). This procedure has been used by several studies (Netemeyer et al., 2004; Van de Vijver and Leung, 1997). The survey was translated to Spanish by a native Mexican, and revised by two additional native Mexicans who are also fluent in English. The Spanish version was back translated by a native Spanish speaker, with early education in the US. The outcomes of these translations were revised by a native Spanish-speaking professor with postgraduate education in the U.S. Data Collection The data was collected in Southeast Region of USA, and in the Northeast and central Mexico. There were two different media to collect the surveys: on line, and hardcopy. The United States surveys were distributed and collected by students in a University from South Texas. In Mexico, the surveys were distributed in two maquiladoras and then collected principally from the north and center of Mexico. Of the original sample (721), a number of surveys were not used in this study due to several reasons. Since this research is comparing women, we could not use those surveys completed by men, which was 48 percent. From the remaining 52 percent (375), eleven percent was incomplete (41), and about 59 percent were single women without children. The final sample (n) was 153: 81 surveys collected in Mexico, and 72 surveys collected in the US. Assessment of the Model The data collected does not pass the normality assumption for covariance-based structural equation modeling (CB-SEM). Additionally, the final sample size was 153, which can be considered small for CB-SEM. These restrictions invite us to use PLS-SEM, which is a robust technique that has been used successfully despite these two problems (Chin, 1998; Henseler et al., 2009). For the assessment of the construct validity, I conducted Factor Analysis employing the SPSS software (SPSS Inc., 2007). This analysis was done using the complete sample; including both México and United States sub samples. Although the scales have been used successfully in previous research, it is appropriate to test them with the data collected for this study. According to Hair et al. (1998), the loadings for the indicators on the construct should exceed the threshold of 0.7 to pass the validity of the
37

A. Cavazos-Garza | IJMMR ♦ Vol. 4 ♦ No. 1 ♦ 2011
measurement model. However, there has been previous research that supports using loadings above 0.5 when there are additional indicators to support the latent variable (Chin, 1998; Hrivnak, 2009). Only those indicators that passed this threshold were retained. Once we have assessed the reliability of the factor structure we may continue with the evaluation of the internal consistency. The most common measure that has been used for internal consistency is Cronbach’s alpha. The internal consistency was high, showing alpha coefficients ranging from 0.78 to 0.90 (well above Hair’s et al. [1998] threshold of 0.70). Henseler et al. (2009) also propose looking at the composite reliability. According to these authors, cronbach’s alpha has the assumption that all indicators are equally reliable. PLS on the hand, gives a more reliable composite by prioritizing according to the reliability of the indicators. The gauge for this measure is similar to that of cronbach’s alpha. These measures were improved from those generated through cronbach’s alpha. Structural Model Evaluation Once we have evaluated the outer model as reliable and valid we can proceed with the evaluation of the structural (i.e. inner) model. The most common criteria for the assessment of structural models are the R2 or variance explained of the endogenous variables, and the path coefficients. This study will assess the work and family conflict model using partial least squares structural equation modeling (PLS). There is a number of software compatible with this technique that can be used for the assessment of a model. SmartPLS (Ringle, Wende, and Will 2005), was selected because it permits simultaneous testing of hypotheses using both single- and multi-item measurements (Hennig-Thurau, Henning, Sattler, 2007). I will begin by presenting the results for the model with the complete data set in Figure 2. According to Chin (1998) an R2 above 0.67 is substantial, at 0.33 it is considered moderate, and 0.19 is weak (p.323). In the opinion of Henseler, Ringle, and Sinkovics (2009), a lower variance explained (R2 ) may be acceptable when only a few exogenous latent variables are used to explain that construct. Figure 2 presents the values for the first criterion in the assessment of the model (i.e. R2). As we can see, the R2 for intention to turnover (0.375) can be considered acceptable at the moderate level. On the other hand, the explained variance for satisfaction and commitment are below the weak threshold. However, as mentioned above, due to the few number of exogenous variable used to explain the model, these score may be considered acceptable.
Figure 2: Model Results for the Complete Sample
This model portrays the results from the SEM study. The bold lines represent significant relationships; dotted lines represent paths that resulted non-significant. The numbers in the paths represent the β, the value below the dependent variables represent the variance explained. * p < 0.5; ** p< 0.01
38

INTERNATIONAL JOURNAL OF MANAGEMENT AND MARKETING RESEARCH ♦Volume 4 ♦ Number 1 ♦ 2011
The second criterion to evaluate the model is the estimates of the path coefficients. The values of the path coefficients should be appraised in sign and magnitude, as well as significance (Henseler et al., 2009). Table 1 shows the results for the path coefficients for the complete sample model and the model for the subgroups of the United States (US) and Mexico (MX). We can see in Figure 2 as well as in Table 1 the path loadings and significance for each of the hypotheses (paths) that we had postulated. Table 1: Hypotheses Assessment
Hypotheses Expected All US MX Comparison Sign B SD β SD β SD p-value
H1: Career -> WIF - -0.144 0.175 -0.292 0.304 0.241 0.245 0.092 H2a: Parental -> FIW - -0.138 0.114 -0.274 0.304 -0.304* 0.146 Not supported H2b: Marital -> FIW - 0.178 0.127 0.268 0.214 0.152 0.131 Not supported H2c: Homecare -> FIW - -0.069 0.108 -0.302** 0.116 0.163 0.097 0.012 H3: WIF -> Satisfaction - 0.027 0.135 0.197 0.217 -0.158 0.237 Not supported H4: FIW -> Satisfaction - 0.196 0.128 0.239 0.300 0.358* 0.174 Not supported H5: WIF -> Turnover + 0.249* 0.110 0.403** 0.140 0.072 0.153 0.042 H6: FIW -> Turnover + 0.415*** 0.107 0.150 0.144 0.673*** 0.126 0.002 H7: WIF -> Commitment + 0.293* 0.125 0.428** 0.156 0.254 0.266 Not supported H8: FIW -> Commitment + -0.079 0.139 0.057 0.173 -0.088 0.248 Not supported
This table shows the values of the paths according results from the SEM study for the complete sample and each of the subsamples. For each of these groups the β and standard deviation is given. Those underlined represent significant relationships The last column represents the p-value of the expected difference for each of the two subsamples. * p < 0.5; ** p< 0.01; *** p< 0.001
It is important to point out that the life roles are measured from high to low. In other words the higher the score, the weaker the value of the role. The same is true for commitment, the higher the score; the less committed the employee feels toward his/her organization. For H1, the path from Career to WIF is found to have the correct sign, but it is not significant. The influence that parental role has on FIW (H2a) had also the correct sign, but no significant relationship. The FIW Marital role relationship (H2b) also failed to achieve significance. Homecare role, expected to be positively related with FIW as well (H2c), was found to have the correct sign but not significant. H3 and H4, which are the influence of WIF and FIW with job satisfaction, were expected to have a negative sign, the results show WIF was not significantly related with job satisfaction in any of the subsamples. However, FIW was found to be significantly related to job satisfaction in the Mexican sample with a p value of 0.04 in the opposite direction as expected. The influence of both WIF and FIW with intention to turnover were expected to be positive (H5 and H6). Both these hypotheses were supported; the first at a confidence level of below 0.05 and the latter with a p-value of below 0.001. The last two hypotheses were the influence of WIF and FIW to commitment (H7 and H8). H7 was found to have the opposite sign, but failed to achieve significance. On the other hand H8 portrayed a negative relationship (correct sign), in this case with a significant p-value of below 0.05. The original ninth set of hypotheses predicted a significant difference in each of the life roles between the US and MX sample. Mann Whitney U test and the Kolmogorov-Smirnov test were used to test the difference in the subsamples. Mann Whitney is a non-parametric test, which combines and sorts the data of both samples assigning ranks to all cases and then counting the times that a score from group one come before a score of group two. The Kolmogorov-Smirnov test compares the observed cumulative distribution functions for both samples. When the maximum absolute difference is significantly large, the two distributions of the two samples are considered different. Table 2 portrays the results for both the tests. As we can see, all roles with the exception of marital (9c) were considered significantly different. Career role difference was the most significant (9a), followed by homecare (9d) and finally parental role
39

A. Cavazos-Garza | IJMMR ♦ Vol. 4 ♦ No. 1 ♦ 2011
(9b). The MX sample tends to hold stronger (lower value) each of the life roles found to be significantly different. Table 2: Comparison of Role Salience for US and MX
Career Parental Marital Homecare Mann-Whitney U 1700 2097.5 2880.5 2089 Wilcoxon W 5021 5337.5 5508.5 5410 Z -4.459 -2.973 -0.13 -3.092 Significance 0.000 0.003 0.897 0.002 Kolmogorov-Smirnov Z 2.515 1.539 0.724 1.753 Significance 0.000 0.018 0.671 0.004
This table shows the results for the test of similarity between each of the roles. The rows titled as significance show the p-value for each of the roles in each of the tests. * p < 0.5; ** p< 0.01; *** p< 0.001 In regards to the expectation of the US model to differ significantly from the MX model (H10), I used the method proposed by Henseler et al. (2009) to test this hypothesis. These authors suggest to test the difference in models with the output of bootstrapping generated by the PLS software. Bootstrap was generated for each of the subsamples. Each path in the model was subject to the analysis proposed by Henseler et al. (2009) by using 100 path loadings for each subsample. The results for this analysis are shown in Table 1. Three paths resulted with significant differences in the two subsamples H2c (p = 0.012), H5 (p = 0.042) and H6 (p = 0.002) giving support to H10. Moreover, Table 3 presents the results for the R squares of the three models (i.e. complete sample, US sample and MX sample). The variance explained for turnover in the model with the complete had a value of 0.375. However, for the US sample the explained variance loses some of its strength to 0.257. On the other hand, in the model with the MX sample the variance explained increases to 0.531. In other words, for the Mexican sample, FIW and WIF explain over twice as much of the variance in turnover than does the US sample. Table 3: Results of the Model
ALL US MX AVE Composite
Reliability R 2
AVE Comp. Reliab.
R 2 AVE Comp. Reliab. R 2
WIF 0.719 0.927 0.039 0.740 0.934 0.130 0.707 0.923 0.072 FIW 0.708 0.906 0.090 0.691 0.899 0.233 0.715 0.909 0.204 Satisfaction 0.560 0.828 0.046 0.232 0.368 0.153 0.586 0.841 0.069 Turnover 0.770 0.930 0.375 0.736 0.917 0.257 0.786 0.936 0.531 Commitment 0.600 0.857 0.061 0.579 0.845 0.215 0.550 0.829 0.039
This table shows the results for the dependent variables from the SEM study for the complete sample and each of the subsamples. AVE represents the average variance extracted for each of the dependent variables. The composite reliability is gauged as cronbach’s alpha. The variance explained values (R 2) that are underlined are those that meet the threshold of above 0.67 as substantial, at 0.33 as moderate, and 0.19 as weak Moreover, while the R2 for the FIW did not reach the explanation to be deemed as weak with the complete sample, once split the R2 for both the US sample (0.233) and the MX samples (0.204) increased and were considered to have a weak explanation. In the same vein, commitment with an R square of 0.061, did not reach the level of weak explanation with the complete sample. However, after separating the samples the R2 for US sample increased to 0.215, which deems the explained variance as weak.
40

INTERNATIONAL JOURNAL OF MANAGEMENT AND MARKETING RESEARCH ♦Volume 4 ♦ Number 1 ♦ 2011
We should also point out the differences in the path values and significance as portrayed in Table 1. For the complete sample model, the only paths that were considered significant were both WIF and FIW to intention to turnover, and WIF to commitment. However the values and significance change once the data is split in the US and MX subgroups. For the first Hypotheses (H1) there is a change in sign from the US sample and the MX example, although none of these paths is considered significant. The path between parental role and FIW (H2a) was found to be non-significant in the complete sample, non-significant as well for the US sample, but not so for the MX sample. The path for H2a was found to be significant at the 0.05 level for the MX sample, in the expected direction (β = -0.304). Even so, when the two results were compared with a t statistic method, there was not enough support to deem them as significantly different. Continuing with the influence of the marital role to FIW (H2b), while the path coefficient for the US sample was about fifty six percent higher than the MX sample (β = 0.268 vs. β = 0.152), none of these two were found to be significant. Although the influence of homecare with FIW role (H2c) had been found to be insignificant, the results when splitting the sample gave a surprising finding. The US sample shows this path as significant at the 0.01 level, with the correct sign (β = -0.302). The MX sample had (β = 0.163), but the significance was questionable with a p value of 0.096 and with the opposite direction. However the t-test did reveal a significant (p = 0.003) difference in these two samples for this particular path (H2c). The complete sample model revealed no significant relationship in the path from WIF to satisfaction (H3), and the same was true for the two subsamples. Additionally, the t-test revealed no significant difference in this path between subsamples. The path from FIW to satisfaction (H4) had been deemed insignificant for the complete model, it remained insignificant for the US sample, but gained significance in the MX sample with path coefficient of 0.358 at a 0.05 level. However, this relationship was positive as opposed to the predicted negative relationship. The fifth hypothesis, the path from WIF to intention to turnover was supported with a path coefficient of 0.249 in the right direction and with a p-value of 0.026. For the US sample, the path strength increased to 0.403 and with a p value of 0.005, while for the MX sample it lost both strength and significance. The influence from FIW to intention to turnover, H6, was supported in both sign and significance with a path coefficient of 0.415 and p value of less than 0.000. After the sample was split, the US lost strength and significance while the MX sample showed an improved strength and significance with a path coefficient of 0.673. Furthermore, the t-test comparing these two results supports a significant difference with a p value of 0.007.The last two hypotheses are the relationships of WIF and FIW with the outcome of commitment (H7 and H8). Hypothesis 7 was in the correct sign for the complete sample and the MX sample while in the opposite direction for the US sample, nevertheless, in none of these settings were the paths found to be significant. On the other hand, hypothesis eight was found to be significant with the complete sample, the path showed an improved strength and significance with the US sample and lost significance with the MX sample. In summary, H5, H6, and H8 were supported for the complete sample. H2c, H5, and H8 were supported for the US sample. H2a, H4, and H6 were supported for the MX sample. Furthermore, the method proposed by Henseler et al. (2009) revealed that there is a significant difference between H2c, H5, and H6, supporting H10. In regard to the difference in roles for each subsample: 9a, 9b, and 9d were also supported. CONCLUSION The present research proposed a model where both dimensions of work and family conflict--work interfering with family and family interfering with work--mediated the effect of four life roles (i.e. career, parent, marital, and homecare) in three organizational outcomes (satisfaction, turnover intention, and
41

A. Cavazos-Garza | IJMMR ♦ Vol. 4 ♦ No. 1 ♦ 2011
commitment). The findings in this study give support to the relationship between the parental role and family interfering with work for the Mexican sample. In addition, homecare role was found to be related with and the family interfering with work (FIW) conflict in the U.S. sample. I also found support in the relationship between work interfering with family (WIF) and both turnover intention and commitment. On the other hand, the relationship between FIW and job satisfaction as well as turnover intention was supported in the Mexican sample. It appears that the family interfering with work conflict has a stronger effect on organizational outcomes than the work interfering with family for the Mexican sample. In contrast, the U.S. sample demonstrated that work interfering with family and not family interfering with work had an effect on organizational outcomes. This may be explained by the value placed in family in the Mexican culture. Perhaps Mexican women are more willing to quit their job than American women are when their family responsibilities hinder their ability to perform well at work. In addition to this, there may be a society and family pressure to return to their traditional role of taking care of the house while the man in the house is the breadwinner. Another interesting finding was that of the WIF conflict not affecting job satisfaction in any of the samples. This could be explained through Herzberg motivation-hygiene theory. Work interfering with family can be considered as a hygiene factor by merit of the original factors proposed by Herzberg (e.g. company policy and administration, work conditions, and personal life). The next question would be if work interfering with family has been recurrently related with organization outcomes in other populations why does the Mexican sample not show the same behavior. In other words, why does WIF conflict not affect Mexican women while it does affect employees from other nations? One possible explanation could be that there are less job opportunities in México than in the U.S. so Mexican women are appreciative of the opportunity. We could also retake the family support network in the Mexican society where in the case of having more responsibilities at work, a family member would step in and assist in these activities (e.g. taking care of children). Moreover, given that 24-hour domestic service can be easily accessible in México, it may be easier for Mexican women to alleviate the stress of this conflict. Limitations and Future Research No study is free of limitations or possible improvements. The first limitation of this study is the size of the sample. Although the total number of surveys collected was over 700, only those of women that were married and/or had children were included. Additionally, the surveys were collected mainly from south Texas and north of Mexico. This may present a bias on regional culture for each of the countries. Future research could overcome this limitation by collecting a greater number of surveys in diversity of regions in each country in order to have a better representation the national population. In addition, it would be interesting to understand the differences between men in both countries. Furthermore, comparing the difference in gender in each population may also bring light to understand different HR policies required in each setting. In addition, this study could be extended to include more nationalities and assess the differences they present in the WFC model. This research studied the effect of different life roles mediated with both dimensions of work and family conflict, in organizational outcomes. It could be interesting to assess the effect of the life roles directly into the organizational outcomes. Even more, comparing the effect of different HR policies in different countries may serve as guide for implementing only those that have an important effect in each country rather than applying same policies in all countries. This study is of interest to academics in the fields of organizational behavior (OB) and human resources (HR), as it expands knowledge on the WFC model, which has not been tested in conjunction with role salience. Furthermore, the WFC model has not been tested in the Mexican and U.S. comparative context. This research is also relevant to HR managers since this study may be used as a tool to design policies that are more effective as well as more family oriented. This research is also of interest to managers in organizations, as it will help in understanding how WFC influences the outcomes of an
42

INTERNATIONAL JOURNAL OF MANAGEMENT AND MARKETING RESEARCH ♦Volume 4 ♦ Number 1 ♦ 2011
organization. Finally, women activists will also be interested in this study because it aids in the advancement of women in their careers. REFERENCES Participacion economica de las Mujeres. Retrieved April 10 2008, 2008, from http://e-mexico.gob.mx/wb2/eMex/eMex_Participacion_economica_Mujeres Women in the Labor Force Databook. (2007). from http://www.bls.gov/cps/wlf-intro-2007.pdf Allen, N. J., & Meyer, J. P. (1990). The Measurement and Antecedents of Affective, Continuance and Normative Commitment to the Organization. Journal of Occupational Psychology, 63(1), 1. Allen, N. J., & Meyer, J. P. (1996). Affective, Continuance, and Normative Commitment to the Organization: An Examination of Construct Validity. Journal of Vocational Behaviour, 49(3), 252-276. Allen, T. D., Herst, D. E., Bruck, C., & Sutton, M. (2000). Consequences associated with work-to-family conflict: A review and agenda for future research. Journal of Occupational Health Psychology, 5, 278-308. Amatea, E. S., Cross, E. G., Clark, J. E., & Bobby, C. L. (1986). Assessing the Work and Family Role Expectations of Career-Oriented Men and Women: The Life Role Salience Scales. Journal of Marriage and the Family, 48(4), 831. Anderson, S. E., Coffey, B. S., & Byerly, R. T. (2002). Formal organizational initiatives and informal workplace practices: Links to work-family conflict and job-related outcomes. Journal of Management, 28(6), 787. Aryee, S., Fields, D., & Luk, V. (1999). A cross-cultural test of a model of the work-family interface. Journal of Management, 25(4), 491. Baltes, B. B., Briggs, T. E., Huff, J. W., Wright, J. A., & Neuman, G. A. (1999). Flexible and compressed workweek schedules: A meta-analysis of their effects on work-related criteria. Journal of Applied Psychology, 84(4), 496. Bedeian, A., Burke, G., & Moffet, R. (1988). Outcomes of Work-Family Conflict among married male and female Professionals. Journal of Management, 14(3). Behson, S. J. (2002). Coping with family-to-work conflict: The role of informal work accomodations to family. Journal of Occupational Health Psychology, 7. Boyar, S. L., Carl P. Maertz, J., Donald C. Mosley, J., & Carr, J. C. (2008). The impact of work/family demand on work-family conflict. Journal of Managerial Psychology, 23(3), 215. Boyar, S. L., Carson, C. M., Donald C. Mosley, J., Carl P. Maertz, J., & Pearson, A. W. (2006). Assessment of the validity of Netemeyer et al.'s (1996) WFC and FWC scales. International Journal of Conflict Management, 17(1), 34. Brislin, R. (1980). Translation and content analysis of oral and written material. In H. Triandis & J. Berrey (Eds.), Methodology: 2. Handbook of Cross-cultural Psychology. Boston: Allyn and Bacon.
43

A. Cavazos-Garza | IJMMR ♦ Vol. 4 ♦ No. 1 ♦ 2011
Brown, G. W., Bifulco, A., & Harris, T. O. (1987). Life events, vulnerability and onset of depression: Some refinements. The British Journal of Psychiatry, 150, 30-42. Buffardi, L. C. a. E., C. J. (1997). The impact of dependent-care responsibility and gender on work attitudes. Journal of Occupational Health Psychology, 4, 356-367. Cacsio, W. (1991). Costing Human Resources: The Financial Impact of Behavior in Organizations: Thomson South-Western. Carlson, D. S., & Kacmar, K. M. (2000). Work-family conflict in the organization: Do life role values make a difference? Journal of Management, 26(5), 1031. Carlson, D. S., & Perrewe, P. L. (1999). The role of social support in the stressor-strain relationship: An examination of work-family conflict. Journal of Management, 25(4), 513. Carr, J. C., Boyar, S. L., & Gregory, B. T. (2008). The moderating effect of work-family centrality on work-family conflict, organizational attitudes, and turnover behavior. Journal of Management, 34(2), 244. Chen, Z., & Francesco, A. (2003). The relationship between the three components of commitment and employee performance in China. Journal of Vocational Behavior, 62(3). Chi-Ching, Y. (1995). The effects of career salience and life-cycle variables on perceptions of work-family interfaces. Human Relations, 48(3), 265. Chin, W. W. (1998). Issues and opinion on structural equation modeling. MIS Quarterly, 22(1). Cinamon, R. G., & Yisrael, R. (2002). Gender differences in the importance of work and family roles: Implications for work-family conflict. Sex Roles, 47(11), 531. Dunham, R., Grube, J., & Castaneda, M. (1994). Organizational commitment: The utility of an integrative definition. Journal of applied psychology 79(33), 370-380. Eby, L. T., Casper, W. J., Lockwood, A., Bordeaux, C., & Brinley, A. (2005). Work and family research in IO/OB: Content analysis and review of the literature (1980-2002). Journal of Vocational Behavior, 66(1), 124. Franco, J. L., Sabattini, L., & Crosby, F. J. (2004). Anticipating Work and Family: Exploring the Associations among Gender-Related Ideologies, Values, and Behaviors in Latino and White Families in the United States. The Journal of Social Issues, 60(4), 755. Fox, M. L., & Dwyer, D. J. (1999). An investigation of the effects of time and involvement in the relationship between stressors and work-family conflict. Journal of Occupational Health Psychology, 4. Frone, M., Russell, M., & Cooper, M. (1992). Prevalence of work-family conflict: Are work and family boundaries asymmetrically permeable? Journal of Organizational Behavior, 13, 723- 729. Frone, M. R., Russell, M., & Cooper, M. L. (1995). Job stressors, job involvement and employee health: A test of identity theory. Journal of Occupational and Organizational Psychology, 68(1), 1. Frone, M. R., Yardley, J. K., & Markel, K. S. (1997). Developing and testing an integrative model of the work-family interface. Journal of Vocational Behavior (50).
44

INTERNATIONAL JOURNAL OF MANAGEMENT AND MARKETING RESEARCH ♦Volume 4 ♦ Number 1 ♦ 2011
Greenhaus, J. H., Bedeian, A., & Mossholder, K. W. (1987). Work experiences, job performance, and feelings of personal and family well-being. Journal of Vocational Behavior, 31. Hair, J. F., Anderson, R. E., & Tatham, R. L. (1998). Multivariate Data Analysis, (5th Ed.). New York, NY: Macmillan. Harter, J. K., Schmidt, F. L., & Hayes, T. L. (2002). Business-unit-level relationship between employee satisfaction, employee engagement, and business outcomes: A meta-analysis. Journal of Applied Psychology, 87(2), 268. Henseler, J., Ringle, C. M., & Sinkovics, R. R. (2009). The use of partial least squares path modeling in international marketing (Vol. 20): Emerald Group Publishing Limited. Hill, E. J., Chongming, Y., Alan, J. H., & Maria, F. (2004). A Cross-Cultural Test of the Work-Family Interface in 48 Countries. Journal of Marriage and Family, 66(5), 1300. Hofstede, G. (1980). Culture’s consequences, international differences in work-related values. Beverly Hills, Calif.: Sage Publications. Hofstede, G. (1994). Cultural constraints in management theories. International Review of Strategic Management, 5, 27. Hofstede, G. (2001). Culture's Consequences: Comparing Values, Behaviors, Institutions, and Organizations across Nations. (2nd ed.). Thousand Oaks, CA: Sage Publications. Huselid, M. A. (1993). Essays on human resource management practices turnover, productivity, and firm performance. Unpublished 9404819, State University of New York at Buffalo, United States -- New York. Joiner, T. A., & Bakalis, S. (2006). The antecedents of organizational commitment: the case of Australian casual academics. The International Journal of Educational Management, 20(6), 439. Karambayya, R., & Reilly, A. H. (1992). Dual earner couples: Attitudes and actions in restructuring work for family. Journal of Organizational Behavior, 13, 585-601. Kerpelman, J. L., & Schvaneveldt, P. L. (1999). Young adults' anticipated identity importance of career, marital, ad parental roles: Comparisons of men and women with different role balance orientations. Sex Roles, 41(3/4), 189. Kline, R. B. (2005). Principles and practice of Structural Equation Modeling (2nd Ed.). New York: The Guilford Press. Kopelman, R. E., Greenhaus, J. H., & Connolly, T. F. (1983). A Model of Work, Family, and Interrole Conflict: A Construct Validation Study. Organizational Behavior and Human Performance, 32(2), 198. Kossek, E. E., & Ozeki, C. (1998). Work-family conflict, policies, and the job-life satisfaction relationship: A review and directions for organizational behavior-human resources research. Journal of Applied Psychology, 83(2), 139. Lewis, S. N. C., & Cooper, C. L. (1987). Stress in Two-Earner Couples and Stage in the Life-Cycle. Journal of Occupational Psychology, 60(4), 289.
45

A. Cavazos-Garza | IJMMR ♦ Vol. 4 ♦ No. 1 ♦ 2011
Lobel, S. S., & St. Claire, L. (1992). Effects of family responsibilities, gender, and career identity salience on performance outcomes. Academy of Management Journal, 35. Lundberg, U., & Frankenhaeuser, M. (1999). Stress and workload of men and women in high-ranking positions. Journal of Occupational Health Psychology, 4, 142-151. Lyness, K. S., & Thompson, D. E. (1997). Above the glass ceiling? A comparison of matched samples of female and male executives. Journal of Applied Psychology, 82(3), 359. Martire, L. M., Stephens, M. A. P., & Townsend, A. L. (2000). Centrality of women's multiple roles: Beneficial and detrimental consequences for psychological well-being. Psychology and Aging, 15(1), 148-156. Meyer, J., Stanley, D., Herscovitch, L., & Topolnytsky, L. (2002). Affective, Continuance, and Normative Commitment to the Organization: A Meta-analysis of Antecedents, Correlates, and Consequences. Journal of Vocational Behavior, 61(1). Meyers, L., Gamst, A., and Guarino, G. (2006). Applied multivariate research design and interpretation. Thousand Oaks [u.a.] Sage. Money, R. B., & Graham, J. L. (1999). Salesperson Performance, Pay, and Job Satisfaction: Tests of a Model Using Data Collected in the United States and Japan. [Article]. Journal of International Business Studies, 30(1), 149-172. Munro-smith, N. (2003, 7-10 December 2003). A culturally aware course design. Paper presented at the 20th Annual Conference of the Australasian Society for Computers in Learning in Tertiary Education, Adelaide, Australia. Netemeyer, R. G., Boles, J. S., & McMurrian, R. (1996). Development and validation of work-family conflict and family-work conflict scales. Journal of Applied Psychology, 81(4), 400. Netemeyer, R. G., Brashear-Alejandro, T., & Boles, J. S. (2004). A Cross-National Model of Job-Related Outcomes of Work Role and Family Role Variables: A Retail Sales Context. Academy of Marketing Science. Journal, 32(1), 49. Nissly, J. A. (2004). Prospective and retrospective examinations of factors related to intention to leave and turnover among public child welfare workers. Unpublished Ph.D., University of Southern California, United States -- California. Noor, N. M. (2004). Work-Family Conflict, Work- and Family-Role Salience, and Women's Well-Being. The Journal of Social Psychology, 144(4), 389. Oshagbemi, T. (1999). Overall job satisfaction: how good are single versus multiple-item measures? Journal of Managerial Psychology, 14(5), 388. Parasuraman, S., Greenhaus, J. H., Rabinowitz, S., Bedeian, A. G., & Mossholder, K. W. (1989). Work and Family Variables as Mediators of the Relationship. Academy of Management Journal, 32(1), 185. Pleck, J. H., Lamb, M. E., & Levine, J. A. (1986). Epilog: Facilitating Future Change in Men's Family Roles. Marriage & Family Review, 9(3/4), 11.
46

INTERNATIONAL JOURNAL OF MANAGEMENT AND MARKETING RESEARCH ♦Volume 4 ♦ Number 1 ♦ 2011
Posthuma, R. A., Joplin, J. R. W., & Carl P. Maertz, J. (2005). Comparing the Validity of Turnover Predictors in the United States and Mexico. International Journal of Cross Cultural Management: CCM, 5(2), 165. Quinn, R. P., & Shepard, L. J. (1974). The 1972-73 Quality of Employment Survey: Descriptive Statistics with comparison data. Reitzes, D. C., & Mutran, E. J. (1994). Multiple roles and identities: Factors influencing self-esteem among middle-aged working men and women. Social Psychology Quarterly, 57(4), 313. Rice, R. W., Frone, M. R., & McFarlin, D. B. (1992). Work-nonwork conflict and the perceived quality of life. Journal of Organizational Behavior (1986-1998), 13(2), 155. Robbins, S. P., & Judge, T. A. (2007). Organizational Behavior (11th ed.). Upper Saddle River, NJ: Pearson Prentice Hall. Segrest, S. L., Romero, E. J., & Domke-Damonte, D. J. (2003). Exploring the role of Machismo in gender discrimination: A comparison of Mexico and the U.S. Equal Opportunities International, 22(1), 13. Shamir, B. (1983). Some antecedents of work-nonwork conflict. Journal of Vocational Behavior, 23, 98. Van de Vijver, F. J. R. L., Kwok. (1997). Methods and data analysis for cross-cultural research. Cross-cultural psychology series, (Vol. 1). Thousand Oaks, CA, US: Sage Publications, Inc. Williams, K., & Alliger, G. M. (1994). Role stressors, mood spillover, and perceptions of work-family conflict in employed parents. Academy of Management Journal, 37(4), 837. Wysocki, B. J. (1997). The outlook: Retaining employees turns into a hot topic. Wall Street Journal, Eastern edition. Yang, N., Chen, C., Choi, J., & Zou, Y. (2000). Sources of work-family conflict: A Sino-US comparison of the effects of work and family demands. Academy of Management Journal, 43. Zahrly, J., & Tosi, H. (1989). The Differential Effect of Organizational Induction Process on Early Work Role Adjustment. Journal of Organizational Behavior, 10(1), 59. Zedeck, S., & Mosier, K. (1990). Work in the Family and Employing Organization. American Psychologist, 45(2). BIOGRAPHY Dr. Alicia Cavazos-Garza is an Assistant Professor of Management in Texas A&M University- Kingsville. She can be contacted at: College of Business, Rm 220, TAMUK, University 700 University Blvd.,Kingsville, TX 78363-8202. Email: [email protected]
47


INTERNATIONAL JOURNAL OF MANAGEMENT AND MARKETING RESEARCH ♦Volume 4 ♦ Number 1 ♦ 2011
DEVELOPMENT OF MARKETING ORIENTATION IN SMALL AND MEDIUM-SIZED ENTERPRISES
EVIDENCE FROM EASTERN EUROPE Andrzej Kobylanski, Penn State Greater Allegheny
Radoslaw Szulc, University of Warmia and Mazury in Olsztyn
ABSTRACT
One of the most important aspects that determine an organization’s market position is the entrepreneurs’ approach to market orientation and marketing actions. The aim of this study was to investigate the process of marketing orientation development in SMEs in the country of Eastern Europe, where the economy changed from one of a central planning system to a “free” market economy. Authors investigated to what extent small firms that have survived long enough on the market are competitive because of their adoption of a marketing orientation. For research purposes authors used theoretical concepts that characterize marketing orientation using five attributes: customer orientation, integrated marketing functions, marketing information, strategic marketing planning and operational effectiveness. The empirical evidence presented in this article suggests that customer orientation is critical for SMEs. However, investigated SMEs often focus on the sales level, which is characteristic for organizations with sales instead of marketing orientation. JEL: M13, M31, O52 KEYWORDS: marketing orientation, small business, SMEs in Poland INTRODUCTION
mall and medium–sized enterprises (SME) play a major role in countries at all levels of economic development (Caniels and Romijn, 2005). Many acknowledge that developed economies have a high proportion of small businesses, and it is predicted that the number of such entities will continue to grow,
due to declines in manufacturing and growth in the service sector (Burns, 1996; Carson, 1993). As markets are becoming more global, many business opportunities are opening for small and medium-sized businesses, but competitive pressure is increasing at the same time (Caniels and Romijn, 2005). They need to adjust their actions to the environmental challenges through active market development, a continuous search for market opportunities and expansion of their customer base. There are many interesting aspects to marketing and small firms, and numerous authors deal with this in careful and expertly-written ways with numerous references to original literature. Many researchers and practitioners are looking to find the answer to the fundamental question as to why some organizations are profitable with good perspectives for growth (why they are successful), while others cannot achieve this state (Beverland and Lockshin, 2005). One of the challenges that small firms are facing is that managers/owners often rely only on previous experience and common sense, because in their perception the boundary between marketing and selling becomes very blurred. One of the most important aspects that determine an organization’s market position is the entrepreneurs’ approach to market orientation and marketing actions. Small business managers’ attitude toward a structured approach to marketing can be seen as a sign of maturity and responsible decision making that can lead to a positive business performance. Small business marketing strategies are very often described as a process of “crafting” (Beverland and Lockshin, 2005), where marketing tools are adapted to meet immediate needs and react to threats, rather than designed to achieve long-term goals.
S
49

A. Kobylanski, R. Szulc | IJMMR ♦ Vol. 4 ♦ No. 1 ♦ 2011
Therefore, some studies suggest that it may be desirable to provide some marketing education to potential entrepreneurs before they launch a business (Carson, 1993). While the underlying principles of marketing are equally applicable to large and small firms alike, smaller firms are facing problems with the implementation of marketing tools (McCartan-Quinn and Carson, 2003). It is generally accepted that the characteristics of the small firm influence marketing practice. Smaller companies have a different approach to marketing activities because they have much leaner resources compared to large firms (Zontanos and Anderson, 2004). Small firms face marketing challenges which are related to the general characteristics of small businesses, like a limited customer base, limited marketing activity, expertise and impact, reactive rather than planned marketing and difficulties in exploring marketing opportunities (Stokes and Fitchew, 1997). However, in contrast to large firms, small firms can build marketing advantages based on a close relationship between entrepreneur/manager and customers (Zontanos and Anderson, 2004). They are close to their markets, have greater flexibility and can implement decisions much faster. LITERATURE REVIEW AND BACKROUND The argument that marketing orientation is a practical and theoretical problem is not new. This issue has been investigated using a conceptual and empirical approach for more than 50 years worldwide, and about 20 years in Poland (Kleczek, 2002). This subject is very interesting to investigate in the segment of small and medium-sized business organizations, because empirical evidence suggests that organizations with a high level of marketing orientation outperform competitors that represent a low level of marketing orientation. According to Oakey (1991) most often the small firms’ marketing activities occur during the selling process. More in-depth analysis provides a better picture of marketing in small organizations. Carson (1985), based on small business organizations in Ireland, described the conditions of marketing orientation as a function of marketing management and created the four-stage evolution model. He presented progress on the path to becoming a medium-sized firm as a four-step evolution process: 1) initial marketing activity; 2) reactive selling, which entails the need for more sales, and change in attitude; 3) the DIY marketing approach; and 4) integrated proactive marketing. Each stage represents an organization’s progress through growth in sales level, whereas the fourth stage represents the highest dynamic of this growth. However, Carson (1985) pointed out that all of the small business organizations have the biggest problems when advancing from the third level to the fourth. This indicates that only a small number of enterprises are using the marketing approach to manage their business. Works of Hooley et al., (1990), as well as research conducted by Preston et al., (1993), confirmed that marketing orientation is a result of the evolutionary process that, because of a changing environment, takes the company from complete unawareness of the concept to full acceptance. Stokes and Fitchew (1997) argue that small firms in their initial phase of development seem to give marketing low priority compared to the other functions of their business. However, just as the firm must evolve to survive, so marketing evolves to reflect the owner-manager experience and the needs of the firm (Carson, 1985). Implementation of marketing tools often does not translate into understanding and utilization of marketing management strategy. It also does not guarantee successful creation of sustainable competitive advantage (SCA). This is a situation when identifiable marketing orientation can be proven – an organization is implementing marketing tools and techniques to respond to changes in external and internal dimensions. Correct understanding of marketing orientation means that an organization will create values inside the organization, which will enable it to successfully respond to the external challenges. This type of mindset will indicate the important role of marketing in the overall business strategy and will provide conditions to create and develop marketing orientation in the organization.
50
INTERNATIONAL JOURNAL OF MANAGEMENT AND MARKETING RESEARCH ♦Volume 4 ♦ Number 1 ♦ 2011
The basic assumption behind the successful implementation of marketing strategy is cooperation among all functional areas in the organization to achieve a synergy effect. Coordination of the actions in the outside dimension (competitors, customer needs), and the internal dimension, where a marketing approach is adopted by existing structures in the organization, is a foundation of the established market orientation. An organization with a clear marketing orientation is designing its actions to collect information about customers and competitors' capabilities. It is able to utilize this information across departments and to use the information to create customer value proposition. Increasing the marketing role in a firm can usually be achieved by creating values and an organizational structure that supports orientation to the external environment – customer and competition. Heiens (2000) strongly suggests that market orientation can be conceptualized as inclusion of two major components: (1) customer-focus and (2) competitor-focus. Only after fulfilling these conditions can we identify the position of marketing in the organization’s overall strategy. Then the organization would be able to create and maintain marketing orientation. Marketing orientation can be defined in various ways, depending on the perspective that is taken into consideration. However, most researchers agree that acknowledgment of customer needs and expectations is the main component of marketing orientation. Deshpande and Webster (1989) define it as: “a shared set of beliefs and values that put the consumer into the center of the firm’s thinking.” Avlonitis and Gounaris (1999) define three priorities of marketing orientation: customers and product’s ability to satisfy specific customer needs; marketing as a dominant culture of the company and ability to adjust products as a response to the changes in customer needs and wants in order to deliver customer satisfaction. Others (Harris and Ogbonna, 1999) are focusing on the organizational aspect, where marketing orientation is “an organizational culture focused on the market.” Some (Houston, 1986; Dixon, 1990) distinguish it as a company philosophy. This approach is fully represented by the definition provided by Narver and Slater (1990): “the organizational culture that most effectively and efficiently creates the necessary behaviors for the creation of superior value for buyers and thus continuous superior performance for the business.” Kohli and Jaworski (1990) define marketing orientation rather as a process or activity-based characteristic of the firm. They focused on the organizational behavioral perspective, where indicators of marketing orientation are represented by the actions connected to utilization of market intelligence. According to Misiag (2001), marketing orientation is more than the effect of the spontaneous and intuitive processes under the pressure and influence of the outside environment. It is the internal driving force that will have an impact on marketing actions. It is going to influence not only customers, but also employees of the organization and the relationship within. In the current environment, without established marketing orientation, business organizations will not survive and will not have a chance for growth. Therefore, implementation of the marketing orientation is the highest stage of development for organizations and critical component of the successful business performance. It can be developed based on the actions determined by the level of importance. Starting from management actions (marketing management), preparation and coordination (marketing planning), as well as implementation. Implementation of marketing orientation means creation and management of marketing actions, such as: environmental scanning, assessment of customer needs and expectation, and the design of goals and objectives that are based on organizational constraints; which finally lead to the design of marketing strategy. In order to be successful in their marketing the owners/managers need to understand and accept marketing rules that determine appropriate actions. These actions are essentially connected with marketing orientation attributes. Kleczek, et al. (1997) distinguished five attributes. The first one is represented by customer orientation - fulfillment of customer needs and expectations that should lead to satisfaction. The second is integrated marketing functions – an organizational system that is focused around marketing goals and ways to achieve them. The next distinguished attribute is called: marketing information (market
51

A. Kobylanski, R. Szulc | IJMMR ♦ Vol. 4 ♦ No. 1 ♦ 2011
intelligence) – market and marketing research. The two remaining areas are: strategic approach/perspective (strategic marketing planning) and operational effectiveness (tactical and operational plans for implementation of marketing actions and control system). More recent study (Carr and Lopez, 2007) propose similar integrated approach, in which there are three components of marketing orientation - customer orientation, competitor orientation and cross-functional coordination. Miles and Arnold (2001) view the customer orientation, customer satisfaction, integrated marketing actions and profitability as the key components of marketing orientation. These aforementioned approaches present similar concepts and therefore we have been able to use them as a framework for our research purposes - investigation of marketing orientation in SMEs in Poland.
METHODS This section reports the research methods underlying the empirical study. This research is based on the assumption that small and medium-sized enterprises in the Warmia and Mazury district (one of the economic regions in Poland) are implementing rules of marketing orientation in their business activities. Businesses are most vulnerable when they are very young and very small. As many research projects confirm, only a small percentage stay in business for a longer time period. Over two-thirds close in the decade in which they opened (Zontanos and Anderson, 2004). Therefore, it could be beneficial to investigate to what extent small firms that have survived long enough on the market are competitive enough because of their adoption of marketing orientation. The purpose of this research project is to verify the hypothesis: H1: Organizations with longer presence in the market have a higher level of development of marketing orientation. To investigate the research topic, we need to find answers to the following questions. What types of marketing actions are taken by investigated enterprises? Can they be summarized as a consistent approach described as a marketing orientation? Are investigated enterprises different from each other in terms of implemented marketing actions and the duration of being present on the market? The data were collected from 170 randomly selected business organizations from one geographical region in Poland. Selected organizations were chosen from the Polish national registrar system REGON and were pre-screened using the following conditions: active business organizations, organizations that started business before January 1st, 1999, employment under 250 employees, and organizations that belong to one of the five categories of Polish Classification of Business Activity developed by the National Census Bureau of Poland and recorded highest level of sales in goods and services.
The screening process limited population to 45,000 businesses, from which a random selection process has been conducted. Further verification of a business resulted in 80 enterprises that were finally selected. The structure of research sample is presented in Table 1. Selected enterprises were divided into two groups based on the time in the market. Group 1 consisted of organizations that started their business activity during the market transformation time in Poland (1990-1994). Group 2 included organizations that started their business operations in relatively stable economic environment (1995-1998). Both periods of time had variations in terms of the periods of market prosperity and slowdowns. They could be characterized by the changes in GDP, inflation and unemployment rates as well as changes in legal and political environment. Enterprises from one group could be present on the market for eight years, while organizations from the second group could be in the start-up phase of operations. Recorded date of starting business operations has been established as an independent variable, because we assume that duration of time directly influences the learning curve, accumulation of market experience and evolution
52
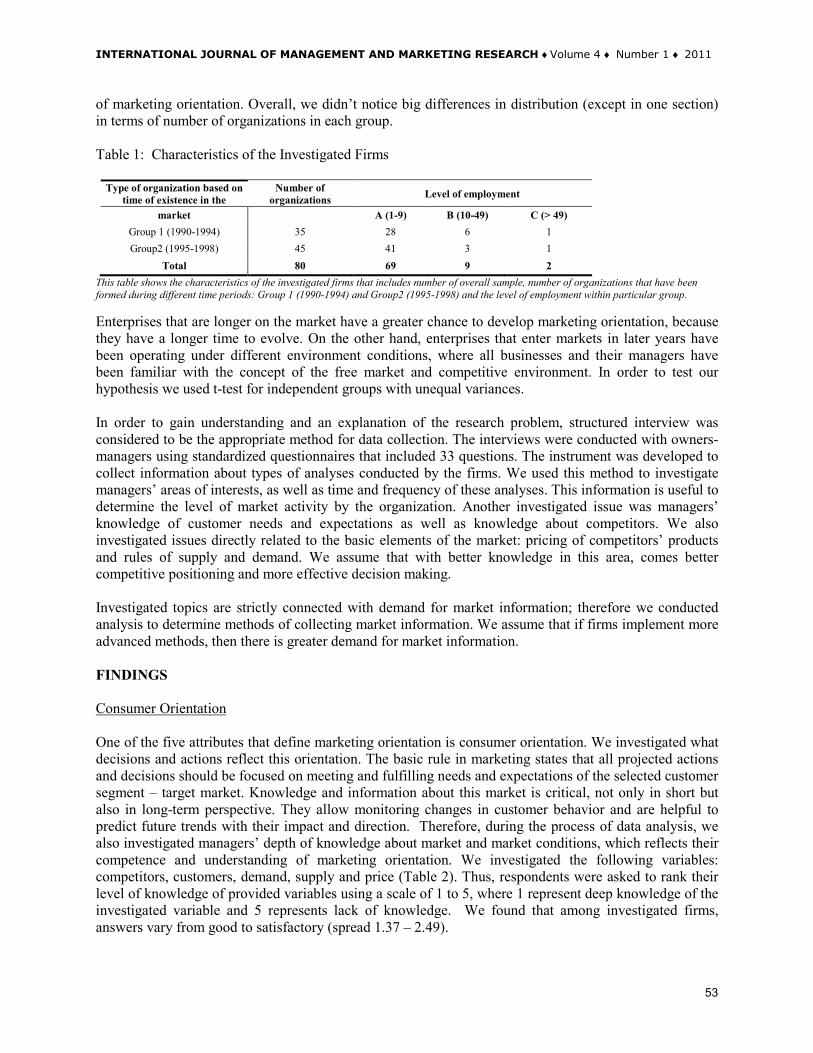
INTERNATIONAL JOURNAL OF MANAGEMENT AND MARKETING RESEARCH ♦Volume 4 ♦ Number 1 ♦ 2011
of marketing orientation. Overall, we didn’t notice big differences in distribution (except in one section) in terms of number of organizations in each group. Table 1: Characteristics of the Investigated Firms
Type of organization based on time of existence in the
Number of organizations Level of employment
market A (1-9) B (10-49) C (> 49) Group 1 (1990-1994) 35 28 6 1 Group2 (1995-1998) 45 41 3 1
Total 80 69 9 2 This table shows the characteristics of the investigated firms that includes number of overall sample, number of organizations that have been formed during different time periods: Group 1 (1990-1994) and Group2 (1995-1998) and the level of employment within particular group. Enterprises that are longer on the market have a greater chance to develop marketing orientation, because they have a longer time to evolve. On the other hand, enterprises that enter markets in later years have been operating under different environment conditions, where all businesses and their managers have been familiar with the concept of the free market and competitive environment. In order to test our hypothesis we used t-test for independent groups with unequal variances. In order to gain understanding and an explanation of the research problem, structured interview was considered to be the appropriate method for data collection. The interviews were conducted with owners-managers using standardized questionnaires that included 33 questions. The instrument was developed to collect information about types of analyses conducted by the firms. We used this method to investigate managers’ areas of interests, as well as time and frequency of these analyses. This information is useful to determine the level of market activity by the organization. Another investigated issue was managers’ knowledge of customer needs and expectations as well as knowledge about competitors. We also investigated issues directly related to the basic elements of the market: pricing of competitors’ products and rules of supply and demand. We assume that with better knowledge in this area, comes better competitive positioning and more effective decision making. Investigated topics are strictly connected with demand for market information; therefore we conducted analysis to determine methods of collecting market information. We assume that if firms implement more advanced methods, then there is greater demand for market information. FINDINGS Consumer Orientation One of the five attributes that define marketing orientation is consumer orientation. We investigated what decisions and actions reflect this orientation. The basic rule in marketing states that all projected actions and decisions should be focused on meeting and fulfilling needs and expectations of the selected customer segment – target market. Knowledge and information about this market is critical, not only in short but also in long-term perspective. They allow monitoring changes in customer behavior and are helpful to predict future trends with their impact and direction. Therefore, during the process of data analysis, we also investigated managers’ depth of knowledge about market and market conditions, which reflects their competence and understanding of marketing orientation. We investigated the following variables: competitors, customers, demand, supply and price (Table 2). Thus, respondents were asked to rank their level of knowledge of provided variables using a scale of 1 to 5, where 1 represent deep knowledge of the investigated variable and 5 represents lack of knowledge. We found that among investigated firms, answers vary from good to satisfactory (spread 1.37 – 2.49).
53

A. Kobylanski, R. Szulc | IJMMR ♦ Vol. 4 ♦ No. 1 ♦ 2011
We used t-test for independent variables, where we conducted statistical analysis of the means in two investigated groups. Computed statistics suggest that tests are significant in two cases: knowledge of demand and knowledge of customer needs and expectations (Table 2), where the knowledge of general demand is weaker than the knowledge of the target market. Therefore, general knowledge about demand and its characteristics is the least recognizable element of the market. Table 2: The Level of Knowledge of Market Components
Knowledge of: Mean Group 1
Mean Group 2 t p St. Dev.
Group 1 St. Dev
Group 2 F-test
Competitor 1.857 1.778 0.518 0.606 0.733 0.636 1.331
Customer 1.371 1.689 -2.947*** 0.004 0.490 0.468 1.096
Demand 2.057 2.489 -3.135*** 0.002 0.639 0.589 1.179
Supply 1.914 1.978 -0.376 0.708 0.659 0.811 1.5188
Price 1.914 2.156 -1.448 0.152 0.658 0.796 1.463 This table shows the results for t-test for independent variables and analysis of variance F-test, where n1=35 and n2=45. Respondents answers are ranked on the scale of 1 to 5, where 1 - very well, and 5 - not at all. Significance levels are denoted *, **, *** for the 0.1, 05, and 0.001 respectively.
The survey results point out that customer orientation as a component of the marketing orientation is very important for small and medium-sized businesses. We observe that investigated firms are customer-oriented and they know the expectations of their customers. Overall, they have a decent knowledge about other variables: competitors, determinants of pricing and determinants of supply. However, organizations have great difficulty collecting and using information about customer demand. Integrated Marketing Functions All activities focused on establishing and achieving marketing goals reflect the level of integration among marketing functions. Usually it can be described as involvement of all employees in marketing actions, starting from the process of planning, through the implementation and control phase, which could be identified as their non-formalized involvement in formulation and execution of marketing strategy. Based on collected data we could identify that finding new customers was the most important goal among analyzed firms. This goal was set by 20 firms (57%) and 20 firms (45%) in group 1 and group 2, respectively. We observed strong focus to achieve this goal, because increased sales through new customers is a main strategic goal for 50% of analyzed enterprises. We can conclude that this is a very important aspect for small businesses. However, such a significant focus on sales is characteristic for organizations with sales orientation not marketing orientation. Therefore, we found this contradictory to the stated hypothesis. Investigated organizations most often utilized penetration strategy, where they are competing with present product and present markets. This strategic approach makes organizations more competitive, but in the long term there will be no benefits for small organizations or their customers. This is an example where lack of marketing orientation limits firms’ abilities to grow through innovativeness (product development strategy) and new customers (market expansion, and diversification). Marketing Intelligence The study conducted by Kohli and Jaworski (1990) stresses the importance of the market intelligence (collection, dissemination and responsiveness to collected data) as important components of a marketing oriented company. Small businesses have a major deficiency in the ability to forecast future demand for products, resulting in a slow reaction to changes in marketing environment and a consequential less than
54

INTERNATIONAL JOURNAL OF MANAGEMENT AND MARKETING RESEARCH ♦Volume 4 ♦ Number 1 ♦ 2011
optimum deployment of production resources (Ong, 1997). Others (Beverland and Lockshin, 2005) stress that entrepreneurs are focused more on the need to gain competitive advantage, rather than into research about customers’ requirements. They prefer to have contact with the customers, listen and respond to them, rather than undertake formal marketing research to understand the marketplace (Carter and Jones-Evans 2000, Zontanos and Anderson 2004). They gather intelligence in an informal manner and prefer face-to-face communication in doing so. Therefore, they can access inexpensive, vital and timely market information that can lead to making informed marketing decisions. Investigated organizations are able to collect data using multiple methods; however they have many financial and organizational constraints that limit their ability to gather information. In order to consider the process of generating market intelligence as part of marketing orientation, we need to analyze not only how these firms are using this information, but also how often they perform data collection and what type of methods they are using. We can assume that in an organization where there is a greater level of marketing orientation there is a greater need for marketing information and therefore more sophisticated methods for collecting data are used. On the other hand organizations that are smaller in size also have different needs for intelligence, compared to larger, formalized organizations. Among investigated organizations we identified specific methods of collecting information, according to initial segmentation for two groups (Table 3). Table 3: Marketing Research Methods Used by Investigated SMEs
Research methods Mean Group1
Mean Group2 t p
St. Dev. Group1
St. Dev. Group 2 F-test
Observation 2.057 1.956 0.376 0.708 1.282 1.127 1.293 Surveys 3.857 3.578 2.2697*** 0.026 0.430 0.621 2.087** Customer interview 1.857 1.756 0.5114 0.610 0.810 0.933 1.328 Interview with members of the supply channel 2.257 2.400 -0.5302 0.597 1.291 1.116 1.339
Analysis of competitors 3.057 3.489 -2.164*** 0.033 1.136 0.626 3.293*** Secondary data analysis 3.371 2.800 2.688*** 0.009 0.770 1.057 1.885*
This table shows the results for t-test and analysis of variance F-test, where n1=35 and n2=45. Respondents answers are ranked on the scale of 1 to 5, where 1 – very often, and 4 - not at all. Significance levels are denoted *, **, *** for the 0.1, 05, and 0.001 respectively. In order to measure how often the identified methods have been used to collect information, we used a scale from 1 to 4, where 1 means “very often” and 4 - “not at all.” So, the lower mean in the group translates into more frequent use of investigated methods. We observed that statistically significant differences exist in methods that are less often utilized. Many assume that the most popular method of collecting information is via survey. However our findings present a different picture, where an interview with the customer is the most common method of collecting information. Intuitively it makes sense because small businesses are very close to customers. We noticed that even firms with longer presence on the market don’t utilize surveys as a valuable tool. Interestingly, secondary data about past performance, which is easily obtainable by owners/managers is not perceived as a helpful method to generate market intelligence. Strategic Approach/Perspective Market research indicates that entrepreneurial organizations don’t use the long-term approach. Instead, their marketing strategies often rely on crisis management, gut feelings and actions designed to deal with immediate competitive pressures. Strategic marketing planning is a continuous process, designed to help management create, change or retain a business strategy, to create strategic visions and build long term competitive advantage. Based on collected data we see that only 31.15% of small and medium sized firms are planning marketing activities using a strategic approach. The majority (68.85%) are neglecting this process, focusing on day-to-day activities and problem solving.
55

A. Kobylanski, R. Szulc | IJMMR ♦ Vol. 4 ♦ No. 1 ♦ 2011
Table 4: Strategic Marketing Planning among the SMEs
Strategic Marketing Total How long strategic planning has been implemented Planning (SMP) % 1 – 3 years More than 3 years
80 100 total % of SMP % of all total % of SMP % of all No 61 68.85 x x x x x x Yes 19 31.15 5 26.32 6.25 14 73.68 17.50
This table illustrates the structure of organizations that do not implement strategic approach at all, and organizations that are implementing Strategic Marketing Planning (SMP) for less than 3 years or for more than 3 years. With more in-depth analysis of the size of the organizations and how long they have been on the market, we notice that almost 79% of them are firms employing up to nine workers. More than half of them (52.63%) are preparing strategic marketing plans for more than three years. Among larger firms, that employ 10 – 49 people, 21% of them also prepare strategic marketing plans for more than three years. From the overall sample of selected firms that are preparing strategic plans (19 out of 80), twelve of them belong to the second group of companies (those which established market presence in recent years). Therefore, these findings do not support the hypothesis that firms which are longer on the market have developed better marketing orientation. Operational Effectiveness Operational effectiveness can be achieved when an organization has sufficient resources and marketing competencies, appropriate operational/tactical plans and a control system. We asked about scope of plans and how the gathered data are used in the process of forecasting. Table 5 presents respondents’ answers to this question. Table 5: Utilization of the Marketing Research Results in the Process of Planning and Forecasting
Type of plans and forecasting Number of organizations % Short term planning (tactical plans) 30 37.5 Mid-range planning (business plans) 6 7.5
Long term planning (Strategic Marketing Planning) 19 23.75 Sales revenue forecasting 15 18.75
Sales level forecasting 10 12.5 This table shows the utilization of the marketing research results in the process of planning and forecasting in terms of the number and percentage of investigated organizations. Investigated firms are more focused on short-term planning (37.5%) than long term (23.75%). They specify that important indicators of operational effectiveness are projected level of revenue and projected changes in the sales level (market share). DISCUSSION Statistical analysis and hypothesis verifications didn’t provide an optimistic picture. There is a brighter spot in this analysis, though. Respondents evaluated a critical component of the marketing orientation - consumer orientation as a very positive and necessary step in small and medium-sized enterprise evolution. However, it doesn’t translate immediately to full adoption of marketing orientation. The dominant strategy adopted by these firms is market penetration. Analysis of the third area of marketing orientation, needs for marketing information, proves that firms still have a long way to evolve to develop marketing orientation. This situation has been indicated by low demand for information and an unclear understanding of the information needs. Thus investigated organizations don’t take advantage of making informed decisions and using information in the planning process. Weakness in marketing orientation is also suggested by the number of firms that take a strategic approach to design and implement strategic
56

INTERNATIONAL JOURNAL OF MANAGEMENT AND MARKETING RESEARCH ♦Volume 4 ♦ Number 1 ♦ 2011
plans. However, all of them are using some sort of planning process and sales forecasting. Therefore, they have established criteria that can be used to evaluate operational efficiency, but in their current state they don’t utilize this at all. Based on collected data from one economic region in Poland, we see the potential to conduct comparative studies in other countries. We could take a twofold approach based on the type of economy. One possibility is to conduct a similar study in another country in Eastern Europe, where the economy also went from the central planning system to the “free” market economy. This will allow us to confirm our findings as specific to the economies that went through a transformation process or verify that the findings are only specific to Poland. The second approach would be to compare findings from a country with an established, traditional market-oriented economy. This perspective will provide additional insights to confirm or reject our findings as a general rule in the process of the development of marketing orientation. SUMMARY Changes in the external environment make unavoidable impact on small and medium-sized enterprise development. In order to adjust to those changes they need to monitor market signals and identify market information that might have strategic importance to the organization’s development. Through market analysis as well as recognition of the scope, immediacy and impact of changes in external environment, organizations can make informed marketing decisions and therefore build a better competitive position in the market. The only way to achieve this position is to get access to the information about external environment. It can be gathered through appropriate methods of data collection, considering all types of constraints characteristic to small and medium-sized business organizations. Our findings in the area of collecting information and using it in business operations are consistent with existing findings in the literature. Small and medium-sized business organizations are usually implementing marketing actions only on a small scale. Organizational limitations and constraints are causing them to be very simple, intuitive and not coordinated. Most of them are influenced by the owner/manager’s marketing skills, knowledge and attitude. This aspect was clarified in the question: “Who in your organization is responsible for strategic marketing planning, information collection and analysis?” with the most common answer - owner of the business. Very seldom were managers/owners asking for support and input from staff members and never from specialized service firms. Investigated firms are focused on their markets and trying to closely monitor trends and processes that influence them, however they are mainly focused on consumer actions and behaviors. Unfortunately, they leave all other aspects of external environment outside their scope of market research. Therefore, we can conclude that the duration of time that the enterprise is active on the market does not significantly influence marketing actions taken by the firm and has no positive impact on the development of marketing orientation. Finally, we are able to see that small and medium-sized enterprises are more likely to present an entrepreneurial and reactive approach to marketing, where many decisions are made in the intuitive way (often bearing higher market risk), than actions dictated by conscious and information-based decisions. REFERENCES Avlonitis, Gounaris (1999) "Marketing orientation and its determinants: an empirical analysis,” European Journal of Marketing, vol. 33(11/12), p. 1003-1037 Beverland, Lockshin (2005) "Crafting a competitive advantage: tempering entrepreneurial action with positioning-based values," Qualitative Market Research, vol. 7(3), p. 172-182
57

A. Kobylanski, R. Szulc | IJMMR ♦ Vol. 4 ♦ No. 1 ♦ 2011
Burns (1996) “The Business Plan” in Paul Burns and Jim Dewhurst (eds.), Small Business and Enterpreneurship, Second edition, Houndmills, Basingstoke: Macmillan Small Business Series, Macmilland PressLtd., p.180-197 Caniëls, Romijn (2005) “What works, and why, in business services provision for SME: insights from evolutionary theory,” Managing Service Quality, vol.15 (6), p. 591-608 Carr, Lopez (2007) “Examining Market Orientation as Both Culture and Conduct: Modeling the Relationships between Market Orientation and Employee Responses,” Journal of Marketing Theory and Practice, vol. 15(2), p.113-125 Carson (1985) “The Evolution of Marketing in Small Firms,” European Journal of Marketing, vol. 19(5) p.7-16 Carson (1993) “A Philosophy for Marketing Education in Small Firms,” Journal of Marketing Management, vol. 9, p. 189-2004 Carter, Jones-Evans (2000) Enterprise and Small Business: Principles, Practice and Policy, Pearson Education, Edinburgh. Deshpande, Webster (1989) “Organizational Culture and Marketing: Defining the Research,” Journal of Marketing, vol. 53(1), p. 3-17 Dixon (1990) "Marketing as production: the development of a concept," Journal of the Academy of Marketing Science, vol. 18(4), p. 337-43 Harris, Ogbonna (1999) “Developing a market oriented culture: A critical evaluation,” The Journal of Management Studies, vol. 36, p.177-196 Heiens (2000) “Market Orientation: Toward an Integrated Framework,” Academy of Marketing Science Review, vol. 1, p.1-4 Hooley, Lynch, Shepherd (1990) "The marketing concept: putting the theory into practice,” European Journal of Marketing, vol. 24(9), p. 7-23 Houston (1986) "The marketing concept: what it is and what it is not," Journal of Marketing, vol. 50(2), p. 23-39 Jaworski, Kohli (1993) “Market orientation: Antecedents and consequences,” Journal of Marketing, vol. 57, July, p. 53-70. Kleczek, Kowal, Wozniczka (1997) ”Strategiczne planowanie marketingowe,” (Strategic Marketing Planning), PWE, Warsaw, Poland. Kleczek (2002) “Stan badan orientacji marketingowej w Polsce,” (The Current State of Research into Marketing Orientation in Poland) in Z. Kędzior and E. Kieżel (Eds.), Konsumpcja i Rynek w Warunkach Zmian Systemowych. (Consumption and Market during Systemic Changes) PWE, Warsaw, Poland, pp. 302-308
58

INTERNATIONAL JOURNAL OF MANAGEMENT AND MARKETING RESEARCH ♦Volume 4 ♦ Number 1 ♦ 2011
Kohli, Jaworski (1990) “Market Orientation: The Construct, Research Propositions, and Managerial Implications,” Journal of Marketing, vol. 54(2), p.1-18 McCartan-Quinn, Carson (2003) “Issues which impact upon marketing in the small firm,” Small Business Economics, vol. 21(2), p. 201-213 Miles, Arnold (2001) “The relationship between marketing orientation and entrepreneurial orientation,” Entrepreneurship Theory and Practice, vol. 1(15), p.49-65 Misiag (2001) “Metodyczne problemy badania orientacji marketingowej” (Methodical Problems in Marketing Orientation Research,” Marketing i Rynek (Marketing and Market), no 10 Narver, Slater (1990) “The effect of a market orientation on business profitability,” Journal of Marketing, vol. 54, October, p. 20–35 Oakey (1991) “Innovation and the Management of Marketing in High Technology Firms,” Journal of Marketing Management, vol. 7(4), p. 343-356 Ong (1997) “Productivity improvements for a small "made-to-order" manufacturing environment,” Industrial Management + Data Systems, vol. 97(7), p. 251 Preston, Saker, Smith, (1993) "Culture driven strategic marketing planning", in Chias, J. and Sured, J. (Eds), Marketing for the New Europe: Dealing with Complexity, 22nd EMAC Conference, 25-28 May, Barcelona, Spain, p. 1267-1277 Stokes, Fitchew (1997) “Marketing in Small Firms: Towards a Conceptual Understanding,” in Marketing without Borders, Proceedings from the Academy of Marketing 1st Annual Conference, p. 1509-1513 Zontanos, Anderson (2004) “Relationships, marketing and small business: an exploration of links in theory and practice,” Qualitative Market Research, vol. 7(3), p. 228-236 BIOGRAPHY Andrzej Kobylanski, Ph.D. is an Assistant Professor of Marketing at the Pennsylvania State University. He can be contacted at Penn State Greater Allegheny, 4000 University Drive, McKeesport, PA 15132, (412) 675-9455, U.S. email: [email protected] (corresponding author). Radoslaw Szulc, Ph.D. is an Assistant Professor of Marketing in the Department of Marketing and Market Analysis, Faculty of Economic Sciences at the University of Warmia and Mazury in Olsztyn, Poland. He can be contacted at University of Warmia and Mazury in Olsztyn, Prawochenskiego 19, 10-720 Olsztyn, Poland, email: radasz @uwm.edu.pl .
59


INTERNATIONAL JOURNAL OF MANAGEMENT AND MARKETING RESEARCH ♦Volume 4 ♦ Number 1 ♦ 2011
PRODUCT INNOVATION BY SMALL AND MEDIUM-SIZED FIRMS THROUGH OUTSOURCING AND
COLLABORATION Arup K. Sen, D’youville College
Kushnood Haq, D’youville College
ABSTRACT This paper assesses the role of outsourcing and inter-firm collaboration to product innovation in Western New York’s small and medium-sized firms (SMFs). Results of an exploratory survey of 100 small and medium-sized manufacturing firms are presented. A major finding of the paper suggests that SMFs are involved in external collaboration to support new product development. A large majority of these firms collaborate with networks of external partners for their core and non-core activities. A collaborative relationship with external entities was hypothesized to support product innovation; however this was not confirmed by the survey results. The results also indicate that in comparison to the levels ten years ago, outsourcing by SMF increased in all five categories of Research and Development (R&D), product development, manufacturing, marketing/sales, and distribution. Comparatively, medium-sized firms tend to outsource non-core activities while smaller firms tend to outsource their core organizational competencies. KEYWORDS: SMFs, collaboration, outsourcing, innovation, R&D JEL: M16 INTRODUCTION
substantial body of literature now highlights that there has been a fundamental and systematic change in the way SMFs undertake product innovation activities. Furthermore, use of external networks through collaboration and outsourcing has witnessed a substantial growth by the SMFs
(Hagedoorn, 2002). Increased competition in the global marketplace, the advancement of manufacturing technologies, and increasingly limited life cycle of products, have greatly impacted product innovation strategies of the small and medium-sized manufacturing firms. Duysters et al. (1999) indicate that external alliances and collaboration has become a cornerstone of the firm’s product innovation strategy by which we refer specifically to the use of outsourcing and strategic alliances to undertake product innovation (Tidd and Trehwhella, 1997) and Narula (2002). The role of collaboration and outsourcing in the small and medium-sized manufacturing sector has been emphasized by several academic and professional studies (Powell et al, 1996; Staropoli, 1998). The importance of external alliances is discussed especially in relation to SMFs that lack the necessary resources and expertise to effectively manage the new product development process, from innovation to commercialization stages (Baum et al. 2000). Despite mostly having limited resources, SMFs have generally overcome external barriers to growth by using external alliances. This paper examines the role of collaboration and outsourcing in the innovation performance of Western New York (WNY) small and medium-sized manufacturing firms. The results of a recent telephone survey show that the propensity to successfully bring new products to the market place is often contingent upon the use of external expertise. The results also suggest that a firms’ size can influence the depth and nature of its outsourcing activity. Small firms tend to augment their internal competencies by engaging with networks of external innovation support (Howells, 2008). These networks are designed to access human knowledge and expertise, new processes and technologies, and manufacturing facility. In additional to strategic benefits
A
61

A. K. Sen, K. Haq | IJMMR ♦ Vol. 4 ♦ No. 1 ♦ 2011
like flexibility and product quality, a major motivating factor for collaboration has been comparative cost of production. Our interest in the SMF segment of manufacturing firms stems from two factors highlighted in the literature. First, the extent of engaging external sources is much greater for SMFs than their larger counterparts (Seget, 2002). Second, the strong emphasis to develop external relationships is arguable stronger for SMFs than for their larger firms because SMFs contain limited in-house knowledge and resources (Yasuda, 2005). Set against this backdrop, the following analysis addresses three main questions. First, to what extent does collaboration vary by firm size? Second, do firms of different sizes exhibit different approaches toward outsourcing? Finally, what are the key factors in outsourcing and other services for effective implementation? Data for the inquiry come from an empirical investigation of small and medium-sized manufacturing firms in Western New York. It should be noted, however, that this paper does not attempt to contribute to ongoing theoretical debates regarding motives behind outsourcing or external collaboration (see Howells et al., 2008). Instead, the focus of this study is empirical, exploratory, and descriptive. Even so, some of the findings may be of interest to R&D managers and/or students of industrial organizations. In particular, the study finds that R&D outsourcing is no longer as popular as it once was, regardless of firm size. It is also important to differentiate between outsourcing and collaboration from the outset, as outsourcing is driven primarily by the need for cost-containment, whereas collaboration is more strongly motivated by the need to access knowledge that cannot be readily generated via in-house investment. On this note, the remainder of our paper is organized as follows: The next section discusses the literature review on SMFs. Next describes the survey methodology and gives a descriptive snapshot of the main characteristics of the sample followed by the results of the survey firms on external collaboration and assess the contribution of these linkages to the product development process. Following this section, we describe the current outsourcing patterns of SMFs as compared to ten years ago. This paper concludes with a brief discussion of the implications of the survey results, research limitations, and future research. LITERATURE REVIEW Evidence dating back to the 1960s dictates that SMFs can enhance their technological skills by outsourcing specialized work such as product innovation to external experts. (Sen, 2007). Specific literature on this subject further indicates that internal resources are best allocated to the core competencies that match the firms existing skills, whereas non-core competencies are better handled by external firms (Sen and MacPherson, 2009). The notion that external alliances can augment the competitive advantage of small and medium-sized firms is well documented in literature (DeJong and Marsili, 2006). Increasingly, outsourcing has evolved as a common practice in the global economy (Hitt et al. 2000) and firms have been outsourcing their non-core activities of their operation to both domestic and foreign firms in order to focus on their core competencies which will provide these firms with a stronger source of competitive advantage (Lei et. al. 1992). However, these SMFs have limited knowledge and experience in outsourcing (Murray and Kotabe, 1999). Outsourcing as defined by Gilley and Rasheed (2000) is the purchase from an external supplier of a value creating activity that the outsourcing firm could have done in-house. This concept is derived from Ricardo’s (1817) Law of Comparative Advantage in which he indicates that the value of the entire economy would significantly increase if firms would focus on the activities in which they have a relative comparative advantage while outsourcing the activities to those providers who had the relative comparative advantage in performing and delivering those activities. Much of the literature on outsourcing is either conceptual or anecdotal and has focused primarily on the larger firms (Alvarez and Barney, 2001). Such external linkages to access specialized knowledge and other operational activities
62

INTERNATIONAL JOURNAL OF MANAGEMENT AND MARKETING RESEARCH ♦Volume 4 ♦ Number 1 ♦ 2011
have become increasingly common among larger companies (Howells et al. 2008); Lane and Probert, 2007). For several decades, outsourcing has been implemented primarily for cost-containment, but recent evidence suggests SMFs are not outsourcing to access knowledge, expertise, and technology (Sen, 2009). For small firms, the decision to engage networks of external partners is rarely a simple make-or-buy decision (MacPherson, 1997). Instead, the decision is typically powered by shear necessity because in-house resources are fully stretched. Moreover, SMFs need to combine multiple strengths of expertise’s for any given product development initiative (Freel, 2006) – rendering the need for external collaboration quite critical. Among SMFs that operate in knowledge-intensive industries, the resource-based perspective on external sourcing offers a more powerful explanation for collaborative activity then the transactions-cost approach (Vanchan, 2006; Yasuda, 2004). A common dominator across recent studies is that SMFs must develop external partnerships or collaborative arrangements in order to bring new products to the marketplace. Such arrangements often involve intricate layers of intermediaries to broker information (Howells, 2006), giving rise to complex networks that are not always easy to manage (Britton, 2003). DATA AND METHDOLOGY Obtaining systematic information from small and medium-sized firms is a major challenge for researchers because of lack of updated contact information. Past experience has showed that SMFs are reluctant to respond to mail surveys because of time constraints faced by a typical SMF owner/manager. Other obstacle may include the respondents lack of understanding and interpretation of terminology used in the questionnaire. Because of these limitations, a telephone survey was launched to collect data from 100 small and medium-sized manufacturing firms. For this study, SMFs were classified as firms with less than 500 employees (small firms were defined as having 1-50 employees, whereas medium-sized firms were allocated to the 51-100 employee class). In a preliminary effort to contact manufacturing firms, a telephone survey was conducted with owners of 100 manufacturing firms located in Erie and Niagara counties in New York State While the survey data are restricted to two counties in New York state (leaving the analysis rather limited in terms of geographical scope), the data suggest potentially useful directions for additional empirical work at an expanded geographical scale. The survey instrument was pre-tested with a pilot study of 25 firms during June, 2009. The results and feedback from the pilot study were used to design the final survey instrument. Telephone interviews were then conducted by professional trained interviewers utilizing the Computer Aided Telephone Interviewing (CATI) system and by computer-assisted random sampling. After three attempts, 76 usable responses were received (yielding an initial response rate of 19%). In order to achieve a higher response rate three more attempts were made to reach the remaining firms, yielding another 24 additional completed surveys (giving a final response rate of 25%). Although response rates of approximately 25% is common in survey research that focuses on business establishments, our 25% rate was disappointing in light of the potential salience of the study to the target firms. Nevertheless, t-tests comparing early (n=76) versus late respondents (n=24) failed to uncover statistically significant differences between the two groups in terms of critical variables such as export intensity, R&D intensity, levels of outsourcing, and collaboration. This said, we concede that a 25% response rate is insufficient to offer conclusive findings. Instead, our results should be treated as suggestive only.
63

A. K. Sen, K. Haq | IJMMR ♦ Vol. 4 ♦ No. 1 ♦ 2011
RESULTS External Collaboration Patterns of external collaboration across the two size-classes of firms are shown in Table 1. The results indicate that the medium-sized firms utilize external partners both in the patent and product development stages to a greater extent then their smaller counterparts. The results also indicate that 63 percent of the medium-sized firms obtained their patents in collaboration with an external partner as compared to 38 percent of the smaller firms. The results were quite similar for both sized firms in terms of new product development (see Table 1). Collaboration with an external partner is similar for both new product development and patents. Tables 2 and 3 also suggest that external collaboration is not correlated with either of the two innovation measures, and this holds true for both size-classes of firms. This might explain, at least partially, while levels of R&D outsourcing have not significantly increased over time. Although there are benefits to external collaboration as discussed in previous sections, these benefits do not seem to translate to superior innovation performance. Table 1: Size of Firm by the Incidence of External Collaboration
Small Medium All Patent Collaboration Yes 18 (38) 22 (63) 40 (48) No 29 (62) 13 (37) 42 (52) Total 47 (100) 35 (100) 82 (100) Chi-square = 1.092 (p = .463) Product Collaboration Yes 14 (45) 15 (65) 29 (54) No 17 (55) 8 (35) 25 (46) Total 31 (100) 23 (100) 54 (100) Chi-square = 1.226 (p = .372)
This table shows external collaboration of patent and product development by size of firm Table 2: Correlation of Product Innovation and External Collaboration
Small Medium All r p r p r p New product collaboration -.078 .667 0.85 .726 -.033 .714
This table shows the correlation between product innovation and external collaboration. Table 3: Correlation of Patent Approvals and External Collaboration
Small Medium All r p r p r p Patent collaboration .136 .412 -.046 .753 -0.19 .787
This table shows the correlation between patent approvals and external collaboration. As shown in Table 4, the collaborative strategies result from different purposes and are initiated by different entities. Both small and medium-sized firms indicate that the three most important reasons why their firm utilizes external partners for product innovation are to … 1) access distribution network, 2) access manufacturing and facility, and 3) lower their manufacturing and production costs. The medium-sized firms consider lowering manufacturing and production cost to be more important than the smaller firms. Medium-sized firms are also more likely than their smaller counterparts to collaborate with external partners for new product development and processes and to access R&D expertise and scientific know how.
64

INTERNATIONAL JOURNAL OF MANAGEMENT AND MARKETING RESEARCH ♦Volume 4 ♦ Number 1 ♦ 2011
Table 4: Importance of External Partners for Product Innovation
IMPORTANT Small Medium All
Access distribution network 45% 42% 44% Access manufacturing/facility 35 46 39 Lower manufacturing/production cost 25 49 33 Access R&D expertise/scientific know how 5 20 10 Develop new products or processes 2 26 10 Extend range of candidates in pipeline 5 14 8 Manage federal regulation 3 12 7 Manage risk in production 4 15 7 Manage risk in R&D 1 9 4
This table shows the importance of various factors for using external partners for product innovation OUTSOURCING The findings also shed a light on the activities of SMFs with respect to five dimensions of outsourcing. These dimensions include R&D, product development, manufacturing, marketing, and distribution. Respondents were asked to estimate their current outsourced percentage of the total budget compared to that of ten years ago for each of the five categories. For the combined sample, outsourcing levels increased in all the five categories. In the case of manufacturing, for instance, outsourcing levels increased from an average of 8.7% in 1999 to 13.4% in 2009 (a 54% increase). Similarly, for marketing, outsourcing increased from 3.7% in 1999 to 23.2% in 2009. (see Table 5). It is no surprise, that most of the firms outsource on these dimensions as much as possible (to constrain costs) and that the outsourcing trend is systematically upward, especially for medium-sized firms. Data presented elsewhere show that cost minimization is the key driver in this respect as few companies want to internalize these activities (Sen and Haq 2010). The distribution dimension also shows an upward trend, and again this is primarily cost driven. In contrast, research or knowledge based activities have remained stable and appear to be migrating back toward the in-house domain. In the case of research, for example, outsourcing levels increased from 6.6% in 1999 to only 7.4% in 2009. With regard to outsourcing patterns by firm size, Table 4 suggests that the medium-sized firms outsource more of the non-core activities as compared to the smaller firms, while the smaller firms outsource research and product development (core competencies) more than the medium-sized firms. Table 5: Outsourcing Trends: Current vs. Ten Years Ago
Firm Size Sample Mean Small Medium ANOVA
% % % Research: Current 7.4 9.0 6.6 .117 10 years ago 6.6 10.0 5.5 .123 Product Development: Current 4.3 7.5 3.7 .030 10 years ago 2.3 5.0 1.8 .291 Manufacturing/Production: Current 13.4 11.3 16.5 .128 10 years ago 8.7 8.9 8.4 .439 Marketing/Sales: Current 23.2 5.0 35.3 .069 10 years ago 3.7 5.0 1.0 .392 Distribution: Current 16.2 10.3 26.9 .345 10 years ago 12.0 8.7 17.3 .029
This table shows outsourcing of R&D, product development, manufacturing/production, marketing/sales, and distribution currently and 10 years ago
65

A. K. Sen, K. Haq | IJMMR ♦ Vol. 4 ♦ No. 1 ♦ 2011
The firms were also asked to estimate their outsourcing related savings across all of the outsourcing categories. A fourth (26%) of our respondents stated that outsourcing did not result in any cost savings. Again, the results indicate that medium-sized firms are different than their smaller firm counterparts. While 40% of the medium-sized firms achieved outsourcing related cost savings in the range of 6-20% , the smaller firms achieved only 29% during the same time period. Though not statistically significant, there is at least some evidence from Table 6 that medium-sized firms are more adept at managing the outsourcing relationship than the smaller firms. It should be clear to the SMFs that outsourcing should be considered as a complement to the firms’ core and non-core competencies rather than a substitute strategy. Strategic outsourcing is not a panacea for whatever ails the company. Rather, it is a sophisticated approach to the strategic use of non-core business functions. Table 6: Savings Realized from Outsourcing
Size of Firm Savings Realized Total Sample % Small % Medium %
None 25.9 26.3 25.0 1 - 5% 22.4 26.3 15.0 6 – 10% 17.2 18.4 15.0 11 – 15% 12.1 10.5 15.0 16 – 20% 3.4 - 10.0 >20% 19.0 18.5 20.0
This table presents the monetary savings firms have realized from outsourcing CONCLUDING COMMENTS In this paper, we have attempted to understand how small and medium-sized manufacturing firms have employed outsourcing and collaboration in an effort to combat declining product pipelines and patented product portfolios. We also focus on the role of external collaboration and outsourcing in the small and medium sized firms and the relationship between innovation and collaboration. The empirical portion of this paper was based on a telephone survey of 100 small and medium manufacturing firms located in Erie and Niagara counties in New York State. Based on the results of the study, the following findings may be summarized. First, both small and medium-sized firms utilize external partners for product and patent development. However, medium-sized firms engage external partners more than their smaller counterparts. Secondly, outsourcing of all five categories has increased from ten years ago. However, outsourcing activities of non-core activities has increased at a faster pace primarily to lower production costs. The primary reason for this trend is cost minimization, and increasingly, fewer and fewer SMFs wish to perform these activities in-house. Finally, approximately 25% of the firms did not realize any cost savings from outsourcing. The data also suggests that medium-sized firms achieve a higher cost savings than smaller firms, probably because they have more control and appear to manage their outsourcing relationships more efficiently. The outsourcing of non-core activities such as distribution, manufacturing, and marketing is likely to increase over time, though the same cannot be stated for the core competency function such as research and development. We also state that R&D and product development outsourcing will continue to grow but firms will be more selective by utilizing firms that have a proven track record. Finally, this study has offered an exploratory review of a topic that has attracted significant attention in the recent academic literature on SMFs and outsourcing activities within the manufacturing sector. Caution should be taken in generalizing the results of this study because this study is subject to several limitations. The three major limitations are: 1) sample size, 2) low response rate, 3) limited geographic scope. The first limitation concerns the small sample size used in this study. Data was collected utilizing a sub-sample instead of the total population because of our limited budget. We could not afford to survey
66

INTERNATIONAL JOURNAL OF MANAGEMENT AND MARKETING RESEARCH ♦Volume 4 ♦ Number 1 ♦ 2011
more than 40% of the population. A second weakness of the study is the low response rate of 25%. Usually a 20% or lower response rate in survey research with business establishments is quite common. Nevertheless, our response rate of 25% is insufficient to provide conclusive findings, and thus the results should be treated as suggestive only. Finally, the sample was selected from Western New York and thus limited in geographic scope. A goal of this exploratory study was to point in the direction of new research opportunities. In addition to the research questions reviewed in this study, we believe considerable opportunities exist for further empirical research to extend the current analysis to determine if R&D outsourcing is a thing of the past not only with small and medium sized manufacturing firms but other high-tech industries and larger firms which should yield additional important insights. Future research on the motive of R&D outsourcing and collaboration should specifically examine the relationship between innovation and collaboration and innovation outsourcing and to what extent do they support innovation. APPENDIX
Survey of Internationalization of Small and Medium-Sized Manufacturing Enterprises in The Buffalo/Niagara Region
Confidentiality Statement: There are no anticipated risks to participation in this research. Your summary results will be held in strict confidence. No identifiable reference will be made to any person or establishment, and only combined results will be reported in this research project. Please answer the questions below and return the survey in the stamped, addressed envelope. Most questions ask for rough estimates only, or yes/no answers. Skip any items that you feel uncomfortable with. Feel free to add written comments at any point. Section A: Company Characteristics 1. How long has your establishment been manufacturing in Buffalo/Niagara region? 1 – 5 years 11 – 20 years 6 – 10 years More than 20 years 2. Is your establishment wholly United States owned? Yes No Country of ownership? __________________________________ 2a. Your headquarter location:_______________________________________________ 3. Please describe your most important product line? __________________________ SIC: _____ 4. What was your establishment’s total sale in 2008? Below $1 million $21 - $50 million $1 - $5 million $51 - $100 million $6 - $10 million Over $100 million $11 - $20 million 5. The total number of employees are: (CHECK ONE BOX ONLY) Less than 10 26 – 50 101-500 11-25 51-100 More than 500 6. In a typical operating year, roughly what percentage (%) of your establishment’s total sales go toward research and development
(R&D) activity? __________ % Section B: Export Markets 7. Do you export? Yes No Plan to export in the future 8. How familiar are you with Government Export Assistance program? Extremely familiar Not very familiar Very familiar Not at all familiar Some what familiar 9. Have you ever used any type of Government Export Assistance? Yes No
67

A. K. Sen, K. Haq | IJMMR ♦ Vol. 4 ♦ No. 1 ♦ 2011
10. If “Yes” to Government Export Assistance…How effective was the Government Export Assistance to your business? Extremely effective Not very effective Very effective Not at all effective Some what effective 11. Over the last 5 years, how would you rank your establishment’s annual growth performance over the categories listed below? (CHECK ONE BOX PER CATEGORY)
Average annual growth rate (percentage) Category Below 1% 1 – 5% 5.1 – 10% 10.1 – 15% 15%+ Total sales Export sales R&D spending
12. In a typical operating year, roughly what percentage (%) of your establishment’s total sales come from export markets? __________ % 13. If you currently have export markets, please specify and rank the top 3 destinations. Also indicate where you expect to see the best export prospects over the next 5 years. (If you do NOT currently export, but wish to do so soon, please indicate where you want to export to). Current Export Markets Export Earnings Best Export Prospects (% of total sales) 1. ______________________________ ________% ___________________________ 2. ______________________________ ________% ___________________________ 3. ______________________________ ________% ___________________________ 14. What are the barriers in exporting to the foreign market? If you have actually exported, please answer in regard to the actual obstacles faced. If you are currently attempting to export or are not interested in exporting, please answer in regard to the perceived obstacles faced. (PLEASE RATE YOUR RESPONSES AS PER THE FOLLOWNG SCALE, CHECK ONE BOX PER LINE).
1=No barrier 2= Minor barrier 3= Moderate barrier 4= Above moderate barrier 5= Major barrier 1 2 3 4 5 Size of your firm Financial requirements Willingness to take risk Lack of in-house expertise Management time requirements Cultural differences Licensing requirements Immigration issues Strong domestic competition Out-dated plant and equipment Employee recruitment difficulties Rising costs of production inputs Government controls/regulations Declining demand for product Lack of operating capital Shortage of production materials Strong competition from foreign producers Other Please specify: _______________ SECTION C: Innovation 15a. Please indicate a rough estimate of patents and products your company has achieved over the past 7 years (or the period from
company inception to present, if less than 7 years). US patent approvals: ______ New Products: ______ 15b. What portion of these patents were developed in collaboration with an external partner? _____ %
What portion of these products were developed in collaboration with an external partner? _____%
68

INTERNATIONAL JOURNAL OF MANAGEMENT AND MARKETING RESEARCH ♦Volume 4 ♦ Number 1 ♦ 2011
16. Please indicate the importance of the following reasons for outsourcing your product innovation. (Using a number from the scale in the box below, check √ one box per factor)
1=not important 2=minor importance 3=moderate importance 4=very important 5=critically important
FACTORS 1 2 3 4 5
a. Access R&D expertise/scientific know how □ □ □ □ □ b. Develop new products or processes □ □ □ □ □ c. Extend range of candidates in pipeline □ □ □ □ □ d. Access manufacturing /facility □ □ □ □ □ e. Lower manufacturing/production cost □ □ □ □ □ f. Manage Federal regulation □ □ □ □ □ g. Access distribution network □ □ □ □ □ h. Manage risk in R&D □ □ □ □ □ i. Manage risk in production □ □ □ □ □ SECTION D: Outsourcing 17. What percentage of the total budget for each of the following areas is used for outsourcing? (The term “outsourcing” refers to
payments to another firm for services that your company may otherwise perform in-house) 18. What percentage of the total budget was used for outsourcing 10 years ago (or the period from company inception to present, if less
than 10 years)? % Budget Used in Outsourcing 10 years ago Research & Development ___% ___% Product development ___% ___%
Manufacturing/production ___% ___% Marketing/sales ___% ___%
Distribution ___% ___% Other-> SPECIFY:_____________ ___% ___% (IF YOU OUTSOURCE R&D: PLEASE ANSWER Q.19A – Q.19D) 19a. Do you outsource to domestic or foreign firms? □ Domestic □ Foreign □ Both 19b. If “Foreign”, please specify the top 2 countries: 1)__________________ 2) _________________
If “Domestic”, is the firm located within your state or elsewhere in the United States: 1) ___ Within State 2) ___ Elsewhere in the US
If “Elsewhere in US”, please give the most important reason for choosing a firm in another state:
________________________________________________________________________ 19c. Please indicate the two primary reasons involved in outsourcing your R&D activities in order of
importance?
1. ______________________________ 2. ___________________________________ 19d. Please indicate the two primary risk factors involved in outsourcing your R&D activities in order of importance?
1. ______________________________ 2. ___________________________________ (IF YOU OUTSOURCE YOUR PRODUCT DEVELOPMENT: PLEASE ANSWER Q20A – Q20D) 20a. Do you outsource to domestic or foreign firms? □ Domestic □ Foreign □ Both 20b. If “Foreign”, please specify the top 2 countries: 1) _______________ 2) _________________
If “Domestic”, is the firm located within your state or elsewhere in United States: 1) ___ Within State 2) ___ Elsewhere in the US
If “Elsewhere in US”, please give the most important reason for choosing a firm in another state:
________________________________________________________________________
20c. Please indicate the two primary reasons involved in outsourcing your manufacturing activities in order of importance?
1. ______________________________ 2. ___________________________________
69
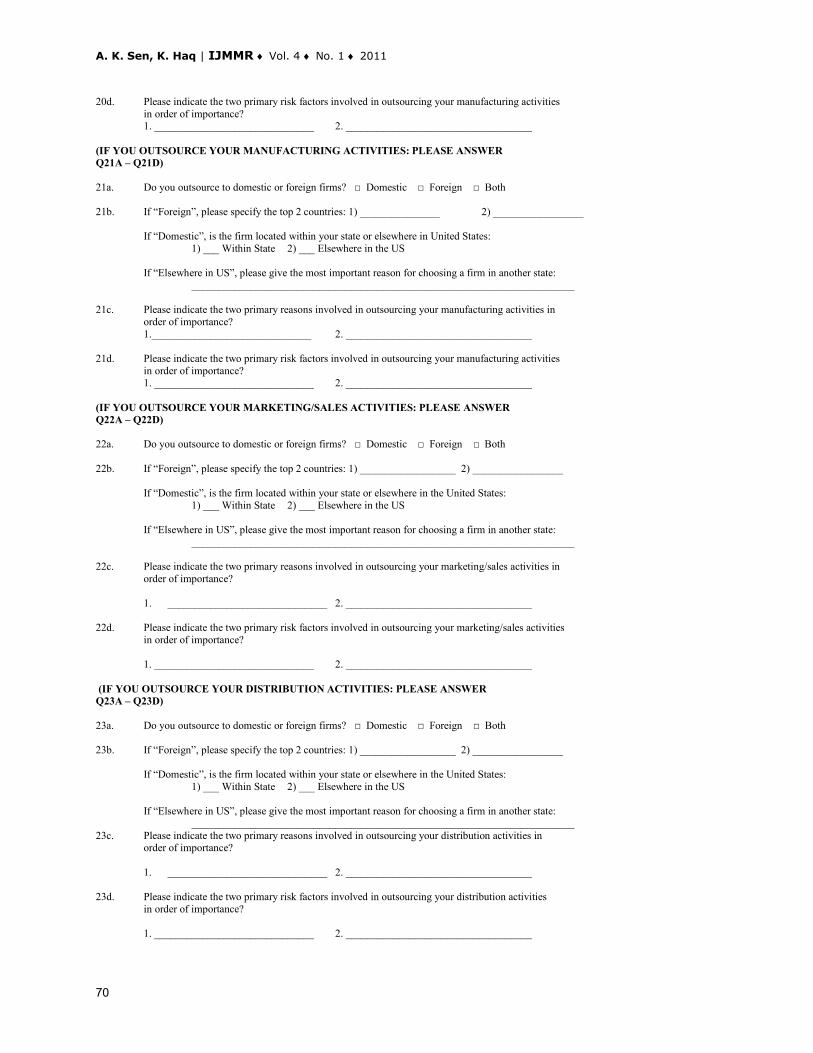
A. K. Sen, K. Haq | IJMMR ♦ Vol. 4 ♦ No. 1 ♦ 2011
20d. Please indicate the two primary risk factors involved in outsourcing your manufacturing activities in order of importance?
1. ______________________________ 2. ___________________________________ (IF YOU OUTSOURCE YOUR MANUFACTURING ACTIVITIES: PLEASE ANSWER Q21A – Q21D) 21a. Do you outsource to domestic or foreign firms? □ Domestic □ Foreign □ Both 21b. If “Foreign”, please specify the top 2 countries: 1) _______________ 2) _________________
If “Domestic”, is the firm located within your state or elsewhere in United States: 1) ___ Within State 2) ___ Elsewhere in the US
If “Elsewhere in US”, please give the most important reason for choosing a firm in another state:
________________________________________________________________________
21c. Please indicate the two primary reasons involved in outsourcing your manufacturing activities in order of importance?
1.______________________________ 2. ___________________________________ 21d. Please indicate the two primary risk factors involved in outsourcing your manufacturing activities in order of importance?
1. ______________________________ 2. ___________________________________ (IF YOU OUTSOURCE YOUR MARKETING/SALES ACTIVITIES: PLEASE ANSWER Q22A – Q22D) 22a. Do you outsource to domestic or foreign firms? □ Domestic □ Foreign □ Both 22b. If “Foreign”, please specify the top 2 countries: 1) __________________ 2) _________________
If “Domestic”, is the firm located within your state or elsewhere in the United States: 1) ___ Within State 2) ___ Elsewhere in the US
If “Elsewhere in US”, please give the most important reason for choosing a firm in another state:
________________________________________________________________________ 22c. Please indicate the two primary reasons involved in outsourcing your marketing/sales activities in order of importance?
1. ______________________________ 2. ___________________________________ 22d. Please indicate the two primary risk factors involved in outsourcing your marketing/sales activities in order of importance?
1. ______________________________ 2. ___________________________________ (IF YOU OUTSOURCE YOUR DISTRIBUTION ACTIVITIES: PLEASE ANSWER Q23A – Q23D) 23a. Do you outsource to domestic or foreign firms? □ Domestic □ Foreign □ Both 23b. If “Foreign”, please specify the top 2 countries: 1) __________________ 2) _________________
If “Domestic”, is the firm located within your state or elsewhere in the United States: 1) ___ Within State 2) ___ Elsewhere in the US
If “Elsewhere in US”, please give the most important reason for choosing a firm in another state:
________________________________________________________________________ 23c. Please indicate the two primary reasons involved in outsourcing your distribution activities in order of importance?
1. ______________________________ 2. ___________________________________ 23d. Please indicate the two primary risk factors involved in outsourcing your distribution activities in order of importance?
1. ______________________________ 2. ___________________________________
70

INTERNATIONAL JOURNAL OF MANAGEMENT AND MARKETING RESEARCH ♦Volume 4 ♦ Number 1 ♦ 2011
24. Approximately, what monetary savings on average have you realized from outsourcing: □ None □ 1 – 5 % □ 6 – 10% □ 11 – 15% □ 16 – 20% □ >20% 25. Please rate the importance of the sources of outside advice to your company (some agreement being formal, requiring a fee payment
and others may be informal, not requiring any financial payment) to your firm’s business. (Using a number from the scale in the box below, check √ one box per factor)
1=not important 2=minor importance 3=moderate importance 4=very important 5=critically important
SERVICES 1 2 3 4 5
a. Marketing consulting/research □ □ □ □ □ b. Advertising/Public relations □ □ □ □ □ c. Teaching and research hospitals □ □ □ □ □ d. University research departments □ □ □ □ □ e. Competitors □ □ □ □ □ f. Local government agencies □ □ □ □ □ g. Federal agencies □ □ □ □ □ h. Non government agencies □ □ □ □ □ i. Local networks of business associates □ □ □ □ □ j. Customers/users □ □ □ □ □ k. Suppliers □ □ □ □ □ 26. How would you describe the competitive problems facing your establishment? (RANK THE FOLLOWING CATEGORIES
FROM A LOW OF “1” (NOT A PROBLEM) TO “5” (A SEVER PROBLEM). CHECK THE BOX THAT BEST DESCRIBES YOUR POSITION FOR EACH STATEMENT).
1 2 3 4 5 Foreign imports Local taxes State taxes Federal taxes Finding good labor U.S. competitors Access to capital Foreign trade barriers Federal regulations Local business services Other Specify: ______________ Thank you very much for your help in this survey. We appreciate your time and effort. If you would like a copy of our summary report, please provide your mailing address. I would like to receive a summary report: Company name: ______________________________________________________________ Address: ____________________________________________________________________ City: ____________________ State: _______ Zip: __________________________________ Telephone number: ____________________________________________________________ Fax number: __________________________________________________________________ Name of respondent: ___________________________________________________________ Title: _______________________________________________________________________ If you have any further questions about this survey, please contact: Dr. Kushnood Haq Dr. Arup Sen 320 Porter Avenue 320 Porter Avenue Buffalo, NY 14201 Buffalo, NY 14201 716-829-8123 716-829-7658 E-mail: [email protected] E-mail: [email protected] The research study has been reviewed and approved by the Institutional Review Board of D’Youville College.
1=Not a problem 2=Minor problem 3=Moderate problem 4=Important problem 5=Severe problem
71

A. K. Sen, K. Haq | IJMMR ♦ Vol. 4 ♦ No. 1 ♦ 2011
REFERENCES Alvarez, S.A. and Barney, J.B. (2001) Hoe entrepreneurial firms can benefit from alliances with large partners, Academy of Management Executive, 15 (1): 139-148. Baum, J.A.C., Calabrese, T. and Silverman, B.S. (2000) ‘Don’t go it alone: alliance network composition and startups’ performance in Canadian biotechnology, Strategic Management Journal, Vol. 21, No. 3, pp. 267-294. Britton, J.N. H., (2003) Network structure of an industrial cluster: electronics in Toronto. Environment and Planning (A), 35; 983-1006. DeJong, J.P.L., and O. Marsili, (2006) The fruit flies of innovation: A taxonomy of innovative small firms, Research Policy, 35: 213-229. Duysters, G., Kok, G., Vaandrager, M., 1999 Crafting successful strategic partnerships, R&D Management 29, 343-351. Freel, M. (2006) Patterns of technological innovation in knowledge intensive business services. Industry and Innovation, 13: 335-358. Gilley, K.M. and Rasheed, A. (2000) Marketing more by doing less: Analysis of outsourcing and its effects on firm performance, Journal of Management, 26: 763-790. Hagedoorn, J., 2002 Inter-firm R&D partnerships-an overview of patterns and trends since 1960, Research Policy 31, 477-492. Hagedoorn, J. 2002 Inter-firm R&D partnerships: an overview of major trends and patterns since 1960. Research Policy, V. 31, pp. 477-492. Hitt, M.A., Ireland, R.D., and Hoskisson, R.E. (2000) Strategic Management: Competitiveness and Globalization (4th Ed.) St. Paul, MN West Publishing. Howells, J., (2006) Intermediation and the role of intermediaries in innovation. Research Policy, 35: 715-728. Howells, J., Gagliardi, D. and Malik, K. (2008) The growth and management of R&D outsourcing: evidence from UK pharmaceuticals. R&D Management, 38: 205-219. Lane, C., and Probert, J., 2007 The external sourcing of technological knowledge by U.S. pharmaceutical companies: Strategic goals and inter-organizational relationships, Industry and Innovation. V. 14, No. 1, pp. 5-25. Lei, D., Hitt, M.A. and Bettis, R. (1996) Dynamic core competencies through meta-learning and strategic context, Journal of Management, 22 (4): 549-569. MacPherson, A. (1997) The contribution of producer service outsourcing to the innovation performance of New York State manufacturing firms. Annals of the Association of American Geographers, 87: 52-71. Murray, J.Y. and Kotabe, M. (1999) Sourcing strategies of U.S. service companies: A modified transaction-cost analysis, Strategic Management Journal, 20: 791-809.
72

INTERNATIONAL JOURNAL OF MANAGEMENT AND MARKETING RESEARCH ♦Volume 4 ♦ Number 1 ♦ 2011
Narula, R., 2002 R&D collaboration by SMEs: some analytical issues and evidence in: Contractor, F., Lorange, P. (Eds.), Cooperative Strategies and Alliances, Pergamon Press. Powell, W.W., Koput, K.W. and Smith-Doerr, L. (1996) ‘Interorganisational collaboration and the locus of innovation: networks of learning in biotechnology’, Administrative Science Quarterly, Vol. 41, No. 1, pp. 116-146. Sen, A.K. (2009) Outsourcing of research and development activities: Evidence from U.S. biopharmaceutical firms, Global Journal of Business Research, Vol. 3 No. 73-82. Sen,A.K. and Haq,K, (2010) Internationalization of SMEs: opportunities and limitations in the age of globalization, International Business & Economics Research Journal Sen, A.K. and MacPherson, A., (2009) Outsourcing, external collaboration, and innovation among U.S. firms in the biopharmaceutical industry, The Industrial Geographer, Vol. 6 Issue 1: 20-36. Staropoli, C. (1998) ‘Cooperation in R&D in the pharmaceutical industry – the network as an organizational innovation governing technological innovation’, Technovation, Vol. 18, No. 1, pp. 13-23. Tidd, J., Trewhella, M., 1997 Organizational and technological antecedents for knowledge creation and learning, R&D Management 27, 359-375. Vanchan, V. and MacPherson, A., (2007) The growth performance of U.S. firms in the industrial design sector; and exploratory study. Industry and Innovation, 37: 219-231. Yasuda, H. (2005) Formation of strategic alliances in high technology industries: Comparative study of the resourced based theory and the transaction-cost theory. Technovation, 25: 763-770. AUTHOR BIOGRAPHY Dr. Arup K. Sen, is the Chair of the Business Department at D’Youville College, Buffalo, N.Y. with responsibility for program development, enrollment and retention, and managing the daily operations of the Business Department. He also serves as the Director of the Graduate Business and Advance Programs. Prior to joining D’Youville, College in 2002, Dr. Sen served as a faculty in the School of Management at The University at Buffalo for 18 years. He received his Bachelors degree in Accounting from Hampton University, Masters in Marketing from Virginia Commonwealth University and Ph.D. in International Trade from The University at Buffalo. Dr. Sen’s research interests involve internationalization, outsourcing, and collaboration of core and non-core activities of small and medium sized firms. Dr. Arup Sen can be contacted at D’Youville, College 320 Porter Avenue, Buffalo, NY 14201, Email: [email protected] Dr. Kushnood Haq is the Vice President of Academic Affairs at D’Youville College, Bachelors in Management from Canisius College, his MBA from St. Bonaventure University and his Ph.D. in International Trade from The University at Buffalo. Dr. Haq’s research interests involve internationalization of higher education, foreign direct investment, and export activities of small and medium sized firms. Dr. Kushnood Haq can be contacted at D’Youville, College 320 Porter Avenue, Buffalo, NY 14201, Email: [email protected]
73


INTERNATIONAL JOURNAL OF MANAGEMENT AND MARKETING RESEARCH ♦Volume 4 ♦ Number 1 ♦ 2011
MOBILE ADVERTISING ENGINE FOR CENTRALIZED MOBILE COUPON DELIVERY
Jeffrey Wray, Stetson University, USA Daniel Plante, Stetson University, USA
ABSTRACT
During the past decade, the preferred medium for advertising has seen a dramatic shift away from print media and other traditional means of distribution. In 2009 alone, it is estimated that advertising spending dropped by between 10 and 20 percent for newspapers, consumer magazines, radio, and television while increasing an estimated 9.2 and 18.1 percent in Internet and mobile advertising respectively. Driven by the high cost of print media, lower redemption rates on print coupons, and correspondingly higher redemption rates for mobile and Internet coupons, companies are beginning to adopt and develop mobile campaign management strategies to adapt to the changing market. However, presently the majority of mobile and Internet campaign management platforms are developed on a merchant-by-merchant basis. Customers must either download a separate mobile phone app or visit and register at a different web site for each merchant to obtain their coupons. In this paper, we present a more centralized coupon distribution approach using a Mobile Advertising Engine that aggregates coupons from multiple corporations, tracks point of sales redemption, and reports campaign effectiveness using a mobile marketing and reporting platform. JEL: M3; O3 KEYWORDS: Marketing, technologies INTRODUCTION
e are living in an increasingly “smarter” mobile world. As will be shown in the next section, recent trends indicate that smartphone sales are on the rise, traditional forms of media (e.g. newspaper, magazines, and radio) are on the decline, users are becoming increasingly
comfortable with accessing information and making purchases with their smartphones, and most major brands are moving towards mobile marketing. If the projected growth in mobile smartphone adoption and usage is realized, along with the expected increase in mobile marketing by businesses, care must be taken to provide customers with a superior user experience. With respect to mobile coupon delivery, which is the focus of this paper, providing the most appropriate coupons at the most appropriate times, and only in the quantity desired by the consumer, is vital to achieving this goal. As more businesses move toward mobile marketing and couponing on a per-brand basis, a major issue arises; for consumers to take advantage of each brand’s coupons and offers, they must access each via a separate mobile web site or mobile application (or app). The users’ experiences are tarnished as they log on and register for each different site or download yet another app onto their phones, completing yet another registration in doing so. Likewise, each time they wish to search for coupons, compare offers, or redeem a coupon, they must access separate sites or apps to do so for different brands or merchants. Instead, should many brands and merchant coupons be accessible via a single app or mobile site at times when the users need them, consumer satisfaction should increase. Also, marketing programs must be able to target individualized preferences and behaviors and be able to measure the return on investment (ROI). With traditional marketing, companies target their advertising to broad geographic areas with a wide variety of demographics. There is no way of determining the effectiveness of the specific advertisement on a specific demographic.
W
75

J. Wray, D. Plante | IJMMR ♦ Vol. 4 ♦ No. 1 ♦ 2011
In this paper, we present a framework that provides an effective solution for both the consumer and businesses. The Mobile Advertising Engine (MAE) integrates real-time campaign management, location intelligence, redemption and reporting into a web service that businesses can use to acquire new customers and increase overall customer loyalty. One of the primary qualities that separates this mobile advertising engine from other advertising methods is the MAE’s collective nature, namely that it aggregates all participating businesses and their coupons in one system. This attribute not only provides businesses the ability to obtain an accurate understanding of their customers’ purchasing patterns and the ability to target different audiences based upon their location and redemption history, it implicitly provides a new channel for helping customers find merchants when they are most in need of their products and services. Another critical component to the MAE framework is that it provides customers with the ability to opt-in only to the brands of their choice and to opt-out of any or all brands should they choose to. In the next section, we provide a literature review detailing why the present trends indicate a robust environment for mobile marketing and coupon delivery. In the subsequent section, we describe the MAE framework and its interfaces to the consumer and merchants. In the final section, we conclude by outlining the limitations of the present work and provide suggestions for future research. LITERATURE REVIEW In its annual report on mobile phone and smartphone market shares, the Garter Group estimated that last year 172 million smartphones were sold worldwide, up 24 percent over 2008, while total mobile phone sales were flat at 1.2 billion (Schonfeld, 2010a). By April 2010, 85 percent of all mobile web traffic in the U.S. was delivered to and from Apple and Google Android smartphones (Wimberly, 2010), and Coda Research Consultancy projects that mobile data traffic is expected to rise 40-fold between now and 2015 (Schonfeld, 2010b). Banking on a surge in mobile advertising via smartphones, this year Google acquired AdMob for $750 million (Shields, 2010) and Apple acquired Quattro Wireless for $275 million (Kincaid, 2010), the two leading mobile advertising companies in the U.S. Also, CTIA, the International Association for the Wireless Telecommunications, released the results of its semi-annual survey on the wireless industry (CTIA, 2010). Some results from this survey included: more than 1.5 trillion SMS text messages were sent in 2009 compared to 363 billion in 2007, a four-fold increase; more than 24.2 billion MMS messages were reported in the last half of 2009, more than double the 9.3 billion sent in the last half of 2008. Research also indicates that consumers appear to be becoming more comfortable with using smartphones for on-line banking and purchasing. According to a study conducted by the market research firm Data Innovation Inc., from a survey of 246 smartphone users, nearly 70 percent of those respondents used mobile banking and/or payment service in the previous three months (Butcher, 2010). Presenting the results of its quarterly Smartphone Intelligence survey, Compete, a Kantar Media company, found that customers are relatively comfortable with m-commerce, with 37 percent purchasing non-mobile items, 19 percent purchasing music, and 41 percent of iPhone and 43 percent of Android phone users checking sale prices at alternative locations from their handset during the previous six months (Compete, 2009). At the same time, our access to some traditional media, such as newspapers and radio, is sharply declining (Perez-Pena, 2008; Fisher, 2008). Likewise, advertising spending as a whole is on the decline, down an estimated 7.6 percent in 2009 and anticipated to be another 1 percent drop in 2010 (Clifford, 2009), and those budgets are shifting away from traditional channels. As shown in Table 1, in 2009 the sharpest decreases in advertising budgets were in the traditional advertising segments: newspapers, consumer magazines, radio, and broadcast television. During the same period, however, correspondingly sharp increases in advertising budgets were found in the mobile and Internet segments. In 2006, the Mobile Marketing Association (MMA) published statistics indicating that 89% of major brands were planning to
76

INTERNATIONAL JOURNAL OF MANAGEMENT AND MARKETING RESEARCH ♦Volume 4 ♦ Number 1 ♦ 2011
market their goods via mobile phones by 2008 (MMA, 2006). In 2008, Juniper Research estimated that almost 3 billion mobile coupons will be issued to mobile phone users by 2011 with almost $7 billion of discounts redeemed (JR, 2008), and by 2014, the mobile retail market will exceed $12 billion (JR, 2010). While clearly in absolute dollars total advertising budgets in the traditional segments are still considerably larger than for mobile and the Internet, the trend towards more advertising in these latter segments is apparent. Also, while the intention of this paper is not to address where on the simplified S-curve mobile SMS or application adoption rests (Rogers, 1962), nor to predict future trends of such a diffusion model, it does assume that the present trend is more likely than not to continue, with greater adoption of mobile applications and mobile web applications inevitable. Table 1: Advertising Budgets 2009
Segment Percent Change ’08 to ‘09
Total Budget 2009 (in billions)
Newspapers -18.7 $35.5 Consumer Magazines -14.8 11 Radio -11.7 15.8 Broadcast Television -10.1 43.0 Mobile +18.1 1.3 Internet +9.2 23.8
Predictions in the Communications Industry Forecast from private equity firm Veronis Suhler Stevenson (Clifford, 2009) This dramatic change in advertising and mobile and smartphone usage provides merchants with new opportunities to reach out to new and existing customers in innovative ways, via SMS messaging, mobile applications, and mobile web sites. For example, mobile coupon redemption rates, which can reach levels as high as 20 percent, are also considerably higher than corresponding redemption rates for traditional paper coupons, which typically are between 1 and 2 percent, and even for those obtained via the Internet (Holmen, 2009; Lavallee, 2009). However, in the Data Innovation Inc. survey, it was also found that poor mobile site functionality often led mobile users to abandon a mobile purchase, with 45 percent abandoning the process due to the site not loading and 38 percent doing so because the site was not developed for smartphone users (Butcher, 2010). Also, issues of privacy and consumer interest in receiving mobile advertisement, both solicited and non-solicited, must be addressed. Some of these concerns have been extensively examined, and the Mobile Marketing Association has published its “Code of Conduct” that mobile marketers are expected to adhere to (MMA, 2008). However, well-designed and easy to use mobile web applications are still not pervasive. Businesses expecting to attract mobile users will need to cater to their expectations for application layout and design and ease of use if they intend to retain them as long-term clients. Also of importance for mobile marketers is the relevancy and timeliness of their advertisements (Gray, 2009). In particular, if customers opt-in to receive coupons, the likelihood of those coupons being relevant increases, and they are timely in that they are available when the customer needs them. This is especially true as more and more mobile phones become GPS-enabled and therefore location aware, allowing the consumer to find offers where they are when ready to use them. In such a dynamic environment, a major challenge for mobile marketers is to provide the most appropriate advertisements, coupons, or offers that their clients would find useful. Chiou-Wei and Inman (2008) investigated the drivers for electronic coupon redemption for five product categories during the period 2003-2005 and found that an increased distance between the customer and redemption location had a strong negative effect on redemption while expiration date did not. They also found that education and employment significantly influenced redemption rates for electronic coupons. These findings are consistent with those previously found by Steenkamp and Baumgartner (1992), namely that individuals who are highly educated and have higher income levels tend to engage in more exploratory information search behavior. Examining an extensive amount of consumer data over an extended period, Meyers and Litt (2008) found what they called the “sweet spot” in coupon redemption, namely when the coupon value and expiration
77

J. Wray, D. Plante | IJMMR ♦ Vol. 4 ♦ No. 1 ♦ 2011
length criteria sync, that drives higher coupon redemption rates. Also, from one of its studies, ABI Research found that 70 percent of mobile coupon redemptions came from the tech savvy 18 – 34 age demographic (Gray, 2009). MAE FRAMEWORK The MAE framework is comprised of five separate components: a web and mobile application for the consumer to access coupons from the content delivery system both from a web page and from a mobile phone; a web application for merchants to administer the campaign management system (CMS); a point-of-sales (POS) component to allow redemption of coupons at the merchants’ physical locations; a central administration web application used to control all aspects of the MAE, including adding, removing, and managing merchant and consumer accounts; and a back-end analytics and reporting engine to learn user patterns and provide coupon recommendations to consumers on a personalized basis. The server framework was developed using a middleware paradigm, with the fundamental middleware service of the MAE being the Core Services (CS). While other add-ons may be incorporated into the MAE, the fundamental services for the MAE system are: Location Based Services (LBS), Real-Time Redemption Services (RTRS), and Reporting Services (RS). The MAE prototype we developed was implemented using Ruby On Rails for the server and consumer’s web interface, MySQL for the database, and the W3C Geolocation API specification (Popescu, 2008) for the mobile solution. While in general, the MAE framework can support various forms of content, for example Voting, Calls to Action, and Surveys, our prototype presently only supports coupons. As such, we will focus on coupon offers for the remainder of this paper. The MAE workflow is provided in Figure 1. The process begins (Step 1) with a merchant developing a campaign for providing coupons to a targeted audience. All members of that audience have opted-in for the particular merchant developing the campaign, as merchants do not have access to accounts for consumers who have not opted in with them. The campaign is bounded by a start and stop date and time, and all coupons entered into the system for the campaign are stamped with expiration dates corresponding to the stop time for the campaign. The merchant also selects a means of delivery for the campaign, namely SMS, MMS, or simply as coupons available to users via their web and mobile interfaces. The MAE launches the campaign (Step 2) at the start time provided by the merchant, at which time the coupons become available to users of the system; if SMS or MMS are chosen as the means of delivery, those messages are sent to the opted-in audience. In Step 3, the customers administer their own accounts. They may register on the MAE system, opt-in for merchants of their choice, set their account preferences such as categories of interest or password changes, or simply browse through available coupons from merchants they both have and have not opted-in for. They may save coupons of interest so that they are readily available when they need them, or they may search specifically for coupons that are available within a given distance (e.g. 5 miles) from their present location should they have GPS-enabled smartphones. Steps 4 and 5 only take place for those users who redeem coupons. In Step 4, users have an option for redeeming their coupon(s). One option is that the users may present their SMS or MMS messages and their corresponding coupon activation codes or barcodes to the merchant for redemption. For an activation code, the merchant must key it into the POS system, while for a barcode, the merchant may either scan or key it in. Another option for the users is for them to print the coupons, for example from a home computer, from the web interface available to them. The printed coupons may be presented directly to the merchants. This latter option exists primarily for those customers who do not own mobile phones. An example of the search and activate process for a mobile user is illustrated in Figure 2. In Figure 2(a), the mobile user is presented with all merchants within a given distance of the location determined by the MAE Location Based Services (LBS). The latitude and longitude of the user’s location is displayed by
78

INTERNATIONAL JOURNAL OF MANAGEMENT AND MARKETING RESEARCH ♦Volume 4 ♦ Number 1 ♦ 2011
the prototype, though this data would not be displayed for a production application. Here, the user is presented with two merchants with offerings, namely ABC Grill – Deland and Big-Box Mart. Upon selecting ABC Grill – Deland, in Figure 2(b), the user is provided the address and an option to view the merchant’s location on a map, as well as all of the offers available from that merchant. Other information could be provided here, such as phone number, hours of operation, or other merchant-specified details. Selecting one of the coupon choices in Figure 2(b) guides the user to a coupon detail screen as shown in Figure 2(c). By selecting the coupon, the user has “activated” the coupon, generating a unique coupon activation number specific to that user for the particular coupon. Figure 1: Mobile Advertising Engine (MAE) Workflow
The MAE workflow process involves the following steps: 1.) merchant develops campaign for targeted audience, 2.) merchant launches campaign, sending SMS coupons to targeted audience while making coupons available to all users, 3.) customers manage their accounts, saving coupons of interest, 4.) customers redeem coupons, 5.) POS communicates with MAE server during coupon redemption, 6.) analytics engine processes data to determine better campaign strategies.
79

J. Wray, D. Plante | IJMMR ♦ Vol. 4 ♦ No. 1 ♦ 2011
Figure 2: Sample Mobile User Search and Activate Process
(a) (b) (c) An example of a mobile user searching for and activating a coupon to be redeemed at a POS: (a) user is provided with all merchants in area; (b) all coupons for a merchant are displayed; (c) a coupon detail view of a particular coupon with activation code is presented to the user. Step 5 illustrates the communication between the POS and the MAE system. Complications due to hardware and infrastructure compatibility at the point of redemption presently make this a difficult problem to solve. While countries like Japan and Korea have more readily installed specialized mobile device readers at the POS, the U.S. and European countries have been much slower in doing so (Holmen, 2009). While image scanners that work at the pixel level are capable of scanning 1-D and 2-D bar codes off of phone screens, infrared scanners do not because the screens absorb too much light to effectively allow the black-white contrast to be picked up (Reedy, 2009). Also, even if image scanners exist at the POS, many POS systems, especially for larger brands, have software that is custom written. Therefore, integration with the particular software installed on the POS system must presently be done on a case-by-case basis. For POS systems capable of interfacing with the MAE system, the redemption process provides tracking of which customers redeem which coupons. When a campaign is created, each coupon loaded into the system is provided with a unique coupon ID. As each customer also has a unique customer ID, and each merchant has a unique merchant ID, the MAE system records which coupons each customer at a given merchant redeems at a given time. When an activation code is keyed or scanned in, the POS system communicates with the MAE to validate the coupon. If the coupon is valid, the MAE sends a response code indicating so, along with the information needed for the POS to issue the discount. Therefore, not only is the discount provided to the customer, the MAE system stores that information as well. By recording consumer redemption patterns and utilizing the MAE server’s Reporting Services (RS), targeted recommendations for other coupons that the user may be interested in are possible, as is campaign reporting and customization that will lead to more tailored campaign creation (Step 6).
80

INTERNATIONAL JOURNAL OF MANAGEMENT AND MARKETING RESEARCH ♦Volume 4 ♦ Number 1 ♦ 2011
In Figure 3, sample web pages for an existing campaign are illustrated. In Figure 3(a), a quick view of a campaign that is either in progress or completed is displayed. As campaigns progress the merchant is able to monitor its redemption rate of specific offers and change or end them if interested in doing so (in Figure 3(c).) A merchant is also able to view, add, or remove different locations under its purview. While not the most ideal means of redeeming coupons at the POS, Figure 3(d) provides a quick and easy prototype approach to redeeming coupons. The merchant at the POS only need enter the activation code and submit the request to allow a coupon to be redeemed. Other more effective approaches include either installing a redemption terminal or an image scanner. For the latter case, activation codes would have a corresponding bar code displayed in the mobile user’s handset display or for printing on the web interface. Figure 3: Sample Merchant Web Interface for Monitoring Campaigns
(a) (b)
(c) (d)
Sample pages for a merchant campaign: (a) a quick view of a campaign either in progress or after complete; (b) a listing of all locations a merchant manages campaigns for; (c) a listing of all offers and whether they are active; (d) prototype redemption page for merchant to key in coupons being redeemed at POS. Keying in activation codes at the POS slows the redemption process down and leads to a less than optimal experience for both customers and clerks. Even scanning bar codes may be improved upon, particularly when a single customer is redeeming multiple coupons during one transaction. Near-field communication (NFC), a short-range communications technology with a maximum range of only 10 cm, provides a better solution not only for coupon redemption but also for mobile payments (NFC-Forum, 2010). While presently not widely used in the U.S., by waving a NFC-enabled mobile handset in front of a NFC receiving POS device, secure mobile banking and mobile payments to and from customer accounts is already possible (Talbot, 2009). Most mobile handsets, including iPhones and Blackberry phones, may be retrofitted with NFC hardware (Clark, 2009). However, as is the case with the lack of pervasively installed image scanners capable of reading bar codes, most POS systems presently are not capable of communicating with NFC-enabled mobile devices.
81
J. Wray, D. Plante | IJMMR ♦ Vol. 4 ♦ No. 1 ♦ 2011
A major advantage of the MAE framework is that once a campaign is launched, while only opt-in customers are sent SMS or MMS messages, every consumer in the system can access the coupons via the web and mobile interfaces. When a consumer finds a coupon of interest, upon redeeming that coupon, the customer now is opted-in to that merchant. That new customer’s information (e.g. email address, home zip code, interest category preferences) is now available to the merchant. Individual companies developing their own campaign management and mobile coupon delivery systems only have their own customers accessing their mobile coupons. To drive more consumers to their sites, merchants must either use more tradition media to do so, for example television, radio, or newspaper advertisements, or less traditional channels such as the Internet (including social networking). They also may receive new mobile or email customers by having them sign up when making a purchase on-line or in their stores. However, having many users conveniently accessing their coupons, for example, when those users are driving in the vicinity of the merchants’ stores, provides merchants with a new channel for targeting consumers when they are closer to the point of sale at a time when they may need goods or services that are available by the merchant. CONCLUSIONS In this paper, we presented a centralized coupon distribution framework using a Mobile Advertising Engine (MAE) which aggregates coupons from multiple corporations, tracks point of sale (POS) redemption, and reports campaign effectiveness using a mobile marketing and reporting platform. As advertising budgets continue to shrink, and as advertising effectiveness through traditional media continues to wane, advertising and customer loyalty building via the Internet and mobile handsets is becoming increasingly attractive to merchants. Mobile advertising is particularly interesting given that so many mobile devices are now location-aware (using GPS) and Internet connected (using wireless or 3G). These relevancy and timeliness determinants provide a means of driving both repeat and new customers, for example with mobile coupon offers, to merchant locations when customers are most likely to purchase. Merchants also are less likely to lose sales due to forgotten paper coupons or offers, as the pervasiveness of mobile handsets that consumers carry at all times provides a convenient storage mechanism for all offers of interest. Also, with mobile marketing, companies can develop targeted personalized campaigns that are more cost effective than traditional marketing campaigns. The Mobile Advertising Engine provides a simple, easy-to-use platform for marketers to develop and analyze their marketing campaigns. While the prototype developed and reported on in this paper provides the structure for the inclusion of a reporting and analytics component, only basic reporting has presently been included. To achieve the goal of providing an exceptional customer experience, it is imperative that coupons presented to each individual customer be carefully selected for delivery as a production system may contain thousands of coupons, most of which will not be of interest to any given customer. Customers should be delivered coupons based on their interests, demographics and location via the use of an analytics engine that can automate the selection, and this is the subject of ongoing research. Also, a carefully designed search feature based on location, expiration date, category, and other coupon features must be provided to help the customer easily find coupons of interest. A particularly difficult issue is that of handling coupon redemption at the point of sale (POS), as different POS systems have different interfaces, software, and implementation characteristics. For our prototype, we idealize this interface with a web application running from a browser, yet a production system should allow integrated coupon redemption at the POS. Presently, there is no easy solution to this problem. Either software must be written for each individual POS system or a specialized terminal must be used. While the later is the easier of the two solutions, it entails additional costs for the merchant and does not guarantee integration with the POS, for example to allow coupon redemption to be recorded on the register receipt and automatically taken off of the bill. The best solution to this problem would be for a
82

INTERNATIONAL JOURNAL OF MANAGEMENT AND MARKETING RESEARCH ♦Volume 4 ♦ Number 1 ♦ 2011
Standards Board to be established to specify a standard interface that all POS providers must provide so that third parties may develop software and systems that integrate at the POS. Without this, tight integration with the POS will only be possible on a system-by-system basis. Finally, with the explosion in social networking, many businesses are now establishing social networking presences (e.g. “Follow us on Twitter” or “Find us on Facebook”.) Mobile social advertising is a relatively new phenomenon, and some efforts have been made to understand how users will accept it (Wais and Clemons, 2008.) Future versions of the MAE may allow integration with social networking sites should user attitudes of this practice be deemed acceptable. REFERENCES Butcher, D. (2010, January 28). Seventy percent of smartphone owners use mobile financial services. Retrieved from http://www.mobilecommercedaily.com/70-percent-of-smartphone-owners-use-mobile-financial-services-study/ Chiou-Wei, S-Z. & Inman, J.J. (2008). Do Shoppers Like Electronic Coupons?: A Panel Data Analysis. Journal of Retailing, 84(3), 297-307. Clark, S. (2009, November 4). Zenius adds NFC to standard mobile phones with Bladox Waver. Retrieved from http://www.nearfieldcommunicationsworld.com/2009/11/04/32152/zenius-adds-nfc-to-standard-mobile-phones-with-bladox-waver/ Clifford, S. (2009, August 4). A look head at the money in the communications industry. New York Times, p. 3. Compete (2009, January 4). Smartphone owners now spending more from handset, but poor site functionality is a turn-off. Retrieved from http://multivu.prnewswire.com/mnr/compete/41839/ CTIA (2010, March 23). CTIA-The wireless association announces semi-annual wireless industry survey results. Retrieved from http://www.ctia.org/media/press/body.cfm/prid/1936 Fisher, M. (2008, June 1). Weakening signals; the listener signs off at a time when radio's future is fuzzy. The Washington Post, p. M3. Gray, S. (2009). The formative years: the mobile couponing craze takes shape. International Journal of Mobile Marketing, 4(1), 12-14. Holmen, E. (2009). Directing mobile coupons to your customers. Response, 18(3), 51. Juniper Research (2008, April 23). Press release: retailers to send up to 3 billion ‘mobile coupons’ to phone users by 2011, according to Juniper Research. Retrieved from http://juniperresearch.com/shop/viewpressrelease.php?pr=88 Juniper Research (2010, March 9). Press release: mobile retail market to exceed $12 billion by 2014, driven by one-to-one marketing and smartphone adoption, Juniper Report finds. Retrieved from https://www.juniperresearch.com/shop/viewpressrelease.php?id=207&pr=179 Kincaid, J. (2010, January 4). Denied AdMob, Apple buys competing ad platform Quattro Wireless for $275 million. Retrieved from: http://techcrunch.com/2010/01/04/apple-acquires-quattro-wireless/
83

J. Wray, D. Plante | IJMMR ♦ Vol. 4 ♦ No. 1 ♦ 2011
Lavallee, A. (2009, May 29). Unilever to test mobile coupons - in trial at supermarket, cellphones will be the medium for discount offers. Wall Street Journal (Eastern Edition), p. B8. Meyers, P. & Litt, S. (2008). Finding the redemption sweet spot: debunking the top ten myths about couponing. Journal of Consumer Marketing, 25(1), 57-59. Mobile Marketing Association (2006, February 21). 89% of major brands planning to market via mobile phones by 2008. Retrieved from http://mmaglobal.com/research/89-major-brands-planning-market-mobile-phones-2008-mobile-marketing-accelerate-more-half-br Mobile Marketing Association (2008, July 15). Global code of conduct. Version 078. Available: http://www.mmaglobal.com/codeofconduct.pdf NFC-Forum. (2010). Retrieved 03-28-2010 from http://www.nfc-forum.org/home/ Perez-Pena, R. (2008, October 28). Newspaper circulation continues to decline rapidly. New York Times, p. 4. Popescu, A. (ed.) (2008, December 28). W3C working draft: Geolocation API specification. Retrieved from http://www.w3.org/TR/2008/WD-geolocation-API-20081222 Reedy, S. (2009). Mobile coupons go mainstream. Telephony, 250(7), 30-31. Rogers, E.M. (1962). Diffusion of Innovations. New York, NY: Free Press. Schonfeld, E. (2010a, February 23). Smartphone sales up 24 percent, iPhone’s share nearly doubled last year (Gartner). Retrieved from http://techcrunch.com/2010/02/23/smartphone-iphone-sales-2009-gartner/ Schonfeld, E. (2010b, March 30). Mobile data traffic expected to rise 40-fold over next five years. Retrieved from http://techcrunch.com/2010/03/30/mobile-data-traffic-rise-40-fold/ Shields, M. (2010, May 21). FTC approves Google’s AdMob acquisition. Retrieved from http://www.mediaweek.com/mw/content_display/news/digital-downloads/broadband/e3idbde8a913c88374206b0d933b1fc8c18 Steenkamp, J.E.M. & Baumgartner (1992). The role of optimum stimulation level in exploratory consumer behavior. Journal of Consumer Research, 19(3), 434-448. Talbot, D. (2009, April 02). Nokia bets on mobile payment: despite a global recession, mobile-payment services are surging in the developing world. Technology Review. Retrieved from http://www.technologyreview.com/read_article.aspx?ch=specialsections&sc=telecom&id=22379 Wais, J. S., & Clemons, E.K. (2008) Understanding and implementing mobile social advertising. International Journal of Mobile Marketing, 3(1), 80-87. Wimberly, T. (2010, April 27). AdMob: Android passes iPhone in U.S. traffic. Retrieved from http://androidandme.com/2010/04/news/admob-android-passes-iphone-in-u-s-traffic/
84

INTERNATIONAL JOURNAL OF MANAGEMENT AND MARKETING RESEARCH ♦Volume 4 ♦ Number 1 ♦ 2011
ACKNOWLEDGEMENT The authors wish to thank the anonymous reviewers for their comments and suggestions, all of which were very helpful in improving the quality of this paper. BIOGRAPHY Jeffrey Wray received a Bachelors of Science in Computer Information Systems from the Department of Mathematics and Computer Science at Stetson University, 421 N. Woodland Blvd., DeLand, Florida, USA. He is also a Master of Business Administration candidate at Stetson University. He can be contacted at [email protected]. Dr. Daniel Plante is an Associate Professor of Computer Science at Stetson University, Department of Mathematics and Computer Science, 421 N. Woodland Blvd., DeLand, Florida, USA. He received a PhD in Physics from the University of Notre Dame in 1995 and a Master of Engineering in Computer Science from North Carolina State University in 2003. He can be contacted at [email protected].
85


INTERNATIONAL JOURNAL OF MANAGEMENT AND MARKETING RESEARCH ♦Volume 4 ♦ Number 1 ♦ 2011
AN ASSESSMENT OF VISITOR SATISFACTION WITH NATURE-BASED TOURISM ATTRACTIONS
Perunjodi Naidoo, University of Technology Mauritius Prabha Ramseook-Munhurrun, University of Technology Mauritius
Premita Seegoolam, University of Technology Mauritius
ABSTRACT Nature-based tourism is an important component of the tourism industry and has experienced significant growth during recent years. Nature-based tourism attractions (NBTA) can provide substantial economic gains to both host communities and tourism businesses. To sustain the growth of NBTA and maintain its associated benefits, it is important to ensure that the visitors are satisfied with the experiences provided. Despite the importance of delivering visitor satisfaction for NBTA, there is scant literature available on visitor satisfaction with NBTA. The aims of this study is to identify the factors that influence visitor satisfaction with NBTA. The study also analyzes the relationship between NBTA, overall satisfaction and visitor loyalty. Visitor satisfaction was measured using a questionnaire which adopted the perceive-performance theory. The study area for this study was seven NBTA where convenience sampling was used for the selection of the attractions. Data was collected from the on-site survey method with a sample size of 600 NBTA visitors. Statistical analyses were used and hypotheses were tested. Based upon the results of this study, recommendations were made. JEL: M31 KEYWORDS: Customer loyalty, Customer satisfaction, Mauritius, Nature-based tourism attractions, Willingness to recommend INTRODUCTION
ature-based tourism is one of the fastest growing sectors of the tourism industry (Memetoglu, 2006). To match consumer demand, there is an increasing need to provide more nature-based tourism attractions to visitors. However, little has been done to analyze visitor satisfaction with
these attractions. Satisfaction is recognized as one of the key judgments that consumers make regarding a tourism service (Yüksel and Yüksel, 2002). According to Walker (1995), satisfied customers are believed to affect the long-term viability of an organization through repeat purchase and positive word-of-mouth (WOM) communication. Therefore, it is imperative to evaluate satisfaction at NBTA to ensure the long-term survival of the organization in the competitive business environment and also for enhancing the experience of visitors with the attraction. The assessment of visitor satisfaction with NBTA may also assist in identifying the strong and weak attributes of these attractions and thus help in improving the services being provided. The aim of the study is to assess visitor satisfaction with NBTA. The objectives of the study are to identify the factors that contribute to visitor satisfaction with NBTA. The study also analyzes the relationship between NBTA, overall satisfaction and visitor loyalty. Mauritius a developing island covering 1,860 square kilometres (720 square miles) with 1,227,078 inhabitants is a well-known holiday destination for beach-resort tourists. Today, tourism is one of the main pillars of the Mauritius economy. The growth of the tourism industry has occurred continuously from 27, 650 tourists in 1970 to 930, 456 in 2008 (Central Statistics Office). In 2008, gross tourism receipts amounted to USD$ 1,338 million (41, 213 million rupees) and provided direct employment to 26, 322 individuals in 2007 (AHRIM, 2008). France is the leading market with 240, 028 tourist arrivals followed by the United Kingdom, Reunion island, Italy, Germany and India. Mauritius is mainly promoted as a beach resort destination; however, so as to gain competitive advantage, other features have
N
87

P. Naidoo et al | IJMMR ♦ Vol. 4 ♦ No. 1 ♦ 2011
been added to expand the portfolio of activities provided to tourists. In recent years, NBTA has been promoted as a form of green tourism, however, satisfying visitors is still a problem for many of these attractions. Investigating visitor satisfaction at these attractions may help to identify aspects that need improvement so as to enhance the experience of visitors. The paper is organised as follows: the introductory section presents the objectives of the study. The next section reviews the relevant literature on NBTA and customer satisfaction. The research methodology is then presented followed by the results and discussion. The last part of the study concludes the paper. LITERATURE REVIEW Nature-Based Tourism Attractions Tourism is the world’s largest and fastest growing industry. Goeldner, Ritchie and McIntosh (2000) identified three operating sectors within the tourism industry: (1) the transportation sector, (2) the accommodation sector and (3) the attraction sector. According to Gunn (1988) attractions are described as the “first power”, “lodestones for pleasure” and the real energizer of tourism in a region. Pigram (1983) takes a more pragmatic approach by stating that without attractions, tourism would not exist. Attractions are a central component of the tourism industry, and Gunn (1988:37) states that “without developed attraction, tourism as we know it could not exist; there would be little need for transportation, facilities, services and information system”. Attractions are important to the tourism production process as they often are the reason to visit specific destinations or places. This emphasizes the importance of tourism attractions and highlights the need to understand the range and the type of attraction that exist. According to Swarbrooke (2000:67), “visitor attractions are the heart of the tourism industry; they are the motivators that make people wants to take a trip in the first place”. In opposition, Richards (2001) points out that it can be argued that attractions do not always literally attract visitors, however, they certainly do provide a focus for much tourist activity, and are an essential weapon in the arsenal of tourist destinations engaged in a competitive struggle for tourist business. There have been many attempts to explain the multitude forms in which visitor attractions exist (Holloway, 1995; Smith, 1998). According to Buckley, Pickering and Weaver (2003), visitor attractions range from very small to enormous size, from free entrance to expensive fees, and include both natural and built features or a combination of these two (Prideaux, 2002). Laarman and Durst (1987) define NBTA as a type of tourism activity that combines three specific elements, namely education, recreation and adventure. Valentine (1992) also incorporates the recreation element in his definition, and states that NBTA is primarily concerned with the direct enjoyment of some relative undisturbed phenomenon of nature. He suggested that there are three types of activities that come under his definition: experiences that are dependent on nature, experiences that are enhanced by nature and experiences for which a natural setting is incidental. According to Jenkins and Pigram (2003), nature-based activities may be defined as all forms of leisure that rely on the natural environment and includes many activities, ranging from sitting under at tree to hiking in the wilderness. Due to the diversity of activities and the variation in styles, there is a plethora of expressions for NBTA. According to Newsome, Moore and Dowling (2002) NBTA may be labeled as adventure, wildlife and ecotourism while McKercher (1998) expands it further to alternative tourism, educational tourism, sustainable tourism, responsible tourism and other forms of outdoor-oriented non-mass tourism. Measuring Visitor Satisfaction Customer satisfaction is one of the most frequently examined topics in the hospitality and tourism field because it plays an important role in the survival and future of any tourism products and services (Gursoy, McCleary and Lepsito, 2007). The majority of researchers from the 1980’s and 1990’s found that
88

INTERNATIONAL JOURNAL OF MANAGEMENT AND MARKETING RESEARCH ♦Volume 4 ♦ Number 1 ♦ 2011
satisfaction was more a judgment or evaluation than an attitude and is a complex construct with numerous associated measurement issues (Yüksel and Rimmington, 1998). Past research has operationalized satisfaction at both the overall satisfaction and attribute satisfaction levels. Attribute satisfaction has been defined as consumer subjective satisfaction judgment resulting from observation of attribute performance (Oliver, 1993). Accordingly, it would be more appropriate to first measure customer satisfaction towards different attributes or dimensions of service or product and then calculate overall satisfaction derived from measures of satisfaction with multiple items. Understanding how important each attribute and dimension is to the customers is of upmost importance. According to Backman, Backman and Malinovsky (2000), NBTA satisfaction is measured using dimensions such as programmatic, responsiveness, tangible, empathy, assurance and reliability. Similar dimensions were used by Akama and Kieti (2003) with added attributes such as price, perceived value and responsibility. According to Mehmetoglu (2007), natural attributes play a more important role in satisfying visitors at NBTA. The main attribute for NBTA remains its pristine environment (Prato, 2006), however, there are other attributes that are important for the attraction. Other studies on attractions such as Frochot (2003) use the dimensions of responsiveness, tangible, communication, consumable and empathy to measure customer satisfaction in attractions. Most of the studies conducted to evaluate satisfaction in the tourism industry have utilized models of expectation-disconfirmation theory (Oliver, 1980) and the perceived-performance model (Tse and Wilton, 1988). The expectancy-disconfirmation model, suggests that satisfaction is related to the interplay of a customer’s perceptions, expectations, and intentions. The concept was introduced by Oliver (1980) and indicates that customer satisfaction is an evaluative response to the product purchase and consumption experience resulting from a comparison of what was expected and what is received. If the actual performance is better than their expectations, they are likely to have a positive disconfirmation, suggesting that consumers are highly satisfied and will be more willing to purchase the same product again. Based on the expectancy-disconfirmation theory, Parasuraman and Zeithaml (1988) developed the SERVQUAL instrument to measure perceived service quality. The perceived-performance model (Tse and Wilton, 1988) suggests that consumers’ satisfaction or dissatisfaction with a product can be assessed only examining their evaluation of the actual performance. It has been argued that regardless of the existence of any previous expectations, the customer is likely to be satisfied when a product or service performs at a desired level. Baker and Crompton (2000) also state that because performance quality is under management’s control, the model may be more useful than other theories of visitor satisfaction, as the basis for the construction of a tool for the tourism provider is to accurately evaluate customer satisfaction. It is very important to identify and measure consumer satisfaction with each attribute of a destination, because consumer satisfaction/dissatisfaction with one of the components may lead to satisfaction/dissatisfaction with the overall destination (Kozak and Rimmington, 2000). Finally, the level of satisfaction attained by an individual may influence their future intentions, in terms of revisiting a destination and/or recommending it to other people. Customer loyalty reflects attitudes and behavior towards services and their repeat usage (Backman and Crompton, 1991). Some studies recognize that understanding which factors increase loyalty is valuable information for tourism marketers and managers (Flavian, Martinaz, and Polo, 2001). Cronin and Taylor (1992), measure the construct “future behavioral intention” by using two indicators: the intention of repurchase and the intention to recommend through positive WOM recommendations. In tourism research, a similar approach is adopted and loyalty intention is represented in terms of the intention to revisit and the willingness to recommend it to friends and relatives (Oppermann, 2000; Chen and Gursoy, 2001). Therefore, two indicators, “revisiting intention” and “willingness to recommend” are used as measures of loyalty intention. In NBTA, it can be observed that WOM recommendations can be mostly used as loyalty intention as compared to repeat visit. This is so, as according to Chen and Gursoy (2001) visitors may wish to experience a new attraction even if they were satisfied the previous attraction. Thus,
89

P. Naidoo et al | IJMMR ♦ Vol. 4 ♦ No. 1 ♦ 2011
loyalty intention should be measure by “willingness to recommend” as visitors may wish to experience new attractions. METHODOLOGY The quantitative method was used to collect data for the study. Literature was examined to identify instruments used for studies on customer satisfaction and service quality in attractions. The research instrument was developed based on models of Akama and Kieti (2003), Frochot (2003), Kim et al. (2002) and Howan et al. (2008). The questionnaire was divided into three sections. Part A consisted of seven dimensions of NBTA namely: Responsiveness, Tangibles, Price, Communication, Assurance, Empathy and Natural Attractions. Each of these dimensions was further divided into related statements. Part A also consisted of three questions regarding satisfaction, overall satisfaction and customer loyalty. Respondents were required to rate all questions in Part A using a 5-point Likert-type scale ranging from 1=strongly disagree, 2=disagree, 3=neither disagree nor agree, 4= agree, 5=strongly agree. Ritchie (1991; 1995) argues that Likert scales are appropriate for evaluating visitor experiences of attractions as they are effective in measuring customer attitudes and are easy to construct and manage. Section B of the questionnaire consisted of both open and close-ended questions. This section allows general attitudes to be expressed which can aid in interpreting the structured questions. Section C gathered demographic information of the visitors at the NBTA. The questionnaires were designed in both English and French as these languages were understood by most locals and by a large number of tourists. A short and concise covering letter was included to explain the purpose of the survey. Convenience sampling was used to select attractions based on the list of NBTA identified in the Mauritius Tourism Promotion Authority guidebook. It was noted that in total there were 14 NBTA in the guide book. A letter was sent to each NBTA to seek permission for undertaking the survey at the different locations. Only 6 NBTA positively responded to the letter. The sample size chosen was 100 visitors per attraction representing a total of 600 respondents. The sampling technique used for the survey is the convenience sampling method. Only those who were keen to complete the questionnaire were selected during the month of March to April 2009. The survey was conducted over six weeks at the different attractions where questionnaires were distributed from 9.00 A.M. to 4 P.M on a daily basis respondents were approached and informed about the purpose of the survey prior to answering the questionnaire. Respondents younger than age 16 were excluded from the study. A pre-test was conducted among 15 graduate students in the School of Sustainable Development and Tourism at the University of Technology, Mauritius who had at least visited one of the six NBTA selected. Based on the feedback received from the pre-test, the wordings of 4 questions were modified. Then, the questionnaire was tested at the 6 NBTA attractions (N=12) with 2 questionnaires distributed per attraction. No modifications were made as both the French and English questionnaires were free from ambiguities. RESULTS AND DISCUSSION Out of 600 questionnaires, 21 were not returned and 22 were discarded since they were partly filled, thus giving a response rate of 92.8%. The percentage of females was higher than males with 52% and 48% respectively although visitors were approached with no gender discrimination. However, when groups of mixed genders were approached, the female was delegated to complete the questionnaire. Additionally, females were easily approachable and were keener to respond as compared to males. 75% of the respondents were between 16-39 years of age. 74.9% of the respondents have visited NBTA in the past, thereby showing that they had experienced similar attractions and were familiar with the services and facilities being offered at such sites. 62% of the respondents stated that it was their first visit to that particular NBTA, 25% of respondents were at their second visit to the NBTA, followed by 8% who were visiting the attraction for the third time and the 5% remaining were repeaters with at least 4 visits. It can
90

INTERNATIONAL JOURNAL OF MANAGEMENT AND MARKETING RESEARCH ♦Volume 4 ♦ Number 1 ♦ 2011
be noted that respondents were mainly tourists with a percentage of 60.7% while local respondents accounted only 39.3%. Table 1 shows the statements pertaining to respondents’ visitor satisfaction with the NBTA. Participants were asked to rate their satisfaction with the dimensions of Responsiveness, Tangibles, Price, Communication, Assurance, Empathy, Natural Resources. The highest mean value for Responsiveness was 4.10 for “visitors are made to feel welcome”. The lowest mean value is 3.87 for the statement of “staff is well informed to answer customers’ requests”. This shows that the NBTA were hospitable towards the customers. Statements referring to availability and willingness of staff to welcome and help, convenience opening hours and waiting time were rated as satisfactory by customers. However, staff at the attractions were not well informed enough to help customers in their requests and were unable to provide them with the relevant information they required. The highest mean value for Tangibles is 4.21, which is for “site is well kept and restored”. It shows that the NBTA in Mauritius are well-maintained. This is so as, NBTA is a new developing market for Mauritius and that the attraction managers are aware that they have to keep the sites clean and attractive to satisfy customers. The minimum mean value for Tangibles is 3.90 which is for “direction sign to show around the attraction” which demonstrates that signage needs to be improved. Furthermore, the findings reveal that visitors were not very satisfied with the level of crowdedness at the attractions. They felt that the attractions received too many customers which spoilt the natural beauty of the site. Table 1 shows that the visitors perceived that Pricing at the NBTA were averagely priced. The majority of visitors were international visitors, thus they had experienced nature-based attractions abroad which may have offered better value for money. A few visitors also expressed that a price discrimination system was imposed on them, due to the difference in pricing for locals and tourists. In Mauritius, it is a common practice that a “tourist price” is charged for several services as it is believed that tourists have higher purchasing power than locals. Additionally, a few tourists believed that they did not receive value for money with the current price charged for the articles made available on the site. The results for the Communication dimension reveal that some of the NBTA sampled only offered brochures, information or leaflets in French and English and not in foreign languages such as German or Italian. The Mauritian population is fluent in both French and English. Since a majority of visitors are locals, French and British tourists, managers of NBTA did not provide foreign language brochures. However, the other foreigners strongly feel that it is necessary to offer foreign language brochures as this will be really helpful for them to appreciate the attraction. Furthermore, it can be seen that at some attractions, there is a need to have guides in order to provide visitors with relevant information. Assurance consisted of 4 statements as shown in Table 1. The respondents felt that the NBTA is not easily accessible by local transport. Only, respondents having private cars, hired cars or travelling by coach can easily access the site. Respondents also found that there were not enough parking during peak periods and this was mainly observed from local respondents. The results also reveal there were not enough places to sit and relax while discovering the attractions. These comments were mostly from parents with small children and elderly persons who found that it was tiresome to visit the attraction without resting during their visit. The statement about safety and security achieved the highest mean value of 4.02 and shows that NBTA were committed to keeping visitors safe and secure. The dimension of Natural Resources consisted of 4 statements. The lowest mean value was 3.40 for the statement “the sites consider needs for elderly and disable visitors”. This shows that customers feel that the NBTA could do more to provide for the needs of the elderly and disabled visitors. However, as the experience offered at some NBTA is expected to offer a high level of risk, it is important that NBTA provides an indication of the appropriateness of the site to different market segments (i.e. adventure seekers, family with young children, elderly) in their promotion. Of the 7 statements regarding Natural
91

P. Naidoo et al | IJMMR ♦ Vol. 4 ♦ No. 1 ♦ 2011
Resources, only two statements have mean value of less than 4 as shown in Table 1. Visitors suggested that the attractions tend to lack rare fauna and flora despite being satisfied with the uniqueness of the natural resources. Table 1: Mean Scores for Visitor Satisfaction at NBTA
DIMENSIONS MEAN VALUE
STANDARD DEVIATION
Responsiveness Staff are always helpful and courteous 4.06 0.787 Staff are quick to react to customers’ requests 3.91 0.735 Staff are willing to take time with visitors 3.89 0.882 Staff are well informed to answer customers’ requests 3.87 0.879 Visitors are made to feel welcome 4.10 0.761 Visitors are free to explore, there is no restriction 4.05 0.743 Waiting time for service at the attraction is acceptable 4.08 0.752 The site is opened at convenient hours 4.07 0.752 Tangibles The site is well kept and restored 4.21 0.646 The attraction environment is attractive 4.13 0.712 Direction signs to show around the attraction are clear and helpful 3.9 0.914 The attraction is uncrowded and unspoiled 3.92 0.886 Staff are presentable and easily identified 4.06 0.793 The physical facilities offered are well maintained and in good condition 4.08 0.688 The attraction is clean 4.09 0.761 Price The entry price is reasonable 3.84 0.873 Level of prices for services provided on the site is acceptable 3.67 0.824 There is no price discrimination at the site 3.68 0.838 The site offers value for money 3.83 0.858 Communication There is availability of brochures in English and /or French of the attraction 3.75 0.958 The information offered is sufficiently detailed to enjoy the attraction
3.62 0.873
Information about forbidden and limited behaviors at the attraction are provided 3.62 0.950 Foreign language leaflets are helpful 3.61 0.908 There is a need to have guides in order to obtain relevant explanation 3.8 0.874 Assurance You feel Safe & Secure at the attraction 4.02 0.734 There is sufficient places to sit and relax 3.83 0.850 Attraction is easily accessible for everyone (roads, transport & signage) 3.81 0.829
There is enough parking available 3.80 0.879 Empathy Personal attention is provided to visitors when needed
3.88 0.787
The facilities and equipment offered are at convenient location
3.87 0.773
There is a good viewing and comfortable facilities available
3.93 0.833
The site considers needs for elderly and disable visitors
3.40 1.005
Natural resources There are rare fauna and flora at the attraction 3.94 0.842 The attraction is a tranquil rest area 4.12 0.757 The site is unique and authentic 4.10 0.768 It is a very knowledgeable site for visitors 4.05 0.806 The site is free from air and noise pollution 4.11 0.778 There are large variety of species 3.83 0.918 It is a wilderness and unspoiled area 4.12 0.712 Overall Service quality 4.13 0.622 Loyalty intentions I will recommend this attraction to friends and relatives 4.10 0.673 I will revisit this attraction again 3.62 1.076 Visitor Satisfaction I am satisfied with the services provided by the NBTA 4.10 .601
Table 1 shows the mean scores for the service quality dimensions of nature-based tourism attractions
92

INTERNATIONAL JOURNAL OF MANAGEMENT AND MARKETING RESEARCH ♦Volume 4 ♦ Number 1 ♦ 2011
The overall service quality with the NBTA was calculated by adding the mean values of all statements and dividing the sum obtained by the number of statements. The overall service quality with the NBTA was 4.13 indicating that respondents were satisfied with their visit. Table 1 further showed that respondents were more likely to recommend the attraction (mean value of 4.10) that revisit it again (mean value of 3.62). Relationships between NBTA dimensions, Overall Satisfaction and Loyalty Intentions The relationships among service quality, satisfaction, and behavioral intentions have been a significant strategic focus of organizations and academic researchers (Cronin and Taylor, 1992; Baker and Crompton, 2000). Researchers have established a positive relationship between service quality and customer satisfaction (Cronin and Taylor, 1992; Baker and Crompton, 2000) and customer satisfaction and loyalty (Cronin and Taylor, 1992; Oliver, 1997). However, the strength of the relationship between satisfaction and loyalty has been found to vary significantly under different conditions (Anderson and Srinivasan, 2003). This study therefore attempts to test the following hypotheses: H1: The NBTA dimensions has a significant influence on visitors’ satisfaction H2: The NBTA dimensions has a significant influence on visitors’ loyalty intentions H3: The NBTA dimensions and satisfaction have a significant influence on visitors’ loyalty intentions The hypotheses were tested using multiple regressions as the study attempts to find the effect of the independent variables on the dependent variable. Linear regression analysis was conducted using general overall visitor satisfaction (SAT) as a dependent variable and the seven dimensions of service quality, responsiveness (RES), tangibles (TANG), Price (PRC), communication (COMM), Assurance (ASSU), empathy (EMP) and natural resources (NR) as the independent variables. The first model measured the NBTA dimensions on visitors’ satisfaction and has the following form: SAT = f (RES, TANG, PRC, COMM, ASSU, EMP, NR) The second model measured the NBTA dimensions as independent variables on visitors’ loyalty as dependent variable and has the following form: LOYALTY = f (RES, TANG, PRC, COMM, ASSU, EMP, NR) The third model measured the NBTA dimensions and visitor satisfaction as independent variables on visitors’ loyalty as dependent variable and has the following form: LOYALTY = f (RES, TANG, PRC, COMM, ASSU, EMP, NR, SAT) Table 2 presents a summary of the regression results. The adjusted R2 of 0.455 indicates 45.5 percent of variance in visitors’ satisfaction can be predicted by five of the seven dimensions, namely Tangibles, Price, Assurance, Empathy and the Natural Resources. The positive coefficient for the dimensions Tangibility, Price, Empathy and Natural Resources were found to be statistically significant, suggesting increasing level of satisfaction. However, the assurance dimension had negative coefficient, meaning decreasing level of satisfaction. In other words, higher assurance results in decreasing visitor satisfaction. The resulting regression model 1 is: SAT = 0.316 + 0.313 (TANG) + 0.289 (PRC) – 0.385 (ASSU) + 0.355 (EMP) + 0.198 (NR)
93

P. Naidoo et al | IJMMR ♦ Vol. 4 ♦ No. 1 ♦ 2011
The results of the regression analyses indicate a significant predictive validity of the dimensions of the instrument. Hence, the hypothesis H1 is supported. Overall, this study concluded that NBTA dimensions affect visitor satisfaction. Table 2: Regression results for the NBTA on Satisfaction and Loyalty Intentions
Independent variables Visitor Satisfaction Loyalty Intentions
Standardized Coefficients
t-value Sig. Standardized Coefficients
t-value Sig.
Responsiveness -0.158 -1.115 0.269 0.228 1.492 0.140 Tangibles 0.313 1.936 0.047* 0.244 1.401 0.035* Price 0.289 2.663 0.010** 0.070 0.598 0.551 Communication 0.098 0.717 0.476 0.066 0.447 0.656 Assurance -0.305 -2.435 0.017** 0.060 0.444 0.658 Empathy 0.355 2.746 0.008** -0.236 -1.688 0.046* Natural Resources 0.198 2.057 0.043* 0.352 3.381 0.001** Adjust R2 = 0.455 ; R2 = 0.503; F-value =
10.537, p < 0.000 Adjust R2 = 0.366 ; R2 = 0.421; F-value = 7.595, p < 0.000
* Significant at 5%; ** Significant at 1% Table 2 shows the results of the regression model 1 and 2 respectively. Model 1 shows that visitor satisfaction is influenced by tangibles, price, assurance, empathy and natural resources, while model 2 shows that loyalty intentions is influenced by tangibles, empathy and natural resources. Table 2 further shows the regression results for NBTA and visitors’ loyalty intentions. The adjusted R2 of 0.366 indicates that 36.6 percent of the NBTA is associated with visitor loyalty by three of the seven dimensions, namely tangibles, empathy and natural resources. The positive significant coefficient suggests that the highly perceived NBTA dimensions led to higher visitor loyalty. The resulting regression model 2 is: LOYALTY = 0.475 + 0.244 (TANG) – 0.236 (EMP) + 0.352 (NR). Therefore, H2 is partially supported. Visitor satisfaction may be considered as a mediator to the extent to which it carries the influences of NBTA dimensions to visitor loyalty intentions. Table 3 shows the regression results for NBTA and overall satisfaction on visitors’ loyalty intentions. The adjusted R2 of 0.383 indicates that 38.3 percent of the NBTA and overall satisfaction is associated with visitor loyalty. Three of the seven dimensions, namely tangibles, empathy and natural resources influences visitors loyalty intentions, where tangibles and natural resources have positive influences while empathy has a negative influence. It is further observed that overall satisfaction is also associated with loyalty intentions. The resulting regression model 3 is: LOYALTY = 0.413 + 0.177 (TANG) – 0.312 (EMP) + 0.309 (NR) + 0.216 (SAT). Therefore, H3 is partially supported. Table 3: Regression results for NBTA dimension and Satisfaction on Loyalty intentions
Independent variables Loyalty Intentions
Standardized Coefficients t-value Sig. Responsiveness 0.262 1.723 0.089 Tangibles 0.177 1.002 0.019** Price 0.008 0.064 0.949 Communication 0.045 0.307 0.760 Assurance 0.126 0.907 0.367 Empathy -0.312 -2.158 0.034* Natural Resources 0.309 2.927 0.005* Visitor Satisfaction 0.216 1.731 0.048** Adjust R2 = 0.383 ; R2 = 0.444; F-value = 7.201, p < 0.000 * Significant at 5%; ** Significant at 1%
Table 3 shows the influence of NBTA dimensions and visitor satisfaction on loyalty intentions and it is found that only tangibles, empathy, natural resources and visitor satisfaction are statistically significant.
94

INTERNATIONAL JOURNAL OF MANAGEMENT AND MARKETING RESEARCH ♦Volume 4 ♦ Number 1 ♦ 2011
CONCLUSIONS The purpose of the study was to assess visitor satisfaction at NBTA in Mauritius. There was a need to identify the important attributes that contribute to visitor satisfaction at these attractions. Dimensions such as Responsiveness, Tangibles, Price, Communication, Assurance, Empathy and Natural Resources were found to be important determinants of customer satisfaction for NBTA. The perceived-performance model was adopted for the survey. Visitors were less satisfied with the attributes of Communication, Price and Empathy while they were more satisfied with Tangibles and Natural Resources. Studies on attractions found similar results which were obtained by Akama and Kieti (2003) for Price and by Frochot and Hughes (2000) for Communication and Empathy. The weak attributes need to be redressed as this may have an effect on visitor satisfaction over the long-term. In the study, it was observed that respondents felt that staff was not well informed to react to consumers requests. Training is a key factor to the success of any organization and staff must be provided with proper training in terms of communicating with guests. They should be well briefed about the activities and services provided by the NBTA. They could also be given relevant documentation regarding possible questions that visitors may ask. The aim of training would be to ensure that staff provide a high level of service to the customers and in return create visitor satisfaction. The Tangibles of NBTA is of fundamental importance for consumers. The survey revealed that there is a lack of signage at the attraction. The management should therefore place proper direction signs to enable customers to visit the attraction without a guide. The problem of crowding at the attraction must be addressed by controlling the carrying capacity at the entrance by implementing an advanced booking system during peak seasons. There is also a lack of availability of brochures in languages like German, Spanish and Italian. NBTA must make brochures available in these languages available as according to data from the survey, non-English speaking visitors consists of around 25%. These must include sufficient details to enable the visitors to enjoy the attraction while at the same time providing information on the behavior expected from customers on the site. The NBTA are located mostly in remote areas where there are few or no transport facilities to reach these attractions. The Ministry of Tourism and Leisure in collaboration with the transport authorities can devise strategies to provide public transport to these sites to ensure access to locals. The pricing and services offered should be reviewed to offer more value for money and quality to visitors. For instance, it was found that visitors want additional facilities and amenities such as more food and beverage outlets and more diversify products in its gift shop. Thus management of the attractions must be able to fulfill all the needs of the customers in order to enhance satisfaction. The study has also found that there is a relationship between NBTA, overall satisfaction and visitors’ loyalty intentions. The findings of this study indicate that tangibles, price, assurance, empathy and natural resources dimensions have significant effect on overall satisfaction. It was also found that visitors’ satisfaction play an important role in enhancing visitors’ loyalty intentions. Thus, a satisfied NBTA visitor is important in developing a loyal visitor. Satisfaction was also found to mediate the relationship of NBTA (via tangibles, empathy and natural resources dimensions) and visitor loyalty. It was found that although visits were likely to recommendation these attractions, there was a lower likelihood for repeat patronage. Furthermore from the study data, it is seen that visitors of NBTA are mainly first timers. Thus, to remain competitive, NBTA in Mauritius should satisfy first time visitors so that they recommend the attraction to others. Future research could investigate the differences between international tourists and local visitors’ perceptions of visitor satisfaction with NBTA. This could assist organizations in appropriately positioning the NBTA and providing the services required by their specific market segments. Another study could use factor analyses to test the validity of the seven-dimension structure instrument as a generic tool to measure satisfaction in NBTA.
95

P. Naidoo et al | IJMMR ♦ Vol. 4 ♦ No. 1 ♦ 2011
REFERENCES Akama, J.S. and Kieti, D. M. (2003). Measuring tourist satisfaction with Kenya's safari: A case study of Tsavo West National Park. Tourism Management, Vol. 2, pp 73-81. Anderson, R.E., and Srinivasan, S.S. (2003). E-satisfaction and e-loyalty: a contingency framework. Psychology & Marketing. 20 (2), 123–138. Backman, K., Backman, S. and Malinovsky, J. (2000). An assessment of service quality in a nature-based tourism setting. Journal of Quality Assurance in Hospitality and Tourism. Vol. 1, No. 2, pp. 9-29. Backman, S. and Crompton, J., (1991). The usefulness of selected variables for predicting activity loyalty. Leisure Sciences, Vol.13, pp. 205–220. Baker, D. and Crompton, J. (2000). Quality, satisfaction and behavioral intentions. Annals of Tourism Research. Vol. 27. pp. 785–804. Buckley, R., Pickering, C.M. and Weaver, D. (2003). Nature-based Tourism, Environment and Land Management. UK: CABI Publishing. Central Statistics Office (2008). Digest of International Travel and Tourism Statistics 2008, Ministry of Finance and Economic Empowerment, Vol. 35, pp. 1-55. Chen, J. S. and Gursoy, D. (2001). An investigation of tourists' destination loyalty and preferences. International Journal of Contemporary Hospitality Management. vol. 13, no. 2, pp. 79-85. Cronin, J. and Taylor, S. (1992). Measuring service quality: a re-examination and extension. Journal of Marketing. vol. 56, no. 3, pp. 55-68. Flavian, C., Martinez, E., and Polo, Y. (2001). Loyalty to grocery stores in the Spanish market of the 1990s. Journal of Retailing and Consumer Services. No. 8, pp 85–93. Frochot, I. and Hughes, H. (2000). HISTOQUAL: The development of a historic houses assessment scale. Tourism Management. Vol. 21, No. 2, pp 157- 167. Frochot, I. (2003). An analysis of regional positioning and its associated food images in French tourism regional brochures. Journal of Travel and Tourism Marketing. Vol. 14, pp. 77–96. Goeldner, C. Ritchie, J. and McIntosh, R. (2000). Tourism: Principles, Practices, Philosophies, New York: Wiley. Gunn, C. (1988). Vacationscape: Designing Tourist Regions. (2nd ed). New York: Van Nostrand Reinhold. Holloway, L. C. (1995). The business of Tourism. (4th ed). New York: Longman. Howan, G., Crilley, G. and McGrath, R. (2008). A Focused service quality, benefits, overall satisfaction and loyalty model for public aquatic centres. Managing Leisure. Vol. 13, pp. 139-161. Jenkins, John and Pigram, John (2003) Encyclopedia of Leisure and Outdoor Recreation. United Kingdom: Routledge.
96

INTERNATIONAL JOURNAL OF MANAGEMENT AND MARKETING RESEARCH ♦Volume 4 ♦ Number 1 ♦ 2011
Kim, S.S., Lee, C. K. and Klenosky, D.B. (2002). The influence of push and pull factors at Korean national parks. Tourism Management. Vol. 24, pp. 169-180. Kozak, M. and Rimmington, M. (2000). Tourist satisfaction with Mallorca, Spain, as of season holiday destination. Journal of Travel Research, Vol. 38, pp. 260 - 269. Laarman, J.G. and Durst, P.B (1987). Nature travel in the tropics. Journal of Forestry. Vol. 85, No. 5. pp. 43–46. McKercher, B. (1998). The Business of Nature-based Tourism. Australia: Hospitality Press. Mehmetoglu, M. (2007). Typologising nature-based tourists by activity- theoretical and practical implications. Tourism Management. Vol. 28, pp. 651-660. Newsome, D., Moore, S.A., & Dowling, R. K. (2002) Natural Area Tourism: Ecology, Impacts and Management. United Kingdom: Channel View Publications. Oliver R. L. (1980). A cognitive model of the antecedents and consequences of satisfaction decisions. Journal of Marketing Research. Vol. 17, pp. 460–69. Oliver, R. (1993). Cognitive, affective and attribute bases of the satisfaction response. Journal of Consumer Research. Vol. 20, pp. 418-430. Oliver, R.L. (1997). Customer satisfaction: A behavioral perspective on the consumer. New York: McGraw-Hill. Oppermann, M. (2000). Tourism destination loyalty. Journal of Travel Research, Vol. 39, pp. 78-84. Parasuraman, A., Zeithaml, V.A. and Berry, L.L. (1988). SERVQUAL: A multiple-item scale for measuring consumer perceptions of service quality. Journal of Retailing, Vol.64, No.1.pp. 12-40. Pigram, J.J. (1983). Outdoor Recreation Resource Management. London: CroomHelm. Prideaux, B. (2002). Building visitor attractions in peripheral areas. International Journal of Tourism Research. Vol. 4, pp 379-391. Prato, T. (2006). Using multi-criteria design analysis in natural resource management, UK: Ashgate Publishing. Richards, G. (2001). Cultural Attractions and European Tourism.UK: CABI Publishing. Smith, R. (1998). Visitors attractions in Scotland. In tourism in Scotland (R. McLellan and R. Smith, Eds) pp. 187-208, UK: International Thompson Business Press. Swarbrooke, J. (2000). Sustainable Tourism Management. Wallingford: CABI International. Tse, D. and Wilton, P. (1988). Models of consumer satisfaction formation: an extension. Journal of Marketing Research. Vol. 25, pp. 204-12. Valentine, P. S. (1992). Review: nature-based tourism. In B. Weiler, & C.M. Hall (Eds.), Special interest tourism (pp. 105-127). London, England: Belhaven.
97

P. Naidoo et al | IJMMR ♦ Vol. 4 ♦ No. 1 ♦ 2011
Walker, J. L. (1995). Service encounter satisfaction: conceptualized. Journal of Services Marketing. Vol. 9, No. 1, pp. 5-14. Wright, P. (1996). North American ecotourism markets: motivations, preferences, and destinations. Journal of Travel Research. Vol. 34, No. 5. pp. 3-10. Yüksel, A., Rimmington, M. (1998). Customer-satisfaction measurement. Cornell Hotel and Restaurant Administration Quarterly. Vol. 39, No. 6, pp. 60-71. Yüksel, A., Yüksel, F. (2002). Measurement of tourist satisfaction with restaurant services: a segment-based approach. Journal of Vacation Marketing. Vol. 9, No. 1, pp. 52-68. ACKNOWLEDGEMENT The authors would like to thank the editor and the anonymous reviewers for their comments. BIOGRAPHY Perunjodi Naidoo is a lecturer of Tourism at the University of Technology, Mauritius. Her research interests include tourism marketing, sustainable tourism and service quality. She can be contacted at the School of Sustainable Development and Tourism, University of Technology Mauritius, La Tour Koenig, Pointe aux Sables. Email: [email protected] Prabha Ramseook-Munhurrun is a lecturer of Services Management at the University of Technology, Mauritius. Her research interests include service quality, customer satisfaction and tourism marketing. She can be contacted at the School of Sustainable Development and Tourism, University of Technology Mauritius, La Tour Koenig, Pointe aux Sables. Email: [email protected] Premita Seegoolam is a former undergraduate student at the School of Sustainable Development and Tourism.
98

REVIEWERS
The IBFR would like to thank the following members of the academic community and industry for the much appreciated contribution as reviewers.
Vera Adamchik University of Houston-VictoriaYousuf Al-Busaidi Sultan Qaboos UniversityGlyn Atwal Groupe Ecole Supérieure de Commerce de RennesSusan C. Baxter Bethune-Cookman CollegeKarel Bruna University of Economics-PragueWan-Ju Chen Diwan College of ManagementLeonel Di Camillo Universidad AustralSteven Dunn University of Wisconsin OshkoshWilliam Francisco Austin Peay State UniversityLucia Gibilaro University of BergamoDanyelle Guyatt University of BathZulkifli Hasan Islamic University College of MalaysiaTejendra N. Kalia Worcester State CollegeAnn Galligan Kelley Providence CollegeHalil Kiymaz Rollins CollegeBohumil Král University of Economics-PragueChristopher B. Kummer Webster University-ViennaMary Layfield Ledbetter Nova Southeastern UniversityXin (Robert) Luo Virginia State UniversityAndy Lynch Southern New Hampshire University
Cheryl G. Max IBMAvi Messica Holon Institute of TechnologyCameron Montgomery Delta State UniversityBilge Kagan Ozdemir Anadolu UniversityDawn H. Pearcy Eastern Michigan UniversityRahim Quazi Prairie View A&M UniversityAnitha Ramachander New Horizon College of EngineeringKathleen Reddick College of St. ElizabethMatthew T. Royle Valdosta State UniversityTatsiana N. Rybak Belarusian State Economic UniversityRafiu Oyesola Salawu Obafemi Awolowo UniversityPaul Allen Salisbury York College, City University of New YorkSunando Sengupta Bowie State UniversitySmita Mayuresh Sovani Pune UniversityJiří Strouhal University of Economics-PragueRamona Toma Lucian Blaga University of Sibiu-RomaniaJorge Torres-Zorrilla Pontificia Universidad Católica del PerúK.W. VanVuren The University of Tennessee – MartinVeronda Willis The University of Texas at San Antonio Eduardo Sandoval Universidad de ConcepciónM. Shahadat Hossain SUNY Potsdam

ARBITROSEl IBFR agradece a los siguientes miembros de nuestro cuerpo de Ad-Hoc Reviewers por su contribución académica.
María Antonieta Andrade Vallejo Instituto Politécnico NacionalOlga Lucía Anzola Morales Universidad Externado de ColombiaAntonio Arbelo Alvarez Universidad de la LagunaHector Luis Avila Baray Instituto Tecnologico De Cd. CuauhtemocGraciela Ayala Jiménez Universidad Autónoma de QuerétaroSheila Nora Carrillo Incháustegui Univ. Peruana Cayetano HerediaMaría Antonia Cervilla de Olivieri Universidad Simón BolívarSemei Leopoldo Coronado Ramírez Universidad de GuadalajaraTomás J. Cuevas-Contreras Universidad Autónoma de Ciudad JuárezJavier de León Ledesma Univ. de Las Palmas de Gran Canaria -TafiraCarlos Fong Reynoso Universidad de GuadalajaraArturo Hernández Universidad Tecnológica CentroamericanaLourdes Jordán Sales Universidad de Las Palmas de Gran CanariaSantiago León Ch., Universidad Marítima del CaribeGraciela López Méndez Universidad de Guadalajara-JaliscoVirginia Guadalupe López Torres Univ. Autónoma de Baja CaliforniaAngel Machorro Rodríguez Instituto Tecnológico de OrizabaOmaira Cecilia Martínez Moreno Univ. Autónoma de Baja CaliforniaAlaitz Mendizabal Zubeldia Univ. del País Vasco/ Euskal Herriko U.Juan Nicolás Montoya Monsalve Univ Nacional de Colombia-ManizalesAlberto Elías Muñoz Santiago Fundación Universidad del Norte
Juan Carlos Robledo Fernández Universidad EAFIT-Medellin Universidad Tecnologica de Bolivar José Gabriel Ruiz Andrade Univ. Autónoma de Baja CaliforniaJuan Manuel San Martín Reyna Univ. Autónoma de TamaulipasFrancisco Sanches Tomé Instituto Politécnico da GuardaDeycy Janeth Sánchez Preciado Universidad del CaucaMaría Cristina Sánchez Romero Instituto Tecnológico de OrizabaPol Santandreu i Gràcia, Universitat de Barcelona Santandreu ConsultorsVictor Gustavo Sarasqueta Universidad Argentina de la Empresa UADEJaime Andrés Sarmiento Espinel Universidad Militar de Nueva GranadaLorena Vélez García Universidad Autónoma de Baja CaliforniaAlejandro Villafañez Zamudio Instituto Tecnologico de MatamorosHector Rosendo Villanueva Zamora Universidad MesoamericanaAlfonso Rodríguez Ramírez Universidad Libre Seccional CaliNeyda Cardozo Sánchez Universidad Nacional Experimental de TáchiraBenjamin Castillo Osorio Universidad del Sinú-Sede MonteriaLuz Stella Pemberthy Gallo Universidad del CaucaAdolfo León Plazas Tenorio Universidad del CaucaLuis Eduardo Sandoval Garrido Universidad Militar de Nueva GranadaOskar Villarreal Larrinaga Univ. del País Vasco/Euskal Herriko Univ.Adriana del Carmen Rodríguez Guardado Universidad de Guadalajara

HOW TO PUBLISH
Submission Instructions
The Journal welcomes submissions for publication consideration. Authors wishing to submit papers for publication consideration should e-mail their manuscripts to [email protected]. Complete directions for manuscript submission are available at the Journal website www.theIBFR.com. Papers may be submitted for initial review in any format. However, authors should take special care to address spelling and grammar issues prior to submission. Authors of accepted papers are required to precisely format their document according to the guidelines of the journal.
There is no charge for paper reviews. The normal review time for submissions is 90-120 days. However, authors desiring a quicker review may elect to pay an expedited review fee. Authors who pay the expedited review fee are guaranteed an initial review within two weeks of submission and receipt of the fee. Authors of accepted papers are required to pay a publication fee based on the length of the manuscript. Please see our website for current publication and expedited review rates.
Authors submitting a manuscript for publication consideration must guarantee that the document contains the original work of the authors, has not been published elsewhere, and is not under publication consideration elsewhere. In addition, submission of a manuscript implies that the author is prepared to pay the publication fee should the manuscript be accepted.
Subscriptions
Individual and library subscriptions to the Journal are available. Please contact us by mail or by email to: [email protected] for updated information.
Contact Information
Mercedes Jalbert, Managing Editor The IBFRP.O. Box 4908Hilo, HI [email protected]
Website
www.theIBFR.org or www.theIBFR.com

Review of Business & Finance Case Studies Review of Business and Finance Case Studies publishes high-quality case studies in all areas of business, finance and related fields. Cases based on real world and hypothetical situations are welcome.
All papers submitted to the Journal are double-blind reviewed. The RBFCS is listed Cabell, Ulrich’s Periodicals Directory. The Journal is distributed through SSRN and EBSCOHost publishing, with presence in over 70 countries.
The journal accept rate is between 15 and 25 percent
REVIEW BUSINESS &FINANCE CASE STUDIES
of Business Education & AccreditationBE A
AT Accounting
Taxation&
Accounting and Taxation (AT)
Accounting and Taxation (AT) publishes high-quality articles in all areas of accounting, auditing, taxation and related areas. Theoretical, empirical and applied manuscripts are welcome for publication consideration.
All papers submitted to the Journal are double-blind reviewed. BEA is listed Cabell, Ulrich’s Periodicals Directory. The Journal is distributed through SSRN and EBSCOHost publishing, with presence in over 70 countries.
The journal acceptance rate is between 5 and 15 percent.
Business Education and Acreditation (BEA)Business Education & Accreditation publishes high-quality articles in all areas of business education, curriculum, educational methods, educational administration, advances in educational technology and accreditation. Theoretical, empirical and applied manuscripts are welcome for publication consideration.
All papers submitted to the Journal are double-blind reviewed. BEA is is listed Cabell, Ulrich’s Periodicals Directory. The Journal is distributed through SSRN and EBSCOHost publishing, with presence in over 70 countries.
The journal acceptance rate is between 15 and 25 percent.
PUBLICATION OPPORTUNITIES