II. ARS Portfolio and Performance III. Market Review: Absolute ...
50
-
Upload
khangminh22 -
Category
Documents
-
view
1 -
download
0
Transcript of II. ARS Portfolio and Performance III. Market Review: Absolute ...

Agenda
2
I. ARS Program: A Year in ReviewII. ARS Portfolio and PerformanceIII. Market Review: Absolute ReturnIV. Conclusions
Section I
3
4
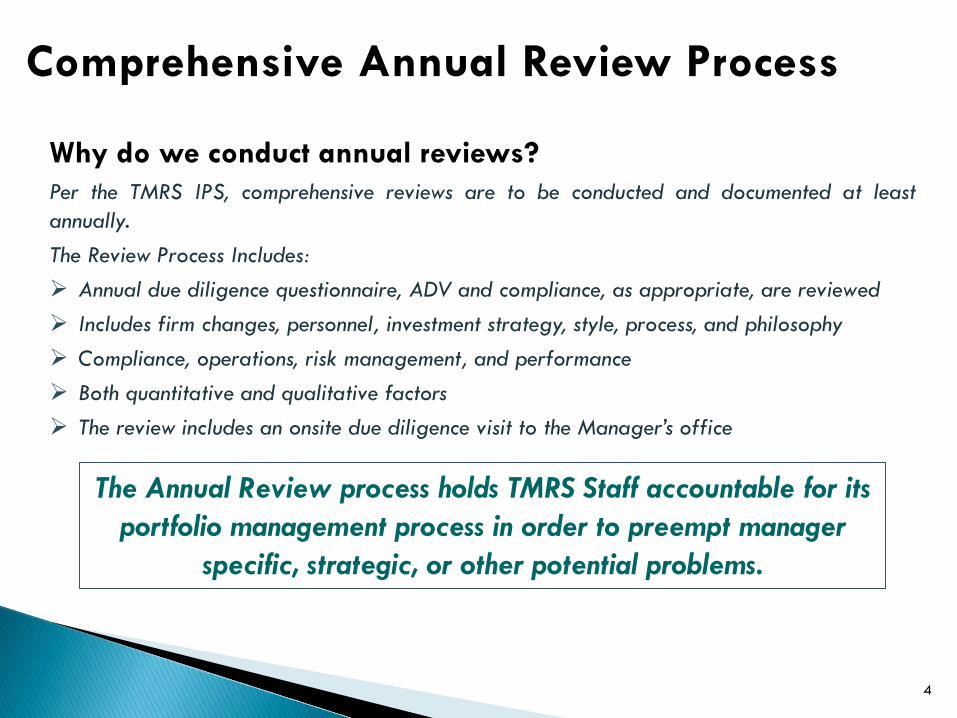
Comprehensive Annual Review Process
Why do we conduct annual reviews?Per the TMRS IPS, comprehensive reviews are to be conducted and documented at leastannually.The Review Process Includes: Annual due diligence questionnaire, ADV and compliance, as appropriate, are reviewed Includes firm changes, personnel, investment strategy, style, process, and philosophy Compliance, operations, risk management, and performance Both quantitative and qualitative factors The review includes an onsite due diligence visit to the Manager’s office
The Annual Review process holds TMRS Staff accountable for its portfolio management process in order to preempt manager
specific, strategic, or other potential problems.

5
Absolute Return Initiatives Accomplished: Annual Review
• Develop a blueprint to implement a Direct Absolute Return Investment Program
• Establish a due-diligence process to identify “best in class” manager opportunities
• Initiate & execute on manager selection, negotiation, and funding while maintainingconsideration of portfolio construction and diversification looking forward 2 years
• Progress Direct Absolute Return Portfolio towards a state of “fully invested” whilemanaging redemption timing, rebalancing challenges, and capacity constraints
• Construct and maintain the ARS Direct portfolio to accomplish TMRS’ investmentobjectives
• Monitor existing portfolio. Source, research, and pursue new strategies and co-invest opportunities
• Finalize transition from BAAM Treaty Oak to Direct Portfolio
Status
ARS Program Review
Managerial prioritization, Staff experience and partner resources enabled TMRS to develop a path toensure this outcome was accomplished
Sourcing, investment and operational due diligence, and leveraging Staff and partner relationships werekey factors enabling the identification of opportunities
Recommendations and approval of selected manager investments and funding are executed on a dynamictimeline taking into account anticipated portfolio diversification and market regimes
Active decisions to weight managers and rebalance based on constraints are made in real time (Nov. 2016Internal Memo)
$2.3 billion of ARS Direct capital deployed since Jan. 1, 2016. The risk/return profile of the Directportfolio achieves TMRS investment objectives
Additional strategies, including fund style co-invests, may be used to further optimize the portfolio as well as blend down fees with existing funds

6
Portfolio Management InitiativesBecoming a Strategic Partner
Fund of Funds
Direct Fund
Strategic Capital
Direct Investor
More Expensive
More Specialized Expertise
Asset Managers
Sophisticated Institutions
Sophisticated Institutions
Separate Accounts, Co-
Invest, etc.
Sophisticated Institutions
Resourced Institutions
Resourced Institutions
Resource Constrained Institutions

7
ARS Program Review Direct Funding Timeline
2016
Total Direct Initial Subs: $990 millionTotal Additional Subs: $215 million
$1,205 billion
2017
Total Direct Initial Subs: $353 millionTotal Additional Subs: $330 million
$683 million
• Macro (2)• LSE (4)• ED (1)• Credit (3)• MS (1)• RV (2)• CTA (1)
• RV (2)• MS (1)• Macro (1)
• Credit (3)• MS (1)• Macro (1)• RV (1)
2018
Total Direct Initial Subs: $550 millionTotal Additional Subs: No addl. subs
$550 million
2019
Total Direct Initial Subs: $500 millionTotal Additional Subs: $10 million
$510 million
• Macro (2)• RV (1)• Credit (1)
2020
Total Direct Initial Subs: No new initialTotal Additional Subs: $125 million
$125 million
• No New Initial Subscriptions
Current Direct Investment Vehicles: 23
Total Direct Capital Approved: $3.2 billion
Total Direct Capital Invested:$3.0 billion
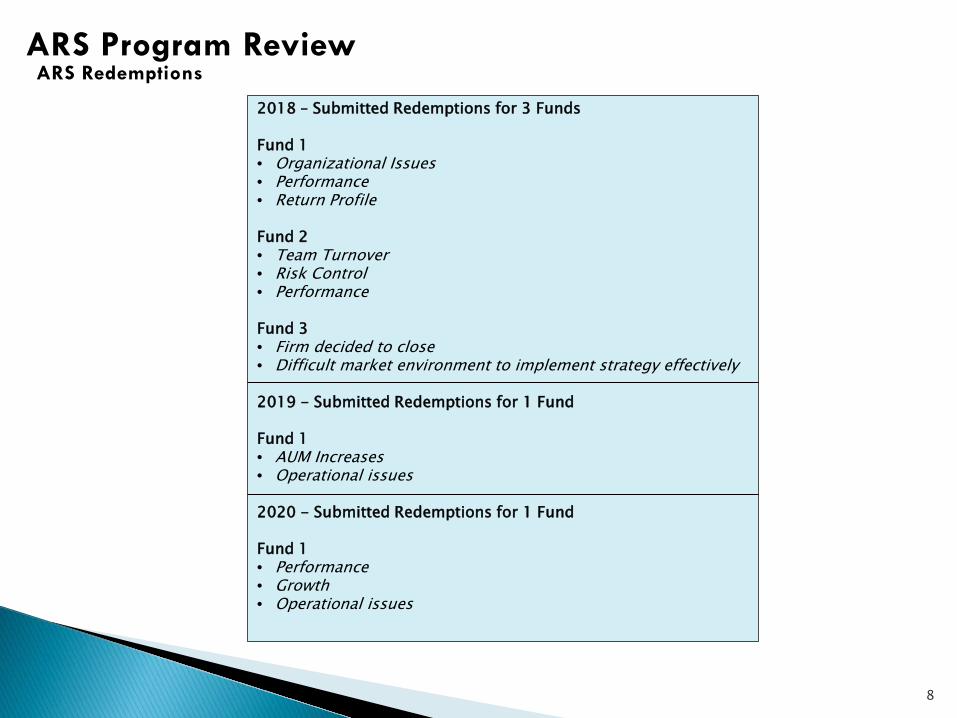
ARS Program Review ARS Redemptions
2018 – Submitted Redemptions for 3 Funds
Fund 1• Organizational Issues• Performance• Return Profile
Fund 2• Team Turnover• Risk Control• Performance
Fund 3• Firm decided to close• Difficult market environment to implement strategy effectively
2019 - Submitted Redemptions for 1 Fund
Fund 1• AUM Increases• Operational issues
2020 - Submitted Redemptions for 1 Fund
Fund 1• Performance• Growth• Operational issues
8

ARS Program Review Portfolio Additions 2020 YTD
(Mar-2020) Multi-Strategy Fund +$20M• Diversification• Manager sizing• Return Potential
(Apr-2020) Macro Fund +$20M• Additional capacity granted to select investors
(Apr-2020) Relative Value Fund +$50M• Favorable market environment prospectively• Reduced mgmt. fee
(May-2020) Credit Fund +$25M• Favorable market environment prospectively• Limited capacity
(Jun-2020) Multi-Strategy Fund +$30M• Compelling opportunities for Fund to take advantage of• Limited capacity
(Apr-2020) Macro Fund +$36M• Additional capacity granted to select investors
9

10
ARS Team ExperienceMarc Leavitt24 years experienceConsultant, Hedge Fund, Family Office, EndowmentMBA, Charter Alternative Investment Analyst Designation
Kevin Notaro16 years experience Investment Management (Fund of Hedge Funds)Finance Major
Frank Atkins21 years experience Equity Research, ConsultantMBA, CFA
Timothy Sweeney16 years experience Hedge Fund, Investment BankFinance Major
CIOTJ
Carlson
Admin. SupportCindy MorseDebbie West
OperationsSally Case
Geldon VllahuPeter Jeske
Risk ManagementDimitry ShishkoffMelissa JerkinsRyan ConnerJanine Prukop
Private EquityTom Masthay
Peter TenerielloCelisse Cobos
ComplianceKurt Cressotti
Absolute Return TeamMarc Leavitt (6 years TMRS)Kevin Notaro (3 years TMRS)Frank Atkins (1 year TMRS)Timothy Sweeney (new to team)
Real AssetsEddie Schultz
Melody BickerstethYvonne HuangJosh Garcia
Public EquityKristin Qualls
Fixed IncomeJason Weiner
German GaymerJacob Bowland
ARS Program ReviewARS Staff Resources
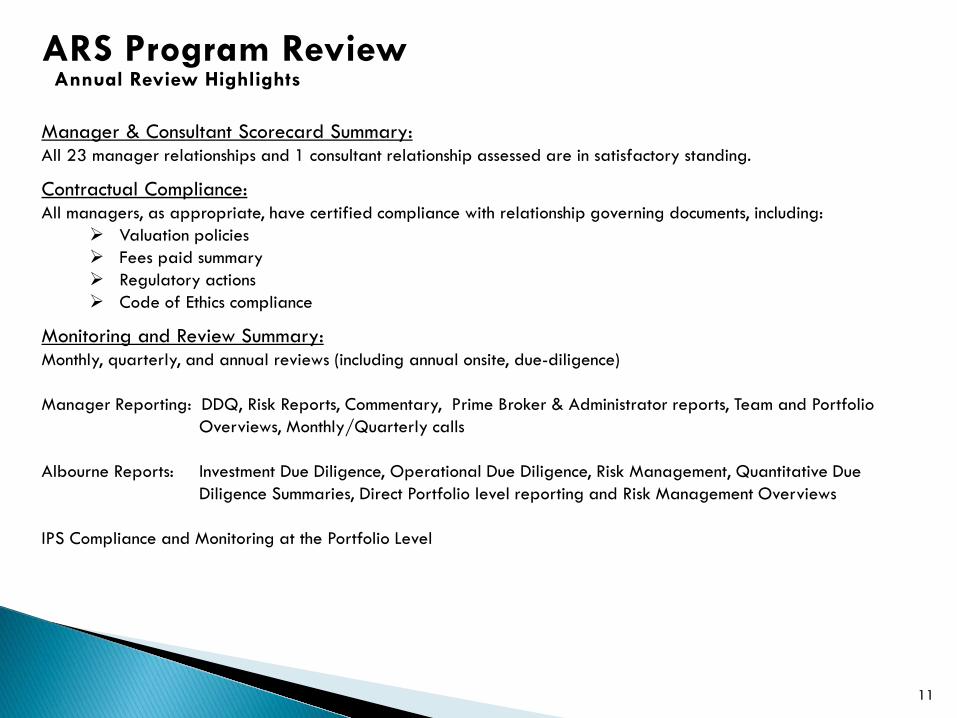
ARS Program Review Annual Review Highlights
Manager & Consultant Scorecard Summary:All 23 manager relationships and 1 consultant relationship assessed are in satisfactory standing.
Contractual Compliance: All managers, as appropriate, have certified compliance with relationship governing documents, including:
Valuation policies Fees paid summary Regulatory actions Code of Ethics compliance
Monitoring and Review Summary:Monthly, quarterly, and annual reviews (including annual onsite, due-diligence)
Manager Reporting: DDQ, Risk Reports, Commentary, Prime Broker & Administrator reports, Team and Portfolio Overviews, Monthly/Quarterly calls
Albourne Reports: Investment Due Diligence, Operational Due Diligence, Risk Management, Quantitative Due Diligence Summaries, Direct Portfolio level reporting and Risk Management Overviews
IPS Compliance and Monitoring at the Portfolio Level
11

ARS Program Review Additional Information
ARS Team Activities2015 Total Manager Meetings: 3122016 Total Manager Meetings: 2762017 Total Manager Meetings: 2402018 Total Manager Meetings: 2672019 Total Manager Meetings: 3342020 Total Manager Meetings: 293*ARS Total Manager Meetings: 1722
Credit: 274Macro/CTA: 278L/S Equity: 235Relative Value: 226Multi-Strategy: 154Event Driven: 69Fund of Fund: 100Consultant: 127Economists: 26Other: 233
* As of August 7, 2020
12
On-site manager meetings have not
occurred since Covidrelated lockdowns began. Traditional phone calls as
well as video conferencing have taken the lead role for speaking
with managers.
13
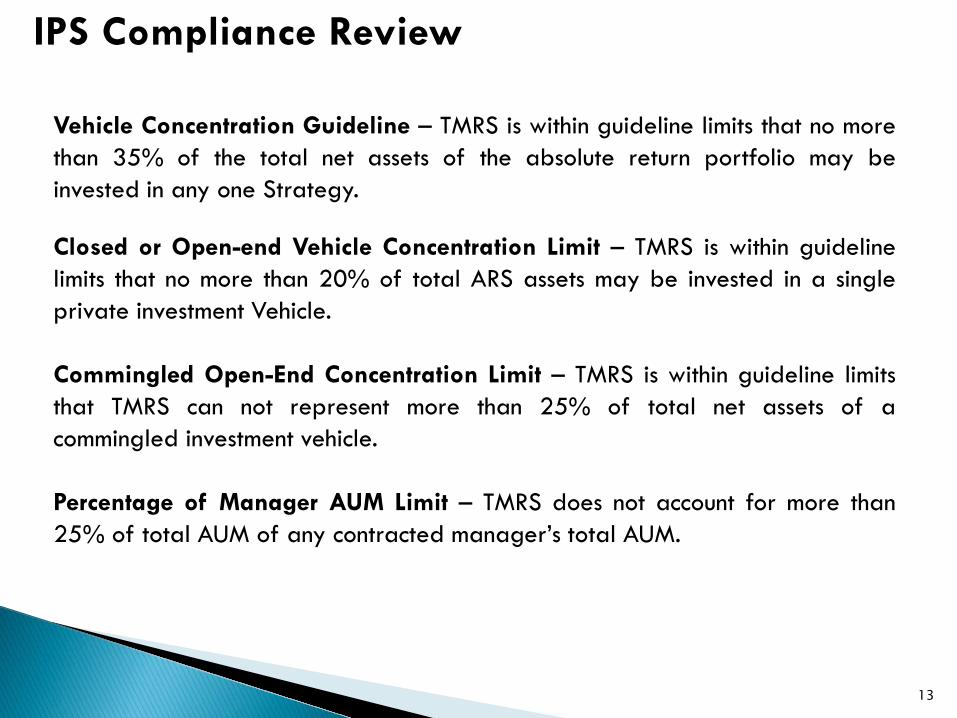
IPS Compliance Review
Vehicle Concentration Guideline – TMRS is within guideline limits that no morethan 35% of the total net assets of the absolute return portfolio may beinvested in any one Strategy.
Closed or Open-end Vehicle Concentration Limit – TMRS is within guidelinelimits that no more than 20% of total ARS assets may be invested in a singleprivate investment Vehicle.
Commingled Open-End Concentration Limit – TMRS is within guideline limitsthat TMRS can not represent more than 25% of total net assets of acommingled investment vehicle.
Percentage of Manager AUM Limit – TMRS does not account for more than25% of total AUM of any contracted manager’s total AUM.

Section II
14

Absolute Return Asset Class Objectives
IPS Stated Objective for the Absolute Return Portfolio:“The Absolute Return portfolio is used to provide both favorable stand-
alone, risk-adjusted returns as well as diversification for the overall plan.”A primary goal of the annual review presentation is to discuss the AbsoluteReturn portfolio and its construction relative to IPS stated performance goals &implementation objectives:
Benchmark Performance Goals: Long-term performance goal is a rate of return of 3-month LIBOR + 4%, net of investment
management fees.
The current (periods less than 5 years) strategic benchmark is the HFRI Fund of FundDiversified Index, net of investment management fees, with similar risk relative to thebenchmark
Additionally, as documented in the IPS, the absolute return portfolio is expected to generatereturns net of all fees and expenses, in excess of their respective indices, over rolling fiveyear investment time horizons.
15

Absolute Return Asset Class Objectives
The Direct Portfolio is designed to accomplish the following primary goals:
Decrease total portfolio risk
Potentially increase portfolio returns (as a Fixed Income substitute)
Provide performance with low correlation to traditional asset classes
Attractive risk-adjusted returns over the long-term
Seek to generate positive returns regardless of traditional market
benchmark returns
Seek to capture Alpha: a manager’s rate of return in excess of that which
can be explained by its systematic risk (represented by Beta)
16

Absolute Return Asset Class as a DiversifierDiversifying during Equity Market Downturns
Hedge funds in traditional portfolios provides diversification
17

18
Absolute Return Asset Class as a Diversifier
Source: JPMAAM.
The benefits of adding a core diversified hedge fund allocation to different stock/bond portfolios

19
Broad Sources of Risk
Source: RVK
ARS team is looking across a multitude of investment strategies to build out the portfolio.
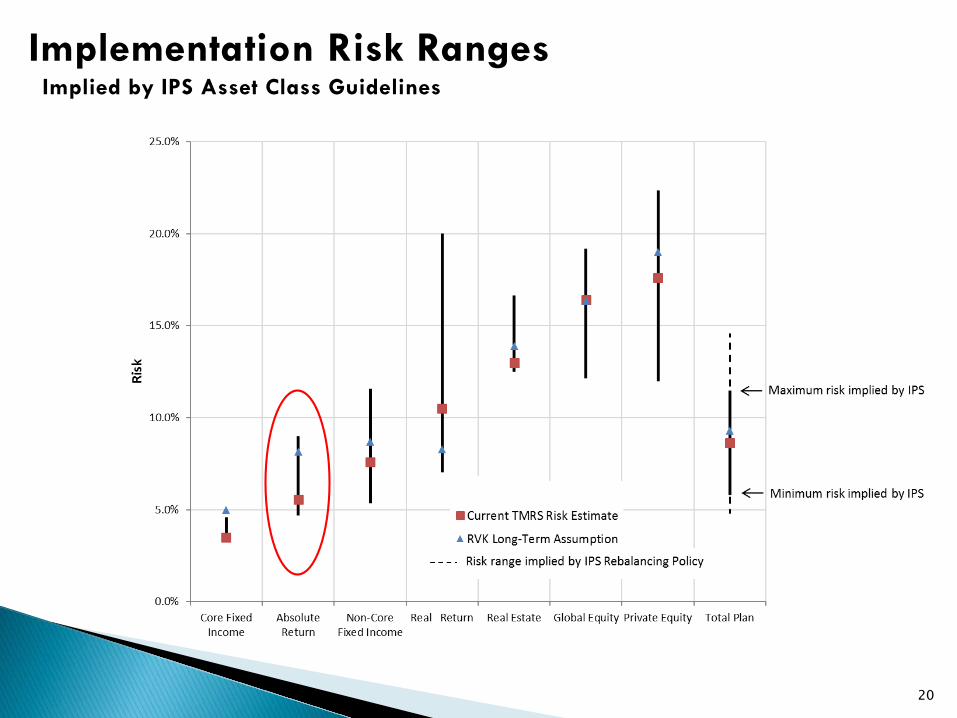
20
Implementation Risk Ranges Implied by IPS Asset Class Guidelines

21
Portfolio Line Items and Volatility
Source: Aksia
ARS portfolio is diversified, yet maintains adequate levels of risk.
TMRS ARS Portfolio

Balanced/Uncorrelated:AHL PDTDE Shaw ValenceStone Oak (& Select)AlpstoneSymmetry
Risk Reducers:AlyeskaGraticuleVardeDSAMEast LodgeBG FundRed CliffSouthern RidgesCerberusBayviewEislerDiameter
ReturnEnhancers:MyriadSouthpointPharoRedmileVarde AsiaInfinity Q
22
Sizing of managers is based on both qualitative and quantitative factors along with risk/reward profiles.

23
Source: State StreetEstimates as of August 1, 2020
Portfolio Exposures
ARS’ diversification remains balanced across strategies.*Prospective portfolio exposure with full
allocation to Varde Asia and Stone Oak

24
ARS portfolio has been built to be well diversified from a geographical standpoint.

25
Hedge Fund Returns
Source: Boomerang Capital, Credit Suisse Hedge Indices
ARS’ diversification remains balanced across strategies.

26
Hedge Fund Returns
ARS’ diversification remains balanced across strategies.
1Data sourced from UBS Capital Introduction, Hedge Fund Research Inc. (HFR Inc.), Hedge Fund Intelligence (HFM Global), and Eurekahedge. Report generated by Edgefolio for Cap Intro.Dispersion of returns is from January 2020 – July 2020.
Active management is critical for identifying top hedge fund strategies

27Source: State Street Investment Analytics
Performance/Limiting Losses
Sub $500M Invested

28Source: State Street Investment Analytics
*October 2014 – June 2020
Performance

29Source: State Street Investment Analytics
Performance
MKT VALUE
% of Plan
1 Month
3 Months YTD 1-YR 3-YR ITD
Incept Date
TMRS - ABSOLUTE RETURN DIRECT $2,955M 9.9% 1.44 5.61 -0.22 1.54 3.97 4.38 1-1-16 HFRI FOF DIVERSIFIED INDEX 1.70 7.28 -0.97 0.93 2.65 2.37 1-1-16Excess -0.26 -1.68 0.75 0.61 1.31 2.01

30
Performance
Source: Albourne Risk Report
*Portfolio returns are Proforma from Oct 2014 thru Dec 2015, at which point TMRS ARS direct portfolio begins.
31
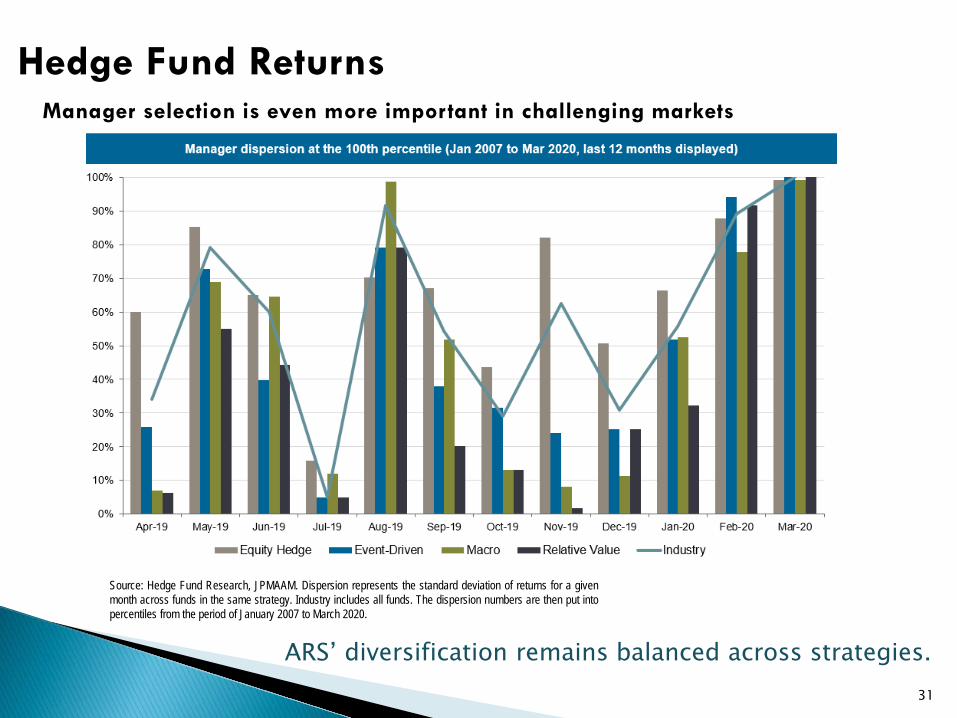
Hedge Fund Returns
ARS’ diversification remains balanced across strategies.
Source: Hedge Fund Research, JPMAAM. Dispersion represents the standard deviation of returns for a givenmonth across funds in the same strategy. Industry includes all funds. The dispersion numbers are then put intopercentiles from the period of January 2007 to March 2020.
Manager selection is even more important in challenging markets

Average returns (3 year rolling) have compressed post crisis when considering prevailing Libor rates.
32Source: Barclays, HFR, BloombergData thru Jun-20
Historical ReturnsHedge Fund Libor Premium
• Macroeconomic environment has changed–and so have expectations.
• The last decade has been an interesting backdrop for the hedge fund industry. Investors have benefited from a long-running bull market, while also having to contend with historically low interest rates and periods of extreme volatility.

Returns, on a risk-adjusted basis, are in line with pre-crisis profiles. Volatility remains relatively low while stocks and bonds are near highs.
33
Source: HFRI, CBOE, MSCI, FactSet, J.P. Morgan Asset Management
Historical ReturnsHedge Funds & Volatility
34Source: HFR, Barclays
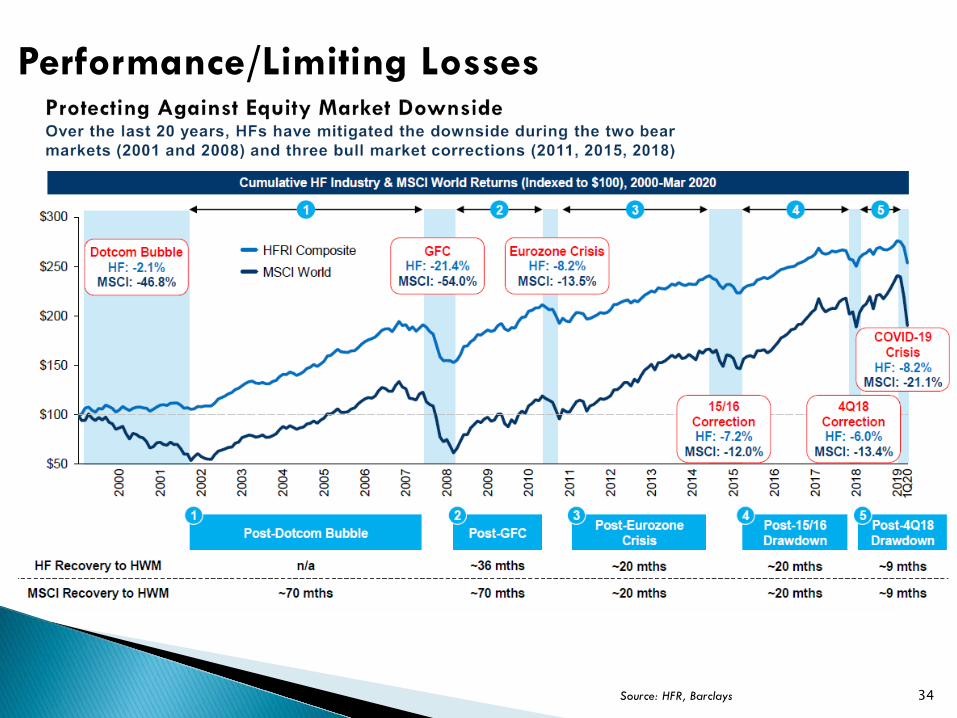
Performance/Limiting Losses

35Source: HFR, Barclays
Performance/Limiting Losses

36
The Importance of Limiting Losses
Source: JP Morgan
ARS’ priority on downside protection in market pullbacks.Warren Buffett – “Rule No. 1: Never lose money. Rule No. 2: Never forget rule No. 1.”
Based on monthly returns over the past 15 years through June 2020.

Section III
37

38
Market Outlook
Source: Infinity Q Capital Management Research

39
Market VolatilityS&P 500 vs VIX Volatility Index

40
Bear Market ComparisonsShortest bear market in the history of the S&P 500

41
Bear Market – Underlying S&P 500 SectorsDispersion amongst sectors is great

42
Economic Stimulus Crisis Response
Source: McKinsey

43
Source: Albourne HedgeRS Indices. * Based on fund returns/estimates received as at 14-Jul-2020. Past performance is not necessarily indicative of future results.
Strategy Super Strategy Jan-20 Feb-20 Mar-20 1Q 2020 Apr-20 May-20 Jun-20 2Q 2020 YTD
HF Universal HF Universal 0.0% -1.3% -6.9% -8.0% 3.2% 2.2% 1.9% 7.4% -1.6%
CB Arbitrage Relative Value 0.6% 0.5% -8.1% -7.1% 3.9% 1.6% 3.1% 8.8% 0.6%
Fixed Income Arbitrage Relative Value 0.9% 0.2% -2.7% -1.7% 2.4% 1.6% 1.1% 5.2% 4.0%
Fundamental Equity MN Relative Value -0.2% 0.1% -3.0% -3.2% 2.5% 0.3% 1.7% 4.6% 1.5%
Quantitative Equity MN Relative Value -0.2% -2.5% -3.6% -6.2% 0.9% -0.5% 0.6% 1.0% -5.3%
Relative Value Credit Relative Value 0.8% 0.3% -6.2% -5.2% 2.3% 1.4% 2.1% 6.0% 0.6%
Statistical Arbitrage Relative Value -0.4% -1.0% -2.0% -3.4% 3.7% 0.9% 2.1% 6.7% 3.0%
Structured Credit - Relative Value Relative Value 1.2% -0.4% -20.2% -19.6% 0.9% 3.3% 4.7% 9.0% -11.9%
Relative Value Relative Value 0.5% -0.4% -7.7% -7.6% 2.1% 1.4% 2.1% 5.8% -2.3%
Activist Event Driven -1.0% -6.7% -19.2% -25.3% 11.4% 4.6% 2.5% 19.4% -10.7%
Distressed / Restructuring Event Driven 0.1% -1.5% -13.2% -14.3% 3.3% 2.7% 2.2% 8.5% -6.9%
Emerging Market Fixed Income Event Driven 0.1% -1.7% -14.5% -15.9% 1.5% 6.0% 3.2% 11.1% -6.0%
Risk Arbitrage Event Driven 0.2% -1.0% -8.9% -9.6% 5.1% -0.2% 0.5% 5.4% -4.3%
Event Driven Event Driven -0.4% -2.7% -13.1% -15.8% 5.5% 2.6% 2.7% 11.2% -6.3%
Asia Pacific Long / Short Equity Long/Short -0.8% 0.5% -6.8% -7.1% 5.0% 1.9% 4.6% 11.9% 4.2%
Emerging Markets Long / Short Equity Long/Short 0.0% -3.1% -8.2% -11.0% 3.0% 0.7% 3.4% 7.3% -4.9%
European Long / Short Equity Long/Short 0.5% -2.5% -5.7% -7.7% 3.7% 1.1% 2.0% 6.9% -1.6%
Japan Long / Short Equity Long/Short -0.4% -2.8% -3.4% -6.4% 2.4% 1.3% 0.4% 4.1% -3.2%
US Long / Short Equity Long/Short -0.5% -2.5% -7.1% -9.8% 4.5% 2.3% 0.9% 7.9% -2.2%
Equity L/S Equity Long/Short -0.3% -1.9% -7.1% -9.1% 5.2% 3.2% 2.0% 10.7% 0.4%
CTA Directional 1.4% -1.5% 0.7% 0.6% -0.2% -0.6% -0.7% -1.5% -1.1%
Global Asset Allocation Directional 0.4% -1.3% -3.5% -4.3% 0.6% -0.2% -0.1% 0.4% -3.8%
Global Macro Directional -0.5% 0.2% -2.2% -2.5% 1.6% 1.5% 2.0% 5.1% 3.0%
Insurance Directional 0.6% 0.5% -0.3% 0.8% 0.0% 0.6% 0.8% 1.4% 2.0%
Directional Directional 0.3% -0.6% -2.0% -2.3% 0.8% 1.3% 0.4% 2.5% -0.4%

44
• The 2nd quarter of 2020 saw a remarkable rally in risk assets, on the heels of the record-setting Feb.-March marketdrawdown. The MSCI ACWI TR was up 20%, while IG/HY bonds and commodities were up 9-10% and 13.3%.
• Structured Credit Relative Value strategy continues to recover from the March lows, with the strategy (Asset-Weighted) indexgaining +4.8% in June 2020 on the heels of a strong May (+3.5%). CLOs have rallied for three straight months. Outperformancewas driven by exposure to riskier tranches that are mostly held by hedge funds. In spite of the significant 2Q rally, StructuredCredit remains the worst-performing hedge fund sub-strategy YTD (-13%), due to the severity of the March correction in thespace.
• Equity L/S strategies posted strong gains in 2Q in concert with the global rally in equities. The broad index (Asset-Weighted) isnow up 2.7% YTD. Regionally, Asia Pacific Long/Short has outperformed (+10% YTD) it’s counterparts with the strategycontinuing to produce significant alpha. For US managers positive performance was led by the long book in June. Specifically,long exposure to Technology and Consumer Discretionary drove performance. In the latter part of May we had a significant factorsell-off and the rotation into Value led to a degradation of alpha for many managers. The rotation was short-lived as it continuedonly up to the second trading week of June, as Momentum and Growth again took authority of the market, leading to a reboundin alpha for the strategy in the second half of the month.
• Convertible Bond Arbitrage managers posted significant gains in 2Q, retracing most of March -10.3% drawdown, to finish flatYTD. Gains continued to be driven by new issue trades primarily. June was another strong month for new issuance with $20bn ofgross proceeds and the second highest monthly total on record behind May’s $26bn. This has brought the total issuance in thefirst half of 2020 above the levels since for the whole of 2019. Managers active in SPAC trades also saw strong performance fromthose books as an active month for SPAC M&A deals - and strong performance from those names post-acquisition - provided anuplift across the universe. The broad convertible universe richened slightly in June but still remains cheap. The overall USconvertible market (ICE BofA All US Convertible Index - VXA0 index) is now above +7% YTD as of June 2020 despite the broaderequity market remaining in negative territory.
• Amidst the continued recovery in HY Credit, especially in triple C rated bonds, Relative Value Credit andDistressed/Restructuring strategies continue to retrace their March losses. RVC is now positive YTD (+52bps), whileDistressed/Restructuring is still firmly in negative territory -6.4% YTD.
• CTA managers have struggled in recent months and YTD (-4.7%). June was another predominately negative month for CTAswith the AW Index down -1.3% for the month. Similar to May (-1%), some of the bigger losses were in commodities and FX(long USD) as the market recovery continued. Leverage still remains lower than normal due to volatility remaining elevated, butvol targets and VaR are at more normal levels compared to previous months.

• Market volatility YTD highlights value of uncorrelated strategies• The trend into Private Equity continues, while investors have also been
committing to various Private Credit strategies given the dislocation andpickup in defaults
• The next area of interest appears to be less correlated hedge fund strategiesas a proxy for the lost protective characteristics of bonds; despite this,Healthcare and Technology ELS also remain popular
• Performance overall has generally been positive• Alternatives performance through June of this year has generally been
compelling versus traditional assets• The median Albourne client HF portfolio returned -0.96% YTD, and those
with lower beta mandates appear to have done better with a median of 1.55%YTD
• While most areas have held up well, certain strategies such as StructuredCredit have struggled, and investors are reconsidering its suitability withintheir portfolios
• Expect certain managers to continue to see substantial outflows whereperformance has been lagging and decayed further in 2020
45

• What is the future of investment and operational due diligence?• Thus far, Albourne’s due diligence processes have continued uninterrupted;
reduced travel has provided more time for analysts to explore the myriadother complexities of this new environment, communicated to clientsthrough research updates
• Business continuity plans appear to have worked successfully in most cases
• How will the industry deal with a remote workforce?• Asset managers and investors have had to deal with a wide range of new
issues created by homeworking, however a survey of managers showed 100%who believe their key personnel have been able to fulfill their duties and 99%of managers stated they underwent no changes to operational processes
• Going forward there are new security and IT considerations/challenges toensure privacy obligations are met and the risk of data loss is mitigated
• Social issues are impacting asset management• Interest in ESG and D&I related initiatives has picked up dramatically;
Albourne is launching a new D&I questionnaire imminently and recentlypublished an ESG primer
46
Hedge Fund Strategy Outlook
• Directional strategies are positioned defensively due to the uncertainty surroundingthe COVID-19 pandemic. Global Macro managers are monitoring geopolitical andeconomic situations including US/China relations, political/fiscal dynamics in the EUand the 2020 US presidential elections.
• Relative Value managers are looking for opportunities due to the dislocation causedby the pandemic. For Relative Value Credit managers, HY spread dispersion remainselevated which is posing a lot of opportunities.
• Long Short managers believe the market is bifurcated between companies likely tocome out of this period well while others might suffer from reduced demand, creatingmany long and short opportunities in the market.
• Event Driven managers are finding opportunities across the spectrum. For DistressedRestructuring managers, the current market environment is expected to create manyactionable distressed opportunities.
47Albourne 3Q 2020 Quarterly Strategy Forecast

Section IV
48

49
• In the past four and a half years, TMRS Staff has focused on theimplementation and execution of the strategic decision to build outa Direct Absolute Return Program.
• Mindset: Protect Capital in anticipation of market volatility
• Despite challenges, the Direct Portfolio is achieving returnobjectives, as illustrated in the IPS, both from a relative andabsolute perspective.
• The Portfolio is constructed to seek attractive risk-adjusted returnsover the long-term while providing performance that has lowcorrelation to traditional asset classes.
• Global markets tend to be cyclical and diverse, with bouts ofvolatility disruptions. This poses both opportunities and risks forARS’ overall investment portfolio and prospects going forward.

50